UNITED STATES
SECURITIES AND EXCHANGE COMMISSION
Washington, D.C. 20549
FORM N-CSR
CERTIFIED SHAREHOLDER REPORT OF REGISTERED
MANAGEMENT INVESTMENT COMPANIES
Investment Company Act file number | 811-04367 |
|
Columbia Funds Series Trust I |
(Exact name of registrant as specified in charter) |
|
One Financial Center, Boston, Massachusetts | | 02111 |
(Address of principal executive offices) | | (Zip code) |
|
James R. Bordewick, Jr., Esq. Columbia Management Advisors, LLC One Financial Center Boston, MA 02111 |
(Name and address of agent for service) |
|
Registrant’s telephone number, including area code: | 1-617-426-3750 | |
|
Date of fiscal year end: | August 31 | |
|
Date of reporting period: | August 31, 2009 | |
| | | | | | | | |
Form N-CSR is to be used by management investment companies to file reports with the Commission not later than 10 days after the transmission to stockholders of any report that is required to be transmitted to stockholders under Rule 30e-1 under the Investment Company Act of 1940 (17 CFR 270.30e-1). The Commission may use the information provided on Form N-CSR in its regulatory, disclosure review, inspection, and policymaking roles.
A registrant is required to disclose the information specified by Form N-CSR, and the Commission will make this information public. A registrant is not required to respond to the collection of information contained in Form N-CSR unless the Form displays a currently valid Office of Management and Budget (“OMB”) control number. Please direct comments concerning the accuracy of the information collection burden estimate and any suggestions for reducing the burden to Secretary, Securities and Exchange Commission, 450 Fifth Street, NW, Washington, DC 20549-0609. The OMB has reviewed this collection of information under the clearance requirements of 44 U.S.C. § 3507.
Item 1. Reports to Stockholders.
Columbia Management®
Annual Report
August 31, 2009
Columbia Funds
g Columbia International Stock Fund
g Columbia Mid Cap Growth Fund
g Columbia Small Cap Growth Fund I
g Columbia Technology Fund
g Columbia Balanced Fund
g Columbia Oregon Intermediate Municipal Bond Fund
g Columbia Conservative High Yield Fund
| NOT FDIC INSURED | | May Lose Value | |
|
| NOT BANK ISSUED | | No Bank Guarantee | |
|
Table of Contents
| Economic Update | | | 1 | | |
|
| Columbia International Stock Fund | | | 3 | | |
|
| Columbia Mid Cap Growth Fund | | | 8 | | |
|
| Columbia Small Cap Growth Fund I | | | 13 | | |
|
| Columbia Technology Fund | | | 18 | | |
|
| Columbia Balanced Fund | | | 23 | | |
|
Columbia Oregon Intermediate
Municipal Bond Fund | | | 28 | | |
|
Columbia Conservative
High Yield Fund | | | 33 | | |
|
| Financial Statements | | | | | |
|
| Investment Portfolios | | | 38 | | |
|
Statements of Assets and
Liabilities | | | 82 | | |
|
| Statements of Operations | | | 86 | | |
|
Statements of Changes in
Net Assets | | | 90 | | |
|
| Financial Highlights | | | 101 | | |
|
| Notes to Financial Statements | | | 135 | | |
|
| Report of Independent Registered Public Accounting Firm | | | 155 | | |
|
| Federal Income Tax Information | | | 156 | | |
|
| Fund Governance | | | 157 | | |
|
Important Information About
This Report | | | 161 | | |
|
The views expressed in this report reflect the current views of the respective parties. These views are not guarantees of future performance and involve certain risks, uncertainties and assumptions that are difficult to predict, so actual outcomes and results may differ significantly from the views expressed. These views are subject to change at any time based upon economic, market or other conditions and the respective parties disclaim any responsibility to update such views. These views may not be relied on as investment advice and, because investment decisions for a Columbia Fund are based on numerous factors, may not be relied on as an indication of trading intent on behalf of any particular Columbia Fund. References to specific securities should not be construed as a recommendation or investment advice.
President's Message

Dear Shareholder:
We are pleased to provide this shareholder report detailing your fund's performance, portfolio holdings and financial statements. We hope this information is helpful in monitoring your investments as we work through these challenging economic times. We recognize that you have entrusted us with your money and want you to know that our professional investment teams work to interpret the latest economic and market trends with the goal of optimizing portfolio construction for our clients.
The first half of 2009 was defined by extremes. The multiyear lows we witnessed in the early months gave way to a stunning rally for the U.S. financial markets in the spring. A global market rebound may be underway, thanks to the massive fiscal and aggressive monetary policies of governments around the world. As of the June 30 market close, the S&P 500® Index1 was trading at nearly 16.6 times its 2009 Wall Street consensus earnings estimates with a sharp increase of nearly 36% since March 9. More mixed economic news has yet to provide the all-clear signal for investors, although economic activity has started to firm up. We believe this challenging economic environment makes it even more important to work with professional money managers while continuing to invest for l ife events like retirement, college planning, home improvements and career changes.
Retirement income planning has become an increasingly significant focus in the lives of millions of Americans. Recent economic conditions make it even more important to manage short-term obligations such as mortgages, monthly bills and credit card debt while also taking the steps necessary to prepare for or maximize retirement benefits. Better nutrition and medical services can result in U.S. citizens living longer, healthier lives. This means the risk of outliving one's assets in retirement is very real without proper planning. Financial security and retirement planning is an ongoing process that requires active management of your savings, investments and risks. We encourage you to review your retirement plan regularly so you'll be better able to meet your retirement needs in the future.
We recognize that economic uncertainty creates great challenges for many investors. Our professional investment teams work diligently to help investors navigate through difficult markets. Thank you for your business and for the opportunity to work together towards your investment goals.
Sincerely,

J. Kevin Connaughton
President, Columbia Funds
On September 29, 2009, Bank of America Corporation entered into an agreement to sell a portion of the asset management business of Columbia Management Group, LLC. Please see Note 13 of the Notes to Financial Statements for additional information.
Past performance is no guarantee of future results.
1The Standard & Poor's (S&P) 500 Index tracks the performance of 500 widely held, large-capitalization U.S. stocks. Indices are not available for investment, are not professionally managed and do not reflect sales charges, fees, brokerage commissions, taxes or other expenses of investing. Securities in the fund may not match those in an index.
Economic Update – Columbia Funds
During the 12-month period that began September 1, 2008 and ended August 31, 2009, the U.S. economy faced the worst financial crisis since the Great Depression, then steadied itself as steps taken by a new administration began to show results in the second half of the period. Economic growth, as measured by gross domestic product, contracted by more than 6% in the second half of 2008. The decline for the first half of 2009 is expected to have been less severe, and hopes for a late 2009 recovery have been encouraged by the Federal Reserve Board (the Fed) Chairman Bernanke. The lapse from growth has resulted in the longest—and most severe—recession in nearly three decades.
The labor market shed more than six million jobs between 2008 and 2009, raising the unemployment rate to 9.7% and virtually wiping out all of the jobs gained since the last recession. Manufacturing activity slowed and consumer spending declined. The beleaguered housing market continued to lose ground as prices fell and inventories rose. However, mortgage purchase applications increased late in the period, buoyed by low interest rates and an $8,000 first-time home buyer tax credit. Late in 2008, consumer confidence, as measured by the Conference Board, plummeted to its lowest point ever. However, it has since stabilized and turned higher near the end of the period.
Troubles that began in the U.S. subprime mortgage market resulted in a meltdown within the U.S. financial sector that claimed several major institutions in 2008 and led others to seek bailouts, restructuring or both. New rigorous lending standards severely limited access to credit, further hampering economic growth. In this environment, a new administration sought to stabilize the financial system, address economic woes and introduce sweeping health care reform. Stimulus spending began to flow into the economy, raising hopes that growth would be restored in the second half of 2009. In December 2008, the Fed lowered a key short-term borrowing rate—the federal funds rate—to between zero and 0.25%—a record low. In light of protracted economic weakness, we believe the Fed is unlikely to tighten its reins on money until the economy and the labor markets stabilize.
Stocks retreated, then rebounded
Against a weakening economic backdrop, the U.S. stock market lost 18.25% for the 12-month period, as measured by the S&P 500® Index. Losses affected the stocks of companies of all sizes and investment style categories, as measured by their respective Russell indices.1 Stock markets outside the U.S. suffered losses that were nearly as substantial. The MSCI EAFE Index,2 a broad gauge of stock market performance in
1The Russell 1000 Index tracks the performance of 1,000 of the largest U.S. companies, based on market capitalization. The Russell MidCap Index measures the performance of the 800 smallest companies in the Russell 1000 Index, which represents approximately 25% of the total market capitalization of the Russell 1000 Index. The Russell 2000 Index measures the performance of the 2,000 smallest companies in the Russell 3000 Index, which represents approximately 8% of the total market capitalization of the Russell 3000 Index.
2The Morgan Stanley Capital International Europe, Australasia, Far East (MSCI EAFE) Index is a capitalization-weighted index that tracks the total return of common stocks in 21 developed-market countries within Europe, Australasia and the Far East.
Summary
For the 12-month period that ended August 31, 2009
g Stocks lost ground, as measured by the S&P 500® Index and the MSCI EAFE Index, but cut their losses in a rebound that began half way through the period.
| S&P Index | | MSCI Index | |
|
 | |  | |
|
g As investors appeared to exhibit more tolerance for risk, the Barclays Capital Aggregate Bond Index delivered positive results. High-yield bonds rebounded strongly, as measured by the JPMorgan Developed BB High Yield Index.
Barclays
Aggregate Index | | JPMorgan
Index | |
|
 | |  | |
|
1
Economic Update (continued) – Columbia Funds
foreign developed markets, lost 14.95% (in U.S. dollars) for the period. Emerging stock markets were also caught in the downdraft, but bounced back stronger than domestic or developed world markets in 2009. The MSCI Emerging Markets Index3 returned negative 9.95% (in U.S. dollars).
Bonds outperformed stocks
As investors sought refuge from a volatile stock market, the highest quality sectors of the U.S. bond market delivered modest gains. During the first half of the period, Treasury prices rose and yields declined sharply as the economy faltered and stock market volatility increased. As hopes for a recovery materialized in the second half of the period, yields rose and Treasuries lagged riskier segments of the bond market. The benchmark 10-year U.S. Treasury yield began the period at 3.8%, declined to 2.2% in December 2008, then rose to end the period at 3.4%. In this environment, the Barclays Capital Aggregate Bond Index4 (formerly the Lehman Brothers Aggregate Bond Index) returned 7.94%. High-yield bond prices fell sharply in 2008 as economic prospects weakened and default fears rose, then rebounded strongly in 2009. For the 12-month period, the JPMorgan Developed BB High Yield Index5 returned 6.51%.
Past performance is no guarantee of future results.
3The Morgan Stanley Capital International Emerging Markets Index (MSCI EMI) is a free float-adjusted market capitalization index that is designed to measure equity market performance in the global emerging markets. As of June 2006, the MSCI Emerging Markets Index consisted of the following 25 emerging market country indices: Argentina, Brazil, Chile, China, Colombia, Czech Republic, Egypt, Hungary, India, Indonesia, Israel, Jordan, Korea, Malaysia, Mexico, Morocco, Pakistan, Peru, Philippines, Poland, Russia, South Africa, Taiwan, Thailand and Turkey.
4The Barclays Capital Aggregate Bond Index is a market value-weighted index that tracks the daily price, coupon, pay-downs and total return performance of fixed-rate, publicly placed, dollar-denominated and non-convertible investment-grade debt issues with at least $250 million par amount outstanding and with at least one year to final maturity.
5The JPMorgan Developed BB High Yield Index is designed to mirror the investable universe of the U.S. dollar developed, BB-rated, high yield corporate debt market.
Indices are not available for investment, are not professionally managed and do not reflect sales charges, fees, brokerage commissions, taxes or other expenses of investing. Securities in the fund may not match those in an index.
2
Fund Profile – Columbia International Stock Fund
Summary
g For the 12-month period that ended August 31, 2009, the fund's Class A shares returned negative 16.59% without sales charge.
g The MSCI EAFE Index1 returned negative 14.95%. The MSCI All Country World ex U.S. Index GD (gross of dividends) and ND (net of dividends)2 returned negative 13.96% and negative 14.41%, respectively. The average return of the fund's peer group, the Lipper International Multi-Cap Core Funds Classification,3 returned negative 15.59%.
g A focus on stocks that are sensitive to economic changes generally accounted for the underperformance relative to the fund's benchmarks.
Portfolio Management
Fred Copper is the lead manager of the fund and has managed or co-managed the fund since October 2005 and has been associated with the advisor or its predecessors or affiliate organizations since 2005.
Jasmine (Weili) Huang has co-managed the fund since May 2006 and has been associated with the advisor or its predecessors or affiliate organizations since 2003.
Timothy R. Anderson has co-managed the fund since May 2006 and has been associated with the advisor or its predecessors or affiliate organizations since 2006.
Paul J. DiGiacomo has co-managed the fund since May 2006 and has been associated with the advisor or its predecessors or affiliate organizations since 2006.
Daisuke Nomoto has co-managed the fund since May 2006 and has been associated with the advisor or its predecessors or affiliate organizations since 2005.
1The Morgan Stanley Capital International Europe, Australasia, Far East (MSCI EAFE) Index is a capitalization-weighted index that tracks the total return of common stocks in 21 developed-market countries within Europe, Australasia and the Far East.
2The Morgan Stanley Capital International (MSCI) All Country (AC) World ex U.S. Index tracks global stock market performance that includes developed and emerging markets but excludes the U.S. Indices are not available for investment, are not professionally managed and do not reflect sales charges, fees, brokerage commissions, taxes or other expenses of investing. Securities in the fund may not match those in an index.
3Lipper Inc., a widely respected data provider in the industry, calculates an average total return (assuming reinvestment of distributions) for mutual funds with investment objectives similar to those of the fund. Lipper makes no adjustment for the effect of sales loads.
Performance data quoted represents past performance and current performance may be lower or higher. Past performance is no guarantee of future results. The investment return and principal value will fluctuate so that shares, when redeemed, may be worth more or less than the original cost. Please visit www.columbiafunds.com for daily and most recent month-end performance updates.
Summary
1-year return as of 08/31/09
| | –16.59% | |
|
| |  | | | Class A shares
(without sales charge) | |
|
| | | | | –14.95% | |
|
| |  | | | MSCI EAFE Index | |
|
| | | | | –14.41% | |
|
| |  | | | MSCI All Country World ex
U.S. Index (ND) | |
|
| | | | | –13.96% | |
|
| |  | | | MSCI All Country World ex
U.S. Index (GD) | |
|
Morningstar Style BoxTM
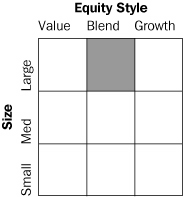
The Morningstar Style BoxTM reveals a fund's investment strategy. For equity funds, the vertical axis shows the market capitalization of the stocks owned, and the horizontal axis shows investment style (value, blend or growth). Information shown is based on the most recent data provided by Morningstar.
3
Performance Information – Columbia International Stock Fund
Performance data quoted represents past performance and current performance may be lower or higher. Past performance is no guarantee of future results. The investment return and principal value will fluctuate so that shares, when redeemed, may be worth more or less than the original cost. Please visit www.columbiafunds.com for daily and most recent month-end performance updates.
Annual operating expense ratio (%)*
| Class A | | | 1.52 | | |
| Class B | | | 2.27 | | |
| Class C | | | 2.27 | | |
| Class Y | | | 1.06 | | |
| Class Z | | | 1.27 | | |
* The annual operating expense ratio is as stated in the fund's prospectus that is current as of the date of this report and includes the expenses incurred by the investment companies in which the fund invests. Differences in expense ratios disclosed elsewhere in this report may result from including expenses incurred by the investment companies, fee waivers and expense reimbursements as well as different time periods used in calculating the ratios.
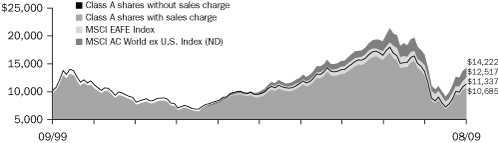
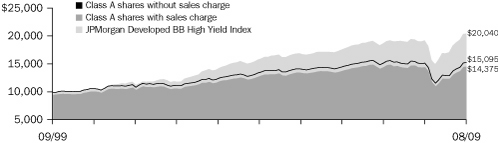
Performance of a $10,000 investment 09/01/99 – 08/31/09
The chart above shows the change in value of a hypothetical $10,000 investment in Class A shares of Columbia International Stock Fund during the stated time period, and does not reflect the deduction of taxes that a shareholder may pay on fund distributions or on the redemption of fund shares. The Morgan Stanley Capital International Europe, Australasia, Far East (MSCI EAFE) Index is a capitalization-weighted index that tracks the total return of common stocks in 21 developed-market countries within Europe, Australasia and the Far East. The MSCI All Country (AC) World ex U.S. Index is an index of global stock market performance that includes developed and emerging markets but excludes the U.S. Indices are not available for investment, are not professionally managed and do not reflect sales charges, fees, brokerage commissions, taxes or other expenses of investing. Securities in the fund may not match those in an index.
Performance of a $10,000 investment 09/01/99 – 08/31/09 ($)
| Sales charge | | without | | with | |
| Class A | | | 11,337 | | | | 10,685 | | |
| Class B | | | 10,744 | | | | 10,744 | | |
| Class C | | | 10,788 | | | | 10,788 | | |
| Class Y | | | 11,635 | | | | n/a | | |
| Class Z | | | 11,635 | | | | n/a | | |
Average annual total return as of 08/31/09 (%)
| Share class | | A | | B | | C | | Y | | Z | |
| Inception | | 11/01/02 | | 11/01/02 | | 10/13/03 | | 07/15/09 | | 10/01/92 | |
| Sales charge | | without | | with | | without | | with | | without | | with | | without | | without | |
| 1-year | | | –16.59 | | | | –21.38 | | | | –17.26 | | | | –21.20 | | | | –17.24 | | | | –18.03 | | | | –16.29 | | | | –16.29 | | |
| 5-year | | | 3.69 | | | | 2.47 | | | | 2.95 | | | | 2.65 | | | | 2.95 | | | | 2.95 | | | | 4.00 | | | | 4.00 | | |
| 10-year | | | 1.26 | | | | 0.66 | | | | 0.72 | | | | 0.72 | | | | 0.76 | | | | 0.76 | | | | 1.53 | | | | 1.53 | | |
Average annual total return as of 09/30/09 (%)
| Share class | | A | | B | | C | | Y | | Z | |
| Sales charge | | without | | with | | without | | with | | without | | with | | without | | without | |
| 1-year | | | 2.31 | | | | –3.57 | | | | 1.57 | | | | –3.27 | | | | 1.56 | | | | 0.59 | | | | 2.63 | | | | 2.63 | | |
| 5-year | | | 4.04 | | | | 2.81 | | | | 3.30 | | | | 2.99 | | | | 3.30 | | | | 3.30 | | | | 4.35 | | | | 4.35 | | |
| 10-year | | | 1.40 | | | | 0.80 | | | | 0.85 | | | | 0.85 | | | | 0.89 | | | | 0.89 | | | | 1.66 | | | | 1.66 | | |
The "with sales charge" returns include the maximum initial sales charge of 5.75% for Class A shares and the applicable contingent deferred sales charge of 5.00% in the first year, declining to 1.00% in the sixth year and eliminated thereafter for Class B shares and 1.00% for Class C shares in the first year only. The "without sales charge" returns do not include the effect of sales charges. If they had, returns would be lower.
Performance results reflect any fee waivers or reimbursements of fund expenses by the investment advisor and/or any of its affiliates. Absent these fee waivers or expense reimbursement arrangements, performance results would have been lower.
All results shown assume reinvestment of distributions. Class Y and Class Z shares are sold at net asset value with no distribution and service (Rule 12b-1) fees. Class Y and Class Z shares have limited eligibility and the investment minimum requirements may vary. Please see the fund's prospectus for details. Performance for different share classes will vary based on differences in sales charges and fees associated with each class.
The tables do not reflect the deduction of taxes that a shareholder may pay on fund distributions or on the redemption of fund shares.
Class A, Class B, Class C and Class Y are newer classes of shares. Class A, Class B and Class Y share performance information includes the performance of Class Z shares (the oldest existing share class) for periods prior to their inception. Class C share performance information includes returns of Class B shares for the period from November 1, 2002 through October 12, 2003, and the returns of Class Z shares for periods prior thereto. These returns reflect differences in sales charges, but have not been restated to reflect any differences in expenses (such as distribution and service (Rule 12b-1) fees) between Class Z shares and the newer classes of shares. If differences in expenses had been reflected, the returns shown for periods prior to the incepton of Class A, Class B, and Class C shares would have been lower, since these classes of shares are subject to distribution and service (Rule 12b-1) fees, and the returns shown for the periods prior to the inception of Class Y shares would have been higher. Class A and Class B shares were initially offered on November 1, 2002, Class C shares were initially offered on October 13, 2003, Class Y shares were initially offered on July 15, 2009 and Class Z shares were initially offered on October 1, 1992.
4
Understanding Your Expenses – Columbia International Stock Fund
As a fund shareholder, you incur two types of costs. There are transaction costs, which generally include sales charges on purchases and may include redemption fees or exchange fees. There are also ongoing costs, which generally include investment advisory fees, distribution and service (Rule 12b-1) fees and other fund expenses. The information on this page is intended to help you understand the ongoing costs of investing in the fund and to compare these costs with the ongoing costs of investing in other mutual funds.
Analyzing your fund's expenses by share class
To illustrate these ongoing costs, we have provided an example and calculated the expenses paid by investors in each share class during the period. The information in the following table is based on an initial investment of $1,000, which is invested at the beginning of the period and held for the entire period. Expense information is calculated two ways and each method provides you with different information. The amount listed in the "Actual" column is calculated using the fund's actual operating expenses and total return for the period. The amount listed in the "Hypothetical" column for each share class assumes that the return each year is 5% before expenses and is calculated based on the fund's actual operating expenses. You should not use the hypothetical account values and expenses to estimate either your actual account balance at the end of the period or the expenses you paid during this period.
Compare with other funds
Since all mutual funds are required to include the same hypothetical calculations about expenses in shareholder reports, you can use this information to compare the ongoing costs of investing in the fund with other funds. To do so, compare the 5% hypothetical example with the 5% hypothetical examples that appear in the shareholder reports of other funds. As you compare hypothetical examples of other funds, it is important to note that hypothetical examples are meant to highlight the ongoing costs of investing in a fund and do not reflect any transaction costs, such as sales charges, redemption fees or exchange fees.
Estimating your actual expenses
To estimate the expenses that you paid over the period, first you will need your account balance at the end of the period:
g For shareholders who receive their account statements from Columbia Management Services, Inc., your account balance is available online at www.columbiafunds.com or by calling Shareholder Services at 800.345.6611.
g For shareholders who receive their account statements from their financial intermediary, contact your financial intermediary to obtain your account balance.
1. Divide your ending account balance by $1,000. For example, if an account balance was $8,600 at the end of the period, the result would be 8.6.
2. In the section of the table below titled "Expenses paid during the period," locate the amount for your share class. You will find this number in the column labeled "Actual." Multiply this number by the result from step 1. Your answer is an estimate of the expenses you paid on your account during the period.
If the value of your account falls below the minimum initial investment requirement applicable to you, your account generally will be subject to a $20 annual fee. This fee is not included in the accompanying table. If you are subject to the fee, keep it in mind when you are estimating the ongoing expenses of investing in the fund and when comparing the expenses of this fund with other funds.
03/01/09 – 08/31/09
| | | Account value at the
beginning of the period ($) | | Account value at the
end of the period ($) | | Expenses paid
during the period ($) | | Fund's annualized
expense ratio (%) | |
| | | Actual | | Hypothetical | | Actual | | Hypothetical | | Actual | | Hypothetical | | Actual | |
| Class A | | | 1,000.00 | | | | 1,000.00 | | | | 1,572.62 | | | | 1,018.15 | | | | 9.08 | | | | 7.12 | | | | 1.40 | | |
| Class B | | | 1,000.00 | | | | 1,000.00 | | | | 1,567.32 | | | | 1,014.37 | | | | 13.91 | | | | 10.92 | | | | 2.15 | | |
| Class C | | | 1,000.00 | | | | 1,000.00 | | | | 1,566.92 | | | | 1,014.37 | | | | 13.91 | | | | 10.92 | | | | 2.15 | | |
| Class Y | | | 1,000.00 | | | | 1,000.00 | | | | 1,123.30 | * | | | 1,020.21 | | | | 1.38 | * | | | 5.04 | | | | 0.99 | | |
| Class Z | | | 1,000.00 | | | | 1,000.00 | | | | 1,576.00 | | | | 1,019.41 | | | | 7.47 | | | | 5.85 | | | | 1.15 | | |
Expenses paid during the period are equal to the annualized expense ratio for the share class, multiplied by the average account value over the period, then multiplied by the number of days in the fund's most recent fiscal half-year and divided by 365.
Had the investment advisor and/or any of its affiliates not waived fees or reimbursed a portion of expenses for all Classes except Class Y, account value at the end of the period would have been reduced.
It is important to note that the expense amounts shown in the table are meant to highlight only ongoing costs of investing in the fund and do not reflect any transaction costs, such as sales charges, redemption fees or exchange fees. Therefore, the hypothetical examples provided may not help you determine the relative total costs of owning shares of different funds. If these transaction costs were included, your costs would have been higher.
*For the period July 15, 2009 through August 31, 2009. Class Y shares commenced operations on July 15, 2009.
5
Portfolio Managers' Report – Columbia International Stock Fund
Performance data quoted represents past performance and current performance may be lower or higher. Past performance is no guarantee of future results. The investment return and principal value will fluctuate so that shares, when redeemed, may be worth more or less than the original cost. Please visit www.columbiafunds.com for daily and most recent month-end performance updates.
Net asset value per share
as of 08/31/09 ($)
| Class A | | | 11.15 | | |
| Class B | | | 10.72 | | |
| Class C | | | 10.78 | | |
| Class Y | | | 11.30 | | |
| Class Z | | | 11.30 | | |
Distributions declared per share
09/01/08 – 08/31/09 ($)
| Class A | | | 0.42 | | |
| Class B | | | 0.42 | | |
| Class C | | | 0.42 | | |
| Class Y | | | — | | |
| Class Z | | | 0.42 | | |
For the 12-month period that ended August 31, 2009, Columbia International Stock Fund Class A shares returned negative 16.59% without sales charge. In a difficult period for the equity markets worldwide, the fund fell somewhat further than the MSCI EAFE Index, which returned negative 14.95%; the MSCI All Country World ex U.S. Index GD (gross of dividends), which returned negative 13.96% and the MSCI All Country World ex U.S. Index ND (net of dividends), which returned negative 14.41%. As of August 31, 2009 and going forward, fund performance will only be compared to the MSCI All Country World ex U.S. Index ND, which includes the impact of an estimated withholding tax on dividend reinvestment in its return. The fund's return was also lower than the negative 15.59% average return of its peer group, the Lipper International Multi-Cap Core Funds Classification. The fund's shortfall against its benchmarks occurred mostly in the first six months of the period, when it was focused on stocks that are sensitive to changes in the economy. Commodity and industrial names were particularly hard hit during this time and were among the biggest detractors from return.
The markets in transition
During the first six months of the period, from September 2008 through February 2009, we witnessed the near-collapse of the U.S. financial system, paralysis in the credit markets, a rise in unemployment and a decline in investor confidence that resulted in a sharp sell-off in international stocks. As central banks and governments took measures to stabilize the credit markets and stimulate economic growth, investors returned to the equity markets. In the last six months of the period, from early March through August, equity prices rose dramatically.
Emphasis on China, investments in Turkey aided returns
Although the Chinese market declined dramatically early in the period, it reached new highs as the year wore on, and the fund's emphasis on China was positive for return. Dongfeng Motor Group, which rose because of a huge run-up in auto sales, was a particularly noteworthy performer. We took profits and sold the stock.
Because a worldwide credit crisis started in the United States, we believed it would be the first country to recover from it. With that in mind, we built an out-of-index position in U.S. stocks. However, the U.S. market performed generally in line with the other countries in the EAFE index and provided no particular benefit to return. We added investments in Turkey, purchasing Turkiye Is Bankasi, a large financial institution, and Turk Hava Yollari A.O. (Turkish Airlines). Both delivered strong results.
Agriculture a developing theme
In many areas in the world, continuing population growth has raised concerns about the shortage of clean water and arable land and the long-term ability to produce sufficient amounts of food. To take advantage of companies that we believe are seeking solutions to these problems, we favored certain agricultural businesses. Viterra in Canada, one of the biggest grain companies in the world, is an example of an agricultural holding that benefited performance.
6
Portfolio Managers' Report (continued) – Columbia International Stock Fund
Positive results in a disappointing period
Other companies that aided results included Paddy Power, a gaming company in Ireland. UK-based Brit Insurance Holdings was helpful, as insurance companies outside the United States did not experience the steep declines of many other financial institutions. Banco Bilbao Vizcaya Argentaria, one of Spain's largest banks, also enhanced returns because of its exposure to Latin America, a region that was less affected by the credit crisis. In the defensive telecommunications sector, Bezeq Israeli Telecommunication's valuation and double-digit yield were attractive, and the company was a noteworthy performer.
Disappointments from a range of sectors
Stocks that disappointed included ING Groep, a global financial services company in the Netherlands, and OPAP, a Greek gaming company that suffered on concerns that the government may levy taxes on winnings. Both stocks remain in the portfolio. Technip, a French oil service company, was hit hard early in the period when commodity-related stocks struggled, and we sold it.
A positive investment backdrop
Until the financial system is back to full strength, the job market strengthens and inflation accelerates, we feel that central banks and governments are likely to maintain monetary policy that accommodates and stimulates growth. This situation should be constructive for stocks. Even though equities have recovered significantly from their lowest levels, we believe they continue to be attractively valued.
Portfolio holdings and characteristics are subject to change periodically and may not be representative of current holdings and characteristics. The outlook for this fund may differ from that presented for other Columbia Funds.
Equity investments are affected by stock market fluctuations that occur in response to economic and business developments.
International investing may involve certain risks, including currency fluctuations, risks associated with possible differences in financial accounting standards and other monetary and political risks. Significant levels of foreign taxes, including potentially confiscatory levels of taxation and withholding taxes, may also apply to some foreign investments.
Investing in emerging markets may involve greater risks than investing in more developed countries. In addition, concentration of investments in a single region may result in greater volatility.
Top 5 countries
as of 08/31/09 (%)
| Japan | | | 22.8 | | |
| United Kingdom | | | 16.6 | | |
| France | | | 10.6 | | |
| Switzerland | | | 8.1 | | |
| USA | | | 6.4 | | |
Top 10 holdings
as of 08/31/09 (%)
| Banco Santander | | | 2.2 | | |
| Total | | | 2.1 | | |
| Nestle | | | 2.0 | | |
| BHP Billiton | | | 1.8 | | |
Banco Bibao
Vizcaya Argentina | | | 1.8 | | |
| Roche Holdings | | | 1.7 | | |
| Sanofi-Aventis | | | 1.6 | | |
| Barclays | | | 1.6 | | |
| AstraZeneca | | | 1.5 | | |
| BASF | | | 1.4 | | |
Holdings discussed in this report
as of 08/31/09 (%)
| Turkiye Is Bankasi | | | 0.5 | | |
| Turk Hava Yollari A.O. | | | 0.5 | | |
| Viterra | | | 0.7 | | |
| Paddy Power | | | 0.6 | | |
| Brit Insurance Holdings | | | 0.9 | | |
Banco Bilbao
Vizcaya Argentaria | | | 1.8 | | |
Bezeq Israeli
Telecommunications | | | 0.8 | | |
| ING Groep | | | 0.9 | | |
| OPAP | | | 0.9 | | |
The fund is actively managed and the composition of its portfolio will change over time. Information provided is calculated as a percentage of net assets.
7
Fund Profile – Columbia Mid Cap Growth Fund
Performance data quoted represents past performance and current performance may be lower or higher. Past performance is no guarantee of future results. The investment return and principal value will fluctuate so that shares, when redeemed, may be worth more or less than the original cost. Please visit www.columbiafunds.com for daily and most recent month-end performance updates.
Summary
1-year return as of 08/31/09
| | | | | –22.38% | |
|
| |  | | | Class A shares
(without sales charge) | |
|
| | | | | –20.21% | |
|
| |  | | | Russell MidCap Growth Index | |
|
| | | | | –19.92% | |
|
| |  | | | Russell MidCap Index | |
|
Morningstar Style BoxTM
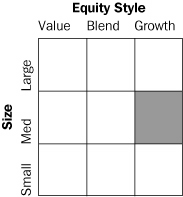
The Morningstar Style BoxTM reveals a fund's investment strategy. For equity funds, the vertical axis shows the market capitalization of the stocks owned, and the horizontal axis shows investment style (value, blend or growth). Information shown is based on the most recent data provided by Morningstar.
Summary
g For the 12-month period that ended August 31, 2009, the fund's Class A shares returned negative 22.38% without sales charge.
g The fund, its benchmarks—the Russell MidCap Growth Index and the Russell MidCap Index1—and the average return of the fund's peer group, the Lipper Mid-Cap Growth Funds Classification,2 all lost 19% or more during the period.
g The fund's emphasis on quality held back results relative to these comparative measures as stocks rebounded in 2009, led by more volatile, less consistent companies.
Portfolio Management
Wayne M. Collette has co-managed the fund since February 2006 and has been associated with the advisor or its predecessors or affiliate organizations since 2001.
George J. Myers has co-managed the fund since February 2006 and has been associated with the advisor or its predecessors or affiliate organizations since 2004.
Lawrence W. Lin has co-managed the fund since October 2007 and has been associated with the advisor or its predecessors or affiliate organizations since 2006.
Brian D. Neigut has co-managed the fund since October 2007 and has been associated with the advisor or its predecessors or affiliate organizations since 2007.
1The Russell MidCap Growth Index measures the performance of those Russell Midcap companies with higher price-to-book ratios and higher forecasted growth values. The stocks are also members of the Russell 1000 Growth Index. The Russell MidCap Index measures the performance of the 800 smallest companies in the Russell 1000 Index, which represents approximately 25% of the total market capitalization of the Russell 1000 Index. Indices are not available for investment, are not professionally managed and do not reflect sales charges, fees, brokerage commissions, taxes or other expenses of investing. Securities in the fund may not match those in an index.
2Lipper Inc., a widely respected data provider in the industry, calculates an average total return (assuming reinvestment of distributions) for mutual funds with investment objectives similar to those of the fund. Lipper makes no adjustment for the effect of sales loads.
8
Performance Information – Columbia Mid Cap Growth Fund
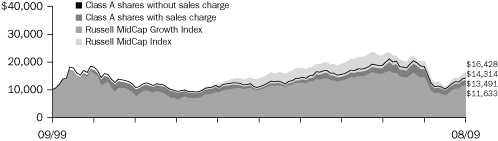
Performance of a $10,000 investment 09/01/99 – 08/31/09
The chart above shows the change in value of a hypothetical $10,000 investment in Class A shares of Columbia Mid Cap Growth Fund during the stated time period, and does not reflect the deduction of taxes that a shareholder may pay on fund distributions or on the redemption of fund shares. The Russell MidCap Growth Index measures the performance of those Russell Midcap companies with higher price-to-book ratios and higher forecasted growth values. The stocks are also members off the Russell 1000 Growth Index. The Russell MidCap Index measures the performance of the 800 smallest companies in the Russell 1000 Index. Indices are not available for investment, are not professionally managed and do not reflect sales charges, fees, brokerage commissions, taxes or other expenses of investing. Securities in the fund may not match those in an index.
Performance of a $10,000 investment 09/01/99 – 08/31/09 ($)
| Sales charge | | without | | with | |
| Class A | | | 14,314 | | | | 13,491 | | |
| Class B | | | 13,605 | | | | 13,605 | | |
| Class C | | | 13,630 | | | | 13,630 | | |
| Class R | | | 14,186 | | | | n/a | | |
| Class T | | | 14,308 | | | | 13,485 | | |
| Class Y | | | 14,621 | | | | n/a | | |
| Class Z | | | 14,621 | | | | n/a | | |
Performance data quoted represents past performance and current performance may be lower or higher. Past performance is no guarantee of future results. The investment return and principal value will fluctuate so that shares, when redeemed, may be worth more or less than the original cost. Please visit www.columbiafunds.com for daily and most recent month-end performance updates.
Annual operating expense ratio (%)*
| Class A | | | 1.29 | | |
| Class B | | | 2.04 | | |
| Class C | | | 2.04 | | |
| Class R | | | 1.54 | | |
| Class T | | | 1.34 | | |
| Class Y | | | 0.87 | | |
| Class Z | | | 1.04 | | |
* The annual operating expense ratio is as stated in the fund's prospectus that is current as of the date of this report. Differences in expense ratios disclosed elsewhere in this report may result from including fee waivers and expense reimbursements as well as different time periods used in calculating the ratios.
Average annual total return as of 08/31/09 (%)
| Share class | | A | | B | | C | | R | | T | | Y | | Z | |
| Inception | | 11/01/02 | | 11/01/02 | | 10/13/03 | | 01/23/06 | | 11/01/02 | | 07/15/09 | | 11/20/85 | |
| Sales charge | | without | | with | | without | | with | | without | | with | | without | | without | | with | | without | | without | |
| 1-year | | | –22.38 | | | | –26.83 | | | | –22.93 | | | | –26.64 | | | | –22.96 | | | | –23.70 | | | | –22.57 | | | | –22.41 | | | | –26.86 | | | | –22.16 | | | | –22.16 | | |
| 5-year | | | 5.67 | | | | 4.42 | | | | 4.90 | | | | 4.57 | | | | 4.89 | | | | 4.89 | | | | 5.48 | | | | 5.61 | | | | 4.37 | | | | 5.93 | | | | 5.93 | | |
| 10-year | | | 3.65 | | | | 3.04 | | | | 3.13 | | | | 3.13 | | | | 3.15 | | | | 3.15 | | | | 3.56 | | | | 3.65 | | | | 3.04 | | | | 3.87 | | | | 3.87 | | |
Average annual total return as of 09/30/09 (%)
| Share class | | A | | B | | C | | R | | T | | Y | | Z | |
| Sales charge | | without | | with | | without | | with | | without | | with | | without | | without | | with | | without | | without | |
| 1-year | | | –2.04 | | | | –7.65 | | | | –2.80 | | | | –7.48 | | | | –2.79 | | | | –3.73 | | | | –2.31 | | | | –2.09 | | | | –7.74 | | | | –1.85 | | | | –1.85 | | |
| 5-year | | | 6.23 | | | | 4.98 | | | | 5.45 | | | | 5.12 | | | | 5.45 | | | | 5.45 | | | | 6.03 | | | | 6.18 | | | | 4.93 | | | | 6.48 | | | | 6.48 | | |
| 10-year | | | 4.22 | | | | 3.60 | | | | 3.68 | | | | 3.68 | | | | 3.70 | | | | 3.70 | | | | 4.12 | | | | 4.21 | | | | 3.60 | | | | 4.43 | | | | 4.43 | | |
The "with sales charge" returns include the maximum initial sales charge of 5.75% for Class A and T shares and the applicable contingent deferred sales charge of 5.00% in the first year, declining to 1.00% in the sixth year and eliminated thereafter for Class B shares and 1.00% for Class C shares for the first year only. The "without sales charge" returns do not include the effect of sales charges. If they had, returns would be lower.
Performance results reflect any fee waivers or reimbursements of fund expenses by the investment advisor and/or any of its affiliates. Absent these fee waivers or expense reimbursement arrangements, performance results would have been lower.
All results shown assume reinvestment of distributions. Class Y and Class Z shares are sold at net asset value with no distribution and service (Rule 12b-1) fees. Class R shares are sold at net asset value with distribution (Rule 12b-1) fees. Class R, Class Y and Class Z shares have limited eligibility and the investment minimum requirements may vary. Please see the fund's prospectus for details. Performance for different share classes will vary based on differences in sales charges and fees associated with each class.
The tables do not reflect the deduction of taxes that a shareholder may pay on fund distributions or on the redemption of fund shares.
Class A, Class B, Class C, Class R, Class T and Class Y are newer classes of shares. Class A, Class B, Class T and Class Y share performance information includes the performance of Class Z shares (the oldest existing share class) for periods prior to their inception. Class C share performance information includes returns of Class B shares for the period from November 1, 2002 through October 12, 2003, and the returns of Class Z shares for periods prior thereto. Class R share performance information includes returns of Class A shares for the period from November 1, 2002 through January 22, 2006, and the returns of Class Z share for periods prior thereto. These returns reflect differences in sales charges, but have not been restated to reflect any differences in expenses (such as distribution and service (Rule 12b-1) fees) between Class Z shares and the newer classes of shares. If differences in expenses had been reflected, the ret urns shown for Class A, Class B, Class R and Class T shares for periods during which Class Z share returns are included would have een lower, since the newer classes of shares are subject to distribution and service (Rule 12b-1) fees, and the returns shown for the periods prior to the inception of Class Y shares would have been higher. Class A and Class B shares were initially offered on November 1, 2002, Class C shares were initially offered on October 13, 2003, Class R shares were initially offered on January 23, 2006, Class T shares were initially offered on November 1, 2002, Class Y shares were initially offered on July 15, 2009 and Class Z shares were initially offered on November 20, 1985.
9
Understanding Your Expenses – Columbia Mid Cap Growth Fund
Estimating your actual expenses
To estimate the expenses that you paid over the period, first you will need your account balance at the end of the period:
g For shareholders who receive their account statements from Columbia Management Services, Inc., your account balance is available online at www.columbiafunds.com or by calling Shareholder Services at 800.345.6611.
g For shareholders who receive their account statements from their financial intermediary, contact your financial intermediary to obtain your account balance.
1. Divide your ending account balance by $1,000. For example, if an account balance was $8,600 at the end of the period, the result would be 8.6.
2. In the section of the table below titled "Expenses paid during the period," locate the amount for your share class. You will find this number in the column labeled "Actual." Multiply this number by the result from step 1. Your answer is an estimate of the expenses you paid on your account during the period.
If the value of your account falls below the minimum initial investment requirement applicable to you, your account generally will be subject to a $20 annual fee. This fee is not included in the accompanying table. If you are subject to the fee, keep it in mind when you are estimating the ongoing expenses of investing in the fund and when comparing the expenses of this fund with other funds.
As a fund shareholder, you incur two types of costs. There are transaction costs, which generally include sales charges on purchases and may include redemption fees or exchange fees. There are also ongoing costs, which generally include investment advisory fees, distribution and service (Rule 12b-1) fees and other fund expenses. The information on this page is intended to help you understand the ongoing costs of investing in the fund and to compare these costs with the ongoing costs of investing in other mutual funds.
Analyzing your fund's expenses by share class
To illustrate these ongoing costs, we have provided an example and calculated the expenses paid by investors in each share class during the period. The information in the following table is based on an initial investment of $1,000, which is invested at the beginning of the period and held for the entire period. Expense information is calculated two ways and each method provides you with different information. The amount listed in the "Actual" column is calculated using the fund's actual operating expenses and total return for the period. The amount listed in the "Hypothetical" column for each share class assumes that the return each year is 5% before expenses and is calculated based on the fund's actual operating expenses. You should not use the hypothetical account values and expenses to estimate either your actual account balance at the end of the period or the expenses you paid during this period.
Compare with other funds
Since all mutual funds are required to include the same hypothetical calculations about expenses in shareholder reports, you can use this information to compare the ongoing costs of investing in the fund with other funds. To do so, compare the 5% hypothetical example with the 5% hypothetical examples that appear in the shareholder reports of other funds. As you compare hypothetical examples of other funds, it is important to note that hypothetical examples are meant to highlight the ongoing costs of investing in a fund and do not reflect any transaction costs, such as sales charges, redemption fees or exchange fees.
03/01/09 – 08/31/09
| | | Account value at the
beginning of the period ($) | | Account value at the
end of the period ($) | | Expenses paid
during the period ($) | | Fund's annualized
expense ratio (%) | |
| | | Actual | | Hypothetical | | Actual | | Hypothetical | | Actual | | Hypothetical | | Actual | |
| Class A | | | 1,000.00 | | | | 1,000.00 | | | | 1,396.28 | | | | 1,019.06 | | | | 7.37 | | | | 6.21 | | | | 1.22 | | |
| Class B | | | 1,000.00 | | | | 1,000.00 | | | | 1,391.79 | | | | 1,015.27 | | | | 11.88 | | | | 10.01 | | | | 1.97 | | |
| Class C | | | 1,000.00 | | | | 1,000.00 | | | | 1,391.59 | | | | 1,015.27 | | | | 11.88 | | | | 10.01 | | | | 1.97 | | |
| Class R | | | 1,000.00 | | | | 1,000.00 | | | | 1,394.72 | | | | 1,017.80 | | | | 8.87 | | | | 7.48 | | | | 1.47 | | |
| Class T | | | 1,000.00 | | | | 1,000.00 | | | | 1,396.28 | | | | 1,018.80 | | | | 7.67 | | | | 6.46 | | | | 1.27 | | |
| Class Y | | | 1,000.00 | | | | 1,000.00 | | | | 1,111.20 | * | | | 1,020.87 | | | | 1.19 | * | | | 4.38 | | | | 0.86 | | |
| Class Z | | | 1,000.00 | | | | 1,000.00 | | | | 1,398.10 | | | | 1,020.32 | | | | 5.86 | | | | 4.94 | | | | 0.97 | | |
Expenses paid during the period are equal to the annualized expense ratio for the share class, multiplied by the average account value over the period, then multiplied by the number of days in the fund's most recent fiscal half-year and divided by 365.
It is important to note that the expense amounts shown in the table are meant to highlight only ongoing costs of investing in the fund and do not reflect any transaction costs, such as sales charges, redemption fees or exchange fees. Therefore, the hypothetical examples provided may not help you determine the relative total costs of owning shares of different funds. If these transaction costs were included, your costs would have been higher.
*For the period July 15, 2009 through August 31, 2009. Class Y shares commenced operations on July 15, 2009.
10
Portfolio Managers' Report – Columbia Mid Cap Growth Fund
For the 12-month period that ended August 31, 2009, Columbia Mid Cap Growth Fund Class A shares returned negative 22.38% without sales charge. The fund lost more than its benchmarks, the Russell MidCap Growth Index, which returned negative 20.21%, and the Russell MidCap Index, which returned negative 19.92% for the same period. The fund's return also was slightly lower than the negative 21.46% average return of its peer group, the Lipper Mid-Cap Growth Funds Classification. The fund's focus on higher quality helped it outperform during the severe market slump in 2008. However, the fund underperformed during this 12-month period, primarily because lower quality stocks with less earnings consistency led the market's recovery in 2009.
Technology, health care and industrials selections disappointed
A slowing economy held back returns of several information technology, health care and industrials holdings. In technology, a weak market for semiconductor chips reduced demand for semiconductor equipment producer MEMC Electronic Materials. We retained a reduced position in the stock because we think MEMC has the potential to improve in an economic upturn. However, we sold two other disappointing technology holdings—video game developers Activision Blizzard and Ubisoft Entertainment. After revenues of both companies slowed in 2008, the lack of attractive new products led to lagging demand in 2009. In health care, contract research organizations (CROs) Covance and Charles River Laboratories International underperformed amid investor concerns that a slowing economy would limit pharmaceutical research and development spending. We sold both holdings. The slump in energy development in late 2008 hurt two energy-related industria ls holdings. We kept a position in McDermott International, which produces equipment used in oil exploration and production, because we think it should do well when energy activity increases. However, we sold SunPower, which manufactures solar energy systems, because of its uncertain prospects.
Energy, financials and utility holdings outperformed
Good stock selection in the energy, financials and utilities sectors helped support relative results. Two significant investments among the fund's energy sector investments were exploration and production companies Whiting Petroleum and SandRidge Energy. Both companies featured proven reserves and strong balance sheets, which helped them outperform when energy stocks began recovering after their 2008 slump. We took profits and sold the position in Whiting but retained an investment in SandRidge. In the financials sector, two real estate-related companies showed strength after the market hit its lows in March 2009. Bargain-hunting by investors helped lift valuations of CB Richard Ellis Group, a commercial real estate marketing company, and Alexandria Real Estate Equities, a real estate investment trust (REIT) that invests principally in laboratory properties. In the utilities group, AES, a U.S.-based power company with operations in 29 countries, showed strength as emerging markets began recovering.
Performance data quoted represents past performance and current performance may be lower or higher. Past performance is no guarantee of future results. The investment return and principal value will fluctuate so that shares, when redeemed, may be worth more or less than the original cost. Please visit www.columbiafunds.com for daily and most recent month-end performance updates.
Net asset value per share
as of 08/31/09 ($)
| Class A | | | 17.58 | | |
| Class B | | | 16.59 | | |
| Class C | | | 16.63 | | |
| Class R | | | 17.42 | | |
| Class T | | | 17.58 | | |
| Class Y | | | 17.98 | | |
| Class Z | | | 17.98 | | |
Distributions declared per share
09/01/08 – 08/31/09 ($)
| Class A | | | 0.49 | | |
| Class B | | | 0.49 | | |
| Class C | | | 0.49 | | |
| Class R | | | 0.49 | | |
| Class T | | | 0.49 | | |
| Class Y | | | — | | |
| Class Z | | | 0.49 | | |
11
Portfolio Managers' Report (continued) – Columbia Mid Cap Growth Fund
Top 5 sectors
as of 08/31/09 (%)
| Information Technology | | | 22.3 | | |
| Consumer Discretionary | | | 17.3 | | |
| Industrials | | | 15.2 | | |
| Health Care | | | 13.6 | | |
| Financials | | | 7.8 | | |
Top 10 holdings
as of 08/31/09 (%)
| Express Scripts | | | 1.6 | | |
| Life Technologies | | | 1.4 | | |
| GameStop | | | 1.4 | | |
| Precision Castparts | | | 1.3 | | |
| Illumina | | | 1.3 | | |
| CommScope | | | 1.2 | | |
| Avon | | | 1.2 | | |
| Waddell & Reed Financial | | | 1.2 | | |
| ICON | | | 1.1 | | |
| CF Industries Holdings | | | 1.1 | | |
Holdings discussed in this report
as of 08/31/09 (%)
| MEMC Electronic Materials | | | 0.4 | | |
| McDermott International | | | 1.1 | | |
| SandRidge Energy | | | 0.6 | | |
| CB Richard Ellis Group | | | 0.7 | | |
Alexandria Real Estate
Equities | | | 0.5 | | |
| AES Corp. | | | 1.1 | | |
The fund is actively managed and the composition of its portfolio will change over time. Information provided is calculated as a percentage of net assets.
Positioned for an economic rebound
Starting in the early months of 2009, when we began to take a more positive view of the outlook for the economy and the stock market, we have gradually shifted the portfolio to place greater emphasis on economically sensitive companies. The fund's sector weights remain very close to those of the Russell MidCap Growth Index, but we have placed greater emphasis on quality companies that we believe could benefit from a global economic rebound. For example, we increased holdings among companies positioned to benefit from an increase in discretionary spending. In the industrials and materials groups, we have looked for opportunities in industries such as steel and fertilizers with exposure to growing emerging markets. We expect to continue to increase exposure incrementally to more cyclically sensitive companies. We intend to remain sensitive to stock valuations and to take care in assessing the risk/reward tradeoffs in our stock sel ection.
Portfolio holdings and characteristics are subject to change periodically and may not be representative of current holdings and characteristics. The outlook for this fund may differ from that presented for other Columbia Funds.
Equity investments are affected by stock market fluctuations that occur in response to economic and business developments.
Investing in mid-cap stocks may present special risks, including possible illiquidity and greater price volatility than stocks of larger, more established companies.
12
Fund Profile – Columbia Small Cap Growth Fund I
Summary
g For the 12-month period that ended August 31, 2009, the fund's Class A shares returned negative 25.16% without sales charge.
g The fund, its benchmarks—the Russell 2000 Growth Index and the Russell 2000 Index1—and the average return of the fund's peer group, the Lipper Small-Cap Growth Funds Classification,2 all lost 21% or more during the 12-month period.
g The fund's focus on higher quality stocks with strong balance sheets hindered relative performance as lower quality, more volatile stocks led the market's rebound in the second half of the period.
Portfolio Management
Wayne M. Collette has co-managed the fund since February 2006 and has been associated with the advisor or its predecessors or affiliate organizations since 2001.
George J. Myers has co-managed the fund since February 2006 and has been associated with the advisor or its predecessors or affiliate organizations since 2004.
Lawrence W. Lin has co-managed the fund since October 2007 and has been associated with the advisor or its predecessors or affiliate organizations since 2006.
Brian D. Neigut has co-managed the fund since October 2007 and has been associated with the advisor or its predecessors or affiliate organizations since 2007.
1The Russell 2000 Growth Index measures the performance of those Russell 2000 companies with higher price-to-book ratios and higher forecasted growth values. The Russell 2000 Index measures the performance of the 2,000 smallest companies in the Russell 3000 Index, which represents approximately 8% of the total market capitalization of the Russell 3000 Index. Indices are not available for investment, are not professionally managed and do not reflect sales charges, fees, brokerage commissions, taxes or other expenses of investing. Securities in the fund may not match those in an index.
2Lipper Inc., a widely respected data provider in the industry, calculates an average total return (assuming reinvestment of distributions) for mutual funds with investment objectives similar to those of the fund. Lipper makes no adjustment for the effect of sales loads.
Performance data quoted represents past performance and current performance may be lower or higher. Past performance is no guarantee of future results. The investment return and principal value will fluctuate so that shares, when redeemed, may be worth more or less than the original cost. Please visit www.columbiafunds.com for daily and most recent month-end performance updates.
Summary
1-year return as of 08/31/09
| | –25.16% | |
|
| |  | | | Class A shares
(without sales charge) | |
|
| | | | | –22.02% | |
|
| |  | | | Russell 2000 Growth Index | |
|
| | | | | –21.29% | |
|
| |  | | | Russell 2000 Index | |
|
Morningstar Style BoxTM
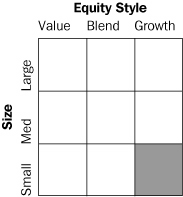
The Morningstar Style BoxTM reveals a fund's investment strategy. For equity funds, the vertical axis shows the market capitalization of the stocks owned, and the horizontal axis shows investment style (value, blend or growth). Information shown is based on the most recent data provided by Morningstar.
13
Performance Information – Columbia Small Cap Growth Fund I
Performance data quoted represents past performance and current performance may be lower or higher. Past performance is no guarantee of future results. The investment return and principal value will fluctuate so that shares, when redeemed, may be worth more or less than the original cost. Please visit www.columbiafunds.com for daily and most recent month-end performance updates.
Annual operating expense ratio (%)*
| Class A | | | 1.38 | | |
| Class B | | | 2.13 | | |
| Class C | | | 2.13 | | |
| Class Y | | | 1.00 | | |
| Class Z | | | 1.13 | | |
* The annual operating expense ratio is as stated in the fund's prospectus that is current as of the date of this report. Differences in expense ratios disclosed elsewhere in this report may result from including fee waivers and expense reimbursements as well as different time periods used in calculating the ratios.
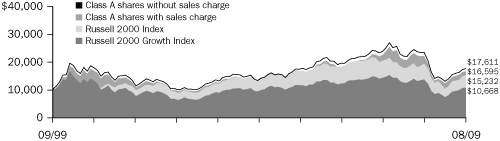
Performance of a $10,000 investment 09/01/99 – 08/31/09 ($)
The chart above shows the change in value of a hypothetical $10,000 investment in Class A shares of Columbia Small Cap Growth Fund I during the stated time period, and does not reflect the deduction of taxes that a shareholder may pay on fund distributions or on the redemption of fund shares. The Russell 2000 Growth Index measures the performance of those Russell 2000 Index companies with higher price-to-book ratios and higher forecasted growth values. The Russell 2000 Index measures the performance of the 2,000 smallest companies in the Russell 3000 Index, which represents approximately 8% of the total market capitalization of the Russell 3000 Index. Indices are not available for investment, are not professionally managed and do not reflect sales charges, fees, brokerage commissions, ta xes or other expenses of investing. Securities in the fund may not match those in an index.
Performance of a $10,000 investment 09/01/99 – 08/31/09 ($)
| Sales charge | | without | | with | |
| Class A | | | 17,611 | | | | 16,595 | | |
| Class B | | | 17,134 | | | | 17,134 | | |
| Class C | | | 17,134 | | | | 17,134 | | |
| Class Y | | | 17,780 | | | | n/a | | |
| Class Z | | | 17,780 | | | | n/a | | |
Average annual total return as of 08/31/09 (%)
| Share class | | A | | B | | C | | Y | | Z | |
| Inception | | 11/01/05 | | 11/01/05 | | 11/01/05 | | 07/15/09 | | 10/01/96 | |
| Sales charge | | without | | with | | without | | with | | without | | with | | without | | without | |
| 1-year | | | –25.16 | | | | –29.47 | | | | –25.70 | | | | –29.42 | | | | –25.65 | | | | –26.39 | | | | –24.97 | | | | –24.97 | | |
| 5-year | | | 5.71 | | | | 4.47 | | | | 5.13 | | | | 4.82 | | | | 5.13 | | | | 5.13 | | | | 5.91 | | | | 5.91 | | |
| 10-year | | | 5.82 | | | | 5.20 | | | | 5.53 | | | | 5.53 | | | | 5.53 | | | | 5.53 | | | | 5.92 | | | | 5.92 | | |
Average annual total return as of 09/30/09 (%)
| Share class | | A | | B | | C | | Y | | Z | |
| Sales charge | | without | | with | | without | | with | | without | | with | | without | | without | |
| 1-year | | | –8.26 | | | | –13.53 | | | | –8.94 | | | | –13.50 | | | | –8.91 | | | | –9.82 | | | | –8.01 | | | | –8.01 | | |
| 5-year | | | 5.94 | | | | 4.69 | | | | 5.34 | | | | 5.03 | | | | 5.33 | | | | 5.33 | | | | 6.15 | | | | 6.15 | | |
| 10-year | | | 6.37 | | | | 5.74 | | | | 6.07 | | | | 6.07 | | | | 6.07 | | | | 6.07 | | | | 6.48 | | | | 6.48 | | |
The "with sales charge" returns include the maximum initial sales charge of 5.75% for Class A shares and the applicable contingent deferred sales charge of 5.00% in the first year, declining to 1.00% in the sixth year and eliminated thereafter for Class B shares and 1.00% for Class C shares for the first year only. The "without sales charge" returns do not include the effect of sales charges. If they had, returns would be lower.
Performance results reflect any fee waivers or reimbursements of fund expenses by the investment advisor and/or any of its affiliates. Absent these fee waivers or expense reimbursement arrangements, performance results would have been lower.
All results shown assume reinvestment of distributions. Class Y and Class Z shares are sold at net asset value with no distribution and service (Rule 12b-1) fees. Class Y shares and Class Z shares have limited eligibility and the investment minimum requirements may vary. Please see the fund's prospectus for details. Performance for different share classes will vary based on differences in sales charges and fees associated with each class.
The tables do not reflect the deduction of taxes that a shareholder may pay on fund distributions or on the redemption of fund shares.
Class A, Class B, Class C and Class Y are newer classes of shares. Class A, Class B and Class Y share performance information includes the performance of Class Z shares (the oldest existing share class) for periods prior to their inception. These returns reflect differences in sales charges, but have not been restated to reflect any differences in expenses (such as distribution and service (Rule 12b-1) fees) between Class Z shares and the newer classes of shares. If differences in expenses had been reflected, the returns shown for periods prior to the incepton of Class A, Class B, and Class C shares would have been lower, since these classes of shares are subject to distribution and service (Rule 12b-1) fees, and the returns shown for the periods prior to the inception of Class Y shares would have been higher. Class A, Class B and Class C shares were initially offered on November 1, 2005, Class Y shares were initially offered on July 15, 2009 and Class Z shares were initially offered on October 1, 1996.
14
Understanding Your Expenses – Columbia Small Cap Growth Fund I
As a fund shareholder, you incur two types of costs. There are transaction costs, which generally include sales charges on purchases and may include redemption fees or exchange fees. There are also ongoing costs, which generally include investment advisory fees, distribution and service (Rule 12b-1) fees and other fund expenses. The information on this page is intended to help you understand the ongoing costs of investing in the fund and to compare these costs with the ongoing costs of investing in other mutual funds.
Analyzing your fund's expenses by share class
To illustrate these ongoing costs, we have provided an example and calculated the expenses paid by investors in each share class during the period. The information in the following table is based on an initial investment of $1,000, which is invested at the beginning of the period and held for the entire period. Expense information is calculated two ways and each method provides you with different information. The amount listed in the "Actual" column is calculated using the fund's actual operating expenses and total return for the period. The amount listed in the "Hypothetical" column for each share class assumes that the return each year is 5% before expenses and is calculated based on the fund's actual operating expenses. You should not use the hypothetical account values and expenses to estimate either your actual account balance at the end of the period or the expenses you paid during this period.
Compare with other funds
Since all mutual funds are required to include the same hypothetical calculations about expenses in shareholder reports, you can use this information to compare the ongoing costs of investing in the fund with other funds. To do so, compare the 5% hypothetical example with the 5% hypothetical examples that appear in the shareholder reports of other funds. As you compare hypothetical examples of other funds, it is important to note that hypothetical examples are meant to highlight the ongoing costs of investing in a fund and do not reflect any transaction costs, such as sales charges, redemption fees or exchange fees.
Estimating your actual expenses
To estimate the expenses that you paid over the period, first you will need your account balance at the end of the period:
g For shareholders who receive their account statements from Columbia Management Services, Inc., your account balance is available online at www.columbiafunds.com or by calling Shareholder Services at 800.345.6611.
g For shareholders who receive their account statements from their financial intermediary, contact your financial intermediary to obtain your account balance.
1. Divide your ending account balance by $1,000. For example, if an account balance was $8,600 at the end of the period, the result would be 8.6.
2. In the section of the table below titled "Expenses paid during the period," locate the amount for your share class. You will find this number in the column labeled "Actual." Multiply this number by the result from step 1. Your answer is an estimate of the expenses you paid on your account during the period.
If the value of your account falls below the minimum initial investment requirement applicable to you, your account generally will be subject to a $20 annual fee. This fee is not included in the accompanying table. If you are subject to the fee, keep it in mind when you are estimating the ongoing expenses of investing in the fund and when comparing the expenses of this fund with other funds.
03/01/09 – 08/31/09
| | | Account value at the
beginning of the period ($) | | Account value at the
end of the period ($) | | Expenses paid
during the period ($) | | Fund's annualized
expense ratio (%) | |
| | | Actual | | Hypothetical | | Actual | | Hypothetical | | Actual | | Hypothetical | | Actual | |
| Class A | | | 1,000.00 | | | | 1,000.00 | | | | 1,350.20 | | | | 1,018.40 | | | | 8.00 | | | | 6.87 | | | | 1.35 | | |
| Class B | | | 1,000.00 | | | | 1,000.00 | | | | 1,345.01 | | | | 1,014.62 | | | | 12.41 | | | | 10.66 | | | | 2.10 | | |
| Class C | | | 1,000.00 | | | | 1,000.00 | | | | 1,345.01 | | | | 1,014.62 | | | | 12.41 | | | | 10.66 | | | | 2.10 | | |
| Class Y | | | 1,000.00 | | | | 1,000.00 | | | | 1,093.20 | * | | | 1,020.01 | | | | 1.42 | * | | | 5.24 | | | | 1.03 | | |
| Class Z | | | 1,000.00 | | | | 1,000.00 | | | | 1,351.41 | | | | 1,019.66 | | | | 6.52 | | | | 5.60 | | | | 1.10 | | |
Expenses paid during the period are equal to the annualized expense ratio for the share class, multiplied by the average account value over the period, then multiplied by the number of days in the fund's most recent fiscal half-year and divided by 365.
Had the investment advisor and/or any of its affiliates not waived fees or reimbursed a portion of expenses for all Classes except Class Y, account value at the end of the period would have been reduced.
It is important to note that the expense amounts shown in the table are meant to highlight only ongoing costs of investing in the fund and do not reflect any transaction costs, such as sales charges, redemption fees or exchange fees. Therefore, the hypothetical examples provided may not help you determine the relative total costs of owning shares of different funds. If these transaction costs were included, your costs would have been higher.
*For the period July 15, 2009 through August 31, 2009. Class Y shares commenced operations on July 15, 2009.
15
Portfolio Managers' Report – Columbia Small Cap Growth Fund I
Performance data quoted represents past performance and current performance may be lower or higher. Past performance is no guarantee of future results. The investment return and principal value will fluctuate so that shares, when redeemed, may be worth more or less than the original cost. Please visit www.columbiafunds.com for daily and most recent month-end performance updates.
Net asset value per share
as of 08/31/09 ($)
| Class A | | | 20.82 | | |
| Class B | | | 20.35 | | |
| Class C | | | 20.35 | | |
| Class Y | | | 21.00 | | |
| Class Z | | | 21.00 | | |
For the 12-month period that ended August 31, 2009, Columbia Small Cap Growth Fund I Class A shares returned negative 25.16% without sales charge. The fund lagged its benchmarks, the Russell 2000 Growth Index, which returned negative 22.02%, and the Russell 2000 Index, which returned negative 21.29%, for the same period. The fund's return also was lower than the negative 21.47% average return of its peer group, the Lipper Small-Cap Growth Funds Classification. The focus on higher quality small-cap companies with strong balance sheets helped the fund outperform in a falling stock market in late 2008 and early 2009. However, the fund's quality focus led to underperformance relative to its benchmarks for the period, as more volatile stocks led the market recovery in the spring of 2009.
Health care, technology and industrials holdings detracted
Stock selection in the health care, technology and industrials groups detracted from results relative to the Russell 2000 Growth Index. In health care, ICON, a contract research organization, and CardioNet and Masimo, two companies that provide outpatient monitoring devices and services, were disappointments. ICON's stock declined when investors feared that a weakened economy would limit research and development spending by the pharmaceuticals industry. We retained a position in the stock because we believe that the corporation is well positioned competitively going forward. We also retained an investment in Masimo, but have liquidated the CardioNet position. Both CardioNet and Masimo fell amid investor concerns about their vulnerability to changing reimbursement policies from potential health care industry reforms. We maintained a reduced position in Vocus, a company that offers on-demand public relations software to corporatio ns, many of which have suffered from the effects of a weakening economy. Among the fund's industrial holdings, detractors included Hexcel and Bucyrus International. We liquidated a position in Hexcel, which manufactures composite materials used by the aerospace industry, where demand has fallen off. However, we maintained a position in Bucyrus, a manufacturer of mining equipment, where we see potential gains in an economic recovery.
Consumer discretionary, energy and financials holdings outperformed
Good stock selection in the consumer discretionary, energy and financials sectors helped support relative results. In the consumer discretionary sector, Lululemon Athletica and Tempur-Pedic International gained ground. Lululemon, a fast-growing producer of sportswear for yoga practitioners, performed well after introducing a website to supplement store-based sales. Mattress manufacturer Tempur-Pedic benefited from improving sentiment about the housing industry late in the period. In energy, exploration and production companies CNX Gas and Concho Resources outperformed in a volatile market for the sector. We took profits and sold the CNX position while retaining an investment in Concho. In the financials group, strong contributions came from asset managers Janus Capital Group and Cohen & Steers. Janus, a mutual fund manager, and Cohen & Steers, which manages real estate investment funds, both gained as the stock market re bounded. We sold Cohen & Steers before the end of the period.
16
Portfolio Managers' Report (continued) – Columbia Small Cap Growth Fund I
Positioned for an economic rebound
Early in 2009 we began to increase exposure incrementally to more economically sensitive stocks that we believe could do well as the global economy recovers and the equity markets rebound. We have sought opportunities among consumer and technology companies that we believe can benefit when discretionary spending improves and within the industrials and materials sectors, which are positioned to benefit from a potential resurgence by emerging market economies. We intend to remain sensitive to stock valuations and to take care in assessing the risk/reward tradeoffs in stock selection.
Portfolio holdings and characteristics are subject to change periodically and may not be representative of current holdings and characteristics. The outlook for this fund may differ from that presented for other Columbia Funds.
Equity investments are affected by stock market fluctuations that occur in response to economic and business developments.
Investments in small-cap stocks may be subject to greater volatility and price fluctuations because they may be thinly traded and less liquid than investments in larger companies.
Top 5 sectors
as of 08/31/09 (%)
| Information Technology | | | 26.8 | | |
| Health Care | | | 23.2 | | |
| Consumer Discretionary | | | 15.7 | | |
| Industrials | | | 12.6 | | |
| Financials | | | 5.0 | | |
Top 10 holdings
as of 08/31/09 (%)
| Onyx Pharmaceuticals | | | 1.4 | | |
| TNS | | | 1.3 | | |
| ICON | | | 1.2 | | |
| Impax Laboratories | | | 1.2 | | |
| Tempur-Pedic International | | | 1.2 | | |
| SAVVIS | | | 1.1 | | |
| NuVasive | | | 1.1 | | |
| Corinthian Colleges | | | 1.0 | | |
| TiVo | | | 1.0 | | |
| Lumber Liquidators | | | 1.0 | | |
Holdings discussed in this report
as of 08/31/09 (%)
| ICON | | | 1.2 | | |
| Masimo | | | 0.9 | | |
| Vocus | | | 0.1 | | |
| Bucyrus International | | | 0.4 | | |
| Lululemon Athletica | | | 0.5 | | |
| Tempur-Pedic International | | | 1.2 | | |
| Concho Resources | | | 0.6 | | |
| Janus Capital Group | | | 0.7 | | |
The fund is actively managed and the composition of its portfolio will change over time. Information provided is calculated as a percentage of net assets.
17
Fund Profile – Columbia Technology Fund
Performance data quoted represents past performance and current performance may be lower or higher. Past performance is no guarantee of future results. The investment return and principal value will fluctuate so that shares, when redeemed, may be worth more or less than the original cost. Please visit www.columbiafunds.com for daily and most recent month-end performance updates.
Summary
1-year return as of 08/31/09
| | | | | –22.02% | |
|
| |  | | | Class A shares
(without sales charge) | |
|
| | | | | –12.47% | |
|
| |  | | | Merrill Lynch
100 Technology Index | |
|
Summary
g For the 12-month period that ended August 31, 2009, the fund's Class A shares returned negative 22.02% without sales charge.
g The fund underperformed its benchmark, the Merrill Lynch 100 Technology Index.1 The average return of the fund's peer group, the Lipper Science & Technology Funds Classification,2 was negative 11.53%.
g Underexposure to semiconductor makers hurt the fund's relative returns as semiconductor demand increased sharply following the market downturn. The fund was also hurt by an emphasis on cell phone tower companies, which failed to keep pace in the cyclical recovery.
Portfolio Management
Wayne Collette has managed the fund since June 2002 and has been associated with the advisor or its predecessors or affiliate organizations since 2001.
1The Merrill Lynch 100 Technology Index is an equally-weighted index of 100 leading technology stocks. Indices are not available for investment, are not professionally managed and do not reflect sales charges, fees, brokerage commissions, taxes or other expenses of investing. Securities in the fund may not match those in an index.
2Lipper Inc., a widely respected data provider in the industry, calculates an average total return (assuming reinvestment of distributions) for mutual funds with investment objectives similar to those of the fund. Lipper makes no adjustment for the effect of sales loads.
18
Performance Information – Columbia Technology Fund
Performance of a $10,000 investment 11/09/00 – 08/31/09 ($)
The chart above shows the change in value of a hypothetical $10,000 investment in Class A shares of Columbia Technology Fund during the stated time period, and does not reflect the deduction of taxes that a shareholder may pay on fund distributions or on the redemption of fund shares. The Merrill Lynch 100 Technology Index is an equally-weighted index of 100 leading technology stocks. Indices are not available for investment, are not professionally managed and do not reflect sales charges, fees, brokerage commissions, taxes or other expenses of investing. Securities in the fund may not match those in an index.
Performance of a $10,000 investment 11/09/00 – 08/31/09 ($)
| Sales charge | | without | | with | |
| Class A | | | 8,433 | | | | 7,949 | | |
| Class B | | | 7,991 | | | | 7,991 | | |
| Class C | | | 8,000 | | | | 8,000 | | |
| Class Z | | | 8,594 | | | | n/a | | |
Average annual total return as of 08/31/09 (%)
| Share class | | A | | B | | C | | Z | |
| Inception | | 11/01/02 | | 11/01/02 | | 10/13/03 | | 11/09/00 | |
| Sales charge | | without | | with | | without | | with | | without | | with | | without | |
| 1-year | | | –22.02 | | | | –26.48 | | | | –22.68 | | | | –26.55 | | | | –22.74 | | | | –23.51 | | | | –21.91 | | |
| 5-year | | | 5.36 | | | | 4.11 | | | | 4.56 | | | | 4.22 | | | | 4.55 | | | | 4.55 | | | | 5.60 | | |
| Life | | | –1.92 | | | | –2.57 | | | | –2.51 | | | | –2.51 | | | | –2.50 | | | | –2.50 | | | | –1.71 | | |
Average annual total return as of 09/30/09 (%)
| Share class | | A | | B | | C | | Z | |
| Sales charge | | without | | with | | without | | with | | without | | with | | without | |
| 1-year | | | –0.25 | | | | –5.93 | | | | –1.02 | | | | –5.97 | | | | –1.15 | | | | –2.14 | | | | –0.12 | | |
| 5-year | | | 5.12 | | | | 3.87 | | | | 4.32 | | | | 3.98 | | | | 4.31 | | | | 4.31 | | | | 5.37 | | |
| Life | | | –1.18 | | | | –1.83 | | | | –1.77 | | | | –1.77 | | | | –1.76 | | | | –1.76 | | | | –0.96 | | |
The "with sales charge" returns include the maximum initial sales charge of 5.75% for Class A shares and the applicable contingent deferred sales charge of 5.00% in the first year, declining to 1.00% in the sixth year and eliminated thereafter for Class B shares and 1.00% for Class C shares for the first year only. The "without sales charge" returns do not include the effect of sales charges. If they had, returns would be lower.
Performance results reflect any fee waivers or reimbursements of fund expenses by the investment advisor and/or any of its affiliates. Absent these fee waivers or expense reimbursement arrangements, performance results would have been lower.
All results shown assume reinvestment of distributions. Class Z shares are sold at net asset value with no distribution and service (Rule 12b-1) fees. Class Z shares have limited eligibility and the investment minimum requirements may vary. Please see the fund's prospectus for details. Performance for different share classes will vary based on differences in sales charges and fees associated with each class.
The tables do not reflect the deduction of taxes that a shareholder may pay on fund distributions or on the redemption of fund shares.
Class A, Class B and Class C are newer classes of shares. Class A and Class B share performance information includes the performance of Class Z shares (the oldest existing share class) for periods prior to their inception. Class C share performance information includes returns of Class B shares for the period from November 1, 2002 through October 12, 2003, and the returns of Class Z shares for periods prior thereto. These returns reflect differences in sales charges, but have not been restated to reflect any differences in expenses (such as distribution and service (Rule 12b-1) fees) between Class Z shares and the newer classes of shares. If differences in expenses had been reflected, the returns shown for periods prior to the inception of the newer classes of shares would have been lower, since the newer classes of shares are subject to distribution and service (Rule 12b-1) fees. Class A and Class B shares were initially offere d on November 1, 2002, Class C shares were initially offered on October 13, 2003, and Class Z shares were initially offered on November 9, 2000.
Performance data quoted represents past performance and current performance may be lower or higher. Past performance is no guarantee of future results. The investment return and principal value will fluctuate so that shares, when redeemed, may be worth more or less than the original cost. Please visit www.columbiafunds.com for daily and most recent month-end performance updates
Annual operating expense ratio (%)*
| Class A | | | 1.37 | | |
| Class B | | | 2.12 | | |
| Class C | | | 2.12 | | |
| Class Z | | | 1.12 | | |
*The annual operating expense ratio is as stated in the fund's prospectus that is current as of the date of this report. Differences in expense ratios disclosed elsewhere in this report may result from including fee waivers and expense reimbursements as well as different time periods used in calculating the ratios.
19
Understanding Your Expenses – Columbia Technology Fund
Estimating your actual expenses
To estimate the expenses that you paid over the period, first you will need your account balance at the end of the period:
g For shareholders who receive their account statements from Columbia Management Services, Inc., your account balance is available online at www.columbiafunds.com or by calling Shareholder Services at 800.345.6611.
g For shareholders who receive their account statements from their financial intermediary, contact your financial intermediary to obtain your account balance.
1. Divide your ending account balance by $1,000. For example, if an account balance was $8,600 at the end of the period, the result would be 8.6.
2. In the section of the table below titled "Expenses paid during the period," locate the amount for your share class. You will find this number in the column labeled "Actual." Multiply this number by the result from step 1. Your answer is an estimate of the expenses you paid on your account during the period.
If the value of your account falls below the minimum initial investment requirement applicable to you, your account generally will be subject to a $20 annual fee. This fee is not included in the accompanying table. If you are subject to the fee, keep it in mind when you are estimating the ongoing expenses of investing in the fund and when comparing the expenses of this fund with other funds.
As a fund shareholder, you incur two types of costs. There are transaction costs, which generally include sales charges on purchases and may include redemption fees or exchange fees. There are also ongoing costs, which generally include investment advisory fees, distribution and service (Rule 12b-1) fees and other fund expenses. The information on this page is intended to help you understand the ongoing costs of investing in the fund and to compare these costs with the ongoing costs of investing in other mutual funds.
Analyzing your fund's expenses by share class
To illustrate these ongoing costs, we have provided an example and calculated the expenses paid by investors in each share class during the period. The information in the following table is based on an initial investment of $1,000, which is invested at the beginning of the period and held for the entire period. Expense information is calculated two ways and each method provides you with different information. The amount listed in the "Actual" column is calculated using the fund's actual operating expenses and total return for the period. The amount listed in the "Hypothetical" column for each share class assumes that the return each year is 5% before expenses and is calculated based on the fund's actual operating expenses. You should not use the hypothetical account values and expenses to estimate either your actual account balance at the end of the period or the expenses you paid during this period.
Compare with other funds
Since all mutual funds are required to include the same hypothetical calculations about expenses in shareholder reports, you can use this information to compare the ongoing costs of investing in the fund with other funds. To do so, compare the 5% hypothetical example with the 5% hypothetical examples that appear in the shareholder reports of other funds. As you compare hypothetical examples of other funds, it is important to note that hypothetical examples are meant to highlight the ongoing costs of investing in a fund and do not reflect any transaction costs, such as sales charges, redemption fees or exchange fees.
03/01/09 – 08/31/09
| | | Account value at the
beginning of the period ($) | | Account value at the
end of the period ($) | | Expenses paid
during the period ($) | | Fund's annualized
expense ratio (%) | |
| | | Actual | | Hypothetical | | Actual | | Hypothetical | | Actual | | Hypothetical | | Actual | |
| Class A | | | 1,000.00 | | | | 1,000.00 | | | | 1,375.71 | | | | 1,017.95 | | | | 8.62 | | | | 7.32 | | | | 1.44 | | |
| Class B | | | 1,000.00 | | | | 1,000.00 | | | | 1,369.81 | | | | 1,014.17 | | | | 13.08 | | | | 11.12 | | | | 2.19 | | |
| Class C | | | 1,000.00 | | | | 1,000.00 | | | | 1,369.11 | | | | 1,014.17 | | | | 13.08 | | | | 11.12 | | | | 2.19 | | |
| Class Z | | | 1,000.00 | | | | 1,000.00 | | | | 1,377.48 | | | | 1,019.21 | | | | 7.13 | | | | 6.06 | | | | 1.19 | | |
Expenses paid during the period are equal to the annualized expense ratio for the share class, multiplied by the average account value over the period, then multiplied by the number of days in the fund's most recent fiscal half-year and divided by 365.
Had the investment advisor and/or any of its affiliates not waived fees or reimbursed a portion of expenses, account value at the end of the period would have been reduced.
It is important to note that the expense amounts shown in the table are meant to highlight only ongoing costs of investing in the fund and do not reflect any transaction costs, such as sales charges, redemption fees or exchange fees. Therefore, the hypothetical examples provided may not help you determine the relative total costs of owning shares of different funds. If these transaction costs were included, your costs would have been higher.
20
Portfolio Manager's Report – Columbia Technology Fund
For the 12-month period that ended August 31, 2009, Columbia Technology Fund Class A shares returned negative 22.02% without sales charge. The fund underperformed its benchmark, the Merrill Lynch 100 Technology Index, which returned negative 12.47% for the same period. Its return also fell behind the average return of its peer group, the Lipper Science & Technology Funds Classification, which was negative 11.53%. An underweight position in semiconductor manufacturers, which led a rebound in technology stocks in 2009, combined with overexposure to cell tower companies, which underperformed, caused the fund to lag the index and its peer group average.
Fund positioning led to disappointments
An underweight position in semiconductor stocks helped the fund in late 2008, but hurt during the cyclical upturn in early 2009 when demand for semiconductors surged. Exposure to relatively poor performers in the industry, including MEMC Electronic Materials, also hurt. While we have worked to bring the fund's exposure to semiconductor companies closer to that of the index, we remain mindful of valuations and thus the fund had not reached an index weight as of the end of the period.
An overweight position in cell-tower companies also detracted from returns. Because contracts for towers tend to be longer term, these issues are less sensitive to early-stage economic improvements. Detractors included market leaders Crown Castle International and American Tower. Despite a disappointing period for these companies, we continue to like their long-term prospects because of significant barriers to entry by other competitors, including community opposition to new cell phone tower placements.
Elsewhere in the portfolio, weak consumer spending patterns hurt software makers Microsoft and Adobe Systems. Near-term headwinds notwithstanding, we believe that the impending introduction of Microsoft's Windows 7 operating system could spark improved PC sales.
Rising smart phone use, consumer spending trends helped offset losses
While the recession slowed the emergence of new technologies and stifled efforts to identify stocks that may benefit, the smart phone product cycle has been an exception. Rising consumer and corporate use of smart phones, including the iPhone, has not only benefited the stock of companies that make the devices, such as Apple, but also connection providers, such as Neutral Tandem, and chip makers, such as QUALCOMM. Although Apple and QUALCOMM lost ground during the period, they held up considerably better than the sector overall.
The fund's positions in NetFlix and priceline.com benefited as consumers sought lower cost options for entertainment and travel. Positive economic trends benefited Itron, which sells utility meters for residential use. We believe that the stock has the potential to continue to benefit from an improving housing market. Relatively light
Performance data quoted represents past performance and current performance may be lower or higher. Past performance is no guarantee of future results. The investment return and principal value will fluctuate so that shares, when redeemed, may be worth more or less than the original cost. Please visit www.columbiafunds.com for daily and most recent month-end performance updates.
Net asset value per share
as of 08/31/09 ($)
| Class A | | | 7.58 | | |
| Class B | | | 7.26 | | |
| Class C | | | 7.27 | | |
| Class Z | | | 7.70 | | |
21
Portfolio Manager's Report (continued) – Columbia Technology Fund
Top 5 sectors
as of 08/31/09 (%)
| Software & Services | | | 39.1 | | |
Technology Hardware &
Equipment | | | 28.2 | | |
Semiconductors &
Equipment | | | 21.6 | | |
| Telecommunication Services | | | 3.8 | | |
| Retailing | | | 3.7 | | |
Top 10 holdings
as of 08/31/09 (%)
| Apple | | | 4.9 | | |
| Microsoft | | | 3.0 | | |
| Qualcomm | | | 2.7 | | |
| Analog Devices | | | 2.5 | | |
| Novellus | | | 2.1 | | |
| Verisign | | | 2.1 | | |
| Western Digital | | | 2.0 | | |
| eBay | | | 1.8 | | |
| Corning | | | 1.8 | | |
| TNS, Inc | | | 1.8 | | |
Holdings discussed in this report
as of 08/31/09 (%)
| MEMC Electronic Materials | | | 0.8 | | |
| Crown Castle International | | | 0.5 | | |
| American Tower | | | 0.5 | | |
| Microsoft | | | 3.0 | | |
| Adobe Systems | | | 1.1 | | |
| Apple | | | 4.9 | | |
| Neutral Tandem | | | 0.5 | | |
| QUALCOMM | | | 2.7 | | |
| NetFlix | | | 1.5 | | |
| Priceline.com | | | 0.6 | | |
| Itron | | | 0.9 | | |
The fund is actively managed and the composition of its portfolio will change over time. Information provided is calculated as a percentage of net assets.
exposure to several poor-performing information technology services companies also helped overall returns.
Improved outlook on corporate technology spending
In light of the improving economic environment and following a long period of reduced spending patterns, corporate technology spending looks poised to grow incrementally. We continue to assess new technologies and product cycle trends and seek to identify stocks that may benefit, working to ensure that new picks for the portfolio remain consistent with our investment philosophy, which emphasizes strong balance sheets, proven management teams and reasonable valuations.
Portfolio holdings and characteristics are subject to change periodically and may not be representative of current holdings and characteristics. The outlook for this fund may differ from that presented for other Columbia Funds.
Equity investments are affected by stock market fluctuations that occur in response to economic and business developments.
The share price of a fund that invests primarily in one sector will likely be subject to more volatility than a fund that invests across many sectors. Technology stocks may be more volatile than stocks in other sectors. The fund should be considered part of an overall investment program, and not a complete investment program.
International investing may involve certain risks, including currency fluctuations, risks associated with possible differences in financial accounting standards and other monetary and political risks. Significant levels of foreign taxes, including potentially confiscatory levels of taxation and withholding taxes, may also apply to some foreign investments.
Investing in emerging markets may involve greater risks than investing in more developed countries. In addition, concentration of investments in a single region may result in greater volatility.
22
Fund Profile – Columbia Balanced Fund
Summary
g For the 12-month period that ended August 31, 2009, the fund's Class A shares returned negative 4.03% without sales charge.
g Bonds reported positive returns during the period, but the fund's overall return was brought down by the weak performance of the stock market.
g Although returns from broad stock market indices were sharply negative, the defensive positioning of the fund's equity component helped reduce losses.
Portfolio Management
Columbia Balanced Fund is managed by a manager from Columbia's large-cap core team:
Guy W. Pope
and by managers from Columbia's bond team:
Leonard A. Aplet Ronald B. Stahl Kevin L. Cronk
Guy W. Pope has co-managed the fund since 1997 and has been with the advisor or its predecessors since 1993.
Leonard A. Aplet has co-managed the fund since 1991 and has been with the advisor or its predecessors since 1987.
Ronald B. Stahl has co-managed the fund since 2005 and has been with the advisor or its predecessors since 1998.
Kevin L. Cronk has co-managed the fund since 2006 and has been with the advisor or its predecessors since 1999.
1The Standard & Poor's (S&P) 500® Index tracks the performance of 500 widely held, large-capitalization U.S. stocks.
2The Barclays Capital Aggregate Bond Index is a market value-weighted index that tracks the daily price, coupon, pay-downs, and total return performance of fixed-rate, publicly placed, dollar-denominated, and non-convertible investment grade debt issues with at least $250 million par amount outstanding and with at least one year to final maturity.
Indices are not available for investment, are not professionally managed and do not reflect sales charges, fees, brokerage commissions, taxes or other expenses of investing. Securities in the fund may not match those in an index.
Performance data quoted represents past performance and current performance may be lower or higher. Past performance is no guarantee of future results. The investment return and principal value will fluctuate so that shares, when redeemed, may be worth more or less than the original cost. Please visit www.columbiafunds.com for daily and most recent month-end performance updates.
Summary
1-year return as of 08/31/09
| | –4.03% | |
|
| |  | | | Class A shares
(without sales charge) | |
|
| | | | | –18.25% | |
|
| |  | | | S&P 500® Index1 | |
|
| | | | | +7.94% | |
|
| |  | | | Barclays Capital
Aggregate Bond Index2 | |
|
23
Performance Information – Columbia Balanced Fund
Performance data quoted represents past performance and current performance may be lower or higher. Past performance is no guarantee of future results. The investment return and principal value will fluctuate so that shares, when redeemed, may be worth more or less than the original cost. Please visit www.columbiafunds.com for daily and most recent month-end performance updates.
Annual operating expense ratio (%)*
| Class A | | | 1.00 | | |
| Class B | | | 1.75 | | |
| Class C | | | 1.75 | | |
| Class Z | | | 0.75 | | |
* The annual operating expense ratio is as stated in the fund's prospectus that is current as of the date of this report. Differences in expense ratios disclosed elsewhere in this report may result from including fee waivers and expense reimbursements as well as different time periods used in calculating the ratios.
Performance of a $10,000 investment 09/01/99 – 08/31/09
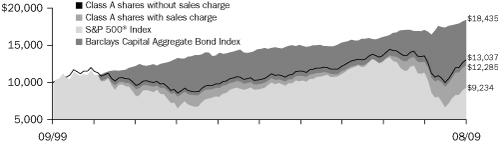 | |
|
The chart above shows the change in value of a hypothetical $10,000 investment in Class A shares of Columbia Balanced Fund during the stated time period, and does not reflect the deduction of taxes that a shareholder may pay on fund distributions or on the redemption of fund shares. The Standard & Poor's (S&P) 500® Index tracks the performance of 500 widely held, large-capitalization U.S. stocks. The Barclays Capital Aggregate Bond Index is a market value-weighted index that tracks the daily price, coupon, pay-downs, and total return performance of fixed-rate, publicly placed, dollar-denominated, and non-convertible investment grade debt issues with at least $250 million par amount outstanding and with at least one year to final maturity. Indices are not available for investm ent, are not professionally managed and do not reflect sales charges, fees, brokerage commissions, taxes or other expenses of investing. Securities in the fund may not match those in an index.
Performance of a $10,000 investment 09/01/99 – 08/31/09 ($)
| Sales charge | | without | | with | |
| Class A | | | 13,037 | | | | 12,285 | | |
| Class B | | | 12,378 | | | | 12,378 | | |
| Class C | | | 12,378 | | | | 12,378 | | |
| Class Z | | | 13,290 | | | | n/a | | |
Average annual total return as of 08/31/09 (%)
| Share class | | A | | B | | C | | Z | |
| Inception | | 11/01/02 | | 11/01/02 | | 10/13/03 | | 10/01/91 | |
| Sales charge | | without | | with | | without | | with | | without | | with | | without | |
| 1-year | | | –4.03 | | | | –9.57 | | | | –4.82 | | | | –9.49 | | | | –4.77 | | | | –5.71 | | | | –3.87 | | |
| 5-year | | | 4.83 | | | | 3.59 | | | | 4.03 | | | | 3.69 | | | | 4.04 | | | | 4.04 | | | | 5.08 | | |
| 10-year | | | 2.69 | | | | 2.08 | | | | 2.16 | | | | 2.16 | | | | 2.16 | | | | 2.16 | | | | 2.89 | | |
Average annual total return as of 09/30/09 (%)
| Share class | | A | | B | | C | | Z | |
| Sales charge | | without | | with | | without | | with | | without | | with | | without | |
| 1-year | | | 6.03 | | | | –0.05 | | | | 5.20 | | | | 0.20 | | | | 5.20 | | | | 4.20 | | | | 6.25 | | |
| 5-year | | | 5.33 | | | | 4.09 | | | | 4.53 | | | | 4.20 | | | | 4.53 | | | | 4.53 | | | | 5.58 | | |
| 10-year | | | 3.08 | | | | 2.47 | | | | 2.55 | | | | 2.55 | | | | 2.55 | | | | 2.55 | | | | 3.28 | | |
The "with sales charge" returns include the maximum initial sales charge of 5.75% for Class A shares and the applicable contingent deferred sales charge of 5.00% in the first year, declining to 1.00% in the sixth year and eliminated thereafter for Class B shares and 1.00% for Class C shares for the first year only. The "without sales charge" returns do not include the effect of sales charges. If they had, returns would be lower.
Performance results reflect any fee waivers or reimbursements of fund expenses by the investment advisor and/or any of its affiliates. Absent these fee waivers or expense reimbursement arrangements, performance results would have been lower.
All results shown assume reinvestment of distributions. Class Z shares are sold at net asset value with no distribution and service (Rule 12b-1) fees. Class Z shares have limited eligibility and the investment minimum requirements may vary. Please see the fund's prospectus for details. Performance for different share classes will vary based on differences in sales charges and fees associated with each class.
The tables do not reflect the deduction of taxes that a shareholder may pay on fund distributions or on the redemption of fund shares.
Class A, Class B and Class C are newer classes of shares. Class A and Class B share performance information includes the performance of Class Z shares (the oldest existing share class) for periods prior to their inception. Class C share performance information includes returns of Class B shares for the period from November 1, 2002 through October 12, 2003, and the returns of Class Z shares for periods prior thereto. These returns reflect differences in sales charges, but have not been restated to reflect any differences in expenses (such as distribution and service (Rule 12b-1) fees) between Class Z shares and the newer classes of shares. If differences in expenses had been reflected, the returns shown for periods prior to the inception of the newer classes of shares would have been lower, since the newer classes of shares are subject to distribution and service (Rule 12b-1) fees. Class A and Class B shares were initially offere d on November 1, 2002, Class C shares were initially offered on October 13, 2003 and Class Z shares were initially offered on October 1, 1991.
24
Understanding Your Expenses – Columbia Balanced Fund
As a fund shareholder, you incur two types of costs. There are transaction costs, which generally include sales charges on purchases and may include redemption fees or exchange fees. There are also ongoing costs, which generally include investment advisory fees, distribution and service (Rule 12b-1) fees and other fund expenses. The information on this page is intended to help you understand the ongoing costs of investing in the fund and to compare these costs with the ongoing costs of investing in other mutual funds.
Analyzing your fund's expenses by share class
To illustrate these ongoing costs, we have provided an example and calculated the expenses paid by investors in each share class during the period. The information in the following table is based on an initial investment of $1,000, which is invested at the beginning of the period and held for the entire period. Expense information is calculated two ways and each method provides you with different information. The amount listed in the "Actual" column is calculated using the fund's actual operating expenses and total return for the period. The amount listed in the "Hypothetical" column for each share class assumes that the return each year is 5% before expenses and is calculated based on the fund's actual operating expenses. You should not use the hypothetical account values and expenses to estimate either your actual account balance at the end of the period or the expenses you paid during this period.
Compare with other funds
Since all mutual funds are required to include the same hypothetical calculations about expenses in shareholder reports, you can use this information to compare the ongoing costs of investing in the fund with other funds. To do so, compare the 5% hypothetical example with the 5% hypothetical examples that appear in the shareholder reports of other funds. As you compare hypothetical examples of other funds, it is important to note that hypothetical examples are meant to highlight the ongoing costs of investing in a fund and do not reflect any transaction costs, such as sales charges, redemption fees or exchange fees.
Estimating your actual expenses
To estimate the expenses that you paid over the period, first you will need your account balance at the end of the period:
g For shareholders who receive their account statements from Columbia Management Services, Inc., your account balance is available online at www.columbiafunds.com or by calling Shareholder Services at 800.345.6611.
g For shareholders who receive their account statements from their financial intermediary, contact your financial intermediary to obtain your account balance.
1. Divide your ending account balance by $1,000. For example, if an account balance was $8,600 at the end of the period, the result would be 8.6.
2. In the section of the table below titled "Expenses paid during the period," locate the amount for your share class. You will find this number in the column labeled "Actual." Multiply this number by the result from step 1. Your answer is an estimate of the expenses you paid on your account during the period.
If the value of your account falls below the minimum initial investment requirement applicable to you, your account generally will be subject to a $20 annual fee. This fee is not included in the accompanying table. If you are subject to the fee, keep it in mind when you are estimating the ongoing expenses of investing in the fund and when comparing the expenses of this fund with other funds.
03/01/09 – 08/31/09
| | | Account value at the
beginning of the period ($) | | Account value at the
end of the period ($) | | Expenses paid
during the period ($) | | Fund's annualized
expense ratio (%) | |
| | | Actual | | Hypothetical | | Actual | | Hypothetical | | Actual | | Hypothetical | | Actual | |
| Class A | | | 1,000.00 | | | | 1,000.00 | | | | 1,307.71 | | | | 1,020.01 | | | | 5.99 | | | | 5.24 | | | | 1.03 | | |
| Class B | | | 1,000.00 | | | | 1,000.00 | | | | 1,302.31 | | | | 1,016.23 | | | | 10.33 | | | | 9.05 | | | | 1.78 | | |
| Class C | | | 1,000.00 | | | | 1,000.00 | | | | 1,302.21 | | | | 1,016.23 | | | | 10.33 | | | | 9.05 | | | | 1.78 | | |
| Class Z | | | 1,000.00 | | | | 1,000.00 | | | | 1,308.41 | | | | 1,021.27 | | | | 4.54 | | | | 3.97 | | | | 0.78 | | |
Expenses paid during the period are equal to the annualized expense ratio for the share class, multiplied by the average account value over the period, then multiplied by the number of days in the fund's most recent fiscal half-year and divided by 365.
It is important to note that the expense amounts shown in the table are meant to highlight only ongoing costs of investing in the fund and do not reflect any transaction costs, such as sales charges, redemption fees or exchange fees. Therefore, the hypothetical examples provided may not help you determine the relative total costs of owning shares of different funds. If these transaction costs were included, your costs would have been higher.
25
Portfolio Managers' Report – Columbia Balanced Fund
Performance data quoted represents past performance and current performance may be lower or higher. Past performance is no guarantee of future results. The investment return and principal value will fluctuate so that shares, when redeemed, may be worth more or less than the original cost. Please visit www.columbiafunds.com for daily and most recent month-end performance updates.
Net asset value per share
as of 08/31/09 ($)
| Class A | | | 22.46 | | |
| Class B | | | 22.41 | | |
| Class C | | | 22.42 | | |
| Class Z | | | 22.43 | | |
Distributions declared per share
09/01/08 – 08/31/09 ($)
| Class A | | | 0.52 | | |
| Class B | | | 0.37 | | |
| Class C | | | 0.37 | | |
| Class Z | | | 0.57 | | |
For the 12-month period that ended August 31, 2009, the fund's Class A shares returned negative 4.03% without sales charge. The S&P 500® Index returned negative 18.25% and the Barclays Capital Aggregate Bond Index returned 7.94%. The fund held up significantly better than the average fund in its peer group, the Lipper Mixed-Asset Target Allocation Growth Funds Classification,1 which returned negative 10.83%. Both the fixed-income and equity portions of the fund outperformed their respective benchmarks.
A weak stock market drove negative returns for the period
Despite a substantial rally in the second half of the period, a weak stock market was the most important determinant of fund performance. The fund's relatively conservative orientation helped it avoid some of the market's worst pitfalls. For example, in the financials sector, the fund's focus on JPMorgan Chase and Goldman Sachs Group was beneficial as they held up far better than less well-capitalized competitors. We initiated a position in real estate broker CB Richard Ellis in the second half of the period, in time to enjoy a significant rebound. Other successful second-half purchases included utility company AES and beleaguered telecommunications giant Sprint Nextel, which was sold from the portfolio after achieving a triple-digit gain in a matter of months.
The biggest disappointments among the fund's equity holdings came from the energy and industrials sectors. Offshore drilling company Transocean suffered from a sharp pullback in exploration activity, while General Electric suffered on both the finance and industrial sides. We held General Electric throughout the 12-month period but trimmed the fund's holdings. Stock selection in the health care area also hurt performance, with Thermo Fisher Scientific declining more than 25%.
Fixed-income performance added value to fund
The fund's fixed-income investments performed well versus their benchmark for the period. While Treasury securities outperformed most other sectors in the first half of the period, corporate bonds and other sectors with higher risk profiles proved more profitable in the second half. In particular, the fund's investments in the media, natural gas and wireless industries outperformed the broader corporate market for the year. Brokerage, finance and insurance sector holdings produced less favorable results, particularly during the credit crisis of late 2008. However, we have slowly added to these sectors as we believe their fundamental prospects improved.
1Lipper Inc., a widely respected data provider in the industry, calculates an average total return (assuming reinvestment of distributions) for mutual funds with investment objectives similar to those of the fund. Lipper makes no adjustment for the effect of sales loads.
26
Portfolio Managers' Report (continued) – Columbia Balanced Fund
Looking ahead
We expect that the Federal Reserve will retain its position on monetary policy to accommodate growth for some time, as they have expressed that the need to stimulate growth is a greater near-term concern than the inflationary potential inherent in a large-scale stimulus package. The portfolio remains underweight in Treasury securities, in keeping with the strategy that served it well during the first half of 2009. The fund's investments in asset-backed securities and commercial mortgage-backed securities have benefited from inclusion in the government's TALF program, and the CMBS sector in particular remains attractively priced because of its relatively late entry into the program. Within the MBS sector we favor securities that are agency guaranteed versus non-agency guaranteed securities.
Portfolio holdings and characteristics are subject to change periodically and may not be representative of current holdings and characteristics. The outlook for the fund may differ from those presented for other Columbia Funds.
Equity investments are affected by stock market fluctuations that occur in response to economic and business developments.
Investing in fixed-income securities may involve certain risks, including the credit quality of individual issuers, possible prepayments, market or economic developments and yield and share price fluctuations due to changes in interest rates. When interest rates go up, bond prices typically drop, and vice versa.
Investments in high-yield or "junk" bonds offer the potential for higher income than investments in investment-grade bonds, but also involves a higher degree of risk. Changes in economic conditions or other circumstances may adversely affect a high-yield bond issuer's ability to make timely principal and interest payments.
Top 10 equity holdings
as of 08/31/09 (%)
| Microsoft | | | 2.1 | | |
| JPMorgan Chase | | | 2.0 | | |
| Philip Morris International | | | 2.0 | | |
| Google | | | 1.7 | | |
| Wells Fargo | | | 1.7 | | |
| Chevron | | | 1.6 | | |
| Abbott Laboratories | | | 1.6 | | |
| Hewlett-Packard | | | 1.6 | | |
| Goldman Sachs Group | | | 1.5 | | |
| Apple | | | 1.5 | | |
Portfolio composition
as of 08/31/09 (%)
| Common Stock | | | 64.1 | | |
| Mortgage Backed Securities | | | 11.0 | | |
Corporate Fixed-Income
Bonds & Notes | | | 9.6 | | |
Government & Agency
Obligations | | | 5.3 | | |
Commercial Mortgage-Backed
Securities | | | 3.7 | | |
Collateralized Mortgage
Obligations | | | 2.3 | | |
| Asset-Backed Securities | | | 1.2 | | |
| Cash & Equivalents | | | 2.8 | | |
Holdings discussed in this report
as of 08/31/09 (%)
| JPMorgan Chase | | | 2.0 | | |
| Goldman Sachs Group | | | 1.5 | | |
| CB Richard Ellis | | | 0.4 | | |
| AES | | | 0.7 | | |
| Transocean | | | 0.8 | | |
| General Electric | | | 0.5 | | |
| Thermo Fisher Scientific | | | 0.9 | | |
The fund is actively managed and the composition of its portfolio will change over time. Information provided is calculated as a percentage of net assets.
27
Fund Profile – Columbia Oregon Intermediate Municipal Bond Fund
Performance data quoted represents past performance and current performance may be lower or higher. Past performance is no guarantee of future results. The investment return and principal value will fluctuate so that shares, when redeemed, may be worth more or less than the original cost. Please visit www.columbiafunds.com for daily and most recent month-end performance updates.
Summary
1-year return as of 08/31/09
| | | | | +4.70% | |
|
| |  | | | Class A shares
(without sales charge) | |
|
| | | | | +6.58% | |
|
| |  | | | Barclays Capital 3-15 Year Blend Municipal Bond Index | |
|
| | | | | +6.50% | |
|
| |  | | | Barclays Capital General
Obligation Bond Index | |
|
Morningstar Style BoxTM
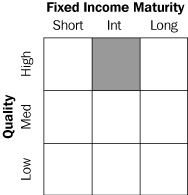
The Morningstar Style BoxTM reveals a fund's investment strategy. For fixed-income funds, the vertical axis shows the average credit quality of the bonds owned, and the horizontal axis shows interest rate sensitivity as measured by a bond's duration (short, intermediate or long). Information shown is based on the most recent data provided by Morningstar.
Summary
g For the 12-month period that ended August 31, 2009, the fund's Class A shares returned 4.70% without sales charge.
g The fund underperformed its benchmarks, the Barclays Capital 3-15 Year Blend Municipal Bond Index and the Barclays Capital General Obligation Bond Index1 but performed in line with the average fund in its peer group, the Lipper Other States Intermediate Municipal Debt Funds Classification.2
g Pre-refunded issues and general obligation bonds of the state and certain municipalities aided returns, while non-rated holdings, hospital and multi-family housing bonds detracted from results.
Portfolio Management
Brian M. McGreevy has managed the fund since 2003 and has been with the advisor and its predecessors since 1994.
1The Barclays Capital 3-15 Year Blend Municipal Bond Index tracks the performance of municipal bonds issued after December 31, 1990 with remaining maturities between 2 and 17 years and at least $5 million in principal amount outstanding. The Barclays Capital General Obligation Bond Index is an index that represents average market-weighted performance of general obligations securitites that have been issued in the last five years with maturities greater than one year. Indices are not available for investment, are not professionally managed and do not reflect sales charges, fees, brokerage commissions, taxes or other expenses of investing. Securities in the fund may not match those in an index.
2Lipper Inc., a widely respected data provider in the industry, calculates an average total return (assuming reinvestment of distributions) for mutual funds with investment objectives similar to those of the fund. Lipper makes no adjustment for the effect of sales loads.
28
Performance Information – Columbia Oregon Intermediate Municipal Bond Fund
Performance of a $10,000 investment 09/01/99 – 08/31/09
 | |
|
The chart above shows the change in value of a hypothetical $10,000 investment in Class A shares of Columbia Oregon Intermediate Municipal Bond Fund during the stated time period, and does not reflect the deduction of taxes that a shareholder may pay on fund distributions or on the redemption of fund shares. The growth of $10,000 with sales charge for Class A is calculated with an initial sales charge of 4.75%. The Barclays Capital 3-15 Year Blend Municipal Bond Index tracks the performance of municipal bonds issued after December 31, 1990 with remaining maturities between 2 and 17 years and at least $5 million in principal amount outstanding. The Barclays Capital General Obligation Bond Index is an index that represents average market-weighted performance of general obligations securities that have been issued in the last five years with maturities greater than one year. Indices are not available for investment, are not profess ionally managed and do not reflect sales charges, fees, brokerage commissions, taxes or other expenses of investing. Securities in the fund may not match those in an index.
Performance of a $10,000 investment 09/01/99 – 08/31/09 ($)
| Sales charge | | without | | with | |
| Class A | | | 15,841 | | | | 15,089 | | |
| Class B | | | 15,054 | | | | 15,054 | | |
| Class C | | | 15,365 | | | | 15,365 | | |
| Class Z | | | 16,148 | | | | n/a | | |
Average annual total return as of 08/31/09 (%)
| Share class | | A | | B | | C | | Z | |
| Inception | | 11/01/02 | | 11/01/02 | | 10/13/03 | | 07/02/84 | |
| Sales charge | | without | | with | | without | | with | | without | | with | | without | |
| 1-year | | | 4.70 | | | | 1.26 | | | | 3.92 | | | | 0.92 | | | | 4.28 | | | | 3.28 | | | | 4.96 | | |
| 5-year | | | 3.40 | | | | 2.40 | | | | 2.63 | | | | 2.63 | | | | 2.99 | | | | 2.99 | | | | 3.66 | | |
| 10-year | | | 4.71 | | | | 4.20 | | | | 4.18 | | | | 4.18 | | | | 4.39 | | | | 4.39 | | | | 4.91 | | |
Average annual total return as of 09/30/09 (%)
| Share class | | A | | B | | C | | Z | |
| Sales charge | | without | | with | | without | | with | | without | | with | | without | |
| 1-year | | | 10.92 | | | | 7.33 | | | | 10.10 | | | | 7.10 | | | | 10.49 | | | | 9.49 | | | | 11.20 | | |
| 5-year | | | 3.83 | | | | 2.83 | | | | 3.06 | | | | 3.06 | | | | 3.42 | | | | 3.42 | | | | 4.10 | | |
| 10-year | | | 4.96 | | | | 4.45 | | | | 4.42 | | | | 4.42 | | | | 4.64 | | | | 4.64 | | | | 5.17 | | |
The "with sales charge" returns include the maximum initial sales charge of 3.25% for Class A shares and the applicable contingent deferred sales charge of 3.00% in the first year, declining to 1.00% in the fourth year and eliminated thereafter for Class B shares and 1.00% for Class C shares for the first year only. The "without sales charge" returns do not include the effect of sales charges. If they had, returns would be lower.
The 5 & 10-year Class A average annual returns with sales charge as of 08/31/09 and 09/30/09 include the previous sales charge of 4.75%. The 1-year Class A average annual return with sales charge as of 08/31/09 and 09/30/09 includes the new sales charge of 3.25%. This change was effective beginning August 22, 2005.
Performance results reflect any fee waivers or reimbursements of fund expenses by the investment advisor and/or any of its affiliates. Absent these fee waivers or expense reimbursement arrangements, performance results would have been lower.
All results shown assume reinvestment of distributions. Class Z shares are sold at net asset value with no distribution and service (Rule 12b-1) fees. Class Z shares have limited eligibility and the investment minimum requirements may vary. Please see the fund's prospectus for details. Performance for different share classes will vary based on differences in sales charges and fees associated with each class.
The tables do not reflect the deduction of taxes that a shareholder may pay on fund distributions or on the redemption of fund shares.
Class A, Class B and Class C are newer classes of shares. Class A and Class B share performance information includes the performance of Class Z shares (the oldest existing share class) for periods prior to their inception. Class C share performance information includes returns of Class B shares for the period from November 1, 2002 through October 12, 2003, and the returns of Class Z shares for periods prior thereto. These returns reflect differences in sales charges, but have not been restated to reflect any differences in expenses (such as distribution and service (Rule 12b-1) fees) between Class Z shares and the newer classes of shares. If differences in expenses had been reflected, the returns shown for periods prior to the inception of the newer classes of shares would have been lower, since the newer classes of shares are subject to distribution and service (Rule 12b-1) fees. Class A and Class B shares were initially offere d on November 1, 2002, Class C shares were initially offered on October 13, 2003 and Class Z shares were initially offered on July 2, 1984.
Performance data quoted represents past performance and current performance may be lower or higher. Past performance is no guarantee of future results. The investment return and principal value will fluctuate so that shares, when redeemed, may be worth more or less than the original cost. Please visit www.columbiafunds.com for daily and most recent month-end performance updates.
Annual operating expense ratio (%)*
| Class A | | | 0.87 | | |
| Class B | | | 1.62 | | |
| Class C | | | 1.62 | | |
| Class Z | | | 0.62 | | |
Annual operating expense ratio
after contractual waivers (%)*
| Class A | | | 0.75 | | |
| Class B | | | 1.50 | | |
| Class C | | | 1.50 | | |
| Class Z | | | 0.50 | | |
* The annual operating expense ratio and annual operating expense ratio after contractual waivers are as stated in the fund's prospectus that is current as of the date of this report and include the expenses incurred by the investment companies in which the fund invests. The contractual waiver expires 12/31/09. Differences in expense ratios disclosed elsewhere in this report may result from including expenses incurred by the investment companies, fee waivers and expense reimbursements as well as different time periods used in calculating the ratios.
29
Understanding Your Expenses – Columbia Oregon Intermediate Municipal Bond Fund
Estimating your actual expenses
To estimate the expenses that you paid over the period, first you will need your account balance at the end of the period:
g For shareholders who receive their account statements from Columbia Management Services, Inc., your account balance is available online at www.columbiafunds.com or by calling Shareholder Services at 800.345.6611.
g For shareholders who receive their account statements from their financial intermediary, contact your financial intermediary to obtain your account balance.
1. Divide your ending account balance by $1,000. For example, if an account balance was $8,600 at the end of the period, the result would be 8.6.
2. In the section of the table below titled "Expenses paid during the period," locate the amount for your share class. You will find this number in the column labeled "Actual." Multiply this number by the result from step 1. Your answer is an estimate of the expenses you paid on your account during the period.
If the value of your account falls below the minimum initial investment requirement applicable to you, your account generally will be subject to a $20 annual fee. This fee is not included in the accompanying table. If you are subject to the fee, keep it in mind when you are estimating the ongoing expenses of investing in the fund and when comparing the expenses of this fund with other funds.
As a fund shareholder, you incur two types of costs. There are transaction costs, which generally include sales charges on purchases and may include redemption fees or exchange fees. There are also ongoing costs, which generally include investment advisory fees, distribution and service (Rule 12b-1) fees and other fund expenses. The information on this page is intended to help you understand the ongoing costs of investing in the fund and to compare these costs with the ongoing costs of investing in other mutual funds.
Analyzing your fund's expenses by share class
To illustrate these ongoing costs, we have provided an example and calculated the expenses paid by investors in each share class during the period. The information in the following table is based on an initial investment of $1,000, which is invested at the beginning of the period and held for the entire period. Expense information is calculated two ways and each method provides you with different information. The amount listed in the "Actual" column is calculated using the fund's actual operating expenses and total return for the period. The amount listed in the "Hypothetical" column for each share class assumes that the return each year is 5% before expenses and is calculated based on the fund's actual operating expenses. You should not use the hypothetical account values and expenses to estimate either your actual account balance at the end of the period or the expenses you paid during this period.
Compare with other funds
Since all mutual funds are required to include the same hypothetical calculations about expenses in shareholder reports, you can use this information to compare the ongoing costs of investing in the fund with other funds. To do so, compare the 5% hypothetical example with the 5% hypothetical examples that appear in the shareholder reports of other funds. As you compare hypothetical examples of other funds, it is important to note that hypothetical examples are meant to highlight the ongoing costs of investing in a fund and do not reflect any transaction costs, such as sales charges, redemption fees or exchange fees.
03/01/09 – 08/31/09
| | | Account value at the
beginning of the period ($) | | Account value at the
end of the period ($) | | Expenses paid
during the period ($) | | Fund's annualized
expense ratio (%) | |
| | | Actual | | Hypothetical | | Actual | | Hypothetical | | Actual | | Hypothetical | | Actual | |
| Class A | | | 1,000.00 | | | | 1,000.00 | | | | 1,036.20 | | | | 1,021.42 | | | | 3.85 | | | | 3.82 | | | | 0.75 | | |
| Class B | | | 1,000.00 | | | | 1,000.00 | | | | 1,032.31 | | | | 1,017.64 | | | | 7.68 | | | | 7.63 | | | | 1.50 | | |
| Class C | | | 1,000.00 | | | | 1,000.00 | | | | 1,034.08 | | | | 1,019.41 | | | | 5.90 | | | | 5.85 | | | | 1.15 | | |
| Class Z | | | 1,000.00 | | | | 1,000.00 | | | | 1,037.51 | | | | 1,022.68 | | | | 2.57 | | | | 2.55 | | | | 0.50 | | |
Expenses paid during the period are equal to the annualized expense ratio for the share class, multiplied by the average account value over the period, then multiplied by the number of days in the fund's most recent fiscal half-year and divided by 365.
Had the investment advisor and/or any of its affiliates not waived fees or reimbursed a portion of expenses, account value at the end of the period would have been reduced.
It is important to note that the expense amounts shown in the table are meant to highlight only ongoing costs of investing in the fund and do not reflect any transaction costs, such as sales charges, redemption fees or exchange fees. Therefore, the hypothetical examples provided may not help you determine the relative total costs of owning shares of different funds. If these transaction costs were included, your costs would have been higher.
30
Portfolio Manager's Report – Columbia Oregon Intermediate Municipal Bond Fund
For the 12-month period that ended August 31, 2009, Columbia Oregon Intermediate Municipal Bond Fund Class A shares returned 4.70% without sales charge. The fund's benchmarks, the Barclays Capital 3-15 Year Blend Municipal Bond Index and the Barclays Capital General Obligation Bond Index, returned 6.58% and 6.50%, respectively. The average return of funds in the Lipper Other States Intermediate Municipal Debt Funds Classification was 4.72%. The fund's emphasis on pre-refunded bonds was an important factor in its positive results. However, its focus on shorter maturity pre-refunded issues held back performance relative to its benchmarks.
A period of heightened volatility
Market turmoil accelerated late in 2008 as the failure of several prominent financial institutions coincided with a deepening recession. Investor tolerance for risk dried up, with all sectors of the fixed-income markets, except for Treasuries, experiencing bouts of extraordinary weakness. As a result, prices fell across many sectors and the difference in yield between AAA- and BBB-rated bonds expanded by as much as four full percentage points. Quality and performance generally moved in tandem, with AAA-rated issues showing solid returns while BBB issues suffered declines. As the period closed, market conditions improved significantly, narrowing the spread between yields on high and lower quality issues from their extreme levels, although it remained historically wide.
Pre-refunded and general obligation bonds stood out
The fund's emphasis on pre-refunded bonds, which accounted for approximately 20% of the portfolio, was an important factor in its positive results. Pre-refunded bonds are backed by escrowed funds sufficient to pay off the entire issue at maturity. However, the fund's focus on shorter maturity pre-refunded issues held back performance relative to its benchmarks. Pre-refunded bonds in the four-to-seven year maturity range, where the benchmarks had greater exposure, outperformed the one-to-three year issues that the fund stressed.
AA-rated local general obligation bonds also contributed positively, as higher quality issues found increased support. The fund's sizeable commitment to longer-maturity zero-coupon bonds also boosted returns as interest rates fell and prices rose for much of the period. Zero coupon issues are sold at deep discount and pay no current income. As such, they are exceptionally sensitive to changing interest rates. As long-term rates declined, the value of these bonds rose. The fund also benefited from having minimal exposure to Puerto Rico bonds and to bonds subject to the AMT (Alternative Minimum Tax), which lagged other segments of the municipal market because of lower quality and lack of demand, respectively.
Non-rated issues disappointed
Non-rated bonds, which make up about seven percent of the fund's holdings compared to close to zero in the benchmarks, lost value as investors shied away from risk and the uncertainty associated with non-rated bonds. Some issuers choose not to apply for ratings because of related fees and administrative costs, and some issues are too small to meet rating company requirements. However, we believe that many of the fund's non-rated holdings would merit investment grade ratings, and we have maintained the fund's
Performance data quoted represents past performance and current performance may be lower or higher. Past performance is no guarantee of future results. The investment return and principal value will fluctuate so that shares, when redeemed, may be worth more or less than the original cost. Please visit www.columbiafunds.com for daily and most recent month-end performance updates.
Net asset value per share
as of 08/31/09 ($)
| Class A | | | 12.17 | | |
| Class B | | | 12.17 | | |
| Class C | | | 12.17 | | |
| Class Z | | | 12.17 | | |
Distribution declared per share
09/01/08 – 08/31/09 ($)
| Class A | | | 0.45 | | |
| Class B | | | 0.36 | | |
| Class C | | | 0.40 | | |
| Class Z | | | 0.48 | | |
A portion of the fund's income may be subject to the alternative minimum tax. The fund may at times purchase tax-exempt securities at a discount. Some or all of this discount may be included in the fund's ordinary income, and is taxable when distributed.
31
Portfolio Manager's Report (continued) – Columbia Oregon Intermediate Municipal Bond Fund
30-day SEC yields
as of 08/31/09 (%)
| Class A | | | 2.35 | | |
| Class B | | | 1.72 | | |
| Class C | | | 2.07 | | |
| Class Z | | | 2.71 | | |
The 30-day SEC yields reflect the portfolio's earning power, net of expenses, expressed as an annualized percentage of the public offering price per share at the end of the period.
Taxable-equivalent SEC yields
as of 08/31/09 (%)
| Class A | | | 3.97 | | |
| Class B | | | 2.90 | | |
| Class C | | | 3.49 | | |
| Class Z | | | 4.58 | | |
Taxable-equivalent SEC yields are based on the combined maximum effective 35.0% federal income tax rate and applicable state income tax rate. This tax rate does not reflect the phase out of exemptions or the reduction of otherwise allowable deductions that occur when adjusted gross income exceeds certain levels.
Top 5 sectors
as of 08/31/09 (%)
| Tax-Backed | | | 44.7 | | |
| Refunded/Escrowed | | | 20.2 | | |
| Utilities | | | 8.5 | | |
| Health Care | | | 8.2 | | |
| Education | | | 5.4 | | |
Portfolio quality
as of 08/31/09 (%)
| AAA | | | 17.6 | | |
| AA | | | 50.4 | | |
| A | | | 20.8 | | |
| BBB | | | 4.6 | | |
| Non Rated | | | 6.6 | | |
Ratings shown in the quality breakdown represent the rating assigned to a particular bond by one of the following nationally-recognized rating agencies: Standard and Poor's, Moody's Investors Service, Inc. or Fitch Ratings Ltd. Ratings are relative and subjective and are not absolute standards of quality. The fund's credit quality does not remove market risk.
Maturity breakdown
as of 08/31/09 (%)
| 0-1 year | | | 5.6 | | |
| 1-3 years | | | 16.6 | | |
| 3-5 years | | | 13.0 | | |
| 5-7 years | | | 8.1 | | |
| 7-10 years | | | 15.7 | | |
| 10-15 years | | | 21.9 | | |
| 15-20 years | | | 11.5 | | |
| 20-25 years | | | 2.9 | | |
| 25+ years | | | 0.5 | | |
| Net Cash & Equivalents | | | 4.2 | | |
The fund is actively managed and the composition of its portfolio will change over time. Information provided is calculated as a percentage of net assets.
position. BBB-rated bonds tied to multi-family housing and hospital issues also detracted from the fund's returns.
Seeking to enhance yield
In an effort to enhance the fund's yield, we increased exposure to general obligations bonds in the 10- to 15-year maturity range while cutting back shorter-term holdings, where rising prices have driven yields below one percent. We also decreased the fund's position in bonds subject to near-term calls. In addition, we shed some pre-refunded exposure while expanding the fund's exposure to the A/BBB quality ranges, where opportunities appear to be more attractive.
Positive and negative influences on Oregon's economy appear roughly in balance. The pace of job losses has slackened, inventories of unsold homes have shrunk and the bulk of the state's federal stimulus funds are just now arriving. Still, unemployment and housing remain concerns, keeping pressure on state and local budgets. In that setting, we believe that careful credit selection remains the key to finding value for the portfolio. Unusually light flows of new issues in Oregon are adding to the challenge of finding new commitments of appropriate size.
Portfolio holdings and characteristics are subject to change periodically and may not be representative of current holdings and characteristics. The outlook for the fund may differ from those presented for other Columbia Funds.
Tax-exempt investing offers current tax-exempt income, but it also involves certain risks. The value of the fund will be affected by interest rate changes and the creditworthiness of issues held in the fund. When interest rates go up, bond prices generally drop and vice versa.
Interest income from certain tax-exempt bonds may be subject to certain state and local taxes and, if applicable, the alternative minimum tax. Capital gains are not exempt from income taxes.
Single-state municipal bond funds pose additional risks, due to limited geographical diversification.
32
Fund Profile – Columbia Conservative High Yield Fund
Summary
g For the 12-month period that ended August 31, 2009, the fund's Class A shares returned 0.91% without sales charge.
g The fund underperformed its benchmark, the JPMorgan Developed BB High Yield Index,1 but outperformed the average of return of its peer group, the Lipper High Current Yield Funds Classification.2
g The fund's quality orientation versus its benchmark and peer group drove its relative returns throughout the period.
Portfolio Management
Kevin L. Cronk, CFA has co-managed the fund since 2005 and has been with the advisor or its predecessors since 1999.
1The JPMorgan Developed BB High Yield Index is designed to mirror the investable universe of the U.S. dollar developed, BB-rated, high yield corporate debt market. Indices are not available for investment, are not professionally managed and do not reflect sales charges, fees, brokerage commissions, taxes or other expenses of investing. Securities in the fund may not match those in an index.
2Lipper Inc., a widely respected data provider in the industry, calculates an average total return (assuming reinvestment of distributions) for mutual funds with investment objectives similar to those of the fund. Lipper makes no adjustment for the effect of sales loads.
Performance data quoted represents past performance and current performance may be lower or higher. Past performance is no guarantee of future results. The investment return and principal value will fluctuate so that shares, when redeemed, may be worth more or less than the original cost. Please visit www.columbiafunds.com for daily and most recent month-end performance updates.
Summary
1-year return as of 08/31/09
| | | | | +0.91% | |
|
| |  | | | Class A shares
(without sales charge) | |
|
| | | | | +6.51% | |
|
| |  | | | JPMorgan Developed
BB High Yield Index | |
|
Morningstar Style BoxTM
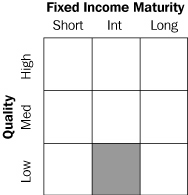
The Morningstar Style BoxTM reveals a fund's investment strategy. For fixed-income funds, the vertical axis shows the average credit quality of the bonds owned, and the horizontal axis shows interest rate sensitivity as measured by a bond's duration (short, intermediate or long). Information shown is based on the most recent data provided by Morningstar.
33
Performance Information – Columbia Conservative High Yield Fund
Performance data quoted represents past performance and current performance may be lower or higher. Past performance is no guarantee of future results. The investment return and principal value will fluctuate so that shares, when redeemed, may be worth more or less than the original cost. Please visit www.columbiafunds.com for daily and most recent month-end performance updates.
Annual operating expense ratio (%)*
| Class A | | | 1.14 | | |
| Class B | | | 1.89 | | |
| Class C | | | 1.89 | | |
| Class Y | | | 0.71 | | |
| Class Z | | | 0.89 | | |
* The annual operating expense ratio is as stated in the fund's prospectus that is current as of the date of this report. Differences in expense ratios disclosed elsewhere in this report may result from including fee waivers and expense reimbursements as well as different time periods used in calculating the ratios.
Performance of a $10,000 investment 09/01/99 – 08/31/09 ($)
The chart above shows the change in value of a hypothetical $10,000 investment in Class A shares of Columbia Conservative High Yield Fund during the stated time period, and does not reflect the deduction of taxes that a shareholder may pay on fund distributions or on the redemption of fund shares. The JPMorgan Developed BB High Yield Index is an index that is designed to mirror the investable universe of the U.S. dollar developed, BB-rated, high yield corporate debt market. Indices are not available for investment, are not professionally managed and do not reflect sales charges, fees, brokerage commissions, taxes or other expenses of investing. Securities in the fund may not match those in an index.
Performance of a $10,000 investment 09/01/99 – 08/31/09 ($)
| Sales charge | | without | | with | |
| Class A | | | 15,095 | | | | 14,375 | | |
| Class B | | | 14,328 | | | | 14,328 | | |
| Class C | | | 14,444 | | | | 14,444 | | |
| Class Y | | | 15,362 | | | | n/a | | |
| Class Z | | | 15,362 | | | | n/a | | |
Average annual total return as of 08/31/09 (%)
| Share class | | A | | B | | C | | Y | | Z | |
| Inception | | 11/01/02 | | 11/01/02 | | 10/13/03 | | 07/15/09 | | 10/01/93 | |
| Sales charge | | without | | with | | without | | with | | without | | with | | without | | without | |
| 1-year | | | 0.91 | | | | –3.89 | | | | 0.17 | | | | –4.50 | | | | 0.31 | | | | –0.62 | | | | 1.19 | | | | 1.17 | | |
| 5-year | | | 2.62 | | | | 1.63 | | | | 1.86 | | | | 1.55 | | | | 2.01 | | | | 2.01 | | | | 2.88 | | | | 2.87 | | |
| 10-year | | | 4.20 | | | | 3.70 | | | | 3.66 | | | | 3.66 | | | | 3.75 | | | | 3.75 | | | | 4.39 | | | | 4.39 | | |
Average annual total return as of 09/30/09 (%)
| Share class | | A | | B | | C | | Y | | Z | |
| Sales charge | | without | | with | | without | | with | | without | | with | | without | | without | |
| 1-year | | | 10.59 | | | | 5.29 | | | | 9.77 | | | | 4.77 | | | | 9.92 | | | | 8.92 | | | | 10.90 | | | | 10.86 | | |
| 5-year | | | 3.06 | | | | 2.06 | | | | 2.30 | | | | 1.99 | | | | 2.45 | | | | 2.45 | | | | 3.32 | | | | 3.31 | | |
| 10-year | | | 4.60 | | | | 4.09 | | | | 4.05 | | | | 4.05 | | | | 4.13 | | | | 4.13 | | | | 4.79 | | | | 4.78 | | |
The "with sales charge" returns include the maximum initial sales charge of 4.75% for Class A shares and the applicable contingent deferred sales charge of 5.00% in the first year, declining to 1.00% in the sixth year and eliminated thereafter for Class B shares and 1.00% for Class C shares for the first year only. The "without sales charge" returns do not include the effect of sales charges. If they had, returns would be lower.
Performance results reflect any fee waivers or reimbursements of fund expenses by the investment advisor and/or any of its affiliates. Absent these fee waivers or expense reimbursement arrangements, performance results would have been lower.
All results shown assume reinvestment of distributions. Class Y and Class Z shares are sold at net asset value with no distribution and service (Rule 12b-1) fees. Class Y and Class Z shares have limited eligibility and the investment minimum requirements may vary. Please see the fund's prospectus for details. Performance for different share classes will vary based on differences in sales charges and fees associated with each class.
The tables do not reflect the deduction of taxes that a shareholder may pay on fund distributions or on the redemption of fund shares.
Class A, Class B, Class C and Class Y are newer classes of shares. Class A, Class B and Class Y share performance information includes the performance of Class Z shares (the oldest existing share class) for periods prior to their inception. Class C share performance information includes returns of Class B shares for the period from November 1, 2002 through October 12, 2003, and the returns of Class Z shares for periods prior thereto. These returns reflect differences in sales charges, but have not been restated to reflect any differences in expenses (such as distribution and service (Rule 12b-1) fees) between Class Z shares and the newer classes of shares. If differences in expenses had been reflected, the returns shown for Class A, Class B, and Class C for periods during which Class Z share returns are included would have been lower, since these classes of shares are subject to distribution and service (Rule 12b-1) fees, and th e returns shown for Class Y shares would have been higher. Class A and Class B shares were initially offered on November 1, 2002, Class C shares were initially offered on October 13, 2003, Class Y shares were initially offered on July 15, 2009 and Class Z shares were initially offered on October 1, 1993.
34
Understanding Your Expenses – Columbia Conservative High Yield Fund
As a fund shareholder, you incur two types of costs. There are transaction costs, which generally include sales charges on purchases and may include redemption fees or exchange fees. There are also ongoing costs, which generally include investment advisory fees, distribution and service (Rule 12b-1) fees and other fund expenses. The information on this page is intended to help you understand the ongoing costs of investing in the fund and to compare these costs with the ongoing costs of investing in other mutual funds.
Analyzing your fund's expenses by share class
To illustrate these ongoing costs, we have provided an example and calculated the expenses paid by investors in each share class during the period. The information in the following table is based on an initial investment of $1,000, which is invested at the beginning of the period and held for the entire period. Expense information is calculated two ways and each method provides you with different information. The amount listed in the "Actual" column is calculated using the fund's actual operating expenses and total return for the period. The amount listed in the "Hypothetical" column for each share class assumes that the return each year is 5% before expenses and is calculated based on the fund's actual operating expenses. You should not use the hypothetical account values and expenses to estimate either your actual account balance at the end of the period or the expenses you paid during this period.
Compare with other funds
Since all mutual funds are required to include the same hypothetical calculations about expenses in shareholder reports, you can use this information to compare the ongoing costs of investing in the fund with other funds. To do so, compare the 5% hypothetical example with the 5% hypothetical examples that appear in the shareholder reports of other funds. As you compare hypothetical examples of other funds, it is important to note that hypothetical examples are meant to highlight the ongoing costs of investing in a fund and do not reflect any transaction costs, such as sales charges, redemption fees or exchange fees.
Estimating your actual expenses
To estimate the expenses that you paid over the period, first you will need your account balance at the end of the period:
g For shareholders who receive their account statements from Columbia Management Services, Inc., your account balance is available online at www.columbiafunds.com or by calling Shareholder Services at 800.345.6611.
g For shareholders who receive their account statements from their financial intermediary, contact your financial intermediary to obtain your account balance.
1. Divide your ending account balance by $1,000. For example, if an account balance was $8,600 at the end of the period, the result would be 8.6.
2. In the section of the table below titled "Expenses paid during the period," locate the amount for your share class. You will find this number in the column labeled "Actual." Multiply this number by the result from step 1. Your answer is an estimate of the expenses you paid on your account during the period.
If the value of your account falls below the minimum initial investment requirement applicable to you, your account generally will be subject to a $20 annual fee. This fee is not included in the accompanying table. If you are subject to the fee, keep it in mind when you are estimating the ongoing expenses of investing in the fund and when comparing the expenses of this fund with other funds.
03/01/09 – 08/31/09
| | | Account value at the
beginning of the period ($) | | Account value at the
end of the period ($) | | Expenses paid
during the period ($) | | Fund's annualized
expense ratio (%) | |
| | | Actual | | Hypothetical | | Actual | | Hypothetical | | Actual | | Hypothetical | | Actual | |
| Class A | | | 1,000.00 | | | | 1,000.00 | | | | 1,174.12 | | | | 1,020.32 | | | | 5.32 | | | | 4.94 | | | | 0.97 | | |
| Class B | | | 1,000.00 | | | | 1,000.00 | | | | 1,169.78 | | | | 1,016.53 | | | | 9.41 | | | | 8.74 | | | | 1.72 | | |
| Class C | | | 1,000.00 | | | | 1,000.00 | | | | 1,170.59 | | | | 1,017.29 | | | | 8.59 | | | | 7.98 | | | | 1.57 | | |
| Class Y | | | 1,000.00 | | | | 1,000.00 | | | | 1,052.80 | * | | | 1,021.93 | | | | 0.88 | * | | | 3.31 | | | | 0.65 | | |
| Class Z | | | 1,000.00 | | | | 1,000.00 | | | | 1,175.48 | | | | 1,021.58 | | | | 3.95 | | | | 3.67 | | | | 0.72 | | |
Expenses paid during the period are equal to the annualized expense ratio for the share class, multiplied by the average account value over the period, then multiplied by the number of days in the fund's most recent fiscal half-year and divided by 365.
Had the distributor not waived fees or reimbursed a portion of Class C expenses, Class C account value at the end of the period would have been reduced.
It is important to note that the expense amounts shown in the table are meant to highlight only ongoing costs of investing in the fund and do not reflect any transaction costs, such as sales charges, redemption fees or exchange fees. Therefore, the hypothetical examples provided may not help you determine the relative total costs of owning shares of different funds. If these transaction costs were included, your costs would have been higher.
*For the period July 15, 2009 through August 31, 2009. Class Y shares commenced operations on July 15, 2009.
35
Portfolio Manager's Report – Columbia Conservative High Yield Fund
Performance data quoted represents past performance and current performance may be lower or higher. Past performance is no guarantee of future results. The investment return and principal value will fluctuate so that shares, when redeemed, may be worth more or less than the original cost. Please visit www.columbiafunds.com for daily and most recent month-end performance updates.
Net asset value per share
as of 08/31/09 ($)
| Class A | | | 7.10 | | |
| Class B | | | 7.10 | | |
| Class C | | | 7.10 | | |
| Class Y | | | 7.10 | | |
| Class Z | | | 7.10 | | |
Distributions declared per share
09/01/08 – 08/31/09 ($)
| Class A | | | 0.51 | | |
| Class B | | | 0.46 | | |
| Class C | | | 0.47 | | |
| Class Y | | | 0.07 | | |
| Class Z | | | 0.53 | | |
For the 12-month period that ended August 31, 2009, Columbia Conservative High Yield Fund Class A shares returned 0.91% without sales charge. The fund's return was lower than the 6.51% return of the JPMorgan Developed BB High Yield Index and higher than the 0.37% average return of its peer group, the Lipper High Current Yield Funds Classification. The fund's positioning generally drove performance against these comparative measures.
Quality orientation had mixed results
During the first half of the period, the fund's aggressive positioning relative to the index resulted in a performance shortfall. However, we believe that the portfolio's quality was higher than the average of its peers during this period and that it resulted in strong outperformance relative to the Lipper measure. As the high-yield market began to recover in 2009, the fund's quality orientation versus its peer group was a disadvantage. Underweights in more speculative benchmark positions, including financials, retail and housing, hampered performance against the index in the second half of the period.
A range of sectors drove positive returns
The fund had more exposure than the index to the wireless and metals sectors, which benefited performance. Wireless, which includes satellite and cellular phone service providers, proved resilient in the face of economic weakness. In the metals sector, many companies enjoyed rebounding commodity prices. An underweight in gaming bonds also proved advantageous as casino operators proved to be linked more closely to the economic cycle than many investors expected. An underweight in information technology was also beneficial as technology spending failed to pick up. The strongest contributors to fund performance during the period were Nextel Communications, mining giant Freeport-McMoRan Copper & Gold, satellite television provider EchoStar and hospital operator HCA.
Disappointments from chemicals and housing, underweight in financials
Security selection in the chemicals industry turned negative as Nova Chemicals and Chemtura suffered sharp drop-offs in demand during the period. Both positions were sold. An underweight in financials also hurt performance as many "fallen angels"—once-strong companies that had been beaten down by the financial crisis—bounced back after being downgraded to junk status. An underweight in housing also hampered returns as homebuilders and building product producer bonds rallied in anticipation of improving housing market conditions. In addition, casino operator Foxwoods, asset manager Nuveen and chipmaker Freescale weighed on performance. All three were sold during the period.
Looking ahead
Signs of improvement in manufacturing and housing have lifted hopes for a return to economic growth, and many other economic indicators have stabilized. However, we believe that employment and consumer spending are likely to remain soft, restraining growth going forward. At 11.5%* and climbing, the default rate on high-yield securities
* Moody's trailing 12-month default rate
36
Portfolio Manager's Report (continued) – Columbia Conservative High Yield Fund
is now higher than the two previous peaks, in 1991 and 2002. Nevertheless, we expect defaults to decline meaningfully in the coming year and return to historical levels. At the end of the period, the yield difference between the high-yield market and Treasuries was 8.80 percentage points, which we believe offers good long-term value. However, there are clear risks ahead for highly leveraged companies. In this environment, we intend to preserve the fund's relatively conservative positioning. We continue to favor high quality BB- and B-rated issuers and to avoid riskier low quality CCC-rated bonds. We believe that these higher quality high-yield bonds can provide upside potential with some protection against downside risk.
Portfolio holdings and characteristics are subject to change periodically and may not be representative of current holdings and characteristics. The outlook for the fund may differ from those presented for other Columbia Funds.
Investing in fixed-income securities may involves certain risks, including the credit quality of individual issuers, possible prepayments, market or economic developments and yields and share price fluctuations due to changes in interest rates. When interest rates go up, bond prices typically drop, and vice versa.
The term "conservative" in the Columbia Conservative High Yield Fund's name, and as used in the discussion above, is intended to describe the fund's credit approach relative to other high yield funds; the fund invests primarily in bonds rated Ba or B by Moody's Investors Service, Inc. or BB or B by Standard & Poor's. These lower rated bonds, commonly referred to as "junk" bonds, are subject to greater credit risk, and are generally less liquid, than higher-rated, lower yielding bonds. Also, changes in economic conditions or other circumstances may adversely affect a junk bond issuer's ability to make principal and interest payments. Rising interest rates tend to lower the value of all bonds.
Portfolio quality
as of 08/31/09 (%)
| AAA | | | 1.1 | | |
| BBB | | | 0.7 | | |
| BB | | | 49.9 | | |
| B | | | 43.2 | | |
| CCC | | | 1.8 | | |
| CC | | | 0.3 | | |
| Not Rated | | | 0.7 | | |
| Other | | | 2.3 | | |
Ratings shown in the quality breakdown represent the rating assigned to a particular bond by one of the following nationally-recognized rating agencies: Standard and Poor's, Moody's Investors Service, Inc. or Fitch Ratings Ltd. Ratings are relative and subjective and are not absolute standards of quality. The fund's credit quality does not remove market risk.
Maturity breakdown
as of 08/31/09 (%)
| 1-3 years | | | 4.7 | | |
| 3-5 years | | | 20.6 | | |
| 5-7 years | | | 36.5 | | |
| 7-10 years | | | 26.5 | | |
| 10-15 years | | | 3.4 | | |
| 15-20 years | | | 2.3 | | |
| 20-30 years | | | 2.2 | | |
| 30 years and over | | | 0.4 | | |
| Repurchase Agreement | | | 1.1 | | |
| Other | | | 2.3 | | |
Holdings discussed in this report
as of 08/31/09 (%)
| Nextel Communications | | | 1.7 | | |
Freeport-McMoRan
Copper & Gold | | | 2.8 | | |
| EchoStar | | | 1.9 | | |
| HCA | | | 2.9 | | |
The fund is actively managed and the composition of its portfolio will change over time. Information provided is calculated as a percentage of net assets.
37
Investment Portfolio – Columbia International Stock Fund
August 31, 2009
| Common Stocks – 97.6% | |
| | | Shares | | Value ($) | |
| Consumer Discretionary – 9.8% | |
| Auto Components – 0.6% | |
| Stanley Electric Co., Ltd. | | | 176,500 | | | | 3,558,453 | | |
| Auto Components Total | | | 3,558,453 | | |
| Automobiles – 2.6% | |
| Daihatsu Motor Co., Ltd. | | | 379,000 | | | | 3,889,790 | | |
| Honda Motor Co., Ltd. | | | 63,400 | | | | 1,999,774 | | |
| Nissan Motor Co., Ltd. | | | 682,100 | | | | 4,764,804 | | |
| Toyota Motor Corp. | | | 91,900 | | | | 3,940,688 | | |
| Automobiles Total | | | 14,595,056 | | |
| Diversified Consumer Services – 1.0% | |
| Benesse Corp. | | | 120,500 | | | | 5,918,162 | | |
| Diversified Consumer Services Total | | | 5,918,162 | | |
| Hotels, Restaurants & Leisure – 1.5% | |
| OPAP SA | | | 199,710 | | | | 4,867,170 | | |
| Paddy Power PLC | | | 126,525 | | | | 3,491,683 | | |
| Hotels, Restaurants & Leisure Total | | | 8,358,853 | | |
| Media – 1.6% | |
| Publicis Groupe SA | | | 124,642 | | | | 4,583,313 | | |
| Vivendi | | | 161,832 | | | | 4,609,885 | | |
| Media Total | | | 9,193,198 | | |
| Specialty Retail – 1.6% | |
| Game Group PLC | | | 1,739,750 | | | | 4,623,426 | | |
| USS Co., Ltd. | | | 70,360 | | | | 4,431,054 | | |
| Specialty Retail Total | | | 9,054,480 | | |
| Textiles, Apparel & Luxury Goods – 0.9% | |
| Polo Ralph Lauren Corp. (a) | | | 69,786 | | | | 4,632,395 | | |
| Youngone Corp. (b) | | | 44,020 | | | | 274,222 | | |
| Youngone Holdings Co. Ltd. | | | 11,500 | | | | 204,880 | | |
| Textiles, Apparel & Luxury Goods Total | | | 5,111,497 | | |
| Consumer Discretionary Total | | | 55,789,699 | | |
| Consumer Staples – 9.5% | |
| Beverages – 0.5% | |
| Carlsberg A/S, Class B | | | 39,497 | | | | 2,837,488 | | |
| Beverages Total | | | 2,837,488 | | |
| Food & Staples Retailing – 2.9% | |
| Koninklijke Ahold NV | | | 464,454 | | | | 5,440,586 | | |
| Seven & I Holdings Co., Ltd. | | | 283,400 | | | | 6,852,767 | | |
| Wal-Mart Stores, Inc. | | | 78,643 | | | | 4,000,570 | | |
| Food & Staples Retailing Total | | | 16,293,923 | | |
| | | Shares | | Value ($) | |
| Food Products – 5.1% | |
| China Milk Products Group Ltd. | | | 8,422,000 | | | | 3,243,839 | | |
| Kerry Group PLC, Class A | | | 176,875 | | | | 4,627,614 | | |
| Nestle SA, Registered Shares | | | 272,983 | | | | 11,337,985 | | |
| Toyo Suisan Kaisha Ltd. | | | 226,000 | | | | 5,756,260 | | |
| Viterra, Inc. (b) | | | 452,652 | | | | 3,985,901 | | |
| Food Products Total | | | 28,951,599 | | |
| Tobacco – 1.0% | |
| Japan Tobacco, Inc. | | | 1,988 | | | | 5,766,375 | | |
| Tobacco Total | | | 5,766,375 | | |
| Consumer Staples Total | | | 53,849,385 | | |
| Energy – 8.0% | |
| Energy Equipment & Services – 1.5% | |
| Noble Corp. (a) | | | 122,541 | | | | 4,292,611 | | |
| Shinko Plantech Co., Ltd. | | | 435,900 | | | | 4,206,751 | | |
| Energy Equipment & Services Total | | | 8,499,362 | | |
| Oil, Gas & Consumable Fuels – 6.5% | |
Australian Worldwide
Exploration Ltd. (b) | | | 2,092,410 | | | | 4,562,742 | | |
| BP PLC (a) | | | 243,138 | | | | 2,092,764 | | |
| BP PLC, ADR | | | 118,026 | | | | 6,072,438 | | |
| Repsol YPF SA | | | 91,659 | | | | 2,273,259 | | |
| Royal Dutch Shell PLC, Class B | | | 291,300 | | | | 7,919,721 | | |
| Total SA | | | 205,869 | | | | 11,796,492 | | |
Yanzhou Coal Mining Co., Ltd.,
Class H | | | 1,586,000 | | | | 2,263,244 | | |
| Oil, Gas & Consumable Fuels Total | | | 36,980,660 | | |
| Energy Total | | | 45,480,022 | | |
| Financials – 25.7% | |
| Capital Markets – 0.5% | |
| Intermediate Capital Group PLC | | | 579,816 | | | | 2,828,452 | | |
| Capital Markets Total | | | 2,828,452 | | |
| Commercial Banks – 17.0% | |
Australia & New Zealand
Banking Group Ltd. | | | 214,018 | | | | 3,851,105 | | |
Banco Bilbao Vizcaya
Argentaria SA | | | 560,014 | | | | 9,947,134 | | |
| Banco Santander SA | | | 818,037 | | | | 12,589,334 | | |
| Bank of China Ltd., Class H | | | 5,458,000 | | | | 2,654,899 | | |
| Barclays PLC | | | 1,454,634 | | | | 8,915,848 | | |
| BNP Paribas | | | 59,409 | | | | 4,783,926 | | |
| DBS Group Holdings Ltd. | | | 645,000 | | | | 5,657,934 | | |
| HSBC Holdings PLC | | | 631,863 | | | | 6,903,250 | | |
See Accompanying Notes to Financial Statements.
38
Columbia International Stock Fund
August 31, 2009
| Common Stocks (continued) | |
| | | Shares | | Value ($) | |
| National Australia Bank Ltd. | | | 244,489 | | | | 5,885,167 | | |
| National Bank of Greece SA (b) | | | 178,044 | | | | 5,577,076 | | |
| Standard Chartered PLC | | | 332,706 | | | | 7,551,601 | | |
Sumitomo Mitsui Financial
Group, Inc. | | | 153,200 | | | | 6,602,171 | | |
Sumitomo Trust & Banking
Co., Ltd. | | | 614,000 | | | | 3,754,605 | | |
Svenska Handelsbanken AB,
Class A | | | 267,619 | | | | 7,011,490 | | |
| Turkiye Is Bankasi, Class C | | | 674,991 | | | | 2,677,286 | | |
| Yamaguchi Financial Group, Inc. | | | 211,000 | | | | 2,424,062 | | |
| Commercial Banks Total | | | 96,786,888 | | |
| Diversified Financial Services – 0.9% | |
| ING Groep NV (b) | | | 330,621 | | | | 4,998,098 | | |
| Diversified Financial Services Total | | | 4,998,098 | | |
| Insurance – 4.5% | |
| Axis Capital Holdings Ltd. | | | 119,194 | | | | 3,633,033 | | |
Baloise Holding AG,
Registered Shares | | | 66,276 | | | | 6,002,331 | | |
| Brit Insurance Holdings PLC | | | 1,458,211 | | | | 5,156,132 | | |
| Sampo Oyj, Class A | | | 190,505 | | | | 4,560,901 | | |
Zurich Financial Services AG,
Registered Shares | | | 28,108 | | | | 6,176,911 | | |
| Insurance Total | | | 25,529,308 | | |
| Real Estate Investment Trusts (REITs) – 0.9% | |
Japan Retail Fund
Investment Corp. | | | 983 | | | | 5,239,850 | | |
| Real Estate Investment Trusts (REITs) Total | | | 5,239,850 | | |
| Real Estate Management & Development – 1.9% | |
| Hongkong Land Holdings Ltd. | | | 1,187,000 | | | | 4,831,090 | | |
| Leopalace21 Corp. | | | 348,900 | | | | 3,157,161 | | |
| Swire Pacific Ltd., Class A | | | 307,800 | | | | 3,210,862 | | |
Real Estate Management &
Development Total | | | 11,199,113 | | |
| Financials Total | | | 146,581,709 | | |
| Health Care – 8.1% | |
| Biotechnology – 0.6% | |
| Amgen, Inc. (b) | | | 57,260 | | | | 3,420,712 | | |
| Biotechnology Total | | | 3,420,712 | | |
| Pharmaceuticals – 7.5% | |
| Astellas Pharma, Inc. | | | 103,300 | | | | 4,140,881 | | |
| AstraZeneca PLC, ADR | | | 187,720 | | | | 8,753,384 | | |
| Novartis AG, Registered Shares | | | 149,743 | | | | 6,940,586 | | |
| | | Shares | | Value ($) | |
Roche Holding AG,
Genusschein Shares | | | 59,740 | | | | 9,494,987 | | |
| Sanofi-Aventis SA | | | 136,043 | | | | 9,228,874 | | |
| Santen Pharmaceutical Co., Ltd. | | | 124,100 | | | | 4,174,455 | | |
| Pharmaceuticals Total | | | 42,733,167 | | |
| Health Care Total | | | 46,153,879 | | |
| Industrials – 11.0% | |
| Aerospace & Defense – 1.7% | |
| BAE Systems PLC | | | 1,098,463 | | | | 5,550,717 | | |
| MTU Aero Engines Holding AG | | | 97,265 | | | | 4,106,480 | | |
| Aerospace & Defense Total | | | 9,657,197 | | |
| Airlines – 0.5% | |
| Turk Hava Yollari A.O. | | | 1,412,987 | | | | 2,712,754 | | |
| Airlines Total | | | 2,712,754 | | |
| Commercial Services & Supplies – 0.5% | |
| Aeon Delight Co., Ltd. | | | 212,200 | | | | 3,110,594 | | |
| Commercial Services & Supplies Total | | | 3,110,594 | | |
| Construction & Engineering – 3.7% | |
| COMSYS Holdings Corp. | | | 286,200 | | | | 3,306,448 | | |
| CTCI Corp. | | | 2,695,000 | | | | 2,529,902 | | |
| Impregilo SpA | | | 1,363,066 | | | | 5,539,846 | | |
| Toyo Engineering Corp. | | | 1,104,000 | | | | 3,950,908 | | |
| Vinci SA | | | 104,619 | | | | 5,613,066 | | |
| Construction & Engineering Total | | | 20,940,170 | | |
| Electrical Equipment – 1.1% | |
| Schneider Electric SA | | | 68,868 | | | | 6,348,282 | | |
| Electrical Equipment Total | | | 6,348,282 | | |
| Industrial Conglomerates – 2.3% | |
| DCC PLC | | | 141,638 | | | | 3,431,581 | | |
| Keppel Corp. Ltd. | | | 384,000 | | | | 2,027,996 | | |
| Siemens AG, Registered Shares | | | 26,291 | | | | 2,278,406 | | |
| Tyco International Ltd. | | | 161,462 | | | | 5,116,731 | | |
| Industrial Conglomerates Total | | | 12,854,714 | | |
| Machinery – 0.8% | |
| Demag Cranes AG | | | 147,423 | | | | 4,438,256 | | |
| Machinery Total | | | 4,438,256 | | |
| Professional Services – 0.4% | |
| Teleperformance | | | 74,770 | | | | 2,568,813 | | |
| Professional Services Total | | | 2,568,813 | | |
| Industrials Total | | | 62,630,780 | | |
See Accompanying Notes to Financial Statements.
39
Columbia International Stock Fund
August 31, 2009
| Common Stocks (continued) | |
| | | Shares | | Value ($) | |
| Information Technology – 4.9% | |
| Electronic Equipment, Instruments & Components – 0.7% | |
| FUJIFILM Holdings Corp. | | | 133,000 | | | | 3,966,416 | | |
Electronic Equipment, Instruments &
Components Total | | | 3,966,416 | | |
| Internet Software & Services – 0.5% | |
| Yahoo! Japan Corp. | | | 8,113 | | | | 2,759,554 | | |
| Internet Software & Services Total | | | 2,759,554 | | |
| IT Services – 1.1% | |
| Cap Gemini SA | | | 82,965 | | | | 4,012,987 | | |
| Redecard SA | | | 176,800 | | | | 2,420,247 | | |
| IT Services Total | | | 6,433,234 | | |
| Office Electronics – 1.2% | |
| Canon, Inc. | | | 176,200 | | | | 6,760,172 | | |
| Office Electronics Total | | | 6,760,172 | | |
| Semiconductors & Semiconductor Equipment – 0.7% | |
United Microelectronics
Corp., ADR (b) | | | 1,229,964 | | | | 3,997,383 | | |
Semiconductors & Semiconductor
Equipment Total | | | 3,997,383 | | |
| Software – 0.7% | |
| Nintendo Co., Ltd. | | | 14,600 | | | | 3,947,727 | | |
| Software Total | | | 3,947,727 | | |
| Information Technology Total | | | 27,864,486 | | |
| Materials – 9.2% | |
| Chemicals – 2.6% | |
| BASF SE | | | 155,650 | | | | 8,120,055 | | |
| Clariant AG, Registered Shares (b) | | | 397,371 | | | | 3,591,312 | | |
| Syngenta AG, Registered Shares | | | 12,129 | | | | 2,852,130 | | |
| Chemicals Total | | | 14,563,497 | | |
| Construction Materials – 0.6% | |
| Ciments Francais SA | | | 33,032 | | | | 3,625,946 | | |
| Construction Materials Total | | | 3,625,946 | | |
| Containers & Packaging – 0.7% | |
| Toyo Seikan Kaisha Ltd. | | | 197,300 | | | | 4,117,750 | | |
| Containers & Packaging Total | | | 4,117,750 | | |
| Metals & Mining – 5.3% | |
| Anglo American PLC | | | 129,093 | | | | 4,204,127 | | |
| BHP Billiton PLC | | | 395,477 | | | | 10,377,171 | | |
| BlueScope Steel Ltd. | | | 1,192,599 | | | | 2,882,836 | | |
| Salzgitter AG | | | 42,534 | | | | 4,048,244 | | |
| | | Shares | | Value ($) | |
| Tokyo Steel Manufacturing Co., Ltd. | | | 325,600 | | | | 4,286,513 | | |
| Yamato Kogyo Co., Ltd. | | | 153,400 | | | | 4,583,041 | | |
| Metals & Mining Total | | | 30,381,932 | | |
| Materials Total | | | 52,689,125 | | |
| Telecommunication Services – 5.9% | |
| Diversified Telecommunication Services – 5.0% | |
| BCE, Inc. | | | 159,500 | | | | 3,919,205 | | |
Bezeq Israeli Telecommunication
Corp., Ltd. | | | 2,037,791 | | | | 4,260,714 | | |
| France Telecom SA | | | 123,996 | | | | 3,153,473 | | |
Nippon Telegraph &
Telephone Corp. | | | 125,500 | | | | 5,610,747 | | |
| Tele2 AB, Class B | | | 165,087 | | | | 2,291,313 | | |
| Telefonica O2 Czech Republic AS | | | 201,513 | | | | 5,591,770 | | |
| Telekomunikacja Polska SA | | | 638,555 | | | | 3,596,989 | | |
Diversified Telecommunication
Services Total | | | 28,424,211 | | |
| Wireless Telecommunication Services – 0.9% | |
| Softbank Corp. | | | 129,000 | | | | 2,890,543 | | |
| Vodafone Group PLC | | | 995,159 | | | | 2,145,164 | | |
| Wireless Telecommunication Services Total | | | 5,035,707 | | |
| Telecommunication Services Total | | | 33,459,918 | | |
| Utilities – 5.5% | |
| Electric Utilities – 1.4% | |
| Enel SpA | | | 520,427 | | | | 3,066,404 | | |
| Iberdrola SA | | | 550,752 | | | | 5,100,543 | | |
| Electric Utilities Total | | | 8,166,947 | | |
| Independent Power Producers & Energy Traders – 1.6% | |
| Drax Group PLC | | | 608,617 | | | | 4,725,253 | | |
| International Power PLC | | | 1,003,786 | | | | 4,578,685 | | |
Independent Power Producers &
Energy Traders Total | | | 9,303,938 | | |
| Multi-Utilities – 2.5% | |
| AGL Energy Ltd. | | | 432,541 | | | | 5,103,548 | | |
| RWE AG | | | 70,218 | | | | 6,502,925 | | |
| United Utilities Group PLC | | | 329,551 | | | | 2,421,155 | | |
| Multi-Utilities Total | | | 14,027,628 | | |
| Utilities Total | | | 31,498,513 | | |
Total Common Stocks
(cost of $518,568,348) | | | 555,997,516 | | |
See Accompanying Notes to Financial Statements.
40
Columbia International Stock Fund
August 31, 2009
| Investment Company – 1.1% | |
| | | Shares | | Value ($) | |
| iShares MSCI EAFE Index Fund | | | 122,178 | | | | 6,436,337 | | |
Total Investment Company
(cost of $5,676,549) | | | 6,436,337 | | |
| Preferred Stock – 0.5% | |
| Utilities – 0.5% | |
| Electric Utilities – 0.5% | |
| Cia Energetica de Minas Gerais | | | 172,675 | | | | 2,542,437 | | |
| Electric Utilities Total | | | 2,542,437 | | |
| Utilities Total | | | 2,542,437 | | |
Total Preferred Stock
(cost of $3,361,156) | | | 2,542,437 | | |
| Rights – 0.0% | |
| | | Units | | | |
| Financials – 0.0% | |
| Diversified Financial Services – 0.0% | |
Fortis
Expires 07/04/14 (b)(c) | | | 234,651 | | | | — | | |
| Diversified Financial Services Total | | | — | | |
| Financials Total | | | — | | |
Total Rights
(cost of $—) | | | — | | |
| Short-Term Obligation – 0.8% | |
| | | Par ($) | | | |
Repurchase agreement with
Fixed Income Clearing Corp.,
dated 08/31/09, due 09/01/09
at 0.130%, collateralized by
U.S. Treasury obligations with
various maturities to 08/15/23,
market value $4,870,368
(repurchase proceeds $4,772,017) | | | 4,772,000 | | | | 4,772,000 | | |
Total Short-Term Obligation
(cost of $4,772,000) | | | 4,772,000 | | |
Total Investments – 100.0%
(cost of $532,378,053) (d) | | | 569,748,290 | | |
| Other Assets & Liabilities, Net – 0.0% | | | 266,588 | | |
| Net Assets – 100.0% | | | 570,014,878 | | |
Notes to Investment Portfolio:
(a) All or a portion of these securities are pledged as collateral for open written options contracts.
(b) Non-income producing security.
(c) Represents fair value as determined in good faith under procedures approved by the Board of Trustees.
(d) Cost for federal income tax purposes is $540,499,041.
The following table summarizes the inputs used, as of August 31, 2009, in valuing the Fund's assets:
| Description | | Quoted Prices
(Level 1) | | Other
Significant
Observable
Inputs
(Level 2) | | Significant
Unobservable
Inputs
(Level 3) | | Total | |
| Common Stocks | |
Consumer
Discretionary | | $ | 4,632,395 | | | $ | 51,157,304 | | | $ | — | | | $ | 55,789,699 | | |
| Consumer Staples | | | 7,986,471 | | | | 45,862,914 | | | | — | | | | 53,849,385 | | |
| Energy | | | 10,365,049 | | | | 35,114,973 | | | | — | | | | 45,480,022 | | |
| Financials | | | 8,464,123 | | | | 138,117,586 | | | | — | | | | 146,581,709 | | |
| Health Care | | | 12,174,096 | | | | 33,979,783 | | | | — | | | | 46,153,879 | | |
| Industrials | | | 5,116,731 | | | | 57,514,049 | | | | — | | | | 62,630,780 | | |
Information
Technology | | | 6,417,630 | | | | 21,446,856 | | | | — | | | | 27,864,486 | | |
| Materials | | | — | | | | 52,689,125 | | | | — | | | | 52,689,125 | | |
Telecommunication
Services | | | 3,919,205 | | | | 29,540,713 | | | | — | | | | 33,459,918 | | |
| Utilities | | | — | | | | 31,498,513 | | | | — | | | | 31,498,513 | | |
| Total Common Stocks | | | 59,075,700 | | | | 496,921,816 | | | | — | | | | 555,997,516 | | |
| Total Investment Company | | | 6,436,337 | | | | — | | | | — | | | | 6,436,337 | | |
| Total Preferred Stock | | | 2,542,437 | | | | — | | | | — | | | | 2,542,437 | | |
| Total Rights | | | — | | | | — | | | | — | | | | — | | |
Total Short-Term
Obligation | | | — | | | | 4,772,000 | | | | — | | | | 4,772,000 | | |
| Total Investments | | | 68,054,474 | | | | 501,693,816 | | | | — | | | | 569,748,290 | | |
Total Forward Foreign
Currency Exchange
Contracts | | | — | | | | 1,505,470 | | | | — | | | | 1,505,470 | | |
Total Written Call
Option Contracts | | | (41,310 | ) | | | — | | | | — | | | | (41,310 | ) | |
| Total | | $ | 68,013,164 | | | $ | 503,199,286 | | | $ | — | | | $ | 571,212,450 | | |
The Fund's assets assigned to the Level 2 input category include certain foreign securities for which a third party statistical pricing service may be employed for purposes of fair market valuation.
For more information on valuation inputs, and their aggregation into the levels used in the table above, please refer to the Security Valuation section in the accompanying Notes to Financial Statements.
Risk Exposure/Type
At August 31, 2009, the Fund held the following written call option contracts:
Equity Risk
Written
Call Options
Name of Issuer | | Strike
Price | | Number of
Contracts | | Expiration
Date | | Premium | | Value | |
| BP PLC | | $ | 55.0 | | | | 1,180 | | | 09/19/09 | | $ | 36,048 | | | $ | 17,700 | | |
| Noble Corp. | | | 40.0 | | | | 1,225 | | | 09/19/09 | | | 29,816 | | | | 18,375 | | |
Polo Ralph
Lauren Corp. | | | 75.0 | | | | 349 | | | 09/19/09 | | | 9,203 | | | | 5,235 | | |
| Total written call options: (proceeds $75,067) | | $ | 41,310 | | |
For the year ended August 31, 2009, transactions in written option contracts were as follows:
| | | Number of
contracts | | Premium
received | |
| Options outstanding at August 31, 2008 | | | 2,638 | | | $ | 153,683 | | |
| Options written | | | 23,991 | | | | 894,894 | | |
Options terminated in closing
purchase transactions | | | — | | | | — | | |
| Options exercised | | | (5,443 | ) | | | (252,507 | ) | |
| Options expired | | | (18,432 | ) | | | (721,003 | ) | |
| Options outstanding at August 31, 2009 | | | 2,754 | | | $ | 75,067 | | |
See Accompanying Notes to Financial Statements.
41
Columbia International Stock Fund
August 31, 2009
Forward foreign currency exchange contracts outstanding on August 31, 2009 are:
Foreign Exchange Rate Risk
Forward
Foreign
Currency
Exchange
Contracts
to Buy | |
Value | |
Aggregate
Face Value | |
Settlement
Date | |
Unrealized
Appreciation
(Depreciation) | |
| AUD | | | | $ | 19,544,498 | | | $ | 18,140,754 | | | 10/08/09 | | $ | 1,403,744 | | |
| AUD | | | | | 2,766,184 | | | | 2,751,629 | | | 10/08/09 | | | 14,555 | | |
| AUD | | | | | 1,355,278 | | | | 1,331,102 | | | 10/08/09 | | | 24,176 | | |
| CHF | | | | | 1,967,737 | | | | 1,952,019 | | | 10/08/09 | | | 15,718 | | |
| DKK | | | | | 3,453,504 | | | | 3,365,468 | | | 10/08/09 | | | 88,036 | | |
| DKK | | | | | 209,781 | | | | 208,174 | | | 10/08/09 | | | 1,607 | | |
| EUR | | | | | 12,422,521 | | | | 12,098,073 | | | 10/08/09 | | | 324,448 | | |
| EUR | | | | | 1,479,520 | | | | 1,469,183 | | | 10/08/09 | | | 10,337 | | |
| EUR | | | | | 844,416 | | | | 837,676 | | | 10/08/09 | | | 6,740 | | |
| EUR | | | | | 1,136,879 | | | | 1,129,715 | | | 10/08/09 | | | 7,164 | | |
| GBP | | | | | 18,042,839 | | | | 18,054,395 | | | 10/08/09 | | | (11,556 | ) | |
| GBP | | | | | 2,904,044 | | | | 2,943,778 | | | 10/08/09 | | | (39,734 | ) | |
| GBP | | | | | 1,567,598 | | | | 1,576,865 | | | 10/08/09 | | | (9,267 | ) | |
| GBP | | | | | 1,272,961 | | | | 1,289,753 | | | 10/08/09 | | | (16,792 | ) | |
| JPY | | | | | 1,615,057 | | | | 1,583,850 | | | 10/08/09 | | | 31,207 | | |
| NOK | | | | | 2,912,919 | | | | 2,707,870 | | | 10/08/09 | | | 205,049 | | |
| NOK | | | | | 176,963 | | | | 176,350 | | | 10/08/09 | | | 613 | | |
| SEK | | | | | 4,972,428 | | | | 4,503,703 | | | 10/08/09 | | | 468,725 | | |
| SEK | | | | | 302,075 | | | | 300,125 | | | 10/08/09 | | | 1,950 | | |
| SGD | | | | | 1,621,988 | | | | 1,622,428 | | | 10/08/09 | | | (440 | ) | |
| | | $ | 2,526,280 | | |
Forward
Foreign
Currency
Exchange
Contracts
to Sell | |
Value | |
Aggregate
Face Value | |
Settlement
Date | |
Unrealized
Appreciation
(Depreciation) | |
| CAD | | | | $ | 4,734,813 | | | $ | 4,530,594 | | | 10/08/09 | | $ | (204,219 | ) | |
| CAD | | | | | 1,572,181 | | | | 1,576,080 | | | 10/08/09 | | | 3,899 | | |
| CAD | | | | | 382,768 | | | | 381,433 | | | 10/08/09 | | | (1,335 | ) | |
| CHF | | | | | 4,588,239 | | | | 4,484,351 | | | 10/08/09 | | | (103,888 | ) | |
| CHF | | | | | 159,648 | | | | 158,462 | | | 10/08/09 | | | (1,186 | ) | |
| CZK | | | | | 5,180,560 | | | | 4,979,087 | | | 10/08/09 | | | (201,473 | ) | |
| CZK | | | | | 811,399 | | | | 787,719 | | | 10/08/09 | | | (23,680 | ) | |
| CZK | | | | | 364,064 | | | | 358,230 | | | 10/08/09 | | | (5,834 | ) | |
| GBP | | | | | 1,574,109 | | | | 1,642,643 | | | 10/08/09 | | | 68,534 | | |
| ILS | | | | | 4,691,717 | | | | 4,507,531 | | | 10/08/09 | | | (184,186 | ) | |
| ILS | | | | | 285,081 | | | | 283,692 | | | 10/08/09 | | | (1,389 | ) | |
| JPY | | | | | 4,010,618 | | | | 4,006,615 | | | 10/08/09 | | | (4,003 | ) | |
| JPY | | | | | 1,473,528 | | | | 1,451,175 | | | 10/08/09 | | | (22,353 | ) | |
| JPY | | | | | 235,082 | | | | 232,402 | | | 10/08/09 | | | (2,680 | ) | |
| PLN | | | | | 2,969,430 | | | | 2,707,922 | | | 10/08/09 | | | (261,508 | ) | |
| PLN | | | | | 180,378 | | | | 176,330 | | | 10/08/09 | | | (4,048 | ) | |
| SGD | | | | | 2,731,988 | | | | 2,699,664 | | | 10/08/09 | | | (32,324 | ) | |
| SGD | | | | | 1,057,275 | | | | 1,051,941 | | | 10/08/09 | | | (5,334 | ) | |
| SGD | | | | | 131,813 | | | | 131,279 | | | 10/08/09 | | | (534 | ) | |
| TWD | | | | | 4,510,526 | | | | 4,480,381 | | | 10/08/09 | | | (30,145 | ) | |
| TWD | | | | | 1,049,547 | | | | 1,050,472 | | | 10/08/09 | | | 925 | | |
| TWD | | | | | 337,838 | | | | 337,078 | | | 10/08/09 | | | (760 | ) | |
| TWD | | | | | 1,127,943 | | | | 1,124,654 | | | 10/08/09 | | | (3,289 | ) | |
| | | $ | (1,020,810 | ) | |
The Fund was invested in the following countries at August 31, 2009:
Summary of Securities by
Country (Unaudited) | | Value | | % of Total
Investments | |
| Japan | | $ | 129,868,476 | | | | 22.8 | | |
| United Kingdom | | | 94,819,287 | | | | 16.7 | | |
| France | | | 60,325,056 | | | | 10.6 | | |
| Switzerland | | | 46,396,244 | | | | 8.1 | | |
| United States* | | | 36,304,389 | | | | 6.4 | | |
| Spain | | | 29,910,270 | | | | 5.2 | | |
| Germany | | | 29,494,365 | | | | 5.2 | | |
| Australia | | | 22,285,398 | | | | 3.9 | | |
| Ireland | | | 11,550,878 | | | | 2.0 | | |
| Greece | | | 10,444,246 | | | | 1.8 | | |
| Netherlands | | | 10,438,684 | | | | 1.8 | | |
| Sweden | | | 9,302,803 | | | | 1.6 | | |
| Italy | | | 8,606,251 | | | | 1.5 | | |
| China | | | 8,161,982 | | | | 1.4 | | |
| Hong Kong | | | 8,041,953 | | | | 1.4 | | |
| Canada | | | 7,905,106 | | | | 1.4 | | |
| Singapore | | | 7,685,929 | | | | 1.4 | | |
| Taiwan | | | 6,527,284 | | | | 1.2 | | |
| Czech Republic | | | 5,591,770 | | | | 1.0 | | |
| Turkey | | | 5,390,040 | | | | 1.0 | | |
| Brazil | | | 4,962,684 | | | | 0.9 | | |
| Finland | | | 4,560,901 | | | | 0.8 | | |
| Israel | | | 4,260,714 | | | | 0.7 | | |
| Poland | | | 3,596,990 | | | | 0.6 | | |
| Denmark | | | 2,837,488 | | | | 0.5 | | |
| Korea, Republic of | | | 479,102 | | | | 0.1 | | |
| Belgium** | | | — | | | | — | | |
| | | $ | 569,748,290 | | | | 100.0 | | |
* Includes short-term obligation and investment company.
** Rounds to less than $1 and 0.1%, respectively.
Certain securities are listed by country of underlying exposure but may trade predominantly on another exchange.
| Acronym | | Name | |
| ADR | | American Depositary Receipt | |
|
| AUD | | Australian Dollar | |
|
| CAD | | Canadian Dollar | |
|
| CHF | | Swiss Franc | |
|
| CZK | | Czech Koruna | |
|
| DKK | | Danish Krone | |
|
| EUR | | Euro | |
|
| GBP | | Pound Sterling | |
|
| ILS | | Israeli Shekel | |
|
| JPY | | Japanese Yen | |
|
| NOK | | Norwegian Krone | |
|
| PLN | | Polish Zloty | |
|
| SEK | | Swedish Krona | |
|
| SGD | | Singapore Dollar | |
|
| TWD | | New Taiwan Dollar | |
|
See Accompanying Notes to Financial Statements.
42
Investment Portfolio – Columbia Mid Cap Growth Fund
August 31, 2009
| Common Stocks – 99.6% | |
| | | Shares | | Value ($) | |
| Consumer Discretionary – 17.3% | |
| Distributors – 0.4% | |
| LKQ Corp. (a) | | | 217,100 | | | | 3,768,856 | | |
| Distributors Total | | | 3,768,856 | | |
| Diversified Consumer Services – 2.3% | |
| Apollo Group, Inc., Class A (a) | | | 98,820 | | | | 6,405,512 | | |
| DeVry, Inc. | | | 150,511 | | | | 7,691,112 | | |
| ITT Educational Services, Inc. (a) | | | 97,718 | | | | 10,259,413 | | |
| Diversified Consumer Services Total | | | 24,356,037 | | |
| Hotels, Restaurants & Leisure – 2.9% | |
| Buffalo Wild Wings, Inc. (a) | | | 102,950 | | | | 4,244,629 | | |
Ctrip.com International Ltd.,
ADR | | | 80,380 | | | | 3,933,797 | | |
| Darden Restaurants, Inc. | | | 171,700 | | | | 5,654,081 | | |
| Royal Caribbean Cruises Ltd. | | | 239,660 | | | | 4,572,713 | | |
Starwood Hotels & Resorts
Worldwide, Inc. | | | 252,390 | | | | 7,516,174 | | |
| Wynn Resorts Ltd. (a) | | | 87,810 | | | | 4,753,155 | | |
| Hotels, Restaurants & Leisure Total | | | 30,674,549 | | |
| Household Durables – 0.4% | |
| Garmin Ltd. | | | 128,920 | | | | 4,237,600 | | |
| Household Durables Total | | | 4,237,600 | | |
| Internet & Catalog Retail – 1.6% | |
| NetFlix, Inc. (a) | | | 168,730 | | | | 7,366,752 | | |
| Priceline.com, Inc. (a) | | | 61,920 | | | | 9,534,442 | | |
| Internet & Catalog Retail Total | | | 16,901,194 | | |
| Leisure Equipment & Products – 0.4% | |
| Polaris Industries, Inc. | | | 119,697 | | | | 4,513,774 | | |
| Leisure Equipment & Products Total | | | 4,513,774 | | |
| Media – 1.5% | |
Lamar Advertising Co.,
Class A (a) | | | 255,920 | | | | 5,858,009 | | |
| McGraw-Hill Companies, Inc. | | | 299,080 | | | | 10,052,079 | | |
| Media Total | | | 15,910,088 | | |
| Multiline Retail – 1.0% | |
| Nordstrom, Inc. | | | 383,760 | | | | 10,760,630 | | |
| Multiline Retail Total | | | 10,760,630 | | |
| Specialty Retail – 5.8% | |
Abercrombie & Fitch Co.,
Class A | | | 138,580 | | | | 4,474,748 | | |
| Advance Auto Parts, Inc. | | | 132,610 | | | | 5,609,403 | | |
| Aeropostale, Inc. (a) | | | 158,170 | | | | 6,192,355 | | |
| American Eagle Outfitters, Inc. | | | 297,340 | | | | 4,014,090 | | |
| Bed Bath & Beyond, Inc. (a) | | | 139,270 | | | | 5,080,570 | | |
| | | Shares | | Value ($) | |
| Best Buy Co., Inc. | | | 104,050 | | | | 3,774,934 | | |
| GameStop Corp., Class A (a) | | | 597,376 | | | | 14,217,549 | | |
| Sherwin-Williams Co. | | | 67,440 | | | | 4,059,888 | | |
| TJX Companies, Inc. | | | 229,160 | | | | 8,238,302 | | |
| Urban Outfitters, Inc. (a) | | | 172,600 | | | | 4,907,018 | | |
| Specialty Retail Total | | | 60,568,857 | | |
| Textiles, Apparel & Luxury Goods – 1.0% | |
| Coach, Inc. | | | 200,920 | | | | 5,684,027 | | |
| Hanesbrands, Inc. (a) | | | 244,160 | | | | 5,142,009 | | |
| Textiles, Apparel & Luxury Goods Total | | | 10,826,036 | | |
| Consumer Discretionary Total | | | 182,517,621 | | |
| Consumer Staples – 5.9% | |
| Food & Staples Retailing – 0.4% | |
| Safeway, Inc. | | | 223,130 | | | | 4,250,626 | | |
| Food & Staples Retailing Total | | | 4,250,626 | | |
| Food Products – 2.4% | |
| Campbell Soup Co. | | | 155,840 | | | | 4,887,142 | | |
| Corn Products International, Inc. | | | 203,940 | | | | 6,048,861 | | |
| Dean Foods Co. (a) | | | 265,360 | | | | 4,813,630 | | |
| H.J. Heinz Co. | | | 246,850 | | | | 9,503,725 | | |
| Food Products Total | | | 25,253,358 | | |
| Household Products – 0.6% | |
| Clorox Co. | | | 106,920 | | | | 6,317,903 | | |
| Household Products Total | | | 6,317,903 | | |
| Personal Products – 1.8% | |
| Avon Products, Inc. | | | 402,600 | | | | 12,830,862 | | |
| Herbalife Ltd. | | | 194,400 | | | | 5,886,432 | | |
| Personal Products Total | | | 18,717,294 | | |
| Tobacco – 0.7% | |
| Lorillard, Inc. | | | 97,210 | | | | 7,073,972 | | |
| Tobacco Total | | | 7,073,972 | | |
| Consumer Staples Total | | | 61,613,153 | | |
| Energy – 5.7% | |
| Energy Equipment & Services – 1.9% | |
| Core Laboratories N.V. | | | 38,440 | | | | 3,562,235 | | |
| Diamond Offshore Drilling, Inc. | | | 120,430 | | | | 10,768,851 | | |
| FMC Technologies, Inc. (a) | | | 113,320 | | | | 5,405,364 | | |
| Energy Equipment & Services Total | | | 19,736,450 | | |
| Oil, Gas & Consumable Fuels – 3.8% | |
| Concho Resources, Inc. (a) | | | 157,279 | | | | 5,125,723 | | |
| Consol Energy, Inc. | | | 165,140 | | | | 6,177,887 | | |
See Accompanying Notes to Financial Statements.
43
Columbia Mid Cap Growth Fund
August 31, 2009
| Common Stocks (continued) | |
| | | Shares | | Value ($) | |
| Continental Resources, Inc. (a) | | | 164,317 | | | | 5,800,390 | | |
| PetroHawk Energy Corp. (a) | | | 337,710 | | | | 7,270,896 | | |
| Quicksilver Resources, Inc. (a) | | | 384,870 | | | | 4,164,293 | | |
| SandRidge Energy, Inc. (a) | | | 503,730 | | | | 6,145,506 | | |
| Ultra Petroleum Corp. (a) | | | 114,950 | | | | 5,337,129 | | |
| Oil, Gas & Consumable Fuels Total | | | 40,021,824 | | |
| Energy Total | | | 59,758,274 | | |
| Financials – 7.8% | |
| Capital Markets – 4.3% | |
Affiliated Managers
Group, Inc. (a) | | | 103,090 | | | | 6,734,870 | | |
| Ameriprise Financial, Inc. | | | 189,890 | | | | 5,702,397 | | |
| Janus Capital Group, Inc. | | | 904,000 | | | | 11,498,880 | | |
| T. Rowe Price Group, Inc. | | | 193,620 | | | | 8,774,858 | | |
Waddell & Reed Financial, Inc.,
Class A | | | 458,480 | | | | 12,163,474 | | |
| Capital Markets Total | | | 44,874,479 | | |
| Commercial Banks – 0.3% | |
| Zions Bancorporation | | | 199,300 | | | | 3,521,631 | | |
| Commercial Banks Total | | | 3,521,631 | | |
| Diversified Financial Services – 0.8% | |
Intercontinental
Exchange, Inc. (a) | | | 41,930 | | | | 3,933,034 | | |
| Moody's Corp. | | | 158,050 | | | | 4,305,282 | | |
| Diversified Financial Services Total | | | 8,238,316 | | |
| Real Estate Investment Trusts (REITs) – 1.7% | |
Alexandria Real Estate
Equities, Inc. | | | 98,990 | | | | 5,514,733 | | |
| Digital Realty Trust, Inc. | | | 160,500 | | | | 6,994,590 | | |
Nationwide Health
Properties, Inc. | | | 177,670 | | | | 5,664,120 | | |
Real Estate Investment Trusts
(REITs) Total | | | 18,173,443 | | |
| Real Estate Management & Development – 0.7% | |
CB Richard Ellis Group, Inc.,
Class A (a) | | | 575,630 | | | | 6,815,459 | | |
Real Estate Management &
Development Total | | | 6,815,459 | | |
| Financials Total | | | 81,623,328 | | |
| Health Care – 13.6% | |
| Biotechnology – 2.0% | |
Alexion
Pharmaceuticals, Inc. (a) | | | 77,270 | | | | 3,487,968 | | |
| | | Shares | | Value ($) | |
BioMarin
Pharmaceuticals, Inc. (a) | | | 303,300 | | | | 4,995,351 | | |
| Onyx Pharmaceuticals, Inc. (a) | | | 161,222 | | | | 5,170,389 | | |
| Vertex Pharmaceuticals, Inc. (a) | | | 188,410 | | | | 7,048,418 | | |
| Biotechnology Total | | | 20,702,126 | | |
| Health Care Equipment & Supplies – 1.7% | |
| Hologic, Inc. (a) | | | 445,950 | | | | 7,335,877 | | |
| Intuitive Surgical, Inc. (a) | | | 47,760 | | | | 10,636,630 | | |
| Health Care Equipment & Supplies Total | | | 17,972,507 | | |
| Health Care Providers & Services – 5.1% | |
| CIGNA Corp. | | | 377,930 | | | | 11,122,480 | | |
| Express Scripts, Inc. (a) | | | 238,200 | | | | 17,202,804 | | |
Medco Health
Solutions, Inc. (a) | | | 78,980 | | | | 4,361,276 | | |
| Mednax, Inc. (a) | | | 117,980 | | | | 6,143,219 | | |
| Patterson Companies, Inc. (a) | | | 294,780 | | | | 8,026,859 | | |
| VCA Antech, Inc. (a) | | | 256,100 | | | | 6,338,475 | | |
| Health Care Providers & Services Total | | | 53,195,113 | | |
| Health Care Technology – 0.4% | |
| Cerner Corp. (a) | | | 73,980 | | | | 4,565,306 | | |
| Health Care Technology Total | | | 4,565,306 | | |
| Life Sciences Tools & Services – 3.8% | |
| ICON PLC, ADR (a) | | | 539,887 | | | | 11,672,357 | | |
| Illumina, Inc. (a) | | | 386,062 | | | | 13,616,407 | | |
| Life Technologies Corp. (a) | | | 324,910 | | | | 14,468,242 | | |
| Life Sciences Tools & Services Total | | | 39,757,006 | | |
| Pharmaceuticals – 0.6% | |
| Perrigo Co. | | | 216,200 | | | | 6,382,224 | | |
| Pharmaceuticals Total | | | 6,382,224 | | |
| Health Care Total | | | 142,574,282 | | |
| Industrials – 15.2% | |
| Aerospace & Defense – 2.6% | |
| BE Aerospace, Inc. (a) | | | 465,630 | | | | 7,976,242 | | |
| ITT Corp. | | | 123,600 | | | | 6,189,888 | | |
| Precision Castparts Corp. | | | 149,193 | | | | 13,618,337 | | |
| Aerospace & Defense Total | | | 27,784,467 | | |
| Air Freight & Logistics – 0.5% | |
Expeditors International of
Washington, Inc. | | | 176,850 | | | | 5,775,921 | | |
| Air Freight & Logistics Total | | | 5,775,921 | | |
| Airlines – 0.4% | |
| Delta Air Lines, Inc. (a) | | | 575,390 | | | | 4,154,316 | | |
| Airlines Total | | | 4,154,316 | | |
See Accompanying Notes to Financial Statements.
44
Columbia Mid Cap Growth Fund
August 31, 2009
| Common Stocks (continued) | |
| | | Shares | | Value ($) | |
| Commercial Services & Supplies – 0.9% | |
| Stericycle, Inc. (a) | | | 113,170 | | | | 5,604,178 | | |
| Waste Connections, Inc. (a) | | | 138,234 | | | | 3,780,700 | | |
| Commercial Services & Supplies Total | | | 9,384,878 | | |
| Construction & Engineering – 1.1% | |
| Foster Wheeler AG (a) | | | 280,010 | | | | 8,106,289 | | |
Jacobs Engineering
Group, Inc. (a) | | | 83,600 | | | | 3,676,728 | | |
| Construction & Engineering Total | | | 11,783,017 | | |
| Electrical Equipment – 1.5% | |
| AMETEK, Inc. | | | 159,220 | | | | 5,012,246 | | |
| GrafTech International Ltd. (a) | | | 274,100 | | | | 3,900,443 | | |
| Roper Industries, Inc. | | | 141,900 | | | | 6,723,222 | | |
| Electrical Equipment Total | | | 15,635,911 | | |
| Industrial Conglomerates – 1.5% | |
| McDermott International, Inc. (a) | | | 486,480 | | | | 11,558,765 | | |
| Textron, Inc. | | | 299,750 | | | | 4,604,160 | | |
| Industrial Conglomerates Total | | | 16,162,925 | | |
| Machinery – 3.3% | |
| Bucyrus International, Inc. | | | 210,180 | | | | 6,273,873 | | |
| Cummins, Inc. | | | 190,230 | | | | 8,621,223 | | |
| Joy Global, Inc. | | | 130,478 | | | | 5,069,070 | | |
| Navistar International Corp. (a) | | | 109,990 | | | | 4,755,968 | | |
| Pall Corp. | | | 193,090 | | | | 5,740,566 | | |
| Wabtec Corp. | | | 102,140 | | | | 3,825,143 | | |
| Machinery Total | | | 34,285,843 | | |
| Marine – 0.3% | |
| Genco Shipping & Trading Ltd. | | | 170,300 | | | | 3,298,711 | | |
| Marine Total | | | 3,298,711 | | |
| Professional Services – 1.4% | |
| Dun & Bradstreet Corp. | | | 84,750 | | | | 6,190,140 | | |
| Monster Worldwide, Inc. (a) | | | 510,738 | | | | 8,284,170 | | |
| Professional Services Total | | | 14,474,310 | | |
| Road & Rail – 1.1% | |
| Landstar System, Inc. | | | 190,910 | | | | 6,657,032 | | |
Old Dominion
Freight Line, Inc. (a) | | | 141,150 | | | | 5,050,347 | | |
| Road & Rail Total | | | 11,707,379 | | |
| Trading Companies & Distributors – 0.6% | |
| Fastenal Co. | | | 159,560 | | | | 5,776,072 | | |
| Trading Companies & Distributors Total | | | 5,776,072 | | |
| Industrials Total | | | 160,223,750 | | |
| | | Shares | | Value ($) | |
| Information Technology – 22.3% | |
| Communications Equipment – 2.3% | |
| CommScope, Inc. (a) | | | 482,976 | | | | 13,021,033 | | |
| Motorola, Inc. | | | 837,620 | | | | 6,014,111 | | |
| Tandberg ASA | | | 228,220 | | | | 4,729,300 | | |
| Communications Equipment Total | | | 23,764,444 | | |
| Computers & Peripherals – 1.8% | |
| NCR Corp. (a) | | | 396,910 | | | | 5,290,810 | | |
| NetApp, Inc. (a) | | | 190,010 | | | | 4,322,728 | | |
| Teradata Corp. (a) | | | 164,240 | | | | 4,422,983 | | |
| Western Digital Corp. (a) | | | 160,460 | | | | 5,500,569 | | |
| Computers & Peripherals Total | | | 19,537,090 | | |
| Electronic Equipment, Instruments & Components – 0.9% | |
| Flextronics International Ltd. (a) | | | 714,450 | | | | 4,236,688 | | |
| LG Display Co., Ltd., ADR | | | 384,570 | | | | 5,568,574 | | |
Electronic Equipment, Instruments &
Components Total | | | 9,805,262 | | |
| Internet Software & Services – 2.0% | |
| Akamai Technologies, Inc. (a) | | | 152,070 | | | | 2,682,515 | | |
| Equinix, Inc. (a) | | | 61,131 | | | | 5,150,898 | | |
| Sohu.com, Inc. (a) | | | 94,590 | | | | 5,779,449 | | |
| VeriSign, Inc. (a) | | | 360,860 | | | | 7,646,623 | | |
| Internet Software & Services Total | | | 21,259,485 | | |
| IT Services – 3.4% | |
| Alliance Data Systems Corp. (a) | | | 99,930 | | | | 5,552,111 | | |
Cognizant Technology
Solutions Corp., Class A (a) | | | 231,850 | | | | 8,086,928 | | |
Hewitt Associates, Inc.,
Class A (a) | | | 141,010 | | | | 5,079,180 | | |
| MasterCard, Inc., Class A | | | 20,920 | | | | 4,239,020 | | |
| Paychex, Inc. | | | 150,250 | | | | 4,250,573 | | |
| Western Union Co. | | | 464,580 | | | | 8,381,023 | | |
| IT Services Total | | | 35,588,835 | | |
| Semiconductors & Semiconductor Equipment – 7.1% | |
| Altera Corp. | | | 289,190 | | | | 5,555,340 | | |
| Analog Devices, Inc. | | | 380,389 | | | | 10,745,989 | | |
| Linear Technology Corp. | | | 198,850 | | | | 5,283,445 | | |
| Maxim Integrated Products, Inc. | | | 356,880 | | | | 6,702,206 | | |
MEMC Electronic
Materials, Inc. (a) | | | 254,330 | | | | 4,056,564 | | |
| Microchip Technology, Inc. | | | 256,400 | | | | 6,807,420 | | |
| Micron Technology, Inc. (a) | | | 673,090 | | | | 4,960,673 | | |
| Novellus Systems, Inc. (a) | | | 392,410 | | | | 7,518,576 | | |
| NVIDIA Corp. (a) | | | 457,520 | | | | 6,643,190 | | |
See Accompanying Notes to Financial Statements.
45
Columbia Mid Cap Growth Fund
August 31, 2009
| Common Stocks (continued) | |
| | | Shares | | Value ($) | |
| ON Semiconductor Corp. (a) | | | 587,770 | | | | 4,743,304 | | |
| Silicon Laboratories, Inc. (a) | | | 123,830 | | | | 5,577,303 | | |
| Xilinx, Inc. | | | 282,630 | | | | 6,285,691 | | |
Semiconductors & Semiconductor
Equipment Total | | | 74,879,701 | | |
| Software – 4.8% | |
| Adobe Systems, Inc. (a) | | | 127,380 | | | | 4,002,280 | | |
| Autodesk, Inc. (a) | | | 389,680 | | | | 9,130,202 | | |
| BMC Software, Inc. (a) | | | 112,610 | | | | 4,014,546 | | |
| Electronic Arts, Inc. (a) | | | 350,240 | | | | 6,381,373 | | |
| Intuit, Inc. (a) | | | 212,230 | | | | 5,893,627 | | |
| McAfee, Inc. (a) | | | 122,070 | | | | 4,855,945 | | |
| Micros Systems, Inc. (a) | | | 184,480 | | | | 5,141,458 | | |
| Salesforce.com, Inc. (a) | | | 140,140 | | | | 7,269,062 | | |
| Symantec Corp. (a) | | | 230,860 | | | | 3,490,603 | | |
| Software Total | | | 50,179,096 | | |
| Information Technology Total | | | 235,013,913 | | |
| Materials – 6.6% | |
| Chemicals – 2.6% | |
| CF Industries Holdings, Inc. | | | 142,450 | | | | 11,632,467 | | |
| Ecolab, Inc. | | | 119,270 | | | | 5,043,928 | | |
Potash Corp. of
Saskatchewan, Inc. | | | 119,540 | | | | 10,580,486 | | |
| Chemicals Total | | | 27,256,881 | | |
| Construction Materials – 0.6% | |
| Martin Marietta Materials, Inc. | | | 69,830 | | | | 6,115,711 | | |
| Construction Materials Total | | | 6,115,711 | | |
| Containers & Packaging – 0.9% | |
| Crown Holdings, Inc. (a) | | | 166,820 | | | | 4,142,141 | | |
| Greif, Inc., Class A | | | 101,010 | | | | 5,004,035 | | |
| Containers & Packaging Total | | | 9,146,176 | | |
| Metals & Mining – 2.5% | |
| Agnico-Eagle Mines Ltd. | | | 130,290 | | | | 7,478,646 | | |
| Cliffs Natural Resources, Inc. | | | 428,000 | | | | 10,832,680 | | |
| Walter Energy, Inc. | | | 165,390 | | | | 8,585,395 | | |
| Metals & Mining Total | | | 26,896,721 | | |
| Materials Total | | | 69,415,489 | | |
| | | Shares | | Value ($) | |
| Telecommunication Services – 2.8% | |
| Diversified Telecommunication Services – 0.4% | |
| Vimpel-Communications, ADR (a) | | | 285,650 | | | | 4,410,436 | | |
Diversified Telecommunication
Services Total | | | 4,410,436 | | |
| Wireless Telecommunication Services – 2.4% | |
American Tower Corp.,
Class A (a) | | | 270,367 | | | | 8,557,116 | | |
Millicom International
Cellular SA (a) | | | 54,340 | | | | 3,834,230 | | |
| NII Holdings, Inc. (a) | | | 175,640 | | | | 4,164,424 | | |
SBA Communications Corp.,
Class A (a) | | | 347,150 | | | | 8,369,786 | | |
Wireless Telecommunication
Services Total | | | 24,925,556 | | |
| Telecommunication Services Total | | | 29,335,992 | | |
| Utilities – 2.4% | |
| Electric Utilities – 0.4% | |
| PPL Corp. | | | 157,910 | | | | 4,642,554 | | |
| Electric Utilities Total | | | 4,642,554 | | |
| Gas Utilities – 0.6% | |
| Questar Corp. | | | 176,740 | | | | 5,966,742 | | |
| Gas Utilities Total | | | 5,966,742 | | |
| Independent Power Producers & Energy Traders – 1.1% | |
| AES Corp. (a) | | | 832,150 | | | | 11,375,491 | | |
Independent Power Producers &
Energy Traders Total | | | 11,375,491 | | |
| Multi-Utilities – 0.3% | |
| Xcel Energy, Inc. | | | 159,120 | | | | 3,142,620 | | |
| Multi-Utilities Total | | | 3,142,620 | | |
| Utilities Total | | | 25,127,407 | | |
Total Common Stocks
(cost of $875,181,565) | | | 1,047,203,209 | | |
See Accompanying Notes to Financial Statements.
46
Columbia Mid Cap Growth Fund
August 31, 2009
| Short-Term Obligation – 0.4% | |
| | | Par ($) | | Value ($) | |
Repurchase agreement with
Fixed Income Clearing Corp.,
dated 08/31/09, due 09/01/09
at 0.130%, collateralized by a
U.S. Treasury obligation
maturing 08/26/10, market
value $4,524,548 (repurchase
proceeds $4,431,016) | | | 4,431,000 | | | | 4,431,000 | | |
Total Short-Term Obligation
(cost of $4,431,000) | | | 4,431,000 | | |
Total Investments – 100.0%
(cost of $879,612,565) (b) | | | 1,051,634,209 | | |
| Other Assets & Liabilities, Net – 0.0% | | | 182,946 | | |
| Net Assets – 100.0% | | | 1,051,817,155 | | |
Notes to Investment Portfolio:
(a) Non-income producing security.
(b) Cost for federal income tax purposes is $889,283,945.
The following table summarizes the inputs used, as of August 31, 2009 in valuing the Fund's assets:
| Description | | Quoted Prices
(Level 1) | | Other
Significant
Observable
Inputs
(Level 2) | | Significant
Unobservable
Inputs
(Level 3) | | Total | |
| Common Stocks | |
Consumer
Discretionary | | $ | 182,517,621 | | | $ | — | | | $ | — | | | $ | 182,517,621 | | |
| Consumer Staples | | | 61,613,153 | | | | — | | | | — | | | | 61,613,153 | | |
| Energy | | | 59,758,274 | | | | — | | | | — | | | | 59,758,274 | | |
| Financials | | | 81,623,328 | | | | — | | | | — | | | | 81,623,328 | | |
| Health Care | | | 142,574,282 | | | | — | | | | — | | | | 142,574,282 | | |
| Industrials | | | 160,223,750 | | | | — | | | | — | | | | 160,223,750 | | |
Information
Technology | | | 230,284,613 | | | | 4,729,300 | | | | — | | | | 235,013,913 | | |
| Materials | | | 69,415,489 | | | | — | | | | — | | | | 69,415,489 | | |
Telecommunication
Services | | | 29,335,992 | | | | — | | | | — | | | | 29,335,992 | | |
| Utilities | | | 25,127,407 | | | | — | | | | — | | | | 25,127,407 | | |
| Total Common Stocks | | | 1,042,473,909 | | | | 4,729,300 | | | | — | | | | 1,047,203,209 | | |
Total Short-Term
Obligation | | | — | | | | 4,431,000 | | | | — | | | | 4,431,000 | | |
| Total Investments | | $ | 1,042,473,909 | | | $ | 9,160,300 | | | $ | — | | | $ | 1,051,634,209 | | |
The Fund's assets assigned to the Level 2 input category include certain foreign securities for which a third party statistical pricing service may be employed for purposes of fair market valuation.
For more information on valuation inputs, and their aggregation into the levels used in the table above, please refer to the Security Valuation section in the accompanying Notes to Financial Statements.
Risk Exposure/Type
For the year ended August 31, 2009, transactions in written option contracts were as follows:
Equity Risk
Written Call Options | | Number of
contracts | | Premium
received | |
| Options outstanding at August 31, 2008 | | | 1,197 | | | $ | 128,030 | | |
| Options written | | | 197 | | | | 55,554 | | |
Options terminated in closing
purchase transactions | | | (1,394 | ) | | | (183,584 | ) | |
| Options exercised | | | — | | | | — | | |
| Options expired | | | — | | | | — | | |
| Options outstanding at August 31, 2009 | | | — | | | $ | — | | |
At August 31, 2009, the Fund held Investments In the following sectors:
| % of Sector (Unaudited) | | Net Assets | |
| Information Technology | | | 22.3 | | |
| Consumer Discretionary | | | 17.3 | | |
| Industrials | | | 15.2 | | |
| Health Care | | | 13.6 | | |
| Financials | | | 7.8 | | |
| Materials | | | 6.6 | | |
| Consumer Staples | | | 5.9 | | |
| Energy | | | 5.7 | | |
| Telecommunication Services | | | 2.8 | | |
| Utilities | | | 2.4 | | |
| | | | 99.6 | | |
| Short-Term Obligation | | | 0.4 | | |
| Other Assets & Liabilities, Net | | | 0.0 | * | |
| | | | 100.0 | | |
* Rounds to less than 0.01%.
| Acronym | | Name | |
| ADR | | American Depositary Receipt | |
|
See Accompanying Notes to Financial Statements.
47
Investment Portfolio – Columbia Small Cap Growth Fund I
August 31, 2009
| Common Stocks – 96.9% | |
| | | Shares | | Value ($) | |
| Consumer Discretionary – 15.7% | |
| Diversified Consumer Services – 2.2% | |
| Capella Education Co. (a) | | | 73,531 | | | | 4,658,189 | | |
| Coinstar, Inc. (a) | | | 77,900 | | | | 2,571,479 | | |
| Corinthian Colleges, Inc. (a) | | | 314,801 | | | | 6,034,735 | | |
| Diversified Consumer Services Total | | | 13,264,403 | | |
| Hotels, Restaurants & Leisure – 2.6% | |
| Bally Technologies, Inc. (a) | | | 75,700 | | | | 3,060,551 | | |
| Boyd Gaming Corp. (a) | | | 270,300 | | | | 2,778,684 | | |
| Buffalo Wild Wings, Inc. (a) | | | 111,000 | | | | 4,576,530 | | |
| Ruth's Hospitality Group, Inc. (a) | | | 350,800 | | | | 1,389,168 | | |
| Sonic Corp. (a) | | | 157,300 | | | | 1,797,939 | | |
Texas Roadhouse, Inc.,
Class A (a) | | | 200,200 | | | | 2,040,038 | | |
| Hotels, Restaurants & Leisure Total | | | 15,642,910 | | |
| Household Durables – 1.2% | |
| Tempur-Pedic International, Inc. (a) | | | 462,200 | | | | 6,840,560 | | |
| Household Durables Total | | | 6,840,560 | | |
| Internet & Catalog Retail – 1.9% | |
| Blue Nile, Inc. (a) | | | 58,900 | | | | 3,261,882 | | |
| NetFlix, Inc. (a) | | | 80,500 | | | | 3,514,630 | | |
| Shutterfly, Inc. (a) | | | 185,900 | | | | 2,688,114 | | |
Ticketmaster Entertainment,
Inc. (a) | | | 211,600 | | | | 2,065,216 | | |
| Internet & Catalog Retail Total | | | 11,529,842 | | |
| Leisure Equipment & Products – 0.3% | |
| Polaris Industries, Inc. | | | 45,697 | | | | 1,723,234 | | |
| Leisure Equipment & Products Total | | | 1,723,234 | | |
| Media – 2.0% | |
Entercom Communications Corp.,
Class A | | | 488,400 | | | | 2,388,276 | | |
| Imax Corp. (a) | | | 470,500 | | | | 4,422,700 | | |
| Knology, Inc. (a) | | | 217,700 | | | | 1,576,148 | | |
| Marvel Entertainment, Inc. (a) | | | 66,700 | | | | 3,226,279 | | |
| Media Total | | | 11,613,403 | | |
| Specialty Retail – 3.9% | |
| Aeropostale, Inc. (a) | | | 74,100 | | | | 2,901,015 | | |
| Gymboree Corp. (a) | | | 49,100 | | | | 2,199,189 | | |
| hhgregg, Inc. (a) | | | 181,415 | | | | 3,134,851 | | |
| Hibbett Sports, Inc. (a) | | | 180,500 | | | | 3,171,385 | | |
| Lumber Liquidators, Inc. (a) | | | 264,700 | | | | 5,823,400 | | |
| OfficeMax, Inc. | | | 267,900 | | | | 3,029,949 | | |
| Pier 1 Imports, Inc. (a) | | | 1,026,500 | | | | 2,597,045 | | |
| Specialty Retail Total | | | 22,856,834 | | |
| | | Shares | | Value ($) | |
| Textiles, Apparel & Luxury Goods – 1.6% | |
| Iconix Brand Group, Inc. (a) | | | 114,700 | | | | 1,970,546 | | |
| Lululemon Athletica, Inc. (a) | | | 145,400 | | | | 2,916,724 | | |
| True Religion Apparel, Inc. (a) | | | 92,000 | | | | 2,081,960 | | |
| Warnaco Group, Inc. (a) | | | 67,200 | | | | 2,556,960 | | |
| Textiles, Apparel & Luxury Goods Total | | | 9,526,190 | | |
| Consumer Discretionary Total | | | 92,997,376 | | |
| Consumer Staples – 2.3% | |
| Food Products – 1.1% | |
| Corn Products International, Inc. | | | 135,000 | | | | 4,004,100 | | |
| Diamond Foods, Inc. | | | 87,600 | | | | 2,448,420 | | |
| Food Products Total | | | 6,452,520 | | |
| Personal Products – 1.2% | |
| Bare Escentuals, Inc. (a) | | | 320,100 | | | | 2,970,528 | | |
| Chattem, Inc. (a) | | | 65,197 | | | | 3,992,664 | | |
| Personal Products Total | | | 6,963,192 | | |
| Consumer Staples Total | | | 13,415,712 | | |
| Energy – 4.5% | |
| Energy Equipment & Services – 1.7% | |
| Core Laboratories N.V. | | | 37,400 | | | | 3,465,858 | | |
| Hercules Offshore, Inc. (a) | | | 551,100 | | | | 2,535,060 | | |
| Pioneer Drilling Co. (a) | | | 389,285 | | | | 2,218,924 | | |
| Tesco Corp. (a) | | | 231,600 | | | | 1,778,688 | | |
| Energy Equipment & Services Total | | | 9,998,530 | | |
| Oil, Gas & Consumable Fuels – 2.8% | |
| Arena Resources, Inc. (a) | | | 117,393 | | | | 3,589,878 | | |
| Concho Resources, Inc. (a) | | | 103,220 | | | | 3,363,940 | | |
| Goodrich Petroleum Corp. (a) | | | 78,800 | | | | 1,886,472 | | |
| Quicksilver Resources, Inc. (a) | | | 190,900 | | | | 2,065,538 | | |
| SandRidge Energy, Inc. (a) | | | 277,200 | | | | 3,381,840 | | |
| Ship Finance International Ltd. | | | 192,500 | | | | 2,437,050 | | |
| Oil, Gas & Consumable Fuels Total | | | 16,724,718 | | |
| Energy Total | | | 26,723,248 | | |
| Financials – 5.0% | |
| Capital Markets – 1.9% | |
| Janus Capital Group, Inc. | | | 322,155 | | | | 4,097,812 | | |
| Riskmetrics Group, Inc. (a) | | | 209,300 | | | | 3,256,708 | | |
Waddell & Reed Financial, Inc.,
Class A | | | 150,500 | | | | 3,992,765 | | |
| Capital Markets Total | | | 11,347,285 | | |
See Accompanying Notes to Financial Statements.
48
Columbia Small Cap Growth Fund I
August 31, 2009
| Common Stocks (continued) | |
| | | Shares | | Value ($) | |
| Commercial Banks – 0.4% | |
| East West Bancorp, Inc. | | | 240,716 | | | | 2,216,994 | | |
| Commercial Banks Total | | | 2,216,994 | | |
| Consumer Finance – 0.4% | |
| Ezcorp, Inc., Class A (a) | | | 167,800 | | | | 2,243,486 | | |
| Consumer Finance Total | | | 2,243,486 | | |
| Real Estate Investment Trusts (REITs) – 2.3% | |
Alexandria Real Estate
Equities, Inc. | | | 73,400 | | | | 4,089,114 | | |
| FelCor Lodging Trust, Inc. | | | 573,168 | | | | 2,355,720 | | |
| Home Properties, Inc. | | | 53,200 | | | | 2,020,004 | | |
| LaSalle Hotel Properties | | | 201,300 | | | | 3,331,515 | | |
| Tanger Factory Outlet Centers | | | 57,800 | | | | 2,174,436 | | |
| Real Estate Investment Trusts (REITs) Total | | | 13,970,789 | | |
| Financials Total | | | 29,778,554 | | |
| Health Care – 23.2% | |
| Biotechnology – 6.4% | |
| Acorda Therapeutics, Inc. (a) | | | 115,300 | | | | 2,608,086 | | |
| Alexion Pharmaceuticals, Inc. (a) | | | 72,200 | | | | 3,259,108 | | |
| Allos Therapeutics, Inc. (a) | | | 255,605 | | | | 1,878,697 | | |
| Array Biopharma, Inc. (a) | | | 478,700 | | | | 1,972,244 | | |
| BioMarin Pharmaceuticals, Inc. (a) | | | 224,700 | | | | 3,700,809 | | |
| Celera Corp. (a) | | | 353,900 | | | | 2,314,506 | | |
| Halozyme Therapeutics, Inc. (a) | | | 336,100 | | | | 2,500,584 | | |
| Human Genome Sciences, Inc. (a) | | | 195,964 | | | | 3,876,168 | | |
| Onyx Pharmaceuticals, Inc. (a) | | | 260,883 | | | | 8,366,518 | | |
| OSI Pharmaceuticals, Inc. (a) | | | 99,900 | | | | 3,338,658 | | |
| Seattle Genetics, Inc. (a) | | | 306,780 | | | | 3,758,055 | | |
| Biotechnology Total | | | 37,573,433 | | |
| Health Care Equipment & Supplies – 4.4% | |
| Cutera, Inc. (a) | | | 228,600 | | | | 1,997,964 | | |
| DexCom, Inc. (a) | | | 306,800 | | | | 2,396,108 | | |
| Haemonetics Corp. (a) | | | 28,000 | | | | 1,473,920 | | |
| Insulet Corp. (a) | | | 251,669 | | | | 2,317,872 | | |
| Masimo Corp. (a) | | | 209,400 | | | | 5,260,128 | | |
| NuVasive, Inc. (a) | | | 161,300 | | | | 6,463,291 | | |
| Syneron Medical Ltd. (a) | | | 113,600 | | | | 1,108,736 | | |
| Thoratec Corp. (a) | | | 189,600 | | | | 4,975,104 | | |
| Health Care Equipment & Supplies Total | | | 25,993,123 | | |
| Health Care Providers & Services – 5.3% | |
| AMERIGROUP Corp. (a) | | | 207,900 | | | | 4,916,835 | | |
| Brookdale Senior Living, Inc. | | | 105,800 | | | | 1,681,162 | | |
| Catalyst Health Solutions, Inc. (a) | | | 111,955 | | | | 3,197,435 | | |
| Genoptix, Inc. (a) | | | 98,400 | | | | 2,823,096 | | |
| HMS Holdings Corp. (a) | | | 92,600 | | | | 3,482,686 | | |
| | | Shares | | Value ($) | |
| IPC The Hospitalist Co., Inc. (a) | | | 100,905 | | | | 2,980,734 | | |
| Mednax, Inc. (a) | | | 88,000 | | | | 4,582,160 | | |
| Owens & Minor, Inc. | | | 69,500 | | | | 3,075,375 | | |
| Psychiatric Solutions, Inc. (a) | | | 164,654 | | | | 4,411,080 | | |
| Health Care Providers & Services Total | | | 31,150,563 | | |
| Health Care Technology – 2.1% | |
Allscripts-Misys Healthcare
Solutions, Inc. | | | 163,500 | | | | 2,427,975 | | |
| Medidata Solutions, Inc. (a) | | | 127,871 | | | | 2,028,034 | | |
| Omnicell, Inc. (a) | | | 407,986 | | | | 4,479,686 | | |
| Quality Systems, Inc. | | | 68,100 | | | | 3,666,504 | | |
| Health Care Technology Total | | | 12,602,199 | | |
| Life Sciences Tools & Services – 2.2% | |
| ICON PLC, ADR (a) | | | 328,989 | | | | 7,112,742 | | |
| Illumina, Inc. (a) | | | 161,700 | | | | 5,703,159 | | |
| Life Sciences Tools & Services Total | | | 12,815,901 | | |
| Pharmaceuticals – 2.8% | |
| Auxilium Pharmaceuticals, Inc. (a) | | | 109,400 | | | | 3,149,626 | | |
| Cypress Bioscience, Inc. (a) | | | 267,400 | | | | 1,861,104 | | |
| Impax Laboratories, Inc. (a) | | | 936,700 | | | | 7,109,553 | | |
| Perrigo Co. | | | 160,900 | | | | 4,749,768 | | |
| Pharmaceuticals Total | | | 16,870,051 | | |
| Health Care Total | | | 137,005,270 | | |
| Industrials – 12.6% | |
| Aerospace & Defense – 1.3% | |
| LMI Aerospace, Inc. (a) | | | 123,700 | | | | 1,139,277 | | |
| Orbital Sciences Corp. (a) | | | 278,200 | | | | 4,114,578 | | |
| Teledyne Technologies, Inc. (a) | | | 80,700 | | | | 2,724,432 | | |
| Aerospace & Defense Total | | | 7,978,287 | | |
| Air Freight & Logistics – 0.7% | |
Atlas Air Worldwide Holdings,
Inc. (a) | | | 75,600 | | | | 1,885,464 | | |
| Forward Air Corp. | | | 99,500 | | | | 2,296,460 | | |
| Air Freight & Logistics Total | | | 4,181,924 | | |
| Commercial Services & Supplies – 2.0% | |
| ACCO Brands Corp. (a) | | | 560,736 | | | | 3,140,122 | | |
| Clean Harbors, Inc. (a) | | | 60,100 | | | | 3,547,102 | | |
| Herman Miller, Inc. | | | 189,000 | | | | 3,065,580 | | |
| Knoll, Inc. | | | 218,000 | | | | 2,099,340 | | |
| Commercial Services & Supplies Total | | | 11,852,144 | | |
| Construction & Engineering – 0.7% | |
| Granite Construction, Inc. | | | 94,400 | | | | 3,030,240 | | |
| Pike Electric Corp. (a) | | | 123,200 | | | | 1,368,752 | | |
| Construction & Engineering Total | | | 4,398,992 | | |
See Accompanying Notes to Financial Statements.
49
Columbia Small Cap Growth Fund I
August 31, 2009
| Common Stocks (continued) | |
| | | Shares | | Value ($) | |
| Electrical Equipment – 1.8% | |
| Acuity Brands, Inc. | | | 75,400 | | | | 2,421,094 | | |
| Baldor Electric Co. | | | 88,400 | | | | 2,481,388 | | |
| GrafTech International Ltd. (a) | | | 385,600 | | | | 5,487,088 | | |
| Electrical Equipment Total | | | 10,389,570 | | |
| Machinery – 2.6% | |
| Bucyrus International, Inc. | | | 80,700 | | | | 2,408,895 | | |
Columbus McKinnon
Corp./NY (a) | | | 253,000 | | | | 3,111,900 | | |
| Key Technology, Inc. (a) | | | 63,646 | | | | 700,743 | | |
| Middleby Corp. (a) | | | 58,100 | | | | 2,741,739 | | |
Mueller Water Products, Inc.,
Class A | | | 170,295 | | | | 783,357 | | |
| Robbins & Myers, Inc. | | | 120,800 | | | | 2,804,976 | | |
| Wabtec Corp. | | | 73,100 | | | | 2,737,595 | | |
| Machinery Total | | | 15,289,205 | | |
| Marine – 0.4% | |
| Genco Shipping & Trading Ltd. | | | 108,700 | | | | 2,105,519 | | |
| Marine Total | | | 2,105,519 | | |
| Professional Services – 1.4% | |
| Advisory Board Co. (a) | | | 117,900 | | | | 3,116,097 | | |
| TrueBlue, Inc. (a) | | | 219,000 | | | | 2,978,400 | | |
Watson Wyatt Worldwide, Inc.,
Class A | | | 44,479 | | | | 1,943,732 | | |
| Professional Services Total | | | 8,038,229 | | |
| Road & Rail – 1.5% | |
Genesee & Wyoming, Inc.,
Class A (a) | | | 98,300 | | | | 3,084,654 | | |
| Old Dominion Freight Line, Inc. (a) | | | 88,700 | | | | 3,173,686 | | |
| Saia, Inc. (a) | | | 137,500 | | | | 2,433,750 | | |
| Road & Rail Total | | | 8,692,090 | | |
| Trading Companies & Distributors – 0.2% | |
| Houston Wire & Cable Co. | | | 128,389 | | | | 1,477,757 | | |
| Trading Companies & Distributors Total | | | 1,477,757 | | |
| Industrials Total | | | 74,403,717 | | |
| Information Technology – 26.8% | |
| Communications Equipment – 2.5% | |
| Arris Group, Inc. (a) | | | 256,800 | | | | 3,405,168 | | |
| Aruba Networks, Inc. (a) | | | 528,400 | | | | 4,813,724 | | |
| CommScope, Inc. (a) | | | 86,400 | | | | 2,329,344 | | |
| Polycom, Inc. (a) | | | 92,700 | | | | 2,186,793 | | |
| Starent Networks Corp. (a) | | | 98,200 | | | | 1,987,568 | | |
| Communications Equipment Total | | | 14,722,597 | | |
| | | Shares | | Value ($) | |
| Computers & Peripherals – 0.6% | |
| 3PAR, Inc. (a) | | | 213,500 | | | | 1,887,340 | | |
| Netezza Corp. (a) | | | 196,300 | | | | 1,884,480 | | |
| Computers & Peripherals Total | | | 3,771,820 | | |
| Electronic Equipment, Instruments & Components – 0.1% | |
| DTS, Inc. (a) | | | 22,100 | | | | 592,280 | | |
Electronic Equipment, Instruments &
Components Total | | | 592,280 | | |
| Internet Software & Services – 3.9% | |
| DealerTrack Holdings, Inc. (a) | | | 125,300 | | | | 2,528,554 | | |
| GSI Commerce, Inc. (a) | | | 247,100 | | | | 4,284,714 | | |
| Logmein, Inc. (a) | | | 106,916 | | | | 1,742,731 | | |
| Omniture, Inc. (a) | | | 164,600 | | | | 2,355,426 | | |
| SAVVIS, Inc. (a) | | | 391,100 | | | | 6,633,056 | | |
| VistaPrint Ltd. (a) | | | 122,500 | | | | 5,076,400 | | |
| Vocus, Inc. (a) | | | 28,654 | | | | 483,106 | | |
| Internet Software & Services Total | | | 23,103,987 | | |
| IT Services – 3.0% | |
| Cybersource Corp. (a) | | | 119,769 | | | | 1,838,454 | | |
| ExlService Holdings, Inc. (a) | | | 177,400 | | | | 2,128,800 | | |
Global Cash Access
Holdings, Inc. (a) | | | 377,400 | | | | 2,736,150 | | |
| TNS, Inc. (a) | | | 301,000 | | | | 7,813,960 | | |
| Wright Express Corp. (a) | | | 105,800 | | | | 3,334,816 | | |
| IT Services Total | | | 17,852,180 | | |
| Semiconductors & Semiconductor Equipment – 6.9% | |
| Amkor Technology, Inc. (a) | | | 268,500 | | | | 1,487,490 | | |
| Atheros Communications, Inc. (a) | | | 105,100 | | | | 2,904,964 | | |
| Cavium Networks, Inc. (a) | | | 218,000 | | | | 4,427,580 | | |
| Entegris, Inc. (a) | | | 454,700 | | | | 1,818,800 | | |
| FormFactor, Inc. (a) | | | 146,300 | | | | 3,209,822 | | |
Integrated Device
Technology, Inc. (a) | | | 330,300 | | | | 2,255,949 | | |
| Microsemi Corp. (a) | | | 319,736 | | | | 4,511,475 | | |
| MKS Instruments, Inc. (a) | | | 127,700 | | | | 2,353,511 | | |
| Semtech Corp. (a) | | | 162,500 | | | | 2,968,875 | | |
| Silicon Laboratories, Inc. (a) | | | 55,700 | | | | 2,508,728 | | |
| Skyworks Solutions, Inc. (a) | | | 348,600 | | | | 4,061,190 | | |
| Tessera Technologies, Inc. (a) | | | 89,400 | | | | 2,246,622 | | |
| Verigy Ltd. (a) | | | 303,500 | | | | 3,244,415 | | |
| Volterra Semiconductor Corp. (a) | | | 141,000 | | | | 2,497,110 | | |
Semiconductors & Semiconductor
Equipment Total | | | 40,496,531 | | |
| Software – 9.8% | |
| Advent Software, Inc. (a) | | | 106,869 | | | | 4,134,762 | | |
| Ariba, Inc. (a) | | | 226,200 | | | | 2,592,252 | | |
| Blackboard, Inc. (a) | | | 126,524 | | | | 4,353,691 | | |
See Accompanying Notes to Financial Statements.
50
Columbia Small Cap Growth Fund I
August 31, 2009
| Common Stocks (continued) | |
| | | Shares | | Value ($) | |
| Concur Technologies, Inc. (a) | | | 74,243 | | | | 2,625,233 | | |
| Informatica Corp. (a) | | | 139,300 | | | | 2,497,649 | | |
| Jack Henry & Associates, Inc. | | | 82,900 | | | | 1,932,399 | | |
| Kenexa Corp. (a) | | | 341,000 | | | | 4,180,660 | | |
| Lawson Software, Inc. (a) | | | 490,500 | | | | 3,021,480 | | |
| Micros Systems, Inc. (a) | | | 109,400 | | | | 3,048,978 | | |
| Netscout Systems, Inc. (a) | | | 365,824 | | | | 4,192,343 | | |
| Nice Systems Ltd., ADR (a) | | | 97,500 | | | | 2,731,950 | | |
| Parametric Technology Corp. (a) | | | 207,700 | | | | 2,762,410 | | |
| Rosetta Stone, Inc. (a) | | | 137,100 | | | | 3,023,055 | | |
| Solera Holdings, Inc. (a) | | | 200,398 | | | | 5,278,483 | | |
| Sybase, Inc. (a) | | | 76,400 | | | | 2,662,540 | | |
| Taleo Corp., Class A (a) | | | 145,500 | | | | 2,632,095 | | |
| TiVo, Inc. (a) | | | 601,200 | | | | 5,897,772 | | |
| Software Total | | | 57,567,752 | | |
| Information Technology Total | | | 158,107,147 | | |
| Materials – 4.3% | |
| Chemicals – 1.3% | |
| Intrepid Potash, Inc. (a) | | | 125,800 | | | | 2,955,042 | | |
| Rockwood Holdings, Inc. (a) | | | 218,000 | | | | 4,440,660 | | |
| Chemicals Total | | | 7,395,702 | | |
| Containers & Packaging – 0.4% | |
| Greif, Inc., Class A | | | 49,500 | | | | 2,452,230 | | |
| Containers & Packaging Total | | | 2,452,230 | | |
| Metals & Mining – 2.6% | |
| AK Steel Holding Corp. | | | 206,800 | | | | 4,202,176 | | |
| Gammon Gold, Inc. (a) | | | 297,200 | | | | 2,000,156 | | |
Thompson Creek
Metals Co., Inc. (a) | | | 397,600 | | | | 4,572,400 | | |
| Walter Energy, Inc. | | | 91,400 | | | | 4,744,574 | | |
| Metals & Mining Total | | | 15,519,306 | | |
| Materials Total | | | 25,367,238 | | |
| Telecommunication Services – 2.5% | |
| Diversified Telecommunication Services – 1.7% | |
Cogent Communications
Group, Inc. (a) | | | 291,362 | | | | 2,811,643 | | |
| Neutral Tandem, Inc. (a) | | | 231,493 | | | | 5,789,640 | | |
| Premiere Global Services, Inc. (a) | | | 183,700 | | | | 1,719,432 | | |
Diversified Telecommunication
Services Total | | | 10,320,715 | | |
| | | Shares | | Value ($) | |
| Wireless Telecommunication Services – 0.8% | |
SBA Communications Corp.,
Class A (a) | | | 189,307 | | | | 4,564,192 | | |
Wireless Telecommunication
Services Total | | | 4,564,192 | | |
| Telecommunication Services Total | | | 14,884,907 | | |
Total Common Stocks
(cost of $483,826,720) | | | 572,683,169 | | |
| Short-Term Obligation – 4.0% | |
| | | Par ($) | | | |
Repurchase agreement with
Fixed Income Clearing Corp.,
dated 08/31/09, due 09/01/09
at 0.130%, collateralized by a
U.S. Treasury obligation
maturing 08/26/10, market value
$24,046,303 (repurchase
proceeds $23,570,085) | | | 23,570,000 | | | | 23,570,000 | | |
Total Short-Term Obligation
(cost of $23,570,000) | | | 23,570,000 | | |
Total Investments – 100.9%
(cost of $507,396,720) (b) | | | 596,253,169 | | |
| Other Assets & Liabilities, Net – (0.9)% | | | (5,419,876 | ) | |
| Net Assets – 100.0% | | | 590,833,293 | | |
See Accompanying Notes to Financial Statements.
51
Columbia Small Cap Growth Fund I
August 31, 2009
Notes to Investment Portfolio:
(a) Non-income producing security.
(b) Cost for federal income tax purposes is $512,945,810.
The following table summarizes the inputs used, as of August 31, 2009, in valuing the Fund's assets:
| Description | | Quoted Prices
(Level 1) | | Other
Significant
Observable
Inputs
(Level 2) | | Significant
Unobservable
Inputs
(Level 3) | | Total | |
| Common Stocks | |
Consumer
Discretionary | | $ | 92,997,376 | | | $ | — | | | $ | — | | | $ | 92,997,376 | | |
| Consumer Staples | | | 13,415,712 | | | | — | | | | — | | | | 13,415,712 | | |
| Energy | | | 26,723,248 | | | | — | | | | — | | | | 26,723,248 | | |
| Financials | | | 29,778,554 | | | | — | | | | — | | | | 29,778,554 | | |
| Health Care | | | 137,005,270 | | | | — | | | | — | | | | 137,005,270 | | |
| Industrials | | | 74,403,717 | | | | — | | | | — | | | | 74,403,717 | | |
Information
Technology | | | 158,107,147 | | | | — | | | | — | | | | 158,107,147 | | |
| Materials | | | 25,367,238 | | | | — | | | | — | | | | 25,367,238 | | |
Telecommunication
Services | | | 14,884,907 | | | | — | | | | — | | | | 14,884,907 | | |
| Total Common Stocks | | | 572,683,169 | | | | — | | | | — | | | | 572,683,169 | | |
Total Short-Term
Obligation | | | — | | | | 23,570,000 | | | | — | | | | 23,570,000 | | |
| Total Investments | | $ | 572,683,169 | | | $ | 23,570,000 | | | $ | — | | | $ | 596,253,169 | | |
For more information on valuation inputs, and their aggregation into the levels used in the table above, please refer to the Security Valuation section in the accompanying Notes to Financial Statements.
At August 31, 2009, the Fund held investments in the following sectors:
| Sector (Unaudited) | | % of
Net Assets | |
| Information Technology | | | 26.8 | | |
| Health Care | | | 23.2 | | |
| Consumer Discretionary | | | 15.7 | | |
| Industrials | | | 12.6 | | |
| Financials | | | 5.0 | | |
| Energy | | | 4.5 | | |
| Materials | | | 4.3 | | |
| Telecommunication Services | | | 2.5 | | |
| Consumer Staples | | | 2.3 | | |
| | | | 96.9 | | |
| Short-Term Obligation | | | 4.0 | | |
| Other Assets & Liabilities, Net | | | (0.9 | ) | |
| | | | 100.0 | | |
| Acronym | | Name | |
| ADR | | American Depositary Receipt | |
|
See Accompanying Notes to Financial Statements.
52
Investment Portfolio – Columbia Technology Fund
August 31, 2009
| Common Stocks – 100.0% | |
| | | Shares | | Value ($) | |
| Consumer Discretionary – 5.8% | |
| Hotels, Restaurants & Leisure – 0.4% | |
| Ctrip.com International Ltd., ADR | | | 23,090 | | | | 1,130,025 | | |
| Hotels, Restaurants & Leisure Total | | | 1,130,025 | | |
| Household Durables – 1.2% | |
| Garmin Ltd. | | | 101,400 | | | | 3,333,018 | | |
| Household Durables Total | | | 3,333,018 | | |
| Internet & Catalog Retail – 2.8% | |
| Amazon.com, Inc. (a) | | | 21,650 | | | | 1,757,763 | | |
| NetFlix, Inc. (a) | | | 92,030 | | | | 4,018,030 | | |
| Priceline.com, Inc. (a) | | | 10,520 | | | | 1,619,870 | | |
| Internet & Catalog Retail Total | | | 7,395,663 | | |
| Media – 0.5% | |
| DIRECTV Group, Inc. (a) | | | 52,720 | | | | 1,305,347 | | |
| Media Total | | | 1,305,347 | | |
| Specialty Retail – 0.9% | |
| GameStop Corp., Class A (a) | | | 105,800 | | | | 2,518,040 | | |
| Specialty Retail Total | | | 2,518,040 | | |
| Consumer Discretionary Total | | | 15,682,093 | | |
| Health Care – 1.3% | |
| Health Care Technology – 0.8% | |
| Cerner Corp. (a) | | | 17,250 | | | | 1,064,497 | | |
| Omnicell, Inc. (a) | | | 87,320 | | | | 958,774 | | |
| Health Care Technology Total | | | 2,023,271 | | |
| Life Sciences Tools & Services – 0.5% | |
| Illumina, Inc. (a) | | | 38,810 | | | | 1,368,829 | | |
| Life Sciences Tools & Services Total | | | 1,368,829 | | |
| Health Care Total | | | 3,392,100 | | |
| Industrials – 0.3% | |
| Electrical Equipment – 0.3% | |
| GrafTech International Ltd. (a) | | | 54,370 | | | | 773,685 | | |
| Electrical Equipment Total | | | 773,685 | | |
| Industrials Total | | | 773,685 | | |
| Information Technology – 88.8% | |
| Communications Equipment – 6.5% | |
| CommScope, Inc. (a) | | | 158,446 | | | | 4,271,704 | | |
| Motorola, Inc. | | | 438,750 | | | | 3,150,225 | | |
| QUALCOMM, Inc. | | | 158,040 | | | | 7,336,217 | | |
| | | Shares | | Value ($) | |
| Research In Motion Ltd. (a) | | | 17,374 | | | | 1,269,344 | | |
| Tandberg ASA | | | 64,740 | | | | 1,341,578 | | |
| Communications Equipment Total | | | 17,369,068 | | |
| Computers & Peripherals – 14.6% | |
| Apple, Inc. (a) | | | 77,574 | | | | 13,048,723 | | |
| Dell, Inc. (a) | | | 261,570 | | | | 4,140,653 | | |
| EMC Corp. (a) | | | 296,230 | | | | 4,710,057 | | |
| NCR Corp. (a) | | | 249,970 | | | | 3,332,100 | | |
| NetApp, Inc. (a) | | | 91,080 | | | | 2,072,070 | | |
| Seagate Technology | | | 275,700 | | | | 3,818,445 | | |
| Teradata Corp. (a) | | | 107,210 | | | | 2,887,165 | | |
| Western Digital Corp. (a) | | | 152,380 | | | | 5,223,586 | | |
| Computers & Peripherals Total | | | 39,232,799 | | |
| Electronic Equipment, Instruments & Components – 6.9% | |
| Amphenol Corp., Class A | | | 45,120 | | | | 1,577,395 | | |
| Arrow Electronics, Inc. (a) | | | 112,990 | | | | 3,123,044 | | |
| AU Optronics Corp., ADR | | | 127,254 | | | | 1,254,721 | | |
| Corning, Inc. | | | 320,260 | | | | 4,829,521 | | |
| Flextronics International Ltd. (a) | | | 410,840 | | | | 2,436,281 | | |
| Itron, Inc. (a) | | | 43,090 | | | | 2,360,901 | | |
| LG Display Co., Ltd., ADR | | | 195,550 | | | | 2,831,564 | | |
Electronic Equipment, Instruments &
Components Total | | | 18,413,427 | | |
| Internet Software & Services – 11.2% | |
| Akamai Technologies, Inc. (a) | | | 122,540 | | | | 2,161,606 | | |
| Baidu, Inc., ADR (a) | | | 7,140 | | | | 2,356,628 | | |
| eBay, Inc. (a) | | | 222,430 | | | | 4,924,600 | | |
| Equinix, Inc. (a) | | | 16,975 | | | | 1,430,314 | | |
| Google, Inc., Class A (a) | | | 5,850 | | | | 2,700,769 | | |
| NetEase.com, Inc., ADR (a) | | | 55,040 | | | | 2,311,130 | | |
| SAVVIS, Inc. (a) | | | 83,780 | | | | 1,420,909 | | |
| Sohu.com, Inc. (a) | | | 21,730 | | | | 1,327,703 | | |
| VeriSign, Inc. (a) | | | 260,970 | | | | 5,529,954 | | |
| VistaPrint Ltd. (a) | | | 28,750 | | | | 1,191,400 | | |
| Vocus, Inc. (a) | | | 22,173 | | | | 373,837 | | |
| Yahoo!, Inc. (a) | | | 290,510 | | | | 4,244,351 | | |
| Internet Software & Services Total | | | 29,973,201 | | |
| IT Services – 7.0% | |
| Accenture Ltd., Class A | | | 52,570 | | | | 1,734,810 | | |
Affiliated Computer Services, Inc.,
Class A (a) | | | 29,250 | | | | 1,310,400 | | |
Cognizant Technology Solutions
Corp., Class A (a) | | | 116,140 | | | | 4,050,963 | | |
| Fiserv, Inc. (a) | | | 84,220 | | | | 4,063,615 | | |
| Global Cash Access Holdings, Inc. (a) | | | 112,380 | | | | 814,755 | | |
| TNS, Inc. (a) | | | 181,980 | | | | 4,724,201 | | |
| Western Union Co. | | | 109,900 | | | | 1,982,596 | | |
| IT Services Total | | | 18,681,340 | | |
See Accompanying Notes to Financial Statements.
53
Columbia Technology Fund
August 31, 2009
| Common Stocks (continued) | |
| | | Shares | | Value ($) | |
| Semiconductors & Semiconductor Equipment – 21.6% | |
| Altera Corp. | | | 110,450 | | | | 2,121,745 | | |
| Analog Devices, Inc. | | | 233,521 | | | | 6,596,968 | | |
ASML Holding N.V.,
N.Y. Registered Shares | | | 150,380 | | | | 4,130,939 | | |
| Atheros Communications, Inc. (a) | | | 42,940 | | | | 1,186,862 | | |
| Avago Technologies Ltd. (a) | | | 160,745 | | | | 2,925,559 | | |
| Broadcom Corp., Class A (a) | | | 68,050 | | | | 1,936,023 | | |
| FormFactor, Inc. (a) | | | 69,360 | | | | 1,521,758 | | |
| Intel Corp. | | | 204,800 | | | | 4,161,536 | | |
| Linear Technology Corp. | | | 121,130 | | | | 3,218,424 | | |
| Maxim Integrated Products, Inc. | | | 184,930 | | | | 3,472,985 | | |
| MEMC Electronic Materials, Inc. (a) | | | 127,460 | | | | 2,032,987 | | |
| Microchip Technology, Inc. | | | 124,110 | | | | 3,295,120 | | |
| Micron Technology, Inc. (a) | | | 199,100 | | | | 1,467,367 | | |
| Microsemi Corp. (a) | | | 132,108 | | | | 1,864,044 | | |
| Novellus Systems, Inc. (a) | | | 295,180 | | | | 5,655,649 | | |
| NVIDIA Corp. (a) | | | 164,360 | | | | 2,386,507 | | |
| Silicon Laboratories, Inc. (a) | | | 31,730 | | | | 1,429,119 | | |
Siliconware Precision
Industries Co., ADR | | | 286,890 | | | | 1,807,407 | | |
Taiwan Semiconductor
Manufacturing Co., Ltd., ADR | | | 257,770 | | | | 2,758,139 | | |
| Tessera Technologies, Inc. (a) | | | 41,820 | | | | 1,050,937 | | |
| Verigy Ltd. (a) | | | 132,700 | | | | 1,418,563 | | |
| Xilinx, Inc. | | | 64,060 | | | | 1,424,694 | | |
Semiconductors & Semiconductor
Equipment Total | | | 57,863,332 | | |
| Software – 21.0% | |
| Adobe Systems, Inc. (a) | | | 91,420 | | | | 2,872,416 | | |
| Autodesk, Inc. (a) | | | 152,730 | | | | 3,578,464 | | |
| BMC Software, Inc. (a) | | | 63,510 | | | | 2,264,132 | | |
Check Point Software
Technologies Ltd. (a) | | | 105,830 | | | | 2,949,482 | | |
| Citrix Systems, Inc. (a) | | | 71,220 | | | | 2,541,130 | | |
| Concur Technologies, Inc. (a) | | | 32,360 | | | | 1,144,250 | | |
| Electronic Arts, Inc. (a) | | | 161,070 | | | | 2,934,695 | | |
| Intuit, Inc. (a) | | | 91,750 | | | | 2,547,897 | | |
| McAfee, Inc. (a) | | | 60,260 | | | | 2,397,143 | | |
| Microsoft Corp. | | | 326,700 | | | | 8,053,155 | | |
| Nice Systems Ltd., ADR (a) | | | 39,310 | | | | 1,101,466 | | |
| Nuance Communications, Inc. (a) | | | 206,870 | | | | 2,550,707 | | |
| Oracle Corp. | | | 186,040 | | | | 4,068,695 | | |
| Red Hat, Inc. (a) | | | 150,980 | | | | 3,466,501 | | |
| Rosetta Stone, Inc. (a) | | | 44,800 | | | | 987,840 | | |
| Salesforce.com, Inc. (a) | | | 59,050 | | | | 3,062,923 | | |
| Sybase, Inc. (a) | | | 92,260 | | | | 3,215,261 | | |
| Symantec Corp. (a) | | | 143,240 | | | | 2,165,789 | | |
| | | Shares | | Value ($) | |
| TiVo, Inc. (a) | | | 437,790 | | | | 4,294,720 | | |
| Software Total | | | 56,196,666 | | |
| Information Technology Total | | | 237,729,833 | | |
| Telecommunication Services – 3.8% | |
| Diversified Telecommunication Services – 1.0% | |
| Neutral Tandem, Inc. (a) | | | 53,580 | | | | 1,340,036 | | |
| Vimpel-Communications, ADR (a) | | | 90,370 | | | | 1,395,313 | | |
| Diversified Telecommunication Services Total | | | 2,735,349 | | |
| Wireless Telecommunication Services – 2.8% | |
| American Tower Corp., Class A (a) | | | 39,793 | | | | 1,259,448 | | |
| Crown Castle International Corp. (a) | | | 50,030 | | | | 1,343,806 | | |
| Millicom International Cellular SA (a) | | | 18,050 | | | | 1,273,608 | | |
SBA Communications Corp.,
Class A (a) | | | 147,790 | | | | 3,563,217 | | |
| Wireless Telecommunication Services Total | | | 7,440,079 | | |
| Telecommunication Services Total | | | 10,175,428 | | |
Total Common Stocks
(cost of $221,571,349) | | | 267,753,139 | | |
Total Investments – 100.0%
(cost of $221,571,349) (b) | | | 267,753,139 | | |
| Other Assets & Liabilities, Net – 0.0% | | | (128,011 | ) | |
| Net Assets – 100.0% | | | 267,625,128 | | |
Notes to Investment Portfolio:
(a) Non-income producing security.
(b) Cost for federal income tax purposes is $223,396,101.
The following table summarizes the inputs used, as of August 31, 2009 in valuing the Fund's assets:
| Description | | Quoted Prices
(Level 1) | | Other
Significant
Observable
Inputs
(Level 2) | | Significant
Unobservable
Inputs
(Level 3) | | Total | |
| Common Stocks | |
Consumer
Discretionary | | $ | 15,682,093 | | | $ | — | | | $ | — | | | $ | 15,682,093 | | |
| Health Care | | | 3,392,100 | | | | — | | | | — | | | | 3,392,100 | | |
| Industrials | | | 773,685 | | | | — | | | | — | | | | 773,685 | | |
Information
Technology | | | 236,388,255 | | | | 1,341,578 | | | | — | | | | 237,729,833 | | |
Telecommunication
Services | | | 10,175,428 | | | | — | | | | — | | | | 10,175,428 | | |
| Total Common Stocks | | | 266,411,561 | | | | 1,341,578 | | | | — | | | | 267,753,139 | | |
| Total Investments | | $ | 266,411,561 | | | $ | 1,341,578 | | | $ | — | | | $ | 267,753,139 | | |
The Fund's assets assigned to the Level 2 input category include certain foreign securities for which a third party statistical pricing service may be employed for purposes of fair market valuation.
See Accompanying Notes to Financial Statements.
54
Columbia Technology Fund
August 31, 2009
For more information on valuation inputs, and their aggregation into the levels used in the table above, please refer to the Security Valuation section in the accompanying Notes to Financial Statements.
At August 31, 2009, the asset allocation of the Fund is as follows:
| Asset Allocation (Unaudited) | | % of
Net Assets | |
| Information Technology | | | 88.8 | | |
| Consumer Discretionary | | | 5.8 | | |
| Telecommunication Services | | | 3.8 | | |
| Health Care | | | 1.3 | | |
| Industrials | | | 0.3 | | |
| | | | 100.0 | | |
| Other Assets & Liabilities, Net | | | 0.0 | * | |
| | | | 100.0 | | |
* Rounds to less than 0.1%
| Acronym | | Name | |
| ADR | | American Depositary Receipt | |
|
See Accompanying Notes to Financial Statements.
55
Investment Portfolio – Columbia Balanced Fund
August 31, 2009
| Common Stocks – 64.1% | |
| | | Shares | | Value ($) | |
| Consumer Discretionary – 7.7% | |
| Hotels, Restaurants & Leisure – 1.7% | |
| Carnival Corp. (a) | | | 61,666 | | | | 1,803,731 | | |
| Las Vegas Sands Corp. (a) | | | 38,093 | | | | 543,206 | | |
Melco Crown Entertainment,
Ltd., ADR (a) | | | 106,837 | | | | 654,911 | | |
| Penn National Gaming, Inc. (a) | | | 33,568 | | | | 980,521 | | |
| Hotels, Restaurants & Leisure Total | | | 3,982,369 | | |
| Household Durables – 0.9% | |
| Newell Rubbermaid, Inc. | | | 145,397 | | | | 2,023,926 | | |
| Household Durables Total | | | 2,023,926 | | |
| Leisure Equipment & Products – 0.9% | |
| Hasbro, Inc. | | | 72,800 | | | | 2,066,792 | | |
| Leisure Equipment & Products Total | | | 2,066,792 | | |
| Media – 1.0% | |
| McGraw-Hill Companies, Inc. | | | 32,629 | | | | 1,096,661 | | |
| News Corp., Class A | | | 98,600 | | | | 1,056,992 | | |
| Media Total | | | 2,153,653 | | |
| Multiline Retail – 1.5% | |
| Target Corp. | | | 73,699 | | | | 3,463,853 | | |
| Multiline Retail Total | | | 3,463,853 | | |
| Specialty Retail – 1.2% | |
| GameStop Corp., Class A (a) | | | 43,280 | | | | 1,030,064 | | |
| Lowe's Companies, Inc. | | | 82,585 | | | | 1,775,577 | | |
| Specialty Retail Total | | | 2,805,641 | | |
| Textiles, Apparel & Luxury Goods – 0.5% | |
| NIKE, Inc., Class B | | | 21,884 | | | | 1,212,155 | | |
| Textiles, Apparel & Luxury Goods Total | | | 1,212,155 | | |
| Consumer Discretionary Total | | | 17,708,389 | | |
| Consumer Staples – 6.2% | |
| Beverages – 1.4% | |
| PepsiCo, Inc. | | | 58,035 | | | | 3,288,844 | | |
| Beverages Total | | | 3,288,844 | | |
| Food & Staples Retailing – 1.1% | |
| CVS Caremark Corp. | | | 66,636 | | | | 2,500,183 | | |
| Food & Staples Retailing Total | | | 2,500,183 | | |
| Personal Products – 1.7% | |
| Avon Products, Inc. | | | 46,026 | | | | 1,466,849 | | |
| Herbalife Ltd. | | | 49,419 | | | | 1,496,407 | | |
Mead Johnson Nutrition Co.,
Class A | | | 26,396 | | | | 1,046,865 | | |
| Personal Products Total | | | 4,010,121 | | |
| | | Shares | | Value ($) | |
| Tobacco – 2.0% | |
| Philip Morris International, Inc. | | | 98,151 | | | | 4,486,482 | | |
| Tobacco Total | | | 4,486,482 | | |
| Consumer Staples Total | | | 14,285,630 | | |
| Energy – 8.2% | |
| Energy Equipment & Services – 1.4% | |
| Transocean Ltd. (a) | | | 23,711 | | | | 1,798,242 | | |
| Weatherford International Ltd. (a) | | | 68,956 | | | | 1,375,672 | | |
| Energy Equipment & Services Total | | | 3,173,914 | | |
| Oil, Gas & Consumable Fuels – 6.8% | |
| Alpha Natural Resources, Inc. (a) | | | 21,639 | | | | 699,156 | | |
| Apache Corp. | | | 28,906 | | | | 2,455,565 | | |
| Canadian Natural Resources Ltd. | | | 23,300 | | | | 1,333,459 | | |
| Chevron Corp. | | | 53,181 | | | | 3,719,479 | | |
| ConocoPhillips | | | 56,163 | | | | 2,529,020 | | |
| Devon Energy Corp. | | | 26,033 | | | | 1,597,906 | | |
| Petroleo Brasilerio SA, ADR | | | 62,616 | | | | 2,078,851 | | |
| Suncor Energy, Inc. | | | 44,147 | | | | 1,352,664 | | |
| Oil, Gas & Consumable Fuels Total | | | 15,766,100 | | |
| Energy Total | | | 18,940,014 | | |
| Financials – 11.1% | |
| Capital Markets – 3.6% | |
| Bank of New York Mellon Corp. | | | 56,057 | | | | 1,659,848 | | |
| Goldman Sachs Group, Inc. | | | 21,287 | | | | 3,522,147 | | |
| State Street Corp. | | | 59,355 | | | | 3,114,950 | | |
| Capital Markets Total | | | 8,296,945 | | |
| Commercial Banks – 2.2% | |
| PNC Financial Services Group, Inc. | | | 28,670 | | | | 1,221,055 | | |
| Wells Fargo & Co. | | | 139,932 | | | | 3,850,929 | | |
| Commercial Banks Total | | | 5,071,984 | | |
| Diversified Financial Services – 2.0% | |
| JPMorgan Chase & Co. | | | 108,103 | | | | 4,698,156 | | |
| Diversified Financial Services Total | | | 4,698,156 | | |
| Insurance – 2.6% | |
Berkshire Hathaway, Inc.,
Class B (a) | | | 501 | | | | 1,646,286 | | |
| MetLife, Inc. | | | 56,384 | | | | 2,129,060 | | |
| Prudential Financial, Inc. | | | 42,230 | | | | 2,135,993 | | |
| Insurance Total | | | 5,911,339 | | |
See Accompanying Notes to Financial Statements.
56
Columbia Balanced Fund
August 31, 2009
| Common Stocks (continued) | |
| | | Shares | | Value ($) | |
| Real Estate Investment Trusts (REITs) – 0.3% | |
PennyMac Mortgage Investment
Trust (a) | | | 33,529 | | | | 662,198 | | |
| Real Estate Investment Trusts (REITs) Total | | | 662,198 | | |
| Real Estate Management & Development – 0.4% | |
CB Richard Ellis Group, Inc.,
Class A (a) | | | 72,908 | | | | 863,231 | | |
| Real Estate Management & Development Total | | | 863,231 | | |
| Financials Total | | | 25,503,853 | | |
| Health Care – 7.7% | |
| Health Care Equipment & Supplies – 1.1% | |
| Baxter International, Inc. | | | 43,887 | | | | 2,498,048 | | |
| Health Care Equipment & Supplies Total | | | 2,498,048 | | |
| Health Care Providers & Services – 2.4% | |
| Cardinal Health, Inc. | | | 81,665 | | | | 2,823,976 | | |
| Medco Health Solutions, Inc. (a) | | | 24,054 | | | | 1,328,262 | | |
| VCA Antech, Inc. (a) | | | 51,596 | | | | 1,277,001 | | |
| Health Care Providers & Services Total | | | 5,429,239 | | |
| Life Sciences Tools & Services – 0.9% | |
| Thermo Fisher Scientific, Inc. (a) | | | 48,226 | | | | 2,180,297 | | |
| Life Sciences Tools & Services Total | | | 2,180,297 | | |
| Pharmaceuticals – 3.3% | |
| Abbott Laboratories | | | 80,350 | | | | 3,634,231 | | |
| Allergan, Inc. | | | 15,810 | | | | 884,095 | | |
| Merck & Co., Inc. | | | 97,022 | | | | 3,146,423 | | |
| Pharmaceuticals Total | | | 7,664,749 | | |
| Health Care Total | | | 17,772,333 | | |
| Industrials – 5.0% | |
| Aerospace & Defense – 1.8% | |
| Honeywell International, Inc. | | | 55,679 | | | | 2,046,760 | | |
| United Technologies Corp. | | | 34,251 | | | | 2,033,139 | | |
| Aerospace & Defense Total | | | 4,079,899 | | |
| Industrial Conglomerates – 1.7% | |
| General Electric Co. | | | 88,591 | | | | 1,231,415 | | |
| Tyco International Ltd. | | | 86,487 | | | | 2,740,773 | | |
| Industrial Conglomerates Total | | | 3,972,188 | | |
| Machinery – 0.6% | |
| Navistar International Corp. (a) | | | 33,954 | | | | 1,468,171 | | |
| Machinery Total | | | 1,468,171 | | |
| | | Shares | | Value ($) | |
| Road & Rail – 0.9% | |
| Union Pacific Corp. | | | 32,309 | | | | 1,932,401 | | |
| Road & Rail Total | | | 1,932,401 | | |
| Industrials Total | | | 11,452,659 | | |
| Information Technology – 13.7% | |
| Communications Equipment – 1.6% | |
| CommScope, Inc. (a) | | | 39,299 | | | | 1,059,501 | | |
| QUALCOMM, Inc. | | | 56,400 | | | | 2,618,088 | | |
| Communications Equipment Total | | | 3,677,589 | | |
| Computers & Peripherals – 3.6% | |
| Apple, Inc. (a) | | | 20,685 | | | | 3,479,424 | | |
| EMC Corp. (a) | | | 71,833 | | | | 1,142,145 | | |
| Hewlett-Packard Co. | | | 81,096 | | | | 3,640,399 | | |
| Computers & Peripherals Total | | | 8,261,968 | | |
| Internet Software & Services – 1.7% | |
| Google, Inc., Class A (a) | | | 8,637 | | | | 3,987,444 | | |
| Internet Software & Services Total | | | 3,987,444 | | |
| IT Services – 2.5% | |
| SAIC, Inc. (a) | | | 57,755 | | | | 1,067,890 | | |
| Visa, Inc., Class A | | | 24,992 | | | | 1,776,931 | | |
| Western Union Co. | | | 161,056 | | | | 2,905,450 | | |
| IT Services Total | | | 5,750,271 | | |
| Semiconductors & Semiconductor Equipment – 1.0% | |
| Atmel Corp. (a) | | | 108,905 | | | | 449,778 | | |
| Broadcom Corp., Class A (a) | | | 28,762 | | | | 818,279 | | |
| Marvell Technology Group Ltd. (a) | | | 63,040 | | | | 961,360 | | |
Semiconductors & Semiconductor
Equipment Total | | | 2,229,417 | | |
| Software – 3.3% | |
| Autodesk, Inc. (a) | | | 62,474 | | | | 1,463,766 | | |
| Microsoft Corp. | | | 199,772 | | | | 4,924,380 | | |
| Symantec Corp. (a) | | | 86,655 | | | | 1,310,223 | | |
| Software Total | | | 7,698,369 | | |
| Information Technology Total | | | 31,605,058 | | |
| Materials – 2.5% | |
| Chemicals – 1.0% | |
| Agrium, Inc. | | | 23,479 | | | | 1,120,183 | | |
| Potash Corp. of Saskatchewan, Inc. | | | 13,684 | | | | 1,211,171 | | |
| Chemicals Total | | | 2,331,354 | | |
See Accompanying Notes to Financial Statements.
57
Columbia Balanced Fund
August 31, 2009
| Common Stocks (continued) | |
| | | Shares | | Value ($) | |
| Metals & Mining – 1.5% | |
ArcelorMittal, NY Registered
Shares | | | 31,688 | | | | 1,129,044 | | |
| Vale SA, ADR | | | 49,944 | | | | 959,424 | | |
| Walter Energy, Inc. | | | 26,788 | | | | 1,390,565 | | |
| Metals & Mining Total | | | 3,479,033 | | |
| Materials Total | | | 5,810,387 | | |
| Telecommunication Services – 1.3% | |
| Diversified Telecommunication Services – 0.6% | |
| Verizon Communications, Inc. | | | 43,856 | | | | 1,361,290 | | |
| Diversified Telecommunication Services Total | | | 1,361,290 | | |
| Wireless Telecommunication Services – 0.7% | |
Millicom International
Cellular SA (a) | | | 21,858 | | | | 1,542,301 | | |
| Wireless Telecommunication Services Total | | | 1,542,301 | | |
| Telecommunication Services Total | | | 2,903,591 | | |
| Utilities – 0.7% | |
| Independent Power Producers & Energy Traders – 0.7% | |
| AES Corp. (a) | | | 109,807 | | | | 1,501,062 | | |
Independent Power Producers & Energy
Traders Total | | | 1,501,062 | | |
| Utilities Total | | | 1,501,062 | | |
Total Common Stocks
(cost of $126,620,533) | | | 147,482,976 | | |
| Mortgage-Backed Securities – 11.0% | |
| | | Par ($) | | | |
| Federal Home Loan Mortgage Corp. | |
| 5.000% 12/01/35 | | | 757,599 | | | | 780,756 | | |
| 5.000% 07/01/38 | | | 901,113 | | | | 926,494 | | |
| 5.000% 12/01/38 | | | 199,260 | | | | 204,872 | | |
| 5.000% 05/01/39 | | | 560,609 | | | | 576,344 | | |
| 5.500% 12/01/18 | | | 758,264 | | | | 808,049 | | |
| 5.500% 07/01/19 | | | 214,624 | | | | 227,776 | | |
| 5.500% 07/01/21 | | | 177,127 | | | | 186,653 | | |
| 5.500% 08/01/21 | | | 27,270 | | | | 28,737 | | |
| 5.500% 12/01/36 | | | 701,625 | | | | 732,499 | | |
| 5.500% 12/01/37 | | | 564,034 | | | | 588,589 | | |
| 5.500% 07/01/38 | | | 2,275,022 | | | | 2,373,938 | | |
| 6.000% 03/01/17 | | | 49,873 | | | | 53,319 | | |
| 6.000% 04/01/17 | | | 309,392 | | | | 330,768 | | |
| 6.000% 05/01/17 | | | 160,897 | | | | 172,013 | | |
| 6.000% 08/01/17 | | | 106,143 | | | | 113,477 | | |
| | | Par ($) | | Value ($) | |
| 6.000% 08/01/38 | | | 987,559 | | | | 1,041,607 | | |
| 6.500% 08/01/32 | | | 106,389 | | | | 114,258 | | |
| 6.500% 03/01/38 | | | 560,000 | | | | 596,927 | | |
| 6.500% 01/01/39 | | | 1,116,126 | | | | 1,189,723 | | |
TBA,
6.500% 09/01/39 (b) | | | 1,600,000 | | | | 1,702,499 | | |
| Federal National Mortgage Association | |
| 5.000% 05/01/37 | | | 514,376 | | | | 528,813 | | |
| 5.000% 03/01/38 | | | 942,782 | | | | 969,042 | | |
| 5.500% 04/01/36 | | | 445,772 | | | | 465,388 | | |
| 5.500% 05/01/36 | | | 56,224 | | | | 58,698 | | |
| 5.500% 02/01/37 | | | 930,000 | | | | 969,907 | | |
5.618% 07/01/32
(09/01/09) (c)(d) | | | 241,357 | | | | 253,445 | | |
| 6.000% 09/01/36 | | | 338,441 | | | | 357,353 | | |
| 6.000% 10/01/36 | | | 1,123,383 | | | | 1,186,157 | | |
| 6.000% 07/01/37 | | | 148,105 | | | | 156,195 | | |
| 6.000% 08/01/37 | | | 547,773 | | | | 577,698 | | |
| 6.000% 09/01/37 | | | 576,228 | | | | 607,706 | | |
| 6.500% 03/01/37 | | | 291,530 | | | | 312,456 | | |
| 6.500% 08/01/37 | | | 311,174 | | | | 333,364 | | |
TBA:
5.000% 09/01/39 (b) | | | 2,925,000 | | | | 3,001,781 | | |
| 5.500% 09/01/39 (b) | | | 575,000 | | | | 598,539 | | |
| Government National Mortgage Association | |
| 4.500% 02/15/39 | | | 137,441 | | | | 138,868 | | |
| 5.500% 02/15/37 | | | 1,160,000 | | | | 1,214,873 | | |
| 6.000% 12/15/37 | | | 552,412 | | | | 583,496 | | |
| 7.000% 10/15/31 | | | 54,914 | | | | 60,624 | | |
| 7.000% 04/15/32 | | | 44,394 | | | | 48,697 | | |
| 7.000% 05/15/32 | | | 72,169 | | | | 79,165 | | |
Total Mortgage-Backed Securities
(cost of $24,446,792) | | | 25,251,563 | | |
| Corporate Fixed-Income Bonds & Notes – 9.6% | |
| Basic Materials – 0.7% | |
| Chemicals – 0.2% | |
| EI Du Pont de Nemours & Co. | |
| 5.000% 07/15/13 | | | 185,000 | | | | 200,521 | | |
| Huntsman International LLC | |
| 7.875% 11/15/14 | | | 300,000 | | | | 267,000 | | |
| Chemicals Total | | | 467,521 | | |
| Forest Products & Paper – 0.1% | |
| Georgia-Pacific Corp. | |
| 8.000% 01/15/24 | | | 280,000 | | | | 260,400 | | |
| Forest Products & Paper Total | | | 260,400 | | |
See Accompanying Notes to Financial Statements.
58
Columbia Balanced Fund
August 31, 2009
| Corporate Fixed-Income Bonds & Notes (continued) | |
| | | Par ($) | | Value ($) | |
| Iron/Steel – 0.2% | |
| Nucor Corp. | |
| 5.850% 06/01/18 | | | 265,000 | | | | 288,607 | | |
| Iron/Steel Total | | | 288,607 | | |
| Metals & Mining – 0.2% | |
| Freeport-McMoRan Copper & Gold, Inc. | |
| 8.375% 04/01/17 | | | 230,000 | | | | 239,775 | | |
| Vale Overseas Ltd. | |
| 6.250% 01/23/17 | | | 220,000 | | | | 233,163 | | |
| Metals & Mining Total | | | 472,938 | | |
| Basic Materials Total | | | 1,489,466 | | |
| Communications – 1.5% | |
| Media – 0.4% | |
| Comcast Corp. | |
| 7.050% 03/15/33 | | | 225,000 | | | | 252,608 | | |
| EchoStar DBS Corp. | |
| 6.625% 10/01/14 | | | 280,000 | | | | 266,000 | | |
| News America, Inc. | |
| 6.550% 03/15/33 | | | 275,000 | | | | 280,829 | | |
| Viacom, Inc. | |
| 6.125% 10/05/17 | | | 75,000 | | | | 79,271 | | |
| Media Total | | | 878,708 | | |
| Telecommunication Services – 1.1% | |
| AT&T, Inc. | |
| 5.100% 09/15/14 | | | 225,000 | | | | 243,204 | | |
| British Telecommunications PLC | |
| 5.150% 01/15/13 | | | 175,000 | | | | 181,328 | | |
| Cricket Communications, Inc. | |
| 9.375% 11/01/14 | | | 270,000 | | | | 254,475 | | |
| Intelsat Corp. | |
| 9.250% 06/15/16 | | | 260,000 | | | | 263,250 | | |
| Lucent Technologies, Inc. | |
| 6.450% 03/15/29 | | | 545,000 | | | | 370,600 | | |
| New Cingular Wireless Services, Inc. | |
| 8.750% 03/01/31 | | | 200,000 | | | | 265,822 | | |
| Qwest Communications International, Inc. | |
| 7.500% 02/15/14 | | | 260,000 | | | | 250,900 | | |
| Telefonica Emisiones SAU | |
| 5.984% 06/20/11 | | | 300,000 | | | | 319,446 | | |
| Verizon Wireless Capital LLC | |
| 5.550% 02/01/14 (e) | | | 240,000 | | | | 259,533 | | |
| Vodafone Group PLC | |
| 5.750% 03/15/16 | | | 210,000 | | | | 223,479 | | |
| Telecommunication Services Total | | | 2,632,037 | | |
| Communications Total | | | 3,510,745 | | |
| | | Par ($) | | Value ($) | |
| Consumer Cyclical – 0.5% | |
| Apparel – 0.1% | |
| Levi Strauss & Co. | |
| 9.750% 01/15/15 | | | 260,000 | | | | 265,850 | | |
| Apparel Total | | | 265,850 | | |
| Lodging – 0.1% | |
| Host Hotels & Resorts LP | |
| 6.750% 06/01/16 | | | 280,000 | | | | 260,400 | | |
| Lodging Total | | | 260,400 | | |
| Retail – 0.3% | |
| CVS Caremark Corp. | |
| 5.750% 06/01/17 | | | 200,000 | | | | 215,330 | | |
| Wal-Mart Stores, Inc. | |
| 5.800% 02/15/18 | | | 300,000 | | | | 335,147 | | |
| Retail Total | | | 550,477 | | |
| Consumer Cyclical Total | | | 1,076,727 | | |
| Consumer Non-Cyclical – 0.9% | |
| Beverages – 0.2% | |
| Bottling Group LLC | |
| 6.950% 03/15/14 | | | 225,000 | | | | 263,550 | | |
| Miller Brewing Co. | |
| 5.500% 08/15/13 (e) | | | 190,000 | | | | 199,710 | | |
| Beverages Total | | | 463,260 | | |
| Food – 0.2% | |
| Campbell Soup Co. | |
| 4.500% 02/15/19 | | | 90,000 | | | | 91,244 | | |
| ConAgra Foods, Inc. | |
| 6.750% 09/15/11 | | | 17,000 | | | | 18,485 | | |
| JBS USA LLC/JBS USA Finance, Inc. | |
| 11.625% 05/01/14 (e) | | | 255,000 | | | | 267,750 | | |
| Kroger Co. | |
| 6.200% 06/15/12 | | | 200,000 | | | | 217,185 | | |
| Food Total | | | 594,664 | | |
| Healthcare Services – 0.2% | |
| HCA, Inc. | |
| 9.250% 11/15/16 | | | 25,000 | | | | 25,312 | | |
PIK,
9.625% 11/15/16 | | | 78,000 | | | | 78,780 | | |
| Roche Holdings, Inc. | |
| 6.000% 03/01/19 (e) | | | 250,000 | | | | 276,680 | | |
| Healthcare Services Total | | | 380,772 | | |
| Pharmaceuticals – 0.3% | |
| Express Scripts, Inc. | |
| 5.250% 06/15/12 | | | 155,000 | | | | 164,417 | | |
See Accompanying Notes to Financial Statements.
59
Columbia Balanced Fund
August 31, 2009
| Corporate Fixed-Income Bonds & Notes (continued) | |
| | | Par ($) | | Value ($) | |
| Omnicare, Inc. | |
| 6.875% 12/15/15 | | | 280,000 | | | | 261,800 | | |
| Wyeth | |
| 5.500% 02/01/14 | | | 220,000 | | | | 240,561 | | |
| Pharmaceuticals Total | | | 666,778 | | |
| Consumer Non-Cyclical Total | | | 2,105,474 | | |
| Energy – 1.2% | |
| Oil & Gas – 0.6% | |
| Canadian Natural Resources Ltd. | |
| 5.700% 05/15/17 | | | 200,000 | | | | 209,478 | | |
| Chesapeake Energy Corp. | |
| 6.375% 06/15/15 | | | 285,000 | | | | 259,706 | | |
| Chevron Corp. | |
| 4.950% 03/03/19 | | | 200,000 | | | | 212,456 | | |
| KCS Energy, Inc. | |
| 7.125% 04/01/12 | | | 255,000 | | | | 251,175 | | |
| Nexen, Inc. | |
| 5.875% 03/10/35 | | | 225,000 | | | | 197,880 | | |
| Talisman Energy, Inc. | |
| 6.250% 02/01/38 | | | 235,000 | | | | 230,878 | | |
| Oil & Gas Total | | | 1,361,573 | | |
| Oil & Gas Services – 0.2% | |
| Halliburton Co. | |
| 5.900% 09/15/18 | | | 175,000 | | | | 190,982 | | |
| Weatherford International Ltd. | |
| 5.150% 03/15/13 | | | 225,000 | | | | 234,459 | | |
| Oil & Gas Services Total | | | 425,441 | | |
| Pipelines – 0.4% | |
| El Paso Corp. | |
| 6.875% 06/15/14 | | | 115,000 | | | | 112,182 | | |
| Enterprise Products Operating LLC | |
| 4.600% 08/01/12 | | | 200,000 | | | | 207,528 | | |
| MarkWest Energy Partners LP | |
| 8.500% 07/15/16 | | | 280,000 | | | | 264,600 | | |
| Plains All American Pipeline LP | |
| 6.650% 01/15/37 | | | 225,000 | | | | 234,285 | | |
| TransCanada Pipelines Ltd. | |
| 6.350% 05/15/67 (c) | | | 245,000 | | | | 205,800 | | |
| Pipelines Total | | | 1,024,395 | | |
| Energy Total | | | 2,811,409 | | |
| Financials – 2.9% | |
| Banks – 1.8% | |
| ANZ National International Ltd. | |
| 6.200% 07/19/13 (e) | | | 200,000 | | | | 214,980 | | |
| | | Par ($) | | Value ($) | |
| Bank of New York Mellon Corp. | |
| 5.125% 08/27/13 | | | 300,000 | | | | 322,795 | | |
| Barclays Bank PLC | |
| 6.750% 05/22/19 | | | 275,000 | | | | 301,319 | | |
| Capital One Financial Corp. | |
| 5.500% 06/01/15 | | | 325,000 | | | | 318,172 | | |
| Citigroup, Inc. | |
| 5.000% 09/15/14 | | | 225,000 | | | | 206,147 | | |
| 5.250% 02/27/12 | | | 150,000 | | | | 151,924 | | |
| Credit Suisse/New York NY | |
| 6.000% 02/15/18 | | | 275,000 | | | | 282,833 | | |
| Deutsche Bank AG/London | |
| 4.875% 05/20/13 | | | 250,000 | | | | 264,154 | | |
| Goldman Sachs Group, Inc. | |
| 6.345% 02/15/34 | | | 220,000 | | | | 193,931 | | |
| JPMorgan Chase & Co. | |
| 6.000% 01/15/18 | | | 405,000 | | | | 435,251 | | |
| Keycorp | |
| 6.500% 05/14/13 | | | 185,000 | | | | 188,407 | | |
| Merrill Lynch & Co., Inc. | |
| 6.050% 08/15/12 (f) | | | 250,000 | | | | 260,505 | | |
| Morgan Stanley | |
| 4.750% 04/01/14 | | | 160,000 | | | | 158,843 | | |
| Northern Trust Corp. | |
| 4.625% 05/01/14 | | | 300,000 | | | | 318,543 | | |
| U.S. Bank N.A. | |
| 6.300% 02/04/14 | | | 275,000 | | | | 304,603 | | |
| Wachovia Corp. | |
| 4.875% 02/15/14 | | | 300,000 | | | | 306,384 | | |
| Banks Total | | | 4,228,791 | | |
| Diversified Financial Services – 0.5% | |
| AGFC Capital Trust I | |
| 6.000% 01/15/67 (c)(e) | | | 280,000 | | | | 93,800 | | |
| Ameriprise Financial, Inc. | |
| 7.300% 06/28/19 | | | 180,000 | | | | 198,504 | | |
| CDX North America High Yield | |
| 8.875% 06/29/13 (e) | | | 261,000 | | | | 241,099 | | |
| General Electric Capital Corp. | |
| 5.000% 01/08/16 | | | 420,000 | | | | 419,348 | | |
| Lehman Brothers Holdings, Inc. | |
| 5.750% 07/18/11 (g)(h) | | | 275,000 | | | | 50,531 | | |
| Diversified Financial Services Total | | | 1,003,282 | | |
| Insurance – 0.4% | |
| Chubb Corp. | |
| 5.750% 05/15/18 | | | 90,000 | | | | 97,659 | | |
| Lincoln National Corp. | |
| 8.750% 07/01/19 | | | 175,000 | | | | 195,694 | | |
| MetLife, Inc. | |
| 6.817% 08/15/18 | | | 185,000 | | | | 204,385 | | |
See Accompanying Notes to Financial Statements.
60
Columbia Balanced Fund
August 31, 2009
| Corporate Fixed-Income Bonds & Notes (continued) | |
| | | Par ($) | | Value ($) | |
| Principal Life Income Funding Trusts | |
| 5.300% 04/24/13 | | | 240,000 | | | | 244,743 | | |
| UnitedHealth Group, Inc. | |
| 5.250% 03/15/11 | | | 225,000 | | | | 232,822 | | |
| Insurance Total | | | 975,303 | | |
| Real Estate Investment Trusts (REITs) – 0.2% | |
| Duke Realty LP | |
| 7.375% 02/15/15 | | | 175,000 | | | | 179,420 | | |
| Health Care Property Investors, Inc. | |
| 6.450% 06/25/12 | | | 200,000 | | | | 205,507 | | |
| Simon Property Group LP | |
| 5.750% 12/01/15 | | | 150,000 | | | | 155,366 | | |
| Real Estate Investment Trusts (REITs) Total | | | 540,293 | | |
| Financials Total | | | 6,747,669 | | |
| Industrials – 0.5% | |
| Aerospace & Defense – 0.2% | |
| BE Aerospace, Inc. | |
| 8.500% 07/01/18 | | | 250,000 | | | | 246,250 | | |
| United Technologies Corp. | |
| 5.375% 12/15/17 | | | 165,000 | | | | 179,674 | | |
| Aerospace & Defense Total | | | 425,924 | | |
| Miscellaneous Manufacturing – 0.1% | |
| Bombardier, Inc. | |
| 6.300% 05/01/14 (e) | | | 270,000 | | | | 249,750 | | |
| Miscellaneous Manufacturing Total | | | 249,750 | | |
| Transportation – 0.2% | |
| Burlington Northern Santa Fe Corp. | |
| 6.200% 08/15/36 | | | 185,000 | | | | 204,475 | | |
| Norfolk Southern Corp. | |
| 5.750% 04/01/18 | | | 175,000 | | | | 187,151 | | |
| United Parcel Service, Inc. | |
| 4.500% 01/15/13 | | | 145,000 | | | | 155,626 | | |
| Transportation Total | | | 547,252 | | |
| Industrials Total | | | 1,222,926 | | |
| Technology – 0.3% | |
| Networking Products – 0.2% | |
| Cisco Systems, Inc. | |
| 4.950% 02/15/19 | | | 325,000 | | | | 339,202 | | |
| Networking Products Total | | | 339,202 | | |
| | | Par ($) | | Value ($) | |
| Software – 0.1% | |
| Oracle Corp. | |
| 6.500% 04/15/38 | | | 225,000 | | | | 260,476 | | |
| Software Total | | | 260,476 | | |
| Technology Total | | | 599,678 | | |
| Utilities – 1.1% | |
| Electric – 0.9% | |
| Commonwealth Edison Co. | |
| 5.950% 08/15/16 | | | 200,000 | | | | 215,888 | | |
| Consolidated Edison Co. of New York, Inc. | |
| 5.850% 04/01/18 | | | 225,000 | | | | 243,894 | | |
| Dominion Resources Inc/VA | |
| 5.200% 08/15/19 | | | 210,000 | | | | 216,561 | | |
| Indiana Michigan Power Co. | |
| 5.650% 12/01/15 | | | 275,000 | | | | 283,868 | | |
| Pacific Gas & Electric Co. | |
| 5.800% 03/01/37 | | | 225,000 | | | | 238,349 | | |
| Progress Energy, Inc. | |
| 7.750% 03/01/31 | | | 250,000 | | | | 306,486 | | |
| Southern California Edison Co. | |
| 5.000% 01/15/14 | | | 200,000 | | | | 213,798 | | |
| Texas Competitive Electric Holdings Co. LLC | |
PIK,
10.500% 11/01/16 | | | 418,468 | | | | 230,158 | | |
| Electric Total | | | 1,949,002 | | |
| Gas – 0.2% | |
| Atmos Energy Corp. | |
| 6.350% 06/15/17 | | | 210,000 | | | | 225,958 | | |
| Sempra Energy | |
| 6.500% 06/01/16 | | | 180,000 | | | | 197,970 | | |
| Gas Total | | | 423,928 | | |
| Utilities Total | | | 2,372,930 | | |
Total Corporate Fixed-Income Bonds & Notes
(cost of $20,934,465) | | | 21,937,024 | | |
| Government & Agency Obligations – 5.3% | |
| Foreign Government Obligations – 0.5% | |
| Province of Ontario | |
| 5.450% 04/27/16 | | | 450,000 | | | | 497,561 | | |
| Province of Quebec | |
| 4.625% 05/14/18 | | | 475,000 | | | | 489,519 | | |
| United Mexican States | |
| 7.500% 04/08/33 | | | 250,000 | | | | 281,563 | | |
| Foreign Government Obligations Total | | | 1,268,643 | | |
See Accompanying Notes to Financial Statements.
61
Columbia Balanced Fund
August 31, 2009
| Government & Agency Obligations (continued) | |
| | | Par ($) | | Value ($) | |
| U.S. Government Agencies – 1.3% | |
| Federal Home Loan Bank | |
| 5.500% 08/13/14 | | | 800,000 | | | | 902,356 | | |
| Federal Home Loan Mortgage Corp. | |
| 3.125% 10/25/10 (i) | | | 65,000 | | | | 66,887 | | |
| 3.750% 03/27/19 | | | 600,000 | | | | 596,319 | | |
| 6.625% 09/15/09 | | | 1,310,000 | | | | 1,313,207 | | |
| U.S. Government Agencies Total | | | 2,878,769 | | |
| U.S. Government Obligations – 3.5% | |
| U.S. Treasury Bonds | |
| 5.375% 02/15/31 | | | 3,857,000 | | | | 4,512,088 | | |
| U.S. Treasury Inflation Indexed Bond | |
| 3.500% 01/15/11 | | | 1,115,055 | | | | 1,157,566 | | |
| U.S. Treasury Notes | |
| 1.875% 04/30/14 | | | 1,100,000 | | | | 1,080,836 | | |
| 2.250% 05/31/14 | | | 1,200,000 | | | | 1,197,094 | | |
| U.S. Government Obligations Total | | | 7,947,584 | | |
Total Government & Agency Obligations
(cost of $11,748,618) | | | 12,094,996 | | |
| Commercial Mortgage-Backed Securities – 3.7% | |
| Bear Stearns Commercial Mortgage Securities | |
5.623% 03/11/39
(09/01/09) (c)(d) | | | 760,000 | | | | 543,393 | | |
5.742% 09/11/42
(09/01/09) (c)(d) | | | 750,000 | | | | 694,698 | | |
| CS First Boston Mortgage Securities Corp. | |
| 4.577% 04/15/37 | | | 975,000 | | | | 980,752 | | |
| GE Capital Commercial Mortgage Corp. | |
| 4.819% 01/10/38 | | | 550,000 | | | | 563,533 | | |
| Greenwich Capital Commercial Funding Corp. | |
| 5.117% 04/10/37 | | | 770,000 | | | | 769,304 | | |
| JPMorgan Chase Commercial Mortgage Securities Corp. | |
| 4.780% 07/15/42 | | | 1,350,000 | | | | 1,087,545 | | |
| 5.440% 06/12/47 | | | 820,000 | | | | 676,039 | | |
| 5.447% 06/12/47 | | | 791,000 | | | | 699,984 | | |
5.525% 04/15/43
(09/01/09) (c)(d) | | | 1,122,000 | | | | 802,080 | | |
| 5.857% 10/12/35 | | | 1,500,000 | | | | 1,574,934 | | |
Total Commercial Mortgage-Backed Securities
(cost of $9,097,707) | | | 8,392,262 | | |
| Collateralized Mortgage Obligations – 2.3% | |
| | | Par ($) | | Value ($) | |
| Agency – 1.1% | |
| Federal Home Loan Mortgage Corp. | |
| 4.000% 10/15/18 | | | 1,900,000 | | | | 1,935,807 | | |
| 4.500% 08/15/28 | | | 720,000 | | | | 748,960 | | |
| Agency Total | | | 2,684,767 | | |
| Non-Agency – 1.2% | |
| Bear Stearns Adjustable Rate Mortgage Trust | |
5.411% 02/25/47
(09/01/09) (c)(d) | | | 1,053,856 | | | | 637,378 | | |
| Lehman Mortgage Trust | |
| 6.500% 01/25/38 | | | 562,891 | | | | 404,930 | | |
| SACO I, Inc. | |
(j) 09/25/24
(09/01/09) (c)(d)(h) | | | 6,364 | | | | 2,100 | | |
| Structured Asset Securities Corp. | |
| 5.500% 05/25/33 | | | 449,611 | | | | 359,733 | | |
| 5.500% 07/25/33 | | | 539,555 | | | | 536,415 | | |
| WaMu Mortgage Pass-Through Certificates | |
5.678% 02/25/37
(09/01/09) (c)(d) | | | 1,143,263 | | | | 761,230 | | |
| Non-Agency Total | | | 2,701,786 | | |
Total Collateralized Mortgage Obligations
(cost of $6,296,634) | | | 5,386,553 | | |
| Asset-Backed Securities – 1.2% | |
| Cityscape Home Equity Loan Trust | |
| 7.410% 05/25/28 | | | 141,715 | | | | 141,150 | | |
| First Alliance Mortgage Loan Trust | |
| 7.340% 06/20/27 | | | 50,869 | | | | 35,684 | | |
| Ford Credit Auto Owner Trust | |
| 5.470% 06/15/12 | | | 611,000 | | | | 642,570 | | |
| Franklin Auto Trust | |
| 5.360% 05/20/16 | | | 761,000 | | | | 760,173 | | |
| IMC Home Equity Loan Trust | |
| 7.310% 11/20/28 | | | 698,501 | | | | 653,336 | | |
| 7.520% 08/20/28 | | | 584,692 | | | | 527,496 | | |
Total Asset-Backed Securities
(cost of $2,852,591) | | | 2,760,409 | | |
See Accompanying Notes to Financial Statements.
62
Columbia Balanced Fund
August 31, 2009
| Short-Term Obligation – 4.9% | |
| | | Par ($) | | Value ($) | |
Repurchase agreement with
Fixed Income Clearing Corp.,
dated 08/31/09, due 09/01/09
at 0.140%, collateralized by a
U.S. Government Agency
obligation maturing 11/16/12,
market value $11,569,537
(repurchase proceeds
$11,340,044) | | | 11,340,000 | | | | 11,340,000 | | |
Total Short-Term Obligation
(cost of $11,340,000) | | | 11,340,000 | | |
Total Investments – 102.1%
(cost of $213,337,340) (k) | | | 234,645,783 | | |
| Other Assets & Liabilities, Net – (2.1)% | | | (4,726,498 | ) | |
| Net Assets – 100.0% | | | 229,919,285 | | |
Notes to Investment Portfolio:
(a) Non-income producing security.
(b) Security purchased on a delayed delivery basis.
(c) The interest rate shown on floating rate or variable rate securities reflects the rate at August 31, 2009.
(d) Parenthetical date represents the next reset date for the security.
(e) Security exempt from registration pursuant to Rule 144A under the Securities Act of 1933. These securities may be resold in transactions exempt from registration, normally to qualified institutional buyers. At August 31, 2009, these securities, which are not illiquid, amounted to $1,803,302, which represents 0.8% of net assets.
(f) Investments in affiliates during the year ended August 31, 2009:
| Security name: Merrill Lynch & Co., Inc. 6.050% 08/15/12 | |
| Par as of 08/31/08: | | $ | 250,000 | | |
| Par purchased: | | $ | – | | |
| Par sold: | | $ | – | | |
| Par as of 08/31/09: | | $ | 250,000 | | |
| Net realized gain (loss): | | $ | – | | |
| Interest income earned: | | $ | 15,125 | | |
| Value at end of period: | | $ | 260,505 | | |
(g) The issuer has filed for bankruptcy protection under Chapter 11, and is in default of certain debt covenants. Income is not being accrued. At August 31, 2009, the value of these securities amounted to $50,531, which represents less than 0.1% of net assets.
(h) Represents fair value as determined in good faith under procedures approved by the Board of Trustees. The value of these securities amounted to $52,631, which represents less than 0.1% of net assets.
(i) All of this security with a market value of $66,887 is pledged as collateral for open futures contracts.
(j) Zero coupon bond.
(k) Cost for federal income tax purposes is $214,981,571.
The following table summarizes the inputs used, as of August 31, 2009 in valuing the Fund's assets:
| Description | | Quoted Prices
(Level 1) | | Other
Significant
Observable
Inputs
(Level 2) | | Significant
Unobservable
Inputs
(Level 3) | | Total | |
| Common Stocks | |
Consumer
Discretionary | | $ | 17,708,389 | | | $ | — | | | $ | — | | | $ | 17,708,389 | | |
| Consumer Staples | | | 14,285,630 | | | | — | | | | — | | | | 14,285,630 | | |
| Energy | | | 18,940,014 | | | | — | | | | — | | | | 18,940,014 | | |
| Financials | | | 25,503,853 | | | | — | | | | — | | | | 25,503,853 | | |
| Health Care | | | 17,772,333 | | | | — | | | | — | | | | 17,772,333 | | |
| Industrials | | | 11,452,659 | | | | — | | | | — | | | | 11,452,659 | | |
Information
Technology | | | 31,605,058 | | | | — | | | | — | | | | 31,605,058 | | |
| Materials | | | 5,810,387 | | | | — | | | | — | | | | 5,810,387 | | |
Telecommunication
Services | | | 2,903,591 | | | | — | | | | — | | | | 2,903,591 | | |
| Utilities Total | | | 1,501,062 | | | | — | | | | — | | | | 1,501,062 | | |
| Total Common Stocks | | | 147,482,976 | | | | — | | | | — | | | | 147,482,976 | | |
Total Mortgage-Backed
Securities | | | 5,302,819 | | | | 19,948,744 | | | | — | | | | 25,251,563 | | |
Corporate Fixed-Income
Bonds & Notes | |
| Basic Materials | | | — | | | | 1,489,466 | | | | — | | | | 1,489,466 | | |
| Communication | | | — | | | | 3,510,745 | | | | — | | | | 3,510,745 | | |
Consumer
Cyclical | | | — | | | | 1,076,727 | | | | — | | | | 1,076,727 | | |
Consumer
Non-Cyclical | | | — | | | | 2,105,474 | | | | — | | | | 2,105,474 | | |
| Energy | | | — | | | | 2,811,409 | | | | — | | | | 2,811,409 | | |
| Financials | | | — | | | | 6,747,669 | | | | — | | | | 6,747,669 | | |
| Industrials | | | — | | | | 1,222,926 | | | | — | | | | 1,222,926 | | |
| Technology | | | — | | | | 599,678 | | | | — | | | | 599,678 | | |
| Utilities | | | — | | | | 2,372,930 | | | | — | | | | 2,372,930 | | |
Total Corporate
Fixed-Income
Bonds & Notes | | | — | | | | 21,937,024 | | | | — | | | | 21,937,024 | | |
Total Government &
Agency Obligations | | | 7,947,584 | | | | 4,147,412 | | | | — | | | | 12,094,996 | | |
Total Commercial
Mortgage-Backed
Securities | | | — | | | | 8,392,262 | | | | — | | | | 8,392,262 | | |
Total Collateralized
Mortgage Obligations | | | — | | | | 5,384,453 | | | | 2,100 | | | | 5,386,553 | | |
Total Asset-Backed
Securities | | | — | | | | 2,760,409 | | | | — | | | | 2,760,409 | | |
Total Short-Term
Obligation | | | — | | | | 11,340,000 | | | | — | | | | 11,340,000 | | |
| Total Investments | | | 160,733,379 | | | | 73,910,304 | | | | 2,100 | | | | 234,645,783 | | |
Total Unrealized
appreciation
(depreciation) on
open long futures
contracts | | | 8,680 | | | | — | | | | — | | | | 8,680 | | |
| Total | | $ | 160,742,059 | | | $ | 73,910,304 | | | $ | 2,100 | | | $ | 234,654,463 | | |
See Accompanying Notes to Financial Statements.
63
Columbia Balanced Fund
August 31, 2009
The following table reconciles asset balances for the twelve month period ending August 31, 2009, in which significant unobservable inputs (Level 3) were used in determining value:
Investments
in Securities | | Balance as of
August 31,
2008 | | Accrued
Discounts
(Premiums) | | Realized
Gain (Loss) | | Change in
Unrealized
Appreciation
(Depreciation) | | Net
Purchases | | Net
Sales | | Net Transfers
into Level 3 | | Net Transfers
out of Level 3 | | Balance as of
August 31,
2009 | |
Collateralized
Mortgage
Obligations | |
| Non-Agency | | $ | 8,880 | | | $ | 13 | | | $ | 135 | | | $ | (4,367 | ) | | $ | — | | | $ | (2,561 | ) | | $ | — | | | $ | — | | | $ | 2,100 | | |
| | | $ | 8,880 | | | $ | 13 | | | $ | 135 | | | $ | (4,367 | ) | | $ | — | | | $ | (2,561 | ) | | $ | — | | | $ | — | | | $ | 2,100 | | |
The information in the above reconciliation represents fiscal year to date activity for any securities identified as using Level 3 inputs at either the beginning or the end of the current fiscal period.
The change in unrealized depreciation attributable to securities owned at August 31, 2009 which were valued using significant unobservable inputs (Level 3) amounted to $4,367. This amount is included in net change in unrealized depreciation on the Statements of Changes in Net Assets.
For more information on valuation inputs, and their aggregation into the levels used in the tables above, please refer to the Security Valuation section in the accompanying Notes to Financial Statements
At August 31, 2009, the asset allocation of the Fund is as follows:
| Asset Allocation (Unaudited) | | % of
Net Assets | |
| Common Stocks | | | 64.1 | | |
| Mortgage-Backed Securities | | | 11.0 | | |
| Corporate Fixed-Income Bonds & Notes | | | 9.6 | | |
| Government & Agency Obligations | | | 5.3 | | |
| Commercial Mortgage-Backed Securities | | | 3.7 | | |
| Collateralized Mortgage Obligations | | | 2.3 | | |
| Asset-Backed Securities | | | 1.2 | | |
| | | | 97.2 | | |
| Short-Term Obligation | | | 4.9 | | |
| Other Assets & Liabilities, Net | | | (2.1 | ) | |
| | | | 100.0 | | |
At August 31, 2009, the Fund held the following open long futures contracts:
Risk
Exposure/
Type | | Number of
Contracts | | Value | | Aggregate
Face Value | | Expiration
Date | | Unrealized
Appreciation | |
| Interest Rate Risk | |
10-Year
U.S.
Treasury
Notes | | | 12 | | | $ | 1,406,625 | | | $ | 1,397,945 | | | Dec-09 | | $ | 8,680 | | |
| Acronym | | Name | |
| ADR | | American Depositary Receipt | |
|
| PIK | | Payment-In-Kind | |
|
| TBA | | To Be Announced | |
|
See Accompanying Notes to Financial Statements.
64
Investment Portfolio – Columbia Oregon Intermediate Municipal Bond Fund
August 31, 2009
| Municipal Bonds – 94.6% | |
| | | Par ($) | | Value ($) | |
| Education – 5.4% | |
| Education – 5.4% | |
| OR Economic Development Revenue | |
| Broadway Housing LLC, | |
Series 2008 A,
6.250% 04/01/23 | | | 3,250,000 | | | | 3,660,475 | | |
| OR Facilities Authority | |
| Linfield College, | |
Series 2005 A,
5.000% 10/01/20 | | | 1,825,000 | | | | 1,833,468 | | |
| OR Forest Grove Student Housing | |
| Oak Tree Foundation, | |
Series 2007,
5.500% 03/01/37 | | | 3,000,000 | | | | 2,247,480 | | |
| OR Forest Grove | |
| Pacific University, | |
Series 2009,
6.000% 05/01/30 | | | 1,500,000 | | | | 1,504,080 | | |
| OR Health Sciences University | |
| Series 1996 A, | |
Insured: NPFGC:
(a) 07/01/12 | | | 1,315,000 | | | | 1,186,906 | | |
| (a) 07/01/14 | | | 2,550,000 | | | | 2,077,995 | | |
| (a) 07/01/15 | | | 4,325,000 | | | | 3,331,418 | | |
| (a) 07/01/21 | | | 12,515,000 | | | | 6,443,097 | | |
OR Health, Housing, Educational &
Cultural Facilities Authority | |
| Linfield College, | |
Series 1998 A:
4.650% 10/01/09 | | | 555,000 | | | | 555,572 | | |
| 5.500% 10/01/18 | | | 1,000,000 | | | | 1,000,880 | | |
| Reed College, | |
Series 1995 A,
Insured: NPFGC
5.100% 07/01/10 | | | 240,000 | | | | 246,597 | | |
| Education Total | | | 24,087,968 | | |
| Education Total | | | 24,087,968 | | |
| Health Care – 8.2% | |
| Continuing Care Retirement – 0.5% | |
| OR Albany Hospital Facility Authority | |
| Mennonite Home Albany, | |
Series 2004 PJ-A:
4.750% 10/01/11 | | | 660,000 | | | | 635,422 | | |
| 5.000% 10/01/12 | | | 680,000 | | | | 647,475 | | |
| | | Par ($) | | Value ($) | |
OR Multnomah County Hospital
Facilities Authority | |
| Terwilliger Plaza, Inc., | |
Series 2006 A,
5.250% 12/01/26 | | | 1,400,000 | | | | 1,181,460 | | |
| Continuing Care Retirement Total | | | 2,464,357 | | |
| Hospitals – 7.7% | |
OR Benton County Hospital
Facilities Authority | |
| Samaritan Health Services, | |
Series 1998:
4.800% 10/01/11 | | | 245,000 | | | | 247,771 | | |
| 5.200% 10/01/17 | | | 2,255,000 | | | | 2,269,996 | | |
OR Clackamas County Hospital
Facility Authority | |
| Legacy Health System, IBC, | |
Series 1999,
Insured: NPFGC
5.500% 02/15/13 | | | 495,000 | | | | 500,257 | | |
| Legacy Health System: | |
Series 1999:
5.000% 02/15/16 | | | 1,010,000 | | | | 1,021,342 | | |
| 5.500% 02/15/13 | | | 5,450,000 | | | | 5,507,879 | | |
| 5.500% 02/15/14 | | | 2,385,000 | | | | 2,410,019 | | |
Series 2001:
4.600% 05/01/10 | | | 885,000 | | | | 904,718 | | |
| 5.250% 05/01/21 | | | 4,890,000 | | | | 5,011,370 | | |
| 5.750% 05/01/12 | | | 2,000,000 | | | | 2,138,300 | | |
| 5.750% 05/01/16 | | | 1,500,000 | | | | 1,570,755 | | |
OR Deschutes County Hospital
Facilities Authority | |
| Cascade Healthcare Community, | |
Series 2008,
7.375% 01/01/23 | | | 2,000,000 | | | | 2,267,560 | | |
| OR Medford Hospital Facilities Authority | |
| Asante Health System, | |
Series 1998 A,
Insured: NPFGC:
5.250% 08/15/10 | | | 485,000 | | | | 485,975 | | |
| 5.250% 08/15/11 | | | 260,000 | | | | 260,458 | | |
OR Multnomah County Hospital
Facilities Authority | |
| Providence Health System, | |
Series 2004,
5.250% 10/01/16 | | | 2,970,000 | | | | 3,225,865 | | |
See Accompanying Notes to Financial Statements.
65
Columbia Oregon Intermediate Municipal Bond Fund
August 31, 2009
| Municipal Bonds (continued) | |
| | | Par ($) | | Value ($) | |
| OR Salem Hospital Facility Authority | |
| Series 2006 A, | |
| 5.000% 08/15/27 | | | 3,500,000 | | | | 3,375,330 | | |
| Series 2008 A, | |
| 5.250% 08/15/18 | | | 2,500,000 | | | | 2,650,125 | | |
OR Umatilla County Hospital
Facility Authority | |
| Catholic Health Initiatives, | |
Series 2000 A,
5.750% 12/01/20 | | | 285,000 | | | | 290,289 | | |
| Hospitals Total | | | 34,138,009 | | |
| Health Care Total | | | 36,602,366 | | |
| Housing – 4.0% | |
| Assisted Living/Senior – 0.4% | |
OR Clackamas County Hospital
Facility Authority | |
| Robison Jewish Home, | |
Series 2005:
5.000% 10/01/19 | | | 1,000,000 | | | | 822,850 | | |
| 5.125% 10/01/24 | | | 1,000,000 | | | | 771,820 | | |
| Assisted Living/Senior Total | | | 1,594,670 | | |
| Multi-Family – 1.3% | |
OR Clackamas County Housing
Authority | |
| Multi-Family Housing, | |
Easton Ridge,
Series 1996 A:
5.800% 12/01/16 | | | 1,905,000 | | | | 1,767,307 | | |
| 5.900% 12/01/26 | | | 1,750,000 | | | | 1,443,102 | | |
PR Commonwealth of Puerto Rico
Housing Finance Authority | |
| Series 2008, | |
| 5.000% 12/01/13 | | | 2,455,000 | | | | 2,652,996 | | |
| Multi-Family Total | | | 5,863,405 | | |
| Single-Family – 2.3% | |
| OR Housing & Community Services | |
| Department Mortgage Single Family Program: | |
Series 1991 D,
6.700% 07/01/13 | | | 95,000 | | | | 95,257 | | |
Series 1998 A,
4.850% 07/01/10 | | | 95,000 | | | | 95,730 | | |
Series 1999 E,
5.375% 07/01/21 | | | 1,480,000 | | | | 1,495,570 | | |
Series 1999 M, AMT,
5.800% 07/01/12 | | | 85,000 | | | | 85,115 | | |
| | | Par ($) | | Value ($) | |
Series 2000 E,
Insured: FHA:
5.700% 07/01/12 | | | 270,000 | | | | 276,080 | | |
| 5.800% 07/01/14 | | | 240,000 | | | | 245,582 | | |
| 6.000% 07/01/20 | | | 670,000 | | | | 673,209 | | |
Series 2001 J,
5.150% 07/01/24 | | | 1,095,000 | | | | 1,101,088 | | |
Series 2001 Q:
4.700% 07/01/15 | | | 455,000 | | | | 465,652 | | |
| 4.900% 07/01/17 | | | 445,000 | | | | 452,503 | | |
Series 2008 G,
5.200% 07/01/28 | | | 5,345,000 | | | | 5,420,364 | | |
| Single-Family Total | | | 10,406,150 | | |
| Housing Total | | | 17,864,225 | | |
| Other – 20.9% | |
| Other – 0.7% | |
OR Health, Housing, Educational &
Cultural Facilities Authority | |
| Goodwill Industries Lane County, | |
Series 1998 A,
6.650% 11/15/22 (b) | | | 3,245,000 | | | | 2,903,464 | | |
| Other Total | | | 2,903,464 | | |
| Refunded/Escrowed (c) – 20.2% | |
| OR Benton & Linn Counties | |
| School District No. 509J, Corvallis, | |
Series 2003,
Pre-refunded 06/01/13,
Insured: FSA
5.000% 06/01/17 | | | 2,665,000 | | | | 3,009,025 | | |
| OR Board of Higher Education | |
| Lottery Education, | |
Series 1999 A,
Pre-refunded 04/01/11,
Insured: FSA
5.000% 04/01/14 | | | 2,705,000 | | | | 2,886,046 | | |
Series 2001 A,
Pre-refunded 08/01/11,
5.250% 08/01/14 | | | 1,225,000 | | | | 1,327,569 | | |
OR Clackamas Community
College District | |
| Series 2001, | |
Pre-refunded 06/15/11,
Insured: FGIC
5.250% 06/15/15 | | | 1,390,000 | | | | 1,500,116 | | |
See Accompanying Notes to Financial Statements.
66
Columbia Oregon Intermediate Municipal Bond Fund
August 31, 2009
| Municipal Bonds (continued) | |
| | | Par ($) | | Value ($) | |
OR Clackamas County Hospital
Facility Authority | |
| Willamette View, Inc., | |
Series 1999 A,
Pre-refunded 11/01/09,
6.850% 11/01/15 | | | 1,335,000 | | | | 1,360,138 | | |
| OR Clackamas County | |
| School District No. 086, | |
Series 2000,
Pre-refunded 06/15/10,
6.000% 06/15/16 | | | 2,350,000 | | | | 2,454,293 | | |
| School District No. 108, | |
Series 2001,
Pre-refunded 06/15/11,
Insured: FSA
5.375% 06/15/15 | | | 1,055,000 | | | | 1,140,919 | | |
| School District No. 7J, | |
Lake Oswego,
Series 2001,
Pre-refunded 06/01/11:
5.375% 06/01/16 | | | 1,295,000 | | | | 1,393,873 | | |
| 5.375% 06/01/17 | | | 2,535,000 | | | | 2,728,547 | | |
| OR Coos County | |
| School District No. 13, North Bend, | |
Series 2002,
Pre-refunded 06/15/12,
Insured: FSA
5.500% 06/15/15 | | | 1,765,000 | | | | 1,976,853 | | |
| OR Department of Transportation | |
| Highway User Tax, | |
Series 2002 A,
Pre-refunded 11/15/12,
5.500% 11/15/16 | | | 2,500,000 | | | | 2,828,150 | | |
OR Deschutes County Hospital
Facilities Authority | |
| Cascade Health Services, Inc., | |
Series 2002,
Pre-refunded 01/01/12:
5.500% 01/01/22 | | | 2,000,000 | | | | 2,200,180 | | |
| 5.600% 01/01/27 | | | 5,550,000 | | | | 6,118,264 | | |
| 5.600% 01/01/32 | | | 2,000,000 | | | | 2,204,780 | | |
| OR Deschutes County | |
| School District No. 1, | |
Series 2001 A,
Pre-refunded 06/15/11,
Insured: FSA
5.500% 06/15/18 | | | 1,000,000 | | | | 1,081,600 | | |
| | | Par ($) | | Value ($) | |
| OR Jackson County | |
| School District No. 4, | |
Phoenix-Talent,
Series 2001,
Pre-refunded 06/15/11,
5.500% 06/15/16 | | | 1,000,000 | | | | 1,083,660 | | |
| School District No. 9, Eagle Point, | |
Series 2000,
Pre-refunded 06/15/11,
5.625% 06/15/15 | | | 1,920,000 | | | | 2,084,870 | | |
| OR Linn County Community | |
| School District No. 9, Lebanon, | |
Series 2001,
Pre-refunded 06/15/13,
Insured: FGIC
5.550% 06/15/21 | | | 2,000,000 | | | | 2,301,600 | | |
| School District No. 9, | |
Series 2001,
Pre-refunded 06/15/13,
Insured: FGIC
5.250% 06/15/15 | | | 405,000 | | | | 461,449 | | |
OR Multnomah County Educational
Facilities Authority | |
| University of Portland, | |
Series 2000,
Pre-refunded 04/01/10:
5.700% 04/01/15 | | | 1,000,000 | | | | 1,030,430 | | |
| 6.000% 04/01/20 | | | 1,000,000 | | | | 1,032,170 | | |
| 6.000% 04/01/25 | | | 500,000 | | | | 516,085 | | |
| OR Multnomah County | |
| School District No. 40, | |
Series 2001,
Pre-refunded 12/01/10,
Insured: FSA
5.000% 12/01/14 | | | 1,790,000 | | | | 1,889,148 | | |
| School District No. 7, Reynolds, | |
Series 2000,
Pre-refunded 06/15/11,
5.625% 06/15/17 | | | 1,000,000 | | | | 1,085,310 | | |
| OR Multnomah-Clackamas Counties | |
| Centennial School District No. 28-302, | |
Series 2001,
Pre-refunded 06/15/11,
Insured: FGIC:
5.375% 06/15/16 | | | 2,055,000 | | | | 2,222,359 | | |
| 5.375% 06/15/17 | | | 2,280,000 | | | | 2,465,683 | | |
| 5.375% 06/15/18 | | | 2,490,000 | | | | 2,692,786 | | |
See Accompanying Notes to Financial Statements.
67
Columbia Oregon Intermediate Municipal Bond Fund
August 31, 2009
| Municipal Bonds (continued) | |
| | | Par ($) | | Value ($) | |
OR North Clackamas Parks &
Recreation District Facilities | |
| Series 1993, | |
Escrowed to Maturity,
5.700% 04/01/13 | | | 1,625,000 | | | | 1,773,330 | | |
| OR Portland Community College District | |
| Series 2001 A, | |
Pre-refunded 06/01/11:
5.375% 06/01/14 | | | 1,925,000 | | | | 2,078,634 | | |
| 5.375% 06/01/16 | | | 2,705,000 | | | | 2,920,886 | | |
| 5.375% 06/01/17 | | | 2,540,000 | | | | 2,742,717 | | |
OR Portland Urban Renewal &
Redevelopment | |
| South Park Blocks, | |
Series 2000 A,
Pre-refunded 06/15/10,
Insured: AMBAC:
5.750% 06/15/17 | | | 2,065,000 | | | | 2,171,988 | | |
| 5.750% 06/15/19 | | | 2,580,000 | | | | 2,713,670 | | |
| OR Salem Water & Sewer | |
| Series 2000, | |
Pre-refunded 06/01/10,
Insured: FSA
5.300% 06/01/15 | | | 1,500,000 | | | | 1,555,440 | | |
OR Umatilla County Hospital
Facility Authority | |
| Catholic Health Initiatives, | |
Series 2000 A,
Escrowed to Maturity:
5.750% 12/01/20 | | | 245,000 | | | | 256,312 | | |
| 6.000% 12/01/30 | | | 4,825,000 | | | | 5,056,745 | | |
| OR Washington & Clackamas Counties | |
| School District No. 23J, Tigard, | |
Series 2002,
Pre-refunded 06/15/12,
Insured: NPFGC
5.375% 06/15/17 | | | 1,500,000 | | | | 1,674,915 | | |
| OR Washington County | |
| School District No. 48J, Beaverton, | |
Series 2001,
Pre-refunded 01/01/11:
5.125% 01/01/14 | | | 2,000,000 | | | | 2,116,120 | | |
| 5.125% 01/01/17 | | | 1,820,000 | | | | 1,925,669 | | |
| 5.125% 01/01/18 | | | 2,260,000 | | | | 2,391,216 | | |
Series 2001,
Pre-refunded 06/01/11,
5.500% 06/01/16 | | | 2,785,000 | | | | 3,013,314 | | |
| | | Par ($) | | Value ($) | |
| OR Yamhill County | |
| School District No. 029J, | |
Series 2002,
Pre-refunded 06/15/12,
Insured: NPFGC
5.250% 06/15/16 | | | 2,535,000 | | | | 2,816,740 | | |
VI Virgin Islands Public Finance
Authority | |
| Series 1989 A, | |
Escrowed to Maturity,
7.300% 10/01/18 | | | 1,185,000 | | | | 1,485,078 | | |
| Refunded/Escrowed Total | | | 89,768,677 | | |
| Other Total | | | 92,672,141 | | |
| Other Revenue – 2.2% | |
| Recreation – 2.2% | |
| OR Board of Higher Education | |
| Lottery Education: | |
Series 2003 A,
Insured: FSA
5.000% 04/01/14 | | | 1,830,000 | | | | 2,039,645 | | |
Series 2008,
5.000% 04/01/24 | | | 3,130,000 | | | | 3,389,696 | | |
Series 2009 A,
5.000% 04/01/27 | | | 4,000,000 | | | | 4,279,520 | | |
| Recreation Total | | | 9,708,861 | | |
| Other Revenue Total | | | 9,708,861 | | |
| Tax-Backed – 44.7% | |
| Local Appropriated – 0.3% | |
| OR Deschutes & Jefferson County | |
| School District No. 02J, | |
Series 2004 B,
Insured: FGIC
(a) 06/15/22 | | | 2,335,000 | | | | 1,345,194 | | |
| Local Appropriated Total | | | 1,345,194 | | |
| Local General Obligations – 30.5% | |
| OR Bend Municipal Airport | |
| Series 1999 B, AMT, | |
| 5.375% 06/01/13 | | | 135,000 | | | | 135,319 | | |
| OR Benton & Linn Counties | |
| School District No. 509J & 509A, | |
Series 2007,
Insured: FSA
5.000% 06/15/20 | | | 5,000,000 | | | | 5,533,250 | | |
See Accompanying Notes to Financial Statements.
68
Columbia Oregon Intermediate Municipal Bond Fund
August 31, 2009
| Municipal Bonds (continued) | |
| | | Par ($) | | Value ($) | |
OR Canyonville South Umpqua
Rural Fire District | |
| Series 2001, | |
| 5.400% 07/01/31 | | | 610,000 | | | | 421,778 | | |
| OR Clackamas & Washington Counties | |
| School District No. 3, | |
Series 2009,
5.000% 06/15/24 | | | 4,150,000 | | | | 4,604,217 | | |
| School District No. 3A, | |
Series 2003,
Insured: FGIC
(a) 06/15/17 | | | 4,000,000 | | | | 3,041,080 | | |
OR Clackamas Community
College District | |
| Series 2001, | |
Insured: FGIC
5.250% 06/15/15 | | | 110,000 | | | | 117,006 | | |
| OR Clackamas County | |
| School District No. 108, Estacada, | |
Series 2005,
Insured: FSA
5.500% 06/15/25 | | | 2,485,000 | | | | 2,973,129 | | |
| School District No. 115, | |
Series 2006 A,
Insured: NPFGC:
(a) 06/15/25 | | | 2,250,000 | | | | 1,014,975 | | |
| (a) 06/15/26 | | | 2,610,000 | | | | 1,104,917 | | |
| School District No. 12, | |
North Clackamas,
Series 2007 B,
Insured: FSA
(a) 06/15/22 | | | 4,000,000 | | | | 3,937,120 | | |
| School District No. 46, | |
Series 2009:
5.000% 06/15/25 | | | 4,350,000 | | | | 4,704,742 | | |
| 5.000% 06/15/26 | | | 3,000,000 | | | | 3,176,010 | | |
Series 2007,
Insured: NPFGC
4.125% 06/01/27 | | | 2,000,000 | | | | 2,009,780 | | |
| OR Columbia County | |
| School District No. 502, | |
Deferred Interest,
Series 1999,
Insured: FGIC:
(a) 06/01/13 | | | 1,685,000 | | | | 1,550,992 | | |
| (a) 06/01/14 | | | 1,025,000 | | | | 905,793 | | |
| | | Par ($) | | Value ($) | |
OR Columbia Multnomah &
Washington Counties | |
| School District No. 1J, | |
Series 2009:
5.000% 06/15/23 | | | 1,000,000 | | | | 1,087,550 | | |
| 5.000% 06/15/24 | | | 1,165,000 | | | | 1,258,631 | | |
| 5.000% 06/15/25 | | | 1,275,000 | | | | 1,368,279 | | |
| OR Deschutes County | |
| Administrative School District No. 1, | |
Series 2007,
Insured: FGIC
4.500% 06/15/20 | | | 5,000,000 | | | | 5,392,550 | | |
| OR Jackson County | |
| School District No. 009, | |
Series 2005,
Insured: NPFGC:
5.500% 06/15/20 | | | 1,000,000 | | | | 1,150,600 | | |
| 5.500% 06/15/21 | | | 1,410,000 | | | | 1,619,766 | | |
| School District No. 549C, | |
Series 2008:
4.625% 06/15/27 | | | 1,500,000 | | | | 1,543,020 | | |
| 4.625% 06/15/28 | | | 1,660,000 | | | | 1,699,043 | | |
| 4.625% 06/15/30 | | | 2,000,000 | | | | 2,017,860 | | |
| OR Jefferson County | |
| School District No. 509J, | |
Madras School District,
Series 2002,
Insured: FGIC
5.250% 06/15/18 | | | 1,075,000 | | | | 1,153,067 | | |
| OR Josephine County | |
| Unit School District, | |
Three Rivers,
Series 2005,
Insured: FGIC:
5.000% 12/15/15 | | | 1,000,000 | | | | 1,153,100 | | |
| 5.000% 12/15/16 | | | 1,000,000 | | | | 1,153,720 | | |
| OR Lane Community College | |
| Series 2009: | |
| 4.250% 06/15/17 | | | 2,195,000 | | | | 2,391,562 | | |
| 4.250% 06/15/18 | | | 2,000,000 | | | | 2,165,440 | | |
| OR Lane County | |
| School District No. 19, Springfield: | |
Series 1997,
Insured: FGIC:
6.000% 10/15/12 | | | 1,740,000 | | | | 1,943,215 | | |
| 6.000% 10/15/14 | | | 1,310,000 | | | | 1,509,028 | | |
See Accompanying Notes to Financial Statements.
69
Columbia Oregon Intermediate Municipal Bond Fund
August 31, 2009
| Municipal Bonds (continued) | |
| | | Par ($) | | Value ($) | |
Series 2006,
Insured: FSA
(a) 06/15/25 | | | 5,160,000 | | | | 2,275,250 | | |
| School District No. 4J, Eugene, | |
Series 2002:
5.000% 07/01/12 | | | 1,000,000 | | | | 1,105,530 | | |
| 5.250% 07/01/13 | | | 1,000,000 | | | | 1,136,760 | | |
| OR Linn Benton Community College | |
| Series 2001, | |
Insured: FGIC
(a) 06/15/13 | | | 1,000,000 | | | | 918,890 | | |
| Series 2002, | |
Insured: FGIC
(a) 06/15/14 | | | 1,000,000 | | | | 875,950 | | |
| OR Linn County | |
| Community School District No. 9, Lebanon, | |
Series 2001,
Insured: FGIC
5.250% 06/15/15 | | | 305,000 | | | | 338,629 | | |
| OR Madras Aquatic Center District | |
| Series 2005, | |
| 5.000% 06/01/22 | | | 1,695,000 | | | | 1,823,447 | | |
| OR Multnomah-Clackamas Counties | |
| Centennial School District No. 28JT, | |
Series 2006,
Insured: AMBAC
(a) 06/01/16 | | | 2,260,000 | | | | 1,715,702 | | |
| OR Portland Community College District | |
| Series 2005, | |
Insured: FSA
5.000% 06/15/16 | | | 4,750,000 | | | | 5,395,715 | | |
| OR Portland Limited Tax | |
| Series 2001 B: | |
| (a) 06/01/13 | | | 1,500,000 | | | | 1,383,270 | | |
| (a) 06/01/16 | | | 3,500,000 | | | | 2,837,310 | | |
| (a) 06/01/18 | | | 4,000,000 | | | | 2,898,320 | | |
| (a) 06/01/19 | | | 4,000,000 | | | | 2,731,440 | | |
| (a) 06/01/20 | | | 4,000,000 | | | | 2,582,160 | | |
| OR Portland | |
| Series 2005, | |
| 5.000% 06/01/16 | | | 3,075,000 | | | | 3,500,119 | | |
| OR Salem-Keizer | |
| School District No 24J, | |
Series 2009 A,
4.000% 06/15/15 | | | 3,850,000 | | | | 4,181,832 | | |
| | | Par ($) | | Value ($) | |
| OR Salem | |
| Series 2009: | |
| 5.000% 06/01/19 | | | 2,025,000 | | | | 2,282,722 | | |
| 5.000% 06/01/20 | | | 880,000 | | | | 983,338 | | |
| 5.000% 06/01/26 | | | 3,315,000 | | | | 3,536,111 | | |
OR Tri-County Metropolitan
Transportation District | |
| Series 2003 A, | |
| 5.000% 09/01/15 | | | 1,000,000 | | | | 1,089,310 | | |
Series 2005 A,
Insured: FSA
5.000% 09/01/17 | | | 4,250,000 | | | | 4,808,237 | | |
OR Tualatin Hills Park &
Recreation District | |
| Series 1998, | |
Insured: FGIC
5.750% 03/01/14 | | | 990,000 | | | | 1,151,321 | | |
| OR Washington & Clackamas Counties | |
| School District No. 23J, Tigard: | |
Series 2000,
(a) 06/15/18 | | | 2,700,000 | | | | 1,947,834 | | |
Series 2005,
Insured: NPFGC
5.000% 06/15/21 | | | 6,575,000 | | | | 7,417,520 | | |
OR Washington Clackamas &
Yamhill Counties | |
| School District No. 88J, | |
Series 2007 B,
Insured: NPFGC
4.500% 06/15/23 | | | 8,125,000 | | | | 8,519,469 | | |
OR Washington Multnomah &
Yamhill Counties | |
| School District No. 1J: | |
Series 1998,
5.000% 11/01/13 | | | 1,100,000 | | | | 1,239,392 | | |
Series 2006,
Insured: NPFGC
(a) 06/15/25 | | | 4,065,000 | | | | 1,784,738 | | |
| OR Yamhill County | |
| School District No. 029J, | |
Series 2005,
Insured: FGIC
5.500% 06/15/21 | | | 1,000,000 | | | | 1,165,240 | | |
| Local General Obligations Total | | | 135,462,095 | | |
See Accompanying Notes to Financial Statements.
70
Columbia Oregon Intermediate Municipal Bond Fund
August 31, 2009
| Municipal Bonds (continued) | |
| | | Par ($) | | Value ($) | |
| Special Non-Property Tax – 1.7% | |
| OR Department of Transportation | |
| Series 2007 A, | |
| 5.000% 11/15/16 | | | 6,305,000 | | | | 7,287,823 | | |
| Special Non-Property Tax Total | | | 7,287,823 | | |
| Special Property Tax – 4.6% | |
| OR Hood River Urban Renewal Agency | |
| Series 1996, | |
| 6.250% 12/15/11 | | | 535,000 | | | | 514,617 | | |
| OR Keizer | |
| Series 2008, | |
| 5.200% 06/01/31 | | | 2,500,000 | | | | 2,508,500 | | |
| OR Lebanon Urban Renewal Agency | |
| Series 2000: | |
| 5.750% 06/01/15 | | | 1,120,000 | | | | 1,002,366 | | |
| 6.000% 06/01/20 | | | 1,580,000 | | | | 1,358,737 | | |
| OR Medford Urban Renewal | |
| Series 1996, | |
| 5.875% 09/01/10 | | | 345,000 | | | | 345,987 | | |
OR Portland Airport Way Urban
Renewal & Redevelopment | |
| Convention Center, | |
Series 2000 A,
Insured: AMBAC:
5.750% 06/15/17 | | | 1,500,000 | | | | 1,553,115 | | |
| 5.750% 06/15/18 | | | 2,050,000 | | | | 2,120,130 | | |
OR Portland River District Urban
Renewal & Redevelopment | |
| Series 2003 A, | |
Insured: AMBAC:
5.000% 06/15/17 | | | 1,500,000 | | | | 1,636,980 | | |
| 5.000% 06/15/18 | | | 3,070,000 | | | | 3,132,352 | | |
| 5.000% 06/15/20 | | | 2,000,000 | | | | 2,028,780 | | |
| OR Redmond Urban Renewal Agency | |
| Downtown Area B, | |
Series 1999:
5.650% 06/01/13 | | | 720,000 | | | | 681,818 | | |
| 5.850% 06/01/19 | | | 785,000 | | | | 688,076 | | |
| OR Seaside Urban Renewal Agency | |
| Greater Seaside Urban Renewal, | |
Series 2001,
5.250% 06/01/15 | | | 1,000,000 | | | | 949,940 | | |
| | | Par ($) | | Value ($) | |
| OR Veneta Urban Renewal Agency | |
| Series 2001: | |
| 5.375% 02/15/16 | | | 700,000 | | | | 668,934 | | |
| 5.625% 02/15/21 | | | 1,100,000 | | | | 1,004,806 | | |
| Special Property Tax Total | | | 20,195,138 | | |
| State Appropriated – 5.3% | |
OR Department of Administrative
Services | |
| Certificates of Participation: | |
Series 1999 A,
Insured: AMBAC:
5.000% 05/01/13 | | | 4,240,000 | | | | 4,293,721 | | |
| 5.000% 05/01/14 | | | 1,000,000 | | | | 1,012,670 | | |
Series 2002 B,
Insured: NPFGC
5.250% 05/01/10 | | | 840,000 | | | | 865,024 | | |
Series 2002 C,
Insured: NPFGC:
5.250% 11/01/15 | | | 1,000,000 | | | | 1,083,960 | | |
| 5.250% 11/01/17 | | | 5,000,000 | | | | 5,402,150 | | |
Series 2002 E,
Insured: FSA
5.000% 11/01/13 | | | 1,470,000 | | | | 1,609,371 | | |
Series 2007 A,
Insured FGIC:
5.000% 05/01/24 | | | 2,630,000 | | | | 2,747,245 | | |
| 5.000% 05/01/25 | | | 2,780,000 | | | | 2,889,226 | | |
| 5.000% 05/01/26 | | | 2,800,000 | | | | 2,893,436 | | |
PR Commonwealth of Puerto Rico
Public Finance Corp. | |
| Series 2004 A, | |
LOC: Government Development Bank for Puerto Rico
5.750% 08/01/27 (02/01/12) (d) | | | 750,000 | | | | 770,130 | | |
| State Appropriated Total | | | 23,566,933 | | |
| State General Obligations – 2.3% | |
| OR Board of Higher Education | |
| Deferred Interest, | |
Series 2001 A,
(a) 08/01/17 | | | 1,050,000 | | | | 801,286 | | |
Series 1996 A,
(a) 08/01/14 | | | 490,000 | | | | 433,023 | | |
Series 2001 A:
5.250% 08/01/14 | | | 255,000 | | | | 273,092 | | |
| 5.250% 08/01/16 | | | 780,000 | | | | 833,812 | | |
Series 2004 D,
5.000% 08/01/24 | | | 3,620,000 | | | | 3,829,345 | | |
See Accompanying Notes to Financial Statements.
71
Columbia Oregon Intermediate Municipal Bond Fund
August 31, 2009
| Municipal Bonds (continued) | |
| | | Par ($) | | Value ($) | |
| OR Elderly & Disabled Housing | |
| Series 2001 B, | |
| 4.950% 08/01/20 | | | 985,000 | | | | 993,688 | | |
| OR State | |
| Series 2002 A, | |
| 5.250% 10/15/15 | | | 1,735,000 | | | | 1,917,695 | | |
| OR Veterans Welfare | |
| Series 2000 80A, | |
| 5.700% 10/01/32 | | | 1,270,000 | | | | 1,282,967 | | |
| State General Obligations Total | | | 10,364,908 | | |
| Tax-Backed Total | | | 198,222,091 | | |
| Transportation – 0.7% | |
| Airports – 0.2% | |
OR Port of Portland International
Airport | |
| Series 1998 12B, | |
Insured: FGIC
5.250% 07/01/12 | | | 1,000,000 | | | | 1,008,020 | | |
| Airports Total | | | 1,008,020 | | |
| Ports – 0.5% | |
| OR Port of Morrow | |
| Series 2007: | |
| 4.875% 06/01/20 | | | 750,000 | | | | 595,065 | | |
| 5.000% 06/01/25 | | | 1,000,000 | | | | 740,010 | | |
| OR Port of St. Helens | |
| Series 1999: | |
| 5.600% 08/01/14 | | | 315,000 | | | | 303,988 | | |
| 5.750% 08/01/19 | | | 425,000 | | | | 392,020 | | |
| Ports Total | | | 2,031,083 | | |
| Transportation Total | | | 3,039,103 | | |
| Utilities – 8.5% | |
| Independent Power Producers – 0.8% | |
| OR Western Generation Agency | |
| Series 2006 A, | |
| 5.000% 01/01/21 | | | 3,000,000 | | | | 2,508,780 | | |
Wauna Cogeneration,
Series 2006 A,
5.000% 01/01/20 | | | 1,000,000 | | | | 850,630 | | |
| Independent Power Producers Total | | | 3,359,410 | | |
| Investor Owned – 1.9% | |
| OR Port of St. Helens Pollution Control | |
| Portland General Electric Co.: | |
Series 1985 A,
4.800% 04/01/10 | | | 5,195,000 | | | | 5,163,674 | | |
| | | Par ($) | | Value ($) | |
Series 1985 B,
4.800% 06/01/10 | | | 3,500,000 | | | | 3,472,910 | | |
| Investor Owned Total | | | 8,636,584 | | |
| Municipal Electric – 2.8% | |
| OR Emerald Peoples Utility District | |
| Series 1996, | |
Insured: FGIC:
7.350% 11/01/10 | | | 2,160,000 | | | | 2,299,838 | | |
| 7.350% 11/01/11 | | | 2,000,000 | | | | 2,226,520 | | |
| 7.350% 11/01/12 | | | 2,490,000 | | | | 2,863,400 | | |
| 7.350% 11/01/13 | | | 2,675,000 | | | | 3,162,519 | | |
| Series 2003 A, | |
Insured: FSA
5.250% 11/01/20 | | | 605,000 | | | | 649,395 | | |
| OR Eugene Electric Utilities System | |
| Series 2001 B, | |
Insured: FSA
5.250% 08/01/13 | | | 1,040,000 | | | | 1,106,165 | | |
| Municipal Electric Total | | | 12,307,837 | | |
| Water & Sewer – 3.0% | |
| OR Myrtle Point Water | |
| Series 2000, | |
| 6.000% 12/01/20 | | | 510,000 | | | | 523,352 | | |
| OR Portland Water Systems Revenue | |
| Series 2004 B, | |
| 5.000% 10/01/13 | | | 730,000 | | | | 831,134 | | |
| Series 2006 B, | |
| 5.000% 10/01/16 | | | 5,330,000 | | | | 6,154,445 | | |
| OR Portland | |
| Series 2008 A, | |
| 5.000% 06/15/17 | | | 1,500,000 | | | | 1,722,315 | | |
| OR Sheridan Water | |
| Series 1998, | |
| 5.350% 04/01/18 | | | 300,000 | | | | 285,321 | | |
| Series 2000: | |
| 6.200% 05/01/15 | | | 625,000 | | | | 626,700 | | |
| 6.450% 05/01/20 | | | 520,000 | | | | 520,608 | | |
OR Washington County Housing
Authority | |
| Clean Water Services Sewer, | |
Series 2004 Lien,
Insured: NPFGC
5.000% 10/01/13 | | | 2,310,000 | | | | 2,573,178 | | |
| Water & Sewer Total | | | 13,237,053 | | |
| Utilities Total | | | 37,540,884 | | |
Total Municipal Bonds
(cost of $406,553,836) | | | 419,737,639 | | |
See Accompanying Notes to Financial Statements.
72
Columbia Oregon Intermediate Municipal Bond Fund
August 31, 2009
| Investment Companies – 4.2% | |
| | | Shares | | Value ($) | |
Columbia Tax-Exempt
Reserves, Capital Class
(7 day yield of 0.220%) (e)(f) | | | 8,970,586 | | | | 8,970,586 | | |
Dreyfus Tax-Exempt Cash
Management Fund
(7 day yield of 0.160%) | | | 9,594,698 | | | | 9,594,698 | | |
Total Investment Companies
(cost of $18,565,284) | | | 18,565,284 | | |
Total Investments – 98.8%
(cost of $425,119,120) (g) | | | 438,302,923 | | |
| Other Assets & Liabilities, Net – 1.2% | | | 5,452,419 | | |
| Net Assets – 100.0% | | | 443,755,342 | | |
Notes to Investment Portfolio:
(a) Zero coupon bond.
(b) Denotes a restricted security, which is subject to restrictions on resale under federal securities laws or in transactions exempt from registration. At August 31, 2009, the value of this security amounted to $2,903,464, which represents 0.7% of net assets.
| Security | | Acquisition
Date | | Acquisition
Cost | |
OR Health, Housing, Educational &
Cultural Facilities Authority, Goodwill
Industries Lane County, Series 1998 A,
6.650% 11/15/22 | | | 06/17/98 | | | $ | 3,245,000 | | |
(c) The Fund has been informed that each issuer has placed direct obligations of the U.S. Government in an irrevocable trust, solely for the payment of principal and interest.
(d) Parenthetical date represents the next reset date for the security.
(e) Investments in affiliates during the year ended August 31, 2009:
| Security name: Columbia Tax-Exempt Reserves, Capital Class (7 day yield of 0.220%). | |
| Shares as of 08/31/08: | | | – | | |
| Shares purchased: | | | 75,766,222 | | |
| Shares sold: | | | (66,795,636 | ) | |
| Shares as of 08/31/09: | | | 8,970,586 | | |
| Net realized gain/loss: | | $ | – | | |
| Dividend income earned: | | $ | 35,973 | | |
| Value at end of period: | | $ | 8,970,586 | | |
(f) Money market mutual fund registered under the Investment Company Act of 1940, as amended, and advised by Columbia Management Advisors, LLC or one of its affiliates.
(g) Cost for federal income tax purposes is $424,953,999.
The following table summarizes the inputs used, as of August 31, 2009 in valuing the Fund's assets:
| Description | | Quoted Prices
(Level 1) | | Other
Significant
Observable
Inputs
(Level 2) | | Significant
Unobservable
Inputs
(Level 3) | | Total | |
| Municipal Bonds | |
| Education | | $ | — | | | $ | 24,087,968 | | | $ | — | | | $ | 24,087,968 | | |
| Health Care | | | — | | | | 36,602,366 | | | | — | | | | 36,602,366 | | |
| Housing | | | — | | | | 17,864,225 | | | | — | | | | 17,864,225 | | |
| Other | | | — | | | | 92,672,141 | | | | — | | | | 92,672,141 | | |
| Other Revenue | | | — | | | | 9,708,861 | | | | — | | | | 9,708,861 | | |
| Tax-Backed | | | — | | | | 198,222,091 | | | | — | | | | 198,222,091 | | |
| Transportation | | | — | | | | 3,039,103 | | | | — | | | | 3,039,103 | | |
| Utilities | | | — | | | | 37,540,884 | | | | — | | | | 37,540,884 | | |
| Total Municipal Bonds | | | — | | | | 419,737,639 | | | | — | | | | 419,737,639 | | |
| Investment Companies | | | 18,565,284 | | | | — | | | | — | | | | 18,565,284 | | |
| Total Investments | | $ | 18,565,284 | | | $ | 419,737,639 | | | $ | — | | | $ | 438,302,923 | | |
The Fund's assets assigned to the Level 2 input category include certain foreign securities for which a third party statistical pricing service may be employed for purposes of fair market valuation.
For more information on valuation inputs, and their aggregation into the levels used in the table above, please refer to the Security Valuation section in the accompanying Notes to Financial Statements
At August 31, 2009, the composition of the Fund by revenue source is as follows:
| Holdings By Revenue Source (Unaudited) | | % of
Net Assets | |
| Tax-Backed | | | 44.7 | | |
| Other | | | 20.9 | | |
| Utilities | | | 8.5 | | |
| Health Care | | | 8.2 | | |
| Education | | | 5.4 | | |
| Housing | | | 4.0 | | |
| Other Revenue | | | 2.2 | | |
| Transportation | | | 0.7 | | |
| | | | 94.6 | | |
| Investment Companies | | | 4.2 | | |
| Other Assets & Liabilities, Net | | | 1.2 | | |
| | | | 100.0 | | |
| Acronym | | Name | |
| AMBAC | | Ambac Assurance Corp. | |
|
| AMT | | Alternative Minimum Tax | |
|
| FGIC | | Financial Guaranty Insurance Co. | |
|
| FHA | | Federal Housing Administration | |
|
| FSA | | Financial Security Assurance, Inc. | |
|
| IBC | | Insured Bond Certificates | |
|
| LOC | | Letter of Credit | |
|
| NPFGC | | National Public Finance Guarantee Corp. | |
|
See Accompanying Notes to Financial Statements.
73
Investment Portfolio – Columbia Conservative High Yield Fund
August 31, 2009
| Corporate Fixed-Income Bonds & Notes – 96.6% | |
| | | Par ($)(a) | | Value ($) | |
| Basic Materials – 12.3% | |
| Chemicals – 1.6% | |
| Agricultural Chemicals – 0.4% | |
| Terra Capital, Inc. | |
| 7.000% 02/01/17 | | | 2,340,000 | | | | 2,205,450 | | |
| | | | 2,205,450 | | |
| Chemicals-Diversified – 1.2% | |
| Huntsman International LLC | |
| 6.875% 11/15/13 (b) | | EUR | 1,205,000 | | | | 1,416,540 | | |
| 7.875% 11/15/14 | | | 1,310,000 | | | | 1,165,900 | | |
| INVISTA | |
| 9.250% 05/01/12 (b) | | | 4,805,000 | | | | 4,714,906 | | |
| | | | 7,297,346 | | |
| Chemicals Total | | | 9,502,796 | | |
| Forest Products & Paper – 3.3% | |
| Paper & Related Products – 3.3% | |
| Cascades, Inc. | |
| 7.250% 02/15/13 | | | 3,770,000 | | | | 3,553,225 | | |
| Clearwater Paper Corp. | |
| 10.625% 06/15/16 (b) | | | 675,000 | | | | 723,094 | | |
| Domtar Corp. | |
| 7.125% 08/15/15 | | | 3,740,000 | | | | 3,599,750 | | |
| Georgia-Pacific Corp. | |
| 8.000% 01/15/24 | | | 6,505,000 | | | | 6,049,650 | | |
| PE Paper Escrow GmbH | |
| 12.000% 08/01/14 (b) | | | 2,075,000 | | | | 2,126,875 | | |
| Westvaco Corp. | |
| 8.200% 01/15/30 | | | 3,490,000 | | | | 3,429,382 | | |
| | | | 19,481,976 | | |
| Forest Products & Paper Total | | | 19,481,976 | | |
| Iron/Steel – 2.1% | |
| Steel-Producers – 2.1% | |
| Russel Metals, Inc. | |
| 6.375% 03/01/14 | | | 3,340,000 | | | | 2,939,200 | | |
| Steel Dynamics, Inc. | |
| 8.250% 04/15/16 (b) | | | 6,135,000 | | | | 6,027,637 | | |
| United States Steel Corp. | |
| 7.000% 02/01/18 | | | 3,165,000 | | | | 3,019,980 | | |
| | | | 11,986,817 | | |
| Iron/Steel Total | | | 11,986,817 | | |
| Metals & Mining – 5.3% | |
| Diversified Minerals – 2.5% | |
| FMG Finance Ltd. | |
| 10.625% 09/01/16 (b) | | | 3,335,000 | | | | 3,585,125 | | |
| | | Par ($)(a) | | Value ($) | |
| Teck Resources Ltd. | |
| 10.750% 05/15/19 | | | 9,975,000 | | | | 11,359,031 | | |
| | | | 14,944,156 | | |
| Metal-Diversified – 2.8% | |
| Freeport-McMoRan Copper & Gold, Inc. | |
| 8.375% 04/01/17 | | | 15,645,000 | | | | 16,309,913 | | |
| | | | 16,309,913 | | |
| Metals & Mining Total | | | 31,254,069 | | |
| Basic Materials Total | | | 72,225,658 | | |
| Communications – 20.9% | |
| Advertising – 0.4% | |
| Advertising Agencies – 0.4% | |
| Interpublic Group of Companies, Inc. | |
| 6.250% 11/15/14 | | | 960,000 | | | | 885,600 | | |
| 10.000% 07/15/17 (b) | | | 1,360,000 | | | | 1,421,200 | | |
| | | | 2,306,800 | | |
| Advertising Total | | | 2,306,800 | | |
| Media – 4.8% | |
| Broadcast Services/Programs – 0.5% | |
| Liberty Media LLC | |
| 8.250% 02/01/30 | | | 4,115,000 | | | | 3,127,400 | | |
| | | | 3,127,400 | | |
| Cable TV – 4.3% | |
| Cablevision Systems Corp. | |
| 8.000% 04/15/12 | | | 1,125,000 | | | | 1,150,313 | | |
| CSC Holdings, Inc. | |
| 8.500% 06/15/15 (b) | | | 3,200,000 | | | | 3,232,000 | | |
| 8.625% 02/15/19 (b) | | | 1,070,000 | | | | 1,080,700 | | |
| DirecTV Holdings LLC/DirecTV Financing Co., Inc. | |
| 6.375% 06/15/15 | | | 8,765,000 | | | | 8,874,562 | | |
| EchoStar DBS Corp. | |
| 6.625% 10/01/14 | | | 11,700,000 | | | | 11,115,000 | | |
| | | | 25,452,575 | | |
| Media Total | | | 28,579,975 | | |
| Telecommunication Services – 15.7% | |
| Cellular Telecommunications – 6.3% | |
| Cricket Communications, Inc. | |
| 7.750% 05/15/16 (b) | | | 5,020,000 | | | | 4,869,400 | | |
| Digicel Ltd. | |
| 9.250% 09/01/12 (b) | | | 3,490,000 | | | | 3,481,275 | | |
| MetroPCS Wireless, Inc. | |
| 9.250% 11/01/14 | | | 2,950,000 | | | | 2,894,687 | | |
See Accompanying Notes to Financial Statements.
74
Columbia Conservative High Yield Fund
August 31, 2009
| Corporate Fixed-Income Bonds & Notes (continued) | |
| | | Par ($)(a) | | Value ($) | |
| Nextel Communications, Inc. | |
| 7.375% 08/01/15 | | | 11,645,000 | | | | 9,941,919 | | |
| NII Capital Corp. | |
| 10.000% 08/15/16 (b) | | | 1,790,000 | | | | 1,772,100 | | |
| Wind Acquisition Finance SA | |
| 10.750% 12/01/15 (b) | | | 3,935,000 | | | | 4,230,125 | | |
| 11.750% 07/15/17 (b) | | | 6,900,000 | | | | 7,486,500 | | |
| 11.750% 07/15/17 (b) | | EUR | 1,500,000 | | | | 2,225,663 | | |
| | | | 36,901,669 | | |
| Media – 0.8% | |
| Quebecor Media, Inc. | |
| 7.750% 03/15/16 | | | 4,970,000 | | | | 4,684,225 | | |
| | | | 4,684,225 | | |
| Satellite Telecommunications – 1.6% | |
| Inmarsat Finance PLC | |
| 7.625% 06/30/12 | | | 630,000 | | | | 623,700 | | |
| 10.375% 11/15/12 | | | 4,145,000 | | | | 4,300,438 | | |
| Intelsat Corp. | |
| 9.250% 06/15/16 | | | 4,695,000 | | | | 4,753,687 | | |
| | | | 9,677,825 | | |
| Telecommunication Equipment – 0.6% | |
| Lucent Technologies, Inc. | |
| 6.450% 03/15/29 | | | 4,960,000 | | | | 3,372,800 | | |
| | | | 3,372,800 | | |
| Telecommunication Services – 1.2% | |
| Nordic Telephone Co. Holdings ApS | |
| 8.875% 05/01/16 (b) | | | 1,555,000 | | | | 1,578,325 | | |
| SBA Telecommunications, Inc. | |
| 8.250% 08/15/19 (b) | | | 3,510,000 | | | | 3,527,550 | | |
| Time Warner Telecom Holdings, Inc. | |
| 9.250% 02/15/14 | | | 1,805,000 | | | | 1,836,587 | | |
| | | | 6,942,462 | | |
| Telephone-Integrated – 4.6% | |
| Citizens Communications Co. | |
| 7.875% 01/15/27 | | | 7,935,000 | | | | 6,863,775 | | |
| Qwest Communications International, Inc. | |
| 7.500% 02/15/14 | | | 3,035,000 | | | | 2,928,775 | | |
| Qwest Corp. | |
| 7.500% 10/01/14 | | | 5,155,000 | | | | 5,109,894 | | |
| 7.500% 06/15/23 | | | 4,215,000 | | | | 3,582,750 | | |
| Windstream Corp. | |
| 8.625% 08/01/16 | | | 8,820,000 | | | | 8,853,075 | | |
| | | | 27,338,269 | | |
| | | Par ($)(a) | | Value ($) | |
| Wireless Equipment – 0.6% | |
| CC Holdings GS V LLC/Crown Castle GS III Corp. | |
| 7.750% 05/01/17 (b) | | | 3,350,000 | | | | 3,383,500 | | |
| | | | 3,383,500 | | |
| Telecommunication Services Total | | | 92,300,750 | | |
| Communications Total | | | 123,187,525 | | |
| Consumer Cyclical – 10.7% | |
| Apparel – 0.4% | |
| Apparel Manufacturers – 0.4% | |
| Levi Strauss & Co. | |
| 9.750% 01/15/15 | | | 2,395,000 | | | | 2,448,887 | | |
| | | | 2,448,887 | | |
| Apparel Total | | | 2,448,887 | | |
| Auto Parts & Equipment – 0.6% | |
| Rubber-Tires – 0.6% | |
| Goodyear Tire & Rubber Co. | |
| 9.000% 07/01/15 | | | 2,661,000 | | | | 2,700,915 | | |
| 10.500% 05/15/16 | | | 895,000 | | | | 955,412 | | |
| | | | 3,656,327 | | |
| Auto Parts & Equipment Total | | | 3,656,327 | | |
| Entertainment – 1.6% | |
| Casino Services – 0.1% | |
| American Casino & Entertainment Properties LLC | |
| 11.000% 06/15/14 (b) | | | 885,000 | | | | 736,763 | | |
| | | | 736,763 | | |
| Gambling (Non-Hotel) – 0.3% | |
| Pinnacle Entertainment, Inc. | |
| 8.625% 08/01/17 (b) | | | 1,920,000 | | | | 1,891,200 | | |
| | | | 1,891,200 | | |
| Music – 0.6% | |
| WMG Acquisition Corp. | |
| 7.375% 04/15/14 | | | 4,075,000 | | | | 3,677,687 | | |
| | | | 3,677,687 | | |
| Racetracks – 0.6% | |
| Penn National Gaming, Inc. | |
| 8.750% 08/15/19 (b) | | | 3,215,000 | | | | 3,190,887 | | |
| | | | 3,190,887 | | |
| Entertainment Total | | | 9,496,537 | | |
See Accompanying Notes to Financial Statements.
75
Columbia Conservative High Yield Fund
August 31, 2009
| Corporate Fixed-Income Bonds & Notes (continued) | |
| | | Par ($)(a) | | Value ($) | |
| Home Builders – 1.8% | |
| Building-Residential/Commercial – 1.8% | |
| D.R. Horton, Inc. | |
| 5.625% 09/15/14 | | | 2,955,000 | | | | 2,777,700 | | |
| 5.625% 01/15/16 | | | 2,250,000 | | | | 2,013,750 | | |
| KB Home | |
| 5.875% 01/15/15 | | | 5,110,000 | | | | 4,624,550 | | |
| Ryland Group, Inc. | |
| 8.400% 05/15/17 | | | 1,270,000 | | | | 1,289,050 | | |
| | | | 10,705,050 | | |
| Home Builders Total | | | 10,705,050 | | |
| Lodging – 3.5% | |
| Casino Hotels – 1.2% | |
| Boyd Gaming Corp. | |
| 7.125% 02/01/16 | | | 2,200,000 | | | | 1,831,500 | | |
| MGM Mirage | |
| 13.000% 11/15/13 (b) | | | 1,850,000 | | | | 2,062,750 | | |
| Wynn Las Vegas LLC | |
| 6.625% 12/01/14 | | | 3,670,000 | | | | 3,376,400 | | |
| | | | 7,270,650 | | |
| Gambling (Non-Hotel) – 0.6% | |
| Seminole Indian Tribe of Florida | |
| 7.804% 10/01/20 (b) | | | 4,105,000 | | | | 3,522,542 | | |
| | | | 3,522,542 | | |
| Hotels & Motels – 1.7% | |
| Host Hotels & Resorts LP | |
| 6.750% 06/01/16 | | | 5,505,000 | | | | 5,119,650 | | |
| Starwood Hotels & Resorts Worldwide, Inc. | |
| 6.750% 05/15/18 | | | 5,240,000 | | | | 4,742,200 | | |
| | | | 9,861,850 | | |
| Lodging Total | | | 20,655,042 | | |
| Retail – 2.3% | |
| Retail-Apparel/Shoe – 0.9% | |
| Limited Brands, Inc. | |
| 8.500% 06/15/19 (b) | | | 3,990,000 | | | | 4,041,994 | | |
| Phillips-Van Heusen Corp. | |
| 8.125% 05/01/13 | | | 1,250,000 | | | | 1,268,750 | | |
| | | | 5,310,744 | | |
| Retail-Computer Equipment – 0.3% | |
| GameStop Corp./GameStop, Inc. | |
| 8.000% 10/01/12 | | | 1,645,000 | | | | 1,665,563 | | |
| | | | 1,665,563 | | |
| Retail-Propane Distributors – 1.1% | |
| AmeriGas Partners LP | |
| 7.125% 05/20/16 | | | 4,315,000 | | | | 4,131,612 | | |
| | | Par ($)(a) | | Value ($) | |
| Inergy LP/Inergy Finance Corp. | |
| 8.250% 03/01/16 | | | 1,225,000 | | | | 1,212,750 | | |
| 8.750% 03/01/15 (b) | | | 1,085,000 | | | | 1,095,850 | | |
| | | | 6,440,212 | | |
| Retail Total | | | 13,416,519 | | |
| Textiles – 0.5% | |
| Textile-Home Furnishings – 0.5% | |
| Mohawk Industries, Inc. | |
| 6.625% 01/15/16 | | | 2,975,000 | | | | 2,791,431 | | |
| | | | 2,791,431 | | |
| Textiles Total | | | 2,791,431 | | |
| Consumer Cyclical Total | | | 63,169,793 | | |
| Consumer Non-Cyclical – 14.1% | |
| Beverages – 0.9% | |
| Beverages-Wine/Spirits – 0.9% | |
| Constellation Brands, Inc. | |
| 8.125% 01/15/12 | | | 5,580,000 | | | | 5,580,000 | | |
| | | | 5,580,000 | | |
| Beverages Total | | | 5,580,000 | | |
| Biotechnology – 0.4% | |
| Medical-Biomedical/Gene – 0.4% | |
| Bio-Rad Laboratories, Inc. | |
| 7.500% 08/15/13 | | | 2,500,000 | | | | 2,500,000 | | |
| | | | 2,500,000 | | |
| Biotechnology Total | | | 2,500,000 | | |
| Commercial Services – 2.5% | |
| Commercial Services – 0.8% | |
| ARAMARK Corp. | |
| 8.500% 02/01/15 | | | 1,185,000 | | | | 1,149,450 | | |
| Iron Mountain, Inc. | |
| 8.000% 06/15/20 | | | 2,910,000 | | | | 2,811,788 | | |
| 8.375% 08/15/21 | | | 835,000 | | | | 829,781 | | |
| | | | 4,791,019 | | |
| Funeral Services & Related Items – 0.2% | |
| Service Corp. International | |
| 6.750% 04/01/16 | | | 800,000 | | | | 752,000 | | |
| 7.000% 06/15/17 | | | 695,000 | | | | 649,825 | | |
| | | | 1,401,825 | | |
| Private Corrections – 1.1% | |
| Corrections Corp. of America | |
| 6.250% 03/15/13 | | | 280,000 | | | | 273,700 | | |
| 7.750% 06/01/17 | | | 4,000,000 | | | | 3,950,000 | | |
See Accompanying Notes to Financial Statements.
76
Columbia Conservative High Yield Fund
August 31, 2009
| Corporate Fixed-Income Bonds & Notes (continued) | |
| | | Par ($)(a) | | Value ($) | |
| GEO Group, Inc. | |
| 8.250% 07/15/13 | | | 2,042,000 | | | | 2,031,790 | | |
| | | | 6,255,490 | | |
| Rental Auto/Equipment – 0.4% | |
| RSC Equipment Rental, Inc. | |
| 10.000% 07/15/17 (b) | | | 2,285,000 | | | | 2,387,825 | | |
| | | | 2,387,825 | | |
| Commercial Services Total | | | 14,836,159 | | |
| Food – 3.2% | |
| Food-Meat Products – 1.9% | |
| JBS USA LLC/JBS USA Finance, Inc. | |
| 11.625% 05/01/14 (b) | | | 3,165,000 | | | | 3,323,250 | | |
| Smithfield Foods, Inc. | |
| 10.000% 07/15/14 (b) | | | 3,525,000 | | | | 3,595,500 | | |
| Tyson Foods, Inc. | |
| 10.500% 03/01/14 | | | 4,000,000 | | | | 4,460,000 | | |
| | | | 11,378,750 | | |
| Food-Miscellaneous/Diversified – 0.6% | |
| Del Monte Corp. | |
| 6.750% 02/15/15 | | | 3,315,000 | | | | 3,215,550 | | |
| | | | 3,215,550 | | |
| Retail-Hypermarkets – 0.7% | |
| New Albertsons, Inc. | |
| 8.000% 05/01/31 | | | 4,955,000 | | | | 4,298,463 | | |
| | | | 4,298,463 | | |
| Food Total | | | 18,892,763 | | |
| Healthcare Products – 0.5% | |
| Medical Products – 0.5% | |
| Biomet, Inc. | |
PIK,
10.375% 10/15/17 | | | 2,630,000 | | | | 2,741,775 | | |
| | | | 2,741,775 | | |
| Healthcare Products Total | | | 2,741,775 | | |
| Healthcare Services – 4.5% | |
| Medical-HMO – 0.6% | |
| Coventry Health Care, Inc. | |
| 5.875% 01/15/12 | | | 955,000 | | | | 954,671 | | |
| Health Net, Inc. | |
| 6.375% 06/01/17 | | | 2,895,000 | | | | 2,504,175 | | |
| | | | 3,458,846 | | |
| Medical-Hospitals – 3.3% | |
| Community Health Systems, Inc. | |
| 8.875% 07/15/15 | | | 2,240,000 | | | | 2,248,400 | | |
| | | Par ($)(a) | | Value ($) | |
| HCA, Inc. | |
| 9.250% 11/15/16 | | | 3,850,000 | | | | 3,898,125 | | |
PIK,
9.625% 11/15/16 | | | 13,022,000 | | | | 13,152,220 | | |
| | | | 19,298,745 | | |
| Physician Practice Management – 0.6% | |
| U.S. Oncology, Inc. | |
| 9.125% 08/15/17 (b) | | | 3,455,000 | | | | 3,593,200 | | |
| | | | 3,593,200 | | |
| Healthcare Services Total | | | 26,350,791 | | |
| Household Products/Wares – 0.3% | |
| Consumer Products-Miscellaneous – 0.3% | |
| American Greetings Corp. | |
| 7.375% 06/01/16 | | | 1,820,000 | | | | 1,556,100 | | |
| | | | 1,556,100 | | |
| Household Products/Wares Total | | | 1,556,100 | | |
| Pharmaceuticals – 1.8% | |
| Medical-Drugs – 1.1% | |
| Elan Finance PLC | |
4.440% 11/15/11
(11/15/09) (c)(d) | | | 885,000 | | | | 831,900 | | |
| 8.875% 12/01/13 | | | 1,560,000 | | | | 1,505,400 | | |
| Valeant Pharmaceuticals International | |
| 8.375% 06/15/16 (b) | | | 1,890,000 | | | | 1,918,350 | | |
| Warner Chilcott Corp. | |
| 8.750% 02/01/15 | | | 2,025,000 | | | | 2,014,875 | | |
| | | | 6,270,525 | | |
| Pharmacy Services – 0.7% | |
| Omnicare, Inc. | |
| 6.750% 12/15/13 | | | 4,380,000 | | | | 4,139,100 | | |
| | | | 4,139,100 | | |
| Pharmaceuticals Total | | | 10,409,625 | | |
| Consumer Non-Cyclical Total | | | 82,867,213 | | |
| Diversified – 0.6% | |
| Diversified Holding Companies – 0.6% | |
| Diversified Operations – 0.6% | |
| Icahn Enterprises LP/Icahn Enterprises Finance Corp. | |
| 7.125% 02/15/13 | | | 3,630,000 | | | | 3,448,500 | | |
| | | | 3,448,500 | | |
| Diversified Holding Companies Total | | | 3,448,500 | | |
| Diversified Total | | | 3,448,500 | | |
See Accompanying Notes to Financial Statements.
77
Columbia Conservative High Yield Fund
August 31, 2009
| Corporate Fixed-Income Bonds & Notes (continued) | |
| | | Par ($)(a) | | Value ($) | |
| Energy – 12.6% | |
| Coal – 2.0% | |
| Coal – 2.0% | |
| Arch Western Finance LLC | |
| 6.750% 07/01/13 | | | 6,310,000 | | | | 6,026,050 | | |
| Massey Energy Co. | |
| 6.875% 12/15/13 | | | 6,170,000 | | | | 5,799,800 | | |
| | | | 11,825,850 | | |
| Coal Total | | | 11,825,850 | | |
| Oil & Gas – 8.8% | |
| Oil Companies-Exploration & Production – 7.7% | |
| Chesapeake Energy Corp. | |
| 6.375% 06/15/15 | | | 11,700,000 | | | | 10,661,625 | | |
| 9.500% 02/15/15 | | | 595,000 | | | | 606,900 | | |
| Cimarex Energy Co. | |
| 7.125% 05/01/17 | | | 3,890,000 | | | | 3,598,250 | | |
| Connacher Oil & Gas Ltd. | |
| 11.750% 07/15/14 (b) | | | 2,860,000 | | | | 2,902,900 | | |
| Forest Oil Corp. | |
| 8.500% 02/15/14 (b) | | | 6,625,000 | | | | 6,658,125 | | |
| KCS Energy, Inc. | |
| 7.125% 04/01/12 | | | 2,455,000 | | | | 2,418,175 | | |
| Newfield Exploration Co. | |
| 6.625% 09/01/14 | | | 6,095,000 | | | | 5,881,675 | | |
| 6.625% 04/15/16 | | | 995,000 | | | | 950,225 | | |
| OPTI Canada, Inc. | |
| 8.250% 12/15/14 | | | 3,255,000 | | | | 2,115,750 | | |
| Penn Virginia Corp. | |
| 10.375% 06/15/16 | | | 2,100,000 | | | | 2,210,250 | | |
| PetroHawk Energy Corp. | |
| 7.875% 06/01/15 | | | 1,150,000 | | | | 1,115,500 | | |
| Quicksilver Resources, Inc. | |
| 7.125% 04/01/16 | | | 2,765,000 | | | | 2,294,950 | | |
| Range Resources Corp. | |
| 7.500% 05/15/16 | | | 1,765,000 | | | | 1,747,350 | | |
| Southwestern Energy Co. | |
| 7.500% 02/01/18 (b) | | | 2,310,000 | | | | 2,324,437 | | |
| | | | 45,486,112 | | |
| Oil Refining & Marketing – 1.1% | |
| Frontier Oil Corp. | |
| 8.500% 09/15/16 | | | 1,550,000 | | | | 1,573,250 | | |
| Tesoro Corp. | |
| 6.625% 11/01/15 | | | 5,200,000 | | | | 4,654,000 | | |
| | | | 6,227,250 | | |
| Oil & Gas Total | | | 51,713,362 | | |
| | | Par ($)(a) | | Value ($) | |
| Pipelines – 1.8% | |
| Pipelines – 1.8% | |
| El Paso Corp. | |
| 6.875% 06/15/14 | | | 750,000 | | | | 731,623 | | |
| 7.250% 06/01/18 | | | 2,020,000 | | | | 1,913,403 | | |
| Kinder Morgan Finance Co. ULC | |
| 5.700% 01/05/16 | | | 5,030,000 | | | | 4,602,450 | | |
| MarkWest Energy Partners LP | |
| 6.875% 11/01/14 | | | 2,490,000 | | | | 2,278,350 | | |
| 8.500% 07/15/16 | | | 360,000 | | | | 340,200 | | |
| Williams Companies, Inc. | |
| 7.875% 09/01/21 | | | 925,000 | | | | 1,001,621 | | |
| | | | 10,867,647 | | |
| Pipelines Total | | | 10,867,647 | | |
| Energy Total | | | 74,406,859 | | |
| Financials – 4.2% | |
| Banks – 0.2% | |
| Diversified Banking Institutional – 0.2% | |
| Goldman Sachs Capital II | |
| 5.793% 12/29/49 (c) | | | 1,790,000 | | | | 1,288,800 | | |
| | | | 1,288,800 | | |
| Banks Total | | | 1,288,800 | | |
| Diversified Financial Services – 2.8% | |
| Finance-Auto Loans – 0.3% | |
| GMAC, Inc. | |
| 8.000% 11/01/31 (b) | | | 2,305,000 | | | | 1,780,613 | | |
| | | | 1,780,613 | | |
| Finance-Consumer Loans – 0.3% | |
| Sears Roebuck Acceptance Corp. | |
| 7.000% 02/01/11 | | | 1,530,000 | | | | 1,514,700 | | |
| | | | 1,514,700 | | |
| Finance-Credit Card – 0.5% | |
| Discover Financial Services | |
| 10.250% 07/15/19 | | | 2,895,000 | | | | 3,170,755 | | |
| | | | 3,170,755 | | |
| Finance-Investment Banker/Broker – 0.9% | |
| Lazard Group LLC | |
| 7.125% 05/15/15 | | | 5,170,000 | | | | 5,193,456 | | |
| | | | 5,193,456 | | |
| Finance-Leasing Company – 0.5% | |
| International Lease Finance Corp. | |
| 5.625% 09/15/10 | | | 3,200,000 | | | | 3,005,117 | | |
| | | | 3,005,117 | | |
See Accompanying Notes to Financial Statements.
78
Columbia Conservative High Yield Fund
August 31, 2009
| Corporate Fixed-Income Bonds & Notes (continued) | |
| | | Par ($)(a) | | Value ($) | |
| Special Purpose Entity – 0.3% | |
| Reliance Intermediate Holdings LP | |
| 9.500% 12/15/19 (b) | | | 1,965,000 | | | | 1,920,787 | | |
| | | | 1,920,787 | | |
| Diversified Financial Services Total | | | 16,585,428 | | |
| Insurance – 0.9% | |
| Life/Health Insurance – 0.2% | |
| Provident Companies, Inc. | |
| 7.000% 07/15/18 | | | 1,435,000 | | | | 1,269,907 | | |
| | | | 1,269,907 | | |
| Multi-Line Insurance – 0.2% | |
| ING Groep NV | |
| 5.775% 12/29/49 (c) | | | 2,140,000 | | | | 1,187,700 | | |
| | | | 1,187,700 | | |
| Property/Casualty Insurance – 0.5% | |
| Crum & Forster Holdings Corp. | |
| 7.750% 05/01/17 | | | 2,935,000 | | | | 2,656,175 | | |
| | | | 2,656,175 | | |
| Insurance Total | | | 5,113,782 | | |
| Real Estate Investment Trusts (REITs) – 0.3% | |
| REITS-Health Care – 0.3% | |
| Senior Housing Properties Trust | |
| 8.625% 01/15/12 | | | 1,650,000 | | | | 1,650,000 | | |
| | | | 1,650,000 | | |
| Real Estate Investment Trusts (REITs) Total | | | 1,650,000 | | |
| Financials Total | | | 24,638,010 | | |
| Industrials – 12.5% | |
| Aerospace & Defense – 1.9% | |
| Aerospace/Defense-Equipment – 0.7% | |
| BE Aerospace, Inc. | |
| 8.500% 07/01/18 | | | 4,040,000 | | | | 3,979,400 | | |
| | | | 3,979,400 | | |
| Electronics-Military – 1.2% | |
| L-3 Communications Corp. | |
| 5.875% 01/15/15 | | | 3,840,000 | | | | 3,590,400 | | |
| 6.375% 10/15/15 | | | 3,845,000 | | | | 3,623,912 | | |
| | | | 7,214,312 | | |
| Aerospace & Defense Total | | | 11,193,712 | | |
| | | Par ($)(a) | | Value ($) | |
| Building Materials – 1.0% | |
| Building & Construction Products-Miscellaneous – 0.6% | |
| Owens Corning | |
| 6.500% 12/01/16 | | | 3,785,000 | | | | 3,588,275 | | |
| | | | 3,588,275 | | |
| Building Products-Cement/Aggregation – 0.4% | |
| Texas Industries, Inc. | |
| 7.250% 07/15/13 | | | 2,040,000 | | | | 1,907,400 | | |
| 7.250% 07/15/13 | | | 470,000 | | | | 439,450 | | |
| | | | 2,346,850 | | |
| Building Materials Total | | | 5,935,125 | | |
| Electrical Components & Equipment – 0.7% | |
| Wire & Cable Products – 0.7% | |
| Belden, Inc. | |
| 7.000% 03/15/17 | | | 2,360,000 | | | | 2,159,400 | | |
| General Cable Corp. | |
| 7.125% 04/01/17 | | | 2,075,000 | | | | 1,986,812 | | |
| | | | 4,146,212 | | |
| Electrical Components & Equipment Total | | | 4,146,212 | | |
| Electronics – 0.2% | |
| Electronic Components-Miscellaneous – 0.2% | |
| Flextronics International Ltd. | |
| 6.250% 11/15/14 | | | 1,326,000 | | | | 1,219,920 | | |
| | | | 1,219,920 | | |
| Electronics Total | | | 1,219,920 | | |
| Environmental Control – 0.5% | |
| Hazardous Waste Disposal – 0.5% | |
| Clean Harbors, Inc. | |
| 7.625% 08/15/16 (b) | | | 2,945,000 | | | | 2,952,363 | | |
| | | | 2,952,363 | | |
| Environmental Control Total | | | 2,952,363 | | |
| Machinery-Construction & Mining – 0.5% | |
| Machinery-Construction & Mining – 0.5% | |
| Terex Corp. | |
| 8.000% 11/15/17 | | | 3,685,000 | | | | 3,123,038 | | |
| | | | 3,123,038 | | |
| Machinery-Construction & Mining Total | | | 3,123,038 | | |
| Machinery-Diversified – 0.7% | |
| Machinery-General Industry – 0.7% | |
| CPM Holdings, Inc. | |
| 10.625% 09/01/14 (b) | | | 1,425,000 | | | | 1,439,250 | | |
See Accompanying Notes to Financial Statements.
79
Columbia Conservative High Yield Fund
August 31, 2009
| Corporate Fixed-Income Bonds & Notes (continued) | |
| | | Par ($)(a) | | Value ($) | |
| Manitowoc Co., Inc. | |
| 7.125% 11/01/13 | | | 3,445,000 | | | | 2,687,100 | | |
| | | | 4,126,350 | | |
| Machinery-Diversified Total | | | 4,126,350 | | |
| Miscellaneous Manufacturing – 2.2% | |
| Diversified Manufacturing Operators – 1.8% | |
| Bombardier, Inc. | |
| 6.300% 05/01/14 (b) | | | 6,915,000 | | | | 6,396,375 | | |
| Koppers Holdings, Inc. | |
11/15/14 (e)
(9.875% 11/15/09) | | | 1,785,000 | | | | 1,695,750 | | |
| Trinity Industries, Inc. | |
| 6.500% 03/15/14 | | | 2,530,000 | | | | 2,466,750 | | |
| | | | 10,558,875 | | |
| Miscellaneous Manufacturing – 0.4% | |
| American Railcar Industries, Inc. | |
| 7.500% 03/01/14 | | | 2,455,000 | | | | 2,277,012 | | |
| | | | 2,277,012 | | |
| Miscellaneous Manufacturing Total | | | 12,835,887 | | |
| Packaging & Containers – 2.2% | |
| Containers-Metal/Glass – 1.4% | |
| Crown Americas LLC & Crown Americas Capital Corp. | |
| 7.750% 11/15/15 | | | 2,940,000 | | | | 2,910,600 | | |
| Crown Americas LLC & Crown Americas Capital Corp. II | |
| 7.625% 05/15/17 (b) | | | 1,435,000 | | | | 1,424,237 | | |
| Owens-Brockway Glass Container, Inc. | |
| 8.250% 05/15/13 | | | 3,860,000 | | | | 3,898,600 | | |
| | | | 8,233,437 | | |
| Containers-Paper/Plastic – 0.8% | |
| Solo Cup Co. | |
| 10.500% 11/01/13 (b) | | | 2,740,000 | | | | 2,877,000 | | |
| Temple-Inland, Inc. | |
| 6.625% 01/15/16 | | | 1,850,000 | | | | 1,824,119 | | |
| | | | 4,701,119 | | |
| Packaging & Containers Total | | | 12,934,556 | | |
| Transportation – 2.6% | |
| Transportation-Marine – 1.2% | |
| Navios Maritime Holdings, Inc. | |
| 9.500% 12/15/14 | | | 2,545,000 | | | | 2,226,875 | | |
| Ship Finance International Ltd. | |
| 8.500% 12/15/13 | | | 460,000 | | | | 425,500 | | |
| Stena AB | |
| 7.500% 11/01/13 | | | 2,540,000 | | | | 2,286,000 | | |
| | | Par ($)(a) | | Value ($) | |
| Teekay Corp. | |
| 8.875% 07/15/11 | | | 1,836,000 | | | | 1,826,820 | | |
| | | | 6,765,195 | | |
| Transportation-Railroad – 0.8% | |
| Kansas City Southern de Mexico SA de CV | |
| 7.375% 06/01/14 | | | 3,000,000 | | | | 2,655,000 | | |
| RailAmerica, Inc. | |
| 9.250% 07/01/17 (b) | | | 2,155,000 | | | | 2,227,731 | | |
| | | | 4,882,731 | | |
| Transportation-Services – 0.6% | |
| Bristow Group, Inc. | |
| 7.500% 09/15/17 | | | 3,720,000 | | | | 3,515,400 | | |
| | | | 3,515,400 | | |
| Transportation Total | | | 15,163,326 | | |
| Industrials Total | | | 73,630,489 | | |
| Technology – 0.3% | |
| Computers – 0.3% | |
| Computers-Memory Devices – 0.3% | |
| Seagate Technology International | |
| 10.000% 05/01/14 (b) | | | 1,765,000 | | | | 1,892,963 | | |
| | | | 1,892,963 | | |
| Computers Total | | | 1,892,963 | | |
| Technology Total | | | 1,892,963 | | |
| Utilities – 8.4% | |
| Electric – 7.7% | |
| Electric-Generation – 2.7% | |
| AES Corp. | |
| 7.750% 03/01/14 | | | 3,805,000 | | | | 3,705,119 | | |
| 8.000% 10/15/17 | | | 5,450,000 | | | | 5,218,375 | | |
| Edison Mission Energy | |
| 7.000% 05/15/17 | | | 800,000 | | | | 611,000 | | |
| Intergen NV | |
| 9.000% 06/30/17 (b) | | | 6,255,000 | | | | 6,145,537 | | |
| | | | 15,680,031 | | |
| Electric-Integrated – 2.3% | |
| Calpine Construction Finance Co. LP & CCFC Finance Corp. | |
| 8.000% 06/01/16 (b) | | | 3,205,000 | | | | 3,188,975 | | |
| CMS Energy Corp. | |
| 6.875% 12/15/15 | | | 2,855,000 | | | | 2,795,685 | | |
| Ipalco Enterprises, Inc. | |
| 7.250% 04/01/16 (b) | | | 2,315,000 | | | | 2,245,550 | | |
See Accompanying Notes to Financial Statements.
80
Columbia Conservative High Yield Fund
August 31, 2009
| Corporate Fixed-Income Bonds & Notes (continued) | |
| | | Par ($)(a) | | Value ($) | |
| TXU Energy Co. LLC (Term Loan) | |
3.776% 10/10/14
(09/09/09) (d)(f) | | | 2,925,000 | | | | 2,223,000 | | |
3.785% 10/10/14
(09/01/09) (d)(f) | | | 52,500 | | | | 39,900 | | |
PIK,
3.776% 10/10/14
(09/09/09) (d)(f) | | | 3,900,000 | | | | 2,964,000 | | |
| | | | 13,457,110 | | |
| Independent Power Producer – 2.7% | |
| Dynegy Holdings, Inc. | |
| 7.125% 05/15/18 | | | 1,810,000 | | | | 1,203,650 | | |
| Mirant North America LLC | |
| 7.375% 12/31/13 | | | 4,425,000 | | | | 4,248,000 | | |
| NRG Energy, Inc. | |
| 7.375% 02/01/16 | | | 7,595,000 | | | | 7,262,719 | | |
| NSG Holdings LLC/NSG Holdings, Inc. | |
| 7.750% 12/15/25 (b) | | | 3,975,000 | | | | 3,319,125 | | |
| | | | 16,033,494 | | |
| Electric Total | | | 45,170,635 | | |
| Gas – 0.7% | |
| Gas-Distribution – 0.7% | |
| Centerpoint Energy, Inc. | |
| 5.950% 02/01/17 | | | 3,185,000 | | | | 3,046,831 | | |
| 6.500% 05/01/18 | | | 1,040,000 | | | | 1,022,967 | | |
| | | | 4,069,798 | | |
| Gas Total | | | 4,069,798 | | |
| Utilities Total | | | 49,240,433 | | |
Total Corporate Fixed-Income Bonds & Notes
(cost of $561,705,388) | | | 568,707,443 | | |
| Short-Term Obligation – 2.3% | |
Repurchase agreement with
Fixed Income Clearing Corp.,
dated 08/31/09, due 09/01/09
at 0.140%, collateralized by a
U.S. Government Agency
obligation maturing 02/25/11,
market value $13,994,175
(repurchase proceeds $13,715,053) | | | 13,715,000 | | | | 13,715,000 | | |
Total Short-Term Obligation
(cost of $13,715,000) | | | 13,715,000 | | |
Total Investments – 98.9%
(cost of $575,420,388) (g) | | | 582,422,443 | | |
| Other Assets & Liabilities, Net – 1.1% | | | 6,590,113 | | |
| Net Assets – 100.0% | | | 589,012,556 | | |
Notes to Investment Portfolio:
(a) Principal amount is stated in United States dollars unless otherwise noted.
(b) Security exempt from registration pursuant to Rule 144A under the Securities Act of 1933. These securities may be resold in transactions exempt from registration, normally to qualified institutional buyers. At August 31, 2009, these securities, which are not illiquid, except for the following, amounted to $137,938,594, which represents 23.4% of net assets.
| Security | | Acquisition
Dates | | Par | | Cost | | Value | |
Seminole Indian
Tribe of Florida
7.804% 10/01/20 | | 09/26/07-
10/04/07 | |
$4,105,000 | |
$4,167,863 | |
$3,522,542 | |
(c) The interest rate shown on floating rate or variable rate securities reflects the rate at August 31, 2009.
(d) Parenthetical date represents the next reset date for the security.
(e) Step bond. This security is currently not paying coupon. Shown parenthetically is the next interest rate to be paid and the date the Fund will begin accruing at this rate.
(f) Loan participation agreement.
(g) Cost for federal income tax purposes is $577,244,245.
Significant observable inputs (level 2 measurements), including quoted prices for similar securities, interest rates, prepayment speeds and others, were used in determining value for all securities in the Fund's portfolio as of August 31, 2009.
For more information on valuation inputs, please refer to the Security Valuation section in the accompanying Notes to Financial Statements.
At August 31, 2009, the asset allocation of the fund is as follows:
| Assets Allocation (Unaudited) | | % of
Net Assets | |
| Communications | | | 20.9 | | |
| Consumer Non-Cyclical | | | 14.1 | | |
| Energy | | | 12.6 | | |
| Industrials | | | 12.5 | | |
| Basic Materials | | | 12.3 | | |
| Consumer Cyclical | | | 10.7 | | |
| Utilities | | | 8.4 | | |
| Financials | | | 4.2 | | |
| Diversified | | | 0.6 | | |
| Technology | | | 0.3 | | |
| | | | 96.6 | | |
| Short-Term Obligation | | | 2.3 | | |
| Other Assets & Liabilities, Net | | | 1.1 | | |
| | | | 100.0 | | |
Forward foreign currency exchange contracts outstanding on August 31, 2009:
Risk Exposure Type – Foreign Exchange Rate Risk
Forward
Foreign
Currency
Exchange
Contracts
to Sell | | Value | | Aggregate
Face Value | | Settlement
Date | | Unrealized
Depreciation | |
| EUR | | | | $ | 1,419,286 | | | $ | 1,407,097 | | | 09/16/09 | | $ | (12,189 | ) | |
| EUR | | | | | 2,143,268 | | | | 2,116,202 | | | 09/17/09 | | | (27,066 | ) | |
| | | | | $ | (39,255 | ) | |
| Acronym | | Name | |
| EUR | | Euro | |
|
| PIK | | Payment-In-Kind | |
|
See Accompanying Notes to Financial Statements.
81
Statements of Assets and Liabilities – Columbia Funds
August 31, 2009
| | | ($) | | ($) | | ($) | | ($) | |
| | |
Columbia
International
Stock Fund | | Columbia
Mid Cap
Growth Fund | | Columbia
Small Cap
Growth Fund I | | Columbia
Technology Fund | |
| Assets | |
| Unaffiliated investments, at identified cost | | | 532,378,053 | | | | 879,612,565 | | | | 507,396,720 | | | | 221,571,349 | | |
| Affiliated investments, at identified cost | | | — | | | | — | | | | — | | | | — | | |
| Total investments, at identified cost | | | 532,378,053 | | | | 879,612,565 | | | | 507,396,720 | | | | 221,571,349 | | |
| Unaffiliated investments, at value | | | 569,748,290 | | | | 1,051,634,209 | | | | 596,253,169 | | | | 267,753,139 | | |
| Affiliated investments, at value | | | — | | | | — | | | | — | | | | — | | |
| Total investments, at value | | | 569,748,290 | | | | 1,051,634,209 | | | | 596,253,169 | | | | 267,753,139 | | |
| Cash | | | 853 | | | | 35 | | | | 718 | | | | — | | |
Foreign currency (cost of $220,465, $—, $—, $—, $—, $— and
$—, respectively) | | | 220,452 | | | | — | | | | — | | | | — | | |
| Unrealized appreciation on forward foreign currency exchange contracts | | | 2,677,427 | | | | — | | | | — | | | | — | | |
| Receivable for: | |
| Investments sold | | | 2,962,310 | | | | 8,328,994 | | | | 9,591,891 | | | | 9,865,307 | | |
| Fund shares sold | | | 119,557 | | | | 816,613 | | | | 1,169,449 | | | | 376,311 | | |
| Dividends | | | 1,324,437 | | | | 1,207,153 | | | | 101,698 | | | | 283,900 | | |
| Interest | | | 17 | | | | 16 | | | | 85 | | | | — | | |
| Futures variation margin | | | — | | | | — | | | | — | | | | — | | |
| Foreign tax reclaims | | | 1,378,120 | | | | — | | | | — | | | | — | | |
| Expense reimbursement due from investment advisor | | | — | | | | — | | | | 49,880 | | | | — | | |
| Trustees' deferred compensation plan | | | 87,357 | | | | 56,053 | | | | 19,062 | | | | 15,670 | | |
| Prepaid expenses | | | 7,843 | | | | 12,691 | | | | 4,058 | | | | 3,513 | | |
| Total Assets | | | 578,526,663 | | | | 1,062,055,764 | | | | 607,190,010 | | | | 278,297,840 | | |
| Liabilities | |
| Payable to custodian bank | | | — | | | | — | | | | — | | | | 164,359 | | |
Written options, at value (premium of $75,067, $—, $—, $—, $—,
$— and $—, respectively) | | | 41,310 | | | | — | | | | — | | | | — | | |
| Unrealized depreciation on forward foreign currency exchange contracts | | | 1,171,957 | | | | — | | | | — | | | | — | | |
| Expense reimbursement due to investment advisor | | | 24,234 | | | | — | | | | — | | | | — | | |
| Payable for: | |
| Investments purchased | | | 5,704,735 | | | | 7,830,529 | | | | 14,917,773 | | | | 9,471,436 | | |
| Investments purchased on a delayed delivery basis | | | — | | | | — | | | | — | | | | — | | |
| Fund shares repurchased | | | 748,188 | | | | 1,290,334 | | | | 739,772 | | | | 614,779 | | |
| Distributions | | | — | | | | — | | | | — | | | | — | | |
| Investment advisory fee | | | 416,654 | | | | 700,973 | | | | 424,189 | | | | 196,970 | | |
| Pricing and bookkeeping fees | | | 13,838 | | | | 13,412 | | | | 10,572 | | | | 7,470 | | |
| Transfer agent fee | | | 97,399 | | | | 158,115 | | | | 125,326 | | | | 102,850 | | |
| Trustees' fees | | | 155 | | | | 30,545 | | | | 43 | | | | 1,812 | | |
| Audit fee | | | 44,250 | | | | 43,575 | | | | 39,575 | | | | 27,273 | | |
| Custody fee | | | 41,000 | | | | 5,654 | | | | 4,571 | | | | 1,889 | | |
| Distribution and service fees | | | 47,256 | | | | 32,844 | | | | 22,240 | | | | 43,062 | | |
| Chief compliance officer expenses | | | 123 | | | | 148 | | | | 120 | | | | 106 | | |
| Interest payable | | | 100 | | | | — | | | | — | | | | — | | |
| Trustees' deferred compensation plan | | | 87,357 | | | | 56,053 | | | | 19,062 | | | | 15,670 | | |
| Other liabilities | | | 73,229 | | | | 76,427 | | | | 53,474 | | | | 25,036 | | |
| Total Liabilities | | | 8,511,785 | | | | 10,238,609 | | | | 16,356,717 | | | | 10,672,712 | | |
| Net Assets | | | 570,014,878 | | | | 1,051,817,155 | | | | 590,833,293 | | | | 267,625,128 | | |
| Net Assets Consist of | |
| Paid-in capital | | | 800,036,177 | | | | 1,211,632,062 | | | | 633,336,868 | | | | 388,229,762 | | |
| Undistributed (overdistributed) net investment income | | | 8,468,703 | | | | 347,574 | | | | — | | | | — | | |
| Accumulated net investment loss | | | — | | | | — | | | | (251,701 | ) | | | (22,060 | ) | |
| Accumulated net realized loss | | | (277,443,183 | ) | | | (332,184,125 | ) | | | (131,108,323 | ) | | | (166,764,364 | ) | |
| Net unrealized appreciation (depreciation) on: | |
| Investments | | | 37,370,237 | | | | 172,021,644 | | | | 88,856,449 | | | | 46,181,790 | | |
| Foreign currency translations | | | 1,549,187 | | | | — | | | | — | | | | — | | |
| Futures contracts | | | — | | | | — | | | | — | | | | — | | |
| Written options | | | 33,757 | | | | — | | | | — | | | | — | | |
| Net Assets | | | 570,014,878 | | | | 1,051,817,155 | | | | 590,833,293 | | | | 267,625,128 | | |
See Accompanying Notes to Financial Statements.
82
| | | ($) | | ($) | | ($) | |
| | | Columbia
Balanced Fund | | Columbia
Oregon Intermediate
Municipal
Bond Fund | | Columbia
Conservative
High Yield Fund | |
| Assets | |
| Unaffiliated investments, at identified cost | | | 213,087,559 | | | | 416,148,534 | | | | 575,420,388 | | |
| Affiliated investments, at identified cost | | | 249,781 | | | | 8,970,586 | | | | — | | |
| Total investments, at identified cost | | | 213,337,340 | | | | 425,119,120 | | | | 575,420,388 | | |
| Unaffiliated investments, at value | | | 234,385,278 | | | | 429,332,337 | | | | 582,422,443 | | |
| Affiliated investments, at value | | | 260,505 | | | | 8,970,586 | | | | — | | |
| Total investments, at value | | | 234,645,783 | | | | 438,302,923 | | | | 582,422,443 | | |
| Cash | | | 905 | | | | 689 | | | | 68 | | |
Foreign currency (cost of $220,465, $—, $—, $—, $—, $— and
$—, respectively) | | | — | | | | — | | | | — | | |
| Unrealized appreciation on forward foreign currency exchange contracts | | | — | | | | — | | | | — | | |
| Receivable for: | |
| Investments sold | | | 1,271,635 | | | | 871,445 | | | | 7,075,766 | | |
| Fund shares sold | | | 2,147,363 | | | | 682,725 | | | | 645,651 | | |
| Dividends | | | 217,885 | | | | — | | | | — | | |
| Interest | | | 632,054 | | | | 4,907,170 | | | | 11,346,822 | | |
| Futures variation margin | | | 6,000 | | | | — | | | | — | | |
| Foreign tax reclaims | | | 1,021 | | | | — | | | | — | | |
| Expense reimbursement due from investment advisor | | | — | | | | 65,913 | | | | — | | |
| Trustees' deferred compensation plan | | | 19,176 | | | | 23,810 | | | | 50,342 | | |
| Prepaid expenses | | | 1,981 | | | | 4,090 | | | | 5,494 | | |
| Total Assets | | | 238,943,803 | | | | 444,858,765 | | | | 601,546,586 | | |
| Liabilities | |
| Payable to custodian bank | | | — | | | | — | | | | — | | |
Written options, at value (premium of $75,067, $—, $—, $—, $—,
$— and $—, respectively) | | | — | | | | — | | | | — | | |
| Unrealized depreciation on forward foreign currency exchange contracts | | | — | | | | — | | | | 39,255 | | |
| Expense reimbursement due to investment advisor | | | — | | | | — | | | | — | | |
| Payable for: | |
| Investments purchased | | | 2,973,405 | | | | — | | | | 8,642,051 | | |
| Investments purchased on a delayed delivery basis | | | 5,283,827 | | | | — | | | | — | | |
| Fund shares repurchased | | | 528,115 | | | | 377,618 | | | | 1,454,334 | | |
| Distributions | | | — | | | | 374,563 | | | | 1,789,789 | | |
| Investment advisory fee | | | 92,387 | | | | 186,681 | | | | 304,641 | | |
| Pricing and bookkeeping fees | | | 9,225 | | | | 16,116 | | | | 12,616 | | |
| Transfer agent fee | | | 39,542 | | | | 54,729 | | | | 93,033 | | |
| Trustees' fees | | | 1,383 | | | | 183 | | | | 7 | | |
| Audit fee | | | 43,603 | | | | 41,700 | | | | 42,550 | | |
| Custody fee | | | 2,557 | | | | 2,999 | | | | 2,967 | | |
| Distribution and service fees | | | 18,276 | | | | 9,771 | | | | 70,899 | | |
| Chief compliance officer expenses | | | 128 | | | | 127 | | | | 123 | | |
| Interest payable | | | — | | | | — | | | | — | | |
| Trustees' deferred compensation plan | | | 19,176 | | | | 23,810 | | | | 50,342 | | |
| Other liabilities | | | 12,894 | | | | 15,126 | | | | 31,423 | | |
| Total Liabilities | | | 9,024,518 | | | | 1,103,423 | | | | 12,534,030 | | |
| Net Assets | | | 229,919,285 | | | | 443,755,342 | | | | 589,012,556 | | |
| Net Assets Consist of | |
| Paid-in capital | | | 226,640,196 | | | | 430,347,115 | | | | 731,484,965 | | |
| Undistributed (overdistributed) net investment income | | | 713,516 | | | | 458,365 | | | | — | | |
| Accumulated net investment loss | | | — | | | | — | | | | (519,212 | ) | |
| Accumulated net realized loss | | | (18,751,550 | ) | | | (233,941 | ) | | | (148,916,917 | ) | |
| Net unrealized appreciation (depreciation) on: | |
| Investments | | | 21,308,443 | | | | 13,183,803 | | | | 7,002,055 | | |
| Foreign currency translations | | | — | | | | — | | | | (38,335 | ) | |
| Futures contracts | | | 8,680 | | | | — | | | | — | | |
| Written options | | | — | | | | — | | | | — | | |
| Net Assets | | | 229,919,285 | | | | 443,755,342 | | | | 589,012,556 | | |
See Accompanying Notes to Financial Statements.
83
Statements of Assets and Liabilities (continued) – Columbia Funds
August 31, 2009
| | |
Columbia
International
Stock Fund | | Columbia
Mid Cap
Growth Fund | | Columbia
Small Cap
Growth Fund I | | Columbia
Technology Fund | |
| Class A | |
| Net assets | | $ | 150,742,750 | | | $ | 53,880,907 | | | $ | 54,383,719 | | | $ | 81,320,856 | | |
| Shares outstanding | | | 13,517,658 | | | | 3,064,199 | | | | 2,611,776 | | | | 10,732,786 | | |
| Net asset value per share (a)(b) | | $ | 11.15 | | | $ | 17.58 | | | $ | 20.82 | | | $ | 7.58 | | |
| Maximum sales charge | | | 5.75 | % | | | 5.75 | % | | | 5.75 | % | | | 5.75 | % | |
| Maximum offering price per share (c) | | $ | 11.83 | | | $ | 18.65 | | | $ | 22.09 | | | $ | 8.04 | | |
| Class B | |
| Net assets | | $ | 6,391,760 | | | $ | 8,322,472 | | | $ | 2,619,905 | | | $ | 6,562,206 | | |
| Shares outstanding | | | 596,034 | | | | 501,779 | | | | 128,749 | | | | 903,725 | | |
| Net asset value and offering price per share (a)(b) | | $ | 10.72 | | | $ | 16.59 | | | $ | 20.35 | | | $ | 7.26 | | |
| Class C | |
| Net assets | | $ | 12,614,943 | | | $ | 9,105,936 | | | $ | 10,092,996 | | | $ | 24,409,660 | | |
| Shares outstanding | | | 1,169,879 | | | | 547,500 | | | | 496,091 | | | | 3,355,376 | | |
| Net asset value and offering price per share (a)(b) | | $ | 10.78 | | | $ | 16.63 | | | $ | 20.35 | | | $ | 7.27 | | |
| Class R | |
| Net assets | | | — | | | $ | 3,875,856 | | | | — | | | | — | | |
| Shares outstanding | | | — | | | | 222,492 | | | | — | | | | — | | |
| Net asset value and offering price per share | | | — | | | $ | 17.42 | | | | — | | | | — | | |
| Class T | |
| Net assets | | | — | | | $ | 18,846,973 | | | | — | | | | — | | |
| Shares outstanding | | | — | | | | 1,071,815 | | | | — | | | | — | | |
| Net asset value per share (a) | | | — | | | $ | 17.58 | | | | — | | | | — | | |
| Maximum sales charge | | | — | | | | 5.75 | % | | | — | | | | — | | |
| Maximum offering price per share (c) | | | — | | | $ | 18.65 | | | | — | | | | — | | |
| Class Y (d) | |
| Net assets | | $ | 30,817,905 | | | $ | 3,066,853 | | | $ | 14,222,339 | | | | — | | |
| Shares outstanding | | | 2,727,686 | | | | 170,582 | | | | 677,177 | | | | — | | |
| Net asset value and offering price per share (b) | | $ | 11.30 | | | $ | 17.98 | | | $ | 21.00 | | | | — | | |
| Class Z | |
| Net assets | | $ | 369,447,520 | | | $ | 954,718,158 | | | $ | 509,514,334 | | | $ | 155,332,406 | | |
| Shares outstanding | | | 32,708,634 | | | | 53,095,652 | | | | 24,261,343 | | | | 20,184,227 | | |
| Net asset value and offering price per share (b) | | $ | 11.30 | | | $ | 17.98 | | | $ | 21.00 | | | $ | 7.70 | | |
(a) Redemption price per share is equal to net asset value less any applicable contingent deferred sales charge.
(b) Redemption price per share is equal to net asset value less any applicable redemption fees.
(c) On sales of $50,000 or more the offering price is reduced.
(d) Class Y shares commenced operations on July 15, 2009.
See Accompanying Notes to Financial Statements.
84
| | | Columbia
Balanced Fund | | Columbia
Oregon Intermediate
Municipal
Bond Fund | | Columbia
Conservative
High Yield Fund | |
| Class A | |
| Net assets | | $ | 19,151,790 | | | $ | 15,507,304 | | | $ | 77,819,705 | | |
| Shares outstanding | | | 852,828 | | | | 1,274,324 | | | | 10,966,737 | | |
| Net asset value per share (a)(b) | | $ | 22.46 | | | $ | 12.17 | | | $ | 7.10 | | |
| Maximum sales charge | | | 5.75 | % | | | 3.25 | % | | | 4.75 | % | |
| Maximum offering price per share (c) | | $ | 23.83 | | | $ | 12.58 | | | $ | 7.45 | | |
| Class B | |
| Net assets | | $ | 6,934,001 | | | $ | 641,057 | | | $ | 29,524,787 | | |
| Shares outstanding | | | 309,384 | | | | 52,678 | | | | 4,160,779 | | |
| Net asset value and offering price per share (a)(b) | | $ | 22.41 | | | $ | 12.17 | | | $ | 7.10 | | |
| Class C | |
| Net assets | | $ | 11,014,355 | | | $ | 11,331,518 | | | $ | 29,379,525 | | |
| Shares outstanding | | | 491,311 | | | | 931,160 | | | | 4,140,344 | | |
| Net asset value and offering price per share (a)(b) | | $ | 22.42 | | | $ | 12.17 | | | $ | 7.10 | | |
| Class R | |
| Net assets | | | — | | | | — | | | | — | | |
| Shares outstanding | | | — | | | | — | | | | — | | |
| Net asset value and offering price per share | | | — | | | | — | | | | — | | |
| Class T | |
| Net assets | | | — | | | | — | | | | — | | |
| Shares outstanding | | | — | | | | — | | | | — | | |
| Net asset value per share (a) | | | — | | | | — | | | | — | | |
| Maximum sales charge | | | — | | | | — | | | | — | | |
| Maximum offering price per share (c) | | | — | | | | — | | | | — | | |
| Class Y (d) | |
| Net assets | | | — | | | | — | | | $ | 18,373,074 | | |
| Shares outstanding | | | — | | | | — | | | | 2,589,232 | | |
| Net asset value and offering price per share (b) | | | — | | | | — | | | $ | 7.10 | | |
| Class Z | |
| Net assets | | $ | 192,819,139 | | | $ | 416,275,463 | | | $ | 433,915,465 | | |
| Shares outstanding | | | 8,594,973 | | | | 34,207,137 | | | | 61,149,669 | | |
| Net asset value and offering price per share (b) | | $ | 22.43 | | | $ | 12.17 | | | $ | 7.10 | | |
See Accompanying Notes to Financial Statements.
85
Statements of Operations – Columbia Funds
For the Year Ended August 31, 2009
| | | ($) | | ($) | | ($) | | ($) | |
| | | Columbia
International
Stock Fund(a) | | Columbia
Mid Cap
Growth Fund(a) | | Columbia
Small Cap
Growth Fund I(a) | | Columbia
Technology Fund | |
| Investment Income | |
| Dividends | | | 20,781,414 | | | | 9,664,125 | | | | 1,270,825 | | | | 1,598,107 | | |
| Dividends from affiliates | | | — | | | | — | | | | — | | | | — | | |
| Interest | | | 9,381 | | | | 69,916 | | | | 57,205 | | | | 47,785 | | |
| Interest from affiliates | | | — | | | | — | | | | — | | | | — | | |
| Foreign taxes withheld | | | (1,877,803 | ) | | | (67,249 | ) | | | (4,788 | ) | | | (66,537 | ) | |
| Total Investment Income | | | 18,912,992 | | | | 9,666,792 | | | | 1,323,242 | | | | 1,579,355 | | |
| Expenses | |
| Investment advisory fee | | | 4,361,396 | | | | 7,193,675 | | | | 3,216,309 | | | | 2,084,965 | | |
| Distribution fee: | |
| Class B | | | 50,417 | | | | 66,028 | | | | 16,228 | | | | 46,683 | | |
| Class C | | | 86,383 | | | | 61,884 | | | | 57,126 | | | | 177,969 | | |
| Class R | | | — | | | | 9,280 | | | | — | | | | — | | |
| Service fee: | |
| Class A | | | 334,086 | | | | 113,283 | | | | 99,304 | | | | 195,193 | | |
| Class B | | | 16,802 | | | | 22,009 | | | | 5,409 | | | | 15,601 | | |
| Class C | | | 28,794 | | | | 20,628 | | | | 19,042 | | | | 59,410 | | |
| Shareholder services fee—Class T | | | — | | | | 50,991 | | | | — | | | | — | | |
| Pricing and bookkeeping fees | | | 122,775 | | | | 145,117 | | | | 97,227 | | | | 77,395 | | |
| Transfer agent fee: | |
| Class A, Class B, Class C, Class Z | | | 912,210 | | | | — | | | | 533,538 | | | | 583,249 | | |
| Class A, Class B, Class C, Class R, Class T, Class Z | | | — | | | | 1,272,967 | | | | — | | | | — | | |
| Class Y | | | 6 | | | | 6 | | | | 5 | | | | — | | |
| Trustees' fees | | | 42,140 | | | | 41,475 | | | | 25,947 | | | | 23,133 | | |
| Custody fee | | | 241,805 | | | | 37,017 | | | | 28,183 | | | | 12,477 | | |
| Chief compliance officer expenses | | | 748 | | | | 902 | | | | 705 | | | | 586 | | |
| Other expenses | | | 434,086 | | | | 512,595 | | | | 338,029 | | | | 273,718 | | |
| Expenses before interest expense | | | 6,631,648 | | | | 9,547,857 | | | | 4,437,052 | | | | 3,550,379 | | |
| Interest expense | | | 3,282 | | | | — | | | | — | | | | — | | |
| Total Expenses | | | 6,634,930 | | | | 9,547,857 | | | | 4,437,052 | | | | 3,550,379 | | |
| Fees waived by transfer agent | | | (211,614 | ) | | | — | | | | — | | | | — | | |
| Fees waived or expenses reimbursed by investment advisor | | | (83,891 | ) | | | — | | | | (109,017 | ) | | | (169,244 | ) | |
| Fees waived by distributor—Class C | | | — | | | | — | | | | — | | | | — | | |
| Expense reductions | | | — | * | | | (160 | ) | | | (1,139 | ) | | | (348 | ) | |
| Net Expenses | | | 6,339,425 | | | | 9,547,697 | | | | 4,326,896 | | | | 3,380,787 | | |
| Net Investment Income (Loss) | | | 12,573,567 | | | | 119,095 | | | | (3,003,654 | ) | | | (1,801,432 | ) | |
(a) Class Y shares commenced operation on July 15, 2009.
* Rounds to less than $1.00.
See Accompanying Notes to Financial Statements.
86
| | | ($) | | ($) | | ($) | |
| | | Columbia
Balanced Fund | | Columbia
Oregon
Intermediate
Municipal
Bond Fund | | Columbia
Conservative
High Yield Fund(a) | |
| Investment Income | |
| Dividends | | | 2,188,239 | | | | 53,294 | | | | — | | |
| Dividends from affiliates | | | — | | | | 35,973 | | | | — | | |
| Interest | | | 3,840,522 | | | | 18,370,698 | | | | 42,754,605 | | |
| Interest from affiliates | | | 15,125 | | | | — | | | | — | | |
| Foreign taxes withheld | | | (3,254 | ) | | | — | | | | — | | |
| Total Investment Income | | | 6,040,632 | | | | 18,459,965 | | | | 42,754,605 | | |
| Expenses | |
| Investment advisory fee | | | 884,961 | | | | 2,043,052 | | | | 2,918,130 | | |
| Distribution fee: | |
| Class B | | | 46,858 | | | | 4,457 | | | | 220,870 | | |
| Class C | | | 45,017 | | | | 67,266 | | | | 164,122 | | |
| Class R | | | — | | | | — | | | | — | | |
| Service fee: | |
| Class A | | | 28,651 | | | | 30,442 | | | | 154,799 | | |
| Class B | | | 15,620 | | | | 1,486 | | | | 73,623 | | |
| Class C | | | 15,006 | | | | 22,422 | | | | 54,631 | | |
| Shareholder services fee—Class T | | | — | | | | — | | | | — | | |
| Pricing and bookkeeping fees | | | 80,304 | | | | 128,479 | | | | 122,442 | | |
| Transfer agent fee: | |
| Class A, Class B, Class C, Class Z | | | 227,539 | | | | 193,107 | | | | 691,922 | | |
| Class A, Class B, Class C, Class R, Class T, Class Z | | | — | | | | — | | | | — | | |
| Class Y | | | — | | | | — | | | | — | | |
| Trustees' fees | | | 17,859 | | | | 29,089 | | | | 21,243 | | |
| Custody fee | | | 18,778 | | | | 16,457 | | | | 17,188 | | |
| Chief compliance officer expenses | | | 638 | | | | 731 | | | | 731 | | |
| Other expenses | | | 177,638 | | | | 197,928 | | | | 210,430 | | |
| Expenses before interest expense | | | 1,558,869 | | | | 2,734,916 | | | | 4,650,131 | | |
| Interest expense | | | — | | | | — | | | | 41 | | |
| Total Expenses | | | 1,558,869 | | | | 2,734,916 | | | | 4,650,172 | | |
| Fees waived by transfer agent | | | — | | | | — | | | | — | | |
| Fees waived or expenses reimbursed by investment advisor | | | — | | | | (564,350 | ) | | | — | | |
| Fees waived by distributor—Class C | | | — | | | | (31,391 | ) | | | (32,778 | ) | |
| Expense reductions | | | (7 | ) | | | (2,264 | ) | | | (134 | ) | |
| Net Expenses | | | 1,558,862 | | | | 2,136,911 | | | | 4,617,260 | | |
| Net Investment Income (Loss) | | | 4,481,770 | | | | 16,323,054 | | | | 38,137,345 | | |
See Accompanying Notes to Financial Statements.
87
Statements of Operations (continued) – Columbia Funds
For the Year Ended August 31, 2009
| | | ($) | | ($) | | ($) | | ($) | |
| | | Columbia
International
Stock Fund | | Columbia
Mid Cap
Growth Fund | | Columbia
Small Cap
Growth Fund I | | Columbia
Technology Fund | |
Net Realized and Unrealized Gain (Loss) on Investments,
Foreign Currency, Futures Contracts, Written Options
and Credit Default Swap Contracts | |
| Net realized gain (loss) on: | |
| Investments | | | (238,374,677 | ) | | | (323,366,092 | ) | | | (118,706,282 | ) | | | (120,369,300 | ) | |
Foreign currency transactions and forward
foreign currency exchange contracts | | | (14,362,028 | ) | | | (3,571 | ) | | | — | | | | 606 | | |
| Futures contracts | | | 312,044 | | | | — | | | | — | | | | — | | |
| Written options | | | 721,003 | | | | 250,550 | | | | — | | | | — | | |
| Credit default swap contracts | | | — | | | | — | | | | — | | | | — | | |
| Net realized gain (loss) | | | (251,703,658 | ) | | | (323,119,113 | ) | | | (118,706,282 | ) | | | (120,368,694 | ) | |
| Net change in unrealized appreciation (depreciation) on: | |
| Investments | | | 40,238,614 | | | | (2,756,022 | ) | | | 43,575,198 | | | | 24,800,916 | | |
Foreign currency translations and forward
foreign currency exchange contracts | | | 6,546,806 | | | | 459 | | | | — | | | | 230 | | |
| Futures contracts | | | — | | | | — | | | | — | | | | — | | |
| Written options | | | (103,334 | ) | | | (20,300 | ) | | | — | | | | — | | |
| Net change in unrealized appreciation (depreciation) | | | 46,682,086 | | | | (2,775,863 | ) | | | 43,575,198 | | | | 24,801,146 | | |
| Net Gain (Loss) | | | (205,021,572 | ) | | | (325,894,976 | ) | | | (75,131,084 | ) | | | (95,567,548 | ) | |
| Net Increase (Decrease) Resulting from Operations | | | (192,448,005 | ) | | | (325,775,881 | ) | | | (78,134,738 | ) | | | (97,368,980 | ) | |
See Accompanying Notes to Financial Statements.
88
| | | ($) | | ($) | | ($) | |
| | | Columbia
Balanced Fund | | Columbia
Oregon
Intermediate
Municipal
Bond Fund | | Columbia
Conservative
High Yield Fund | |
Net Realized and Unrealized Gain (Loss) on Investments,
Foreign Currency, Futures Contracts, Written Options
and Credit Default Swap Contracts | |
| Net realized gain (loss) on: | |
| Investments | | | (17,486,926 | ) | | | (245,683 | ) | | | (75,944,512 | ) | |
Foreign currency transactions and forward
foreign currency exchange contracts | | | (187 | ) | | | — | | | | 99,978 | | |
| Futures contracts | | | (176,021 | ) | | | 176,711 | | | | — | | |
| Written options | | | — | | | | — | | | | — | | |
| Credit default swap contracts | | | — | | | | — | | | | (177,056 | ) | |
| Net realized gain (loss) | | | (17,663,134 | ) | | | (68,972 | ) | | | (76,021,590 | ) | |
| Net change in unrealized appreciation (depreciation) on: | |
| Investments | | | 6,355,029 | | | | 3,804,182 | | | | 43,418,393 | | |
Foreign currency translations and forward
foreign currency exchange contracts | | | — | | | | — | | | | (32,831 | ) | |
| Futures contracts | | | 7,980 | | | | — | | | | — | | |
| Written options | | | — | | | | — | | | | — | | |
| Net change in unrealized appreciation (depreciation) | | | 6,363,009 | | | | 3,804,182 | | | | 43,385,562 | | |
| Net Gain (Loss) | | | (11,300,125 | ) | | | 3,735,210 | | | | (32,636,028 | ) | |
| Net Increase (Decrease) Resulting from Operations | | | (6,818,355 | ) | | | 20,058,264 | | | | 5,501,317 | | |
See Accompanying Notes to Financial Statements.
89
Statements of Changes in Net Assets – Columbia Funds
| Increase (Decrease) in Net Assets | | Columbia
International Stock Fund | | Columbia
Mid Cap Growth Fund | |
| | | Year Ended August 31, | | Year Ended August 31, | |
| | | 2009 ($) | | 2008 ($) | | 2009 ($) | | 2008 ($) | |
| Operations | |
| Net investment income (loss) | | | 12,573,567 | | | | 26,230,017 | | | | 119,095 | | | | (4,034,375 | ) | |
Net realized gain (loss) on investments, foreign currency transactions,
forward foreign currency exchange contracts, futures contracts and
written options | | | (251,703,658 | ) | | | 41,658,043 | | | | (323,119,113 | ) | | | 73,654,134 | | |
Net change in unrealized appreciation (depreciation) on investments,
foreign currency translations, forward foreign currency exchange contracts,
futures contracts and written options | | | 46,682,086 | | | | (271,209,838 | ) | | | (2,775,863 | ) | | | (86,939,898 | ) | |
| Net decrease resulting from operations | | | (192,448,005 | ) | | | (203,321,778 | ) | | | (325,775,881 | ) | | | (17,320,139 | ) | |
| Distributions to Shareholders | |
| From net investment income: | |
| Class A | | | — | | | | (9,432,860 | ) | | | — | | | | — | | |
| Class B | | | — | | | | (671,765 | ) | | | — | | | | — | | |
| Class C | | | — | | | | (704,627 | ) | | | — | | | | — | | |
| Class Z | | | — | | | | (34,647,077 | ) | | | — | | | | — | | |
| From net realized gains: | |
| Class A | | | (6,159,742 | ) | | | (32,176,830 | ) | | | (1,358,266 | ) | | | (7,449,915 | ) | |
| Class B | | | (334,111 | ) | | | (2,998,328 | ) | | | (314,199 | ) | | | (2,671,575 | ) | |
| Class C | | | (536,917 | ) | | | (3,138,414 | ) | | | (263,576 | ) | | | (1,418,104 | ) | |
| Class R | | | — | | | | — | | | | (39,054 | ) | | | (125,444 | ) | |
| Class T | | | — | | | | — | | | | (545,428 | ) | | | (4,023,387 | ) | |
| Class Z | | | (15,741,630 | ) | | | (109,632,234 | ) | | | (25,919,329 | ) | | | (198,592,083 | ) | |
| Total distributions to shareholders | | | (22,772,400 | ) | | | (193,402,135 | ) | | | (28,439,852 | ) | | | (214,280,508 | ) | |
| Net Capital Stock Transactions | | | (110,942,583 | ) | | | (81,735,879 | ) | | | (2,385,092 | ) | | | 79,545,772 | | |
| Redemption Fees | | | 8,875 | | | | 32,159 | | | | — | | | | — | | |
| Increase from regulatory settlements | | | 7,166,056 | | | | — | | | | 253,476 | | | | — | | |
| Total increase (decrease) in net assets | | | (318,988,057 | ) | | | (478,427,633 | ) | | | (356,347,349 | ) | | | (152,054,875 | ) | |
| Net Assets | |
| Beginning of period | | | 889,002,935 | | | | 1,367,430,568 | | | | 1,408,164,504 | | | | 1,560,219,379 | | |
| End of period | | | 570,014,878 | | | | 889,002,935 | | | | 1,051,817,155 | | | | 1,408,164,504 | | |
| Undistributed (Overdistributed) net investment income, at end of period | | | 8,468,703 | | | | 2,368,803 | | | | 347,574 | | | | (63,002 | ) | |
| Accumulated net investment loss, at end of period | | | — | | | | — | | | | — | | | | — | | |
See Accompanying Notes to Financial Statements.
90
| Increase (Decrease) in Net Assets | | Columbia
Small Cap Growth Fund I | | Columbia Technology Fund | |
| | | Year Ended August 31, | | Year Ended August 31, | |
| | | 2009 ($) | | 2008 ($) | | 2009 ($) | | 2008 ($) | |
| Operations | |
| Net investment income (loss) | | | (3,003,654 | ) | | | (1,914,834 | ) | | | (1,801,432 | ) | | | (2,728,745 | ) | |
Net realized gain (loss) on investments, foreign currency transactions,
forward foreign currency exchange contracts, futures contracts and
written options | | | (118,706,282 | ) | | | (4,868,937 | ) | | | (120,368,694 | ) | | | (35,387,716 | ) | |
Net change in unrealized appreciation (depreciation) on investments,
foreign currency translations, forward foreign currency exchange contracts,
futures contracts and written options | | | 43,575,198 | | | | 4,243,839 | | | | 24,801,146 | | | | (26,425,433 | ) | |
| Net decrease resulting from operations | | | (78,134,738 | ) | | | (2,539,932 | ) | | | (97,368,980 | ) | | | (64,541,894 | ) | |
| Distributions to Shareholders | |
| From net investment income: | |
| Class A | | | — | | | | — | | | | — | | | | — | | |
| Class B | | | — | | | | — | | | | — | | | | — | | |
| Class C | | | — | | | | — | | | | — | | | | — | | |
| Class Z | | | — | | | | — | | | | — | | | | — | | |
| From net realized gains: | |
| Class A | | | — | | | | (2,852,442 | ) | | | — | | | | (8,118,379 | ) | |
| Class B | | | — | | | | (179,710 | ) | | | — | | | | (570,106 | ) | |
| Class C | | | — | | | | (349,068 | ) | | | — | | | | (2,475,187 | ) | |
| Class R | | | — | | | | — | | | | — | | | | — | | |
| Class T | | | — | | | | — | | | | — | | | | — | | |
| Class Z | | | — | | | | (28,831,023 | ) | | | — | | | | (10,480,382 | ) | |
| Total distributions to shareholders | | | — | | | | (32,212,243 | ) | | | — | | | | (21,644,054 | ) | |
| Net Capital Stock Transactions | | | 259,444,727 | | | | 201,401,030 | | | | (36,348,719 | ) | | | 193,663,602 | | |
| Redemption Fees | | | — | | | | — | | | | — | | | | — | | |
| Increase from regulatory settlements | | | — | | | | — | | | | — | | | | — | | |
| Total increase (decrease) in net assets | | | 181,309,989 | | | | 166,648,855 | | | | (133,717,699 | ) | | | 107,477,654 | | |
| Net Assets | |
| Beginning of period | | | 409,523,304 | | | | 242,874,449 | | | | 401,342,827 | | | | 293,865,173 | | |
| End of period | | | 590,833,293 | | | | 409,523,304 | | | | 267,625,128 | | | | 401,342,827 | | |
| Undistributed (Overdistributed) net investment income, at end of period | | | — | | | | — | | | | — | | | | — | | |
| Accumulated net investment loss, at end of period | | | (251,701 | ) | | | (33,301 | ) | | | (22,060 | ) | | | (18,676 | ) | |
See Accompanying Notes to Financial Statements.
91
Statements of Changes in Net Assets (continued) – Columbia Funds
| Increase (Decrease) in Net Assets | | Columbia Balanced Fund | | Columbia Oregon Intermediate
Municipal Bond Fund | |
| | | Year Ended August 31, | | Year Ended August 31, | |
| | | 2009 ($) | | 2008 ($) | | 2009 ($) | | 2008 ($) | |
| Operations | |
| Net investment income | | | 4,481,770 | | | | 4,769,381 | | | | 16,323,054 | | | | 15,601,337 | | |
Net realized gain (loss) on investments, foreign currency transactions,
forward foreign currency exchange contracts, futures contracts
and credit default swap contracts | | | (17,663,134 | ) | | | 148,613 | | | | (68,972 | ) | | | 2,710 | | |
Net change in unrealized appreciation (depreciation) on investments,
foreign currency translations, forward foreign currency exchange contracts and
futures contracts | | | 6,363,009 | | | | (4,604,672 | ) | | | 3,804,182 | | | | 1,580,839 | | |
| Net increase (decrease) resulting from operations | | | (6,818,355 | ) | | | 313,322 | | | | 20,058,264 | | | | 17,184,886 | | |
| Distributions to Shareholders | |
| From net investment income: | |
| Class A | | | (280,981 | ) | | | (181,589 | ) | | | (455,891 | ) | | | (244,762 | ) | |
| Class B | | | (115,048 | ) | | | (108,589 | ) | | | (17,932 | ) | | | (21,708 | ) | |
| Class C | | | (98,834 | ) | | | (36,152 | ) | | | (299,764 | ) | | | (165,652 | ) | |
| Class Y | | | — | | | | — | | | | — | | | | — | | |
| Class Z | | | (4,322,287 | ) | | | (4,759,119 | ) | | | (15,530,146 | ) | | | (15,146,964 | ) | |
| From net realized gains: | |
| Class A | | | — | | | | (42,359 | ) | | | — | | | | — | | |
| Class B | | | — | | | | (41,396 | ) | | | — | | | | — | | |
| Class C | | | — | | | | (11,431 | ) | | | — | | | | — | | |
| Class Z | | | — | | | | (1,153,447 | ) | | | — | | | | — | | |
| Total distributions to shareholders | | | (4,817,150 | ) | | | (6,334,082 | ) | | | (16,303,733 | ) | | | (15,579,086 | ) | |
| Net Capital Stock Transactions | | | 43,969,754 | | | | (8,432,031 | ) | | | 40,028,648 | | | | 22,433,776 | | |
| Increase from regulatory settlements | | | — | | | | — | | | | 182,996 | | | | — | | |
| Total increase (decrease) in net assets | | | 32,334,249 | | | | (14,452,791 | ) | | | 43,966,175 | | | | 24,039,576 | | |
| Net Assets | |
| Beginning of period | | | 197,585,036 | | | | 212,037,827 | | | | 399,789,167 | | | | 375,749,591 | | |
| End of period | | | 229,919,285 | | | | 197,585,036 | | | | 443,755,342 | | | | 399,789,167 | | |
| Undistributed (Overdistributed) net investment income, at end of period | | | 713,516 | | | | 887,913 | | | | 458,365 | | | | 119,582 | | |
| Accumulated net investment loss, at end of period | | | — | | | | — | | | | — | | | | — | | |
(a) Class Y shares commenced operations on July 15, 2009.
(b) Class Y shares reflect activity for the period July 15, 2009 through August 31, 2009.
See Accompanying Notes to Financial Statements.
92
| Increase (Decrease) in Net Assets | | Columbia Conservative
High Yield Fund | |
| | | Year Ended August 31, | |
| | | 2009 ($)(a)(b) | | 2008 ($) | |
| Operations | |
| Net investment income | | | 38,137,345 | | | | 44,653,217 | | |
Net realized gain (loss) on investments, foreign currency transactions,
forward foreign currency exchange contracts, futures contracts
and credit default swap contracts | | | (76,021,590 | ) | | | (32,866,454 | ) | |
Net change in unrealized appreciation (depreciation) on investments,
foreign currency translations, forward foreign currency exchange contracts and
futures contracts | | | 43,385,562 | | | | (9,037,506 | ) | |
| Net increase (decrease) resulting from operations | | | 5,501,317 | | | | 2,749,257 | | |
| Distributions to Shareholders | |
| From net investment income: | |
| Class A | | | (4,836,008 | ) | | | (5,617,372 | ) | |
| Class B | | | (2,089,701 | ) | | | (2,594,827 | ) | |
| Class C | | | (1,576,170 | ) | | | (1,633,855 | ) | |
| Class Y | | | (140,707 | ) | | | — | | |
| Class Z | | | (30,149,732 | ) | | | (35,546,349 | ) | |
| From net realized gains: | |
| Class A | | | — | | | | — | | |
| Class B | | | — | | | | — | | |
| Class C | | | — | | | | — | | |
| Class Z | | | — | | | | — | | |
| Total distributions to shareholders | | | (38,792,318 | ) | | | (45,392,403 | ) | |
| Net Capital Stock Transactions | | | 49,489,148 | | | | (186,827,688 | ) | |
| Increase from regulatory settlements | | | 97,269 | | | | — | | |
| Total increase (decrease) in net assets | | | 16,295,416 | | | | (229,470,834 | ) | |
| Net Assets | |
| Beginning of period | | | 572,717,140 | | | | 802,187,974 | | |
| End of period | | | 589,012,556 | | | | 572,717,140 | | |
| Undistributed (Overdistributed) net investment income, at end of period | | | — | | | | — | | |
| Accumulated net investment loss, at end of period | | | (519,212 | ) | | | (1,361,166 | ) | |
See Accompanying Notes to Financial Statements.
93
Statements of Changes in Net Assets – Capital Stock Activity
| | | Columbia International Stock Fund | |
| | | Year Ended
August 31, 2009 (a)(b) | | Year Ended
August 31, 2008 | |
| | | Shares | | Dollars ($) | | Shares | | Dollars ($) | |
| Class A | |
| Subscriptions | | | 516,883 | | | | 4,695,613 | | | | 975,202 | | | | 16,730,687 | | |
| Distributions reinvested | | | 637,490 | | | | 5,520,581 | | | | 2,202,887 | | | | 37,096,606 | | |
| Redemptions | | | (3,223,832 | ) | | | (29,220,643 | ) | | | (2,503,358 | ) | | | (42,265,055 | ) | |
| Net increase (decrease) | | | (2,069,459 | ) | | | (19,004,449 | ) | | | 674,731 | | | | 11,562,238 | | |
| Class B | |
| Subscriptions | | | 53,826 | | | | 477,504 | | | | 70,938 | | | | 1,181,285 | | |
| Distributions reinvested | | | 34,698 | | | | 290,772 | | | | 185,273 | | | | 3,044,038 | | |
| Redemptions | | | (490,621 | ) | | | (4,372,977 | ) | | | (800,526 | ) | | | (13,109,714 | ) | |
| Net decrease | | | (402,097 | ) | | | (3,604,701 | ) | | | (544,315 | ) | | | (8,884,391 | ) | |
| Class C | |
| Subscriptions | | | 60,419 | | | | 547,251 | | | | 95,461 | | | | 1,579,479 | | |
| Distributions reinvested | | | 48,757 | | | | 410,531 | | | | 179,202 | | | | 2,958,629 | | |
| Redemptions | | | (397,869 | ) | | | (3,664,430 | ) | | | (311,754 | ) | | | (5,191,712 | ) | |
| Net increase (decrease) | | | (288,693 | ) | | | (2,706,648 | ) | | | (37,091 | ) | | | (653,604 | ) | |
| Class R | |
| Subscriptions | | | — | | | | — | | | | — | | | | — | | |
| Distributions reinvested | | | — | | | | — | | | | — | | | | — | | |
| Redemptions | | | — | | | | — | | | | — | | | | — | | |
| Net increase | | | — | | | | — | | | | — | | | | — | | |
| Class T | |
| Subscriptions | | | — | | | | — | | | | — | | | | — | | |
| Distributions reinvested | | | — | | | | — | | | | — | | | | — | | |
| Redemptions | | | — | | | | — | | | | — | | | | — | | |
| Net increase (decrease) | | | — | | | | — | | | | — | | | | — | | |
| Class Y | |
| Subscriptions | | | 2,967,379 | | | | 31,160,000 | | | | — | | | | — | | |
| Redemptions | | | (239,693 | ) | | | (2,583,893 | ) | | | — | | | | — | | |
| Net increase | | | 2,727,686 | | | | 28,576,107 | | | | — | | | | — | | |
| Class Z | |
| Subscriptions | | | 5,611,403 | | | | 52,602,683 | | | | 3,255,835 | | | | 56,183,125 | | |
| Distributions reinvested | | | 826,429 | | | | 7,239,240 | | | | 3,044,744 | | | | 51,669,244 | | |
| Redemptions | | | (18,754,823 | ) | | | (174,044,815 | ) | | | (11,607,704 | ) | | | (191,612,491 | ) | |
| Net increase (decrease) | | | (12,316,991 | ) | | | (114,202,892 | ) | | | (5,307,125 | ) | | | (83,760,122 | ) | |
(a) Class Y shares commenced operations on July 15, 2009.
(b) Class Y shares reflect activity for the period July 15, 2009 through August 31, 2009.
See Accompanying Notes to Financial Statements.
94
| | | Columbia Mid Cap Growth Fund | |
| | | Year Ended
August 31, 2009 (a)(b) | | Year Ended
August 31, 2008 | |
| | | Shares | | Dollars ($) | | Shares | | Dollars ($) | |
| Class A | |
| Subscriptions | | | 1,325,611 | | | | 20,942,358 | | | | 1,189,780 | | | | 30,192,118 | | |
| Distributions reinvested | | | 92,517 | | | | 1,247,914 | | | | 263,684 | | | | 6,958,613 | | |
| Redemptions | | | (1,052,807 | ) | | | (15,739,486 | ) | | | (558,061 | ) | | | (13,959,242 | ) | |
| Net increase (decrease) | | | 365,321 | | | | 6,450,786 | | | | 895,403 | | | | 23,191,489 | | |
| Class B | |
| Subscriptions | | | 110,528 | | | | 1,579,437 | | | | 91,800 | | | | 2,208,736 | | |
| Distributions reinvested | | | 22,692 | | | | 290,458 | | | | 97,190 | | | | 2,456,004 | | |
| Redemptions | | | (339,719 | ) | | | (4,808,540 | ) | | | (216,194 | ) | | | (5,193,517 | ) | |
| Net decrease | | | (206,499 | ) | | | (2,938,645 | ) | | | (27,204 | ) | | | (528,777 | ) | |
| Class C | |
| Subscriptions | | | 247,147 | | | | 3,434,668 | | | | 390,973 | | | | 9,599,134 | | |
| Distributions reinvested | | | 16,018 | | | | 205,511 | | | | 44,557 | | | | 1,128,627 | | |
| Redemptions | | | (319,840 | ) | | | (4,881,049 | ) | | | (141,809 | ) | | | (3,297,549 | ) | |
| Net increase (decrease) | | | (56,675 | ) | | | (1,240,870 | ) | | | 293,721 | | | | 7,430,212 | | |
| Class R | |
| Subscriptions | | | 210,812 | | | | 3,285,912 | | | | 52,197 | | | | 1,293,922 | | |
| Distributions reinvested | | | 2,133 | | | | 28,557 | | | | 4,120 | | | | 108,221 | | |
| Redemptions | | | (67,669 | ) | | | (1,075,077 | ) | | | (12,260 | ) | | | (298,056 | ) | |
| Net increase | | | 145,276 | | | | 2,239,392 | | | | 44,057 | | | | 1,104,087 | | |
| Class T | |
| Subscriptions | | | 14,049 | | | | 212,279 | | | | 15,680 | | | | 404,273 | | |
| Distributions reinvested | | | 39,726 | | | | 536,305 | | | | 149,423 | | | | 3,947,762 | | |
| Redemptions | | | (123,232 | ) | | | (1,878,375 | ) | | | (87,386 | ) | | | (2,241,391 | ) | |
| Net increase (decrease) | | | (69,457 | ) | | | (1,129,791 | ) | | | 77,717 | | | | 2,110,644 | | |
| Class Y | |
| Subscriptions | | | 266,736 | | | | 4,450,800 | | | | — | | | | — | | |
| Redemptions | | | (96,154 | ) | | | (1,696,154 | ) | | | — | | | | — | | |
| Net increase | | | 170,582 | | | | 2,754,646 | | | | — | | | | — | | |
| Class Z | |
| Subscriptions | | | 9,977,319 | | | | 157,271,217 | | | | 6,345,510 | | | | 161,605,779 | | |
| Distributions reinvested | | | 1,250,287 | | | | 17,216,609 | | | | 4,848,079 | | | | 130,170,927 | | |
| Redemptions | | | (11,924,613 | ) | | | (183,008,436 | ) | | | (9,407,154 | ) | | | (245,538,589 | ) | |
| Net increase (decrease) | | | (697,007 | ) | | | (8,520,610 | ) | | | 1,786,435 | | | | 46,238,117 | | |
See Accompanying Notes to Financial Statements.
95
Statements of Changes in Net Assets (continued) – Capital Stock Activity
| | | Columbia Small Cap Growth Fund I | |
| | | Year Ended
August 31, 2009 (a)(b) | | Year Ended
August 31, 2008 | |
| | | Shares | | Dollars ($) | | Shares | | Dollars ($) | |
| Class A | |
| Subscriptions | | | 1,943,857 | | | | 34,901,719 | | | | 1,300,483 | | | | 37,263,371 | | |
| Distributions reinvested | | | — | | | | — | | | | 88,853 | | | | 2,726,015 | | |
| Redemptions | | | (920,396 | ) | | | (17,183,781 | ) | | | (382,678 | ) | | | (10,694,676 | ) | |
| Net increase (decrease) | | | 1,023,461 | | | | 17,717,938 | | | | 1,006,658 | | | | 29,294,710 | | |
| Class B | |
| Subscriptions | | | 66,830 | | | | 1,233,954 | | | | 74,312 | | | | 2,095,819 | | |
| Distributions reinvested | | | — | | | | — | | | | 5,795 | | | | 176,045 | | |
| Redemptions | | | (40,755 | ) | | | (731,949 | ) | | | (17,548 | ) | | | (487,833 | ) | |
| Net increase (decrease) | | | 26,075 | | | | 502,005 | | | | 62,559 | | | | 1,784,031 | | |
| Class C | |
| Subscriptions | | | 404,657 | | | | 7,692,600 | | | | 254,182 | | | | 7,075,964 | | |
| Distributions reinvested | | | — | | | | — | | | | 11,411 | | | | 346,671 | | |
| Redemptions | | | (214,776 | ) | | | (3,870,815 | ) | | | (33,081 | ) | | | (898,404 | ) | |
| Net increase (decrease) | | | 189,881 | | | | 3,821,785 | | | | 232,512 | | | | 6,524,231 | | |
| Class Y | |
| Subscriptions | | | 726,438 | | | | 14,786,726 | | | | — | | | | — | | |
| Redemptions | | | (49,261 | ) | | | (1,011,823 | ) | | | — | | | | — | | |
| Net increase | | | 677,177 | | | | 13,774,903 | | | | — | | | | — | | |
| Class Z | |
| Subscriptions | | | 16,638,266 | | | | 317,334,603 | | | | 6,765,958 | | | | 192,384,904 | | |
| Distributions reinvested | | | — | | | | — | | | | 733,603 | | | | 22,602,322 | | |
| Redemptions | | | (5,031,679 | ) | | | (93,706,507 | ) | | | (1,778,786 | ) | | | (51,189,168 | ) | |
| Net increase (decrease) | | | 11,606,587 | | | | 223,628,096 | | | | 5,720,775 | | | | 163,798,058 | | |
(a) Class Y shares commenced operations on July 15, 2009.
(b) Class Y shares reflect activity for the period July 15, 2009 through August 31, 2009.
See Accompanying Notes to Financial Statements.
96
| | | Columbia Technology Fund | |
| | | Year Ended
August 31, 2009 | | Year Ended
August 31, 2008 | |
| | | Shares | | Dollars ($) | | Shares | | Dollars ($) | |
| Class A | |
| Subscriptions | | | 4,349,034 | | | | 29,339,307 | | | | 9,909,915 | | | | 113,413,674 | | |
| Distributions reinvested | | | — | | | | — | | | | 524,254 | | | | 6,306,776 | | |
| Redemptions | | | (7,726,142 | ) | | | (49,825,236 | ) | | | (5,750,661 | ) | | | (59,634,796 | ) | |
| Net increase (decrease) | | | (3,377,108 | ) | | | (20,485,929 | ) | | | 4,683,508 | | | | 60,085,654 | | |
| Class B | |
| Subscriptions | | | 143,829 | | | | 927,078 | | | | 447,305 | | | | 4,894,865 | | |
| Distributions reinvested | | | — | | | | — | | | | 40,585 | | | | 474,030 | | |
| Redemptions | | | (392,198 | ) | | | (2,436,019 | ) | | | (276,613 | ) | | | (2,839,009 | ) | |
| Net increase (decrease) | | | (248,369 | ) | | | (1,508,941 | ) | | | 211,277 | | | | 2,529,886 | | |
| Class C | |
| Subscriptions | | | 522,506 | | | | 3,405,023 | | | | 2,841,735 | | | | 32,444,710 | | |
| Distributions reinvested | | | — | | | | — | | | | 115,830 | | | | 1,356,366 | | |
| Redemptions | | | (1,892,006 | ) | | | (12,137,396 | ) | | | (1,455,517 | ) | | | (14,746,150 | ) | |
| Net increase (decrease) | | | (1,369,500 | ) | | | (8,732,373 | ) | | | 1,502,048 | | | | 19,054,926 | | |
| Class Y | |
| Subscriptions | | | — | | | | — | | | | — | | | | — | | |
| Redemptions | | | — | | | | — | | | | — | | | | — | | |
| Net increase | | | — | | | | — | | | | — | | | | — | | |
| Class Z | |
| Subscriptions | | | 9,291,739 | | | | 61,587,346 | | | | 14,754,503 | | | | 165,653,340 | | |
| Distributions reinvested | | | — | | | | — | | | | 795,555 | | | | 9,689,861 | | |
| Redemptions | | | (10,291,563 | ) | | | (67,208,822 | ) | | | (6,036,452 | ) | | | (63,350,065 | ) | |
| Net increase (decrease) | | | (999,824 | ) | | | (5,621,476 | ) | | | 9,513,606 | | | | 111,993,136 | | |
See Accompanying Notes to Financial Statements.
97
Statements of Changes in Net Assets (continued) – Capital Stock Activity
| | | Columbia Balanced Fund | |
| | | Year Ended
August 31, 2009 | | Year Ended
August 31, 2008 | |
| | | Shares | | Dollars ($) | | Shares | | Dollars ($) | |
| Class A | |
| Subscriptions | | | 708,774 | | | | 14,496,979 | | | | 234,243 | | | | 5,750,552 | | |
| Distributions reinvested | | | 12,409 | | | | 243,487 | | | | 7,632 | | | | 190,439 | | |
| Redemptions | | | (314,065 | ) | | | (6,131,842 | ) | | | (61,892 | ) | | | (1,526,712 | ) | |
| Net increase | | | 407,118 | | | | 8,608,624 | | | | 179,983 | | | | 4,414,279 | | |
| Class B | |
| Subscriptions | | | 145,116 | | | | 2,867,407 | | | | 109,424 | | | | 2,682,377 | | |
| Distributions reinvested | | | 5,350 | | | | 104,942 | | | | 5,366 | | | | 134,645 | | |
| Redemptions | | | (155,841 | ) | | | (3,021,067 | ) | | | (81,305 | ) | | | (2,008,400 | ) | |
| Net increase (decrease) | | | (5,375 | ) | | | (48,718 | ) | | | 33,485 | | | | 808,622 | | |
| Class C | |
| Subscriptions | | | 449,324 | | | | 9,081,085 | | | | 85,196 | | | | 2,081,093 | | |
| Distributions reinvested | | | 4,417 | | | | 85,684 | | | | 1,568 | | | | 39,110 | | |
| Redemptions | | | (96,186 | ) | | | (1,823,294 | ) | | | (29,299 | ) | | | (722,081 | ) | |
| Net increase | | | 357,555 | | | | 7,343,475 | | | | 57,465 | | | | 1,398,122 | | |
| Class Z | |
| Subscriptions | | | 2,436,622 | | | | 51,173,961 | | | | 575,998 | | | | 14,167,692 | | |
| Distributions reinvested | | | 210,989 | | | | 4,140,192 | | | | 230,027 | | | | 5,759,342 | | |
| Redemptions | | | (1,385,254 | ) | | | (27,247,780 | ) | | | (1,416,000 | ) | | | (34,980,088 | ) | |
| Net increase (decrease) | | | 1,262,357 | | | | 28,066,373 | | | | (609,975 | ) | | | (15,053,054 | ) | |
See Accompanying Notes to Financial Statements.
98
| | | Columbia Oregon Intermediate Municipal Bond Fund | |
| | | Year Ended
August 31, 2009 | | Year Ended
August 31, 2008 | |
| | | Shares | | Dollars ($) | | Shares | | Dollars ($) | |
| Class A | |
| Subscriptions | | | 645,220 | | | | 7,740,369 | | | | 534,896 | | | | 6,468,236 | | |
| Distributions reinvested | | | 27,514 | | | | 328,090 | | | | 13,577 | | | | 163,573 | | |
| Redemptions | | | (244,240 | ) | | | (2,938,693 | ) | | | (161,887 | ) | | | (1,955,965 | ) | |
| Net increase | | | 428,494 | | | | 5,129,766 | | | | 386,586 | | | | 4,675,844 | | |
| Class B | |
| Subscriptions | | | 12,812 | | | | 151,232 | | | | 3,769 | | | | 45,316 | | |
| Distributions reinvested | | | 1,103 | | | | 13,131 | | | | 1,199 | | | | 14,466 | | |
| Redemptions | | | (8,431 | ) | | | (100,630 | ) | | | (27,814 | ) | | | (334,529 | ) | |
| Net increase (decrease) | | | 5,484 | | | | 63,733 | | | | (22,846 | ) | | | (274,747 | ) | |
| Class C | |
| Subscriptions | | | 344,664 | | | | 4,130,110 | | | | 585,163 | | | | 7,095,783 | | |
| Distributions reinvested | | | 10,716 | | | | 127,847 | | | | 5,168 | | | | 62,225 | | |
| Redemptions | | | (74,243 | ) | | | (878,119 | ) | | | (31,559 | ) | | | (380,864 | ) | |
| Net increase | | | 281,137 | | | | 3,379,838 | | | | 558,772 | | | | 6,777,144 | | |
| Class Z | |
| Subscriptions | | | 4,984,227 | | | | 59,336,743 | | | | 3,436,233 | | | | 41,557,481 | | |
| Distributions reinvested | | | 969,877 | | | | 11,543,269 | | | | 938,095 | | | | 11,317,742 | | |
| Redemptions | | | (3,322,767 | ) | | | (39,424,701 | ) | | | (3,442,463 | ) | | | (41,619,688 | ) | |
| Net increase (decrease) | | | 2,631,337 | | | | 31,455,311 | | | | 931,865 | | | | 11,255,535 | | |
See Accompanying Notes to Financial Statements.
99
Statements of Changes in Net Assets (continued) – Capital Stock Activity
| | | Columbia Conservative High Yield Fund | |
| | | Year Ended
August 31, 2009 (a)(b) | | Year Ended
August 31, 2008 | |
| | | Shares | | Dollars ($) | | Shares | | Dollars ($) | |
| Class A | |
| Subscriptions | | | 7,347,134 | | | | 47,177,159 | | | | 1,848,022 | | | | 14,702,780 | | |
| Distributions reinvested | | | 629,430 | | | | 4,106,780 | | | | 612,446 | | | | 4,859,130 | | |
| Redemptions | | | (6,015,382 | ) | | | (39,077,085 | ) | | | (6,227,566 | ) | | | (49,559,113 | ) | |
| Net increase (decrease) | | | 1,961,182 | | | | 12,206,854 | | | | (3,767,098 | ) | | | (29,997,203 | ) | |
| Class B | |
| Subscriptions | | | 308,521 | | | | 1,950,860 | | | | 122,459 | | | | 967,631 | | |
| Distributions reinvested | | | 224,041 | | | | 1,452,365 | | | | 230,065 | | | | 1,824,137 | | |
| Redemptions | | | (1,390,908 | ) | | | (9,027,660 | ) | | | (1,558,840 | ) | | | (12,351,913 | ) | |
| Net decrease | | | (858,346 | ) | | | (5,624,435 | ) | | | (1,206,316 | ) | | | (9,560,145 | ) | |
| Class C | |
| Subscriptions | | | 1,788,700 | | | | 11,592,043 | | | | 95,162 | | | | 750,825 | | |
| Distributions reinvested | | | 167,490 | | | | 1,094,947 | | | | 137,201 | | | | 1,088,045 | | |
| Redemptions | | | (840,135 | ) | | | (5,421,856 | ) | | | (1,352,814 | ) | | | (10,813,809 | ) | |
| Net increase (decrease) | | | 1,116,055 | | | | 7,265,134 | | | | (1,120,451 | ) | | | (8,974,939 | ) | |
| Class Y | |
| Subscriptions | | | 2,586,030 | | | | 18,015,831 | | | | — | | | | — | | |
| Distributions reinvested | | | 3,202 | | | | 22,730 | | | | — | | | | — | | |
| Net increase | | | 2,589,232 | | | | 18,038,561 | | | | — | | | | — | | |
| Class Z | |
| Subscriptions | | | 24,712,911 | | | | 158,824,736 | | | | 7,934,712 | | | | 63,102,454 | | |
| Distributions reinvested | | | 1,849,969 | | | | 12,099,935 | | | | 1,543,670 | | | | 12,239,087 | | |
| Redemptions | | | (23,662,625 | ) | | | (153,321,637 | ) | | | (26,827,150 | ) | | | (213,636,942 | ) | |
| Net increase (decrease) | | | 2,900,255 | | | | 17,603,034 | | | | (17,348,768 | ) | | | (138,295,401 | ) | |
(a) Class Y shares commenced operations on July 15, 2009.
(b) Class Y shares reflect activity for the period July 15, 2009 through August 31, 2009.
See Accompanying Notes to Financial Statements.
100
Financial Highlights – Columbia International Stock Fund
Selected data for a share outstanding throughout each period is as follows:
| | | Year Ended August 31, | |
| Class A Shares | | 2009 | | 2008 | | 2007 | | 2006 | | 2005 | |
| Net Asset Value, Beginning of Period | | $ | 14.02 | | | $ | 19.93 | | | $ | 18.89 | | | $ | 15.76 | | | $ | 13.04 | | |
| Income from Investment Operations: | |
| Net investment income (a) | | | 0.22 | | | | 0.37 | (b) | | | 0.26 | | | | 0.26 | | | | 0.25 | | |
Net realized and unrealized gain (loss) on investments,
foreign currency, foreign capital gains tax
and written options | | | (2.81 | ) | | | (3.43 | ) | | | 3.04 | | | | 3.17 | | | | 2.47 | | |
| Total from investment operations | | | (2.59 | ) | | | (3.06 | ) | | | 3.30 | | | | 3.43 | | | | 2.72 | | |
| Less Distributions to Shareholders: | |
| From net investment income | | | — | | | | (0.64 | ) | | | (0.29 | ) | | | (0.13 | ) | | | — | (c) | |
| From net realized gains | | | (0.42 | ) | | | (2.21 | ) | | | (1.97 | ) | | | (0.17 | ) | | | — | | |
| Total distributions to shareholders | | | (0.42 | ) | | | (2.85 | ) | | | (2.26 | ) | | | (0.30 | ) | | | — | (c) | |
| Redemption Fees: | |
| Redemption fees added to paid-in-capital (a)(c) | | | — | | | | — | | | | — | | | | — | | | | — | | |
| Increase from regulatory settlements | | | 0.14 | | | | — | | | | — | | | | — | | | | — | | |
| Net Asset Value, End of Period | | $ | 11.15 | | | $ | 14.02 | | | $ | 19.93 | | | $ | 18.89 | | | $ | 15.76 | | |
| Total return (d)(e) | | | (16.59 | )% | | | (17.74 | )% | | | 18.46 | %(f) | | | 21.98 | % | | | 20.89 | % | |
| Ratios to Average Net Assets/Supplemental Data: | |
| Net expenses before interest expense (g) | | | 1.41 | % | | | 1.23 | % | | | 1.24 | % | | | 1.19 | % | | | 1.25 | % | |
| Interest expense | | | — | %(h) | | | — | %(h) | | | — | %(h) | | | — | %(h) | | | — | | |
| Net expenses (g) | | | 1.41 | % | | | 1.23 | % | | | 1.24 | % | | | 1.19 | % | | | 1.25 | % | |
| Waiver/Reimbursement | | | 0.06 | % | | | 0.09 | % | | | 0.10 | % | | | 0.08 | % | | | 0.09 | % | |
| Net investment income (g) | | | 2.37 | % | | | 2.17 | % | | | 1.33 | % | | | 1.49 | % | | | 1.71 | % | |
| Portfolio turnover rate | | | 118 | % | | | 63 | % | | | 65 | % | | | 95 | % | | | 66 | % | |
| Net assets, end of period (000s) | | $ | 150,743 | | | $ | 218,484 | | | $ | 297,149 | | | $ | 277,295 | | | $ | 71,270 | | |
(a) Per share data was calculated using the average shares outstanding during the period.
(b) Net investment income per share reflects a special dividend. The effect of this dividend amounted to $0.04 per share.
(c) Rounds to less than $0.01 per share.
(d) Total return at net asset value assuming all distributions reinvested and no initial sales charge or contingent deferred sales charge.
(e) Had the investment advisor and/or any of its affiliates not waived fees or reimbursed a portion of expenses, total return would have been reduced.
(f) Total return includes a voluntary reimbursement by the investment advisor for a realized investment loss due to a trading error. This reimbursement increased total return and net asset value per share by less than 0.01% and less than $0.01, respectively.
(g) The benefits derived from expense reductions had an impact of less than 0.01%.
(h) Rounds to less than 0.01%.
See Accompanying Notes to Financial Statements.
101
Financial Highlights – Columbia International Stock Fund
Selected data for a share outstanding throughout each period is as follows:
| | | Year Ended August 31, | |
| Class B Shares | | 2009 | | 2008 | | 2007 | | 2006 | | 2005 | |
| Net Asset Value, Beginning of Period | | $ | 13.61 | | | $ | 19.40 | | | $ | 18.44 | | | $ | 15.37 | | | $ | 12.81 | | |
| Income from Investment Operations: | |
| Net investment income (a) | | | 0.14 | | | | 0.20 | (b) | | | 0.09 | | | | 0.11 | | | | 0.07 | | |
Net realized and unrealized gain (loss) on investments,
foreign currency, foreign capital gains tax
and written options | | | (2.73 | ) | | | (3.29 | ) | | | 2.99 | | | | 3.14 | | | | 2.49 | | |
| Total from investment operations | | | (2.59 | ) | | | (3.09 | ) | | | 3.08 | | | | 3.25 | | | | 2.56 | | |
| Less Distributions to Shareholders: | |
| From net investment income | | | — | | | | (0.49 | ) | | | (0.15 | ) | | | (0.01 | ) | | | — | | |
| From net realized gains | | | (0.42 | ) | | | (2.21 | ) | | | (1.97 | ) | | | (0.17 | ) | | | — | | |
| Total distributions to shareholders | | | (0.42 | ) | | | (2.70 | ) | | | (2.12 | ) | | | (0.18 | ) | | | — | | |
| Redemption Fees: | |
| Redemption fees added to paid-in-capital (a)(c) | | | — | | | | — | | | | — | | | | — | | | | — | | |
| Increase from regulatory settlements | | | 0.12 | | | | — | | | | — | | | | — | | | | — | | |
| Net Asset Value, End of Period | | $ | 10.72 | | | $ | 13.61 | | | $ | 19.40 | | | $ | 18.44 | | | $ | 15.37 | | |
| Total return (d)(e) | | | (17.26 | )% | | | (18.31 | )% | | | 17.54 | %(f) | | | 21.30 | % | | | 19.98 | % | |
| Ratios to Average Net Assets/Supplemental Data: | |
| Net expenses before interest expense (g) | | | 2.16 | % | | | 1.98 | % | | | 1.99 | % | | | 1.94 | % | | | 2.01 | % | |
| Interest expense | | | — | %(h) | | | — | %(h) | | | — | %(h) | | | — | %(h) | | | — | | |
| Net expenses (g) | | | 2.16 | % | | | 1.98 | % | | | 1.99 | % | | | 1.94 | % | | | 2.01 | % | |
| Waiver/Reimbursement | | | 0.06 | % | | | 0.09 | % | | | 0.10 | % | | | 0.08 | % | | | 0.10 | % | |
| Net investment income (g) | | | 1.57 | % | | | 1.18 | % | | | 0.49 | % | | | 0.62 | % | | | 0.47 | % | |
| Portfolio turnover rate | | | 118 | % | | | 63 | % | | | 65 | % | | | 95 | % | | | 66 | % | |
| Net assets, end of period (000s) | | $ | 6,392 | | | $ | 13,580 | | | $ | 29,925 | | | $ | 42,585 | | | $ | 12,026 | | |
(a) Per share data was calculated using the average shares outstanding during the period.
(b) Net investment income per share reflects a special dividend. The effect of this dividend amounted to $0.04 per share.
(c) Rounds to less than $0.01 per share.
(d) Total return at net asset value assuming all distributions reinvested and no contingent deferred sales charge.
(e) Had the investment advisor and/or any of its affiliates not waived fees or reimbursed a portion of expenses, total return would have been reduced.
(f) Total return includes a voluntary reimbursement by the investment advisor for a realized investment loss due to a trading error. This reimbursement increased total return and net asset value per share by less than 0.01% and less than $0.01, respectively.
(g) The benefits derived from expense reductions had an impact of less than 0.01%.
(h) Rounds to less than 0.01%.
See Accompanying Notes to Financial Statements.
102
Financial Highlights – Columbia International Stock Fund
Selected data for a share outstanding throughout each period is as follows:
| | | Year Ended August 31, | |
| Class C Shares | | 2009 | | 2008 | | 2007 | | 2006 | | 2005 | |
| Net Asset Value, Beginning of Period | | $ | 13.68 | | | $ | 19.49 | | | $ | 18.51 | | | $ | 15.43 | | | $ | 12.86 | | |
| Income from Investment Operations: | |
| Net investment income (a) | | | 0.15 | | | | 0.23 | (b) | | | 0.11 | | | | 0.13 | | | | 0.07 | | |
Net realized and unrealized gain (loss) on investments,
foreign currency, foreign capital gains tax
and written options | | | (2.76 | ) | | | (3.34 | ) | | | 2.99 | | | | 3.13 | | | | 2.50 | | |
| Total from investment operations | | | (2.61 | ) | | | (3.11 | ) | | | 3.10 | | | | 3.26 | | | | 2.57 | | |
| Less Distributions to Shareholders: | |
| From net investment income | | | — | | | | (0.49 | ) | | | (0.15 | ) | | | (0.01 | ) | | | — | | |
| From net realized gains | | | (0.42 | ) | | | (2.21 | ) | | | (1.97 | ) | | | (0.17 | ) | | | — | | |
| Total distributions to shareholders | | | (0.42 | ) | | | (2.70 | ) | | | (2.12 | ) | | | (0.18 | ) | | | — | | |
| Redemption Fees: | |
| Redemption fees added to paid-in-capital (a)(c) | | | — | | | | — | | | | — | | | | — | | | | — | | |
| Increase from regulatory settlements | | | 0.13 | | | | — | | | | — | | | | — | | | | — | | |
| Net Asset Value, End of Period | | $ | 10.78 | | | $ | 13.68 | | | $ | 19.49 | | | $ | 18.51 | | | $ | 15.43 | | |
| Total return (d)(e) | | | (17.24 | )% | | | (18.33 | )% | | | 17.59 | %(f) | | | 21.28 | % | | | 19.98 | % | |
| Ratios to Average Net Assets/Supplemental Data: | |
| Net expenses before interest expense (g) | | | 2.16 | % | | | 1.98 | % | | | 1.99 | % | | | 1.94 | % | | | 2.01 | % | |
| Interest expense | | | — | %(h) | | | — | %(h) | | | — | %(h) | | | — | %(h) | | | — | | |
| Net expenses (g) | | | 2.16 | % | | | 1.98 | % | | | 1.99 | % | | | 1.94 | % | | | 2.01 | % | |
| Waiver/Reimbursement | | | 0.06 | % | | | 0.09 | % | | | 0.10 | % | | | 0.08 | % | | | 0.10 | % | |
| Net investment income (g) | | | 1.63 | % | | | 1.38 | % | | | 0.57 | % | | | 0.75 | % | | | 0.46 | % | |
| Portfolio turnover rate | | | 118 | % | | | 63 | % | | | 65 | % | | | 95 | % | | | 66 | % | |
| Net assets, end of period (000s) | | $ | 12,615 | | | $ | 19,946 | | | $ | 29,144 | | | $ | 27,806 | | | $ | 904 | | |
(a) Per share data was calculated using the average shares outstanding during the period.
(b) Net investment income per share reflects a special dividend. The effect of this dividend amounted to $0.04 per share.
(c) Rounds to less than $0.01 per share.
(d) Total return at net asset value assuming all distributions reinvested and no contingent deferred sales charge.
(e) Had the investment advisor and/or any of its affiliates not waived fees or reimbursed a portion of expenses, total return would have been reduced.
(f) Total return includes a voluntary reimbursement by the investment advisor for a realized investment loss due to a trading error. This reimbursement increased total return and net asset value per share by less than 0.01% and less than $0.01, respectively.
(g) The benefits derived from expense reductions had an impact of less than 0.01%.
(h) Rounds to less than 0.01%.
See Accompanying Notes to Financial Statements.
103
Financial Highlights – Columbia International Stock Fund
Selected data for a share outstanding throughout the period is as follows:
| Class Y Shares | | Period Ended
August 31,
2009 (a) | |
| Net Asset Value, Beginning of Period | | $ | 10.06 | | |
| Income from Investment Operations: | |
| Net investment income (b) | | | 0.03 | | |
| Net realized and unrealized gain on investments, foreign currency and written options | | | 1.21 | | |
| Total from investment operations | | | 1.24 | | |
| Redemption Fees: | |
| Redemption fees added to paid-in-capital (b)(c) | | | — | | |
| Net Asset Value, End of Period | | $ | 11.30 | | |
| Total return (d)(e) | | | 12.33 | % | |
| Ratios to Average Net Assets/Supplemental Data: | |
| Net expenses before interest expense (f)(g) | | | 0.99 | % | |
| Interest expense (f)(h) | | | — | % | |
| Net expenses (f)(g) | | | 0.99 | % | |
| Net investment income (f)(g) | | | 2.05 | % | |
| Portfolio turnover rate (e) | | | 118 | % | |
| Net assets, end of period (000s) | | $ | 30,818 | | |
(a) Class Y shares commenced operations on July 15, 2009. Per share data and total return reflect activity from that date.
(b) Per share data was calculated using the average shares outstanding during the period.
(c) Rounds to less than $0.01 per share.
(d) Total return at net asset value.
(e) Not annualized.
(f) Annualized.
(g) The benefits derived from expense reductions had an impact of less than 0.01%.
(h) Rounds to less than 0.01%.
See Accompanying Notes to Financial Statements.
104
Financial Highlights – Columbia International Stock Fund
Selected data for a share outstanding throughout each period is as follows:
| | | Year Ended August 31, | |
| Class Z Shares | | 2009 | | 2008 | | 2007 | | 2006 | | 2005 | |
| Net Asset Value, Beginning of Period | | $ | 14.15 | | | $ | 20.09 | | | $ | 19.03 | | | $ | 15.85 | | | $ | 13.14 | | |
| Income from Investment Operations: | |
| Net investment income (a) | | | 0.24 | | | | 0.40 | (b) | | | 0.31 | | | | 0.29 | | | | 0.25 | | |
Net realized and unrealized gain (loss) on investments,
foreign currency, foreign capital gains tax
and written options | | | (2.80 | ) | | | (3.44 | ) | | | 3.06 | | | | 3.23 | | | | 2.53 | | |
| Total from investment operations | | | (2.56 | ) | | | (3.04 | ) | | | 3.37 | | | | 3.52 | | | | 2.78 | | |
| Less Distributions to Shareholders: | |
| From net investment income | | | — | | | | (0.69 | ) | | | (0.34 | ) | | | (0.17 | ) | | | (0.07 | ) | |
| From net realized gains | | | (0.42 | ) | | | (2.21 | ) | | | (1.97 | ) | | | (0.17 | ) | | | — | | |
| Total distributions to shareholders | | | (0.42 | ) | | | (2.90 | ) | | | (2.31 | ) | | | (0.34 | ) | | | (0.07 | ) | |
| Redemption Fees: | |
| Redemption fees added to paid-in-capital (a)(c) | | | — | | | | — | | | | — | | | | — | | | | — | | |
| Increase from regulatory settlements | | | 0.13 | | | | — | | | | — | | | | — | | | | — | | |
| Net Asset Value, End of Period | | $ | 11.30 | | | $ | 14.15 | | | $ | 20.09 | | | $ | 19.03 | | | $ | 15.85 | | |
| Total return (d)(e) | | | (16.29 | )% | | | (17.52 | )% | | | 18.73 | %(f) | | | 22.45 | % | | | 21.20 | % | |
| Ratios to Average Net Assets/Supplemental Data: | |
| Net expenses before interest expense (g) | | | 1.16 | % | | | 0.98 | % | | | 0.99 | % | | | 0.94 | % | | | 1.00 | % | |
| Interest expense | | | — | %(h) | | | — | %(h) | | | — | %(h) | | | — | %(h) | | | — | | |
| Net expenses (g) | | | 1.16 | % | | | 0.98 | % | | | 0.99 | % | | | 0.94 | % | | | 1.00 | % | |
| Waiver/Reimbursement | | | 0.06 | % | | | 0.09 | % | | | 0.10 | % | | | 0.08 | % | | | 0.10 | % | |
| Net investment income (g) | | | 2.60 | % | | | 2.32 | % | | | 1.55 | % | | | 1.63 | % | | | 1.71 | % | |
| Portfolio turnover rate | | | 118 | % | | | 63 | % | | | 65 | % | | | 95 | % | | | 66 | % | |
| Net assets, end of period (000s) | | $ | 369,448 | | | $ | 636,992 | | | $ | 1,011,212 | | | $ | 1,005,878 | | | $ | 964,495 | | |
(a) Per share data was calculated using the average shares outstanding during the period.
(b) Net investment income per share reflects a special dividend. The effect of this dividend amounted to $0.04 per share.
(c) Rounds to less than $0.01 per share.
(d) Total return at net asset value assuming all distributions reinvested.
(e) Had the investment advisor and/or any of its affiliates not waived fees or reimbursed a portion of expenses, total return would have been reduced.
(f) Total return includes a voluntary reimbursement by the investment advisor for a realized investment loss due to a trading error. This reimbursement increased total return and net asset value per share by less than 0.01% and less than $0.01, respectively.
(g) The benefits derived from expense reductions had an impact of less than 0.01%.
(h) Rounds to less than 0.01%.
See Accompanying Notes to Financial Statements.
105
Financial Highlights – Columbia Mid Cap Growth Fund
Selected data for a share outstanding throughout each period is as follows:
| | | Year Ended August 31, | |
| Class A Shares | | 2009 | | 2008 | | 2007 | | 2006 | | 2005 | |
| Net Asset Value, Beginning of Period | | $ | 23.47 | | | $ | 27.51 | | | $ | 24.01 | | | $ | 22.16 | | | $ | 16.99 | | |
| Income from Investment Operations: | |
| Net investment loss (a) | | | (0.03 | ) | | | (0.12 | ) | | | (0.01 | )(b) | | | (0.10 | ) | | | (0.15 | ) | |
Net realized and unrealized gain (loss) on investments,
foreign currency and written options | | | (5.37 | ) | | | (0.06 | ) | | | 4.97 | | | | 2.26 | | | | 5.32 | | |
| Total from investment operations | | | (5.40 | ) | | | (0.18 | ) | | | 4.96 | | | | 2.16 | | | | 5.17 | | |
| Less Distributions to Shareholders: | |
| From net realized gains | | | (0.49 | ) | | | (3.86 | ) | | | (1.46 | ) | | | (0.31 | ) | | | — | | |
| Increase from regulatory settlements | | | — | (c) | | | — | | | | — | | | | — | | | | — | | |
| Net Asset Value, End of Period | | $ | 17.58 | | | $ | 23.47 | | | $ | 27.51 | | | $ | 24.01 | | | $ | 22.16 | | |
| Total return (d) | | | (22.38 | )% | | | (2.21 | )% | | | 21.24 | % | | | 9.76 | %(e) | | | 30.43 | %(e) | |
| Ratios to Average Net Assets/Supplemental Data: | |
| Net expenses before interest expense (f) | | | 1.26 | % | | | 1.18 | % | | | 1.17 | % | | | 1.21 | % | | | 1.23 | % | |
| Interest expense | | | — | | | | — | %(g) | | | — | %(g) | | | — | | | | — | %(g) | |
| Net expenses (f) | | | 1.26 | % | | | 1.18 | % | | | 1.17 | % | | | 1.21 | % | | | 1.23 | % | |
| Waiver/Reimbursement | | | — | | | | — | | | | — | | | | 0.01 | % | | | 0.05 | % | |
| Net investment loss (f) | | | (0.20 | )% | | | (0.48 | )% | | | (0.05 | )% | | | (0.43 | )% | | | (0.76 | )% | |
| Portfolio turnover rate | | | 160 | % | | | 149 | % | | | 171 | % | | | 67 | % | | | 104 | % | |
| Net assets, end of period (000s) | | $ | 53,881 | | | $ | 63,337 | | | $ | 49,614 | | | $ | 12,654 | | | $ | 6,078 | | |
(a) Per share data was calculated using the average shares outstanding during the period.
(b) Net investment income per share reflects special dividends. The effect of these dvidends amounted to $0.07 per share.
(c) Rounds to less than $0.01.
(d) Total return at net asset value assuming all distributions reinvested and no initial sales charge or contingent deferred sales charge.
(e) Had the investment advisor and/or any of its affiliates not waived fees or reimbursed a portion of expenses, total return would have been reduced.
(f) The benefits derived from expense reductions had an impact of less than 0.01%.
(g) Rounds to less than 0.01%.
See Accompanying Notes to Financial Statements.
106
Financial Highlights – Columbia Mid Cap Growth Fund
Selected data for a share outstanding throughout each period is as follows:
| | | Year Ended August 31, | |
| Class B Shares | | 2009 | | 2008 | | 2007 | | 2006 | | 2005 | |
| Net Asset Value, Beginning of Period | | $ | 22.35 | | | $ | 26.47 | | | $ | 23.32 | | | $ | 21.69 | | | $ | 16.75 | | |
| Income from Investment Operations: | |
| Net investment loss (a) | | | (0.14 | ) | | | (0.30 | ) | | | (0.20 | )(b) | | | (0.28 | ) | | | (0.30 | ) | |
Net realized and unrealized gain (loss) on investments,
foreign currency and written options | | | (5.13 | ) | | | (0.04 | ) | | | 4.81 | | | | 2.22 | | | | 5.24 | | |
| Total from investment operations | | | (5.27 | ) | | | (0.34 | ) | | | 4.61 | | | | 1.94 | | | | 4.94 | | |
| Less Distributions to Shareholders: | |
| From net realized gains | | | (0.49 | ) | | | (3.78 | ) | | | (1.46 | ) | | | (0.31 | ) | | | — | | |
| Increase from regulatory settlements | | | — | (c) | | | — | | | | — | | | | — | | | | — | | |
| Net Asset Value, End of Period | | $ | 16.59 | | | $ | 22.35 | | | $ | 26.47 | | | $ | 23.32 | | | $ | 21.69 | | |
| Total return (d) | | | (22.93 | )% | | | (2.92 | )% | | | 20.33 | % | | | 8.95 | %(e) | | | 29.49 | %(e) | |
| Ratios to Average Net Assets/Supplemental Data: | |
| Net expenses before interest expense (f) | | | 2.01 | % | | | 1.93 | % | | | 1.92 | % | | | 1.96 | % | | | 1.98 | % | |
| Interest expense | | | — | | | | — | %(g) | | | — | %(g) | | | — | | | | — | %(g) | |
| Net expenses (f) | | | 2.01 | % | | | 1.93 | % | | | 1.92 | % | | | 1.96 | % | | | 1.98 | % | |
| Waiver/Reimbursement | | | — | | | | — | | | | — | | | | 0.01 | % | | | 0.05 | % | |
| Net investment loss (f) | | | (0.95 | )% | | | (1.23 | )% | | | (0.79 | )% | | | (1.19 | )% | | | (1.51 | )% | |
| Portfolio turnover rate | | | 160 | % | | | 149 | % | | | 171 | % | | | 67 | % | | | 104 | % | |
| Net assets, end of period (000s) | | $ | 8,322 | | | $ | 15,829 | | | $ | 19,472 | | | $ | 7,452 | | | $ | 6,377 | | |
(a) Per share data was calculated using the average shares outstanding during the period.
(b) Net investment income per share reflects special dividends. The effect of these dvidends amounted to $0.07 per share.
(c) Rounds to less than $0.01.
(d) Total return at net asset value assuming all distributions reinvested and no contingent deferred sales charge.
(e) Had the investment advisor and/or any of its affiliates not waived fees or reimbursed a portion of expenses, total return would have been reduced.
(f) The benefits derived from expense reductions had an impact of less than 0.01%.
(g) Rounds to less than 0.01%.
See Accompanying Notes to Financial Statements.
107
Financial Highlights – Columbia Mid Cap Growth Fund
Selected data for a share outstanding throughout each period is as follows:
| | | Year Ended August 31, | |
| Class C Shares | | 2009 | | 2008 | | 2007 | | 2006 | | 2005 | |
| Net Asset Value, Beginning of Period | | $ | 22.41 | | | $ | 26.53 | | | $ | 23.37 | | | $ | 21.74 | | | $ | 16.79 | | |
| Income from Investment Operations: | |
| Net investment loss (a) | | | (0.14 | ) | | | (0.30 | ) | | | (0.21 | )(b) | | | (0.28 | ) | | | (0.30 | ) | |
Net realized and unrealized gain (loss) on investments,
foreign currency and written options | | | (5.15 | ) | | | (0.04 | ) | | | 4.83 | | | | 2.22 | | | | 5.25 | | |
| Total from investment operations | | | (5.29 | ) | | | (0.34 | ) | | | 4.62 | | | | 1.94 | | | | 4.95 | | |
| Less Distributions to Shareholders: | |
| From net realized gains | | | (0.49 | ) | | | (3.78 | ) | | | (1.46 | ) | | | (0.31 | ) | | | — | | |
| Increase from regulatory settlements | | | — | (c) | | | — | | | | — | | | | — | | | | — | | |
| Net Asset Value, End of Period | | $ | 16.63 | | | $ | 22.41 | | | $ | 26.53 | | | $ | 23.37 | | | $ | 21.74 | | |
| Total return (d) | | | (22.96 | )% | | | (2.91 | )% | | | 20.33 | % | | | 8.93 | %(e) | | | 29.48 | %(e) | |
| Ratios to Average Net Assets/Supplemental Data: | |
| Net expenses before interest expense (f) | | | 2.01 | % | | | 1.93 | % | | | 1.92 | % | | | 1.96 | % | | | 1.98 | % | |
| Interest expense | | | — | | | | — | %(g) | | | — | %(g) | | | — | | | | — | %(g) | |
| Net expenses (f) | | | 2.01 | % | | | 1.93 | % | | | 1.92 | % | | | 1.96 | % | | | 1.98 | % | |
| Waiver/Reimbursement | | | — | | | | — | | | | — | | | | 0.01 | % | | | 0.05 | % | |
| Net investment loss (f) | | | (0.95 | )% | | | (1.23 | )% | | | (0.81 | )% | | | (1.16 | )% | | | (1.52 | )% | |
| Portfolio turnover rate | | | 160 | % | | | 149 | % | | | 171 | % | | | 67 | % | | | 104 | % | |
| Net assets, end of period (000s) | | $ | 9,106 | | | $ | 13,540 | | | $ | 8,237 | | | $ | 2,454 | | | $ | 674 | | |
(a) Per share data was calculated using the average shares outstanding during the period.
(b) Net investment income per share reflects special dividends. The effect of these dvidends amounted to $0.07 per share.
(c) Rounds to less than $0.01.
(d) Total return at net asset value assuming all distributions reinvested and no contingent deferred sales charge.
(e) Had the investment advisor and/or any of its affiliates not waived fees or reimbursed a portion of expenses, total return would have been reduced.
(f) The benefits derived from expense reductions had an impact of less than 0.01%.
(g) Rounds to less than 0.01%.
See Accompanying Notes to Financial Statements.
108
Financial Highlights – Columbia Mid Cap Growth Fund
Selected data for a share outstanding throughout each period is as follows:
| | | Year Ended August 31, | | Period Ended
August 31, | |
| Class R Shares | | 2009 | | 2008 | | 2007 | | 2006 (a) | |
| Net Asset Value, Beginning of Period | | $ | 23.32 | | | $ | 27.39 | | | $ | 23.97 | | | $ | 24.44 | | |
| Income from Investment Operations: | |
| Net investment loss (b) | | | (0.07 | ) | | | (0.18 | ) | | | (0.15 | )(c) | | | (0.10 | ) | |
Net realized and unrealized gain (loss) on investments,
foreign currency and written options | | | (5.34 | ) | | | (0.06 | ) | | | 5.03 | | | | (0.37 | ) | |
| Total from investment operations | | | (5.41 | ) | | | (0.24 | ) | | | 4.88 | | | | (0.47 | ) | |
| Less Distributions to Shareholders: | |
| From net realized gains | | | (0.49 | ) | | | (3.83 | ) | | | (1.46 | ) | | | — | | |
| Increase from regulatory settlements | | | — | (d) | | | — | | | | — | | | | — | | |
| Net Asset Value, End of Period | | $ | 17.42 | | | $ | 23.32 | | | $ | 27.39 | | | $ | 23.97 | | |
| Total return (e) | | | (22.57 | )% | | | (2.44 | )% | | | 20.93 | % | | | (1.92 | )%(f) | |
| Ratios to Average Net Assets/Supplemental Data: | |
| Net expenses before interest expense (g) | | | 1.51 | % | | | 1.43 | % | | | 1.42 | % | | | 1.47 | %(h) | |
| Interest expense | | | — | | | | — | %(i) | | | — | %(i) | | | — | | |
| Net expenses (g) | | | 1.51 | % | | | 1.43 | % | | | 1.42 | % | | | 1.47 | %(h) | |
| Net investment loss (g) | | | (0.45 | )% | | | (0.74 | )% | | | (0.57 | )% | | | (0.66 | )%(h) | |
| Portfolio turnover rate | | | 160 | % | | | 149 | % | | | 171 | % | | | 67 | % | |
| Net assets, end of period (000s) | | $ | 3,876 | | | $ | 1,800 | | | $ | 908 | | | $ | 57 | | |
(a) Class R shares were initially offered on January 23, 2006. Total return reflects activity from that date.
(b) Per share data was calculated using the average shares outstanding during the period.
(c) Net investment income per share reflects special dividends. The effect of these dvidends amounted to $0.07 per share.
(d) Rounds to less than $0.01.
(e) Total return at net asset value assuming all distributions reinvested.
(f) Not annualized.
(g) The benefits derived from expense reductions had an impact of less than 0.01%.
(h) Annualized.
(i) Rounds to less than 0.01%.
See Accompanying Notes to Financial Statements.
109
Financial Highlights – Columbia Mid Cap Growth Fund
Selected data for a share outstanding throughout each period is as follows:
| | | Year Ended August 31, | |
| Class T Shares | | 2009 | | 2008 | | 2007 | | 2006 | | 2005 | |
| Net Asset Value, Beginning of Period | | $ | 23.48 | | | $ | 27.53 | | | $ | 24.04 | | | $ | 22.20 | | | $ | 17.03 | | |
| Income from Investment Operations: | |
| Net investment loss (a) | | | (0.04 | ) | | | (0.14 | ) | | | (0.03 | )(b) | | | (0.12 | ) | | | (0.16 | ) | |
Net realized and unrealized gain (loss) on investments,
foreign currency and written options | | | (5.37 | ) | | | (0.06 | ) | | | 4.98 | | | | 2.27 | | | | 5.33 | | |
| Total from investment operations | | | (5.41 | ) | | | (0.20 | ) | | | 4.95 | | | | 2.15 | | | | 5.17 | | |
| Less Distributions to Shareholders: | |
| From net realized gains | | | (0.49 | ) | | | (3.85 | ) | | | (1.46 | ) | | | (0.31 | ) | | | — | | |
| Increase from regulatory settlements | | | — | (c) | | | — | | | | — | | | | — | | | | — | | |
| Net Asset Value, End of Period | | $ | 17.58 | | | $ | 23.48 | | | $ | 27.53 | | | $ | 24.04 | | | $ | 22.20 | | |
| Total return (d) | | | (22.41 | )% | | | (2.27 | )% | | | 21.17 | % | | | 9.70 | %(e) | | | 30.36 | %(e) | |
| Ratios to Average Net Assets/Supplemental Data: | |
| Net expenses before interest expense (f) | | | 1.31 | % | | | 1.23 | % | | | 1.22 | % | | | 1.26 | % | | | 1.28 | % | |
| Interest expense | | | — | | | | — | %(g) | | | — | %(g) | | | — | | | | — | %(g) | |
| Net expenses (f) | | | 1.31 | % | | | 1.23 | % | | | 1.22 | % | | | 1.26 | % | | | 1.28 | % | |
| Waiver/Reimbursement | | | — | | | | — | | | | — | | | | 0.01 | % | | | 0.05 | % | |
| Net investment loss (f) | | | (0.25 | )% | | | (0.53 | )% | | | (0.10 | )% | | | (0.50 | )% | | | (0.82 | )% | |
| Portfolio turnover rate | | | 160 | % | | | 149 | % | | | 171 | % | | | 67 | % | | | 104 | % | |
| Net assets, end of period (000s) | | $ | 18,847 | | | $ | 26,801 | | | $ | 29,282 | | | $ | 27,101 | | | $ | 27,969 | | |
(a) Per share data was calculated using the average shares outstanding during the period.
(b) Net investment income per share reflects special dividends. The effect of these dvidends amounted to $0.07 per share.
(c) Rounds to less than $0.01.
(d) Total return at net asset value assuming all distributions reinvested and no initial sales charge or contingent deferred sales charge.
(e) Had the investment advisor and/or any of its affiliates not waived fees or reimbursed a portion of expenses, total return would have been reduced.
(f) The benefits derived from expense reductions had an impact of less than 0.01%.
(g) Rounds to less than 0.01%.
See Accompanying Notes to Financial Statements.
110
Financial Highlights – Columbia Mid Cap Growth Fund
Selected data for a share outstanding throughout the period is as follows:
| Class Y Shares | | Period Ended
August 31,
2009 (a) | |
| Net Asset Value, Beginning of Year | | $ | 16.18 | | |
| Income from Investment Operations: | |
| Net investment income (b) | | | 0.01 | | |
| Net realized and unrealized gain on investments and foreign currency | | | 1.79 | | |
| Total from investment operations | | | 1.80 | | |
| Net Asset Value, End of Period | | $ | 17.98 | | |
| Total return (c)(d) | | | 11.12 | % | |
| Ratios to Average Net Assets: | |
| Net expenses (e)(f) | | | 0.86 | % | |
| Net investment income (e)(f) | | | 0.31 | % | |
| Portfolio turnover rate (d) | | | 160 | % | |
| Net assets, end of period (000s) | | $ | 3,067 | | |
(a) Class Y shares commenced operations on July 15, 2009. Per share data and total return reflect activity from that date.
(b) Per share data was calculated using the average shares outstanding during the period.
(c) Total return at net asset value.
(d) Not annualized.
(e) The benefits derived from expense reductions had an impact of less than 0.01%.
(f) Annualized.
See Accompanying Notes to Financial Statements.
111
Financial Highlights – Columbia Mid Cap Growth Fund
Selected data for a share outstanding throughout each period is as follows:
| | | Year Ended August 31, | |
| Class Z Shares | | 2009 | | 2008 | | 2007 | | 2006 | | 2005 | |
| Net Asset Value, Beginning of Period | | $ | 23.92 | | | $ | 27.93 | | | $ | 24.35 | | | $ | 22.41 | | | $ | 17.14 | | |
| Income from Investment Operations: | |
| Net investment income (loss) (a) | | | 0.01 | | | | (0.06 | ) | | | 0.05 | (b) | | | (0.05 | ) | | | (0.10 | ) | |
Net realized and unrealized gain (loss) on investments,
foreign currency and written options | | | (5.46 | ) | | | (0.07 | ) | | | 5.04 | | | | 2.30 | | | | 5.37 | | |
| Total from investment operations | | | (5.45 | ) | | | (0.13 | ) | | | 5.09 | | | | 2.25 | | | | 5.27 | | |
| Less Distributions to Shareholders: | |
| From net investment income | | | — | | | | — | | | | (0.05 | ) | | | — | | | | — | | |
| From net realized gains | | | (0.49 | ) | | | (3.88 | ) | | | (1.46 | ) | | | (0.31 | ) | | | — | | |
| Total distributions to shareholders | | | (0.49 | ) | | | (3.88 | ) | | | (1.51 | ) | | | (0.31 | ) | | | — | | |
| Increase from regulatory settlements | | | — | (c) | | | — | | | | — | | | | — | | | | — | | |
| Net Asset Value, End of Period | | $ | 17.98 | | | $ | 23.92 | | | $ | 27.93 | | | $ | 24.35 | | | $ | 22.41 | | |
| Total return (d) | | | (22.16 | )% | | | (1.97 | )% | | | 21.49 | % | | | 10.06 | %(e) | | | 30.75 | %(e) | |
| Ratios to Average Net Assets/Supplemental Data: | |
| Net expenses before interest expense (f) | | | 1.01 | % | | | 0.93 | % | | | 0.92 | % | | | 0.96 | % | | | 0.98 | % | |
| Interest expense | | | — | | | | — | %(g) | | | — | %(g) | | | — | | | | — | %(g) | |
| Net expenses (f) | | | 1.01 | % | | | 0.93 | % | | | 0.92 | % | | | 0.96 | % | | | 0.98 | % | |
| Waiver/Reimbursement | | | — | | | | — | | | | — | | | | 0.01 | % | | | 0.05 | % | |
| Net investment income (loss) (f) | | | 0.05 | % | | | (0.23 | )% | | | 0.20 | % | | | (0.20 | )% | | | (0.52 | )% | |
| Portfolio turnover rate | | | 160 | % | | | 149 | % | | | 171 | % | | | 67 | % | | | 104 | % | |
| Net assets, end of period (000s) | | $ | 954,718 | | | $ | 1,286,857 | | | $ | 1,452,707 | | | $ | 807,089 | | | $ | 799,505 | | |
(a) Per share data was calculated using the average shares outstanding during the period.
(b) Net investment income per share reflects special dividends. The effect of these dvidends amounted to $0.07 per share.
(c) Rounds to less than $0.01.
(d) Total return at net asset value assuming all distributions reinvested.
(e) Had the investment advisor and/or any of its affiliates not waived fees or reimbursed a portion of expenses, total return would have been reduced.
(f) The benefits derived from expense reductions had an impact of less than 0.01%.
(g) Rounds to less than 0.01%.
See Accompanying Notes to Financial Statements.
112
Financial Highlights – Columbia Small Cap Growth Fund I
Selected data for a share outstanding throughout each period is as follows:
| | | Year Ended August 31, | | Period Ended
August 31, | |
| Class A Shares | | 2009 | | 2008 | | 2007 | | 2006 (a) | |
| Net Asset Value, Beginning of Period | | $ | 27.82 | | | $ | 31.69 | | | $ | 30.29 | | | $ | 27.47 | | |
| Income from Investment Operations: | |
| Net investment loss (b) | | | (0.19 | ) | | | (0.24 | ) | | | (0.25 | ) | | | (0.30 | ) | |
Net realized and unrealized gain (loss) on investments,
foreign currency and written options | | | (6.81 | ) | | | 0.17 | | | | 6.38 | | | | 4.01 | | |
| Total from investment operations | | | (7.00 | ) | | | (0.07 | ) | | | 6.13 | | | | 3.71 | | |
| Less Distributions to Shareholders: | |
| From net realized gains | | | — | | | | (3.80 | ) | | | (4.73 | ) | | | (0.89 | ) | |
| Net Asset Value, End of Period | | $ | 20.82 | | | $ | 27.82 | | | $ | 31.69 | | | $ | 30.29 | | |
| Total return (c) | | | (25.16 | )%(d) | | | (1.34 | )%(e) | | | 21.96 | % | | | 13.73 | %(f) | |
| Ratios to Average Net Assets/Supplemental Data: | |
| Net expenses before interest expense (g) | | | 1.37 | % | | | 1.37 | % | | | 1.40 | % | | | 1.46 | %(h) | |
| Interest expense | | | — | | | | — | | | | — | %(i) | | | — | %(h)(i) | |
| Net expenses (g) | | | 1.37 | % | | | 1.37 | % | | | 1.40 | % | | | 1.46 | %(h) | |
| Waiver/Reimbursement | | | 0.03 | % | | | — | | | | — | | | | — | | |
| Net investment loss (g) | | | (1.01 | )% | | | (0.82 | )% | | | (0.82 | )% | | | (1.15 | )%(h) | |
| Portfolio turnover rate | | | 149 | % | | | 165 | % | | | 151 | % | | | 109 | %(f) | |
| Net assets, end of period (000s) | | $ | 54,384 | | | $ | 44,184 | | | $ | 18,430 | | | $ | 2,836 | | |
(a) Class A shares were initially offered on November 1, 2005.
(b) Per share data was calculated using the average shares outstanding during the period.
(c) Total return at net asset value assuming all distributions reinvested and no initial sales charge or contingent deferred sales charge.
(d) Had the investment advisor and/or any of its affiliates not waived fees or reimbursed a portion of expenses, total return would have been reduced.
(e) Total return includes a voluntary reimbursement by the investment advisor for a realized investment loss due to a trading error. This reimbursement increased total return and net asset value per share by less than 0.01% and less than $0.01, respectively.
(f) Not annualized.
(g) The benefits derived from expense reductions had an impact of less than 0.01%.
(h) Annualized.
(i) Rounds to less than 0.01%.
See Accompanying Notes to Financial Statements.
113
Financial Highlights – Columbia Small Cap Growth Fund I
Selected data for a share outstanding throughout each period is as follows:
| | | Year Ended August 31, | | Period Ended
August 31, | |
| Class B Shares | | 2009 | | 2008 | | 2007 | | 2006 (a) | |
| Net Asset Value, Beginning of Period | | $ | 27.39 | | | $ | 31.26 | | | $ | 30.14 | | | $ | 27.47 | | |
| Income from Investment Operations: | |
| Net investment loss (b) | | | (0.32 | ) | | | (0.45 | ) | | | (0.48 | ) | | | (0.50 | ) | |
Net realized and unrealized gain (loss) on investments,
foreign currency and written options | | | (6.72 | ) | | | 0.14 | | | | 6.33 | | | | 4.06 | | |
| Total from investment operations | | | (7.04 | ) | | | (0.31 | ) | | | 5.85 | | | | 3.56 | | |
| Less Distributions to Shareholders: | |
| From net realized gains | | | — | | | | (3.56 | ) | | | (4.73 | ) | | | (0.89 | ) | |
| Net Asset Value, End of Period | | $ | 20.35 | | | $ | 27.39 | | | $ | 31.26 | | | $ | 30.14 | | |
| Total return (c) | | | (25.70 | )%(d) | | | (2.10 | )%(e) | | | 21.05 | % | | | 13.17 | %(f) | |
| Ratios to Average Net Assets/Supplemental Data: | |
| Net expenses before interest expense (g) | | | 2.12 | % | | | 2.12 | % | | | 2.15 | % | | | 2.21 | %(h) | |
| Interest expense | | | — | | | | — | | | | — | %(i) | | | — | %(h)(i) | |
| Net expenses (g) | | | 2.12 | % | | | 2.12 | % | | | 2.15 | % | | | 2.21 | %(h) | |
| Waiver/Reimbursement | | | 0.03 | % | | | — | | | | — | | | | — | | |
| Net investment loss (g) | | | (1.75 | )% | | | (1.57 | )% | | | (1.57 | )% | | | (1.92 | )%(h) | |
| Portfolio turnover rate | | | 149 | % | | | 165 | % | | | 151 | % | | | 109 | %(f) | |
| Net assets, end of period (000s) | | $ | 2,620 | | | $ | 2,812 | | | $ | 1,254 | | | $ | 521 | | |
(a) Class B shares were initially offered on November 1, 2005.
(b) Per share data was calculated using the average shares outstanding during the period.
(c) Total return at net asset value assuming all distributions reinvested and no contingent deferred sales charge.
(d) Had the investment advisor and/or any of its affiliates not waived fees or reimbursed a portion of expenses, total return would have been reduced.
(e) Total return includes a voluntary reimbursement by the investment advisor for a realized investment loss due to a trading error. This reimbursement increased total return and net asset value per share by less than 0.01% and less than $0.01, respectively.
(f) Not annualized.
(g) The benefits derived from expense reductions had an impact of less than 0.01%.
(h) Annualized.
(i) Rounds to less than 0.01%.
See Accompanying Notes to Financial Statements.
114
Financial Highlights – Columbia Small Cap Growth Fund I
Selected data for a share outstanding throughout each period is as follows:
| | | Year Ended August 31, | | Period Ended
August 31, | |
| Class C Shares | | 2009 | | 2008 | | 2007 | | 2006 (a) | |
| Net Asset Value, Beginning of Period | | $ | 27.37 | | | $ | 31.25 | | | $ | 30.14 | | | $ | 27.47 | | |
| Income from Investment Operations: | |
| Net investment loss (b) | | | (0.32 | ) | | | (0.44 | ) | | | (0.48 | ) | | | (0.49 | ) | |
Net realized and unrealized gain (loss) on investments,
foreign currency and written options | | | (6.70 | ) | | | 0.12 | | | | 6.32 | | | | 4.05 | | |
| Total from investment operations | | | (7.02 | ) | | | (0.32 | ) | | | 5.84 | | | | 3.56 | | |
| Less Distributions to Shareholders: | |
| From net realized gains | | | — | | | | (3.56 | ) | | | (4.73 | ) | | | (0.89 | ) | |
| Net Asset Value, End of Period | | $ | 20.35 | | | $ | 27.37 | | | $ | 31.25 | | | $ | 30.14 | | |
| Total return (c) | | | (25.65 | )%(d) | | | (2.14 | )%(e) | | | 21.02 | % | | | 13.17 | %(f) | |
| Ratios to Average Net Assets/Supplemental Data: | |
| Net expenses before interest expense (g) | | | 2.12 | % | | | 2.12 | % | | | 2.15 | % | | | 2.21 | %(h) | |
| Interest expense | | | — | | | | — | | | | — | %(i) | | | — | %(h)(i) | |
| Net expenses (g) | | | 2.12 | % | | | 2.12 | % | | | 2.15 | % | | | 2.21 | %(h) | |
| Waiver/Reimbursement | | | 0.03 | % | | | — | | | | — | | | | — | | |
| Net investment loss (g) | | | (1.75 | )% | | | (1.57 | )% | | | (1.56 | )% | | | (1.92 | )%(h) | |
| Portfolio turnover rate | | | 149 | % | | | 165 | % | | | 151 | % | | | 109 | %(f) | |
| Net assets, end of period (000s) | | $ | 10,093 | | | $ | 8,382 | | | $ | 2,303 | | | $ | 427 | | |
(a) Class C shares were initially offered on November 1, 2005.
(b) Per share data was calculated using the average shares outstanding during the period.
(c) Total return at net asset value assuming all distributions reinvested and no contingent deferred sales charge.
(d) Had the investment advisor and/or any of its affiliates not waived fees or reimbursed a portion of expenses, total return would have been reduced.
(e) Total return includes a voluntary reimbursement by the investment advisor for a realized investment loss due to a trading error. This reimbursement increased total return and net asset value per share by less than 0.01% and less than $0.01, respectively.
(f) Not annualized.
(g) The benefits derived from expense reductions had an impact of less than 0.01%.
(h) Annualized.
(i) Rounds to less than 0.01%.
See Accompanying Notes to Financial Statements.
115
Financial Highlights – Columbia Small Cap Growth Fund I
Selected data for a share outstanding throughout the period is as follows:
| Class Y Shares | | Period Ended
August 31,
2009 (a) | |
| Net Asset Value, Beginning of Period | | $ | 19.21 | | |
| Income from Investment Operations: | |
| Net investment loss (b) | | | (0.03 | ) | |
| Net realized and unrealized gain on investments and foreign currency | | | 1.82 | | |
| Total from investment operations | | | 1.79 | | |
| Net Asset Value, End of Period | | $ | 21.00 | | |
| Total return (c)(d) | | | 9.32 | % | |
| Ratios to Average Net Assets/Supplemental Data: | |
| Net expenses (e)(f) | | | 1.03 | % | |
| Net investment loss (e)(f) | | | (0.96 | )% | |
| Portfolio turnover rate (d) | | | 149 | % | |
| Net assets, end of period (000s) | | $ | 14,222 | | |
(a) Class Y shares commenced operations on July 15, 2009. Per share data and total return reflect activity from that date.
(b) Per share data was calculated using the average shares outstanding during the period.
(c) Total return at net asset value.
(d) Not annualized.
(e) The benefits derived from expense reductions had an impact of less than 0.01%.
(f) Annualized.
See Accompanying Notes to Financial Statements.
116
Financial Highlights – Columbia Small Cap Growth Fund I
Selected data for a share outstanding throughout each period is as follows:
| | | Year Ended August 31, | |
| Class Z Shares | | 2009 | | 2008 | | 2007 | | 2006 | | 2005 | |
| Net Asset Value, Beginning of Period | | $ | 27.99 | | | $ | 31.86 | | | $ | 30.36 | | | $ | 27.80 | | | $ | 21.32 | | |
| Income from Investment Operations: | |
| Net investment loss (a) | | | (0.14 | ) | | | (0.17 | ) | | | (0.18 | ) | | | (0.29 | ) | | | (0.24 | ) | |
Net realized and unrealized gain (loss) on investments,
foreign currency and written options | | | (6.85 | ) | | | 0.18 | | | | 6.41 | | | | 3.74 | | | | 6.72 | | |
| Total from investment operations | | | (6.99 | ) | | | 0.01 | | | | 6.23 | | | | 3.45 | | | | 6.48 | | |
| Less Distributions to Shareholders: | |
| From net investment income | | | — | | | | — | | | | — | (b) | | | — | | | | — | | |
| From net realized gains | | | — | | | | (3.88 | ) | | | (4.73 | ) | | | (0.89 | ) | | | — | | |
| Total distributions to shareholders | | | — | | | | (3.88 | ) | | | (4.73 | ) | | | (0.89 | ) | | | — | | |
| Net Asset Value, End of Period | | $ | 21.00 | | | $ | 27.99 | | | $ | 31.86 | | | $ | 30.36 | | | $ | 27.80 | | |
| Total return (c) | | | (24.97 | )%(d) | | | (1.09 | )%(e) | | | 22.28 | % | | | 12.64 | %(d) | | | 30.39 | %(f) | |
| Ratios to Average Net Assets/Supplemental Data: | |
| Net expenses before interest expense (g) | | | 1.12 | % | | | 1.12 | % | | | 1.15 | % | | | 1.20 | % | | | 1.16 | % | |
| Interest expense | | | — | | | | — | | | | — | %(h) | | | — | %(h) | | | — | %(h) | |
| Net expenses (g) | | | 1.12 | % | | | 1.12 | % | | | 1.15 | % | | | 1.20 | % | | | 1.16 | % | |
| Waiver/Reimbursement | | | 0.03 | % | | | — | | | | — | | | | — | %(h) | | | — | | |
| Net investment loss (g) | | | (0.76 | )% | | | (0.57 | )% | | | (0.59 | )% | | | (0.96 | )% | | | (0.99 | )% | |
| Portfolio turnover rate | | | 149 | % | | | 165 | % | | | 151 | % | | | 109 | % | | | 114 | % | |
| Net assets, end of period (000s) | | $ | 509,514 | | | $ | 354,145 | | | $ | 220,887 | | | $ | 193,493 | | | $ | 214,659 | | |
(a) Per share data was calculated using the average shares outstanding during the period.
(b) Rounds to less than $0.01 per share.
(c) Total return at net asset value assuming all distributions reinvested.
(d) Had the investment advisor and/or any of its affiliates not waived fees or reimbursed a portion of expenses, total return would have been reduced.
(e) Total return includes a voluntary reimbursement by the investment advisor for a realized investment loss due to a trading error. This reimbursement increased total return and net asset value per share by less than 0.01% and less than $0.01, respectively.
(f) Total return includes a reimbursement of loss experienced by the Fund due to compliance violation. This reimbursement had an impact of less than 0.01% on the Fund's total return.
(g) The benefits derived from expense reductions had an impact of less than 0.01%.
(h) Rounds to less than 0.01%.
See Accompanying Notes to Financial Statements.
117
Financial Highlights – Columbia Technology Fund
Selected data for a share outstanding throughout each period is as follows:
| | | Year Ended August 31, | |
| Class A Shares | | 2009 | | 2008 | | 2007 | | 2006 | | 2005 | |
| Net Asset Value, Beginning of Period | | $ | 9.72 | | | $ | 11.62 | | | $ | 9.33 | | | $ | 8.77 | | | $ | 6.50 | | |
| Income from Investment Operations: | |
| Net investment loss (a) | | | (0.05 | ) | | | (0.07 | ) | | | (0.10 | ) | | | (0.09 | ) | | | (0.04 | ) | |
Net realized and unrealized gain (loss) on investments,
foreign currency, futures contracts and written options | | | (2.09 | ) | | | (1.22 | ) | | | 2.39 | | | | 1.21 | | | | 2.31 | | |
| Total from investment operations | | | (2.14 | ) | | | (1.29 | ) | | | 2.29 | | | | 1.12 | | | | 2.27 | | |
| Less Distributions to Shareholders: | |
| From net realized gains | | | — | | | | (0.61 | ) | | | — | | | | (0.56 | ) | | | — | | |
| Net Asset Value, End of Period | | $ | 7.58 | | | $ | 9.72 | | | $ | 11.62 | | | $ | 9.33 | | | $ | 8.77 | | |
| Total return (b) | | | (22.02 | )%(c) | | | (12.13 | )% | | | 24.54 | % | | | 12.78 | %(c) | | | 34.92 | %(c) | |
| Ratios to Average Net Assets/Supplemental Data: | |
| Net expenses before interest expense (d) | | | 1.46 | % | | | 1.36 | % | | | 1.46 | % | | | 1.45 | % | | | 1.85 | % | |
| Interest expense | | | — | | | | — | | | | — | %(e) | | | — | %(e) | | | — | | |
| Net expenses (d) | | | 1.46 | % | | | 1.36 | % | | | 1.46 | % | | | 1.45 | % | | | 1.85 | % | |
| Waiver/Reimbursement | | | 0.07 | % | | | — | | | | — | | | | — | %(e) | | | 0.06 | % | |
| Net investment loss (d) | | | (0.80 | )% | | | (0.69 | )% | | | (0.96 | )% | | | (0.95 | )% | | | (1.47 | )% | |
| Portfolio turnover rate | | | 284 | % | | | 263 | % | | | 210 | % | | | 350 | % | | | 328 | % | |
| Net assets, end of period (000s) | | $ | 81,321 | | | $ | 137,181 | | | $ | 109,541 | | | $ | 75,996 | | | $ | 14,696 | | |
(a) Per share data was calculated using the average shares outstanding during the period.
(b) Total return at net asset value assuming all distributions reinvested and no initial sales charge or contingent deferred sales charge.
(c) Had the investment advisor and/or any of its affiliates not waived fees or reimbursed a portion of expenses, total return would have been reduced.
(d) The benefits derived from expense reductions had an impact of less than 0.01%.
(e) Rounds to less than 0.01%.
See Accompanying Notes to Financial Statements.
118
Financial Highlights – Columbia Technology Fund
Selected data for a share outstanding throughout each period is as follows:
| | | Year Ended August 31, | |
| Class B Shares | | 2009 | | 2008 | | 2007 | | 2006 | | 2005 | |
| Net Asset Value, Beginning of Period | | $ | 9.39 | | | $ | 11.25 | | | $ | 9.10 | | | $ | 8.57 | | | $ | 6.40 | | |
| Income from Investment Operations: | |
| Net investment loss (a) | | | (0.10 | ) | | | (0.15 | ) | | | (0.17 | ) | | | (0.16 | ) | | | (0.17 | ) | |
Net realized and unrealized gain (loss) on investments,
foreign currency, futures contracts and written options | | | (2.03 | ) | | | (1.19 | ) | | | 2.32 | | | | 1.19 | | | | 2.34 | | |
| Total from investment operations | | | (2.13 | ) | | | (1.34 | ) | | | 2.15 | | | | 1.03 | | | | 2.17 | | |
| Less Distributions to Shareholders: | |
| From net realized gains | | | — | | | | (0.52 | ) | | | — | | | | (0.50 | ) | | | — | | |
| Net Asset Value, End of Period | | $ | 7.26 | | | $ | 9.39 | | | $ | 11.25 | | | $ | 9.10 | | | $ | 8.57 | | |
| Total return (b) | | | (22.68 | )%(c) | | | (12.80 | )% | | | 23.63 | % | | | 11.98 | %(c) | | | 33.91 | %(c) | |
| Ratios to Average Net Assets/Supplemental Data: | |
| Net expenses before interest expense (d) | | | 2.21 | % | | | 2.11 | % | | | 2.21 | % | | | 2.20 | % | | | 2.60 | % | |
| Interest expense | | | — | | | | — | | | | — | %(e) | | | — | %(e) | | | — | | |
| Net expenses (d) | | | 2.21 | % | | | 2.11 | % | | | 2.21 | % | | | 2.20 | % | | | 2.60 | % | |
| Waiver/Reimbursement | | | 0.07 | % | | | — | | | | — | | | | — | %(e) | | | 0.06 | % | |
| Net investment loss (d) | | | (1.55 | )% | | | (1.43 | )% | | | (1.70 | )% | | | (1.70 | )% | | | (2.29 | )% | |
| Portfolio turnover rate | | | 284 | % | | | 263 | % | | | 210 | % | | | 350 | % | | | 328 | % | |
| Net assets, end of period (000s) | | $ | 6,562 | | | $ | 10,812 | | | $ | 10,580 | | | $ | 7,823 | | | $ | 3,183 | | |
(a) Per share data was calculated using the average shares outstanding during the period.
(b) Total return at net asset value assuming all distributions reinvested and no contingent deferred sales charge.
(c) Had the investment advisor and/or any of its affiliates not waived fees or reimbursed a portion of expenses, total return would have been reduced.
(d) The benefits derived from expense reductions had an impact of less than 0.01%.
(e) Rounds to less than 0.01%.
See Accompanying Notes to Financial Statements.
119
Financial Highlights – Columbia Technology Fund
Selected data for a share outstanding throughout each period is as follows:
| | | Year Ended August 31, | |
| Class C Shares | | 2009 | | 2008 | | 2007 | | 2006 | | 2005 | |
| Net Asset Value, Beginning of Period | | $ | 9.41 | | | $ | 11.27 | | | $ | 9.12 | | | $ | 8.59 | | | $ | 6.41 | | |
| Income from Investment Operations: | |
| Net investment loss (a) | | | (0.10 | ) | | | (0.15 | ) | | | (0.17 | ) | | | (0.16 | ) | | | (0.17 | ) | |
Net realized and unrealized gain (loss) on investments,
foreign currency, futures contracts and written options | | | (2.04 | ) | | | (1.19 | ) | | | 2.32 | | | | 1.19 | | | | 2.35 | | |
| Total from investment operations | | | (2.14 | ) | | | (1.34 | ) | | | 2.15 | | | | 1.03 | | | | 2.18 | | |
| Less Distributions to Shareholders: | |
| From net realized gains | | | — | | | | (0.52 | ) | | | — | | | | (0.50 | ) | | | — | | |
| Net Asset Value, End of Period | | $ | 7.27 | | | $ | 9.41 | | | $ | 11.27 | | | $ | 9.12 | | | $ | 8.59 | | |
| Total return (b) | | | (22.74 | )%(c) | | | (12.78 | )% | | | 23.57 | % | | | 11.95 | %(c) | | | 34.01 | %(c) | |
| Ratios to Average Net Assets/Supplemental Data: | |
| Net expenses before interest expense (d) | | | 2.21 | % | | | 2.11 | % | | | 2.21 | % | | | 2.20 | % | | | 2.60 | % | |
| Interest expense | | | — | | | | — | | | | — | %(e) | | | — | %(e) | | | — | | |
| Net expenses (d) | | | 2.21 | % | | | 2.11 | % | | | 2.21 | % | | | 2.20 | % | | | 2.60 | % | |
| Waiver/Reimbursement | | | 0.07 | % | | | — | | | | — | | | | — | %(e) | | | 0.06 | % | |
| Net investment loss (d) | | | (1.55 | )% | | | (1.45 | )% | | | (1.70 | )% | | | (1.70 | )% | | | (2.23 | )% | |
| Portfolio turnover rate | | | 284 | % | | | 263 | % | | | 210 | % | | | 350 | % | | | 328 | % | |
| Net assets, end of period (000s) | | $ | 24,410 | | | $ | 44,466 | | | $ | 36,325 | | | $ | 21,018 | | | $ | 1,972 | | |
(a) Per share data was calculated using the average shares outstanding during the period.
(b) Total return at net asset value assuming all distributions reinvested and no contingent deferred sales charge.
(c) Had the investment advisor and/or any of its affiliates not waived fees or reimbursed a portion of expenses, total return would have been reduced.
(d) The benefits derived from expense reductions had an impact of less than 0.01%.
(e) Rounds to less than 0.01%.
See Accompanying Notes to Financial Statements.
120
Financial Highlights – Columbia Technology Fund
Selected data for a share outstanding throughout each period is as follows:
| | | Year Ended August 31, | |
| Class Z Shares | | 2009 | | 2008 | | 2007 | | 2006 | | 2005 | |
| Net Asset Value, Beginning of Period | | $ | 9.86 | | | $ | 11.78 | | | $ | 9.43 | | | $ | 8.86 | | | $ | 6.55 | | |
| Income from Investment Operations: | |
| Net investment loss (a) | | | (0.04 | ) | | | (0.05 | ) | | | (0.08 | ) | | | (0.07 | ) | | | (0.10 | ) | |
Net realized and unrealized gain (loss) on investments,
foreign currency, futures contracts and written options | | | (2.12 | ) | | | (1.23 | ) | | | 2.43 | | | | 1.22 | | | | 2.41 | | |
| Total from investment operations | | | (2.16 | ) | | | (1.28 | ) | | | 2.35 | | | | 1.15 | | | | 2.31 | | |
| Less Distributions to Shareholders: | |
| From net realized gains | | | — | | | | (0.64 | ) | | | — | | | | (0.58 | ) | | | — | | |
| Net Asset Value, End of Period | | $ | 7.70 | | | $ | 9.86 | | | $ | 11.78 | | | $ | 9.43 | | | $ | 8.86 | | |
| Total return (b) | | | (21.91 | )%(c) | | | (11.93 | )% | | | 24.92 | % | | | 13.01 | %(c) | | | 35.27 | %(c) | |
| Ratios to Average Net Assets/Supplemental Data: | |
| Net expenses before interest expense (d) | | | 1.21 | % | | | 1.11 | % | | | 1.21 | % | | | 1.20 | % | | | 1.60 | % | |
| Interest expense | | | — | | | | — | | | | — | %(e) | | | — | %(e) | | | — | | |
| Net expenses (d) | | | 1.21 | % | | | 1.11 | % | | | 1.21 | % | | | 1.20 | % | | | 1.60 | % | |
| Waiver/Reimbursement | | | 0.07 | % | | | — | | | | — | | | | — | %(e) | | | 0.06 | % | |
| Net investment loss (d) | | | (0.54 | )% | | | (0.45 | )% | | | (0.70 | )% | | | (0.71 | )% | | | (1.29 | )% | |
| Portfolio turnover rate | | | 284 | % | | | 263 | % | | | 210 | % | | | 350 | % | | | 328 | % | |
| Net assets, end of period (000s) | | $ | 155,332 | | | $ | 208,883 | | | $ | 137,420 | | | $ | 70,767 | | | $ | 40,947 | | |
(a) Per share data was calculated using the average shares outstanding during the period.
(b) Total return at net asset value assuming all distributions reinvested.
(c) Had the investment advisor and/or any of its affiliates not waived fees or reimbursed a portion of expenses, total return would have been reduced.
(d) The benefits derived from expense reductions had an impact of less than 0.01%.
(e) Rounds to less than 0.01%.
See Accompanying Notes to Financial Statements.
121
Financial Highlights – Columbia Balanced Fund
Selected data for a share outstanding throughout each period is as follows:
| | | Year Ended August 31, | |
| Class A Shares | | 2009 | | 2008 | | 2007 | | 2006 | | 2005 | |
| Net Asset Value, Beginning of Period | | $ | 24.03 | | | $ | 24.77 | | | $ | 22.51 | | | $ | 21.75 | | | $ | 19.86 | | |
| Income from Investment Operations: | |
| Net investment income (a) | | | 0.47 | | | | 0.53 | | | | 0.48 | | | | 0.38 | | | | 0.02 | (b) | |
Net realized and unrealized gain (loss) on investments
and futures contracts | | | (1.52 | ) | | | (0.56 | ) | | | 2.26 | | | | 0.78 | | | | 2.28 | | |
| Total from investment operations | | | (1.05 | ) | | | (0.03 | ) | | | 2.74 | | | | 1.16 | | | | 2.30 | | |
| Less Distributions to Shareholders: | |
| From net investment income | | | (0.52 | ) | | | (0.56 | ) | | | (0.48 | ) | | | (0.40 | ) | | | (0.41 | ) | |
| From net realized gains | | | — | | | | (0.15 | ) | | | — | | | | — | | | | — | | |
| Total distributions to shareholders | | | (0.52 | ) | | | (0.71 | ) | | | (0.48 | ) | | | (0.40 | ) | | | (0.41 | ) | |
| Net Asset Value, End of Period | | $ | 22.46 | | | $ | 24.03 | | | $ | 24.77 | | | $ | 22.51 | | | $ | 21.75 | | |
| Total return (c) | | | (4.03 | )% | | | (0.22 | )% | | | 12.26 | % | | | 5.40 | %(d) | | | 11.72 | % | |
| Ratios to Average Net Assets/Supplemental Data: | |
| Net expenses before interest expense (e) | | | 1.04 | % | | | 0.99 | % | | | 1.02 | % | | | 0.98 | % | | | 1.02 | % | |
| Interest expense | | | — | | | | — | | | | — | | | | — | %(f) | | | — | | |
| Net expenses (e) | | | 1.04 | % | | | 0.99 | % | | | 1.02 | % | | | 0.98 | % | | | 1.02 | % | |
| Waiver/Reimbursement | | | — | | | | — | | | | — | | | | 0.01 | % | | | — | | |
| Net investment income (e) | | | 2.33 | % | | | 2.14 | % | | | 1.98 | % | | | 1.71 | % | | | 1.80 | % | |
| Portfolio turnover rate | | | 102 | % | | | 94 | % | | | 78 | % | | | 59 | % | | | 63 | % | |
| Net assets, end of period (000s) | | $ | 19,152 | | | $ | 10,712 | | | $ | 6,582 | | | $ | 4,137 | | | $ | 3,378 | | |
(a) Per share data was calculated using the average shares outstanding during the period.
(b) Net investment income per share reflects a special dividend. The effect of this dividend amounted to $0.06 per share.
(c) Total return at net asset value assuming all distributions reinvested and no initial sales charge or contingent deferred sales charge.
(d) Had the investment advisor and/or any of its affiliates not waived fees or reimbursed a portion of expenses, total return would have been reduced.
(e) The benefits derived from expense reductions had an impact of less than 0.01%.
(f) Rounds to less than 0.01%.
See Accompanying Notes to Financial Statements.
122
Financial Highlights – Columbia Balanced Fund
Selected data for a share outstanding throughout each period is as follows:
| | | Year Ended August 31, | |
| Class B Shares | | 2009 | | 2008 | | 2007 | | 2006 | | 2005 | |
| Net Asset Value, Beginning of Period | | $ | 23.99 | | | $ | 24.73 | | | $ | 22.47 | | | $ | 21.72 | | | $ | 19.83 | | |
| Income from Investment Operations: | |
| Net investment income (a) | | | 0.32 | | | | 0.34 | | | | 0.29 | | | | 0.21 | | | | 0.01 | (b) | |
Net realized and unrealized gain (loss) on investments
and futures contracts | | | (1.53 | ) | | | (0.56 | ) | | | 2.27 | | | | 0.78 | | | | 2.14 | | |
| Total from investment operations | | | (1.21 | ) | | | (0.22 | ) | | | 2.56 | | | | 0.99 | | | | 2.15 | | |
| Less Distributions to Shareholders: | |
| From net investment income | | | (0.37 | ) | | | (0.37 | ) | | | (0.30 | ) | | | (0.24 | ) | | | (0.26 | ) | |
| From net realized gains | | | — | | | | (0.15 | ) | | | — | | | | — | | | | — | | |
| Total distributions to shareholders | | | (0.37 | ) | | | (0.52 | ) | | | (0.30 | ) | | | (0.24 | ) | | | (0.26 | ) | |
| Net Asset Value, End of Period | | $ | 22.41 | | | $ | 23.99 | | | $ | 24.73 | | | $ | 22.47 | | | $ | 21.72 | | |
| Total return (c) | | | (4.82 | )% | | | (0.97 | )% | | | 11.45 | % | | | 4.57 | %(d) | | | 10.91 | % | |
| Ratios to Average Net Assets/Supplemental Data: | |
| Net expenses before interest expense (e) | | | 1.79 | % | | | 1.74 | % | | | 1.77 | % | | | 1.73 | % | | | 1.77 | % | |
| Interest expense | | | — | | | | — | | | | — | | | | — | %(f) | | | — | | |
| Net expenses (e) | | | 1.79 | % | | | 1.74 | % | | | 1.77 | % | | | 1.73 | % | | | 1.77 | % | |
| Waiver/Reimbursement | | | — | | | | — | | | | — | | | | 0.01 | % | | | — | | |
| Net investment income (e) | | | 1.63 | % | | | 1.37 | % | | | 1.20 | % | | | 0.95 | % | | | 1.07 | % | |
| Portfolio turnover rate | | | 102 | % | | | 94 | % | | | 78 | % | | | 59 | % | | | 63 | % | |
| Net assets, end of period (000s) | | $ | 6,934 | | | $ | 7,551 | | | $ | 6,955 | | | $ | 7,213 | | | $ | 8,149 | | |
(a) Per share data was calculated using the average shares outstanding during the period.
(b) Net investment income per share reflects a special dividend. The effect of this dividend amounted to $0.06 per share.
(c) Total return at net asset value assuming all distributions reinvested and no contingent deferred sales charge.
(d) Had the investment advisor and/or any of its affiliates not waived fees or reimbursed a portion of expenses, total return would have been reduced.
(e) The benefits derived from expense reductions had an impact of less than 0.01%.
(f) Rounds to less than 0.01%.
See Accompanying Notes to Financial Statements.
123
Financial Highlights – Columbia Balanced Fund
Selected data for a share outstanding throughout each period is as follows:
| | | Year Ended August 31, | |
| Class C Shares | | 2009 | | 2008 | | 2007 | | 2006 | | 2005 | |
| Net Asset Value, Beginning of Period | | $ | 23.99 | | | $ | 24.73 | | | $ | 22.48 | | | $ | 21.72 | | | $ | 19.83 | | |
| Income from Investment Operations: | |
| Net investment income (a) | | | 0.31 | | | | 0.34 | | | | 0.29 | | | | 0.21 | | | | 0.01 | (b) | |
Net realized and unrealized gain (loss) on investments
and futures contracts | | | (1.51 | ) | | | (0.56 | ) | | | 2.26 | | | | 0.79 | | | | 2.14 | | |
| Total from investment operations | | | (1.20 | ) | | | (0.22 | ) | | | 2.55 | | | | 1.00 | | | | 2.15 | | |
| Less Distributions to Shareholders: | |
| From net investment income | | | (0.37 | ) | | | (0.37 | ) | | | (0.30 | ) | | | (0.24 | ) | | | (0.26 | ) | |
| From net realized gains | | | — | | | | (0.15 | ) | | | — | | | | — | | | | — | | |
| Total distributions to shareholders | | | (0.37 | ) | | | (0.52 | ) | | | (0.30 | ) | | | (0.24 | ) | | | (0.26 | ) | |
| Net Asset Value, End of Period | | $ | 22.42 | | | $ | 23.99 | | | $ | 24.73 | | | $ | 22.48 | | | $ | 21.72 | | |
| Total return (c) | | | (4.77 | )% | | | (0.97 | )% | | | 11.40 | % | | | 4.62 | %(d) | | | 10.91 | % | |
| Ratios to Average Net Assets/Supplemental Data: | |
| Net expenses before interest expense (e) | | | 1.79 | % | | | 1.74 | % | | | 1.77 | % | | | 1.73 | % | | | 1.77 | % | |
| Interest expense | | | — | | | | — | | | | — | | | | — | %(f) | | | — | | |
| Net expenses (e) | | | 1.79 | % | | | 1.74 | % | | | 1.77 | % | | | 1.73 | % | | | 1.77 | % | |
| Waiver/Reimbursement | | | — | | | | — | | | | — | | | | 0.01 | % | | | — | | |
| Net investment income (e) | | | 1.57 | % | | | 1.39 | % | | | 1.20 | % | | | 0.98 | % | | | 1.06 | % | |
| Portfolio turnover rate | | | 102 | % | | | 94 | % | | | 78 | % | | | 59 | % | | | 63 | % | |
| Net assets, end of period (000s) | | $ | 11,014 | | | $ | 3,209 | | | $ | 1,887 | | | $ | 1,491 | | | $ | 952 | | |
(a) Per share data was calculated using the average shares outstanding during the period.
(b) Net investment income per share reflects a special dividend. The effect of this dividend amounted to $0.06 per share.
(c) Total return at net asset value assuming all distributions reinvested and no contingent deferred sales charge.
(d) Had the investment advisor and/or any of its affiliates not waived fees or reimbursed a portion of expenses, total return would have been reduced.
(e) The benefits derived from expense reductions had an impact of less than 0.01%.
(f) Rounds to less than 0.01%.
See Accompanying Notes to Financial Statements.
124
Financial Highlights – Columbia Balanced Fund
Selected data for a share outstanding throughout each period is as follows:
| | | Year Ended August 31, | |
| Class Z Shares | | 2009 | | 2008 | | 2007 | | 2006 | | 2005 | |
| Net Asset Value, Beginning of Period | | $ | 24.02 | | | $ | 24.75 | | | $ | 22.50 | | | $ | 21.74 | | | $ | 19.84 | | |
| Income from Investment Operations: | |
| Net investment income (a) | | | 0.52 | | | | 0.58 | | | | 0.53 | | | | 0.43 | | | | 0.01 | (b) | |
Net realized and unrealized gain (loss) on investments
and futures contracts | | | (1.54 | ) | | | (0.54 | ) | | | 2.26 | | | | 0.79 | | | | 2.36 | | |
| Total from investment operations | | | (1.02 | ) | | | 0.04 | | | | 2.79 | | | | 1.22 | | | | 2.37 | | |
| Less Distributions to Shareholders: | |
| From net investment income | | | (0.57 | ) | | | (0.62 | ) | | | (0.54 | ) | | | (0.46 | ) | | | (0.47 | ) | |
| From net realized gains | | | — | | | | (0.15 | ) | | | — | | | | — | | | | — | | |
| Total distributions to shareholders | | | (0.57 | ) | | | (0.77 | ) | | | (0.54 | ) | | | (0.46 | ) | | | (0.47 | ) | |
| Net Asset Value, End of Period | | $ | 22.43 | | | $ | 24.02 | | | $ | 24.75 | | | $ | 22.50 | | | $ | 21.74 | | |
| Total return (c) | | | (3.87 | )% | | | 0.07 | % | | | 12.49 | % | | | 5.66 | %(d) | | | 12.06 | % | |
| Ratios to Average Net Assets/Supplemental Data: | |
| Net expenses before interest expense (e) | | | 0.79 | % | | | 0.74 | % | | | 0.77 | % | | | 0.73 | % | | | 0.77 | % | |
| Interest expense | | | — | | | | — | | | | — | | | | — | %(f) | | | — | | |
| Net expenses (e) | | | 0.79 | % | | | 0.74 | % | | | 0.77 | % | | | 0.73 | % | | | 0.77 | % | |
| Waiver/Reimbursement | | | — | | | | — | | | | — | | | | 0.01 | % | | | — | | |
| Net investment income (e) | | | 2.62 | % | | | 2.35 | % | | | 2.19 | % | | | 1.94 | % | | | 2.11 | % | |
| Portfolio turnover rate | | | 102 | % | | | 94 | % | | | 78 | % | | | 59 | % | | | 63 | % | |
| Net assets, end of period (000s) | | $ | 192,819 | | | $ | 176,113 | | | $ | 196,615 | | | $ | 226,694 | | | $ | 301,109 | | |
(a) Per share data was calculated using the average shares outstanding during the period.
(b) Net investment income per share reflects a special dividend. The effect of this dividend amounted to $0.06 per share.
(c) Total return at net asset value assuming all distributions reinvested.
(d) Had the investment advisor and/or any of its affiliates not waived fees or reimbursed a portion of expenses, total return would have been reduced.
(e) The benefits derived from expense reductions had an impact of less than 0.01%.
(f) Rounds to less than 0.01%.
See Accompanying Notes to Financial Statements.
125
Financial Highlights – Columbia Oregon Intermediate Municipal Bond Fund
Selected data for a share outstanding throughout each period is as follows:
| | | Year Ended August 31, | |
| Class A Shares | | 2009 | | 2008 | | 2007 | | 2006 | | 2005 | |
| Net Asset Value, Beginning of Period | | $ | 12.07 | | | $ | 12.02 | | | $ | 12.24 | | | $ | 12.45 | | | $ | 12.45 | | |
| Income from Investment Operations: | |
| Net investment income (a) | | | 0.45 | | | | 0.46 | | | | 0.46 | | | | 0.45 | | | | 0.46 | | |
Net realized and unrealized gain (loss) on investments
and futures contracts | | | 0.09 | | | | 0.05 | | | | (0.23 | ) | | | (0.20 | ) | | | 0.03 | | |
| Total from investment operations | | | 0.54 | | | | 0.51 | | | | 0.23 | | | | 0.25 | | | | 0.49 | | |
| Less Distributions to Shareholders: | |
| From net investment income | | | (0.45 | ) | | | (0.46 | ) | | | (0.45 | ) | | | (0.46 | ) | | | (0.45 | ) | |
| From net realized gains | | | — | | | | — | | | | — | | | | — | | | | (0.04 | ) | |
| Total distributions to shareholders | | | (0.45 | ) | | | (0.46 | ) | | | (0.45 | ) | | | (0.46 | ) | | | (0.49 | ) | |
| Increase from regulatory settlements | | | 0.01 | | | | — | | | | — | | | | — | | | | — | | |
| Net Asset Value, End of Period | | $ | 12.17 | | | $ | 12.07 | | | $ | 12.02 | | | $ | 12.24 | | | $ | 12.45 | | |
| Total return (b) | | | 4.70 | %(c) | | | 4.31 | %(c) | | | 1.92 | % | | | 2.05 | %(c) | | | 4.05 | % | |
| Ratios to Average Net Assets/Supplemental Data: | |
| Net expenses (d) | | | 0.75 | % | | | 0.77 | % | | | 0.88 | % | | | 0.89 | % | | | 0.89 | % | |
| Waiver/Reimbursement | | | 0.14 | % | | | 0.10 | % | | | — | | | | — | %(e) | | | — | | |
| Net investment income (d) | | | 3.74 | % | | | 3.78 | % | | | 3.73 | % | | | 3.72 | % | | | 3.71 | % | |
| Portfolio turnover rate | | | 8 | % | | | 5 | % | | | 16 | % | | | 2 | % | | | 9 | % | |
| Net assets, end of period (000s) | | $ | 15,507 | | | $ | 10,210 | | | $ | 5,519 | | | $ | 6,507 | | | $ | 4,300 | | |
(a) Per share data was calculated using the average shares outstanding during the period.
(b) Total return at net asset value assuming all distributions reinvested and no initial sales charge or contingent deferred sales charge.
(c) Had the investment advisor and/or any of its affiliates not waived fees or reimbursed a portion of expenses, total return would have been reduced.
(d) The benefits derived from expense reductions had an impact of less than 0.01%.
(e) Rounds to less than 0.01%.
See Accompanying Notes to Financial Statements.
126
Financial Highlights – Columbia Oregon Intermediate Municipal Bond Fund
Selected data for a share outstanding throughout each period is as follows:
| | | Year Ended August 31, | |
| Class B Shares | | 2009 | | 2008 | | 2007 | | 2006 | | 2005 | |
| Net Asset Value, Beginning of Period | | $ | 12.07 | | | $ | 12.02 | | | $ | 12.24 | | | $ | 12.45 | | | $ | 12.45 | | |
| Income from Investment Operations: | |
| Net investment income (a) | | | 0.36 | | | | 0.37 | | | | 0.36 | | | | 0.37 | | | | 0.37 | | |
Net realized and unrealized gain (loss) on investments
and futures contracts | | | 0.09 | | | | 0.05 | | | | (0.22 | ) | | | (0.22 | ) | | | 0.03 | | |
| Total from investment operations | | | 0.45 | | | | 0.42 | | | | 0.14 | | | | 0.15 | | | | 0.40 | | |
| Less Distributions to Shareholders: | |
| From net investment income | | | (0.36 | ) | | | (0.37 | ) | | | (0.36 | ) | | | (0.36 | ) | | | (0.36 | ) | |
| From net realized gains | | | — | | | | — | | | | — | | | | — | | | | (0.04 | ) | |
| Total distributions to shareholders | | | (0.36 | ) | | | (0.37 | ) | | | (0.36 | ) | | | (0.36 | ) | | | (0.40 | ) | |
| Increase from regulatory settlements | | | 0.01 | | | | — | | | | — | | | | — | | | | — | | |
| Net Asset Value, End of Period | | $ | 12.17 | | | $ | 12.07 | | | $ | 12.02 | | | $ | 12.24 | | | $ | 12.45 | | |
| Total return (b) | | | 3.92 | %(c) | | | 3.56 | %(c) | | | 1.16 | % | | | 1.29 | %(c) | | | 3.26 | % | |
| Ratios to Average Net Assets/Supplemental Data: | |
| Net expenses (d) | | | 1.50 | % | | | 1.52 | % | | | 1.63 | % | | | 1.64 | % | | | 1.64 | % | |
| Waiver/Reimbursement | | | 0.14 | % | | | 0.10 | % | | | — | | | | — | %(e) | | | — | | |
| Net investment income (d) | | | 3.02 | % | | | 3.08 | % | | | 2.98 | % | | | 3.00 | % | | | 2.96 | % | |
| Portfolio turnover rate | | | 8 | % | | | 5 | % | | | 16 | % | | | 2 | % | | | 9 | % | |
| Net assets, end of period (000s) | | $ | 641 | | | $ | 570 | | | $ | 842 | | | $ | 913 | | | $ | 1,226 | | |
(a) Per share data was calculated using the average shares outstanding during the period.
(b) Total return at net asset value assuming all distributions reinvested and no contingent deferred sales charge.
(c) Had the investment advisor and/or any of its affiliates not waived fees or reimbursed a portion of expenses, total return would have been reduced.
(d) The benefits derived from expense reductions had an impact of less than 0.01%.
(e) Rounds to less than 0.01%.
See Accompanying Notes to Financial Statements.
127
Financial Highlights – Columbia Oregon Intermediate Municipal Bond Fund
Selected data for a share outstanding throughout each period is as follows:
| | | Year Ended August 31, | |
| Class C Shares | | 2009 | | 2008 | | 2007 | | 2006 | | 2005 | |
| Net Asset Value, Beginning of Period | | $ | 12.07 | | | $ | 12.02 | | | $ | 12.24 | | | $ | 12.45 | | | $ | 12.45 | | |
| Income from Investment Operations: | |
| Net investment income (a) | | | 0.40 | | | | 0.41 | | | | 0.40 | | | | 0.41 | | | | 0.41 | | |
Net realized and unrealized gain (loss) on investments
and futures contracts | | | 0.09 | | | | 0.05 | | | | (0.21 | ) | | | (0.21 | ) | | | 0.03 | | |
| Total from investment operations | | | 0.49 | | | | 0.46 | | | | 0.19 | | | | 0.20 | | | | 0.44 | | |
| Less Distributions to Shareholders: | |
| From net investment income | | | (0.40 | ) | | | (0.41 | ) | | | (0.41 | ) | | | (0.41 | ) | | | (0.40 | ) | |
| From net realized gains | | | — | | | | — | | | | — | | | | — | | | | (0.04 | ) | |
| Total distributions to shareholders | | | (0.40 | ) | | | (0.41 | ) | | | (0.41 | ) | | | (0.41 | ) | | | (0.44 | ) | |
| Increase from regulatory settlements | | | 0.01 | | | | — | | | | — | | | | — | | | | — | | |
| Net Asset Value, End of Period | | $ | 12.17 | | | $ | 12.07 | | | $ | 12.02 | | | $ | 12.24 | | | $ | 12.45 | | |
| Total return (b)(c) | | | 4.28 | % | | | 3.88 | % | | | 1.52 | % | | | 1.64 | % | | | 3.64 | % | |
| Ratios to Average Net Assets/Supplemental Data: | |
| Net expenses (d) | | | 1.15 | % | | | 1.17 | % | | | 1.28 | % | | | 1.29 | % | | | 1.29 | % | |
| Waiver/Reimbursement | | | 0.49 | % | | | 0.45 | % | | | 0.35 | % | | | 0.35 | % | | | 0.35 | % | |
| Net investment income (d) | | | 3.34 | % | | | 3.36 | % | | | 3.33 | % | | | 3.33 | % | | | 3.31 | % | |
| Portfolio turnover rate | | | 8 | % | | | 5 | % | | | 16 | % | | | 2 | % | | | 9 | % | |
| Net assets, end of period (000s) | | $ | 11,332 | | | $ | 7,847 | | | $ | 1,097 | | | $ | 616 | | | $ | 601 | | |
(a) Per share data was calculated using the average shares outstanding during the period.
(b) Total return at net asset value assuming all distributions reinvested and no contingent deferred sales charge.
(c) Had the investment advisor and/or any of its affiliates not waived fees or reimbursed a portion of expenses, total return would have been reduced.
(d) The benefits derived from expense reductions had an impact of less than 0.01%.
See Accompanying Notes to Financial Statements.
128
Financial Highlights – Columbia Oregon Intermediate Municipal Bond Fund
Selected data for a share outstanding throughout each period is as follows:
| | | Year Ended August 31, | |
| Class Z Shares | | 2009 | | 2008 | | 2007 | | 2006 | | 2005 | |
| Net Asset Value, Beginning of Period | | $ | 12.07 | | | $ | 12.02 | | | $ | 12.24 | | | $ | 12.45 | | | $ | 12.45 | | |
| Income from Investment Operations: | |
| Net investment income (a) | | | 0.48 | | | | 0.49 | | | | 0.49 | | | | 0.49 | | | | 0.49 | | |
Net realized and unrealized gain (loss) on investments
and futures contracts | | | 0.09 | | | | 0.05 | | | | (0.23 | ) | | | (0.21 | ) | | | 0.03 | | |
| Total from investment operations | | | 0.57 | | | | 0.54 | | | | 0.26 | | | | 0.28 | | | | 0.52 | | |
| Less Distributions to Shareholders: | |
| From net investment income | | | (0.48 | ) | | | (0.49 | ) | | | (0.48 | ) | | | (0.49 | ) | | | (0.48 | ) | |
| From net realized gains | | | — | | | | — | | | | — | | | | — | | | | (0.04 | ) | |
| Total distributions to shareholders | | | (0.48 | ) | | | (0.49 | ) | | | (0.48 | ) | | | (0.49 | ) | | | (0.52 | ) | |
| Increase from regulatory settlements | | | 0.01 | | | | — | | | | — | | | | — | | | | — | | |
| Net Asset Value, End of Period | | $ | 12.17 | | | $ | 12.07 | | | $ | 12.02 | | | $ | 12.24 | | | $ | 12.45 | | |
| Total return (b) | | | 4.96 | %(c) | | | 4.59 | %(c) | | | 2.18 | % | | | 2.31 | %(c) | | | 4.31 | % | |
| Ratios to Average Net Assets/Supplemental Data: | |
| Net expenses (d) | | | 0.50 | % | | | 0.52 | % | | | 0.63 | % | | | 0.64 | % | | | 0.64 | % | |
| Waiver/Reimbursement | | | 0.14 | % | | | 0.10 | % | | | — | | | | — | %(e) | | | — | | |
| Net investment income (d) | | | 4.02 | % | | | 4.07 | % | | | 3.98 | % | | | 3.99 | % | | | 3.96 | % | |
| Portfolio turnover rate | | | 8 | % | | | 5 | % | | | 16 | % | | | 2 | % | | | 9 | % | |
| Net assets, end of period (000s) | | $ | 416,275 | | | $ | 381,162 | | | $ | 368,292 | | | $ | 380,653 | | | $ | 410,706 | | |
(a) Per share data was calculated using the average shares outstanding during the period.
(b) Total return at net asset value assuming all distributions reinvested.
(c) Had the investment advisor and/or any of its affiliates not waived fees or reimbursed a portion of expenses, total return would have been reduced.
(d) The benefits derived from expense reductions had an impact of less than 0.01%.
(e) Rounds to less than 0.01%.
See Accompanying Notes to Financial Statements.
129
Financial Highlights – Columbia Conservative High Yield Fund
Selected data for a share outstanding throughout each period is as follows:
| | | Year Ended August 31, | |
| Class A Shares | | 2009 | | 2008 | | 2007 | | 2006 | | 2005 | |
| Net Asset Value, Beginning of Period | | $ | 7.61 | | | $ | 8.12 | | | $ | 8.27 | | | $ | 8.62 | | | $ | 8.69 | | |
| Income from Investment Operations: | |
| Net investment income (a) | | | 0.50 | | | | 0.51 | | | | 0.52 | | | | 0.50 | | | | 0.48 | | |
Net realized and unrealized loss on investments,
foreign currency and credit default swap contracts | | | (0.50 | ) | | | (0.50 | ) | | | (0.13 | ) | | | (0.32 | ) | | | (0.03 | ) | |
| Total from investment operations | | | — | | | | 0.01 | | | | 0.39 | | | | 0.18 | | | | 0.45 | | |
| Less Distributions to Shareholders: | |
| From net investment income | | | (0.51 | ) | | | (0.52 | ) | | | (0.54 | ) | | | (0.53 | ) | | | (0.52 | ) | |
| Increase from regulatory settlements | | | — | (b) | | | — | | | | — | | | | — | | | | — | | |
| Net Asset Value, End of Period | | $ | 7.10 | | | $ | 7.61 | | | $ | 8.12 | | | $ | 8.27 | | | $ | 8.62 | | |
| Total return (c) | | | 0.91 | % | | | 0.07 | % | | | 4.75 | % | | | 2.16 | %(d) | | | 5.31 | % | |
| Ratios to Average Net Assets/Supplemental Data: | |
| Net expenses before interest expense (e) | | | 1.07 | % | | | 1.07 | % | | | 1.03 | % | | | 0.97 | % | | | 0.95 | % | |
| Interest expense | | | — | %(f) | | | — | | | | — | %(f) | | | — | | | | — | | |
| Net expenses (e) | | | 1.07 | % | | | 1.07 | % | | | 1.03 | % | | | 0.97 | % | | | 0.95 | % | |
| Waiver/Reimbursement | | | — | | | | — | | | | — | | | | — | %(f) | | | — | | |
| Net investment income (e) | | | 7.68 | % | | | 6.46 | % | | | 6.25 | % | | | 5.97 | % | | | 5.55 | % | |
| Portfolio turnover rate | | | 67 | % | | | 29 | % | | | 42 | % | | | 31 | % | | | 40 | % | |
| Net assets, end of period (000s) | | $ | 77,820 | | | $ | 68,496 | | | $ | 103,769 | | | $ | 170,575 | | | $ | 321,402 | | |
(a) Per share data was calculated using the average shares outstanding during the period.
(b) Rounds to less than $0.01 per share.
(c) Total return at net asset value assuming all distributions reinvested and no initial sales charge or contingent deferred sales charge.
(d) Had the investment advisor and/or any of its affiliates not waived fees or reimbursed a portion of expenses, total return would have been reduced.
(e) The benefits derived from expense reductions had an impact of less than 0.01%.
(f) Rounds to less than 0.01%.
See Accompanying Notes to Financial Statements.
130
Financial Highlights – Columbia Conservative High Yield Fund
Selected data for a share outstanding throughout each period is as follows:
| | | Year Ended August 31, | |
| Class B Shares | | 2009 | | 2008 | | 2007 | | 2006 | | 2005 | |
| Net Asset Value, Beginning of Period | | $ | 7.61 | | | $ | 8.12 | | | $ | 8.27 | | | $ | 8.62 | | | $ | 8.69 | | |
| Income from Investment Operations: | |
| Net investment income (a) | | | 0.45 | | | | 0.45 | | | | 0.46 | | | | 0.44 | | | | 0.42 | | |
Net realized and unrealized loss on investments,
foreign currency and credit default swap contracts | | | (0.50 | ) | | | (0.50 | ) | | | (0.13 | ) | | | (0.32 | ) | | | (0.03 | ) | |
| Total from investment operations | | | (0.05 | ) | | | (0.05 | ) | | | 0.33 | | | | 0.12 | | | | 0.39 | | |
| Less Distributions to Shareholders: | |
| From net investment income | | | (0.46 | ) | | | (0.46 | ) | | | (0.48 | ) | | | (0.47 | ) | | | (0.46 | ) | |
| Increase from regulatory settlements | | | — | (b) | | | — | | | | — | | | | — | | | | — | | |
| Net Asset Value, End of Period | | $ | 7.10 | | | $ | 7.61 | | | $ | 8.12 | | | $ | 8.27 | | | $ | 8.62 | | |
| Total return (c) | | | 0.17 | % | | | (0.67 | )% | | | 3.97 | % | | | 1.40 | %(d) | | | 4.53 | % | |
| Ratios to Average Net Assets/Supplemental Data: | |
| Net expenses before interest expense (e) | | | 1.82 | % | | | 1.82 | % | | | 1.78 | % | | | 1.72 | % | | | 1.70 | % | |
| Interest expense | | | — | %(f) | | | — | | | | — | %(f) | | | — | | | | — | | |
| Net expenses (e) | | | 1.82 | % | | | 1.82 | % | | | 1.78 | % | | | 1.72 | % | | | 1.70 | % | |
| Waiver/Reimbursement | | | — | | | | — | | | | — | | | | — | %(f) | | | — | | |
| Net investment income (e) | | | 6.96 | % | | | 5.71 | % | | | 5.50 | % | | | 5.21 | % | | | 4.80 | % | |
| Portfolio turnover rate | | | 67 | % | | | 29 | % | | | 42 | % | | | 31 | % | | | 40 | % | |
| Net assets, end of period (000s) | | $ | 29,525 | | | $ | 38,175 | | | $ | 50,577 | | | $ | 66,886 | | | $ | 89,101 | | |
(a) Per share data was calculated using the average shares outstanding during the period.
(b) Rounds to less than $0.01 per share.
(c) Total return at net asset value assuming all distributions reinvested and no contingent deferred sales charge.
(d) Had the investment advisor and/or any of its affiliates not waived fees or reimbursed a portion of expenses, total return would have been reduced.
(e) The benefits derived from expense reductions had an impact of less than 0.01%.
(f) Rounds to less than 0.01%.
See Accompanying Notes to Financial Statements.
131
Financial Highlights – Columbia Conservative High Yield Fund
Selected data for a share outstanding throughout each period is as follows:
| | | Year Ended August 31, | |
| Class C Shares | | 2009 | | 2008 | | 2007 | | 2006 | | 2005 | |
| Net Asset Value, Beginning of Period | | $ | 7.61 | | | $ | 8.12 | | | $ | 8.27 | | | $ | 8.62 | | | $ | 8.69 | | |
| Income from Investment Operations: | |
| Net investment income (a) | | | 0.46 | | | | 0.47 | | | | 0.47 | | | | 0.45 | | | | 0.43 | | |
Net realized and unrealized loss on investments,
foreign currency and credit default swap contracts | | | (0.50 | ) | | | (0.51 | ) | | | (0.13 | ) | | | (0.32 | ) | | | (0.03 | ) | |
| Total from investment operations | | | (0.04 | ) | | | (0.04 | ) | | | 0.34 | | | | 0.13 | | | | 0.40 | | |
| Less Distributions to Shareholders: | |
| From net investment income | | | (0.47 | ) | | | (0.47 | ) | | | (0.49 | ) | | | (0.48 | ) | | | (0.47 | ) | |
| Increase from regulatory settlements | | | — | (b) | | | — | | | | — | | | | — | | | | — | | |
| Net Asset Value, End of Period | | $ | 7.10 | | | $ | 7.61 | | | $ | 8.12 | | | $ | 8.27 | | | $ | 8.62 | | |
| Total return (c)(d) | | | 0.31 | % | | | (0.52 | )% | | | 4.13 | % | | | 1.55 | % | | | 4.69 | % | |
| Ratios to Average Net Assets/Supplemental Data: | |
| Net expenses before interest expense (e) | | | 1.67 | % | | | 1.67 | % | | | 1.63 | % | | | 1.57 | % | | | 1.55 | % | |
| Interest expense | | | — | %(f) | | | — | | | | — | %(f) | | | — | | | | — | | |
| Net expenses (e) | | | 1.67 | % | | | 1.67 | % | | | 1.63 | % | | | 1.57 | % | | | 1.55 | % | |
| Waiver/Reimbursement | | | 0.15 | % | | | 0.15 | % | | | 0.15 | % | | | 0.15 | % | | | 0.15 | % | |
| Net investment income (e) | | | 7.08 | % | | | 5.88 | % | | | 5.69 | % | | | 5.37 | % | | | 4.95 | % | |
| Portfolio turnover rate | | | 67 | % | | | 29 | % | | | 42 | % | | | 31 | % | | | 40 | % | |
| Net assets, end of period (000s) | | $ | 29,380 | | | $ | 23,003 | | | $ | 33,673 | | | $ | 11,653 | | | $ | 18,002 | | |
(a) Per share data was calculated using the average shares outstanding during the period.
(b) Rounds to less than $0.01 per share.
(c) Total return at net asset value assuming all distributions reinvested and no contingent deferred sales charge.
(d) Had the investment advisor and/or any of its affiliates not waived fees or reimbursed a portion of expenses, total return would have been reduced.
(e) The benefits derived from expense reductions had an impact of less than 0.01%.
(f) Rounds to less than 0.01%.
See Accompanying Notes to Financial Statements.
132
Financial Highlights – Columbia Conservative High Yield Fund
Selected data for a share outstanding throughout the period is as follows:
| Class Y Shares | | Period Ended
August 31,
2009 (a) | |
| Net Asset Value, Beginning of Period | | $ | 6.81 | | |
| Income from Investment Operations: | |
| Net investment income (b) | | | 0.06 | | |
Net realized and unrealized gain on investments,
foreign currency and credit default swap contracts | | | 0.30 | | |
| Total from investment operations | | | 0.36 | | |
| Less Distributions to Shareholders: | |
| From net investment income | | | (0.07 | ) | |
| Net Asset Value, End of Period | | $ | 7.10 | | |
| Total return (c)(d) | | | 5.28 | % | |
| Ratios to Average Net Assets/Supplemental Data: | |
| Net expenses before interest expense (e)(f) | | | 0.65 | % | |
| Interest expense (e)(g) | | | — | % | |
| Net expenses (e)(f) | | | 0.65 | % | |
| Net investment income (e)(f) | | | 6.92 | % | |
| Portfolio turnover rate (d) | | | 67 | % | |
| Net assets, end of period (000s) | | $ | 18,373 | | |
(a) Class Y shares commenced operations on July 15, 2009. Per share data and total return reflect activity from that date.
(b) Per share data was calculated using the average shares outstanding during the period.
(c) Total return at net asset value assuming all distributions reinvested.
(d) Not annualized.
(e) Annualized.
(f) The benefits derived from expense reductions had an impact of less than 0.01%.
(g) Rounds to less than 0.01%.
See Accompanying Notes to Financial Statements.
133
Financial Highlights – Columbia Conservative High Yield Fund
Selected data for a share outstanding throughout each period is as follows:
| | | Year Ended August 31, | |
| Class Z Shares | | 2009 | | 2008 | | 2007 | | 2006 | | 2005 | |
| Net Asset Value, Beginning of Period | | $ | 7.61 | | | $ | 8.12 | | | $ | 8.27 | | | $ | 8.62 | | | $ | 8.69 | | |
| Income from Investment Operations: | |
| Net investment income (a) | | | 0.52 | | | | 0.53 | | | | 0.54 | | | | 0.52 | | | | 0.50 | | |
Net realized and unrealized loss on investments,
foreign currency and credit default swap contracts | | | (0.50 | ) | | | (0.50 | ) | | | (0.13 | ) | | | (0.32 | ) | | | (0.03 | ) | |
| Total from investment operations | | | 0.02 | | | | 0.03 | | | | 0.41 | | | | 0.20 | | | | 0.47 | | |
| Less Distributions to Shareholders: | |
| From net investment income | | | (0.53 | ) | | | (0.54 | ) | | | (0.56 | ) | | | (0.55 | ) | | | (0.54 | ) | |
| Increase from regulatory settlements | | | — | (b) | | | — | | | | — | | | | — | | | | — | | |
| Net Asset Value, End of Period | | $ | 7.10 | | | $ | 7.61 | | | $ | 8.12 | | | $ | 8.27 | | | $ | 8.62 | | |
| Total return (c) | | | 1.17 | % | | | 0.32 | % | | | 5.01 | % | | | 2.42 | %(d) | | | 5.54 | % | |
| Ratios to Average Net Assets/Supplemental Data: | |
| Net expenses before interest expense (e) | | | 0.82 | % | | | 0.82 | % | | | 0.78 | % | | | 0.72 | % | | | 0.70 | % | |
| Interest expense | | | — | %(f) | | | — | | | | — | %(f) | | | — | | | | — | | |
| Net expenses (e) | | | 0.82 | % | | | 0.82 | % | | | 0.78 | % | | | 0.72 | % | | | 0.70 | % | |
| Waiver/Reimbursement | | | — | | | | — | | | | — | | | | — | %(f) | | | — | | |
| Net investment income (e) | | | 7.94 | % | | | 6.71 | % | | | 6.49 | % | | | 6.20 | % | | | 5.80 | % | |
| Portfolio turnover rate | | | 67 | % | | | 29 | % | | | 42 | % | | | 31 | % | | | 40 | % | |
| Net assets, end of period (000s) | | $ | 433,915 | | | $ | 443,043 | | | $ | 614,168 | | | $ | 801,811 | | | $ | 1,073,894 | | |
(a) Per share data was calculated using the average shares outstanding during the period.
(b) Rounds to less than $0.01 per share.
(c) Total return at net asset value assuming all distributions reinvested.
(d) Had the investment advisor and/or any of its affiliates not waived fees or reimbursed a portion of expenses, total return would have been reduced.
(e) The benefits derived from expense reductions had an impact of less than 0.01%.
(f) Rounds to less than 0.01%.
See Accompanying Notes to Financial Statements.
134
Notes to Financial Statements – Columbia Funds
August 31, 2009
Note 1. Organization
Columbia Funds Series Trust I (the "Trust") is a Massachusetts business trust registered under the Investment Company Act of 1940, as amended (the "1940 Act"), as an open-end management investment company. Information presented in these financial statements pertains to the following series of the Trust (each a "Fund" and collectively, the "Funds"):
Columbia International Stock Fund
Columbia Mid Cap Growth Fund
Columbia Small Cap Growth Fund I
Columbia Technology Fund
Columbia Balanced Fund
Columbia Oregon Intermediate Municipal Bond Fund
Columbia Conservative High Yield Fund
All Funds currently operate as diversified funds.
Investment Objectives
Columbia International Stock Fund seeks long-term capital appreciation. Columbia Mid Cap Growth Fund seeks significant capital appreciation by investing, under normal market conditions, at least 80% of its total net assets (plus any borrowings for investment purposes) in stocks of companies with a market capitalization, at the time of initial purchase, equal to or less than the largest stock in the Russell Midcap Index. Columbia Small Cap Growth Fund I seeks capital appreciation by investing, under normal market conditions, at least 80% of its net assets (plus any borrowings for investment purposes) in stocks of companies with a market capitalization, at the time of initial purchase, equal to or less than the largest stock in the Standard & Poor's SmallCap 600 Index. Columbia Technology Fund seeks capital appreciation by investing, under normal market conditions, at least 80% of its total net assets (plus any borrowings for investment purposes) in stocks of technology companies that may benefit from technological improvements, advancements or developments. Columbia Balanced Fund seeks high total return by investing in common stocks and debt securities. Columbia Oregon Intermediate Municipal Bond Fund seeks a high level of income exempt from federal and Oregon income tax by investing at least 80% of its net assets (plus any borrowings for investment purposes) in municipal securities issued by the State of Oregon (and its political subdivisions, agencies, authorities and instrumentalities). Columbia Conservative High Yield Fund seeks a high level of income, with capital appreciation as a secondary goal, by investing in non-investment-grade, corporate debt securities, commonly referred to as "junk" or "high-yield" bonds.
Fund Shares
The Trust may issue an unlimited number of shares. Columbia Technology Fund, Columbia Balanced Fund and Columbia Oregon Intermediate Municipal Bond Fund each offer four classes of shares: Class A, Class B, Class C and Class Z. Columbia International Stock Fund, Columbia Small Cap Growth Fund I and Columbia Conservative High Yield Fund each offer five classes of shares: Class A, Class B, Class C, Class Y and Class Z. Columbia Mid Cap Growth Fund offers seven classes of shares: Class A, Class B, Class C, Class R, Class T, Class Y and Class Z. Each share class has its own expense structure and sales charges, as applicable. Class Y shares commenced operations effective July 15, 2009.
Effective June 22, 2009, the Funds no longer accept investments from new or existing investors in the Funds' Class B shares, except in connection with the reinvestment of any dividend and/or capital gain distributions in Class B shares of each Fund and exchanges by existing Class B shareholders of the other Columbia Funds.
With the exception of Class A shares of Columbia Oregon Intermediate Municipal Bond Fund and Columbia Conservative High Yield Fund, Class A and Class T shares are subject to a front-end sales charge of up to 5.75% based on the amount of initial investment. Class A shares of Columbia Oregon Intermediate Municipal Bond Fund and Columbia Conservative High Yield Fund are subject to a front-end sales charge of up to 3.25% and 4.75%, respectively, based on the amount of initial investment. Class A and Class T shares purchased without an initial sales charge in accounts aggregating $1 million to $50 million at the time of purchase are subject to a 1.00% contingent deferred sales charge ("CDSC") if the shares are sold within one year after purchase. With the exception of Class B shares of Columbia Oregon Intermediate Municipal Bond Fund, which are subject to a maximum CDSC of 3.00%, Class B shares are subject to a maximum CDSC of 5.00% based upon the holding period after purchase. Class B shares will generally convert to Class A shares eight years after purchase. Class C shares are subject to a 1.00% CDSC on shares sold within one year after
135
Columbia Funds, August 31, 2009 (continued)
purchase. Class R, Class Y and Class Z shares are offered continuously at net asset value. There are certain restrictions on the purchase of Class R, Class Y and Class Z shares, as described in the Funds' prospectuses.
Note 2. Significant Accounting Policies
The preparation of financial statements in accordance with accounting principles generally accepted in the United States of America ("GAAP") requires management to make certain estimates and assumptions that affect the reported amounts of assets and liabilities, the disclosure of contingent assets and liabilities at the date of the financial statements and the reported amounts of revenue and expenses during the reporting period. Actual results could differ from those estimates.
Management has evaluated the events and transactions that have occurred through October 22, 2009, the date the financial statements were issued, and except as disclosed in Note 13, and noted no items requiring adjustment of the financial statements or additional disclosures.
The following is a summary of significant accounting policies consistently followed by the Funds in the preparation of their financial statements.
Security Valuation
Equity securities, exchange-traded funds and securities of certain investments companies are valued at the last sale price on the principal exchange on which they trade, except for securities traded on the NASDAQ, which are valued at the NASDAQ official close price. Unlisted securities or listed securities for which there were no sales during the day are valued at the closing bid price on such exchanges or over-the-counter markets.
Debt securities generally are valued by pricing services approved by the Trust's Board of Trustees, based upon market transactions for normal, institutional-size trading units of similar securities. The services may use various pricing techniques which take into account appropriate factors such as yield, quality, coupon rate, maturity, type of issue, trading characteristics and other data, as well as broker quotes. Debt securities for which quotations are readily available are valued at an over-the-counter or exchange bid quotation.
Certain debt securities, which tend to be more thinly traded and of lesser quality, are priced based on fundamental analysis of the financial condition of the issuer and the estimated value of any collateral. Valuations developed through pricing techniques may vary from the actual amounts realized upon sale of the securities, and the potential variation may be greater for those securities valued using fundamental analysis.
Short-term investments maturing in 60 days or less are valued at amortized cost, which approximates market value.
Investments in other open-end investment companies are valued at net asset value.
Futures contracts are valued at the settlement price established each day by the board of trade or exchange on which they are traded.
Purchased options are valued at the last reported sale price, or in the absence of a sale, at the last quoted bid price. Written options are valued at the last reported sale price, or in the absence of a sale, at the last quoted ask price.
Forward foreign currency exchange contracts are valued at the prevailing forward exchange rate of the underlying currencies.
Credit default swap contracts are marked to market daily based upon quotations from market makers. Quotations obtained from independent pricing services use information provided by market makers.
Foreign securities are generally valued at the last sale price on the foreign exchange or market on which they trade. If any foreign share prices are not readily available as a result of limited share activity, the securities are valued at the last sale price of the local shares in the principal market in which such securities are normally traded.
Generally, trading in foreign securities is substantially completed each day at various times prior to the close of the New York Stock Exchange ("NYSE"). The values of such securities used in computing the net asset value of the Funds' shares are determined as of such times. Foreign currency exchange rates are generally determined at 4:00 p.m. Eastern (U.S.) time. Occasionally, events affecting the values of such foreign securities and such exchange rates may occur between the times at which they are determined and the close of the customary trading session of the NYSE, which would not be
136
Columbia Funds, August 31, 2009 (continued)
reflected in the computation of the Funds' net asset values. If events materially affecting the values of such foreign securities occur and it is determined that market quotations are not reliable, then these foreign securities will be valued at their fair value using procedures approved by the Board of Trustees.
Certain Funds may use a systematic fair valuation model provided by an independent third party to value securities principally traded in foreign markets in order to adjust for possible stale pricing that may occur between the close of the foreign exchanges and the time for valuation.
Investments for which market quotations are not readily available, or that have quotations which management believes are not reliable, are valued at fair value as determined in good faith under consistently applied procedures established by and under the general supervision of the Board of Trustees. If a security is valued at fair value, such value is likely to be different from the last quoted market price for the security. The determination of fair value often requires significant judgment. To determine fair value, management may use assumptions including but not limited to future cash flows and estimated risk premiums. Multiple inputs from various sources may be used to determine value.
Various inputs are used to determine the value of the Funds' investments. Management establishes a hierarchy that prioritizes the inputs to valuation techniques used to measure fair value giving the highest priority to unadjusted quoted prices in active markets for identical securities (level 1 measurements) and the lowest priority to unobservable inputs (level 3 measurements) when market prices are not readily available or reliable. The three levels of the fair value hierarchy are described below:
• Level 1 – quoted prices in active markets for identical securities
• Level 2 – prices determined using other significant observable inputs (including quoted prices for similar securities, interest rates, prepayment speeds, credit risk and others)
• Level 3 – prices determined using significant unobservable inputs. In situations where quoted prices or observable inputs are unavailable or less reliable, unobservable inputs may be used. Unobservable inputs may include management's own assumptions about the factors market participants would use in pricing an investment.
The inputs or methodology used for valuing securities are not necessarily an indication of the risk associated with investing in those securities.
Security Transactions
Security transactions are accounted for on the trade date. Cost is determined and gains (losses) are based upon the specific identification method for both financial statement and federal income tax purposes.
Management is required to provide disclosures regarding the Funds' derivative instruments and hedging activities, by providing for qualitative disclosures about the objectives and strategies for using derivatives, quantitative data about the fair value of and gains and losses on derivative contracts, and details of credit-risk-related contingent features in their derivative contracts. For additional information on derivative instruments, please see Note 6.
Management is required to provide disclosures regarding the Funds' credit derivatives and hybrid financial instruments containing embedded credit derivatives by disclosing: (i) the nature and terms of the credit derivative, reasons for entering into the credit derivative, the events or circumstances that would require the seller to perform under the credit derivative, and the current status of the payment/performance risk of the credit derivative, (ii) the maximum potential amount of future payments (undiscounted) the seller could be required to make under the credit derivative, (iii) the fair value of the credit derivative, (iv) the nature of any recourse provisions and assets held either as collateral or by third parties, and (v) the current status of the payment/performance risk of a guarantee.
Repurchase Agreements
Each Fund may engage in repurchase agreement transactions with institutions that Columbia Management Advisors, LLC ("Columbia"), the Funds' investment advisor, has determined are creditworthy. Each Fund, through its custodian, receives delivery of the underlying securities collateralizing a repurchase agreement. Columbia is responsible for determining that the collateral is at least equal, at all times, to the value of the repurchase obligation including interest. A
137
Columbia Funds, August 31, 2009 (continued)
repurchase agreement transaction involves certain risks in the event of default or insolvency of the counterparty. These risks include possible delays in or restrictions on each Fund's ability to dispose of the underlying securities and a possible decline in the value of the underlying securities during the period while the Funds seek to assert their rights.
Loan Participations and Commitments
Columbia Conservative High Yield Fund may invest in loan participations. When the Fund purchases a loan participation, the Fund typically enters into a contractual relationship with the lender or third party selling such participation ("Selling Participant"), but not the borrower. However, the Fund assumes the credit risk of the borrower, Selling Participant and any other persons interpositioned between the Fund and the borrower. The Fund may not directly benefit from the collateral supporting the senior loan which it has purchased from the Selling Participant.
Delayed Delivery Securities
Certain Funds may trade securities on other than normal settlement terms, including securities purchased or sold on a "when-issued" basis. This may increase the risk if the other party to the transaction fails to deliver and causes the Funds to subsequently invest at less advantageous prices. Each Fund holds until the settlement date, in a segregated account, cash or liquid securities in an amount equal to the delayed delivery commitment.
Treasury Inflation Protected Securities
Columbia Balanced Fund may invest in treasury inflation protected securities ("TIPS"). The principal amount of TIPS is adjusted periodically and is increased for inflation or decreased for deflation based on a monthly published index. Interest payments are based on the adjusted principal at the time the interest is paid. These adjustments are recorded as interest income on the Statements of Operations.
Foreign Currency Transactions and Translations
The values of all assets and liabilities quoted in foreign currencies are translated into U.S. dollars at that day's exchange rates. Net realized and unrealized gains (losses) on foreign currency transactions and translations include gains (losses) arising from the fluctuation in exchange rates between trade and settlement dates on securities transactions, gains (losses) arising from the disposition of foreign currency and currency gains (losses) between the accrual and payment dates on dividends, interest income and foreign withholding taxes.
For financial statement purposes, the Funds do not distinguish that portion of gains (losses) on investments which is due to changes in foreign exchange rates from that which is due to changes in market prices of the investments. Such fluctuations are included with the net realized and unrealized gains (losses) on investments on the Statements of Operations.
Income Recognition
Interest income is recorded on the accrual basis. Premium and discount are amortized and accreted, respectively, on all debt securities, unless otherwise noted. Distributions received from real estate investment trusts (REITs) in excess of their income are recorded as a reduction of the cost of the related investments. If the Funds no longer own the applicable securities, any distributions received in excess of income are recorded as realized gains.
Original issue discount is accreted to interest income over the life of the security with a corresponding increase in the cost basis.
Corporate actions and dividend income are recorded on the ex-date except for certain foreign securities which are recorded as soon after the ex-date as the Funds become aware of such, net of any non-reclaimable tax withholdings.
Awards from class action litigation are recorded as a reduction of cost if the Funds still own the applicable securities on the payment date. If the Funds no longer own the applicable securities, the proceeds are recorded as realized gains.
The value of additional securities received as an income payment is recorded as income and as the cost basis of such securities.
138
Columbia Funds, August 31, 2009 (continued)
Expenses
General expenses of the Trust are allocated to the Funds and other series of the Trust based upon relative net assets or other expense allocation methodologies determined by the nature of the expense. Expenses directly attributable to a specific class of shares are charged to that share class. Expenses directly attributable to a Fund are charged to such Fund.
Determination of Class Net Asset Value
All income, expenses (other than class-specific expenses, as shown on the Statements of Operations) and realized and unrealized gains (losses) are allocated to each class of a Fund on a daily basis for purposes of determining the net asset value of each class. Income and expenses are allocated to each class based on the settled shares method, while realized and unrealized gains (losses) are allocated based on the relative net assets of each class for Columbia Oregon Intermediate Municipal Bond Fund and Columbia Conservative High Yield Fund. For the remaining Funds, income, expenses (other than class-specific expenses, as shown on the Statements of Operations) and realized and unrealized gains (losses) are allocated to each class of a Fund based on the relative net assets of each class of that Fund.
Federal Income Tax Status
Each Fund intends to qualify each year as a "regulated investment company" under Subchapter M of the Internal Revenue Code, as amended, and will distribute substantially all of its tax-exempt or taxable income, if any, for its tax year, and as such will not be subject to federal income taxes. In addition, each Fund intends to distribute in each calendar year substantially all of its net investment income, capital gains and certain other amounts, if any, such that each Fund should not be subject to federal excise tax. Therefore, no federal income or excise tax provision is recorded.
Foreign Capital Gains Taxes
Realized gains in certain countries may be subject to foreign taxes at the fund level, at rates ranging from approximately 10% to 15%. The Funds accrue for such foreign taxes on net realized and unrealized gains at the appropriate rate for each jurisdiction.
Distributions to Shareholders
Distributions from net investment income for Columbia International Stock Fund, Columbia Mid Cap Growth Fund, Columbia Small Cap Growth Fund I and Columbia Technology Fund, if any, are declared and paid annually. Distributions from net investment income for Columbia Balanced Fund, if any, are declared and paid quarterly. Distributions from net investment income for Columbia Oregon Intermediate Municipal Bond Fund and Columbia Conservative High Yield Fund are declared daily and paid monthly. Net realized capital gains, if any, are distributed at least annually. Income distributions and capital gain distributions are determined in accordance with federal income tax regulations which may differ from GAAP.
Indemnification
In the normal course of business, each Fund enters into contracts that contain a variety of representations and warranties and which provide general indemnities. A Fund's maximum exposure under these arrangements is unknown because this would involve future claims against a Fund. Also, under the Trust's organizational documents and by contract, the Trustees and officers of the Trust are indemnified against certain liabilities that may arise out of actions relating to their duties to the Trust. However, based on experience, the Funds expect the risk of loss due to these representations, warranties and indemnities to be minimal.
Note 3. Federal Tax Information
The timing and character of income and capital gain distributions are determined in accordance with income tax regulations, which may differ from GAAP. Reclassifications are made to each Fund's capital accounts for permanent tax differences to reflect income and gains available for distribution (or available capital loss carryforwards) under income tax regulations.
For the year ended August 31, 2009, permanent book and tax basis differences resulting primarily from differing treatments for net operating loss reclassifications, foreign currency transactions, expiring capital loss carryforwards, paydown reclassifications, distribution reclassifications, Passive Foreign Investment Company adjustments, proceeds from litigation settlements, market discount reclassifications and
139
Columbia Funds, August 31, 2009 (continued)
discount accretion/premium amortization on debt securities were identified and reclassified among the components of each Funds' net assets as follows:
| | | Undistributed
(Overdistributed)
Net Investment
Income/
Accumulated Net
Investment Loss | |
Accumulated
Net Realized
Gain (Loss) | |
Paid-In Capital | |
| Columbia International Stock Fund | | $ | (6,473,667 | ) | | $ | 27,791,121 | | | $ | (21,317,454 | ) | |
| Columbia Mid Cap Growth Fund | | | 291,481 | | | | 1,278,063 | | | | (1,569,544 | ) | |
| Columbia Small Cap Growth Fund I | | | 2,785,254 | | | | (1 | ) | | | (2,785,253 | ) | |
| Columbia Technology Fund | | | 1,798,048 | | | | (606 | ) | | | (1,797,442 | ) | |
| Columbia Balanced Fund | | | 160,983 | | | | (160,983 | ) | | | — | | |
| Columbia Oregon Intermediate Municipal Bond Fund | | | 319,462 | | | | (136,464 | ) | | | (182,998 | ) | |
| Columbia Conservative High Yield Fund | | | 1,496,927 | | | | (1,399,654 | ) | | | (97,273 | ) | |
Net investment income and net realized gains (losses), as disclosed on the Statements of Operations, and net assets were not affected by these reclassifications.
The tax character of distributions paid during the years ended August 31, 2009 and August 31, 2008 was as follows:
| | | August 31, 2009 | |
| | | Tax-Exempt
Income | | Ordinary
Income* | | Long-Term
Capital Gains | | Total | |
| Columbia International Stock Fund | | $ | — | | | $ | 39,369 | | | $ | 22,733,031 | | | $ | 22,772,400 | | |
| Columbia Mid Cap Growth Fund | | | — | | | | 250 | | | | 28,439,602 | | | | 28,439,852 | | |
| Columbia Small Cap Growth Fund I | | | — | | | | — | | | | — | | | | — | | |
| Columbia Technology Fund | | | — | | | | — | | | | — | | | | — | | |
| Columbia Balanced Fund | | | — | | | | 4,817,150 | | | | — | | | | 4,817,150 | | |
| Columbia Oregon Intermediate Municipal Bond Fund | | | 16,013,698 | | | | 290,035 | | | | — | | | | 16,303,733 | | |
| Columbia Conservative High Yield Fund | | | — | | | | 38,792,318 | | | | — | | | | 38,792,318 | | |
140
Columbia Funds, August 31, 2009 (continued)
| | | August 31, 2008 | |
| | | Tax-Exempt
Income | | Ordinary
Income* | | Long-Term
Capital Gains | | Total | |
| Columbia International Stock Fund | | $ | — | | | $ | 72,484,263 | | | $ | 120,917,872 | | | $ | 193,402,135 | | |
| Columbia Mid Cap Growth Fund | | | — | | | | 67,860,029 | | | | 146,420,479 | | | | 214,280,508 | | |
| Columbia Small Cap Growth Fund I | | | — | | | | 7,557,491 | | | | 24,654,752 | | | | 32,212,243 | | |
| Columbia Technology Fund | | | — | | | | 6,856,684 | | | | 14,787,370 | | | | 21,644,054 | | |
| Columbia Balanced Fund | | | — | | | | 5,285,251 | | | | 1,048,831 | | | | 6,334,082 | | |
| Columbia Oregon Intermediate Municipal Bond Fund | | | 15,579,086 | | | | — | | | | — | | | | 15,579,086 | | |
| Columbia Conservative High Yield Fund | | | — | | | | 45,392,403 | | | | — | | | | 45,392,403 | | |
* For tax purposes short-term capital gain distributions, if any, are considered ordinary income distributions.
As of August 31, 2009, the components of distributable earnings on a tax basis were as follows:
| | | Undistributed
Tax-Exempt
Income | | Undistributed
Ordinary
Income | | Undistributed
Long-Term
Capital Gains | | Net Unrealized
Appreciation* | |
| Columbia International Stock Fund | | $ | — | | | $ | 14,290,496 | | | $ | — | | | $ | 29,249,249 | | |
| Columbia Mid Cap Growth Fund | | | — | | | | 418,848 | | | | — | | | | 162,350,264 | | |
| Columbia Small Cap Growth Fund I | | | — | | | | — | | | | — | | | | 83,307,359 | | |
| Columbia Technology Fund | | | — | | | | — | | | | — | | | | 44,357,038 | | |
| Columbia Balanced Fund | | | — | | | | 844,205 | | | | — | | | | 19,664,212 | | |
| Columbia Oregon Intermediate Municipal Bond Fund | | | 693,883 | | | | — | | | | — | | | | 13,348,924 | | |
| Columbia Conservative High Yield Fund | | | — | | | | 2,087,603 | | | | — | | | | 5,178,198 | | |
* The differences between book-basis and tax-basis net unrealized appreciation/depreciation are primarily due to deferral of losses from wash sales, PFIC adjustments, discount accretion/premium amortization on debt securities and identified straddle loss deferrals.
Unrealized appreciation and depreciation at August 31, 2009, based on cost of investments for federal income tax purposes, excluding any unrealized appreciation and depreciation from changes in the value of other assets and liabilities resulting from changes in exchange rates, were:
| | | Unrealized
Appreciation | | Unrealized
Depreciation | | Net
Unrealized
Appreciation | |
| Columbia International Stock Fund | | $ | 73,904,493 | | | $ | (44,655,244 | ) | | $ | 29,249,249 | | |
| Columbia Mid Cap Growth Fund | | | 193,890,245 | | | | (31,539,981 | ) | | | 162,350,264 | | |
| Columbia Small Cap Growth Fund I | | | 99,956,379 | | | | (16,649,020 | ) | | | 83,307,359 | | |
| Columbia Technology Fund | | | 47,030,505 | | | | (2,673,467 | ) | | | 44,357,038 | | |
| Columbia Balanced Fund | | | 26,736,629 | | | | (7,072,417 | ) | | | 19,664,212 | | |
| Columbia Oregon Intermediate Municipal Bond Fund | | | 18,929,134 | | | | (5,580,210 | ) | | | 13,348,924 | | |
| Columbia Conservative High Yield Fund | | | 23,936,436 | | | | (18,758,238 | ) | | | 5,178,198 | | |
141
Columbia Funds, August 31, 2009 (continued)
The following capital loss carryforwards, determined as of August 31, 2009, may be available to reduce taxable income arising from future net realized gains on investments, if any, to the extent permitted by the Internal Revenue Code:
| | | 2010 | | 2013 | | 2014 | | 2015 | | 2016 | | 2017 | | Total | |
| Columbia International Stock Fund | | $ | 36,290,283 | | | $ | — | | | $ | — | | | $ | — | | | $ | — | | | $ | 59,458,342 | �� | | $ | 95,748,625 | | |
| Columbia Mid Cap Growth Fund | | | — | | | | — | | | | — | | | | — | | | | — | | | | 106,558,441 | | | | 106,558,441 | | |
| Columbia Small Cap Growth Fund I | | | — | | | | — | | | | — | | | | — | | | | — | | | | 50,644,545 | | | | 50,644,545 | | |
| Columbia Technology Fund | | | — | | | | — | | | | — | | | | — | | | | — | | | | 89,694,106 | | | | 89,694,106 | | |
| Columbia Balanced Fund | | | — | | | | — | | | | — | | | | — | | | | — | | | | 5,769,283 | | | | 5,769,283 | | |
Columbia Oregon Intermediate
Municipal Bond Fund | | | — | | | | 19,562 | | | | — | | | | — | | | | — | | | | 68,683 | | | | 88,245 | | |
| Columbia Conservative High Yield Fund | | | 9,535,110 | | | | — | | | | 975,147 | | | | 22,859,341 | | | | 5,603,050 | | | | 40,533,191 | | | | 79,505,839 | | |
Capital loss carryforwards that were utilized and/or expired during the year ended August 31, 2009 were as follows:
| Columbia International Stock Fund | | $ | 14,151,400 | | |
| Columbia Mid Cap Growth Fund | | | 1,376,842 | | |
Of the remaining capital loss carryforwards attributable to Columbia International Stock Fund, $36,290,283 ($36,290,283 expiring August 31, 2010) remain from Columbia International Stock Fund's merger with Columbia International Equity Fund. The availability of the remaining capital loss carryforwards may be limited in a given year.
Under current tax rules, certain currency and capital losses realized after October 31 may be deferred and treated as occurring on the first day of the following fiscal year. As of August 31, 2009, post-October capital losses attributed to security transactions were deferred to September 1, 2009, as follows:
| | | Capital
Losses | |
| Columbia International Stock Fund | | $ | 177,793,391 | | |
| Columbia Mid Cap Growth Fund | | | 215,954,307 | | |
| Columbia Small Cap Growth Fund I | | | 75,137,911 | | |
| Columbia Technology Fund | | | 75,245,506 | | |
| Columbia Balanced Fund | | | 11,402,987 | | |
Columbia Oregon Intermediate
Municipal Bond Fund | | | 136,753 | | |
| Columbia Conservative High Yield Fund | | | 68,230,698 | | |
Management is required to determine whether a tax position of the Funds is more likely than not to be sustained upon examination by the applicable taxing authority, including resolution of any related appeals or litigation processes, based on the technical merits of the position. The tax benefit to be recognized by each Fund is measured as the largest amount of benefit that is greater than fifty percent likely of being realized upon ultimate settlement. Management is not aware of any tax positions for which it is reasonably possible that the total amounts of unrecognized tax benefits will significantly change in the next twelve months. However, management's conclusions may be subject to review and adjustment at a later date based on factors including, but not limited to, new tax laws, regulations, and administrative interpretations (including relevant court decisions). The Funds' federal tax returns for the prior three fiscal ye ars remain subject to examination by the Internal Revenue Service.
Note 4. Fees and Compensation Paid to Affiliates
Investment Advisory Fee
Columbia, an indirect, wholly owned subsidiary of Bank of America Corporation ("BOA"), provides investment advisory, administrative and other services to the Funds. In rendering investment advisory services to the Funds with the exception of Columbia Oregon Intermediate Municipal Bond Fund, Columbia may use the portfolio management and research resources of Columbia Management Pte. Ltd, an affiliate of
142
Columbia Funds, August 31, 2009 (continued)
Columbia. Columbia receives a monthly investment advisory fee based on each Fund's average daily net assets at the following annual rates:
| | | First
$500
Million | | $500 Million
to $1
Billion | | $1 Billion
to $1.5
Billion | | $1.5 Billion
to $3
Billion | | $3 Billion
to $6
Billion | | Over
$6 Billion | |
Columbia International
Stock Fund | | | 0.87 | % | | | 0.82 | % | | | 0.77 | % | | | 0.72 | % | | | 0.70 | % | | | 0.68 | % | |
Columbia Mid Cap
Growth Fund | | | 0.82 | % | | | 0.75 | % | | | 0.72 | % | | | 0.67 | % | | | 0.67 | % | | | 0.67 | % | |
Columbia Small Cap
Growth Fund I | | | 0.87 | % | | | 0.82 | % | | | 0.77 | % | | | 0.77 | % | | | 0.77 | % | | | 0.77 | % | |
| Columbia Technology Fund | | | 0.87 | % | | | 0.82 | % | | | 0.77 | % | | | 0.77 | % | | | 0.77 | % | | | 0.77 | % | |
| Columbia Balanced Fund | | | 0.50 | % | | | 0.50 | % | | | 0.50 | % | | | 0.50 | % | | | 0.50 | % | | | 0.50 | % | |
Columbia Oregon
Intermediate Municipal
Bond Fund | | | 0.50 | % | | | 0.50 | % | | | 0.50 | % | | | 0.50 | % | | | 0.50 | % | | | 0.50 | % | |
Columbia Conservative
High Yield Fund | | | 0.60 | % | | | 0.55 | % | | | 0.52 | % | | | 0.49 | % | | | 0.49 | % | | | 0.49 | % | |
For the year ended August 31, 2009, the effective investment advisory fee rates for the Funds, as a percentage of each Fund's average daily net assets, were as follows:
| | | Effective
Fee Rate | |
| Columbia International Stock Fund | | | 0.87 | % | |
| Columbia Mid Cap Growth Fund | | | 0.79 | % | |
| Columbia Small Cap Growth Fund I | | | 0.87 | % | |
| Columbia Technology Fund | | | 0.87 | % | |
| Columbia Balanced Fund | | | 0.50 | % | |
Columbia Oregon Intermediate
Municipal Bond Fund | | | 0.50 | % | |
| Columbia Conservative High Yield Fund | | | 0.60 | % | |
Pricing and Bookkeeping Fees
The Funds have entered into a Financial Reporting Services Agreement (the "Financial Reporting Services Agreement") with State Street Bank & Trust Company ("State Street") and Columbia pursuant to which State Street provides financial reporting services to the Funds. The Funds have also entered into an Accounting Services Agreement (collectively with the Financial Reporting Services Agreement, the "State Street Agreements") with State Street and Columbia pursuant to which State Street provides accounting services to the Funds. Under the State Street Agreements, each Fund pays State Street an annual fee of $38,000 paid monthly plus an additional monthly fee based on an annualized percentage rate of average daily net assets of each Fund for the month. The aggregate fee per Fund will not exceed $140,000 per year (exclusive of out-of-pocket expenses and charges). The Funds also reimburse State Street for certain out-of-pocket ex penses and charges.
The Funds have entered into a Pricing and Bookkeeping Oversight and Services Agreement (the "Services Agreement") with Columbia. Under the Services Agreement, Columbia provides services related to Fund expenses and the requirements of the Sarbanes-Oxley Act of 2002, and provides oversight of the accounting and financial reporting services provided by State Street. Under the Services Agreement, the Funds reimburse Columbia for out-of-pocket expenses.
Transfer Agent Fee
Columbia Management Services, Inc. (the "Transfer Agent"), an affiliate of Columbia and an indirect, wholly owned subsidiary of BOA, provides shareholder services to the Funds and has contracted with Boston Financial Data Services ("BFDS") to serve as sub-transfer agent.
143
Columbia Funds, August 31, 2009 (continued)
The Funds pay a monthly fee to the Transfer Agent for its services. All share classes with the exception of Class Y shares (the "Other Share Classes"), pay a monthly service fee (the "aggregate fee") based on the following:
(i) An annual rate of $17.34 is applied to the aggregate number of open accounts for the Other Share Classes, and
(ii) An allocated portion of fees for wire, telephone and redemption orders, Individual Retirement Account ("IRA") trustee agent fees and account transcript fees due to the Transfer Agent from shareholders of the Funds and credits (net of bank charges) earned with respect to balances in accounts the Transfer Agent maintains in connection with its services to the Funds. The Transfer Agent also receives reimbursement for certain out-of-pocket expenses.
The aggregate fee is allocated to the Other Share Classes based on the relative average daily net assets of each share class.
The Class Y shares of Columbia International Stock Fund, Columbia Mid Cap Growth Fund, Columbia Small Cap Growth Fund I and Columbia Conservative High Yield Fund pay a monthly service fee based on the following:
(i) An annual rate of $17.34 is applied to the aggregate number of open accounts for Class Y shares, and
(ii) An allocated portion of fees for wire, telephone and redemption orders, IRA trustee agent fees and account transcript fees due to the Transfer Agent from shareholders of the Funds and credits (net of bank charges) earned with respect to balances in accounts the Transfer Agent maintains in connection with its services to the Funds. The Transfer Agent also receives reimbursement for certain out-of-pocket expenses.
The Transfer Agent is also entitled to receive reimbursement of certain sub-transfer agent fees paid by the Transfer Agent (exclusive of BFDS fees), calculated based on the combined assets held in the Other Share Classes in omnibus accounts and intended to recover the cost of payments to other parties (including affiliates of BOA) for services to those accounts. Such fees are allocated to the Other Share Classes based on the relative average daily net assets of each share class. The Transfer Agent pays the fees of BFDS for services as sub-transfer agent and is not entitled to reimbursement for such fees from the Funds.
Prior to January 12, 2009, the Transfer Agent voluntarily waived transfer agent fees up to 0.10% of Columbia International Stock Fund's average daily net assets. For the year ended August 31, 2009, the Transfer Agent waived transfer agent fees of $211,614.
An annual minimum account balance fee of $20 may apply to certain accounts with a value below each Fund's initial minimum investment requirements to reduce the impact of small accounts on transfer agent fees. These minimum account balance fees are recorded as part of expense reductions on the Statements of Operations. For the year ended August 31, 2009, no minimum account balance fees were charged by the Funds.
Underwriting Discounts, Service and Distribution Fees
Columbia Management Distributors, Inc. (the "Distributor"), an affiliate of Columbia and an indirect, wholly owned subsidiary of BOA, is the principal underwriter of the Funds' shares. For the year ended August 31, 2009, the Distributor has retained net underwriting discounts on sales of Class A and Class T shares and received net CDSC fees on Class A, Class B, Class C and Class T share redemptions as follows:
| | | Front-End Sales Charge | | CDSC | |
| | | Class A | | Class T | | Class A | | Class B | | Class C | | Class T | |
| Columbia International Stock Fund | | $ | 5,544 | | | $ | — | | | $ | 518 | | | $ | 11,608 | | | $ | 340 | | | $ | — | | |
| Columbia Mid Cap Growth Fund | | | 7,851 | | | | 126 | | | | 136 | | | | 9,579 | | | | 1,459 | | | | — | | |
| Columbia Small Cap Growth Fund I | | | 15,319 | | | | — | | | | 1,794 | | | | 4,599 | | | | 13,038 | | | | — | | |
| Columbia Technology Fund | | | 16,620 | | | | — | | | | 6,561 | | | | 45,466 | | | | 14,176 | | | | — | | |
| Columbia Balanced Fund | | | 19,806 | | | | — | | | | 1 | | | | 9,543 | | | | 423 | | | | — | | |
Columbia Oregon Intermediate
Municipal Bond Fund | | | 5,749 | | | | — | | | | — | | | | 839 | | | | 3,336 | | | | — | | |
| Columbia Conservative High Yield Fund | | | 14,276 | | | | — | | | | 3 | | | | 40,997 | | | | 2,360 | | | | — | | |
144
Columbia Funds, August 31, 2009 (continued)
The Funds have adopted distribution and shareholder servicing plans pursuant to Rule 12b-1 under the 1940 Act (the "Plans") which require the payment of a monthly service and distribution fee to the Distributor based on the average daily net assets of each Fund at the following annual rates:
| | | Distribution Fee | |
| | | Class A (a) | | Class B | | Class C | | Class R | |
| Columbia International Stock Fund | | | — | | | | 0.75 | % | | | 0.75 | % | | | — | | |
| Columbia Mid Cap Growth Fund | | | 0.10 | % | | | 0.75 | % | | | 0.75 | % | | | 0.50 | % | |
| Columbia Small Cap Growth Fund I | | | 0.10 | % | | | 0.75 | % | | | 0.75 | % | | | — | | |
| Columbia Technology Fund | | | 0.10 | % | | | 0.75 | % | | | 0.75 | % | | | — | | |
| Columbia Balanced Fund | | | 0.10 | % | | | 0.75 | % | | | 0.75 | % | | | — | | |
| Columbia Oregon Intermediate Municipal Bond Fund | | | 0.10 | % | | | 0.75 | % | | | 0.75 | % | | | — | | |
| Columbia Conservative High Yield Fund | | | 0.10 | % | | | 0.75 | % | | | 0.75 | % | | | — | | |
| | | Service Fee | |
| | | Class A (a) | | Class B | | Class C | |
| Columbia International Stock Fund | | | 0.25 | % | | | 0.25 | % | | | 0.25 | % | |
| Columbia Mid Cap Growth Fund | | | 0.25 | % | | | 0.25 | % | | | 0.25 | % | |
| Columbia Small Cap Growth Fund I | | | 0.25 | % | | | 0.25 | % | | | 0.25 | % | |
| Columbia Technology Fund | | | 0.25 | % | | | 0.25 | % | | | 0.25 | % | |
| Columbia Balanced Fund | | | 0.25 | % | | | 0.25 | % | | | 0.25 | % | |
| Columbia Oregon Intermediate Municipal Bond Fund | | | 0.25 | % | | | 0.25 | % | | | 0.25 | % | |
| Columbia Conservative High Yield Fund | | | 0.25 | % | | | 0.25 | % | | | 0.25 | % | |
(a) Except for Columbia International Stock Fund, the Funds may pay distribution and service fees up to a maximum of 0.35% of each Fund's average daily net assets attributable to Class A shares (comprised of up to 0.25% for shareholder liaison services and up to 0.10% for distribution services), but currently limit such fees to an aggregate fee of not more than 0.25% of each Fund's average daily net assets attributable to Class A shares.
The Distributor has voluntarily agreed to waive a portion of the distribution and service fees for Class C shares so that the combined fees do not exceed the annual rate of 0.65% of the average daily net assets of the Class C shares of Columbia Oregon Intermediate Municipal Bond Fund, and 0.85% of the average daily net assets of the Class C shares of Columbia Conservative High Yield Fund. These arrangements may be modified or terminated by the Distributor at any time.
The CDSC and the distribution fees received from the Plans are used principally as repayment to the Distributor for amounts paid by the Distributor to dealers who sold such shares.
Shareholder Services Fees
Columbia Mid Cap Growth Fund has adopted shareholder services plans that permit the Fund to pay for certain services provided to Class T shareholders by its financial advisors. The Fund may pay shareholder service fees up to an aggregate annual rate of 0.50% of the Fund's average daily net assets attributable to Class T shares (comprised of an annual rate of up to 0.25% for shareholder liaison services and up to 0.25% for administrative support services), but such fees will not exceed the Fund's net investment income attributable to Class T shares. Columbia Mid Cap Growth Fund limits such fees to an aggregate annual rate of not more than 0.30% of the Fund's average daily net assets attributable to Class T shares for shareholder liaison services and administrative support services.
Expense Limits and Fee Reimbursements
Effective January 1, 2009, Columbia has voluntarily agreed to reimburse a portion of the Funds' expenses so that the Funds' ordinary operating expenses (excluding any distribution and service fees, brokerage commissions, interest, taxes and extraordinary expenses, but including custodian charges
145
Columbia Funds, August 31, 2009 (continued)
relating to overdrafts, if any), after giving effect to any balance credits from the Funds' custodian, do not exceed the following annual rates, based on each Fund's average daily net assets:
| | | Annual Rate | |
| Columbia International Stock Fund | | | 1.15 | % | |
| Columbia Mid Cap Growth Fund | | | 1.05 | % | |
| Columbia Small Cap Growth Fund I | | | 1.10 | % | |
| Columbia Technology Fund | | | 1.20 | % | |
| Columbia Balanced Fund | | | 0.95 | % | |
| Columbia Conservative High Yield Fund | | | 0.80 | % | |
Columbia, in its discretion, may revise or discontinue these arrangements at any time.
Columbia has contractually agreed to bear a portion of Columbia Oregon Intermediate Municipal Bond Fund's expenses so that the Fund's ordinary operating expenses (excluding any distribution and service fees, brokerage commissions, interest, taxes and extraordinary expenses, but including custodian charges relating to overdrafts, if any), after giving effect to any balance credits from the Fund's custodian, do not exceed the annual rate of 0.50% of the Fund's average daily net assets through December 31, 2009. There is no guarantee that this arrangement will continue after December 31, 2009.
Prior to January 1, 2009, Columbia voluntarily agreed to bear a portion of Columbia Technology Fund's expenses so that the Fund's total operating expenses (excluding any distribution and service fees, brokerage commissions, interest, taxes and extraordinary expenses, but including custodian charges relating to overdrafts, if any), after giving effect to any balance credits from the Fund's custodian, did not exceed the annual rate of 1.65% of the Fund's average daily net assets.
Fees Paid to Officers and Trustees
All officers of the Funds are employees of Columbia or its affiliates and, with the exception of the Funds' Chief Compliance Officer, receive no compensation from the Funds. The Board of Trustees has appointed a Chief Compliance Officer to the Funds in accordance with federal securities regulations. The Funds, along with other affiliated funds, pay their pro-rata share of the expenses associated with the Chief Compliance Officer. Each Fund's expenses for the Chief Compliance Officer will not exceed $15,000 per year.
The Trust's eligible Trustees may participate in a deferred compensation plan which may be terminated at any time. Obligations of the plan will be paid solely out of the Funds' assets.
As a result of fund mergers, certain Funds assumed the liabilities of the deferred compensation plan of the acquired fund, which are included in "Trustees' fees" on the Statements of Assets and Liabilities. The deferred compensation plan may be terminated at any time. Any payments to plan participants are paid solely out of the Funds' assets.
Other Related Party Transactions
In connection with the purchase and sale of its securities during the period, the Funds used several brokers that are affiliates of BOA. Total brokerage commissions paid to affiliated brokers for the year ended August 31, 2009 were as follows:
| Columbia International Stock Fund | | $ | 112,358 | | |
| Columbia Mid Cap Growth Fund | | | 17,764 | | |
| Columbia Small Cap Growth Fund I | | | 19,273 | | |
| Columbia Technology Fund | | | 11,300 | | |
| Columbia Balanced Fund | | | 945 | | |
Note 5. Custody Credits
Each Fund has an agreement with its custodian bank under which custody fees may be reduced by balance credits. These credits are recorded as part of expense reductions on the Statements of Operations. The Funds could have invested a portion of the assets utilized in connection with the expense offset arrangement in an income-producing asset if they had not entered into such an agreement.
For the year ended August 31, 2009, these custody credits reduced total expenses for the Funds as follows:
| | | Custody
Credits | |
| Columbia International Stock Fund | | $ | — | * | |
| Columbia Mid Cap Growth Fund | | | 160 | | |
| Columbia Small Cap Growth Fund I | | | 1,139 | | |
| Columbia Technology Fund | | | 348 | | |
| Columbia Balanced Fund | | | 7 | | |
| Columbia Oregon Intermediate | | | | | |
| Municipal Bond Fund | | | 2,264 | | |
| Columbia Conservative High Yield Fund | | | 134 | | |
* Rounds to less than $1.
146
Columbia Funds, August 31, 2009 (continued)
Note 6. Objectives and Strategies for Investing in Derivatives Instruments
Columbia International Stock Fund, Columbia Mid Cap Growth Fund, Columbia Balanced Fund and Columbia Conservative High Yield Fund use derivatives instruments, including futures contracts, options, credit default swaps and forwards contracts, in order to meet each fund's objectives. Each Fund employs strategies in differing combinations to permit it to increase, decrease or change the level of exposure to market risk factors. The achievement of any strategy relating to derivatives depends on analysis of various risk factors, and if the strategies for investment do not work as intended, each Fund may not achieve its objectives.
In pursuit of the Funds' investment objectives, the Funds are exposed to the following market risks:
Equity Risk: Equity risk relates to change in value of equity securities such as common stocks due to general market conditions, such as real or perceived adverse economic conditions, changes in the general outlook for corporate earnings, or adverse investor sentiment. Equity securities generally have greater price volatility than fixed income securities.
Interest Rate Risk: Interest rate risk refers to the fluctuation in value of fixed income securities because of the inverse relationship of price and yield. Fixed income securities generally will decline in value upon an increase in general interest rates, and their value generally will increase upon a decline in general interest rates. Fixed income securities with longer durations tend to be more sensitive to changes in interest rates, usually making them more volatile than securities with shorter durations.
Foreign Exchange Rate Risk: Foreign exchange rate risk relates to the change in the U.S. dollar value of a security that is denominated in a foreign currency. The U.S. dollar value of a foreign-currency-denominated security will decrease as the dollar appreciates against the currency, while the U.S. dollar value will increase as the dollar depreciates against the currency.
The following notes provide more detailed information about each derivative type held by the Funds:
Futures Contracts—Each of Columbia Balanced Fund and Columbia Oregon Intermediate Municipal Bond Fund entered into interest rate futures contracts and Columbia International Stock Fund entered into stock index futures contracts to manage the Funds' exposure to the securities markets and/or movements in interest rates.
The use of futures contracts involves certain risks, which include: (1) imperfect correlation between the price movement of the instruments and the underlying securities, (2) inability to close out positions due to differing trading hours, or the temporary absence of a liquid market, for either the instruments or the underlying securities, or (3) an inaccurate prediction of the future direction of interest rates by Columbia. Upon entering into a futures contract, the Funds pledge cash or securities with the broker in an amount sufficient to meet the initial margin requirement. Subsequent payments are made or received by the Funds equal to the daily change in the contract value and are recorded as variation margin receivable or payable and offset in unrealized gains or losses. The Funds recognize a realized gain or loss when the contract is closed or expires.
Futures contracts involve, to varying degrees, risk of loss in excess of the variation margin disclosed on the Funds' Statements of Assets and Liabilities.
Options—Each of Columbia International Stock Fund and Columbia Mid Cap Growth Fund had written covered call options to decrease the Funds' exposure to equity risk and to increase return on instruments. A written covered call option becomes more valuable as the price of the underlying instruments depreciate relative to the strike price.
Writing put options tends to increase the Funds' exposure to the underlying instrument. When the Funds write a call or put option, an amount equal to the premium received is recorded as a liability and subsequently marked-to-market to reflect the current value of the option written. Premiums received from writing options which expire are treated as realized gains. Premiums received from writing options which are exercised or closed are added to the proceeds or offset against the amounts paid on the underlying security transaction to determine the realized gain or loss. The Funds, as writers of an option, have no control over whether the underlying security may be sold (call) or purchased (put) and as a result bear the market risk of an unfavorable change in the price of the security underlying the written option. There is the risk that the Funds may not be able to enter into a closing transaction because of an illiquid market. T he Funds' custodian will set aside cash or liquid portfolio securities
147
Columbia Funds, August 31, 2009 (continued)
equal to the amount of the written options contract commitment in a separate account.
The Funds may also purchase put and call options. Purchasing call options tends to increase the Funds' exposure to the underlying instrument. Purchasing put options tends to decrease the Funds' exposure to the underlying instrument. The Funds may pay a premium, which is included in the Funds' Statements of Assets and Liabilities as an investment and subsequently marked-to-market to reflect the current value of the option. The risk associated with purchasing put and call options is limited to the premium paid. Premiums paid for purchasing options which expire are treated as realized losses. Premiums paid for purchasing options which are exercised are added to the amounts paid (call) or offset against the proceeds (put) on the underlying security to determine the realized gain or loss. If the Funds enter into a closing transaction, the Funds will realize a gain or loss, depending on whether the proceeds from the closing transactio n are greater or less than the cost of the option.
Forward Foreign Currency Exchange Contracts—Columbia International Stock Fund entered into forward foreign currency exchange contracts to shift its investment exposure from one currency to another. The Fund used forward contracts to shift its U.S. dollar exposure in order to achieve a representative weighted mix of major currencies in it benchmark and/or to recover an underweight country exposure in its portfolio.
Columbia Conservative High Yield Fund entered into forward foreign currency exchange contracts for the purpose of shifting foreign currency exposure back to U.S. dollars.
Forward foreign currency exchange contracts are agreements to exchange one currency for another at a future date at a specified price. These contracts are used to minimize the exposure to foreign exchange rate fluctuations during the period between the trade and settlement dates of the contract. The Funds may utilize forward foreign currency exchange contracts in connection with the settlement of purchases and sales of securities. The Funds may also enter into these contracts to reduce the exposure to adverse price movements in certain other foreign currency denominated assets. Contracts to buy generally are used to acquire exposure to foreign currencies, while contracts to sell are generally used to reduce the exposure to foreign exchange rate fluctuations. Forward foreign currency exchange contracts are valued daily at the current exchange rate of the underlying currency, resulting in unrealized gains (losses) which become rea lized at the time the forward foreign currency exchange contracts are closed or mature. Realized and unrealized gains (losses) arising from such transactions are included in net realized and unrealized gains (losses) on foreign currency transactions. The use of forward foreign currency exchange contracts does not eliminate fluctuations in the prices of the Funds' portfolio securities. While the maximum potential loss from such contracts is the aggregate face value in U.S. dollars at the time the contract was opened, exposure is typically limited to the change in value of the contract (in U.S. dollars) over the period it remains open. The Funds could also be exposed to risk that counterparties of the contracts may be unable to fulfill the terms of the contracts.
Credit Default Swaps—During the reporting period, Columbia Conservative High Yield Fund entered into credit default swap transactions as a protection provider to increase exposure to a credit or basket of credits that could not be established efficiently and economically through purchase of individual bonds. At August 31, 2009, the Fund did not have any open credit default swap contracts.
Credit default swaps are agreements in which one party pays fixed periodic payments to a counterparty in consideration for a guarantee from the counterparty to make a specific payment should a negative credit event take place. The Fund may receive an upfront payment as the protection seller or make an upfront payment as the protection buyer. Credit default swaps are marked to market daily based on quotations from market makers and any change is recorded as unrealized appreciation/depreciation on the Statements of Assets and Liabilities. Periodic payments received or made are recorded as a realized gain or loss and premiums received or made are amortized on the Statements of Operations.
If the Fund is a seller of protection and a credit event occurs, as defined under the terms of that particular swap agreement, the Fund will either (i) pay to the buyer of protection an amount equal to the notional amount of the swap and take delivery of the referenced obligation or underlying securities comprising the referenced index or (ii) pay a net settlement amount in the form of cash or securities equal to the notional amount of the swap less the recovery value of the referenced obligation or underlying securities comprising the referenced index.
148
Columbia Funds, August 31, 2009 (continued)
If the Fund is a buyer of protection and a credit event occurs, as defined under the terms of that particular swap agreement, the Fund will either (i) receive from the seller of protection an amount equal to the notional amount of the swap and deliver the referenced obligation or underlying securities comprising the referenced index or (ii) receive a net settlement amount in the form of cash or securities equal to the notional amount of the swap less the recovery value of the referenced obligation or underlying securities comprising the referenced index.
The following table is a summary of the Funds' value of derivative investments as of August 31, 2009.
| | | Fair Value of Derivative Instruments | |
| | | Assets | | Liabilities | |
| | | Statements of Assets and Liabilities
Fair Value | | Statements of Assets and Liabilities
Fair Value | |
| Funds | | Futures
Variation
Margin* | | Written
Options | | Unrealized
Appreciation
on Forward
Foreign
Currency
Exchange
Contracts | | Unrealized
Depreciation
on Forward
Foreign
Currency
Exchange
Contracts | |
Columbia International
Stock Fund | | $ | — | | | $ | 41,310 | | | $ | 2,677,427 | | | $ | 1,171,957 | | |
| Columbia Balanced Fund | | | 6,000 | | | | — | | | | — | | | | — | | |
Columbia Conservative
High Yield Fund | | | — | | | | — | | | | — | | | | 39,255 | | |
* Includes only the current day's variation margin.
The Effect of Derivative Instruments on the Statements of Operations for the year ended August 31, 2009.
| | | Amount of Realized Gain or (Loss) on
Derivatives Recognized in Income | | Change in Unrealized Appreciation
(Depreciation) on Derivatives
Recognized in Income | |
| Funds | | Risk
Exposure | | Futures
Contracts | | Written
Options | | Credit
Default
Swaps | | Unrealized
Appreciation
(Depreciation)
on Forward
Foreign
Currency
Exchange
Contracts | | Futures
Contracts | | Written
Options | | Credit
Default
Swaps | | Unrealized
Depreciation
on Forward
Foreign
Currency
Exchange
Contracts | |
Columbia
International
Stock Fund | | Equity and
Foreign
Exchange Rate | | $ | 312,044 | | | $ | 721,003 | | | $ | — | | | $ | (13,519,447 | ) | | $ | — | | | $ | (103,334 | ) | | $ | — | | | $ | 6,447,130 | | |
Columbia Mid Cap
Growth Fund
| | Equity and
Foreign
Exchange Rate | | | — | | | | 250,550 | | | | — | | | | — | | | | — | | | | (20,300 | ) | | | — | | | | — | | |
149
Columbia Funds, August 31, 2009 (continued)
| | | Amount of Realized Gain or (Loss) on
Derivatives Recognized in Income | | Change in Unrealized Appreciation
(Depreciation) on Derivatives
Recognized in Income | |
| Funds | | Risk
Exposure | | Futures
Contracts | | Credit
Default
Swaps | | Unrealized
Appreciation
(Depreciation)
on Forward
Foreign
Currency
Exchange
Contracts | | Futures
Contracts | | Unrealized
Depreciation
on Forward
Foreign
Currency
Exchange
Contracts | |
| Columbia Balanced Fund | | Interest Rate | | $ | (176,021 | ) | | $ | — | | | $ | — | | | $ | 7,980 | | | $ | — | | |
Columbia Oregon
Intermediate Municipal
Bond Fund | | Interest Rate | | | 176,711 | | | | — | | | | — | | | | — | | | | — | | |
Columbia Conservative
High Yield Fund | | Credit and Foreign
Exchange Rate | | | — | | | | (177,056 | ) | | | 107,952 | | | | — | | | | (36,980 | ) | |
Note 7. Portfolio Information
For the year ended August 31, 2009, the cost of purchases and proceeds from sales of securities, excluding short-term obligations, for the Funds were as follows:
| | | U.S. Government Securities | | Other Investment Securities | |
| | | Purchases | | Sales | | Purchases | | Sales | |
| Columbia International Stock Fund | | $ | — | | | $ | — | | | $ | 617,860,021 | | | $ | 734,524,344 | | |
| Columbia Mid Cap Growth Fund | | | — | | | | — | | | | 1,495,536,394 | | | | 1,505,548,006 | | |
| Columbia Small Cap Growth Fund I | | | — | | | | — | | | | 801,973,396 | | | | 544,455,022 | | |
| Columbia Technology Fund | | | — | | | | — | | | | 673,759,934 | | | | 699,651,285 | | |
| Columbia Balanced Fund | | | 30,745,012 | | | | 26,580,339 | | | | 192,431,855 | | | | 152,770,141 | | |
| Columbia Oregon Intermediate Municipal Bond Fund | | | — | | | | — | | | | 57,971,315 | | | | 31,400,595 | | |
| Columbia Conservative High Yield Fund | | | — | | | | — | | | | 372,234,470 | | | | 308,521,666 | | |
Note 8. Regulatory Settlements
As of August 31, 2009, the following Funds had received payments relating to certain regulatory settlements with third parties that the Funds had participated in during the year. The payments have been included in "Increase from regulatory settlements" on the Statements of Changes in Net Assets. The payments were as follows:
| Columbia International Stock Fund | | $ | 7,166,056 | | |
| Columbia Mid Cap Growth Fund | | | 253,476 | | |
Columbia Oregon Intermediate
Municipal Bond Fund | | | 182,996 | | |
| Columbia Conservative High Yield Fund | | | 97,269 | | |
150
Columbia Funds, August 31, 2009 (continued)
Note 9. Redemption Fees
Columbia International Stock Fund may impose a 2.00% redemption fee on the proceeds of fund shares that are redeemed within 60 days of purchase. The redemption fee is designed to offset brokerage commissions and other costs associated with short term trading of fund shares. The redemption fees, which are retained by the Fund, are accounted for as an addition to paid-in capital and are allocated to each class based on the relative net assets at the time of the redemption. For the year ended August 31, 2009, the redemption fees for Class A, Class B, Class C, Class Y and Class Z shares of Columbia International Stock Fund amounted to $2,367, $123, $203, $14 and $6,168, respectively.
Note 10. Line of Credit
The Funds and other affiliated funds participate in a $280,000,000 committed, unsecured revolving line of credit provided by State Street. The maximum amount that may be borrowed by any fund is limited to the lesser of $200,000,000 and the Fund's borrowing limit set forth in the Fund's registration statement. Borrowings are available for short-term liquidity or temporary or emergency purposes.
Interest is charged to each participating fund based on the fund's borrowings at a rate per annum equal to the greater of the Federal Funds Rate plus 0.50% or the overnight LIBOR Rate plus 0.50%. In addition, an annual operations agency fee of $20,000, an amendment fee of 0.02% and a commitment fee of 0.12% per annum are accrued and apportioned among the participating funds pro rata based on their relative net assets. Prior to October 16, 2008, the Funds and other affiliated funds participated in a $350,000,000 committed, unsecured revolving line of credit and a $150,000,000 uncommitted, unsecured line of credit, both provided by State Street. Interest on the committed line of credit was charged to each participating fund based on the fund's borrowings at a rate per annum equal to the Federal Funds Rate plus 0.50%. In addition, a commitment fee of 0.10% per annum was accrued and apportioned among the participating funds pro rata based on their relative net assets. Interest on the uncommitted line of credit was charged to each participating fund based on the fund's borrowings at a rate per annum equal to the Federal Funds Rate plus 0.375%. State Street charged an annual operations agency fee of $40,000 for the committed line of credit and was able to charge an annual administration fee of $15,000 for the uncommitted line of credit. The commitment fee, the operations agency fee and the administration fee were accrued and apportioned among the participating funds pro rata based on their relative net assets.
For the year ended August 31, 2009, the average daily loan balance outstanding on days where borrowing existed, and the weighted average interest rate of each Fund that borrowed were as follows:
| | | Average
Borrowings | | Weighted
Average
Interest
Rate | |
Columbia International
Stock Fund | | $ | 2,074,359 | | | | 1.27 | % | |
Columbia Conservative
High Yield Fund | | | 1,900,000 | | | | 0.78 | % | |
Note 11. Shares of Beneficial Interest
As of August 31, 2009, six Funds had shareholders whose shares were beneficially owned by participant accounts over which BOA and/or any of its affiliates had either sole or joint investment discretion. The percentages of shares of beneficial interest outstanding held therein are as follows:
| | | % of Shares
Outstanding
Held | |
Columbia International
Stock Fund | | | 55.7 | | |
Columbia Mid Cap
Growth Fund | | | 38.6 | | |
Columbia Small Cap
Growth Fund I | | | 38.2 | | |
| Columbia Technology Fund | | | 10.1 | | |
| Columbia Balanced Fund | | | 14.6 | | |
Columbia Conservative
High Yield Fund | | | 39.0 | | |
151
Columbia Funds, August 31, 2009 (continued)
As of August 31, 2009, six Funds had shareholders that held greater than 5% of the shares outstanding of a Fund, over which BOA and/or any of its affiliates did not have investment discretion. The number of accounts and the percentages of shares of beneficial interest outstanding held therein are as follows:
| | | Number of
Shareholders | | % of Shares
Outstanding
Held | |
Columbia Mid Cap
Growth Fund | | | 1 | | | | 6.2 | | |
Columbia Small Cap
Growth Fund I | | | 2 | | | | 17.1 | | |
| Columbia Technology Fund | | | 3 | | | | 27.9 | | |
| Columbia Balanced Fund | | | 1 | | | | 7.9 | | |
Columbia Oregon Intermediate
Municipal Bond Fund | | | 1 | | | | 17.1 | | |
Columbia Conservative
High Yield Fund | | | 1 | | | | 12.8 | | |
Subscription and redemption activity of these accounts may have a significant effect on the operations of the Funds.
Note 12. Significant Risks and Contingencies
Sector Focus Risk
Certain Funds may focus their investments in certain sectors, subjecting them to greater risk than a fund that is less focused.
High-Yield Securities Risk
Investing in high-yield securities may involve greater credit risk and considerations not typically associated with investing in U.S. Government bonds and other higher quality fixed income securities. These securities are non-investment grade securities, often referred to as "junk" bonds. Economic downturns may disrupt the high yield market and impair the ability of issuers to repay principal and interest. Also, an increase in interest rates would likely have an adverse impact on the value of such obligations. Moreover, high-yield securities may be less liquid to the extent that there is no established secondary market.
Foreign Securities Risk
There are certain additional risks involved when investing in foreign securities. These risks may involve foreign currency exchange rate fluctuations, adverse political and economic developments and the possible prevention of currency exchange or other foreign governmental laws or restrictions. In addition, the liquidity of foreign securities may be more limited than that of domestic securities.
Investments in emerging market countries are subject to additional risk. The risk of foreign investments is typically increased in less developed countries. These countries are also more likely to experience high levels of inflation, deflation or currency devaluation which could hurt their economies and securities markets.
Geographic Concentration Risk
Columbia Oregon Intermediate Municipal Bond Fund had greater than 5% of its total net assets on August 31, 2009, invested in debt obligations issued by the state of Oregon and its political subdivisions, agencies and public authorities. This Fund is more susceptible to economic and political factors adversely affecting issuers of the state's municipal securities than are municipal bond funds that are not concentrated to the same extent in these issuers.
Concentration of Credit Risk
Columbia Oregon Intermediate Municipal Bond Fund holds investments that are insured by private insurers who guarantee the payment of principal and interest in the event of default or that are supported by a letter of credit. At August 31, 2009, private insurers who insured greater than 5% of the total investments of Columbia Oregon Intermediate Municipal Bond Fund were as follows:
| Insurer | | % of Total
Net Assets | |
| National Public Finance Guarantee Corp. | | | 13.3 | | |
| Financial Security Assurance, Inc. | | | 10.1 | | |
| Financial Guaranty Insurance Corp. | | | 11.2 | | |
| Ambac Assurance Corp. | | | 5.0 | | |
152
Columbia Funds, August 31, 2009 (continued)
At October 13, 2009, National Public Finance Guarantee Corp., Financial Guaranty Insurance Corp., Ambac Assurance Corp. and Financial Security Assurance, Inc. were rated by Standard & Poor's A, non rated, CC and AAA, respectively.
Tax Development Risk
Columbia Oregon Intermediate Municipal Bond Fund purchases municipal securities whose interest, in the opinion of bond counsel, is free from federal income tax. There is no assurance that the Internal Revenue Service (IRS) will agree with this opinion. In the event the IRS determines that an issuer does not comply with relevant tax requirements, interest payments from a security could become federally taxable, possibly retroactively to the date the security was issued. As a shareholder of Columbia Oregon Intermediate Municipal Bond Fund, you may be required to file an amended tax return as a result.
Legal Proceedings
Columbia Management Advisors, LLC and Columbia Management Distributors, Inc. (collectively, the "Columbia Group") are subject to a settlement agreement with the New York Attorney General ("NYAG") (the "NYAG Settlement") and a settlement order with the SEC (the "SEC Order") on matters relating to mutual fund trading, each dated February 9, 2005. Under the terms of the SEC Order, the Columbia Group (or predecessor entities) agreed, among other things, to: pay disgorgement and civil money penalties collectively totaling $140 million; cease and desist from violations of the antifraud provisions and certain other provisions of the federal securities laws; maintain certain compliance and ethics oversight structures; and retain an independent consultant to review the Columbia Group's applicable supervisory, compliance, control and other policies and procedures. The NYAG Settlement, among other things, requires Columbia Management Advis ors, LLC and its affiliates to reduce management fees for certain funds in the Columbia family of mutual funds in a projected total of $160 million over five years through November 30, 2009 and to make certain disclosures to investors relating to expenses. In connection with the Columbia Group providing services to the Columbia Funds, the Columbia Funds have voluntarily undertaken to implement certain governance measures designed to maintain the independence of their boards of trustees and certain special consulting and compliance measures.
Pursuant to the SEC Order and related procedures, the $140 million in settlement amounts described above has been substantially distributed in accordance with a distribution plan that was developed by an independent distribution consultant and approved by the SEC on April 6, 2007.
In connection with the events described above, various parties have filed suit against certain funds, the Trustees of the Columbia Funds, FleetBoston Financial Corporation and its affiliated entities and/or Bank of America and its affiliated entities.
On February 20, 2004, the Judicial Panel on Multidistrict Litigation transferred these cases and cases against other mutual fund companies based on similar allegations to the United States District Court in Maryland for consolidated or coordinated pretrial proceedings (the "MDL"). Subsequently, additional related cases were transferred to the MDL. On September 29, 2004, the plaintiffs in the MDL filed amended and consolidated complaints. One of these amended complaints is a putative class action that includes claims under the federal securities laws and state common law, and that names Columbia Management Advisors, Inc. (which has since merged into Banc of America Capital Management, LLC (now named Columbia Management Advisors, LLC)) ("Columbia"), Columbia Funds Distributor, Inc. (now named Columbia Management Distributors, Inc.) (the "Distributor"), the Trustees of the Columbia Funds, Bank of America Corporation and others as d efendants. Another of the amended complaints is a derivative action purportedly on behalf of the Columbia Funds that asserts claims under federal securities laws and state common law.
On February 25, 2005, Columbia and other defendants filed motions to dismiss the claims in the pending cases. On March 1, 2006, for reasons stated in the court's memoranda dated November 3, 2005, the United States District Court for the District of Maryland granted in part and denied in part the defendants' motions to dismiss. The court dismissed all of the class action claims pending against the Columbia Funds Trusts. As to Columbia and the Distributor, the claims under the Securities Act of 1933, the claims under Sections 34(b) and 36(a) of the Investment Company Act of 1940 ("ICA") and the state law claims were dismissed. The claims under Sections 10(b) and 20(a) of the Securities Exchange Act of 1934 and claims under Section 36(b) of the ICA were not dismissed.
153
Columbia Funds, August 31, 2009 (continued)
On March 21, 2005, a purported class action was filed in Massachusetts state court alleging that certain conduct, including market timing, entitled Class B shareholders in certain Columbia Funds to an exemption from contingent deferred sales charges upon early redemption (the "CDSC Lawsuit"). The CDSC Lawsuit was removed to federal court in Massachusetts and transferred to the MDL.
On September 14, 2007, the plaintiffs and the Columbia defendants named in the MDL, including the Columbia Funds, entered into a stipulation of settlement with respect to all Columbia-related claims in the MDL described above, including the CDSC Lawsuit. The settlement is subject to court approval.
Note 13. Subsequent Events
Bank of America Corporation, the indirect parent company of Columbia, entered into an agreement dated September 29, 2009 to sell a portion of the asset management business of Columbia Management Group, LLC to Ameriprise Financial, Inc. The transaction ("Transaction") includes a sale of the part of the asset management business that advises long-term mutual funds, including the Funds. The Transaction is subject to certain approvals and other conditions to closing, and is currently expected to close in the spring of 2010.
On October 15, 2009, the committed line of credit discussed in Note 10 was renewed on amended terms. Pursuant to the amended terms, interest is charged to each participating fund based on the fund's borrowings at a rate per annum equal to the greater of the Federal Funds Rate plus 1.25% or the overnight LIBOR Rate plus 1.25%. In addition, a commitment fee of 0.15% per annum is accrued and apportioned among the participating funds pro rata based on their relative net assets. The annual operations agency fee of $20,000 was waived.
154
Report of Independent Registered Public Accounting Firm
To the Board of Trustees and the Shareholders of Columbia Funds Series Trust I
In our opinion, the accompanying statements of assets and liabilities, including the investment portfolios, and the related statements of operations and of changes in net assets and the financial highlights present fairly, in all material respects, the financial position of Columbia International Stock Fund, Columbia Mid Cap Growth Fund, Columbia Small Cap Growth Fund I, Columbia Technology Fund, Columbia Balanced Fund, Columbia Oregon Intermediate Municipal Bond Fund and Columbia Conservative High Yield Fund (constituting part of Columbia Funds Series Trust I, hereafter collectively referred to as the "Funds") at August 31, 2009, the results of each of their operations for the year then ended, the changes in each of their net assets for each of the two years in the period then ended, and the financial highlights for each of the periods indicated, in conformity with accounting principles generally accepted in the United States o f America. These financial statements and financial highlights (hereafter referred to as "financial statements") are the responsibility of the Funds' management. Our responsibility is to express an opinion on these financial statements based on our audits. We conducted our audits of these financial statements in accordance with the standards of the Public Company Accounting Oversight Board (United States). Those standards require that we plan and perform the audit to obtain reasonable assurance about whether the financial statements are free of material misstatement. An audit includes examining, on a test basis, evidence supporting the amounts and disclosures in the financial statements, assessing the accounting principles used and significant estimates made by management, and evaluating the overall financial statement presentation. We believe that our audits, which included confirmation of securities at August 31, 2009 by correspondence with the custodian and brokers, provide a reasonable basis for our opin ion.
PricewaterhouseCoopers LLP
Boston, Massachusetts
October 22, 2009
155
Federal Income Tax Information (Unaudited)
Columbia International Stock Fund
Foreign taxes paid during the fiscal year ended August 31, 2009, of $1,876,804 are being passed through to shareholders. This represents $0.04 per share. Eligible shareholders may claim this amount as a foreign tax credit.
Gross income derived from sources within foreign countries was $17,758,569 ($0.35 per share) for the fiscal year ended August 31, 2009.
The Fund will notify shareholders in January 2010 of amounts for use in preparing 2009 income tax returns.
Columbia Balanced Fund
For non-corporate shareholders 39.98% or the maximum amount allowable under the Jobs and Growth Tax Relief Reconciliation Act of 2003, of the ordinary income distributed by the Fund for the fiscal year ended August 31, 2009 may represent qualified dividend income.
39.14% of the ordinary income distributed by the Fund for the fiscal year ended August 31, 2009, qualifies for the corporate dividends received deduction.
The Fund will notify shareholders in January 2010 of amounts for use in preparing 2009 income tax returns.
Columbia Oregon Intermediate Municipal Bond Fund
98.22% of the distributions from net investment income will be treated as exempt income for federal income tax purposes.
The Fund will notify shareholders in January 2010 of amounts for use in preparing 2009 income tax returns.
156
Fund Governance
The Trustees serve terms of indefinite duration. The names, addresses and ages of the Trustees and officers of the Funds in the Columbia Funds Complex, the year each was first elected or appointed to office, their principal business occupations during at least the last five years, the number of Funds overseen by each Trustee and other directorships they hold are shown below. Each officer listed below serves as an officer of each Fund in the Columbia Funds Complex.
Independent Trustees
Name, Address and Year of Birth,
Position with Funds, Year First
Elected or Appointed to Office | | Principal Occupation(s) During Past Five Years, Number of Funds in the Columbia
Funds Complex Overseen by Trustee, Other Directorships Held
| |
| John D. Collins (Born 1938) | |
|
c/o Columbia Management
Advisors, LLC
One Financial Center
Boston, MA 02111
Trustee (since 2007) | | Retired. Consultant, KPMG, LLP (accounting and tax firm) from July 1999 to June 2000; Partner, KPMG, LLP from March 1962 to June 1999. Oversees 66, Mrs. Fields Famous Brands LLC (consumer products); Suburban Propane Partners, L.P.; and Montpelier Re (insurance underwriting firm) | |
|
| Rodman L. Drake (Born 1943) | |
|
c/o Columbia Management
Advisors, LLC
One Financial Center
Boston, MA 02111
Trustee (since 2007)
and Chairman of the Board
(since 2009) | | Co-Founder of Baringo Capital LLC (private equity) since 2002; President, Continuation Investments Group, Inc. from 1997 to 2001. Oversees 66, Jackson Hewitt Tax Service Inc. (tax preparation services); Crystal Capital River Inc. (real estate investment trust); Student Loan Corporation (student loan provider); Celgene Corporation (global biotechnology company); and The Helios Funds (exchange-traded funds) | |
|
| Douglas A. Hacker (Born 1955) | |
|
c/o Columbia Management
Advisors, LLC
One Financial Center
Boston, MA 02111
Trustee (since 1996) | | Independent business executive since May 2006; Executive Vice President—Strategy of United Airlines (airline) from December 2002 to May 2006; President of UAL Loyalty Services (airline marketing company) from September 2001 to December 2002; Executive Vice President and Chief Financial Officer of United Airlines from July 1999 to September 2001. Oversees 66, Nash Finch Company (food distributor); Aircastle Limited (aircraft leasing) | |
|
| Janet Langford Kelly (Born 1957) | |
|
c/o Columbia Management
Advisors, LLC
One Financial Center
Boston, MA 02111
Trustee (since 1996) | | Senior Vice President, General Counsel and Corporate Secretary, ConocoPhillips (integrated energy company) since September 2007; Deputy General Counsel—Corporate Legal Services, ConocoPhillips from August 2006 to August 2007; Partner, Zelle, Hofmann, Voelbel, Mason&Gette LLP (law firm) from March 2005 to July 2006; Adjunct Professor of Law, Northwestern University, from September 2004 to June 2006; Director, UAL Corporation (airline) from February 2006 to July 2006; Oversees 66, None | |
|
| Charles R. Nelson (Born 1942) | |
|
c/o Columbia Management
Advisors, LLC
One Financial Center
Boston, MA 02111
Trustee (since 1981) | | Professor of Economics, University of Washington, since January 1976; Ford and Louisa Van Voorhis Professor of Political Economy, University of Washington, since September 1993; Adjunct Professor of Statistics, University of Washington, since September 1980; Associate Editor, Journal of Money Credit and Banking, 1993-2008 Consultant on econometric and statistical matters. Oversees 66, None | |
|
157
Fund Governance (continued)
Independent Trustees (continued)
Name, Address and Year of Birth,
Position with Funds, Year First
Elected or Appointed to Office | | Principal Occupation(s) During Past Five Years, Number of Funds in the Columbia
Funds Complex Overseen by Trustee, Other Directorships Held
| |
| John J. Neuhauser (Born 1943) | |
|
c/o Columbia Management
Advisors, LLC
One Financial Center
Boston, MA 02111
Trustee (since 1985) | | President, Saint Michael's College, since August 2007; University Professor, Boston College from November 2005 to August 2007; Academic Vice President and Dean of Faculties, Boston College from August 1999 to October 2005. Oversees 66, Liberty All-Star Equity Fund and Liberty All-Star Growth Fund, Inc. (closed-end funds) | |
|
| Jonathan Piel (Born 1938) | |
|
c/o Columbia Management
Advisors, LLC
One Financial Center
Boston, MA 02111
Trustee (since 2007) | | Cable television producer and website designer; The Editor, Scientific American from 1984 to 1994; Vice President, Scientific American, Inc., from 1984 to 1994; Member, Advisory Board, Stone Age Institute, Bloomington, Indiana (research institute that explores the effect of technology on human evolution); Member, Board of Directors of the National Institute of Social Sciences, New York City; Member, Board of Trustees of the William Alanson White Institute, New York City (institution for training psychoanalysts); and Member, Advisory Board, Mount Sinai Children's Environmental Health Center, New York. Oversees 66, None | |
|
| Patrick J. Simpson (Born 1944) | |
|
c/o Columbia Management
Advisors, LLC
One Financial Center
Boston, MA 02111
Trustee (since 2000) | | Partner, Perkins Coie LLP (law firm). Oversees 66, None | |
|
| Thomas C. Theobald (Born 1937) | |
|
c/o Columbia Management
Advisors, LLC
One Financial Center
Boston, MA 02111
Trustee (since 1996) | | Partner and Senior Advisor, Chicago Growth Partners (private equity investing) since September 2004; Managing Director, William Blair Capital Partners (private equity investing) from September 1994 to September 2004. Oversees 66, Anixter International (network support equipment distributor); Ventas, Inc. (real estate investment trust); Jones Lang LaSalle (real estate management services); Ambac Financial Group (financial guaranty insurance) | |
|
| Anne-Lee Verville (Born 1945) | |
|
c/o Columbia Management
Advisors, LLC
One Financial Center
Boston, MA 02111
Trustee (since 1998) | | Retired since 1997 (formerly General Manager—Global Education Industry (from 1994 to 1997), President-Application Systems Division (from 1991 to 1994), Chief Financial Officer—US Marketing&Services (from 1988 to 1991), and Chief Information Officer (from 1987 to 1988), IBM Corporation (computer and technology)). Oversees 66, None | |
|
158
Fund Governance (continued)
Interested Trustee
Name, Address and Year of Birth,
Position with Funds, Year First
Elected or Appointed to Office | | Principal Occupation(s) During Past Five Years, Number of Funds in the Columbia
Funds Complex Overseen by Trustee, Other Directorships Held
| |
| William E. Mayer1 (Born 1940) | |
|
c/o Columbia Management
Advisors, LLC
One Financial Center
Boston, MA 02111
Trustee (since 1994) | | Partner, Park Avenue Equity Partners (private equity) since February 1999; Dean and Professor, College of Business, University of Maryland from 1992 to 1997. Oversees 66, Lee Enterprises (print media),WRHambrecht + Co. (financial (investment company) service provider); BlackRock Kelso Capital Corporation | |
|
1 The Funds currently treat Mr. Mayer as an "interested person" (as defined in the Investment Company Act of 1940) by reason of his affiliation with WR Hambrecht + Co., a registered broker/dealer that may execute portfolio transactions for or engage in principal transactions with the Funds or other funds or accounts advised/managed by the Advisor or other Bank of America affiliates.
The Statement of Additional Information includes additional information about the Trustees of the Funds and is available, without charge, upon request by calling 1-800-345-6611.
Officers
Name, Address and Year of Birth,
Position with Funds, Year First
Elected or Appointed to Office | | Principal Occupation(s) During Past Five Years
| |
| J. Kevin Connaughton (Born 1964) | |
|
One Financial Center
Boston, MA 02111
President (since 2009) | | Managing Director of Columbia Management Advisors, LLC since December 2004; Senior Vice President and Chief Financial Officer—Columbia Funds, from June 2008 to January 2009; Treasurer—Columbia Funds, from October 2003 to May 2008; Treasurer—the Liberty Funds, Stein Roe Funds and Liberty All-Star Funds, December 2000-December 2006; Senior Vice President—Columbia Management Advisors, LLC, from April 2003 to December 2004; President—Columbia Funds, Liberty Funds and Stein Roe Funds, February 2004 to October 2004; Treasurer—Galaxy Funds, September 2002 to December 2005; Treasurer, December 2002 to December 2004, and President, February 2004 to December 2004—Columbia Management Multi-Strategy Hedge Fund, LLC; and a senior officer of various other Bank of America-affiliated entities, including other registered and unregistered funds. | |
|
| James R. Bordewick, Jr. (Born 1959) | |
|
One Financial Center
Boston, MA 02111
Senior Vice President, Secretary
and Chief Legal Officer (since 2006) | | Associate General Counsel, Bank of America since April 2005; Senior Vice President and Associate General Counsel, MFS Investment Management (investment management) prior to April 2005. | |
|
| Linda J. Wondrack (Born 1964) | |
|
One Financial Center
Boston, MA 02111
Senior Vice President and
Chief Compliance Officer
(since 2007) | | Director (Columbia Management Group LLC and Investment Product Group Compliance), Bank of America since June 2005; Director of Corporate Compliance and Conflicts Officer, MFS Investment Management (investment management), August 2004 to May 2005; Managing Director, Deutsche Asset Management (investment management) prior to August 2004. | |
|
159
Fund Governance (continued)
Officers (continued)
Name, Address and Year of Birth,
Position with Funds, Year First
Elected or Appointed to Office | | Principal Occupation(s) During Past Five Years
| |
| Michael G. Clarke (Born 1969) | |
|
One Financial Center
Boston, MA 02111
Senior Vice President and
Chief Financial Officer
(since 2009) | | Director of Fund Administration of the Advisor since January 2006; Managing Director of the Advisor September 2004 to December 2005; Vice President Fund Administration June 2002 to September 2004. | |
|
| Jeffrey R. Coleman (Born 1969) | |
|
One Financial Center
Boston, MA 02111
Deputy Treasurer (since 2006) | | Director of Fund Administration of the Advisor since January 2006; Fund Controller of the Advisor from October 2004 to January 2006; Vice President of CDC IXIS Asset Management Services, Inc. (investment management) from August 2000 to September 2004. | |
|
| Joseph F. DiMaria (Born 1968) | |
|
One Financial Center
Boston, MA 02111
Chief Accounting Officer and
Treasurer (since 2009) | | Director of Fund Administration of the Advisor since January 2006; Head of Tax/Compliance and Assistant Treasurer of the Advisor from November 2004 to December 2005; Director of Trustee Administration (Sarbanes-Oxley) of the Advisor from May 2003 to October 2004. | |
|
| Julian Quero (Born 1967) | |
|
One Financial Center
Boston, MA 02111
Deputy Treasurer (since 2008) | | Senior Tax Manager of the Advisor since August 2006; Senior Compliance Manager of the Advisor from April 2002 to August 2006. | |
|
| Barry S. Vallan (Born 1969) | |
|
One Financial Center
Boston, MA 02111
Controller (since 2006) | | Vice President—Fund Treasury of the Advisor since October 2004; Vice President—Trustee Reporting of the Advisor from April 2002 to October 2004. | |
|
| Stephen T. Welsh (Born 1957) | |
|
One Financial Center
Boston, MA 02111
Vice President (since 1996) | | President, Columbia Management Services, Inc. since July 2004; Senior Vice President and Controller, Columbia Management Services, Inc. prior to July 2004. | |
|
160
Important Information About This Report – Columbia Funds
The funds mail one shareholder report to each shareholder address. If you would like more than one report, please call shareholder services at 1-800-345-6611 and additional reports will be sent to you. This report has been prepared for shareholders of the Columbia Funds.
A description of the policies and procedures that each fund uses to determine how to vote proxies and a copy of each fund's voting records are available (i) at www.columbiamanagement.com, (ii) on the Securities and Exchange Commission's website at www.sec.gov, and (iii) without charge, upon request, by calling 1-800-368-0346. Information regarding how each fund voted proxies relating to portfolio securities during the 12-month period ended June 30 is available from the SEC's website. Information regarding how each fund voted proxies relating to portfolio securities is also available from the funds' website, www.columbiamanagement.com.
Each fund files a complete schedule of portfolio holdings with the SEC for the first and third quarters of each fiscal year on Form N-Q. Each fund's Form N-Q is available on the SEC's website at www.sec.gov and may be reviewed and copied at the SEC's Public Reference Room in Washington, D.C. Information on the operation of the Public Reference Room may be obtained by calling 1-800-SEC-0330.
Please read and consider the investment objectives, risks, charges and expenses for any fund carefully before investing. For a prospectus which contains this and other important information about the fund, contact your Columbia Management representative or financial advisor or go to www.columbiafunds.com.
Columbia Management Group, LLC ("Columbia Management") is the investment management division of Bank of America Corporation. Columbia Management entities furnish investment management services and products for institutional and individual investors. Columbia Funds are distributed by Columbia Management Distributors, Inc., member of FINRA, SIPC, part of Columbia Management and an affiliate of Bank of America Corporation.
Transfer Agent
Columbia Management Services, Inc.
P.O. Box 8081
Boston, MA 02266-8081
1-800-345-6611
Distributor
Columbia Management
Distributors, Inc.
One Financial Center
Boston, MA 02111
Investment Advisor
Columbia Management Advisors, LLC
100 Federal Street
Boston, MA 02110
161
Columbia Management®
One Financial Center
Boston, MA 02111-2621
PRSRT STD
U.S. Postage
PAID
Holliston, MA
Permit NO. 20
Columbia Management®
Columbia Funds
Annual Report, August 31, 2009
©2009 Columbia Management Distributors, Inc.
One Financial Center, Boston, MA 02111-2621
800-345-6611 www.columbiafunds.com
SHC-42/23528-0809 (10/09) 09/90896

Annual Report
August 31, 2009
Columbia Federal Securities Fund
| | |
| NOT FDIC INSURED | | May Lose Value |
| NOT BANK ISSUED | | No Bank Guarantee |
Table of contents
The views expressed in this report reflect the current views of the respective parties. These views are not guarantees of future performance and involve certain risks, uncertainties and assumptions that are difficult to predict so actual outcomes and results may differ significantly from the views expressed. These views are subject to change at any time based upon economic, market or other conditions and the respective parties disclaim any responsibility to update such views. These views may not be relied on as investment advice and, because investment decisions for a Columbia Fund are based on numerous factors, may not be relied on as an indication of trading intent on behalf of any particular Columbia Fund. References to specific company securities should not be construed as a recommendation or investment advice.
| | 1 | The Standard & Poor’s (S&P) 500 Index tracks the performance of 500 widely held, large-capitalization U.S. stocks. Indices are not available for investment, are not professionally managed and do not reflect sales charges, fees, brokerage commissions, taxes or other expenses of investing. Securities in the fund may not match those in an index. | |
President’s Message

Dear Shareholder:
We are pleased to provide this shareholder report detailing your fund’s performance, portfolio holdings and financial statements. We hope this information is helpful in monitoring your investments as we work through these challenging economic times. We recognize that you have entrusted us with your money and want you to know that our professional investment teams work to interpret the latest economic and market trends with the goal of optimizing portfolio construction for our clients.
The first half of 2009 was defined by extremes. The multiyear lows we witnessed in the early months gave way to a stunning rally for the U.S. financial markets in the spring. A global market rebound may be underway, thanks to the massive fiscal and aggressive monetary policies of governments around the world. As of the June 30 market close, the S&P 500 Index1 was trading at nearly 16.6 times its 2009 Wall Street consensus earnings estimates with a sharp increase of nearly 36% since March 9. More mixed economic news has yet to provide the all-clear signal for investors, although economic activity has started to firm up. We believe this challenging economic environment makes it even more important to work with professional money managers while continuing to invest for life events like retirement, college planning, home improvements and career changes.
Retirement income planning has become an increasingly significant focus in the lives of millions of Americans. Recent economic conditions make it even more important to manage short-term obligations such as mortgages, monthly bills and credit card debt while also taking the steps necessary to prepare for or maximize retirement benefits. Better nutrition and medical services can result in U.S. citizens living longer, healthier lives. This means the risk of outliving one’s assets in retirement is very real without proper planning. Financial security and retirement planning is an ongoing process that requires active management of your savings, investments and risks. We encourage you to review your retirement plan regularly so you’ll be better able to meet your retirement needs in the future.
We recognize that economic uncertainty creates great challenges for many investors. Our professional investment teams work diligently to help investors navigate through difficult markets. Thank you for your business and for the opportunity to work together towards your investment goals.
Sincerely,

J. Kevin Connaughton
President, Columbia Funds
On September 29, 2009, Bank of America Corporation entered into an agreement to sell a portion of the asset management business of Columbia Management Group, LLC. Please see Note 13 of the Notes to Financial Statements for additional information.
Past performance is no guarantee of future results.
Fund Profile – Columbia Federal Securities Fund
Summary
| n | | For the 12-month period that ended August 31, 2009, the fund’s Class A shares returned 6.04% without sales charge. |
| n | | In a period that was generally volatile for all financial assets, the returns of the fund, its benchmark, the Citigroup Government/Mortgage Index1, and the average fund in its peer group—the Lipper General U.S. Government Funds Classification2—were all solidly positive. |
| n | | The fund lost ground against its benchmark during the first half of the period, when a flight-to-quality market prevailed, and had a modest shortfall against its competition in the second half of the period, when the market rewarded risk-taking. |
Portfolio Management
Jonathan P. Carlson has co-managed the fund since June 2007 and has been with the advisor since June 2007.
Michael Zazzarino has co-managed the fund since December 2007 and has been with the advisor since July 2007.
| 1 | The Citigroup Government/Mortgage Index is a combination of the Citigroup U.S. Government Index and the Citigroup Mortgage Index. The Government Index tracks the performance of the Treasury and government-sponsored indices within the U.S. Broad Investment Grade (BIG) Bond Index. The Mortgage Index tracks the performance of the mortgage component of the U.S. BIG Bond Index, comprising 30- and 15-year GNMA, FNMA and FHLMC pass-throughs and FNMA and FHLMC balloon mortgages. Indices are not available for investment, are not professionally managed and do not reflect sales charges, fees, brokerage commissions, taxes or other expenses of investing. Securities in the fund may not match those in an index. |
| 2 | Lipper Inc., a widely respected data provider in the industry, calculates an average total return (assuming reinvestment of distributions) for mutual funds with investment objectives similar to those of the fund. Lipper makes no adjustment for the effect of sales loads. |
Performance data quoted represents past performance and current performance may be lower or higher. Past performance is no guarantee of future results. The investment return and principal value will fluctuate so that shares, when redeemed, may be worth more or less than the original cost. Please visit www.columbiafunds.com for daily and most recent month-end performance updates.
Summary
1-year return as of 08/31/09
| | |
| |
 | | +6.04% Class A Shares
(without sales charge) |
| |
| | +8.29% Citigroup Government/Mortgage Index |
|
Morningstar Style BoxTM |
|
Fixed Income Maturity |
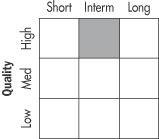
|
The Morningstar Style Box™ reveals a fund’s investment strategy. For fixed-income funds, the vertical axis shows the average credit quality of the bonds owned, and the horizontal axis shows interest rate sensitivity as measured by a bond’s duration (short, intermediate or long). Information shown is based on the most recent data provided by Morningstar.
1
Economic Update – Columbia Federal Securities Fund
During the 12-month period that began September 1, 2008 and ended August 31, 2009, the U.S. economy faced the worst financial crisis since the Great Depression, then steadied itself as steps taken by a new administration began to show results in the second half of the period. Economic growth, as measured by gross domestic product, contracted by more than 6% in the second half of 2008. The decline for the first half of 2009 is expected to be less severe, and hopes for a late 2009 recovery have been encouraged by the Federal Reserve Board (the Fed) Chairman Bernanke. The lapse from growth has resulted in the longest — and most severe — recession in nearly three decades.
The labor market shed more than six million jobs between 2008 and 2009, raising the unemployment rate to 9.7% and virtually wiping out all of the jobs gained since the last recession. Manufacturing activity slowed and consumer spending declined. The beleaguered housing market continued to lose ground as prices fell and inventories rose. However, mortgage purchase applications increased late in the period, buoyed by low interest rates and an $8,000 first-time home buyer tax credit. Late in 2008, consumer confidence, as measured by the Conference Board, plummeted to its lowest point ever. However, it has since stabilized and turned higher near the end of the period.
Troubles that began in the U.S. subprime mortgage market resulted in a meltdown within the U.S. financial sector that claimed several major institutions in 2008 and led others to seek bailouts, restructuring or both. New rigorous lending standards severely limited access to credit, further hampering economic growth. In this environment, a new administration sought to stabilize the financial system, address economic woes and introduce sweeping health care reform. Stimulus spending began to flow into the economy, raising hopes that growth would be restored in the second half of 2009. In December 2008, the Fed lowered a key short-term borrowing rate — the federal funds rate — to between zero and 0.25% — a record low. In light of protracted economic weakness, we believe the Fed is unlikely to tighten its reins on money until the economy and the labor markets stabilize.
Summary
For the 12-month period that ended August 31, 2009
| | n | | Stocks lost ground, as measured by the S&P 500 Index and the MSCI EAFE Index, but cut their losses in a rebound that began half way through the period. | |
| | |
| S&P Index | | MSCI EAFE Index |
| |

| |
|
–18.25% | | –14.95% |
| | n | | As investors appeared to exhibit more tolerance for risk, the Barclays Capital Aggregate Bond Index delivered positive results. High-yield bonds rebounded strongly, as measured by the JPMorgan Developed BB High Yield Index. | |
| | |
| Barclays Aggregate Index | | JPMorgan
Index |
| |

| |
|
7.94% | | 6.51% |
2
Economic Update (continued) – Columbia Federal Securities Fund
Bonds outperformed stocks
As investors sought refuge from a volatile stock market, the highest quality sectors of the U.S. bond market delivered modest gains. During the first half of the period, Treasury prices rose and yields declined sharply as the economy faltered and stock market volatility increased. As hopes for a recovery materialized in the second half of the period, yields rose and Treasuries lagged riskier segments of the bond market. The benchmark 10-year U.S. Treasury yield began the period at 3.8%, declined to 2.2% in December 2008, then rose to end the period at 3.4%. In this environment, the Barclays Capital Aggregate Bond Index1 (formerly the Lehman Brothers U.S. Aggregate Bond Index) returned 7.94%. High-yield bond prices fell sharply in 2008 as economic prospects weakened and default fears rose, then rebounded strongly in 2009. For the 12-month period, the JPMorgan Developed BB High Yield Index2 returned 6.51%.
Stocks retreated, then rebounded
Against a weakening economic backdrop, the U.S. stock market lost 18.25% for the 12-month period, as measured by the S&P 500 Index. 3 Losses affected the stocks of companies of all sizes and investment style categories, as measured by their respective Russell indices.4 Stock markets outside the U.S. suffered losses that were nearly as substantial. The MSCI EAFE Index,5 a broad gauge of stock market performance in foreign developed markets, lost 14.95% (in U.S. dollars) for the period. Emerging stock markets were also caught in the downdraft, but bounced back stronger than domestic or developed world markets in 2009. The MSCI Emerging Markets Index6 returned negative 9.95% (in U.S. dollars).
Past performance is no guarantee of future results.
| 1 | The Barclays Capital Aggregate Bond Index is a market value-weighted index that tracks the daily price, coupon, pay-downs and total return performance of fixed-rate, publicly placed, dollar-denominated and non-convertible investment grade debt issues with at least $250 million par amount outstanding and with at least one year to final maturity. |
| 2 | The JPMorgan Developed BB High Yield Index is an unmanaged index designed to mirror the investable universe of the U.S. dollar developed, BB-rated, high yield corporate debt market. |
| 3 | The Standard & Poor’s (S&P) 500 Index tracks the performance of 500 widely held, large-capitalization U.S. stocks. |
| 4 | The Russell 1000 Index tracks the performance of 1,000 of the largest U.S. companies, based on market capitalization. The Russell Midcap Index measures the performance of the 800 smallest companies in the Russell 1000 Index, which represents approximately 25% of the total market capitalization of the Russell 1000 Index. The Russell 2000 Index measures the performance of the 2,000 smallest companies in the Russell 3000 Index, which represents approximately 8% of the total market capitalization of the Russell 3000 Index. |
| 5 | The Morgan Stanley Capital International Europe, Australasia, Far East (MSCI EAFE) Index is a capitalization-weighted index that tracks the total return of common stocks in 21 developed-market countries within Europe, Australasia and the Far East. |
| 6 | The Morgan Stanley Capital International Emerging Markets Index (MSCI EMI) is a free float-adjusted market capitalization index that is designed to measure equity market performance in the global emerging markets. As of June 2006, the MSCI Emerging Markets Index consisted of the following 25 emerging market country indices: Argentina, Brazil, Chile, China, Colombia, Czech Republic, Egypt, Hungary, India, Indonesia, Israel, Jordan, Korea, Malaysia, Mexico, Morocco, Pakistan, Peru, Philippines, Poland, Russia, South Africa, Taiwan, Thailand and Turkey. |
Indices are not available for investment, are not professionally managed and do not reflect sales charges, fees, brokerage commissions, taxes or other expenses of investing. Securities in the fund may not match those in an index.
3
Performance Information – Columbia Federal Securities Fund
Performance data quoted represents past performance and current performance may be lower or higher. Past performance is no guarantee of future results. The investment return and principal value will fluctuate so that shares, when redeemed, may be worth more or less than the original cost. Please visit www.columbiafunds.com for daily and most recent month-end performance updates.
| | |
| Annual operating expense ratio (%)* |
| |
Class A | | 0.98 |
Class B | | 1.73 |
Class C | | 1.73 |
Class Z | | 0.73 |
| * | The annual operating expense ratio is as stated in the fund’s prospectus that is current as of the date of this report. Differences in expense ratios disclosed elsewhere in this report may result from including fee waivers and expense reimbursements as well as different time periods used in calculating the ratios. |
| | |
| Net asset value per share |
| |
as of 08/31/09 ($) | | |
Class A | | 10.72 |
Class B | | 10.72 |
Class C | | 10.72 |
Class Z | | 10.72 |
| Distributions declared per share |
| |
09/01/08 – 08/31/09 ($) | | |
Class A | | 0.37 |
Class B | | 0.29 |
Class C | | 0.31 |
Class Z | | 0.40 |
|
| Performance of a $10,000 investment 09/01/99 – 08/31/09 |
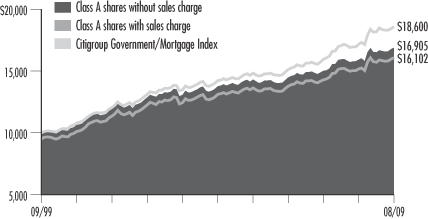
The chart above shows the change in value of a hypothetical $10,000 investment in Class A shares of Columbia Federal Securities Fund during the stated time period, and does not reflect the deduction of taxes that a shareholder may pay on fund distributions or on the redemption of fund shares. The Citigroup Government/Mortgage Index is a combination of the Citigroup U.S. Government Index and the Citigroup Mortgage Index. The Government Index tracks the performance of the Treasury and government-sponsored indices within the U.S. Broad Investment Grade (BIG) Bond Index. The Mortgage Index tracks the performance of the mortgage component of the U.S. BIG Bond Index, comprising 30- and 15-year GNMA, FNMA and FHLMC pass-throughs and FNMA and FHLMC balloon mortgages. Indices are not available for investment, and do not reflect sales charges, fees, brokerage commissions, taxes or other expenses of investing. Securities in the fund may not match those in an index.
| | | | |
| Performance of a $10,000 investment 09/01/99 – 08/31/09 ($) |
| | |
| Sales charge | | without | | with |
Class A | | 16,905 | | 16,102 |
Class B | | 15,693 | | 15,693 |
Class C | | 15,926 | | 15,926 |
Class Z | | 17,330 | | n/a |
| | | | | | | | | | | | | | |
| Average annual total return as of 08/31/09 (%) | | | | |
| | | | |
| Share class | | A | | B | | C | | Z |
| Inception | | 03/30/84 | | 06/08/92 | | 08/01/97 | | 01/11/99 |
| Sales charge | | without | | with | | without | | with | | without | | with | | without |
1-year | | 6.04 | | 1.01 | | 5.25 | | 0.25 | | 5.40 | | 4.40 | | 6.31 |
5-year | | 4.17 | | 3.16 | | 3.39 | | 3.04 | | 3.55 | | 3.55 | | 4.43 |
10-year | | 5.39 | | 4.88 | | 4.61 | | 4.61 | | 4.76 | | 4.76 | | 5.65 |
| | | | | | | | | | | | | | |
| Average annual total return as of 09/30/09 (%) | | | | |
| | | | |
| Share class | | A | | B | | C | | Z |
| Sales charge | | without | | with | | without | | with | | without | | with | | without |
1-year | | 6.32 | | 1.27 | | 5.52 | | 0.52 | | 5.68 | | 4.68 | | 6.58 |
5-year | | 4.27 | | 3.26 | | 3.49 | | 3.14 | | 3.64 | | 3.64 | | 4.53 |
10-year | | 5.33 | | 4.82 | | 4.55 | | 4.55 | | 4.71 | | 4.71 | | 5.59 |
The “with sales charge” returns include the maximum initial sales charge of 4.75% for Class A shares and the applicable contingent deferred sales charge of 5.00% in the first year, declining to 1.00% in the sixth year, and eliminated thereafter for Class B shares and 1.00% for Class C shares for the first year only. The “without sales charge” returns do not include the effect of sales charges. If they had, returns would be lower.
Performance results reflect any fee waivers or expense reimbursements of fund expenses by the investment advisor and/or any of its affiliates. Absent these fee waivers or reimbursement arrangements, performance results would have been lower.
All results shown assume reinvestment of distributions. Class Z shares are sold at net asset value with no distribution and service (Rule 12b-1) fees. Class Z shares have limited eligibility and the investment minimum requirements may vary. Please see the fund’s prospectus for details. Performance for different share classes will vary based on differences in sales charges and fees associated with each class.
The tables do not reflect the deduction of taxes a shareholder may pay on fund distributions or on the redemption of fund shares.
4
Understanding Your Expenses – Columbia Federal Securities Fund
Estimating your actual expenses
To estimate the expenses that you paid over the period, first you will need your account balance at the end of the period:
| | n | | For shareholders who receive their account statements from Columbia Management Services, Inc., your account balance is available online at www.columbiafunds.com or by calling Shareholder Services at 800.345.6611. | |
| | n | | For shareholders who receive their account statements from their Financial intermediary firm, contact your Financial intermediary firm to obtain your account balance. | |
| | 1. | Divide your ending account balance by $1,000. For example, if an account balance was $8,600 at the end of the period, the result would be 8.6. | |
| | 2. | In the section of the table below titled “Expenses paid during the period,” locate the amount for your share class. You will find this number in the column labeled “Actual.” Multiply this number by the result from step 1. Your answer is an estimate of the expenses you paid on your account during the period. | |
If the value of your account falls below the minimum initial investment requirement applicable to you, your account generally will be subject to a $20 annual fee. This fee is not included in the accompanying table. If you are subject to the fee, keep it in mind when you are estimating the ongoing expenses of investing in the fund and when comparing the expenses of this fund with other funds.
As a fund shareholder, you incur two types of costs. There are transaction costs, which generally include sales charges on purchases and may include redemption fees or exchange fees. There are also ongoing costs, which generally include investment advisory fees, distribution and service (Rule 12b-1) fees and other fund expenses. The information on this page is intended to help you understand the ongoing costs of investing in the fund and to compare these costs with the ongoing costs of investing in other mutual funds.
Analyzing your fund’s expenses by share class
To illustrate these ongoing costs, we have provided an example and calculated the expenses paid by investors in each share class during the period. The information in the following table is based on an initial investment of $1,000, which is invested at the beginning of the period and held for the entire period. Expense information is calculated two ways and each method provides you with different information. The amount listed in the “Actual” column is calculated using the fund’s actual operating expenses and total return for the period. The amount listed in the “Hypothetical” column for each share class assumes that the return each year is 5% before expenses and is calculated based on the fund’s actual operating expenses. You should not use the hypothetical account values and expenses to estimate either your actual account balance at the end of the period or the expenses you paid during this period.
Compare with other funds
Since all mutual funds are required to include the same hypothetical calculations about expenses in shareholder reports, you can use this information to compare the ongoing costs of investing in the fund with other funds. To do so, compare the 5% hypothetical example with the 5% hypothetical examples that appear in the shareholder reports of other funds. As you compare hypothetical examples of other funds, it is important to note that hypothetical examples are meant to highlight the ongoing costs of investing in a fund and do not reflect any transaction costs, such as sales charges, redemption fees or exchange fees.
| | | | | | | | | | | | | | |
| 03/01/09 – 08/31/09 |
| | | | |
| | | Account value at the
beginning of the period ($) | | Account value at the
end of the period ($) | | Expenses paid
during the period ($) | | Fund’s annualized
expense ratio (%) |
| | | Actual | | Hypothetical | | Actual | | Hypothetical | | Actual | | Hypothetical | | Actual |
Class A | | 1,000.00 | | 1,000.00 | | 1,023.39 | | 1,020.42 | | 4.85 | | 4.84 | | 0.95 |
Class B | | 1,000.00 | | 1,000.00 | | 1,019.61 | | 1,016.64 | | 8.65 | | 8.64 | | 1.70 |
Class C | | 1,000.00 | | 1,000.00 | | 1,020.42 | | 1,017.39 | | 7.89 | | 7.88 | | 1.55 |
Class Z | | 1,000.00 | | 1,000.00 | | 1,024.70 | | 1,021.68 | | 3.57 | | 3.57 | | 0.70 |
Expenses paid during the period are equal to the annualized expense ratio for the share class, multiplied by the average account value over the period, then multiplied by the number of days in the fund’s most recent fiscal half-year and divided by 365.
Had the investment advisor and/or any of its affiliates not waived fees or reimbursed a portion of expenses, account value at the end of the period would have been reduced.
It is important to note that the expense amounts shown in the table are meant to highlight only ongoing costs of investing in the fund and do not reflect any transaction costs, such as sales charges, redemption fees or exchange fees. Therefore, the hypothetical examples provided may not help you determine the relative total costs of owning shares of different funds. If these transaction costs were included, your costs would have been higher.
5
Portfolio Manager’s Report – Columbia Federal Securities Fund
For the 12-month period that ended August 31, 2009, Columbia Federal Securities Fund Class A shares returned 6.04% without sales charge. The fund’s benchmark, the Citigroup Government/Mortgage Index, returned 8.29%. The fund underperformed its benchmark because it had less exposure to Treasury securities than its benchmark, which consists exclusively of Treasury and government agency securities. Treasuries and agencies were strong performers in the risk-averse environment of late 2008.
Relative performance in the fixed-income market over the past twelve months was largely determined by risk exposure within a particular index or fund. In September 2008, following the collapse of Lehman Brothers, investors flocked to the safety of Treasury securities, making the Citigroup Government/Mortgage Index a difficult benchmark to compete with, given the broader diversification of most funds in the peer group.
The fund also gave up some ground to the benchmark in the first half of 2009 because of rising interest rates. When rates rise, it is desirable to keep a bond portfolio’s duration as low as possible. (Duration is a measure of a portfolio’s interest-rate sensitivity, determined by the maturities and coupons of the portfolio’s combined holdings.) While we kept the fund’s duration at or near its statutory minimum of three years, the benchmark had dipped well below that level when rates fell to historic lows in late 2008. Although we changed the fund’s prospectus in the first quarter of 2009 to allow for durations as low as one year, the fund’s performance lagged the benchmark until this change was effected.
Risk aversion trend reversed in 2009
The market’s aversion to risk in 2008 was a powerful trend, but it eventually reversed itself in 2009, aided by the federal government. By directing multi-billion dollar investments into specific market segments, federal programs such as TALF (Term Asset-Backed Loan Facility) and PPIP (Public-Private Investment Program) provided liquidity to markets and confidence to investors. In that spirit, we upped the fund’s commitment to agency mortgages as early as December 2008. The fund added steadily to its risk exposure, continuing the theme of targeting those sectors receiving government support. We invested in asset-backed securities because of TALF and invested in Commercial Mortgage-Backed securities (CMBS) when a new version of TALF came out in March. We retained both overweight positions through the end of the period, but we divested much of the fund’s agency mortgage position when we judged that sector’s relative valuation had become too rich. We also increased the fund’s corporate bond position beginning in March 2009, on the belief that improved market conditions would also benefit banks, brokers, insurance companies and other companies that owned these assets. To offset the potential riskiness of these holdings in the finance sector, we invested heavily in defensive sectors, such as utilities, which also performed nicely.
Performance data quoted represents past performance and current performance may be lower or higher. Past performance is no guarantee of future results. The investment return and principal value will fluctuate so that shares, when redeemed, may be worth more or less than the original cost. Please visit www.columbiafunds.com for daily and most recent month-end performance updates.
| | |
| 30-day SEC yields |
| |
as of 08/31/09 (%) | | |
Class A | | 2.97 |
Class B | | 2.37 |
Class C | | 2.52 |
Class Z | | 3.36 |
The 30-day SEC yields reflect the fund’s earning power net of expenses, expressed as an annualized percentage of the public offering price at the end of the period.
| | |
| Average life breakdown |
| |
as of 08/31/09 (%) | | |
0-1 year | | 3.6 |
1-5 years | | 55.3 |
5-10 years | | 33.6 |
10-20 years | | 4.1 |
20+ years | | 3.4 |
Average life is the expected maturity of a bond and is calculated as a percentage of senior securities.
| | |
| Top 5 Sectors |
| |
as of 08/31/09 (%) | | |
Mortgage backed securities | | 41.5 |
Government & agency obligations | | 39.1 |
Asset backed securities | | 6.1 |
Commercial mortgage backed securities | | 5.0 |
Corporate fixed-income bonds & note | | 4.3 |
Table excludes investments in collateral for securities lending and short-term obligation.
6
Portfolio Manager’s Report (continued) – Columbia Federal Securities Fund
Despite our efforts to reintroduce risk into the portfolio, which were clearly additive to returns, we believe that the fund had generally less risk than funds in its peer group for the 12-month period. Some competitors were able to devote more portfolio space to riskier sectors compared to the fund, which cannot allocate more than 20% of total assets to non-Treasury, i.e. sectors riskier than Treasuries, and the fund’s exposure at the end of the period was 15.5%. Others were willing to anticipate or even speculate in 2008, which runs contrary to this fund’s conservative investment style. While the slight shortfall is disappointing, we decided early in 2009 that the portfolio would be managed versus the benchmark, not its competition, and on that basis its relative performance in 2009 was quite strong.
Looking ahead
As we look ahead, we remain comfortable with the fund’s risk exposure. We have made no decisive bets on the future course of interest rates, although the portfolio’s current duration is slightly longer than the index as something of a hedge: If there is another flight to quality, the fund’s corporate and CMBS positions would be vulnerable, but lower interest rates would presumably reward a longer duration. Mindful of the potential risks of inflation, we have avoided longer maturities and have instead concentrated the fund’s investments in the five to 10-year segment of the market.
Portfolio holdings and characteristics are subject to change periodically and may not be representative of current holdings and characteristics. The outlook for the fund may differ from those presented for other Columbia Funds.
Investing in fixed-income securities may involve certain risks, including the credit quality of individual issuers, possible prepayments, market or economic developments and yield and share price fluctuations due to changes in interest rates. When interest rates go up, bond prices typically drop, and vice versa.
7
Investment Portfolio – Columbia Federal Securities Fund
August 31, 2009
Mortgage-Backed Securities – 41.5%
| | | | |
| | | Par ($) | | Value ($) |
| Federal Home Loan Mortgage Corp. | | |
3.652% 05/01/18 (a) | | 14,797 | | 14,824 |
3.792% 07/01/19 (a) | | 32,118 | | 32,235 |
4.359% 02/01/18 (a) | | 16,326 | | 16,347 |
5.599% 08/01/37 (a) | | 4,789,003 | | 5,025,095 |
5.703% 06/01/37 (a) | | 4,357,017 | | 4,581,166 |
5.714% 06/01/36 (a) | | 5,651,095 | | 5,946,154 |
6.000% 03/01/38 | | 46,005,188 | | 48,561,531 |
6.000% 05/01/38 | | 13,381,205 | | 14,113,544 |
7.000% 08/01/29 | | 9 | | 10 |
7.500% 03/01/16 | | 356 | | 359 |
8.000% 09/01/09 | | 292 | | 295 |
8.000% 12/01/11 | | 623 | | 635 |
8.000% 05/01/16 | | 29 | | 31 |
8.000% 04/01/17 | | 43,539 | | 47,135 |
8.500% 06/01/17 | | 288 | | 312 |
8.500% 09/01/17 | | 8,027 | | 8,684 |
8.500% 09/01/20 | | 39,670 | | 42,915 |
9.000% 12/01/16 | | 2,376 | | 2,623 |
9.000% 12/01/18 | | 3,893 | | 4,290 |
9.000% 01/01/22 | | 58,677 | | 65,390 |
9.250% 07/01/10 | | 75 | | 76 |
9.250% 10/01/19 | | 12,449 | | 13,822 |
9.500% 04/01/11 | | 485 | | 517 |
9.500% 05/01/12 | | 961 | | 1,041 |
9.500% 04/01/16 | | 614 | | 681 |
9.500% 07/01/16 | | 721 | | 804 |
9.500% 09/01/16 | | 688 | | 766 |
9.500% 10/01/16 | | 3,520 | | 3,910 |
9.500% 09/01/20 | | 270 | | 300 |
9.500% 06/01/21 | | 8,878 | | 9,869 |
9.750% 09/01/16 | | 4,519 | | 4,983 |
10.000% 09/01/18 | | 496 | | 520 |
10.000% 11/01/19 | | 36,017 | | 40,494 |
10.250% 09/01/09 | | 150 | | 152 |
10.250% 06/01/10 | | 189 | | 192 |
10.250% 10/01/10 | | 3,013 | | 3,111 |
10.500% 01/01/16 | | 41,473 | | 46,314 |
10.500% 06/01/17 | | 57,684 | | 62,639 |
10.500% 08/01/19 | | 7,628 | | 8,545 |
10.500% 09/01/19 | | 4,967 | | 5,052 |
10.500% 01/01/20 | | 23,356 | | 26,093 |
10.500% 04/01/21 | | 2,107 | | 2,233 |
11.250% 10/01/09 | | 42 | | 42 |
11.250% 02/01/10 | | 111 | | 112 |
11.250% 04/01/11 | | 7,617 | | 8,310 |
11.250% 10/01/12 | | 1,383 | | 1,411 |
11.250% 08/01/13 | | 9,903 | | 10,060 |
11.250% 02/01/15 | | 306 | | 311 |
11.250% 09/01/15 | | 5,554 | | 6,428 |
| | | | |
| | | Par ($) | | Value ($) |
11.250% 12/01/15 | | 21,447 | | 24,755 |
11.500% 02/01/15 | | 25,315 | | 27,010 |
| |
| Federal National Mortgage Association | | |
2.700% 07/01/27 (a) | | 16,427 | | 16,333 |
3.000% 11/01/19 (a) | | 2,624 | | 2,606 |
3.125% 06/01/19 (a) | | 12,608 | | 12,719 |
3.145% 07/01/20 (a) | | 6,009 | | 6,022 |
3.276% 12/01/17 (a) | | 12,253 | | 12,286 |
3.349% 06/01/20 (a) | | 17,312 | | 17,302 |
3.478% 03/01/18 (a) | | 80,788 | | 80,878 |
3.959% 08/01/19 (a) | | 21,342 | | 21,086 |
5.030% 05/01/24 | | 3,545,000 | | 3,564,393 |
5.157% 12/01/31 (a) | | 34,117 | | 35,179 |
5.199% 08/01/36 (a) | | 14,818 | | 14,980 |
5.500% 04/01/36 | | 24,813,548 | | 25,944,212 |
5.500% 02/01/37 | | 55,973,361 | | 58,375,187 |
5.637% 10/01/37 (a) | | 3,966,501 | | 4,163,472 |
6.000% 01/01/24 | | 141,716 | | 150,130 |
6.000% 02/01/24 | | 102,654 | | 108,702 |
6.000% 03/01/24 | | 643,073 | | 680,963 |
6.000% 04/01/24 | | 510,262 | | 540,369 |
6.000% 05/01/24 | | 232,062 | | 245,736 |
6.000% 08/01/24 | | 63,935 | | 67,702 |
6.000% 01/01/26 | | 1,849 | | 1,963 |
6.000% 03/01/26 | | 33,526 | | 35,594 |
6.000% 04/01/26 | | 1,390 | | 1,476 |
6.000% 05/01/26 | | 5,430 | | 5,765 |
6.500% 08/01/10 | | 2,949 | | 3,055 |
6.500% 12/01/10 | | 200 | | 207 |
6.500% 04/01/11 | | 3,858 | | 4,111 |
6.500% 10/01/22 | | 22,370 | | 23,976 |
6.500% 09/01/25 | | 22,357 | | 24,227 |
6.500% 11/01/25 | | 95,695 | | 103,700 |
6.500% 05/01/26 | | 169,435 | | 183,608 |
6.500% 09/01/28 | | 9,891 | | 10,712 |
6.500% 12/01/28 | | 12,591 | | 13,637 |
6.500% 01/01/29 | | 94,392 | | 102,229 |
6.500% 06/01/29 | | 86,722 | | 93,814 |
6.565% 07/01/16 | | 4,492,702 | | 5,016,484 |
7.000% 07/01/10 | | 1,048 | | 1,064 |
7.000% 09/01/10 | | 1,968 | | 1,997 |
7.000% 10/01/10 | | 773 | | 784 |
7.000% 10/01/12 | | 7,347 | | 7,729 |
7.000% 08/01/23 | | 87,540 | | 96,375 |
7.000% 10/01/23 | | 23,647 | | 26,034 |
7.000% 11/01/23 | | 37,790 | | 41,603 |
7.000% 02/01/27 | | 4,735 | | 5,207 |
7.500% 12/01/09 | | 622 | | 626 |
7.500% 02/01/10 | | 58 | | 59 |
7.500% 06/01/10 | | 507 | | 515 |
See Accompanying Notes to Financial Statements.
8
Columbia Federal Securities Fund
August 31, 2009
Mortgage-Backed Securities (continued)
| | | | |
| | | Par ($) | | Value ($) |
7.500% 11/01/11 | | 385 | | 395 |
7.500% 12/01/14 | | 265 | | 288 |
7.500% 01/01/17 | | 26,661 | | 29,744 |
7.500% 02/01/18 | | 9,996 | | 11,157 |
7.500% 10/01/23 | | 11,388 | | 12,618 |
7.500% 12/01/23 | | 49,414 | | 54,751 |
8.000% 03/01/13 | | 1,147 | | 1,257 |
8.000% 11/01/15 | | 794 | | 897 |
8.000% 06/01/25 | | 1,697 | | 1,915 |
8.000% 08/01/27 | | 23,154 | | 26,151 |
8.000% 02/01/30 | | 1,635 | | 1,850 |
8.000% 03/01/30 | | 3,167 | | 3,583 |
8.000% 08/01/30 | | 1,860 | | 2,104 |
8.000% 10/01/30 | | 29,572 | | 33,452 |
8.000% 11/01/30 | | 141,736 | | 160,332 |
8.000% 12/01/30 | | 45,070 | | 50,984 |
8.000% 01/01/31 | | 225,198 | | 254,720 |
8.000% 02/01/31 | | 729 | | 824 |
8.000% 04/01/31 | | 21,822 | | 24,686 |
8.000% 05/01/31 | | 34,185 | | 38,673 |
8.000% 08/01/31 | | 1,379 | | 1,560 |
8.000% 09/01/31 | | 50,243 | | 56,837 |
8.000% 12/01/31 | | 10,002 | | 11,315 |
8.000% 04/01/32 | | 81,437 | | 92,124 |
8.000% 05/01/32 | | 298,771 | | 337,973 |
8.000% 06/01/32 | | 290,897 | | 329,066 |
8.000% 07/01/32 | | 4,464 | | 5,050 |
8.000% 08/01/32 | | 6,931 | | 7,840 |
8.000% 10/01/32 | | 22,574 | | 25,536 |
8.000% 11/01/32 | | 63,831 | | 72,206 |
8.000% 02/01/33 | | 86,952 | | 98,361 |
8.000% 03/01/33 | | 28,917 | | 32,505 |
8.500% 06/01/15 | | 1,615 | | 1,736 |
8.500% 02/01/17 | | 1,535 | | 1,679 |
8.500% 09/01/21 | | 11,714 | | 11,835 |
9.000% 12/01/09 | | 115 | | 117 |
9.000% 04/01/15 | | 3,722 | | 3,841 |
9.000% 04/01/16 | | 186 | | 190 |
9.000% 07/01/16 | | 2,326 | | 2,547 |
9.000% 09/01/16 | | 413 | | 417 |
9.000% 01/01/17 | | 18 | | 19 |
9.000% 08/01/17 | | 1,205 | | 1,218 |
9.000% 05/01/18 | | 11,678 | | 12,783 |
9.000% 09/01/19 | | 751 | | 759 |
9.000% 11/01/19 | | 24 | | 25 |
9.000% 07/01/20 | | 89 | | 91 |
9.000% 08/01/21 | | 58,895 | | 59,551 |
9.000% 06/01/22 | | 2,503 | | 2,583 |
9.000% 09/01/24 | | 14,535 | | 15,983 |
9.500% 12/01/10 | | 64 | | 65 |
9.500% 06/01/16 | | 28,352 | | 31,194 |
| | | | |
| | | Par ($) | | Value ($) |
9.500% 02/01/17 | | 1,546 | | 1,645 |
9.500% 01/01/19 | | 111,336 | | 121,698 |
9.500% 04/01/20 | | 86,214 | | 94,667 |
9.500% 07/15/21 | | 272,815 | | 306,949 |
9.500% 08/01/21 | | 126,115 | | 142,105 |
10.500% 03/01/14 | | 391 | | 395 |
10.500% 12/01/15 | | 3,580 | | 3,762 |
11.000% 08/01/15 | | 2,289 | | 2,340 |
TBA, | | | | |
4.500% 12/01/39 (b) | | 18,900,000 | | 19,000,397 |
| |
| Government National Mortgage Association | | |
4.375% 05/20/22 (a) | | 23,427 | | 23,936 |
4.375% 06/20/23 (a) | | 15,702 | | 16,051 |
4.625% 08/20/22 (a) | | 4,591 | | 4,718 |
5.000% 04/20/39 | | 50,844,506 | | 52,415,776 |
6.000% 12/15/10 | | 8,747 | | 9,090 |
6.500% 06/15/23 | | 9,230 | | 9,835 |
6.500% 08/15/23 | | 1,388 | | 1,479 |
6.500% 09/15/23 | | 11,966 | | 12,751 |
6.500% 10/15/23 | | 26,395 | | 28,126 |
6.500% 11/15/23 | | 99,440 | | 105,964 |
6.500% 12/15/23 | | 42,028 | | 44,785 |
6.500% 01/15/24 | | 35,340 | | 37,893 |
6.500% 02/15/24 | | 30,325 | | 32,516 |
6.500% 03/15/24 | | 73,457 | | 78,765 |
6.500% 04/15/24 | | 15,240 | | 16,341 |
6.500% 05/15/24 | | 20,786 | | 22,232 |
6.500% 07/15/24 | | 83,087 | | 88,585 |
6.500% 09/15/25 | | 29,024 | | 31,151 |
6.500% 12/15/25 | | 23,564 | | 25,290 |
6.500% 01/15/28 | | 19,428 | | 21,038 |
6.500% 02/15/28 | | 29,986 | | 32,472 |
6.500% 07/15/28 | | 83,312 | | 90,218 |
6.500% 08/15/28 | | 55,926 | | 60,562 |
6.500% 10/15/28 | | 53,710 | | 58,162 |
6.500% 11/15/28 | | 15,107 | | 16,360 |
6.500% 12/15/28 | | 160,844 | | 174,177 |
6.500% 01/15/29 | | 108,836 | | 117,790 |
6.500% 02/15/29 | | 31,174 | | 33,739 |
7.000% 03/15/22 | | 7,863 | | 8,648 |
7.000% 04/15/22 | | 1,152 | | 1,267 |
7.000% 10/15/22 | | 2,026 | | 2,228 |
7.000% 10/15/22 | | 921 | | 1,013 |
7.000% 11/15/22 | | 7,529 | | 8,280 |
7.000% 01/15/23 | | 116,067 | | 127,613 |
7.000% 03/15/23 | | 1,179 | | 1,297 |
7.000% 05/15/23 | | 73,030 | | 80,295 |
7.000% 06/15/23 | | 16,611 | | 18,263 |
7.000% 07/15/23 | | 4,106 | | 4,514 |
7.000% 10/15/23 | | 43,032 | | 47,312 |
See Accompanying Notes to Financial Statements.
9
Columbia Federal Securities Fund
August 31, 2009
Mortgage-Backed Securities (continued)
| | | | |
| | | Par ($) | | Value ($) |
7.000% 12/15/23 | | 37,790 | | 41,555 |
7.000% 01/15/24 | | 1,758 | | 1,936 |
7.000% 03/15/24 | | 617 | | 679 |
7.000% 10/15/24 | | 31,762 | | 34,931 |
7.000% 09/15/25 | | 2,997 | | 3,299 |
7.000% 10/15/25 | | 77,862 | | 85,702 |
7.000% 12/15/25 | | 31,680 | | 34,870 |
7.000% 01/15/26 | | 30,471 | | 33,530 |
7.000% 02/15/26 | | 34,604 | | 38,078 |
7.000% 03/15/26 | | 5,001 | | 5,505 |
7.000% 04/15/26 | | 3,504 | | 3,857 |
7.000% 05/15/26 | | 1,495 | | 1,645 |
7.000% 06/15/26 | | 46,175 | | 50,811 |
7.000% 11/15/26 | | 46,453 | | 51,127 |
7.000% 12/15/26 | | 731 | | 805 |
7.000% 01/15/27 | | 3,149 | | 3,467 |
7.000% 02/15/27 | | 348 | | 383 |
7.000% 04/15/27 | | 3,823 | | 4,208 |
7.000% 09/15/27 | | 32,319 | | 35,581 |
7.000% 10/15/27 | | 52,685 | | 58,004 |
7.000% 11/15/27 | | 132,265 | | 145,617 |
7.000% 12/15/27 | | 229,554 | | 252,729 |
7.000% 01/15/28 | | 10,127 | | 11,155 |
7.000% 02/15/28 | | 39,229 | | 43,184 |
7.000% 03/15/28 | | 135,655 | | 149,409 |
7.000% 04/15/28 | | 69,840 | | 76,931 |
7.000% 05/15/28 | | 19,642 | | 21,637 |
7.000% 06/15/28 | | 5,277 | | 5,813 |
7.000% 07/15/28 | | 296,810 | | 326,940 |
7.000% 07/15/28 | | 11,242 | | 12,383 |
7.000% 09/15/28 | | 17,440 | | 19,210 |
7.000% 12/15/28 | | 89,475 | | 98,558 |
7.000% 01/15/29 | | 1,112 | | 1,227 |
7.000% 03/15/29 | | 19,113 | | 21,090 |
7.000% 04/15/29 | | 32,129 | | 35,450 |
7.000% 05/15/29 | | 19,485 | | 21,499 |
7.000% 06/15/29 | | 14,884 | | 16,422 |
7.000% 07/15/29 | | 53,195 | | 58,696 |
7.000% 08/15/29 | | 32,247 | | 35,580 |
7.000% 09/15/29 | | 18,377 | | 20,276 |
7.000% 10/15/29 | | 7,610 | | 8,397 |
7.500% 04/15/22 | | 17,386 | | 19,382 |
7.500% 10/15/23 | | 30,003 | | 33,492 |
7.500% 08/15/25 | | 122,870 | | 137,422 |
7.500% 10/15/25 | | 10,698 | | 11,965 |
7.500% 12/15/25 | | 44,067 | | 49,285 |
8.000% 11/15/14 | | 11,673 | | 12,581 |
8.000% 06/20/17 | | 120,706 | | 132,992 |
8.000% 06/15/22 | | 63,167 | | 71,327 |
8.000% 02/15/23 | | 74,943 | | 84,760 |
8.000% 03/20/23 | | 396 | | 447 |
| | | | |
| | | Par ($) | | Value ($) |
8.000% 06/15/23 | | 1,285 | | 1,453 |
8.000% 07/15/26 | | 29,284 | | 33,229 |
8.000% 07/15/29 | | 2,773 | | 3,153 |
8.500% 12/15/21 | | 3,794 | | 4,329 |
8.500% 01/15/22 | | 61,482 | | 70,222 |
8.500% 09/15/22 | | 2,856 | | 3,253 |
8.500% 11/20/22 | | 38,596 | | 43,926 |
8.500% 12/15/22 | | 3,358 | | 3,830 |
8.750% 12/15/21 | | 101,779 | | 115,509 |
8.850% 01/15/19 | | 33,558 | | 37,432 |
8.850% 05/15/19 | | 58,832 | | 65,625 |
9.000% 05/15/16 | | 19,012 | | 20,787 |
9.000% 06/15/16 | | 8,233 | | 9,001 |
9.000% 07/15/16 | | 21,326 | | 23,317 |
9.000% 08/15/16 | | 698 | | 763 |
9.000% 09/15/16 | | 19,251 | | 21,048 |
9.000% 10/15/16 | | 24,586 | | 26,882 |
9.000% 11/15/16 | | 7,132 | | 7,799 |
9.000% 11/20/16 | | 56,232 | | 61,254 |
9.000% 12/15/16 | | 737 | | 807 |
9.000% 01/15/17 | | 54,520 | | 60,587 |
9.000% 02/15/17 | | 1,385 | | 1,540 |
9.000% 03/20/17 | | 21,602 | | 23,918 |
9.000% 05/15/17 | | 2,444 | | 2,716 |
9.000% 06/15/17 | | 17,994 | | 19,996 |
9.000% 06/20/17 | | 89,542 | | 99,145 |
9.000% 07/15/17 | | 460 | | 510 |
9.000% 09/15/17 | | 5,470 | | 6,079 |
9.000% 10/15/17 | | 8,036 | | 8,765 |
9.000% 12/15/17 | | 4,998 | | 5,568 |
9.000% 04/20/18 | | 73,756 | | 81,893 |
9.000% 05/20/18 | | 26,205 | | 29,096 |
9.000% 12/15/19 | | 327 | | 366 |
9.000% 04/15/20 | | 975 | | 1,113 |
9.000% 05/20/21 | | 1,783 | | 2,034 |
9.000% 09/15/21 | | 179 | | 205 |
9.000% 02/15/25 | | 81,578 | | 94,090 |
9.250% 10/15/16 | | 64,724 | | 71,278 |
9.250% 05/15/18 | | 14,209 | | 15,790 |
9.250% 07/15/21 | | 33,960 | | 38,568 |
9.250% 09/15/21 | | 30,803 | | 34,982 |
9.500% 10/15/09 | | 466 | | 472 |
9.500% 12/20/24 | | 10,926 | | 12,494 |
9.500% 01/20/25 | | 7,183 | | 8,430 |
10.000% 12/15/17 | | 1,194 | | 1,329 |
10.000% 07/20/18 | | 17,083 | | 19,013 |
10.000% 11/15/18 | | 486 | | 541 |
10.000% 03/15/19 | | 349 | | 390 |
10.000% 11/15/20 | | 11,274 | | 12,695 |
10.500% 02/15/10 | | 286 | | 296 |
10.500% 09/15/10 | | 130 | | 135 |
See Accompanying Notes to Financial Statements.
10
Columbia Federal Securities Fund
August 31, 2009
Mortgage-Backed Securities (continued)
| | | | |
| | | Par ($) | | Value ($) |
10.500% 06/15/11 | | 6,857 | | 7,297 |
10.500% 06/15/12 | | 7,748 | | 8,272 |
10.500% 11/15/13 | | 8,508 | | 9,310 |
10.500% 08/15/15 | | 1,210 | | 1,342 |
10.500% 09/15/15 | | 16,510 | | 18,306 |
10.500% 10/15/15 | | 5,759 | | 6,379 |
10.500% 12/15/15 | | 82 | | 91 |
10.500% 01/15/16 | | 11,663 | | 13,011 |
10.500% 01/20/16 | | 121 | | 134 |
10.500% 02/15/16 | | 5,404 | | 6,029 |
10.500% 03/15/16 | | 3,869 | | 4,311 |
10.500% 07/15/17 | | 11,561 | | 12,914 |
10.500% 10/15/17 | | 843 | | 941 |
10.500% 11/15/17 | | 38,227 | | 42,702 |
10.500% 12/15/17 | | 22,689 | | 25,345 |
10.500% 01/15/18 | | 7,710 | | 8,628 |
10.500% 02/15/18 | | 19,756 | | 22,161 |
10.500% 03/15/18 | | 12,641 | | 14,180 |
10.500% 04/15/18 | | 22,387 | | 25,111 |
10.500% 06/15/18 | | 5,971 | | 6,688 |
10.500% 07/15/18 | | 42,610 | | 47,797 |
10.500% 09/15/18 | | 5,039 | | 5,652 |
10.500% 10/15/18 | | 4,933 | | 5,535 |
10.500% 12/15/18 | | 9,270 | | 10,415 |
10.500% 02/15/19 | | 7,245 | | 8,156 |
10.500% 03/15/19 | | 2,241 | | 2,522 |
10.500% 04/15/19 | | 35,185 | | 39,609 |
10.500% 05/15/19 | | 31,932 | | 35,931 |
10.500% 06/15/19 | | 41,365 | | 46,525 |
10.500% 06/20/19 | | 7,511 | | 8,425 |
10.500% 07/15/19 | | 80,946 | | 91,122 |
10.500% 07/20/19 | | 3,569 | | 4,004 |
10.500% 08/15/19 | | 20,251 | | 22,796 |
10.500% 08/20/19 | | 10,440 | | 11,618 |
10.500% 09/15/19 | | 8,692 | | 9,738 |
10.500% 09/20/19 | | 7,778 | | 8,724 |
10.500% 10/15/19 | | 3,904 | | 4,395 |
10.500% 12/15/19 | | 22,541 | | 25,376 |
10.500% 03/15/20 | | 8,034 | | 9,045 |
10.500% 05/15/20 | | 6,749 | | 7,598 |
10.500% 07/15/20 | | 16,379 | | 18,440 |
10.500% 08/15/20 | | 10,609 | | 11,944 |
10.500% 09/15/20 | | 10,589 | | 11,919 |
10.500% 11/15/20 | | 1,922 | | 2,164 |
10.500% 12/15/20 | | 716 | | 805 |
10.500% 01/15/21 | | 2,546 | | 2,860 |
10.500% 08/15/21 | | 88,309 | | 98,723 |
11.000% 12/15/09 | | 55 | | 55 |
11.000% 01/15/10 | | 6 | | 6 |
11.000% 02/15/10 | | 252 | | 259 |
11.000% 03/15/10 | | 216 | | 217 |
| | | | |
| | | Par ($) | | Value ($) |
11.000% 07/15/10 | | 2,131 | | 2,200 |
11.000% 08/15/10 | | 2,048 | | 2,112 |
11.000% 09/15/10 | | 8,203 | | 8,448 |
11.000% 10/15/10 | | 95 | | 97 |
11.000% 11/15/10 | | 1,057 | | 1,088 |
11.000% 04/15/11 | | 2,177 | | 2,315 |
11.000% 02/15/13 | | 661 | | 694 |
11.000% 07/15/13 | | 7,470 | | 8,173 |
11.000% 08/15/15 | | 21,601 | | 24,174 |
11.000% 09/15/15 | | 14,556 | | 16,229 |
11.000% 10/15/15 | | 6,936 | | 7,763 |
11.000% 11/15/15 | | 43,159 | | 47,826 |
11.000% 12/15/15 | | 38,595 | | 43,192 |
11.000% 01/15/16 | | 20,050 | | 22,297 |
11.000% 02/15/16 | | 2,416 | | 2,701 |
11.000% 03/15/16 | | 3,074 | | 3,431 |
11.000% 07/15/16 | | 32,818 | | 36,496 |
11.000% 08/15/18 | | 2,131 | | 2,372 |
11.000% 09/15/18 | | 52,214 | | 58,496 |
11.000% 11/15/18 | | 8,387 | | 9,396 |
11.000% 12/15/18 | | 29,791 | | 33,375 |
11.000% 06/20/19 | | 4,856 | | 5,406 |
11.000% 07/20/19 | | 166 | | 184 |
11.000% 09/20/19 | | 2,819 | | 3,142 |
11.000% 12/15/20 | | 10,621 | | 11,949 |
11.500% 03/15/10 | | 309 | | 322 |
11.500% 04/15/10 | | 618 | | 643 |
11.500% 07/15/10 | | 1,449 | | 1,508 |
11.500% 09/15/10 | | 8,063 | | 8,393 |
11.500% 10/15/10 | | 3,413 | | 3,554 |
11.500% 01/15/13 | | 14,800 | | 16,336 |
11.500% 02/15/13 | | 37,953 | | 42,052 |
11.500% 03/15/13 | | 66,509 | | 73,705 |
11.500% 04/15/13 | | 51,596 | | 56,933 |
11.500% 05/15/13 | | 79,847 | | 88,023 |
11.500% 06/15/13 | | 48,239 | | 53,275 |
11.500% 07/15/13 | | 39,755 | | 44,143 |
11.500% 08/15/13 | | 13,115 | | 14,473 |
11.500% 09/15/13 | | 12,717 | | 14,121 |
11.500% 11/15/13 | | 5,488 | | 6,095 |
11.500% 01/15/14 | | 2,904 | | 3,249 |
11.500% 02/15/14 | | 4,635 | | 5,186 |
11.500% 08/15/15 | | 2,757 | | 3,112 |
11.500% 09/15/15 | | 7,804 | | 8,468 |
11.500% 10/15/15 | | 15,660 | | 17,702 |
11.500% 11/15/15 | | 5,802 | | 6,551 |
11.500% 12/15/15 | | 4,352 | | 4,914 |
11.500% 01/15/16 | | 5,940 | | 6,746 |
11.500% 02/15/16 | | 4,427 | | 4,840 |
11.500% 02/20/16 | | 7,489 | | 8,370 |
11.500% 11/15/17 | | 7,178 | | 8,188 |
See Accompanying Notes to Financial Statements.
11
Columbia Federal Securities Fund
August 31, 2009
Mortgage-Backed Securities (continued)
| | | | |
| | | Par ($) | | Value ($) |
11.500% 12/15/17 | | 3,152 | | 3,595 |
11.500% 01/15/18 | | 1,936 | | 2,202 |
11.500% 02/15/18 | | 2,807 | | 3,193 |
11.500% 02/20/18 | | 668 | | 712 |
11.500% 05/15/18 | | 4,175 | | 4,749 |
11.500% 11/15/19 | | 3,505 | | 3,998 |
11.750% 07/15/13 | | 7,074 | | 7,799 |
11.750% 07/15/15 | | 33,558 | | 37,740 |
12.000% 11/15/12 | | 2,598 | | 2,847 |
12.000% 12/15/12 | | 58,557 | | 64,275 |
12.000% 01/15/13 | | 53,748 | | 59,479 |
12.000% 02/15/13 | | 32,339 | | 35,849 |
12.000% 03/15/13 | | 5,736 | | 6,312 |
12.000% 05/15/13 | | 5,096 | | 5,621 |
12.000% 08/15/13 | | 10,289 | | 11,368 |
12.000% 09/15/13 | | 43,060 | | 47,478 |
12.000% 09/20/13 | | 1,516 | | 1,677 |
12.000% 10/15/13 | | 5,067 | | 5,621 |
12.000% 12/15/13 | | 8,396 | | 9,321 |
12.000% 01/15/14 | | 8,779 | | 9,676 |
12.000% 01/20/14 | | 694 | | 769 |
12.000% 02/15/14 | | 26,013 | | 28,950 |
12.000% 02/20/14 | | 12,873 | | 14,191 |
12.000% 03/15/14 | | 68,374 | | 76,293 |
12.000% 03/20/14 | | 5,853 | | 6,479 |
12.000% 04/15/14 | | 45,019 | | 50,413 |
12.000% 05/15/14 | | 70,280 | | 78,693 |
12.000% 06/15/14 | | 22,062 | | 24,801 |
12.000% 07/15/14 | | 6,998 | | 7,836 |
12.000% 08/20/14 | | 957 | | 1,061 |
12.000% 01/15/15 | | 10,693 | | 11,981 |
12.000% 02/15/15 | | 30,687 | | 34,786 |
12.000% 03/15/15 | | 21,269 | | 23,745 |
12.000% 03/20/15 | | 171 | | 191 |
12.000% 04/15/15 | | 27,579 | | 31,191 |
12.000% 05/15/15 | | 10,654 | | 11,986 |
12.000% 06/15/15 | | 16,229 | | 18,266 |
12.000% 07/15/15 | | 15,198 | | 16,881 |
12.000% 09/20/15 | | 7,967 | | 8,999 |
12.000% 10/15/15 | | 6,347 | | 7,059 |
12.000% 11/15/15 | | 5,815 | | 6,592 |
12.000% 12/20/15 | | 1,115 | | 1,244 |
12.000% 02/15/16 | | 5,008 | | 5,827 |
12.000% 02/20/16 | | 797 | | 887 |
12.250% 02/15/14 | | 9,071 | | 10,319 |
12.250% 03/15/14 | | 4,011 | | 4,563 |
12.250% 04/15/14 | | 13,141 | | 14,947 |
12.500% 04/15/10 | | 5,768 | | 6,025 |
12.500% 05/15/10 | | 9,034 | | 9,362 |
12.500% 06/15/10 | | 15,774 | | 16,456 |
12.500% 07/15/10 | | 4,954 | | 5,178 |
| | | | |
| | | Par ($) | | Value ($) |
12.500% 08/15/10 | | 2,915 | | 3,022 |
12.500% 10/15/10 | | 6,221 | | 6,507 |
12.500% 11/15/10 | | 17,226 | | 17,950 |
12.500% 12/15/10 | | 29,870 | | 31,242 |
12.500% 01/15/11 | | 3,010 | | 3,221 |
12.500% 05/15/11 | | 6,052 | | 6,555 |
12.500% 10/15/13 | | 21,114 | | 23,875 |
12.500% 10/20/13 | | 15,412 | | 17,365 |
12.500% 11/15/13 | | 78,469 | | 88,723 |
12.500% 12/15/13 | | 16,482 | | 18,270 |
12.500% 01/15/14 | | 18,044 | | 20,677 |
12.500% 05/15/14 | | 55,478 | | 63,114 |
12.500% 06/15/14 | | 31,054 | | 35,500 |
12.500% 07/20/14 | | 1,835 | | 1,962 |
12.500% 08/15/14 | | 5,386 | | 6,172 |
12.500% 09/20/14 | | 1,426 | | 1,628 |
12.500% 12/15/14 | | 32,798 | | 37,584 |
12.500% 01/15/15 | | 40,353 | | 46,434 |
12.500% 04/15/15 | | 1,881 | | 2,161 |
12.500% 05/15/15 | | 9,557 | | 10,991 |
12.500% 05/20/15 | | 2,237 | | 2,565 |
12.500% 06/15/15 | | 5,428 | | 6,247 |
12.500% 07/15/15 | | 12,972 | | 14,930 |
12.500% 07/20/15 | | 2,388 | | 2,701 |
12.500% 08/15/15 | | 18,088 | | 20,818 |
12.500% 10/15/15 | | 25,980 | | 29,901 |
12.500% 11/20/15 | | 7,187 | | 8,243 |
13.000% 01/15/11 | | 12,384 | | 12,876 |
13.000% 02/15/11 | | 9,551 | | 10,238 |
13.000% 03/15/11 | | 9,751 | | 10,492 |
13.000% 04/15/11 | | 21,027 | | 22,569 |
13.000% 06/15/11 | | 5,018 | | 5,370 |
13.000% 06/15/12 | | 2,804 | | 2,913 |
13.000% 10/15/12 | | 8,499 | | 9,463 |
13.000% 11/15/12 | | 4,528 | | 5,062 |
13.000% 12/15/12 | | 1,656 | | 1,838 |
13.000% 02/15/13 | | 9,097 | | 10,319 |
13.000% 05/15/13 | | 2,282 | | 2,600 |
13.000% 09/15/13 | | 2,738 | | 3,067 |
13.000% 09/20/13 | | 6,736 | | 7,645 |
13.000% 10/15/13 | | 28,980 | | 32,905 |
13.000% 06/15/14 | | 20,511 | | 23,738 |
13.000% 07/15/14 | | 12,221 | | 14,150 |
13.000% 07/20/14 | | 1,381 | | 1,563 |
13.000% 09/15/14 | | 16,880 | | 19,505 |
13.000% 10/15/14 | | 2,902 | | 3,339 |
13.000% 11/15/14 | | 21,777 | | 25,243 |
13.000% 12/15/14 | | 6,099 | | 7,061 |
13.000% 03/15/15 | | 2,432 | | 2,795 |
13.000% 06/15/15 | | 4,024 | | 4,777 |
13.500% 05/15/10 | | 1,727 | | 1,831 |
See Accompanying Notes to Financial Statements.
12
Columbia Federal Securities Fund
August 31, 2009
Mortgage-Backed Securities (continued)
| | | | |
| | | Par ($) | | Value ($) |
13.500% 06/15/10 | | 284 | | 301 |
13.500% 07/15/10 | | 396 | | 420 |
13.500% 10/15/10 | | 2,933 | | 3,108 |
13.500% 04/15/11 | | 2,016 | | 2,224 |
13.500% 05/15/11 | | 13,359 | | 14,696 |
13.500% 10/15/12 | | 625 | | 711 |
13.500% 11/15/12 | | 16,485 | | 18,764 |
13.500% 06/15/13 | | 2,583 | | 3,012 |
13.500% 07/15/14 | | 1,421 | | 1,684 |
13.500% 08/15/14 | | 1,217 | | 1,442 |
13.500% 08/20/14 | | 4,261 | | 4,960 |
13.500% 09/15/14 | | 3,090 | | 3,661 |
13.500% 09/20/14 | | 3,849 | | 4,544 |
13.500% 10/15/14 | | 3,181 | | 3,769 |
13.500% 11/15/14 | | 9,194 | | 10,893 |
13.500% 11/20/14 | | 12,698 | | 14,963 |
13.500% 12/15/14 | | 2,990 | | 3,542 |
13.500% 12/20/14 | | 4,036 | | 4,765 |
13.500% 01/15/15 | | 4,506 | | 5,398 |
13.500% 02/20/15 | | 6,957 | | 8,196 |
13.500% 04/15/15 | | 3,212 | | 3,848 |
13.500% 06/15/15 | | 3,903 | | 4,675 |
14.000% 06/15/11 | | 1,707 | | 1,891 |
15.000% 09/15/11 | | 7,810 | | 8,751 |
15.000% 07/15/12 | | 1,059 | | 1,226 |
| | | | |
Total Mortgage-Backed Securities
(cost of $255,081,307) | | 261,186,924 |
|
Government & Agency Obligations – 39.1% |
| | | | |
| U.S. Government Agencies – 6.5% | | |
| Federal Home Loan Bank | | |
5.375% 03/11/16 | | 8,130,000 | | 9,065,608 |
5.375% 06/10/16 | | 28,020,000 | | 31,249,417 |
| | |
| Small Business Administration | | | | |
8.200% 10/01/11 | | 42,463 | | 43,493 |
8.250% 11/01/11 | | 87,180 | | 89,657 |
9.150% 07/01/11 | | 27,895 | | 28,705 |
| | | | |
U.S. Government Agencies Total | | 40,476,880 |
| | | | |
| U.S. Government Obligations – 32.6% | | |
| U.S. Treasury Bonds | | | | |
4.500% 02/15/36 (c) | | 11,080,000 | | 11,658,243 |
8.750% 08/15/20 (c) | | 7,946,000 | | 11,506,801 |
| | |
| U.S. Treasury Notes | | | | |
0.875% 03/31/11 (c) | | 12,205,000 | | 12,232,181 |
0.875% 05/31/11 (c) | | 16,288,000 | | 16,303,913 |
1.375% 03/15/12 (c) | | 49,378,000 | | 49,497,594 |
1.750% 03/31/14 (c) | | 1,330,000 | | 1,302,152 |
| | | | |
| | | Par ($) | | Value ($) |
1.875% 02/28/14 (c) | | 32,970,000 | | 32,514,091 |
1.875% 04/30/14 (c) | | 3,000 | | 2,948 |
2.625% 04/30/16 | | 39,480,000 | | 38,681,162 |
2.750% 02/15/19 (c) | | 18,393,000 | | 17,411,568 |
3.125% 09/30/13 (c) | | 7,775,000 | | 8,118,196 |
| | |
| U.S. Treasury STRIPS | | | | |
11/15/21 (c)(d) | | 10,000,000 | | 5,986,590 |
| | | | |
U.S. Government Obligations Total | | 205,215,439 |
| | | | |
Total Government & Agency Obligations
(cost of $244,487,793) | | 245,692,319 |
|
Asset-Backed Securities – 6.1% |
| American Express Credit Account Master Trust | | |
0.303% 12/15/13 (a) | | 1,415,000 | | 1,397,726 |
| | |
| BMW Vehicle Lease Trust | | | | |
2.040% 04/15/11 | | 2,185,000 | | 2,194,781 |
| |
| Capital One Multi-Asset Execution Trust | | |
0.343% 05/15/13 (a) | | 1,985,000 | | 1,973,146 |
4.700% 06/15/15 | | 125,000 | | 131,909 |
| |
| Chase Issuance Trust | | |
2.400% 06/17/13 | | 3,300,000 | | 3,341,855 |
4.260% 05/15/13 | | 3,210,000 | | 3,352,861 |
| |
| Citibank Credit Card Issuance Trust | | |
0.623% 08/20/14 (a) | | 4,415,000 | | 4,343,510 |
2.023% 03/17/14 (a) | | 4,415,000 | | 4,511,316 |
| |
| CPL Transition Funding LLC | | |
5.960% 07/15/15 | | 585,000 | | 638,385 |
| |
| Discover Card Master Trust | | |
0.969% 06/15/15 (a) | | 4,415,000 | | 4,262,513 |
1.573% 12/15/14 (a) | | 4,415,000 | | 4,421,137 |
| |
| Entergy Gulf States Reconstruction Funding LLC | | |
5.510% 10/01/13 | | 366,609 | | 389,563 |
| |
| Ford Credit Auto Owner Trust | | |
5.150% 11/15/11 | | 159,082 | | 162,880 |
| |
| Honda Auto Receivables Owner Trust | | |
2.310% 05/15/13 | | 2,475,000 | | 2,484,508 |
2.790% 01/15/13 | | 1,370,000 | | 1,389,292 |
| |
| Massachusetts RRB Special Purpose Trust WMECO-1 | | |
6.530% 06/01/15 | | 72,270 | | 78,833 |
| |
| Nissan Auto Receivables Owner Trust | | |
3.800% 10/15/10 | | 2,032,781 | | 2,044,422 |
See Accompanying Notes to Financial Statements.
13
Columbia Federal Securities Fund
August 31, 2009
Asset-Backed Securities (continued)
| | | | |
| | | Par ($) | | Value ($) |
| Small Business Administration | | |
7.600% 01/01/12 | | 49,476 | | 50,930 |
8.650% 11/01/14 | | 201,191 | | 211,129 |
8.850% 08/01/11 | | 4,073 | | 4,235 |
| |
| West Penn Funding LLC Transition Bonds | | |
4.460% 12/27/10 (e) | | 980,733 | | 992,144 |
| | | | |
Total Asset-Backed Securities
(cost of $38,086,624) | | | | 38,377,075 |
|
Commercial Mortgage-Backed Securities – 5.0% |
| Bear Stearns Commercial Mortgage Securities | | |
4.740% 03/13/40 | | 1,225,000 | | 1,259,983 |
4.933% 02/13/42 (a) | | 1,260,000 | | 1,202,107 |
| |
| Citigroup Commercial Mortgage Trust | | |
4.733% 10/15/41 | | 765,000 | | 708,613 |
| |
| GMAC Commercial Mortgage Securities, Inc. | | |
5.668% 05/10/40 (a) | | 815,000 | | 836,899 |
| |
| Greenwich Capital Commercial Funding Corp. | | |
5.317% 06/10/36 (a) | | 2,620,000 | | 2,628,717 |
6.116% 07/10/38 (a) | | 1,440,000 | | 1,257,457 |
| |
| GS Mortgage Securities Corp. II | | |
4.751% 07/10/39 | | 1,205,000 | | 1,116,488 |
| |
| JPMorgan Chase Commercial Mortgage Securities Corp. | | |
4.393% 07/12/37 | | 2,123,385 | | 2,164,869 |
| |
| LB-UBS Commercial Mortgage Trust | | |
4.853% 09/15/31 | | 885,000 | | 905,049 |
5.124% 11/15/32 (a) | | 715,000 | | 724,476 |
5.279% 11/15/38 | | 3,698,074 | | 3,770,455 |
| |
| Merrill Lynch Mortgage Investors, Inc. | | |
I.O., | | | | |
0.579% 12/15/30 (a)(f) | | 2,988,797 | | 47,883 |
| |
| Morgan Stanley Capital I | | |
4.970% 12/15/41 | | 895,000 | | 892,069 |
5.150% 06/13/41 | | 260,000 | | 262,659 |
| |
| Morgan Stanley Dean Witter Capital I | | |
4.180% 03/12/35 | | 1,879,545 | | 1,905,564 |
5.080% 09/15/37 | | 2,995,000 | | 3,036,402 |
5.980% 01/15/39 | | 1,430,000 | | 1,498,241 |
| |
| PNC Mortgage Acceptance Corp. | | |
5.910% 03/12/34 | | 164,796 | | 164,643 |
| | | | |
| | | Par ($) | | Value ($) |
| Wachovia Bank Commercial Mortgage Trust | | |
4.980% 11/15/34 | | 2,030,000 | | 2,078,588 |
5.037% 03/15/42 | | 3,420,000 | | 3,468,944 |
5.384% 10/15/44 (a) | | 265,000 | | 261,262 |
5.726% 06/15/45 | | 1,280,520 | | 1,300,266 |
| | | | |
Total Commercial Mortgage-Backed Securities (cost of $29,298,728) | | 31,491,634 |
|
Corporate Fixed-Income Bonds & Notes – 4.3% |
| | | | |
| Communications – 0.5% | | |
| Media – 0.3% | | |
| Comcast Corp. | | | | |
6.550% 07/01/39 | | 985,000 | | 1,066,359 |
6.950% 08/15/37 | | 475,000 | | 537,607 |
| |
| Time Warner, Inc. | | |
6.500% 11/15/36 | | 35,000 | | 35,246 |
| | | | |
Media Total | | | | 1,639,212 |
|
| Telecommunication Services – 0.2% |
| New Cingular Wireless Services, Inc. | | |
8.750% 03/01/31 | | 225,000 | | 299,050 |
| |
| Verizon Wireless Capital LLC | | |
5.550% 02/01/14 (e) | | 1,050,000 | | 1,135,457 |
| | | | |
Telecommunication Services Total | | | | 1,434,507 |
| | | | |
Communications Total | | | | 3,073,719 |
| | | | |
| Consumer Cyclical – 0.2% | | | | |
| Retail – 0.2% | | | | |
| CVS Pass-Through Trust | | | | |
8.353% 07/10/31 (e) | | 1,093,532 | | 1,169,051 |
| | | | |
Retail Total | | | | 1,169,051 |
| | | | |
Consumer Cyclical Total | | | | 1,169,051 |
| | | | |
| Consumer Non-cyclical – 0.0% | | | | |
| Food – 0.0% | | | | |
| Campbell Soup Co. | | | | |
4.500% 02/15/19 | | 120,000 | | 121,659 |
| | | | |
Food Total | | | | 121,659 |
| | | | |
Consumer Non-cyclical Total | | | | 121,659 |
| | | | |
| Energy – 0.6% | | | | |
| Oil & Gas – 0.1% | | | | |
| Marathon Oil Corp. | | | | |
7.500% 02/15/19 | | 220,000 | | 251,209 |
| | | | |
Oil & Gas Total | | | | 251,209 |
See Accompanying Notes to Financial Statements.
14
Columbia Federal Securities Fund
August 31, 2009
Corporate Fixed-Income Bonds & Notes (continued)
| | | | |
| | | Par ($) | | Value ($) |
| Oil & Gas Services – 0.0% | | | | |
| Smith International, Inc. | | | | |
9.750% 03/15/19 | | 50,000 | | 60,615 |
| | |
| Weatherford International Ltd. | | | | |
5.150% 03/15/13 | | 175,000 | | 182,357 |
| | | | |
Oil & Gas Services Total | | | | 242,972 |
| | |
| Pipelines – 0.5% | | | | |
| Energy Transfer Partners LP | | | | |
6.000% 07/01/13 | | 875,000 | | 921,784 |
6.625% 10/15/36 | | 925,000 | | 969,956 |
| | |
| Kinder Morgan Energy Partners LP | | | | |
5.625% 02/15/15 | | 120,000 | | 126,951 |
| | |
| Plains All American Pipeline LP | | | | |
6.500% 05/01/18 | | 1,050,000 | | 1,110,366 |
| | | | |
Pipelines Total | | | | 3,129,057 |
| | | | |
Energy Total | | | | 3,623,238 |
| | | | |
| Financials – 2.6% |
| Banks – 1.0% | | | | |
| Bank of New York Mellon Corp. | | | | |
5.450% 05/15/19 | | 1,140,000 | | 1,211,526 |
| | |
| Capital One Capital IV | | | | |
6.745% 02/17/37 (a) | | 105,000 | | 75,600 |
| | |
| Capital One Capital V | | | | |
10.250% 08/15/39 | | 95,000 | | 96,598 |
| | |
| Citigroup, Inc. | | | | |
6.875% 03/05/38 | | 55,000 | | 49,674 |
8.125% 07/15/39 | | 1,245,000 | | 1,279,732 |
8.500% 05/22/19 | | 825,000 | | 901,789 |
| | |
| JPMorgan Chase Capital XX | | | | |
6.550% 09/29/36 | | 1,005,000 | | 875,911 |
| | |
| Morgan Stanley | | | | |
7.300% 05/13/19 | | 390,000 | | 434,316 |
| | |
| USB Capital IX | | | | |
6.189% 10/29/49 (a) | | 850,000 | | 612,000 |
| | |
| Wachovia Capital Trust III | | | | |
5.800% 03/29/49 (a) | | 110,000 | | 70,950 |
| | |
| Wachovia Corp. | | | | |
5.500% 05/01/13 | | 475,000 | | 504,684 |
| | | | |
Banks Total | | | | 6,112,780 |
| |
| Diversified Financial Services – 0.4% | | |
| Ameriprise Financial, Inc. | | | | |
7.300% 06/28/19 | | 210,000 | | 231,588 |
| | | | |
| | | Par ($) | | Value ($) |
| Discover Financial Services | | | | |
10.250% 07/15/19 | | 110,000 | | 120,478 |
| | |
| General Electric Capital Corp. | | | | |
6.000% 08/07/19 | | 1,480,000 | | 1,491,218 |
| | |
| International Lease Finance Corp. | | | | |
4.875% 09/01/10 | | 785,000 | | 734,960 |
| | | | |
Diversified Financial Services Total | | 2,578,244 |
| | |
| Insurance – 0.9% | | | | |
| Lincoln National Corp. | | | | |
8.750% 07/01/19 | | 1,290,000 | | 1,442,548 |
| | |
| MetLife Capital Trust X | | | | |
9.250% 04/08/38 (a)(e) | | 312,000 | | 303,420 |
| | |
| MetLife, Inc. | | | | |
6.750% 06/01/16 | | 1,490,000 | | 1,629,902 |
10.750% 08/01/39 | | 835,000 | | 939,608 |
| | |
| Principal Life Income Funding Trusts | | | | |
5.300% 04/24/13 | | 15,000 | | 15,296 |
| | |
| Prudential Financial, Inc. | | | | |
7.375% 06/15/19 | | 1,205,000 | | 1,309,603 |
| | | | |
Insurance Total | | | | 5,640,377 |
| |
Real Estate Investment Trusts
(REITs) – 0.3% | | |
| Duke Realty LP | | | | |
7.375% 02/15/15 | | 805,000 | | 825,331 |
8.250% 08/15/19 | | 840,000 | | 847,033 |
| | |
| Simon Property Group LP | | | | |
5.750% 12/01/15 | | 355,000 | | 367,701 |
| | | | |
Real Estate Investment Trusts (REITs) Total | | 2,040,065 |
| | | | |
Financials Total | | | | 16,371,466 |
| | | | |
| Industrials – 0.0% | | | | |
| Miscellaneous Manufacturing – 0.0% | | |
| Ingersoll-Rand Global Holding Co., Ltd. | | |
9.500% 04/15/14 | | 135,000 | | 158,297 |
| | | | |
Miscellaneous Manufacturing Total | | 158,297 |
| | | | |
Industrials Total | | | | 158,297 |
| | | | |
| Technology – 0.1% | | | | |
| Software – 0.1% | | |
| Oracle Corp. | | | | |
4.950% 04/15/13 | | 410,000 | | 438,782 |
| | | | |
Software Total | | | | 438,782 |
| | | | |
Technology Total | | | | 438,782 |
See Accompanying Notes to Financial Statements.
15
Columbia Federal Securities Fund
August 31, 2009
Corporate Fixed-Income Bonds & Notes (continued)
| | | | |
| | | Par ($) | | Value ($) |
| Utilities – 0.3% | | | | |
Electric – 0.3% | | | | |
| Niagara Mohawk Power Corp. | | | | |
4.881% 08/15/19 (e) | | 835,000 | | 843,506 |
| | |
| Pacific Gas & Electric Co. | | | | |
5.800% 03/01/37 | | 1,050,000 | | 1,112,297 |
| | |
| Southern Co. | | | | |
4.150% 05/15/14 | | 20,000 | | 20,567 |
| | | | |
Electric Total | | | | 1,976,370 |
| | |
| Gas – 0.0% | | | | |
| Sempra Energy | | | | |
6.500% 06/01/16 | | 25,000 | | 27,496 |
| | | | |
Gas Total | | | | 27,496 |
| | | | |
Utilities Total | | | | 2,003,866 |
| | | | |
Total Corporate Fixed-Income Bonds & Notes (cost of $26,206,499) | | 26,960,078 |
|
Collateralized Mortgage Obligations – 2.2% |
| | | | |
| Agency – 2.1% | | | | |
| Federal Home Loan Mortgage Corp. | | |
6.000% 05/15/29 | | 8,812,000 | | 9,064,727 |
I.O.,
5.500% 05/15/27 (f) | | 24,466 | | 154 |
| FN Dus Broken Arrow | | | | |
TBA,
4.420% 10/15/19 (b) | | 4,415,000 | | 4,415,000 |
| Vendee Mortgage Trust | | | | |
I.O.:
0.301% 03/15/29 (a)(f) | | 5,696,214 | | 27,989 |
0.439% 03/15/28 (a)(f) | | 4,772,948 | | 33,406 |
| | | | |
Agency Total | | | | 13,541,276 |
| | | | |
| Non-Agency – 0.1% | | | | |
| Nomura Asset Acceptance Corp. | | |
6.664% 05/25/36 | | 406,930 | | 2,354 |
| |
| Tryon Mortgage Funding, Inc. | | |
7.500% 02/20/27 | | 17,932 | | 15,697 |
| |
| Washington Mutual Mortgage Loan Trust | | |
1.566% 01/25/40 (a) | | 439,060 | | 422,742 |
| | | | |
Non-Agency Total | | | | 440,793 |
| | | | |
Total Collateralized Mortgage Obligations
(cost of $15,015,084) | | 13,982,069 |
Securities Lending Collateral – 19.9%
| | | | | |
| | | Shares | | Value ($) | |
State Street Navigator Securities Lending Prime Portfolio (7 day yield of 0.416%) (g) | | 125,244,371 | | 125,244,371 | |
| | | | | |
Total Securities Lending Collateral
(cost of $125,244,371) | | 125,244,371 | |
| |
Short-Term Obligation – 2.1% | | | |
| | | Par ($) | | | |
Repurchase agreement with Fixed Income Clearing Corp., dated 08/31/09, due 09/01/09 at 0.140%, collateralized by a U.S. Government Agency obligation maturing 12/03/13, market value $13,660,731 (repurchase proceeds $13,388,052) | | 13,388,000 | | 13,388,000 | |
| | | | | |
Total Short-Term Obligation
(cost of $13,388,000) | | 13,388,000 | |
| | | | | |
Total Investments – 120.2%
(cost of $746,808,406) (h) | | 756,322,470 | |
| | | | | |
Obligation to Return Collateral for Securities Loaned – (19.9)% | | (125,244,371 | ) |
| | | | | |
Other Assets & Liabilities, Net – (0.3)% | | (1,951,854 | ) |
| | | | | |
Net Assets – 100.0% | | 629,126,245 | |
Notes to Investment Portfolio:
| (a) | The interest rate shown on floating rate or variable rate securities reflects the rate at August 31, 2009. |
| (b) | Security purchased on a delayed delivery basis. |
| (c) | All or a portion of this security was on loan at August 31, 2009. The total market value of securities on loan at August 31, 2009 is $122,964,096. |
| (e) | Security exempt from registration pursuant to Rule 144A under the Securities Act of 1933. These securities may be resold in transactions exempt from registration, normally to qualified institutional buyers. At August 31, 2009, these securities, which are not illiquid, amounted to $4,443,578, which represents 0.7% of net assets. |
| (f) | Accrued interest accumulates in the value of this security and is payable at redemption. |
| (g) | Investment made with cash collateral received from securities lending activity. |
| (h) | Cost for federal income tax purposes is $746,808,406. |
Investment in affiliate during the year ended August 31, 2009:
Security name: MBNA Credit Card Master Note Trust, 4.450%, 08/15/16
| | | | |
Par as of 08/31/08: | | $ | 5,000,000 | |
Par purchased: | | $ | — | |
Par sold: | | $ | (5,000,000 | ) |
Par as of 8/31/09: | | $ | — | |
Net realized gain/(loss): | | $ | (2,735,000 | ) |
Interest income earned: | | $ | 81,583 | |
Value at end of period: | | $ | — | |
See Accompanying Notes to Financial Statements.
16
Columbia Federal Securities Fund
August 31, 2009
The following table summarizes the inputs used, as of August 31, 2009 in valuing the Fund’s assets:
| | | | | | | | | | | | |
Description | | Quoted
Prices
(Level 1) | | Other
Significant
Observable
Inputs
(Level 2) | | Significant
Unobservable
Inputs
(Level 3) | | Total |
Mortgage-Backed Securities | | $ | 19,000,397 | | $ | 242,186,527 | | $ | — | | $ | 261,186,924 |
| | | | | | | | | | | | |
Government & Agency Obligations | | | 199,228,849 | | | 46,463,470 | | | — | | | 245,692,319 |
| | | | | | | | | | | | |
Asset-Backed Securities | | | — | | | 38,377,075 | | | — | | | 38,377,075 |
| | | | | | | | | | | | |
Commercial Mortgage-Backed Securities | | | — | | | 31,491,634 | | | — | | | 31,491,634 |
| | | | | | | | | | | | |
Corporate Fixed-Income Bonds & Notes | | | | | | | | | | | | |
Communications | | | — | | | 3,073,719 | | | — | | | 3,073,719 |
Consumer Cyclical | | | — | | | 1,169,051 | | | — | | | 1,169,051 |
Consumer Non Cyclical | | | — | | | 121,659 | | | — | | | 121,659 |
Energy | | | — | | | 3,623,238 | | | — | | | 3,623,238 |
Financials | | | — | | | 16,371,466 | | | — | | | 16,371,466 |
Industrials | | | — | | | 158,297 | | | — | | | 158,297 |
Technology | | | — | | | 438,782 | | | — | | | 438,782 |
Utilities | | | — | | | 2,003,866 | | | — | | | 2,003,866 |
| | | | | | | | | | | | |
Total Corporate Fixed-Income Bonds & Notes | | | — | | | 26,960,078 | | | — | | $ | 26,960,078 |
| | | | | | | | | | | | |
Total Collateralized Mortgage Obligations | | | — | | | 13,982,069 | | | — | | $ | 13,982,069 |
| | | | | | | | | | | | |
Total Short-Term Obligation | | | — | | | 13,388,000 | | | — | | $ | 13,388,000 |
| | | | | | | | | | | | |
Total Securities Lending Collateral | | | 125,244,371 | | | — | | | — | | $ | 125,244,371 |
| | | | | | | | | | | | |
Total Investments | | $ | 343,473,617 | | $ | 412,848,853 | | $ | — | | $ | 756,322,470 |
| | | | | | | | | | | | |
For more information on valuation inputs, and their aggregation into the levels used in the table above, please refer to the Security Valuation section in the accompanying Notes to Financial Statements.
At August 31, 2009, the asset allocation of the Fund is as follows:
| | | |
Asset Allocation (Unaudited) | | % of Net Assets | |
Mortgage-Backed Securities | | 41.5 | % |
Government & Agency Obligations | | 39.1 | |
Asset-Backed Securities | | 6.1 | |
Commercial Mortgage-Backed Securities | | 5.0 | |
Corporate Fixed-Income Bonds & Notes | | 4.3 | |
Collateralized Mortgage Obligations | | 2.2 | |
| | | |
| | 98.2 | |
Securities Lending Collateral | | 19.9 | |
Short-Term Obligation | | 2.1 | |
Obligation to Return Collateral for Securities Loaned | | (19.9 | ) |
Other Assets & Liabilities, Net | | (0.3 | ) |
| | | |
| | 100.0 | % |
| | | |
| | |
Acronym | | Name |
| I.O. | | Interest Only |
| STRIPS | | Separate Trading of Registered Interest and Principal of Securities |
| TBA | | To Be Announced |
See Accompanying Notes to Financial Statements.
17
Statement of Assets and Liabilities – Columbia Federal Securities Fund
August 31, 2009
| | | | | |
| | | | | ($) | |
| Assets | | Investments, at cost | | 746,808,406 | |
| | | | | |
| | Investments, at value (including securities on loan of $122,964,096) | | 756,322,470 | |
| | Receivable for: | | | |
| | Investments sold | | 23,791,582 | |
| | Fund shares sold | | 104,029 | |
| | Interest | | 3,715,742 | |
| | Securities lending income | | 24,613 | |
| | Dollar roll income | | 25,588 | |
| | Expense reimbursement due from investment advisor | | 21,054 | |
| | Trustees’ deferred compensation plan | | 75,961 | |
| | Other assets | | 76,560 | |
| | | |
| | Total Assets | | 784,157,599 | |
| | |
| Liabilities | | Payable to custodian bank | | 2,866,057 | |
| | Collateral on securities loaned | | 125,244,371 | |
| | Payable for: | | | |
| | Investments purchased | | 1,883,055 | |
| | Investments purchased on delayed delivery basis | | 23,096,802 | |
| | Fund shares repurchased | | 609,409 | |
| | Distributions | | 563,927 | |
| | Investment advisory fee | | 277,764 | |
| | Pricing and bookkeeping fees | | 29,223 | |
| | Transfer agent fee | | 99,920 | |
| | Trustees’ fees | | 29,958 | |
| | Custody fee | | 17,356 | |
| | Distribution and service fees | | 147,898 | |
| | Chief compliance officer expenses | | 145 | |
| | Trustees’ deferred compensation plan | | 75,961 | |
| | Other liabilities | | 89,508 | |
| | | |
| | Total Liabilities | | 155,031,354 | |
| |
| | | |
| | Net Assets | | 629,126,245 | |
| | |
| Net Assets Consist of | | Paid-in capital | | 644,288,305 | |
| | Overdistributed net investment income | | (685,288 | ) |
| | Accumulated net realized loss | | (23,990,836 | ) |
| | Net unrealized appreciation (depreciation) on investments | | 9,514,064 | |
| | | |
| | Net Assets | | 629,126,245 | |
See Accompanying Notes to Financial Statements.
18
Statement of Assets and Liabilities (continued) – Columbia Federal Securities Fund
August 31, 2009
| | | | | | |
| | | | | | |
| Class A | | Net assets | | $ | 515,927,639 | |
| | Shares outstanding | | | 48,146,304 | |
| | Net asset value per share | | $ | 10.72 | (a) |
| | Maximum sales charge | | | 4.75 | % |
| | Maximum offering price per share | | $ | 11.25 | (b) |
| | |
| Class B | | Net assets | | $ | 26,133,740 | |
| | Shares outstanding | | | 2,438,797 | |
| | Net asset value and offering price per share | | $ | 10.72 | (a) |
| | |
| Class C | | Net assets | | $ | 14,205,341 | |
| | Shares outstanding | | | 1,325,641 | |
| | Net asset value and offering price per share | | $ | 10.72 | (a) |
| | |
| Class Z | | Net assets | | $ | 72,859,525 | |
| | Shares outstanding | | | 6,799,241 | |
| | Net asset value, offering and redemption price per share | | $ | 10.72 | |
| (a) | Redemption price per share is equal to net asset value less any applicable contingent deferred sales charge. |
| (b) | On sales of $50,000 or more the offering price is reduced. |
See Accompanying Notes to Financial Statements.
19
Statement of Operations – Columbia Federal Securities Fund
For the Year Ended August 31, 2009
| | | | | |
| | | | | ($) | |
| Investment Income | | Interest | | 26,302,684 | |
| | Interest from affiliates | | 81,583 | |
| | Securities lending income | | 1,636,173 | |
| | Dollar roll fee income | | 1,007,151 | |
| | | |
| | Total Investment Income | | 29,027,591 | |
| | |
| Expenses | | Investment advisory fee | | 3,446,020 | |
| | Distribution fee: | | | |
| | Class B | | 247,438 | |
| | Class C | | 119,925 | |
| | Service fee: | | | |
| | Class A | | 1,350,282 | |
| | Class B | | 82,479 | |
| | Class C | | 39,990 | |
| | Pricing and bookkeeping fees | | 212,818 | |
| | Transfer agent fee | | 755,300 | |
| | Trustees’ fees | | 25,215 | |
| | Custody fee | | 103,662 | |
| | Reports to shareholders | | 146,903 | |
| | Chief compliance officer expenses | | 862 | |
| | Other expenses | | 194,929 | |
| | | |
| | Expenses before interest expense | | 6,725,823 | |
| | Interest expense | | 421 | |
| | | |
| | Total Expenses | | 6,726,244 | |
| | |
| | Fees waived or expenses reimbursed by investment advisor | | (129,672 | ) |
| | Fees waived by distributor – Class C | | (23,948 | ) |
| | Expense reductions | | (4 | ) |
| | | |
| | Net Expenses | | 6,572,620 | |
| |
| | | |
| | Net Investment Income | | 22,454,971 | |
| | |
| Net Realized and Unrealized Gain (Loss) on Investments and Futures Contracts | | Net realized gain (loss) on: | | | |
| | Unaffiliated investments | | 18,730,112 | |
| | Affiliated investments | | (2,735,000 | ) |
| | Futures contracts | | (1,433,501 | ) |
| | | |
| | Net realized gain | | 14,561,611 | |
| | |
| | Net change in unrealized appreciation (depreciation) on: | | | |
| | Investments | | 1,849,104 | |
| | Futures contracts | | (132,953 | ) |
| | | |
| | Net change in unrealized appreciation (depreciation) | | 1,716,151 | |
| | | |
| | Net Gain | | 16,277,762 | |
| |
| | | |
| | Net Increase Resulting from Operations | | 38,732,733 | |
See Accompanying Notes to Financial Statements.
20
Statement of Changes in Net Assets – Columbia Federal Securities Fund
| | | | | | | | |
| | | | | Year Ended August 31, | |
| Increase (Decrease) in Net Assets | | | | 2009 ($) | | | 2008 ($) | |
| Operations | | Net investment income | | 22,454,971 | | | 30,407,909 | |
| | Net realized gain on investments and futures contracts | | 14,561,611 | | | 7,778,041 | |
| | Net change in unrealized appreciation (depreciation) on investments and futures contracts | | 1,716,151 | | | 4,235,086 | |
| | | |
| | Net increase resulting from operations | | 38,732,733 | | | 42,421,036 | |
| | | |
| Distributions to Shareholders | | From net investment income: | | | | | | |
| | Class A | | (18,982,480 | ) | | (25,018,770 | ) |
| | Class B | | (918,131 | ) | | (1,434,983 | ) |
| | Class C | | (460,568 | ) | | (323,241 | ) |
| | Class Z | | (2,887,362 | ) | | (3,855,707 | ) |
| | | |
| | Total distributions to shareholders | | (23,248,541 | ) | | (30,632,701 | ) |
| | | |
| | Net Capital Stock Transactions | | (49,705,001 | ) | | (93,534,106 | ) |
| | Increase from regulatory settlements | | 69,270 | | | — | |
| | | | | | | | |
| | Total decrease in net assets | | (34,151,539 | ) | | (81,745,771 | ) |
| | | |
| Net Assets | | Beginning of period | | 663,277,784 | | | 745,023,555 | |
| | End of period | | 629,126,245 | | | 663,277,784 | |
| | Overdistributed net investment income at end of period | | (685,288 | ) | | (1,882,825 | ) |
See Accompanying Notes to Financial Statements.
21
Statement of Changes in Net Assets – Capital Stock Activity
| | | | | | | | | | | | | | |
| | | Columbia Federal Securities Fund | |
| | | Year Ended
August 31, 2009 | | | | | Year Ended
August 31, 2008 | |
| | | Shares | | | Dollars ($) | | | | | Shares | | | Dollars ($) | |
Class A | | | | | | | | | | | | | | |
Subscriptions | | 3,556,008 | | | 37,812,023 | | | | | 2,227,145 | | | 23,586,061 | |
Distributions reinvested | | 1,277,998 | | | 13,595,455 | | | | | 1,657,646 | | | 17,432,337 | |
Redemptions | | (9,159,108 | ) | | (97,530,319 | ) | | | | (8,589,620 | ) | | (90,278,887 | ) |
| | | | | | | | | | | | | | |
Net decrease | | (4,325,102 | ) | | (46,122,841 | ) | | | | (4,704,829 | ) | | (49,260,489 | ) |
| | | | | |
Class B | | | | | | | | | | | | | | |
Subscriptions | | 924,207 | | | 9,820,780 | | | | | 557,421 | | | 5,926,478 | |
Distributions reinvested | | 66,978 | | | 712,144 | | | | | 111,320 | | | 1,170,699 | |
Redemptions | | (1,869,251 | ) | | (19,910,268 | ) | | | | (1,655,664 | ) | | (17,401,449 | ) |
| | | | | | | | | | | | | | |
Net decrease | | (878,066 | ) | | (9,377,344 | ) | | | | (986,923 | ) | | (10,304,272 | ) |
| | | | | |
Class C | | | | | | | | | | | | | | |
Subscriptions | | 1,309,558 | | | 13,904,546 | | | | | 493,239 | | | 5,221,115 | |
Distributions reinvested | | 21,008 | | | 223,615 | | | | | 21,327 | | | 224,441 | |
Redemptions | | (851,908 | ) | | (9,049,658 | ) | | | | (351,910 | ) | | (3,700,058 | ) |
| | | | | | | | | | | | | | |
Net increase | | 478,658 | | | 5,078,503 | | | | | 162,656 | | | 1,745,498 | |
| | | | | |
Class Z | | | | | | | | | | | | | | |
Subscriptions | | 2,295,644 | | | 24,441,990 | | | | | 1,983,908 | | | 20,660,872 | |
Distributions reinvested | | 42,909 | | | 456,821 | | | | | 77,044 | | | 805,807 | |
Redemptions | | (2,274,304 | ) | | (24,182,130 | ) | | | | (5,468,486 | ) | | (57,181,522 | ) |
| | | | | | | | | | | | | | |
Net increase (decrease) | | 64,249 | | | 716,681 | | | | | (3,407,534 | ) | | (35,714,843 | ) |
See Accompanying Notes to Financial Statements.
22
Financial Highlights – Columbia Federal Securities Fund
Selected data for a share outstanding throughout each period is as follows:
| | | | | | | | | | | | | | | | | | | | |
| | | Year Ended August 31, | |
| Class A Shares | | 2009 | | | 2008 | | | 2007 | | | 2006 | | | 2005 | |
Net Asset Value, Beginning of Period | | $ | 10.47 | | | $ | 10.30 | | | $ | 10.38 | | | $ | 10.73 | | | $ | 10.75 | |
| | | | | |
Income from Investment Operations: | | | | | | | | | | | | | | | | | | | | |
Net investment income (a) | | | 0.36 | | | | 0.46 | | | | 0.46 | | | | 0.44 | | | | 0.41 | |
Net realized and unrealized gain (loss) on investments and futures contracts | | | 0.26 | | | | 0.17 | | | | (0.08 | ) | | | (0.32 | ) | | | — | (b) |
| | | | | | | | | | | | | | | | | | | | |
Total from investment operations | | | 0.62 | | | | 0.63 | | | | 0.38 | | | | 0.12 | | | | 0.41 | |
| | | | | |
Less Distributions to Shareholders: | | | | | | | | | | | | | | | | | | | | |
From net investment income | | | (0.37 | ) | | | (0.46 | ) | | | (0.46 | ) | | | (0.46 | ) | | | (0.43 | ) |
From return of capital | | | — | | | | — | | | | — | (b) | | | (0.01 | ) | | | — | |
| | | | | | | | | | | | | | | | | | | | |
Total distributions to shareholders | | | (0.37 | ) | | | (0.46 | ) | | | (0.46 | ) | | | (0.47 | ) | | | (0.43 | ) |
| | | | | |
Increase from regulatory settlements | | | — | (b) | | | — | | | | — | | | | — | | | | — | |
| | | | | |
Net Asset Value, End of Period | | $ | 10.72 | | | $ | 10.47 | | | $ | 10.30 | | | $ | 10.38 | | | $ | 10.73 | |
Total return (c) | | | 6.04 | %(d) | | | 6.18 | % | | | 3.73 | %(d) | | | 1.07 | %(d) | | | 3.91 | % |
| | | | | |
Ratios to Average Net Assets/Supplemental Data: | | | | | | | | | | | | | | | | | | | | |
Net expenses before interest expense (e) | | | 0.96 | % | | | 0.98 | % | | | 0.95 | % | | | 0.97 | % | | | 1.08 | % |
Interest expense | | | — | %(f) | | | — | | | | — | | | | — | | | | — | |
Net expenses (e) | | | 0.96 | % | | | 0.98 | % | | | 0.95 | % | | | 0.97 | % | | | 1.08 | % |
Waiver/Reimbursement | | | 0.02 | % | | | — | | | | 0.02 | % | | | 0.01 | % | | | — | |
Net investment income (e) | | | 3.39 | % | | | 4.33 | % | | | 4.43 | % | | | 4.24 | % | | | 3.87 | % |
Portfolio turnover rate (g) | | | 253 | % | | | 135 | % | | | 121 | % | | | 92 | % | | | 80 | % |
Net assets, end of period (000s) | | $ | 515,928 | | | $ | 549,203 | | | $ | 589,124 | | | $ | 665,283 | | | $ | 754,026 | |
| (a) | Per share data was calculated using the average shares outstanding during the period. |
| (b) | Rounds to less than $0.01 per share. |
| (c) | Total return at net asset value assuming all distributions reinvested and no initial sales charge or contingent deferred sales charge. |
| (d) | Had the investment advisor and/or any of its affiliates not waived fees or reimbursed a portion of expenses, total return would have been reduced. |
| (e) | The benefits derived from expense reductions had an impact of less than 0.01% except for the year ended August 31, 2007 which had a 0.01% impact. |
| (f) | Rounds to less than 0.01% per share. |
| (g) | Portfolio turnover excludes dollar roll transactions. |
See Accompanying Notes to Financial Statements.
23
Financial Highlights – Columbia Federal Securities Fund
Selected data for a share outstanding throughout each period is as follows:
| | | | | | | | | | | | | | | | | | | | |
| | | Year Ended August 31, | |
| Class B Shares | | 2009 | | | 2008 | | | 2007 | | | 2006 | | | 2005 | |
Net Asset Value, Beginning of Period | | $ | 10.47 | | | $ | 10.30 | | | $ | 10.38 | | | $ | 10.73 | | | $ | 10.75 | |
| | | | | |
Income from Investment Operations: | | | | | | | | | | | | | | | | | | | | |
Net investment income (a) | | | 0.28 | | | | 0.38 | | | | 0.38 | | | | 0.36 | | | | 0.33 | |
Net realized and unrealized gain (loss) on investments and futures contracts | | | 0.26 | | | | 0.17 | | | | (0.08 | ) | | | (0.32 | ) | | | — | (b) |
| | | | | | | | | | | | | | | | | | | | |
Total from investment operations | | | 0.54 | | | | 0.55 | | | | 0.30 | | | | 0.04 | | | | 0.33 | |
| | | | | |
Less Distributions to Shareholders: | | | | | | | | | | | | | | | | | | | | |
From net investment income | | | (0.29 | ) | | | (0.38 | ) | | | (0.38 | ) | | | (0.38 | ) | | | (0.35 | ) |
From return of capital | | | — | | | | — | | | | — | (b) | | | (0.01 | ) | | | — | |
| | | | | | | | | | | | | | | | | | | | |
Total distributions to shareholders | | | (0.29 | ) | | | (0.38 | ) | | | (0.38 | ) | | | (0.39 | ) | | | (0.35 | ) |
| | | | | |
Increase from regulatory settlements | | | — | (b) | | | — | | | | — | | | | — | | | | — | |
| | | | | |
Net Asset Value, End of Period | | $ | 10.72 | | | $ | 10.47 | | | $ | 10.30 | | | $ | 10.38 | | | $ | 10.73 | |
Total return (c) | | | 5.25 | %(d) | | | 5.39 | % | | | 2.96 | %(d) | | | 0.32 | %(d) | | | 3.13 | % |
| | | | | |
Ratios to Average Net Assets/Supplemental Data: | | | | | | | | | | | | | | | | | | | | |
Net expenses before interest expense (e) | | | 1.71 | % | | | 1.73 | % | | | 1.70 | % | | | 1.72 | % | | | 1.83 | % |
Interest expense | | | — | %(f) | | | — | | | | — | | | | — | | | | — | |
Net expenses (e) | | | 1.71 | % | | | 1.73 | % | | | 1.70 | % | | | 1.72 | % | | | 1.83 | % |
Waiver/Reimbursement | | | 0.02 | % | | | — | | | | 0.02 | % | | | 0.01 | % | | | — | |
Net investment income (e) | | | 2.67 | % | | | 3.59 | % | | | 3.68 | % | | | 3.49 | % | | | 3.12 | % |
Portfolio turnover rate (g) | | | 253 | % | | | 135 | % | | | 121 | % | | | 92 | % | | | 80 | % |
Net assets, end of period (000s) | | $ | 26,134 | | | $ | 34,716 | | | $ | 44,345 | | | $ | 65,896 | | | $ | 69,452 | |
| (a) | Per share data was calculated using the average shares outstanding during the period. |
| (b) | Rounds to less than $0.01 per share. |
| (c) | Total return at net asset value assuming all distributions reinvested and no contingent deferred sales charge. |
| (d) | Had the investment advisor and/or any of its affiliates not waived fees or reimbursed a portion of expenses, total return would have been reduced. |
| (e) | The benefits derived from expense reductions had an impact of less than 0.01% except for the year ended August 31, 2007 which had a 0.01% impact. |
| (f) | Rounds to less than 0.01% per share. |
| (g) | Portfolio turnover excludes dollar roll transactions. |
See Accompanying Notes to Financial Statements.
24
Financial Highlights – Columbia Federal Securities Fund
Selected data for a share outstanding throughout each period is as follows:
| | | | | | | | | | | | | | | | | | | | |
| | | Year Ended August 31, | |
| Class C Shares | | 2009 | | | 2008 | | | 2007 | | | 2006 | | | 2005 | |
Net Asset Value, Beginning of Period | | $ | 10.47 | | | $ | 10.30 | | | $ | 10.38 | | | $ | 10.73 | | | $ | 10.75 | |
| | | | | |
Income from Investment Operations: | | | | | | | | | | | | | | | | | | | | |
Net investment income (a) | | | 0.29 | | | | 0.39 | | | | 0.40 | | | | 0.38 | | | | 0.35 | |
Net realized and unrealized gain (loss) on investments and
futures contracts | | | 0.27 | | | | 0.18 | | | | (0.08 | ) | | | (0.33 | ) | | | — | (b) |
| | | | | | | | | | | | | | | | | | | | |
Total from investment operations | | | 0.56 | | | | 0.57 | | | | 0.32 | | | | 0.05 | | | | 0.35 | |
| | | | | |
Less Distributions to Shareholders: | | | | | | | | | | | | | | | | | | | | |
From net investment income | | | (0.31 | ) | | | (0.40 | ) | | | (0.40 | ) | | | (0.39 | ) | | | (0.37 | ) |
From return of capital | | | — | | | | — | | | | — | (b) | | | (0.01 | ) | | | — | |
| | | | | | | | | | | | | | | | | | | | |
Total distributions to shareholders | | | (0.31 | ) | | | (0.40 | ) | | | (0.40 | ) | | | (0.40 | ) | | | (0.37 | ) |
| | | | | |
Increase from regulatory settlements | | | — | (b) | | | — | | | | — | | | | — | | | | — | |
| | | | | |
Net Asset Value, End of Period | | $ | 10.72 | | | $ | 10.47 | | | $ | 10.30 | | | $ | 10.38 | | | $ | 10.73 | |
Total return (c)(d) | | | 5.40 | % | | | 5.54 | % | | | 3.11 | % | | | 0.47 | % | | | 3.29 | % |
| | | | | |
Ratios to Average Net Assets/Supplemental Data: | | | | | | | | | | | | | | | | | | | | |
Net expenses before interest expense (e) | | | 1.56 | % | | | 1.58 | % | | | 1.55 | % | | | 1.57 | % | | | 1.68 | % |
Interest expense | | | — | %(f) | | | — | | | | — | | | | — | | | | — | |
Net expenses (e) | | | 1.56 | % | | | 1.58 | % | | | 1.55 | % | | | 1.57 | % | | | 1.68 | % |
Waiver/Reimbursement | | | 0.17 | % | | | 0.15 | % | | | 0.17 | % | | | 0.16 | % | | | 0.15 | % |
Net investment income (e) | | | 2.76 | % | | | 3.73 | % | | | 3.83 | % | | | 3.65 | % | | | 3.27 | % |
Portfolio turnover rate (g) | | | 253 | % | | | 135 | % | | | 121 | % | | | 92 | % | | | 80 | % |
Net assets, end of period (000s) | | $ | 14,205 | | | $ | 8,865 | | | $ | 7,051 | | | $ | 8,231 | | | $ | 8,547 | |
| (a) | Per share data was calculated using the average shares outstanding during the period. |
| (b) | Rounds to less than $0.01 per share. |
| (c) | Total return at net asset value assuming all distributions reinvested and no contingent deferred sales charge. |
| (d) | Had the investment advisor and/or any of its affiliates not waived fees or reimbursed a portion of expenses, total return would have been reduced. |
| (e) | The benefits derived from expense reductions had an impact of less than 0.01% except for the year ended August 31, 2007 which had a 0.01% impact. |
| (f) | Rounds to less than 0.01% per share. |
| (g) | Portfolio turnover excludes dollar roll transactions. |
See Accompanying Notes to Financial Statements.
25
Financial Highlights – Columbia Federal Securities Fund
Selected data for a share outstanding throughout each period is as follows:
| | | | | | | | | | | | | | | | | | | | |
| | | Year Ended August 31, | |
| Class Z Shares | | 2009 | | | 2008 | | | 2007 | | | 2006 | | | 2005 | |
Net Asset Value, Beginning of Period | | $ | 10.47 | | | $ | 10.30 | | | $ | 10.38 | | | $ | 10.73 | | | $ | 10.75 | |
| | | | | |
Income from Investment Operations: | | | | | | | | | | | | | | | | | | | | |
Net investment income (a) | | | 0.39 | | | | 0.48 | | | | 0.48 | | | | 0.46 | | | | 0.44 | |
Net realized and unrealized gain (loss) on investments and futures contracts | | | 0.26 | | | | 0.18 | | | | (0.07 | ) | | | (0.32 | ) | | | — | (b) |
| | | | | | | | | | | | | | | | | | | | |
Total from investment operations | | | 0.65 | | | | 0.66 | | | | 0.41 | | | | 0.14 | | | | 0.44 | |
| | | | | |
Less Distributions to Shareholders: | | | | | | | | | | | | | | | | | | | | |
From net investment income | | | (0.40 | ) | | | (0.49 | ) | | | (0.49 | ) | | | (0.48 | ) | | | (0.46 | ) |
From return of capital | | | — | | | | — | | | | — | (b) | | | (0.01 | ) | | | — | |
| | | | | | | | | | | | | | | | | | | | |
Total distributions to shareholders | | | (0.40 | ) | | | (0.49 | ) | | | (0.49 | ) | | | (0.49 | ) | | | (0.46 | ) |
| | | | | |
Increase from regulatory settlements | | | — | (b) | | | — | | | | — | | | | — | | | | — | |
| | | | | |
Net Asset Value, End of Period | | $ | 10.72 | | | $ | 10.47 | | | $ | 10.30 | | | $ | 10.38 | | | $ | 10.73 | |
Total return (c) | | | 6.31 | %(d) | | | 6.45 | % | | | 3.99 | %(d) | | | 1.33 | %(d) | | | 4.16 | % |
| | | | | |
Ratios to Average Net Assets/Supplemental Data: | | | | | | | | | | | | | | | | | | | | |
Net expenses before interest expense (e) | | | 0.71 | % | | | 0.73 | % | | | 0.70 | % | | | 0.72 | % | | | 0.83 | % |
Interest expense | | | — | %(f) | | | — | | | | — | | | | — | | | | — | |
Net expenses (e) | | | 0.71 | % | | | 0.73 | % | | | 0.70 | % | | | 0.72 | % | | | 0.83 | % |
Waiver/Reimbursement | | | 0.02 | % | | | — | | | | 0.02 | % | | | 0.01 | % | | | — | |
Net investment income (e) | | | 3.63 | % | | | 4.58 | % | | | 4.68 | % | | | 4.51 | % | | | 4.12 | % |
Portfolio turnover rate (g) | | | 253 | % | | | 135 | % | | | 121 | % | | | 92 | % | | | 80 | % |
Net assets, end of period (000s) | | $ | 72,860 | | | $ | 70,493 | | | $ | 104,504 | | | $ | 109,187 | | | $ | 39,680 | |
| (a) | Per share data was calculated using the average shares outstanding during the period. |
| (b) | Rounds to less than $0.01 per share. |
| (c) | Total return at net asset value assuming all distributions reinvested. |
| (d) | Had the investment advisor and/or any of its affiliates not waived fees or reimbursed a portion of expenses, total return would have been reduced. |
| (e) | The benefits derived from expense reductions had an impact of less than 0.01% except for the year ended August 31, 2007 which had a 0.01% impact. |
| (f) | Rounds to less than 0.01% per share. |
| (g) | Portfolio turnover excludes dollar roll transactions. |
See Accompanying Notes to Financial Statements.
26
Notes to Financial Statements – Columbia Federal Securities Fund
August 31, 2009
Note 1. Organization
Columbia Federal Securities Fund (the ��Fund”), a series of Columbia Funds Series Trust I (the “Trust”), is a diversified fund. The Trust is registered under the Investment Company Act of 1940, as amended (the “1940 Act”), as an open-end management investment company organized as a Massachusetts business trust.
Investment Objective
The Fund seeks total return, consisting of current income and capital appreciation.
Fund Shares
The Trust may issue an unlimited number of shares, and the Fund offers four classes of shares: Class A, Class B, Class C and Class Z. Each share class has its own expense structure and sales charges, as applicable.
Class A shares are subject to a maximum front-end sales charge of 4.75% based on the amount of initial investment. Class A shares purchased without an initial sales charge in accounts aggregating $1 million to $50 million at the time of purchase are subject to a 1.00% contingent deferred sales charge (“CDSC”) on shares sold within one year after purchase. Class B shares are subject to a maximum CDSC of 5.00% based upon the holding period after purchase. Class B shares will convert to Class A shares eight years after purchase. Class C shares are subject to a 1.00% CDSC on shares sold within one year after purchase. Class Z shares are offered continuously at net asset value. There are certain restrictions on the purchase of Class Z shares, as described in the Fund’s prospectus.
Effective June 22, 2009, the Fund no longer accepts investments in Class B shares from new or existing investors in the Fund’s Class B shares, except in connection with the reinvestment of any dividend and/or capital gain distributions in Class B shares of the Fund, and exchanges by existing Class B shareholders of other Columbia Funds.
Note 2. Significant Accounting Policies
The preparation of financial statements in accordance with accounting principles generally accepted in the United States of America (“GAAP”) requires management to make certain estimates and assumptions that affect the reported amounts of assets and liabilities, the disclosure of contingent assets and liabilities at the date of the financial statements and the reported amounts of revenue and expenses during the reporting period. Actual results could differ from those estimates.
Management has evaluated the events and transactions that have occurred through October 22, 2009, the date the financial statements were issued, and except as disclosed in Note 13, noted no items requiring adjustment of the financial statements or additional disclosures.
The following is a summary of significant accounting policies consistently followed by the Fund in the preparation of its financial statements.
Security Valuation
Debt securities generally are valued by pricing services approved by the Trust’s Board of Trustees, based upon market transactions for normal, institutional-size trading units of similar securities. The services may use various pricing techniques which take into account appropriate factors such as yield, quality, coupon rate, maturity, type of issue, trading characteristics and other data, as well as broker quotes. Debt securities for which quotations are readily available are valued at an over-the-counter or exchange bid quotation.
Certain debt securities, which tend to be more thinly traded and of lesser quality, are priced based on fundamental analysis of the financial condition of the issuer and the estimated value of any collateral. Valuations developed through pricing techniques may vary from the actual amounts realized upon sale of the securities, and the potential variation may be greater for those securities valued using fundamental analysis.
Short-term investments maturing in 60 days or less are valued at amortized cost, which approximates market value.
Futures contracts are valued at the settlement price established each day by the board of trade or exchange on which they are traded.
Investments for which market quotations are not readily available, or that have quotations which management believes are not reliable, are valued at fair value as determined in good faith under consistently applied procedures established by and under the general supervision of the Board of Trustees. If a security is valued at fair value, such value is likely to be different from the last quoted market price for the security. The determination of fair value often requires significant judgment. To determine fair value,
27
Columbia Federal Securities Fund
August 31, 2009
management may use assumptions including but not limited to future cash flows and estimated risk premiums. Multiple inputs from various sources may be used to determine value.
Various inputs are used to determine the value of the Fund’s investments. Management establishes a hierarchy that prioritizes the inputs to valuation techniques used to measure fair value giving the highest priority to unadjusted quoted prices in active markets for identical securities (level 1 measurements) and the lowest priority to unobservable inputs (level 3 measurements) when market prices are not readily available or reliable. The three levels of the fair value hierarchy are described below:
| n | | Level 1 — quoted prices in active markets for identical securities |
| n | | Level 2 — prices determined using other significant observable inputs (including quoted prices for similar securities, interest rates, prepayment speeds, credit risk and others) |
| n | | Level 3 — prices determined using significant unobservable inputs. In situations where quoted prices or observable inputs are unavailable or less reliable, unobservable inputs may be used. Unobservable inputs may include management’s own assumptions about the factors market participants would use in pricing an investment. |
The inputs or methodology used for valuing securities are not necessarily an indication of the risk associated with investing in those securities.
Security Transactions
Security transactions are accounted for on the trade date. Cost is determined and gains (losses) are based upon the specific identification method for both financial statement and federal income tax purposes.
Management is required to provide disclosures regarding the Fund’s derivative instruments and hedging activities, by providing for qualitative disclosures about the objectives and strategies for using derivatives, quantitative data about the fair value of and gains and losses on derivative contracts, and details of credit-risk-related contingent features in their derivative contracts. For additional information on derivative instruments, please see Note 6.
Repurchase Agreements
The Fund may engage in repurchase agreement transactions with institutions that Columbia has determined are creditworthy. The Fund, through its custodian, receives delivery of the underlying securities collateralizing a repurchase agreement. Columbia is responsible for determining that the collateral is at least equal, at all times, to the value of the repurchase obligation including interest. A repurchase agreement transaction involves certain risks in the event of default or insolvency of the counterparty. These risks include possible delays in or restrictions on the Fund’s ability to dispose of the underlying securities and a possible decline in the value of the underlying securities during the period while the Fund seeks to assert its rights.
Mortgage Dollar Roll Transactions
The Fund may enter into mortgage “dollar rolls” in which the Fund sells securities for delivery in the current month and simultaneously contracts with the same counterparty to repurchase similar (same type, coupon and maturity) but not identical securities on a specified future date not exceeding 120 days. During the roll period, the Fund loses the right to receive principal and interest paid on the securities sold. However, the Fund would benefit to the extent of any difference between the price received for the securities sold and the lower forward price for the future purchase (often referred to as the “drop”) or fee income plus the interest earned on the cash proceeds of the securities sold until the settlement date of the forward purchase. Unless such benefits exceed the income, capital appreciation and gain or loss due to mortgage prepayments that would have been realized on the securities sold as part of the mortgage dollar roll, the use of this technique will diminish the investment performance of the Fund compared with what such performance would have been without the use of mortgage dollar rolls. All cash proceeds will be invested in instruments that are permissible investments for the Fund. The Fund will hold and maintain in a segregated account until the settlement date, cash or liquid securities in an amount equal to the forward purchase price.
The Fund’s policy is to record the components of mortgage dollar rolls using “to be announced” mortgage-backed securities. For financial reporting and tax purposes, the Fund treats mortgage dollar rolls as two separate transactions, one involving the purchase of a security and a separate transaction involving a sale. The Fund does not currently
28
Columbia Federal Securities Fund
August 31, 2009
enter into mortgage dollar rolls that are accounted for as financing transactions.
Mortgage dollar rolls involve certain risks. If the broker-dealer to whom the Fund sells the securities becomes insolvent, the Fund’s right to purchase or repurchase the mortgage-related securities may be restricted and the instruments which the Fund is required to repurchase may be worth less than instruments which the Fund originally held. Successful use of mortgage dollar rolls may depend upon the investment advisor’s ability to predict correctly interest rates and mortgage prepayments. For these reasons, there is no assurance that mortgage dollar rolls can be successfully employed.
Delayed Delivery Securities
The Fund may trade securities on other than normal settlement terms, including securities purchased or sold on a “when-issued” basis. This may increase the risk if the other party to the transaction fails to deliver and causes the Fund to subsequently invest at less advantageous prices. The Fund holds until the settlement date, in a segregated account, cash or liquid securities in an amount equal to the delayed delivery commitment.
Income Recognition
Interest income is recorded on an accrual basis and includes accretion of discounts, amortization of premiums and paydown gains and losses. Fee income attributable to mortgage dollar roll transactions is recorded on the accrual basis over the term of the transaction. The value of additional securities received as an income payment is recorded as income and as the cost basis of such securities.
Expenses
General expenses of the Trust are allocated to the Fund and other series of the Trust based upon relative net assets or other expense allocation methodologies determined by the nature of the expense. Expenses directly attributable to the Fund are charged to the Fund.
Determination of Class Net Asset Value
All income, expenses (other than class-specific expenses, as shown on the Statement of Operations) and realized and unrealized gains (losses) are allocated to each class of the Fund on a daily basis for purposes of determining the net asset value of each class. Income and expenses are allocated to each class based on the settled shares method, while realized and unrealized gains (losses) are allocated based on the relative net assets of each class.
Federal Income Tax Status
The Fund intends to qualify each year as a “regulated investment company” under Subchapter M of the Internal Revenue Code, as amended, and will distribute substantially all of its tax exempt or taxable income, if any, for its tax year, and as such will not be subject to federal income taxes. In addition, the Fund intends to distribute in each calendar year substantially all of its net investment income, capital gains and certain other amounts, if any, such that the Fund should not be subject to federal excise tax. Therefore, no federal income or excise tax provision is recorded.
Distributions to Shareholders
Distributions from net investment income are declared daily and paid monthly. Net realized capital gains, if any, are distributed at least annually. Income distributions and capital gain distributions are determined in accordance with federal income tax regulations which may differ from GAAP.
Indemnification
In the normal course of business, the Fund enters into contracts that contain a variety of representations and warranties and which provide general indemnities. The Fund’s maximum exposure under these arrangements is unknown because this would involve future claims against the Fund. Also, under the Trust’s organizational documents and by contract, the Trustees and officers of the Trust are indemnified against certain liabilities that may arise out of actions relating to their duties to the Trust. However, based on experience, the Fund expects the risk of loss due to these representations, warranties and indemnities to be minimal.
Note 3. Federal Tax Information
The timing and character of income and capital gain distributions are determined in accordance with income tax regulations, which may differ from GAAP. Reclassifications are made to the Fund’s capital accounts for permanent tax differences to reflect income and gains available for distribution (or available capital loss carryforwards) under income tax regulations.
29
Columbia Federal Securities Fund
August 31, 2009
For the year ended August 31, 2009, permanent book and tax basis differences resulting primarily from differing treatments for amortization/accretion adjustments, paydown reclassifications, proceeds from litigation settlements and expired capital loss carryforwards were identified and reclassified among the components of the Fund’s net assets as follows:
| | | | |
| | | | | |
Overdistributed
Net Investment
Income | | Accumulated
Net Realized
Loss | | Paid-In Capital |
| $1,991,107 | | $16,094,573 | | $(18,085,680) |
Net investment income and net realized gains (losses), as disclosed on the Statement of Operations, and net assets were not affected by this reclassification.
The tax character of distributions paid during the years ended August 31, 2009 and August 31, 2008 was as follows:
| | | | | | |
| | | August 31,
2009 | | August 31,
2008 |
Ordinary Income* | | $ | 23,248,541 | | $ | 30,632,701 |
Long-Term Capital Gains | | | — | | | — |
| * | For tax purposes short-term capital gains distributions, if any, are considered ordinary income distributions. |
As of August 31, 2009, the components of distributable earnings on a tax basis were as follows:
| | | | |
| | | | | |
Undistributed
Ordinary Income | | Undistributed
Long-Term
Capital Gains | | Net Unrealized
Depreciation* |
| $— | | $— | | $9,514,064 |
Unrealized appreciation and depreciation at August 31, 2009, based on cost of investments for federal income tax purposes were:
| | | | |
| | | | |
Unrealized appreciation | | $ | 12,936,589 | |
Unrealized depreciation | | | (3,422,525 | ) |
| | | | |
Net unrealized appreciation | | $ | 9,514,064 | |
The following capital loss carryforwards may be available to reduce taxable income arising from future net realized gains on investments, if any, to the extent permitted by the Internal Revenue Code:
| | | |
| | | |
| Year of Expiration | | Capital Loss Carryforwards |
2012 | | $ | 24,359 |
2014 | | | 10,286,822 |
2015 | | | 7,609,058 |
| | | |
Total | | $ | 17,920,239 |
Capital loss carryforwards of $29,849,094 expired during the year ended August 31, 2009. Any capital loss carryforwards acquired as part of a merger that are permanently lost due to provisions under the Internal Revenue Code are included as being expired. Expired capital loss carryforwards are recorded as a reduction of paid-in capital.
Of the capital loss carryforwards attributable to the Fund, $24,359 (expiring on 08/31/12) remains from Nations Government Securities Fund’s merger with the Fund.
Under current tax rules, certain currency (and capital) losses realized after October 31 may be deferred and treated as occurring on the first day of the following fiscal year. As of August 31, 2009, post-October capital losses of $6,070,597 attributed to security transactions were deferred to September 1, 2009.
Management is required to determine whether a tax position of the Fund is more likely than not to be sustained upon examination by the applicable taxing authority, including resolution of any related appeals or litigation processes, based on the technical merits of the position. The tax benefit to be recognized by the Fund is measured as the largest amount of benefit that is greater than fifty percent likely of being realized upon ultimate settlement. Management is not aware of any tax positions for which it is reasonably possible that the total amounts of unrecognized tax benefits will significantly change in the next twelve months. However, management’s conclusions may be subject to review and adjustment at a later date based on factors including, but not limited to, new tax laws, regulations, and administrative interpretations (including relevant court decisions). The Fund’s federal tax returns for the prior three fiscal years remain subject to examination by the Internal Revenue Service.
30
Columbia Federal Securities Fund
August 31, 2009
Note 4. Fees and Compensation Paid to Affiliates
Investment Advisory Fee
Columbia, an indirect, wholly owned subsidiary of Bank of America Corporation (“BOA”), provides investment advisory, administrative and other services to the Fund. In rendering investment advisory services to the Fund, Columbia may use the portfolio management and research resources of Columbia Management Pte. Ltd, an affiliate of Columbia. Columbia receives a monthly investment advisory fee based on the Fund’s average daily net assets at the following annual rates:
| | | |
| | | | |
| Average Daily Net Assets | | Annual Fee Rate | |
First $500 million | | 0.53 | % |
$500 million to $1 billion | | 0.48 | % |
$1 billion to $1.5 billion | | 0.45 | % |
$1.5 billion to $3 billion | | 0.42 | % |
$3 billion to $6 billion | | 0.41 | % |
Over $6 billion | | 0.40 | % |
For the year ended August 31, 2009, the Fund’s effective investment advisory fee rate was 0.52% of the Fund’s average daily net assets.
Pricing and Bookkeeping Fees
The Fund has entered into a Financial Reporting Services Agreement (the “Financial Reporting Services Agreement”) with State Street Bank & Trust Company (“State Street”) and Columbia pursuant to which State Street provides financial reporting services to the Fund. The Fund has also entered into an Accounting Services Agreement (collectively with the Financial Reporting Services Agreement, the “State Street Agreements”) with State Street and Columbia pursuant to which State Street provides accounting services to the Fund. Under the State Street Agreements, the Fund pays State Street an annual fee of $38,000 paid monthly plus an additional monthly fee based on an annualized percentage rate of average daily net assets of the Fund for the month. The aggregate fee will not exceed $140,000 per year (exclusive of out-of-pocket expenses and charges). The Fund also reimburses State Street for certain out-of-pocket expenses and charges.
The Fund has entered into a Pricing and Bookkeeping Oversight and Services Agreement (the “Services Agreement”) with Columbia. Under the Services Agreement, Columbia provides services related to Fund expenses and the requirements of the Sarbanes-Oxley Act of 2002, and provides oversight of the accounting and financial reporting services provided by State Street. Under the Services Agreement, the Fund reimburses Columbia for out-of-pocket expenses.
Transfer Agent Fee
Columbia Management Services, Inc. (the “Transfer Agent”), an affiliate of Columbia and an indirect, wholly owned subsidiary of BOA, provides shareholder services to the Fund and has contracted with Boston Financial Data Services (“BFDS”) to serve as sub-transfer agent. The Transfer Agent is entitled to receive a fee for its services, paid monthly, at the annual rate of $17.34 per open account plus reimbursement of certain sub-transfer agent fees paid by the Transfer Agent (exclusive of BFDS fees), calculated based on assets held in omnibus accounts and intended to recover the cost of payments to other parties (including affiliates of BOA) for services to those accounts. The Transfer Agent pays the fees of BFDS for services as sub-transfer agent and is not entitled to reimbursement for such fees from the Fund.
The Transfer Agent may also retain, as additional compensation for its services, fees for wire, telephone and redemption orders, Individual Retirement Account (“IRA”) trustee agent fees and account transcript fees due to the Transfer Agent from shareholders of the Fund and credits (net of bank charges) earned with respect to balances in accounts the Transfer Agent maintains in connection with its services to the Fund. The Transfer Agent also receives reimbursement for certain out-of-pocket expenses.
An annual minimum account balance fee of $20 may apply to certain accounts with a value below the Fund’s initial minimum investment requirements to reduce the impact of small accounts on transfer agent fees. These minimum account balance fees are recorded as part of expense reductions on the Statement of Operations. For the year ended August 31, 2009, no minimum account balance fees were charged by the Fund.
31
Columbia Federal Securities Fund
August 31, 2009
Underwriting Discounts, Service and Distribution Fees
Columbia Management Distributors, Inc. (the “Distributor”), an affiliate of Columbia and an indirect, wholly owned subsidiary of BOA, is the principal underwriter of the Fund’s shares. For the year ended August 31, 2009, the Distributor has retained net underwriting discounts of $23,576 on sales of the Fund’s Class A shares and received net CDSC fees of $6,042, $44,909 and $5,057 on Class A, Class B and Class C share redemptions, respectively.
The Fund has adopted plans pursuant to Rule 12b-1 under the 1940 Act (the “Plans”) which require the payment of a monthly service fee to the Distributor at the maximum annual rate of 0.25% of the average daily net assets attributable to Class A, Class B and Class C shares of the Fund. The Plans also require the payment of a monthly distribution fee to the Distributor at the maximum annual rate of 0.75% of the average daily net assets attributable to Class B and Class C shares. The Distributor has voluntarily agreed to waive a portion of the distribution fee for Class C shares so that it will not exceed 0.60% annually of the average daily net assets attributable to the Class C shares. This agreement may be modified or terminated by the Distributor at any time.
The CDSC and the distribution fees received from the Plans are used principally as repayment to the Distributor for amounts paid by the Distributor to dealers who sold such shares.
Expense Limits and Fee Waivers
Effective January 1, 2009, Columbia has voluntarily agreed to reimburse a portion of the Fund’s expenses so that the Fund’s ordinary operating expenses (excluding any distribution and service fees, brokerage commissions, interest, taxes and extraordinary expenses, but including custodian charges relating to overdrafts, if any), after giving effect to any balance credits from the Fund’s custodian, do not exceed 0.70% annually of the Fund’s average daily net assets. Columbia, in its discretion, may revise or discontinue this arrangement at any time.
Fees Paid to Officers and Trustees
All officers of the Fund are employees of Columbia or its affiliates and, with the exception of the Fund’s Chief Compliance Officer, receive no compensation from the Fund. The Board of Trustees has appointed a Chief Compliance Officer to the Fund in accordance with federal securities regulations. The Fund, along with other affiliated funds, pays its pro-rata share of the expenses associated with the Chief Compliance Officer. The Fund’s expenses for the Chief Compliance Officer will not exceed $15,000 per year.
The Trust’s eligible Trustees may participate in a deferred compensation plan which may be terminated at any time. Obligations of the plan will be paid solely out of the Fund’s assets.
As a result of a fund merger, the Fund assumed the liabilities of the deferred compensation plan of the acquired fund, which are included in “Trustees’ fee” on the Statement of Assets and Liabilities. The deferred compensation plan may be terminated at any time. Any payments to plan participants are paid solely out of the Fund’s assets.
Note 5. Custody Credits
The Fund has an agreement with its custodian bank under which custody fees may be reduced by balance credits. These credits are recorded as part of expense reductions on the Statement of Operations. The Fund could have invested a portion of the assets utilized in connection with the expense offset arrangement in an income-producing asset if it had not entered into such an agreement.
For the year ended August 31, 2009, these custody credits reduced total expenses by $4 for the Fund.
Note 6. Objectives and Strategies for Investing in Derivatives Instruments
The Fund uses derivative instruments including futures contracts in order to meet its objectives. The Fund employs strategies in differing combinations to permit it to increase, decrease or change the level of exposure to market risk factors. The achievement of any strategy relating to derivatives depends on analysis of various risk factors, and if the strategies for investment do not work as intended, the Fund may not achieve its objectives.
In pursuit of its investment objectives, the Fund is exposed to the following market risks:
Interest Rate Risk: Interest rate risk refers to the fluctuation in value of fixed income securities because of the inverse relationship of price and yield. Fixed income securities will
32
Columbia Federal Securities Fund
August 31, 2009
decline in value because of an increase in general interest rate and their value will increase because of a decline in general interest rate. Fixed income securities with longer durations tend to be more sensitive to changes in interest rates, usually making them more volatile than securities with shorter durations.
The following notes provide more detailed information about each derivative type held by the Fund:
Futures Contracts – The Fund entered into stock index futures contracts to manage its exposure to the securities markets and/or to movements in interest rates.
The use of futures contracts involves certain risks, which include: (1) imperfect correlation between the price movement of the instruments and the underlying securities, (2) inability to close out positions due to differing trading hours, or the temporary absence of a liquid market, for either the instruments or the underlying securities, or (3) an inaccurate prediction of the future direction of interest rates by Columbia. Upon entering into a futures contract, the Fund pledges cash or securities with the broker in an amount sufficient to meet the initial margin requirement. Subsequent payments are made or received by the Fund equal to the daily change in the contract value and are recorded as variation margin receivable or payable and offset in unrealized gains or losses. The Fund recognizes a realized gain or loss when the contract is closed or expires.
Futures contracts involve, to varying degrees, risk of loss in excess of the variation margin disclosed on the Fund’s Statement of Assets and Liabilities.
The Effect of Derivative Instruments on the Statement of Operations for the Year Ended August 31, 2009:
| | | | | | |
| | | Amount of Realized Gain or (Loss) and Change in
Unrealized Appreciation or (Depreciation)
on Derivatives Recognized in Income |
| | | Risk
Exposure | | Net
Realized Gain
(Loss) | | Change in Unrealized Appreciation (Depreciation) |
| Futures Contracts | | Interest Rate
Risk | | (1,433,501) | | (132,953) |
Note 7. Portfolio Information
For the year ended August 31, 2009, the cost of purchases and proceeds from sales of securities, excluding short-term obligations, for the Fund were $1,547,514,468 and $1,637,432,753, respectively, of which $1,359,936,986 and $2,075,324,942, respectively, were U.S. Government securities.
Note 8. Regulatory Settlements
As of August 31, 2009, the Fund had received payments of $69,270 relating to certain regulatory settlements with third parties that the Fund had participated in during the year. The payments have been included in “Increase from regulatory settlements” on the Statement of Changes in Net Assets.
Note 9. Line of Credit
The Fund and other affiliated funds participate in a $280,000,000 committed, unsecured revolving line of credit provided by State Street. The maximum amount that may be borrowed by any fund is limited to the lesser of $200,000,000 and the Fund’s borrowing limit set forth in the Fund’s registration statement. Borrowings are available for short-term liquidity or temporary or emergency purposes.
Interest is charged to each participating fund based on the fund’s borrowings at a rate per annum equal to the greater of the Federal Funds Rate plus 0.50% or the overnight LIBOR Rate plus 0.50%. In addition, an annual operations agency fee of $20,000, an amendment fee of 0.02% and a commitment fee of 0.12% per annum are accrued and apportioned among the participating funds pro rata based on their relative net assets. Prior to October 16, 2008, the Fund and other affiliated funds participated in a $350,000,000 committed, unsecured revolving line of credit and a $150,000,000 uncommitted, unsecured line of credit, both provided by State Street. Interest on the committed line of credit was charged to each participating fund based on the fund’s borrowings at a rate per annum equal to the Federal Funds Rate plus 0.50%. In addition, a commitment fee of 0.10% per annum was accrued and apportioned among the participating funds pro rata based on their relative net assets. Interest on the uncommitted line of credit was charged to each participating fund based on the fund’s borrowings at a rate per annum equal to the Federal Funds Rate plus 0.375%. State Street charged an annual operations agency fee of $40,000 for the committed line of credit and was able to charge an annual administration fee of $15,000 for the uncommitted line of
33
Columbia Federal Securities Fund
August 31, 2009
credit. The commitment fee, the operations agency fee and the administration fee were accrued and apportioned among the participating funds pro rata based on their relative net assets.
For the year ended August 31, 2009, the average daily loan balance outstanding on days where borrowing existed was $3,416,667 at a weighted average interest rate of 0.76%
Note 10. Securities Lending
The Fund may lend its securities to certain approved brokers, dealers and other financial institutions. Each loan is collateralized by cash, in an amount at least equal to the market value of the securities loaned plus accrued income from the investment of collateral. The market value of the loaned securities is determined at the close of business of the Fund and any additional required collateral is delivered to the Fund on the next business day. The collateral received is invested and the income generated by the investment of the collateral, net of any fees remitted to State Street as the lending agent and borrower rebates, is paid to the Fund. Generally, in the event of borrower default, the Fund has the right to use the collateral to offset any losses incurred. In the event the Fund is delayed or prevented from exercising its right to dispose of the collateral, there may be a potential loss to the Fund. The Fund bears the risk of loss with respect to the investment of collateral.
Note 11. Shares of Beneficial Interest
As of August 31, 2009, 10.6% of the Fund’s shares outstanding were beneficially owned by one participant account over which BOA and/or any of its affiliates had either sole or joint investment discretion.
Subscription and redemption activity of this account may have a significant effect on the operations of the Fund.
Note 12. Significant Risks and Contingencies
Asset-Backed Securities Risk
The value of asset-backed securities may be affected by, among other factors, changes in interest rates, the market’s assessment of the quality of underlying assets, the creditworthiness of the servicer for the underlying assets, factors concerning the interests in and structure of the issuer or the originator of the underlying assets, or the creditworthiness or rating of the entities that provide any supporting letters of credit, surety bonds, derivative instruments, or other credit enhancement. The value of asset-backed securities also will be affected by the exhaustion, termination or expiration of any credit enhancement. Most asset-backed securities are subject to prepayment risk, which is the possibility that the underlying debt may be refinanced or prepaid prior to maturity during periods of declining or low interest rates, causing the Fund to have to reinvest the money received in securities that have lower yields. In addition, the impact of prepayments on the value of asset-backed securities may be difficult to predict and may result in greater volatility.
Mortgage-Backed Securities Risk
The value of mortgage-backed securities may be affected by, among other things, changes in interest rates, factors concerning the interests in and structure of the issuer or the originator of the mortgages, the creditworthiness of the entities that provide any supporting letters of credit, surety bonds or other credit enhancements or the quality of underlying assets or the market’s assessment thereof. Mortgage-backed securities are subject to prepayment risk, which is the possibility that the underlying mortgage may be refinanced or prepaid prior to maturity during periods of declining or low interest rates, causing the Funds to have to reinvest the money received in securities that have lower yields. In addition, the impact of prepayments on the value of mortgage-backed securities may be difficult to predict and may result in greater volatility.
Legal Proceedings
Columbia Management Advisors, LLC and Columbia Management Distributors, Inc. (collectively, the “Columbia Group”) are subject to a settlement agreement with the New York Attorney General (“NYAG”) (the “NYAG Settlement”) and a settlement order with the SEC (the “SEC Order”) on matters relating to mutual fund trading, each dated February 9, 2005. Under the terms of the SEC Order, the Columbia Group (or predecessor entities) agreed, among other things, to: pay disgorgement and civil money penalties collectively totaling $140 million; cease and desist from violations of the antifraud provisions and certain other provisions of the federal securities laws; maintain certain compliance and ethics oversight structures; and retain an independent consultant to review the Columbia Group’s applicable supervisory, compliance, control and other policies
34
Columbia Federal Securities Fund
August 31, 2009
and procedures. The NYAG Settlement, among other things, requires Columbia Management Advisors, LLC and its affiliates to reduce management fees for certain funds in the Columbia family of mutual funds in a projected total of $160 million over five years through November 30, 2009 and to make certain disclosures to investors relating to expenses. In connection with the Columbia Group providing services to the Columbia Funds, the Columbia Funds have voluntarily undertaken to implement certain governance measures designed to maintain the independence of their boards of trustees and certain special consulting and compliance measures.
Pursuant to the SEC Order and related procedures, the $140 million in settlement amounts described above has been substantially distributed in accordance with a distribution plan that was developed by an independent distribution consultant and approved by the SEC on April 6, 2007.
In connection with the events described above, various parties have filed suit against certain funds, the Trustees of the Columbia Funds, FleetBoston Financial Corporation and its affiliated entities and/or Bank of America and its affiliated entities.
On February 20, 2004, the Judicial Panel on Multidistrict Litigation transferred these cases and cases against other mutual fund companies based on similar allegations to the United States District Court in Maryland for consolidated or coordinated pretrial proceedings (the “MDL”). Subsequently, additional related cases were transferred to the MDL. On September 29, 2004, the plaintiffs in the MDL filed amended and consolidated complaints. One of these amended complaints is a putative class action that includes claims under the federal securities laws and state common law, and that names Columbia Management Advisors, Inc. (which has since merged into Banc of America Capital Management, LLC (now named Columbia Management Advisors, LLC)) (“Columbia”), Columbia Funds Distributor, Inc. (now named Columbia Management Distributors, Inc.) (the “Distributor”), the Trustees of the Columbia Funds, Bank of America Corporation and others as defendants. Another of the amended complaints is a derivative action purportedly on behalf of the Columbia Funds that asserts claims under federal securities laws and state common law.
On February 25, 2005, Columbia and other defendants filed motions to dismiss the claims in the pending cases. On March 1, 2006, for reasons stated in the court’s memoranda dated November 3, 2005, the United States District Court for the District of Maryland granted in part and denied in part the defendants’ motions to dismiss. The court dismissed all of the class action claims pending against the Columbia Funds Trusts. As to Columbia and the Distributor, the claims under the Securities Act of 1933, the claims under Sections 34(b) and 36(a) of the Investment Company Act of 1940 (“ICA”) and the state law claims were dismissed. The claims under Sections 10(b) and 20(a) of the Securities Exchange Act of 1934 and claims under Section 36(b) of the ICA were not dismissed.
On March 21, 2005, a purported class action was filed in Massachusetts state court alleging that certain conduct, including market timing, entitled Class B shareholders in certain Columbia Funds to an exemption from contingent deferred sales charges upon early redemption (the “CDSC Lawsuit”). The CDSC Lawsuit was removed to federal court in Massachusetts and transferred to the MDL.
On September 14, 2007, the plaintiffs and the Columbia defendants named in the MDL, including the Columbia Funds, entered into a stipulation of settlement with respect to all Columbia-related claims in the MDL described above, including the CDSC Lawsuit. The settlement is subject to court approval.
Note 13. Subsequent Events
Bank of America Corporation, the indirect parent company of Columbia, entered into an agreement dated September 29, 2009 to sell a portion of the asset management business of Columbia Management Group, LLC to Ameriprise Financial, Inc. The transaction (“Transaction”) includes a sale of the part of the asset management business that advises long-term mutual funds, including the Fund. The Transaction is subject to certain approvals and other conditions to closing, and is currently expected to close in the spring of 2010.
On October 15, 2009, the committed line of credit discussed in Note 9 was renewed on amended terms. Pursuant to the amended terms, interest is charged to each participating fund based on the fund’s borrowings at a rate per annum equal to the greater of the Federal Funds Rate plus 1.25% or the overnight LIBOR Rate plus 1.25%. In addition, a commitment fee of 0.15% per annum is accrued and apportioned among the participating funds pro rata based on their relative net assets. The annual operations agency fee of $20,000 was waived.
35
Report of Independent Registered Public Accounting Firm
To the Trustees of Columbia Funds Series Trust I and the Shareholders of Columbia Federal Securities Fund
In our opinion, the accompanying statement of assets and liabilities, including the investment portfolio, and the related statements of operations and of changes in net assets and the financial highlights present fairly, in all material respects, the financial position of Columbia Federal Securities Fund (the “Fund”) (a series of Columbia Funds Series Trust I) at August 31, 2009, the results of its operations for the year then ended, and the changes in its net assets for each of the two years in the period then ended and the financial highlights for each of the five years in the period then ended, in conformity with accounting principles generally accepted in the United States of America. These financial statements and financial highlights (hereafter referred to as “financial statements”) are the responsibility of the Fund’s management. Our responsibility is to express an opinion on these financial statements based on our audits. We conducted our audits of these financial statements in accordance with the standards of the Public Company Accounting Oversight Board (United States). Those standards require that we plan and perform the audit to obtain reasonable assurance about whether the financial statements are free of material misstatement. An audit includes examining, on a test basis, evidence supporting the amounts and disclosures in the financial statements, assessing the accounting principles used and significant estimates made by management, and evaluating the overall financial statement presentation. We believe that our audits, which included confirmation of securities at August 31, 2009 by correspondence with the custodian and brokers, provide a reasonable basis for our opinion.
PricewaterhouseCoopers LLP
Boston, Massachusetts
October 22, 2009
36
Fund Governance
The Trustees serve terms of indefinite duration. The names, addresses and ages of the Trustees and officers of the Funds in the Columbia Funds Series Trust I, the year each was first elected or appointed to office, their principal business occupations during at least the last five years, the number of Funds overseen by each Trustee and other directorships they hold are shown below. Each officer listed below serves as an officer of each Fund in the Columbia Funds Complex.
Independent Trustees
| | |
Name, Address and Year of Birth,
Position with Funds, Year First
Elected or Appointed to Office | | Principal Occupation(s) During Past Five Years, Number of Funds in the Columbia
Funds Complex Overseen by Trustee, Other Directorships Held |
| |
| John D. Collins (Born 1938) | | |
c/o Columbia Management Advisors, LLC One Financial Center Boston, MA 02111 Trustee (since 2007) | | Retired. Consultant, KPMG, LLP (accounting and tax firm) from July 1999 to June 2000; Partner, KPMG, LLP from March 1962 to June 1999. Oversees 66; Mrs. Fields Famous Brands LLC (consumer products); Suburban Propane Partners, L.P.; and Montpelier Re (underwriting firm) |
| |
| Rodman L. Drake (Born 1943) | | |
c/o Columbia Management Advisors, LLC One Financial Center Boston, MA 02111 Trustee (since 2007)
and Chairman of the Board
(since 2009) | | Co-Founder of Baringo Capital LLC (private equity) since 2002; President, Continuation Investments Group, Inc. from 1997 to 2001. Oversees 66; Jackson Hewitt Tax Service Inc. (tax preparation services); Crystal Capital River Inc. (real estate investment trust); Student Loan Corporation (student loan provider); Celgene Corporation (global biotechnology company); Apex Silver Mines Ltd. (mining); and Helios Total Return Fund, Inc. and Helios Strategic Mortgage Income Fund, Inc. (exchange-traded funds) |
| |
| Douglas A. Hacker (Born 1955) | | |
c/o Columbia Management Advisors, LLC One Financial Center Boston, MA 02111 Trustee (since 1996) | | Independent business executive since May 2006; Executive Vice President–Strategy of United Airlines (airline) from December 2002 to May 2006; President of UAL Loyalty Services (airline marketing company) from September 2001 to December 2002; Executive Vice President and Chief Financial Officer of United Airlines from July 1999 to September 2001. Oversees 66; Nash Finch Company (food distributor); Aircastle Limited (aircraft leasing) |
|
| Janet Langford Kelly (Born 1957) |
c/o Columbia Management Advisors, LLC One Financial Center Boston, MA 02111 Trustee (since 1996) | | Senior Vice President, General Counsel and Corporate Secretary, ConocoPhillips (integrated energy company) since September 2007; Deputy General Counsel–Corporate Legal Services, ConocoPhillips from August 2006 to August 2007; Partner, Zelle, Hofmann, Voelbel, Mason & Gette LLP (law firm) from March 2005 to July 2006; Adjunct Professor of Law, Northwestern University, from September 2004 to June 2006; Director, UAL Corporation (airline) from February 2006 to July 2006; Oversees 66; None |
| |
| Charles R. Nelson (Born 1942) | | |
c/o Columbia Management Advisors, LLC One Financial Center Boston, MA 02111 Trustee (since 1981) | | Professor of Economics, University of Washington, since January 1976; Ford and Louisa Van Voorhis Professor of Political Economy, University of Washington, since September 1993; Adjunct Professor of Statistics, University of Washington, since September 1980; Associate Editor, Journal of Money Credit and Banking from 1993 to 2008; Consultant on econometric and statistical matters. Oversees 66; None |
37
Fund Governance (continued)
Independent Trustees (continued)
| | |
Name, Address and Year of Birth,
Position with Funds, Year First
Elected or Appointed to Office | | Principal Occupation(s) During Past Five Years, Number of Funds in the Columbia
Funds Complex Overseen by Trustee, Other Directorships Held |
| |
| John J. Neuhauser (Born 1943) | | |
c/o Columbia Management Advisors, LLC One Financial Center Boston, MA 02111 Trustee (since 1985) | | President, Saint Michael’s College, since August 2007; University Professor, Boston College from November 2005 to August 2007; Academic Vice President and Dean of Faculties, Boston College from August 1999 to October 2005. Oversees 66; Liberty All-Star Equity Fund and Liberty All-Star Growth Fund, Inc. (closed-end funds) |
| |
| Jonathan Piel (Born 1938) | | |
c/o Columbia Management Advisors, LLC One Financial Center Boston, MA 02111 Trustee (since 2007) | | Cable television producer and website designer; The Editor, Scientific American from 1984 to 1994; Vice President, Scientific American, Inc., from 1984 to 1994; Member, Advisory Board, Stone Age Institute, Bloomington, Indiana (research institute that explores the effect of technology on human evolution); Member, Board of Directors of the National Institute of Social Sciences, New York City; Member, Board of Trustees of the William Alanson White Institute, New York City (institution for training psychoanalysts); and Member, Advisory Board, Mount Sinai Children’s Environmental Health Center, New York. Oversees 66; None |
| |
| Patrick J. Simpson (Born 1944) | | |
c/o Columbia Management Advisors, LLC One Financial Center Boston, MA 02111 Trustee (since 2000) | | Partner, Perkins Coie LLP (law firm). Oversees 66; None |
|
| Thomas C. Theobald (Born 1937) |
c/o Columbia Management Advisors, LLC One Financial Center Boston, MA 02111 Trustee (since 1996) | | Partner and Senior Advisor, Chicago Growth Partners (private equity investing) since September 2004; Managing Director, William Blair Capital Partners (private equity investing) from September 1994 to September 2004. Oversees 66; Anixter International (network support equipment distributor); Ventas, Inc. (real estate investment trust); Jones Lang LaSalle (real estate management services); Ambac Financial Group (financial guaranty insurance) |
| |
| Anne-Lee Verville (Born 1945) | | |
c/o Columbia Management Advisors, LLC One Financial Center Boston, MA 02111 Trustee (since 1998) | | Retired since 1997 (formerly General Manager–Global Education Industry (from 1994 to 1997), President–Application Systems Division (from 1991 to 1994), Chief Financial Officer–US Marketing & Services (from 1988 to 1991), and Chief Information Officer (from 1987 to 1988), IBM Corporation (computer and technology)). Oversees 66; None |
Interested Trustee
| | |
| |
| William E. Mayer1 (Born 1940) | | |
c/o Columbia Management Advisors, LLC One Financial Center Boston, MA 02111 Trustee (since 1994) | | Partner, Park Avenue Equity Partners (private equity) since February 1999; Dean and Professor, College of Business, University of Maryland from 1992 to 1997. Oversees 66; Lee Enterprises (print media); WR Hambrecht + Co. (financial service provider); BlackRock Kelso Capital Corporation (investment company) |
| 1 | The Funds currently treat Mr. Mayer as an “interested person” (as defined in the Investment Company Act of 1940) by reason of his affiliation with WR Hambrecht + Co., a registered broker/dealer that may execute portfolio transactions for or engage in principal transactions with the Funds or other funds or accounts advised/managed by the Advisor or other Bank of America affiliates. |
The Statement of Additional Information includes additional information about the Trustees of the Funds and is available, without charge, upon request by calling 1-800-345-6611.
38
Fund Governance (continued)
Officers
| | |
Name, Address and Year of Birth,
Position with Funds, Year First
Elected or Appointed to Office | | Principal Occupation(s) During Past Five Years |
|
| J. Kevin Connaughton (Born 1964) |
One Financial Center Boston, MA 02111 President (since 2009) | | Managing Director of Columbia Management Advisors, LLC since December 2004; Senior Vice President and Chief Financial Officer–Columbia Funds, from June 2008 to January 2009; Treasurer–Columbia Funds, from October 2003 to May 2008; Treasurer–the Liberty Funds, Stein Roe Funds and Liberty All-Star Funds, December 2000–December 2006; Senior Vice President–Columbia Management Advisors, LLC, from April 2003 to December 2004; President–Columbia Funds, Liberty Funds and Stein Roe Funds, February 2004 to October 2004; Treasurer–Galaxy Funds, September 2002 to December 2005; Treasurer, December 2002 to December 2004, and President, February 2004 to December 2004–Columbia Management Multi-Strategy Hedge Fund, LLC; and a senior officer of various other Bank of America-affiliated entities, including other registered and unregistered funds. |
|
| James R. Bordewick, Jr. (Born 1959) |
One Financial Center Boston, MA 02111 Senior Vice President, Secretary and Chief Legal Officer (since 2006) | | Associate General Counsel, Bank of America since April 2005; Senior Vice President and Associate General Counsel, MFS Investment Management (investment management) prior to April 2005. |
| |
| Linda J. Wondrack (Born 1964) | | |
One Financial Center Boston, MA 02111 Senior Vice President and Chief Compliance Officer (since 2007) | | Director (Columbia Management Group LLC and Investment Product Group Compliance), Bank of America since June 2005; Director of Corporate Compliance and Conflicts Officer, MFS Investment Management (investment management), August 2004 to May 2005; Managing Director, Deutsche Asset Management (investment management) prior to August 2004. |
| |
| Michael G. Clarke (Born 1969) | | |
One Financial Center Boston, MA 02111 Senior Vice President and Chief Financial Officer (since 2009) | | Director of Fund Administration of the Advisor since January 2006; Managing Director of the Advisor September 2004 to December 2005; Vice President Fund Administration June 2002 to September 2004. |
| |
| Jeffrey R. Coleman (Born 1969) | | |
One Financial Center Boston, MA 02111 Deputy Treasurer (since 2006) | | Director of Fund Administration of the Advisor since January 2006; Fund Controller of the Advisor from October 2004 to January 2006; Vice President of CDC IXIS Asset Management Services, Inc. (investment management) from August 2000 to September 2004. |
| |
| Joseph F. DiMaria (Born 1968) | | |
One Financial Center Boston, MA 02111 Chief Accounting Officer and Treasurer (since 2009) | | Director of Fund Administration of the Advisor since January 2006; Head of Tax/Compliance and Assistant Treasurer of the Advisor from November 2004 to December 2005; Director of Trustee Administration (Sarbanes-Oxley) of the Advisor from May 2003 to October 2004. |
39
Fund Governance (continued)
Officers (continued)
| | |
Name, Address and Year of Birth,
Position with Funds, Year First
Elected or Appointed to Office | | Principal Occupation(s) During Past Five Years |
| |
| Julian Quero (Born 1967) | | |
One Financial Center Boston, MA 02111 Deputy Treasurer (since 2008) | | Senior Tax Manager of the Advisor since August 2006; Senior Compliance Manager of the Advisor from April 2002 to August 2006. |
| |
| Barry S. Vallan (Born 1969) | | |
One Financial Center Boston, MA 02111 Controller (since 2006) | | Vice President–Fund Treasury of the Advisor since October 2004; Vice President–Trustee Reporting of the Advisor from April 2002 to October 2004. |
| |
| Stephen T. Welsh (Born 1957) | | |
One Financial Center Boston, MA 02111 Vice President (since 1996) | | President, Columbia Management Services, Inc. since July 2004; Senior Vice President and Controller, Columbia Management Services, Inc. prior to July 2004. |
40
Important Information About This Report
Transfer Agent
Columbia Management Services, Inc.
P.O. Box 8081
Boston, MA 02266-8081
1-800-345-6611
Distributor
Columbia Management
Distributors, Inc.
One Financial Center
Boston, MA 02111
Investment Advisor
Columbia Management Advisors, LLC
100 Federal Street
Boston, MA 02110
The fund mails one shareholder report to each shareholder address. If you would like more than one report, please call shareholder services at 1-800-345-6611 and additional reports will be sent to you. This report has been prepared for shareholders of Columbia Federal Securities Fund.
A description of the policies and procedures that the fund uses to determine how to vote proxies and a copy of the fund’s voting records are available (i) at www.columbiamanagement.com; (ii) on the Securities and Exchange Commission’s website at www.sec.gov; and (iii) without charge, upon request, by calling 1-800-368-0346. Information regarding how the fund voted proxies relating to portfolio securities during the 12-month period ended June 30 is available from the SEC’s website. Information regarding how the fund voted proxies relating to portfolio securities is also available from the fund’s website.
The fund files a complete schedule of portfolio holdings with the SEC for the first and third quarters of each fiscal year on Form N-Q. The fund’s Form N-Q is available on the SEC’s website at www.sec.gov and may be reviewed and copied at the SEC’s Public Reference Room in Washington, D.C. Information on the operation of the Public Reference Room may be obtained by calling 1-800-SEC-0330.
Please read and consider the investment objectives, risks, charges and expenses for any fund carefully before investing. For a prospectus which contains this and other important information about the fund, contact your Columbia Management representative or financial advisor or go to www.columbiamanagement.com.
Columbia Management Group, LLC (“Columbia Management”) is the investment management division of Bank of America Corporation. Columbia Management entities furnish investment management services and products for institutional and individual investors. Columbia Funds are distributed by Columbia Management Distributors, Inc., member of FINRA, SIPC, part of Columbia Management and an affiliate of Bank of America Corporation.
41

One Financial Center
Boston, MA 02111-2621
Columbia Federal Securities Fund
Annual Report, August 31, 2009
©2009 Columbia Management Distributors, Inc.
One Financial Center, Boston, MA 02111-2621
800.345.6611 www.columbiafunds.com
SHC-42/23530-0809 (10/09) 09/90509

Annual Report
August 31, 2009
Columbia Greater China Fund
| | |
| NOT FDIC INSURED | | May Lose Value |
| NOT BANK ISSUED | | No Bank Guarantee |
Table of contents
The views expressed in this report reflect the current views of the respective parties. These views are not guarantees of future performance and involve certain risks, uncertainties and assumptions that are difficult to predict so actual outcomes and results may differ significantly from the views expressed. These views are subject to change at any time based upon economic, market or other conditions and the respective parties disclaim any responsibility to update such views. These views may not be relied on as investment advice and, because investment decisions for a Columbia Fund are based on numerous factors, may not be relied on as an indication of trading intent on behalf of any particular Columbia Fund. References to specific company securities should not be construed as a recommendation or investment advice.
| 1 | The Standard & Poor’s (S&P) 500 Index tracks the performance of 500 widely held, large-capitalization U.S. stocks. Indices are not available for investment, are not professionally managed and do not reflect sales charges, fees, brokerage commissions, taxes or other expenses of investing. Securities in the fund may not match those in an index. |
President’s Message

Dear Shareholder:
We are pleased to provide this shareholder report detailing your fund’s performance, portfolio holdings and financial statements. We hope this information is helpful in monitoring your investments as we work through these challenging economic times. We recognize that you have entrusted us with your money and want you to know that our professional investment teams work to interpret the latest economic and market trends with the goal of optimizing portfolio construction for our clients.
The first half of 2009 was defined by extremes. The multiyear lows we witnessed in the early months gave way to a stunning rally for the U.S. financial markets in the spring. A global market rebound may be underway, thanks to the massive fiscal and aggressive monetary policies of governments around the world. As of the June 30 market close, the S&P 500 Index1 was trading at nearly 16.6 times its 2009 Wall Street consensus earnings estimates with a sharp increase of nearly 36% since March 9. More mixed economic news has yet to provide the all-clear signal for investors, although economic activity has started to firm up. We believe this challenging economic environment makes it even more important to work with professional money managers while continuing to invest for life events like retirement, college planning, home improvements and career changes.
Retirement income planning has become an increasingly significant focus in the lives of millions of Americans. Recent economic conditions make it even more important to manage short-term obligations such as mortgages, monthly bills and credit card debt while also taking the steps necessary to prepare for or maximize retirement benefits. Better nutrition and medical services can result in U.S. citizens living longer, healthier lives. This means the risk of outliving one’s assets in retirement is very real without proper planning. Financial security and retirement planning is an ongoing process that requires active management of your savings, investments and risks. We encourage you to review your retirement plan regularly so you’ll be better able to meet your retirement needs in the future.
We recognize that economic uncertainty creates great challenges for many investors. Our professional investment teams work diligently to help investors navigate through difficult markets. Thank you for your business and for the opportunity to work together towards your investment goals.
Sincerely,

J. Kevin Connaughton
President, Columbia Funds
On September 29, 2009, Bank of America Corporation entered into an agreement to sell a portion of the asset management business of Columbia Management Group, LLC. Please see Note 12 of the Notes to Financial Statements for additional information.
| Past | performance is no guarantee of future results. |
Fund Profile – Columbia Greater China Fund
Summary
| n | | For the 12-month period that ended August 31, 2009, the fund’s Class A shares returned negative 3.30% without sales charge. |
| n | | The MSCI China Index1 GD (gross of dividends) and MSCI China Index ND (net of dividends) returned 0.76% and 0.59%, respectively. The Hang Seng Index2 returned negative 9.08%. The average fund in its peer group, the Lipper China Region Funds Classification,3 returned negative 3.07%. |
| n | | As the equity markets rebounded, the fund’s defensive positioning generally accounted for its shortfall against its MSCI benchmarks. |
Portfolio Management
Jasmine Huang has co-managed the fund since May 2005 and has been associated with the advisor or its predecessors since September 2003.
Fred Copper has co-managed the fund since October 2005 and has been associated with the advisor or its predecessors since September 2005.
| 1 | The Morgan Stanley Capital International (MSCI) China Index is designed to broadly and fairly represent the full diversity of business activities in China. This index aims to capture 85% of the free float adjusted market capitalization in each industry group. |
| 2 | The Hang Seng Stock Index tracks the performance of approximately 70% of the total market capitalization of the Stock Exchange of Hong Kong. |
Indices are not available for investment, are not professionally managed and do not reflect sales charges, fees, brokerage commissions, taxes or other expenses of investing. Securities in the fund may not match those in an index.
| 3 | Lipper Inc., a widely respected data provider in the industry, calculates an average total return (assuming reinvestment of distributions) for mutual funds with investment objectives similar to those of the fund. Lipper makes no adjustment for the effect of sales loads. |
Performance data quoted represents past performance and current performance may be lower or higher. Past performance is no guarantee of future results. The investment return and principal value will fluctuate so that shares, when redeemed, may be worth more or less than the original cost. Please visit www.columbiafunds.com for daily and most recent month-end performance updates.
Summary
1-year return as of 08/31/09
| | |

| | –3.30% Class A shares |
| | (without sales charge) |
| |
 | | +0.59% MSCI China Index (ND) |
| |
| | +0.76% MSCI China Index (GD) |
| |
| | –9.08% Hang Seng Index |
|
Morningstar Style Box™ |
|
Equity Style |
|
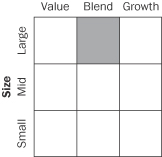
|
The Morningstar Style Box™ reveals a fund’s investment strategy. For equity funds, the vertical axis shows the market capitalization of the stocks owned, and the horizontal axis shows investment style (value, blend or growth). Information shown is based on the most recent data provided by Morningstar.
1
Economic Update – Columbia Greater China Fund
The pace of global economic growth slowed during the 12-month period that began September 1, 2008 and ended August 31, 2009. Most major developed economies had slipped into recession late in 2007 or early in 2008. In the United States, the downturn was sharper than anticipated. The economies of the United Kingdom, parts of Europe, Japan, South Korea and Singapore also contracted. Although emerging markets such as China largely avoided recession, the global slowdown took the steam out of their economic growth early in the period as exports fell off sharply in export-driven economies.
Ambitious growth target still within reach
Yet, recent economic data have sparked optimism around the world. And in China, the government’s ambitious 8% growth target may be within reach. China was quick to implement stimulus measures that helped its economy stabilize in relatively short order. Gross domestic product (GDP) expanded at an annualized pace of 7.1% in the first half of 2009.
China’s rebound has been on all fronts, except for exports, and economic data improved as the period wore on. Fixed asset investment continued at a robust pace, manufacturing activity has been relatively solid and retail sales have expanded. Domestic demand has strengthened, which is good news for China’s policymakers, who have stepped up efforts to provide stimulus, subsidies and other initiatives to drive consumption higher in rural areas. Auto sales in rural areas, for example, rose steadily throughout the period, in response to government subsidies for small-car purchases. Yet, private consumption accounts for only 40% of China’s GDP, compared to 65% to 70% for most developed countries.
Continued construction activity, the result of significant stimulus spending, has been a win-win for China and its trading partners. Countries, such as Taiwan and South Korea, that provide external resources benefit from China’s spending while the technology enhancements they provide help China become more efficient — and more competitive — in the global marketplace.
Growth sparks a market rebound
Although stock market returns were mostly negative around the world, they rebounded as economic prospects improved. The U.S. stock market lost 18.25%, as measured by the S&P 500 Index.1 Developed foreign markets returned negative 14.95%, as measured by the MSCI EAFE Index.2 Emerging markets lost less ground, returning negative 9.95% as measured by the MSCI Emerging Market Index.3
China’s stock market managed a modest gain for the period, returning 0.59% as measured by the MSCI China Index4 ND (net of dividends) as a second half rebound offset sharp losses incurred in the first half of the period.
| 1 | The Standard & Poor’s (S&P) 500 Index tracks the performance of 500 widely held, large-capitalization U.S. stocks. |
| 2 | The Morgan Stanley Capital International Europe, Australasia, Far East (MSCI EAFE) Index is a capitalization-weighted index that tracks the total return of common stocks in 21 developed-market countries within Europe, Australasia and the Far East. |
| 3 | The Morgan Stanley Capital International Emerging Markets Index (MSCI EMI) is a free float-adjusted market capitalization index that is designed to measure equity market performance in the global emerging markets. As of June 2006, the MSCI Emerging Markets Index consisted of the following 25 emerging market country indices: Argentina, Brazil, Chile, China, Colombia, Czech Republic, Egypt, Hungary, India, Indonesia, Israel, Jordan, Korea, Malaysia, Mexico, Morocco, Pakistan, Peru, Philippines, Poland, Russia, South Africa, Taiwan, Thailand and Turkey. |
| 4 | The Morgan Stanley Capital International (MSCI) China Index is designed to broadly and fairly represent the full diversity of business activities in China. This index aims to capture 85% of the free float adjusted market capitalization in each industry group. |
| | Indices are not available for investment, are not professionally managed and do not reflect sales charges, fees, brokerage commissions, taxes or other expenses of investing. Securities in the fund may not match those in an index. |
| Past | performance is no guarantee of future results. |
Summary
For the 12-month period that ended August 31, 2009
| | n | | Most stock markets in developed countries lost ground, as measured by the MSCI EAFE Index. However, China’s stock market managed a small gain as economic growth gained momentum throughout the period. | |
| | |
| MSCI EAFE Index | | MSCI China Index |
| |

| | 
|
–14.95% | | 0.59% |
2
Performance Information – Columbia Greater China Fund
|
| Performance of a $10,000 investment 09/01/99 – 08/31/09 |
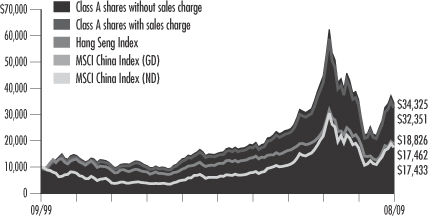
The chart above shows the change in value of a hypothetical $10,000 investment in Class A shares of Columbia Greater China Fund during the stated time, and does not reflect the deduction of taxes that a shareholder may pay on fund distributions or on the redemption of fund shares. The Morgan Stanley Capital International (MSCI) China Index is designed to broadly and fairly represent the full diversity of business activities in China. This index aims to capture 85% of the free float adjusted market capitalization in each industry group. The Hang Seng Stock Index tracks the performance of approximately 70% of the total market capitalization of the stock exchange of Hong Kong. Indices are not available for investment, are not professionally managed and do not reflect sales charges, fees, brokerage commissions, taxes or other expenses of investing. Securities in the fund may not match those in an index.
| | | | |
| Performance of a $10,000 investment 09/01/99 – 08/31/09 ($) |
| | |
| Sales charge: | | without | | with |
Class A | | 34,325 | | 32,351 |
Class B | | 31,872 | | 31,872 |
Class C | | 31,793 | | 31,793 |
Class Z | | 36,087 | | n/a |
| | | | | | | | | | | | | | |
| Average annual total return as of 08/31/09 (%) |
| | | | |
| Share class | | A | | B | | C | | Z |
| Inception | | 05/16/97 | | 05/16/97 | | 05/16/97 | | 05/16/97 |
| Sales charge | | without | | with | | without | | with | | without | | with | | without |
1-year | | –3.30 | | –8.86 | | –4.02 | | –8.74 | | –3.99 | | –4.93 | | –3.05 |
5-year | | 17.81 | | 16.42 | | 16.94 | | 16.72 | | 16.94 | | 16.94 | | 18.12 |
10-year | | 13.13 | | 12.46 | | 12.29 | | 12.29 | | 12.26 | | 12.26 | | 13.69 |
| | | | | | | | | | | | | | |
| Average annual total return as of 09/30/09 (%) |
| Share class | | A | | B | | C | | Z |
| Sales charge | | without | | with | | without | | with | | without | | with | | without |
1-year | | 25.87 | | 18.64 | | 24.92 | | 19.92 | | 24.98 | | 23.98 | | 26.17 |
5-year | | 18.29 | | 16.90 | | 17.41 | | 17.19 | | 17.41 | | 17.41 | | 18.59 |
10-year | | 14.32 | | 13.64 | | 13.47 | | 13.47 | | 13.45 | | 13.45 | | 14.89 |
Performance data quoted represents past performance and current performance may be lower or higher. Past performance is no guarantee of future results. The investment return and principal value will fluctuate so that shares, when redeemed, may be worth more or less than the original cost. Please visit www.columbiafunds.com for daily and most recent month-end performance updates.
| | |
| Annual operating expense ratio (%)* |
| |
Class A | | 1.54 |
Class B | | 2.29 |
Class C | | 2.29 |
Class Z | | 1.29 |
| * | The annual operating expense ratio is as stated in the fund's prospectus that is current as of the date of this report and includes the expenses incurred by the investment companies in which the fund invests. Differences in expense ratios disclosed elsewhere in this report may result from including fee waivers and expense reimbursements as well as different time periods used in calculating the ratios. |
| | |
| Net asset value per share |
| |
As of 08/31/09 ($) | | |
Class A | | 44.30 |
Class B | | 42.77 |
Class C | | 43.36 |
Class Z | | 46.20 |
| Distributions declared per share |
09/01/08 – 08/31/09 ($) | | |
Class A | | 0.54 |
Class B | | 0.54 |
Class C | | 0.54 |
Class Z | | 0.54 |
The “with sales charge” returns include the maximum initial sales charge of 5.75% for Class A shares and the applicable contingent deferred sales charge of 5.00% in the first year, declining to 1.00% in the sixth year and eliminated thereafter for Class B shares and 1.00% for Class C shares for the first year only. The “without sales charge” returns do not include the effect of sales charges. If they had, returns would be lower.
Performance results reflect any fee waivers or reimbursements of fund expenses by the investment advisor and/or any of its affiliates. Absent these fee waivers or expense reimbursement arrangements, performance results would have been lower.
All results shown assume reinvestment of distributions. Class Z shares are sold at net asset value with no distribution and service (Rule 12b-1) fees. Class Z shares have limited eligibility and the investment minimum requirements may vary. Please see the fund’s prospectus for details. Performance for different share classes will vary based on differences in sales charges and fees associated with each class.
The tables do not reflect the deduction of taxes that a shareholder may pay on fund distributions or on the redemption of fund shares.
3
Understanding Your Expenses – Columbia Greater China Fund
Estimating your actual expenses
To estimate the expenses that you paid over the period, first you will need your account balance at the end of the period:
| | n | | For shareholders who receive their account statements from Columbia Management Services, Inc., your account balance is available online at www.columbiafunds.com or by calling Shareholder Services at 800.345.6611. | |
| | n | | For shareholders who receive their account statements from their brokerage firm, contact your brokerage firm to obtain your account balance. | |
| | 1. | Divide your ending account balance by $1,000. For example, if an account balance was $8,600 at the end of the period, the result would be 8.6. | |
| | 2. | In the section of the table below titled “Expenses paid during the period,” locate the amount for your share class. You will find this number in the column labeled “Actual.” Multiply this number by the result from step 1. Your answer is an estimate of the expenses you paid on your account during the period. | |
If the value of your account falls below the minimum initial investment requirement applicable to you, your account generally will be subject to a $20 annual fee. This fee is not included in the accompanying table. If you are subject to the fee, keep it in mind when you are estimating the ongoing expenses of investing in the fund and when comparing the expenses of this fund with other funds.
As a fund shareholder, you incur two types of costs. There are transaction costs, which generally include sales charges on purchases and may include redemption fees or exchange fees. There are also ongoing costs, which generally include investment advisory fees, distribution and service (Rule 12b-1) fees and other fund expenses. The information on this page is intended to help you understand the ongoing costs of investing in the fund and to compare these costs with the ongoing costs of investing in other mutual funds.
Analyzing your fund’s expenses by share class
To illustrate these ongoing costs, we have provided an example and calculated the expenses paid by investors in each share class during the period. The information in the following table is based on an initial investment of $1,000, which is invested at the beginning of the reporting period and held for the entire period. Expense information is calculated two ways and each method provides you with different information. The amount listed in the “Actual” column is calculated using the fund’s actual operating expenses and total return for the period. The amount listed in the “Hypothetical” column for each share class assumes that the return each year is 5% before expenses and is calculated based on the fund’s actual operating expenses. You should not use the hypothetical account values and expenses to estimate either your actual account balance at the end of the period or the expenses you paid during this reporting period.
Compare with other funds
Since all mutual funds are required to include the same hypothetical calculations about expenses in shareholder reports, you can use this information to compare the ongoing costs of investing in the fund with other funds. To do so, compare the 5% hypothetical example with the 5% hypothetical examples that appear in the shareholder reports of other funds. As you compare hypothetical examples of other funds, it is important to note that hypothetical examples are meant to highlight the ongoing costs of investing in a fund and do not reflect any transaction costs, such as sales charges, redemption fees or exchange fees.
| | | | | | | | | | | | | | |
| 03/01/09 – 08/31/09 Columbia Greater China Fund | | | | | | |
| | | | |
| | | Account value at the
beginning of the period ($) | | Account value at the
end of the period ($) | | Expenses paid
during the period ($) | | Fund's annualized
expense ratio (%) |
| | | Actual | | Hypothetical | | Actual | | Hypothetical | | Actual | | Hypothetical | | Actual |
Class A | | 1,000.00 | | 1,000.00 | | 1,564.80 | | 1,017.09 | | 10.41 | | 8.19 | | 1.61 |
Class B | | 1,000.00 | | 1,000.00 | | 1,558.70 | | 1,013.31 | | 15.22 | | 11.98 | | 2.36 |
Class C | | 1,000.00 | | 1,000.00 | | 1,559.21 | | 1,013.31 | | 15.22 | | 11.98 | | 2.36 |
Class Z | | 1,000.00 | | 1,000.00 | | 1,566.62 | | 1,018.35 | | 8.80 | | 6.92 | | 1.36 |
Expenses paid during the period are equal to the annualized expense ratio for the share class, multiplied by the average account value over the period, then multiplied by the number of days in the fund’s most recent fiscal half-year and divided by 365.
It is important to note that the expense amounts shown in the table are meant to highlight only ongoing costs of investing in the fund and do not reflect any transaction costs, such as sales charges, redemption fees or exchange fees. Therefore, the hypothetical examples provided may not help you determine the relative total costs of owning shares of different funds. If these transaction costs were included, your costs would have been higher.
4
Portfolio Manager’s Report – Columbia Greater China Fund
Performance data quoted represents past performance and current performance may be lower or higher. Past performance is no guarantee of future results. The investment return and principal value will fluctuate so that shares, when redeemed, may be worth more or less than the original cost. Please visit www.columbiafunds.com for daily and most recent month-end performance updates.
| | |
| Top 10 holdings |
| |
as of 08/31/09 (%) | | |
China Mobile | | 9.0 |
China Life Insurance | | 7.7 |
Industrial & Commercial Bank of China | | 6.6 |
CNOOC | | 6.2 |
Petrochina | | 5.9 |
Bank of China | | 5.8 |
China Merchants Bank | | 4.9 |
China Shenhua Energy | | 3.3 |
Tencent Holdings | | 3.1 |
Ping An Insurance | | 2.9 |
The fund is actively managed and the composition of its portfolio will change over time. Information provided is calculated as a percentage of net assets.
For the 12-month period that ended August 31, 2009, Columbia Greater China Fund Class A shares returned negative 3.30% without sales charge. This was less than the 0.76% return of the MSCI China Index GD. The fund’s return was also less than the 0.59% return of the MSCI China Index ND. As of August 31, 2009 and going forward, fund performance will only be compared to the index net of dividends, a figure that includes the impact of an estimated withholding tax on dividend reinvestment in its return. In a volatile year for China’s stock market, the fund held up better than the Hang Seng Stock Index, which returned negative 9.08%. The fund performed generally in line with the average fund in its peer group, the Lipper China Region Funds Classification, which returned negative 3.07%. The fund’s defensive positioning early in the period when the equity markets began to recover generally accounted for its shortfall against its benchmark.
Emphasis on mainland China
We focused on mainland China because, unlike Taiwan and Hong Kong, its economy is less dependent on exports to the West and, therefore, on an economic recovery in the West. After declining dramatically, the Chinese stock market stabilized in November and December 2008 and rose sharply during the first eight months of 2009, as the government instituted monetary and fiscal stimulus programs that loosened credit and pumped large amounts of money into the economy. In this environment, we emphasized areas that we believed would benefit from the government’s initiatives, many of which aimed to increase consumer demand. In the financials sector, real estate companies benefited from lower mortgage rates and a decline in home down-payment requirements.
The easing of mortgage regulations sparked a new housing cycle, and the transaction volume for real estate purchases rose 100% over the prior year. To capitalize on these developments, we added real estate companies to the portfolio, such as China Overseas Land & Investment, a nationwide property developer, which was a strong contributor to performance. As the housing market improved, inventories for home building supplies declined, and we boosted holdings in the materials sector. We also invested in insurance companies, such as China Life Insurance, which helped enhance returns. The insurance market is relatively new in China and, as such, we believe it has good prospects going forward.
As the labor markets improved, we began adding consumer discretionary stocks to the portfolio, including Golden Eagle Retail, a department store chain, and Belle International, a women’s footwear retailer, both of which had positive returns. With the consumer in mind, we also boosted the technology weight in the portfolio, favoring companies whose products are popular with consumers, rather than pure technology names. We added Internet service providers Tencent Holdings and Baidu.
Targeting infrastructure development and rising exports
We boosted investment in the industrials sector, because a substantial portion of government stimulus money is slated for fixed-asset development, such as the building of railroads, bridges and highways. We believe that industrial companies could also benefit from a rise in exports, as increased numbers of goods are transported by ship
5
Portfolio Manager’s Report (continued) – Columbia Greater China Fund
| | |
| Holdings discussed in this report |
| |
as of 8/31/09 (%) | | |
China Overseas Land & Investment | | 0.9 |
China Life Insurance | | 7.7 |
Golden Eagle Retail | | 1.3 |
Belle International | | 0.7 |
Tencent Holdings | | 3.1 |
Baidu | | 0.3 |
China South Locomotive & Rolling Stock | | 1.3 |
Information provided is calculated as a percentage of net assets.
and rail. We added China South Locomotive & Rolling Stock, a locomotive and railway equipment manufacturing company, which posted a strong return.
We avoided telecommunications companies and certain energy companies that had come under increased government regulation. Telecommunications, a sector that did poorly, was the biggest underweight in the portfolio.
On track for solid economic growth
We believe that the Chinese government has done a good job of maintaining solid economic growth. In this environment, we plan to continue to focus on companies that could benefit from infrastructure development, the growth of the middle class and rising consumer spending. We believe that these will be long-term trends in the Greater China region.
Equity investments are affected by stock market fluctuations that occur in response to economic and business developments.
International investing may involve certain risks, including currency fluctuations, risks associated with possible differences in financial accounting standards and other monetary and political risks. Significant levels of foreign taxes, including potentially confiscatory levels of taxation and withholding taxes, may also apply to some foreign investments.
Some of the countries in which the fund invests are considered emerging economies, which means there may be greater risks associated with investing there than in more developed countries. In addition, concentration of investments in a single region may result in greater volatility.
6
Investment Portfolio – Columbia Greater China Fund
August 31, 2009
Common Stocks – 99.8%
| | | | |
| | | Shares | | Value ($) |
| Consumer Discretionary – 6.0% | | | | |
| Automobiles – 1.0% | | | | |
Dongfeng Motor Group Co., Ltd., Class H | | 536,000 | | 556,716 |
Great Wall Motor Co., Ltd., Class H | | 1,947,500 | | 1,676,009 |
| | | | |
Automobiles Total | | | | 2,232,725 |
| | |
Distributors – 0.9% | | | | |
Li & Fung Ltd. | | 607,600 | | 2,038,282 |
| | | | |
Distributors Total | | | | 2,038,282 |
| |
Diversified Consumer Services – 0.5% | | |
New Oriental Education & Technology Group, ADR (a) | | 15,047 | | 1,063,071 |
| | | | |
Diversified Consumer Services Total | | 1,063,071 |
| |
Hotels, Restaurants & Leisure – 0.8% | | |
Ctrip.com International Ltd., ADR (a) | | 23,449 | | 1,147,594 |
Formosa International Hotels Corp. | | 61,600 | | 731,718 |
| | | | |
Hotels, Restaurants & Leisure Total | | 1,879,312 |
| | |
Multiline Retail – 1.3% | | | | |
Golden Eagle Retail Group Ltd. | | 1,974,000 | | 2,923,897 |
| | | | |
Multiline Retail Total | | | | 2,923,897 |
| | |
Specialty Retail – 0.7% | | | | |
Belle International Holdings Ltd. | | 1,717,000 | | 1,557,395 |
| | | | |
Specialty Retail Total | | | | 1,557,395 |
|
Textiles, Apparel & Luxury Goods – 0.8% |
China Dongxiang Group Co. | | 2,761,675 | | 1,724,610 |
| | | | |
Textiles, Apparel & Luxury Goods Total | | 1,724,610 |
| | | | |
Consumer Discretionary Total | | 13,419,292 |
| | | | |
| Consumer Staples – 1.9% | | | | |
| Beverages – 0.4% | | | | |
Yantai Changyu Pioneer Wine Co., Class B | | 148,310 | | 881,197 |
| | | | |
Beverages Total | | | | 881,197 |
| | |
Food Products – 1.5% | | | | |
Tingyi Cayman Islands Holding Corp. | | 388,000 | | 697,859 |
Want Want China Holdings Ltd. | | 4,850,000 | | 2,571,915 |
| | | | |
Food Products Total | | | | 3,269,774 |
| | | | |
Consumer Staples Total | | 4,150,971 |
| | | | |
| | | | |
| | | Shares | | Value ($) |
| Energy – 19.3% | | | | |
| Oil, Gas & Consumable Fuels – 19.3% | | |
China Petroleum & Chemical Corp., Class H | | 5,560,000 | | 4,641,434 |
China Shenhua Energy Co., Ltd., Class H | | 1,846,000 | | 7,478,843 |
CNOOC Ltd. | | 10,681,500 | | 13,947,162 |
PetroChina Co., Ltd., Class H | | 12,002,000 | | 13,317,575 |
Yanzhou Coal Mining Co., Ltd., Class H | | 2,752,000 | | 3,927,142 |
| | | | |
Oil, Gas & Consumable Fuels Total | | 43,312,156 |
| | | | |
Energy Total | | | | 43,312,156 |
| | | | |
| Financials – 35.7% |
| Commercial Banks – 18.2% | | | | |
Bank of China Ltd., Class H | | 26,544,000 | | 12,911,622 |
China Citic Bank, Class H | | 3,324,000 | | 2,011,439 |
China Merchants Bank Co., Ltd., Class H | | 5,036,590 | | 10,982,378 |
Industrial & Commercial Bank of China, Class H | | 21,704,000 | | 14,813,870 |
| | | | |
Commercial Banks Total | | | | 40,719,309 |
| |
Diversified Financial Services – 0.4% | | |
Hong Kong Exchanges & Clearing Ltd. | | 54,600 | | 950,337 |
| | | | |
Diversified Financial Services Total | | 950,337 |
| | |
Insurance – 10.6% | | | | |
China Life Insurance Co., Ltd., Class H | | 4,090,000 | | 17,229,774 |
Ping An Insurance (Group) Company of China, Ltd., Class H | | 862,000 | | 6,450,722 |
| | | | |
Insurance Total | | | | 23,680,496 |
|
Real Estate Management & Development – 6.5% |
China Overseas Land & Investment Ltd. | | 968,320 | | 1,951,520 |
China Vanke Co., Ltd., Class B | | 4,437,110 | | 5,152,474 |
Guangzhou R&F Properties Co. Ltd., Class H | | 2,336,000 | | 3,809,720 |
Yanlord Land Group Ltd. | | 2,235,000 | | 3,567,438 |
| | | | |
Real Estate Management & Development Total | | 14,481,152 |
| | | | |
Financials Total | | | | 79,831,294 |
| | | | |
See Accompanying Notes to Financial Statements.
7
Columbia Greater China Fund
August 31, 2009
Common Stocks (continued)
| | | | |
| | | Shares | | Value ($) |
| Health Care – 0.5% |
| Pharmaceuticals – 0.5% | | | | |
China Shineway Pharmaceutical Group Ltd. | | 1,282,000 | | 1,200,875 |
| | | | |
Pharmaceuticals Total | | | | 1,200,875 |
| | | | |
Health Care Total | | | | 1,200,875 |
| | | | |
| Industrials – 12.4% |
| Construction & Engineering – 2.7% | | |
China Railway Construction Corp., Ltd., Class H | | 2,027,000 | | 2,976,248 |
China Railway Group Ltd., Class H (a) | | 1,258,000 | | 1,093,990 |
CTCI Corp. | | 2,199,000 | | 2,064,287 |
| | | | |
Construction & Engineering Total | | | | 6,134,525 |
| | |
Electrical Equipment – 2.3% | | | | |
Harbin Electric, Inc. (a) | | 165,989 | | 2,059,924 |
Shanghai Electric Group Co., Ltd., Class H | | 892,000 | | 408,570 |
Zhuzhou CSR Times Electric Co., Ltd., Class H | | 1,593,000 | | 2,708,970 |
| | | | |
Electrical Equipment Total | | | | 5,177,464 |
| | |
Industrial Conglomerates – 0.8% | | | | |
Beijing Enterprises Holdings Ltd. | | 190,500 | | 945,071 |
Chongqing Machinery & Electric Co., Ltd., Class H (a) | | 4,998,964 | | 909,436 |
| | | | |
Industrial Conglomerates Total | | | | 1,854,507 |
| | |
Machinery – 2.8% | | | | |
China National Materials Co., Ltd., Class H | | 2,380,000 | | 1,971,447 |
China South Locomotive and Rolling Stock Corp., Class H | | 5,168,707 | | 3,067,699 |
Duoyuan Global Water, Inc., ADR (a) | | 37,616 | | 1,123,214 |
| | | | |
Machinery Total | | | | 6,162,360 |
| | |
Marine – 0.6% | | | | |
China Shipping Development Co., Ltd., Class H | | 1,040,000 | | 1,301,602 |
| | | | |
Marine Total | | | | 1,301,602 |
| |
Transportation Infrastructure – 3.2% | | |
China Merchants Holdings International Co., Ltd. | | 722,000 | | 2,347,528 |
Jiangsu Expressway Co., Ltd., Class H | | 1,014,000 | | 798,070 |
Sichuan Expressway Co., Ltd., Class H (a) | | 6,250,000 | | 2,532,111 |
| | | | |
| | | Shares | | Value ($) |
Zhejiang Expressway Co., Ltd., Class H | | 1,428,000 | | 1,361,588 |
| | | | |
Transportation Infrastructure Total | | 7,039,297 |
| | | | |
Industrials Total | | | | 27,669,755 |
| | | | |
| Information Technology – 5.1% |
| Internet Software & Services – 4.6% | | |
Baidu, Inc., ADR (a) | | 2,234 | | 737,354 |
Sohu.com, Inc. (a) | | 42,779 | | 2,613,797 |
Tencent Holdings Ltd. | | 470,400 | | 7,016,140 |
| | | | |
Internet Software & Services Total | | 10,367,291 |
| | |
Software – 0.5% | | | | |
Kingdee International Software Group Co., Ltd. | | 6,794,000 | | 1,095,743 |
| | | | |
Software Total | | | | 1,095,743 |
| | | | |
Information Technology Total | | 11,463,034 |
| | | | |
| Materials – 5.8% | | | | |
| Chemicals – 0.7% | | | | |
Huabao International Holdings Ltd. | | 1,510,000 | | 1,570,309 |
| | | | |
Chemicals Total | | | | 1,570,309 |
| | |
Metals & Mining – 5.1% | | | | |
Angang Steel Co., Ltd., Class H | | 735,376 | | 1,398,556 |
China Metal Recycling Holdings Ltd. (a) | | 1,916,400 | | 1,926,179 |
China Zhongwang Holdings Ltd. (a) | | 4,992,191 | | 5,449,224 |
Hidili Industry International Development Ltd. (a) | | 2,019,000 | | 2,013,673 |
Maanshan Iron & Steel, Class H (a) | | 1,050,247 | | 646,373 |
| | | | |
Metals & Mining Total | | | | 11,434,005 |
| | | | |
Materials Total | | | | 13,004,314 |
| | | | |
| Telecommunication Services – 10.7% | | |
| Diversified Telecommunication Services – 1.7% |
China Telecom Corp., Ltd.,
Class H | | 7,494,000 | | 3,848,308 |
| | | | |
Diversified Telecommunication Services Total | | 3,848,308 |
|
Wireless Telecommunication Services – 9.0% |
China Mobile Ltd. | | 2,069,500 | | 20,133,063 |
| | | | |
Wireless Telecommunication Services Total | | 20,133,063 |
| | | | |
Telecommunication Services Total | | 23,981,371 |
See Accompanying Notes to Financial Statements.
8
Columbia Greater China Fund
August 31, 2009
Common Stocks (continued)
| | | | | |
| | | Shares | | Value ($) | |
| Utilities – 2.4% | | | | | |
| Gas Utilities – 1.7% | | | | | |
Xinao Gas Holdings Ltd. | | 2,384,000 | | 3,801,875 | |
| | | | | |
Gas Utilities Total | | | | 3,801,875 | |
|
Independent Power Producers & Energy Traders – 0.5% | |
China Resources Power Holdings Co., Ltd. | | 446,000 | | 1,078,394 | |
| | | | | |
Independent Power Producers & Energy Traders Total | | 1,078,394 | |
| | |
Water Utilities – 0.2% | | | | | |
Guangdong Investment Ltd. | | 902,000 | | 459,702 | |
| | | | | |
Water Utilities Total | | 459,702 | |
| | | | | |
Utilities Total | | 5,339,971 | |
| | | | | |
Total Common Stocks
(Cost of $144,454,973) | | 223,373,033 | |
| | |
Short-Term Obligation – 0.4% | | | | | |
| | | Par ($) | | | |
Repurchase agreement with Fixed Income Clearing Corp., dated 08/31/09, due 09/01/09 at 0.130%, collateralized by a U.S. Treasury obligation maturing 08/15/23, market value $782,574 (repurchase proceeds $763,003) | | 763,000 | | 763,000 | |
| | | | | |
Total Short-Term Obligation
(cost of $763,000) | | 763,000 | |
| | | | | |
Total Investments – 100.2%
(cost of $145,217,973)(b) | | 224,136,033 | |
| | | | | |
Other Assets & Liabilities, Net – (0.2)% | | (347,687 | ) |
| | | | | |
Net Assets – 100.0% | | 223,788,346 | |
Notes to Investment Portfolio:
| (a) | Non-income producing security. |
| (b) | Cost for federal income tax purposes is $145,217,973. |
The following table summarizes the inputs used, as of August 31, 2009 in valuing the Fund’s assets:
| | | | | | | | | | | | |
Description | | Quoted
Prices
(Level 1) | | Other
Significant
Observable
Inputs
(Level 2) | | Significant
Unobservable
Inputs
(Level 3) | | Total |
Common Stocks | | | | | | | | | | | | |
Consumer Discretionary | | $ | 2,210,665 | | $ | 11,208,627 | | $ | — | | $ | 13,419,292 |
Consumer Staples | | | — | | | 4,150,971 | | | — | | | 4,150,971 |
Energy | | | — | | | 43,312,156 | | | — | | | 43,312,156 |
Financials | | | — | | | 79,831,294 | | | — | | | 79,831,294 |
Health Care | | | — | | | 1,200,875 | | | — | | | 1,200,875 |
Industrials | | | 3,183,138 | | | 24,486,617 | | | — | | | 27,669,755 |
Information Technology | | | 3,351,151 | | | 8,111,883 | | | — | | | 11,463,034 |
Materials | | | — | | | 13,004,314 | | | — | | | 13,004,314 |
Telecommunication Services | | | — | | | 23,981,371 | | | — | | | 23,981,371 |
Utilities | | | — | | | 5,339,971 | | | — | | | 5,339,971 |
| | | | | | | | | | | | |
Total Common Stocks | | | 8,744,954 | | | 214,628,079 | | | — | | | 223,373,033 |
| | | | | | | | | | | | |
Total Short-Term Obligation | | | — | | | 763,000 | | | — | | | 763,000 |
| | | | | | | | | | | | |
Total Investments | | $ | 8,744,954 | | $ | 215,391,079 | | $ | — | | $ | 224,136,033 |
| | | | | | | | | | | | |
The Fund’s assets assigned to the Level 2 input category include certain foreign securities for which a third party statistical pricing service may be employed for purposes of fair market valuation.
For more information on valuation inputs, and their aggregation into the levels used in the table above, please refer to the Security Valuation section in the accompanying Notes to Financial Statements.
The Fund was invested in the following countries at August 31, 2009:
| | | | | |
Summary of Securities
by Country (Unaudited) | | Value | | % of Total Investments |
China | | $ | 214,020,971 | | 95.5 |
Singapore | | | 3,567,438 | | 1.6 |
Hong Kong | | | 2,988,619 | | 1.3 |
Taiwan | | | 2,796,005 | | 1.3 |
United States* | | | 763,000 | | 0.3 |
| | | | | |
| | $ | 224,136,033 | | 100.0 |
| | | | | |
* Includes short-term obligation.
Certain securities are listed by country of underlying exposure but may trade predominantly on another exchange.
At August 31, 2009, the Fund held investments in the following sectors:
| | | |
Sector (Unaudited) | | % of Net Assets | |
Financials | | 35.7 | |
Energy | | 19.3 | |
Industrials | | 12.4 | |
Telecommunication Services | | 10.7 | |
Consumer Discretionary | | 6.0 | |
Materials | | 5.8 | |
Information Technology | | 5.1 | |
Utilities | | 2.4 | |
Consumer Staples | | 1.9 | |
Health Care | | 0.5 | |
| | | |
| | 99.8 | |
Short-Term Obligation | | 0.4 | |
Other Assets & Liabilities, Net | | (0.2 | ) |
| | | |
| | 100.0 | |
| | | |
| | |
Acronym | | Name |
| ADR | | American Depositary Receipt |
See Accompanying Notes to Financial Statements.
9
Statement of Assets and Liabilities – Columbia Greater China Fund
August 31, 2009
| | | | | |
| | | | | ($) | |
| Assets | | Investments, at cost | | 145,217,973 | |
| | | | | |
| | Investments, at value | | 224,136,033 | |
| | Cash | | 518 | |
| | Foreign currency (cost of $168,003) | | 168,045 | |
| | Receivable for: | | | |
| | Fund shares sold | | 396,579 | |
| | Dividends | | 161,004 | |
| | Interest | �� | 3 | |
| | Trustees’ deferred compensation plan | | 17,905 | |
| | Other assets | | 2,079 | |
| | | |
| | Total Assets | | 224,882,166 | |
| | |
| Liabilities | | Payable for: | | | |
| | Fund shares repurchased | | 635,787 | |
| | Investment advisory fee | | 192,255 | |
| | Pricing and bookkeeping fees | | 9,588 | |
| | Transfer agent fee | | 55,162 | |
| | Trustees’ fees | | 1,334 | |
| | Custody fee | | 34,947 | |
| | Distribution and service fees | | 76,295 | |
| | Chief compliance officer expenses | | 106 | |
| | Trustees' deferred compensation plan | | 17,905 | |
| | Other liabilities | | 70,441 | |
| | | |
| | Total Liabilities | | 1,093,820 | |
| |
| | | |
| | Net Assets | | 223,788,346 | |
| | |
| Net Assets Consist of | | Paid-in capital | | 159,535,627 | |
| | Undistributed net investment income | | 882,784 | |
| | Accumulated net realized loss | | (15,548,074 | ) |
| | Net unrealized appreciation (depreciation) on: | | | |
| | Investments | | 78,918,060 | |
| | Foreign currency translations | | (51 | ) |
| | | |
| | Net Assets | | 223,788,346 | |
See Accompanying Notes to Financial Statements.
10
Statement of Assets and Liabilities (continued) – Columbia Greater China Fund
August 31, 2009
| | | | | | |
| | | | | | |
| Class A | | Net assets | | $ | 122,313,921 | |
| | Shares outstanding | | | 2,760,878 | |
| | Net asset value per share | | $ | 44.30 | (a) |
| | Maximum sales charge | | | 5.75 | % |
| | Maximum offering price per share | | $ | 47.00 | (b) |
| | |
| | | | | | |
| Class B | | Net assets | | $ | 17,813,209 | |
| | Shares outstanding | | | 416,504 | |
| | Net asset value and offering price per share | | $ | 42.77 | (a) |
| | |
| | | | | | |
| Class C | | Net assets | | $ | 36,395,192 | |
| | Shares outstanding | | | 839,434 | |
| | Net asset value and offering price per share | | $ | 43.36 | (a) |
| | |
| | | | | | |
| Class Z | | Net assets | | $ | 47,266,024 | |
| | Shares outstanding | | | 1,023,184 | |
| | Net asset value and offering price per share | | $ | 46.20 | (a) |
| (a) | Redemption price per share is equal to net asset value less any applicable contingent deferred sales charge and/or any applicable redemption fees. |
| (b) | On sales of $50,000 or more the offering price is reduced. |
See Accompanying Notes to Financial Statements.
11
Statement of Operations – Columbia Greater China Fund
For the Year Ended August 31, 2009
| | | | | |
| | | | | ($) | |
| Investment Income | | Dividends | | 5,024,631 | |
| | Interest | | 8,891 | |
| | Foreign taxes withheld | | (361,282 | ) |
| | | | | |
| | Total Investment Income | | 4,672,240 | |
| | |
| Expenses | | Investment advisory fee | | 1,676,914 | |
| | Distribution fee: | | | |
| | Class B | | 110,601 | |
| | Class C | | 205,395 | |
| | Service fee: | | | |
| | Class A | | 254,096 | |
| | Class B | | 36,867 | |
| | Class C | | 68,465 | |
| | Pricing and bookkeeping fees | | 73,816 | |
| | Transfer agent fee | | 371,232 | |
| | Trustees’ fees | | 22,443 | |
| | Custody fee | | 168,477 | |
| | Reports to shareholders | | 96,564 | |
| | Chief compliance officer expenses | | 631 | |
| | Other expenses | | 135,005 | |
| | | | | |
| | Expenses before interest expense | | 3,220,506 | |
| | |
| | Interest expense | | 837 | |
| | | | | |
| | Total Expenses | | 3,221,343 | |
| | |
| | Expense reductions | | (31 | ) |
| | | | | |
| | Net Expenses | | 3,221,312 | |
| | |
| | | | | |
| | Net Investment Income | | 1,450,928 | |
| | |
| Net Realized and Unrealized Gain (Loss) on Investments and Foreign Currency | | Net realized loss on: | | | |
| | Investments | | (15,109,856 | ) |
| | Foreign currency transactions | | (1,460 | ) |
| | | | | |
| | Net realized loss | | (15,111,316 | ) |
| | |
| | Net change in unrealized appreciation (depreciation) on: | | | |
| | Investments | | (6,774,595 | ) |
| | Foreign currency translations | | 242 | |
| | | | | |
| | Net change in unrealized appreciation (depreciation) | | (6,774,353 | ) |
| | | | | |
| | Net Loss | | (21,885,669 | ) |
| | |
| | | | | |
| | Net Decrease Resulting from Operations | | (20,434,741 | ) |
See Accompanying Notes to Financial Statements.
12
Statement of Changes in Net Assets – Columbia Greater China Fund
| | | | | | | | |
| | | | | Year Ended August 31, | |
| Increase (Decrease) in Net Assets | | | | 2009 ($) | | | 2008 ($) | |
| Operations | | Net investment income | | 1,450,928 | | | 711,482 | |
| | Net realized gain (loss) on investments and foreign currency transactions | | (15,111,316 | ) | | 3,455,222 | |
| | Net change in unrealized appreciation (depreciation) on investments and foreign currency translations | | (6,774,353 | ) | | (77,324,107 | ) |
| | | | | | | | |
| | Net decrease resulting from operations | | (20,434,741 | ) | | (73,157,403 | ) |
| | | |
| Distributions to Shareholders | | From net investment income: | | | | | | |
| | Class A | | — | | | (1,533,100 | ) |
| | Class B | | — | | | (37,622 | ) |
| | Class C | | — | | | (60,761 | ) |
| | Class Z | | — | | | (558,619 | ) |
| | From net realized gains: | | | | | | |
| | Class A | | (1,483,663 | ) | | (110,894 | ) |
| | Class B | | (223,819 | ) | | (18,405 | ) |
| | Class C | | (392,226 | ) | | (31,737 | ) |
| | Class Z | | (436,493 | ) | | (31,891 | ) |
| | | | | | | | |
| | Total distributions to shareholders | | (2,536,201 | ) | | (2,383,029 | ) |
| | | |
| | Net Capital Stock Transactions | | (12,519,342 | ) | | 16,096,246 | |
| | Increase from regulatory settlements | | 103,255 | | | — | |
| | Redemption fees | | 93,566 | | | 281,680 | |
| | | | | | | | |
| | Total decrease in net assets | | (35,293,463 | ) | | (59,162,506 | ) |
| | | |
| Net Assets | | Beginning of period | | 259,081,809 | | | 318,244,315 | |
| | End of period | | 223,788,346 | | | 259,081,809 | |
| | Undistributed (overdistributed) net investment income at end of period | | 882,784 | | | (1,091,745 | ) |
See Accompanying Notes to Financial Statements.
13
Statement of Changes in Net Assets – Capital Stock Activity
| | | | | | | | | | | | |
| | | Columbia Greater China Fund | |
| | | Year Ended
August 31, 2009 | | | Year Ended
August 31, 2008 | |
| | | Shares | | | Dollars ($) | | | Shares | | | Dollars ($) | |
Class A | | | | | | | | | | | | |
Subscriptions | | 640,144 | | | 24,692,423 | | | 1,730,069 | | | 104,544,490 | |
Distributions reinvested | | 38,179 | | | 1,286,612 | | | 19,701 | | | 1,325,719 | |
Redemptions | | (1,235,383 | ) | | (43,562,423 | ) | | (1,492,314 | ) | | (87,305,080 | ) |
| | | | | | | | | | | | |
Net increase (decrease) | | (557,060 | ) | | (17,583,388 | ) | | 257,456 | | | 18,565,129 | |
| | | | |
Class B | | | | | | | | | | | | |
Subscriptions | | 61,424 | | | 2,316,583 | | | 131,288 | | | 8,339,012 | |
Distributions reinvested | | 5,032 | | | 164,581 | | | 622 | | | 40,941 | |
Redemptions | | (133,056 | ) | | (4,376,447 | ) | | (233,622 | ) | | (13,754,705 | ) |
| | | | | | | | | | | | |
Net decrease | | (66,600 | ) | | (1,895,283 | ) | | (101,712 | ) | | (5,374,752 | ) |
| | | | |
Class C | | | | | | | | | | | | |
Subscriptions | | 295,539 | | | 11,096,474 | | | 413,269 | | | 26,697,199 | |
Distributions reinvested | | 8,529 | | | 282,747 | | | 1,022 | | | 68,125 | |
Redemptions | | (328,054 | ) | | (11,076,276 | ) | | (445,649 | ) | | (26,526,154 | ) |
| | | | | | | | | | | | |
Net increase (decrease) | | (23,986 | ) | | 302,945 | | | (31,358 | ) | | 239,170 | |
| | | | |
Class Z | | | | | | | | | | | | |
Subscriptions | | 515,855 | | | 20,827,817 | | | 529,511 | | | 33,769,297 | |
Distributions reinvested | | 9,309 | | | 326,574 | | | 5,749 | | | 401,400 | |
Redemptions | | (394,270 | ) | | (14,498,007 | ) | | (509,570 | ) | | (31,503,998 | ) |
| | | | | | | | | | | | |
Net increase | | 130,894 | | | 6,656,384 | | | 25,690 | | | 2,666,699 | |
See Accompanying Notes to Financial Statements.
14
Financial Highlights – Columbia Greater China Fund
Selected data for a share outstanding throughout each period is as follows:
| | | | | | | | | | | | | | | | | | | | |
| | | Year Ended August 31, | |
| Class A Shares | | 2009 | | | 2008 | | | 2007 | | | 2006 | | | 2005 | |
Net Asset Value, Beginning of Period | | $ | 46.54 | | | $ | 58.78 | | | $ | 31.90 | | | $ | 24.68 | | | $ | 20.64 | |
| | | | | |
Income from Investment Operations: | | | | | | | | | | | | | | | | | | | | |
Net investment income (a) | | | 0.34 | | | | 0.22 | | | | 0.26 | | | | 0.26 | | | | 0.31 | |
Net realized and unrealized gain (loss) on investments and foreign currency | | | (2.08 | ) | | | (12.02 | ) | | | 26.86 | | | | 7.41 | | | | 3.94 | |
| | | | | | | | | | | | | | | | | | | | |
Total from investment operations | | | (1.74 | ) | | | (11.80 | ) | | | 27.12 | | | | 7.67 | | | | 4.25 | |
| | | | | |
Less Distributions to Shareholders: | | | | | | | | | | | | | | | | | | | | |
From net investment income | | | — | | | | (0.46 | ) | | | (0.24 | ) | | | (0.45 | ) | | | (0.21 | ) |
From net realized gains | | | (0.54 | ) | | | (0.03 | ) | | | — | | | | — | | | | — | |
| | | | | | | | | | | | | | | | | | | | |
Total distributions to shareholders | | | (0.54 | ) | | | (0.49 | ) | | | (0.24 | ) | | | (0.45 | ) | | | (0.21 | ) |
| | | | | |
Increase from regulatory settlements | | | 0.02 | | | | — | | | | — | | | | — | | | | — | |
| | | | | |
Redemption Fees: | | | | | | | | | | | | | | | | | | | | |
Redemption fees added to paid-in-capital (a) | | | 0.02 | | | | 0.05 | | | | — | (b) | | | — | (b) | | | — | (b) |
| | | | | |
Net Asset Value, End of Period | | $ | 44.30 | | | $ | 46.54 | | | $ | 58.78 | | | $ | 31.90 | | | $ | 24.68 | |
Total return (c) | | | (3.30 | )% | | | (20.24 | )% | | | 85.39 | % | | | 31.55 | %(d)(e) | | | 20.66 | % |
| | | | | |
Ratios to Average Net Assets/Supplemental Data: | | | | | | | | | | | | | | | | | | | | |
Net expenses before interest expense (f) | | | 1.69 | % | | | 1.55 | % | | | 1.59 | % | | | 1.73 | % | | | 1.76 | % |
Interest expense | | | — | %(g) | | | — | %(g) | | | — | %(g) | | | — | | | | — | |
Net expenses (f) | | | 1.69 | % | | | 1.55 | % | | | 1.59 | % | | | 1.73 | % | | | 1.76 | % |
Waiver/Reimbursement | | | — | | | | — | | | | — | | | | 0.01 | % | | | — | |
Net investment income (f) | | | 0.96 | % | | | 0.37 | % | | | 0.61 | % | | | 0.93 | % | | | 1.35 | % |
Portfolio turnover rate | | | 39 | % | | | 16 | % | | | 36 | % | | | 32 | % | | | 24 | % |
Net assets, end of period (000s) | | $ | 122,314 | | | $ | 154,413 | | | $ | 179,902 | | | $ | 84,492 | | | $ | 53,975 | |
| (a) | Per share data was calculated using the average shares outstanding during the period. |
| (b) | Rounds to less than $0.01 per share. |
| (c) | Total return at net asset value assuming all distributions reinvested and no initial sales charge or contingent deferred sales charge. |
| (d) | Had the investment advisor and/or any of its affiliates not waived fees or reimbursed a portion of expenses, total return would have been reduced. |
| (e) | Includes a voluntary reimbursement by the investment advisor for a realized investment loss due to a trading error. This reimbursement increased total return and net asset value per share by 0.03% and $0.01, respectively. |
| (f) | The benefits derived from expense reductions had an impact of less than 0.01%. |
| (g) | Rounds to less than 0.01%. |
See Accompanying Notes to Financial Statements.
15
Financial Highlights – Columbia Greater China Fund
Selected data for a share outstanding throughout each period is as follows:
| | | | | | | | | | | | | | | | | | | | |
| | | Year Ended August 31, | |
| Class B Shares | | 2009 | | | 2008 | | | 2007 | | | 2006 | | | 2005 | |
Net Asset Value, Beginning of Period | | $ | 45.29 | | | $ | 57.29 | | | $ | 31.14 | | | $ | 24.11 | | | $ | 20.18 | |
| | | | | |
Income from Investment Operations: | | | | | | | | | | | | | | | | | | | | |
Net investment income (loss) (a) | | | 0.07 | | | | (0.23 | ) | | | (0.06 | ) | | | 0.05 | | | | 0.14 | |
Net realized and unrealized gain (loss) on investments and foreign currency | | | (2.09 | ) | | | (11.73 | ) | | | 26.22 | | | | 7.25 | | | | 3.85 | |
| | | | | | | | | | | | | | | | | | | | |
Total from investment operations | | | (2.02 | ) | | | (11.96 | ) | | | 26.16 | | | | 7.30 | | | | 3.99 | |
| | | | | |
Less Distributions to Shareholders: | | | | | | | | | | | | | | | | | | | | |
From net investment income | | | — | | | | (0.06 | ) | | | (0.01 | ) | | | (0.27 | ) | | | (0.06 | ) |
From net realized gains | | | (0.54 | ) | | | (0.03 | ) | | | — | | | | — | | | | — | |
| | | | | | | | | | | | | | | | | | | | |
Total distributions to shareholders | | | (0.54 | ) | | | (0.09 | ) | | | (0.01 | ) | | | (0.27 | ) | | | (0.06 | ) |
| | | | | |
Increase from regulatory settlements | | | 0.02 | | | | — | | | | — | | | | — | | | | — | |
| | | | | |
Redemption Fees: | | | | | | | | | | | | | | | | | | | | |
Redemption fees added to paid-in-capital (a) | | | 0.02 | | | | 0.05 | | | | — | (b) | | | — | (b) | | | — | (b) |
| | | | | |
Net Asset Value, End of Period | | $ | 42.77 | | | $ | 45.29 | | | $ | 57.29 | | | $ | 31.14 | | | $ | 24.11 | |
Total return (c) | | | (4.02 | )% | | | (20.83 | )% | | | 84.01 | % | | | 30.57 | %(d)(e) | | | 19.77 | % |
| | | | | |
Ratios to Average Net Assets/Supplemental Data: | | | | | | | | | | | | | | | | | | | | |
Net expenses before interest expense (f) | | | 2.44 | % | | | 2.30 | % | | | 2.34 | % | | | 2.48 | % | | | 2.51 | % |
Interest expense | | | — | %(g) | | | — | %(g) | | | — | %(g) | | | — | | | | — | |
Net expenses (f) | | | 2.44 | % | | | 2.30 | % | | | 2.34 | % | | | 2.48 | % | | | 2.51 | % |
Waiver/Reimbursement | | | — | | | | — | | | | — | | | | 0.01 | % | | | — | |
Net investment income (loss) (f) | | | 0.21 | % | | | (0.40 | )% | | | (0.14 | )% | | | 0.19 | % | | | 0.60 | % |
Portfolio turnover rate | | | 39 | % | | | 16 | % | | | 36 | % | | | 32 | % | | | 24 | % |
Net assets, end of period (000s) | | $ | 17,813 | | | $ | 21,880 | | | $ | 33,502 | | | $ | 17,176 | | | $ | 12,680 | |
| (a) | Per share data was calculated using the average shares outstanding during the period. |
| (b) | Rounds to less than $0.01 per share. |
| (c) | Total return at net asset value assuming all distributions reinvested and no contingent deferred sales charge. |
| (d) | Had the investment advisor and/or any of its affiliates not waived fees or reimbursed a portion of expenses, total return would have been reduced. |
| (e) | Includes a voluntary reimbursement by the investment advisor for a realized investment loss due to a trading error. This reimbursement increased total return and net asset value per share by 0.03% and $0.01, respectively. |
| (f) | The benefits derived from expense reductions had an impact of less than 0.01%. |
| (g) | Rounds to less than 0.01%. |
See Accompanying Notes to Financial Statements.
16
Financial Highlights – Columbia Greater China Fund
Selected data for a share outstanding throughout each period is as follows:
| | | | | | | | | | | | | | | | | | | | |
| | | Year Ended August 31, | |
| Class C Shares | | 2009 | | | 2008 | | | 2007 | | | 2006 | | | 2005 | |
Net Asset Value, Beginning of Period | | $ | 45.89 | | | $ | 58.05 | | | $ | 31.56 | | | $ | 24.43 | | | $ | 20.45 | |
| | | | | |
Income from Investment Operations: | | | | | | | | | | | | | | | | | | | | |
Net investment income (loss) (a) | | | 0.09 | | | | (0.22 | ) | | | (0.07 | ) | | | 0.05 | | | | 0.14 | |
Net realized and unrealized gain (loss) on investments and foreign currency | | | (2.12 | ) | | | (11.90 | ) | | | 26.57 | | | | 7.35 | | | | 3.90 | |
| | | | | | | | | | | | | | | | | | | | |
Total from investment operations | | | (2.03 | ) | | | (12.12 | ) | | | 26.50 | | | | 7.40 | | | | 4.04 | |
| | | | | |
Less Distributions to Shareholders: | | | | | | | | | | | | | | | | | | | | |
From net investment income | | | — | | | | (0.06 | ) | | | (0.01 | ) | | | (0.27 | ) | | | (0.06 | ) |
From net realized gains | | | (0.54 | ) | | | (0.03 | ) | | | — | | | | — | | | | — | |
| | | | | | | | | | | | | | | | | | | | |
Total distributions to shareholders | | | (0.54 | ) | | | (0.09 | ) | | | (0.01 | ) | | | (0.27 | ) | | | (0.06 | ) |
| | | | | |
Increase from regulatory settlements | | | 0.02 | | | | — | | | | — | | | | — | | | | — | |
| | | | | |
Redemption Fees: | | | | | | | | | | | | | | | | | | | | |
Redemption fees added to paid-in-capital (a) | | | 0.02 | | | | 0.05 | | | | — | (b) | | | — | (b) | | | — | (b) |
| | | | | |
Net Asset Value, End of Period | | $ | 43.36 | | | $ | 45.89 | | | $ | 58.05 | | | $ | 31.56 | | | $ | 24.43 | |
Total return (c) | | | (3.99 | )% | | | (20.84 | )% | | | 83.97 | % | | | 30.58 | %(d)(e) | | | 19.75 | % |
| | | | | |
Ratios to Average Net Assets/Supplemental Data: | | | | | | | | | | | | | | | | | | | | |
Net expenses before interest expense (f) | | | 2.44 | % | | | 2.30 | % | | | 2.34 | % | | | 2.48 | % | | | 2.51 | % |
Interest expense | | | — | %(g) | | | — | %(g) | | | — | %(g) | | | — | | | | — | |
Net expenses (f) | | | 2.44 | % | | | 2.30 | % | | | 2.34 | % | | | 2.48 | % | | | 2.51 | % |
Waiver/Reimbursement | | | — | | | | — | | | | — | | | | 0.01 | % | | | — | |
Net investment income (loss) (f) | | | 0.24 | % | | | (0.38 | )% | | | (0.17 | )% | | | 0.20 | % | | | 0.60 | % |
Portfolio turnover rate | | | 39 | % | | | 16 | % | | | 36 | % | | | 32 | % | | | 24 | % |
Net assets, end of period (000s) | | $ | 36,395 | | | $ | 39,620 | | | $ | 51,938 | | | $ | 22,229 | | | $ | 13,853 | |
| (a) | Per share data was calculated using the average shares outstanding during the period. |
| (b) | Rounds to less than $0.01 per share. |
| (c) | Total return at net asset value assuming all distributions reinvested and no contingent deferred sales charge. |
| (d) | Had the investment advisor and/or any of its affiliates not waived fees or reimbursed a portion of expenses, total return would have been reduced. |
| (e) | Includes a voluntary reimbursement by the investment advisor for a realized investment loss due to a trading error. This reimbursement increased total return and net asset value per share by 0.03% and $0.01, respectively. |
| (f) | The benefits derived from expense reductions had an impact of less than 0.01%. |
| (g) | Rounds to less than 0.01%. |
See Accompanying Notes to Financial Statements.
17
Financial Highlights – Columbia Greater China Fund
Selected data for a share outstanding throughout each period is as follows:
| | | | | | | | | | | | | | | | | | | | |
| | | Year Ended August 31, | |
| Class Z Shares | | 2009 | | | 2008 | | | 2007 | | | 2006 | | | 2005 | |
Net Asset Value, Beginning of Period | | $ | 48.38 | | | $ | 61.05 | | | $ | 33.10 | | | $ | 25.59 | | | $ | 21.38 | |
| | | | | |
Income from Investment Operations: | | | | | | | | | | | | | | | | | | | | |
Net investment income (a) | | | 0.44 | | | | 0.38 | | | | 0.37 | | | | 0.37 | | | | 0.40 | |
Net realized and unrealized gain (loss) on investments and foreign currency | | | (2.12 | ) | | | (12.47 | ) | | | 27.90 | | | | 7.65 | | | | 4.07 | |
| | | | | | | | | | | | | | | | | | | | |
Total from investment operations | | | (1.68 | ) | | | (12.09 | ) | | | 28.27 | | | | 8.02 | | | | 4.47 | |
| | | | | |
Less Distributions to Shareholders: | | | | | | | | | | | | | | | | | | | | |
From net investment income | | | — | | | | (0.60 | ) | | | (0.32 | ) | | | (0.51 | ) | | | (0.26 | ) |
From net realized gains | | | (0.54 | ) | | | (0.03 | ) | | | — | | | | — | | | | — | |
| | | | | | | | | | | | | | | | | | | | |
Total distributions to shareholders | | | (0.54 | ) | | | (0.63 | ) | | | (0.32 | ) | | | (0.51 | ) | | | (0.26 | ) |
| | | | | |
Increase from regulatory settlements | | | 0.02 | | | | — | | | | — | | | | — | | | | — | |
| | | | | |
Redemption Fees: | | | | | | | | | | | | | | | | | | | | |
Redemption fees added to paid-in-capital (a) | | | 0.02 | | | | 0.05 | | | | — | (b) | | | — | (b) | | | — | (b) |
| | | | | |
Net Asset Value, End of Period | | $ | 46.20 | | | $ | 48.38 | | | $ | 61.05 | | | $ | 33.10 | | | $ | 25.59 | |
Total return (c) | | | (3.05 | )% | | | (20.04 | )% | | | 85.88 | % | | | 31.86 | %(d)(e) | | | 21.00 | % |
| | | | | |
Ratios to Average Net Assets/Supplemental Data: | | | | | | | | | | | | | | | | | | | | |
Net expenses before interest expense (f) | | | 1.44 | % | | | 1.30 | % | | | 1.34 | % | | | 1.48 | % | | | 1.51 | % |
Interest expense | | | — | %(g) | | | — | %(g) | | | — | %(g) | | | — | | | | — | |
Net expenses (f) | | | 1.44 | % | | | 1.30 | % | | | 1.34 | % | | | 1.48 | % | | | 1.51 | % |
Waiver/Reimbursement | | | — | | | | — | | | | — | | | | 0.01 | % | | | — | |
Net investment income (f) | | | 1.17 | % | | | 0.62 | % | | | 0.82 | % | | | 1.25 | % | | | 1.60 | % |
Portfolio turnover rate | | | 39 | % | | | 16 | % | | | 36 | % | | | 32 | % | | | 24 | % |
Net assets, end of period (000s) | | $ | 47,266 | | | $ | 43,170 | | | $ | 52,903 | | | $ | 19,821 | | | $ | 9,012 | |
| (a) | Per share data was calculated using the average shares outstanding during the period. |
| (b) | Rounds to less than $0.01 per share. |
| (c) | Total return at net asset value assuming all distributions reinvested. |
| (d) | Had the investment advisor and/or any of its affiliates not waived fees or reimbursed a portion of expenses, total return would have been reduced. |
| (e) | Includes a voluntary reimbursement by the investment advisor for a realized investment loss due to a trading error. This reimbursement increased total return and net asset value per share by 0.03% and $0.01, respectively. |
| (f) | The benefits derived from expense reductions had an impact of less than 0.01%. |
| (g) | Rounds to less than 0.01%. |
See Accompanying Notes to Financial Statements.
18
Notes to Financial Statements – Columbia Greater China Fund
August 31, 2009
Note 1. Organization
Columbia Greater China Fund (the “Fund”), a series of Columbia Funds Series Trust I (the “Trust”), is a non-diversified fund. The Trust is registered under the Investment Company Act of 1940, as amended (the “1940 Act”), as an open-end management investment company organized as a Massachusetts business trust.
Investment Objective
The Fund seeks long-term capital appreciation.
Fund Shares
The Trust may issue an unlimited number of shares, and the Fund offers four classes of shares: Class A, Class B, Class C and Class Z. Each share class has its own expense structure and sales charges, as applicable.
Class A shares are subject to a maximum front-end sales charge of 5.75% based on the amount of initial investment. Class A shares purchased without an initial sales charge in accounts aggregating $1 million to $50 million at the time of purchase are subject to a 1.00% contingent deferred sales charge (“CDSC”) on shares sold within one year after purchase. Class B shares are subject to a maximum CDSC of 5.00% based upon the holding period after purchase. Class B shares will convert to Class A shares eight years after purchase. Class C shares are subject to a 1.00% CDSC on shares sold within one year after purchase. Class Z shares are offered continuously at net asset value. There are certain restrictions on the purchase of Class Z shares, as described in the Fund’s prospectus.
Effective June 22, 2009, the Fund no longer accepts investments in Class B shares from new or existing investors in the Fund’s Class B shares, except in connection with the reinvestment of any dividend and/or capital gain distributions in Class B shares of the Fund, and exchanges by existing Class B shareholders of other Columbia Funds.
Note 2. Significant Accounting Policies
The preparation of financial statements in accordance with accounting principles generally accepted in the United States of America (“GAAP”) requires management to make certain estimates and assumptions that affect the reported amounts of assets and liabilities, the disclosure of contingent assets and liabilities at the date of the financial statements and the reported amounts of revenue and expenses during the reporting period. Actual results could differ from those estimates.
Management has evaluated the events and transactions that have occurred through October 22, 2009, the date the financial statements were issued, and except as disclosed in Note 12, noted no items requiring adjustment of the financial statements or additional disclosures.
The following is a summary of significant accounting policies consistently followed by the Fund in the preparation of its financial statements.
Security Valuation
Equity securities are valued at the last sale price on the principal exchange on which they trade, except for securities traded on the NASDAQ, which are valued at the NASDAQ official close price. Unlisted securities or listed securities for which there were no sales during the day are valued at the closing bid price on such exchanges or over-the-counter markets.
Short-term investments maturing in 60 days or less are valued at amortized cost, which approximates market value.
Foreign securities are generally valued at the last sale price on the foreign exchange or market on which they trade. If any foreign share prices are not readily available as a result of limited share activity, the securities are valued at the last sale price of the local shares in the principal market in which such securities are normally traded.
Generally, trading in foreign securities is substantially completed each day at various times prior to the close of the New York Stock Exchange (“NYSE”). The values of such securities used in computing the net asset value of the Fund’s shares are determined as of such times. Foreign currency exchange rates are generally determined at 4:00 p.m. Eastern (U.S.) time. Occasionally, events affecting the values of such foreign securities and such exchange rates may occur between the times at which they are determined and the close of the customary trading session of the NYSE, which would not be reflected in the computation of the Fund’s net asset value. If events materially affecting the values of such foreign securities occur and it is determined that market quotations are not reliable, then these foreign securities will be valued at their fair value using procedures approved by the Board of Trustees.
19
Columbia Greater China Fund
August 31, 2009
The Fund may use a systematic fair valuation model provided by an independent third party to value securities principally traded in foreign markets in order to adjust for possible stale pricing that may occur between the close of the foreign exchanges and the time for valuation.
Investments for which market quotations are not readily available, or that have quotations which management believes are not reliable, are valued at fair value as determined in good faith under consistently applied procedures established by and under the general supervision of the Board of Trustees. If a security is valued at fair value, such value is likely to be different from the last quoted market price for the security. The determination of fair value often requires significant judgment. To determine fair value, management may use assumptions including but not limited to future cash flows and estimated risk premiums. Multiple inputs from various sources may be used to determine value.
Various inputs are used to determine the value of the Fund’s investments. Management establishes a hierarchy that prioritizes the inputs to valuation techniques used to measure fair value giving the highest priority to unadjusted quoted prices in active markets for identical securities (level 1 measurements) and the lowest priority to unobservable inputs (level 3 measurements) when market prices are not readily available or reliable. The three levels of the fair value hierarchy are described below:
| n | | Level 1 — quoted prices in active markets for identical securities |
| n | | Level 2 — prices determined using other significant observable inputs (including quoted prices for similar securities, interest rates, prepayment speeds, credit risk and others) |
| n | | Level 3 — prices determined using significant unobservable inputs. In situations where quoted prices or observable inputs are unavailable or less reliable, unobservable inputs may be used. Unobservable inputs may include management’s own assumptions about the factors market participants would use in pricing an investment. |
The inputs or methodology used for valuing securities are not necessarily an indication of the risk associated with investing in those securities.
Security Transactions
Security transactions are accounted for on the trade date. Cost is determined and gains (losses) are based upon the specific identification method for both financial statement and federal income tax purposes.
Repurchase Agreements
The Fund may engage in repurchase agreement transactions with institutions that Columbia Management Advisors, LLC (“Columbia”), the Fund’s investment advisor, has determined are creditworthy. The Fund, through its custodian, receives delivery of the underlying securities collateralizing a repurchase agreement. Columbia is responsible for determining that the collateral is at least equal, at all times, to the value of the repurchase obligation including interest. A repurchase agreement transaction involves certain risks in the event of default or insolvency of the counterparty. These risks include possible delays in or restrictions on the Fund’s ability to dispose of the underlying securities and a possible decline in the value of the underlying securities during the period while the Fund seeks to assert its rights.
Foreign Currency Transactions and Translations
The values of all assets and liabilities quoted in foreign currencies are translated into U.S. dollars at that day’s exchange rates. Net realized and unrealized gains (losses) on foreign currency transactions and translations include gains (losses) arising from the fluctuation in exchange rates between trade and settlement dates on securities transactions, gains (losses) arising from the disposition of foreign currency and currency gains (losses) between the accrual and payment dates on dividends, interest income and foreign withholding taxes.
For financial statement purposes, the Fund does not distinguish that portion of gains (losses) on investments which is due to changes in foreign exchange rates from that which is due to changes in market prices of the investments. Such fluctuations are included with the net realized and unrealized gains (losses) on investments on the Statement of Operations.
20
Columbia Greater China Fund
August 31, 2009
Income Recognition
Interest income is recorded on the accrual basis. Corporate actions and dividend income are recorded on the ex-date except for certain foreign securities which are recorded as soon after the ex-date as the Fund becomes aware of such, net of any non-reclaimable tax withholdings.
Expenses
General expenses of the Trust are allocated to the Fund and other series of the Trust based upon relative net assets or other expense allocation methodologies determined by the nature of the expense. Expenses directly attributable to the Fund are charged to the Fund.
Determination of Class Net Asset Value
All income, expenses (other than class-specific expenses, as shown on the Statement of Operations) and realized and unrealized gains (losses) are allocated to each class of the Fund on a daily basis, based on the relative net assets of each class, for purposes of determining the net asset value of each class.
Federal Income Tax Status
The Fund intends to qualify each year as a “regulated investment company” under Subchapter M of the Internal Revenue Code, as amended, and will distribute substantially all of its tax exempt or taxable income, if any, for its tax year, and as such will not be subject to federal income taxes. In addition, the Fund intends to distribute in each calendar year substantially all of its net investment income, capital gains and certain other amounts, if any, such that the Fund should not be subject to federal excise tax. Therefore, no federal income or excise tax provision is recorded.
Distributions to Shareholders
Distributions from net investment income, if any, are declared and paid annually. Net realized capital gains, if any, are declared and distributed at least annually. Income distributions and capital gain distributions are determined in accordance with federal income tax regulations which may differ from GAAP.
Indemnification
In the normal course of business, the Fund enters into contracts that contain a variety of representations and warranties and which provide general indemnities. The Fund’s maximum exposure under these arrangements is unknown because this would involve future claims against the Fund. Also, under the Trust’s organizational documents and by contract, the Trustees and officers of the Trust are indemnified against certain liabilities that may arise out of actions relating to their duties to the Trust. However, based on experience, the Fund expects the risk of loss due to these representations, warranties and indemnities to be minimal.
Note 3. Federal Tax Information
The timing and character of income and capital gain distributions are determined in accordance with income tax regulations, which may differ from GAAP. Reclassifications are made to the Fund’s capital accounts for permanent tax differences to reflect income and gains available for distribution (or available capital loss carryforwards) under income tax regulations.
For the year ended August 31, 2009, permanent book and tax basis differences resulting primarily from differing treatments for foreign currency transactions, distribution reclassifications, fair fund settlements, litigation proceeds and passive foreign investment company (“PFIC”) adjustments were identified and reclassified among the components of the Fund’s net assets as follows:
| | | | |
| | | | | |
Undistributed Net Investment
Income | | Accumulated
Net Realized
Loss | | Paid-In Capital |
| $523,601 | | $(420,348) | | $(103,253) |
Net investment income and net realized gains (losses), as disclosed on the Statement of Operations, and net assets were not affected by this reclassification.
The tax character of distributions paid during the years ended August 31, 2009 and August 31, 2008 was as follows:
| | | | | | |
| | | | | |
| | | August 31, 2009 | | August 31, 2008 |
Distributions paid
from: | | | | |
Ordinary Income* | | $ | 16,410 | | $ | 2,190,102 |
Long-Term Capital Gains | | | 2,519,791 | | | 192,927 |
| * | For tax purposes short-term capital gain distributions, if any, are considered ordinary income distributions. |
21
Columbia Greater China Fund
August 31, 2009
As of August 31, 2009, the components of distributable earnings on a tax basis were as follows:
| | | | |
| | | | | |
Undistributed
Ordinary
Income | | Undistributed
Long-Term
Capital Gains | | Net Unrealized
Appreciation |
| $908,872 | | $— | | $78,918,060 |
Unrealized appreciation and depreciation at August 31, 2009, based on cost of investments for federal income tax purposes and excluding any unrealized appreciation and depreciation from changes in the value of other assets and liabilities resulting from changes in exchange rates, were:
| | | | |
| | | | |
Unrealized appreciation | | $ | 82,683,492 | |
Unrealized depreciation | | | (3,765,432 | ) |
Net unrealized appreciation | | $ | 78,918,060 | |
The following capital loss carryforwards may be available to reduce taxable income arising from future net realized gains on investments, if any, to the extent permitted by the Internal Revenue Code:
| | |
| | | |
| Year of Expiration | | Capital Loss Carryforwards |
| 2017 | | $11,181,842 |
Under current tax rules, certain capital losses realized after October 31 may be deferred and treated as occurring on the first day of the following fiscal year. As of August 31, 2009, post-October capital losses of $4,366,233 attributed to security transactions were deferred to September 1, 2009.
Management is required to determine whether a tax position of the Fund is more likely than not to be sustained upon examination by the applicable taxing authority, including resolution of any related appeals or litigation processes, based on the technical merits of the position. The tax benefit to be recognized by the Fund is measured as the largest amount of benefit that is greater than fifty percent likely of being realized upon ultimate settlement. Management is not aware of any tax positions for which it is reasonably possible that the total amounts of unrecognized tax benefits will significantly change in the next twelve months. However, management’s conclusions may be subject to review and adjustment at a later date based on factors including, but not limited to, new tax laws, regulations, and administrative interpretations (including relevant court decisions). The Fund’s federal tax returns for the prior three fiscal years remain subject to examination by the Internal Revenue Service.
Note 4. Fees and Compensation Paid to Affiliates
Investment Advisory Fee
Columbia, an indirect, wholly owned subsidiary of Bank of America Corporation (“BOA”), provides investment advisory, administrative and other services to the Fund. In rendering investment advisory services to the Fund, Columbia may use the portfolio management and research resources of Columbia Management Pte. Ltd, an affiliate of Columbia. Columbia receives a monthly investment advisory fee based on the Fund’s average daily net assets at the following annual rates:
| | |
| | | |
| Average Daily Net Assets | | Annual Fee Rate |
First $1 billion | | 0.95% |
$1 billion to $1.5 billion | | 0.87% |
$1.5 billion to $3 billion | | 0.82% |
$3 billion to $6 billion | | 0.77% |
Over $6 billion | | 0.72% |
For the year ended August 31, 2009, the Fund’s effective investment advisory fee rate was 0.95% of the Fund’s average daily net assets.
Pricing and Bookkeeping Fees
The Fund has entered into a Financial Reporting Services Agreement (the “Financial Reporting Services Agreement”) with State Street Bank & Trust Company (“State Street”) and Columbia pursuant to which State Street provides financial reporting services to the Fund. The Fund has also entered into an Accounting Services Agreement (collectively with the Financial Reporting Services Agreement, the “State Street Agreements”) with State Street and Columbia pursuant to which State Street provides accounting services to the Fund. Under the State Street Agreements, the Fund pays State Street an annual fee of $38,000 paid monthly plus an additional monthly fee based on an annualized percentage
22
Columbia Greater China Fund
August 31, 2009
rate of average daily net assets of the Fund for the month. The aggregate fee will not exceed $140,000 per year (exclusive of out-of-pocket expenses and charges). The Fund also reimburses State Street for certain out-of-pocket expenses and charges.
The Fund has entered into a Pricing and Bookkeeping Oversight and Services Agreement (the “Services Agreement”) with Columbia. Under the Services Agreement, Columbia provides services related to Fund expenses and the requirements of the Sarbanes-Oxley Act of 2002, and provides oversight of the accounting and financial reporting services provided by State Street. Under the Services Agreement, the Fund reimburses Columbia for out-of-pocket expenses.
Transfer Agent Fee
Columbia Management Services, Inc. (the “Transfer Agent”), an affiliate of Columbia and an indirect, wholly owned subsidiary of BOA, provides shareholder services to the Fund and has contracted with Boston Financial Data Services (“BFDS”) to serve as sub-transfer agent. The Transfer Agent is entitled to receive a fee for its services, paid monthly, at the annual rate of $17.34 per open account plus reimbursement of certain sub-transfer agent fees paid by the Transfer Agent (exclusive of BFDS fees), calculated based on assets held in omnibus accounts and intended to recover the cost of payments to other parties (including affiliates of BOA) for services to those accounts. The Transfer Agent pays the fees of BFDS for services as sub-transfer agent and is not entitled to reimbursement for such fees from the Fund.
The Transfer Agent may also retain, as additional compensation for its services, fees for wire, telephone and redemption orders, Individual Retirement Account (“IRA”) trustee agent fees and account transcript fees due to the Transfer Agent from shareholders of the Fund and credits (net of bank charges) earned with respect to balances in accounts the Transfer Agent maintains in connection with its services to the Fund. The Transfer Agent also receives reimbursement for certain out-of-pocket expenses.
An annual minimum account balance fee of $20 may apply to certain accounts with a value below the Fund’s initial minimum investment requirements to reduce the impact of small accounts on transfer agent fees. These minimum account balance fees are recorded as part of expense reductions on the Statement of Operations. For the year ended August 31, 2009, no minimum account balance fees were charged by the Fund.
Underwriting Discounts, Service and Distribution Fees
Columbia Management Distributors, Inc. (the “Distributor”), an affiliate of Columbia and an indirect, wholly owned subsidiary of BOA, is the principal underwriter of the Fund’s shares. For the year ended August 31, 2009, the Distributor has retained net underwriting discounts of $46,382 on sales of the Fund’s Class A shares and received net CDSC fees of $1,663, $48,758 and $20,840 on Class A, Class B and Class C share redemptions, respectively.
The Fund has adopted plans pursuant to Rule 12b-1 under the 1940 Act (the “Plans”) which require the payment of a monthly service fee to the Distributor at the maximum annual rate of 0.25% of the average daily net assets attributable to Class A, Class B and Class C shares of the Fund. The Plans also require the payment of a monthly distribution fee to the Distributor at the maximum annual rate of 0.75% of the average daily net assets attributable to Class B and Class C shares only.
The CDSC and the distribution fees received from the Plans are used principally as repayment to the Distributor for amounts paid by the Distributor to dealers who sold such shares.
Expense Limits and Fee Waivers
Effective January 1, 2009, Columbia has voluntarily agreed to reimburse a portion of the Fund’s expenses so that the Fund’s ordinary operating expenses (excluding any distribution and service fees, brokerage commissions, interest, taxes and extraordinary expenses, but including custodian charges relating to overdrafts, if any), after giving effect to any balance credits from the Fund’s custodian, do not exceed 1.40% annually of the Fund’s average daily net assets. Columbia, in its discretion, may revise or discontinue this arrangement at any time.
Fees Paid to Officers and Trustees
All officers of the Fund are employees of Columbia or its affiliates and, with the exception of the Fund’s Chief Compliance Officer, receive no compensation from the Fund. The Board of Trustees has appointed a Chief Compliance
23
Columbia Greater China Fund
August 31, 2009
Officer to the Fund in accordance with federal securities regulations. The Fund, along with other affiliated funds, pays its pro-rata share of the expenses associated with the Chief Compliance Officer. The Fund’s expenses for the Chief Compliance Officer will not exceed $15,000 per year.
The Trust’s eligible Trustees may participate in a deferred compensation plan which may be terminated at any time. Obligations of the plan will be paid solely out of the Fund’s assets.
Note 5. Custody Credits
The Fund has an agreement with its custodian bank under which custody fees may be reduced by balance credits. These credits are recorded as part of expense reductions on the Statement of Operations. The Fund could have invested a portion of the assets utilized in connection with the expense offset arrangement in an income-producing asset if it had not entered into such an agreement.
For the year ended August 31, 2009, these custody credits reduced total expenses by $31 for the Fund.
Note 6. Portfolio Information
For the year ended August 31, 2009, the cost of purchases and proceeds from sales of securities, excluding short-term obligations, for the Fund were $70,264,051 and $76,958,408, respectively.
Note 7. Redemption Fees
The Fund may impose a 2.00% redemption fee on the proceeds of fund shares that are redeemed within 60 days of purchase. The redemption fee is designed to offset brokerage commissions and other costs associated with short term trading of fund shares. The redemption fees, which are retained by the Fund, are accounted for as an addition to paid-in capital and are allocated to each class based on the relative net assets at the time of the redemption. For the year ended August 31, 2009, the redemption fees for Class A, Class B, Class C and Class Z of the Fund amounted to $53,772, $7,827, $14,526 and $17,441, respectively.
Note 8. Regulatory Settlements
As of August 31, 2009, the Fund had received payments of $103,255 relating to certain regulatory settlements with third parties the Fund had participated in during the year. The payments have been included in “Increase from regulatory settlements” on the Statement of Changes in Net Assets.
Note 9. Line of Credit
The Fund and other affiliated funds participate in a $280,000,000 committed, unsecured revolving line of credit provided by State Street. The maximum amount that may be borrowed by any fund is limited to the lesser of $200,000,000 and the Fund’s borrowing limit set forth in the Fund’s registration statement. Borrowings are available for short-term liquidity or temporary or emergency purposes.
Interest is charged to each participating fund based on the fund’s borrowings at a rate per annum equal to the greater of the Federal Funds Rate plus 0.50% or the overnight LIBOR Rate plus 0.50%. In addition, an annual operations agency fee of $20,000, an amendment fee of 0.02% and a commitment fee of 0.12% per annum are accrued and apportioned among the participating funds pro rata based on their relative net assets. Prior to October 16, 2008, the Fund and other affiliated funds participated in a $350,000,000 committed, unsecured revolving line of credit and a $150,000,000 uncommitted, unsecured line of credit, both provided by State Street. Interest on the committed line of credit was charged to each participating fund based on the fund’s borrowings at a rate per annum equal to the Federal Funds Rate plus 0.50%. In addition, a commitment fee of 0.10% per annum was accrued and apportioned among the participating funds pro rata based on their relative net assets. Interest on the uncommitted line of credit was charged to each participating fund based on the fund’s borrowings at a rate per annum equal to the Federal Funds Rate plus 0.375%. State Street charged an annual operations agency fee of $40,000 for the committed line of credit and was able to charge an annual administration fee of $15,000 for the uncommitted line of credit. The commitment fee, the operations agency fee and the administration fee were accrued and apportioned among the participating funds pro rata based on their relative net assets.
For the year ended August 31, 2009, the average daily loan balance outstanding on days where borrowing existed was $2,000,000 at a weighted average interest rate of 2.56%.
24
Columbia Greater China Fund
August 31, 2009
Note 10. Shares of Beneficial Interest
As of August 31, 2009, 14.9% of the Fund’s shares outstanding were beneficially owned by one participant account over which BOA and/or any of its affiliates had either sole or joint investment discretion.
Subscription and redemption activity of this account may have a significant effect on the operations of the Fund.
Note 11. Significant Risks and Contingencies
Sector Focus Risk
The Fund may focus its investments in certain sectors, subjecting it to greater risk than a fund that is less focused.
Non-Diversification Risk
As a non-diversified mutual fund, the Fund is permitted to invest a greater percentage of its total assets in the securities of fewer issuers than a diversified fund. The Fund may, therefore, have a greater risk of loss from a few issuers than a similar fund that invests more broadly.
Foreign Securities Risk
There are certain additional risks involved when investing in foreign securities. These risks may involve foreign currency exchange rate fluctuations, adverse political and economic developments and the possible prevention of currency exchange or other foreign governmental laws or restrictions. In addition, the liquidity of foreign securities may be more limited than that of domestic securities.
Investments in emerging market countries are subject to additional risk. The risk of foreign investments is typically increased in less developed countries. These countries are also more likely to experience high levels of inflation, deflation or currency devaluation which could hurt their economies and securities markets.
Geographic Concentration Risk
Because the Fund’s investments are concentrated in the Greater China region, events within the region will have a greater effect on the Fund than if the Fund were more geographically diversified. In addition, events in any one country within the region may impact the other countries or the region as a whole. Markets in the region can experience significant volatility due to social, regulatory and political uncertainties.
Legal Proceedings
Columbia Management Advisors, LLC and Columbia Management Distributors, Inc. (collectively, the “Columbia Group”) are subject to a settlement agreement with the New York Attorney General (“NYAG”) (the “NYAG Settlement”) and a settlement order with the SEC (the “SEC Order”) on matters relating to mutual fund trading, each dated February 9, 2005. Under the terms of the SEC Order, the Columbia Group (or predecessor entities) agreed, among other things, to: pay disgorgement and civil money penalties collectively totaling $140 million; cease and desist from violations of the antifraud provisions and certain other provisions of the federal securities laws; maintain certain compliance and ethics oversight structures; and retain an independent consultant to review the Columbia Group’s applicable supervisory, compliance, control and other policies and procedures. The NYAG Settlement, among other things, requires Columbia Management Advisors, LLC and its affiliates to reduce management fees for certain funds in the Columbia family of mutual funds in a projected total of $160 million over five years through November 30, 2009 and to make certain disclosures to investors relating to expenses. In connection with the Columbia Group providing services to the Columbia Funds, the Columbia Funds have voluntarily undertaken to implement certain governance measures designed to maintain the independence of their boards of trustees and certain special consulting and compliance measures.
Pursuant to the SEC Order and related procedures, the $140 million in settlement amounts described above has been substantially distributed in accordance with a distribution plan that was developed by an independent distribution consultant and approved by the SEC on April 6, 2007.
In connection with the events described above, various parties have filed suit against certain funds, the Trustees of the Columbia Funds, FleetBoston Financial Corporation and its affiliated entities and/or Bank of America and its affiliated entities.
On February 20, 2004, the Judicial Panel on Multidistrict Litigation transferred these cases and cases against other mutual fund companies based on similar allegations to the United States District Court in Maryland for consolidated or coordinated pretrial proceedings (the “MDL”). Subsequently, additional related cases were transferred to the MDL. On
25
Columbia Greater China Fund
August 31, 2009
September 29, 2004, the plaintiffs in the MDL filed amended and consolidated complaints. One of these amended complaints is a putative class action that includes claims under the federal securities laws and state common law, and that names Columbia Management Advisors, Inc. (which has since merged into Banc of America Capital Management, LLC (now named Columbia Management Advisors, LLC)) (“Columbia”), Columbia Funds Distributor, Inc. (now named Columbia Management Distributors, Inc.) (the “Distributor”), the Trustees of the Columbia Funds, Bank of America Corporation and others as defendants. Another of the amended complaints is a derivative action purportedly on behalf of the Columbia Funds that asserts claims under federal securities laws and state common law.
On February 25, 2005, Columbia and other defendants filed motions to dismiss the claims in the pending cases. On March 1, 2006, for reasons stated in the court’s memoranda dated November 3, 2005, the United States District Court for the District of Maryland granted in part and denied in part the defendants’ motions to dismiss. The court dismissed all of the class action claims pending against the Columbia Funds Trusts. As to Columbia and the Distributor, the claims under the Securities Act of 1933, the claims under Sections 34(b) and 36(a) of the Investment Company Act of 1940 (“ICA”) and the state law claims were dismissed. The claims under Sections 10(b) and 20(a) of the Securities Exchange Act of 1934 and claims under Section 36(b) of the ICA were not dismissed.
On March 21, 2005, a purported class action was filed in Massachusetts state court alleging that certain conduct, including market timing, entitled Class B shareholders in certain Columbia Funds to an exemption from contingent deferred sales charges upon early redemption (the “CDSC Lawsuit”). The CDSC Lawsuit was removed to federal court in Massachusetts and transferred to the MDL.
On September 14, 2007, the plaintiffs and the Columbia defendants named in the MDL, including the Columbia Funds, entered into a stipulation of settlement with respect to all Columbia-related claims in the MDL described above, including the CDSC Lawsuit. The settlement is subject to court approval.
Note 12. Subsequent Events
On October 15, 2009 the committed line of credit discussed in Note 9 was renewed on amended terms. Pursuant to the amended terms, interest is charged to each participating fund based on the fund’s borrowings at a rate per annum equal to the greater of the Federal Funds Rate plus 1.25% or the overnight LIBOR Rate plus 1.25%. In addition, a commitment fee of 0.15% per annum is accrued and apportioned among the participating funds pro rata based on their relative net assets. The annual operations agency fee of $20,000 was waived.
Bank of America Corporation, the indirect parent company of Columbia, entered into an agreement dated September 29, 2009 to sell a portion of the asset management business of Columbia Management Group, LLC to Ameriprise Financial, Inc. The transaction (“Transaction”) includes a sale of the part of the asset management business that advises long-term mutual funds, including the Fund. The Transaction is subject to certain approvals and other conditions to closing, and is currently expected to close in the spring of 2010.
26
Report of Independent Registered Public Accounting Firm
To the Trustees of the Columbia Funds Series Trust I and the Shareholders of Columbia Greater China Fund
In our opinion, the accompanying statement of assets and liabilities, including the investment portfolio, and the related statements of operations and of changes in net assets and the financial highlights present fairly, in all material respects, the financial position of Columbia Greater China Fund (the “Fund”) (a series of Columbia Funds Series Trust I), at August 31, 2009, the results of its operations for the year then ended, the changes in its net assets for each of the two years in the period then ended and the financial highlights for each of the five years in the period then ended, in conformity with accounting principles generally accepted in the United States of America. These financial statements and financial highlights (hereafter referred to as “financial statements”) are the responsibility of the Fund’s management. Our responsibility is to express an opinion on these financial statements based on our audits. We conducted our audits of these financial statements in accordance with the standards of the Public Company Accounting Oversight Board (United States). Those standards require that we plan and perform the audit to obtain reasonable assurance about whether the financial statements are free of material misstatement. An audit includes examining, on a test basis, evidence supporting the amounts and disclosures in the financial statements, assessing the accounting principles used and significant estimates made by management, and evaluating the overall financial statement presentation. We believe that our audits, which included confirmation of securities at August 31, 2009 by correspondence with the custodian and brokers, provide a reasonable basis for our opinion.
PricewaterhouseCoopers LLP
Boston, Massachusetts
October 22, 2009
27
Federal Income Tax Information (Unaudited)
Foreign taxes paid during the fiscal year ended August 31, 2009, of $361,282 are being passed through to shareholders. This represents $0.07 per share. Eligible shareholders may claim this amount as a foreign tax credit.
Gross income derived from sources within foreign countries amounted to $5,024,631 ($1.00 per share) for the period ended August 31, 2009.
The Fund will notify shareholders in January 2010, of amounts for use in preparing 2009 income tax returns.
28
Fund Governance
The Trustees serve terms of indefinite duration. The names, addresses and ages of the Trustees and officers of the Funds in the Columbia Funds Series Trust I, the year each was first elected or appointed to office, their principal business occupations during at least the last five years, the number of Funds overseen by each Trustee and other directorships they hold are shown below. Each officer listed below serves as an officer of each Fund in the Columbia Funds Complex.
Independent Trustees
| | |
Name, Address and Year of Birth,
Position with Funds, Year First
Elected or Appointed to Office | | Principal Occupation(s) During Past Five Years, Number of Funds in the Columbia
Funds Complex Overseen by Trustee, Other Directorships Held |
| |
| John D. Collins (Born 1938) | | |
c/o Columbia Management Advisors, LLC One Financial Center Boston, MA 02111 Trustee (since 2007) | | Retired. Consultant, KPMG, LLP (accounting and tax firm) from July 1999 to June 2000; Partner, KPMG, LLP from March 1962 to June 1999. Oversees 66; Mrs. Fields Famous Brands LLC (consumer products); Suburban Propane Partners, L.P.; and Montpelier Re (underwriting firm) |
| |
| Rodman L. Drake (Born 1943) | | |
c/o Columbia Management Advisors, LLC One Financial Center Boston, MA 02111 Trustee (since 2007)
and Chairman of the Board
(since 2009) | | Co-Founder of Baringo Capital LLC (private equity) since 2002; President, Continuation Investments Group, Inc. from 1997 to 2001. Oversees 66; Jackson Hewitt Tax Service Inc. (tax preparation services); Crystal Capital River Inc. (real estate investment trust); Student Loan Corporation (student loan provider); Celgene Corporation (global biotechnology company); Apex Silver Mines Ltd. (mining); and Helios Total Return Fund, Inc. and Helios Strategic Mortgage Income Fund, Inc. (exchange-traded funds) |
| |
| Douglas A. Hacker (Born 1955) | | |
c/o Columbia Management Advisors, LLC One Financial Center Boston, MA 02111 Trustee (since 1996) | | Independent business executive since May 2006; Executive Vice President–Strategy of United Airlines (airline) from December 2002 to May 2006; President of UAL Loyalty Services (airline marketing company) from September 2001 to December 2002; Executive Vice President and Chief Financial Officer of United Airlines from July 1999 to September 2001. Oversees 66; Nash Finch Company (food distributor); Aircastle Limited (aircraft leasing) |
|
| Janet Langford Kelly (Born 1957) |
c/o Columbia Management Advisors, LLC One Financial Center Boston, MA 02111 Trustee (since 1996) | | Senior Vice President, General Counsel and Corporate Secretary, ConocoPhillips (integrated energy company) since September 2007; Deputy General Counsel–Corporate Legal Services, ConocoPhillips from August 2006 to August 2007; Partner, Zelle, Hofmann, Voelbel, Mason & Gette LLP (law firm) from March 2005 to July 2006; Adjunct Professor of Law, Northwestern University, from September 2004 to June 2006; Director, UAL Corporation (airline) from February 2006 to July 2006; Oversees 66; None |
| |
| Charles R. Nelson (Born 1942) | | |
c/o Columbia Management Advisors, LLC One Financial Center Boston, MA 02111 Trustee (since 1981) | | Professor of Economics, University of Washington, since January 1976; Ford and Louisa Van Voorhis Professor of Political Economy, University of Washington, since September 1993; Adjunct Professor of Statistics, University of Washington, since September 1980; Associate Editor, Journal of Money Credit and Banking from 1993 to 2008; Consultant on econometric and statistical matters. Oversees 66; None |
29
Fund Governance (continued)
Independent Trustees (continued)
| | |
Name, Address and Year of Birth,
Position with Funds, Year First
Elected or Appointed to Office | | Principal Occupation(s) During Past Five Years, Number of Funds in the Columbia
Funds Complex Overseen by Trustee, Other Directorships Held |
| |
| John J. Neuhauser (Born 1943) | | |
c/o Columbia Management Advisors, LLC One Financial Center Boston, MA 02111 Trustee (since 1985) | | President, Saint Michael’s College, since August 2007; University Professor, Boston College from November 2005 to August 2007; Academic Vice President and Dean of Faculties, Boston College from August 1999 to October 2005. Oversees 66; Liberty All-Star Equity Fund and Liberty All-Star Growth Fund, Inc. (closed-end funds) |
| |
| Jonathan Piel (Born 1938) | | |
c/o Columbia Management Advisors, LLC One Financial Center Boston, MA 02111 Trustee (since 2007) | | Cable television producer and website designer; The Editor, Scientific American from 1984 to 1994; Vice President, Scientific American, Inc., from 1984 to 1994; Member, Advisory Board, Stone Age Institute, Bloomington, Indiana (research institute that explores the effect of technology on human evolution); Member, Board of Directors of the National Institute of Social Sciences, New York City; Member, Board of Trustees of the William Alanson White Institute, New York City (institution for training psychoanalysts); and Member, Advisory Board, Mount Sinai Children’s Environmental Health Center, New York. Oversees 66; None |
| |
| Patrick J. Simpson (Born 1944) | | |
c/o Columbia Management Advisors, LLC One Financial Center Boston, MA 02111 Trustee (since 2000) | | Partner, Perkins Coie LLP (law firm). Oversees 66; None |
|
| Thomas C. Theobald (Born 1937) |
c/o Columbia Management Advisors, LLC One Financial Center Boston, MA 02111 Trustee (since 1996) | | Partner and Senior Advisor, Chicago Growth Partners (private equity investing) since September 2004; Managing Director, William Blair Capital Partners (private equity investing) from September 1994 to September 2004. Oversees 66; Anixter International (network support equipment distributor); Ventas, Inc. (real estate investment trust); Jones Lang LaSalle (real estate management services); Ambac Financial Group (financial guaranty insurance) |
| |
| Anne-Lee Verville (Born 1945) | | |
c/o Columbia Management Advisors, LLC One Financial Center Boston, MA 02111 Trustee (since 1998) | | Retired since 1997 (formerly General Manager–Global Education Industry (from 1994 to 1997), President–Application Systems Division (from 1991 to 1994), Chief Financial Officer–US Marketing & Services (from 1988 to 1991), and Chief Information Officer (from 1987 to 1988), IBM Corporation (computer and technology)). Oversees 66; None |
Interested Trustee
| | |
| |
| William E. Mayer1 (Born 1940) | | |
c/o Columbia Management Advisors, LLC One Financial Center Boston, MA 02111 Trustee (since 1994) | | Partner, Park Avenue Equity Partners (private equity) since February 1999; Dean and Professor, College of Business, University of Maryland from 1992 to 1997. Oversees 66; Lee Enterprises (print media); WR Hambrecht + Co. (financial service provider); BlackRock Kelso Capital Corporation (investment company) |
| 1 | The Funds currently treat Mr. Mayer as an “interested person” (as defined in the Investment Company Act of 1940) by reason of his affiliation with WR Hambrecht + Co., a registered broker/dealer that may execute portfolio transactions for or engage in principal transactions with the Funds or other funds or accounts advised/managed by the Advisor or other Bank of America affiliates. |
The Statement of Additional Information includes additional information about the Trustees of the Funds and is available, without charge, upon request by calling 1-800-345-6611.
30
Fund Governance (continued)
Officers
| | |
Name, Address and Year of Birth,
Position with Funds, Year First
Elected or Appointed to Office | | Principal Occupation(s) During Past Five Years |
|
| J. Kevin Connaughton (Born 1964) |
One Financial Center Boston, MA 02111 President (since 2009) | | Managing Director of Columbia Management Advisors, LLC since December 2004; Senior Vice President and Chief Financial Officer–Columbia Funds, from June 2008 to January 2009; Treasurer–Columbia Funds, from October 2003 to May 2008; Treasurer–the Liberty Funds, Stein Roe Funds and Liberty All-Star Funds, December 2000–December 2006; Senior Vice President–Columbia Management Advisors, LLC, from April 2003 to December 2004; President–Columbia Funds, Liberty Funds and Stein Roe Funds, February 2004 to October 2004; Treasurer–Galaxy Funds, September 2002 to December 2005; Treasurer, December 2002 to December 2004, and President, February 2004 to December 2004–Columbia Management Multi-Strategy Hedge Fund, LLC; and a senior officer of various other Bank of America-affiliated entities, including other registered and unregistered funds. |
|
| James R. Bordewick, Jr. (Born 1959) |
One Financial Center Boston, MA 02111 Senior Vice President, Secretary and Chief Legal Officer (since 2006) | | Associate General Counsel, Bank of America since April 2005; Senior Vice President and Associate General Counsel, MFS Investment Management (investment management) prior to April 2005. |
| |
| Linda J. Wondrack (Born 1964) | | |
One Financial Center Boston, MA 02111 Senior Vice President and Chief Compliance Officer (since 2007) | | Director (Columbia Management Group LLC and Investment Product Group Compliance), Bank of America since June 2005; Director of Corporate Compliance and Conflicts Officer, MFS Investment Management (investment management), August 2004 to May 2005; Managing Director, Deutsche Asset Management (investment management) prior to August 2004. |
| |
| Michael G. Clarke (Born 1969) | | |
One Financial Center Boston, MA 02111 Senior Vice President and Chief Financial Officer (since 2009) | | Director of Fund Administration of the Advisor since January 2006; Managing Director of the Advisor September 2004 to December 2005; Vice President Fund Administration June 2002 to September 2004. |
| |
| Jeffrey R. Coleman (Born 1969) | | |
One Financial Center Boston, MA 02111 Deputy Treasurer (since 2006) | | Director of Fund Administration of the Advisor since January 2006; Fund Controller of the Advisor from October 2004 to January 2006; Vice President of CDC IXIS Asset Management Services, Inc. (investment management) from August 2000 to September 2004. |
| |
| Joseph F. DiMaria (Born 1968) | | |
One Financial Center Boston, MA 02111 Chief Accounting Officer and Treasurer (since 2009) | | Director of Fund Administration of the Advisor since January 2006; Head of Tax/Compliance and Assistant Treasurer of the Advisor from November 2004 to December 2005; Director of Trustee Administration (Sarbanes-Oxley) of the Advisor from May 2003 to October 2004. |
31
Fund Governance (continued)
Officers (continued)
| | |
Name, Address and Year of Birth,
Position with Funds, Year First
Elected or Appointed to Office | | Principal Occupation(s) During Past Five Years |
| |
| Julian Quero (Born 1967) | | |
One Financial Center Boston, MA 02111 Deputy Treasurer (since 2008) | | Senior Tax Manager of the Advisor since August 2006; Senior Compliance Manager of the Advisor from April 2002 to August 2006. |
| |
| Barry S. Vallan (Born 1969) | | |
One Financial Center Boston, MA 02111 Controller (since 2006) | | Vice President–Fund Treasury of the Advisor since October 2004; Vice President–Trustee Reporting of the Advisor from April 2002 to October 2004. |
| |
| Stephen T. Welsh (Born 1957) | | |
One Financial Center Boston, MA 02111 Vice President (since 1996) | | President, Columbia Management Services, Inc. since July 2004; Senior Vice President and Controller, Columbia Management Services, Inc. prior to July 2004. |
32
Important Information About This Report
Transfer Agent
Columbia Management Services, Inc.
P.O. Box 8081
Boston, MA 02266-8081
1-800-345-6611
Distributor
Columbia Management
Distributors, Inc.
One Financial Center
Boston, MA 02111
Investment Advisor
Columbia Management Advisors, LLC
100 Federal Street
Boston, MA 02110
The fund mails one shareholder report to each shareholder address. If you would like more than one report, please call shareholder services at 1-800-345-6611 and additional reports will be sent to you. This report has been prepared for shareholders of Columbia Greater China Fund.
A description of the policies and procedures that the fund uses to determine how to vote proxies and a copy of the fund’s voting records are available (i) at www.columbiamanagement.com; (ii) on the Securities and Exchange Commission’s website at www.sec.gov; and (iii) without charge, upon request, by calling 1-800-368-0346. Information regarding how the fund voted proxies relating to portfolio securities during the 12-month period ended June 30 is available from the SEC’s website. Information regarding how the fund voted proxies relating to portfolio securities is also available from the fund’s website.
The fund files a complete schedule of portfolio holdings with the SEC for the first and third quarters of each fiscal year on Form N-Q. The fund’s Form N-Q is available on the SEC’s website at www.sec.gov and may be reviewed and copied at the SEC’s Public Reference Room in Washington, D.C. Information on the operation of the Public Reference Room may be obtained by calling 1-800-SEC-0330.
Please read and consider the investment objectives, risks, charges and expenses for any fund carefully before investing. For a prospectus which contains this and other important information about the fund, contact your Columbia Management representative or financial advisor or go to www.columbiamanagement.com.
Columbia Management Group, LLC (“Columbia Management”) is the investment management division of Bank of America Corporation. Columbia Management entities furnish investment management services and products for institutional and individual investors. Columbia Funds are distributed by Columbia Management Distributors, Inc., member of FINRA, SIPC, part of Columbia Management and an affiliate of Bank of America Corporation.
33

One Financial Center
Boston, MA 02111-2621
Columbia Greater China Fund
Annual Report, August 31, 2009
©2009 Columbia Management Distributors, Inc.
One Financial Center, Boston, MA 02111-2621
800.345.6611 www.columbiafunds.com
SHC-42/23317-0809 (10/09) 09/90511

Annual Report
August 31, 2009
Columbia Strategic Investor Fund
| | |
| NOT FDIC INSURED | | May Lose Value |
| NOT BANK ISSUED | | No Bank Guarantee |
Table of contents
The views expressed in this report reflect the current views of the respective parties. These views are not guarantees of future performance and involve certain risks, uncertainties and assumptions that are difficult to predict, so actual outcomes and results may differ significantly from the views expressed. These views are subject to change at any time based upon economic, market or other conditions and the respective parties disclaim any responsibility to update such views. These views may not be relied on as investment advice and, because investment decisions for a Columbia Fund are based on numerous factors, may not be relied on as an indication of trading intent on behalf of any particular Columbia Fund. References to specific securities should not be construed as a recommendation or investment advice.
President’s Message

Dear Shareholder:
We are pleased to provide this shareholder report detailing your fund’s performance, portfolio holdings and financial statements. We hope this information is helpful in monitoring your investments as we work through these challenging economic times. We recognize that you have entrusted us with your money and want you to know that our professional investment teams work to interpret the latest economic and market trends with the goal of optimizing portfolio construction for our clients.
The first half of 2009 was defined by extremes. The multiyear lows we witnessed in the early months gave
way to a stunning rally for the U.S. financial markets in the spring. A global market rebound may be underway, thanks to the massive fiscal and aggressive monetary policies of governments around the world. As of the June 30 market close, the S&P 500® Index1 was trading at nearly 16.6 times its 2009 Wall Street consensus earnings estimates with a sharp increase of nearly 36% since March 9. More mixed economic news has yet to provide the all-clear signal for investors, although economic activity has started to firm up. We believe this challenging economic environment makes it even more important to work with professional money managers while continuing to invest for life events like retirement, college planning, home improvements and career changes.
Retirement income planning has become an increasingly significant focus in the lives of millions of Americans. Recent economic conditions make it even more important to manage short-term obligations such as mortgages, monthly bills and credit card debt while also taking the steps necessary to prepare for or maximize retirement benefits. Better nutrition and medical services can result in U.S. citizens living longer, healthier lives. This means the risk of outliving one’s assets in retirement is very real without proper planning. Financial security and retirement planning is an ongoing process that requires active management of your savings, investments and risks. We encourage you to review your retirement plan regularly so you’ll be better able to meet your retirement needs in the future.
We recognize that economic uncertainty creates great challenges for many investors. Our professional investment teams work diligently to help investors navigate through difficult markets. Thank you for your business and for the opportunity to work together towards your investment goals.
Sincerely,

J. Kevin Connaughton
President, Columbia Funds
On September 29, 2009, Bank of America Corporation entered into an agreement to sell a portion of the asset management business of Columbia Management Group, LLC. Please see Note 11 of the Notes to Financial Statements for additional information.
Past performance is no guarantee of future results.
| 1 | The Standard & Poor’s (S&P) 500 Index tracks the performance of 500 widely held, large-capitalization U.S. stocks. Indices are not available for investment, are not professionally managed and do not reflect sales charges, fees, brokerage commissions, taxes or other expenses of investing. Securities in the fund may not match those in an index. |
Fund Profile – Columbia Strategic Investor Fund
Performance data quoted represents past performance and current performance may be lower or higher. Past performance is no guarantee of future results. The investment return and principal value will fluctuate so that shares, when redeemed, may be worth more or less than the original cost. Please visit www.columbiafunds.com for daily and most recent month-end performance updates.
Summary
1-year return as of 08/31/09
| | |
| |
 | | –18.44% Class A shares
(without sales charge) |
| |
| | –18.39% Russell 1000 Index |
Summary
| n | | For the 12-month period that ended August 31, 2009, the fund’s Class A shares returned negative 18.44% without sales charge. |
| n | | The fund, its benchmark — the Russell 1000 Index1 — and the average fund in its peer group — the Lipper Multi-Cap Core Funds Classification2 — all suffered double-digit declines in a difficult environment for the equity markets. |
| n | | Solid results relative to the index from the financials, technology and consumer staples sectors were offset by disappointments in the health care, industrials, materials and telecommunication service sectors. |
Portfolio Management
Emil A. Gjester, lead manager of the fund, has managed or co-managed the fund since May 2002 and has been with the advisor or its predecessors or affiliate organizations since 1996.
Jonas Patrikson has co-managed the fund since February 2006 and has been with the advisor or its predecessors or affiliate organizations since September 2004.
Michael T. Welter has co-managed the fund since July 2006 and has been with the advisor or its predecessors or affiliate organizations since 2006.
Mary-Ann Ward has co-managed the fund since April 2008 and has been with the advisor or its predecessors or affiliate organizations since 1997.
| 1 | The Russell 1000 Index tracks the performance of 1,000 of the largest U.S. companies, based on market capitalization. Indices are not available for investment, are not professionally managed and do not reflect sales charges, fees, brokerage commissions, taxes or other expenses of investing. Securities in the fund may not match those in an index. |
| 2 | Lipper Inc., a widely respected data provider in the industry, calculates an average total return (assuming reinvestment of distributions) for mutual funds with investment objectives similar to those of the fund. Lipper makes no adjustment for the effect of sales loads. |
1
Economic Update – Columbia Strategic Investor Fund
Summary
For the 12-month period that ended August 31, 2009
| | n | | Stocks lost ground, as measured by the S&P 500® Index and the MSCI EAFE Index, but cut their losses in a rebound that began half way through the period. | |
| | |
| S&P Index | | MSCI Index |
| |

| |
|
-18.25% | | -14.95% |
| | n | | As investors appeared to exhibit more tolerance for risk, the Barclays Capital Aggregate Bond Index delivered positive results. High-yield bonds rebounded strongly, as measured by the JPMorgan Developed BB High Yield Index. | |
| | |
| Barclays Aggregate Index | | JPMorgan
Index |
| |

| |
|
7.94% | | 6.51% |
During the 12-month period that began September 1, 2008 and ended August 31, 2009, the U.S. economy faced the worst financial crisis since the Great Depression, then steadied itself as steps taken by a new administration began to show results in the second half of the period. Economic growth, as measured by gross domestic product, contracted by more than 6% in the second half of 2008. The decline for the first half of 2009 is expected to have been less severe, and hopes for a late 2009 recovery have been encouraged by Fed Chairman Bernanke. The lapse from growth has resulted in the longest — and most severe — recession in nearly three decades.
The labor market shed more than six million jobs between 2008 and 2009, raising the unemployment rate to 9.7% and virtually wiping out all of the jobs gained since the last recession. Manufacturing activity slowed and consumer spending declined. The beleaguered housing market continued to lose ground as prices fell and inventories rose. However, mortgage purchase applications increased late in the period, buoyed by low interest rates and an $8,000 first-time home buyer tax credit. Late in 2008, consumer confidence, as measured by the Conference Board, plummeted to its lowest point ever. However, it has since stabilized and turned higher near the end of the period.
Troubles that began in the U.S. subprime mortgage market resulted in a meltdown within the U.S. financial sector that claimed several major institutions in 2008 and led others to seek bailouts, restructuring or both. New rigorous lending standards severely limited access to credit, further hampering economic growth. In this environment, a new administration sought to stabilize the financial system, address economic woes and introduce sweeping health care reform. Stimulus spending began to flow into the economy, raising hopes that growth would be restored in the second half of 2009. In December 2008, the Federal Reserve Board (the Fed) lowered a key short-term borrowing rate — the federal funds rate — to between zero and 0.25% — a record low. In light of protracted economic weakness, we believe the Fed is unlikely to tighten its reins on money until the economy and the labor markets stabilize.
Stocks retreated, then rebounded
Against a weakening economic backdrop, the U.S. stock market lost 18.25% for the 12-month period, as measured by the S&P 500® Index. Losses affected the stocks of companies of all sizes and investment style categories, as measured by their respective Russell indices.1 Stock markets outside the U.S. suffered losses that were nearly as substantial. The MSCI EAFE Index,2 a broad gauge of stock market performance in foreign developed markets, lost 14.95% (in U.S. dollars) for the period. Emerging stock markets were also caught in the downdraft, but bounced back stronger than domestic or developed world markets in 2009. The MSCI Emerging Markets Index3 returned negative 9.95% (in U.S. dollars).
Bonds outperformed stocks
As investors sought refuge from a volatile stock market, the highest quality sectors of the U.S. bond market delivered modest gains. During the first half of the period, Treasury prices rose and yields declined sharply as the economy faltered and stock
2
Economic Update (continued) – Columbia Strategic Investor Fund
market volatility increased. As hopes for a recovery materialized in the second half of the period, yields rose and Treasuries lagged behind riskier segments of the bond market. The benchmark 10-year U.S. Treasury yield began the period at 3.8%, declined to 2.2% in December 2008, then rose to end the period at 3.4%. In this environment, the Barclays Capital Aggregate Bond Index4 (formerly the Lehman Brothers U.S. Aggregate Bond Index) returned 7.94%. High-yield bond prices fell sharply in 2008 as economic prospects weakened and default fears rose, then rebounded strongly in 2009. For the 12-month period, the JPMorgan Developed BB High Yield Index5 returned 6.51%.
| 1 | The Russell 1000 Index tracks the performance of 1,000 of the largest U.S. companies, based on market capitalization. The Russell Midcap Index measures the performance of the 800 smallest companies in the Russell 1000 Index, which represents approximately 25% of the total market capitalization of the Russell 1000 Index. The Russell 2000 Index measures the performance of the 2,000 smallest companies in the Russell 3000 Index, which represents approximately 8% of the total market capitalization of the Russell 3000 Index. |
| 2 | The Morgan Stanley Capital International (MSCI) Europe, Australasia, Far East (EAFE) Index is a free float-adjusted market capitalization index that is designed to measure developed market equity performance excluding the U.S. and Canada. |
| 3 | The MSCI Emerging Markets Index is composed of a sample of companies from 22 countries representing the global emerging stock markets. |
| 4 | The Barclays Capital Aggregate Bond Index is a market value-weighted index that tracks the daily price, coupon, pay-downs and total return performance of fixed-rate, publicly placed, dollar-denominated and non-convertible investment-grade debt issues with at least $250 million par amount outstanding and with at least one year to final maturity. |
| 5 | The JPMorgan Developed BB High Yield Index is designed to mirror the investable universe of the U.S. dollar developed, BB-rated, high yield corporate debt market. |
Indices are not available for investment, are not professionally managed and do not reflect sales charges, fees, brokerage commissions, taxes or other expenses of investing. Securities in the fund may not match those in an index.
Past performance is no guarantee of future results.
3
Performance Information – Columbia Strategic Investor Fund
Performance data quoted represents past performance and current performance may be lower or higher. Past performance is no guarantee of future results. The investment return and principal value will fluctuate so that shares, when redeemed, may be worth more or less than the original cost. Please visit www.columbiafunds.com for daily and most recent month-end performance updates.
| | |
| Annual operating expense ratio (%)* |
| |
Class A | | 1.50 |
Class B | | 2.25 |
Class C | | 2.25 |
Class Y | | 0.89 |
Class Z | | 1.25 |
| * | The annual operating expense ratio is as stated in the fund’s prospectus that is current as of the date of this report. Differences in expense ratios disclosed elsewhere in this report may result from including fee waivers and expense reimbursements as well as different time periods used in calculating the ratios. |
| | |
| Net asset value per share |
| |
as of 08/31/09 ($) | | |
Class A | | 14.62 |
Class B | | 14.12 |
Class C | | 14.13 |
Class Y | | 14.64 |
Class Z | | 14.64 |
| | |
| Distributions declared per share |
| |
09/01/08 – 08/31/09 ($) | | |
Class A | | 0.06 |
Class B | | 0.00 |
Class C | | 0.00 |
Class Y | | 0.00 |
Class Z | | 0.10 |
|
| Performance of a $10,000 investment 11/09/00 – 08/31/09 |
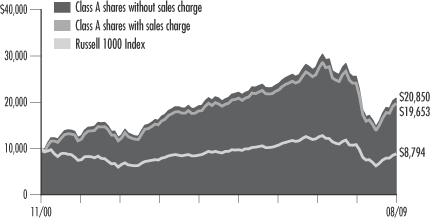
The chart above shows the change in value of a hypothetical $10,000 investment in Class A shares of Columbia Strategic Investor Fund during the stated time period, and does not reflect the deduction of taxes that a shareholder may pay on fund distributions or on the redemption of fund shares. The Russell 1000 Index tracks the performance of 1,000 of the largest U.S. companies, based on market capitalization. Indices are not available for investment, are not professionally managed and do not reflect sales charges, fees, brokerage commissions, taxes or other expenses of investing. Securities in the fund may not match those in an index.
| | | | |
| Performance of a $10,000 investment 11/09/00 – 08/31/09 ($) |
| | |
| Sales charge | | without | | with |
Class A | | 20,850 | | 19,653 |
Class B | | 19,782 | | 19,782 |
Class C | | 19,793 | | 19,793 |
Class Y | | 21,205 | | n/a |
Class Z | | 21,205 | | n/a |
| | | | | | | | | | | | | | | | |
| Average annual total return as of 08/31/09 (%) | | | | |
| | | | | |
| Share class | | A | | B | | C | | Y | | Z |
| Inception | | 11/01/02 | | 11/01/02 | | 10/13/03 | | 07/15/09 | | 11/09/00 |
| Sales charge | | without | | with | | without | | with | | without | | with | | without | | without |
1-year | | –18.44 | | –23.14 | | –19.08 | | –23.13 | | –19.07 | | –19.88 | | –18.26 | | –18.26 |
5-year | | 2.21 | | 1.00 | | 1.44 | | 1.15 | | 1.44 | | 1.44 | | 2.45 | | 2.45 |
Life | | 8.70 | | 7.97 | | 8.05 | | 8.05 | | 8.06 | | 8.06 | | 8.91 | | 8.91 |
| | | | | | | | | | | | | | | | |
| Average annual total return as of 09/30/09 (%) |
| Share class | | A | | B | | C | | Y | | Z |
| Sales charge | | without | | with | | without | | with | | without | | with | | without | | without |
1-year | | –3.41 | | –8.96 | | –4.11 | | –8.91 | | –4.11 | | –5.07 | | –3.11 | | –3.17 |
5-year | | 2.84 | | 1.63 | | 2.09 | | 1.79 | | 2.09 | | 2.09 | | 3.12 | | 3.10 |
Life | | 9.29 | | 8.57 | | 8.65 | | 8.65 | | 8.65 | | 8.65 | | 9.52 | | 9.51 |
4
Performance Information (continued) – Columbia Strategic Investor Fund
The “with sales charge” returns include the maximum initial sales charge of 5.75% for Class A shares and the applicable contingent deferred sales charge of 5.00% in the first year, declining to 1.00% in the sixth year and eliminated thereafter for Class B shares and 1.00% for Class C shares for the first year only. The “without sales charge” returns do not include the effect of sales charges. If they had, returns would be lower.
Performance results reflect any fee waivers or reimbursements of fund expenses by the investment advisor and/or any of its affiliates. Absent these fee waivers or expense reimbursement arrangements, performance results would have been lower.
All results shown assume reinvestment of distributions. Class Y and Class Z shares are sold at net asset value with no distribution and service (Rule 12b-1) fees. Class Y shares and Class Z shares have limited eligibility and the investment minimum requirements may vary. Please see the fund’s prospectus for details. Performance for different share classes will vary based on differences in sales charges and fees associated with each class.
The tables do not reflect the deduction of taxes that a shareholder may pay on fund distributions or on the redemption of fund shares.
Class A, Class B, Class C and Class Y are newer classes of shares. Class A and Class B share performance information includes the performance of Class Z shares (the oldest existing share class) for periods prior to their inception. Class C share performance information includes returns of Class B shares for the period from November 1, 2002 through October 12, 2003, and the returns of Class Z shares for periods prior thereto. Class Y share performance information includes the performance of Class Z shares for periods prior to its inception. These returns reflect differences in sales charges, but have not been restated to reflect any differences in expenses such as distribution and service (Rule 12b-1) fees between Class Z shares and the newer classes of shares. If differences in expenses had been reflected, the returns shown for periods prior to the inception of Class A, Class B and Class C shares would have been lower, since these classes of shares are subject to distribution and service (Rule 12b-1) fees and the returns shown for Class Y share for periods prior to its inception would have been higher. Class A and Class B shares were initially offered on November 1, 2002, Class C shares were initially offered on October 13, 2003, Class Y shares were initially offered on July 15, 2009 and Class Z shares were initially offered on November 9, 2000.
5
Understanding Your Expenses – Columbia Strategic Investor Fund
Estimating your actual expenses
To estimate the expenses that you paid over the period, first you will need your account balance at the end of the period:
| | n | | For shareholders who receive their account statements from Columbia Management Services, Inc., your account balance is available online at www.columbiafunds.com or by calling Shareholder Services at 800.345.6611. | |
| | n | | For shareholders who receive their account statements from their financial intermediary, contact your financial intermediary to obtain your account balance. | |
| | 1. | Divide your ending account balance by $1,000. For example, if an account balance was $8,600 at the end of the period, the result would be 8.6. | |
| | 2. | In the section of the table below titled “Expenses paid during the period,” locate the amount for your share class. You will find this number in the column labeled “Actual.” Multiply this number by the result from step 1. Your answer is an estimate of the expenses you paid on your account during the period. | |
If the value of your account falls below the minimum initial investment requirement applicable to you, your account generally will be subject to a $20 annual fee. This fee is not included in the accompanying table. If you are subject to the fee, keep it in mind when you are estimating the ongoing expenses of investing in the fund and when comparing the expenses of this fund with other funds.
As a fund shareholder, you incur two types of costs. There are transaction costs, which generally include sales charges on purchases and may include redemption fees or exchange fees. There are also ongoing costs, which generally include investment advisory fees, distribution and service (Rule 12b-1) fees and other fund expenses. The information on this page is intended to help you understand the ongoing costs of investing in the fund and to compare these costs with the ongoing costs of investing in other mutual funds.
Analyzing your fund’s expenses by share class
To illustrate these ongoing costs, we have provided an example and calculated the expenses paid by investors in each share class during the period. The information in the following table is based on an initial investment of $1,000, which is invested at the beginning of the period and held for the entire period. Expense information is calculated two ways and each method provides you with different information. The amount listed in the “Actual” column is calculated using the fund’s actual operating expenses and total return for the period. The amount listed in the “Hypothetical” column for each share class assumes that the return each year is 5% before expenses and is calculated based on the fund’s actual operating expenses. You should not use the hypothetical account values and expenses to estimate either your actual account balance at the end of the period or the expenses you paid during this period.
Compare with other funds
Since all mutual funds are required to include the same hypothetical calculations about expenses in shareholder reports, you can use this information to compare the ongoing costs of investing in the fund with other funds. To do so, compare the 5% hypothetical example with the 5% hypothetical examples that appear in the shareholder reports of other funds. As you compare hypothetical examples of other funds, it is important to note that hypothetical examples are meant to highlight the ongoing costs of investing in a fund and do not reflect any transaction costs, such as sales charges, redemption fees or exchange fees.
| | | | | | | | | | | | | | | | |
| 03/01/09 – 08/31/09 |
| | | | |
| | | Account value at the
beginning of the period ($) | | Account value at the end of the period ($) | | Expenses paid during the period ($) | | Fund’s annualized expense ratio (%) |
| | | Actual | | Hypothetical | | Actual | | | Hypothetical | | Actual | | | Hypothetical | | Actual |
Class A | | 1,000.00 | | 1,000.00 | | 1,419.42 | | | 1,018.90 | | 7.62 | | | 6.36 | | 1.25 |
Class B | | 1,000.00 | | 1,000.00 | | 1,414.78 | | | 1,015.12 | | 12.17 | | | 10.16 | | 2.00 |
Class C | | 1,000.00 | | 1,000.00 | | 1,414.38 | | | 1,015.12 | | 12.17 | | | 10.16 | | 2.00 |
Class Y | | 1,000.00 | | 1,000.00 | | 1,099.10 | * | | 1,021.58 | | 0.99 | * | | 3.67 | | 0.72 |
Class Z | | 1,000.00 | | 1,000.00 | | 1,421.39 | | | 1,020.16 | | 6.10 | | | 5.09 | | 1.00 |
Expenses paid during the period are equal to the annualized expense ratio for the share class, multiplied by the average account value over the period, then multiplied by the number of days in the fund’s most recent fiscal half-year and divided by 365.
Had the investment advisor and/or any of its affiliates not waived fees or reimbursed a portion of expenses for all Classes except Class Y, account value at the end of the period would have been reduced.
It is important to note that the expense amounts shown in the table are meant to highlight only ongoing costs of investing in the fund and do not reflect any transaction costs, such as sales charges, redemption fees or exchange fees. Therefore, the hypothetical examples provided may not help you determine the relative total costs of owning shares of different funds. If these transaction costs were included, your costs would have been higher.
* For the period July 15, 2009 through August 31, 2009. Class Y shares commenced operations on July 15, 2009.
6
Portfolio Managers’ Report – Columbia Strategic Investor Fund
Performance data quoted represents past performance and current performance may be lower or higher. Past performance is no guarantee of future results. The investment return and principal value will fluctuate so that shares, when redeemed, may be worth more or less than the original cost. Please visit www.columbiafunds.com for daily and most recent month-end performance updates.
| | |
| Top 5 equity sectors | | |
| |
as of 08/31/09 (%) | | |
Information Technology | | 18.9 |
Financials | | 16.6 |
Energy | | 13.3 |
Health Care | | 10.4 |
Industrials | | 10.2 |
| | |
| Top 10 holdings | | |
| |
as of 08/31/09 (%) | | |
Microsoft | | 2.5 |
JP Morgan Chase & Co. | | 2.5 |
Wells Fargo | | 2.1 |
Apple | | 2.0 |
Exxon Mobil | | 1.9 |
Hewlett-Packard | | 1.8 |
International Business Machines | | 1.8 |
Google | | 1.4 |
PepsiCo | | 1.3 |
Goldman Sachs Group | | 1.3 |
| | |
| Holdings discussed in this report |
| |
as of 08/31/09 (%) | | |
JPMorgan Chase | | 2.5 |
Goldman Sachs | | 1.3 |
Fifth Third Bancorp | | 0.9 |
Herbalife | | 0.5 |
Brocade Communications Systems | | 0.4 |
Agilent Technologies | | 0.7 |
Jo-Ann Stores | | 0.5 |
Bally Technologies | | 0.7 |
Life Technologies | | 0.5 |
PT Perusahaan Gas Negara | | 0.4 |
Hypermarcas | | 0.5 |
The fund is actively managed and the composition of its portfolio will change over time. Information provided is calculated as a percentage of net assets.
For the 12-month period that ended August 31, 2009, Columbia Strategic Investor Fund Class A shares returned negative 18.44% without sales charge. The fund’s benchmark, the Russell 1000 Index, returned negative 18.39%, and the average return of its peer group, the Lipper Multi-Cap Core Funds Classification, was negative 17.36%. Good relative performance from the financials, technology and consumer staples sectors was offset by poor performance relative to the benchmark from the industrials, health care, materials and telecom services sectors.
Stock selection within the financials, technology and consumer staples sectors aided the fund’s relative performance. In financials, we held quality names, such as JPMorgan Chase and Goldman Sachs, and avoided some of the more troubled institutions in insurance and other financial subsectors. In May, we invested in Fifth Third Bancorp — which has registered positive returns. Although the consumer staples sector declined for the period, we owned several stocks that added value relative to the index, including Herbalife, Green Mountain Coffee Roasters, Hansen Natural and United Natural Foods. Herbalife remains in the portfolio while the other three were sold. In information technology, Brocade Communications Systems and Agilent Technologies registered positive returns.
Relative performance suffered in the health care, industrials, materials and telecom services sectors. Although the health care sector as a whole outperformed the market, the fund sustained large percentage losses in some holdings, including Alcon, Covance and Sequenom, each of which was eliminated from the portfolio during the period. In the industrials sector, the fund also experienced several disappointments — among these were McDermott, SPX and AGCO, all of which were sold during the period.
Looking ahead
In our report of six months ago, we indicated that we were finding many compelling investment opportunities in the United States. Our purchases in 2009 have included small to medium-sized companies, such as Jo-Ann Stores, Bally Technologies and Life Technologies.
As the new reporting period begins, we are finding compelling emerging markets investments even after a strong rally in that arena in 2009. Investments in this category include the Indonesian company PT Perusahaan Gas Negara and Brazilian company Hypermarcas.
Portfolio holdings and characteristics are subject to change periodically and may not be representative of current holdings and characteristics. The outlook for the fund may differ from those presented for other Columbia Funds.
Equity investments are affected by stock market fluctuations that occur in response to economic and business developments.
Investments in small- and mid-cap stocks may present special risks. They tend to be more volatile and less liquid than the stocks of larger companies. Small-cap stocks often have narrower markets, limited financial resources and tend to be more thinly traded than stocks of larger companies. Value stocks may also be subject to specific business risks that have caused the stocks to be out of favor. The price of the company’s stock may not approach the value the manager has placed on it.
7
Investment Portfolio – Columbia Strategic Investor Fund
August 31, 2009
Common Stocks – 97.7%
| | | | |
| | | Shares | | Value ($) |
| Consumer Discretionary – 9.7% |
| Auto Components – 0.5% |
Nokian Renkaat Oyj | | 170,967 | | 3,845,590 |
|
Auto Components Total | | 3,845,590 |
| | |
| Distributors – 0.4% | | | | |
LKQ Corp. (a) | | 198,347 | | 3,443,304 |
|
Distributors Total | | 3,443,304 |
|
| Hotels, Restaurants & Leisure – 1.4% |
Bally Technologies, Inc. (a) | | 135,754 | | 5,488,534 |
Burger King Holdings, Inc. | | 148,952 | | 2,670,709 |
WMS Industries, Inc. (a) | | 65,768 | | 2,783,960 |
|
Hotels, Restaurants & Leisure Total | | 10,943,203 |
| |
| Leisure Equipment & Products – 0.4% | | |
Polaris Industries, Inc. | | 77,445 | | 2,920,451 |
|
Leisure Equipment & Products Total | | 2,920,451 |
| |
| Media – 1.3% | | |
DIRECTV Group, Inc. (a) | | 158,956 | | 3,935,751 |
John Wiley & Sons, Inc., Class A | | 95,768 | | 3,071,280 |
Time Warner Cable, Inc. | | 90,956 | | 3,358,095 |
|
Media Total | | 10,365,126 |
| | |
| Multiline Retail – 1.9% | | | | |
Big Lots, Inc. (a) | | 166,572 | | 4,234,260 |
J.C. Penney Co., Inc. | | 97,479 | | 2,928,269 |
Target Corp. | | 164,781 | | 7,744,707 |
|
Multiline Retail Total | | 14,907,236 |
| | |
| Specialty Retail – 2.5% | | | | |
Best Buy Co., Inc. | | 110,332 | | 4,002,845 |
Collective Brands, Inc. (a) | | 233,227 | | 3,694,316 |
Jo-Ann Stores, Inc. (a) | | 147,172 | | 4,020,739 |
Lowe’s Companies, Inc. | | 228,363 | | 4,909,804 |
Urban Outfitters, Inc. (a) | | 109,426 | | 3,110,981 |
|
Specialty Retail Total | | 19,738,685 |
| |
| Textiles, Apparel & Luxury Goods – 1.3% | | |
Hanesbrands, Inc. (a) | | 190,916 | | 4,020,691 |
NIKE, Inc., Class B | | 107,714 | | 5,966,279 |
|
Textiles, Apparel & Luxury Goods Total | | 9,986,970 |
|
Consumer Discretionary Total | | 76,150,565 |
| | | | |
| Consumer Staples – 8.4% | | | | |
| Beverages – 2.5% | | | | |
Carlsberg A/S, Class B | | 72,625 | | 5,217,424 |
Molson Coors Brewing Co., Class B | | 79,121 | | 3,748,753 |
PepsiCo, Inc. | | 186,749 | | 10,583,066 |
|
Beverages Total | | 19,549,243 |
| | | | |
| | | Shares | | Value ($) |
| Food & Staples Retailing – 1.6% | | | | |
BJ’s Wholesale Club, Inc. (a) | | 84,187 | | 2,744,496 |
Safeway, Inc. | | 248,692 | | 4,737,583 |
Walgreen Co. | | 149,536 | | 5,066,280 |
|
Food & Staples Retailing Total | | 12,548,359 |
| | |
| Food Products – 0.9% | | | | |
Archer-Daniels-Midland Co. | | 167,611 | | 4,832,225 |
Sanderson Farms, Inc. | | 63,977 | | 2,661,443 |
|
Food Products Total | | 7,493,668 |
| | |
| Household Products – 0.5% | | | | |
Hypermarcas SA (a) | | 241,500 | | 3,841,550 |
|
Household Products Total | | 3,841,550 |
| | |
| Personal Products – 1.7% | | | | |
Avon Products, Inc. | | 179,882 | | 5,732,839 |
Herbalife Ltd. | | 118,180 | | 3,578,491 |
Mead Johnson Nutrition Co., Class A | | 96,644 | | 3,832,901 |
|
Personal Products Total | | 13,144,231 |
| | |
| Tobacco – 1.2% | | | | |
Philip Morris International, Inc. | | 209,210 | | 9,562,989 |
|
Tobacco Total | | 9,562,989 |
|
Consumer Staples Total | | 66,140,040 |
| | |
| Energy – 13.3% | | | | |
| Energy Equipment & Services – 5.2% |
BJ Services Co. | | 309,621 | | 4,972,513 |
Cameron International Corp. (a) | | 160,738 | | 5,739,954 |
CARBO Ceramics, Inc. | | 117,893 | | 5,075,294 |
National-Oilwell Varco, Inc. (a) | | 144,873 | | 5,266,134 |
Noble Corp. | | 90,141 | | 3,157,639 |
Pioneer Drilling Co. (a) | | 346,954 | | 1,977,638 |
Schlumberger Ltd. | | 77,010 | | 4,327,962 |
Tenaris SA, ADR | | 132,776 | | 3,847,848 |
Transocean Ltd. (a) | | 37,615 | | 2,852,722 |
Wellstream Holdings PLC | | 411,891 | | 3,273,799 |
|
Energy Equipment & Services Total | | 40,491,503 |
|
| Oil, Gas & Consumable Fuels – 8.1% |
Apache Corp. | | 60,917 | | 5,174,899 |
Cimarex Energy Co. | | 141,399 | | 5,520,217 |
Comstock Resources, Inc. (a) | | 73,025 | | 2,579,973 |
Continental Resources, Inc. (a) | | 78,660 | | 2,776,698 |
Devon Energy Corp. | | 79,499 | | 4,879,649 |
EOG Resources, Inc. | | 71,603 | | 5,155,416 |
Exxon Mobil Corp. | | 210,922 | | 14,585,256 |
Hess Corp. | | 70,592 | | 3,571,249 |
Occidental Petroleum Corp. | | 109,768 | | 8,024,041 |
See Accompanying Notes to Financial Statements.
8
Columbia Strategic Investor Fund
August 31, 2009
Common Stocks (continued)
| | | | |
| | | Shares | | Value ($) |
| Energy (continued) | | | | |
| Oil, Gas & Consumable Fuels (continued) |
Peabody Energy Corp. | | 78,207 | | 2,555,805 |
Petroleo Brasileiro SA, ADR | | 116,038 | | 4,599,746 |
StatoilHydro ASA, ADR | | 198,152 | | 4,327,640 |
|
Oil, Gas & Consumable Fuels Total | | 63,750,589 |
|
Energy Total | | 104,242,092 |
| | |
| Financials – 16.6% | | | | |
| Capital Markets – 5.4% | | | | |
Ameriprise Financial, Inc. | | 212,835 | | 6,391,435 |
Charles Schwab Corp. | | 343,434 | | 6,202,418 |
Credit Suisse Group AG, ADR | | 55,305 | | 2,814,471 |
Goldman Sachs Group, Inc. | | 60,640 | | 10,033,494 |
Invesco Ltd. | | 214,633 | | 4,453,635 |
Raymond James Financial, Inc. | | 245,151 | | 5,577,185 |
TD Ameritrade Holding Corp. (a) | | 203,923 | | 3,923,479 |
Waddell & Reed Financial, Inc., Class A | | 115,311 | | 3,059,201 |
|
Capital Markets Total | | 42,455,318 |
| | |
| Commercial Banks – 3.9% | | | | |
Fifth Third Bancorp | | 667,867 | | 7,306,465 |
Glacier Bancorp, Inc. | | 146,812 | | 2,188,967 |
TCF Financial Corp. | | 315,264 | | 4,338,033 |
Wells Fargo & Co. | | 608,320 | | 16,740,966 |
|
Commercial Banks Total | | 30,574,431 |
| | |
| Consumer Finance – 0.9% | | | | |
American Express Co. | | 215,439 | | 7,286,147 |
|
Consumer Finance Total | | 7,286,147 |
|
| Diversified Financial Services – 3.2% |
Hong Kong Exchanges & Clearing Ltd. | | 203,700 | | 3,545,489 |
JPMorgan Chase & Co. | | 444,607 | | 19,322,620 |
Portfolio Recovery Associates, Inc. (a) | | 39,675 | | 1,742,526 |
|
Diversified Financial Services Total | | 24,610,635 |
| | |
| Insurance – 2.5% | | | | |
ACE Ltd. | | 54,005 | | 2,817,981 |
Aon Corp. | | 90,096 | | 3,762,409 |
Axis Capital Holdings Ltd. | | 80,629 | | 2,457,572 |
Principal Financial Group, Inc. | | 140,765 | | 3,997,726 |
Prudential Financial, Inc. | | 129,998 | | 6,575,299 |
|
Insurance Total | | 19,610,987 |
|
| Real Estate Investment Trusts (REITs) – 0.7% |
Digital Realty Trust, Inc. | | 65,511 | | 2,854,969 |
Redwood Trust, Inc. | | 180,962 | | 2,900,821 |
|
Real Estate Investment Trusts (REITs) Total | | 5,755,790 |
|
Financials Total | | 130,293,308 |
| | | | |
| | | Shares | | Value ($) |
| Health Care – 10.4% | | | | |
| Biotechnology – 1.1% | | | | |
Celgene Corp. (a) | | 63,253 | | 3,299,909 |
Gilead Sciences, Inc. (a) | | 115,208 | | 5,191,273 |
|
Biotechnology Total | | 8,491,182 |
|
| Health Care Equipment & Supplies – 2.3% |
Baxter International, Inc. | | 121,088 | | 6,892,329 |
Covidien PLC | | 80,069 | | 3,168,330 |
Hospira, Inc. (a) | | 71,283 | | 2,786,452 |
NuVasive, Inc. (a) | | 70,780 | | 2,836,155 |
Smith & Nephew PLC, ADR | | 58,646 | | 2,477,794 |
|
Health Care Equipment & Supplies Total | | 18,161,060 |
|
| Health Care Providers & Services – 1.7% |
Express Scripts, Inc. (a) | | 64,417 | | 4,652,196 |
Mednax, Inc. (a) | | 53,021 | | 2,760,803 |
UnitedHealth Group, Inc. | | 212,587 | | 5,952,436 |
|
Health Care Providers & Services Total | | 13,365,435 |
| |
| Health Care Technology – 0.3% | | |
MedAssets, Inc. (a) | | 82,219 | | 1,835,950 |
|
Health Care Technology Total | | 1,835,950 |
|
| Life Sciences Tools & Services – 1.1% |
Illumina, Inc. (a) | | 69,296 | | 2,444,070 |
Life Technologies Corp. (a) | | 94,058 | | 4,188,403 |
QIAGEN N.V. (a) | | 106,009 | | 2,178,485 |
|
Life Sciences Tools & Services Total | | 8,810,958 |
| |
| Pharmaceuticals – 3.9% | | |
Abbott Laboratories | | 157,036 | | 7,102,738 |
Allergan, Inc. | | 82,797 | | 4,630,008 |
AstraZeneca PLC, ADR | | 77,962 | | 3,635,368 |
Novo Nordisk A/S, ADR | | 62,792 | | 3,830,940 |
Sanofi-Aventis SA, ADR | | 219,727 | | 7,486,099 |
Teva Pharmaceutical Industries Ltd., ADR | | 73,748 | | 3,798,022 |
|
Pharmaceuticals Total | | 30,483,175 |
|
Health Care Total | | 81,147,760 |
| | |
| Industrials – 10.2% | | | | |
| Aerospace & Defense – 0.8% | | | | |
United Technologies Corp. | | 100,172 | | 5,946,210 |
|
Aerospace & Defense Total | | 5,946,210 |
| | |
| Air Freight & Logistics – 0.8% | | | | |
Expeditors International of Washington, Inc. | | 101,791 | | 3,324,494 |
UTI Worldwide, Inc. (a) | | 197,813 | | 2,541,897 |
|
Air Freight & Logistics Total | | 5,866,391 |
See Accompanying Notes to Financial Statements.
9
Columbia Strategic Investor Fund
August 31, 2009
Common Stocks (continued)
| | | | |
| | | Shares | | Value ($) |
| Industrials (continued) | | | | |
| Construction & Engineering – 0.9% | | | | |
EMCOR Group, Inc. (a) | | 151,846 | | 3,518,272 |
Insituform Technologies, Inc., Class A (a) | | 164,755 | | 3,155,058 |
|
Construction & Engineering Total | | 6,673,330 |
| | |
| Electrical Equipment – 0.3% | | | | |
GrafTech International Ltd. (a) | | 184,886 | | 2,630,928 |
|
Electrical Equipment Total | | | | 2,630,928 |
| | |
| Industrial Conglomerates – 2.3% | | | | |
Barloworld Ltd. | | 372,392 | | 2,278,535 |
General Electric Co. | | 399,068 | | 5,547,045 |
Siemens AG, ADR | | 78,318 | | 6,801,135 |
Tyco International Ltd. | | 109,822 | | 3,480,259 |
|
Industrial Conglomerates Total | | | | 18,106,974 |
| | |
| Machinery – 2.6% | | | | |
Caterpillar, Inc. | | 119,082 | | 5,395,605 |
Dover Corp. | | 94,102 | | 3,254,988 |
Joy Global, Inc. | | 101,047 | | 3,925,676 |
Kubota Corp. | | 189,000 | | 1,561,967 |
Navistar International Corp. (a) | | 47,288 | | 2,044,733 |
Parker Hannifin Corp. | | 85,303 | | 4,150,844 |
|
Machinery Total | | 20,333,813 |
| | |
| Marine – 1.4% | | | | |
A.P. Moller-Maersk A/S, Class B | | 770 | | 5,546,557 |
Diana Shipping, Inc. | | 198,121 | | 2,573,592 |
Genco Shipping & Trading Ltd. | | 153,674 | | 2,976,665 |
|
Marine Total | | 11,096,814 |
| | |
| Professional Services – 0.2% | | | | |
Monster Worldwide, Inc. (a) | | 109,021 | | 1,768,321 |
|
Professional Services Total | | 1,768,321 |
| | |
| Road & Rail – 0.9% | | | | |
Landstar System, Inc. | | 80,663 | | 2,812,719 |
Union Pacific Corp. | | 76,301 | | 4,563,562 |
|
Road & Rail Total | | 7,376,281 |
|
Industrials Total | | | | 79,799,062 |
| | | | |
| Information Technology – 18.9% | | | | |
| Communications Equipment – 1.8% | | | | |
Adtran, Inc. | | 157,752 | | 3,587,281 |
Brocade Communications Systems, Inc. (a) | | 427,192 | | 3,088,598 |
CommScope, Inc. (a) | | 140,360 | | 3,784,106 |
Nokia Oyj, ADR | | 227,142 | | 3,182,259 |
|
Communications Equipment Total | | 13,642,244 |
| | | | |
| | | Shares | | Value ($) |
| Computers & Peripherals – 5.6% | | | | |
Apple, Inc. (a) | | 94,357 | | 15,871,791 |
Hewlett-Packard Co. | | 317,890 | | 14,270,082 |
International Business Machines Corp. | | 117,649 | | 13,888,464 |
|
Computers & Peripherals Total | | 44,030,337 |
|
| Electronic Equipment, Instruments & Components – 1.5% |
Agilent Technologies, Inc. (a) | | 211,071 | | 5,420,303 |
Brightpoint, Inc. (a) | | 273,343 | | 2,006,338 |
Tyco Electronics Ltd. | | 188,053 | | 4,291,369 |
|
Electronic Equipment, Instruments & Components Total | | 11,718,010 |
|
| Internet Software & Services – 2.4% |
Equinix, Inc. (a) | | 33,075 | | 2,786,900 |
Google, Inc., Class A (a) | | 23,498 | | 10,848,322 |
Yahoo!, Inc. (a) | | 374,322 | | 5,468,844 |
|
Internet Software & Services Total | | 19,104,066 |
| | |
| IT Services – 2.0% | | | | |
Fiserv, Inc. (a) | | 55,608 | | 2,683,086 |
Hewitt Associates, Inc., Class A (a) | | 100,032 | | 3,603,153 |
MasterCard, Inc., Class A | | 14,513 | | 2,940,769 |
Redecard SA | | 268,100 | | 3,670,069 |
Western Union Co. | | 168,130 | | 3,033,065 |
|
IT Services Total | | 15,930,142 |
|
| Semiconductors & Semiconductor Equipment – 2.3% |
Amkor Technology, Inc. (a) | | 268,872 | | 1,489,551 |
Fairchild Semiconductor International, Inc. (a) | | 238,597 | | 2,400,286 |
Intel Corp. | | 367,427 | | 7,466,117 |
Micron Technology, Inc. (a) | | 608,535 | | 4,484,903 |
Texas Instruments, Inc. | | 100,409 | | 2,469,057 |
|
Semiconductors & Semiconductor Equipment Total | | 18,309,914 |
| | |
| Software – 3.3% | | | | |
Microsoft Corp. | | 810,610 | | 19,981,537 |
Oracle Corp. | | 157,321 | | 3,440,610 |
Symantec Corp. (a) | | 146,658 | | 2,217,469 |
|
Software Total | | 25,639,616 |
|
Information Technology Total | | | | 148,374,329 |
| | | | |
| Materials – 5.7% | | | | |
| Chemicals – 1.5% | | | | |
Albemarle Corp. | | 73,568 | | 2,371,097 |
Monsanto Co. | | 76,220 | | 6,393,334 |
Potash Corp. of Saskatchewan, Inc. | | 34,556 | | 3,058,551 |
|
Chemicals Total | | 11,822,982 |
See Accompanying Notes to Financial Statements.
10
Columbia Strategic Investor Fund
August 31, 2009
Common Stocks (continued)
| | | | |
| | | Shares | | Value ($) |
| Materials (continued) | | | | |
| Containers & Packaging – 0.4% | | | | |
Owens-Illinois, Inc. (a) | | 85,200 | | 2,891,688 |
|
Containers & Packaging Total | | 2,891,688 |
| | |
| Metals & Mining – 3.8% | | | | |
ArcelorMittal | | 92,214 | | 3,285,585 |
Cliffs Natural Resources, Inc. | | 90,042 | | 2,278,963 |
Freeport-McMoRan Copper & Gold, Inc. | | 127,517 | | 8,031,021 |
Kaiser Aluminum Corp. | | 103,223 | | 3,337,199 |
Nucor Corp. | | 91,326 | | 4,067,660 |
Thompson Creek Metals Co., Inc. (a) | | 449,440 | | 5,168,560 |
Vale SA, ADR | | 204,471 | | 3,927,888 |
|
Metals & Mining Total | | 30,096,876 |
|
Materials Total | | | | 44,811,546 |
| | | | |
| Telecommunication Services – 1.6% |
| Diversified Telecommunication Services – 0.4% |
Verizon Communications, Inc. | | 100,120 | | 3,107,725 |
|
Diversified Telecommunication Services Total | | 3,107,725 |
|
| Wireless Telecommunication Services – 1.2% |
American Tower Corp., Class A (a) | | 97,546 | | 3,087,331 |
Millicom International Cellular SA (a) | | 45,996 | | 3,245,477 |
Mobile TeleSystems OJSC, ADR | | 62,276 | | 2,701,533 |
|
Wireless Telecommunication Services Total | | 9,034,341 |
|
Telecommunication Services Total | | 12,142,066 |
| | |
| Utilities – 2.9% | | | | |
| Electric Utilities – 1.1% | | | | |
Entergy Corp. | | 61,265 | | 4,839,935 |
Exelon Corp. | | 78,593 | | 3,931,222 |
|
Electric Utilities Total | | 8,771,157 |
| | |
| Gas Utilities – 0.4% | | | | |
PT Perusahaan Gas Negara | | 10,198,000 | | 3,515,679 |
|
Gas Utilities Total | | 3,515,679 |
|
| Independent Power Producers & Energy Traders – 0.8% |
AES Corp. (a) | | 441,460 | | 6,034,758 |
|
Independent Power Producers & Energy Traders Total | | 6,034,758 |
| | | | |
| | | Shares | | Value ($) |
| Multi-Utilities – 0.6% | | | | |
Public Service Enterprise Group, Inc. | | 150,564 | | 4,768,362 |
|
Multi-Utilities Total | | | | 4,768,362 |
|
Utilities Total | | | | 23,089,956 |
|
Total Common Stocks
(cost of $661,458,644) | | 766,190,724 |
| | |
Short-Term Obligation – 2.2% | | | | |
| | | Par ($) | | |
Repurchase agreement with Fixed Income Clearing Corp., dated 08/31/09, due on 09/01/09, at 0.130%, collateralized by U.S. Treasury obligations with various maturities to 11/30/10, market value $17,969,250 (repurchase proceeds $17,614,064) | | 17,614,000 | | 17,614,000 |
|
Total Short-Term Obligation
(cost of $17,614,000) | | | | 17,614,000 |
|
Total Investments – 99.9%
(cost of $679,072,644)(b) | | | | 783,804,724 |
|
Other Assets & Liabilities, Net – 0.1% | | 430,481 |
|
Net Assets – 100.0% | | | | 784,235,205 |
Notes to Investment Portfolio:
| (a) | Non-income producing security. |
| (b) | Cost for federal income tax purposes is $682,147,120. |
The following table summarizes the inputs used, as of August 31, 2009 in valuing the Fund’s assets:
| | | | | | | | | | | | |
Description | | Quoted Prices
(Level 1) | | Other
Significant
Observable
Inputs
(Level 2) | | Significant
Unobservable
Inputs
(Level 3) | | Total |
Common Stocks | | | | | | | | | | | | |
Consumer Discretionary | | $ | 72,304,975 | | $ | 3,845,590 | | $ | — | | $ | 76,150,565 |
Consumer Staples | | | 60,922,616 | | | 5,217,424 | | | — | | | 66,140,040 |
Energy | | | 100,968,293 | | | 3,273,799 | | | — | | | 104,242,092 |
Financials | | | 126,747,819 | | | 3,545,489 | | | — | | | 130,293,308 |
Health Care | | | 81,147,760 | | | — | | | — | | | 81,147,760 |
Industrials | | | 70,412,003 | | | 9,387,059 | | | — | | | 79,799,062 |
Information Technology | | | 148,374,329 | | | — | | | — | | | 148,374,329 |
Materials | | | 44,811,546 | | | — | | | — | | | 44,811,546 |
Telecommunication Services | | | 12,142,066 | | | — | | | — | | | 12,142,066 |
Utilities | | | 19,574,277 | | | 3,515,679 | | | — | | | 23,089,956 |
| | | | | | | | | | | | |
Total Common Stocks | | | 737,405,684 | | | 28,785,040 | | | — | | | 766,190,724 |
| | | | | | | | | | | | |
Total Short-Term Obligation | | | — | | | 17,614,000 | | | — | | | 17,614,000 |
| | | | | | | | | | | | |
Total Investments | | $ | 737,405,684 | | $ | 46,399,040 | | $ | — | | $ | 783,804,724 |
| | | | | | | | | | | | |
See Accompanying Notes to Financial Statements.
11
Columbia Strategic Investor Fund
August 31, 2009
The Fund’s assets assigned to the Level 2 input category include certain foreign securities for which a third party statistical pricing service may be employed for purposes of fair market valuation.
For more information on valuation inputs, and their aggregation into the levels used in the table above, please refer to the Security Valuation section in the accompanying Notes to Financial Statements.
At August 31, 2009, the Fund held investments in the following sectors:
| | |
Sector (Unaudited) | | % of
Net Assets |
Information Technology | | 18.9 |
Financials | | 16.6 |
Energy | | 13.3 |
Health Care | | 10.4 |
Industrials | | 10.2 |
Consumer Discretionary | | 9.7 |
Consumer Staples | | 8.4 |
Materials | | 5.7 |
Utilities | | 2.9 |
Telecommunication Services | | 1.6 |
| | |
| | 97.7 |
Short-Term Obligation | | 2.2 |
Other Assets & Liabilities, Net | | 0.1 |
| | |
| | 100.0 |
| | |
The Fund was invested in the following countries at August 31, 2009:
| | | | | |
Summary of Securities
by Country (Unaudited) | | Value | | % of
Total Investments |
United States* | | $ | 680,386,141 | | 86.8 |
Brazil | | | 16,039,254 | | 2.0 |
Denmark | | | 14,594,920 | | 1.9 |
United Kingdom | | | 9,386,960 | | 1.2 |
Germany | | | 8,979,620 | | 1.1 |
Canada | | | 8,227,112 | | 1.1 |
France | | | 7,486,099 | | 0.9 |
Finland | | | 7,027,850 | | 0.9 |
Norway | | | 4,327,640 | | 0.6 |
Italy | | | 3,847,848 | | 0.5 |
Israel | | | 3,798,022 | | 0.5 |
Hong Kong | | | 3,545,488 | | 0.5 |
Indonesia | | | 3,515,680 | | 0.4 |
Netherlands | | | 3,285,585 | | 0.4 |
Switzerland | | | 2,814,471 | | 0.4 |
Russia | | | 2,701,533 | | 0.3 |
South Africa | | | 2,278,534 | | 0.3 |
Japan | | | 1,561,967 | | 0.2 |
| | | | | |
| | $ | 783,804,724 | | 100.0 |
| | | | | |
* Includes short-term obligation.
Certain securities are listed by country of underlying exposure but may trade predominantly on another exchange.
| | |
Acronym | | Name |
| ADR | | American Depositary Receipt |
See Accompanying Notes to Financial Statements.
12
Statement of Assets and Liabilities – Columbia Strategic Investor Fund
August 31, 2009
| | | | | |
| | | | | ($) | |
| Assets | | Investments, at cost | | 679,072,644 | |
| | | | | |
| | Investments, at value | | 783,804,724 | |
| | Cash | | 1,591 | |
| | Receivable for: | | | |
| | Investments sold | | 22,992,615 | |
| | Fund shares sold | | 69,029 | |
| | Dividends | | 935,069 | |
| | Interest | | 64 | |
| | Foreign tax reclaims | | 43,806 | |
| | Trustees’ deferred compensation plan | | 71,028 | |
| | Prepaid expenses | | 9,958 | |
| | | |
| | Total Assets | | 807,927,884 | |
| | |
| Liabilities | | Expense reimbursement due to investment advisor | | 60,668 | |
| | Payable for: | | | |
| | Investments purchased | | 21,384,926 | |
| | Fund shares repurchased | | 1,087,799 | |
| | Investment advisory fee | | 388,795 | |
| | Administration fee | | 100,244 | |
| | Transfer agent fee | | 273,931 | |
| | Pricing and bookkeeping fees | | 13,458 | |
| | Trustees’ fees | | 238 | |
| | Custody fee | �� | 9,000 | |
| | Distribution and service fees | | 72,189 | |
| | Chief compliance officer expenses | | 141 | |
| | Reports to shareholders | | 177,000 | |
| | Trustees’ deferred compensation plan | | 71,028 | |
| | Other liabilities | | 53,262 | |
| | | |
| | Total Liabilities | | 23,692,679 | |
| |
| | | |
| | Net Assets | | 784,235,205 | |
| | |
| Net Assets Consist of | | Paid-in capital | | 908,183,637 | |
| | Undistributed net investment income | | 3,910,097 | |
| | Accumulated net realized loss | | (232,589,664 | ) |
| | Net unrealized appreciation (depreciation) on: | | | |
| | Investments | | 104,732,080 | |
| | Foreign currency translations | | (945 | ) |
| | | |
| | Net Assets | | 784,235,205 | |
See Accompanying Notes to Financial Statements.
13
Statement of Assets and Liabilities (continued) – Columbia Strategic Investor Fund
August 31, 2009
| | | | | | |
| | | | | | |
| Class A | | Net assets | | $ | 158,624,054 | |
| | Shares outstanding | | | 10,852,351 | |
| | Net asset value per share | | $ | 14.62 | (a) |
| | Maximum sales charge | | | 5.75 | % |
| | Maximum offering price per share ($14.62/0.9425) | | $ | 15.51 | (b) |
| | |
| Class B | | | | | | |
| | Net assets | | $ | 24,932,781 | |
| | Shares outstanding | | | 1,765,845 | |
| | Net asset value and offering price per share | | $ | 14.12 | (a) |
| | |
| Class C | | | | | | |
| | Net assets | | $ | 19,873,507 | |
| | Shares outstanding | | | 1,406,953 | |
| | Net asset value and offering price per share | | $ | 14.13 | (a) |
| | |
| Class Y (c) | | | | | | |
| | Net assets | | $ | 9,629,839 | |
| | Shares outstanding | | | 657,726 | |
| | Net asset value, offering and redemption price per share | | $ | 14.64 | |
| | |
| Class Z | | | | | | |
| | Net assets | | $ | 571,175,024 | |
| | Shares outstanding | | | 39,017,329 | |
| | Net asset value, offering and redemption price per share | | $ | 14.64 | |
| (a) | Redemption price per share is equal to net asset value less any applicable contingent deferred sales charge. |
| (b) | On sales of $50,000 or more the offering price is reduced. |
| (c) | Class Y shares commenced operations on July 15, 2009. |
See Accompanying Notes to Financial Statements.
14
Statement of Operations – Columbia Strategic Investor Fund
For the Year Ended August 31, 2009
| | | | | |
| | | | | ($) (a) | |
| Investment Income | | Dividends | | 13,840,881 | |
| | Interest | | 17,478 | |
| | Foreign taxes withheld | | (186,911 | ) |
| | | |
| | Total Investment Income | | 13,671,448 | |
| | |
| Expenses | | Investment advisory fee | | 4,131,661 | |
| | Administration fee | | 1,058,644 | |
| | Distribution fee: | | | |
| | Class B | | 188,336 | |
| | Class C | | 147,985 | |
| | Service fee: | | | |
| | Class A | | 370,260 | |
| | Class B | | 62,779 | |
| | Class C | | 49,328 | |
| | Transfer agent fee – Class A, Class B, Class C and Class Z | | 2,488,953 | |
| | Transfer agent fee – Class Y | | 5 | |
| | Pricing and bookkeeping fees | | 143,423 | |
| | Trustees’ fees | | 48,177 | |
| | Custody fee | | 50,070 | |
| | Reports to shareholders | | 458,121 | |
| | Chief compliance officer expenses | | 831 | |
| | Other expenses | | 224,967 | |
| | | |
| | Total Expenses | | 9,423,540 | |
| | |
| | Fees waived or expenses reimbursed by investment advisor | | (1,606,165 | ) |
| | Expense reductions | | (214 | ) |
| | | |
| | Net Expenses | | 7,817,161 | |
| |
| | | |
| | Net Investment Income | | 5,854,287 | |
| | |
| Net Realized and Unrealized Gain (Loss) on Investments and Foreign Currency | | Net realized loss on: | | | |
| | Investments | | (157,672,633 | ) |
| | Foreign currency transactions | | (85,074 | ) |
| | | |
| | Net realized loss | | (157,757,707 | ) |
| | |
| | Net change in unrealized appreciation (depreciation) on: | | | |
| | Investments | | (54,363,040 | ) |
| | Foreign currency translations | | 5,231 | |
| | | |
| | Net change in unrealized appreciation (depreciation) | | (54,357,809 | ) |
| | | |
| | Net Loss | | (212,115,516 | ) |
| |
| | | |
| | Net Decrease Resulting from Operations | | (206,261,229 | ) |
| (a) | Class Y shares commenced operations on July 15, 2009. |
See Accompanying Notes to Financial Statements.
15
Statement of Changes in Net Assets – Columbia Strategic Investor Fund
| | | | | | | | |
| | | | | Year Ended August 31, | |
| Increase (Decrease) in Net Assets | | | | 2009 ($) | | | 2008 ($) | |
| Operations | | Net investment income | | 5,854,287 | | | 4,888,993 | |
| | Net realized loss on investments and foreign currency transactions | | (157,757,707 | ) | | (46,655,894 | ) |
| | Net change in unrealized appreciation (depreciation) on investments and foreign currency translations | | (54,357,809 | ) | | (37,426,421 | ) |
| | | |
| | Net decrease resulting from operations | | (206,261,229 | ) | | (79,193,322 | ) |
| | | |
| Distributions to Shareholders | | From net investment income: | | | | | | |
| | Class A | | (665,483 | ) | | (773,956 | ) |
| | Class Z | | (4,034,658 | ) | | (4,698,098 | ) |
| | From net realized gains: | | | | | | |
| | Class A | | — | | | (25,957,054 | ) |
| | Class B | | — | | | (5,475,529 | ) |
| | Class C | | — | | | (4,393,348 | ) |
| | Class Z | | — | | | (86,866,170 | ) |
| | | |
| | Total distributions to shareholders | | (4,700,141 | ) | | (128,164,155 | ) |
| | | |
| | Net Capital Stock Transactions | | (62,182,505 | ) | | 51,027,510 | |
| | Increase from regulatory settlements | | 176,191 | | | — | |
| | | |
| | Total decrease in net assets | | (272,967,684 | ) | | (156,329,967 | ) |
| | | |
| Net Assets | | Beginning of period | | 1,057,202,889 | | | 1,213,532,856 | |
| | End of period | | 784,235,205 | | | 1,057,202,889 | |
| | Undistributed net investment income at end of period | | 3,910,097 | | | 2,664,833 | |
See Accompanying Notes to Financial Statements.
16
Statement of Changes in Net Assets (continued) – Columbia Strategic Investor Fund
| | | | | | | | | | | | |
| | | Capital Stock Activity | |
| | | Year Ended August 31, | |
| | | 2009 | | | 2008 | |
| | | Shares | | | Dollars ($) | | | Shares | | | Dollars ($) | |
Class A | | | | | | | | | | | | |
Subscriptions | | 1,198,938 | | | 15,494,350 | | | 1,770,936 | | | 34,839,825 | |
Distributions reinvested | | 53,211 | | | 631,609 | | | 1,207,017 | | | 25,419,789 | |
Redemptions | | (2,913,464 | ) | | (36,422,408 | ) | | (2,371,293 | ) | | (46,749,332 | ) |
| | | | | | | | | | | | |
Net increase (decrease) | | (1,661,315 | ) | | (20,296,449 | ) | | 606,660 | | | 13,510,282 | |
| | | | |
Class B | | | | | | | | | | | | |
Subscriptions | | 90,795 | | | 1,125,543 | | | 209,919 | | | 3,963,170 | |
Distributions reinvested | | — | | | — | | | 246,493 | | | 5,055,566 | |
Redemptions | | (744,915 | ) | | (9,113,095 | ) | | (611,433 | ) | | (11,688,371 | ) |
| | | | | | | | | | | | |
Net decrease | | (654,120 | ) | | (7,987,552 | ) | | (155,021 | ) | | (2,669,635 | ) |
| | | | |
Class C | | | | | | | | | | | | |
Subscriptions | | 155,332 | | | 1,885,688 | | | 218,592 | | | 4,229,781 | |
Distributions reinvested | | — | | | — | | | 190,801 | | | 3,915,246 | |
Redemptions | | (707,882 | ) | | (8,714,088 | ) | | (581,094 | ) | | (11,340,571 | ) |
| | | | | | | | | | | | |
Net decrease | | (552,550 | ) | | (6,828,400 | ) | | (171,701 | ) | | (3,195,544 | ) |
| | | | |
Class Y (a) | | | | | | | | | | | | |
Subscriptions | | 657,726 | | | 9,266,434 | | | — | | | — | |
| | | | | | | | | | | | |
Net increase | | 657,726 | | | 9,266,434 | | | — | | | — | |
| | | | |
Class Z | | | | | | | | | | | | |
Subscriptions | | 2,698,045 | | | 33,794,489 | | | 2,899,426 | | | 57,635,847 | |
Distributions reinvested | | 334,033 | | | 3,961,625 | | | 4,275,497 | | | 90,127,466 | |
Redemptions | | (5,835,211 | ) | | (74,092,652 | ) | | (5,258,470 | ) | | (104,380,906 | ) |
| | | | | | | | | | | | |
Net increase (decrease) | | (2,803,133 | ) | | (36,336,538 | ) | | 1,916,453 | | | 43,382,407 | |
| (a) | Class Y shares commenced operations on July 15, 2009. |
See Accompanying Notes to Financial Statements.
17
Financial Highlights – Columbia Strategic Investor Fund
Selected data for a share outstanding throughout each period is as follows:
| | | | | | | | | | | | | | | | | | | | |
| | | Year Ended August 31, | |
| Class A Shares | | 2009 | | | 2008 | | | 2007 | | | 2006 | | | 2005 | |
Net Asset Value, Beginning of Period | | $ | 18.01 | | | $ | 21.48 | | | $ | 21.22 | | | $ | 21.21 | | | $ | 18.37 | |
| | | | | |
Income from Investment Operations: | | | | | | | | | | | | | | | | | | | | |
Net investment income (a) | | | 0.09 | | | | 0.06 | | | | 0.07 | | | | 0.13 | | | | 0.01 | |
Net realized and unrealized gain (loss) on investments and foreign currency | | | (3.42 | ) | | | (1.25 | ) | | | 2.97 | | | | 1.54 | | | | 3.08 | |
| | | | | | | | | | | | | | | | | | | | |
Total from investment operations | | | (3.33 | ) | | | (1.19 | ) | | | 3.04 | | | | 1.67 | | | | 3.09 | |
| | | | | |
Less Distributions to Shareholders: | | | | | | | | | | | | | | | | | | | | |
From net investment income | | | (0.06 | ) | | | (0.07 | ) | | | (0.10 | ) | | | (0.14 | ) | | | (0.03 | ) |
From net realized gains | | | — | | | | (2.21 | ) | | | (2.68 | ) | | | (1.52 | ) | | | (0.22 | ) |
| | | | | | | | | | | | | | | | | | | | |
Total distributions to shareholders | | | (0.06 | ) | | | (2.28 | ) | | | (2.78 | ) | | | (1.66 | ) | | | (0.25 | ) |
Increase from regulatory settlements | | | — | (b) | | | — | | | | — | | | | — | | | | — | |
| | | | | |
Net Asset Value, End of Period | | $ | 14.62 | | | $ | 18.01 | | | $ | 21.48 | | | $ | 21.22 | | | $ | 21.21 | |
Total return (c)(d) | | | (18.44 | )% | | | (7.09 | )% | | | 16.33 | % | | | 8.26 | % | | | 16.88 | % |
| | | | | |
Ratios to Average Net Assets/Supplemental Data: | | | | | | | | | | | | | | | | | | | | |
Net expenses | | | 1.24 | %(e) | | | 1.22 | %(f) | | | 1.23 | %(g) | | | 1.24 | %(e) | | | 1.24 | %(e) |
Waiver/Reimbursement | | | 0.23 | % | | | 0.03 | % | | | 0.02 | % | | | 0.01 | % | | | 0.03 | % |
Net investment income | | | 0.70 | %(e) | | | 0.30 | %(f) | | | 0.36 | %(g) | | | 0.65 | %(e) | | | 0.64 | %(e) |
Portfolio turnover rate | | | 117 | % | | | 88 | % | | | 139 | % | | | 82 | % | | | 80 | % |
Net assets, end of period (000s) | | $ | 158,624 | | | $ | 225,418 | | | $ | 255,743 | | | $ | 170,201 | | | $ | 169,340 | |
| (a) | Per share data was calculated using the average shares outstanding during the period. |
| (b) | Rounds to less than $0.01 per share. |
| (c) | Total return at net asset value assuming all distributions reinvested and no initial sales charge or contingent deferred sales charge. |
| (d) | Had the investment advisor and/or any of its affiliates not waived fees or reimbursed a portion of expenses, total return would have been reduced. |
| (e) | The benefits derived from expense reductions had an impact of less than 0.01%. |
| (f) | The benefits derived from expense reductions had an impact of 0.04%. |
| (g) | The benefits derived from expense reductions had an impact of 0.06%. |
See Accompanying Notes to Financial Statements.
18
Financial Highlights – Columbia Strategic Investor Fund
Selected data for a share outstanding throughout each period is as follows:
| | | | | | | | | | | | | | | | | | | | |
| | | Year Ended August 31, | |
| Class B Shares | | 2009 | | | 2008 | | | 2007 | | | 2006 | | | 2005 | |
Net Asset Value, Beginning of Period | | $ | 17.45 | | | $ | 20.96 | | | $ | 20.81 | | | $ | 20.84 | | | $ | 18.17 | |
| | | | | |
Income from Investment Operations: | | | | | | | | | | | | | | | | | | | | |
Net investment loss (a) | | | (0.01 | ) | | | (0.09 | ) | | | (0.08 | ) | | | (0.02 | ) | | | — | (b) |
Net realized and unrealized gain (loss) on investments and foreign currency | | | (3.32 | ) | | | (1.21 | ) | | | 2.91 | | | | 1.51 | | | | 2.89 | |
| | | | | | | | | | | | | | | | | | | | |
Total from investment operations | | | (3.33 | ) | | | (1.30 | ) | | | 2.83 | | | | 1.49 | | | | 2.89 | |
| | | | | |
Less Distributions to Shareholders: | | | | | | | | | | | | | | | | | | | | |
From net realized gains | | | — | | | | (2.21 | ) | | | (2.68 | ) | | | (1.52 | ) | | | (0.22 | ) |
Increase from regulatory settlements | | | — | (b) | | | — | | | | — | | | | — | | | | — | |
| | | | | |
Net Asset Value, End of Period | | $ | 14.12 | | | $ | 17.45 | | | $ | 20.96 | | | $ | 20.81 | | | $ | 20.84 | |
Total return (c)(d) | | | (19.08 | )% | | | (7.77 | )% | | | 15.50 | % | | | 7.47 | % | | | 15.97 | % |
| | | | | |
Ratios to Average Net Assets/Supplemental Data: | | | | | | | | | | | | | | | | | | | | |
Net expenses | | | 1.99 | %(e) | | | 1.97 | %(f) | | | 1.98 | %(g) | | | 1.99 | %(e) | | | 1.99 | %(e) |
Waiver/Reimbursement | | | 0.23 | % | | | 0.03 | % | | | 0.02 | % | | | 0.01 | % | | | 0.03 | % |
Net investment loss | | | (0.05 | )%(e) | | | (0.46 | )%(f) | | | (0.39 | )%(g) | | | (0.10 | )%(e) | | | (0.09 | )%(e) |
Portfolio turnover rate | | | 117 | % | | | 88 | % | | | 139 | % | | | 82 | % | | | 80 | % |
Net assets, end of period (000s) | | $ | 24,933 | | | $ | 42,229 | | | $ | 53,965 | | | $ | 51,446 | | | $ | 49,318 | |
| (a) | Per share data was calculated using the average shares outstanding during the period. |
| (b) | Rounds to less than $0.01 per share. |
| (c) | Total return at net asset value assuming all distributions reinvested and no contingent deferred sales charge. |
| (d) | Had the investment advisor and/or any of its affiliates not waived fees or reimbursed a portion of expenses, total return would have been reduced. |
| (e) | The benefits derived from expense reductions had an impact of less than 0.01%. |
| (f) | The benefits derived from expense reductions had an impact of 0.04%. |
| (g) | The benefits derived from expense reductions had an impact of 0.06%. |
See Accompanying Notes to Financial Statements.
19
Financial Highlights – Columbia Strategic Investor Fund
Selected data for a share outstanding throughout each period is as follows:
| | | | | | | | | | | | | | | | | | | | |
| | | Year Ended August 31, | |
| Class C Shares | | 2009 | | | 2008 | | | 2007 | | | 2006 | | | 2005 | |
Net Asset Value, Beginning of Period | | $ | 17.46 | | | $ | 20.96 | | | $ | 20.82 | | | $ | 20.85 | | | $ | 18.18 | |
| | | | | |
Income from Investment Operations: | | | | | | | | | | | | | | | | | | | | |
Net investment loss (a) | | | (0.01 | ) | | | (0.09 | ) | | | (0.08 | ) | | | (0.02 | ) | | | — | (b) |
Net realized and unrealized gain (loss) on investments and foreign currency | | | (3.32 | ) | | | (1.20 | ) | | | 2.90 | | | | 1.51 | | | | 2.89 | |
| | | | | | | | | | | | | | | | | | | | |
Total from investment operations | | | (3.33 | ) | | | (1.29 | ) | | | 2.82 | | | | 1.49 | | | | 2.89 | |
| | | | | |
Less Distributions to Shareholders: | | | | | | | | | | | | | | | | | | | | |
From net realized gains | | | — | | | | (2.21 | ) | | | (2.68 | ) | | | (1.52 | ) | | | (0.22 | ) |
Increase from regulatory settlements | | | — | (b) | | | — | | | | — | | | | — | | | | — | |
| | | | | |
Net Asset Value, End of Period | | $ | 14.13 | | | $ | 17.46 | | | $ | 20.96 | | | $ | 20.82 | | | $ | 20.85 | |
Total return (c)(d) | | | (19.07 | )% | | | (7.72 | )% | | | 15.43 | % | | | 7.46 | % | | | 15.96 | % |
| | | | | |
Ratios to Average Net Assets/Supplemental Data: | | | | | | | | | | | | | | | | | | | | |
Net expenses | | | 1.99 | %(e) | | | 1.97 | %(f) | | | 1.98 | %(g) | | | 1.99 | %(e) | | | 1.99 | %(e) |
Waiver/Reimbursement | | | 0.23 | % | | | 0.03 | % | | | 0.02 | % | | | 0.01 | % | | | 0.03 | % |
Net investment loss | | | (0.05 | )%(e) | | | (0.46 | )%(f) | | | (0.40 | )%(g) | | | (0.10 | )%(e) | | | (0.09 | )%(e) |
Portfolio turnover rate | | | 117 | % | | | 88 | % | | | 139 | % | | | 82 | % | | | 80 | % |
Net assets, end of period (000s) | | $ | 19,874 | | | $ | 34,208 | | | $ | 44,682 | | | $ | 43,881 | | | $ | 39,253 | |
| (a) | Per share data was calculated using the average shares outstanding during the period. |
| (b) | Rounds to less than $0.01 per share. |
| (c) | Total return at net asset value assuming all distributions reinvested and no contingent deferred sales charge. |
| (d) | Had the investment advisor and/or any of its affiliates not waived fees or reimbursed a portion of expenses, total return would have been reduced. |
| (e) | The benefits derived from expense reductions had an impact of less than 0.01%. |
| (f) | The benefits derived from expense reductions had an impact of 0.04%. |
| (g) | The benefits derived from expense reductions had an impact of 0.06%. |
See Accompanying Notes to Financial Statements.
20
Financial Highlights – Columbia Strategic Investor Fund
Selected data for a share outstanding throughout the period is as follows:
| | | | |
| Class Y Shares | | Period Ended
August 31,
2009 (a) | |
Net Asset Value, Beginning of Period | | $ | 13.32 | |
| |
Income from Investment Operations: | | | | |
Net investment income (b) | | | 0.02 | |
Net realized and unrealized gain on investments and foreign currency | | | 1.30 | |
| | | | |
Total from investment operations | | | 1.32 | |
| |
Net Asset Value, End of Period | | $ | 14.64 | |
Total return (c)(d)(e) | | | 9.91 | % |
| |
Ratios to Average Net Assets/Supplemental Data: | | | | |
Net expenses (f)(g) | | | 0.72 | % |
Net investment income (f)(g) | | | 0.99 | % |
Portfolio turnover rate (e) | | | 117 | % |
Net assets, end of period (000s) | | $ | 9,630 | |
| (a) | Class Y shares commenced operations on July 15, 2009. Per share data and total return reflect activity from that date. |
| (b) | Per share data was calculated using the average shares outstanding during the period. |
| (c) | Total return at net asset value assuming all distributions reinvested. |
| (d) | Had the investment advisor and/or any of its affiliates not waived fees or reimbursed a portion of expenses, total return would have been reduced. |
| (f) | The benefits derived from expense reductions had an impact of less than 0.01%. |
See Accompanying Notes to Financial Statements.
21
Financial Highlights – Columbia Strategic Investor Fund
Selected data for a share outstanding throughout each period is as follows:
| | | | | | | | | | | | | | | | | | | | |
| | | Year Ended August 31, | |
| Class Z Shares | | 2009 | | | 2008 | | | 2007 | | | 2006 | | | 2005 | |
Net Asset Value, Beginning of Period | | $ | 18.06 | | | $ | 21.53 | | | $ | 21.28 | | | $ | 21.27 | | | $ | 18.42 | |
| | | | | |
Income from Investment Operations: | | | | | | | | | | | | | | | | | | | | |
Net investment income (a) | | | 0.12 | | | | 0.11 | | | | 0.13 | | | | 0.18 | | | | 0.01 | |
Net realized and unrealized gain (loss) on investments and foreign currency | | | (3.44 | ) | | | (1.25 | ) | | | 2.96 | | | | 1.54 | | | | 3.13 | |
| | | | | | | | | | | | | | | | | | | | |
Total from investment operations | | | (3.32 | ) | | | (1.14 | ) | | | 3.09 | | | | 1.72 | | | | 3.14 | |
| | | | | |
Less Distributions to Shareholders: | | | | | | | | | | | | | | | | | | | | |
From net investment income | | | (0.10 | ) | | | (0.12 | ) | | | (0.16 | ) | | | (0.19 | ) | | | (0.07 | ) |
From net realized gains | | | — | | | | (2.21 | ) | | | (2.68 | ) | | | (1.52 | ) | | | (0.22 | ) |
| | | | | | | | | | | | | | | | | | | | |
Total distributions to shareholders | | | (0.10 | ) | | | (2.33 | ) | | | (2.84 | ) | | | (1.71 | ) | | | (0.29 | ) |
Increase from regulatory settlements | | | — | (b) | | | — | | | | — | | | | — | | | | — | |
| | | | | |
Net Asset Value, End of Period | | $ | 14.64 | | | $ | 18.06 | | | $ | 21.53 | | | $ | 21.28 | | | $ | 21.27 | |
Total return (c)(d) | | | (18.26 | )% | | | (6.85 | )% | | | 16.62 | % | | | 8.50 | % | | | 17.16 | % |
| | | | | |
Ratios to Average Net Assets/Supplemental Data: | | | | | | | | | | | | | | | | | | | | |
Net expenses | | | 0.99 | %(e) | | | 0.97 | %(f) | | | 0.98 | %(g) | | | 0.99 | %(e) | | | 0.99 | %(e) |
Waiver/Reimbursement | | | 0.23 | % | | | 0.03 | % | | | 0.02 | % | | | 0.01 | % | | | 0.03 | % |
Net investment income | | | 0.94 | %(e) | | | 0.55 | %(f) | | | 0.63 | %(g) | | | 0.89 | %(e) | | | 0.86 | %(e) |
Portfolio turnover rate | | | 117 | % | | | 88 | % | | | 139 | % | | | 82 | % | | | 80 | % |
Net assets, end of period (000s) | | $ | 571,175 | | | $ | 755,348 | | | $ | 859,142 | | | $ | 179,027 | | | $ | 267,380 | |
| (a) | Per share data was calculated using the average shares outstanding during the period. |
| (b) | Rounds to less than $0.01 per share. |
| (c) | Total return at net asset value assuming all distributions reinvested. |
| (d) | Had the investment advisor and/or any of its affiliates not waived fees or reimbursed a portion of expenses, total return would have been reduced. |
| (e) | The benefits derived from expense reductions had an impact of less than 0.01%. |
| (f) | The benefits derived from expense reductions had an impact of 0.04%. |
| (g) | The benefits derived from expense reductions had an impact of 0.06%. |
See Accompanying Notes to Financial Statements.
22
Notes to Financial Statements – Columbia Strategic Investor Fund
August 31, 2009
Note 1. Organization
Columbia Strategic Investor Fund (the “Fund”), a series of Columbia Funds Series Trust I (the “Trust”), is a diversified fund. The Trust is a Massachusetts business trust registered under the Investment Company Act of 1940, as amended (the “1940 Act”), as an open-end management investment company.
Investment Objective
The Fund seeks long-term growth of capital by using a “value” approach to investing primarily in common stocks.
Fund Shares
The Trust may issue an unlimited number of shares, and the Fund offers five classes of shares: Class A, Class B, Class C, Class Y and Class Z. Each share class has its own expense structure and sales charges, as applicable. Class Y shares commenced operations effective July 15, 2009. Effective June 22, 2009, the Fund no longer accepts investments in Class B shares from new or existing investors in the Fund’s Class B shares, except in connection with the reinvestment of any dividend and/or capital gain distributions in Class B shares of the Fund, and exchanges by existing Class B shareholders of other Columbia Funds.
Class A shares are subject to a maximum front-end sales charge of 5.75% based on the amount of initial investment. Class A shares purchased without an initial sales charge in accounts aggregating $1 million to $50 million at the time of purchase are subject to a 1.00% contingent deferred sales charge (“CDSC”) if the shares are sold within one year after purchase. Class B shares are subject to a maximum CDSC of 5.00% based upon the holding period after purchase. Class B shares will convert to Class A shares eight years after purchase. Class C shares are subject to a 1.00% CDSC on shares sold within one year after purchase. Class Y and Class Z shares are offered continuously at net asset value. There are certain restrictions on the purchase of Class Y and Class Z shares, as described in the Fund’s prospectus.
Note 2. Significant Accounting Policies
The preparation of financial statements in accordance with accounting principles generally accepted in the United States of America (“GAAP”) requires management to make certain estimates and assumptions that affect the reported amounts of assets and liabilities, the disclosure of contingent assets and liabilities at the date of the financial statements and the reported amounts of revenue and expenses during the reporting period. Actual results could differ from those estimates.
Management has evaluated the events and transactions that have occurred through October 22, 2009, the date the financial statements were issued, and except as disclosed in Note 11, noted no items requiring adjustment of the financial statements or additional disclosures.
The following is a summary of significant accounting policies consistently followed by the Fund in the preparation of its financial statements.
Security Valuation
Equity securities are valued at the last sale price on the principal exchange on which they trade, except for securities traded on the NASDAQ, which are valued at the NASDAQ official close price. Unlisted securities or listed securities for which there were no sales during the day are valued at the closing bid price on such exchanges or over-the-counter markets.
Short-term investments maturing in 60 days or less are valued at amortized cost, which approximates market value.
Foreign securities are generally valued at the last sale price on the foreign exchange or market on which they trade. If any foreign share prices are not readily available as a result of limited share activity, the securities are valued at the last sale price of the local shares in the principal market in which such securities are normally traded.
Generally, trading in foreign securities is substantially completed each day at various times prior to the close of the New York Stock Exchange (“NYSE”). The values of such securities used in computing the net asset value of the Fund’s shares are determined as of such times. Foreign currency exchange rates are generally determined at 4:00 p.m. Eastern (U.S.) time. Occasionally, events affecting the values of such foreign securities and such exchange rates may occur between the times at which they are determined and the close of the customary trading session of the NYSE, which would not be reflected in the computation of the Fund’s net asset value. If events materially affecting the values of such foreign securities occur and it is determined that market
23
Columbia Strategic Investor Fund
August 31, 2009
quotations are not reliable, then these foreign securities will be valued at their fair value using procedures approved by the Board of Trustees.
Investments for which market quotations are not readily available, or that have quotations which management believes are not reliable, are valued at fair value as determined in good faith under consistently applied procedures established by and under the general supervision of the Board of Trustees. If a security is valued at fair value, such value is likely to be different from the last quoted market price for the security. The determination of fair value often requires significant judgment. To determine fair value, management may use assumptions including but not limited to future cash flows and estimated risk premiums. Multiple inputs from various sources may be used to determine value.
Various inputs are used to determine the value of the Fund’s investments. Management establishes a hierarchy that prioritizes the inputs to valuation techniques used to measure fair value giving the highest priority to unadjusted quoted prices in active markets for identical securities (level 1 measurements) and the lowest priority to unobservable inputs (level 3 measurements) when market prices are not readily available or reliable. The three levels of the fair value hierarchy are described below:
| | • | | Level 1 – quoted prices in active markets for identical securities | |
| | • | | Level 2 – prices determined using other significant observable inputs (including quoted prices for similar securities, interest rates, prepayment speeds, credit risk and others) | |
| | • | | Level 3 – prices determined using significant unobservable inputs. In situations where quoted prices or observable inputs are unavailable or less reliable, unobservable inputs may be used. Unobservable inputs may include management’s own assumptions about the factors market participants would use in pricing an investment. | |
The inputs or methodology used for valuing securities are not necessarily an indication of the risk associated with investing in those securities.
Security Transactions
Security transactions are accounted for on the trade date. Cost is determined and gains (losses) are based upon the specific identification method for both financial statement and federal income tax purposes.
Repurchase Agreements
The Fund may engage in repurchase agreement transactions with institutions that Columbia Management Advisors, LLC (“Columbia”), the Fund’s investment advisor, has determined are creditworthy. The Fund, through its custodian, receives delivery of the underlying securities collateralizing a repurchase agreement. Columbia is responsible for determining that the collateral is at least equal, at all times, to the value of the repurchase obligation including interest. A repurchase agreement transaction involves certain risks in the event of default or insolvency of the counterparty. These risks include possible delays in or restrictions on the Fund’s ability to dispose of the underlying securities and a possible decline in the value of the underlying securities during the period while the Fund seeks to assert its rights.
Foreign Currency Transactions and Translations
The values of all assets and liabilities quoted in foreign currencies are translated into U.S. dollars at that day’s exchange rates. Net realized and unrealized gains (losses) on foreign currency transactions and translations include gains (losses) arising from the fluctuation in exchange rates between trade and settlement dates on securities transactions, gains (losses) arising from the disposition of foreign currency and currency gains (losses) between the accrual and payment dates on dividends, interest income and foreign withholding taxes.
For financial statement purposes, the Fund does not distinguish that portion of gains (losses) on investments which is due to changes in foreign exchange rates from that which is due to changes in market prices of the investments. Such fluctuations are included with the net realized and unrealized gains (losses) on investments on the Statement of Operations.
Income Recognition
Interest income is recorded on the accrual basis.
Corporate actions and dividend income are recorded on the ex-date except for certain foreign securities which are recorded as soon after the ex-date as the Fund becomes aware of such, net of any non-reclaimable tax withholdings.
24
Columbia Strategic Investor Fund
August 31, 2009
Expenses
General expenses of the Trust are allocated to the Fund and other series of the Trust based upon relative net assets or other expense allocation methodologies determined by the nature of the expense. Expenses directly attributable to the Fund are charged to the Fund.
Determination of Class Net Asset Value
All income, expenses (other than class-specific expenses, as shown on the Statement of Operations) and realized and unrealized gains (losses) are allocated to each class of the Fund on a daily basis, based on the relative net assets of each class, for purposes of determining the net asset value of each class.
Federal Income Tax Status
The Fund intends to qualify each year as a “regulated investment company” under Subchapter M of the Internal Revenue Code, as amended, and will distribute substantially all of its taxable income, if any, for its tax year, and as such will not be subject to federal income taxes. In addition, the Fund intends to distribute in each calendar year substantially all of its net investment income, capital gains and certain other amounts, if any, such that the Fund should not be subject to federal excise tax. Therefore, no federal income or excise tax provision is recorded.
Distributions to Shareholders
Distributions from net investment income, if any, are declared and paid annually. Net realized capital gains, if any, are distributed at least annually. Income distributions and capital gain distributions are determined in accordance with federal income tax regulations which may differ from GAAP.
Indemnification
In the normal course of business, the Fund enters into contracts that contain a variety of representations and warranties and which provide general indemnities. The Fund’s maximum exposure under these arrangements is unknown because this would involve future claims against the Fund. Also, under the Trust’s organizational documents and by contract, the Trustees and officers of the Trust are indemnified against certain liabilities that may arise out of actions relating to their duties to the Trust. However, based on experience, the Fund expects the risk of loss due to these representations, warranties and indemnities to be minimal.
Note 3. Federal Tax Information
The timing and character of income and capital gain distributions are determined in accordance with income tax regulations, which may differ from GAAP. Reclassifications are made to the Fund’s capital accounts for permanent tax differences to reflect income and gains available for distribution (or available capital loss carryforwards) under income tax regulations.
For the year ended August 31, 2009, permanent book and tax basis differences resulting primarily from differing treatments for foreign currency transactions and expired capital loss carryforward were identified and reclassified among the components of the Fund’s net assets as follows:
| | | | |
| | | | | |
Undistributed Net Investment
Income | | Accumulated Net Realized
Loss | | Paid-In Capital |
| $91,118 | | $85,073 | | $(176,191) |
Net investment income and net realized gains (losses), as disclosed on the Statement of Operations, and net assets were not affected by this reclassification.
The tax character of distributions paid during the years ended August 31, 2009 and August 31, 2008 was as follows:
| | | | | | |
| | | August 31, |
| | | 2009 | | 2008 |
Ordinary Income* | | $ | 4,700,141 | | $ | 8,110,181 |
Long-Term Capital Gains | | | — | | | 120,053,974 |
| * | For tax purposes short-term capital gains distributions, if any, are considered ordinary income distributions. |
As of August 31, 2009, the components of distributable earnings on a tax basis were as follows:
| | | | |
| | | | | |
Undistributed
Ordinary Income | | Undistributed Long-term Capital Gains | | Net
Unrealized Appreciation* |
| $4,021,259 | | $— | | $101,657,604 |
| * | The differences between book-basis and tax-basis net unrealized depreciation are primarily due to deferral of losses from wash sales. |
25
Columbia Strategic Investor Fund
August 31, 2009
Unrealized appreciation and depreciation at August 31, 2009, based on cost of investments for federal income tax purposes were:
| | | | |
| | | | |
Unrealized appreciation | | $ | 135,211,118 | |
Unrealized depreciation | | | (33,553,514 | ) |
Net unrealized appreciation | | $ | 101,657,604 | |
The following capital loss carryforwards may be available to reduce taxable income arising from future net realized gains on investments, if any, to the extent permitted by the Internal Revenue Code:
| | | |
| | | |
| Year of Expiration | | Capital Loss Carryforward |
| 2011 | | $ | 15,870,696 |
| 2017 | | | 122,751,575 |
| | | |
| Total | | $ | 138,622,271 |
Of the remaining capital loss carryforwards attributable to the Fund, $15,870,696 expiring August 31, 2011 remains from the Fund’s merger with Columbia Young Investor Fund. Utilization of capital losses from Columbia Young Investor Fund could be subject to limitations imposed by the Internal Revenue Code.
Under current tax rules, certain currency (and capital) losses realized after October 31 may be deferred and treated as occurring on the first day of the following fiscal year. As of August 31, 2009, post-October capital losses of $90,892,917 attributed to security transactions were deferred to September 1, 2009.
Management is required to determine whether a tax position of the Fund is more likely than not to be sustained upon examination by the applicable taxing authority, including resolution of any related appeals or litigation processes, based on the technical merits of the position. The tax benefit to be recognized by the Fund is measured as the largest amount of benefit that is greater than fifty percent likely of being realized upon ultimate settlement. Management is not aware of any tax positions for which it is reasonably possible that the total amounts of unrecognized tax benefits will significantly change in the next twelve months. However, management’s conclusions may be subject to review and adjustment at a later date based on factors including, but not limited to, new tax laws, regulations, and administrative interpretations (including relevant court decisions). The Fund’s federal tax returns for the prior three fiscal years remain subject to examination by the Internal Revenue Service.
Note 4. Fees and Compensation Paid to Affiliates
Investment Advisory Fee
Columbia, an indirect, wholly owned subsidiary of Bank of America Corporation (“BOA”), provides investment advisory services to the Fund. In rendering investment advisory services to the Fund, Columbia may use the portfolio management and research resources of Columbia Management Pte. Ltd., an affiliate of Columbia. Columbia receives a monthly investment advisory fee based on the Fund’s average daily net assets at the following annual rates:
| | | |
| | | | |
| Average Daily Net Assets | | Annual Fee Rate | |
First $500 million | | 0.60 | % |
$500 million to $1 billion | | 0.55 | % |
Over $1 billion | | 0.50 | % |
For the year ended August 31, 2009, the Fund’s effective investment advisory fee rate was 0.59% of the Fund’s average daily net assets.
Administration Fee
Columbia provides administrative and other services to the Fund for a monthly administration fee based on the Fund’s average daily net assets at the following annual rates:
| | | |
| | | | |
| Average Daily Net Assets | | Annual Fee Rates | |
First $1 billion | | 0.150 | % |
Over $1 billion | | 0.125 | % |
For the year ended August 31, 2009, the effective administration fee rate was 0.15% of the Fund’s average daily net assets.
Pricing and Bookkeeping Fees
The Fund has entered into a Financial Reporting Services Agreement (the “Financial Reporting Services Agreement”) with State Street Bank & Trust Company (“State Street”) and Columbia pursuant to which State Street provides financial
26
Columbia Strategic Investor Fund
August 31, 2009
reporting services to the Fund. The Fund has also entered into an Accounting Services Agreement (collectively with the Financial Reporting Services Agreement, the “State Street Agreements”) with State Street and Columbia pursuant to which State Street provides accounting services to the Fund. Under the State Street Agreements, the Fund pays State Street an annual fee of $38,000 paid monthly plus an additional monthly fee based on an annualized percentage rate of average daily net assets of the Fund for the month. The aggregate fee will not exceed $140,000 per year (exclusive of out-of-pocket expenses and charges). The Fund also reimburses State Street for certain out-of-pocket expenses and charges.
The Fund has entered into a Pricing and Bookkeeping Oversight and Services Agreement (the “Services Agreement”) with Columbia. Under the Services Agreement, Columbia provides services related to Fund expenses and the requirements of the Sarbanes-Oxley Act of 2002, and provides oversight of the accounting and financial reporting services provided by State Street. Under the Services Agreement, the Fund reimburses Columbia for out-of-pocket expenses.
Transfer Agent Fee
Columbia Management Services, Inc. (the “Transfer Agent”), an affiliate of Columbia and an indirect, wholly owned subsidiary of BOA, provides shareholder services to the Fund and has contracted with Boston Financial Data Services (“BFDS”) to serve as sub-transfer agent.
The Fund pays monthly fees to the Transfer Agent for its services. Class Y shares pay a monthly service fee based on the following:
| (i) | An annual rate of $17.34 is applied to the aggregate number of open accounts for Class Y shares, |
| (ii) | An allocated portion of fees for wire, telephone and redemption orders, Individual Retirement Account (“IRA”) trustee agent fees and account transcript fees due to the Transfer Agent from shareholders of the Fund and credits (net of bank charges) earned with respect to balances in accounts the Transfer Agent maintains in connection with its services to the Fund. The Transfer Agent also receives reimbursement for certain out-of-pocket expenses. |
All other share classes of the Fund (the “Other Share Classes”) pay a monthly service fee (the “aggregate fee”) based on the following:
| (i) | An annual rate of $17.34 is applied to the aggregate number of open accounts for the Other Share Classes, and |
| (iii) | An allocated portion of fees for wire, telephone and redemption orders, IRA trustee agent fees and account transcript fees due to the Transfer Agent from shareholders of the Fund and credits (net of bank charges) earned with respect to balances in accounts the Transfer Agent maintains in connection with its services to the Fund. The Transfer Agent also receives reimbursement for certain out-of-pocket expenses. |
The aggregate fee is allocated to the Other Share Classes based on the relative average daily net assets of each share class.
The Transfer Agent is also entitled to receive reimbursement of certain sub-transfer agent fees paid by the Transfer Agent (exclusive of BFDS fees), calculated based on the combined assets held in the Other Share Classes in omnibus accounts and intended to recover the cost of payments to other parties (including affiliates of BOA) for services to those accounts. Such fees are allocated to the Other Share Classes based on the relative average daily net assets of each share class. The Transfer Agent pays the fees of BFDS for services as sub-transfer agent and is not entitled to reimbursement for such fees from the Fund.
An annual minimum account balance fee of $20 may apply to certain accounts with a value below the Fund’s initial minimum investment requirements to reduce the impact of small accounts on transfer agent fees. These minimum account balance fees are recorded as part of expense reductions on the Statement of Operations. For the year ended August 31, 2009, no minimum account balance fees were charged by the Fund.
Underwriting Discounts, Service and Distribution Fees
Columbia Management Distributors, Inc. (the “Distributor”), an affiliate of Columbia and an indirect, wholly owned subsidiary of BOA, is the principal underwriter of the Fund’s shares. For the year ended August 31, 2009, the Distributor has retained net underwriting discounts of $11,787 on sales of
27
Columbia Strategic Investor Fund
August 31, 2009
the Fund’s Class A shares and received net CDSC fees of $463, $70,039 and $2,303 on Class A, Class B and Class C share redemptions, respectively.
The Fund has adopted distribution and shareholder servicing plans pursuant to Rule 12b-1 under the 1940 Act (the “Plans”) which require the payment of a monthly service fee to the Distributor at the maximum annual rate of 0.25% of the average daily net assets attributable to Class A, Class B and Class C shares of the Fund. The Plans also require the payment of a monthly distribution fee to the Distributor at the maximum annual rate of 0.75% of the average daily net assets attributable to Class B and Class C shares only.
The CDSC and the distribution fees received from the Plans are used principally as repayment to the Distributor for amounts paid by the Distributor to dealers who sold such shares.
Expense Limits and Fee Waivers
Effective January 16, 2009, Columbia has voluntarily agreed to reimburse a portion of the Fund’s expenses so that the Fund’s ordinary operating expenses (excluding any distribution and service fees, brokerage commissions, interest, taxes and extraordinary expenses, but including custodian charges relating to overdrafts, if any), after giving effect to any balance credits from the Fund’s custodian, do not exceed 1.00% annually of the Fund’s average daily net assets. Columbia, in its discretion, may revise or discontinue this arrangement at any time.
Prior to January 16, 2009, Columbia voluntarily waived fees and/or reimbursed the Fund so that total expenses (excluding any distribution and service fees, brokerage commissions, interest, taxes and extraordinary expenses, but including custodian charges relating to overdrafts, if any), after giving effect to any balance credits from the Fund’s custodian, did not exceed 0.98% annually of the Fund’s average daily net assets.
Fees Paid to Officers and Trustees
All officers of the Fund are employees of Columbia or its affiliates and, with the exception of the Fund’s Chief Compliance Officer, receive no compensation from the Fund. The Board of Trustees has appointed a Chief Compliance Officer to the Fund in accordance with federal securities regulations. The Fund, along with other affiliated funds, pays its pro-rata share of the expenses associated with the Chief Compliance Officer. The Fund’s expenses for the Chief Compliance Officer will not exceed $15,000 per year.
The Fund’s eligible Trustees may participate in a deferred compensation plan which may be terminated at any time. Obligations of the plan will be paid solely out of the Fund’s assets.
Note 5. Custody Credits
The Fund has an agreement with its custodian bank under which custody fees may be reduced by balance credits. These credits are recorded as part of expense reductions on the Statement of Operations. The Fund could have invested a portion of the assets utilized in connection with the expense offset arrangement in an income-producing asset if it had not entered into such an agreement.
For the year ended August 31, 2009, these custody credits reduced total expenses by $214 for the Fund.
Note 6. Portfolio Information
For the year ended August 31, 2009, the cost of purchases and proceeds from sales of securities, excluding short-term obligations, for the Fund were $842,340,362 and $910,224,590, respectively.
Note 7. Regulatory Settlements
As of August 31, 2009, the Fund had received payments of $176,191 relating to certain regulatory settlements with third parties that the Fund had participated in during the year. The payments have been included in “Increase from regulatory settlements” on the Statement of Changes in Net Assets.
Note 8. Line of Credit
The Fund and other affiliated funds participate in a $280,000,000 committed, unsecured revolving line of credit provided by State Street. The maximum amount that may be borrowed by any fund is limited to the lesser of $200,000,000 and the Fund’s borrowing limit set forth in the Fund’s registration statement. Borrowings are available for short-term liquidity or temporary or emergency purposes.
Interest is charged to each participating fund based on the fund’s borrowings at a rate per annum equal to the greater of the Federal Funds Rate plus 0.50% or the overnight LIBOR Rate plus 0.50%. In addition, an annual operations agency fee
28
Columbia Strategic Investor Fund
August 31, 2009
of $20,000, an amendment fee of 0.02% and a commitment fee of 0.12% per annum are accrued and apportioned among the participating funds pro rata based on their relative net assets. Prior to October 16, 2008, the Fund and other affiliated funds participated in a $350,000,000 committed, unsecured revolving line of credit and a $150,000,000 uncommitted, unsecured line of credit, both provided by State Street. Interest on the committed line of credit was charged to each participating fund based on the fund’s borrowings at a rate per annum equal to the Federal Funds Rate plus 0.50%. In addition, a commitment fee of 0.10% per annum was accrued and apportioned among the participating funds pro rata based on their relative net assets. Interest on the uncommitted line of credit was charged to each participating fund based on the fund’s borrowings at a rate per annum equal to the Federal Funds Rate plus 0.375%. State Street charged an annual operations agency fee of $40,000 for the committed line of credit and was able to charge an annual administration fee of $15,000 for the uncommitted line of credit. The commitment fee, the operations agency fee and the administration fee were accrued and apportioned among the participating funds pro rata based on their relative net assets.
For the year ended August 31, 2009, the Fund did not borrow under these arrangements.
Note 9. Shares of Beneficial Interest
As of August 31, 2009, the Fund had one shareholder that held 7.2% of the shares outstanding, over which BOA and/or any of its affiliates did not have investment discretion.
Subscription and redemption activity of this account may have a significant effect on the operations of the Fund.
Note 10. Significant Risks and Contingencies
Foreign Securities Risk
There are certain additional risks involved when investing in foreign securities. These risks may involve foreign currency exchange rate fluctuations, adverse political and economic developments and the possible prevention of currency exchange or other foreign governmental laws or restrictions. In addition, the liquidity of foreign securities may be more limited than that of domestic securities.
Legal Proceedings
Columbia Management Advisors, LLC and Columbia Management Distributors, Inc. (collectively, the “Columbia Group”) are subject to a settlement agreement with the New York Attorney General (“NYAG”) (the “NYAG Settlement”) and a settlement order with the SEC (the “SEC Order”) on matters relating to mutual fund trading, each dated February 9, 2005. Under the terms of the SEC Order, the Columbia Group (or predecessor entities) agreed, among other things, to: pay disgorgement and civil money penalties collectively totaling $140 million; cease and desist from violations of the antifraud provisions and certain other provisions of the federal securities laws; maintain certain compliance and ethics oversight structures; and retain an independent consultant to review the Columbia Group’s applicable supervisory, compliance, control and other policies and procedures. The NYAG Settlement, among other things, requires Columbia Management Advisors, LLC and its affiliates to reduce management fees for certain funds in the Columbia family of mutual funds in a projected total of $160 million over five years through November 30, 2009 and to make certain disclosures to investors relating to expenses. In connection with the Columbia Group providing services to the Columbia Funds, the Columbia Funds have voluntarily undertaken to implement certain governance measures designed to maintain the independence of their boards of trustees and certain special consulting and compliance measures.
Pursuant to the SEC Order and related procedures, the $140 million in settlement amounts described above has been substantially distributed in accordance with a distribution plan that was developed by an independent distribution consultant and approved by the SEC on April 6, 2007.
In connection with the events described above, various parties have filed suit against certain funds, the Trustees of the Columbia Funds, FleetBoston Financial Corporation and its affiliated entities and/or Bank of America and its affiliated entities.
On February 20, 2004, the Judicial Panel on Multidistrict Litigation transferred these cases and cases against other mutual fund companies based on similar allegations to the United States District Court in Maryland for consolidated or coordinated pretrial proceedings (the “MDL”). Subsequently, additional related cases were transferred to the MDL. On September 29, 2004, the plaintiffs in the MDL filed amended
29
Columbia Strategic Investor Fund
August 31, 2009
and consolidated complaints. One of these amended complaints is a putative class action that includes claims under the federal securities laws and state common law, and that names Columbia Management Advisors, Inc. (which has since merged into Banc of America Capital Management, LLC (now named Columbia Management Advisors, LLC)) (“Columbia”), Columbia Funds Distributor, Inc. (now named Columbia Management Distributors, Inc.) (the “Distributor”), the Trustees of the Columbia Funds, Bank of America Corporation and others as defendants. Another of the amended complaints is a derivative action purportedly on behalf of the Columbia Funds that asserts claims under federal securities laws and state common law.
On February 25, 2005, Columbia and other defendants filed motions to dismiss the claims in the pending cases. On March 1, 2006, for reasons stated in the court’s memoranda dated November 3, 2005, the United States District Court for the District of Maryland granted in part and denied in part the defendants’ motions to dismiss. The court dismissed all of the class action claims pending against the Columbia Funds Trusts. As to Columbia and the Distributor, the claims under the Securities Act of 1933, the claims under Sections 34(b) and 36(a) of the Investment Company Act of 1940 (“ICA”) and the state law claims were dismissed. The claims under Sections 10(b) and 20(a) of the Securities Exchange Act of 1934 and claims under Section 36(b) of the ICA were not dismissed.
On March 21, 2005, a purported class action was filed in Massachusetts state court alleging that certain conduct, including market timing, entitled Class B shareholders in certain Columbia Funds to an exemption from contingent deferred sales charges upon early redemption (the “CDSC Lawsuit”). The CDSC Lawsuit was removed to federal court in Massachusetts and transferred to the MDL.
On September 14, 2007, the plaintiffs and the Columbia defendants named in the MDL, including the Columbia Funds, entered into a stipulation of settlement with respect to all Columbia-related claims in the MDL described above, including the CDSC Lawsuit. The settlement is subject to court approval.
Note 11. Subsequent Events
Bank of America Corporation, the indirect parent company of Columbia, entered into an agreement dated September 29, 2009 to sell a portion of the asset management business of Columbia Management Group, LLC to Ameriprise Financial, Inc. The transaction (“Transaction”) includes a sale of the part of the asset management business that advises long-term mutual funds, including the Fund. The Transaction is subject to certain approvals and other conditions to closing, and is currently expected to close in the spring of 2010.
On October 15, 2009, the committed line of credit discussed in Note 8 was renewed on amended terms. Pursuant to the amended terms, interest is charged to each participating fund based on the fund’s borrowings at a rate per annum equal to the greater of the Federal Funds Rate plus 1.25% or the overnight LIBOR Rate plus 1.25%. In addition, a commitment fee of 0.15% per annum is accrued and apportioned among the participating funds pro rata based on their relative net assets. The annual operations agency fee of $20,000 was waived.
30
Report of Independent Registered Public Accounting Firm
To the Trustees of the Columbia Funds Series Trust I and the Shareholders of Columbia Strategic Investor Fund
In our opinion, the accompanying statement of assets and liabilities, including the investment portfolio, and the related statements of operations and of changes in net assets and the financial highlights present fairly, in all material respects, the financial position of Columbia Strategic Investor Fund (the “Fund”) (a series of Columbia Funds Series Trust I), at August 31, 2009, the results of its operations for the year then ended, the changes in its net assets for each of the two years in the period then ended and the financial highlights for each of the periods indicated, in conformity with accounting principles generally accepted in the United States of America. These financial statements and financial highlights (hereafter referred to as “financial statements”) are the responsibility of the Fund’s management. Our responsibility is to express an opinion on these financial statements based on our audits. We conducted our audits of these financial statements in accordance with the standards of the Public Company Accounting Oversight Board (United States). Those standards require that we plan and perform the audit to obtain reasonable assurance about whether the financial statements are free of material misstatement. An audit includes examining, on a test basis, evidence supporting the amounts and disclosures in the financial statements, assessing the accounting principles used and significant estimates made by management, and evaluating the overall financial statement presentation. We believe that our audits, which included confirmation of securities at August 31, 2009 by correspondence with the custodian and brokers, provide a reasonable basis for our opinion.
PricewaterhouseCoopers LLP
Boston, Massachusetts
October 22, 2009
31
Federal Income Tax Information (Unaudited) – Columbia Strategic Investor Fund
For non-corporate shareholders, 100.00%, or the maximum amount allowable under the Jobs and Growth Tax Relief Reconciliation Act of 2003, of the ordinary income distributed by the Fund for the fiscal year ended August 31, 2009 may represent qualified dividend income. Final information will be provided in your 2009 Form 1099-DIV.
100.00% of the ordinary income distributed by the Fund, for the fiscal year ended August 31, 2009, qualifies for the corporate dividends received deduction.
The Fund will notify shareholders in January 2010, of amounts used in preparing 2009 income tax return.
32
-
Fund Governance – Columbia Strategic Investor Fund
The Trustees serve terms of indefinite duration. The names, addresses and ages of the Trustees and Officers of the Funds in the Columbia Funds Complex, the year each was first elected or appointed to office, their principal business occupations during at least the last five years, the number of Funds overseen by each Trustee and other directorships they hold are shown below. Each officer listed below serves as an officer of each Fund in the Columbia Funds Complex.
Independent Trustees
| | |
Name, Address and Year of Birth, Position with Funds, Year First Elected or Appointed to Office | | Principal Occupation(s) During Past Five Years, Number of Funds in the Columbia Funds Complex Overseen by Trustee, Other Directorships Held |
| |
| John D. Collins (Born 1938) | | |
c/o Columbia Management Advisors, LLC One Financial Center Boston, MA 02111 Trustee (since 2007) | | Retired. Consultant, KPMG, LLP (accounting and tax firm) from July 1999 to June 2000; Partner, KPMG, LLP from March 1962 to June 1999. Oversees 66, Mrs. Fields Famous Brands LLC (consumer products); Suburban Propane Partners, L.P.; and Montpelier Re (insurance underwriting firm) |
| |
| Rodman L. Drake (Born 1943) | | |
c/o Columbia Management Advisors, LLC One Financial Center Boston, MA 02111 Trustee (since 2007) and Chairman of the Board (since 2009) | | Co-Founder of Baringo Capital LLC (private equity) since 2002; President, Continuation Investments Group, Inc. from 1997 to 2001. Oversees 66, Jackson Hewitt Tax Service Inc. (tax preparation services); Crystal Capital River Inc. (real estate investment trust); Student Loan Corporation (student loan provider); Celgene Corporation (global biotechnology company); and The Helios Funds (exchange-traded funds) |
| |
| Douglas A. Hacker (Born 1955) | | |
c/o Columbia Management Advisors, LLC One Financial Center Boston, MA 02111 Trustee (since 1996) | | Independent business executive since May 2006; Executive Vice President–Strategy of United Airlines (airline) from December 2002 to May 2006; President of UAL Loyalty Services (airline marketing company) from September 2001 to December 2002; Executive Vice President and Chief Financial Officer of United Airlines from July 1999 to September 2001. Oversees 66, Nash Finch Company (food distributor); Aircastle Limited (aircraft leasing) |
| |
| Janet Langford Kelly (Born 1957) | | |
c/o Columbia Management Advisors, LLC One Financial Center Boston, MA 02111 Trustee (since 1996) | | Senior Vice President, General Counsel and Corporate Secretary, ConocoPhillips (integrated energy company) since September 2007; Deputy General Counsel– Corporate Legal Services, ConocoPhillips from August 2006 to August 2007; Partner, Zelle, Hofmann, Voelbel, Mason & Gette LLP (law firm) from March 2005 to July 2006; Adjunct Professor of Law, Northwestern University, from September 2004 to June 2006; Director, UAL Corporation (airline) from February 2006 to July 2006; Oversees 66, None |
| |
| Charles R. Nelson (Born 1942) | | |
c/o Columbia Management Advisors, LLC One Financial Center Boston, MA 02111 Trustee (since 1981) | | Professor of Economics, University of Washington, since January 1976; Ford and Louisa Van Voorhis Professor of Political Economy, University of Washington, since September 1993; Adjunct Professor of Statistics, University of Washington, since September 1980; Associate Editor, Journal of Money Credit and Banking, 1993-2008 Consultant on econometric and statistical matters. Oversees 66, None |
33
Fund Governance (continued) – Columbia Strategic Investor Fund
Independent Trustees (continued)
| | |
Name, Address and Year of Birth, Position with Funds, Year First Elected or Appointed to Office | | Principal Occupation(s) During Past Five Years, Number of Funds in the Columbia
Funds Complex Overseen by Trustee, Other Directorships Held |
| |
| John J. Neuhauser (Born 1943) | | |
c/o Columbia Management Advisors, LLC One Financial Center Boston, MA 02111 Trustee (since 1985) | | President, Saint Michael’s College, since August 2007; University Professor, Boston College from November 2005 to August 2007; Academic Vice President and Dean of Faculties, Boston College from August 1999 to October 2005. Oversees 66, Liberty All-Star Equity Fund and Liberty All-Star Growth Fund, Inc. (closed-end funds) |
| |
Jonathan Piel (Born 1938) | | |
c/o Columbia Management Advisors, LLC One Financial Center Boston, MA 02111 Trustee (since 2007) | | Cable television producer and website designer; The Editor, Scientific American from 1984 to 1994; Vice President, Scientific American, Inc., from 1984 to 1994; Member, Advisory Board, Stone Age Institute, Bloomington, Indiana (research institute that explores the effect of technology on human evolution); Member, Board of Directors of the National Institute of Social Sciences, New York City; Member, Board of Trustees of the William Alanson White Institute, New York City (institution for training psychoanalysts); and Member, Advisory Board, Mount Sinai Children’s Environmental Health Center, New York. Oversees 66, None |
| |
| Patrick J. Simpson (Born 1944) | | |
c/o Columbia Management Advisors, LLC One Financial Center Boston, MA 02111 Trustee (since 2000) | | Partner, Perkins Coie LLP (law firm). Oversees 66, None |
| |
| Thomas C. Theobald (Born 1937) | | |
c/o Columbia Management Advisors, LLC One Financial Center Boston, MA 02111 Trustee (since 1996) | | Partner and Senior Advisor, Chicago Growth Partners (private equity investing) since September 2004; Managing Director, William Blair Capital Partners (private equity investing) from September 1994 to September 2004. Oversees 66, Anixter International (network support equipment distributor); Ventas, Inc. (real estate investment trust); Jones Lang LaSalle (real estate management services); Ambac Financial Group (financial guaranty insurance) |
| |
| Anne-Lee Verville (Born 1945) | | |
c/o Columbia Management Advisors, LLC One Financial Center Boston, MA 02111 Trustee (since 1998) | | Retired since 1997 (formerly General Manager–Global Education Industry (from 1994 to 1997), President–Application Systems Division (from 1991 to 1994), Chief Financial Officer–US Marketing & Services (from 1988 to 1991), and Chief Information Officer (from 1987 to 1988), IBM Corporation (computer and technology)). Oversees 66, None |
34
Fund Governance (continued) – Columbia Strategic Investor Fund
Interested Trustee
| | |
| |
| William E. Mayer1 (Born 1940) | | |
c/o Columbia Management Advisors, LLC One Financial Center Boston, MA 02111 Trustee (since 1994) | | Partner, Park Avenue Equity Partners (private equity) since February 1999; Dean and Professor, College of Business, University of Maryland from 1992 to 1997. Oversees 66, Lee Enterprises (print media), WR Hambrecht + Co. (financial service provider); BlackRock Kelso Capital Corporation (investment company) |
| 1 | The Funds currently treat Mr. Mayer as an “interested person” (as defined in the Investment Company Act of 1940) by reason of his affiliation with WR Hambrecht + Co., a registered broker/dealer that may execute portfolio transactions for or engage in principal transactions with the Funds or other funds or accounts advised/managed by the Advisor or other Bank of America affiliates. |
The Statement of Additional Information includes additional information about the Trustees of the Funds and is available, without charge, upon request by calling 1-800-345-6611.
35
Fund Governance (continued) – Columbia Strategic Investor Fund
Officers
| | |
Name, Address and Year of Birth, Position with Funds, Year First Elected or Appointed to Office | | Principal Occupation(s) During Past Five Years |
| |
| J. Kevin Connaughton (Born 1964) | | |
One Financial Center Boston, MA 02111 President (since 2009) | | Managing Director of Columbia Management Advisors, LLC since December 2004; Senior Vice President and Chief Financial Officer–Columbia Funds, from June 2008 to January 2009; Treasurer–Columbia Funds, from October 2003 to May 2008; Treasurer–the Liberty Funds, Stein Roe Funds and Liberty All-Star Funds, December 2000–December 2006; Senior Vice President–Columbia Management Advisors, LLC, from April 2003 to December 2004; President–Columbia Funds, Liberty Funds and Stein Roe Funds, February 2004 to October 2004; Treasurer–Galaxy Funds, September 2002 to December 2005; Treasurer, December 2002 to December 2004, and President, February 2004 to December 2004–Columbia Management Multi-Strategy Hedge Fund, LLC; and a senior officer of various other Bank of America-affiliated entities, including other registered and unregistered funds. |
| |
| James R. Bordewick, Jr. (Born 1959) | | |
One Financial Center Boston, MA 02111 Senior Vice President, Secretary and Chief Legal Officer (since 2006) | | Associate General Counsel, Bank of America since April 2005; Senior Vice President and Associate General Counsel, MFS Investment Management (investment management) prior to April 2005. |
| |
| Linda J. Wondrack (Born 1964) | | |
One Financial Center Boston, MA 02111 Senior Vice President and Chief Compliance Officer (since 2007) | | Director (Columbia Management Group LLC and Investment Product Group Compliance), Bank of America since June 2005; Director of Corporate Compliance and Conflicts Officer, MFS Investment Management (investment management), August 2004 to May 2005; Managing Director, Deutsche Asset Management (investment management) prior to August 2004. |
| |
| Michael G. Clarke (Born 1969) | | |
One Financial Center Boston, MA 02111 Senior Vice President and Chief Financial Officer (since 2009) | | Director of Fund Administration of the Advisor since January 2006; Managing Director of the Advisor September 2004 to December 2005; Vice President Fund Administration June 2002 to September 2004. |
| |
| Jeffrey R. Coleman (Born 1969) | | |
One Financial Center Boston, MA 02111 Deputy Treasurer (since 2008) | | Director of Fund Administration of the Advisor since January 2006; Fund Controller of the Advisor from October 2004 to January 2006; Vice President of CDC IXIS Asset Management Services, Inc. (investment management) from August 2000 to September 2004. |
| |
| Joseph F. DiMaria (Born 1968) | | |
One Financial Center Boston, MA 02111 Chief Accounting Officer and Treasurer (since 2009) | | Director of Fund Administration of the Advisor since January 2006; Head of Tax/Compliance and Assistant Treasurer of the Advisor from November 2004 to December 2005; Director of Trustee Administration (Sarbanes-Oxley) of the Advisor from May 2003 to October 2004. |
36
Fund Governance (continued) – Columbia Strategic Investor Fund
Officers (continued)
| | |
Name, Address and Year of Birth, Position with Funds, Year First
Elected or Appointed to Office | | Principal Occupation(s) During Past Five Years |
| |
| Julian Quero (Born 1967) | | |
One Financial Center Boston, MA 02111 Deputy Treasurer (since 2008) | | Senior Tax Manager of the Advisor since August 2006; Senior Compliance Manager of the Advisor from April 2002 to August 2006. |
| |
| Barry S. Vallan (Born 1969) | | |
One Financial Center Boston, MA 02111 Controller (since 2006) | | Vice President–Fund Treasury of the Advisor since October 2004; Vice President–Trustee Reporting of the Advisor from April 2002 to October 2004. |
| |
| Stephen T. Welsh (Born 1957) | | |
One Financial Center Boston, MA 02111 Vice President (since 1996) | | President, Columbia Management Services, Inc. since July 2004; Senior Vice President and Controller, Columbia Management Services, Inc. prior to July 2004. |
37
[THIS PAGE INTENTIONALLY LEFT BLANK]
38
[THIS PAGE INTENTIONALLY LEFT BLANK]
39
[THIS PAGE INTENTIONALLY LEFT BLANK]
40
Important Information About This Report
Transfer Agent
Columbia Management Services, Inc.
P.O. Box 8081
Boston, MA 02266-8081
1-800-345-6611
Distributor
Columbia Management
Distributors, Inc.
One Financial Center
Boston, MA 02111
Investment Advisor
Columbia Management Advisors, LLC
100 Federal Street
Boston, MA 02110
The fund mails one shareholder report to each shareholder address. If you would like more than one report, please call shareholder services at 1-800-345-6611 and additional reports will be sent to you. This report has been prepared for shareholders of Columbia Strategic Investor Fund.
A description of the policies and procedures that the fund uses to determine how to vote proxies and a copy of the fund’s voting records are available (i) at www.columbiamanagement.com, (ii) on the Securities and Exchange Commission’s website at www.sec.gov, and (iii) without charge, upon request, by calling 1-800-368-0346. Information regarding how the fund voted proxies relating to portfolio securities during the 12-month period ended June 30 is available from the SEC’s website. Information regarding how the fund voted proxies relating to portfolio securities is also available from the fund’s website, www.columbiamanagement.com.
The fund files a complete schedule of portfolio holdings with the SEC for the first and third quarters of each fiscal year on Form N-Q. The fund’s Form N-Q is available on the SEC’s website at www.sec.gov and may be reviewed and copied at the SEC’s Public Reference Room in Washington, D.C. Information on the operation of the Public Reference Room may be obtained by calling 1-800-SEC-0330.
Please read and consider the investment objectives, risks, charges and expenses for any fund carefully before investing. For a prospectus which contains this and other important information about the fund, contact your Columbia Management representative or financial advisor or go to www.columbiamanagement.com.
Columbia Management Group, LLC (“Columbia Management”) is the investment management division of Bank of America Corporation. Columbia Management entities furnish investment management services and products for institutional and individual investors. Columbia Funds are distributed by Columbia Management Distributors, Inc., member of FINRA, SIPC, part of Columbia Management and an affiliate of Bank of America Corporation.
41

One Financial Center
Boston, MA 02111-2621
Columbia Strategic Investor Fund
Annual Report, August 31, 2009
©2009 Columbia Management Distributors, Inc.
One Financial Center, Boston, MA 02111-2621
800.345.6611 www.columbiafunds.com
SHC-42/23316-0809 (10/09) 09/90900

Annual Report
August 31, 2009
Columbia Real Estate Equity Fund
| | |
| NOT FDIC INSURED | | May Lose Value |
| NOT BANK ISSUED | | No Bank Guarantee |
Table of contents
The views expressed in this report reflect the current views of the respective parties. These views are not guarantees of future performance and involve certain risks, uncertainties and assumptions that are difficult to predict, so actual outcomes and results may differ significantly from the views expressed. These views are subject to change at any time based upon economic, market or other conditions and the respective parties disclaim any responsibility to update such views. These views may not be relied on as investment advice and, because investment decisions for a Columbia Fund are based on numerous factors, may not be relied on as an indication of trading intent on behalf of any particular Columbia Fund. References to specific securities should not be construed as a recommendation or investment advice.
President’s Message

Dear Shareholder:
We are pleased to provide this shareholder report detailing your fund’s performance, portfolio holdings and financial statements. We hope this information is helpful in monitoring your investments as we work through these challenging economic times. We recognize that you have entrusted us with your money and want you to know that our professional investment teams work to interpret the latest economic and market trends with the goal of optimizing portfolio construction for our clients.
The first half of 2009 was defined by extremes. The multiyear lows we witnessed in the early months gave way to a stunning rally for the U.S. financial markets in the spring. A global market rebound may be underway, thanks to the massive fiscal and aggressive monetary policies of governments around the world. As of the June 30 market close, the S&P 500® Index1 was trading at nearly 16.6 times its 2009 Wall Street consensus earnings estimates with a sharp increase of nearly 36% since March 9. More mixed economic news has yet to provide the all-clear signal for investors, although economic activity has started to firm up. We believe this challenging economic environment makes it even more important to work with professional money managers while continuing to invest for life events like retirement, college planning, home improvements and career changes.
Retirement income planning has become an increasingly significant focus in the lives of millions of Americans. Recent economic conditions make it even more important to manage short-term obligations such as mortgages, monthly bills and credit card debt while also taking the steps necessary to prepare for or maximize retirement benefits. Better nutrition and medical services can result in U.S. citizens living longer, healthier lives. This means the risk of outliving one’s assets in retirement is very real without proper planning. Financial security and retirement planning is an ongoing process that requires active management of your savings, investments and risks. We encourage you to review your retirement plan regularly so you’ll be better able to meet your retirement needs in the future.
We recognize that economic uncertainty creates great challenges for many investors. Our professional investment teams work diligently to help investors navigate through difficult markets. Thank you for your business and for the opportunity to work together towards your investment goals.
Sincerely,

J. Kevin Connaughton
President, Columbia Funds
On September 29, 2009, Bank of America Corporation entered into an agreement to sell a portion of the asset management business of Columbia Management Group, LLC. Please see Note 11 of the Notes to Financial Statements for additional information.
Past performance is no guarantee of future results.
| 1 | The Standard & Poor’s (S&P) 500 Index tracks the performance of 500 widely held, large-capitalization U.S. stocks. Indices are not available for investment, are not professionally managed and do not reflect sales charges, fees, brokerage commissions, taxes or other expenses of investing. Securities in the fund may not match those in an index. |
Fund Profile – Columbia Real Estate Equity Fund
Performance data quoted represents past performance and current performance may be lower or higher. Past performance is no guarantee of future results. The investment return and principal value will fluctuate so that shares, when redeemed, may be worth more or less than the original cost. Please visit www.columbiafunds.com for daily and most recent month-end performance updates.
Summary
1-year return as of 08/31/09
| | |
| |
 | | –29.89% Class A shares |
| | (without sales charge) |
| |
| | –32.83% FTSE NAREIT Equity REITs Index |
Summary
| n | | For the 12-month period that ended August 31, 2009, the fund’s Class A shares returned negative 29.89% without sales charge. |
| n | | In a brutal real estate market, the fund held up better than its benchmark, the FTSE NAREIT Equity REITs Index, 1 and the average return of its peer group, the Lipper Real Estate Funds Classification.2 |
| n | | A lack of available capital for transactions and debt restructuring hurt REITs over the period, resulting in a loss for the sector. Positive security selection drove the fund’s showing relative to the index and peer group. |
Portfolio Management
Arthur J. Hurley has managed the fund since September 2006 and has been with the advisor or its predecessors or affiliate organizations since 2006.
| 1 | The FTSE National Association of Real Estate Investment Trusts (NAREIT) Equity REITs Index tracks the performance of all publicly traded equity real estate investment trusts (REITs). Indices are not available for investment, are not professionally managed and do not reflect sales charges, fees, brokerage commissions, taxes or other expenses of investing. Securities in the fund may not match those in an index. |
| 2 | Lipper Inc., a widely respected data provider in the industry, calculates an average total return (assuming reinvestment of distributions) for mutual funds with investment objectives similar to those of the fund. Lipper makes no adjustment for the effect of sales loads. |
1
Economic Update – Columbia Real Estate Equity Fund
Summary
For the 12-month period that ended August 31, 2009
| | n | | Stocks lost ground, as measured by the S&P 500® Index and the MSCI EAFE Index, but cut their losses in a rebound that began half way through the period. | |
| | |
| S&P Index | | MSCI Index |
| |

| |
|
-18.25% | | -14.95% |
| | n | | As investors appeared to exhibit more tolerance for risk, the Barclays Capital Aggregate Bond Index delivered positive results. High-yield bonds rebounded strongly, as measured by the JPMorgan Developed BB High Yield Index. | |
| | |
| Barclays Aggregate Index | | JPMorgan
Index |
| |

| |
|
7.94% | | 6.51% |
During the 12-month period that began September 1, 2008 and ended August 31, 2009, the U.S. economy faced the worst financial crisis since the Great Depression, then steadied itself as steps taken by a new administration began to show results in the second half of the period. Economic growth, as measured by gross domestic product, contracted by more than 6% in the second half of 2008. The decline for the first half of 2009 is expected to have been less severe, and hopes for a late 2009 recovery have been encouraged by Fed Chairman Bernanke. The lapse from growth has resulted in the longest — and most severe — recession in nearly three decades.
The labor market shed more than six million jobs between 2008 and 2009, raising the unemployment rate to 9.7% and virtually wiping out all of the jobs gained since the last recession. Manufacturing activity slowed and consumer spending declined. The beleaguered housing market continued to lose ground as prices fell and inventories rose. However, mortgage purchase applications increased late in the period, buoyed by low interest rates and an $8,000 first-time home buyer tax credit. Late in 2008, consumer confidence, as measured by the Conference Board, plummeted to its lowest point ever. However, it has since stabilized and turned higher near the end of the period.
Troubles that began in the U.S. subprime mortgage market resulted in a meltdown within the U.S. financial sector that claimed several major institutions in 2008 and led others to seek bailouts, restructuring or both. New rigorous lending standards severely limited access to credit, further hampering economic growth. In this environment, a new administration sought to stabilize the financial system, address economic woes and introduce sweeping health care reform. Stimulus spending began to flow into the economy, raising hopes that growth would be restored in the second half of 2009. In December 2008, the Federal Reserve Board (the Fed) lowered a key short-term borrowing rate — the federal funds rate — to between zero and 0.25% — a record low. In light of protracted economic weakness, we believe the Fed is unlikely to tighten its reins on money until the economy and the labor markets stabilize.
Stocks retreated, then rebounded
Against a weakening economic backdrop, the U.S. stock market lost 18.25% for the 12-month period, as measured by the S&P 500® Index. Losses affected the stocks of companies of all sizes and investment style categories, as measured by their respective Russell indices.1 Stock markets outside the U.S. suffered losses that were nearly as substantial. The MSCI EAFE Index,2 a broad gauge of stock market performance in foreign developed markets, lost 14.95% (in U.S. dollars) for the period. Emerging stock markets were also caught in the downdraft, but bounced back stronger than domestic or developed world markets in 2009. The MSCI Emerging
Markets Index3 returned negative 9.95% (in U.S. dollars).
Bonds outperformed stocks
As investors sought refuge from a volatile stock market, the highest quality sectors of the U.S. bond market delivered modest gains. During the first half of the period, Treasury prices rose and yields declined sharply as the economy faltered and stock
2
Economic Update (continued) – Columbia Real Estate Equity Fund
market volatility increased. As hopes for a recovery materialized in the second half of the period, yields rose and Treasuries lagged behind riskier segments of the bond market. The benchmark 10-year U.S. Treasury yield began the period at 3.8%, declined to 2.2% in December 2008, then rose to end the period at 3.4%. In this environment, the Barclays Capital Aggregate Bond Index4 (formerly the Lehman Brothers U.S. Aggregate Bond Index) returned 7.94%. High-yield bond prices fell sharply in 2008 as economic prospects weakened and default fears rose, then rebounded strongly in 2009. For the 12-month period, the JPMorgan Developed BB High Yield Index5 returned 6.51%.
| 1 | The Russell 1000 Index tracks the performance of 1,000 of the largest U.S. companies, based on market capitalization. The Russell Midcap Index measures the performance of the 800 smallest companies in the Russell 1000 Index, which represents approximately 25% of the total market capitalization of the Russell 1000 Index. The Russell 2000 Index measures the performance of the 2,000 smallest companies in the Russell 3000 Index, which represents approximately 8% of the total market capitalization of the Russell 3000 Index. |
| 2 | The Morgan Stanley Capital International (MSCI) Europe, Australasia, Far East (EAFE) Index is a free float-adjusted market capitalization index that is designed to measure developed market equity performance excluding the U.S. and Canada. |
| 3 | The MSCI Emerging Markets Index is composed of a sample of companies from 22 countries representing the global emerging stock markets. |
| 4 | The Barclays Capital Aggregate Bond Index is a market value-weighted index that tracks the daily price, coupon, pay-downs and total return performance of fixed-rate, publicly placed, dollar-denominated and non-convertible investment-grade debt issues with at least $250 million par amount outstanding and with at least one year to final maturity. |
| 5 | The JPMorgan Developed BB High Yield Index is designed to mirror the investable universe of the U.S. dollar developed, BB-rated, high yield corporate debt market. |
Indices are not available for investment, are not professionally managed and do not reflect sales charges, fees, brokerage commissions, taxes or other expenses of investing. Securities in the fund may not match those in an index.
Past performance is no guarantee of future results.
3
Performance Information – Columbia Real Estate Equity Fund
Performance data quoted represents past performance and current performance may be lower or higher. Past performance is no guarantee of future results. The investment return and principal value will fluctuate so that shares, when redeemed, may be worth more or less than the original cost. Please visit www.columbiafunds.com for daily and most recent month-end performance updates.
| | | |
| Annual operating expense ratio* | |
| |
Class A | | 1.29 | % |
Class B | | 2.04 | % |
Class C | | 2.04 | % |
Class Z | | 1.04 | % |
| * | The annual operating expense ratio is as stated in the fund’s prospectus that is current as of the date of this report and includes the expenses incurred by the investment companies in which the fund invests. Differences in expense ratios disclosed elsewhere in this report may result from including expenses incurred by the investment companies, fee waivers and expense reimbursements as well as different time periods used in calculating the ratios. | |
| | |
| Net asset value per share |
| |
as of 08/31/09 ($) | | |
Class A | | 9.11 |
Class B | | 9.12 |
Class C | | 9.10 |
Class Z | | 9.13 |
| | |
| Distributions declared per share |
| |
09/01/08 – 08/31/09 ($) | | |
Class A | | 0.50 |
Class B | | 0.43 |
Class C | | 0.43 |
Class Z | | 0.52 |
|
| Performance of a $10,000 investment 09/01/99 – 08/31/09 |

The chart above shows the change in value of a hypothetical $10,000 investment in Class A shares of Columbia Real Estate Equity Fund during the stated time period, and does not reflect the deduction of taxes that a shareholder may pay on fund distributions or on the redemption of fund shares. The FTSE National Association of Real Estate Investment Trusts (NAREIT) Equity REITs Index tracks the performance of all publicly traded equity real estate investment trusts (REITs). Indices are not available for investment, do not reflect sales charges, fees, brokerage commissions, taxes or other expenses of investing. Securities in the fund may not match those in an index.
| | | | |
| Performance of a $10,000 investment 09/01/99 – 08/31/09 ($) |
| | |
| Sales charge | | without | | with |
Class A | | 20,401 | | 19,223 |
Class B | | 19,416 | | 19,416 |
Class C | | 19,403 | | 19,403 |
Class Z | | 20,815 | | n/a |
| | | | | | | | | | | | | | |
| Average annual total return as of 08/31/09 (%) |
| | | | |
| Share class | | A | | B | | C | | Z |
| Inception | | 11/01/02 | | 11/01/02 | | 10/13/03 | | 04/01/94 |
| Sales charge | | without | | with | | without | | with | | without | | with | | without |
1- year | | –29.89 | | –33.90 | | –30.38 | | –33.67 | | –30.37 | | –31.03 | | –29.71 |
5-year | | 0.12 | | –1.06 | | –0.62 | | –0.76 | | –0.62 | | –0.62 | | 0.38 |
10-year | | 7.39 | | 6.75 | | 6.86 | | 6.86 | | 6.85 | | 6.85 | | 7.61 |
| | | | | | | | | | | | | | |
| Average annual total return as of 09/30/09 (%) |
| | | | |
| Share class | | A | | B | | C | | Z |
| Sales charge | | without | | with | | without | | with | | without | | with | | without |
1- year | | –27.80 | | –31.94 | | –28.31 | | –31.68 | | –28.30 | | –28.98 | | –27.57 |
5-year | | 0.50 | | –0.68 | | –0.24 | | –0.38 | | –0.24 | | –0.24 | | 0.77 |
10-year | | 8.21 | | 7.57 | | 7.67 | | 7.67 | | 7.66 | | 7.66 | | 8.43 |
The “with sales charge” returns include the maximum initial sales charge of 5.75% for Class A shares and the applicable contingent deferred sales charge of 5.00% in the first year, declining to 1.00% in the sixth year and eliminated thereafter for Class B shares and 1.00% for Class C shares for the first year only. The “without sales charge” returns do not include the effect of sales charges. If they had, returns would be lower.
Performance results reflect any fee waivers or reimbursements of fund expenses by the investment advisor and/or any of its affiliates. Absent these fee waivers or expense reimbursement arrangements, performance results would have been lower.
All results shown assume reinvestment of distributions. Class Z shares are sold at net asset value with no distribution and service (Rule 12b-1) fees. Class Z shares have limited eligibility and the investment minimum requirements may vary. Please see the fund’s prospectus for details. Performance for different share classes will vary based on differences in sales charges and fees associated with each class.
The tables do not reflect the deduction of taxes that a shareholder may pay on fund distributions or on the redemption of fund shares.
Class A, Class B and Class C are newer classes of shares. Class A and Class B share performance information includes the performance of Class Z shares (the oldest existing share class) for periods prior to their inception. Class C share performance information includes returns of Class B shares for the period from November 1, 2002 through October 12, 2003, and the returns of Class Z shares for periods prior thereto. These returns reflect differences in sales charges, but have not been restated to reflect any differences in expenses (such as distribution and service (Rule 12b-1) fees) between Class Z shares and the newer classes of shares. If differences in expenses had been reflected, the returns shown for periods prior to the inception of the newer classes of shares would have been lower, since the newer classes of shares are subject to distribution and service (Rule 12b-1) fees. Class A and Class B shares were initially offered on November 1, 2002, Class C shares were initially offered on October 13, 2003 and Class Z shares were initially offered on April 1, 1994.
4
Understanding Your Expenses – Columbia Real Estate Equity Fund
As a fund shareholder, you incur two types of costs. There are transaction costs, which generally include sales charges on purchases and may include redemption fees or exchange fees. There are also ongoing costs, which generally include investment advisory fees, distribution and service (Rule 12b-1) fees and other fund expenses. The information on this page is intended to help you understand the ongoing costs of investing in the fund and to compare these costs with the ongoing costs of investing in other mutual funds.
Analyzing your fund’s expenses by share class
To illustrate these ongoing costs, we have provided an example and calculated the expenses paid by investors in each share class during the period. The information in the following table is based on an initial investment of $1,000, which is invested at the beginning of the period and held for the entire period. Expense information is calculated two ways and each method provides you with different information. The amount listed in the “Actual” column is calculated using the fund’s actual operating expenses and total return for the period. The amount listed in the “Hypothetical” column for each share class assumes that the return each year is 5% before expenses and is calculated based on the fund’s actual operating expenses. You should not use the hypothetical account values and expenses to estimate either your actual account balance at the end of the period or the expenses you paid during this period.
Compare with other funds
Since all mutual funds are required to include the same hypothetical calculations about expenses in shareholder reports, you can use this information to compare the ongoing costs of investing in the fund with other funds. To do so, compare the 5% hypothetical example with the 5% hypothetical examples that appear in the shareholder reports of other funds. As you compare hypothetical examples of other funds, it is important to note that hypothetical examples are meant to highlight the ongoing costs of investing in a fund and do not reflect any transaction costs, such as sales charges, redemption fees or exchange fees.
Estimating your actual expenses
To estimate the expenses that you paid over the period, first you will need your account balance at the end of the period:
| | n | | For shareholders who receive their account statements from Columbia Management Services, Inc., your account balance is available online at www.columbiafunds.com or by calling Shareholder Services at 800.345.6611. | |
| | n | | For shareholders who receive their account statements from their financial intermediary, contact your financial intermediary to obtain your account balance. | |
| | 1. | Divide your ending account balance by $1,000. For example, if an account balance was $8,600 at the end of the period, the result would be 8.6. | |
| | 2. | In the section of the table below titled “Expenses paid during the period,” locate the amount for your share class. You will find this number in the column labeled “Actual.” Multiply this number by the result from step 1. Your answer is an estimate of the expenses you paid on your account during the period. | |
If the value of your account falls below the minimum initial investment requirement applicable to you, your account generally will be subject to a $20 annual fee. This fee is not included in the accompanying table. If you are subject to the fee, keep it in mind when you are estimating the ongoing expenses of investing in the fund and when comparing the expenses of this fund with other funds.
| | | | | | | | | | | | | | |
| 03/01/09 – 08/31/09 |
| | | | |
| | | Account value at the
beginning of the period ($) | | Account value at the
end of the period ($) | | Expenses paid
during the period ($) | | Fund’s annualized
expense ratio (%) |
| | | Actual | | Hypothetical | | Actual | | Hypothetical | | Actual | | Hypothetical | | Actual |
Class A | | 1,000.00 | | 1,000.00 | | 1,630.99 | | 1,018.80 | | 8.42 | | 6.46 | | 1.27 |
Class B | | 1,000.00 | | 1,000.00 | | 1,626.31 | | 1,015.02 | | 13.37 | | 10.26 | | 2.02 |
Class C | | 1,000.00 | | 1,000.00 | | 1,625.60 | | 1,015.02 | | 13.37 | | 10.26 | | 2.02 |
Class Z | | 1,000.00 | | 1,000.00 | | 1,633.92 | | 1,020.06 | | 6.77 | | 5.19 | | 1.02 |
Expenses paid during the period are equal to the annualized expense ratio for the share class, multiplied by the average account value over the period, then multiplied by the number of days in the fund’s most recent fiscal half-year and divided by 365.
It is important to note that the expense amounts shown in the table are meant to highlight only ongoing costs of investing in the fund and do not reflect any transaction costs, such as sales charges, redemption fees or exchange fees. Therefore, the hypothetical examples provided may not help you determine the relative total costs of owning shares of different funds. If these transaction costs were included, your costs would have been higher.
5
Portfolio Manager’s Report – Columbia Real Estate Equity Fund
Performance data quoted represents past performance and current performance may be lower or higher. Past performance is no guarantee of future results. The investment return and principal value will fluctuate so that shares, when redeemed, may be worth more or less than the original cost. Please visit www.columbiafunds.com for daily and most recent month-end performance updates.
| | |
| Top 10 equity holdings |
| |
as of 08/31/09 (%) | | |
Simon Property Group | | 8.7 |
Nationwide Health Properties | | 5.5 |
Mack-Cali Realty | | 5.2 |
Federal Realty Investment Trust | | 5.0 |
Digital Realty Trust | | 4.4 |
Boston Properties | | 4.1 |
Ventas | | 4.0 |
Corporate Office Properties Trust | | 3.8 |
Potlatch | | 3.6 |
Health Care REIT | | 3.6 |
For the 12-month period that ended August 31, 2009, the fund’s Class A shares returned negative 29.89% without sales charge. The fund’s benchmark, the FTSE NAREIT Equity REITs Index, returned negative 32.83%. The average return of the fund’s peer group, the Lipper Real Estate Funds Classification, was negative 32.59%. Throughout late 2008, REIT prices sank as the business prospects for commercial real estate were hurt by broad economic weakness and lack of access to capital. During this period, the fund’s defensive positioning helped it hold up better than the index and its peers in a very difficult market environment.
Stock selection aided relative returns
Security selection was more important to performance than property type weights during the downturn, and this played to the fund’s advantage. The fund’s retail property REIT holdings helped relative returns. Mall owner Macerich improved its balance sheet position and benefited as the capital markets became more accommodating later in the period. Residential REIT holdings also aided relative returns. Manufactured home community owner-operator Equity Lifestyle Properties benefited from a defensive business model that generated stable cash flows and the relative low volatility of underlying property values in its communities. Specialized REITs Nationwide Health Properties, Health Care REIT and Omega Healthcare Investors also held up well relative to the index.
Lack of available capital hurt REITs across the board
A lack of available capital for new acquisitions and restructurings brought the commercial real estate industry to a virtual standstill during the period. The fund’s holdings were not immune to the lack of transaction activity, nor were they unaffected by a persistent gap between buyers’ bids and sellers’ asking prices, which seemed out of line with market realities. In addition to general REIT market woes, a few individual securities delivered particularly disappointing performance for the fund. The shutdown in commercial real estate sales activity had a severe effect on the transaction-based business model of Kimco Realty, which was also heavily leveraged. Concerns about near-term debt maturities and capital availability for biotech tenants hurt Alexandria Real Estate Equities, while construction funding issues negatively affected Entertainment Properties.
Conservatively positioned moving forward
Despite limited access to traditional capital sources, the REIT market demonstrated an ability to tap capital in recent months. This has improved REIT balance sheets and figured into the group’s recent rally. We believe that the next turning point for the REIT market could arrive once stronger REITs with access to capital take advantage of distressed pricing to create attractive external growth opportunities. To help the fund benefit from market developments going forward, we have slowly moved the portfolio away from a defensive positioning and towards a slightly more aggressive stance.
Portfolio holdings and characteristics are subject to change periodically and may not be representative of current holdings and characteristics. The outlook for the fund may differ from those presented for other Columbia Funds.
6
Portfolio Manager’s Report (continued) – Columbia Real Estate Equity Fund
Equity investments are affected by stock market fluctuations that occur in response to economic and business developments.
The fund may be subject to the same types of risks associated with direct ownership of real estate, including the decline of property values due to general, local and regional economic conditions. In addition, the fund’s share price will likely be subject to more volatility than the overall stock market because it concentrates in real estate stocks.
| | |
| Holdings discussed in this report |
| |
as of 08/31/09 (%) | | |
Nationwide Health Properties | | 5.5 |
Health Care REIT | | 3.6 |
Equity Lifestyle Properties | | 3.6 |
Entertainment Properties Trust | | 3.5 |
Omega Healthcare Investors | | 2.6 |
Kimco Realty | | 2.3 |
Macerich | | 2.0 |
Alexandria Real Estate Equities | | 2.0 |
| | |
| Top sectors |
| |
as of 08/31/09 (%) | | |
Specialized REITs | | 28.3 |
Office REITs | | 26.8 |
Retail REITs | | 25.1 |
Residential REITs | | 13.1 |
Unassigned | | 3.5 |
Hotel Resorts & Cruise Lines | | 1.9 |
Industrial REITs | | 1.3 |
The fund is actively managed and the composition of its portfolio will change over time. Top sectors are calculated as a percentage of total investments. Top 10 holdings and holdings discussed in this report are calculated as a percentage of net assets.
7
Investment Portfolio – Columbia Real Estate Equity Fund
August 31, 2009
Common Stocks – 95.3%
| | | | |
| | | Shares | | Value ($) |
| Consumer Discretionary – 1.8% | | | | |
| Hotels, Restaurants & Leisure – 1.8% | | |
Starwood Hotels & Resorts Worldwide, Inc. | | 165,198 | | 4,919,597 |
| | | | |
Hotels, Restaurants & Leisure Total | | 4,919,597 |
| | | | |
Consumer Discretionary Total | | | | 4,919,597 |
| | | | |
| Financials – 93.5% | | | | |
| Real Estate Investment Trusts (REITs) – 93.5% |
Alexandria Real Estate Equities, Inc. | | 95,100 | | 5,298,021 |
BioMed Realty Trust, Inc. | | 514,800 | | 6,939,504 |
Boardwalk Real Estate Investment Trust | | 215,108 | | 7,211,202 |
Boston Properties, Inc. | | 179,000 | | 10,843,820 |
Brandywine Realty Trust | | 470,827 | | 4,995,474 |
CBL & Associates Properties, Inc. | | 410,346 | | 3,844,942 |
Corporate Office Properties Trust SBI MD | | 268,262 | | 9,888,137 |
Digital Realty Trust, Inc. | | 267,565 | | 11,660,483 |
Duke Realty Corp. | | 533,286 | | 6,143,455 |
Entertainment Properties Trust | | 289,800 | | 9,088,128 |
Equity Lifestyle Properties, Inc. | | 234,456 | | 9,436,854 |
Equity Residential Property Trust | | 258,738 | | 7,066,135 |
Federal Realty Investment Trust | | 212,102 | | 13,228,802 |
Health Care REIT, Inc. | | 223,106 | | 9,528,857 |
Kimco Realty Corp. | | 480,449 | | 6,029,635 |
LTC Properties, Inc. | | 84,600 | | 2,154,762 |
Macerich Co. | | 186,091 | | 5,333,368 |
Mack-Cali Realty Corp. | | 428,923 | | 13,738,404 |
Mid-America Apartment Communities, Inc. | | 201,402 | | 8,817,379 |
National Retail Properties, Inc. | | 361,896 | | 7,426,106 |
Nationwide Health Properties, Inc. | | 450,587 | | 14,364,713 |
Omega Healthcare Investors, Inc. | | 400,660 | | 6,775,160 |
Potlatch Corp. | | 327,919 | | 9,542,443 |
ProLogis | | 309,917 | | 3,446,277 |
Public Storage | | 96,109 | | 6,780,490 |
Realty Income Corp. | | 252,685 | | 6,456,102 |
Simon Property Group, Inc. | | 357,737 | | 22,759,228 |
Sun Communities, Inc. | | 78,031 | | 1,393,634 |
U-Store-It Trust | | 713,978 | | 4,619,438 |
Ventas, Inc. | | 269,537 | | 10,568,546 |
| | | | |
Real Estate Investment Trusts (REITs) Total | | 245,379,499 |
| | | | |
Financials Total | | | | 245,379,499 |
| | | | |
| | | | | |
| | | Shares | | Value ($) | |
Total Common Stocks
(cost of $197,853,357) | | | | 250,299,096 | |
| | |
| Investment Company – 3.4% | | | | | |
iShares Dow Jones U.S. Real Estate Index Fund | | 220,451 | | 8,952,515 | |
| | | | | |
Total Investment Company
(cost of $9,582,487) | | 8,952,515 | |
| |
Short-Term Obligation – 2.1% | | | |
| | | Par ($) | | | |
Repurchase agreement with Fixed Income Clearing Corp., dated 08/31/09, due 09/01/09 at 0.130%, collateralized by a U.S. Treasury obligation maturing 08/26/10, market value $5,544,935 (repurchase proceeds $5,435,020) | | 5,435,000 | | 5,435,000 | |
| | | | | |
Total Short-Term Obligation
(cost of $5,435,000) | | 5,435,000 | |
| | | | | |
Total Investments – 100.8%
(cost of $212,870,844)(a) | | | | 264,686,611 | |
| | | | | |
Other Assets & Liabilities, Net – (0.8)% | | (2,178,374 | ) |
| | | | | |
Net Assets – 100.0% | | | | 262,508,237 | |
Notes to Investment Portfolio:
| (a) | Cost for federal income tax purposes is $215,083,920. |
The following table summarizes the inputs used, as of August 31, 2009 in valuing the Fund’s assets:
| | | | | | | | | | | | |
Description | | Quoted
Prices
(Level 1) | | Other
Significant
Observable
Inputs
(Level 2) | | Significant
Unobservable
Inputs
(Level 3) | | Total |
Common Stocks | | | | | | | | | | | | |
Consumer Discretionary | | $ | 4,919,597 | | $ | — | | $ | — | | $ | 4,919,597 |
Financials | | | 245,379,499 | | | — | | | — | | | 245,379,499 |
| | | | | | | | | | | | |
Total Common Stocks | | | 250,299,096 | | | — | | | — | | | 250,299,096 |
| | | | | | | | | | | | |
Investment Company | | | 8,952,515 | | | — | | | — | | | 8,952,515 |
Total Short-Term Obligation | | | — | | | 5,435,000 | | | — | | | 5,435,000 |
| | | | | | | | | | | | |
Total Investments | | $ | 259,251,611 | | $ | 5,435,000 | | $ | — | | $ | 264,686,611 |
| | | | | | | | | | | | |
For more information on valuation inputs, and their aggregation into the levels used in the table above, please refer to the Security Valuation section in the accompanying Notes to Financial Statements.
See Accompanying Notes to Financial Statements.
8
Columbia Real Estate Equity Fund
August 31, 2009
At August 31, 2009, the asset allocation of the Fund is as follows:
| | | |
Asset Allocation (Unaudited) | | % of Net Assets | |
Financials | | 93.5 | |
Consumer Discretionary | | 1.8 | |
| | | |
| | 95.3 | |
Investment Company | | 3.4 | |
Short-Term Obligation | | 2.1 | |
Other Assets & Liabilities, Net | | (0.8 | ) |
| | | |
| | 100.0 | |
| | | |
See Accompanying Notes to Financial Statements.
9
Statement of Assets and Liabilities – Columbia Real Estate Equity Fund
August 31, 2009
| | | | | | |
| | | | | ($) | |
| Assets | | Investments, at cost | | | 212,870,844 | |
| | | | | | |
| | Investments, at value | | | 264,686,611 | |
| | Cash | | | 660 | |
| | Receivable for: | | | | |
| | Fund shares sold | | | 433,916 | |
| | Dividends | | | 724,831 | |
| | Interest | | | 20 | |
| | Trustees’ deferred compensation plan | | | 31,571 | |
| | Prepaid expenses | | | 6,158 | |
| | | |
| | Total Assets | | | 265,883,767 | |
| | |
| Liabilities | | Payable for: | | | | |
| | Fund shares repurchased | | | 3,023,398 | |
| | Investment advisory fee | | | 164,434 | |
| | Transfer agent fee | | | 67,892 | |
| | Audit fee | | | 34,875 | |
| | Trustees’ fees | | | 179 | |
| | Pricing and bookkeeping fees | | | 7,272 | |
| | Custody fee | | | 1,720 | |
| | Distribution and service fees | | | 9,235 | |
| | Chief compliance officer expenses | | | 109 | |
| | Trustees’ deferred compensation plan | | | 31,571 | |
| | Other liabilities | | | 34,845 | |
| | | |
| | Total Liabilities | | | 3,375,530 | |
| |
| | | |
| | Net Assets | | | 262,508,237 | |
| | |
| Net Assets Consist of | | Paid-in capital | | | 286,487,838 | |
| | Overdistributed net investment income | | | 1,268,255 | |
| | Accumulated net realized loss | | | (77,063,654 | ) |
| | Net unrealized appreciation (depreciation) on: | | | | |
| | Investments | | | 51,815,767 | |
| | Foreign currency translations | | | 31 | |
| | | |
| | Net Assets | | | 262,508,237 | |
| | |
| Class A | | Net assets | | $ | 17,113,681 | |
| | Shares outstanding | | | 1,878,502 | |
| | Net asset value per share | | $ | 9.11 | (a) |
| | Maximum sales charge | | | 5.75 | % |
| | Maximum offering price per share ($9.11/0.9425) | | $ | 9.67 | (b) |
| | |
| Class B | | | | | | |
| | Net assets | | $ | 3,355,912 | |
| | Shares outstanding | | | 368,024 | |
| | Net asset value and offering price per share | | $ | 9.12 | (a) |
| | |
| Class C | | | | | | |
| | Net assets | | $ | 3,553,459 | |
| | Shares outstanding | | | 390,557 | |
| | Net asset value and offering price per share | | $ | 9.10 | (a) |
| | |
| Class Z | | | | | | |
| | Net assets | | $ | 238,485,185 | |
| | Shares outstanding | | | 26,125,553 | |
| | Net asset value, offering and redemption price per share | | $ | 9.13 | |
| (a) | Redemption price per share is equal to net asset value less any applicable contingent deferred sales charge. |
| (b) | On sales of $50,000 or more the offering price is reduced. |
See Accompanying Notes to Financial Statements.
10
Statement of Operations – Columbia Real Estate Equity Fund
For the Year Ended August 31, 2009
| | | | | |
| | | | | ($) | |
| Investment Income | | Dividends | | 8,973,191 | |
| | Interest | | 20,957 | |
| | Foreign taxes withheld | | (47,168 | ) |
| | | |
| | Total Income | | 8,946,980 | |
| | |
| Expenses | | Investment advisory fee | | 1,670,236 | |
| | Distribution fee: | | | |
| | Class B | | 26,912 | |
| | Class C | | 26,164 | |
| | Service fee: | | | |
| | Class A | | 35,816 | |
| | Class B | | 8,971 | |
| | Class C | | 8,721 | |
| | Transfer agent fee | | 387,916 | |
| | Pricing and bookkeeping fees | | 74,509 | |
| | Trustees’ fees | | 23,322 | |
| | Custody fee | | 8,708 | |
| | Reports to shareholders | | 125,065 | |
| | Chief compliance officer expenses | | 653 | |
| | Other expenses | | 71,846 | |
| | | |
| | Total Expenses | | 2,468,839 | |
| | Expense reductions | | (11 | ) |
| | | |
| | Net Expenses | | 2,468,828 | |
| |
| | | |
| | Net Investment Income | | 6,478,152 | |
| | |
| Net Realized and Unrealized Gain (Loss) on Investments and Foreign Currency | | Net realized gain (loss) on: | | | |
| | Investments | | (91,399,705 | ) |
| | Foreign currency transactions | | 1,637 | |
| | | |
| | Net realized loss | | (91,398,068 | ) |
| | |
| | Net change in unrealized appreciation (depreciation) on: | | | |
| | Investments | | (8,110,583 | ) |
| | Foreign currency translations | | 304 | |
| | | |
| | Net change in unrealized appreciation (depreciation) | | (8,110,279 | ) |
| | | |
| | Net Loss | | (99,508,347 | ) |
| |
| | | |
| | Net Decrease Resulting from Operations | | (93,030,195 | ) |
See Accompanying Notes to Financial Statements.
11
Statement of Changes in Net Assets – Columbia Real Estate Equity Fund
| | | | | | | | |
| | | | | Year Ended August 31, | |
| Increase (Decrease) in Net Assets | | | | 2009 ($) | | | 2008 ($) | |
| Operations | | Net investment income | | 6,478,152 | | | 7,017,632 | |
| | Net realized gain (loss) on investments and foreign currency transactions | | (91,398,068 | ) | | 49,736,685 | |
| | Net change in unrealized appreciation (depreciation) on investments and foreign currency translations | | (8,110,279 | ) | | (74,425,849 | ) |
| | | |
| | Net decrease resulting from operations | | (93,030,195 | ) | | (17,671,532 | ) |
| | | |
| Distributions to Shareholders | | From net investment income: | | | | | | |
| | Class A | | (551,971 | ) | | (231,829 | ) |
| | Class B | | (117,661 | ) | | (37,874 | ) |
| | Class C | | (110,966 | ) | | (32,873 | ) |
| | Class Z | | (8,341,582 | ) | | (3,748,998 | ) |
| | From net realized gains: | | | | | | |
| | Class A | | — | | | (6,859,068 | ) |
| | Class B | | — | | | (2,737,380 | ) |
| | Class C | | — | | | (2,361,785 | ) |
| | Class Z | | — | | | (93,321,186 | ) |
| | From return of capital: | | | | | | |
| | Class A | | (299,968 | ) | | — | |
| | Class B | | (73,441 | ) | | — | |
| | Class C | | (72,111 | ) | | — | |
| | Class Z | | (4,249,735 | ) | | — | |
| | | |
| | Total distributions to shareholders | | (13,817,435 | ) | | (109,330,993 | ) |
| | | |
| | Net Capital Stock Transactions | | 51,156,494 | | | 18,819,376 | |
| | | |
| | Total decrease in net assets | | (55,691,136 | ) | | (108,183,149 | ) |
| | | |
| Net Assets | | Beginning of period | | 318,199,373 | | | 426,382,522 | |
| | End of period | | 262,508,237 | | | 318,199,373 | |
| | Undistributed (Overdistributed) net investment income at end of period | | 1,268,255 | | | 1,348,655 | |
See Accompanying Notes to Financial Statements.
12
Statement of Changes in Net Assets (continued) – Columbia Real Estate Equity Fund
| | | | | | | | | | | | |
| | | Capital Stock Activity | |
| | | Year Ended
August 31, 2009 | | | Year Ended
August 31, 2008 | |
| | | Shares | | | Dollars ($) | | | Shares | | | Dollars ($) | |
Class A | | | | | | | | | | | | |
Subscriptions | | 897,568 | | | 7,501,890 | | | 616,079 | | | 8,565,733 | |
Distributions reinvested | | 103,384 | | | 796,102 | | | 455,084 | | | 6,729,883 | |
Redemptions | | (733,801 | ) | | (5,988,913 | ) | | (959,008 | ) | | (15,547,187 | ) |
| | | | | | | | | | | | |
Net increase (decrease) | | 267,151 | | | 2,309,079 | | | 112,155 | | | (251,571 | ) |
| | | | |
Class B | | | | | | | | | | | | |
Subscriptions | | 26,122 | | | 254,768 | | | 82,549 | | | 1,472,374 | |
Distributions reinvested | | 22,182 | | | 170,811 | | | 164,393 | | | 2,432,022 | |
Redemptions | | (194,445 | ) | | (1,599,367 | ) | | (198,348 | ) | | (3,015,576 | ) |
| | | | | | | | | | | | |
Net increase (decrease) | | (146,141 | ) | | (1,173,788 | ) | | 48,594 | | | 888,820 | |
| | | | |
Class C | | | | | | | | | | | | |
Subscriptions | | 97,202 | | | 833,369 | | | 106,346 | | | 1,756,270 | |
Distributions reinvested | | 22,330 | | | 170,897 | | | 151,036 | | | 2,229,869 | |
Redemptions | | (196,401 | ) | | (1,646,317 | ) | | (188,638 | ) | | (2,822,085 | ) |
| | | | | | | | | | | | |
Net increase (decrease) | | (76,869 | ) | | (642,051 | ) | | 68,744 | | | 1,164,054 | |
| | | | |
Class Z | | | | | | | | | | | | |
Subscriptions | | 15,480,870 | | | 128,665,264 | | | 4,334,071 | | | 58,822,815 | |
Proceeds received in connection with merger | | — | | | — | | | 1,924,145 | | | 25,873,534 | |
Distributions reinvested | | 976,848 | | | 7,579,012 | | | 4,827,796 | | | 71,469,590 | |
Redemptions | | (10,673,077 | ) | | (85,581,022 | ) | | (8,939,020 | ) | | (139,147,866 | ) |
| | | | | | | | | | | | |
Net increase | | 5,784,641 | | | 50,663,254 | | | 2,146,992 | | | 17,018,073 | |
See Accompanying Notes to Financial Statements.
13
Financial Highlights – Columbia Real Estate Equity Fund
Selected data for a share outstanding throughout each period is as follows:
| | | | | | | | | | | | | | | | | | | | |
| | | Year Ended August 31, | |
| Class A Shares | | 2009 | | | 2008 | | | 2007 | | | 2006 | | | 2005 | |
Net Asset Value, Beginning of Period | | $ | 13.85 | | | $ | 20.72 | | | $ | 29.07 | | | $ | 27.84 | | | $ | 25.59 | |
| | | | | |
Income from Investment Operations: | | | | | | | | | | | | | | | | | | | | |
Net investment income (a) | | | 0.22 | | | | 0.29 | | | | 0.22 | | | | 0.39 | | | | 0.79 | (b) |
Net realized and unrealized gain (loss) on investments and foreign currency | | | (4.46 | ) | | | (1.10 | ) | | | 1.24 | | | | 4.90 | | | | 4.73 | |
| | | | | | | | | | | | | | | | | | | | |
Total from investment operations | | | (4.24 | ) | | | (0.81 | ) | | | 1.46 | | | | 5.29 | | | | 5.52 | |
| | | | | |
Less Distributions to Shareholders: | | | | | | | | | | | | | | | | | | | | |
From net investment income | | | (0.33 | ) | | | (0.16 | ) | | | (0.33 | ) | | | (0.78 | ) | | | (0.75 | ) |
From net realized gains | | | — | | | | (5.90 | ) | | | (9.48 | ) | | | (3.28 | ) | | | (2.52 | ) |
From return of capital | | | (0.17 | ) | | | — | | | | — | | | | — | | | | — | |
| | | | | | | | | | | | | | | | | | | | |
Total distributions to shareholders | | | (0.50 | ) | | | (6.06 | ) | | | (9.81 | ) | | | (4.06 | ) | | | (3.27 | ) |
| | | | | |
Net Asset Value, End of Period | | $ | 9.11 | | | $ | 13.85 | | | $ | 20.72 | | | $ | 29.07 | | | $ | 27.84 | |
Total return (c) | | | (29.89 | )% | | | (5.46 | )% | | | 1.72 | % | | | 21.66 | % | | | 22.65 | % |
| | | | | |
Ratios to Average Net Assets/Supplemental Data: | | | | | | | | | | | | | | | | | | | | |
Net expenses before interest expense (d) | | | 1.31 | % | | | 1.28 | % | | | 1.21 | % | | | 1.19 | % | | | 1.18 | % |
Interest expense | | | — | | | | — | %(e) | | | — | %(e) | | | — | %(e) | | | — | |
Net expenses (d) | | | 1.31 | % | | | 1.28 | % | | | 1.21 | % | | | 1.19 | % | | | 1.18 | % |
Net investment income (d) | | | 2.69 | % | | | 1.93 | % | | | 0.84 | % | | | 1.45 | % | | | 2.98 | % |
Portfolio turnover rate | | | 110 | % | | | 78 | % | | | 67 | % | | | 10 | % | | | 10 | % |
Net assets, end of period (000s) | | $ | 17,114 | | | $ | 22,321 | | | $ | 31,069 | | | $ | 44,685 | | | $ | 45,756 | |
| (a) | Per share data was calculated using the average shares outstanding during the period. |
| (b) | Net investment income per share reflects a special dividend. The effect of this dividend amounted to $0.24 per share. |
| (c) | Total return at net asset value assuming all distributions reinvested and no initial sales charge or contingent deferred sales charge. |
| (d) | The benefits derived from expense reductions had an impact of less than 0.01%. |
| (e) | Rounds to less than 0.01%. |
See Accompanying Notes to Financial Statements.
14
Financial Highlights – Columbia Real Estate Equity Fund
Selected data for a share outstanding throughout each period is as follows:
| | | | | | | | | | | | | | | | | | | | |
| | | Year Ended August 31, | |
| Class B Shares | | 2009 | | | 2008 | | | 2007 | | | 2006 | | | 2005 | |
Net Asset Value, Beginning of Period | | $ | 13.85 | | | $ | 20.76 | | | $ | 29.09 | | | $ | 27.85 | | | $ | 25.60 | |
| | | | | |
Income from Investment Operations: | | | | | | | | | | | | | | | | | | | | |
Net investment income (a) | | | 0.16 | | | | 0.20 | | | | 0.03 | | | | 0.19 | | | | 0.60 | (b) |
Net realized and unrealized gain (loss) on investments and foreign currency | | | (4.46 | ) | | | (1.14 | ) | | | 1.24 | | | | 4.90 | | | | 4.73 | |
| | | | | | | | | | | | | | | | | | | | |
Total from investment operations | | | (4.30 | ) | | | (0.94 | ) | | | 1.27 | | | | 5.09 | | | | 5.33 | |
| | | | | |
Less Distributions to Shareholders: | | | | | | | | | | | | | | | | | | | | |
From net investment income | | | (0.26 | ) | | | (0.07 | ) | | | (0.12 | ) | | | (0.57 | ) | | | (0.56 | ) |
From net realized gains | | | — | | | | (5.90 | ) | | | (9.48 | ) | | | (3.28 | ) | | | (2.52 | ) |
From return of capital | | | (0.17 | ) | | | — | | | | — | | | | — | | | | — | |
| | | | | | | | | | | | | | | | | | | | |
Total distributions to shareholders | | | (0.43 | ) | | | (5.97 | ) | | | (9.60 | ) | | | (3.85 | ) | | | (3.08 | ) |
| | | | | |
Net Asset Value, End of Period | | $ | 9.12 | | | $ | 13.85 | | | $ | 20.76 | | | $ | 29.09 | | | $ | 27.85 | |
Total return (c) | | | (30.38 | )% | | | (6.21 | )% | | | 0.99 | % | | | 20.78 | % | | | 21.74 | % |
| | | | | |
Ratios to Average Net Assets/Supplemental Data: | | | | | | | | | | | | | | | | | | | | |
Net expenses before interest expense (d) | | | 2.06 | % | | | 2.03 | % | | | 1.96 | % | | | 1.94 | % | | | 1.93 | % |
Interest expense | | | — | | | | — | %(e) | | | — | %(e) | | | — | %(e) | | | — | |
Net expenses (d) | | | 2.06 | % | | | 2.03 | % | | | 1.96 | % | | | 1.94 | % | | | 1.93 | % |
Net investment income (d) | | | 1.96 | % | | | 1.30 | % | | | 0.10 | % | | | 0.72 | % | | | 2.26 | % |
Portfolio turnover rate | | | 110 | % | | | 78 | % | | | 67 | % | | | 10 | % | | | 10 | % |
Net assets, end of period (000s) | | $ | 3,356 | | | $ | 7,123 | | | $ | 9,663 | | | $ | 13,309 | | | $ | 14,393 | |
| (a) | Per share data was calculated using the average shares outstanding during the period. |
| (b) | Net investment income per share reflects a special dividend. The effect of this dividend amounted to $0.24 per share. |
| (c) | Total return at net asset value assuming all distributions reinvested and no contingent deferred sales charge. |
| (d) | The benefits derived from expense reductions had an impact of less than 0.01%. |
| (e) | Rounds to less than 0.01%. |
See Accompanying Notes to Financial Statements.
15
Financial Highlights – Columbia Real Estate Equity Fund
Selected data for a share outstanding throughout each period is as follows:
| | | | | | | | | | | | | | | | | | | | |
| | | Year Ended August 31, | |
| Class C Shares | | 2009 | | | 2008 | | | 2007 | | | 2006 | | | 2005 | |
Net Asset Value, Beginning of Period | | $ | 13.82 | | | $ | 20.72 | | | $ | 29.06 | | | $ | 27.83 | | | $ | 25.58 | |
| | | | | |
Income from Investment Operations: | | | | | | | | | | | | | | | | | | | | |
Net investment income (a) | | | 0.16 | | | | 0.19 | | | | 0.03 | | | | 0.18 | | | | 0.55 | (b) |
Net realized and unrealized gain (loss) on investments and foreign
currency | | | (4.45 | ) | | | (1.12 | ) | | | 1.23 | | | | 4.90 | | | | 4.78 | |
| | | | | | | | | | | | | | | | | | | | |
Total from investment operations | | | (4.29 | ) | | | (0.93 | ) | | | 1.26 | | | | 5.08 | | | | 5.33 | |
| | | | | |
Less Distributions to Shareholders: | | | | | | | | | | | | | | | | | | | | |
From net investment income | | | (0.26 | ) | | | (0.07 | ) | | | (0.12 | ) | | | (0.57 | ) | | | (0.56 | ) |
From net realized gains | | | — | | | | (5.90 | ) | | | (9.48 | ) | | | (3.28 | ) | | | (2.52 | ) |
From return of capital | | | (0.17 | ) | | | — | | | | — | | | | — | | | | — | |
| | | | | | | | | | | | | | | | | | | | |
Total distributions to shareholders | | | (0.43 | ) | | | (5.97 | ) | | | (9.60 | ) | | | (3.85 | ) | | | (3.08 | ) |
| | | | | |
Net Asset Value, End of Period | | $ | 9.10 | | | $ | 13.82 | | | $ | 20.72 | | | $ | 29.06 | | | $ | 27.83 | |
Total return (c) | | | (30.37 | )% | | | (6.18 | )% | | | 0.94 | % | | | 20.75 | % | | | 21.75 | % |
| | | | | |
Ratios to Average Net Assets/Supplemental Data: | | | | | | | | | | | | | | | | | | | | |
Net expenses before interest expense (d) | | | 2.06 | % | | | 2.03 | % | | | 1.96 | % | | | 1.94 | % | | | 1.93 | % |
Interest expense | | | — | | | | — | %(e) | | | — | %(e) | | | — | %(e) | | | — | |
Net expenses (d) | | | 2.06 | % | | | 2.03 | % | | | 1.96 | % | | | 1.94 | % | | | 1.93 | % |
Net investment income (d) | | | 1.95 | % | | | 1.26 | % | | | 0.11 | % | | | 0.66 | % | | | 2.08 | % |
Portfolio turnover rate | | | 110 | % | | | 78 | % | | | 67 | % | | | 10 | % | | | 10 | % |
Net assets, end of period (000s) | | $ | 3,553 | | | $ | 6,462 | | | $ | 8,263 | | | $ | 5,486 | | | $ | 4,821 | |
| (a) | Per share data was calculated using the average shares outstanding during the period. |
| (b) | Net investment income per share reflects a special dividend. The effect of this dividend amounted to $0.24 per share. |
| (c) | Total return at net asset value assuming all distributions reinvested and no contingent deferred sales charge. |
| (d) | The benefits derived from expense reductions had an impact of less than 0.01%. |
| (e) | Rounds to less than 0.01%. |
See Accompanying Notes to Financial Statements.
16
Financial Highlights – Columbia Real Estate Equity Fund
Selected data for a share outstanding throughout each period is as follows:
| | | | | | | | | | | | | | | | | | | | |
| | | Year Ended August 31, | |
| Class Z Shares | | 2009 | | | 2008 | | | 2007 | | | 2006 | | | 2005 | |
Net Asset Value, Beginning of Period | | $ | 13.88 | | | $ | 20.74 | | | $ | 29.10 | | | $ | 27.86 | | | $ | 25.60 | |
| | | | | |
Income from Investment Operations: | | | | | | | | | | | | | | | | | | | | |
Net investment income (a) | | | 0.24 | | | | 0.33 | | | | 0.29 | | | | 0.48 | | | | 0.90 | (b) |
Net realized and unrealized gain (loss) on investments and foreign currency | | | (4.47 | ) | | | (1.10 | ) | | | 1.22 | | | | 4.88 | | | | 4.70 | |
| | | | | | | | | | | | | | | | | | | | |
Total from investment operations | | | (4.23 | ) | | | (0.77 | ) | | | 1.51 | | | | 5.36 | | | | 5.60 | |
| | | | | |
Less Distributions to Shareholders: | | | | | | | | | | | | | | | | | | | | |
From net investment income | | | (0.35 | ) | | | (0.19 | ) | | | (0.39 | ) | | | (0.84 | ) | | | (0.82 | ) |
From net realized gains | | | — | | | | (5.90 | ) | | | (9.48 | ) | | | (3.28 | ) | | | (2.52 | ) |
From return of capital | | | (0.17 | ) | | | — | | | | — | | | | — | | | | — | |
| | | | | | | | | | | | | | | | | | | | |
Total distributions to shareholders | | | (0.52 | ) | | | (6.09 | ) | | | (9.87 | ) | | | (4.12 | ) | | | (3.34 | ) |
| | | | | |
Net Asset Value, End of Period | | $ | 9.13 | | | $ | 13.88 | | | $ | 20.74 | | | $ | 29.10 | | | $ | 27.86 | |
Total return (c) | | | (29.71 | )% | | | (5.21 | )% | | | 1.95 | % | | | 21.99 | % | | | 22.99 | % |
| | | | | |
Ratios to Average Net Assets/Supplemental Data: | | | | | | | | | | | | | | | | | | | | |
Net expenses before interest expense (d) | | | 1.06 | % | | | 1.03 | % | | | 0.96 | % | | | 0.94 | % | | | 0.93 | % |
Interest expense | | | — | | | | — | %(e) | | | — | %(e) | | | — | %(e) | | | — | |
Net expenses (d) | | | 1.06 | % | | | 1.03 | % | | | 0.96 | % | | | 0.94 | % | | | 0.93 | % |
Net investment income (d) | | | 2.96 | % | | | 2.17 | % | | | 1.11 | % | | | 1.78 | % | | | 3.40 | % |
Portfolio turnover rate | | | 110 | % | | | 78 | % | | | 67 | % | | | 10 | % | | | 10 | % |
Net assets, end of period (000s) | | $ | 238,485 | | | $ | 282,293 | | | $ | 377,388 | | | $ | 578,899 | | | $ | 758,147 | |
| (a) | Per share data was calculated using the average shares outstanding during the period. |
| (b) | Net investment income per share reflects a special dividend. The effect of this dividend amounted to $0.24 per share. |
| (c) | Total return at net asset value assuming all distributions reinvested. |
| (d) | The benefits derived from expense reductions had an impact of less than 0.01%. |
| (e) | Rounds to less than 0.01%. |
See Accompanying Notes to Financial Statements.
17
Notes to Financial Statements – Columbia Real Estate Equity Fund
August 31, 2009
Note 1. Organization
Columbia Real Estate Equity Fund (the “Fund”), a series of Columbia Funds Series Trust I (the “Trust”), is a non-diversified fund. The Trust is a Massachusetts business trust registered under the Investment Company Act of 1940, as amended (the “1940 Act”), as an open-end management investment company.
Investment Objective
The Fund seeks capital appreciation and above-average income by investing, under normal market conditions, at least 80% of its net assets (plus any borrowings for investment purposes) in stocks of companies principally engaged in the real estate industry, including real estate investment trusts (REITs).
Fund Shares
The Trust may issue an unlimited number of shares, and the Fund offers four classes of shares: Class A, Class B, Class C and Class Z. Each share class has its own expense structure and sales charges, as applicable.
Class A shares are subject to a maximum front-end sales charge of 5.75% based on the amount of initial investment. Class A shares purchased without an initial sales charge in accounts aggregating $1 million to $50 million at the time of purchase are subject to a 1.00% contingent deferred sales charge (“CDSC”) if the shares are sold within one year after purchase. Class B shares are subject to a maximum CDSC of 5.00% based upon the holding period after purchase. Class B shares will convert to Class A shares eight years after purchase. Class C shares are subject to a 1.00% CDSC on shares sold within one year after purchase. Class Z shares are offered continuously at net asset value. There are certain restrictions on the purchase of Class Z shares, as described in the Fund’s prospectus.
Effective June 22, 2009, the Fund no longer accepts investments in Class B shares from new or existing investors in the Fund’s Class B shares, except in connection with the reinvestment of any dividend and/or capital gain distributions in Class B shares of the Fund, and exchanges by existing Class B shareholders of other Columbia Funds.
Note 2. Significant Accounting Policies
The preparation of financial statements in accordance with accounting principles generally accepted in the United States of America (“GAAP”) requires management to make certain estimates and assumptions that affect the reported amounts of assets and liabilities, the disclosure of contingent assets and liabilities at the date of the financial statements and the reported amounts of revenue and expenses during the reporting period. Actual results could differ from those estimates.
Management has evaluated the events and transactions that have occurred through October 22, 2009, the date the financial statements were issued, and except as disclosed in Note 11, noted no items requiring adjustment of the financial statements or additional disclosures.
The following is a summary of significant accounting policies consistently followed by the Fund in the preparation of its financial statements.
Security Valuation
Equity securities and securities of certain investment companies are valued at the last sale price on the principal exchange on which they trade, except for securities traded on the NASDAQ, which are valued at the NASDAQ official close price. Unlisted securities or listed securities for which there were no sales during the day are valued at the closing bid price on such exchanges or over-the-counter markets.
Short-term investments maturing in 60 days or less are valued at amortized cost, which approximates market value.
Investments in other open-end investment companies are valued at net asset value.
Investments for which market quotations are not readily available, or that have quotations which management believes are not reliable, are valued at fair value as determined in good faith under consistently applied procedures established by and under the general supervision of the Board of Trustees. If a security is valued at fair value, such value is likely to be different from the last quoted market price for the security. The determination of fair value often requires significant judgment. To determine fair value, management may use assumptions including but not limited to future cash flows and estimated risk premiums. Multiple inputs from various sources may be used to determine value.
Various inputs are used to determine the value of the Fund’s investments. Management establishes a hierarchy that prioritizes the inputs to valuation techniques used to
18
Columbia Real Estate Equity Fund
August 31, 2009
measure fair value giving the highest priority to unadjusted quoted prices in active markets for identical securities (level 1 measurements) and the lowest priority to unobservable inputs (level 3 measurements) when market prices are not readily available or reliable. The three levels of the fair value hierarchy are described below:
| n | | Level 1 – quoted prices in active markets for identical securities |
| n | | Level 2 – prices determined using other significant observable inputs (including quoted prices for similar securities, interest rates, prepayment speeds, credit risk and others) |
| n | | Level 3 – prices determined using significant unobservable inputs. In situations where quoted prices or observable inputs are unavailable or less reliable, unobservable inputs may be used. Unobservable inputs may include management’s own assumptions about the factors market participants would use in pricing an investment. |
The inputs or methodology used for valuing securities are not necessarily an indication of the risk associated with investing in those securities.
Security Transactions
Security transactions are accounted for on the trade date. Cost is determined and gains (losses) are based upon the specific identification method for both financial statement and federal income tax purposes.
Repurchase Agreements
The Fund may engage in repurchase agreement transactions with institutions that Columbia Management Advisors, LLC (“Columbia”), the Fund’s investment advisor, has determined are creditworthy. The Fund, through its custodian, receives delivery of the underlying securities collateralizing a repurchase agreement. Columbia is responsible for determining that the collateral is at least equal, at all times, to the value of the repurchase obligation including interest. A repurchase agreement transaction involves certain risks in the event of default or insolvency of the counterparty. These risks include possible delays in or restrictions on the Fund’s ability to dispose of the underlying securities and a possible decline in the value of the underlying securities during the period while the Fund seeks to assert its rights.
Income Recognition
Interest income is recorded on the accrual basis.
Distributions received from real estate investment trusts (REITs) in excess of their income are recorded as a reduction of the cost of the related investments. If the Fund no longer owns the applicable securities, any distributions received in excess of income are recorded as realized gains.
Expenses
General expenses of the Trust are allocated to the Fund and other series of the Trust based upon relative net assets or other expense allocation methodologies determined by the nature of the expense. Expenses directly attributable to the Fund are charged to the Fund.
Determination of Class Net Asset Value
All income, expenses (other than class-specific expenses, as shown on the Statement of Operations) and realized and unrealized gains (losses) are allocated to each class of the Fund on a daily basis, based on the relative net assets of each class, for purposes of determining the net asset value of each class.
Federal Income Tax Status
The Fund intends to qualify each year as a “regulated investment company” under Subchapter M of the Internal Revenue Code, as amended, and will distribute substantially all of its taxable income, if any, for its tax year, and as such will not be subject to federal income taxes. In addition, the Fund intends to distribute in each calendar year substantially all of its net investment income, capital gains and certain other amounts, if any, such that the Fund should not be subject to federal excise tax. Therefore, no federal income or excise tax provision is recorded.
Distributions to Shareholders
Distributions from net investment income are declared and paid quarterly. Net realized capital gains, if any, are distributed at least annually. Income distributions and capital gain distributions are determined in accordance with federal income tax regulations which may differ from GAAP.
Indemnification
In the normal course of business, the Fund enters into contracts that contain a variety of representations and
19
Columbia Real Estate Equity Fund
August 31, 2009
warranties and which provide general indemnities. The Fund’s maximum exposure under these arrangements is unknown because this would involve future claims against the Fund. Also, under the Trust’s organizational documents and by contract, the Trustees and officers of the Trust are indemnified against certain liabilities that may arise out of actions relating to their duties to the Trust. However, based on experience, the Fund expects the risk of loss due to these representations, warranties and indemnities to be minimal.
Note 3. Federal Tax Information
The timing and character of income and capital gain distributions are determined in accordance with income tax regulations, which may differ from GAAP. Reclassifications are made to the Fund’s capital accounts for permanent tax differences to reflect income and gains available for distribution (or available capital loss carryforwards) under income tax regulations.
For the year ended August 31, 2009, permanent book and tax basis differences resulting primarily from differing treatments for foreign currency transactions and REIT adjustments were identified and reclassified among the components of the Fund’s net assets as follows:
| | | | |
| | | | | |
Overdistributed Net Investment
Income | | Accumulated
Net Realized Loss | | Paid-In Capital |
| $2,563,628 | | $(1,950,122) | | $(613,506) |
Net investment income and net realized gains (losses), as disclosed on the Statement of Operations, and net assets were not affected by this reclassification.
The tax character of distributions paid during the years ended August 31, 2009 and August 31, 2008 was as follows:
| | | | | | |
| | | August 31, |
| | | 2009 | | 2008 |
| Distributions paid from: | | |
Ordinary Income* | | $ | 9,122,180 | | $ | 4,051,574 |
Long-Term Capital Gains | | | — | | | 105,279,419 |
Return of Capital | | | 4,695,255 | | | — |
| * | For tax purposes short-term capital gain distributions, if any, are considered ordinary income distributions. |
As of August 31, 2009, the components of distributable earnings on a tax basis were as follows:
| | | | | | |
| | | | | |
Undistributed
Ordinary
Income | | Undistributed
Long-Term
Capital Gains | | Net Unrealized
Appreciation* |
| $1,292,499 | | $ | — | | $ | 49,602,691 |
| * | The differences between book-basis and tax-basis net unrealized appreciation are primarily due to deferral of losses from wash sales. |
Unrealized appreciation and depreciation at August 31, 2009, based on cost of investments for federal income tax purposes were:
| | | | |
| | | | |
Unrealized appreciation | | $ | 59,166,860 | |
Unrealized depreciation | | | (9,564,169 | ) |
Net unrealized appreciation | | $ | 49,602,691 | |
The Fund has a tax year end of December 31. The following capital loss carryforwards, determined as of December 31, 2008, may be available to reduce taxable income arising from future net realized gains on investments, if any, to the extent permitted by the Internal Revenue Code:
| | |
| | | |
| Year of Expiration | | Capital Loss Carryforward |
| 2016 | | $2,766,637 |
Under current tax rules, certain currency and capital losses realized after October 31 may be deferred and treated as occurring on the first day of the following fiscal year. As of December 31, 2008, post-October capital losses of $23,909,880 attributed to security transactions were deferred to January 1, 2009.
Management is required to determine whether a tax position of the Fund is more likely than not to be sustained upon examination by the applicable taxing authority, including resolution of any related appeals or litigation processes, based on the technical merits of the position. The tax benefit to be recognized by the Fund is measured as the largest amount of benefit that is greater than fifty percent likely of being realized upon ultimate settlement. Management is not aware of any tax positions for which it is reasonably possible that the total amounts of unrecognized tax benefits will significantly change in the next twelve months. However, management’s conclusions may be subject to review and
20
Columbia Real Estate Equity Fund
August 31, 2009
adjustment at a later date based on factors including, but not limited to, new tax laws, regulations, and administrative interpretations (including relevant court decisions). The Fund’s federal tax returns for the prior three fiscal years remain subject to examination by the Internal Revenue Service.
Note 4. Fees and Compensation Paid to Affiliates
Investment Advisory Fee
Columbia, an indirect, wholly owned subsidiary of Bank of America Corporation (“BOA”), provides investment advisory, administrative and other services to the Fund. In rendering investment advisory services to the Fund, Columbia may use the portfolio management and research resources of Columbia Management Pte. Ltd., an affiliate of Columbia. Columbia receives a monthly investment advisory fee at the annual rate of 0.75% of the Fund’s average daily net assets.
Pricing and Bookkeeping Fees
The Fund has entered into a Financial Reporting Services Agreement (the “Financial Reporting Services Agreement”) with State Street Bank & Trust Company (“State Street”) and Columbia pursuant to which State Street provides financial reporting services to the Fund. The Fund has also entered into an Accounting Services Agreement (collectively with the Financial Reporting Services Agreement, the “State Street Agreements”) with State Street and Columbia pursuant to which State Street provides accounting services to the Fund. Under the State Street Agreements, the Fund pays State Street an annual fee of $38,000 paid monthly plus an additional monthly fee based on an annualized percentage rate of average daily net assets of the Fund for the month. The aggregate fee will not exceed $140,000 per year (exclusive of out-of-pocket expenses and charges). The Fund also reimburses State Street for certain out-of-pocket expenses and charges.
The Fund has entered into a Pricing and Bookkeeping Oversight and Services Agreement (the “Services Agreement”) with Columbia. Under the Services Agreement, Columbia provides services related to Fund expenses and the requirements of the Sarbanes-Oxley Act of 2002, and provides oversight of the accounting and financial reporting services provided by State Street. Under the Services Agreement, the Fund reimburses Columbia for out-of-pocket expenses.
Transfer Agent Fee
Columbia Management Services, Inc. (the “Transfer Agent”), an affiliate of Columbia and an indirect, wholly owned subsidiary of BOA, provides shareholder services to the Fund and has contracted with Boston Financial Data Services (“BFDS”) to serve as sub-transfer agent. The Transfer Agent is entitled to receive a fee for its services, paid monthly, at the annual rate of $17.34 per open account plus reimbursement of certain sub-transfer agent fees paid by the Transfer Agent (exclusive of BFDS fees), calculated based on assets held in omnibus accounts and intended to recover the cost of payments to other parties (including affiliates of BOA) for services to those accounts. The Transfer Agent pays the fees of BFDS for services as sub-transfer agent and is not entitled to reimbursement for such fees from the Fund.
The Transfer Agent may also retain, as additional compensation for its services, fees for wire, telephone and redemption orders, Individual Retirement Account (“IRA”) trustee agent fees and account transcript fees due to the Transfer Agent from shareholders of the Fund and credits (net of bank charges) earned with respect to balances in accounts the Transfer Agent maintains in connection with its services to the Fund. The Transfer Agent also receives reimbursement for certain out-of-pocket expenses.
An annual minimum account balance fee of $20 may apply to certain accounts with a value below the Fund’s initial minimum investment requirements to reduce the impact of small accounts on transfer agent fees. These minimum account balance fees are recorded as part of expense reductions on the Statement of Operations. For the year ended August 31, 2009, no minimum account balance fees were charged by the Fund.
Underwriting Discounts, Service and Distribution Fees
Columbia Management Distributors, Inc. (the “Distributor”), an affiliate of Columbia and an indirect, wholly owned subsidiary of BOA, is the principal underwriter of the Fund’s shares. For the year ended August 31, 2009, the Distributor has retained net underwriting discounts of $5,857 on sales of the Fund’s Class A shares and received net CDSC fees of $7, $6,730 and $1,207 on Class A, Class B and Class C share redemptions, respectively.
21
Columbia Real Estate Equity Fund
August 31, 2009
The Fund has adopted distribution and shareholder servicing plans pursuant to Rule 12b-1 under the 1940 Act (the “Plans”) which require the payment of a monthly service and distribution fee to the Distributor based on the average daily net assets of the Fund at the following annual rates:
| | | | | | | | | | |
| Distribution Fee | | Service Fee |
| Class Aa | | Class B | | Class C | | Class Aa | | Class B | | Class C |
| 0.10% | | 0.75% | | 0.75% | | 0.25% | | 0.25% | | 0.25% |
| a | The Fund may pay distribution and service fees up to a maximum of 0.35% of the Fund’s average daily net assets attributable to Class A shares (comprised of up to 0.10% for distribution services and 0.25% for shareholder liaison services), but currently limits such fees to an aggregate fee of not more than 0.25% of the Fund’s average daily net assets attributable to Class A shares. |
The CDSC and the distribution fees received from the Plans are used principally as repayment to the Distributor for amounts paid by the Distributor to dealers who sold such shares.
Expense Limits and Fee Waivers
Effective January 1, 2009, Columbia has voluntarily agreed to reimburse a portion of the Fund’s expenses so that the Fund’s ordinary operating expenses (excluding any distribution and service fees, brokerage commissions, interest, taxes and extraordinary expenses, but including custodian charges relating to overdrafts, if any), after giving effect to any balance credits from the Fund’s custodian, do not exceed 1.20% annually of the Fund’s average daily net assets. Columbia, in its discretion, may revise or discontinue this arrangement at any time.
Fees Paid to Officers and Trustees
All officers of the Fund are employees of Columbia or its affiliates and, with the exception of the Fund’s Chief Compliance Officer, receive no compensation from the Fund. The Board of Trustees has appointed a Chief Compliance Officer to the Fund in accordance with federal securities regulations. The Fund, along with other affiliated funds, pays its pro-rata share of the expenses associated with the Chief Compliance Officer. The Fund’s expenses for the Chief Compliance Officer will not exceed $15,000 per year.
The Trust’s eligible Trustees may participate in a deferred compensation plan which may be terminated at any time. Obligations of the plan will be paid solely out of the Fund’s assets.
Note 5. Custody Credits
The Fund has an agreement with its custodian bank under which custody fees may be reduced by balance credits. These credits are recorded as part of expense reductions on the Statement of Operations. The Fund could have invested a portion of the assets utilized in connection with the expense offset arrangement in an income-producing asset if it had not entered into such an agreement.
For the year ended August 31, 2009, these custody credits reduced total expenses by $11 for the Fund.
Note 6. Portfolio Information
For the year ended August 31, 2009, the cost of purchases and proceeds from sales of securities, excluding short-term obligations, for the Fund were $302,709,458 and $246,113,971, respectively.
Note 7. Line of Credit
The Fund and other affiliated funds participate in a $280,000,000 committed, unsecured revolving line of credit provided by State Street. The maximum amount that may be borrowed by any fund is limited to the lesser of $200,000,000 and the Fund’s borrowing limit set forth in the Fund’s registration statement. Borrowings are available for short-term liquidity or temporary or emergency purposes.
Interest is charged to each participating fund based on the fund’s borrowings at a rate per annum equal to the greater of the Federal Funds Rate plus 0.50% or the overnight LIBOR Rate plus 0.50%. In addition, an annual operations agency fee of $20,000, an amendment fee of 0.02% and a commitment fee of 0.12% per annum are accrued and apportioned among the participating funds pro rata based on their relative net assets. Prior to October 16, 2008, the Fund and other affiliated funds participated in a $350,000,000 committed, unsecured revolving line of credit and a $150,000,000 uncommitted, unsecured line of credit, both provided by State Street. Interest on the committed line of credit was charged to each participating fund based on the fund’s borrowings at a rate per annum equal to the Federal Funds Rate plus 0.50%. In addition, a commitment fee of 0.10% per annum was accrued and apportioned among the participating funds pro rata based on their relative net assets. Interest on the uncommitted line of credit was charged to each participating fund based on the fund’s borrowings at a rate per annum equal to the Federal
22
Columbia Real Estate Equity Fund
August 31, 2009
Funds Rate plus 0.375%. State Street charged an annual operations agency fee of $40,000 for the committed line of credit and was able to charge an annual administration fee of $15,000 for the uncommitted line of credit. The commitment fee, the operations agency fee and the administration fee were accrued and apportioned among the participating funds pro rata based on their relative net assets.
For the year ended August 31, 2009, the Fund did not borrow under these arrangements.
Note 8. Shares of Beneficial Interest
As of August 31, 2009, 38.4% of the Fund’s shares outstanding were beneficially owned by one participant account over which BOA and/or any of its affiliates had either sole or joint investment discretion.
Subscription and redemption activity of these accounts may have a significant effect on the operations of the Fund.
Note 9. Significant Risks and Contingencies
Sector Focus Risk
The Fund may focus its investments in certain sectors, subjecting it to greater risk than a fund that is less focused.
Real Estate Sector Risk
Interests held in REITs and other companies principally engaged in the real estate industry are subject to risks similar to those of direct investments in real estate. These risks include fluctuating property values, locally, regionally and nationally, which are affected by various factors including interest rates, property taxes, operating expenses, occupancy rates, environmental regulations and contamination, availability of credit, uninsured casualty and condemnation. The value of REITs and other companies principally engaged in the real estate industry are also affected by, among other factors, changes in the prospect for earnings and/or cash flow growth of the REIT or such real estate-related company itself. Because the value of REITs and real estate-related companies may fluctuate widely in response to changes in factors affecting the real estate markets, the value of an investment in the Fund may be more volatile than the value of an investment in a fund that is invested in a more diverse range of market sectors.
Legal Proceedings
Columbia Management Advisors, LLC and Columbia Management Distributors, Inc. (collectively, the “Columbia Group”) are subject to a settlement agreement with the New York Attorney General (“NYAG”) (the “NYAG Settlement”) and a settlement order with the SEC (the “SEC Order”) on matters relating to mutual fund trading, each dated February 9, 2005. Under the terms of the SEC Order, the Columbia Group (or predecessor entities) agreed, among other things, to: pay disgorgement and civil money penalties collectively totaling $140 million; cease and desist from violations of the antifraud provisions and certain other provisions of the federal securities laws; maintain certain compliance and ethics oversight structures; and retain an independent consultant to review the Columbia Group’s applicable supervisory, compliance, control and other policies and procedures. The NYAG Settlement, among other things, requires Columbia Management Advisors, LLC and its affiliates to reduce management fees for certain funds in the Columbia family of mutual funds in a projected total of $160 million over five years through November 30, 2009 and to make certain disclosures to investors relating to expenses. In connection with the Columbia Group providing services to the Columbia Funds, the Columbia Funds have voluntarily undertaken to implement certain governance measures designed to maintain the independence of their boards of trustees and certain special consulting and compliance measures.
Pursuant to the SEC Order and related procedures, the $140 million in settlement amounts described above has been substantially distributed in accordance with a distribution plan that was developed by an independent distribution consultant and approved by the SEC on April 6, 2007.
In connection with the events described above, various parties have filed suit against certain funds, the Trustees of the Columbia Funds, FleetBoston Financial Corporation and its affiliated entities and/or Bank of America and its affiliated entities.
On February 20, 2004, the Judicial Panel on Multidistrict Litigation transferred these cases and cases against other mutual fund companies based on similar allegations to the United States District Court in Maryland for consolidated or coordinated pretrial proceedings (the “MDL”). Subsequently, additional related cases were transferred to the MDL. On
23
Columbia Real Estate Equity Fund
August 31, 2009
September 29, 2004, the plaintiffs in the MDL filed amended and consolidated complaints. One of these amended complaints is a putative class action that includes claims under the federal securities laws and state common law, and that names Columbia Management Advisors, Inc. (which has since merged into Banc of America Capital Management, LLC (now named Columbia Management Advisors, LLC)) (“Columbia”), Columbia Funds Distributor, Inc. (now named Columbia Management Distributors, Inc.) (the “Distributor”), the Trustees of the Columbia Funds, Bank of America Corporation and others as defendants. Another of the amended complaints is a derivative action purportedly on behalf of the Columbia Funds that asserts claims under federal securities laws and state common law.
On February 25, 2005, Columbia and other defendants filed motions to dismiss the claims in the pending cases. On March 1, 2006, for reasons stated in the court’s memoranda dated November 3, 2005, the United States District Court for the District of Maryland granted in part and denied in part the defendants’ motions to dismiss. The court dismissed all of the class action claims pending against the Columbia Funds Trusts. As to Columbia and the Distributor, the claims under the Securities Act of 1933, the claims under Sections 34(b) and 36(a) of the Investment Company Act of 1940 (“ICA”) and the state law claims were dismissed. The claims under Sections 10(b) and 20(a) of the Securities Exchange Act of 1934 and claims under Section 36(b) of the ICA were not dismissed.
On March 21, 2005, a purported class action was filed in Massachusetts state court alleging that certain conduct, including market timing, entitled Class B shareholders in certain Columbia Funds to an exemption from contingent deferred sales charges upon early redemption (the “CDSC Lawsuit”). The CDSC Lawsuit was removed to federal court in Massachusetts and transferred to the MDL.
On September 14, 2007, the plaintiffs and the Columbia defendants named in the MDL, including the Columbia Funds, entered into a stipulation of settlement with respect to all Columbia-related claims in the MDL described above, including the CDSC Lawsuit. The settlement is subject to court approval.
Note 10. Business Combinations and Mergers
As of March 24, 2008, Real Estate Fund, a series of Excelsior Funds, Inc., merged into Columbia Real Estate Equity Fund. Columbia Real Estate Equity Fund received a tax-free transfer of assets from Excelsior Real Estate Fund as follows:
| | | | |
| | | | | |
Shares
Issued | | Net Assets
Received | | Unrealized
Depreciation1 |
1,924,145 | | $25,873,534 | | $(1,417,264) |
Net Assets of
Columbia
Real Estate
Equity Fund
Prior to
Combination | | Net Assets of
Real Estate
Fund Immediately
Prior to Combination | | Net Assets
of Columbia
Real Estate
Equity Fund
Immediately
After
Combination |
$294,500,389 | | $25,873,534 | | $320,373,923 |
| 1 | Unrealized depreciation is included in the Net Assets Received. |
Note 11. Subsequent Event
On October 15, 2009 the committed line of credit discussed in Note 7 was renewed on amended terms. Pursuant to the amended terms, interest is charged to each participating fund based on the fund’s borrowings at a rate per annum equal to the greater of the Federal Funds Rate plus 1.25% or the overnight LIBOR Rate plus 1.25%. In addition, a commitment fee of 0.15% per annum is accrued and apportioned among the participating funds pro rata based on their relative net assets. The annual operations agency fee of $20,000 was waived.
Bank of America Corporation, the indirect parent company of Columbia, entered into an agreement dated September 29, 2009 to sell a portion of the asset management business of Columbia Management Group, LLC to Ameriprise Financial, Inc. The transaction (“Transaction”) includes a sale of the part of the asset management business that advises long-term mutual funds, including the Fund. The Transaction is subject to certain approvals and other conditions to closing, and is currently expected to close in the spring of 2010.
24
Report of Independent Registered Public Accounting Firm
To the Trustees of the Columbia Funds Series Trust I and the Shareholders of Columbia Real Estate Equity Fund
In our opinion, the accompanying statement of assets and liabilities, including the investment portfolio, and the related statements of operations and of changes in net assets and the financial highlights present fairly, in all material respects, the financial position of Columbia Real Estate Equity Fund (the “Fund”) (a series of Columbia Funds Series Trust I), at August 31, 2009, the results of its operations for the year then ended, the changes in its net assets for each of the two years in the period then ended and the financial highlights for each of the five years in the period then ended, in conformity with accounting principles generally accepted in the United States of America. These financial statements and financial highlights (hereafter referred to as “financial statements”) are the responsibility of the Fund’s management. Our responsibility is to express an opinion on these financial statements based on our audits. We conducted our audits of these financial statements in accordance with the standards of the Public Company Accounting Oversight Board (United States). Those standards require that we plan and perform the audit to obtain reasonable assurance about whether the financial statements are free of material misstatement. An audit includes examining, on a test basis, evidence supporting the amounts and disclosures in the financial statements, assessing the accounting principles used and significant estimates made by management, and evaluating the overall financial statement presentation. We believe that our audits, which included confirmation of securities at August 31, 2009 by correspondence with the custodian and brokers, provide a reasonable basis for our opinion.
PricewaterhouseCoopers LLP
Boston, Massachusetts
October 22, 2009
25
Fund Governance – Columbia Real Estate Equity Fund
The Trustees serve terms of indefinite duration. The names, addresses and ages of the Trustees and Officers of the Funds in the Columbia Funds Complex, the year each was first elected or appointed to office, their principal business occupations during at least the last five years, the number of Funds overseen by each Trustee and other directorships they hold are shown below. Each officer listed below serves as an officer of each Fund in the Columbia Funds Complex.
Independent Trustees
| | |
Name, Address and Year of
Birth, Position with Funds, Year
First Elected or Appointed to Office | | Principal Occupation(s) During Past Five Years, Number of Funds in the
Columbia Funds Complex Overseen by Trustee, Other Directorships Held |
| |
| John D. Collins (Born 1938) | | |
c/o Columbia Management Advisors, LLC One Financial Center Boston, MA 02111 Trustee (since 2007) | | Retired. Consultant, KPMG, LLP (accounting and tax firm) from July 1999 to June 2000; Partner, KPMG, LLP from March 1962 to June 1999. Oversees 66, Mrs. Fields Famous Brands LLC (consumer products); Suburban Propane Partners, L.P.; and Montpelier Re (insurance underwriting firm) |
| |
| Rodman L. Drake (Born 1943) | | |
c/o Columbia Management Advisors, LLC One Financial Center Boston, MA 02111 Trustee (since 2007) and Chairman of the Board (since 2009) | | Co-Founder of Baringo Capital LLC (private equity) since 2002; President, Continuation Investments Group, Inc. from 1997 to 2001. Oversees 66, Jackson Hewitt Tax Service Inc. (tax preparation services); Crystal Capital River Inc. (real estate investment trust); Student Loan Corporation (student loan provider); Celgene Corporation (global biotechnology company); and The Helios Funds (exchange-traded funds) |
| |
| Douglas A. Hacker (Born 1955) | | |
c/o Columbia Management Advisors, LLC One Financial Center Boston, MA 02111 Trustee (since 1996) | | Independent business executive since May 2006; Executive Vice President–Strategy of United Airlines (airline) from December 2002 to May 2006; President of UAL Loyalty Services (airline marketing company) from September 2001 to December 2002; Executive Vice President and Chief Financial Officer of United Airlines from July 1999 to September 2001. Oversees 66, Nash Finch Company (food distributor); Aircastle Limited (aircraft leasing) |
|
| Janet Langford Kelly (Born 1957) |
c/o Columbia Management Advisors, LLC One Financial Center Boston, MA 02111 Trustee (since 1996) | | Senior Vice President, General Counsel and Corporate Secretary, ConocoPhillips (integrated energy company) since September 2007; Deputy General Counsel–Corporate Legal Services, ConocoPhillips from August 2006 to August 2007; Partner, Zelle, Hofmann, Voelbel, Mason & Gette LLP (law firm) from March 2005 to July 2006; Adjunct Professor of Law, Northwestern University, from September 2004 to June 2006; Director, UAL Corporation (airline) from February 2006 to July 2006; Oversees 66, None |
| |
| Charles R. Nelson (Born 1942) | | |
c/o Columbia Management Advisors, LLC One Financial Center Boston, MA 02111 Trustee (since 1981) | | Professor of Economics, University of Washington, since January 1976; Ford and Louisa Van Voorhis Professor of Political Economy, University of Washington, since September 1993; Adjunct Professor of Statistics, University of Washington, since September 1980; Associate Editor, Journal of Money Credit and Banking, 1993-2008 Consultant on econometric and statistical matters. Oversees 66, None |
26
Fund Governance (continued) – Columbia Real Estate Equity Fund
Independent Trustees (continued)
| | |
Name, Address and Year of
Birth, Position with Funds, Year
First Elected or Appointed to Office | | Principal Occupation(s) During Past Five Years, Number of Funds in the
Columbia Funds Complex Overseen by Trustee, Other Directorships Held |
| |
| John J. Neuhauser (Born 1943) | | |
c/o Columbia Management Advisors, LLC One Financial Center Boston, MA 02111 Trustee (since 1985) | | President, Saint Michael’s College, since August 2007; University Professor, Boston College from November 2005 to August 2007; Academic Vice President and Dean of Faculties, Boston College from August 1999 to October 2005. Oversees 66, Liberty All-Star Equity Fund and Liberty All-Star Growth Fund, Inc. (closed-end funds) |
| |
| Jonathan Piel (Born 1938) | | |
c/o Columbia Management Advisors, LLC One Financial Center Boston, MA 02111 Trustee (since 2007) | | Cable television producer and website designer; The Editor, Scientific American from 1984 to 1994; Vice President, Scientific American, Inc., from 1984 to 1994; Member, Advisory Board, Stone Age Institute, Bloomington, Indiana (research institute that explores the effect of technology on human evolution); Member, Board of Directors of the National Institute of Social Sciences, New York City; Member, Board of Trustees of the William Alanson White Institute, New York City (institution for training psychoanalysts); and Member, Advisory Board, Mount Sinai Children’s Environmental Health Center, New York. Oversees 66, None |
| |
| Patrick J. Simpson (Born 1944) | | |
c/o Columbia Management Advisors, LLC One Financial Center Boston, MA 02111 Trustee (since 2000) | | Partner, Perkins Coie LLP (law firm). Oversees 66, None |
|
| Thomas C. Theobald (Born 1937) |
c/o Columbia Management Advisors, LLC One Financial Center Boston, MA 02111 Trustee (since 1996) | | Partner and Senior Advisor, Chicago Growth Partners (private equity investing) since September 2004; Managing Director, William Blair Capital Partners (private equity investing) from September 1994 to September 2004. Oversees 66, Anixter International (network support equipment distributor); Ventas, Inc. (real estate investment trust); Jones Lang LaSalle (real estate management services); Ambac Financial Group (financial guaranty insurance) |
| |
| Anne-Lee Verville (Born 1945) | | |
c/o Columbia Management Advisors, LLC One Financial Center Boston, MA 02111 Trustee (since 1998) | | Retired since 1997 (formerly General Manager–Global Education Industry (from 1994 to 1997), President–Application Systems Division (from 1991 to 1994), Chief Financial Officer–US Marketing & Services (from 1988 to 1991), and Chief Information Officer (from 1987 to 1988), IBM Corporation (computer and technology)). Oversees 66, None |
27
Fund Governance (continued) – Columbia Real Estate Equity Fund
Interested Trustee
| | |
| |
| William E. Mayer1 (Born 1940) | | |
c/o Columbia Management Advisors, LLC One Financial Center Boston, MA 02111 Trustee (since 1994) | | Partner, Park Avenue Equity Partners (private equity) since February 1999; Dean and Professor, College of Business, University of Maryland from 1992 to 1997. Oversees 66, Lee Enterprises (print media), WR Hambrecht + Co. (financial service provider); BlackRock Kelso Capital Corporation (investment company) |
| 1 | The Funds currently treat Mr. Mayer as an “interested person” (as defined in the Investment Company Act of 1940) by reason of his affiliation with WR Hambrecht + Co., a registered broker/dealer that may execute portfolio transactions for or engage in principal transactions with the Funds or other funds or accounts advised/managed by the Advisor or other Bank of America affiliates. |
The Statement of Additional Information includes additional information about the Trustees of the Funds and is available, without charge, upon request by calling 1-800-345-6611.
28
Fund Governance (continued) – Columbia Real Estate Equity Fund
Officers
| | |
Name, Address and Year of Birth,
Position with Funds, Year First
Elected or Appointed to Office | | Principal Occupation(s) During Past Five Years |
|
| J. Kevin Connaughton (Born 1964) |
One Financial Center Boston, MA 02111 President (since 2009) | | Managing Director of Columbia Management Advisors, LLC since December 2004; Senior Vice President and Chief Financial Officer–Columbia Funds, from June 2008 to January 2009; Treasurer–Columbia Funds, from October 2003 to May 2008; Treasurer–the Liberty Funds, Stein Roe Funds and Liberty All-Star Funds, December 2000–December 2006; Senior Vice President–Columbia Management Advisors, LLC, from April 2003 to December 2004; President–Columbia Funds, Liberty Funds and Stein Roe Funds, February 2004 to October 2004; Treasurer–Galaxy Funds, September 2002 to December 2005; Treasurer, December 2002 to December 2004, and President, February 2004 to December 2004–Columbia Management Multi-Strategy Hedge Fund, LLC; and a senior officer of various other Bank of America-affiliated entities, including other registered and unregistered funds. |
|
| James R. Bordewick, Jr. (Born 1959) |
One Financial Center Boston, MA 02111 Senior Vice President, Secretary and Chief Legal Officer (since 2006) | | Associate General Counsel, Bank of America since April 2005; Senior Vice President and Associate General Counsel, MFS Investment Management (investment management) prior to April 2005. |
| |
| Linda J. Wondrack (Born 1964) | | |
One Financial Center Boston, MA 02111 Senior Vice President and Chief Compliance Officer (since 2007) | | Director (Columbia Management Group LLC and Investment Product Group Compliance), Bank of America since June 2005; Director of Corporate Compliance and Conflicts Officer, MFS Investment Management (investment management), August 2004 to May 2005; Managing Director, Deutsche Asset Management (investment management) prior to August 2004. |
| |
| Michael G. Clarke (Born 1969) | | |
One Financial Center Boston, MA 02111 Senior Vice President and Chief Financial Officer (since 2009) | | Director of Fund Administration of the Advisor since January 2006; Managing Director of the Advisor September 2004 to December 2005; Vice President Fund Administration June 2002 to September 2004. |
| |
| Jeffrey R. Coleman (Born 1969) | | |
One Financial Center Boston, MA 02111 Deputy Treasurer (since 2008) | | Director of Fund Administration of the Advisor since January 2006; Fund Controller of the Advisor from October 2004 to January 2006; Vice President of CDC IXIS Asset Management Services, Inc. (investment management) from August 2000 to September 2004. |
| |
| Joseph F. DiMaria (Born 1968) | | |
One Financial Center Boston, MA 02111 Chief Accounting Officer and Treasurer (since 2009) | | Director of Fund Administration of the Advisor since January 2006; Head of Tax/Compliance and Assistant Treasurer of the Advisor from November 2004 to December 2005; Director of Trustee Administration (Sarbanes-Oxley) of the Advisor from May 2003 to October 2004. |
29
Fund Governance (continued) – Columbia Real Estate Equity Fund
Officers (continued)
| | |
Name, Address and Year of Birth,
Position with Funds, Year First
Elected or Appointed to Office | | Principal Occupation(s) During Past Five Years |
| |
| Julian Quero (Born 1967) | | |
One Financial Center Boston, MA 02111 Deputy Treasurer (since 2008) | | Senior Tax Manager of the Advisor since August 2006; Senior Compliance Manager of the Advisor from April 2002 to August 2006. |
| |
| Barry S. Vallan (Born 1969) | | |
One Financial Center Boston, MA 02111 Controller (since 2006) | | Vice President–Fund Treasury of the Advisor since October 2004; Vice President–Trustee Reporting of the Advisor from April 2002 to October 2004. |
| |
| Stephen T. Welsh (Born 1957) | | |
One Financial Center Boston, MA 02111 Vice President (since 1996) | | President, Columbia Management Services, Inc. since July 2004; Senior Vice President and Controller, Columbia Management Services, Inc. prior to July 2004. |
30
[THIS PAGE INTENTIONALLY LEFT BLANK]
31
[THIS PAGE INTENTIONALLY LEFT BLANK]
32
Important Information About This Report
Transfer Agent
Columbia Management Services, Inc.
P.O. Box 8081
Boston, MA 02266-8081
1-800-345-6611
Distributor
Columbia Management
Distributors, Inc.
One Financial Center
Boston, MA 02111
Investment Advisor
Columbia Management Advisors, LLC
100 Federal Street
Boston, MA 02110
The fund mails one shareholder report to each shareholder address. If you would like more than one report, please call shareholder services at 1-800-345-6611 and additional reports will be sent to you. This report has been prepared for shareholders of Columbia Real Estate Equity Fund.
A description of the policies and procedures that the fund uses to determine how to vote proxies and a copy of the fund’s voting records are available (i) at www.columbiamanagement.com, (ii) on the Securities and Exchange Commission’s website at www.sec.gov, and (iii) without charge, upon request, by calling 1-800-368-0346. Information regarding how the fund voted proxies relating to portfolio securities during the 12-month period ended June 30 is available from the SEC’s website. Information regarding how the fund voted proxies relating to portfolio securities is also available from the fund’s website, www.columbiamanagement.com.
The fund files a complete schedule of portfolio holdings with the SEC for the first and third quarters of each fiscal year on Form N-Q. The fund’s Form N-Q is available on the SEC’s website at www.sec.gov and may be reviewed and copied at the SEC’s Public Reference Room in Washington, D.C. Information on the operation of the Public Reference Room may be obtained by calling 1-800-SEC-0330.
Please read and consider the investment objectives, risks, charges and expenses for any fund carefully before investing. For a prospectus which contains this and other important information about the fund, contact your Columbia Management representative or financial advisor or go to www.columbiamanagement.com.
Columbia Management Group, LLC (“Columbia Management”) is the investment management division of Bank of America Corporation. Columbia Management entities furnish investment management services and products for institutional and individual investors. Columbia Funds are distributed by Columbia Management Distributors, Inc., member of FINRA, SIPC, part of Columbia Management and an affiliate of Bank of America Corporation.
33

One Financial Center
Boston, MA 02111-2621
Columbia Real Estate Equity Fund
Annual Report, August 31, 2009
©2009 Columbia Management Distributors, Inc.
One Financial Center, Boston, MA 02111-2621
800.345.6611 www.columbiafunds.com
SHC-42/23529-0809 (10/09) 09/90510
Item 2. Code of Ethics.
(a) The registrant has, as of the end of the period covered by this report, adopted a code of ethics that applies to the registrant’s principal executive officer, principal financial officer, principal accounting officer or controller, or persons performing similar functions, regardless of whether these individuals are employed by the registrant or a third party.
(b) During the period covered by this report, there were not any amendments to a provision of the code of ethics adopted in 2(a) above.
(c) During the period covered by this report, there were no waivers, including any implicit waivers, from a provision of the code of ethics described in 2(a) above that relates to one or more of the items set forth in paragraph (b) of this item’s instructions.
Item 3. Audit Committee Financial Expert.
The registrant’s Board of Trustees has determined that John D. Collins, Douglas A. Hacker, Charles R. Nelson and Anne-Lee Verville, each of whom are members of the registrant’s Board of Trustees and Audit Committee, each qualify as an audit committee financial expert. Mr. Collins, Mr. Hacker, Mr. Nelson and Ms. Verville are each independent trustees, as defined in paragraph (a)(2) of this item’s instructions.
Item 4. Principal Accountant Fees and Services.
Fee information below is disclosed for the eleven series of the registrant whose reports to stockholders are included in this annual filing. Fee information for fiscal year ended August 31, 2008 also includes fees for one series that was merged into the registrant during the period.
(a) Audit Fees. Aggregate Audit Fees billed by the principal accountant for professional services rendered during the fiscal years ended August 31, 2009 and August 31, 2008 are approximately as follows:
2009 | | 2008 | |
$ | 423,300 | | $ | 410,800 | |
| | | | | |
Audit Fees include amounts related to the audit of the registrant’s annual financial statements or services that are normally provided by the accountant in connection with statutory and regulatory filings or engagements for those fiscal years. Audit fees in fiscal year 2009 also include fees for the review of and provision of consent in connection with filing Form N-1A for a new share class for five funds.
(b) Audit-Related Fees. Aggregate Audit-Related Fees billed to the registrant by the principal accountant for professional services rendered during the fiscal years ended August 31, 2009 and August 31, 2008 are approximately as follows:
2009 | | 2008 | |
$ | 50,600 | | $ | 60,200 | |
| | | | | |
Audit-Related Fees include amounts for assurance and related services by the principal accountant that are reasonably related to the performance of the audit of the registrant’s financial statements and are not reported in Audit Fees above. In both fiscal years 2009 and 2008, Audit-Related Fees consist of agreed-upon procedures performed for semi-annual shareholder reports. Fiscal year 2008 also includes Audit-Related Fees for agreed-upon procedures related to a fund merger and a fund accounting and custody conversion.
During the fiscal years ended August 31, 2009 and August 31, 2008, there were no Audit-Related Fees billed by the registrant’s principal accountant to the registrant’s investment adviser (not including any sub-adviser whose role is primarily portfolio management and is subcontracted with or overseen by another investment adviser) and any entity controlling, controlled by, or under common control with the adviser that provides ongoing services to the registrant for an engagement that related directly to the operations and financial reporting of the registrant.
(c) Tax Fees. Aggregate Tax Fees billed by the principal accountant to the registrant for professional services rendered during the fiscal years ended August 31, 2009 and August 31, 2008 are approximately as follows:
2009 | | 2008 | |
$ | 52,700 | | $ | 92,600 | |
| | | | | |
Tax Fees include amounts for the review of annual tax returns, the review of required shareholder distribution calculations and typically include amounts for professional services by the principal accountant for tax compliance, tax advice and tax planning. Fiscal year 2008 also includes tax fees for agreed-upon procedures related to fund mergers and the review of final tax returns and for assistance with foreign tax filings.
During the fiscal years ended August 31, 2009 and August 31, 2008, there were no Tax Fees billed by the registrant’s principal accountant to the registrant’s investment adviser (not including any sub-adviser whose role is primarily portfolio management and is subcontracted with or overseen by another investment adviser) and any entity controlling, controlled by, or under common control with the adviser that provides ongoing services
to the registrant for an engagement that related directly to the operations and financial reporting of the registrant.
(d) All Other Fees. Aggregate All Other Fees billed by the principal accountant to the registrant for professional services rendered during the fiscal years ended August 31, 2009 and August 31, 2008 are approximately as follows:
All Other Fees include amounts for products and services provided by the principal accountant, other than the services reported in paragraphs (a) through (c) above.
Aggregate All Other Fees billed by the registrant’s principal accountant to the registrant’s investment adviser (not including any sub-adviser whose role is primarily portfolio management and is subcontracted with or overseen by another investment adviser) and any entity controlling, controlled by, or under common control with the adviser that provides ongoing services to the registrant for an engagement that related directly to the operations and financial reporting of the registrant during the fiscal years ended August 31, 2009 and August 31, 2008 are approximately as follows:
2009 | | 2008 | |
$ | 829,700 | | $ | 1,001,300 | |
| | | | | |
In both fiscal years 2009 and 2008, All Other Fees consist of fees billed for internal control examinations of the registrant’s transfer agent and investment advisor.
(e)(1) Audit Committee Pre-Approval Policies and Procedures
The registrant’s Audit Committee is required to pre-approve the engagement of the registrant’s independent accountants to provide audit and non-audit services to the registrant and non-audit services to its investment adviser (not including any sub-adviser whose role is primarily portfolio management and is subcontracted with or overseen by another investment adviser) or any entity controlling, controlled by or under common control with such investment adviser that provides ongoing services to the registrant (“Adviser Affiliates”), if the engagement relates directly to the operations and financial reporting of the registrant.
The Audit Committee has adop ted a Policy for Engagement of Independent Accountants for Audit and Non-Audit Services (“Policy”). The Policy sets forth the understanding of the Audit Committee regarding the engagement of the registrant’s independent accountants to provide (i) audit and permissible audit-related, tax and other services to the registrant (collectively “Fund Services”); (ii) non-audit services to the registrant’s investment adviser (not including any sub-adviser whose role is primarily portfolio management and is subcontracted with or overseen by another investment adviser) and Adviser Affiliates, if the engagement relates directly to the operations or
financial reporting of a Fund (collectively “Fund-related Adviser Services”); and (iii) certain other audit and non-audit services to the registrant’s investment adviser (not including any sub-adviser whose role is primarily portfolio management and is subcontracted with or overseen by another investment adviser) and Adviser Affiliates. Unless a type of service receives general pre-approval under the Policy, it requires specific pre-approval by the Audit Committee if it is to be provided by the independent accountants. Pre-approval of non-audit services to the registrant, the registrant’s investment adviser (not including any sub-adviser whose role is primarily portfolio management and is subcontracted with or overseen by another investment adviser) and Adviser Affiliates may be waived provided that the “de minimis” requirements set forth under paragraph (c)(7)(i)(C)&nbs p;of Rule 2-01 of Regulation S-X are met.
Under the Policy, the Audit Committee may delegate pre-approval authority to any pre-designated member or members who are Independent Trustees/Directors. The member(s) to whom such authority is delegated must report, for informational purposes only, any pre-approval decisions to the Audit Committee at its next regular meeting. The Audit Committee’s responsibilities with respect to the pre-approval of services performed by the independent accountants may not be delegated to management.
The Policy requires the Fund Treasurer and/or Director of Board Administration to submit to the Audit Committee, on an annual basis, a schedule of the types of services that are subject to general pre-approval. The schedule(s) provide a description of each type of service that is subject to general pre-approval and, where possible, will provide estimated fee caps for each instance of providing each service. The Audit Committees will review and approve the types of services and review the projected fees for the next fiscal year and may add to, or subtract from, the list of general pre-approved services from time to time based on subsequent determinations. That approval acknowledges that the Audit Committee is in agreement with the specific types of services that the independent accountants will be permitted to perform.
The Fund Treasurer and/or Director of Board Administration shall report to the Audit Committee at each of its regular meetings regarding all Fund Services or Fund-related Adviser Services initiated since the last such report was rendered, including a general description of the services, actual billed and projected fees, and the means by which such Fund Services or Fund-related Adviser Services were pre-approved by the Audit Committee.
*****
(e)(2) The percentage of services described in paragraphs (b) through (d) of this Item approved pursuant to the “de minimis” exception under paragraph (c)(7)(i)(C) of Rule 2-01 of Regulation S-X during both fiscal years ended August 31, 2009 and August 31, 2008 was zero.
(f) Not applicable.
(g) The aggregate non-audit fees billed by the registrant’s accountant for services rendered to the registrant, and rendered to the registrant’s investment adviser (not including any sub-adviser whose role is primarily portfolio management and is subcontracted with or overseen by another investment adviser), and any entity controlling, controlled by, or under common control with the adviser that provides ongoing services to the registrant for the fiscal years ended August 31, 2009 and August 31, 2008 are approximately as follows:
2009 | | 2008 | |
$ | 933,000 | | $ | 1,154,100 | |
| | | | | |
(h) The registrant’s Audit Committee of the Board of Directors has considered whether the provision of non-audit services that were rendered to the registrant’s adviser (not including any sub-adviser whose role is primarily portfolio management and is subcontracted with or overseen by another investment adviser), and any entity controlling, controlled by, or under common control with the investment adviser that provides ongoing services to the registrant that were not pre-approved pursuant to paragraph (c)(7)(ii) of Rule 2-01 of Regulation S-X, is compatible with maintaining the principal accountant’s independence.
Item 5. Audit Committee of Listed Registrants.
Not applicable.
Item 6. Investments
(a) The registrant’s “Schedule I — Investments in securities of unaffiliated issuers” (as set forth in 17 CFR 210.12-12) is included in Item 1 of this Form N-CSR.
(b) Not applicable.
Item 7. Disclosure of Proxy Voting Policies and Procedures for Closed-End Management Investment Companies.
Not applicable.
Item 8. Portfolio Managers of Closed-End Management Investment Companies.
Not applicable.
Item 9. Purchases of Equity Securities by Closed-End Management Investment Company and Affiliated Purchasers.
Not applicable.
Item 10. Submission of Matters to a Vote of Security Holders.
There have not been any material changes to the procedures by which shareholders may recommend nominees to the registrant’s board of directors, since those procedures were last disclosed in response to requirements of Item 407(c)(2)(iv) of Regulation S-K (as required by Item 22(b)(15) of Schedule 14A) or this Item.
Item 11. Controls and Procedures.
(a) The registrant’s principal executive officer and principal financial officers, based on their evaluation of the registrant’s disclosure controls and procedures as of a date within 90 days of the filing of this report, have concluded that such controls and procedures are adequately designed to ensure that information required to be disclosed by the registrant in Form N-CSR is accumulated and communicated to the registrant’s management, including the principal executive officer and principal financial officer, or persons performing similar functions, as appropriate to allow timely decisions regarding required disclosure.
(b) There was no change in the registrant’s internal control over financial reporting that occurred during the registrant’s second fiscal quarter of the period covered by this report that has materially affected, or is reasonably likely to materially affect, the registrant’s internal control over financial reporting.
Item 12. Exhibits.
(a)(1) Code of ethics required to be disclosed under Item 2 of Form N-CSR attached hereto as Exhibit 99.CODE ETH.
(a)(2) Certifications pursuant to Rule 30a-2(a) under the Investment Company Act of 1940 (17 CFR 270.30a-2(a)) attached hereto as Exhibit 99.CERT.
(a)(3) Not applicable.
(b) Certification pursuant to Rule 30a-2(b) under the Investment Company Act of 1940 (17 CFR 270.30a-2(b)) attached hereto as Exhibit 99.906CERT.
SIGNATURES
Pursuant to the requirements of the Securities Exchange Act of 1934 and the Investment Company Act of 1940, the registrant has duly caused this report to be signed on its behalf by the undersigned, thereunto duly authorized.
(registrant) | | Columbia Funds Series Trust I | |
| | |
| | |
By (Signature and Title) | | /s/ J. Kevin Connaughton | |
| J. Kevin Connaughton, President | |
| | |
| | |
Date | | October 23, 2009 | |
| | |
|
Pursuant to the requirements of the Securities Exchange Act of 1934 and the Investment Company Act of 1940, this report has been signed below by the following persons on behalf of the registrant and in the capacities and on the dates indicated. |
|
| | |
By (Signature and Title) | | /s/ J. Kevin Connaughton | |
| J. Kevin Connaughton, President | |
| | |
| | |
Date | | October 23, 2009 | |
| | |
| | |
By (Signature and Title) | | /s/ Michael G. Clarke | |
| Michael G. Clarke, Chief Financial Officer | |
| | |
| | |
Date | | October 23, 2009 | |
| | | | | | |