UNITED STATES
SECURITIES AND EXCHANGE COMMISSION
Washington, D.C. 20549
FORM N-CSR
CERTIFIED SHAREHOLDER REPORT OF REGISTERED
MANAGEMENT INVESTMENT COMPANIES
Investment Company Act file number | 811-04367 |
|
Columbia Funds Series Trust I |
(Exact name of registrant as specified in charter) |
|
One Financial Center, Boston, Massachusetts | | 02111 |
(Address of principal executive offices) | | (Zip code) |
|
James R. Bordewick, Jr., Esq. Columbia Management Advisors, LLC One Financial Center Boston, MA 02111 |
(Name and address of agent for service) |
|
Registrant’s telephone number, including area code: | 1-617-426-3750 | |
|
Date of fiscal year end: | October 31 | |
|
Date of reporting period: | October 31, 2009 | |
| | | | | | | | |
Form N-CSR is to be used by management investment companies to file reports with the Commission not later than 10 days after the transmission to stockholders of any report that is required to be transmitted to stockholders under Rule 30e-1 under the Investment Company Act of 1940 (17 CFR 270.30e-1). The Commission may use the information provided on Form N-CSR in its regulatory, disclosure review, inspection, and policymaking roles.
A registrant is required to disclose the information specified by Form N-CSR, and the Commission will make this information public. A registrant is not required to respond to the collection of information contained in Form N-CSR unless the Form displays a currently valid Office of Management and Budget (“OMB”) control number. Please direct comments concerning the accuracy of the information collection burden estimate and any suggestions for reducing the burden to Secretary, Securities and Exchange Commission, 450 Fifth Street, NW, Washington, DC 20549-0609. The OMB has reviewed this collection of information under the clearance requirements of 44 U.S.C. § 3507.
Item 1. Reports to Stockholders.
Columbia Management®
Annual Report
October 31, 2009
Columbia California Tax-Exempt Fund
| NOT FDIC INSURED | | May Lose Value | |
|
| NOT BANK ISSUED | | No Bank Guarantee | |
|
Table of Contents
| Fund Profile | | | 1 | | |
|
| Economic Update | | | 2 | | |
|
| Performance Information | | | 4 | | |
|
| Understanding Your Expenses | | | 5 | | |
|
| Portfolio Manager's Report | | | 6 | | |
|
| Financial Statements | |
|
| Investment Portfolio | | | 8 | | |
|
Statement of Assets and
Liabilities | | | 18 | | |
|
| Statement of Operations | | | 20 | | |
|
Statement of Changes in
Net Assets | | | 21 | | |
|
| Financial Highlights | | | 23 | | |
|
| Notes to Financial Statements | | | 27 | | |
|
Report of Independent Registered
Public Accounting Firm | | | 35 | | |
|
| Federal Income Tax Information | | | 36 | | |
|
| Fund Governance | | | 37 | | |
|
Board Consideration and
Approval of Advisory
Agreements | | | 41 | | |
|
Summary of Management Fee
Evaluation by Independent
Fee Consultant | | | 44 | | |
|
Important Information About
This Report | | | 49 | | |
|
The views expressed in this report reflect the current views of the respective parties. These views are not guarantees of future performance and involve certain risks, uncertainties and assumptions that are difficult to predict, so actual outcomes and results may differ significantly from the views expressed. These views are subject to change at any time based upon economic, market or other conditions and the respective parties disclaim any responsibility to update such views. These views may not be relied on as investment advice and, because investment decisions for a Columbia Fund are based on numerous factors, may not be relied on as an indication of trading intent on behalf of any particular Columbia Fund. References to specific securities should not be construed as a recommendation or investment advice.
President's Message

Dear Shareholder:
We are pleased to provide this shareholder report detailing your fund's performance, portfolio holdings and financial statements. We hope this information is helpful in monitoring your investments as we work through these challenging economic times. We recognize that you have entrusted us with your money and want you to know that our professional investment teams work to interpret the latest economic and market trends with the goal of optimizing portfolio construction for our clients.
The first half of 2009 was defined by extremes. The multi-year lows we witnessed in the early months gave way to a stunning rally for the U.S. financial markets through November 2009. A global market rebound may be underway, thanks to the massive fiscal and aggressive monetary policies of governments around the world. In the third quarter 2009, the S&P 500 Index1 was up 15.61%. We believe this challenging economic environment makes it even more important to work with professional money managers while continuing to invest for life events like retirement, college planning, home improvements and career changes.
Retirement income planning has become an increasingly significant focus in the lives of millions of Americans. Recent economic conditions make it even more important to manage short-term obligations such as mortgages, monthly bills and credit card debt while also taking the steps necessary to prepare for or maximize retirement benefits. Better nutrition and medical services can result in U.S. citizens living longer, healthier lives. This means the risk of outliving one's assets in retirement is very real without proper planning. Financial security and retirement planning is an ongoing process that requires active management of your savings, investments and risks. We encourage you to review your retirement plan regularly so you'll be better able to meet your retirement needs in the future.
We recognize that economic uncertainty creates great challenges for many investors. Our professional investment teams work diligently to help investors navigate through difficult markets. Thank you for your business and for the opportunity to work together towards your investment goals.
Sincerely,

J. Kevin Connaughton
President, Columbia Funds
On September 29, 2009, Bank of America Corporation entered into an agreement to sell a portion of the asset management business of Columbia Management Group, LLC. Please see Note 4 of the Notes to Financial Statements for additional information.
Past performance is no guarantee of future results.
1The Standard & Poor's (S&P) 500 Index tracks the performance of 500 widely held, large-capitalization U.S. stocks. Indices are not available for investment, are not professionally managed and do not reflect sales charges, fees, brokerage commissions, taxes or other expenses of investing. Securities in the fund may not match those in an index.
Fund Profile – Columbia California Tax-Exempt Fund
Summary
g For the 12-month period that ended October 31, 2009, the fund's Class A shares returned 13.76% without sales charge.
g The fund came out slightly ahead of its benchmark, the Barclays Capital Municipal Bond Index1, but trailed the average return of its peer group, the Lipper California Municipal Debt Funds Classification.2
g An overweight in both longer-maturity and lower-quality bonds helped the fund versus the index. We believe that an underweight in the longest-maturity (25+ years) issues and certain high-yield securities, such as tobacco bonds, detracted from results versus the peer group average.
Portfolio Management
Kimberly A. Campbell has managed the fund since 2009 and has been associated with the advisor or its predecessors since 1995.
1The Barclays Capital Municipal Bond Index is considered representative of the broad market for investment-grade, tax-exempt bonds with a maturity of at least one year. Indices are not available for investment, are not professionally managed and do not reflect sales charges, fees, brokerage commissions, taxes or other expenses of investing. Securities in the fund may not match those in an index.
2Lipper Inc., a widely respected data provider in the industry, calculates an average total return (assuming reinvestment of distributions) for mutual funds with investment objectives similar to those of the fund. Lipper makes no adjustment for the effect of sales loads.
Effective November 3, 2008, the Lehman Brothers indices were renamed the Barclays Capital indices.
Performance data quoted represents past performance and current performance may be lower or higher. Past performance is no guarantee of future results. The investment return and principal value will fluctuate so that shares, when redeemed, may be worth more or less than the original cost. Please visit www.columbiafunds.com for daily and most recent month-end performance updates.
Summary
1-year return as of 10/31/09
| | +13.76% | |
|
| |  | | | Class A shares
(without sales charge) | |
|
| | +13.60% | |
|
| |  | | | Barclays Capital
Municipal Bond Index | |
|
Morningstar Style BoxTM

The Morningstar Style BoxTM reveals a fund's investment strategy. For fixed-income funds, the vertical axis shows the average credit quality of the bonds owned, and the horizontal axis shows interest rate sensitivity as measured by a bond's duration (short, intermediate or long). Information shown is based on the most recent data provided by Morningstar.
1
Economic Update – Columbia California Tax-Exempt Fund
Summary
For the 12-month period that ended October 31, 2009
g After a sharp decline, stock markets rebounded around the world, as measured by the S&P 500 Index and the MSCI EAFE Index.
| S&P Index | | MSCI Index | |
|
 | |  | |
|
g As investors appeared to exhibit more tolerance for risk, the Barclays Capital Aggregate Bond Index delivered solid results. High-yield bonds rebounded strongly, as measured by the JPMorgan Developed BB High Yield Index.
Barclays
Aggregate
Index | | JP Morgan
Index | |
|
 | |  | |
|
After a deep and difficult recession, the U.S. economy appeared to regain its footing midway through the 12-month period that began November 1, 2008 and ended October 31, 2009. Gross domestic product (GDP) turned positive in the third quarter of 2009, rising 2.8%, primarily on the strength of federal government stimulus spending. Now, hopes for a sustained recovery likely depend on a rebound in consumer spending and a shift from cost cuts to revenue gains to keep business profits moving higher.
The housing market showed some signs of improvement. Construction spending declined during most of the period, but turned slightly higher in August and September. New and existing home sales were weak in the first half of the period, but increased in the second half. However, new home sales took a surprise dip late in the period, as did housing starts, as the deadline for a generous first-time homebuyer tax credit neared. An extension of the credit into mid-2010 and an expansion of eligibility requirements, which were recently signed into law, renewed hopes for a sustained rebound in housing.
In the beleaguered labor market, the good news was that there was less bad news. Businesses continued to shed jobs throughout the period, raising the unemployment rate to 10.2% and wiping out all of the jobs gained since the last recession. However, the pace of job losses slowed markedly by the period's end, from 533,000 jobs lost in November 2008 to 190,000 jobs lost in October 2009. Yet, prospects appear dim for a quick recovery in the labor markets. In fact, consumer confidence, as measured monthly by the Conference Board, an independent research organization, took a dive in August and September. Consumers surveyed cited worsening business conditions and a bleaker outlook for the labor markets.
Manufacturing activity slowed through the first half of the period, but a key measure—the Institute for Supply Management's Index—rose above 50 in July and remained there for the remainder of the period. Any number above 50 indicates that manufacturing activity is expanding. However, several other key manufacturing indicators soured in October. Industrial production declined and manufacturing capacity utilization stalled after several months of modest improvement.
Consumer spending registered both ups and downs during the 12-month period, and the trend at the end of the period was hard to read because of the impact of the federal Cash for Clunkers program, which boosted auto sales. Spending rose sharply in August, then fell in September. New rigorous lending standards severely limited access to credit for business and consumers alike, and further hampered economic growth. In December 2008, the Federal Reserve Board (the Fed) lowered a key short-term borrowing rate—the federal funds rate—to between zero and 0.25%—a record low. In light of continued uncertainty about the economy, the Fed made no further change to the federal funds rate during the period.
Bonds outperformed domestic stocks
As investors sought refuge from a volatile stock market, the highest-quality sectors of the U.S. bond market delivered solid gains during the first half of the period, Treasury prices rose and yields declined sharply as the economy faltered and stock market volatility increased. As hopes for a recovery materialized, Treasuries lagged riskier segments of the bond market. The benchmark 10-year U.S. Treasury yield began the period at just under 4.0%, declined to 2.2% in December 2008, then rose to end the
2
Economic Update (continued) – Columbia California Tax-Exempt Fund
period at 3.4%. In this environment, the Barclays Capital Aggregate Bond Index1 returned 13.79%. Municipal bonds delivered returns that were in line with taxable investment-grade bonds even without factoring in potential tax advantages to investors in higher income tax brackets. The Barclays Capital Municipal Bond Index2 returned 13.60%. High-yield bond prices fell sharply in 2008 as economic prospects weakened and default fears rose, then rebounded strongly in 2009. For the 12-month period, the JPMorgan Developed BB High Yield Index3 returned 36.47%.
Stocks retreated, then rebounded
Against a strengthening economic backdrop, the U.S. stock market returned 9.80% for the 12-month period, as measured by the S&P 500 Index.4 Mid-cap stocks outperformed large and small-cap stocks and growth outperformed value by a solid margin, as measured by their respective Russell indices.5 Outside the U.S., stock market returns were even stronger. The MSCI EAFE Index,6 a broad gauge of stock market performance in foreign developed markets, gained 27.71% (in U.S. dollars) for the period. Emerging stock markets were caught in last year's downdraft, but they bounced back stronger than domestic or developed world markets in 2009 as economic growth generally outpaced the developed world. The MSCI Emerging Markets Index7 returned 64.13% (in U.S. dollars), led by strong gains from China, India, Indonesia, Colombia and Brazil.
Past performance is no guarantee of future results.
1The Barclays Capital Aggregate Bond Index is a market value-weighted index that tracks the daily price, coupon, pay-downs, and total return performance of fixed-rate, publicly placed, dollar-denominated, and non-convertible investment grade debt issues with at least $250 million par amount outstanding and with at least one year to final maturity.
2The Barclays Capital Municipal Bond Index is considered representative of the broad market for investment grade, tax-exempt bonds with a maturity of at least one year.
3The JPMorgan Developed BB High Yield Index is an unmanaged index designed to mirror the investable universe of the U.S. dollar developed, BB-rated, high yield corporate debt market.
4The Standard & Poor's (S&P) 500 Index tracks the performance of 500 widely held, large-capitalization U.S. stocks.
5The Russell 1000 Index tracks the performance of 1,000 of the largest U.S. companies, based on market capitalization. The Russell MidCap Index measures the performance of the 800 smallest companies in the Russell 1000 Index, which represents approximately 25% of the total market capitalization of the Russell 1000 Index. The Russell 2000 Index measures the performance of the 2,000 smallest companies in the Russell 3000 Index, which represents approximately 8% of the total market capitalization of the Russell 3000 Index. The Russell 3000 Growth Index measures the performance of those Russell 3000 Index companies with higher price-to-book ratios and higher forecasted growth values. The stocks in this index are also members of either the Russell 1000 Growth or the Russell 2000 Growth indexes. The Russell 3000 Value Index measures the performance of those Russell 3000 Index companies with lower price-to-book ratios and lo wer forecasted growth values. The stocks in this index are also members of either the Russell 1000 Value or the Russell 2000 Value indexes.
6The Morgan Stanley Capital International Europe, Australasia, Far East (MSCI EAFE) Index is a capitalization-weighted index that tracks the total return of common stocks in 21 developed-market countries within Europe, Australasia and the Far East.
7The Morgan Stanley Capital International Emerging Markets Index (MSCI EMI) is a free float-adjusted market capitalization index that is designed to measure equity market performance in the global emerging markets. As of June 2006, the MSCI Emerging Markets Index consisted of the following 25 emerging market country indices: Argentina, Brazil, Chile, China, Colombia, Czech Republic, Egypt, Hungary, India, Indonesia, Israel, Jordan, Korea, Malaysia, Mexico, Morocco, Pakistan, Peru, Philippines, Poland, Russia, South Africa, Taiwan, Thailand and Turkey.
Indices are not available for investment, are not professionally managed and do not reflect sales charges, fees, brokerage commissions, taxes or other expenses of investing. Securities in the fund may not match those in an index.
Effective November 3, 2008, the Lehman Brothers indices were renamed the Barclays Capital indices.
3
Performance Information – Columbia California Tax-Exempt Fund
Performance data quoted represents past performance and current performance may be lower or higher. Past performance is no guarantee of future results. The investment return and principal value will fluctuate so that shares, when redeemed, may be worth more or less than the original cost. Please visit www.columbiafunds.com for daily and most recent month-end performance updates.
Annual operating expense ratio (%)*
| Class A | | | 0.86 | | |
| Class B | | | 1.61 | | |
| Class C | | | 1.61 | | |
| Class Z | | | 0.62 | | |
*The annual operating expense ratio is as stated in the fund's prospectus that is current as of the date of this report and includes the expenses incurred by the investment companies in which the fund invests. Differences in expense ratios disclosed elsewhere in this report may result from including expenses incurred by the investment companies, fee waivers and expense reimbursements as well as different time periods used in calculating the ratios.
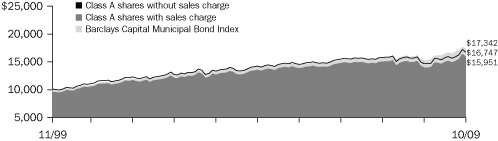
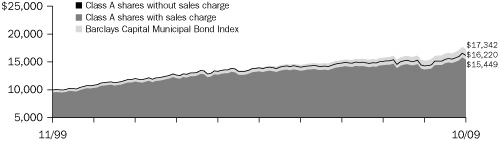
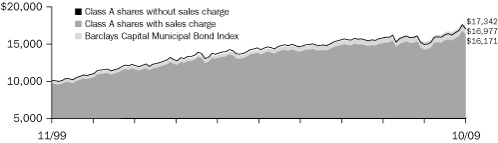
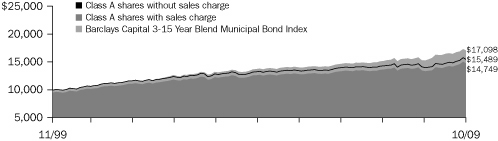
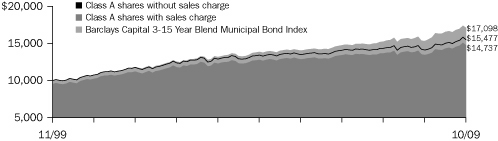
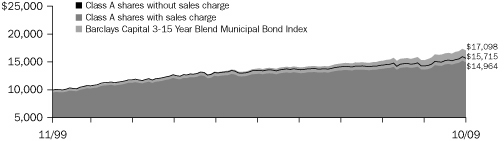
Performance of a $10,000 investment 11/01/99 – 10/31/09
The chart above shows the change in value of a hypothetical $10,000 investment in Class A shares of Columbia California Tax-Exempt Fund during the stated time period, and does not reflect the deduction of taxes that a shareholder may pay on fund distributions or on the redemption of fund shares.
Performance of a $10,000 investment 11/01/99 – 10/31/09 ($)
| Sales charge | | without | | with | |
| Class A | | | 16,747 | | | | 15,951 | | |
| Class B | | | 15,547 | | | | 15,547 | | |
| Class C | | | 16,013 | | | | 16,013 | | |
| Class Z | | | 16,910 | | | | n/a | | |
Average annual total return as of 10/31/09 (%)
| Share class | | A | | B | | C | | Z | |
| Inception | | 06/16/86 | | 08/04/92 | | 08/01/97 | | 09/19/05 | |
| Sales charge | | without | | with | | without | | with | | without | | with | | without | |
| 1-year | | | 13.76 | | | | 8.35 | | | | 12.92 | | | | 7.92 | | | | 13.25 | | | | 12.25 | | | | 14.03 | | |
| 5-year | | | 3.28 | | | | 2.28 | | | | 2.51 | | | | 2.17 | | | | 2.81 | | | | 2.81 | | | | 3.48 | | |
| 10-year | | | 5.29 | | | | 4.78 | | | | 4.51 | | | | 4.51 | | | | 4.82 | | | | 4.82 | | | | 5.39 | | |
Average annual total return as of 09/30/09 (%)
| Share class | | A | | B | | C | | Z | |
| Sales charge | | without | | with | | without | | with | | without | | with | | without | |
| 1-year | | | 15.08 | | | | 9.61 | | | | 14.23 | | | | 9.23 | | | | 14.56 | | | | 13.56 | | | | 15.35 | | |
| 5-year | | | 4.19 | | | | 3.18 | | | | 3.42 | | | | 3.07 | | | | 3.72 | | | | 3.72 | | | | 4.39 | | |
| 10-year | | | 5.46 | | | | 4.95 | | | | 4.68 | | | | 4.68 | | | | 4.99 | | | | 4.99 | | | | 5.56 | | |
The "with sales charge" returns include the maximum initial sales charge of 4.75% for Class A shares and the applicable contingent deferred sales charge of 5.00% in the first year, declining to 1.00% in the sixth year and eliminated thereafter for Class B shares and 1.00% for Class C shares for the first year only. The "without sales charge" returns do not include the effect of sales charges. If they had, returns would be lower.
Performance results reflect any fee waivers or reimbursements of fund expenses by the investment advisor and/or any of its affiliates. Absent these fee waivers or expense reimbursement arrangements, performance results would have been lower.
All results shown assume reinvestment of distributions. Class Z shares are sold at net asset value with no distribution and service (Rule 12b-1) fees. Class Z shares have limited eligibility and the investment minimum requirements may vary. Please see the fund's prospectus for details. Performance for different share classes will vary based on differences in sales charges and fees associated with each class.
The tables do not reflect the deduction of taxes that a shareholder may pay on fund distributions or on the redemption of fund shares.
The returns shown for the fund's Class Z shares include the returns of the fund's Class A shares for periods prior to September 19, 2005, the date on which the fund's Class Z shares were first offered. The returns shown have been adjusted to reflect the fact that Class Z shares are sold without sales charges. The returns shown have not been adjusted to reflect any differences in expenses such as distribution and service (Rule 12b-1) fees between Class Z and Class A shares of the fund. If differences in expenses had been reflected, the returns shown for Class Z shares for periods prior to September 19, 2005 would have been higher.
4
Understanding Your Expenses – Columbia California Tax-Exempt Fund
Estimating your actual expenses
To estimate the expenses that you paid over the period, first you will need your account balance at the end of the period:
g For shareholders who receive their account statements from Columbia Management Services, Inc., your account balance is available online at www.columbiafunds.com or by calling Shareholder Services at 800.345.6611.
g For shareholders who receive their account statements from their financial intermediary, contact your financial intermediary to obtain your account balance.
1. Divide your ending account balance by $1,000. For example, if an account balance was $8,600 at the end of the period, the result would be 8.6.
2. In the section of the table below titled "Expenses paid during the period," locate the amount for your share class. You will find this number in the column labeled "Actual." Multiply this number by the result from step 1. Your answer is an estimate of the expenses you paid on your account during the period.
If the value of your account falls below the minimum initial investment requirement applicable to you, your account generally will be subject to a $20 annual fee. This fee is not included in the accompanying table. If you are subject to the fee, keep it in mind when you are estimating the ongoing expenses of investing in the fund and when comparing the expenses of this fund with other funds.
As a fund shareholder, you incur two types of costs. There are transaction costs, which generally include sales charges on purchases and may include redemption fees or exchange fees. There are also ongoing costs, which generally include investment advisory fees, distribution and service (Rule 12b-1) fees and other fund expenses. The information on this page is intended to help you understand the ongoing costs of investing in the fund and to compare these costs with the ongoing costs of investing in other mutual funds.
Analyzing your fund's expenses by share class
To illustrate these ongoing costs, we have provided an example and calculated the expenses paid by investors in each share class during the period. The information in the following table is based on an initial investment of $1,000, which is invested at the beginning of the period and held for the entire period. Expense information is calculated two ways and each method provides you with different information. The amount listed in the "Actual" column is calculated using the fund's actual operating expenses and total return for the period. The amount listed in the "Hypothetical" column for each share class assumes that the return each year is 5% before expenses and is calculated based on the fund's actual operating expenses. You should not use the hypothetical account values and expenses to estimate either your actual account balance at the end of the period or the expenses you paid during this period.
Compare with other funds
Since all mutual funds are required to include the same hypothetical calculations about expenses in shareholder reports, you can use this information to compare the ongoing costs of investing in the fund with other funds. To do so, compare the 5% hypothetical example with the 5% hypothetical examples that appear in the shareholder reports of other funds. As you compare hypothetical examples of other funds, it is important to note that hypothetical examples are meant to highlight the ongoing costs of investing in a fund and do not reflect any transaction costs, such as sales charges, redemption fees or exchange fees.
05/01/09 – 10/31/09
| | | Account value at the
beginning of the period ($) | | Account value at the
end of the period ($) | | Expenses paid
during the period ($) | | Fund's annualized
expense ratio (%) | |
| | | Actual | | Hypothetical | | Actual | | Hypothetical | | Actual | | Hypothetical | | Actual | |
| Class A | | | 1,000.00 | | | | 1,000.00 | | | | 1,058.00 | | | | 1,020.97 | | | | 4.36 | | | | 4.28 | | | | 0.84 | | |
| Class B | | | 1,000.00 | | | | 1,000.00 | | | | 1,054.00 | | | | 1,017.19 | | | | 8.23 | | | | 8.08 | | | | 1.59 | | |
| Class C | | | 1,000.00 | | | | 1,000.00 | | | | 1,055.60 | | | | 1,018.70 | | | | 6.68 | | | | 6.56 | | | | 1.29 | | |
| Class Z | | | 1,000.00 | | | | 1,000.00 | | | | 1,059.20 | | | | 1,022.18 | | | | 3.11 | | | | 3.06 | | | | 0.60 | | |
Expenses paid during the period are equal to the annualized expense ratio for the share class, multiplied by the average account value over the period, then multiplied by the number of days in the fund's most recent fiscal half-year and divided by 365.
Had the investment advisor and/or any of its affiliates not waived fees or reimbursed a portion of expenses, account value at the end of the period would have been reduced.
It is important to note that the expense amounts shown in the table are meant to highlight only ongoing costs of investing in the fund and do not reflect any transaction costs, such as sales charges, redemption fees or exchange fees. Therefore, the hypothetical examples provided may not help you determine the relative total costs of owning shares of different funds. If these transaction costs were included, your costs would have been higher.
5
Portfolio Manager's Report – Columbia California Tax-Exempt Fund
For the 12-month period that ended October 31, 2009, the fund's Class A shares returned 13.76% without sales charge, compared to 13.60% for the Barclays Capital Municipal Bond Index. Over the same period, the fund fell shy of the average return of its peer group, the Lipper California Municipal Debt Funds Category, which was 13.85%. An overweight in 10- to 20-year bonds, good security selection among 25- to 30-year issues and an underweight in bonds with one- to five-year maturities aided results versus the index. An overweight in lower-quality, BBB-rated bonds, as well as good security selection among AA- and AAA-rated bonds and in the hospital sector, were also helpful. An underweight in state general obligation (GO) bonds, which rallied after the legislature passed a new budget in July 2009, hampered returns versus the index. We believe the fund lagged the average fund in its peer group because it had less exposure to bonds w ith maturities of 25 years or more and less exposure to some high-yield sectors, such as tobacco, both of which were strong performers.
Strongest returns from longer-maturity and lower-quality issues
During the first half of the period, the economy slowed dramatically, unemployment rose, housing prices weakened and stock prices plunged. Municipal bonds faced added pressure as institutional investors sold longer-maturity, high-grade issues, causing yields to rise and bond prices to fall. By late 2008, yields on 10-year high-grade municipal issues had reached roughly 140% of yields on comparable maturity treasury notes. This yield advantage attracted the attention of individual investors, who remained strong buyers for the rest of the period. New municipal issuance, however, remained light, as liquidity dried up and municipal bond insurers suffered credit-rating downgrades that increased the cost for issuers coming to market.
The economic outlook improved in the spring of 2009, thanks to government stimulus measures and low short-term interest rates. Bond investors began taking on added risk to obtain more yield, boosting returns on long-term bonds, especially those with maturities of 20 years or more, as well as lower-quality issues, both of which posted strong returns for the year. New issuance of longer-term municipal bonds remained limited due, in part, to the introduction of Build America bonds, which allow municipalities to sell taxable issues and collect a 35% subsidy from the federal government to help offset the cost increase relative to tax-exempt issues.
Shift toward longer maturities and more yield
Throughout the year, the fund favored intermediate- and longer-maturity securities. As long-term yields rose, we added to our stake in bonds with maturities of 20 years or more, and sold issues with maturities of 10 years or less. In terms of credit quality, we remained focused on medium- to high-quality issues, with roughly 80% of the fund's assets invested in bonds rated A or higher. Our AAA stake, however, declined, as insurer downgrades affected the underlying credit quality of some of the fund's highest-quality issues. Later in the period, we began adding yield by selectively buying some lower-quality issues. At period end, about 12% of the fund's assets were invested in BBB-rated bonds and another 9% in non-rated issues.
Performance data quoted represents past performance and current performance may be lower or higher. Past performance is no guarantee of future results. The investment return and principal value will fluctuate so that shares, when redeemed, may be worth more or less than the original cost. Please visit www.columbiafunds.com for daily and most recent month-end performance updates.
Net asset value per share
as of 10/31/09 ($)
| Class A | | | 7.30 | | |
| Class B | | | 7.30 | | |
| Class C | | | 7.30 | | |
| Class Z | | | 7.30 | | |
Distributions declared per share
11/01/08 – 10/31/09 ($)
| Class A | | | 0.31 | | |
| Class B | | | 0.26 | | |
| Class C | | | 0.28 | | |
| Class Z | | | 0.33 | | |
A portion of the fund's income may be subject to the alternative minimum tax. The fund may at times purchase tax-exempt securities at a discount. Some, or all, of this discount may be included in the fund's ordinary income, and is taxable when distributed. Distributions include $0.01 per share of taxable realized gains.
30-day SEC yields
as of 10/31/09 (%)
| Class A | | | 3.64 | | |
| Class B | | | 3.05 | | |
| Class C | | | 3.36 | | |
| Class Z | | | 4.07 | | |
The 30-day SEC yields reflect the fund's earning power, net of expenses, expressed as an annualized percentage of the public offering price per share at the end of the period.
Taxable-equivalent SEC yields
as of 10/31/09 (%)
| Class A | | | 6.26 | | |
| Class B | | | 5.24 | | |
| Class C | | | 5.79 | | |
| Class Z | | | 7.00 | | |
Taxable-equivalent SEC yields are calculated assuming a federal tax rate of 35.0% and a California state income tax rate of 10.55%. These tax rates do not reflect the phase out of exemptions or the reduction of the otherwise allowable deductions that occur when adjusted gross income exceeds certain levels. Your taxable-equivalent yield may be different depending on your tax bracket.
6
Portfolio Manager's Report (continued) – Columbia California Tax-Exempt Fund
Top 5 sectors
as of 10/31/09 (%)
| Refunded/Escrowed | | | 14.7 | | |
| Local General Obligations | | | 12.5 | | |
| Special Property Tax | | | 11.0 | | |
| Water/Sewer | | | 9.9 | | |
| Local Appropriated | | | 8.5 | | |
Quality breakdown
as of 10/31/09 (%)
| AAA | | | 21.4 | | |
| AA | | | 24.5 | | |
| A | | | 33.4 | | |
| BBB | | | 11.7 | | |
| BB | | | 0.3 | | |
| Non-rated | | | 8.7 | | |
Maturity breakdown
as of 10/31/09 (%)
| 0-1 year | | | 0.1 | | |
| 1-3 years | | | 1.1 | | |
| 3-5 years | | | 8.5 | | |
| 5-7 years | | | 4.1 | | |
| 7-10 years | | | 14.0 | | |
| 10-15 years | | | 23.1 | | |
| 15-20 years | | | 13.1 | | |
| 20-25 years | | | 12.2 | | |
| 25 years and over | | | 21.5 | | |
| Cash & Equivalents | | | 2.3 | | |
Ratings shown in the quality breakdown represent the rating assigned to a particular bond by one of the following nationally-recognized rating agencies: Standard and Poor's, Moody's Investors Service, Inc. or Fitch Ratings Ltd. Ratings are relative and subjective and are not absolute standards of quality. The fund's credit quality does not remove market risk.
The fund is actively managed and the composition of its portfolio will change over time. Information provided is calculated as a percentage of net assets.
Challenges facing California's economy
California has not had an easy road. Tax revenues have been hurt by weakness in the consumer, technology and construction sectors. Personal income tax receipts have decreased as unemployment climbed above the national average, and a declining stock market has had a particularly negative impact on tax revenues from the state's wealthiest taxpayers. A fragile housing market has caused added stress. Amidst these problems, the state's credit rating was downgraded from A1/A+ to BAA1/A. Although the outlook for near-term economic growth remains challenging, we expect the state to benefit longer term from a diverse economic base. We are also encouraged that the legislature and governor were able to reach an agreement to eliminate the budget deficit for fiscal year 2010 and have commissioned studies to address shortcomings in the state's tax structure.
Portfolio holdings and characteristics are subject to change periodically and may not be representative of current holdings and characteristics. The outlook for the fund may differ from those presented for other Columbia Funds.
Tax-exempt investing offers current tax-exempt income, but it also involves certain risks. The value of the fund will be affected by interest rate changes and the creditworthiness of issues held in the fund. When interest rates go up, bond prices generally drop and vice versa.
Interest income from certain tax-exempt bonds may be subject to certain state and local taxes and, if applicable, the alternative minimum tax. Capital gains are not exempt from income taxes.
Single-state municipal bond funds pose additional risks, due to limited geographical diversification.
7
Investment Portfolio – Columbia California Tax-Exempt Fund
October 31, 2009
| Municipal Bonds – 96.6% | |
| | | Par ($) | | Value ($) | |
| Education – 6.9% | |
| Education – 6.5% | |
| CA Educational Facilities Authority | |
| California College of Arts, | |
Series 2005:
5.000% 06/01/26 | | | 1,000,000 | | | | 853,580 | | |
| 5.000% 06/01/35 | | | 1,500,000 | | | | 1,195,980 | | |
| California Lutheran University, | |
Series 2008,
5.750% 10/01/38 | | | 3,000,000 | | | | 2,978,910 | | |
| Loyola Marymount University, | |
Series 2001,
Insured: NPFGC
(a) 10/01/15 | | | 1,265,000 | | | | 994,379 | | |
| University of Redlands, | |
Series 2008 A,
5.125% 08/01/38 | | | 1,750,000 | | | | 1,643,600 | | |
| University of Southern California: | |
Series 2007 A,
4.500% 10/01/33 | | | 4,500,000 | | | | 4,276,485 | | |
Series 2009,
5.000% 10/01/39 | | | 1,425,000 | | | | 1,465,213 | | |
| Woodbury University, | |
Series 2006,
5.000% 01/01/25 | | | 1,830,000 | | | | 1,545,636 | | |
| CA Statewide Communities Development Authority | |
| San Francisco Art Institute, | |
Series 2002,
7.375% 04/01/32 | | | 1,750,000 | | | | 1,396,465 | | |
| CA University | |
| Series 2007, | |
Insured: FSA
4.500% 05/15/35 | | | 4,000,000 | | | | 3,790,520 | | |
| Series 2009 A, | |
| 6.000% 11/01/40 | | | 2,000,000 | | | | 2,138,260 | | |
| Series 2009 O, | |
| 5.250% 05/15/39 | | | 4,000,000 | | | | 4,202,040 | | |
| Education Total | | | 26,481,068 | | |
| Prep School – 0.4% | |
| CA Statewide Communities Development Authority | |
| Crossroads School for Arts & Sciences, | |
Series 1998,
6.000% 08/01/28 (b) | | | 1,645,000 | | | | 1,541,184 | | |
| Prep School Total | | | 1,541,184 | | |
| Education Total | | | 28,022,252 | | |
| | | Par ($) | | Value ($) | |
| Health Care – 8.3% | |
| Hospitals – 8.3% | |
| CA Health Facilities Financing Authority | |
| Catholic Healthcare West: | |
Series 2004 I,
4.950% 07/01/26
(07/01/14) (c)(d) | | | 1,000,000 | | | | 1,052,670 | | |
Series 2009 A,
6.000% 07/01/39 | | | 1,000,000 | | | | 1,045,410 | | |
| Cedars-Sinai Medical Center, | |
Series 2005:
5.000% 11/15/27 | | | 1,500,000 | | | | 1,500,735 | | |
| 5.000% 11/15/34 | | | 2,500,000 | | | | 2,350,450 | | |
| Kaiser Permanante, | |
Series 2006,
5.250% 04/01/39 | | | 2,000,000 | | | | 1,899,520 | | |
| Series 2009 E, | |
| 5.625% 07/01/25 (e) | | | 1,125,000 | | | | 1,159,132 | | |
| Sutter Health, | |
| Series 2042 A, | |
| 5.000% 11/15/42 | | | 3,000,000 | | | | 2,755,560 | | |
| CA Infrastructure & Economic Development Bank | |
| Kaiser Assistance Corp., | |
Series 2001 A,
5.550% 08/01/31 | | | 2,500,000 | | | | 2,512,350 | | |
| CA Kaweah Delta Health Care District | |
| Series 2006, | |
| 4.500% 06/01/34 | | | 3,500,000 | | | | 2,883,895 | | |
| CA Loma Linda Hospital | |
| Loma Linda, University Medical Center, | |
Series 2005,
5.000% 12/01/22 | | | 6,155,000 | | | | 5,550,333 | | |
| CA Municipal Finance Authority | |
| Community Hospital Center, | |
Series 2007,
5.250% 02/01/37 | | | 2,500,000 | | | | 2,243,500 | | |
| CA Rancho Mirage Joint Powers Financing Authority | |
| Eisenhower Medical Center, | |
Series 2007 A,
5.000% 07/01/47 | | | 2,500,000 | | | | 2,237,875 | | |
| CA Sierra View Local Health Care District | |
| Series 2007, | |
| 5.250% 07/01/37 | | | 1,500,000 | | | | 1,350,750 | | |
See Accompanying Notes to Financial Statements.
8
Columbia California Tax-Exempt Fund
October 31, 2009
| Municipal Bonds (continued) | |
| | | Par ($) | | Value ($) | |
| CA Statewide Communities Development Authority | |
| Kaiser Permanente, | |
Series 2007 A,
4.750% 04/01/33 | | | 2,000,000 | | | | 1,801,300 | | |
| CA Turlock Health Facility | |
| Emanuel Medical Center, Inc.: | |
Series 2004,
5.000% 10/15/13 | | | 940,000 | | | | 945,537 | | |
Series 2007 A,
5.000% 10/15/22 | | | 2,780,000 | | | | 2,465,304 | | |
| Hospitals Total | | | 33,754,321 | | |
| Health Care Total | | | 33,754,321 | | |
| Housing – 1.1% | |
| Multi-Family – 0.4% | |
| CA Statewide Communities Development Authority | |
| Oracle Communities Corp., | |
Series 2002 E-1,
5.375% 07/01/32 | | | 2,000,000 | | | | 1,581,760 | | |
| Multi-Family Total | | | 1,581,760 | | |
| Single-Family – 0.7% | |
| CA Housing Finance Agency | |
| Series 1997 B-3 Class I, AMT, | |
Insured: FHA
5.400% 08/01/28 | | | 450,000 | | | | 450,238 | | |
| Series 2006 K, AMT, | |
| 4.625% 08/01/26 | | | 2,500,000 | | | | 2,168,300 | | |
| CA Rural Home Mortgage Finance Authority | |
| Series 1997 A-2, AMT, | |
Guarantor: GNMA
7.000% 09/01/29 | | | 30,000 | | | | 30,437 | | |
| Series 1998 B-5, AMT, | |
Guarantor: FNMA
6.350% 12/01/29 | | | 50,000 | | | | 52,892 | | |
| Series 2000 B, AMT, | |
Guarantor: FNMA
7.300% 06/01/31 | | | 40,000 | | | | 41,081 | | |
| Series 2000 D, AMT, | |
Guarantor: GNMA
7.100% 06/01/31 | | | 35,000 | | | | 35,858 | | |
| Single-Family Total | | | 2,778,806 | | |
| Housing Total | | | 4,360,566 | | |
| | | Par ($) | | Value ($) | |
| Industrials – 1.0% | |
| Oil & Gas – 1.0% | |
| CA M-S-R Energy Authority | |
| Series 2009, | |
| 7.000% 11/01/34 | | | 1,000,000 | | | | 1,123,040 | | |
| CA Southern California Public Power Authority | |
| Series 2007, | |
| 5.000% 11/01/33 | | | 3,385,000 | | | | 3,110,273 | | |
| Oil & Gas Total | | | 4,233,313 | | |
| Industrials Total | | | 4,233,313 | | |
| Other – 16.9% | |
| Other – 0.8% | |
| CA Infrastructure & Economic Development Bank | |
| Walt Disney Family Museum, | |
Series 2008,
5.250% 02/01/38 | | | 3,050,000 | | | | 3,005,562 | | |
| Other Total | | | 3,005,562 | | |
| Refunded/Escrowed (f) – 14.7% | |
| CA Central Unified School District | |
| Series 1993, | |
Escrowed to Maturity,
Insured: AMBAC
(a) 03/01/18 | | | 20,065,000 | | | | 14,954,043 | | |
| CA East Whittier City School District | |
| Series 1997 A, | |
Escrowed to Maturity,
Insured: FGIC
5.750% 08/01/17 | | | 1,675,000 | | | | 1,915,932 | | |
| CA Educational Facilities Authority | |
| Series 1999 B, | |
Pre-refunded 04/01/09,
5.250% 04/01/24 | | | 70,000 | | | | 71,592 | | |
| Series 2000 B, | |
Pre-refunded 06/01/10,
6.625% 06/01/20 | | | 170,000 | | | | 177,665 | | |
| CA Health Facilities Financing Authority | |
| Kaiser Permanente, | |
Series 1998 A,
Escrowed to Maturity,
Insured: FSA
5.000% 06/01/24 | | | 3,000,000 | | | | 3,039,720 | | |
See Accompanying Notes to Financial Statements.
9
Columbia California Tax-Exempt Fund
October 31, 2009
| Municipal Bonds (continued) | |
| | | Par ($) | | Value ($) | |
CA Infrastructure & Economic Development
Bank Revenue | |
| Series 2003 A, | |
Pre-refunded 07/01/26,
Insured: AMBAC
5.125% 07/01/37 | | | 4,275,000 | | | | 5,062,925 | | |
| CA Inland Empire Solid Waste Financing Authority | |
| Series 1996 B, AMT, | |
Escrowed to Maturity,
Insured: FSA
6.250% 08/01/11 | | | 875,000 | | | | 918,514 | | |
| CA Metropolitan Water District of Southern California | |
| Series 1993 A, | |
Escrowed to Maturity,
5.750% 07/01/21 | | | 2,865,000 | | | | 3,376,947 | | |
| CA Morgan Hill Unified School District | |
| Series 2002, | |
Escrowed to Maturity,
Insured: FGIC
(a) 08/01/21 | | | 2,010,000 | | | | 1,252,532 | | |
| CA Pleasanton-Suisun City Home Financing Authority | |
| Series 1984 A, | |
Escrowed to Maturity,
Insured: NPFGC
(a) 10/01/16 | | | 5,270,000 | | | | 4,242,772 | | |
| CA Pomona | |
| Single Family Mortgage Revenue, | |
Series 1990 B,
Escrowed to Maturity,
Guarantor: GNMA
7.500% 08/01/23 | | | 1,000,000 | | | | 1,309,000 | | |
| CA Redding Electric Systems Revenue | |
| Series 1992 A, IFRN, | |
Escrowed to Maturity,
Insured: NPFGC
11.245% 07/01/22
(11/17/09) (c)(d) | | | 510,000 | | | | 670,211 | | |
| CA Riverside County | |
| Series 1989 A, AMT, | |
Escrowed to Maturity,
Guarantor: GNMA
7.800% 05/01/21 | | | 2,500,000 | | | | 3,469,175 | | |
| CA San Joaquin Hills Transportation Corridor Agency | |
| Series 1993, | |
Escrowed to Maturity,
(a) 01/01/20 | | | 15,400,000 | | | | 10,470,460 | | |
| | | Par ($) | | Value ($) | |
| CA San Jose Redevelopment Agency | |
| Series 1993, | |
Escrowed to Maturity,
Insured: NPFGC | |
| 6.000% 08/01/15 | | | 1,405,000 | | | | 1,690,791 | | |
| CA Southern California Public Power Authority | |
| Series 2003 A-1, | |
Pre-refunded 07/01/13,
Insured: AMBAC
5.000% 07/01/25 | | | 1,000,000 | | | | 1,130,610 | | |
| CA State Department of Water Resources | |
| Series 2001, | |
Escrowed to Maturity,
Insured: FSA
5.500% 12/01/14 | | | 10,000 | | | | 11,776 | | |
| CA State | |
| Series 2000: | |
Pre-refunded 05/01/10,
5.625% 05/01/26 | | | 60,000 | | | | 62,186 | | |
Pre-refunded 09/01/10,
Insured: FGIC
5.250% 09/01/30 | | | 155,000 | | | | 161,242 | | |
| Series 2004, | |
Pre-refunded 02/01/14,
5.000% 02/01/33 | | | 1,000,000 | | | | 1,133,620 | | |
| CA Whisman School District | |
| Series 1996 A, | |
Escrowed to Maturity,
Insured: FGIC
(a) 08/01/16 | | | 1,645,000 | | | | 1,335,016 | | |
PR Commonwealth of Puerto Rico
Electric Power Authority | |
| Series 1989 O, | |
Pre-refunded variable dates
beginning 07/01/15,
(a) 07/01/17 | | | 2,490,000 | | | | 1,853,631 | | |
PR Commonwealth of Puerto Rico
Infrastructure Financing Authority | |
| Series 2000 A, | |
Economically Defeased to Maturity,
5.500% 10/01/32 | | | 1,500,000 | | | | 1,586,520 | | |
| Refunded/Escrowed Total | | | 59,896,880 | | |
| Tobacco – 1.4% | |
| CA Golden State Tobacco Securitization Corp. | |
| Series 2007 A-1, | |
| 5.000% 06/01/33 | | | 7,500,000 | | | | 5,695,200 | | |
| Tobacco Total | | | 5,695,200 | | |
| Other Total | | | 68,597,642 | | |
See Accompanying Notes to Financial Statements.
10
Columbia California Tax-Exempt Fund
October 31, 2009
| Municipal Bonds (continued) | |
| | | Par ($) | | Value ($) | |
| Resource Recovery – 1.0% | |
| Disposal – 1.0% | |
| CA Pollution Control Financing Authority | |
| Waste Management, | |
Series 2002 A, AMT,
5.000% 01/01/22 | | | 2,000,000 | | | | 1,908,560 | | |
| CA Statewide Communities Development Authority | |
| Series 2003 A, AMT, | |
| 4.950% 12/01/12 | | | 2,000,000 | | | | 2,079,680 | | |
| Disposal Total | | | 3,988,240 | | |
| Resource Recovery Total | | | 3,988,240 | | |
| Tax-Backed – 40.4% | |
| Local Appropriated – 8.5% | |
| CA Alameda County | |
| Series 1989, | |
Insured: NPFGC
(a) 06/15/14 | | | 2,185,000 | | | | 1,847,243 | | |
| CA Anaheim Public Financing Authority | |
| Series 1997 C, | |
Insured: FSA
6.000% 09/01/14 | | | 3,500,000 | | | | 4,017,965 | | |
| Series 2007 A-1, | |
Insured: FGIC
4.250% 09/01/35 | | | 3,500,000 | | | | 2,928,870 | | |
| CA Antelope Valley East-Kern Water Agency | |
| Certificates of Participation, | |
Series 2007 A-1,
Insured: FGIC
4.375% 06/01/37 | | | 2,500,000 | | | | 2,177,075 | | |
| CA Bodega Bay Fire Protection District | |
| Certificates of Participation, | |
Series 1996,
6.450% 10/01/31 | | | 1,185,000 | | | | 1,056,700 | | |
| CA Los Angeles County Schools | |
| Regionalized Business Services Corp., | |
Series 1999 A,
Insured: AMBAC:
(a) 08/01/16 | | | 1,945,000 | | | | 1,403,026 | | |
| (a) 08/01/17 | | | 1,980,000 | | | | 1,331,511 | | |
| CA Modesto | |
| Certificates of Participation, | |
Series 1993 A,
Insured: AMBAC
5.000% 11/01/23 | | | 2,235,000 | | | | 2,099,827 | | |
| | | Par ($) | | Value ($) | |
| CA Oakland Joint Powers Financing Authority | |
| Series 2008 B, | |
Insured: AGO
5.000% 08/01/22 | | | 3,000,000 | | | | 3,095,280 | | |
| CA Pico Rivera Public Financing Authority | |
| Series 2009, | |
| 5.500% 09/01/31 | | | 1,500,000 | | | | 1,515,780 | | |
| CA Sacramento City Financing Authority | |
| Series 1993 A, | |
Insured: AMBAC
5.375% 11/01/14 | | | 1,100,000 | | | | 1,158,729 | | |
| CA San Joaquin County | |
| Certificates of Participation, | |
Series 1993,
Insured: NPFGC
5.500% 11/15/13 | | | 1,750,000 | | | | 1,788,605 | | |
| CA Santa Ana Financing Authority | |
| Series 1994 A, | |
Insured: NPFGC
6.250% 07/01/18 | | | 6,035,000 | | | | 6,685,271 | | |
| CA Victor Elementary School District | |
| Series 1996, | |
Insured: NPFGC
6.450% 05/01/18 | | | 3,345,000 | | | | 3,667,926 | | |
| Local Appropriated Total | | | 34,773,808 | | |
| Local General Obligations – 12.5% | |
| CA Cabrillo Unified School District | |
| Series 1996 A, | |
Insured: AMBAC
(a) 08/01/15 | | | 3,000,000 | | | | 2,361,180 | | |
| CA Central Valley School District Financing Authority | |
| Series 1998 A, | |
Insured: NPFGC
6.450% 02/01/18 | | | 1,000,000 | | | | 1,131,370 | | |
| CA Coast Community College District | |
| Series 2005, | |
Insured: NPFGC
(a) 08/01/22 | | | 4,000,000 | | | | 2,021,680 | | |
| CA Corona-Norco Unified School District | |
| Series 2001 C, | |
Insured: NPFGC
(a) 09/01/17 | | | 1,000,000 | | | | 697,370 | | |
See Accompanying Notes to Financial Statements.
11
Columbia California Tax-Exempt Fund
October 31, 2009
| Municipal Bonds (continued) | |
| | | Par ($) | | Value ($) | |
| CA Culver City School Facilities Financing Authority | |
| Series 2005, | |
Insured: FSA:
5.500% 08/01/25 | | | 655,000 | | | | 763,095 | | |
| 5.500% 08/01/26 | | | 1,750,000 | | | | 2,051,682 | | |
CA East Side Union High School District
Santa Clara County | |
| Series 2003 B, | |
Insured: NPFGC
5.250% 08/01/26 | | | 2,010,000 | | | | 2,064,089 | | |
| CA Fillmore Unified School District | |
| Series 1997 A, | |
Insured: NPFGC
(a) 07/01/17 | | | 650,000 | | | | 457,399 | | |
| CA Golden West Schools Financing Authority | |
| Placentia Yorba Linda Unified, | |
Series 2006,
Insured: AMBAC
5.500% 08/01/24 | | | 1,825,000 | | | | 2,070,846 | | |
| CA Grossmont Union High School District | |
| Series 2006, | |
Insured: NPFGC
(a) 08/01/28 | | | 5,000,000 | | | | 1,626,200 | | |
| CA Jefferson Union High School District | |
| Series 2000 A, | |
Insured: NPFGC
6.450% 08/01/25 | | | 1,000,000 | | | | 1,163,860 | | |
| CA Lafayette | |
| Series 2002, | |
| 5.125% 07/15/25 | | | 1,995,000 | | | | 2,082,501 | | |
| CA Las Virgenes Unified School District | |
| Series 1997 C, | |
Insured: FGIC
(a) 11/01/20 | | | 1,205,000 | | | | 697,815 | | |
| CA Manteca Unified School District | |
| Series 2006, | |
Insured: NPFGC
(a) 08/01/32 | | | 5,440,000 | | | | 1,316,480 | | |
| CA New Haven Unified School District | |
| Series 2002, | |
Insured: FSA
12.000% 08/01/17 | | | 1,565,000 | | | | 2,441,400 | | |
| CA Oxnard Union High School District | |
| Series 2001 A, | |
Insured: NPFGC
5.650% 02/01/17 | | | 960,000 | | | | 1,042,003 | | |
| | | Par ($) | | Value ($) | |
| CA Poway Unified School District | |
| Series 2009 A, | |
| (a) 08/01/24 | | | 6,770,000 | | | | 2,935,133 | | |
| CA Redwood City Elementary School District | |
| Series 1997, | |
Insured: NPFGC
(a) 08/01/18 | | | 2,385,000 | | | | 1,550,083 | | |
| CA Rocklin Unified School District | |
| Series 1995 C, | |
Insured: NPFGC
(a) 07/01/20 | | | 6,920,000 | | | | 4,203,692 | | |
| CA San Marino Unified School District | |
| Series 1998 B, | |
| 5.000% 06/01/23 | | | 1,000,000 | | | | 1,120,520 | | |
| CA San Mateo County Community College | |
| Series 2006 C, | |
Insured: NPFGC
(a) 09/01/26 | | | 1,925,000 | | | | 799,472 | | |
| CA San Mateo Union High School District | |
| Series 2000 B, | |
Insured: NPFGC
(a) 09/01/26 | | | 4,005,000 | | | | 1,559,827 | | |
| CA Santa Margarita - Dana Point Authority | |
| Series 1994 B, | |
Insured: NPFGC
7.250% 08/01/13 | | | 2,000,000 | | | | 2,288,420 | | |
| CA Saratoga | |
| Series 2001, | |
Insured: NPFGC
5.250% 08/01/31 | | | 2,000,000 | | | | 2,052,100 | | |
| CA Simi Valley Unified School District | |
| Series 1997, | |
Insured: AMBAC
5.250% 08/01/22 | | | 925,000 | | | | 916,027 | | |
| CA South San Francisco Unified School District | |
| Series 2006, | |
Insured: NPFGC
5.250% 09/15/22 | | | 1,500,000 | | | | 1,749,450 | | |
| CA Tahoe-Truckee Unified School District | |
| No. 1-A, | |
Series 1999,
Insured: FGIC
(a) 08/01/23 | | | 3,780,000 | | | | 1,752,748 | | |
| No. 2-A, | |
Series 1999,
Insured: FGIC
(a) 08/01/24 | | | 2,965,000 | | | | 1,285,476 | | |
See Accompanying Notes to Financial Statements.
12
Columbia California Tax-Exempt Fund
October 31, 2009
| Municipal Bonds (continued) | |
| | | Par ($) | | Value ($) | |
| CA Union Elementary School District | |
| Series 1999 A, | |
Insured: NPFGC
(a) 09/01/19 | | | 1,750,000 | | | | 1,089,445 | | |
| CA West Contra Costa Unified School District | |
| Series 2001 A, | |
Insured: NPFGC
5.600% 02/01/20 | | | 1,610,000 | | | | 1,615,571 | | |
| CA West Covina Unified School District | |
| Series 2002 A, | |
Insured: NPFGC
5.250% 02/01/19 | | | 725,000 | | | | 763,041 | | |
| CA Yuba City Unified School District | |
| Series 2000, | |
Insured: NPFGC
(a) 09/01/20 | | | 2,385,000 | | | | 1,351,198 | | |
| Local General Obligations Total | | | 51,021,173 | | |
| Special Non-Property Tax – 2.0% | |
| CA San Diego Redevelopment Agency | |
| Series 2001, | |
Insured: FSA
(a) 09/01/20 | | | 3,630,000 | | | | 2,100,427 | | |
CA San Francisco Bay Area Rapid Transit
Financing Authority | |
| Series 2005 A, | |
Insured: NPFGC
4.250% 07/01/25 | | | 2,000,000 | | | | 1,952,900 | | |
PR Commonwealth of Puerto Rico Highway &
Transportation Authority | |
| Series 1998 A, | |
Insured: NPFGC
4.750% 07/01/38 | | | 2,250,000 | | | | 1,984,252 | | |
| Series 2006 BB, | |
Insured: FSA
5.250% 07/01/22 | | | 2,000,000 | | | | 2,141,520 | | |
| Special Non-Property Tax Total | | | 8,179,099 | | |
| Special Property Tax – 11.0% | |
| CA Carson Improvement Bond Act 1915 | |
| Series 1992, | |
| 7.375% 09/02/22 | | | 120,000 | | | | 119,933 | | |
| CA Cerritos Public Financing Authority | |
| Los Coyotes Redevelopment, | |
Series 1993 A,
Insured: AMBAC
6.500% 11/01/23 | | | 2,000,000 | | | | 2,265,960 | | |
| | | Par ($) | | Value ($) | |
| CA Elk Grove Unified School District | |
| Community Facilities District No. 1, | |
Series 1995 A,
Insured: AMBAC:
(a) 12/01/18 | | | 2,720,000 | | | | 1,578,280 | | |
| 6.500% 12/01/24 | | | 4,055,000 | | | | 4,227,459 | | |
| CA Inglewood Redevelopment Agency | |
| Series 1998 A, | |
Insured: AMBAC
5.250% 05/01/23 | | | 1,000,000 | | | | 964,540 | | |
| CA Lancaster Financing Authority | |
| Series 2003, | |
Insured: NPFGC
5.125% 02/01/17 | | | 1,270,000 | | | | 1,327,201 | | |
| CA Long Beach Bond Finance Authority | |
| Series 2006 C, | |
Insured: AMBAC
5.500% 08/01/31 | | | 3,250,000 | | | | 3,023,897 | | |
| CA Los Angeles Community Redevelopment Agency | |
| Series 1998 C, | |
Insured: NPFGC
5.375% 07/01/18 | | | 1,665,000 | | | | 1,729,136 | | |
CA Los Angeles County Public Works
Financing Authority | |
| J.F. Shea Co., | |
Series 1996 A,
Insured: FSA
5.500% 10/01/18 | | | 2,485,000 | | | | 2,798,582 | | |
| CA Oakdale Public Financing Authority | |
| Central City Redevelopment Project, | |
Series 2004,
5.375% 06/01/33 | | | 1,500,000 | | | | 1,281,690 | | |
| CA Oakland Redevelopment Agency | |
| Series 1992, | |
Insured: AMBAC
5.500% 02/01/14 | | | 6,955,000 | | | | 7,024,620 | | |
| CA Oceanside Community Facilities | |
| Ocean Ranch Corp., | |
Series 2004,
5.875% 09/01/34 | | | 1,000,000 | | | | 832,640 | | |
| CA Orange County Community Facilities District | |
| Ladera Ranch, | |
Series 2004 A,
5.625% 08/15/34 | | | 850,000 | | | | 770,533 | | |
See Accompanying Notes to Financial Statements.
13
Columbia California Tax-Exempt Fund
October 31, 2009
| Municipal Bonds (continued) | |
| | | Par ($) | | Value ($) | |
| CA Rancho Cucamonga Redevelopment Agency | |
| Series 2007 A, | |
Insured: NPFGC
5.000% 09/01/34 | | | 1,000,000 | | | | 890,520 | | |
| CA Redwood City Community Facilities District No. 1 | |
| Series 2003 B, | |
| 5.950% 09/01/28 | | | 750,000 | | | | 645,810 | | |
| CA Riverside County Public Financing Authority | |
| Series 1991 A, | |
| 8.000% 02/01/18 | | | 20,000 | | | | 20,139 | | |
| CA San Bernardino Joint Powers Financing Authority | |
| Series 1998 A, | |
Insured: AMBAC
5.750% 07/01/14 | | | 985,000 | | | | 1,056,826 | | |
| Series 2005 A, | |
Insured: FSA
5.750% 10/01/24 | | | 2,420,000 | | | | 2,737,577 | | |
| CA San Francisco City & County Redevelopment Agency | |
| Series 2009 C, | |
| 6.500% 08/01/39 | | | 1,000,000 | | | | 1,039,390 | | |
| Series 2009, | |
| 6.500% 08/01/32 | | | 500,000 | | | | 526,495 | | |
| CA San Jose Redevelopment Agency | |
| Series 1993, | |
Insured: NPFGC
6.000% 08/01/15 | | | 2,790,000 | | | | 3,091,097 | | |
| CA Sulphur Springs Unified School District | |
| Series 2002-1-A, | |
| 6.000% 09/01/33 | | | 1,500,000 | | | | 1,258,770 | | |
| CA West Covina Redevelopment Agency | |
| Series 1996, | |
| 6.000% 09/01/17 | | | 5,000,000 | | | | 5,643,350 | | |
| Special Property Tax Total | | | 44,854,445 | | |
| State Appropriated – 1.9% | |
| CA Public Works Board | |
| Department of Mental Health, | |
Coalinga State Hospital,
Series 2004 A,
5.500% 06/01/19 | | | 1,500,000 | | | | 1,553,985 | | |
| Various State Prisons Projects, | |
Series 1993 A,
Insured: AMBAC
5.000% 12/01/19 | | | 6,000,000 | | | | 5,986,800 | | |
| State Appropriated Total | | | 7,540,785 | | |
| | | Par ($) | | Value ($) | |
| State General Obligations – 4.5% | |
| CA State | |
| Series 2000, | |
| 5.625% 05/01/26 | | | 160,000 | | | | 163,067 | | |
| Series 2003, | |
| 5.250% 02/01/20 | | | 1,250,000 | | | | 1,312,813 | | |
| Series 2005, | |
| 4.625% 05/01/29 | | | 2,000,000 | | | | 1,793,800 | | |
| Series 2006, | |
| 4.500% 10/01/36 | | | 2,500,000 | | | | 2,101,575 | | |
| Series 2007, | |
| 4.500% 08/01/26 | | | 2,500,000 | | | | 2,315,725 | | |
| Series 2008, | |
| 5.000% 08/01/34 | | | 2,500,000 | | | | 2,337,600 | | |
| Series 2009, | |
| 6.000% 04/01/35 | | | 4,000,000 | | | | 4,247,960 | | |
| PR Commonwealth of Puerto Rico | |
| Series 2004 A: | |
| 5.250% 07/01/21 | | | 2,000,000 | | | | 1,979,240 | | |
| 5.250% 07/01/22 | | | 2,000,000 | | | | 1,977,980 | | |
| State General Obligations Total | | | 18,229,760 | | |
| Tax-Backed Total | | | 164,599,070 | | |
| Transportation – 4.0% | |
| Air Transportation – 0.0% | |
| CA Statewide Communities Development Authority | |
| United Airlines, Inc., | |
Series 2001,
07/01/39 (g) | | | 2,000,000 | | | | 80,000 | | |
| Air Transportation Total | | | 80,000 | | |
| Airports – 1.4% | |
| CA County of Orange | |
| Series 2009 A, | |
| 5.250% 07/01/39 | | | 2,500,000 | | | | 2,486,775 | | |
| CA County of Sacramento | |
| Series 2008 B, AMT, | |
Insured: FSA
5.250% 07/01/39 | | | 1,000,000 | | | | 941,990 | | |
| CA San Diego County Regional Airport Authority | |
| Series 2005, AMT, | |
Insured: AMBAC
5.250% 07/01/20 | | | 750,000 | | | | 758,805 | | |
| CA San Francisco City & County Airports Commission | |
| Series 2008 34E, AMT, | |
Insured: FSA
5.750% 05/01/25 | | | 1,500,000 | | | | 1,555,065 | | |
| Airports Total | | | 5,742,635 | | |
See Accompanying Notes to Financial Statements.
14
Columbia California Tax-Exempt Fund
October 31, 2009
| Municipal Bonds (continued) | |
| | | Par ($) | | Value ($) | |
| Toll Facilities – 2.0% | |
| CA Bay Area Toll Authority | |
| Series 2008 F-1, | |
| 5.125% 04/01/47 | | | 2,500,000 | | | | 2,542,625 | | |
| CA Foothill Eastern Transportation Corridor Agency | |
| Series 1995 A, | |
Insured: NPFGC
5.000% 01/01/35 | | | 2,000,000 | | | | 1,705,000 | | |
| Series 1999, | |
| 5.750% 01/15/40 | | | 4,000,000 | | | | 3,649,920 | | |
| Toll Facilities Total | | | 7,897,545 | | |
| Transportation – 0.6% | |
| CA Los Angeles Harbor Department | |
| Series 2009 B, | |
| 5.250% 08/01/39 | | | 2,500,000 | | | | 2,584,650 | | |
| Transportation Total | | | 2,584,650 | | |
| Transportation Total | | | 16,304,830 | | |
| Utilities – 17.0% | |
| Investor Owned – 1.8% | |
| CA Chula Vista Industrial Development Authority | |
| San Diego Gas & Electric Co.: | |
Series 1996 B, AMT,
5.500% 12/01/21 | | | 2,000,000 | | | | 2,046,000 | | |
| Series 2004 D, | |
| 5.875% 01/01/34 | | | 1,000,000 | | | | 1,078,590 | | |
| Series 2005 D, AMT, | |
| 5.000% 12/01/27 | | | 3,500,000 | | | | 3,259,165 | | |
| CA Pollution Control Financing Authority | |
| San Diego Gas & Electric Co., | |
Series 1996 A,
Insured: AMBAC
5.900% 06/01/14 | | | 1,000,000 | | | | 1,111,130 | | |
| Investor Owned Total | | | 7,494,885 | | |
| Joint Power Authority – 1.7% | |
| CA Infrastructure & Economic Development Bank | |
| CA Independent System Operator Corp., | |
Series 2009 A,
6.250% 02/01/39 | | | 2,000,000 | | | | 2,123,440 | | |
| CA Southern California Public Power Authority | |
| Series 1989, | |
| 6.750% 07/01/13 | | | 4,000,000 | | | | 4,676,600 | | |
| Joint Power Authority Total | | | 6,800,040 | | |
| | | Par ($) | | Value ($) | |
| Municipal Electric – 3.6% | |
| CA Los Angeles Department of Water & Power | |
| Series 2008, | |
| 5.250% 07/01/38 | | | 1,750,000 | | | | 1,840,685 | | |
| CA Modesto Irrigation District | |
| Certificates of Participation, | |
Series 2004 B,
5.500% 07/01/35 | | | 2,000,000 | | | | 2,106,900 | | |
| CA Sacramento Municipal Utility District | |
| Series 1993 G, | |
Insured: NPFGC
6.500% 09/01/13 | | | 1,500,000 | | | | 1,648,590 | | |
| Series 1997 K, | |
Insured: AMBAC:
5.250% 07/01/24 | | | 2,220,000 | | | | 2,425,816 | | |
| 5.700% 07/01/17 | | | 1,900,000 | | | | 2,150,800 | | |
| Series 2001 N, | |
Insured: NPFGC
5.000% 08/15/28 | | | 2,000,000 | | | | 2,002,220 | | |
| CA Tuolumne Wind Project Authority | |
| Series 2009 A, | |
| 5.625% 01/01/29 | | | 1,000,000 | | | | 1,057,500 | | |
PR Commonwealth of Puerto Rico
Electric Power Authority | |
| Series 2008 WW, | |
| 5.000% 07/01/28 | | | 1,500,000 | | | | 1,476,645 | | |
| Municipal Electric Total | | | 14,709,156 | | |
| Water & Sewer – 9.9% | |
| CA Big Bear Lake | |
| Series 1996, | |
Insured: NPFGC
6.000% 04/01/15 | | | 1,350,000 | | | | 1,507,316 | | |
| CA Chino Basin Regional Financing Authority | |
| Inland Empire Utilities Agency, | |
Series 2008 A,
Insured: AMBAC
5.000% 11/01/38 | | | 2,000,000 | | | | 1,908,780 | | |
| CA City of Los Angeles | |
| Series 2009 A, | |
| 5.000% 06/01/39 | | | 4,000,000 | | | | 4,107,120 | | |
| CA Contra Costa Water District | |
| Series 2002 L, | |
Insured: FSA
5.000% 10/01/24 | | | 1,920,000 | | | | 1,979,117 | | |
See Accompanying Notes to Financial Statements.
15
Columbia California Tax-Exempt Fund
October 31, 2009
| Municipal Bonds (continued) | |
| | | Par ($) | | Value ($) | |
| CA Eastern Municipal Water District | |
| Certificates of Participation, | |
Series 1991,
Insured: FGIC
6.750% 07/01/12 | | | 775,000 | | | | 835,094 | | |
| CA Elsinore Valley Municipal Water District | |
| Certificates of Participation, | |
Series 1992 A,
Insured: FGIC
6.000% 07/01/12 | | | 2,500,000 | | | | 2,625,300 | | |
| CA Lodi Wastewater Systems Revenue | |
| Series 2007 A, | |
Insured: FSA
5.000% 10/01/37 | | | 1,250,000 | | | | 1,224,150 | | |
| CA Los Angeles Department of Water & Power | |
| Series 2001 A: | |
| 5.000% 10/01/29 | | | 4,000,000 | | | | 3,853,280 | | |
| 5.125% 07/01/41 | | | 3,000,000 | | | | 3,014,790 | | |
| Insured: FGIC | |
| 5.125% 07/01/41 | | | 3,000,000 | | | | 3,013,830 | | |
| CA Manteca Financing Authority | |
| Series 2003 B, | |
Insured: NPFGC
5.000% 12/01/33 | | | 575,000 | | | | 535,762 | | |
| CA Metropolitan Water District of Southern California | |
| Series 1993 A, | |
| 5.750% 07/01/21 | | | 3,635,000 | | | | 4,275,850 | | |
| CA Pico Rivera Water Authority | |
| Series 1999 A, | |
Insured: NPFGC
5.500% 05/01/29 | | | 2,000,000 | | | | 2,208,360 | | |
| CA San Diego Public Facilities Financing Authority | |
| Series 2009 B, | |
| 5.375% 08/01/34 | | | 2,000,000 | | | | 2,102,900 | | |
| Series 2009, | |
| 5.250% 05/15/39 | | | 3,000,000 | | | | 3,048,540 | | |
| CA Santa Clara Valley Water District | |
| Series 2006, | |
Insured: FSA
4.250% 06/01/30 | | | 2,500,000 | | | | 2,394,550 | | |
| CA Santa Maria Water & Wastewater | |
| Series 1997 A, | |
Insured: AMBAC
(a) 08/01/14 | | | 2,000,000 | | | | 1,672,360 | | |
| Water & Sewer Total | | | 40,307,099 | | |
| Utilities Total | | | 69,311,180 | | |
Total Municipal Bonds
(cost of $381,766,525) | | | 393,171,414 | | |
| Municipal Preferred Stock – 0.4% | |
| | | Shares | | Value ($) | |
| Housing – 0.4% | |
| Multi-Family – 0.4% | |
| Munimae TE Bond Subsidiary LLC | |
| Series 2004 A-2, | |
| 4.900% 06/30/49 (h) | | | 2,000,000 | | | | 1,601,940 | | |
| Multi-Family Total | | | 1,601,940 | | |
| Housing Total | | | 1,601,940 | | |
Total Municipal Preferred Stock
(cost of $2,000,000) | | | 1,601,940 | | |
| Investment Companies – 1.6% | |
| Columbia California Tax-Exempt | |
Reserves, Capital Class
(7 day yield of 0.160%) (i)(j) | | | 3,256,484 | | | | 3,256,484 | | |
| Dreyfus Municipal Cash | |
Management Plus
(7 day yield of 0.210%) | | | 3,461,896 | | | | 3,461,896 | | |
Total Investment Companies
(cost of $6,718,380) | | | 6,718,380 | | |
| Short-Term Obligation – 0.0% | |
| | | Par ($) | | | |
| Variable Rate Demand Note (k) – 0.0% | |
| CA Department of Water Resources | |
| Power Supply Revenue | |
Series 2005 F-2,
LOC: JPMorgan Chase Bank,
LOC: Societe Generale
0.180% 05/01/20 (11/02/09) (d) | | | 100,000 | | | | 100,000 | | |
Total Short-Term Obligation
(cost of $100,000) | | | 100,000 | | |
Total Investments – 98.6%
(cost of $390,584,905) (l) | | | 401,591,734 | | |
| Other Assets & Liabilities, Net – 1.4% | | | 5,553,143 | | |
| Net Assets – 100.0% | | | 407,144,877 | | |
Notes to Investment Portfolio:
(a) Zero coupon bond.
(b) Denotes a restricted security, which is subject to restrictions on resale under federal securities laws or in transactions exempt from registration. At October 31, 2009, the value of this security amounted to $1,541,184 which represents 0.4% of net assets. Additional information on this restricted security is as follows
| Security | | Acquisition
Date | | Acquisition
Cost | |
CA Statewide Communities Development
Authority; Crossroads School for Arts &
Sciences, Series 1998, 6.000% 08/01/28 | | | 08/21/98 | | | $ | 1,750,000 | | |
See Accompanying Notes to Financial Statements.
16
Columbia California Tax-Exempt Fund
October 31, 2009
(c) The interest rate shown on floating rate or variable rate securities reflects the rate at October 31, 2009.
(d) Parenthetical date represents the next interest rate reset date for the security.
(e) Security purchased on a delayed delivery basis.
(f) The Fund has been informed that each issuer has placed direct obligations of the U.S. Government in an irrevocable trust, solely for the payment of principal and interest.
(g) Position reflects anticipated residual bankruptcy claims. Income is not being accrued.
(h) Security exempt from registration pursuant to Rule 144A under the Securities Act of 1933. This security may be resold in transactions exempt from registration, normally to qualified institutional buyers. At October 31, 2009, the value of this security, which is not illiquid, amounted to $1,601,940 which represents 0.4% of net assets.
(i) Investments in affiliates during the year ended October 31, 2009:
Security name: Columbia California Tax-Exempt Reserves, Capital Class (7 day yield of 0.160%)
| Shares as of 10/31/08: | | | — | | |
| Shares purchased: | | | 61,736,560 | | |
| Shares sold: | | | (58,480,076 | ) | |
| Shares as of 10/31/09: | | | 3,256,484 | | |
| Net realized gain/loss: | | $ | — | | |
| Dividend income earned: | | $ | 18,512 | | |
| Value at end of period: | | $ | 3,256,484 | | |
(j) Money market mutual fund registered under the Investment Company Act of 1940, as amended and advised by Columbia Management Advisors, LLC.
(k) This security is payable upon demand and is secured by letters of credit or other credit support agreements from banks. The interest rate changes periodically and the interest rate shown reflects the rate as of October 31, 2009.
(l) Cost for federal income tax purposes is $390,429,472.
The following table summarizes the inputs used, as of October 31, 2009, in valuing the Fund's assets:
| Description | |
Quoted Prices
(Level 1) | | Other
Significant
Observable
Inputs
(Level 2) | | Significant
Unobservable
Inputs
(Level 3) | | Total | |
| Total Municipal Bonds | | $ | — | | | $ | 393,171,414 | | | $ | — | | | $ | 393,171,414 | | |
Total Municipal
Preferred Stock | | | — | | | | 1,601,940 | | | | — | | | | 1,601,940 | | |
Total Investment
Companies | | | 6,718,380 | | | | — | | | | — | | | | 6,718,380 | | |
Total Short-Term
Obligation | | | — | | | | 100,000 | | | | — | | | | 100,000 | | |
| Total Investments | | $ | 6,718,380 | | | $ | 394,873,354 | | | $ | — | | | $ | 401,591,734 | | |
For more information on valuation inputs and their aggregation into the levels used in the table above, please refer to the Security Valuation section in the accompanying Notes to Financial Statements.
At October 31, 2009, the composition of the Fund by revenue source is as follows:
| Holdings By Revenue Source (Unaudited) | | % of
Net Assets | |
| Tax-Backed | | | 40.4 | | |
| Utilities | | | 17.0 | | |
| Refunded/Escrowed | | | 14.7 | | |
| Health Care | | | 8.3 | | |
| Education | | | 6.9 | | |
| Transportation | | | 4.0 | | |
| Other | | | 2.2 | | |
| Housing | | | 1.5 | | |
| Industrials | | | 1.0 | | |
| Resource Recovery | | | 1.0 | | |
| | | | 97.0 | | |
| Investment Companies | | | 1.6 | | |
| Short-Term Obligation | | | 0.0 | * | |
| Other Assets & Liabilities, Net | | | 1.4 | | |
| | | | 100.0 | | |
* Represents less than 0.1%
| Acronym | | Name | |
| AGO | | Assured Guaranty Ltd. | |
|
| AMBAC | | Ambac Assurance Corp. | |
|
| AMT | | Alternative Minimum Tax | |
|
| FGIC | | Financial Guaranty Insurance Co. | |
|
| FHA | | Federal Housing Administration | |
|
| FNMA | | Federal National Mortgage Association | |
|
| FSA | | Financial Security Assurance, Inc. | |
|
| GNMA | | Government National Mortgage Association | |
|
| IFRN | | Inverse Floating Rate Note | |
|
| LOC | | Letter of Credit | |
|
| NPFGC | | National Public Finance Guarantee Corp. | |
|
See Accompanying Notes to Financial Statements.
17
Statement of Assets and Liabilities – Columbia California Tax-Exempt Fund
October 31, 2009
| | | | | ($) | |
| Assets | | Unaffiliated investments, at identified cost | | | 387,328,421 | | |
| | | Affiliated investments, at identified cost | | | 3,256,484 | | |
| | | Total investments, at identified cost | | | 390,584,905 | | |
| | | Unaffiliated investments, at value | | | 398,335,250 | | |
| | | Affiliated investments, at value | | | 3,256,484 | | |
| | | Total investments, at value | | | 401,591,734 | | |
| | | Cash | | | 745 | | |
| | | Receivable for: | | | | | |
| | | Investments sold | | | 2,571,590 | | |
| | | Fund shares sold | | | 72,298 | | |
| | | Interest | | | 5,280,808 | | |
| | | Expense reimbursement due from investment advisor | | | 16,030 | | |
| | | Trustees' deferred compensation plan | | | 38,382 | | |
| | | Prepaid expenses | | | 1,472 | | |
| | | Total Assets | | | 409,573,059 | | |
| Liabilities | | Payable for: | | | | | |
| | | Investments purchased on a delayed delivery basis | | | 1,160,798 | | |
| | | Fund shares repurchased | | | 119,023 | | |
| | | Distributions | | | 737,462 | | |
| | | Investment advisory fee | | | 176,427 | | |
| | | Pricing and bookkeeping fees | | | 14,904 | | |
| | | Transfer agent fee | | | 18,927 | | |
| | | Trustees' fees | | | 19,626 | | |
| | | Custody fee | | | 3,173 | | |
| | | Distribution and service fees | | | 77,282 | | |
| | | Chief compliance officer expenses | | | 65 | | |
| | | Trustees' deferred compensation plan | | | 38,382 | | |
| | | Other liabilities | | | 62,113 | | |
| | | Total Liabilities | | | 2,428,182 | | |
| | | Net Assets | | | 407,144,877 | | |
| Net Assets Consist of | | Paid-in capital | | | 395,010,910 | | |
| | | Undistributed net investment income | | | 291,317 | | |
| | | Accumulated net realized gain | | | 835,821 | | |
| | | Net unrealized appreciation on investments | | | 11,006,829 | | |
| | | Net Assets | | | 407,144,877 | | |
See Accompanying Notes to Financial Statements.
18
Statement of Assets and Liabilities (continued) – Columbia California Tax-Exempt Fund
October 31, 2009
| Class A | | Net assets | | $ | 265,593,502 | | |
| | | Shares outstanding | | | 36,389,971 | | |
| | | Net asset value per share | | $ | 7.30 | (a) | |
| | | Maximum sales charge | | | 4.75 | % | |
| | | Maximum offering price per share ($7.30/0.9525) | | $ | 7.66 | (b) | |
| Class B | | Net assets | | $ | 5,377,347 | | |
| | | Shares outstanding | | | 736,730 | | |
| | | Net asset value and offering price per share | | $ | 7.30 | (a) | |
| Class C | | Net assets | | $ | 28,927,597 | | |
| | | Shares outstanding | | | 3,963,461 | | |
| | | Net asset value and offering price per share | | $ | 7.30 | (a) | |
| Class Z | | Net assets | | $ | 107,246,431 | | |
| | | Shares outstanding | | | 14,694,173 | | |
| | | Net asset value, offering and redemption price per share | | $ | 7.30 | | |
(a) Redemption price per share is equal to net asset value less any applicable contingent deferred sales charge.
(b) On sales of $50,000 or more the offering price is reduced.
See Accompanying Notes to Financial Statements.
19
Statement of Operations – Columbia California Tax-Exempt Fund
For the Year Ended October 31, 2009
| | | | | ($) | |
| Investment Income | | Interest | | | 21,037,035 | | |
| | | Dividends | | | 11,108 | | |
| | | Dividends from affiliates | | | 18,512 | | |
| | | Total Investment Income | | | 21,066,655 | | |
| Expenses | | Investment advisory fee | | | 2,020,284 | | |
| | | Distribution fee: | | | | | |
| | | Class B | | | 60,505 | | |
| | | Class C | | | 190,050 | | |
| | | Service fee: | | | | | |
| | | Class A | | | 634,301 | | |
| | | Class B | | | 19,306 | | |
| | | Class C | | | 60,763 | | |
| | | Pricing and bookkeeping fees | | | 124,648 | | |
| | | Transfer agent fee | | | 117,045 | | |
| | | Trustees' fees | | | 26,608 | | |
| | | Custody fee | | | 15,596 | | |
| | | Chief compliance officer expenses | | | 740 | | |
| | | Other expenses | | | 194,562 | | |
| | | Total Expenses | | | 3,464,408 | | |
| | | Fees waived or expenses reimbursed by investment advisor | | | (73,450 | ) | |
| | | Fees waived by distributor—Class C | | | (76,149 | ) | |
| | | Expense reductions | | | (1,574 | ) | |
| | | Net Expenses | | | 3,313,235 | | |
| | | Net Investment Income | | | 17,753,420 | | |
| Net Realized and Unrealized Gain (Loss) on Investments and Futures Contracts | | Net realized gain on: | | | | | |
| | | Investments | | | 1,218,004 | | |
| | | Futures contracts | | | 191,984 | | |
| | | Net realized gain | | | 1,409,988 | | |
| | | Net change in unrealized appreciation (depreciation) on investments | | | 32,648,383 | | |
| | | Net Gain | | | 34,058,371 | | |
| | | Net Increase Resulting from Operations | | | 51,811,791 | | |
See Accompanying Notes to Financial Statements.
20
Statement of Changes in Net Assets – Columbia California Tax-Exempt Fund
| | | | | Year Ended October 31, | |
| Increase (Decrease) in Net Assets | | | | 2009 ($) | | 2008 ($) | |
| Operations | | Net investment income | | | 17,753,420 | | | | 18,162,478 | | |
| | | Net realized gain on investments and futures contracts | | | 1,409,988 | | | | 1,057,499 | | |
| | | Net change in unrealized appreciation (depreciation) on
investments and futures contracts | | | 32,648,383 | | | | (49,502,897 | ) | |
| | | Net increase (decrease) resulting from operations | | | 51,811,791 | | | | (30,282,920 | ) | |
| Distributions to Shareholders | | From net investment income: | | | | | | | | | |
| | | Class A | | | (11,572,607 | ) | | | (11,559,069 | ) | |
| | | Class B | | | (293,974 | ) | | | (442,150 | ) | |
| | | Class C | | | (989,586 | ) | | | (741,322 | ) | |
| | | Class Z | | | (4,892,289 | ) | | | (5,418,607 | ) | |
| | | From net realized gains: | | | | | | | | | |
| | | Class A | | | (266,708 | ) | | | (1,597,721 | ) | |
| | | Class B | | | (9,730 | ) | | | (89,254 | ) | |
| | | Class C | | | (22,700 | ) | | | (104,151 | ) | |
| | | Class Z | | | (111,582 | ) | | | (730,285 | ) | |
| | | Total distributions to shareholders | | | (18,159,176 | ) | | | (20,682,559 | ) | |
| | | Net Capital Stock Transactions | | | (28,962,294 | ) | | | 16,332,602 | | |
| | | Increase from regulatory settlements | | | 5,166 | | | | — | | |
| | | Total increase (decrease) in net assets | | | 4,695,487 | | | | (34,632,877 | ) | |
| Net Assets | | Beginning of period | | | 402,449,390 | | | | 437,082,267 | | |
| | | End of period | | | 407,144,877 | | | | 402,449,390 | | |
| | | Undistributed net investment income at end of period | | | 291,317 | | | | 282,480 | | |
See Accompanying Notes to Financial Statements.
21
Statement of Changes in Net Assets (continued) – Columbia California Tax-Exempt Fund
| | | Capital Stock Activity | |
| | | Year Ended
October 31, 2009 | | Year Ended
October 31, 2008 | |
| | | Shares | | Dollars ($) | | Shares | | Dollars ($) | |
| Class A | |
| Subscriptions | | | 3,895,993 | | | | 27,313,561 | | | | 8,916,823 | | | | 65,274,242 | | |
| Distributions reinvested | | | 1,117,396 | | | | 7,849,044 | | | | 1,184,466 | | | | 8,612,536 | | |
| Redemptions | | | (7,870,780 | ) | | | (54,925,863 | ) | | | (8,118,611 | ) | | | (58,820,520 | ) | |
| Net increase (decrease) | | | (2,857,391 | ) | | | (19,763,258 | ) | | | 1,982,678 | | | | 15,066,258 | | |
| Class B | |
| Subscriptions | | | 61,966 | | | | 433,630 | | | | 145,678 | | | | 1,073,625 | | |
| Distributions reinvested | | | 26,255 | | | | 183,234 | | | | 46,959 | | | | 343,107 | | |
| Redemptions | | | (803,739 | ) | | | (5,672,592 | ) | | | (876,556 | ) | | | (6,424,692 | ) | |
| Net decrease | | | (715,518 | ) | | | (5,055,728 | ) | | | (683,919 | ) | | | (5,007,960 | ) | |
| Class C | |
| Subscriptions | | | 1,423,590 | | | | 9,936,545 | | | | 1,651,124 | | | | 12,081,252 | | |
| Distributions reinvested | | | 71,416 | | | | 501,907 | | | | 63,179 | | | | 458,523 | | |
| Redemptions | | | (796,791 | ) | | | (5,531,093 | ) | | | (670,276 | ) | | | (4,878,905 | ) | |
| Net increase | | | 698,215 | | | | 4,907,359 | | | | 1,044,027 | | | | 7,660,870 | | |
| Class Z | |
| Subscriptions | | | 2,684,063 | | | | 18,895,881 | | | | 4,727,932 | | | | 34,922,006 | | |
| Distributions reinvested | | | 50,465 | | | | 351,519 | | | | 74,327 | | | | 545,939 | | |
| Redemptions | | | (4,082,983 | ) | | | (28,298,067 | ) | | | (5,048,600 | ) | | | (36,854,511 | ) | |
| Net decrease | | | (1,348,455 | ) | | | (9,050,667 | ) | | | (246,341 | ) | | | (1,386,566 | ) | |
See Accompanying Notes to Financial Statements.
22
Financial Highlights – Columbia California Tax-Exempt Fund
Selected data for a share outstanding throughout each period is as follows:
| | | Year Ended October 31, | |
| Class A Shares | | 2009 | | 2008 | | 2007 | | 2006 | | 2005 | |
| Net Asset Value, Beginning of Period | | $ | 6.71 | | | $ | 7.55 | | | $ | 7.74 | | | $ | 7.59 | | | $ | 7.74 | | |
| Income from Investment Operations: | |
| Net investment income (a) | | | 0.31 | | | | 0.30 | | | | 0.30 | | | | 0.31 | | | | 0.31 | | |
Net realized and unrealized gain (loss) on investments
and futures contracts | | | 0.59 | | | | (0.79 | ) | | | (0.16 | ) | | | 0.18 | | | | (0.15 | ) | |
| Total from investment operations | | | 0.90 | | | | (0.49 | ) | | | 0.14 | | | | 0.49 | | | | 0.16 | | |
| Less Distributions to Shareholders: | |
| From net investment income | | | (0.30 | ) | | | (0.31 | ) | | | (0.30 | ) | | | (0.31 | ) | | | (0.31 | ) | |
| From net realized gains | | | (0.01 | ) | | | (0.04 | ) | | | (0.03 | ) | | | (0.03 | ) | | | — | | |
| Total distributions to shareholders | | | (0.31 | ) | | | (0.35 | ) | | | (0.33 | ) | | | (0.34 | ) | | | (0.31 | ) | |
| Increase from regulatory settlements | | | — | (b) | | | — | | | | — | | | | — | | | | — | | |
| Net Asset Value, End of Period | | $ | 7.30 | | | $ | 6.71 | | | $ | 7.55 | | | $ | 7.74 | | | $ | 7.59 | | |
| Total return (c)(d) | | | 13.76 | % | | | (6.80 | )% | | | 1.86 | % | | | 6.61 | % | | | 2.05 | % | |
| Ratios to Average Net Assets/Supplemental Data: | |
| Net expenses (e) | | | 0.84 | % | | | 0.84 | % | | | 0.83 | % | | | 0.83 | % | | | 0.90 | % | |
| Waiver/Reimbursement | | | 0.02 | % | | | 0.01 | % | | | 0.03 | % | | | 0.02 | % | | | — | %(f) | |
| Net investment income (e) | | | 4.38 | % | | | 4.14 | % | | | 3.99 | % | | | 4.04 | % | | | 4.00 | % | |
| Portfolio turnover rate | | | 14 | % | | | 12 | % | | | 12 | % | | | 10 | % | | | 7 | % | |
| Net assets, end of period (000s) | | $ | 265,594 | | | $ | 263,220 | | | $ | 281,254 | | | $ | 292,740 | | | $ | 303,486 | | |
(a) Per share data was calculated using the average shares outstanding during the period.
(b) Rounds to less than $0.01 per share.
(c) Total return at net asset value assuming all distributions reinvested and no initial sales charge or contingent deferred sales charge.
(d) Had the investment advisor and/or any of its affiliates not waived fees or reimbursed a portion of expenses, total return would have been reduced.
(e) The benefits derived from expense reductions had an impact of less than 0.01%.
(f) Rounds to less than 0.01%.
See Accompanying Notes to Financial Statements.
23
Financial Highlights – Columbia California Tax-Exempt Fund
Selected data for a share outstanding throughout each period is as follows:
| | | Year Ended October 31, | |
| Class B Shares | | 2009 | | 2008 | | 2007 | | 2006 | | 2005 | |
| Net Asset Value, Beginning of Period | | $ | 6.71 | | | $ | 7.55 | | | $ | 7.74 | | | $ | 7.59 | | | $ | 7.74 | | |
| Income from Investment Operations: | |
| Net investment income (a) | | | 0.26 | | | | 0.25 | | | | 0.25 | | | | 0.25 | | | | 0.25 | | |
Net realized and unrealized gain (loss) on investments
and futures contracts | | | 0.59 | | | | (0.80 | ) | | | (0.17 | ) | | | 0.18 | | | | (0.15 | ) | |
| Total from investment operations | | | 0.85 | | | | (0.55 | ) | | | 0.08 | | | | 0.43 | | | | 0.10 | | |
| Less Distributions to Shareholders: | |
| From net investment income | | | (0.25 | ) | | | (0.25 | ) | | | (0.24 | ) | | | (0.25 | ) | | | (0.25 | ) | |
| From net realized gains | | | (0.01 | ) | | | (0.04 | ) | | | (0.03 | ) | | | (0.03 | ) | | | — | | |
| Total distributions to shareholders | | | (0.26 | ) | | | (0.29 | ) | | | (0.27 | ) | | | (0.28 | ) | | | (0.25 | ) | |
| Increase from regulatory settlements | | | — | (b) | | | — | | | | — | | | | — | | | | — | | |
| Net Asset Value, End of Period | | $ | 7.30 | | | $ | 6.71 | | | $ | 7.55 | | | $ | 7.74 | | | $ | 7.59 | | |
| Total return (c)(d) | | | 12.92 | % | | | (7.49 | )% | | | 1.10 | % | | | 5.82 | % | | | 1.29 | % | |
| Ratios to Average Net Assets/Supplemental Data: | |
| Net expenses (e) | | | 1.59 | % | | | 1.59 | % | | | 1.58 | % | | | 1.58 | % | | | 1.65 | % | |
| Waiver/Reimbursement | | | 0.02 | % | | | 0.01 | % | | | 0.03 | % | | | 0.02 | % | | | — | %(f) | |
| Net investment income (e) | | | 3.65 | % | | | 3.38 | % | | | 3.25 | % | | | 3.29 | % | | | 3.25 | % | |
| Portfolio turnover rate | | | 14 | % | | | 12 | % | | | 12 | % | | | 10 | % | | | 7 | % | |
| Net assets, end of period (000s) | | $ | 5,377 | | | $ | 9,740 | | | $ | 16,123 | | | $ | 24,004 | | | $ | 30,327 | | |
(a) Per share data was calculated using the average shares outstanding during the period.
(b) Rounds to less than $0.01 per share.
(c) Total return at net asset value assuming all distributions reinvested and no contingent deferred sales charge.
(d) Had the investment advisor and/or any of its affiliates not waived fees or reimbursed a portion of expenses, total return would have been reduced.
(e) The benefits derived from expense reductions had an impact of less than 0.01%.
(f) Rounds to less than 0.01%.
See Accompanying Notes to Financial Statements.
24
Financial Highlights – Columbia California Tax-Exempt Fund
Selected data for a share outstanding throughout each period is as follows:
| | | Year Ended October 31, | |
| Class C Shares | | 2009 | | 2008 | | 2007 | | 2006 | | 2005 | |
| Net Asset Value, Beginning of Period | | $ | 6.71 | | | $ | 7.55 | | | $ | 7.74 | | | $ | 7.59 | | | $ | 7.74 | | |
| Income from Investment Operations: | |
| Net investment income (a) | | | 0.28 | | | | 0.27 | | | | 0.27 | | | | 0.27 | | | | 0.27 | | |
Net realized and unrealized gain (loss) on investments
and futures contracts | | | 0.59 | | | | (0.80 | ) | | | (0.16 | ) | | | 0.18 | | | | (0.15 | ) | |
| Total from investment operations | | | 0.87 | | | | (0.53 | ) | | | 0.11 | | | | 0.45 | | | | 0.12 | | |
| Less Distributions to Shareholders: | |
| From net investment income | | | (0.27 | ) | | | (0.27 | ) | | | (0.27 | ) | | | (0.27 | ) | | | (0.27 | ) | |
| From net realized gains | | | (0.01 | ) | | | (0.04 | ) | | | (0.03 | ) | | | (0.03 | ) | | | — | | |
| Total distributions to shareholders | | | (0.28 | ) | | | (0.31 | ) | | | (0.30 | ) | | | (0.30 | ) | | | (0.27 | ) | |
| Increase from regulatory settlements | | | — | (b) | | | — | | | | — | | | | — | | | | — | | |
| Net Asset Value, End of Period | | $ | 7.30 | | | $ | 6.71 | | | $ | 7.55 | | | $ | 7.74 | | | $ | 7.59 | | |
| Total return (c)(d) | | | 13.25 | % | | | (7.22 | )% | | | 1.40 | % | | | 6.13 | % | | | 1.59 | % | |
| Ratios to Average Net Assets/Supplemental Data: | |
| Net expenses (e) | | | 1.29 | % | | | 1.29 | % | | | 1.28 | % | | | 1.28 | % | | | 1.35 | % | |
| Waiver/Reimbursement | | | 0.32 | % | | | 0.31 | % | | | 0.33 | % | | | 0.32 | % | | | 0.30 | % | |
| Net investment income (e) | | | 3.91 | % | | | 3.69 | % | | | 3.54 | % | | | 3.59 | % | | | 3.55 | % | |
| Portfolio turnover rate | | | 14 | % | | | 12 | % | | | 12 | % | | | 10 | % | | | 7 | % | |
| Net assets, end of period (000s) | | $ | 28,928 | | | $ | 21,899 | | | $ | 16,765 | | | $ | 16,224 | | | $ | 17,063 | | |
(a) Per share data was calculated using the average shares outstanding during the period.
(b) Rounds to less than $0.01 per share.
(c) Total return at net asset value assuming all distributions reinvested and no contingent deferred sales charge.
(d) Had the investment advisor and/or any of its affiliates not waived fees or reimbursed a portion of expenses, total return would have been reduced.
(e) The benefits derived from expense reductions had an impact of less than 0.01%.
See Accompanying Notes to Financial Statements.
25
Financial Highlights – Columbia California Tax-Exempt Fund
Selected data for a share outstanding throughout each period is as follows:
| | | Year Ended October 31, | | Period Ended
October 31, | |
| Class Z Shares | | 2009 | | 2008 | | 2007 | | 2006 | | 2005 (a) | |
| Net Asset Value, Beginning of Period | | $ | 6.71 | | | $ | 7.55 | | | $ | 7.74 | | | $ | 7.59 | | | $ | 7.73 | | |
| Income from Investment Operations: | |
| Net investment income (b) | | | 0.32 | | | | 0.32 | | | | 0.32 | | | | 0.32 | | | | 0.04 | | |
Net realized and unrealized gain (loss) on investments
and futures contracts | | | 0.60 | | | | (0.80 | ) | | | (0.16 | ) | | | 0.19 | | | | (0.14 | ) | |
| Total from investment operations | | | 0.92 | | | | (0.48 | ) | | | 0.16 | | | | 0.51 | | | | (0.10 | ) | |
| Less Distributions to Shareholders: | |
| From net investment income | | | (0.32 | ) | | | (0.32 | ) | | | (0.32 | ) | | | (0.33 | ) | | | (0.04 | ) | |
| From net realized gains | | | (0.01 | ) | | | (0.04 | ) | | | (0.03 | ) | | | (0.03 | ) | | | — | | |
| Total distributions to shareholders | | | (0.33 | ) | | | (0.36 | ) | | | (0.35 | ) | | | (0.36 | ) | | | (0.04 | ) | |
| Increase from regulatory settlements | | | — | (c) | | | — | | | | — | | | | — | | | | — | | |
| Net Asset Value, End of Period | | $ | 7.30 | | | $ | 6.71 | | | $ | 7.55 | | | $ | 7.74 | | | $ | 7.59 | | |
| Total return (d)(e) | | | 14.03 | % | | | (6.57 | )% | | | 2.09 | % | | | 6.85 | % | | | (1.28 | )%(f) | |
| Ratios to Average Net Assets/Supplemental Data: | |
| Net expenses (g) | | | 0.60 | % | | | 0.60 | % | | | 0.60 | % | | | 0.60 | % | | | 0.58 | %(h) | |
| Waiver/Reimbursement | | | 0.02 | % | | | 0.01 | % | | | 0.03 | % | | | 0.02 | % | | | — | %(h)(i) | |
| Net investment income (g) | | | 4.61 | % | | | 4.38 | % | | | 4.23 | % | | | 4.26 | % | | | 4.29 | %(h) | |
| Portfolio turnover rate | | | 14 | % | | | 12 | % | | | 12 | % | | | 10 | % | | | 7 | %(f) | |
| Net assets, end of period (000s) | | $ | 107,246 | | | $ | 107,591 | | | $ | 122,941 | | | $ | 123,803 | | | $ | 117,979 | | |
(a) Class Z shares commenced operations on September 19, 2005. Per share data and total return reflect activity from that date.
(b) Per share data was calculated using the average shares outstanding during the period.
(c) Rounds to less than $0.01 per share.
(d) Total return at net asset value assuming all distributions reinvested.
(e) Had the investment advisor and/or any of its affiliates not waived fees or reimbursed a portion of expenses, total return would have been reduced.
(f) Not annualized.
(g) The benefits derived from expense reductions had an impact of less than 0.01%.
(h) Annualized.
(i) Rounds to less than 0.01%.
See Accompanying Notes to Financial Statements.
26
Notes to Financial Statements – Columbia California Tax-Exempt Fund
October 31, 2009
Note 1. Organization
Columbia California Tax-Exempt Fund (the "Fund"), a series of Columbia Funds Series Trust I (the "Trust"), is a diversified portfolio. The Trust is a Massachusetts business trust registered under the Investment Company Act of 1940, as amended (the "1940 Act"), as an open-end management investment company.
Investment Objective
The Fund seeks total return, consisting of current income exempt from federal income tax and California individual income tax and of capital appreciation, consistent with moderate fluctuation of principal.
Fund Shares
The Trust may issue an unlimited number of shares, and the Fund offers four classes of shares: Class A, Class B, Class C and Class Z. Each share class has its own expense structure and sales charges, as applicable. Effective June 22, 2009, the Fund no longer accepts investments from new or existing investors in the Fund's Class B shares, except in connection with the reinvestment of any dividend and/or capital gain distributions in Class B shares of the Fund and exchanges by existing Class B shareholders of the other Columbia Funds.
Class A shares are subject to a maximum front-end sales charge of 4.75% based on the amount of initial investment. Class A shares purchased without an initial sales charge in accounts aggregating $1 million to $50 million at the time of purchase are subject to a 1.00% contingent deferred sales charge ("CDSC") if the shares are sold within one year after purchase. Class B shares are subject to a maximum CDSC of 5.00% based upon the holding period after purchase. Class B shares will convert to Class A shares eight years after purchase. Class C shares are subject to a 1.00% CDSC on shares sold within one year after purchase. Class Z shares are offered continuously at net asset value. There are certain restrictions on the purchase of Class Z shares, as described in the Fund's prospectus.
Note 2. Significant Accounting Policies
The preparation of financial statements in accordance with accounting principles generally accepted in the United States of America ("GAAP") requires management to make certain estimates and assumptions that affect the reported amounts of assets and liabilities, the disclosure of contingent assets and liabilities at the date of the financial statements and the reported amounts of revenue and expenses during the reporting period. Actual results could differ from those estimates.
Management has evaluated the events and transactions that have occurred through December 18, 2009, the date the financial statements were issued, and noted no items requiring adjustment of the financial statements or additional disclosures except as disclosed in Note 4.
The following is a summary of significant accounting policies consistently followed by the Fund in the preparation of its financial statements.
Security Valuation
Debt securities generally are valued by pricing services approved by the Trust's Board of Trustees, based upon market transactions for normal, institutional-size trading units of similar securities. The services may use various pricing techniques which take into account appropriate factors such as yield, quality, coupon rate, maturity, type of issue, trading characteristics and other data, as well as broker quotes. Debt securities for which quotations are readily available are valued at an over-the-counter or exchange bid quotation.
Certain debt securities, which tend to be more thinly traded and of lesser quality, are priced based on fundamental analysis of the financial condition of the issuer and the estimated value of any collateral. Valuations developed through pricing techniques may vary from the actual amounts realized upon sale of the securities, and the potential variation may be greater for those securities valued using fundamental analysis.
Short-term investments maturing in 60 days or less are valued at amortized cost, which approximates market value.
Investments in other open-end investment companies are valued at net asset value.
Futures contracts are valued at the settlement price established each day by the board of trade or exchange on which they are traded.
Investments for which market quotations are not readily available, or that have quotations which management believes are not reliable, are valued at fair value as determined in good faith under consistently applied procedures established by and
27
Columbia California Tax-Exempt Fund, October 31, 2009
under the general supervision of the Board of Trustees. If a security is valued at fair value, such value is likely to be different from the last quoted market price for the security. The determination of fair value often requires significant judgment. To determine fair value, management may use assumptions including but not limited to future cash flows and estimated risk premiums. Multiple inputs from various sources may be used to determine value.
Management establishes a hierarchy that prioritizes the inputs to valuation techniques used to measure fair value giving the highest priority to unadjusted quoted prices in active markets for identical securities (level 1 measurements) and the lowest priority to unobservable inputs (level 3 measurements) when market prices are not readily available or reliable. The three levels of the fair value hierarchy are described below:
• Level 1 – quoted prices in active markets for identical securities
• Level 2 – prices determined using other significant observable inputs (including quoted prices for similar securities, interest rates, prepayment speeds, credit risk and others)
• Level 3 – prices determined using significant unobservable inputs. In situations where quoted prices or observable inputs are unavailable or less reliable, unobservable inputs may be used. Unobservable inputs may include management's own assumptions about the factors market participants would use in pricing an investment.
The inputs or methodology used for valuing securities are not necessarily an indication of the risk associated with investing in those securities.
Security Transactions
Security transactions are accounted for on the trade date. Cost is determined and gains (losses) are based upon the specific identification method for both financial statement and federal income tax purposes.
Delayed Delivery Securities
The Fund may trade securities on other than normal settlement terms, including securities purchased or sold on a "when-issued" basis. This may increase the risk if the other party to the transaction fails to deliver and causes the Fund to subsequently invest at less advantageous prices. The Fund holds until the settlement date, in a segregated account, cash or liquid securities in an amount equal to the delayed delivery commitment.
Restricted Securities
Restricted securities are securities that may only be resold upon registration under federal securities laws or in transactions exempt from registration. In some cases, the issuer of restricted securities has agreed to register such securities for resale at the issuer's expense either upon demand by the Fund or in connection with another registered offering of the securities. Many restricted securities may be resold in the secondary market in transactions exempt from registration. Such restricted securities may be determined to be liquid under criteria established by the Board of Trustees. The Fund will not incur any registration costs upon such resale.
Income Recognition
Interest income is recorded on the accrual basis. Premium and discount are amortized and accreted, respectively, on all debt securities, unless otherwise noted. Original issue discount is accreted to interest income over the life of the security with a corresponding increase in the cost basis.
Dividend income is recorded on the ex-date.
Expenses
General expenses of the Trust are allocated to the Fund and other series of the Trust based upon relative net assets or other expense allocation methodologies determined by the nature of the expense. Expenses directly attributable to the Fund are charged to the Fund.
Determination of Class Net Asset Value
All income, expenses (other than class-specific expenses, as shown on the Statement of Operations) and realized and unrealized gains (losses) are allocated to each class of the Fund on a daily basis for purposes of determining the net asset value of each class. Income and expenses are allocated to each class based on the settled shares method, while realized and unrealized gains (losses) are allocated based on the relative net assets of each class.
28
Columbia California Tax-Exempt Fund, October 31, 2009
Federal Income Tax Status
The Fund intends to qualify each year as a "regulated investment company" under Subchapter M of the Internal Revenue Code, as amended, and will distribute substantially all of its tax exempt or taxable income, if any, for its tax year, and as such will not be subject to federal income taxes. In addition, the Fund intends to distribute in each calendar year substantially all of its net investment income, capital gains and certain other amounts, if any, such that the Fund should not be subject to federal excise tax. Therefore, no federal income or excise tax provision is recorded.
Distributions to Shareholders
Distributions from net investment income are declared daily and paid monthly. Net realized capital gains, if any, are distributed at least annually. Income distributions and capital gain distributions are determined in accordance with federal income tax regulations which may differ from GAAP.
Indemnification
In the normal course of business, the Fund enters into contracts that contain a variety of representations and warranties and which provide general indemnities. The Fund's maximum exposure under these arrangements is unknown because this would involve future claims against the Fund. Also, under the Trust's organizational documents and by contract, the Trustees and officers of the Trust are indemnified against certain liabilities that may arise out of actions relating to their duties to the Trust. However, based on experience, the Fund expects the risk of loss due to these representations, warranties and indemnities to be minimal.
Note 3. Federal Tax Information
The timing and character of income and capital gain distributions are determined in accordance with income tax regulations, which may differ from GAAP. Reclassifications are made to the Fund's capital accounts for permanent tax differences to reflect income and gains available for distribution (or available capital loss carryforwards) under income tax regulations.
For the year ended October 31, 2009, permanent book and tax basis differences resulting primarily from differing treatments for market discount reclassifications and discount accretion/premium amortization on debt securities were identified and reclassified among the components of the Fund's net assets as follows:
Undistributed
Net Investment
Income | | Accumulated
Net Realized
Gain | | Paid-In Capital | |
| $ | 3,873 | | | $ | 1,295 | | | $ | (5,168 | ) | |
Net investment income and net realized gains (losses), as disclosed on the Statement of Operations, and net assets were not affected by this reclassification.
The tax character of distributions paid during the years ended October 31, 2009 and October 31, 2008 was as follows:
| | | October 31, | |
| | | 2009 | | 2008 | |
| Tax-Exempt Income | | $ | 17,678,108 | | | $ | 18,139,735 | | |
| Ordinary Income* | | | 70,348 | | | | 302,206 | | |
| Long-Term Capital Gains | | | 410,720 | | | | 2,240,618 | | |
* For tax purposes short-term capital gains distributions, if any, are considered ordinary income distributions.
As of October 31, 2009, the components of distributable earnings on a tax basis were as follows:
Undistributed
Tax-Exempt
Income | | Undistributed
Long-Term
Capital Gains | | Net Unrealized
Appreciation* | |
| $ | 922,803 | | | $ | 1,153,225 | | | $ | 11,162,262 | | |
* The differences between book-basis and tax-basis net unrealized appreciation are primarily due to deferral of losses from discount accretion/premium amortization on debt securities.
Unrealized appreciation and depreciation at October 31, 2009, based on cost of investments for federal income tax purposes, were:
| Unrealized appreciation | | $ | 23,056,073 | | |
| Unrealized depreciation | | | (11,893,811 | ) | |
| Net unrealized appreciation | | $ | 11,162,262 | | |
Management is required to determine whether a tax position of the Fund is more likely than not to be sustained upon examination by the applicable taxing authority, including
29
Columbia California Tax-Exempt Fund, October 31, 2009
resolution of any related appeals or litigation processes, based on the technical merits of the position. The tax benefit to be recognized by the Fund is measured as the largest amount of benefit that is greater than fifty percent likely of being realized upon ultimate settlement. Management is not aware of any tax positions for which it is reasonably possible that the total amounts of unrecognized tax benefits will significantly change in the next twelve months. However, management's conclusions may be subject to review and adjustment at a later date based on factors including, but not limited to, new tax laws, regulations, and administrative interpretations (including relevant court decisions). The Fund's federal tax returns for the prior three fiscal years remain subject to examination by the Internal Revenue Service.
Note 4. Fees and Compensation Paid to Affiliates
Investment Advisory Fee
Columbia Management Advisors, LLC ("Columbia"), an indirect, wholly owned subsidiary of Bank of America Corporation ("BOA"), provides investment advisory, administrative and other services to the Fund. Columbia receives a monthly investment advisory fee based on the Fund's pro-rata portion of the combined average daily net assets of the Fund, Columbia Connecticut Tax-Exempt Fund, Columbia Massachusetts Tax-Exempt Fund and Columbia New York Tax-Exempt Fund, as follows:
| Combined Average Daily Net Assets | | Annual Fee Rate | |
| First $1 billion | | | 0.50 | % | |
| $1 billion to $3 billion | | | 0.45 | % | |
| Over $3 billion | | | 0.40 | % | |
For the year ended October 31, 2009, the Fund's effective investment advisory fee rate was 0.50% of the Fund's average daily net assets.
BOA entered into an agreement dated September 29, 2009 to sell a portion of the asset management business of Columbia Management Group, LLC to Ameriprise Financial, Inc. The transaction ("Transaction") includes a sale of the part of the asset management business that advises long-term mutual funds, including the Fund. The Transaction is subject to certain approvals and other conditions to closing, and is currently expected to close in the spring of 2010.
Pricing and Bookkeeping Fees
The Fund has entered into a Financial Reporting Services Agreement (the "Financial Reporting Services Agreement") with State Street Bank & Trust Company ("State Street") and Columbia pursuant to which State Street provides financial reporting services to the Fund. The Fund has also entered into an Accounting Services Agreement (collectively with the Financial Reporting Services Agreement, the "State Street Agreements") with State Street and Columbia pursuant to which State Street provides accounting services to the Fund. Under the State Street Agreements, the Fund pays State Street an annual fee of $38,000 paid monthly plus an additional monthly fee based on an annualized percentage rate of average daily net assets of the Fund for the month. The aggregate fee will not exceed $140,000 per year (exclusive of out-of-pocket expenses and charges). The Fund also reimburses State Street for certain out-of-pocket expenses and charge s.
The Fund has entered into a Pricing and Bookkeeping Oversight and Services Agreement (the "Services Agreement") with Columbia. Under the Services Agreement, Columbia provides services related to Fund expenses and the requirements of the Sarbanes-Oxley Act of 2002, and provides oversight of the accounting and financial reporting services provided by State Street. Under the Services Agreement, the Fund reimburses Columbia for out-of-pocket expenses.
Transfer Agent Fee
Columbia Management Services, Inc. (the "Transfer Agent"), an affiliate of Columbia and an indirect, wholly owned subsidiary of BOA, provides shareholder services to the Fund and has contracted with Boston Financial Data Services ("BFDS") to serve as sub-transfer agent. The Transfer Agent is entitled to receive a fee for its services, paid monthly, at the annual rate of $17.34 per account plus reimbursement of certain sub-transfer agent fees paid by the Transfer Agent (exclusive of BFDS fees), calculated based on assets held in omnibus accounts and intended to recover the cost of payments to other parties (including affiliates of BOA) for services to those accounts. Effective November 1, 2009, the annual rate changed to $22.36 per account. The Transfer Agent pays the fees of BFDS for services as sub-transfer agent and is not entitled to reimbursement for such fees from the Fund.
The Transfer Agent may also retain, as additional compensation for its services, fees for wire, telephone and
30
Columbia California Tax-Exempt Fund, October 31, 2009
redemption orders, Individual Retirement Account ("IRA") trustee agent fees and account transcript fees due to the Transfer Agent from shareholders of the Fund and credits (net of bank charges) earned with respect to balances in accounts the Transfer Agent maintains in connection with its services to the Fund. The Transfer Agent also receives reimbursement for certain out-of-pocket expenses.
An annual minimum account balance fee of $20 may apply to certain accounts with a value below the Fund's initial minimum investment requirements to reduce the impact of small accounts on transfer agent fees. These minimum account balance fees are recorded as part of expense reductions on the Statement of Operations. For the year ended October 31, 2009, there were no minimum account balance fees charged by the fund.
Underwriting Discounts, Service and Distribution Fees
Columbia Management Distributors, Inc. (the "Distributor"), an affiliate of Columbia and an indirect, wholly owned subsidiary of BOA, is the principal underwriter of the Fund's shares. For the year ended October 31, 2009, the Distributor has retained net underwriting discounts of $26,730 on sales of the Fund's Class A shares and received net CDSC fees of $74,882, $6,819 and $11,765 on Class A, Class B and Class C share redemptions, respectively.
The Fund has adopted distribution and shareholder servicing plans (the "Plans") pursuant to Rule 12b-1 under the 1940 Act, which require the payment of distribution and service fees. The fees are intended to compensate the Distributor and/or eligible selling and/or servicing agents for selling shares of the Fund and providing services to investors. The service fee is equal to 0.10% annually of the net assets attributable to shares of the Fund issued prior to December 1, 1994 and 0.25% annually of the net assets attributable to shares issued thereafter. This arrangement results in an annual rate of service fee for all shares that is a blend between the 0.10% and 0.25% rates. For the year ended October 31, 2009, the Fund's effective service fee rate was 0.24% of the Fund's average daily net assets attributable to Class A, Class B and Class C shares.
The Plans also require the payment of a monthly distribution fee to the Distributor equal to 0.75% annually of the average daily net assets attributable to Class B and Class C shares only. The Distributor has voluntarily agreed to waive a portion of the distribution fee for Class C shares so that it does not exceed 0.45% annually of the average daily net assets attributable to Class C shares. This arrangement may be modified or terminated by the Distributor at any time.
Fee Waivers and Expense Reimbursements
Columbia has voluntarily agreed to reimburse a portion of the Fund's expenses so that the Fund's ordinary operating expenses (excluding any distribution and service fees, brokerage commissions, interest, taxes and extraordinary expenses, but including custodian charges relating to overdrafts, if any), after giving effect to any balance credits from the Fund's custodian, do not exceed 0.60% of the Fund's average daily net assets on an annualized basis. Columbia, in its discretion, may revise or discontinue this arrangement any time.
Fees Paid to Officers and Trustees
All officers of the Fund are employees of Columbia or its affiliates and, with the exception of the Fund's Chief Compliance Officer, receive no compensation from the Fund. The Board of Trustees has appointed a Chief Compliance Officer to the Fund in accordance with federal securities regulations. The Fund, along with other affiliated funds, pays its pro-rata share of the expenses associated with the Chief Compliance Officer. The Fund's expenses for the Chief Compliance Officer will not exceed $15,000 per year.
The Trust's eligible Trustees may participate in a deferred compensation plan which may be terminated at any time. Obligations of the plan will be paid solely out of the Fund's assets.
As a result of a fund merger, the Fund assumed the liabilities of the deferred compensation plan of the acquired fund, which are included in "Trustees' fees" on the Statement of Assets and Liabilities. The deferred compensation plan may be terminated at any time. Any payments to plan participants are paid solely out of the Fund's assets.
Other
The Fund may make daily investments of cash balances in Columbia California Tax-Exempt Reserves, an affiliated open-ended investment company, pursuant to an exemptive order received from the Securities and Exchange Commission. As an investing Fund, the Fund indirectly bears its proportionate share of the expenses of Columbia California Tax-Exempt Reserves.
31
Columbia California Tax-Exempt Fund, October 31, 2009
Note 5. Custody Credits
The Fund has an agreement with its custodian bank under which custody fees may be reduced by balance credits. These credits are recorded as part of expense reductions on the Statement of Operations. The Fund could have invested a portion of the assets utilized in connection with the expense offset arrangement in an income-producing asset if it had not entered into such an agreement.
For the year ended October 31, 2009, these custody credits reduced total expenses by $1,574 for the Fund.
Note 6. Objectives and Strategies for Investing in Derivative Instruments
The Fund uses derivatives instruments including futures contracts in order to meet its investment objectives. The Fund employs strategies in differing combinations to permit it to increase, decrease or change the level of exposure to market risk factors. The achievement of any strategy relating to derivatives depends on analysis of various risk factors, and if the strategies for use of derivatives do not work as intended, the Fund may not achieve its investment objectives.
In pursuit of its investment objectives, the Fund is exposed to the following market risks:
Interest Rate Risk: Interest rate risk relates to the fluctuation in value of fixed income securities because of the inverse relationship of price and yield. Fixed income securities generally will decline in value upon an increase in general interest rates and their value generally will increase upon a decline in general interest rates. Fixed income securities with longer durations tend to be more sensitive to changes in interest rates, usually making them more volatile than securities with shorter durations.
Futures Contracts—The Fund entered into interest rate futures contracts to manage the duration and yield curve exposure of the Fund versus the benchmark.
The use of futures contracts involves certain risks, which include: (1) imperfect correlation between the price movement of the instruments and the underlying securities, (2) inability to close out positions due to differing trading hours, or the temporary absence of a liquid market, for either the instruments or the underlying securities, and (3) an inaccurate prediction of the future direction of interest rates by Columbia.
Upon entering into a futures contract, the Fund pledges cash or securities with the broker in an amount sufficient to meet the initial margin requirement. Subsequent payments are made or received by the Fund equal to the daily change in the contract value and are recorded as variation margin receivable or payable and offset in unrealized gains or losses. The Fund recognizes a realized gain or loss when the contract is closed or expires.
Futures contracts involve, to varying degrees, risk of loss in excess of the variation margin disclosed on the Fund's Statement of Assets and Liabilities.
During the year ended October 31, 2009, the Fund entered into 148 futures contracts. The Fund did not have any open futures contracts at the end of the year.
The effect of derivative instruments on the Statement of Operations for the year ended October 31, 2009.
| | | Amount of Realized Gain on
Derivatives Recognized in Income | |
| Risk Exposure | | Futures Contracts | |
| Interest Rate | | $ | 191,984 | | |
Note 7. Portfolio Information
For the year ended October 31, 2009, the cost of purchases and proceeds from sales of securities, excluding short-term obligations, for the Fund were $53,749,908 and $82,716,094, respectively.
Note 8. Line of Credit
The Fund and other affiliated funds participate in a $280,000,000 committed, unsecured revolving line of credit provided by State Street. The maximum amount that may be borrowed by any fund is limited to the lesser of $200,000,000 and the Fund's borrowing limit set forth in the Fund's registration statement. Borrowings are available for short-term liquidity or temporary or emergency purposes.
Effective October 15, 2009, interest is charged to each participating fund based on the fund's borrowings at a rate per annum equal to the greater of the Federal Funds Rate plus 1.25% or the overnight LIBOR Rate plus 1.25%. In addition, a commitment fee of 0.15% per annum is accrued and apportioned among the participating funds pro rata based on their relative net assets.
32
Columbia California Tax-Exempt Fund, October 31, 2009
Prior to October 15, 2009, interest was charged to each participating fund based on the fund's borrowings at a rate per annum equal to the greater of the Federal Funds Rate plus 0.50% or the overnight LIBOR Rate plus 0.50%. In addition, an annual operations agency fee of $20,000, an amendment fee of 0.02% and a commitment fee of 0.12% per annum were accrued and apportioned among the participating funds pro rata based on their relative net assets.
For the year ended October 31, 2009, the Fund did not borrow under these arrangements.
Note 9. Shares of Beneficial Interest
As of October 31, 2009, 23.6% of the Fund's shares outstanding were beneficially owned by one participant account over which BOA and/or any of its affiliates had either sole or joint investment discretion. On that date, no other shareholder owned more than 5% of the outstanding shares of the Fund.
Subscription and redemption activity of this account may have a significant effect on the operations of the Fund.
Note 10. Regulatory Settlements
As of October 31, 2009, the Fund was entitled to receive payments of $5,166 relating to certain regulatory settlements the Fund had participated in during the year. The payments have been included in "Increase from regulatory settlements" on the Statement of Changes in Net Assets.
Note 11. Significant Risks and Contingencies
Sector Focus Risk
The Fund may focus its investments in certain sectors, subjecting it to greater risk than a fund that is less focused.
Geographic Concentration Risk
The Fund had greater than 5% of its total net assets at October 31, 2009, invested in debt obligations issued by each of California and Puerto Rico and their political subdivisions, agencies and public authorities. The Fund is more susceptible to economic and political factors adversely affecting issuers of the state's or territory's municipal securities than are municipal bond funds that are not concentrated to the same extent in these issuers.
Concentration of Credit Risk
The Fund holds investments that are insured by private insurers who guarantee the payment of principal and interest in the event of default or that are supported by a letter of credit. At October 31, 2009, private insurers who insured greater than 5% of the total investments of the Fund were as follows:
| Insurer | | % of Total
Net Assets | |
| National Public Finance Guarantee Corp. | | | 17.7 | | |
| Ambac Assurance Corp. | | | 16.9 | | |
| Financial Security Assurance, Inc. | | | 8.6 | | |
At November 25, 2009, National Public Finance Guarantee Corp., Ambac Assurance Corp. and Financial Security Assurance, Inc. were rated by Standard & Poor's A, CC and AAA, respectively.
Tax Development Risk
The Fund purchases municipal securities whose interest, in the opinion of bond counsel, is free from federal income tax. There is no assurance that the Internal Revenue Service (IRS) will agree with this opinion. In the event the IRS determines that an issuer does not comply with relevant tax requirements, interest payments from a security could become federally taxable, possibly retroactively to the date the security was issued. As a shareholder of the Fund, you may be required to file an amended tax return as a result.
Legal Proceedings
Columbia Management Advisors, LLC and Columbia Management Distributors, Inc. (collectively, the "Columbia Group") are subject to a settlement agreement with the New York Attorney General ("NYAG") (the "NYAG Settlement") and a settlement order with the SEC (the "SEC Order") on matters relating to mutual fund trading, each dated February 9, 2005. Under the terms of the SEC Order, the Columbia Group (or predecessor entities) agreed, among other things, to: pay disgorgement and civil money penalties collectively totaling $140 million; cease and desist from violations of the antifraud provisions and certain other provisions of the federal securities laws; maintain certain compliance and ethics oversight structures; and retain an independent consultant to review the Columbia Group's applicable supervisory,
33
Columbia California Tax-Exempt Fund, October 31, 2009
compliance, control and other policies and procedures. The NYAG Settlement, among other things, requires Columbia Management Advisors, LLC and its affiliates to reduce management fees for certain funds in the Columbia family of mutual funds in a projected total of $160 million over five years through November 30, 2009 and to make certain disclosures to investors relating to expenses. In connection with the Columbia Group providing services to the Columbia Funds, the Columbia Funds have voluntarily undertaken to implement certain governance measures designed to maintain the independence of their boards of trustees and certain special consulting and compliance measures.
Pursuant to the SEC Order and related procedures, the $140 million in settlement amounts described above has been substantially distributed in accordance with a distribution plan that was developed by an independent distribution consultant and approved by the SEC on April 6, 2007.
In connection with the events described above, various parties have filed suit against certain funds, the Trustees of the Columbia Funds, FleetBoston Financial Corporation and its affiliated entities and/or Bank of America and its affiliated entities.
On February 20, 2004, the Judicial Panel on Multidistrict Litigation transferred these cases and cases against other mutual fund companies based on similar allegations to the United States District Court in Maryland for consolidated or coordinated pretrial proceedings (the "MDL"). Subsequently, additional related cases were transferred to the MDL. On September 29, 2004, the plaintiffs in the MDL filed amended and consolidated complaints. One of these amended complaints is a putative class action that includes claims under the federal securities laws and state common law, and that names Columbia Management Advisors, Inc. (which has since merged into Banc of America Capital Management, LLC (now named Columbia Management Advisors, LLC)) ("Columbia"), Columbia Funds Distributor, Inc. (now named Columbia Management Distributors, Inc.) (the "Distributor"), the Trustees of the Columbia Funds, Bank of America Corporation and others as d efendants. Another of the amended complaints is a derivative action purportedly on behalf of the Columbia Funds that asserts claims under federal securities laws and state common law.
On February 25, 2005, Columbia and other defendants filed motions to dismiss the claims in the pending cases. On March 1, 2006, for reasons stated in the court's memoranda dated November 3, 2005, the United States District Court for the District of Maryland granted in part and denied in part the defendants' motions to dismiss. The court dismissed all of the class action claims pending against the Columbia Funds Trusts. As to Columbia and the Distributor, the claims under the Securities Act of 1933, the claims under Sections 34(b) and 36(a) of the Investment Company Act of 1940 ("ICA") and the state law claims were dismissed. The claims under Sections 10(b) and 20(a) of the Securities Exchange Act of 1934 and claims under Section 36(b) of the ICA were not dismissed.
On March 21, 2005, a purported class action was filed in Massachusetts state court alleging that certain conduct, including market timing, entitled Class B shareholders in certain Columbia Funds to an exemption from contingent deferred sales charges upon early redemption (the "CDSC Lawsuit"). The CDSC Lawsuit was removed to federal court in Massachusetts and transferred to the MDL.
On September 14, 2007, the plaintiffs and the Columbia defendants named in the MDL, including the Columbia Funds, entered into a stipulation of settlement with respect to all Columbia-related claims in the MDL described above, including the CDSC Lawsuit. The settlement is subject to court approval.
34
Report of Independent Registered Public Accounting Firm
To the Trustees of Columbia Funds Series Trust I and the Shareholders of Columbia California Tax-Exempt Fund:
In our opinion, the accompanying statement of assets and liabilities, including the investment portfolio, and the related statements of operations and of changes in net assets and the financial highlights present fairly, in all material respects, the financial position of Columbia California Tax-Exempt Fund (the "Fund") (a series of Columbia Funds Series Trust I) at October 31, 2009, the results of its operations for the year then ended, the changes in its net assets for each of the two years in the period then ended and the financial highlights for the periods indicated, in conformity with accounting principles generally accepted in the United States of America. These financial statements and financial highlights (hereafter referred to as "financial statements") are the responsibility of the Fund's management. Our responsibility is to express an opinion on these financial statements based on our audits. We conducted our audits of these financial statements in accordance with the standards of the Public Company Accounting Oversight Board (United States). Those standards require that we plan and perform the audit to obtain reasonable assurance about whether the financial statements are free of material misstatement. An audit includes examining, on a test basis, evidence supporting the amounts and disclosures in the financial statements, assessing the accounting principles used and significant estimates made by management, and evaluating the overall financial statement presentation. We believe that our audits, which included confirmation of securities at October 31, 2009 by correspondence with the custodian and brokers, provide a reasonable basis for our opinion.
PricewaterhouseCoopers LLP
Boston, Massachusetts
December 18, 2009
35
Federal Income Tax Information (Unaudited)
The Fund hereby designates as a capital gain dividend with respect to the fiscal year ended October 31, 2009, $1,270,411, or, if subsequently determined to be different, the net capital gain of such year.
For the fiscal year ended October 31, 2009, 99.60% of the distributions from net investment income of the Fund qualifies as exempt interest dividends for federal income tax purposes. A portion of the income may be subject to federal alternative minimum tax.
The Fund will notify shareholders in January 2010 of amounts for use in preparing 2009 income tax returns.
36
Fund Governance – Columbia California Tax-Exempt Fund
The Trustees serve terms of indefinite duration. The names, addresses and ages of the Trustees and officers of the Funds in Columbia Funds Series Trust I, the year each was first elected or appointed to office, their principal business occupations during at least the last five years, the number of Funds overseen by each Trustee and other directorships they hold are shown below. Each officer listed below serves as an officer of each Fund in the Columbia Funds Complex.
Independent Trustees
Name, Address and Year of Birth,
Position with Funds, Year First
Elected or Appointed to Office | | Principal Occupation(s) During Past Five Years, Number of Funds in the Columbia
Funds Complex Overseen by Trustee, Other Directorships Held
| |
| John D. Collins (Born 1938) | |
|
c/o Columbia Management
Advisors, LLC
One Financial Center
Boston, MA 02111
Trustee (since 2007) | | Retired. Consultant, KPMG, LLP (accounting and tax firm) from July 1999 to June 2000; Partner, KPMG, LLP from March 1962 to June 1999. Oversees 66, Mrs. Fields Famous Brands LLC (consumer products); Suburban Propane Partners, L.P.; and Montpelier Re (insurance underwriting firm) | |
|
| Rodman L. Drake (Born 1943) | |
|
c/o Columbia Management
Advisors, LLC
One Financial Center
Boston, MA 02111
Trustee (since 2007)
and Chairman of the Board
(since 2009) | | Co-Founder of Baringo Capital LLC (private equity) since 2002; President, Continuation Investments Group, Inc. from 1997 to 2001. Oversees 66, Jackson Hewitt Tax Service Inc. (tax preparation services); Crystal Capital River Inc. (real estate investment trust); Student Loan Corporation (student loan provider); Celgene Corporation (global biotechnology company); and The Helios Funds (exchange-traded funds) | |
|
| Douglas A. Hacker (Born 1955) | |
|
c/o Columbia Management
Advisors, LLC
One Financial Center
Boston, MA 02111
Trustee (since 1996) | | Independent business executive since May 2006; Executive Vice President—Strategy of United Airlines (airline) from December 2002 to May 2006; President of UAL Loyalty Services (airline marketing company) from September 2001 to December 2002; Executive Vice President and Chief Financial Officer of United Airlines from July 1999 to September 2001. Oversees 66, Nash Finch Company (food distributor); Aircastle Limited (aircraft leasing) | |
|
| Janet Langford Kelly (Born 1957) | |
|
c/o Columbia Management
Advisors, LLC
One Financial Center
Boston, MA 02111
Trustee (since 1996) | | Senior Vice President, General Counsel and Corporate Secretary, ConocoPhillips (integrated energy company) since September 2007; Deputy General Counsel—Corporate Legal Services, ConocoPhillips from August 2006 to August 2007; Partner, Zelle, Hofmann, Voelbel, Mason&Gette LLP (law firm) from March 2005 to July 2006; Adjunct Professor of Law, Northwestern University, from September 2004 to June 2006; Director, UAL Corporation (airline) from February 2006 to July 2006; Oversees 66, None | |
|
| Charles R. Nelson (Born 1942) | |
|
c/o Columbia Management
Advisors, LLC
One Financial Center
Boston, MA 02111
Trustee (since 1981) | | Professor of Economics, University of Washington, since January 1976; Ford and Louisa Van Voorhis Professor of Political Economy, University of Washington, since September 1993; Adjunct Professor of Statistics, University of Washington, since September 1980; Associate Editor, Journal of Money Credit and Banking, 1993-2008 Consultant on econometric and statistical matters. Oversees 66, None | |
|
37
Fund Governance (continued) – Columbia California Tax-Exempt Fund
Independent Trustees (continued)
Name, Address and Year of Birth,
Position with Funds, Year First
Elected or Appointed to Office | | Principal Occupation(s) During Past Five Years, Number of Funds in the Columbia
Funds Complex Overseen by Trustee, Other Directorships Held
| |
| John J. Neuhauser (Born 1943) | |
|
c/o Columbia Management
Advisors, LLC
One Financial Center
Boston, MA 02111
Trustee (since 1985) | | President, Saint Michael's College, since August 2007; University Professor, Boston College from November 2005 to August 2007; Academic Vice President and Dean of Faculties, Boston College from August 1999 to October 2005. Oversees 66, Liberty All-Star Equity Fund and Liberty All-Star Growth Fund, Inc. (closed-end funds) | |
|
| Jonathan Piel (Born 1938) | |
|
c/o Columbia Management
Advisors, LLC
One Financial Center
Boston, MA 02111
Trustee (since 2007) | | Cable television producer and website designer; The Editor, Scientific American from 1984 to 1994; Vice President, Scientific American, Inc., from 1984 to 1994; Member, Advisory Board, Stone Age Institute, Bloomington, Indiana (research institute that explores the effect of technology on human evolution); Member, Board of Directors of the National Institute of Social Sciences, New York City; Member, Board of Trustees of the William Alanson White Institute, New York City (institution for training psychoanalysts); and Member, Advisory Board, Mount Sinai Children's Environmental Health Center, New York. Oversees 66, None | |
|
| Patrick J. Simpson (Born 1944) | |
|
c/o Columbia Management
Advisors, LLC
One Financial Center
Boston, MA 02111
Trustee (since 2000) | | Partner, Perkins Coie LLP (law firm). Oversees 66, None | |
|
| Thomas C. Theobald (Born 1937) | |
|
c/o Columbia Management
Advisors, LLC
One Financial Center
Boston, MA 02111
Trustee (since 1996) | | Partner and Senior Advisor, Chicago Growth Partners (private equity investing) since September 2004; Managing Director, William Blair Capital Partners (private equity investing) from September 1994 to September 2004. Oversees 66, Anixter International (network support equipment distributor); Ventas, Inc. (real estate investment trust); Jones Lang LaSalle (real estate management services); Ambac Financial Group (financial guaranty insurance) | |
|
| Anne-Lee Verville (Born 1945) | |
|
c/o Columbia Management
Advisors, LLC
One Financial Center
Boston, MA 02111
Trustee (since 1998) | | Retired since 1997 (formerly General Manager—Global Education Industry (from 1994 to 1997), President-Application Systems Division (from 1991 to 1994), Chief Financial Officer—US Marketing&Services (from 1988 to 1991), and Chief Information Officer (from 1987 to 1988), IBM Corporation (computer and technology)). Oversees 66, None | |
|
38
Fund Governance (continued) – Columbia California Tax-Exempt Fund
Interested Trustee
Name, Address and Year of Birth,
Position with Funds, Year First
Elected or Appointed to Office | | Principal Occupation(s) During Past Five Years, Number of Funds in the Columbia
Funds Complex Overseen by Trustee, Other Directorships Held
| |
| William E. Mayer1 (Born 1940) | |
|
c/o Columbia Management
Advisors, LLC
One Financial Center
Boston, MA 02111
Trustee (since 1994) | | Partner, Park Avenue Equity Partners (private equity) since February 1999; Dean and Professor, College of Business, University of Maryland from 1992 to 1997. Oversees 66, Lee Enterprises (print media),WRHambrecht + Co. (financial service provider); BlackRock Kelso Capital Corporation (investment company) | |
|
1 The Funds currently treat Mr. Mayer as an "interested person" (as defined in the Investment Company Act of 1940) by reason of his affiliation with WR Hambrecht + Co., a registered broker/dealer that may execute portfolio transactions for or engage in principal transactions with the Funds or other funds or accounts advised/managed by the Advisor or other Bank of America affiliates.
The Statement of Additional Information includes additional information about the Trustees of the Funds and is available, without charge, upon request by calling 1-800-345-6611.
Officers
Name, Address and Year of Birth,
Position with Funds, Year First
Elected or Appointed to Office | | Principal Occupation(s) During Past Five Years
| |
| J. Kevin Connaughton (Born 1964) | |
|
One Financial Center
Boston, MA 02111
President (since 2009) | | Managing Director of Columbia Management Advisors, LLC since December 2004; Senior Vice President and Chief Financial Officer—Columbia Funds, from June 2008 to January 2009; Treasurer—Columbia Funds, from October 2003 to May 2008; Treasurer—the Liberty Funds, Stein Roe Funds and Liberty All-Star Funds, December 2000-December 2006; Senior Vice President—Columbia Management Advisors, LLC, from April 2003 to December 2004; President—Columbia Funds, Liberty Funds and Stein Roe Funds, February 2004 to October 2004; Treasurer—Galaxy Funds, September 2002 to December 2005; Treasurer, December 2002 to December 2004, and President, February 2004 to December 2004—Columbia Management Multi-Strategy Hedge Fund, LLC; and a senior officer of various other Bank of America-affiliated entities, including other registered and unregistered funds. | |
|
| James R. Bordewick, Jr. (Born 1959) | |
|
One Financial Center
Boston, MA 02111
Senior Vice President, Secretary
and Chief Legal Officer (since 2006) | | Associate General Counsel, Bank of America since April 2005; Senior Vice President and Associate General Counsel, MFS Investment Management (investment management) prior to April 2005. | |
|
| Linda J. Wondrack (Born 1964) | |
|
One Financial Center
Boston, MA 02111
Senior Vice President and
Chief Compliance Officer
(since 2007) | | Director (Columbia Management Group LLC and Investment Product Group Compliance), Bank of America since June 2005; Director of Corporate Compliance and Conflicts Officer, MFS Investment Management (investment management), August 2004 to May 2005; Managing Director, Deutsche Asset Management (investment management) prior to August 2004. | |
|
39
Fund Governance (continued) – Columbia California Tax-Exempt Fund
Officers (continued)
Name, Address and Year of Birth,
Position with Funds, Year First
Elected or Appointed to Office | | Principal Occupation(s) During Past Five Years
| |
| Michael G. Clarke (Born 1969) | |
|
One Financial Center
Boston, MA 02111
Senior Vice President and
Chief Financial Officer
(since 2009) | | Director of Fund Administration of the Advisor since January 2006; Managing Director of the Advisor September 2004 to December 2005; Vice President Fund Administration June 2002 to September 2004. | |
|
| Jeffrey R. Coleman (Born 1969) | |
|
One Financial Center
Boston, MA 02111
Deputy Treasurer (since 2006) | | Director of Fund Administration of the Advisor since January 2006; Fund Controller of the Advisor from October 2004 to January 2006; Vice President of CDC IXIS Asset Management Services, Inc. (investment management) from August 2000 to September 2004. | |
|
| Joseph F. DiMaria (Born 1968) | |
|
One Financial Center
Boston, MA 02111
Chief Accounting Officer and
Treasurer (since 2009) | | Director of Fund Administration of the Advisor since January 2006; Head of Tax/Compliance and Assistant Treasurer of the Advisor from November 2004 to December 2005; Director of Trustee Administration (Sarbanes-Oxley) of the Advisor from May 2003 to October 2004. | |
|
| Julian Quero (Born 1967) | |
|
One Financial Center
Boston, MA 02111
Deputy Treasurer (since 2008) | | Senior Tax Manager of the Advisor since August 2006; Senior Compliance Manager of the Advisor from April 2002 to August 2006. | |
|
| Barry S. Vallan (Born 1969) | |
|
One Financial Center
Boston, MA 02111
Controller (since 2006) | | Vice President—Fund Treasury of the Advisor since October 2004; Vice President—Trustee Reporting of the Advisor from April 2002 to October 2004. | |
|
| Stephen T. Welsh (Born 1957) | |
|
One Financial Center
Boston, MA 02111
Vice President (since 1996) | | President, Columbia Management Services, Inc. since July 2004; Senior Vice President and Controller, Columbia Management Services, Inc. prior to July 2004. | |
|
40
Board Consideration and Approval of Advisory Agreements
The Advisory Fees and Expenses Committee of the Board of Trustees meets several times annually to review the advisory agreements (collectively, the "Agreements") of the funds for which the Trustees serve as trustees (each a "fund") and to determine whether to recommend that the full Board approve the continuation of the Agreements for an additional one-year period. After the Committee has made its recommendation, the full Board, including the Independent Trustees, determines whether to approve the continuation of the Agreements. In addition, the full Board, including the Independent Trustees, considers matters bearing on the Agreements at most of its other meetings throughout the year and meets regularly with senior management of the funds and Columbia, the funds' investment adviser, including the senior manager of each investment area within Columbia. Through the Board's Investment Oversight Committees, Trustees also meet with selected fund portfolio managers, research analysts and traders at various times throughout the year.
The Trustees receive and review all materials that they, their legal counsel or Columbia believe to be reasonably necessary for the Trustees to evaluate the Agreements and to determine whether to approve the continuation of the Agreements. Those materials generally include, among other items, (i) information on the investment performance of each fund relative to the performance of peer groups of mutual funds and the fund's performance benchmarks, and additional information assessing performance on a risk-adjusted basis, (ii) information on each fund's advisory fees and other expenses, including information comparing the fund's expenses to those of peer groups of mutual funds and information about any applicable expense caps and fee "breakpoints," (iii) information about the profitability of the Agreements to Columbia, including potential "fall-out" or ancillary benefits that Columbia and its affiliates may receive as a result of their relationships with the funds and (iv) information obtained through Columbia's response to a questionnaire prepared at the request of the Trustees by counsel to the funds and independent legal counsel to the Independent Trustees. The Trustees also consider other information such as (v) Columbia's financial results and financial condition, (vi) each fund's investment objective and strategies and the size, education and experience of Columbia's investment staffs and their use of technology, external research and trading cost measurement tools, (vii) the allocation of the funds' brokerage and the use of "soft" commission dollars to pay for research products and services, (viii) Columbia's resources devoted to, and its record of compliance with, the funds' investment policies and restrictions, policies on personal securities transactions and other compliance policies and legal and regulatory requirements, (ix) Columbia's response to va rious legal and regulatory proceedings since 2003 and to the recent period of volatility in the securities markets and (x) the economic outlook generally and for the mutual fund industry in particular. In addition, the Advisory Fees and Expenses Committee confers with the funds' independent fee consultant and reviews materials relating to the funds' relationships with Columbia provided by the independent fee consultant. Throughout the process, the Trustees have the opportunity to ask questions of and to request additional materials from Columbia and to consult with the independent fee consultant and independent legal counsel to the Independent Trustees.
The Board of Trustees most recently approved the continuation of the Agreements at its October, 2009 meeting, following meetings of the Advisory Fees and Expenses Committee held in December, 2008 and February, May, June, August, September and October, 2009. In considering whether to approve the continuation of the Agreements, the Trustees, including the Independent Trustees, did not identify any single factor as determinative, and each weighed various factors as he or she deemed appropriate. The Trustees considered the following matters in connection with their approval of the continuation of the Agreements:
The nature, extent and quality of the services provided to the funds under the Agreements. The Trustees considered the nature, extent and quality of the services provided by Columbia and its affiliates to the funds and the resources dedicated to the funds by Columbia and its affiliates. Among other things, the Trustees considered (i) Columbia's ability (including its personnel and other resources, compensation programs for personnel involved in fund management, reputation and other attributes) to attract, motivate and retain highly qualified research, advisory and supervisory investment professionals; (ii) the portfolio management services provided by those investment professionals; and (iii) the trade execution services provided on behalf of the funds. For each fund, the Trustees also considered the benefits to shareholders of investing in a mutual f und that is part of a
41
family of funds offering exposure to a variety of asset classes and investment disciplines and providing a variety of fund and shareholder services. After reviewing those and related factors, the Trustees concluded, within the context of their overall conclusions regarding each of the Agreements, that the nature, extent and quality of services provided supported the continuation of the Agreements.
Investment performance of the funds and Columbia. The Trustees reviewed information about the performance of each fund over various time periods, including information prepared by an independent third-party data provider that compared the performance of each fund to the performance of peer groups of mutual funds and performance benchmarks. The Trustees also reviewed a description of the third party's methodology for identifying each fund's peer group for purposes of performance and expense comparisons. The Trustees also considered additional information that the Advisory Fees and Expenses Committee requested from Columbia relating to funds that presented relatively weaker performance and/or relatively higher fees or expenses. In the case of each fund whose performance lagged that of a relevant peer group for certain (although not necessarily all) peri ods, the Trustees concluded that other factors relevant to performance were sufficient, in light of other considerations, to warrant continuation of the fund's Agreements. Those factors varied from fund to fund, but included one or more of the following: (i) that the fund's performance, although lagging in certain recent periods, was stronger over the longer term; (ii) that the underperformance was attributable, to a significant extent, to investment decisions that were reasonable and consistent with the fund's investment strategy and policies and that the fund was performing within a reasonable range of expectations, given those investment decisions, market conditions and the fund's investment strategy; (iii) that the fund's performance was competitive when compared to other relevant performance benchmarks or peer groups; (iv) that Columbia had taken or was taking steps designed to help improve the fund's investment performance, including, but not limited to, replacing portfolio managers or modifying invest ment strategies; and (v) that Columbia proposed to waive advisory fees or cap the expenses of the fund.
The Trustees noted that, through April 30, 2009, Columbia California Tax-Exempt Fund's performance was in the first quintile (where the best performance would be in the first quintile) for the one-, three-, five- and ten-year periods, of the peer group selected by an independent third-party data provider for purposes of performance comparisons.
The Trustees also considered Columbia's performance and reputation generally, the funds' performance as a fund family generally, and Columbia's historical responsiveness to Trustee concerns about performance and Columbia's willingness to take steps intended to improve performance. After reviewing those and related factors, the Trustees concluded, within the context of their overall conclusions regarding each of the Agreements, that the performance of each fund and Columbia was sufficient, in light of other considerations, to warrant the continuation of the Agreement(s) pertaining to that fund.
The costs of the services provided and profits realized by Columbia and its affiliates from their relationships with the funds. The Trustees considered the fees charged to the funds for advisory services as well as the total expense levels of the funds. That information included comparisons (provided by management and by an independent third-party data provider) of each fund's advisory fees and total expense levels to those of the fund's peer groups and information about the advisory fees charged by Columbia to comparable institutional accounts. In considering the fees charged to those accounts, the Trustees took into account, among other things, management's representations about the differences between managing mutual funds as compared to other types of accounts, including differences in the services provided, differences in the risk profile of such business for Columbia, and the additional resources required to manage mutual funds effectively. In evaluating each fund's advisory fees, the Trustees also took into account the demands, complexity and quality of the investment management of the fund. The Trustees considered existing advisory fee breakpoints, and Columbia's use of advisory fee waivers and expense caps, which benefited a number of the funds. The Trustees also noted management's stated justification for the fees charged to the funds, which included information about the investment performance of the funds and the services provided to the funds.
The Trustees considered that Columbia California Tax-Exempt Fund's total expenses were in the fourth quintile and actual
42
management fees were in the third quintile (where the lowest fees and expenses would be in the first quintile) of the peer group selected by an independent third-party data provider for purposes of expense comparisons.
The Trustees also considered the compensation directly or indirectly received by Columbia and its affiliates from their relationships with the funds. The Trustees reviewed information provided by management as to the profitability to Columbia and its affiliates of their relationships with each fund, and information about the allocation of expenses used to calculate profitability. When reviewing profitability, the Trustees also considered court cases in which adviser profitability was an issue in whole or in part, the performance of the relevant funds, the expense level of each fund, and whether Columbia had implemented breakpoints and/or expense caps with respect to the fund.
After reviewing those and related factors, the Trustees concluded, within the context of their overall conclusions regarding each of the Agreements, that the advisory fees charged to each fund, and the related profitability to Columbia and its affiliates of their relationships with the fund, supported the continuation of the Agreement(s) pertaining to that fund.
Economies of Scale. The Trustees considered the existence of any economies of scale in the provision by Columbia of services to each fund, to groups of related funds, and to Columbia's investment advisory clients as a whole and whether those economies were shared with the funds through breakpoints in the investment advisory fees or other means, such as fee waivers/expense reductions and additional investments by Columbia in investment, trading and compliance resources. The Trustees noted that many of the funds benefited from breakpoints, fee waivers/expense caps, or both. In considering those issues, the Trustees also took note of the costs of the services provided (both on an absolute and a relative basis) and the profitability to Columbia and its affiliates of their relationships with the funds, as discussed above.
After reviewing those and related factors, the Trustees concluded, within the context of their overall conclusions regarding each of the Agreements, that the extent to which economies of scale were shared with the funds supported the continuation of the Agreements.
Other Factors. The Trustees also considered other factors, which included but were not limited to the following:
n the extent to which each fund had operated in accordance with its investment objective and investment restrictions, the nature and scope of the compliance programs of the funds and Columbia and the compliance-related resources that Columbia and its affiliates were providing to the funds;
n the nature, quality, cost and extent of administrative and shareholder services overseen and performed by Columbia and its affiliates, both under the Agreements and under separate agreements for the provision of transfer agency and administrative services;
n so-called "fall-out benefits" to Columbia and its affiliates, such as the engagement of its affiliates to provide distribution, brokerage and transfer agency services to the funds, and the benefits of research made available to Columbia by reason of brokerage commissions generated by the funds' securities transactions, as well as possible conflicts of interest associated with those fall-out and other benefits, and the reporting, disclosure and other processes in place to disclose and monitor those possible conflicts of interest; and
n the report provided by the funds' independent fee consultant, which included information about and analysis of the funds' fees, expenses and performance.
Based on their evaluation of all factors that they deemed to be material, including those factors described above, and assisted by the advice of independent counsel and the independent fee consultant, the Trustees, including the Independent Trustees, approved the continuance of each of the Agreements through October 31, 2010.
43
Summary of Management Fee Evaluation by
Independent Fee Consultant
[EXCERPTS FROM:] REPORT OF INDEPENDENT FEE CONSULTANT TO THE FUNDS SUPERVISED BY THE COLUMBIA ATLANTIC BOARD
Prepared Pursuant to the February 9, 2005
Assurance of Discontinuance among the
Office of Attorney General of New York State,
Columbia Management Advisors, LLC, and
Columbia Management Distributors, Inc.
November 6, 2009
I. Overview
On February 9, 2005, Columbia Management Advisors, LLC ("CMA") and Columbia Management Distributors, Inc.1 ("CMDI") agreed to the New York Attorney General's Assurance of Discontinuance ("AOD"). Among other things, the AOD stipulates that CMA may manage or advise a Columbia Fund ("Columbia Fund" and, together with some or all of such funds, the "Columbia Funds") only if the Independent Members of the Columbia Fund's Board of Trustees appoint a Senior Officer or retain an Independent Fee Consultant ("IFC") who is to manage the process by which proposed management fees are negotiated. The AOD further stipulates that the Senior Officer or IFC is to prepare a written annual evaluation of the fee negotiation process.
With effect from January 1, 2007, the Independent Members of the Board of Trustees for certain Columbia Funds known collectively as the "Atlantic Funds" (together with the other members of that Board, the "Trustees") retained me as IFC for the Atlantic Funds.2 In this capacity, I have prepared the fifth annual written evaluation of the fee negotiation process. As was the case with the 2007 and 2008 reports, my immediate predecessor as IFC, John Rea, provided invaluable assistance in the preparation of this year's report.
A. Role of the Independent Fee Consultant
The AOD charges the IFC with "managing the process by which proposed management fees...to be charged the Columbia Fund are negotiated so that they are negotiated in a manner which is at arms' length and reasonable and consistent with this Assurance of Discontinuance." The AOD also provides that CMA "may manage or advise a Columbia Fund only if the reasonableness of the proposed management fees is determined by the Board of Trustees...using...an annual independent written evaluation prepared by or under the direction of...the Independent Fee Consultant." Therefore, the AOD makes clear that the IFC does not supplant the Trustees in negotiating management fees with CMA, nor does the IFC substitute his or her judgment for that of the Trustees with respect to the reasonableness of proposed fees or any other matter that is committed to the business judgment of the Trustees.
B. Elements Involved in Managing the Fee Negotiation Process
In preparing the report required by the AOD, the IFC must consider at least the following six factors set forth in the AOD:
1. The nature and quality of CMA's services, including the Fund's performance;
2. Management fees (including any components thereof) charged by other mutual fund companies for like services;
3. Possible economies of scale as the Fund grows larger;
4. Management fees (including any components thereof) charged to institutional and other clients of CMA for like services;
5. Costs to CMA and its affiliates of supplying services pursuant to the management fee agreements, excluding any intra-corporate profit; and
6. Profit margins of CMA and its affiliates from supplying such services.
C. Organization of the Annual Evaluation
This report, like last year's, focuses on the six factors and contains a section for each factor except that CMA's costs and profits from managing the Funds are treated in a single section. In addition to a discussion of these factors, the report offers recommendations to improve the fee review process in future years. A review of the status of recommendations made in the 2008 Report is being provided separately with the materials for the October meeting.
1 CMA and CMDI are subsidiaries of Columbia Management Group, LLC ("CMG"), and are the successors to the entities named in the AOD.
2 I have no material relationship with Bank of America, CMG or any of its affiliates, aside from serving as IFC, and I am aware of no material relationship with any of their affiliates. I retained John Rea, an independent economic consultant, to assist me with this report.
Unless otherwise stated or required by the context, this report covers only the Atlantic Funds, which are also referred as the "Funds."
44
II. Summary of Findings
A. General
1. Based upon my examination of the information supplied by CMG in the light of the six factors set forth in the AOD, I conclude that the Trustees have the relevant information necessary to evaluate the reasonableness of the proposed management fees for each Atlantic Fund.
2. In my view, the process by which the proposed management fees of the Funds have been negotiated in 2009 thus far has been, to the extent practicable, at arms' length and reasonable and consistent with the AOD.
B. Nature and Quality of Services, Including Performance
3. The performance of the Funds has been relatively strong in recent years, although the one-year record was weaker than longer-term records. Based upon 1-, 3-, 5-, and 10-year returns through April 30, 2009, at least half of all the Funds were in the first and second performance quintiles in each of the three longest performance periods; for the one-year period, 40% of the Funds were in the top two quintiles. No more than 13% of the Funds were in the fifth quintile in any one performance period. Domestic equity, quantitative equity, and taxable fixed-income Funds were the strongest performers in 2009, while most foreign equity Funds lagged behind their competitors.
4. Performance rankings were similar in 2008 and 2009: the 1- and 3-year rankings declined slightly over the previous year, while the 5-year rankings improved modestly. Year over year, for the 1- and 3-year periods, the performance of equity Funds, both domestic and international, declined, while that of fixed-income Funds improved. Between three-fifths to two-thirds of the Funds changed quintile rankings in 2009 in the 1-, 3-, and 5-year performance periods.
5. The performance of the domestic equity Funds against their benchmarks was good for the 3- and 5-year performance periods. In contrast, gross returns of international equity and fixed-income Funds typically fell short of their benchmarks. The performance of equity Funds against their benchmarks was highly correlated to performance versus their peers; no such correlation was observed for fixed-income Funds.
6. The Atlantic equity Funds' overall performance adjusted for risk was solid. Based upon 3-year returns, nearly 57% of the equity Funds had a combination of risk-adjusted and unadjusted returns that placed them in the top half of their performance universes. About one quarter of the fixed-income Funds posted high returns and low risk relative to comparable funds. Just over half of the fixed-income Funds, primarily tax-exempt Funds, took on more risk than the typical fund in their performance universes.
7. The industry-standard procedure used by Lipper that includes all share classes in the performance universe tends to bias a Fund's ranking upward within that universe. The bias occurs because either no-12b-1 fee or low-12b-1 fee share classes of the Atlantic Funds are compared with funds in performance universes that include all share classes of multi-class funds with 12b-1 fees of up to 100 basis points. Correcting this bias by limiting the performance universe to classes of comparable funds with low or no 12b-1 fees (a "filtered universe") lowers the relative performance for the Funds, but not to a material extent. The filtering process, however, did identify one Fund for further review that had not been identified as a review fund using unfiltered universes. Conversely, two Funds that had been identified as review funds in the unfiltered universe lost that status in filtered universes.
8. A small number of Funds have consistently underperformed over the past five years. The exact number depends on the criteria used to evaluate longer-term performance. For example, only three Funds had below-median performance in each 1- and 3-year period from 2005 to 2009.
9. The services performed by CMG professionals beyond portfolio management, such as compliance, legal, information technology, risk management, finance, and fund administration, are critical to the success of the Funds and appear to be of high quality.
C. Management Fees Charged by Other Mutual Fund Companies
10. The Funds' management fees and total expenses are generally low relative to those of their peers, with over half of the Funds in the most favorable two quintiles. Only 26% of the Funds ranked in the two most expensive quintiles for actual management fees, and 18% in those quintiles for total expenses. Two Funds are in the fifth quintile for total expenses; four Funds are in the fifth quintile for actual management fees.
45
11. The highest concentration of low-expense Funds is found among the foreign equity Funds. The 12 former Excelsior Funds have relatively high fees and expenses, with two-thirds ranking in either the fourth or fifth quintiles for actual management fees. The higher actual management fee rankings of certain former Excelsior Funds are due in part to fee schedules that are higher than standard Columbia Fund fee schedules at current asset levels.
12. The distribution of total expense and management fee rankings has improved over the prior two years. The implementation of the voluntary standardized cap system has contributed significantly to the improved rankings in 2009.
13. The management fees of the Atlantic Funds are generally in line with those of Columbia Funds supervised by the Nations Board of Trustees (the "Nations Funds"). To the extent that Atlantic Funds have higher average fees in certain investment categories than Nations Funds, the difference reflects either differences in asset size, different fee structures of the former Excelsior Funds, or special circumstances of the Funds included in the investment categories.
D. Trustees' Advisory Contract Review Process
14. The Trustees' evaluation process identified 16 Funds in 2009 for further review based upon long-standing criteria relating to their relative performance or expenses or both. When compared in filtered universes, one additional Fund met the criteria for further review. CMG provided further information about each of those Funds to assist the Trustees in their evaluation.
E. Potential Economies of Scale
15. CMG presented to the Trustees its analysis of the sources and sharing of potential economies of scale. CMG views economies of scale as arising at the complex level and would regard estimates of scale economies for individual funds as unreliable. In its analysis, CMG did not identify specific sources of economies of scale or provide any estimates of any economies of scale that might arise from future asset growth. CMG's analysis included measures taken by the Trustees and CMG that seek to share any potential economies of scale through breakpoints in management fee schedules, the establishment of expense limits for each Fund, enhanced shareholder services, fund mergers, and operational consolidation.
16. An examination of the contractual fee schedules for five Atlantic Funds shows that those with standard fee structures are generally in line with those of their competitors. The fee schedules of the former Excelsior Funds, however, have high initial fees relative to competitors but otherwise have comparable breakpoint structures.
F. Management Fees Charged to Institutional Clients
17. CMG has provided Trustees with comparisons of mutual fund management fees and institutional fees based upon standardized fee schedules and upon actual fees. The results show that, consistent with industry practice, actual and scheduled institutional fees are generally lower than the Funds' management fees. CMG provided additional data this year demonstrating that at small asset levels, the effective fee of certain Funds may be equal to or less than institutional fee levels at those asset levels, due to the effect of expense limits on small funds with high gross expenses. CMG also analyzed the differences between the services provided and risks borne on the one hand by a manager of mutual funds and on the other by institutional advisers, and suggested that these differences should be kept in mind when Trustees review the reasonableness of the Funds' management fees.
G. Revenues, Expenses, and Profits
18. The activity-based cost allocation methodology employed by CMG to allocate costs, both direct and indirect, for purposes of calculating Fund profitability is thoughtful and detailed. This year, CMG further refined the technique by allocating additional indirect expenses on an activity basis.
19. The materials provided on CMG's revenues and expenses with respect to the Funds and the methodology underlying their construction form a sufficient basis for Trustees to evaluate the expenses of and profitability to CMG arising out of its relationships with the Funds.
20. CMG provided a firm-wide pro forma 2009 income statement demonstrating the effect of market events beginning in the fourth quarter of 2008 on its revenues and profitability to provide an additional perspective on calendar 2008 profitability data. In particular, 2008 revenues reflected the higher market prices prevailing
46
during the first three quarters of that year, while expenses dropped due to cost cutting in the wake of the market downturn late in 2008. The continuing effects of this downturn are expected to produce a significant decline in profitability this year.
21. In 2008, CMG's pre-tax post-distribution margin on the Atlantic Fund complex was above industry medians, based on the limited data available for publicly held mutual fund managers. However, as is to be expected in a large fund complex, some Atlantic Funds had relatively high pre-tax profit margins in 2008, when calculated solely with respect to management revenues and expenses, while other Atlantic Funds operated at a loss. There is a positive relationship between Fund size and profitability to CMG, with smaller Funds generally operating at a loss to CMG.
22. CMG pays a fixed percentage of its management fee revenues to an affiliate, U.S. Trust, Bank of America Private Wealth Management, with respect to assets of its clients invested in Atlantic Funds to compensate it for services it performs with respect to those client assets and for the effect of state law limitations on affiliates charging multiple fees. Based on our analysis of the services provided by this affiliate, we have concluded that all payments other than those for sub-transfer agent or sub-accounting services should be treated as a distribution expense.
III. Recommendations
1) Criteria for review. The Trustees may wish to consider modifying the criteria for identifying a Fund for further review (a "Review Fund") to include criteria that focus exclusively on performance. The Trustees' supplementary data request included one such criterion. They may also wish to consider whether it would be useful to apply CMG's own internal monitoring standards for Fund performance to the contract review process, or whether such criteria are more relevant to their ongoing investment oversight.
2) Presentation of Review Fund discussion. CMG should consider whether it could more systematically present in one discussion all relevant information regarding each Review Fund, which is now split into several different portions of the 15(c) materials. For any Fund that has been a Review Fund in consecutive years, CMG should address under what circumstances it could reasonably be anticipated that the Fund would lose that status.
3) Refinement of tax-exempt performance data. Certain single-state tax-exempt Funds compete in extremely small universes and are compared to a multi-state benchmark of uncertain relevance. Notwithstanding the difficulties, CMG should work to improve the reliability of the calculation of relative performance of these Funds. If that is not possible, CMG should provide guidance on how the Trustees should judge the quality of CMG's management of these Funds.
4) Development of risk metrics for asset-allocation, tax-exempt, and money market funds. CMG has developed and shared with the Trustees quantitative risk metrics comparing equity and taxable fixed-income Funds against their peers. However, reliable risk metrics have not been developed for asset-allocation, tax-exempt fixed income, and money market funds. We urge CMG to continue its efforts to provide reliable risk measures for these categories of Funds, especially in the cases of asset-allocation and money market funds, because their investors are likely to be motivated at least in part by a desire to manage risk.
5) Profitability data. For any period during which CMG is an affiliate of U.S. Trust, Bank of America Private Wealth Management, CMG should continue to present to the Trustees the profitability of each Fund, each investment style and each complex (of which Atlantic is one) calculated as follows:
a. Management-only profitability should be calculated without reference to any Private Bank expense.
b. Profitability excluding distribution (which essentially covers the management and transfer agency functions) should be adjusted by removing from the expense calculation any portion of the Private Bank payment not attributable to the performance by the Private Bank of sub-transfer agency or sub-accounting functions.
c. Total profitability, including distribution: No adjustment for Private Bank expenses should be made, because all such expenses represent legitimate fund expenses to be taken into account in calculating CMG's profit margin including distribution.
d. Distribution only: This should include all Private Bank expenses other than those attributable to sub-transfer agency services.
47
6) Contractual fee analysis. This year CMG presented a new Lipper report comparing the contractual management fees of Funds with those of competitors in similar investment styles. However, the reliability of the conclusion—that Fund management fee breakpoints compared favorably with competitive fee rates—was limited by the use of competitive funds at all asset levels. The sponsors of a $100 million mutual fund may not have given much thought to breakpoints at $5 billion; therefore, that fund's contractual fee at that level is unlikely to compare favorably with that of a $5 billion Fund. Limiting the competitors to the Lipper expense group, whose constituents are similar in size to the relevant Fund, would make the results more meaningful. In addition, the brea kpoints of a select group of Atlantic Funds (which would differ each year) should continue to be compared to those of industry rivals to ensure that the Funds' breakpoint schedules remain within industry norms. As breakpoint schedules change relatively little each year, performing such a comparison for each Atlantic Fund each year would not be an efficient use of Trustee and CMG resources.
7) Pro forma profitability data. In any year in which CMG or the Trustees believe that the prior year's profitability is unlikely to be representative of current business results due to changes in markets or for any other reason, CMG should, consistent with this year's practice, prepare a pro forma income statement based on year-to-date actual data and reasonable projections used for its own business planning purposes.
8) Additional institutional data and analysis. While CMG provided a substantial amount of information on its institutional business, including a virtually complete database of all institutional accounts, we suggest some additional items for future years: (a) profitability data for the institutional business in the format, and based upon the same allocation methodologies, used to present Fund profitability, (b) an explanation of how CMA sets institutional fee breakpoints, which normally begin at asset levels far lower than those found in Fund management fee breakpoints, and (c) an analysis of differences in actual fees within specific investment categories, with special attention given to accounts established before and after the implementation of the standardized instit utional fee schedules in 2005.
9) Management fee disparities. In any future study of management fees, CMG and the Atlantic Trustees should analyze the differences in management fee schedules, including those arising out of the reorganization of the former Excelsior Funds as Atlantic Funds. As part of that analysis, CMG should provide an explanation for any significant fee differences among comparable funds across fund families sponsored by CMG, such as differences in the management styles of different Funds included the same Lipper category. Finally, if CMG proposes a management fee change or an expense cap for any mutual fund managed by CMA that is comparable to any Atlantic Fund, CMG should provide the Trustees with sufficient information about the proposal to allow the Trustees to assess the appli cability of the proposed change to the relevant Atlantic Fund or Funds.
10) Explanation of data supplied to Lipper. Each year, as part of the 15(c) process, CMG retains Lipper to compare the fees and expenses of each Fund to a group of competitors. In many cases, CMG, with the approval of the Trustees, adjusts the actual expense data, which is based on the most recent full fiscal year of the Fund (and each competitive fund) to reflect changes in fees or expense limits that occurred during or after the relevant fiscal year. This improves the reliability and usefulness of the comparison. However, to ensure that the Trustees know when and how CMG adjusted the data, we recommend that CMG prepare a table listing for each Fund what adjustments were made, e.g., to reflect a new expense limitation of x basis points that commenced on y date.
Reduction of volume of paper documents submitted. The effort to streamline and better organize the data presented to the Trustees and the process by which that data was prepared and organized continued to be well-received by all parties. Notwithstanding past success, it is always appropriate to look for opportunities to reduce and simplify the presentation of 15(c) data. One possibility would be to remove the 124 pages of biographical data, most if not all of which the Trustees have previously seen as part of their ongoing investment oversight duties, from the paper volume and post it on the Internet-based document storage and retrieval system used by the Funds to provide reference data to Trustees.
* * *
Respectfully submitted,
Steven E. Asher
48
Important Information About This Report
The fund mails one shareholder report to each shareholder address. If you would like more than one report, please call shareholder services at 1-800-345-6611 and additional reports will be sent to you. This report has been prepared for shareholders of Columbia California Tax-Exempt Fund.
A description of the policies and procedures that the fund uses to determine how to vote proxies and a copy of the fund's voting records are available (i) at www.columbiamanagement.com, (ii) on the Securities and Exchange Commission's website at www.sec.gov, and (iii) without charge, upon request, by calling 1-800-368-0346. Information regarding how the fund voted proxies relating to portfolio securities during the 12-month period ended June 30 is available from the SEC's website. Information regarding how the fund voted proxies relating to portfolio securities is also available from the fund's website, www.columbiamanagement.com.
The fund files a complete schedule of portfolio holdings with the SEC for the first and third quarters of each fiscal year on Form N-Q. The fund's Form N-Q is available on the SEC's website at www.sec.gov and may be reviewed and copied at the SEC's Public Reference Room in Washington, D.C. Information on the operation of the Public Reference Room may be obtained by calling 1-800-SEC-0330.
Please read and consider the investment objectives, risks, charges and expenses for any fund carefully before investing. For a prospectus which contains this and other important information about the fund, contact your Columbia Management representative or financial advisor or go to www.columbiamanagement.com.
Columbia Management Group, LLC ("Columbia Management") is the investment management division of Bank of America Corporation. Columbia Management entities furnish investment management services and products for institutional and individual investors. Columbia Funds are distributed by Columbia Management Distributors, Inc., member of FINRA, SIPC, part of Columbia Management and an affiliate of Bank of America Corporation.
Transfer Agent
Columbia Management Services, Inc.
P.O. Box 8081
Boston, MA 02266-8081
1-800-345-6611
Distributor
Columbia Management
Distributors, Inc.
One Financial Center
Boston, MA 02111
Investment Advisor
Columbia Management Advisors, LLC
100 Federal Street
Boston, MA 02110
49
Columbia Management®
One Financial Center
Boston, MA 02111-2621
PRSRT STD
U.S. Postage
PAID
Holliston, MA
Permit NO. 20
Columbia Management®
Columbia California Tax-Exempt Fund
Annual Report, October 31, 2009
©2009 Columbia Management Distributors, Inc.
One Financial Center, Boston, MA 02111-2621
800-345-6611 www.columbiafunds.com
SHC-42/26820-1009 (12/09) 09/97708
Columbia Management®
Annual Report
October 31, 2009
Columbia Connecticut Tax-Exempt Fund
| NOT FDIC INSURED | | May Lose Value | |
|
| NOT BANK ISSUED | | No Bank Guarantee | |
|
Table of Contents
| Fund Profile | | | 1 | | |
|
| Economic Update | | | 2 | | |
|
| Performance Information | | | 4 | | |
|
| Understanding Your Expenses | | | 5 | | |
|
| Portfolio Manager's Report | | | 6 | | |
|
| Financial Statements | |
|
| Investment Portfolio | | | 8 | | |
|
Statement of Assets and
Liabilities | | | 13 | | |
|
| Statement of Operations | | | 14 | | |
|
Statement of Changes in
Net Assets | | | 15 | | |
|
| Financial Highlights | | | 17 | | |
|
| Notes to Financial Statements | | | 20 | | |
|
| Report of Independent Registered Public Accounting Firm | | | 28 | | |
|
| Federal Income Tax Information | | | 29 | | |
|
| Fund Governance | | | 30 | | |
|
Board Consideration and
Approval of Advisory Agreements | | | 34 | | |
|
Summary of Management
Fee Evaluation by Independent
Fee Consultant | | | 37 | | |
|
Important Information About
This Report | | | 45 | | |
|
The views expressed in this report reflect the current views of the respective parties. These views are not guarantees of future performance and involve certain risks, uncertainties and assumptions that are difficult to predict, so actual outcomes and results may differ significantly from the views expressed. These views are subject to change at any time based upon economic, market or other conditions and the respective parties disclaim any responsibility to update such views. These views may not be relied on as investment advice and, because investment decisions for a Columbia Fund are based on numerous factors, may not be relied on as an indication of trading intent on behalf of any particular Columbia Fund. References to specific securities should not be construed as a recommendation or investment advice.
President's Message

Dear Shareholder:
We are pleased to provide this shareholder report detailing your portfolio's performance, portfolio holdings and financial statements. We hope this information is helpful in monitoring your investments as we work through these challenging economic times. We recognize that you have entrusted us with your money and want you to know that our professional investment teams work to interpret the latest economic and market trends with the goal of optimizing portfolio construction for our clients.
The first half of 2009 was defined by extremes. The multi-year lows we witnessed in the early months gave way to a stunning rally for the U.S. financial markets through November 2009. A global market rebound may be underway, thanks to the massive fiscal and aggressive monetary policies of governments around the world. In the third quarter 2009, the S&P 500 Index1 was up 15.61%. We believe this challenging economic environment makes it even more important to work with professional money managers while continuing to invest for life events like retirement, college planning, home improvements and career changes.
Retirement income planning has become an increasingly significant focus in the lives of millions of Americans. Recent economic conditions make it even more important to manage short-term obligations such as mortgages, monthly bills and credit card debt while also taking the steps necessary to prepare for or maximize retirement benefits. Better nutrition and medical services can result in U.S. citizens living longer, healthier lives. This means the risk of outliving one's assets in retirement is very real without proper planning. Financial security and retirement planning is an ongoing process that requires active management of your savings, investments and risks. We encourage you to review your retirement plan regularly so you'll be better able to meet your retirement needs in the future.
We recognize that economic uncertainty creates great challenges for many investors. Our professional investment teams work diligently to help investors navigate through difficult markets. Thank you for your business and for the opportunity to work together towards your investment goals.
Sincerely,

J. Kevin Connaughton
President, Columbia Funds
On September 29, 2009, Bank of America Corporation entered into an agreement to sell a portion of the asset management business of Columbia Management Group, LLC. Please see Note 4 of the Notes to Financial Statements for additional information.
Past performance is no guarantee of future results.
1The Standard & Poor's (S&P) 500 Index tracks the performance of 500 widely held, large-capitalization U.S. stocks. Indices are not available for investment, are not professionally managed and do not reflect sales charges, fees, brokerage commissions, taxes or other expenses of investing. Securities in the fund may not match those in an index.
Fund Profile – Columbia Connecticut Tax-Exempt Fund
Summary
g For the 12-month period that ended October 31, 2009, the fund's Class A shares returned 13.18% without sales charge.
g The fund trailed its benchmark, the Barclays Capital Municipal Bond Index,1 and the average return of its peer group, the Lipper Connecticut Municipal Debt Funds Classification.2
g The fund fell behind its benchmark because it had less exposure to 20-25 year bonds and lower returns among bonds with maturities of 30 years and longer. An underweight in lower quality (BBB) and 20-year and longer bonds, as well as an overweight in intermediate-maturity (10-15 years) bonds, hampered returns against its peer group.
Portfolio Management
Kimberly A. Campbell has managed the fund since 2009 and has been associated with the advisor or its predecessors since 1995.
1The Barclays Capital Municipal Bond Index is considered representative of the broad market for investment-grade, tax-exempt bonds with a maturity of at least one year. Indices are not available for investment, are not professionally managed and do not reflect sales charges, fees, brokerage commissions, taxes or other expenses of investing. Securities in the fund may not match those in an index.
2Lipper Inc., a widely respected data provider in the industry, calculates an average total return (assuming reinvestment of distributions) for mutual funds with investment objectives similar to those of the fund. Lipper makes no adjustment for the effect of sales loads.
Effective November 3, 2008, the Lehman Brothers indices were renamed the Barclays Capital indices.
Performance data quoted represents past performance and current performance may be lower or higher. Past performance is no guarantee of future results. The investment return and principal value will fluctuate so that shares, when redeemed, may be worth more or less than the original cost. Please visit www.columbiafunds.com for daily and most recent month-end performance updates.
Summary
1-year return as of 10/31/09
| | | +13.18% | |
|
 | | Class A shares
(without sales charge) | |
|
| | | +13.60% | |
|
 | | Barclays Capital
Municipal Bond Index | |
|
Morningstar Style BoxTM
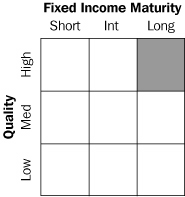
The Morningstar Style BoxTM reveals a fund's investment strategy. For fixed-income funds, the vertical axis shows the average credit quality of the bonds owned, and the horizontal axis shows interest rate sensitivity as measured by a bond's duration (short, intermediate or long). Information shown is based on the most recent data provided by Morningstar.
1
Economic Update – Columbia Connecticut Tax-Exempt Fund
Summary
For the 12-month period that ended October 31, 2009
g After a sharp decline, stock markets rebounded around the world, as measured by the S&P 500 Index and the MSCI EAFE Index.
| S&P Index | | MSCI Index | |
|
 | |  | |
|
g As investors appeared to exhibit more tolerance for risk, the Barclays Capital Aggregate Bond Index delivered solid results. High-yield bonds rebounded strongly, as measured by the JPMorgan Developed BB High Yield Index.
Barclays
Aggregate
Index | | JP Morgan
Index | |
|
 | |  | |
|
After a deep and difficult recession, the U.S. economy appeared to regain its footing midway through the 12-month period that began November 1, 2008 and ended October 31, 2009. Gross domestic product (GDP) turned positive in the third quarter of 2009, rising 2.8%, primarily on the strength of federal government stimulus spending. Now, hopes for a sustained recovery likely depend on a rebound in consumer spending and a shift from cost cuts to revenue gains to keep business profits moving higher.
The housing market showed some signs of improvement. Construction spending declined during most of the period, but turned slightly higher in August and September. New and existing home sales were weak in the first half of the period, but increased in the second half. However, new home sales took a surprise dip late in the period, as did housing starts, as the deadline for a generous first-time homebuyer tax credit neared. An extension of the credit into mid-2010 and an expansion of eligibility requirements, which were recently signed into law, renewed hopes for a sustained rebound in housing.
In the beleaguered labor market, the good news was that there was less bad news. Businesses continued to shed jobs throughout the period, raising the unemployment rate to 10.2% and wiping out all of the jobs gained since the last recession. However, the pace of job losses slowed markedly by the period's end, from 533,000 jobs lost in November 2008 to 190,000 jobs lost in October 2009. Yet, prospects appear dim for a quick recovery in the labor markets. In fact, consumer confidence, as measured monthly by the Conference Board, an independent research organization, took a dive in August and September. Consumers surveyed cited worsening business conditions and a bleaker outlook for the labor markets.
Manufacturing activity slowed through the first half of the period, but a key measure—the Institute for Supply Management's Index—rose above 50 in July and remained there for the remainder of the period. Any number above 50 indicates that manufacturing activity is expanding. However, several other key manufacturing indicators soured in October. Industrial production declined and manufacturing capacity utilization stalled after several months of modest improvement.
Consumer spending registered both ups and downs during the 12-month period, and the trend at the end of the period was hard to read because of the impact of the federal Cash for Clunkers program, which boosted auto sales. Spending rose sharply in August, then fell in September. New rigorous lending standards severely limited access to credit for business and consumers alike, and further hampered economic growth. In December 2008, the Federal Reserve Board (the Fed) lowered a key short-term borrowing rate—the federal funds rate—to between zero and 0.25%—a record low. In light of continued uncertainty about the economy, the Fed made no further change to the federal funds rate during the period.
Bonds outperformed domestic stocks
As investors sought refuge from a volatile stock market, the highest-quality sectors of the U.S. bond market delivered solid gains during the first half of the period, Treasury prices rose and yields declined sharply as the economy faltered and stock market volatility increased. As hopes for a recovery materialized, Treasuries lagged riskier segments of the bond market. The benchmark 10-year U.S. Treasury yield began the
2
Economic Update (continued) – Columbia Connecticut Tax-Exempt Fund
period at just under 4.0%, declined to 2.2% in December 2008, then rose to end the period at 3.4%. In this environment, the Barclays Capital Aggregate Bond Index1 returned 13.79%. Municipal bonds delivered returns that were in line with taxable investment-grade bonds even without factoring in potential tax advantages to investors in higher income tax brackets. The Barclays Capital Municipal Bond Index2 returned 13.60%. High-yield bond prices fell sharply in 2008 as economic prospects weakened and default fears rose, then rebounded strongly in 2009. For the 12-month period, the JPMorgan Developed BB High Yield Index3 returned 36.47%.
Stocks retreated, then rebounded
Against a strengthening economic backdrop, the U.S. stock market returned 9.80% for the 12-month period, as measured by the S&P 500 Index.4 Mid-cap stocks outperformed large and small-cap stocks and growth outperformed value by a solid margin, as measured by their respective Russell indices.5 Outside the U.S., stock market returns were even stronger. The MSCI EAFE Index,6 a broad gauge of stock market performance in foreign developed markets, gained 27.71% (in U.S. dollars) for the period. Emerging stock markets were caught in last year's downdraft, but they bounced back stronger than domestic or developed world markets in 2009 as economic growth generally outpaced the developed world. The MSCI Emerging Markets Index7 returned 64.13% (in U.S. dollars), led by strong gains from China, India, Indonesia, Colombia and Brazil.
Past performance is no guarantee of future results.
1The Barclays Capital Aggregate Bond Index is a market value-weighted index that tracks the daily price, coupon, pay-downs, and total return performance of fixed-rate, publicly placed, dollar-denominated, and non-convertible investment grade debt issues with at least $250 million par amount outstanding and with at least one year to final maturity.
2The Barclays Capital Municipal Bond Index is considered representative of the broad market for investment grade, tax-exempt bonds with a maturity of at least one year.
3The JPMorgan Developed BB High Yield Index is an unmanaged index designed to mirror the investable universe of the U.S. dollar developed, BB-rated, high yield corporate debt market.
4The Standard & Poor's (S&P) 500 Index tracks the performance of 500 widely held, large-capitalization U.S. stocks.
5The Russell 1000 Index tracks the performance of 1,000 of the largest U.S. companies, based on market capitalization. The Russell MidCap Index measures the performance of the 800 smallest companies in the Russell 1000 Index, which represents approximately 25% of the total market capitalization of the Russell 1000 Index. The Russell 2000 Index measures the performance of the 2,000 smallest companies in the Russell 3000 Index, which represents approximately 8% of the total market capitalization of the Russell 3000 Index. The Russell 3000 Growth Index measures the performance of those Russell 3000 Index companies with higher price-to-book ratios and higher forecasted growth values. The stocks in this index are also members of either the Russell 1000 Growth or the Russell 2000 Growth indexes. The Russell 3000 Value Index measures the performance of those Russell 3000 Index companies with lower price-to-book ratios and lo wer forecasted growth values. The stocks in this index are also members of either the Russell 1000 Value or the Russell 2000 Value indexes.
6The Morgan Stanley Capital International Europe, Australasia, Far East (MSCI EAFE) Index is a capitalization-weighted index that tracks the total return of common stocks in 21 developed-market countries within Europe, Australasia and the Far East.
7The Morgan Stanley Capital International Emerging Markets Index (MSCI EMI) is a free float-adjusted market capitalization index that is designed to measure equity market performance in the global emerging markets. As of June 2006, the MSCI Emerging Markets Index consisted of the following 25 emerging market country indices: Argentina, Brazil, Chile, China, Colombia, Czech Republic, Egypt, Hungary, India, Indonesia, Israel, Jordan, Korea, Malaysia, Mexico, Morocco, Pakistan, Peru, Philippines, Poland, Russia, South Africa, Taiwan, Thailand and Turkey.
Indices are not available for investment, are not professionally managed and do not reflect sales charges, fees, brokerage commissions, taxes or other expenses of investing. Securities in the fund may not match those in an index.
Effective November 3, 2008, the Lehman Brothers indices were renamed the Barclays Capital indices.
3
Performance Information – Columbia Connecticut Tax-Exempt Fund
Performance data quoted represents past performance and current performance may be lower or higher. Past performance is no guarantee of future results. The investment return and principal value will fluctuate so that shares, when redeemed, may be worth more or less than the original cost. Please visit www.columbiafunds.com for daily and most recent month-end performance updates.
Annual operating expense ratio (%)*
| Class A | | | 1.00 | | |
| Class B | | | 1.75 | | |
| Class C | | | 1.75 | | |
* The annual operating expense ratio is as stated in the fund's prospectus that is current as of the date of this report and includes the expenses incurred by the investment companies in which the fund invests. Differences in expense ratios disclosed elsewhere in this report may result from including expenses incurred by the investment companies, fee waivers and expense reimbursements as well as different time periods used in calculating the ratios.
Performance of a $10,000 investment 11/01/99 – 10/31/09
The chart above shows the change in value of a hypothetical $10,000 investment in Class A shares of Columbia Connecticut Tax-Exempt Fund during the stated time period, and does not reflect the deduction of taxes that a shareholder may pay on fund distributions or on the redemption of fund shares.
Performance of a $10,000 investment 11/01/99 – 10/31/09 ($)
| Sales charge | | without | | with | |
| Class A | | | 16,220 | | | | 15,449 | | |
| Class B | | | 15,057 | | | | 15,057 | | |
| Class C | | | 15,511 | | | | 15,511 | | |
Average annual total return as of 10/31/09 (%)
| Share class | | A | | B | | C | |
| Inception | | 11/01/91 | | 06/08/92 | | 08/01/97 | |
| Sales charge | | without | | with | | without | | with | | without | | with | |
| 1-year | | | 13.18 | | | | 7.80 | | | | 12.34 | | | | 7.34 | | | | 12.67 | | | | 11.67 | | |
| 5-year | | | 2.98 | | | | 1.99 | | | | 2.22 | | | | 1.88 | | | | 2.52 | | | | 2.52 | | |
| 10-year | | | 4.96 | | | | 4.45 | | | | 4.18 | | | | 4.18 | | | | 4.49 | | | | 4.49 | | |
Average annual total return as of 09/30/09 (%)
| Share class | | A | | B | | C | |
| Sales charge | | without | | with | | without | | with | | without | | with | |
| 1-year | | | 14.55 | | | | 9.11 | | | | 13.71 | | | | 8.71 | | | | 14.05 | | | | 13.05 | | |
| 5-year | | | 3.65 | | | | 2.65 | | | | 2.88 | | | | 2.54 | | | | 3.19 | | | | 3.19 | | |
| 10-year | | | 5.10 | | | | 4.59 | | | | 4.32 | | | | 4.32 | | | | 4.63 | | | | 4.63 | | |
The "with sales charge" returns include the maximum initial sales charge of 4.75% for Class A shares, and the applicable contingent deferred sales charge of 5.00% in the first year, declining to 1.00% in the sixth year and eliminated thereafter for Class B shares and 1.00% for Class C shares for the first year only. The "without sales charge" returns do not include the effect of sales charges. If they had, returns would be lower.
Performance results reflect any fee waivers or reimbursements of fund expenses by the investment advisor and/or any of its affiliates. Absent these fee waivers or expense reimbursement arrangements, performance results would have been lower.
All results shown assume reinvestment of distributions. Performance for different share classes will vary based on differences in sales charges and fees associated with each class. Please see the fund's prospectus for details.
The tables do not reflect the deduction of taxes that a shareholder may pay on fund distributions or on the redemption of fund shares.
4
Understanding Your Expenses – Columbia Connecticut Tax-Exempt Fund
As a fund shareholder, you incur two types of costs. There are transaction costs, which generally include sales charges on purchases and may include redemption fees or exchange fees. There are also ongoing costs, which generally include investment advisory fees, distribution and service (Rule 12b-1) fees and other fund expenses. The information on this page is intended to help you understand the ongoing costs of investing in the fund and to compare these costs with the ongoing costs of investing in other mutual funds.
Analyzing your fund's expenses by share class
To illustrate these ongoing costs, we have provided an example and calculated the expenses paid by investors in each share class during the period. The information in the following table is based on an initial investment of $1,000, which is invested at the beginning of the period and held for the entire period. Expense information is calculated two ways and each method provides you with different information. The amount listed in the "Actual" column is calculated using the fund's actual operating expenses and total return for the period. The amount listed in the "Hypothetical" column for each share class assumes that the return each year is 5% before expenses and is calculated based on the fund's actual operating expenses. You should not use the hypothetical account values and expenses to estimate either your actual account balance at the end of the period or the expenses you paid during this period.
Compare with other funds
Since all mutual funds are required to include the same hypothetical calculations about expenses in shareholder reports, you can use this information to compare the ongoing costs of investing in the fund with other funds. To do so, compare the 5% hypothetical example with the 5% hypothetical examples that appear in the shareholder reports of other funds. As you compare hypothetical examples of other funds, it is important to note that hypothetical examples are meant to highlight the ongoing costs of investing in a fund and do not reflect any transaction costs, such as sales charges, redemption fees or exchange fees.
Estimating your actual expenses
To estimate the expenses that you paid over the period, first you will need your account balance at the end of the period:
g For shareholders who receive their account statements from Columbia Management Services, Inc., your account balance is available online at www.columbiafunds.com or by calling Shareholder Services at 800.345.6611.
g For shareholders who receive their account statements from their financial intermediary, contact your financial intermediary to obtain your account balance.
1. Divide your ending account balance by $1,000. For example, if an account balance was $8,600 at the end of the period, the result would be 8.6.
2. In the section of the table below titled "Expenses paid during the period," locate the amount for your share class. You will find this number in the column labeled "Actual." Multiply this number by the result from step 1. Your answer is an estimate of the expenses you paid on your account during the period.
If the value of your account falls below the minimum initial investment requirement applicable to you, your account generally will be subject to a $20 annual fee. This fee is not included in the accompanying table. If you are subject to the fee, keep it in mind when you are estimating the ongoing expenses of investing in the fund and when comparing the expenses of this fund with other funds.
05/01/09 – 10/31/09
| | | Account value at the
beginning of the period ($) | | Account value at the
end of the period ($) | | Expenses paid
during the period ($) | | Fund's annualized
expense ratio (%) | |
| | | Actual | | Hypothetical | | Actual | | Hypothetical | | Actual | | Hypothetical | | Actual | |
| Class A | | | 1,000.00 | | | | 1,000.00 | | | | 1,045.80 | | | | 1,020.97 | | | | 4.33 | | | | 4.28 | | | | 0.84 | | |
| Class B | | | 1,000.00 | | | | 1,000.00 | | | | 1,041.90 | | | | 1,017.19 | | | | 8.18 | | | | 8.08 | | | | 1.59 | | |
| Class C | | | 1,000.00 | | | | 1,000.00 | | | | 1,043.40 | | | | 1,018.70 | | | | 6.64 | | | | 6.56 | | | | 1.29 | | |
Expenses paid during the period are equal to the annualized expense ratio for the share class, multiplied by the average account value over the period, then multiplied by the number of days in the fund's most recent fiscal half-year and divided by 365.
Had the investment advisor and/or any of its affiliates not waived fees or reimbursed a portion of expenses, account value at the end of the period would have been reduced.
It is important to note that the expense amounts shown in the table are meant to highlight only ongoing costs of investing in the fund and do not reflect any transaction costs, such as sales charges, redemption fees or exchange fees. Therefore, the hypothetical examples provided may not help you determine the relative total costs of owning shares of different funds. If these transaction costs were included, your costs would have been higher.
5
Portfolio Manager's Report – Columbia Connecticut Tax-Exempt Fund
Performance data quoted represents past performance and current performance may be lower or higher. Past performance is no guarantee of future results. The investment return and principal value will fluctuate so that shares, when redeemed, may be worth more or less than the original cost. Please visit www.columbiafunds.com for daily and most recent month-end performance updates.
Net asset value per share
as of 10/31/09 ($)
| Class A | | | 7.56 | | |
| Class B | | | 7.56 | | |
| Class C | | | 7.56 | | |
Distributions declared per share
11/01/08 – 10/31/09 ($)
| Class A | | | 0.29 | | |
| Class B | | | 0.23 | | |
| Class C | | | 0.26 | | |
A portion of the fund's income may be subject to the alternative minimum tax. The fund may at times purchase tax-exempt securities at a discount. Some, or all, of this discount may be included in the fund's ordinary income, and is taxable when distributed. Distributions include $0.02 per share of taxable realized gains.
30-day SEC yields
as of 10/31/09 (%)
| Class A | | | 2.87 | | |
| Class B | | | 2.25 | | |
| Class C | | | 2.56 | | |
The 30-day SEC yields reflect the fund's earning power, net of expenses, expressed as an annualized percentage of the public offering price per share at the end of the period.
Taxable-equivalent SEC yields
as of 10/31/09 (%)
| Class A | | | 4.65 | | |
| Class B | | | 3.64 | | |
| Class C | | | 4.15 | | |
Taxable-equivalent SEC yields are calculated assuming a federal tax rate of 35.0% and a Connecticut state income tax rate of 5.00%. These tax rates do not reflect the phase out of exemptions or the reduction of the otherwise allowable deductions that occur when adjusted gross income exceeds certain levels. Your taxable-equivalent yield may be different depending on your tax bracket.
For the 12-month period that ended October 31, 2009, the fund's Class A shares returned 13.18% without sales charge. Over this same period, the fund's benchmark, the Barclays Capital Municipal Bond Index, returned 13.60%, while the average return of the fund's peer group, the Lipper Connecticut Municipal Debt Funds Classification, was 13.94%. Issue selection among bonds with maturities of 30 years and longer and an underweight in 20- to 30-year issues accounted for the fund's modest shortfall against the index. We believe that the fund had a slightly smaller stake than the average fund in its peer group to BBB-rated bonds and bonds with 20-year and longer maturities, which detracted slightly from performance against that competitive measure.
Strongest returns from longer-maturity and lower-quality issues
During the first half of the period, the economy slowed dramatically, unemployment rose, housing prices weakened and stock prices plunged. Municipal bonds faced added pressure as institutional investors sold longer-maturity high-grade issues, causing yields to rise and bond prices to fall. By late 2008, yields on 10-year high-grade municipal issues had reached roughly 140% of yields on comparable taxable bonds. This yield advantage attracted the attention of individual investors, who remained strong buyers for the rest of the period. New municipal issuance, however, remained light, as liquidity dried up and municipal bond insurers suffered credit-rating downgrades that increased the cost for issuers coming to market.
The economic outlook improved in the spring of 2009, thanks to government stimulus measures and low short-term interest rates. Bond investors began taking on added risk to obtain more yield, boosting returns on long-term bonds, especially those with maturities of 20 years or more, as well as lower-quality issues, both of which posted strong returns for the year. New issuance of longer-term municipal bonds remained limited due, in part, to the introduction of Build America bonds, which allow municipalities to sell taxable issues and collect a 35% subsidy from the federal government to help offset the cost increase relative to tax-exempt issues.
Focus on longer-maturity, higher-quality issues
The fund maintained a bias toward bonds with 10- to 20-year maturities, which offered added yield over shorter-maturity issues but less risk than longer-term securities. An overweight in bonds with 15- to 20-year maturities was especially helpful. As the economic outlook improved, we reduced exposure to shorter-term bonds with maturities of six or less years and added to maturities longer than 15 years. In terms of credit quality, we remained focused on medium- and higher-quality issues. Our stake in AAA-rated bonds declined as a result of recent insurer downgrades. During the second
6
Portfolio Manager's Report (continued) – Columbia Connecticut Tax-Exempt Fund
half of the period, we added selectively to higher-yielding, lower-rated (BBB) issues. At period end, about 5.3% of assets were invested in bonds rated BBB.
Uncertain near-term outlook
Although Connecticut is one of the wealthiest states in the country, it also has one of the highest levels of debt per capita. Unfortunately, sales tax revenues have suffered from the slowdown in consumer and business spending, while personal income tax revenues have been hurt by the Wall Street financial crisis. Weakness in the casino business has also hurt the state's coffers. Although the budget that was passed in September trimmed some costs, further cuts are likely and many of the recent reductions are one-time, non-recurring measures rather than long-term solutions. Plus, a new corporate income tax surcharge, to be phased in over the next three fiscal years, could reduce the state's ability to attract and retain businesses. Days before period end, the state—rated AA by Standard & Poor's and AA3 by Moody's—was put on negative credit watch because of concerns about its ability to withstand further economic weak ness. We expect municipal bond returns to continue to benefit from limited new supply coupled with strong demand from wealthy residents.
Portfolio holdings and characteristics are subject to change periodically and may not be representative of current holdings and characteristics. The outlook for the fund may differ from those presented for other Columbia Funds.
Tax-exempt investing offers current tax-exempt income, but it also involves certain risks. The value of the fund will be affected by interest rate changes and the creditworthiness of issues held in the fund. When interest rates go up, bond prices generally drop and vice versa.
Interest income from certain tax-exempt bonds may be subject to certain state and local taxes and, if applicable, the alternative minimum tax. Capital gains are not exempt from income taxes.
Single-state municipal bond funds pose additional risks, due to limited geographical diversification.
Top 5 sectors
as of 10/31/09 (%)
| Local General Obligations | | | 25.3 | | |
| Education | | | 14.8 | | |
| Special Non-Property Tax | | | 11.1 | | |
| Prep School | | | 7.5 | | |
| State General Obligations | | | 5.1 | | |
Quality breakdown
as of 10/31/09 (%)
| AAA | | | 28.5 | | |
| AA | | | 20.1 | | |
| A | | | 38.3 | | |
| BBB | | | 5.3 | | |
| BB | | | 1.6 | | |
| Non-rated | | | 6.2 | | |
Maturity breakdown
as of 10/31/09 (%)
| 0-1 years | | | 0.2 | | |
| 1-3 years | | | 2.9 | | |
| 3-5 years | | | 6.1 | | |
| 5-7 years | | | 19.0 | | |
| 7-10 years | | | 8.9 | | |
| 10-15 years | | | 18.7 | | |
| 15-20 years | | | 20.5 | | |
| 20-25 years | | | 7.0 | | |
| 25 years and over | | | 14.7 | | |
| Cash & Equivalents | | | 2.0 | | |
Ratings shown in the quality breakdown represent the rating assigned to a particular bond by one of the following nationally-recognized rating agencies: Standard and Poor's, Moody's Investors Service, Inc. or Fitch Ratings Ltd. Ratings are relative and subjective and are not absolute standards of quality. The fund's credit quality does not remove market risk.
The fund is actively managed and the composition of its portfolio will change over time. Information provided is calculated as a percentage of net assets.
7
Investment Portfolio – Columbia Connecticut Tax-Exempt Fund
October 31, 2009
| Municipal Bonds – 96.9% | |
| | | Par ($) | | Value ($) | |
| Education – 22.3% | |
| Education – 14.8% | |
| CT Health & Educational Facilities Authority | |
Connecticut College,
Series 2002 E,
Insured: NPFGC
5.250% 07/01/22 | | | 400,000 | | | | 406,904 | | |
Fairfield University,
Series 2008 N,
4.750% 07/01/27 | | | 1,000,000 | | | | 1,016,290 | | |
Quinnipiac University,
Series 2007 I,
Insured: NPFGC
4.375% 07/01/28 | | | 1,015,000 | | | | 1,009,184 | | |
Trinity College:
Series 1998 F,
Insured: NPFGC
5.500% 07/01/21 | | | 2,000,000 | | | | 2,300,640 | | |
Series 2007 J,
Insured: NPFGC:
4.250% 07/01/31 | | | 1,000,000 | | | | 908,780 | | |
| 4.500% 07/01/37 | | | 1,500,000 | | | | 1,365,165 | | |
University of Connecticut,
Series 2002 A,
Insured: FGIC
5.250% 11/15/14 | | | 2,135,000 | | | | 2,372,476 | | |
University of Hartford,
Series 2002,
Insured: RAD
5.375% 07/01/15 | | | 1,000,000 | | | | 1,030,080 | | |
Yale University:
Series 2003 X-1,
5.000% 07/01/42 | | | 2,000,000 | | | | 2,048,640 | | |
Series 2007 Z-1,
5.000% 07/01/42 | | | 1,500,000 | | | | 1,562,445 | | |
| Education Total | | | 14,020,604 | | |
| Prep School – 7.5% | |
| CT Health & Educational Facilities Authority | |
Brunswick School,
Series 2003 B,
Insured: NPFGC
5.000% 07/01/33 | | | 670,000 | | | | 669,953 | | |
Loomis Chaffee School:
Series 2001 E,
5.250% 07/01/21 | | | 1,765,000 | | | | 1,809,655 | | |
Series 2005 F,
Insured: AMBAC:
5.250% 07/01/25 | | | 2,035,000 | | | | 2,306,001 | | |
| 5.250% 07/01/26 | | | 1,045,000 | | | | 1,190,401 | | |
| | | Par ($) | | Value ($) | |
Miss Porter's School,
Series 2006 B,
Insured: AMBAC
5.000% 07/01/36 | | | 1,075,000 | | | | 1,090,136 | | |
| Prep School Total | | | 7,066,146 | | |
| Education Total | | | 21,086,750 | | |
| Health Care – 7.7% | |
| Hospitals – 4.6% | |
| CT Health & Educational Facilities Authority | |
Danbury Hospital,
Series 2006 H,
Insured: AMBAC
4.500% 07/01/33 | | | 2,000,000 | | | | 1,513,960 | | |
Middlesex Hospital,
Series 2006 L,
Insured: FSA
4.250% 07/01/36 | | | 1,000,000 | | | | 836,170 | | |
William W. Backus Hospital,
Series 2005 F,
Insured: FSA
5.125% 07/01/35 | | | 2,000,000 | | | | 2,029,920 | | |
| Hospitals Total | | | 4,380,050 | | |
| Intermediate Care Facilities – 0.8% | |
| CT Health & Educational Facilities Authority | |
Village for Families & Children, Inc.,
Series 2002 A,
Insured: AMBAC
5.000% 07/01/23 | | | 255,000 | | | | 239,573 | | |
| CT Housing Finance Authority | |
Series 2000,
Insured: AMBAC
5.850% 06/15/30 | | | 500,000 | | | | 506,500 | | |
| Intermediate Care Facilities Total | | | 746,073 | | |
| Nursing Homes – 2.3% | |
| CT Development Authority Health Facility | |
Alzheimers Resources Center, Inc.,
Series 2007:
5.400% 08/15/21 | | | 500,000 | | | | 396,990 | | |
| 5.500% 08/15/27 | | | 2,375,000 | | | | 1,772,842 | | |
| Nursing Homes Total | | | 2,169,832 | | |
| Health Care Total | | | 7,295,955 | | |
See Accompanying Notes to Financial Statements.
8
Columbia Connecticut Tax-Exempt Fund
October 31, 2009
| Municipal Bonds (continued) | |
| | | Par ($) | | Value ($) | |
| Housing – 4.4% | |
| Multi-Family – 1.9% | |
| CT Bridgeport Housing Authority | |
Series 2009,
5.600% 06/01/30 | | | 1,000,000 | | | | 1,014,750 | | |
| CT Greenwich Housing Authority | |
Greenwich Close Apartments,
Series 1997 A,
6.350% 09/01/27 | | | 750,000 | | | | 763,432 | | |
| Multi-Family Total | | | 1,778,182 | | |
| Single-Family – 2.5% | |
| CT Housing Finance Authority | |
Series 2003 C-1,
4.850% 11/15/23 | | | 1,000,000 | | | | 1,013,710 | | |
Series 2006, AMT,
4.875% 11/15/36 | | | 1,500,000 | | | | 1,404,210 | | |
| Single-Family Total | | | 2,417,920 | | |
| Housing Total | | | 4,196,102 | | |
| Other – 4.8% | |
| Pool/Bond Bank – 1.2% | |
| CT State | |
Series 2009 A,
5.000% 06/01/26 | | | 1,000,000 | | | | 1,101,540 | | |
| Pool/Bond Bank Total | | | 1,101,540 | | |
| Refunded/Escrowed(a) – 3.6% | |
| CT New Haven | |
Series 2002 B,
Escrowed to Maturity,
Insured: FGIC
5.000% 11/01/16 | | | 10,000 | | | | 11,079 | | |
Series 2002 C,
Escrowed to Maturity,
Insured: NPFGC
5.000% 11/01/20 | | | 10,000 | | | | 11,098 | | |
| CT North Branford | |
Series 2001,
Pre-refunded 10/01/10,
Insured: NPFGC
5.000% 10/01/15 | | | 50,000 | | | | 52,631 | | |
| CT West Hartford | |
Series 2005 B,
Pre-refunded 10/01/10,
5.000% 10/01/24 | | | 1,500,000 | | | | 1,615,575 | | |
| | | Par ($) | | Value ($) | |
PR Commonwealth of Puerto Rico Public
Finance Corp. | |
Series 2002 E,
Escrowed to Maturity,
Insured: AMBAC
5.500% 08/01/27 | | | 1,500,000 | | | | 1,744,155 | | |
| Refunded/Escrowed Total | | | 3,434,538 | | |
| Other Total | | | 4,536,078 | | |
| Resource Recovery – 3.5% | |
| Disposal – 1.9% | |
| CT New Haven Solid Waste Authority | |
Series 2008,
5.375% 06/01/28 | | | 1,750,000 | | | | 1,840,160 | | |
| Disposal Total | | | 1,840,160 | | |
| Resource Recovery – 1.6% | |
| CT Resource Recovery Authority | |
American Re-Fuel Co.,
Series 2001 AII, AMT,
5.500% 11/15/15 | | | 1,500,000 | | | | 1,484,835 | | |
| Resource Recovery Total | | | 1,484,835 | | |
| Resource Recovery Total | | | 3,324,995 | | |
| Tax-Backed – 44.7% | |
| Local General Obligations – 25.3% | |
| CT Bridgeport | |
Series 1997 A,
Insured: NPFGC
5.500% 08/15/19 | | | 1,500,000 | | | | 1,642,380 | | |
Series 2004 C,
Insured: NPFGC
5.500% 08/15/21 | | | 1,225,000 | | | | 1,328,696 | | |
| CT Cheshire | |
Series 2000 B,
5.000% 08/01/14 | | | 1,720,000 | | | | 1,961,849 | | |
| CT East Hartford | |
Series 2003,
Insured: FGIC
5.250% 05/01/15 | | | 1,000,000 | | | | 1,149,430 | | |
| CT East Haven | |
Series 2003,
Insured: NPFGC
5.000% 09/01/15 | | | 640,000 | | | | 713,222 | | |
See Accompanying Notes to Financial Statements.
9
Columbia Connecticut Tax-Exempt Fund
October 31, 2009
| Municipal Bonds (continued) | |
| | | Par ($) | | Value ($) | |
| CT Granby | |
Series 1993,
Insured: NPFGC
6.550% 04/01/10 | | | 175,000 | | | | 179,305 | | |
Series 2006,
5.000% 02/15/26 | | | 540,000 | | | | 628,906 | | |
| CT Hartford County Metropolitan District | |
Series 1993,
5.200% 12/01/13 | | | 500,000 | | | | 570,620 | | |
| CT New Britain | |
Series 1993 A,
Insured: NPFGC
6.000% 10/01/12 | | | 1,500,000 | | | | 1,618,305 | | |
Series 1993 B,
Insured: NPFGC
6.000% 03/01/12 | | | 750,000 | | | | 792,405 | | |
Series 2006,
Insured: AMBAC
5.000% 04/15/21 | | | 1,160,000 | | | | 1,334,070 | | |
| CT New Haven | |
Series 2002 B,
Insured: FGIC
5.000% 11/01/16 | | | 1,000,000 | | | | 1,103,850 | | |
| CT New Milford | |
Series 2004,
Insured: AMBAC
5.000% 01/15/17 | | | 1,025,000 | | | | 1,184,613 | | |
| CT North Haven | |
Series 2007,
4.750% 07/15/26 | | | 1,150,000 | | | | 1,296,349 | | |
| CT Plainville | |
Series 2002,
Insured: FGIC:
5.000% 12/01/15 | | | 400,000 | | | | 439,836 | | |
| 5.000% 12/01/16 | | | 500,000 | | | | 549,795 | | |
| CT Ridgefield | |
Series 2009,
5.000% 09/15/21 | | | 1,000,000 | | | | 1,157,230 | | |
| CT Stamford | |
Series 2003 B,
5.250% 08/15/16 | | | 2,750,000 | | | | 3,229,518 | | |
| CT Suffield | |
Series 2005,
5.000% 06/15/20 | | | 1,400,000 | | | | 1,623,230 | | |
| | | Par ($) | | Value ($) | |
| CT Westbrook | |
Series 1992,
Insured: NPFGC
6.300% 03/15/12 | | | 265,000 | | | | 297,526 | | |
| CT Westport | |
Series 2003,
5.000% 08/15/15 | | | 1,000,000 | | | | 1,119,430 | | |
| Local General Obligations Total | | | 23,920,565 | | |
| Special Non-Property Tax – 11.1% | |
| CT Special Tax Obligation | |
Transportation Infrastructure:
Series 2002 B,
Insured: AMBAC
5.000% 12/01/21 | | | 1,500,000 | | | | 1,554,825 | | |
Series 2004 B,
Insured: AMBAC
5.250% 07/01/18 | | | 2,000,000 | | | | 2,287,000 | | |
| GU Territory of Guam | |
Series 2009 A,
5.750% 12/01/34 | | | 2,150,000 | | | | 2,189,409 | | |
PR Commonwealth of Puerto Rico
Highway & Transportation Authority | |
Series 1993 X,
Insured: FSA
5.500% 07/01/13 | | | 3,000,000 | | | | 3,183,060 | | |
Series 2005 L,
Insured: AMBAC
5.250% 07/01/38 | | | 1,000,000 | | | | 943,450 | | |
PR Commonwealth of Puerto Rico
Infrastructure Financing Authority | |
Series 2005 A,
Insured: AMBAC
(b) 07/01/35 | | | 2,000,000 | | | | 314,500 | | |
| Special Non-Property Tax Total | | | 10,472,244 | | |
| State Appropriated – 3.2% | |
| CT Juvenile Training School | |
Series 2001,
4.750% 12/15/25 | | | 2,500,000 | | | | 2,542,700 | | |
| CT University of Connecticut | |
Series 2009 A,
5.000% 02/15/28 | | | 500,000 | | | | 539,665 | | |
| State Appropriated Total | | | 3,082,365 | | |
| State General Obligations – 5.1% | |
| CT Housing Finance Authority | |
Series 2009,
5.000% 06/15/28 | | | 750,000 | | | | 797,070 | | |
See Accompanying Notes to Financial Statements.
10
Columbia Connecticut Tax-Exempt Fund
October 31, 2009
| Municipal Bonds (continued) | |
| | | Par ($) | | Value ($) | |
| CT State | |
Series 2001 C,
Insured: FSA
5.500% 12/15/15 | | | 1,500,000 | | | | 1,765,785 | | |
Series 2001,
Insured: FSA
5.500% 12/15/14 | | | 1,500,000 | | | | 1,754,970 | | |
Series 2005 B,
Insured: AMBAC
5.250% 06/01/20 | | | 400,000 | | | | 472,224 | | |
| State General Obligations Total | | | 4,790,049 | | |
| Tax-Backed Total | | | 42,265,223 | | |
| Transportation – 0.6% | |
| Transportation – 0.6% | |
| CT New Haven Air Rights Parking Facility | |
Series 2002,
Insured: AMBAC
5.375% 12/01/15 | | | 500,000 | | | | 556,420 | | |
| Transportation Total | | | 556,420 | | |
| Transportation Total | | | 556,420 | | |
| Utilities – 8.9% | |
| Municipal Electric – 3.9% | |
PR Commonwealth of Puerto Rico
Electric Power Authority | |
Series 2002 KK,
Insured: NPFGC
5.500% 07/01/15 | | | 1,000,000 | | | | 1,082,740 | | |
Series 2003 NN,
Insured: NPFGC
5.250% 07/01/19 | | | 2,500,000 | | | | 2,630,500 | | |
| Municipal Electric Total | | | 3,713,240 | | |
| Water & Sewer – 5.0% | |
CT Greater New Haven Water Pollution
Control Authority | |
Series 2008,
Insured: FSA
4.750% 11/15/28 | | | 600,000 | | | | 612,372 | | |
| CT South Central Regional Water Authority | |
Series 2005,
Insured: NPFGC
5.000% 08/01/30 | | | 1,870,000 | | | | 1,916,806 | | |
| | | Par ($) | | Value ($) | |
Series 2007 A:
Insured: NPFGC
5.250% 08/01/23 | | | 1,000,000 | | | | 1,110,220 | | |
| 5.250% 08/01/24 | | | 1,000,000 | | | | 1,104,070 | | |
| Water & Sewer Total | | | 4,743,468 | | |
| Utilities Total | | | 8,456,708 | | |
Total Municipal Bonds
(cost of $90,090,389) | | | 91,718,231 | | |
| Investment Companies – 1.9% | |
| | | Shares | | | |
Columbia Connecticut
Municipal Reserves,
G-Trust Shares
(7 day yield of 0.160%) (c)(d) | | | 747,272 | | | | 747,272 | | |
Dreyfus Municipal Cash
Management Plus
(7 day yield of 0.210%) | | | 1,038,158 | | | | 1,038,158 | | |
Total Investment Companies
(cost of $1,785,430) | | | 1,785,430 | | |
Total Investments – 98.8%
(cost of $91,875,819) (e) | | | 93,503,661 | | |
| Other Assets & Liabilities, Net – 1.2% | | | 1,142,858 | | |
| Net Assets – 100.0% | | | 94,646,519 | | |
Notes to Investment Portfolio:
(a) The Fund has been informed that each issuer has placed direct obligations of the U.S. Government in an irrevocable trust, solely for the payment of principal and interest.
(b) Zero coupon bond.
(c) Investments in affiliates during the year ended October 31, 2009:
Security name: Columbia Connecticut Municipal Reserves, G-Trust Shares (7 day yield of 0.160%)
| Shares as of 10/31/08: | | | – | | |
| Shares purchased: | | | 16,766,962 | | |
| Shares sold: | | | (16,019,690 | ) | |
| Shares as of 10/31/09: | | | 747,272 | | |
| Net realized gain (loss): | | $ | – | | |
| Dividend income earned: | | $ | 6,358 | | |
| Value at end of period: | | $ | 747,272 | | |
(d) Money market mutual fund registered under the Investment Company Act of 1940, as amended and advised by Columbia Management Advisors, LLC.
(e) Cost for federal income tax purposes is $91,846,996.
See Accompanying Notes to Financial Statements.
11
Columbia Connecticut Tax-Exempt Fund
October 31, 2009
The following table summarizes the inputs used, as of October 31, 2009, in valuing the Fund's assets:
| Description | | Quoted Prices
(Level 1) | | Other
Significant
Observable
Inputs
(Level 2) | | Significant
Unobservable
Inputs
(Level 3) | | Total | |
| Total Municipal Bonds | | $ | — | | | $ | 91,718,231 | | | $ | — | | | $ | 91,718,231 | | |
Total Investment
Companies | | | 1,785,430 | | | | — | | | | — | | | | 1,785,430 | | |
| Total Investments | | $ | 1,785,430 | | | $ | 91,718,231 | | | $ | — | | | $ | 93,503,661 | | |
For more information on valuation inputs, and their aggregation into the levels used in the table above, please refer to the Security Valuation section in the accompanying Notes to Financial Statements.
At October 31, 2009, the composition of the Fund by revenue source is as follows:
| Holdings by Revenue Source (Unaudited) | | % of
Net Assets | |
| Tax-Backed | | | 44.7 | | |
| Education | | | 22.3 | | |
| Utilities | | | 8.9 | | |
| Health Care | | | 7.7 | | |
| Housing | | | 4.4 | | |
| Refunded/Escrowed | | | 3.6 | | |
| Resource Recovery | | | 3.5 | | |
| Pool/Bond Bank | | | 1.2 | | |
| Transportation | | | 0.6 | | |
| | | | 96.9 | | |
| Investment Companies | | | 1.9 | | |
| Other Assets & Liabilities, Net | | | 1.2 | | |
| | | | 100.0 | | |
| Acronym | | Name | |
| AMBAC | | Ambac Assurance Corp. | |
|
| AMT | | Alternative Minimum Tax | |
|
| FGIC | | Financial Guaranty Insurance Co. | |
|
| FSA | | Financial Security Assurance, Inc. | |
|
| NPFGC | | National Public Finance Guarantee Corp. | |
|
| RAD | | Radian Asset Assurance, Inc. | |
|
See Accompanying Notes to Financial Statements.
12
Statement of Assets and Liabilities – Columbia Connecticut Tax-Exempt Fund
October 31, 2009
| | | | | ($) | |
| Assets | | Unaffiliated investments, at identified cost | | | 91,128,547 | | |
| | | Affiliated investments, at identified cost | | | 747,272 | | |
| | | Total investments, at identified cost | | | 91,875,819 | | |
| | | Unaffiliated investments, at value | | | 92,756,389 | | |
| | | Affiliated investments, at value | | | 747,272 | | |
| | | Total investments, at value | | | 93,503,661 | | |
| | | Cash | | | 318 | | |
| | | Receivable for: | | | | | |
| | | Fund shares sold | | | 23,604 | | |
| | | Interest | | | 1,416,084 | | |
| | | Expense reimbursement due from investment advisor | | | 11,989 | | |
| | | Trustees' deferred compensation plan | | | 24,453 | | |
| | | Prepaid expenses | | | 330 | | |
| | | Total Assets | | | 94,980,439 | | |
| Liabilities | | Payable for: | | | | | |
| | | Fund shares repurchased | | | 66,303 | | |
| | | Distributions | | | 107,441 | | |
| | | Investment advisory fee | | | 40,759 | | |
| | | Pricing and bookkeeping fees | | | 6,904 | | |
| | | Transfer agent fee | | | 7,358 | | |
| | | Trustees' fees | | | 294 | | |
| | | Audit fee | | | 33,799 | | |
| | | Custody fee | | | 1,780 | | |
| | | Distribution and service fees | | | 29,117 | | |
| | | Chief compliance officer expenses | | | 54 | | |
| | | Trustees' deferred compensation plan | | | 24,453 | | |
| | | Other liabilities | | | 15,658 | | |
| | | Total Liabilities | | | 333,920 | | |
| | | Net Assets | | | 94,646,519 | | |
| Net Assets Consist of | | Paid-in capital | | | 93,151,173 | | |
| | | Undistributed net investment income | | | 260,400 | | |
| | | Accumulated net realized loss | | | (392,896 | ) | |
| | | Net unrealized appreciation on investments | | | 1,627,842 | | |
| | | Net Assets | | | 94,646,519 | | |
| Class A | | Net assets | | $ | 75,464,619 | | |
| | | Shares outstanding | | | 9,979,133 | | |
| | | Net asset value per share | �� | $ | 7.56 | (a) | |
| | | Maximum sales charge | | | 4.75 | % | |
| | | Maximum offering price per share ($7.56/0.9525) | | $ | 7.94 | (b) | |
| Class B | | Net assets | | $ | 6,870,994 | | |
| | | Shares outstanding | | | 908,580 | | |
| | | Net asset value and offering price per share | | $ | 7.56 | (a) | |
| Class C | | Net assets | | $ | 12,310,906 | | |
| | | Shares outstanding | | | 1,627,949 | | |
| | | Net asset value and offering price per share | | $ | 7.56 | (a) | |
(a) Redemption price per share is equal to net asset value less any applicable contingent deferred sales charge.
(b) On sales of $50,000 or more the offering price is reduced.
See Accompanying Notes to Financial Statements.
13
Statement of Operations – Columbia Connecticut Tax-Exempt Fund
For the Year Ended October 31, 2009
| | | | | ($) | |
| Investment Income | | Interest | | | 4,166,216 | | |
| | | Dividends | | | 4,102 | | |
| | | Dividends from affiliates | | | 6,358 | | |
| | | Total Investment Income | | | 4,176,676 | | |
| Expenses | | Investment advisory fee | | | 462,542 | | |
| | | Distribution fee: | | | | | |
| | | Class B | | | 68,025 | | |
| | | Class C | | | 89,850 | | |
| | | Service fee: | | | | | |
| | | Class A | | | 171,733 | | |
| | | Class B | | | 21,786 | | |
| | | Class C | | | 28,797 | | |
| | | Pricing and bookkeeping fees | | | 61,643 | | |
| | | Transfer agent fee | | | 49,942 | | |
| | | Trustees' fees | | | 19,214 | | |
| | | Custody fee | | | 8,966 | | |
| | | Chief compliance officer expenses | | | 617 | | |
| | | Other expenses | | | 110,271 | | |
| | | Total Expenses | | | 1,093,386 | | |
| | | Fees waived or expenses reimbursed by investment advisor | | | (157,165 | ) | |
| | | Fees waived by distributor—Class C | | | (35,944 | ) | |
| | | Expense reductions | | | (704 | ) | |
| | | Net Expenses | | | 899,573 | | |
| | | Net Investment Income | | | 3,277,103 | | |
| Net Realized and Unrealized Gain (Loss) on Investments and Futures Contracts | | Net realized gain (loss) on: | | | | | |
| | | Investments | | | (382,779 | ) | |
| | | Futures contracts | | | 41,163 | | |
| | | Net realized loss | | | (341,616 | ) | |
| | | Net change in unrealized appreciation (depreciation) on investments | | | 8,246,992 | | |
| | | Net Gain | | | 7,905,376 | | |
| | | Net Increase Resulting from Operations | | | 11,182,479 | | |
See Accompanying Notes to Financial Statements.
14
Statement of Changes in Net Assets – Columbia Connecticut Tax-Exempt Fund
| | | | | Year Ended October 31, | |
| Increase (Decrease) in Net Assets | | | | 2009 ($) | | 2008 ($) | |
| Operations | | Net investment income | | | 3,277,103 | | | | 3,749,263 | | |
| | | Net realized gain (loss) on investments and
futures contracts | | | (341,616 | ) | | | 560,925 | | |
| | | Net change in unrealized appreciation (depreciation) on
investments and futures contracts | | | 8,246,992 | | | | (9,618,951 | ) | |
| | | Net increase (decrease) resulting from operations | | | 11,182,479 | | | | (5,308,763 | ) | |
| Distributions to Shareholders | | From net investment income: | | | | | | | | | |
| | | Class A | | | (2,617,543 | ) | | | (2,926,539 | ) | |
| | | Class B | | | (265,641 | ) | | | (408,528 | ) | |
| | | Class C | | | (385,206 | ) | | | (404,081 | ) | |
| | | From net realized gains: | | | | | | | | | |
| | | Class A | | | (200,742 | ) | | | (917,387 | ) | |
| | | Class B | | | (30,739 | ) | | | (179,705 | ) | |
| | | Class C | | | (35,192 | ) | | | (143,822 | ) | |
| | | Total distributions to shareholders | | | (3,535,063 | ) | | | (4,980,062 | ) | |
| | | Net Capital Stock Transactions | | | (2,691,586 | ) | | | (14,287,061 | ) | |
| | | Total increase (decrease) in net assets | | | 4,955,830 | | | | (24,575,886 | ) | |
| Net Assets | | Beginning of period | | | 89,690,689 | | | | 114,266,575 | | |
| | | End of period | | | 94,646,519 | | | | 89,690,689 | | |
| | | Undistributed net investment income at end of period | | | 260,400 | | | | 266,768 | | |
See Accompanying Notes to Financial Statements.
15
Statement of Changes in Net Assets (continued) – Columbia Connecticut Tax-Exempt Fund
| | | Capital Stock Activity | |
| | | Year Ended
October 31, 2009 | | Year Ended
October 31, 2008 | |
| | | Shares | | Dollars ($) | | Shares | | Dollars ($) | |
| Class A | |
| Subscriptions | | | 1,278,275 | | | | 9,380,485 | | | | 610,845 | | | | 4,564,564 | | |
| Distributions reinvested | | | 250,169 | | | | 1,818,274 | | | | 354,270 | | | | 2,649,306 | | |
| Redemptions | | | (1,221,471 | ) | | | (8,879,826 | ) | | | (2,239,346 | ) | | | (16,546,937 | ) | |
| Net increase (decrease) | | | 306,973 | | | | 2,318,933 | | | | (1,274,231 | ) | | | (9,333,067 | ) | |
| Class B | |
| Subscriptions | | | 44,742 | | | | 320,746 | | | | 36,717 | | | | 272,456 | | |
| Distributions reinvested | | | 22,597 | | | | 162,937 | | | | 46,527 | | | | 348,837 | | |
| Redemptions | | | (720,383 | ) | | | (5,251,093 | ) | | | (731,158 | ) | | | (5,483,520 | ) | |
| Net decrease | | | (653,044 | ) | | | (4,767,410 | ) | | | (647,914 | ) | | | (4,862,227 | ) | |
| Class C | |
| Subscriptions | | | 234,406 | | | | 1,722,201 | | | | 273,434 | | | | 2,031,391 | | |
| Distributions reinvested | | | 28,038 | | | | 203,431 | | | | 38,569 | | | | 288,570 | | |
| Redemptions | | | (297,464 | ) | | | (2,168,741 | ) | | | (321,759 | ) | | | (2,411,728 | ) | |
| Net decrease | | | (35,020 | ) | | | (243,109 | ) | | | (9,756 | ) | | | (91,767 | ) | |
See Accompanying Notes to Financial Statements.
16
Financial Highlights – Columbia Connecticut Tax-Exempt Fund
Selected data for a share outstanding throughout each period is as follows:
| | | Year Ended October 31, | |
| Class A Shares | | 2009 | | 2008 | | 2007 | | 2006 | | 2005 | |
| Net Asset Value, Beginning of Period | | $ | 6.95 | | | $ | 7.71 | | | $ | 7.92 | | | $ | 7.91 | | | $ | 8.19 | | |
| Income from Investment Operations: | |
| Net investment income (a) | | | 0.27 | | | | 0.28 | | | | 0.28 | | | | 0.29 | | | | 0.29 | | |
Net realized and unrealized gain (loss) on investments
and futures contracts | | | 0.63 | | | | (0.68 | ) | | | (0.12 | ) | | | 0.11 | | | | (0.23 | ) | |
| Total from investment operations | | | 0.90 | | | | (0.40 | ) | | | 0.16 | | | | 0.40 | | | | 0.06 | | |
| Less Distributions to Shareholders: | |
| From net investment income | | | (0.27 | ) | | | (0.27 | ) | | | (0.28 | ) | | | (0.28 | ) | | | (0.29 | ) | |
| From net realized gains | | | (0.02 | ) | | | (0.09 | ) | | | (0.09 | ) | | | (0.11 | ) | | | (0.05 | ) | |
| Total distributions to shareholders | | | (0.29 | ) | | | (0.36 | ) | | | (0.37 | ) | | | (0.39 | ) | | | (0.34 | ) | |
| Net Asset Value, End of Period | | $ | 7.56 | | | $ | 6.95 | | | $ | 7.71 | | | $ | 7.92 | | | $ | 7.91 | | |
| Total return (b)(c) | | | 13.18 | % | | | (5.36 | )% | | | 2.03 | % | | | 5.25 | % | | | 0.72 | % | |
| Ratios to Average Net Assets/Supplemental Data: | |
| Net expenses (d) | | | 0.84 | % | | | 0.84 | % | | | 0.84 | % | | | 0.84 | % | | | 0.84 | % | |
| Waiver/Reimbursement | | | 0.17 | % | | | 0.15 | % | | | 0.13 | % | | | 0.16 | % | | | 0.09 | % | |
| Net investment income (d) | | | 3.67 | % | | | 3.73 | % | | | 3.61 | % | | | 3.67 | % | | | 3.63 | % | |
| Portfolio turnover rate | | | 7 | % | | | 10 | % | | | 14 | % | | | 13 | % | | | 9 | % | |
| Net assets, end of period (000s) | | $ | 75,465 | | | $ | 67,265 | | | $ | 84,351 | | | $ | 87,906 | | | $ | 98,063 | | |
(a) Per share data was calculated using the average shares outstanding during the period.
(b) Total return at net asset value assuming all distributions reinvested and no initial sales charge or contingent deferred sales charge.
(c) Had the investment advisor and/or any of its affiliates not waived fees or reimbursed a portion of expenses, total return would have been reduced.
(d) The benefits derived from expense reductions had an impact of less than 0.01%.
See Accompanying Notes to Financial Statements.
17
Financial Highlights – Columbia Connecticut Tax-Exempt Fund
Selected data for a share outstanding throughout each period is as follows:
| | | Year Ended October 31, | |
| Class B Shares | | 2009 | | 2008 | | 2007 | | 2006 | | 2005 | |
| Net Asset Value, Beginning of Period | | $ | 6.95 | | | $ | 7.71 | | | $ | 7.92 | | | $ | 7.91 | | | $ | 8.19 | | |
| Income from Investment Operations: | |
| Net investment income (a) | | | 0.21 | | | | 0.22 | | | | 0.22 | | | | 0.23 | | | | 0.23 | | |
Net realized and unrealized gain (loss) on investments
and futures contracts | | | 0.63 | | | | (0.67 | ) | | | (0.12 | ) | | | 0.11 | | | | (0.23 | ) | |
| Total from investment operations | | | 0.84 | | | | (0.45 | ) | | | 0.10 | | | | 0.34 | | | | — | | |
| Less Distributions to Shareholders: | |
| From net investment income | | | (0.21 | ) | | | (0.22 | ) | | | (0.22 | ) | | | (0.22 | ) | | | (0.23 | ) | |
| From net realized gains | | | (0.02 | ) | | | (0.09 | ) | | | (0.09 | ) | | | (0.11 | ) | | | (0.05 | ) | |
| Total distributions to shareholders | | | (0.23 | ) | | | (0.31 | ) | | | (0.31 | ) | | | (0.33 | ) | | | (0.28 | ) | |
| Net Asset Value, End of Period | | $ | 7.56 | | | $ | 6.95 | | | $ | 7.71 | | | $ | 7.92 | | | $ | 7.91 | | |
| Total return (b)(c) | | | 12.34 | % | | | (6.07 | )% | | | 1.27 | % | | | 4.47 | % | | | (0.03 | )% | |
| Ratios to Average Net Assets/Supplemental Data: | |
| Net expenses (d) | | | 1.59 | % | | | 1.59 | % | | | 1.59 | % | | | 1.59 | % | | | 1.59 | % | |
| Waiver/Reimbursement | | | 0.17 | % | | | 0.15 | % | | | 0.13 | % | | | 0.16 | % | | | 0.09 | % | |
| Net investment income (d) | | | 2.94 | % | | | 2.98 | % | | | 2.86 | % | | | 2.93 | % | | | 2.88 | % | |
| Portfolio turnover rate | | | 7 | % | | | 10 | % | | | 14 | % | | | 13 | % | | | 9 | % | |
| Net assets, end of period (000s) | | $ | 6,871 | | | $ | 10,860 | | | $ | 17,026 | | | $ | 25,085 | | | $ | 34,784 | | |
(a) Per share data was calculated using the average shares outstanding during the period.
(b) Total return at net asset value assuming all distributions reinvested and no contingent deferred sales charge.
(c) Had the investment advisor and/or any of its affiliates not waived fees or reimbursed a portion of expenses, total return would have been reduced.
(d) The benefits derived from expense reductions had an impact of less than 0.01%.
See Accompanying Notes to Financial Statements.
18
Financial Highlights – Columbia Connecticut Tax-Exempt Fund
Selected data for a share outstanding throughout each period is as follows:
| | | Year Ended October 31, | |
| Class C Shares | | 2009 | | 2008 | | 2007 | | 2006 | | 2005 | |
| Net Asset Value, Beginning of Period | | $ | 6.95 | | | $ | 7.71 | | | $ | 7.92 | | | $ | 7.91 | | | $ | 8.19 | | |
| Income from Investment Operations: | |
| Net investment income (a) | | | 0.24 | | | | 0.25 | | | | 0.24 | | | | 0.25 | | | | 0.26 | | |
Net realized and unrealized gain (loss) on investments
and futures contracts | | | 0.63 | | | | (0.68 | ) | | | (0.12 | ) | | | 0.12 | | | | (0.24 | ) | |
| Total from investment operations | | | 0.87 | | | | (0.43 | ) | | | 0.12 | | | | 0.37 | | | | 0.02 | | |
| Less Distributions to Shareholders: | |
| From net investment income | | | (0.24 | ) | | | (0.24 | ) | | | (0.24 | ) | | | (0.25 | ) | | | (0.25 | ) | |
| From net realized gains | | | (0.02 | ) | | | (0.09 | ) | | | (0.09 | ) | | | (0.11 | ) | | | (0.05 | ) | |
| Total distributions to shareholders | | | (0.26 | ) | | | (0.33 | ) | | | (0.33 | ) | | | (0.36 | ) | | | (0.30 | ) | |
| Net Asset Value, End of Period | | $ | 7.56 | | | $ | 6.95 | | | $ | 7.71 | | | $ | 7.92 | | | $ | 7.91 | | |
| Total return (b)(c) | | | 12.67 | % | | | (5.79 | )% | | | 1.57 | % | | | 4.78 | % | | | 0.27 | % | |
| Ratios to Average Net Assets/Supplemental Data: | |
| Net expenses (d) | | | 1.29 | % | | | 1.29 | % | | | 1.29 | % | | | 1.29 | % | | | 1.29 | % | |
| Waiver/Reimbursement | | | 0.47 | % | | | 0.45 | % | | | 0.43 | % | | | 0.46 | % | | | 0.39 | % | |
| Net investment income (d) | | | 3.22 | % | | | 3.28 | % | | | 3.16 | % | | | 3.23 | % | | | 3.18 | % | |
| Portfolio turnover rate | | | 7 | % | | | 10 | % | | | 14 | % | | | 13 | % | | | 9 | % | |
| Net assets, end of period (000s) | | $ | 12,311 | | | $ | 11,565 | | | $ | 12,890 | | | $ | 13,792 | | | $ | 19,585 | | |
(a) Per share data was calculated using the average shares outstanding during the period.
(b) Total return at net asset value assuming all distributions reinvested and no contingent deferred sales charge.
(c) Had the investment advisor and/or any of its affiliates not waived fees or reimbursed a portion of expenses, total return would have been reduced.
(d) The benefits derived from expense reductions had an impact of less than 0.01%.
See Accompanying Notes to Financial Statements.
19
Notes to Financial Statements – Columbia Connecticut Tax-Exempt Fund
October 31, 2009
Note 1. Organization
Columbia Connecticut Tax-Exempt Fund (the "Fund"), a series of Columbia Funds Series Trust I (the "Trust"), is a diversified portfolio. The Trust is a Massachusetts business trust registered under the Investment Company Act of 1940, as amended (the "1940 Act"), as an open-end management investment company.
Investment Objective
The Fund seeks total return, consisting of current income exempt from federal income tax and Connecticut individual income tax and of capital appreciation, consistent with moderate fluctuation of principal.
Fund Shares
The Trust may issue an unlimited number of shares, and the Fund offers three classes of shares: Class A, Class B and Class C. Each share class has its own expense structure and sales charges, as applicable. Effective June 22, 2009, the Fund no longer accepts investments from new or existing investors in the Fund's Class B shares, except in connection with the reinvestment of any dividend and/or capital gain distributions in Class B shares of the Fund and exchanges by existing Class B shareholders of the other Columbia Funds.
Class A shares are subject to a maximum front-end sales charge of 4.75% based on the amount of initial investment. Class A shares purchased without an initial sales charge in accounts aggregating $1 million to $50 million at the time of purchase are subject to a 1.00% contingent deferred sales charge ("CDSC") if the shares are sold within one year after purchase. Class B shares are subject to a maximum CDSC of 5.00% based upon the holding period after purchase. Class B shares will convert to Class A shares eight years after purchase. Class C shares are subject to a 1.00% CDSC on shares sold within one year after purchase.
Note 2. Significant Accounting Policies
The preparation of financial statements in accordance with accounting principles generally accepted in the United States of America ("GAAP") requires management to make certain estimates and assumptions that affect the reported amounts of assets and liabilities, the disclosure of contingent assets and liabilities at the date of the financial statements and the reported amounts of revenue and expenses during the reporting period. Actual results could differ from those estimates.
Management has evaluated the events and transactions that have occurred through December 18, 2009, the date the financial statements were issued, and noted no items requiring adjustment of the financial statements or additional disclosures except as disclosed in Note 4.
The following is a summary of significant accounting policies consistently followed by the Fund in the preparation of its financial statements.
Security Valuation
Debt securities generally are valued by pricing services approved by the Trust's Board of Trustees, based upon market transactions for normal, institutional-size trading units of similar securities. The services may use various pricing techniques which take into account appropriate factors such as yield, quality, coupon rate, maturity, type of issue, trading characteristics and other data, as well as broker quotes. Debt securities for which quotations are readily available are valued at an over-the-counter or exchange bid quotation.
Certain debt securities, which tend to be more thinly traded and of lesser quality, are priced based on fundamental analysis of the financial condition of the issuer and the estimated value of any collateral. Valuations developed through pricing techniques may vary from the actual amounts realized upon sale of the securities, and the potential variation may be greater for those securities valued using fundamental analysis.
Short-term investments maturing in 60 days or less are valued at amortized cost, which approximates market value.
Investments in other open-end investment companies are valued at net asset value.
Futures contracts are valued at the settlement price established each day by the board of trade or exchange on which they are traded.
Investments for which market quotations are not readily available, or that have quotations which management believes are not reliable, are valued at fair value as determined in good faith under consistently applied procedures established by and under the general supervision of the Board of Trustees. If a security is valued at fair value, such value is likely to be
20
Columbia Connecticut Tax-Exempt Fund, October 31, 2009
different from the last quoted market price for the security. The determination of fair value often requires significant judgment. To determine fair value, management may use assumptions including but not limited to future cash flows and estimated risk premiums. Multiple inputs from various sources may be used to determine value.
Management establishes a hierarchy that prioritizes the inputs to valuation techniques used to measure fair value giving the highest priority to unadjusted quoted prices in active markets for identical securities (level 1 measurements) and the lowest priority to unobservable inputs (level 3 measurements) when market prices are not readily available or reliable. The three levels of the fair value hierarchy are described below:
• Level 1—quoted prices in active markets for identical securities
• Level 2—prices determined using other significant observable inputs (including quoted prices for similar securities, interest rates, prepayment speeds, credit risk and others)
• Level 3—prices determined using significant unobservable inputs. In situations where quoted prices or observable inputs are unavailable or less reliable, unobservable inputs may be used. Unobservable inputs may include management's own assumptions about the factors market participants would use in pricing an investment.
The inputs or methodology used for valuing securities are not necessarily an indication of the risk associated with investing in those securities.
Security Transactions
Security transactions are accounted for on the trade date. Cost is determined and gains (losses) are based upon the specific identification method for both financial statement and federal income tax purposes.
Income Recognition
Interest income is recorded on the accrual basis. Premium and discount are amortized and accreted, respectively, on all debt securities, unless otherwise noted. Original issue discount is accreted to interest income over the life of the security with a corresponding increase in the cost basis. Dividend income is recorded on the ex-date.
Expenses
General expenses of the Trust are allocated to the Fund and other series of the Trust based upon relative net assets or other expense allocation methodologies determined by the nature of the expense. Expenses directly attributable to the Fund are charged to the Fund.
Determination of Class Net Asset Value
All income, expenses (other than class-specific expenses, as shown on the Statement of Operations) and realized and unrealized gains (losses) are allocated to each class of the Fund on a daily basis for purposes of determining the net asset value of each class. Income and expenses are allocated to each class based on the settled shares method, while realized and unrealized gains (losses) are allocated based on the relative net assets of each class.
Federal Income Tax Status
The Fund intends to qualify each year as a "regulated investment company" under Subchapter M of the Internal Revenue Code, as amended, and will distribute substantially all of its tax exempt or taxable income, if any, for its tax year, and as such will not be subject to federal income taxes. In addition, the Fund intends to distribute in each calendar year substantially all of its net investment income, capital gains and certain other amounts, if any, such that the Fund should not be subject to federal excise tax. Therefore, no federal income or excise tax provision is recorded.
Distributions to Shareholders
Distributions from net investment income are declared daily and paid monthly. Net realized capital gains, if any, are distributed at least annually. Income distributions and capital gain distributions are determined in accordance with federal income tax regulations which may differ from GAAP.
Indemnification
In the normal course of business, the Fund enters into contracts that contain a variety of representations and warranties and which provide general indemnities. The Fund's maximum exposure under these arrangements is unknown
21
Columbia Connecticut Tax-Exempt Fund, October 31, 2009
because this would involve future claims against the Fund. Also, under the Trust's organizational documents and by contract, the Trustees and officers of the Trust are indemnified against certain liabilities that may arise out of actions relating to their duties to the Trust. However, based on experience, the Fund expects the risk of loss due to these representations, warranties and indemnities to be minimal.
Note 3. Federal Tax Information
The timing and character of income and capital gain distributions are determined in accordance with income tax regulations, which may differ from GAAP. Reclassifications are made to the Fund's capital accounts for permanent tax differences to reflect income and gains available for distribution (or available capital loss carryforwards) under income tax regulations.
For the year ended October 31, 2009, permanent book and tax basis differences resulting primarily from differing treatments for market discount reclassification and discount accretion/premium amortization on debt instruments were identified and reclassified among the components of the Fund's net assets as follows:
Undistributed
Net Investment
Income | | Accumulated
Net Realized
Loss | | Paid-In Capital | |
| $ | (15,081 | ) | | $ | 15,080 | | | $ | 1 | | |
Net investment income and net realized gains (losses), as disclosed on the Statement of Operations, and net assets were not affected by this reclassification.
The tax character of distributions paid during the years ended October 31, 2009 and October 31, 2008 was as follows:
| | | October 31, | |
| | | 2009 | | 2008 | |
| Tax-Exempt Income | | $ | 3,280,569 | | | $ | 3,739,148 | | |
| Ordinary Income* | | | 2,367 | | | | 72,275 | | |
| Long-Term Capital Gains | | | 252,127 | | | | 1,168,639 | | |
* For tax purposes short-term capital gains distributions, if any, are considered ordinary income distributions.
As of October 31, 2009, the components of distributable earnings on a tax basis were as follows:
Undistributed
Tax-Exempt
Income | | Undistributed
Long-Term
Capital Gains | | Net Unrealized
Appreciation* | |
| $ | 370,807 | | | $ | — | | | $ | 1,656,665 | | |
* The differences between book-basis and tax-basis net unrealized appreciation are primarily due to discount accretion/premium amortization on debt securities.
Unrealized appreciation and depreciation at October 31, 2009, based on cost of investments for federal income tax purposes were:
| Unrealized appreciation | | $ | 3,827,866 | | |
| Unrealized depreciation | | | (2,171,201 | ) | |
| Net unrealized appreciation | | $ | 1,656,665 | | |
The following capital loss carryforwards may be available to reduce taxable income arising from future net realized gains on investments, if any, to the extent permitted by the Internal Revenue Code:
| Year of Expiration | | Capital Loss
Carryforward | |
| | 2017 | | | $ | 335,898 | | |
Management is required to determine whether a tax position of the Fund is more likely than not to be sustained upon examination by the applicable taxing authority, including resolution of any related appeals or litigation processes, based on the technical merits of the position. The tax benefit to be recognized by the Fund is measured as the largest amount of benefit that is greater than fifty percent likely of being realized upon ultimate settlement. Management is not aware of any tax positions for which it is reasonably possible that the total amounts of unrecognized tax benefits will significantly change in the next twelve months. However, management's conclusions may be subject to review and adjustment at a later date based on factors including, but not limited to, new tax laws, regulations, and administrative interpretations (including relevant court decisions). The Fund's federal tax
22
Columbia Connecticut Tax-Exempt Fund, October 31, 2009
returns for the prior three fiscal years remain subject to examination by the Internal Revenue Service.
Note 4. Fees and Compensation Paid to Affiliates
Investment Advisory Fee
Columbia Management Advisors, LLC ("Columbia"), an indirect, wholly owned subsidiary of Bank of America Corporation ("BOA"), provides investment advisory, administrative and other services to the Fund. Columbia receives a monthly investment advisory fee based on the Fund's pro-rata portion of the combined average daily net assets of the Fund, Columbia California Tax-Exempt Fund, Columbia Massachusetts Tax-Exempt Fund and Columbia New York Tax-Exempt Fund, as follows:
| Combined Average Daily Net Assets | | Annual Fee Rate | |
| First $1 billion | | | 0.50 | % | |
| $1 billion to $3 billion | | | 0.45 | % | |
| Over $3 billion | | | 0.40 | % | |
For the year ended October 31, 2009, the Fund's effective investment advisory fee rate was 0.50% of the Fund's average daily net assets.
BOA entered into an agreement dated September 29, 2009 to sell a portion of the asset management business of Columbia Management Group, LLC to Ameriprise Financial, Inc. The transaction ("Transaction") includes a sale of the part of the asset management business that advises long-term mutual funds, including the Fund. The Transaction is subject to certain approvals and other conditions to closing, and is currently expected to close in the spring of 2010.
Pricing and Bookkeeping Fees
The Fund has entered into a Financial Reporting Services Agreement (the "Financial Reporting Services Agreement") with State Street Bank & Trust Company ("State Street") and Columbia pursuant to which State Street provides financial reporting services to the Fund. The Fund has also entered into an Accounting Services Agreement (collectively with the Financial Reporting Services Agreement, the "State Street Agreements") with State Street and Columbia pursuant to which State Street provides accounting services to the Fund. Under the State Street Agreements, the Fund pays State Street an annual fee of $38,000 paid monthly plus an additional monthly fee based on an annualized percentage rate of average daily net assets of the Fund for the month. The aggregate fee will not exceed $140,000 per year (exclusive of out-of-pocket expenses and charges). The Fund also reimburses State Street for certain out-of-pocket expenses and charge s.
The Fund has entered into a Pricing and Bookkeeping Oversight and Services Agreement (the "Services Agreement") with Columbia. Under the Services Agreement, Columbia provides services related to Fund expenses and the requirements of the Sarbanes-Oxley Act of 2002, and provides oversight of the accounting and financial reporting services provided by State Street. Under the Services Agreement, the Fund reimburses Columbia for out-of-pocket expenses.
Transfer Agent Fee
Columbia Management Services, Inc. (the "Transfer Agent"), an affiliate of Columbia and an indirect, wholly owned subsidiary of BOA, provides shareholder services to the Fund and has contracted with Boston Financial Data Services ("BFDS") to serve as sub-transfer agent. The Transfer Agent is entitled to receive a fee for its services, paid monthly, at the annual rate of $17.34 per account plus reimbursement of certain sub-transfer agent fees paid by the Transfer Agent (exclusive of BFDS fees), calculated based on assets held in omnibus accounts and intended to recover the cost of payments to other parties (including affiliates of BOA) for services to those accounts. Effective November 1, 2009, the annual rate changed to $22.36 per account. The Transfer Agent pays the fees of BFDS for services as sub-transfer agent and is not entitled to reimbursement for such fees from the Fund.
The Transfer Agent may also retain, as additional compensation for its services, fees for wire, telephone and redemption orders, Individual Retirement Account ("IRA") trustee agent fees and account transcript fees due to the Transfer Agent from shareholders of the Fund and credits (net of bank charges) earned with respect to balances in accounts the Transfer Agent maintains in connection with its services to the Fund. The Transfer Agent also receives reimbursement for certain out-of-pocket expenses.
23
Columbia Connecticut Tax-Exempt Fund, October 31, 2009
An annual minimum account balance fee of $20 may apply to certain accounts with a value below the Fund's initial minimum investment requirements to reduce the impact of small accounts on transfer agent fees. These minimum account balance fees are recorded as part of expense reductions on the Statement of Operations. For the year ended October 31, 2009, there were no minimum account balance fees charged by the fund.
Underwriting Discounts, Service and Distribution Fees
Columbia Management Distributors, Inc. (the "Distributor"), an affiliate of Columbia and an indirect, wholly owned subsidiary of BOA, is the principal underwriter of the Fund's shares. For the year ended October 31, 2009, the Distributor has retained net underwriting discounts of $10,073 on sales of the Fund's Class A shares and received net CDSC fees of $-, $5,835 and $168 on Class A, Class B and Class C share redemptions, respectively.
The Fund has adopted distribution and shareholder servicing plans (the "Plans") pursuant to Rule 12b-1 under the 1940 Act, which require the payment of distribution and service fees. The fees are intended to compensate the Distributor and/or eligible selling and/or servicing agents for selling shares of the Fund and providing services to investors. The service fee is equal to 0.10% annually of the net assets attributable to shares of the Fund issued prior to December 1, 1994 and 0.25% annually of the net assets attributable to shares issued thereafter. This arrangement results in an annual rate of service fee for all shares that is a blend between the 0.10% and 0.25% rates. For the year ended October 31, 2009, the Fund's effective service fee rate was 0.24% of the Fund's average daily net assets attributable to Class A, Class B and Class C shares.
The Plans also require the payment of a monthly distribution fee to the Distributor equal to 0.75% annually of the average daily net assets attributable to Class B and Class C shares only. The Distributor has voluntarily agreed to waive a portion of the distribution fee for Class C shares so that it does not exceed 0.45% annually of the average daily net assets attributable to Class C shares. This arrangement may be modified or terminated by the Distributor at any time.
Fee Waivers and Expense Reimbursements
Columbia has voluntarily agreed to reimburse a portion of the Fund's expenses so that the Fund's ordinary operating expenses (excluding any distribution and service fees, brokerage commissions, interest, taxes and extraordinary expenses, but including custodian charges relating to overdrafts, if any), after giving effect to any balance credits from the Fund's custodian, do not exceed 0.60% of the Fund's average daily net assets on an annualized basis. Columbia, in its discretion, may revise or discontinue this arrangement any time.
Fees Paid to Officers and Trustees
All officers of the Fund are employees of Columbia or its affiliates and, with the exception of the Fund's Chief Compliance Officer, receive no compensation from the Fund. The Board of Trustees has appointed a Chief Compliance Officer to the Fund in accordance with federal securities regulations. The Fund, along with other affiliated funds, pays its pro-rata share of the expenses associated with the Chief Compliance Officer. The Fund's expenses for the Chief Compliance Officer will not exceed $15,000 per year.
The Trust's eligible Trustees may participate in a deferred compensation plan which may be terminated at any time. Obligations of the plan will be paid solely out of the Fund's assets.
Other
The Fund may make daily investments of cash balances in Columbia Connecticut Municipal Reserves, an affiliated open-ended investment company, pursuant to an exemptive order received from the Securities and Exchange Commission. As an investing Fund, the Fund indirectly bears its proportionate share of the expenses of Columbia Connecticut Municipal Reserves.
Note 5. Custody Credits
The Fund has an agreement with its custodian bank under which custody fees may be reduced by balance credits. These credits are recorded as part of expense reductions on the Statement of Operations. The Fund could have invested a portion of the assets utilized in connection with the expense offset arrangement in an income-producing asset if it had not entered into such an agreement.
24
Columbia Connecticut Tax-Exempt Fund, October 31, 2009
For the year ended October 31, 2009, these custody credits reduced total expenses by $704 for the Fund.
Note 6. Objectives and Strategies for Investing in Derivative Instruments
The Fund uses derivatives instruments including futures contracts in order to meet its investment objectives. The Fund employs strategies in differing combinations to permit it to increase, decrease or change the level of exposure to market risk factors. The achievement of any strategy relating to derivatives depends on analysis of various risk factors, and if the strategies for use of derivatives do not work as intended, the Fund may not achieve its investment objectives.
In pursuit of its investment objectives, the Fund is exposed to the following market risks:
Interest Rate Risk: Interest rate risk relates to the fluctuation in value of fixed income securities because of the inverse relationship of price and yield. Fixed income securities generally will decline in value upon an increase in general interest rates, and their value generally will increase upon a decline in general interest rates. Fixed income securities with longer durations tend to be more sensitive to changes in interest rates, usually making them more volatile than securities with shorter durations.
Futures Contracts—The Fund entered into interest rate futures contracts to manage the duration and yield curve exposure of the Fund versus the benchmark.
The use of futures contracts involves certain risks, which include: (1) imperfect correlation between the price movement of the instruments and the underlying securities, (2) inability to close out positions due to differing trading hours, or the temporary absence of a liquid market, for either the instruments or the underlying securities, and (3) an inaccurate prediction of the future direction of interest rates by Columbia.
Upon entering into a futures contract, the Fund pledges cash or securities with the broker in an amount sufficient to meet the initial margin requirement. Subsequent payments are made or received by the Fund equal to the daily change in the contract value and are recorded as variation margin receivable or payable and offset in unrealized gains or losses. The Fund recognizes a realized gain or loss when the contract is closed or expires.
Futures contracts involve, to varying degrees, risk of loss in excess of the variation margin disclosed on the Fund's Statement of Assets and Liabilities.
During the year ended October 31, 2009, the Fund entered into 33 futures contracts. The Fund did not have any open futures contracts at the end of the year.
The effect of derivative instruments on the Statement of Operations for the year ended October 31, 2009.
| | | Amount of Realized Gain
on Derivatives Recognized in Income | |
| Risk Exposure | | Futures Contracts | |
| Interest Rate | | $ | 41,163 | | |
Note 7. Portfolio Information
For the year ended October 31, 2009, the cost of purchases and proceeds from sales of securities, excluding short-term obligations, for the Fund were $6,561,143 and $7,619,472, respectively.
Note 8. Line of Credit
The Fund and other affiliated funds participate in a $280,000,000 committed, unsecured revolving line of credit provided by State Street. The maximum amount that may be borrowed by any fund is limited to the lesser of $200,000,000 and the Fund's borrowing limit set forth in the Fund's registration statement. Borrowings are available for short-term liquidity or temporary or emergency purposes.
Effective October 15, 2009, interest is charged to each participating fund based on the fund's borrowings at a rate per annum equal to the greater of the Federal Funds Rate plus 1.25% or the overnight LIBOR Rate plus 1.25%. In addition, a commitment fee of 0.15% per annum is accrued and apportioned among the participating funds pro rata based on their relative net assets.
Prior to October 15, 2009, interest was charged to each participating fund based on the fund's borrowings at a rate per annum equal to the greater of the Federal Funds Rate plus 0.50% or the overnight LIBOR Rate plus 0.50%. In addition, an annual operations agency fee of $20,000, an amendment fee of 0.02% and a commitment fee of 0.12% per
25
Columbia Connecticut Tax-Exempt Fund, October 31, 2009
annum were accrued and apportioned among the participating funds pro rata based on their relative net assets.
For the year ended October 31, 2009, the Fund did not borrow under these arrangements.
Note 9. Shares of Beneficial Interest
As of October 31, 2009, 10.5% of the Fund's shares outstanding were beneficially owned by one participant account over which BOA and/or any of its affiliates had either sole or joint investment discretion. On that date, no other shareholder owned more than 5% of the outstanding shares of the Fund.
Subscription and redemption activity of this account may have a significant effect on the operations of the Fund.
Note 10. Significant Risks and Contingencies
Sector Focus Risk
The Fund may focus its investments in certain sectors, subjecting it to greater risk than a fund that is less focused.
Geographic Concentration Risk
The Fund had greater than 5% of its total net assets at October 31, 2009, invested in debt obligations issued by each of Connecticut and Puerto Rico and their political subdivisions, agencies and public authorities. The Fund is more susceptible to economic and political factors adversely affecting issuers of these state's or territory's municipal securities than are municipal bond funds that are not concentrated to the same extent in these issuers.
Concentration of Credit Risk
The Fund holds investments that are insured by private insurers who guarantee the payment of principal and interest in the event of default or that are supported by a letter of credit. At October 31, 2009, private insurers who insured greater than 5% of the total investments of the Fund were as follows:
| Insurer | | % of Total
Net Assets | |
| National Public Finance Guarantee Corp. | | | 22.3 | % | |
| Ambac Assurance Corp. | | | 18.2 | | |
| Financial Security Assurance, Inc. | | | 10.8 | | |
| Financial Guaranty Insurance Corp. | | | 5.9 | | |
At November 25, 2009, National Public Finance Guarantee Corp., Financial Guaranty Insurance Corp., Ambac Assurance Corp. and Financial Security Assurance, Inc. were rated by Standard & Poor's A, non rated, CC and AAA, respectively.
Tax Development Risk
The Fund purchases municipal securities whose interest, in the opinion of bond counsel, is free from federal income tax. There is no assurance that the Internal Revenue Service (IRS) will agree with this opinion. In the event the IRS determines that an issuer does not comply with relevant tax requirements, interest payments from a security could become federally taxable, possibly retroactively to the date the security was issued. As a shareholder of the Fund, you may be required to file an amended tax return as a result.
Legal Proceedings
Columbia Management Advisors, LLC and Columbia Management Distributors, Inc. (collectively, the "Columbia Group") are subject to a settlement agreement with the New York Attorney General ("NYAG") (the "NYAG Settlement") and a settlement order with the SEC (the "SEC Order") on matters relating to mutual fund trading, each dated February 9, 2005. Under the terms of the SEC Order, the Columbia Group (or predecessor entities) agreed, among other things, to: pay disgorgement and civil money penalties collectively totaling $140 million; cease and desist from violations of the antifraud provisions and certain other provisions of the federal securities laws; maintain certain compliance and ethics oversight structures; and retain an independent consultant to review the Columbia Group's applicable supervisory,
26
Columbia Connecticut Tax-Exempt Fund, October 31, 2009
compliance, control and other policies and procedures. The NYAG Settlement, among other things, requires Columbia Management Advisors, LLC and its affiliates to reduce management fees for certain funds in the Columbia family of mutual funds in a projected total of $160 million over five years through November 30, 2009 and to make certain disclosures to investors relating to expenses. In connection with the Columbia Group providing services to the Columbia Funds, the Columbia Funds have voluntarily undertaken to implement certain governance measures designed to maintain the independence of their boards of trustees and certain special consulting and compliance measures.
Pursuant to the SEC Order and related procedures, the $140 million in settlement amounts described above has been substantially distributed in accordance with a distribution plan that was developed by an independent distribution consultant and approved by the SEC on April 6, 2007.
In connection with the events described above, various parties have filed suit against certain funds, the Trustees of the Columbia Funds, FleetBoston Financial Corporation and its affiliated entities and/or Bank of America and its affiliated entities.
On February 20, 2004, the Judicial Panel on Multidistrict Litigation transferred these cases and cases against other mutual fund companies based on similar allegations to the United States District Court in Maryland for consolidated or coordinated pretrial proceedings (the "MDL"). Subsequently, additional related cases were transferred to the MDL. On September 29, 2004, the plaintiffs in the MDL filed amended and consolidated complaints. One of these amended complaints is a putative class action that includes claims under the federal securities laws and state common law, and that names Columbia Management Advisors, Inc. (which has since merged into Banc of America Capital Management, LLC (now named Columbia Management Advisors, LLC)) ("Columbia"), Columbia Funds Distributor, Inc. (now named Columbia Management Distributors, Inc.) (the "Distributor"), the Trustees of the Columbia Funds, Bank of America Corporation and others as d efendants. Another of the amended complaints is a derivative action purportedly on behalf of the Columbia Funds that asserts claims under federal securities laws and state common law.
On February 25, 2005, Columbia and other defendants filed motions to dismiss the claims in the pending cases. On March 1, 2006, for reasons stated in the court's memoranda dated November 3, 2005, the United States District Court for the District of Maryland granted in part and denied in part the defendants' motions to dismiss. The court dismissed all of the class action claims pending against the Columbia Funds Trusts. As to Columbia and the Distributor, the claims under the Securities Act of 1933, the claims under Sections 34(b) and 36(a) of the Investment Company Act of 1940 ("ICA") and the state law claims were dismissed. The claims under Sections 10(b) and 20(a) of the Securities Exchange Act of 1934 and claims under Section 36(b) of the ICA were not dismissed.
On March 21, 2005, a purported class action was filed in Massachusetts state court alleging that certain conduct, including market timing, entitled Class B shareholders in certain Columbia Funds to an exemption from contingent deferred sales charges upon early redemption (the "CDSC Lawsuit"). The CDSC Lawsuit was removed to federal court in Massachusetts and transferred to the MDL.
On September 14, 2007, the plaintiffs and the Columbia defendants named in the MDL, including the Columbia Funds, entered into a stipulation of settlement with respect to all Columbia-related claims in the MDL described above, including the CDSC Lawsuit. The settlement is subject to court approval.
27
Report of Independent Registered Public Accounting Firm
To the Trustees of Columbia Funds Series Trust I and the Shareholders of Columbia Connecticut Tax-Exempt Fund:
In our opinion, the accompanying statement of assets and liabilities, including the investment portfolio, and the related statements of operations and of changes in net assets and the financial highlights present fairly, in all material respects, the financial position of Columbia Connecticut Tax-Exempt Fund (the "Fund") (a series of Columbia Funds Series Trust I) at October 31, 2009, the results of its operations for the year then ended, the changes in its net assets for each of the two years in the period then ended and the financial highlights for each of the five years in the period then ended, in conformity with accounting principles generally accepted in the United States of America. These financial statements and financial highlights (hereafter referred to as "financial statements") are the responsibility of the Fund's management. Our responsibility is to express an opinion on these financial statements based on our audit s. We conducted our audits of these financial statements in accordance with the standards of the Public Company Accounting Oversight Board (United States). Those standards require that we plan and perform the audit to obtain reasonable assurance about whether the financial statements are free of material misstatement. An audit includes examining, on a test basis, evidence supporting the amounts and disclosures in the financial statements, assessing the accounting principles used and significant estimates made by management, and evaluating the overall financial statement presentation. We believe that our audits, which included confirmation of securities at October 31, 2009 by correspondence with the custodian and brokers, provide a reasonable basis for our opinion.
PricewaterhouseCoopers LLP
Boston, Massachusetts
December 18, 2009
28
Federal Income Tax Information (Unaudited)
For the fiscal year ended October 31, 2009, 99.93% of the distributions from net investment income of the Fund qualifies as exempt interest dividends for federal income tax purposes. A portion of the income may be subject to federal alternative minimum tax.
The Fund will notify shareholders in January 2010 of amounts for use in preparing 2009 income tax returns.
29
Fund Governance – Columbia Connecticut Tax-Exempt Fund
The Trustees serve terms of indefinite duration. The names, addresses and ages of the Trustees and officers of the Funds in Columbia Funds Series Trust I, the year each was first elected or appointed to office, their principal business occupations during at least the last five years, the number of Funds overseen by each Trustee and other directorships they hold are shown below. Each officer listed below serves as an officer of each Fund in the Columbia Funds Complex.
Independent Trustees
Name, Address and Year of Birth,
Position with Funds, Year First
Elected or Appointed to Office | | Principal Occupation(s) During Past Five Years, Number of Funds in the Columbia
Funds Complex Overseen by Trustee, Other Directorships Held
| |
| John D. Collins (Born 1938) | |
|
c/o Columbia Management
Advisors, LLC
One Financial Center
Boston, MA 02111
Trustee (since 2007) | | Retired. Consultant, KPMG, LLP (accounting and tax firm) from July 1999 to June 2000; Partner, KPMG, LLP from March 1962 to June 1999. Oversees 66, Mrs. Fields Famous Brands LLC (consumer products); Suburban Propane Partners, L.P.; and Montpelier Re (insurance underwriting firm) | |
|
| Rodman L. Drake (Born 1943) | |
|
c/o Columbia Management
Advisors, LLC
One Financial Center
Boston, MA 02111
Trustee (since 2007)
and Chairman of the Board
(since 2009) | | Co-Founder of Baringo Capital LLC (private equity) since 2002; President, Continuation Investments Group, Inc. from 1997 to 2001. Oversees 66, Jackson Hewitt Tax Service Inc. (tax preparation services); Crystal Capital River Inc. (real estate investment trust); Student Loan Corporation (student loan provider); Celgene Corporation (global biotechnology company); and The Helios Funds (exchange-traded funds) | |
|
| Douglas A. Hacker (Born 1955) | |
|
c/o Columbia Management
Advisors, LLC
One Financial Center
Boston, MA 02111
Trustee (since 1996) | | Independent business executive since May 2006; Executive Vice President—Strategy of United Airlines (airline) from December 2002 to May 2006; President of UAL Loyalty Services (airline marketing company) from September 2001 to December 2002; Executive Vice President and Chief Financial Officer of United Airlines from July 1999 to September 2001. Oversees 66, Nash Finch Company (food distributor); Aircastle Limited (aircraft leasing) | |
|
| Janet Langford Kelly (Born 1957) | |
|
c/o Columbia Management
Advisors, LLC
One Financial Center
Boston, MA 02111
Trustee (since 1996) | | Senior Vice President, General Counsel and Corporate Secretary, ConocoPhillips (integrated energy company) since September 2007; Deputy General Counsel—Corporate Legal Services, ConocoPhillips from August 2006 to August 2007; Partner, Zelle, Hofmann, Voelbel, Mason&Gette LLP (law firm) from March 2005 to July 2006; Adjunct Professor of Law, Northwestern University, from September 2004 to June 2006; Director, UAL Corporation (airline) from February 2006 to July 2006; Oversees 66, None | |
|
| Charles R. Nelson (Born 1942) | |
|
c/o Columbia Management
Advisors, LLC
One Financial Center
Boston, MA 02111
Trustee (since 1981) | | Professor of Economics, University of Washington, since January 1976; Ford and Louisa Van Voorhis Professor of Political Economy, University of Washington, since September 1993; Adjunct Professor of Statistics, University of Washington, since September 1980; Associate Editor, Journal of Money Credit and Banking, 1993-2008 Consultant on econometric and statistical matters. Oversees 66, None | |
|
30
Fund Governance (continued) – Columbia Connecticut Tax-Exempt Fund
Independent Trustees (continued)
Name, Address and Year of Birth,
Position with Funds, Year First
Elected or Appointed to Office | | Principal Occupation(s) During Past Five Years, Number of Funds in the Columbia
Funds Complex Overseen by Trustee, Other Directorships Held
| |
| John J. Neuhauser (Born 1943) | |
|
c/o Columbia Management
Advisors, LLC
One Financial Center
Boston, MA 02111
Trustee (since 1985) | | President, Saint Michael's College, since August 2007; University Professor, Boston College from November 2005 to August 2007; Academic Vice President and Dean of Faculties, Boston College from August 1999 to October 2005. Oversees 66, Liberty All-Star Equity Fund and Liberty All-Star Growth Fund, Inc. (closed-end funds) | |
|
| Jonathan Piel (Born 1938) | |
|
c/o Columbia Management
Advisors, LLC
One Financial Center
Boston, MA 02111
Trustee (since 2007) | | Cable television producer and website designer; The Editor, Scientific American from 1984 to 1994; Vice President, Scientific American, Inc., from 1984 to 1994; Member, Advisory Board, Stone Age Institute, Bloomington, Indiana (research institute that explores the effect of technology on human evolution); Member, Board of Directors of the National Institute of Social Sciences, New York City; Member, Board of Trustees of the William Alanson White Institute, New York City (institution for training psychoanalysts); and Member, Advisory Board, Mount Sinai Children's Environmental Health Center, New York. Oversees 66, None | |
|
| Patrick J. Simpson (Born 1944) | |
|
c/o Columbia Management
Advisors, LLC
One Financial Center
Boston, MA 02111
Trustee (since 2000) | | Partner, Perkins Coie LLP (law firm). Oversees 66, None | |
|
| Thomas C. Theobald (Born 1937) | |
|
c/o Columbia Management
Advisors, LLC
One Financial Center
Boston, MA 02111
Trustee (since 1996) | | Partner and Senior Advisor, Chicago Growth Partners (private equity investing) since September 2004; Managing Director, William Blair Capital Partners (private equity investing) from September 1994 to September 2004. Oversees 66, Anixter International (network support equipment distributor); Ventas, Inc. (real estate investment trust); Jones Lang LaSalle (real estate management services); Ambac Financial Group (financial guaranty insurance) | |
|
| Anne-Lee Verville (Born 1945) | |
|
c/o Columbia Management
Advisors, LLC
One Financial Center
Boston, MA 02111
Trustee (since 1998) | | Retired since 1997 (formerly General Manager—Global Education Industry (from 1994 to 1997), President-Application Systems Division (from 1991 to 1994), Chief Financial Officer—US Marketing&Services (from 1988 to 1991), and Chief Information Officer (from 1987 to 1988), IBM Corporation (computer and technology)). Oversees 66, None | |
|
31
Fund Governance (continued) – Columbia Connecticut Tax-Exempt Fund
Interested Trustee
Name, Address and Year of Birth,
Position with Funds, Year First
Elected or Appointed to Office | | Principal Occupation(s) During Past Five Years, Number of Funds in the Columbia
Funds Complex Overseen by Trustee, Other Directorships Held
| |
| William E. Mayer1 (Born 1940) | |
|
c/o Columbia Management
Advisors, LLC
One Financial Center
Boston, MA 02111
Trustee (since 1994) | | Partner, Park Avenue Equity Partners (private equity) since February 1999; Dean and Professor, College of Business, University of Maryland from 1992 to 1997. Oversees 66, Lee Enterprises (print media),WRHambrecht + Co. (financial service provider); BlackRock Kelso Capital Corporation (investment company) | |
|
1 The Funds currently treat Mr. Mayer as an "interested person" (as defined in the Investment Company Act of 1940) by reason of his affiliation with WR Hambrecht + Co., a registered broker/dealer that may execute portfolio transactions for or engage in principal transactions with the Funds or other funds or accounts advised/managed by the Advisor or other Bank of America affiliates.
The Statement of Additional Information includes additional information about the Trustees of the Funds and is available, without charge, upon request by calling 1-800-345-6611.
Officers
Name, Address and Year of Birth,
Position with Funds, Year First
Elected or Appointed to Office | | Principal Occupation(s) During Past Five Years
| |
| J. Kevin Connaughton (Born 1964) | |
|
One Financial Center
Boston, MA 02111
President (since 2009) | | Managing Director of Columbia Management Advisors, LLC since December 2004; Senior Vice President and Chief Financial Officer—Columbia Funds, from June 2008 to January 2009; Treasurer—Columbia Funds, from October 2003 to May 2008; Treasurer—the Liberty Funds, Stein Roe Funds and Liberty All-Star Funds, December 2000-December 2006; Senior Vice President—Columbia Management Advisors, LLC, from April 2003 to December 2004; President—Columbia Funds, Liberty Funds and Stein Roe Funds, February 2004 to October 2004; Treasurer—Galaxy Funds, September 2002 to December 2005; Treasurer, December 2002 to December 2004, and President, February 2004 to December 2004—Columbia Management Multi-Strategy Hedge Fund, LLC; and a senior officer of various other Bank of America-affiliated entities, including other registered and unregistered funds. | |
|
| James R. Bordewick, Jr. (Born 1959) | |
|
One Financial Center
Boston, MA 02111
Senior Vice President, Secretary
and Chief Legal Officer (since 2006) | | Associate General Counsel, Bank of America since April 2005; Senior Vice President and Associate General Counsel, MFS Investment Management (investment management) prior to April 2005. | |
|
| Linda J. Wondrack (Born 1964) | |
|
One Financial Center
Boston, MA 02111
Senior Vice President and
Chief Compliance Officer
(since 2007) | | Director (Columbia Management Group LLC and Investment Product Group Compliance), Bank of America since June 2005; Director of Corporate Compliance and Conflicts Officer, MFS Investment Management (investment management), August 2004 to May 2005; Managing Director, Deutsche Asset Management (investment management) prior to August 2004. | |
|
32
Fund Governance (continued) – Columbia Connecticut Tax-Exempt Fund
Officers (continued)
Name, Address and Year of Birth,
Position with Funds, Year First
Elected or Appointed to Office | | Principal Occupation(s) During Past Five Years
| |
| Michael G. Clarke (Born 1969) | |
|
One Financial Center
Boston, MA 02111
Senior Vice President and
Chief Financial Officer
(since 2009) | | Director of Fund Administration of the Advisor since January 2006; Managing Director of the Advisor September 2004 to December 2005; Vice President Fund Administration June 2002 to September 2004. | |
|
| Jeffrey R. Coleman (Born 1969) | |
|
One Financial Center
Boston, MA 02111
Deputy Treasurer (since 2006) | | Director of Fund Administration of the Advisor since January 2006; Fund Controller of the Advisor from October 2004 to January 2006; Vice President of CDC IXIS Asset Management Services, Inc. (investment management) from August 2000 to September 2004. | |
|
| Joseph F. DiMaria (Born 1968) | |
|
One Financial Center
Boston, MA 02111
Chief Accounting Officer and
Treasurer (since 2009) | | Director of Fund Administration of the Advisor since January 2006; Head of Tax/Compliance and Assistant Treasurer of the Advisor from November 2004 to December 2005; Director of Trustee Administration (Sarbanes-Oxley) of the Advisor from May 2003 to October 2004. | |
|
| Julian Quero (Born 1967) | |
|
One Financial Center
Boston, MA 02111
Deputy Treasurer (since 2008) | | Senior Tax Manager of the Advisor since August 2006; Senior Compliance Manager of the Advisor from April 2002 to August 2006. | |
|
| Barry S. Vallan (Born 1969) | |
|
One Financial Center
Boston, MA 02111
Controller (since 2006) | | Vice President—Fund Treasury of the Advisor since October 2004; Vice President—Trustee Reporting of the Advisor from April 2002 to October 2004. | |
|
| Stephen T. Welsh (Born 1957) | |
|
One Financial Center
Boston, MA 02111
Vice President (since 1996) | | President, Columbia Management Services, Inc. since July 2004; Senior Vice President and Controller, Columbia Management Services, Inc. prior to July 2004. | |
|
33
Board Consideration and Approval of Advisory Agreements
The Advisory Fees and Expenses Committee of the Board of Trustees meets several times annually to review the advisory agreements (collectively, the "Agreements") of the funds for which the Trustees serve as trustees (each a "fund") and to determine whether to recommend that the full Board approve the continuation of the Agreements for an additional one-year period. After the Committee has made its recommendation, the full Board, including the Independent Trustees, determines whether to approve the continuation of the Agreements. In addition, the full Board, including the Independent Trustees, considers matters bearing on the Agreements at most of its other meetings throughout the year and meets regularly with senior management of the funds and Columbia, the funds' investment adviser, including the senior manager of each investment area within Columbia. Through the Board's Investment Oversight Committees, Trustees also meet with selected fund portfolio managers, research analysts and traders at various times throughout the year.
The Trustees receive and review all materials that they, their legal counsel or Columbia believe to be reasonably necessary for the Trustees to evaluate the Agreements and to determine whether to approve the continuation of the Agreements. Those materials generally include, among other items, (i) information on the investment performance of each fund relative to the performance of peer groups of mutual funds and the fund's performance benchmarks, and additional information assessing performance on a risk-adjusted basis, (ii) information on each fund's advisory fees and other expenses, including information comparing the fund's expenses to those of peer groups of mutual funds and information about any applicable expense caps and fee "breakpoints," (iii) information about the profitability of the Agreements to Columbia, including potential "fall-out" or ancillary benefits that Columbia and its affiliates may receive as a result of their relationships with the funds and (iv) information obtained through Columbia's response to a questionnaire prepared at the request of the Trustees by counsel to the funds and independent legal counsel to the Independent Trustees. The Trustees also consider other information such as (v) Columbia's financial results and financial condition, (vi) each fund's investment objective and strategies and the size, education and experience of Columbia's investment staffs and their use of technology, external research and trading cost measurement tools, (vii) the allocation of the funds' brokerage and the use of "soft" commission dollars to pay for research products and services, (viii) Columbia's resources devoted to, and its record of compliance with, the funds' investment policies and restrictions, policies on personal securities transactions and other compliance policies and legal and regulatory requirements, (ix) Columbia's response to va rious legal and regulatory proceedings since 2003 and to the recent period of volatility in the securities markets and (x) the economic outlook generally and for the mutual fund industry in particular. In addition, the Advisory Fees and Expenses Committee confers with the funds' independent fee consultant and reviews materials relating to the funds' relationships with Columbia provided by the independent fee consultant. Throughout the process, the Trustees have the opportunity to ask questions of and to request additional materials from Columbia and to consult with the independent fee consultant and independent legal counsel to the Independent Trustees.
The Board of Trustees most recently approved the continuation of the Agreements at its October, 2009 meeting, following meetings of the Advisory Fees and Expenses Committee held in December, 2008 and February, May, June, August, September and October, 2009. In considering whether to approve the continuation of the Agreements, the Trustees, including the Independent Trustees, did not identify any single factor as determinative, and each weighed various factors as he or she deemed appropriate. The Trustees considered the following matters in connection with their approval of the continuation of the Agreements:
The nature, extent and quality of the services provided to the funds under the Agreements. The Trustees considered the nature, extent and quality of the services provided by Columbia and its affiliates to the funds and the resources dedicated to the funds by Columbia and its affiliates. Among other things, the Trustees considered (i) Columbia's ability (including its personnel and other resources, compensation programs for personnel involved in fund management, reputation and other attributes) to attract, motivate and retain highly qualified research, advisory and supervisory investment professionals; (ii) the portfolio management services provided by those investment professionals; and (iii) the trade execution services provided on behalf of the funds. For each fund, the Trustees also considered the benefits to shareholders of investing in a mutual f und that is part of a family of funds offering exposure to a variety of asset classes
34
and investment disciplines and providing a variety of fund and shareholder services. After reviewing those and related factors, the Trustees concluded, within the context of their overall conclusions regarding each of the Agreements, that the nature, extent and quality of services provided supported the continuation of the Agreements.
Investment performance of the funds and Columbia. The Trustees reviewed information about the performance of each fund over various time periods, including information prepared by an independent third-party data provider that compared the performance of each fund to the performance of peer groups of mutual funds and performance benchmarks. The Trustees also reviewed a description of the third party's methodology for identifying each fund's peer group for purposes of performance and expense comparisons. The Trustees also considered additional information that the Advisory Fees and Expenses Committee requested from Columbia relating to funds that presented relatively weaker performance and/or relatively higher fees or expenses. In the case of each fund whose performance lagged that of a relevant peer group for certain (although not necessarily all) peri ods, the Trustees concluded that other factors relevant to performance were sufficient, in light of other considerations, to warrant continuation of the fund's Agreements. Those factors varied from fund to fund, but included one or more of the following: (i) that the fund's performance, although lagging in certain recent periods, was stronger over the longer term; (ii) that the underperformance was attributable, to a significant extent, to investment decisions that were reasonable and consistent with the fund's investment strategy and policies and that the fund was performing within a reasonable range of expectations, given those investment decisions, market conditions and the fund's investment strategy; (iii) that the fund's performance was competitive when compared to other relevant performance benchmarks or peer groups; (iv) that Columbia had taken or was taking steps designed to help improve the fund's investment performance, including, but not limited to, replacing portfolio managers or modifying invest ment strategies; and (v) that Columbia proposed to waive advisory fees or cap the expenses of the fund.
The Trustees noted that, through April 30, 2009, Columbia Connecticut Tax-Exempt Fund's performance was in the first quintile (where the best performance would be in the first quintile) for the one-, three- and ten-year periods and in the second quintile for the five-year period, of the peer group selected by an independent third-party data provider for purposes of performance comparisons.
The Trustees also considered Columbia's performance and reputation generally, the funds' performance as a fund family generally, and Columbia's historical responsiveness to Trustee concerns about performance and Columbia's willingness to take steps intended to improve performance. After reviewing those and related factors, the Trustees concluded, within the context of their overall conclusions regarding each of the Agreements, that the performance of each fund and Columbia was sufficient, in light of other considerations, to warrant the continuation of the Agreement(s) pertaining to that fund.
The costs of the services provided and profits realized by Columbia and its affiliates from their relationships with the funds. The Trustees considered the fees charged to the funds for advisory services as well as the total expense levels of the funds. That information included comparisons (provided by management and by an independent third-party data provider) of each fund's advisory fees and total expense levels to those of the fund's peer groups and information about the advisory fees charged by Columbia to comparable institutional accounts. In considering the fees charged to those accounts, the Trustees took into account, among other things, management's representations about the differences between managing mutual funds as compared to other types of accounts, including differences in the services provided, differences in the risk profile of such business for Columbia, and the additional resources required to manage mutual funds effectively. In evaluating each fund's advisory fees, the Trustees also took into account the demands, complexity and quality of the investment management of the fund. The Trustees considered existing advisory fee breakpoints, and Columbia's use of advisory fee waivers and expense caps, which benefited a number of the funds. The Trustees also noted management's stated justification for the fees charged to the funds, which included information about the investment performance of the funds and the services provided to the funds.
The Trustees considered that Columbia Connecticut Tax-Exempt Fund's total expenses were in the third quintile and actual management fees were in the second quintile (where the lowest fees and expenses would be in the first quintile) of the peer group selected by an independent third-party data provider for purposes of expense comparisons.
35
The Trustees also considered the compensation directly or indirectly received by Columbia and its affiliates from their relationships with the funds. The Trustees reviewed information provided by management as to the profitability to Columbia and its affiliates of their relationships with each fund, and information about the allocation of expenses used to calculate profitability. When reviewing profitability, the Trustees also considered court cases in which adviser profitability was an issue in whole or in part, the performance of the relevant funds, the expense level of each fund, and whether Columbia had implemented breakpoints and/or expense caps with respect to the fund.
After reviewing those and related factors, the Trustees concluded, within the context of their overall conclusions regarding each of the Agreements, that the advisory fees charged to each fund, and the related profitability to Columbia and its affiliates of their relationships with the fund, supported the continuation of the Agreement(s) pertaining to that fund.
Economies of Scale. The Trustees considered the existence of any economies of scale in the provision by Columbia of services to each fund, to groups of related funds, and to Columbia's investment advisory clients as a whole and whether those economies were shared with the funds through breakpoints in the investment advisory fees or other means, such as fee waivers/expense reductions and additional investments by Columbia in investment, trading and compliance resources. The Trustees noted that many of the funds benefited from breakpoints, fee waivers/expense caps, or both. In considering those issues, the Trustees also took note of the costs of the services provided (both on an absolute and a relative basis) and the profitability to Columbia and its affiliates of their relationships with the funds, as discussed above.
After reviewing those and related factors, the Trustees concluded, within the context of their overall conclusions regarding each of the Agreements, that the extent to which economies of scale were shared with the funds supported the continuation of the Agreements.
Other Factors. The Trustees also considered other factors, which included but were not limited to the following:
n the extent to which each fund had operated in accordance with its investment objective and investment restrictions, the nature and scope of the compliance programs of the funds and Columbia and the compliance-related resources that Columbia and its affiliates were providing to the funds;
n the nature, quality, cost and extent of administrative and shareholder services overseen and performed by Columbia and its affiliates, both under the Agreements and under separate agreements for the provision of transfer agency and administrative services;
n so-called "fall-out benefits" to Columbia and its affiliates, such as the engagement of its affiliates to provide distribution, brokerage and transfer agency services to the funds, and the benefits of research made available to Columbia by reason of brokerage commissions generated by the funds' securities transactions, as well as possible conflicts of interest associated with those fall-out and other benefits, and the reporting, disclosure and other processes in place to disclose and monitor those possible conflicts of interest; and
n the report provided by the funds' independent fee consultant, which included information about and analysis of the funds' fees, expenses and performance.
Based on their evaluation of all factors that they deemed to be material, including those factors described above, and assisted by the advice of independent counsel and the independent fee consultant, the Trustees, including the Independent Trustees, approved the continuance of each of the Agreements through October 31, 2010.
36
Summary of Management Fee Evaluation by
Independent Fee Consultant
[EXCERPTS FROM:] REPORT OF INDEPENDENT FEE CONSULTANT TO THE FUNDS SUPERVISED BY THE COLUMBIA ATLANTIC BOARD
Prepared Pursuant to the February 9, 2005
Assurance of Discontinuance among the
Office of Attorney General of New York State,
Columbia Management Advisors, LLC, and
Columbia Management Distributors, Inc.
November 6, 2009
I. Overview
On February 9, 2005, Columbia Management Advisors, LLC ("CMA") and Columbia Management Distributors, Inc.1 ("CMDI") agreed to the New York Attorney General's Assurance of Discontinuance ("AOD"). Among other things, the AOD stipulates that CMA may manage or advise a Columbia Fund ("Columbia Fund" and, together with some or all of such funds, the "Columbia Funds") only if the Independent Members of the Columbia Fund's Board of Trustees appoint a Senior Officer or retain an Independent Fee Consultant ("IFC") who is to manage the process by which proposed management fees are negotiated. The AOD further stipulates that the Senior Officer or IFC is to prepare a written annual evaluation of the fee negotiation process.
With effect from January 1, 2007, the Independent Members of the Board of Trustees for certain Columbia Funds known collectively as the "Atlantic Funds" (together with the other members of that Board, the "Trustees") retained me as IFC for the Atlantic Funds.2 In this capacity, I have prepared the fifth annual written evaluation of the fee negotiation process. As was the case with the 2007 and 2008 reports, my immediate predecessor as IFC, John Rea, provided invaluable assistance in the preparation of this year's report.
A. Role of the Independent Fee Consultant
The AOD charges the IFC with "managing the process by which proposed management fees...to be charged the Columbia Fund are negotiated so that they are negotiated in a manner which is at arms' length and reasonable and consistent with this Assurance of Discontinuance." The AOD also provides that CMA "may manage or advise a Columbia Fund only if the reasonableness of the proposed management fees is determined by the Board of Trustees...using...an annual independent written evaluation prepared by or under the direction of...the Independent Fee Consultant." Therefore, the AOD makes clear that the IFC does not supplant the Trustees in negotiating management fees with CMA, nor does the IFC substitute his or her judgment for that of the Trustees with respect to the reasonableness of proposed fees or any other matter that is committed to the business judgment of the Trustees.
B. Elements Involved in Managing the Fee Negotiation Process
In preparing the report required by the AOD, the IFC must consider at least the following six factors set forth in the AOD:
1. The nature and quality of CMA's services, including the Fund's performance;
2. Management fees (including any components thereof) charged by other mutual fund companies for like services;
3. Possible economies of scale as the Fund grows larger;
4. Management fees (including any components thereof) charged to institutional and other clients of CMA for like services;
5. Costs to CMA and its affiliates of supplying services pursuant to the management fee agreements, excluding any intra-corporate profit; and
6. Profit margins of CMA and its affiliates from supplying such services.
C. Organization of the Annual Evaluation
This report, like last year's, focuses on the six factors and contains a section for each factor except that CMA's costs and profits from managing the Funds are treated in a single section. In addition to a discussion of these factors, the report offers recommendations to improve the fee review process in future years. A review of the status of recommendations made in the 2008 Report is being provided separately with the materials for the October meeting.
1 CMA and CMDI are subsidiaries of Columbia Management Group, LLC ("CMG"), and are the successors to the entities named in the AOD.
2 I have no material relationship with Bank of America, CMG or any of its affiliates, aside from serving as IFC, and I am aware of no material relationship with any of their affiliates. I retained John Rea, an independent economic consultant, to assist me with this report.
Unless otherwise stated or required by the context, this report covers only the Atlantic Funds, which are also referred as the "Funds."
37
II. Summary of Findings
A. General
1. Based upon my examination of the information supplied by CMG in the light of the six factors set forth in the AOD, I conclude that the Trustees have the relevant information necessary to evaluate the reasonableness of the proposed management fees for each Atlantic Fund.
2. In my view, the process by which the proposed management fees of the Funds have been negotiated in 2009 thus far has been, to the extent practicable, at arms' length and reasonable and consistent with the AOD.
B. Nature and Quality of Services, Including Performance
3. The performance of the Funds has been relatively strong in recent years, although the one-year record was weaker than longer-term records. Based upon 1-, 3-, 5-, and 10-year returns through April 30, 2009, at least half of all the Funds were in the first and second performance quintiles in each of the three longest performance periods; for the one-year period, 40% of the Funds were in the top two quintiles. No more than 13% of the Funds were in the fifth quintile in any one performance period. Domestic equity, quantitative equity, and taxable fixed-income Funds were the strongest performers in 2009, while most foreign equity Funds lagged behind their competitors.
4. Performance rankings were similar in 2008 and 2009: the 1- and 3-year rankings declined slightly over the previous year, while the 5-year rankings improved modestly. Year over year, for the 1- and 3-year periods, the performance of equity Funds, both domestic and international, declined, while that of fixed-income Funds improved. Between three-fifths to two-thirds of the Funds changed quintile rankings in 2009 in the 1-, 3-, and 5-year performance periods.
5. The performance of the domestic equity Funds against their benchmarks was good for the 3- and 5-year performance periods. In contrast, gross returns of international equity and fixed-income Funds typically fell short of their benchmarks. The performance of equity Funds against their benchmarks was highly correlated to performance versus their peers; no such correlation was observed for fixed-income Funds.
6. The Atlantic equity Funds' overall performance adjusted for risk was solid. Based upon 3-year returns, nearly 57% of the equity Funds had a combination of risk-adjusted and unadjusted returns that placed them in the top half of their performance universes. About one quarter of the fixed-income Funds posted high returns and low risk relative to comparable funds. Just over half of the fixed-income Funds, primarily tax-exempt Funds, took on more risk than the typical fund in their performance universes.
7. The industry-standard procedure used by Lipper that includes all share classes in the performance universe tends to bias a Fund's ranking upward within that universe. The bias occurs because either no-12b-1 fee or low-12b-1 fee share classes of the Atlantic Funds are compared with funds in performance universes that include all share classes of multi-class funds with 12b-1 fees of up to 100 basis points. Correcting this bias by limiting the performance universe to classes of comparable funds with low or no 12b-1 fees (a "filtered universe") lowers the relative performance for the Funds, but not to a material extent. The filtering process, however, did identify one Fund for further review that had not been identified as a review fund using unfiltered universes. Conversely, two Funds that had been identified as review funds in the unfiltered universe lost that status in filtered universes.
8. A small number of Funds have consistently underperformed over the past five years. The exact number depends on the criteria used to evaluate longer-term performance. For example, only three Funds had below-median performance in each 1- and 3-year period from 2005 to 2009.
9. The services performed by CMG professionals beyond portfolio management, such as compliance, legal, information technology, risk management, finance, and fund administration, are critical to the success of the Funds and appear to be of high quality.
C. Management Fees Charged by Other Mutual Fund Companies
10. The Funds' management fees and total expenses are generally low relative to those of their peers, with over half of the Funds in the most favorable two quintiles. Only 26% of the Funds ranked in the two most expensive quintiles for actual management fees, and 18% in those quintiles for
38
total expenses. Two Funds are in the fifth quintile for total expenses; four Funds are in the fifth quintile for actual management fees.
11. The highest concentration of low-expense Funds is found among the foreign equity Funds. The 12 former Excelsior Funds have relatively high fees and expenses, with two-thirds ranking in either the fourth or fifth quintiles for actual management fees. The higher actual management fee rankings of certain former Excelsior Funds are due in part to fee schedules that are higher than standard Columbia Fund fee schedules at current asset levels.
12. The distribution of total expense and management fee rankings has improved over the prior two years. The implementation of the voluntary standardized cap system has contributed significantly to the improved rankings in 2009.
13. The management fees of the Atlantic Funds are generally in line with those of Columbia Funds supervised by the Nations Board of Trustees (the "Nations Funds"). To the extent that Atlantic Funds have higher average fees in certain investment categories than Nations Funds, the difference reflects either differences in asset size, different fee structures of the former Excelsior Funds, or special circumstances of the Funds included in the investment categories.
D. Trustees' Advisory Contract Review Process
14. The Trustees' evaluation process identified 16 Funds in 2009 for further review based upon long-standing criteria relating to their relative performance or expenses or both. When compared in filtered universes, one additional Fund met the criteria for further review. CMG provided further information about each of those Funds to assist the Trustees in their evaluation.
E. Potential Economies of Scale
15. CMG presented to the Trustees its analysis of the sources and sharing of potential economies of scale. CMG views economies of scale as arising at the complex level and would regard estimates of scale economies for individual funds as unreliable. In its analysis, CMG did not identify specific sources of economies of scale or provide any estimates of any economies of scale that might arise from future asset growth. CMG's analysis included measures taken by the Trustees and CMG that seek to share any potential economies of scale through breakpoints in management fee schedules, the establishment of expense limits for each Fund, enhanced shareholder services, fund mergers, and operational consolidation.
16. An examination of the contractual fee schedules for five Atlantic Funds shows that those with standard fee structures are generally in line with those of their competitors. The fee schedules of the former Excelsior Funds, however, have high initial fees relative to competitors but otherwise have comparable breakpoint structures.
F. Management Fees Charged to Institutional Clients
17. CMG has provided Trustees with comparisons of mutual fund management fees and institutional fees based upon standardized fee schedules and upon actual fees. The results show that, consistent with industry practice, actual and scheduled institutional fees are generally lower than the Funds' management fees. CMG provided additional data this year demonstrating that at small asset levels, the effective fee of certain Funds may be equal to or less than institutional fee levels at those asset levels, due to the effect of expense limits on small funds with high gross expenses. CMG also analyzed the differences between the services provided and risks borne on the one hand by a manager of mutual funds and on the other by institutional advisers, and suggested that these differences should be kept in mind when Trustees review the reasonableness of the Funds' management fees.
G. Revenues, Expenses, and Profits
18. The activity-based cost allocation methodology employed by CMG to allocate costs, both direct and indirect, for purposes of calculating Fund profitability is thoughtful and detailed. This year, CMG further refined the technique by allocating additional indirect expenses on an activity basis.
19. The materials provided on CMG's revenues and expenses with respect to the Funds and the methodology underlying their construction form a sufficient basis for Trustees to evaluate the expenses of and profitability to CMG arising out of its relationships with the Funds.
39
20. CMG provided a firm-wide pro forma 2009 income statement demonstrating the effect of market events beginning in the fourth quarter of 2008 on its revenues and profitability to provide an additional perspective on calendar 2008 profitability data. In particular, 2008 revenues reflected the higher market prices prevailing during the first three quarters of that year, while expenses dropped due to cost cutting in the wake of the market downturn late in 2008. The continuing effects of this downturn are expected to produce a significant decline in profitability this year.
21. In 2008, CMG's pre-tax post-distribution margin on the Atlantic Fund complex was above industry medians, based on the limited data available for publicly held mutual fund managers. However, as is to be expected in a large fund complex, some Atlantic Funds had relatively high pre-tax profit margins in 2008, when calculated solely with respect to management revenues and expenses, while other Atlantic Funds operated at a loss. There is a positive relationship between Fund size and profitability to CMG, with smaller Funds generally operating at a loss to CMG.
22. CMG pays a fixed percentage of its management fee revenues to an affiliate, U.S. Trust, Bank of America Private Wealth Management, with respect to assets of its clients invested in Atlantic Funds to compensate it for services it performs with respect to those client assets and for the effect of state law limitations on affiliates charging multiple fees. Based on our analysis of the services provided by this affiliate, we have concluded that all payments other than those for sub-transfer agent or sub-accounting services should be treated as a distribution expense.
III. Recommendations
1. Criteria for review. The Trustees may wish to consider modifying the criteria for identifying a Fund for further review (a "Review Fund") to include criteria that focus exclusively on performance. The Trustees' supplementary data request included one such criterion. They may also wish to consider whether it would be useful to apply CMG's own internal monitoring standards for Fund performance to the contract review process, or whether such criteria are more relevant to their ongoing investment oversight.
2. Presentation of Review Fund discussion. CMG should consider whether it could more systematically present in one discussion all relevant information regarding each Review Fund, which is now split into several different portions of the 15(c) materials. For any Fund that has been a Review Fund in consecutive years, CMG should address under what circumstances it could reasonably be anticipated that the Fund would lose that status.
3. Refinement of tax-exempt performance data. Certain single-state tax-exempt Funds compete in extremely small universes and are compared to a multi-state benchmark of uncertain relevance. Notwithstanding the difficulties, CMG should work to improve the reliability of the calculation of relative performance of these Funds. If that is not possible, CMG should provide guidance on how the Trustees should judge the quality of CMG's management of these Funds.
4. Development of risk metrics for asset-allocation, tax-exempt, and money market funds. CMG has developed and shared with the Trustees quantitative risk metrics comparing equity and taxable fixed-income Funds against their peers. However, reliable risk metrics have not been developed for asset-allocation, tax-exempt fixed income, and money market funds. We urge CMG to continue its efforts to provide reliable risk measures for these categories of Funds, especially in the cases of asset-allocation and money market funds, because their investors are likely to be motivated at least in part by a desire to manage risk.
5. Profitability data. For any period during which CMG is an affiliate of U.S. Trust, Bank of America Private Wealth Management, CMG should continue to present to the Trustees the profitability of each Fund, each investment style and each complex (of which Atlantic is one) calculated as follows:
a. Management-only profitability should be calculated without reference to any Private Bank expense.
b. Profitability excluding distribution (which essentially covers the management and transfer agency functions) should be adjusted by removing from the expense calculation any portion of the Private Bank payment not attributable to the performance by the Private Bank of sub-transfer agency or sub-accounting functions.
c. Total profitability, including distribution: No adjustment for Private Bank expenses should be made, because all such expenses represent legitimate fund expenses to be taken into account in calculating CMG's profit margin including distribution.
40
d. Distribution only: This should include all Private Bank expenses other than those attributable to sub-transfer agency services.
6. Contractual fee analysis. This year CMG presented a new Lipper report comparing the contractual management fees of Funds with those of competitors in similar investment styles. However, the reliability of the conclusion—that Fund management fee breakpoints compared favorably with competitive fee rates—was limited by the use of competitive funds at all asset levels. The sponsors of a $100 million mutual fund may not have given much thought to breakpoints at $5 billion; therefore, that fund's contractual fee at that level is unlikely to compare favorably with that of a $5 billion Fund. Limiting the competitors to the Lipper expense group, whose constituents are similar in size to the relevant Fund, would make the results more meaningful. In addition, the brea kpoints of a select group of Atlantic Funds (which would differ each year) should continue to be compared to those of industry rivals to ensure that the Funds' breakpoint schedules remain within industry norms. As breakpoint schedules change relatively little each year, performing such a comparison for each Atlantic Fund each year would not be an efficient use of Trustee and CMG resources.
7. Pro forma profitability data. In any year in which CMG or the Trustees believe that the prior year's profitability is unlikely to be representative of current business results due to changes in markets or for any other reason, CMG should, consistent with this year's practice, prepare a pro forma income statement based on year-to-date actual data and reasonable projections used for its own business planning purposes.
8. Additional institutional data and analysis. While CMG provided a substantial amount of information on its institutional business, including a virtually complete database of all institutional accounts, we suggest some additional items for future years: (a) profitability data for the institutional business in the format, and based upon the same allocation methodologies, used to present Fund profitability, (b) an explanation of how CMA sets institutional fee breakpoints, which normally begin at asset levels far lower than those found in Fund management fee breakpoints, and (c) an analysis of differences in actual fees within specific investment categories, with special attention given to accounts established before and after the implementation of the standardized instit utional fee schedules in 2005.
9. Management fee disparities. In any future study of management fees, CMG and the Atlantic Trustees should analyze the differences in management fee schedules, including those arising out of the reorganization of the former Excelsior Funds as Atlantic Funds. As part of that analysis, CMG should provide an explanation for any significant fee differences among comparable funds across fund families sponsored by CMG, such as differences in the management styles of different Funds included the same Lipper category. Finally, if CMG proposes a management fee change or an expense cap for any mutual fund managed by CMA that is comparable to any Atlantic Fund, CMG should provide the Trustees with sufficient information about the proposal to allow the Trustees to assess the appli cability of the proposed change to the relevant Atlantic Fund or Funds.
10. Explanation of data supplied to Lipper. Each year, as part of the 15(c) process, CMG retains Lipper to compare the fees and expenses of each Fund to a group of competitors. In many cases, CMG, with the approval of the Trustees, adjusts the actual expense data, which is based on the most recent full fiscal year of the Fund (and each competitive fund) to reflect changes in fees or expense limits that occurred during or after the relevant fiscal year. This improves the reliability and usefulness of the comparison. However, to ensure that the Trustees know when and how CMG adjusted the data, we recommend that CMG prepare a table listing for each Fund what adjustments were made, e.g., to reflect a new expense limitation of x basis points that commenced on y date.
Reduction of volume of paper documents submitted. The effort to streamline and better organize the data presented to the Trustees and the process by which that data was prepared and organized continued to be well-received by all parties. Notwithstanding past success, it is always appropriate to look for opportunities to reduce and simplify the presentation of 15(c) data. One possibility would be to remove the 124 pages of biographical data, most if not all of which the Trustees have previously seen as part of their ongoing investment oversight duties, from the paper volume and post it on the Internet-based document storage and retrieval system used by the Funds to provide reference data to Trustees.
* * *
Respectfully Submitted,
Steven E. Asher
41
This page intentionally left blank.
This page intentionally left blank.
This page intentionally left blank.
Important Information About This Report
The fund mails one shareholder report to each shareholder address. If you would like more than one report, please call shareholder services at 1-800-345-6611 and additional reports will be sent to you. This report has been prepared for shareholders of Columbia Connecticut Tax-Exempt Fund.
A description of the policies and procedures that the fund uses to determine how to vote proxies and a copy of the fund's voting records are available (i) at www.columbiamanagement.com, (ii) on the Securities and Exchange Commission's website at www.sec.gov, and (iii) without charge, upon request, by calling 1-800-368-0346. Information regarding how the fund voted proxies relating to portfolio securities during the 12-month period ended June 30 is available from the SEC's website. Information regarding how the fund voted proxies relating to portfolio securities is also available from the fund's website, www.columbiamanagement.com.
The fund files a complete schedule of portfolio holdings with the SEC for the first and third quarters of each fiscal year on Form N-Q. The fund's Form N-Q is available on the SEC's website at www.sec.gov and may be reviewed and copied at the SEC's Public Reference Room in Washington, D.C. Information on the operation of the Public Reference Room may be obtained by calling 1-800-SEC-0330.
Please read and consider the investment objectives, risks, charges and expenses for any fund carefully before investing. For a prospectus which contains this and other important information about the fund, contact your Columbia Management representative or financial advisor or go to www.columbiamanagement.com.
Columbia Management Group, LLC ("Columbia Management") is the investment management division of Bank of America Corporation. Columbia Management entities furnish investment management services and products for institutional and individual investors. Columbia Funds are distributed by Columbia Management Distributors, Inc., member of FINRA, SIPC, part of Columbia Management and an affiliate of Bank of America Corporation.
Transfer Agent
Columbia Management Services, Inc.
P.O. Box 8081
Boston, MA 02266-8081
1-800-345-6611
Distributor
Columbia Management
Distributors, Inc.
One Financial Center
Boston, MA 02111
Investment Advisor
Columbia Management Advisors, LLC
100 Federal Street
Boston, MA 02110
45
Columbia Management®
One Financial Center
Boston, MA 02111-2621
PRSRT STD
U.S. Postage
PAID
Holliston, MA
Permit NO. 20
Columbia Management®
Columbia Connecticut Tax-Exempt Fund
Annual Report, October 31, 2009
©2009 Columbia Management Distributors, Inc.
One Financial Center, Boston, MA 02111-2621
800-345-6611 www.columbiafunds.com
SHC-42/26821-1009 (12/09) 09/97710
Columbia Management®
Annual Report
October 31, 2009
Columbia Massachusetts Tax-Exempt Fund
| NOT FDIC INSURED | | May Lose Value | |
|
| NOT BANK ISSUED | | No Bank Guarantee | |
|
Table of Contents
| Fund Profile | | | 1 | | |
|
| Economic Update | | | 2 | | |
|
| Performance Information | | | 4 | | |
|
| Understanding Your Expenses | | | 5 | | |
|
| Portfolio Manager's Report | | | 6 | | |
|
| Investment Portfolio | | | 8 | | |
|
Statement of Assets and
Liabilities | | | 13 | | |
|
| Statement of Operations | | | 14 | | |
|
Statement of Changes in
Net Assets | | | 15 | | |
|
| Financial Highlights | | | 17 | | |
|
| Notes to Financial Statements | | | 20 | | |
|
| Report of Independent Registered Public Accounting Firm | | | 28 | | |
|
| Federal Income Tax Information | | | 29 | | |
|
| Fund Governance | | | 30 | | |
|
| Board Consideration and Approval of Advisory Agreements | | | 34 | | |
|
| Summary of Management Fee Evaluation by Independent Fee Consultant | | | 37 | | |
|
| Important Information About This Report | | | 45 | | |
|
The views expressed in this report reflect the current views of the respective parties. These views are not guarantees of future performance and involve certain risks, uncertainties and assumptions that are difficult to predict, so actual outcomes and results may differ significantly from the views expressed. These views are subject to change at any time based upon economic, market or other conditions and the respective parties disclaim any responsibility to update such views. These views may not be relied on as investment advice and, because investment decisions for a Columbia Fund are based on numerous factors, may not be relied on as an indication of trading intent on behalf of any particular Columbia Fund. References to specific securities should not be construed as a recommendation or investment advice.
President's Message

Dear Shareholder:
We are pleased to provide this shareholder report detailing your fund's performance, portfolio holdings and financial statements. We hope this information is helpful in monitoring your investments as we work through these challenging economic times. We recognize that you have entrusted us with your money and want you to know that our professional investment teams work to interpret the latest economic and market trends with the goal of optimizing portfolio construction for our clients.
The first half of 2009 was defined by extremes. The multi-year lows we witnessed in the early months gave way to a stunning rally for the U.S. financial markets through November 2009. A global market rebound may be underway, thanks to the massive fiscal and aggressive monetary policies of governments around the world. In the third quarter 2009, the S&P 500 Index1 was up 15.61%. We believe this challenging economic environment makes it even more important to work with professional money managers while continuing to invest for life events like retirement, college planning, home improvements and career changes.
Retirement income planning has become an increasingly significant focus in the lives of millions of Americans. Recent economic conditions make it even more important to manage short-term obligations such as mortgages, monthly bills and credit card debt while also taking the steps necessary to prepare for or maximize retirement benefits. Better nutrition and medical services can result in U.S. citizens living longer, healthier lives. This means the risk of outliving one's assets in retirement is very real without proper planning. Financial security and retirement planning is an ongoing process that requires active management of your savings, investments and risks. We encourage you to review your retirement plan regularly so you'll be better able to meet your retirement needs in the future.
We recognize that economic uncertainty creates great challenges for many investors. Our professional investment teams work diligently to help investors navigate through difficult markets. Thank you for your business and for the opportunity to work together towards your investment goals.
Sincerely,

J. Kevin Connaughton
President, Columbia Funds
On September 29, 2009, Bank of America Corporation entered into an agreement to sell a portion of the asset management business of Columbia Management Group, LLC. Please see Note 4 of the Notes to Financial Statements for additional information.
1The Standard & Poor's (S&P) 500 Index tracks the performance of 500 widely held, large-capitalization U.S. stocks. Indices are not available for investment, are not professionally managed and do not reflect sales charges, fees, brokerage commissions, taxes or other expenses of investing. Securities in the fund may not match those in an index.
Past performance is no guarantee of future results.
Fund Profile – Columbia Massachusetts Tax-Exempt Fund
Summary
g For the 12-month period that ended October 31, 2009, the fund's Class A shares returned 13.82% without sales charge.
g The fund outperformed its benchmark, the Barclays Capital Municipal Bond Index1, but underperformed the average return of its peer group, the Lipper Massachusetts Municipal Debt Funds Classification.2
g An overweight and strong issue selection among 15-20 year and A-rated bonds helped the fund outperform the index, while less exposure to bonds 20 years and longer issue selection among lower-quality bonds dampened results versus the peer group average.
Portfolio Management
Kimberly A. Campbell has managed the fund since 2009 and has been associated with the advisor or its predecessors since 1995.
1The Barclays Capital Municipal Bond Index is considered representative of the broad market for investment grade, tax-exempt bonds with a maturity of at least one year. Indices are not available for investment, are not professionally managed and do not reflect sales charges, fees, brokerage commissions, taxes or other expenses of investing. Securities in the fund may not match those in an index.
2Lipper Inc., a widely respected data provider in the industry, calculates an average total return (assuming reinvestment of distributions) for mutual funds with investment objectives similar to those of the fund. Lipper makes no adjustment for the effect of sales loads.
Effective November 3, 2008, the Lehman Brothers indices were renamed the Barclays Capital indices.
Performance data quoted represents past performance and current performance may be lower or higher. Past performance is no guarantee of future results. The investment return and principal value will fluctuate so that shares, when redeemed, may be worth more or less than the original cost. Please visit www.columbiafunds.com for daily and most recent month-end performance updates.
Summary
1-year return as of 10/31/09
| | | +13.82% | |
|
| |  | | | Class A shares
(without sales charge) | |
|
| | | +13.60% | |
|
| |  | | | Barclays Capital Municipal
Bond Index | |
|
Morningstar Style BoxTM
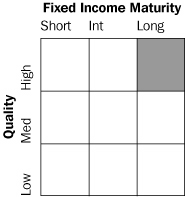
The Morningstar Style BoxTM reveals a fund's investment strategy. For fixed-income funds, the vertical axis shows the average credit quality of the bonds owned, and the horizontal axis shows interest rate sensitivity as measured by a bond's duration (short, intermediate or long). Information shown is based on the most recent data provided by Morningstar.
1
Economic Update – Columbia Massachusetts Tax-Exempt Fund
Summary
For the 12-month period that ended October 31, 2009
g After a sharp decline, stock markets rebounded around the world, as measured by the S&P 500 Index and the MSCI EAFE Index.
| S&P Index | | MSCI Index | |
|
 | |  | |
|
g As investors appeared to exhibit more tolerance for risk, the Barclays Capital Aggregate Bond Index delivered solid results. High-yield bonds rebounded strongly, as measured by the JPMorgan Developed BB High Yield Index.
Barclays
Aggregate
Index | | JPMorgan
Index | |
|
 | |  | |
|
After a deep and difficult recession, the U.S. economy appeared to regain its footing midway through the 12-month period that began November 1, 2008 and ended October 31, 2009. Gross domestic product (GDP) turned positive in the third quarter of 2009, rising 2.8%, primarily on the strength of federal government stimulus spending. Now, hopes for a sustained recovery depend on a rebound in consumer spending and a shift from cost cuts to revenue gains to keep business profits moving higher.
The housing market showed some signs of improvement. Construction spending declined during most of the period, but turned slightly higher in August and September. New and existing home sales were weak in the first half of the period, but increased in the second half. However, new home sales took a surprise dip late in the period, as did housing starts, as the deadline for a generous first-time homebuyer tax credit neared. An extension of the credit into mid-2010 and an expansion of eligibility requirements, which were recently signed into law, renewed hopes for a sustained rebound in housing.
In the beleaguered labor market, the good news was that there was less bad news. Businesses continued to shed jobs throughout the period, raising the unemployment rate to 10.2% and wiping out all of the jobs gained since the last recession. However, the pace of job losses slowed markedly by the period's end, from 533,000 jobs lost in November 2008 to 190,000 jobs lost in October 2009. Yet, prospects appear dim for a quick recovery in the labor markets. In fact, consumer confidence, as measured monthly by The Conference Board, an independent research organization, took a dive in August and September. Consumers surveyed cited worsening business conditions and a bleaker outlook for the labor markets.
Manufacturing activity slowed through the first half of the period, but a key measure—the Institute for Supply Management's Index—rose above 50 in July and remained there for the remainder of the period. Any number above 50 indicates that manufacturing activity is expanding. However, several other key manufacturing indicators soured in October. Industrial production declined and manufacturing capacity utilization stalled after several months of modest improvement.
Consumer spending registered both ups and downs during the 12-month period, and the trend at the end of the period was hard to read because of the impact of the federal Cash for Clunkers program, which boosted auto sales. Spending rose sharply in August, then fell in September. New rigorous lending standards severely limited access to credit for business and consumers alike, and further hampered economic growth. In December 2008, the Federal Reserve Board (the Fed) lowered a key short-term borrowing rate—the federal funds rate—between zero and 0.25%—a record low. In light of continued uncertainty about the economy, the Fed made no further change to the federal funds rate during the period.
Bonds outperformed domestic stocks
As investors sought refuge from a volatile stock market, the highest-quality sectors of the U.S. bond market delivered solid gains during the first half of the period, Treasury prices rose and yields declined sharply as the economy faltered and stock market volatility increased. As hopes for a recovery materialized, Treasuries lagged riskier segments of the bond market. The benchmark 10-year U.S. Treasury yield began the
2
Economic Update (continued) – Columbia Massachusetts Tax-Exempt Fund
period at just under 4.0%, declined to 2.2% in December 2008, then rose to end the period at 3.4%. In this environment, the Barclays Capital Aggregate Bond Index1 returned 13.79%. Municipal bonds delivered returns that were in line with taxable investment-grade bonds even without factoring in potential tax advantages to investors in higher income tax brackets. The Barclays Capital Municipal Bond Index2 returned 13.60%. High-yield bond prices fell sharply in 2008 as economic prospects weakened and default fears rose, then rebounded strongly in 2009. For the 12-month period, the JPMorgan Developed BB High Yield Index3 returned 36.47%.
Stocks retreated, then rebounded
Against a strengthening economic backdrop, the U.S. stock market returned 9.80% for the 12-month period, as measured by the S&P 500 Index.4 Mid-cap stocks outperformed large and small-cap stocks and growth outperformed value by a solid margin, as measured by their respective Russell indices.5 Outside the U.S., stock market returns were even stronger. The MSCI EAFE Index,6 a broad gauge of stock market performance in foreign developed markets, gained 27.71% (in U.S. dollars) for the period. Emerging stock markets were caught in last year's downdraft, but they bounced back stronger than domestic or developed world markets in 2009 as economic growth generally outpaced the developed world. The MSCI Emerging Markets Index7 returned 64.13% (in U.S. dollars), led by strong gains from China, India, Indonesia, Colombia and Brazil.
Past performance is no guarantee of future results.
1The Barclays Capital Aggregate Bond Index is a market value-weighted index that tracks the daily price, coupon, pay-downs, and total return performance of fixed-rate, publicly placed, dollar-denominated, and non-convertible investment grade debt issues with at least $250 million par amount outstanding and with at least one year to final maturity.
2The Barclays Capital Municipal Bond Index is considered representative of the broad market for investment grade, tax-exempt bonds with a maturity of at least one year.
3The JPMorgan Developed BB High Yield Index is designed to mirror the investable universe of the U.S. dollar developed, BB-rated, high yield corporate debt market.
4The Standard & Poor's (S&P) 500 Index tracks the performance of 500 widely held, large-capitalization U.S. stocks.
5The Russell 1000 Index tracks the performance of 1,000 of the largest U.S. companies, based on market capitalization. The Russell MidCap Index measures the performance of the 800 smallest companies in the Russell 1000 Index, which represents approximately 25% of the total market capitalization of the Russell 1000 Index. The Russell 2000 Index measures the performance of the 2,000 smallest companies in the Russell 3000 Index, which represents approximately 8% of the total market capitalization of the Russell 3000 Index. The Russell 3000 Growth Index measures the performance of those Russell 3000 Index companies with higher price-to-book ratios and higher forecasted growth values. The stocks in this index are also members of either the Russell 1000 Growth or the Russell 2000 Gr owth indexes. The Russell 3000 Value Index measures the performance of those Russell 3000 Index companies with lower price-to-book ratios and lower forecasted growth values. The stocks in this index are also members of either the Russell 1000 Value or the Russell 2000 Value indexes.
6The Morgan Stanley Capital International Europe, Australasia, Far East (MSCI EAFE) Index is a capitalization-weighted index that tracks the total return of common stocks in 21 developed-market countries within Europe, Australasia and the Far East.
7The Morgan Stanley Capital International Emerging Markets Index (MSCI EMI) is a free float-adjusted market capitalization index that is designed to measure equity market performance in the global emerging markets. As of June 2006, the MSCI Emerging Markets Index consisted of the following 25 emerging market country indices: Argentina, Brazil, Chile, China, Colombia, Czech Republic, Egypt, Hungary, India, Indonesia, Israel, Jordan, Korea, Malaysia, Mexico, Morocco, Pakistan, Peru, Philippines, Poland, Russia, South Africa, Taiwan, Thailand and Turkey.
Indices are not available for investment, are not professionally managed and do not reflect sales charges, fees, brokerage commissions, taxes or other expenses of investing. Securities in the fund may not match those in an index.
Effective November 3, 2008, the Lehman Brothers indices were renamed the Barclays Capital indices.
3
Performance Information – Columbia Massachusetts Tax-Exempt Fund
Performance data quoted represents past performance and current performance may be lower or higher. Past performance is no guarantee of future results. The investment return and principal value will fluctuate so that shares, when redeemed, may be worth more or less than the original cost. Please visit www.columbiafunds.com for daily and most recent month-end performance updates.
Annual operating expense ratio (%)*
| Class A | | | 0.93 | | |
| Class B | | | 1.68 | | |
| Class C | | | 1.68 | | |
*The annual operating expense ratio is as stated in the fund's prospectus that is current as of the date of this report and includes the expenses incurred by the investment companies in which the fund invests. Differences in expense ratios disclosed elsewhere in this report may result from including expenses incurred by the investment companies, fee waivers and expense reimbursements as well as different time periods used in calculating the ratios.
Performance of a $10,000 investment 11/01/99 – 10/31/09
The chart above shows the change in value of a hypothetical $10,000 investment in Class A shares of Columbia Massachusetts Tax-Exempt Fund during the stated time period, and does not reflect the deduction of taxes that a shareholder may pay on fund distributions or on the redemption of fund shares.
Performance of a $10,000 investment 11/01/99 – 10/31/09 ($)
| Sales charge | | without | | with | |
| Class A | | | 16,977 | | | | 16,171 | | |
| Class B | | | 15,762 | | | | 15,762 | | |
| Class C | | | 16,236 | | | | 16,236 | | |
Average annual total return as of 10/31/09 (%)
| Share class | | A | | B | | C | |
| Inception | | 04/10/87 | | 06/08/92 | | 08/01/97 | |
| Sales charge | | without | | with | | without | | with | | without | | with | |
| 1-year | | | 13.82 | | | | 8.41 | | | | 12.98 | | | | 7.98 | | | | 13.31 | | | | 12.31 | | |
| 5-year | | | 3.29 | | | | 2.29 | | | | 2.52 | | | | 2.18 | | | | 2.82 | | | | 2.82 | | |
| 10-year | | | 5.44 | | | | 4.92 | | | | 4.66 | | | | 4.66 | | | | 4.97 | | | | 4.97 | | |
Average annual total return as of 09/30/09 (%)
| Share class | | A | | B | | C | |
| Sales charge | | without | | with | | without | | with | | without | | with | |
| 1-year | | | 15.75 | | | | 10.25 | | | | 14.90 | | | | 9.90 | | | | 15.24 | | | | 14.24 | | |
| 5-year | | | 4.20 | | | | 3.19 | | | | 3.42 | | | | 3.08 | | | | 3.73 | | | | 3.73 | | |
| 10-year | | | 5.66 | | | | 5.14 | | | | 4.87 | | | | 4.87 | | | | 5.19 | | | | 5.19 | | |
The "with sales charge" returns include the maximum initial sales charge of 4.75% for Class A shares and the applicable contingent deferred sales charge of 5.00% in the first year, declining to 1.00% in the sixth year and eliminated thereafter for Class B shares and 1.00% for Class C shares for the first year only. The "without sales charge" returns do not include the effect of sales charges. If they had, returns would be lower.
Performance results reflect any fee waivers or reimbursements of fund expenses by the investment advisor and/or any of its affiliates. Absent these fee waivers or expense reimbursement arrangements, performance results would have been lower.
All results shown assume reinvestment of distributions. Performance for different share classes will vary based on differences in sales charges and the fees associated with each class. Please see the fund's prospectus for details.
The tables do not reflect the deduction of taxes a shareholder may pay on fund distributions or on the redemption of fund shares
4
Understanding Your Expenses – Columbia Massachusetts Tax-Exempt Fund
As a fund shareholder, you incur two types of costs. There are transaction costs, which generally include sales charges on purchases and may include redemption fees or exchange fees. There are also ongoing costs, which generally include investment advisory fees, distribution and service (Rule 12b-1) fees and other fund expenses. The information on this page is intended to help you understand the ongoing costs of investing in the fund and to compare these costs with the ongoing costs of investing in other mutual funds.
Analyzing your fund's expenses by share class
To illustrate these ongoing costs, we have provided an example and calculated the expenses paid by investors in each share class during the period. The information in the following table is based on an initial investment of $1,000, which is invested at the beginning of the period and held for the entire period. Expense information is calculated two ways and each method provides you with different information. The amount listed in the "Actual" column is calculated using the fund's actual operating expenses and total return for the period. The amount listed in the "Hypothetical" column for each share class assumes that the return each year is 5% before expenses and is calculated based on the fund's actual operating expenses. You should not use the hypothetical account values and expenses to estimate either your actual account balance at the end of the period or the expenses you paid during this period.
Compare with other funds
Since all mutual funds are required to include the same hypothetical calculations about expenses in shareholder reports, you can use this information to compare the ongoing costs of investing in the fund with other funds. To do so, compare the 5% hypothetical example with the 5% hypothetical examples that appear in the shareholder reports of other funds. As you compare hypothetical examples of other funds, it is important to note that hypothetical examples are meant to highlight the ongoing costs of investing in a fund and do not reflect any transaction costs, such as sales charges, redemption fees or exchange fees.
Estimating your actual expenses
To estimate the expenses that you paid over the period, first you will need your account balance at the end of the period:
g For shareholders who receive their account statements from Columbia Management Services, Inc., your account balance is available online at www.columbiafunds.com or by calling Shareholder Services at 800.345.6611.
g For shareholders who receive their account statements from their financial intermediary, contact your financial intermediary to obtain your account balance.
1. Divide your ending account balance by $1,000. For example, if an account balance was $8,600 at the end of the period, the result would be 8.6.
2. In the section of the table below titled "Expenses paid during the period," locate the amount for your share class. You will find this number in the column labeled "Actual." Multiply this number by the result from step 1. Your answer is an estimate of the expenses you paid on your account during the period.
If the value of your account falls below the minimum initial investment requirement applicable to you, your account generally will be subject to a $20 annual fee. This fee is not included in the accompanying table. If you are subject to the fee, keep it in mind when you are estimating the ongoing expenses of investing in the fund and when comparing the expenses of this fund with other funds.
05/01/09 – 10/31/09
| | | Account value at the
beginning of the period ($) | | Account value at the
end of the period ($) | | Expenses paid
during the period ($) | | Fund's annualized
expense ratio (%) | |
| | | Actual | | Hypothetical | | Actual | | Hypothetical | | Actual | | Hypothetical | | Actual | |
| Class A | | | 1,000.00 | | | | 1,000.00 | | | | 1,046.90 | | | | 1,021.02 | | | | 4.28 | | | | 4.23 | | | | 0.83 | | |
| Class B | | | 1,000.00 | | | | 1,000.00 | | | | 1,043.00 | | | | 1,017.24 | | | | 8.14 | | | | 8.03 | | | | 1.58 | | |
| Class C | | | 1,000.00 | | | | 1,000.00 | | | | 1,044.50 | | | | 1,018.75 | | | | 6.60 | | | | 6.51 | | | | 1.28 | | |
Expenses paid during the period are equal to the annualized expense ratio for the share class, multiplied by the average account value over the period, then multiplied by the number of days in the fund's most recent fiscal half-year and divided by 365.
Had the investment advisor and/or any of its affiliates not waived fees or reimbursed a portion of expenses, account value at the end of the period would have been reduced.
It is important to note that the expense amounts shown in the table are meant to highlight only ongoing costs of investing in the fund and do not reflect any transaction costs, such as sales charges, redemption fees or exchange fees. Therefore, the hypothetical examples provided may not help you determine the relative total costs of owning shares of different funds. If these transaction costs were included, your costs would have been higher.
5
Portfolio Manager's Report – Columbia Massachusetts Tax-Exempt Fund
Performance data quoted represents past performance and current performance may be lower or higher. Past performance is no guarantee of future results. The investment return and principal value will fluctuate so that shares, when redeemed, may be worth more or less than the original cost. Please visit www.columbiafunds.com for daily and most recent month-end performance updates.
Net asset value per share
as of 10/31/09 ($)
| Class A | | | 7.57 | | |
| Class B | | | 7.57 | | |
| Class C | | | 7.57 | | |
Distributions declared per share
11/01/08 – 10/31/09 ($)
| Class A | | | 0.35 | | |
| Class B | | | 0.30 | | |
| Class C | | | 0.32 | | |
A portion of the fund's income may be subject to the alternative minimum tax. The fund may at times purchase tax-exempt securities at a discount. Some, or all, of this discount may be included in the fund's ordinary income, and is taxable when distributed. Distributions include $0.05 per share of taxable realized gains.
30-day SEC yields
as of 10/31/09 (%)
| Class A | | | 3.38 | | |
| Class B | | | 2.78 | | |
| Class C | | | 3.10 | | |
The 30-day SEC yields reflect the fund's earning power, net of expenses, expressed as an annualized percentage of the public offering price per share at the end of the period.
Taxable-equivalent SEC yields
as of 10/31/09 (%)
| Class A | | | 5.50 | | |
| Class B | | | 4.52 | | |
| Class C | | | 5.03 | | |
Taxable-equivalent SEC yields are calculated assuming a federal tax rate of 35.0% and a Massachusetts state income tax rate of 5.3%. These tax rates do not reflect the phase out of exemptions or the reduction of the otherwise allowable deductions that occur when adjusted gross income exceeds certain levels. Your taxable-equivalent yield may be different depending on your tax bracket.
For the 12-month period that ended October 31, 2009, the fund's Class A shares returned 13.82% without sales charge. The fund's benchmark, the Barclays Capital Municipal Bond Index returned 13.60%. The average return of its peer group, the Lipper Massachusetts Municipal Debt Funds Classification, was 14.59%. An overweight in bonds with 15- to 20-year maturities, where issue selection was also strong, aided returns versus the index. The fund further benefited from good issue selection in bonds with maturities of 30 years and longer, as well as an overweight and good selection among A-rated securities. Issue selection among BBB-rated bonds, however, was not quite as strong as the index. We believe the fund trailed the Lipper peer group average because of its lower exposure to bonds 20 years and longer, as well as bonds rated BBB and lower, which were strong performers during the period.
Strongest returns from longer-maturity and lower-quality issues
During the first half of the period, the economy slowed dramatically, unemployment rose, housing prices weakened and stock prices plunged. Municipal bonds faced added pressure as institutional investors sold longer-maturity high-grade issues, causing yields to rise and bond prices to fall. By late 2008, yields on 10-year high-grade municipal issues had reached roughly 140% of yields on comparable taxable bonds. This yield advantage attracted the attention of individual investors, who remained strong buyers of municipal bonds for the rest of the period. New municipal issuance, however, remained light, as liquidity dried up and municipal bond insurers suffered credit-rating downgrades that increased the cost for issuers coming to market.
The economic outlook improved in the spring of 2009, thanks to government stimulus measures and low short-term interest rates. Bond investors began taking on added risk to obtain more yield, boosting returns on long-term bonds, especially those with maturities of 20 or more years, as well as lower-quality issues, both of which posted strong returns for the year. New municipal bond issuance remained limited, due, in part, to the introduction of Build America bonds, which allow municipalities to sell taxable issues and collect a 35% subsidy from the federal government to help offset the cost increase relative to tax-exempt issues.
Focus on intermediate maturities and medium- to high-quality bonds
We continued to focus on intermediate-term bonds with maturities of 10 to 20 years, which offered added yield over shorter-term issues without as much risk as longer-term bonds. When we could, we sold bonds with maturities of 10 years or less. On the credit quality side, we remained focused on medium- to high-quality issues with ratings of A or better, which represented 80.3% of assets at period end. Our stake in AAA-rated issues declined because some holdings were affected by the credit-rating downgrades suffered by municipal bond insurers. At period end, BBB-rated issues accounted for 4.5% of assets.
6
Portfolio Manager's Report (continued) – Columbia Massachusetts Tax-Exempt Fund
Mixed outlook for Massachusetts
By period end, there were signs that the recession was moderating in Massachusetts. Deteriorating trends in household income and unemployment began to ease and signs of stability appeared within the Commonwealth's manufacturing, housing, health services and education sectors. Industrial production has started to move higher. Single-family housing starts are up slightly. And both health services and education are expected to add jobs thanks to increased demand. Although Massachusetts has taken steps to balance its budget, including a reduction in its payrolls and an increase in the sales tax this past summer, a $5 billion gap is anticipated for the 2010 fiscal year budget. In addition, revenue collections continued to decline. Depending on what steps are taken to balance next year's budget, the Commonwealth's credit ratings of AA2 by Moody's and AA by Standard & Poor's may come under pressure. We will closely monitor the budg et resolution.
Portfolio holdings and characteristics are subject to change periodically and may not be representative of current holdings and characteristics. The outlook for the fund may differ from those presented for other Columbia Funds.
Tax-exempt investing offers current tax-exempt income, but it also involves certain risks. The value of the fund will be affected by interest rate changes and the creditworthiness of issues held in the fund. When interest rates go up, bond prices generally drop and vice versa.
Interest income from certain tax-exempt bonds may be subject to certain state and local taxes and, if applicable, the alternative minimum tax. Capital gains are not exempt from income taxes.
The fund is non-diversified, which generally means that it may invest a greater percentage of its total assets in the securities of fewer issuers than a "diversified" fund. This increases the risk that a change in the value of any one investment held by the fund could affect the overall value of the fund more than it would affect that of a diversified fund holding a greater number of investments. Accordingly, the fund's value will likely be more volatile than the value of more diversified funds.
Single-state municipal bond funds pose additional risks, due to limited geographical diversification.
Top 5 sectors
as of 10/31/09 (%)
| Education | | | 20.3 | | |
| Refunded/Escrowed | | | 14.2 | | |
| Water & Sewer | | | 11.0 | | |
| Special Non-Property Tax | | | 9.2 | | |
| State General Obligations | | | 8.4 | | |
Quality breakdown
as of 10/31/09 (%)
| AAA | | | 38.8 | | |
| AA | | | 29.7 | | |
| A | | | 12.4 | | |
| BBB | | | 4.5 | | |
| BB | | | 1.2 | | |
| CCC | | | 1.0 | | |
| Non-Rated | | | 12.4 | | |
Maturity breakdown
as of 10/31/09 (%)
| 1-3 years | | | 0.2 | | |
| 3-5 years | | | 5.0 | | |
| 5-7 years | | | 5.0 | | |
| 7-10 years | | | 21.3 | | |
| 10-15 years | | | 21.2 | | |
| 15-20 years | | | 13.3 | | |
| 20-25 years | | | 13.7 | | |
| 25 years and over | | | 17.6 | | |
| Cash & Equivalents | | | 2.7 | | |
Ratings shown in the quality breakdown represent the rating assigned to a particular bond by one of the following nationally-recognized rating agencies: Standard and Poor's, Moody's Investors Service, Inc. or Fitch Ratings Ltd. Ratings are relative and subjective and are not absolute standards of quality. The fund's credit quality does not remove market risk.
The fund is actively managed and the composition of its portfolio will change over time. Information provided is calculated as a percentage of net assets.
7
Investment Portfolio – Columbia Massachusetts Tax-Exempt Fund
October 31, 2009
| Municipal Bonds – 97.3% | |
| | | Par ($) | | Value ($) | |
| Education – 25.5% | |
| Education – 20.3% | |
| MA College Building Authority | |
Series 1994 A,
7.500% 05/01/14 | | | 1,825,000 | | | | 2,114,244 | | |
| MA Development Finance Agency | |
Boston College Trustees,
Series 2009 Q1,
5.000% 07/01/29 | | | 1,000,000 | | | | 1,058,900 | | |
Boston University:
Series 1999 P,
6.000% 05/15/59 | | | 1,000,000 | | | | 1,098,090 | | |
Series 2005 T-1,
Insured: AMBAC
5.000% 10/01/39 | | | 2,000,000 | | | | 1,924,880 | | |
College of The Holy Cross,
Series 2002,
Insured: AMBAC
5.250% 09/01/32 | | | 2,000,000 | | | | 2,237,060 | | |
Emerson College,
Series 2006,
5.000% 01/01/23 | | | 2,500,000 | | | | 2,485,525 | | |
| MA Health & Educational Facilities Authority | |
Boston College:
Series 2008,
5.500% 06/01/35 | | | 2,500,000 | | | | 2,856,775 | | |
Series 2009,
5.500% 11/15/36 | | | 1,000,000 | | | | 1,114,460 | | |
Harvard University,
Series 1991 N,
6.250% 04/01/20 | | | 2,675,000 | | | | 3,412,096 | | |
Massachusetts Institute of Technology,
Series 2002 K:
5.375% 07/01/17 | | | 3,000,000 | | | | 3,555,870 | | |
| 5.500% 07/01/32 | | | 1,500,000 | | | | 1,813,005 | | |
Series 2009 M,
5.250% 02/15/26 | | | 1,250,000 | | | | 1,430,788 | | |
Tufts University:
Series 2002 J,
5.500% 08/15/18 | | | 1,000,000 | | | | 1,167,070 | | |
Series 2008,
5.375% 08/15/38 | | | 1,000,000 | | | | 1,071,140 | | |
| Education Total | | | 27,339,903 | | |
| Prep School – 2.6% | |
| MA Development Finance Agency | |
Dexter School,
Series 2007,
4.500% 05/01/26 | | | 1,600,000 | | | | 1,572,560 | | |
| | | Par ($) | | Value ($) | |
| MA Health & Educational Facilities Authority | |
Learning Center for Deaf Children,
Series 1999 C,
6.100% 07/01/19 | | | 1,000,000 | | | | 1,013,160 | | |
| MA Industrial Finance Agency | |
Cambridge Friends School,
Series 1998,
5.750% 09/01/18 | | | 1,000,000 | | | | 905,160 | | |
| Prep School Total | | | 3,490,880 | | |
| Student Loan – 2.6% | |
| MA Educational Financing Authority | |
Series 2002 E, AMT,
Insured: AMBAC
5.000% 01/01/13 | | | 1,340,000 | | | | 1,383,845 | | |
Series 2008 H, AMT,
Insured: AGO
6.350% 01/01/30 | | | 1,000,000 | | | | 1,037,260 | | |
Series 2009 I,
6.000% 01/01/28 | | | 1,000,000 | | | | 1,053,600 | | |
| Student Loan Total | | | 3,474,705 | | |
| Education Total | | | 34,305,488 | | |
| Health Care – 8.1% | |
| Continuing Care Retirement – 2.4% | |
| MA Development Finance Agency | |
Linden Ponds, Inc.,
Series 2007 A,
5.750% 11/15/42 | | | 3,000,000 | | | | 2,138,490 | | |
Loomis House, Inc.,
Series 2002 A,
6.900% 03/01/32 | | | 1,000,000 | | | | 994,240 | | |
| Continuing Care Retirement Total | | | 3,132,730 | | |
| Health Services – 0.7% | |
| MA Development Finance Agency | |
Boston Biomedical Research Institute,
Series 1999,
5.750% 02/01/29 | | | 1,200,000 | | | | 966,900 | | |
| Health Services Total | | | 966,900 | | |
| Hospitals – 2.4% | |
| MA Development Finance Agency | |
Massachusetts Biomedical Research Corp.,
Series 2000,
6.250% 08/01/20 | | | 1,000,000 | | | | 1,020,530 | | |
See Accompanying Notes to Financial Statements.
8
Columbia Massachusetts Tax-Exempt Fund
October 31, 2009
| Municipal Bonds (continued) | |
| | | Par ($) | | Value ($) | |
| MA Health & Educational Facilities Authority | |
Covenant Health System,
Series 2002,
6.000% 07/01/31 | | | 790,000 | | | | 806,709 | | |
Tri-County Medical Associates, Inc.,
Series 2007,
5.000% 07/15/27 | | | 1,695,000 | | | | 1,407,850 | | |
| Hospitals Total | | | 3,235,089 | | |
| Intermediate Care Facilities – 1.0% | |
| MA Development Finance Agency | |
Evergreen Center, Inc.,
Series 2005,
5.500% 01/01/35 | | | 750,000 | | | | 618,413 | | |
New England Center for Children,
Series 1998,
5.875% 11/01/18 | | | 825,000 | | | | 763,826 | | |
| Intermediate Care Facilities Total | | | 1,382,239 | | |
| Nursing Homes – 1.6% | |
| MA Industrial Finance Agency | |
Chelsea Jewish Nursing Home,
Series 1997 A,
Insured: FHA
6.500% 08/01/37 | | | 780,000 | | | | 804,094 | | |
GF/Massachusetts, Inc.,
Series 1994,
8.300% 07/01/23 (a) | | | 1,885,000 | | | | 1,319,500 | | |
| Nursing Homes Total | | | 2,123,594 | | |
| Health Care Total | | | 10,840,552 | | |
| Housing – 3.2% | |
| Assisted Living/Senior – 0.5% | |
| MA Development Finance Agency | |
VOA Concord Assisted Living, Inc.,
Series 2007,
5.200% 11/01/41 | | | 1,145,000 | | | | 731,460 | | |
| Assisted Living/Senior Total | | | 731,460 | | |
| Multi-Family – 1.1% | |
| MA Housing Finance Agency | |
Series 2004 A, AMT,
Insured: FSA
5.250% 07/01/25 | | | 1,500,000 | | | | 1,502,865 | | |
| Multi-Family Total | | | 1,502,865 | | |
| | | Par ($) | | Value ($) | |
| Single-Family – 1.6% | |
| MA Housing Finance Agency | |
Series 2009-143,
5.600% 12/01/34 | | | 2,000,000 | | | | 2,076,520 | | |
| Single-Family Total | | | 2,076,520 | | |
| Housing Total | | | 4,310,845 | | |
| Other – 23.0% | |
| Other – 3.0% | |
| MA Development Finance Agency | |
WGBH Educational Foundation:
Series 2002 A,
Insured: AMBAC
5.750% 01/01/42 | | | 2,000,000 | | | | 2,164,200 | | |
Series 2008 A,
Insured: AGO
4.500% 01/01/39 | | | 2,000,000 | | | | 1,841,480 | | |
| Other Total | | | 4,005,680 | | |
| Pool/Bond Bank – 5.8% | |
| MA Water Pollution Abatement Trust | |
Series 1999 A,
6.000% 08/01/17 | | | 2,445,000 | | | | 2,944,758 | | |
Series 2002-8,
5.000% 08/01/17 | | | 20,000 | | | | 21,946 | | |
Series 2005-11,
4.750% 08/01/23 | | | 25,000 | | | | 26,564 | | |
Series 2006:
5.250% 08/01/24 | | | 1,000,000 | | | | 1,168,720 | | |
| 5.250% 08/01/27 | | | 1,000,000 | | | | 1,170,310 | | |
| 5.250% 08/01/30 | | | 1,000,000 | | | | 1,148,940 | | |
Series 2009,
5.000% 08/01/38 | | | 1,200,000 | | | | 1,257,492 | | |
| Pool/Bond Bank Total | | | 7,738,730 | | |
| Refunded/Escrowed (b) – 14.2% | |
| MA College Building Authority | |
Series 1999 A,
Insured: NPFGC
Escrowed to Maturity:
(c) 05/01/18 | | | 7,760,000 | | | | 5,726,492 | | |
| (c) 05/01/23 | | | 6,000,000 | | | | 3,413,940 | | |
| MA Development Finance Agency | |
Western New England College,
Series 2002,
Pre-refunded 12/01/12,
5.875% 12/01/22 | | | 905,000 | | | | 1,004,586 | | |
See Accompanying Notes to Financial Statements.
9
Columbia Massachusetts Tax-Exempt Fund
October 31, 2009
| Municipal Bonds (continued) | |
| | | Par ($) | | Value ($) | |
| MA Health & Educational Facilities Authority | |
Covenant Health System,
Series 2002,
Pre-refunded 01/01/12,
6.000% 07/01/31 | | | 210,000 | | | | 234,578 | | |
| MA Turnpike Authority | |
Series 1993 A,
Escrowed to Maturity,
5.000% 01/01/20 | | | 2,000,000 | | | | 2,272,220 | | |
| MA Water Resources Authority | |
Series 1992 A,
Escrowed to Maturity,
6.500% 07/15/19 | | | 2,100,000 | | | | 2,554,755 | | |
Series 1993 C,
Insured: AMBAC,
Escrowed to Maturity,
5.250% 12/01/15 | | | 610,000 | | | | 686,641 | | |
| PR Commonwealth of Puerto Rico Public Buildings Authority | |
Series 2002 C,
Escrowed to Maturity,
5.500% 07/01/14 | | | 5,000 | | | | 5,798 | | |
PR Commonwealth of Puerto Rico Public
Finance Corp. | |
Series 1998 A,
Insured: AMBAC,
Economically Defeased to Maturity,
5.375% 06/01/19 | | | 2,190,000 | | | | 2,519,770 | | |
Series 2002 E,
Escrowed to Maturity,
6.000% 08/01/26 | | | 550,000 | | | | 674,889 | | |
| Refunded/Escrowed Total | | | 19,093,669 | | |
| Other Total | | | 30,838,079 | | |
| Other Revenue – 1.0% | |
| Hotels – 1.0% | |
| MA Boston Industrial Development Financing Authority | |
Crosstown Center Hotel LLC,
Series 2002, AMT,
6.500% 09/01/35 | | | 2,185,000 | | | | 1,320,221 | | |
| Hotels Total | | | 1,320,221 | | |
| Other Revenue Total | | | 1,320,221 | | |
| | | Par ($) | | Value ($) | |
| Tax-Backed – 18.8% | |
| Local General Obligations – 1.2% | |
| MA Norwell | |
Series 2003,
Insured: FGIC
5.000% 11/15/22 | | | 1,410,000 | | | | 1,601,083 | | |
| Local General Obligations Total | | | 1,601,083 | | |
| Special Non-Property Tax – 9.2% | |
| MA Bay Transportation Authority | |
Series 2004 C,
5.250% 07/01/21 | | | 1,500,000 | | | | 1,738,710 | | |
Series 2005 B,
Insured: NPFGC
5.500% 07/01/27 | | | 1,000,000 | | | | 1,187,280 | | |
Series 2006 A,
5.250% 07/01/31 | | | 2,880,000 | | | | 3,254,256 | | |
Series 2008 B,
5.250% 07/01/27 | | | 710,000 | | | | 820,653 | | |
MA Special Obligation Dedicated
Tax Revenue | |
Series 2005,
Insured: FGIC
5.500% 01/01/30 | | | 2,500,000 | | | | 2,776,000 | | |
PR Commonwealth of Puerto Rico Highway &
Transportation Authority | |
Series 2005 BB,
Insured: FSA
5.250% 07/01/22 | | | 1,500,000 | | | | 1,606,140 | | |
PR Commonwealth of Puerto Rico Sales Tax
Financing Corp. | |
Series 2007 A,
5.250% 08/01/57 | | | 1,000,000 | | | | 1,013,900 | | |
| Special Non-Property Tax Total | | | 12,396,939 | | |
| State General Obligations – 8.4% | |
| MA Bay Transportation Authority | |
Series 1991 A,
Insured: NPFGC
7.000% 03/01/21 | | | 1,500,000 | | | | 1,808,985 | | |
Series 1992 B,
Insured: NPFGC
6.200% 03/01/16 | | | 3,725,000 | | | | 4,260,469 | | |
Series 1994,
Insured: FGIC
7.000% 03/01/14 | | | 1,250,000 | | | | 1,447,075 | | |
See Accompanying Notes to Financial Statements.
10
Columbia Massachusetts Tax-Exempt Fund
October 31, 2009
| Municipal Bonds (continued) | |
| | | Par ($) | | Value ($) | |
| MA State | |
Series 2003 D,
Insured: AMBAC
5.500% 10/01/19 | | | 450,000 | | | | 529,902 | | |
Series 2004 B,
5.250% 08/01/22 | | | 1,000,000 | | | | 1,155,840 | | |
| PR Commonwealth of Puerto Rico | |
Public Improvement,
Series 1998,
5.250% 07/01/18 | | | 1,000,000 | | | | 1,019,810 | | |
Series 2007 A,
Insured: FGIC
5.500% 07/01/21 | | | 1,000,000 | | | | 1,011,080 | | |
| State General Obligations Total | | | 11,233,161 | | |
| Tax-Backed Total | | | 25,231,183 | | |
| Transportation – 4.8% | |
| Air Transportation – 1.4% | |
| MA Port Authority | |
Bosfuel Corp.,
Series 2007, AMT,
Insured: FGIC
5.000% 07/01/32 | | | 2,000,000 | | | | 1,863,820 | | |
| Air Transportation Total | | | 1,863,820 | | |
| Airports – 2.5% | |
| MA Port Authority | |
Series 1999 D, AMT,
Insured: FGIC
6.000% 07/01/29 | | | 2,000,000 | | | | 2,012,120 | | |
Series 2007 A,
Insured: FSA
4.500% 07/01/37 | | | 1,500,000 | | | | 1,411,710 | | |
| Airports Total | | | 3,423,830 | | |
| Toll Facilities – 0.9% | |
| MA Turnpike Authority | |
Series 1997 C,
Insured: NPFGC
(c) 01/01/20 | | | 2,000,000 | | | | 1,159,880 | | |
| Toll Facilities Total | | | 1,159,880 | | |
| Transportation Total | | | 6,447,530 | | |
| | | Par ($) | | Value ($) | |
| Utilities – 12.9% | |
| Municipal Electric – 1.9% | |
| MA Development Finance Agency | |
Devens Electric System,
Series 2001,
6.000% 12/01/30 | | | 1,000,000 | | | | 1,021,760 | | |
PR Commonwealth of Puerto Rico
Electric Power Authority | |
Series 2007 VV,
Insured: NPFGC
5.250% 07/01/29 | | | 1,000,000 | | | | 1,024,680 | | |
Series 2008 WW,
5.000% 07/01/28 | | | 500,000 | | | | 492,215 | | |
| Municipal Electric Total | | | 2,538,655 | | |
| Water & Sewer – 11.0% | |
| MA Boston Water & Sewer Commission | |
Series 1992 A,
5.750% 11/01/13 | | | 855,000 | | | | 927,213 | | |
Series 1993 A,
5.250% 11/01/19 | | | 4,750,000 | | | | 5,369,733 | | |
Series 2009 A,
5.000% 11/01/28 | | | 1,250,000 | | | | 1,354,175 | | |
| MA Water Resources Authority | |
Series 1993 C:
Insured: AMBAC
5.250% 12/01/15 | | | 390,000 | | | | 440,302 | | |
Insured: NPFGC
5.250% 12/01/15 | | | 1,070,000 | | | | 1,208,009 | | |
Series 2002 J,
Insured: FSA:
5.250% 08/01/19 | | | 1,000,000 | | | | 1,168,520 | | |
| 5.500% 08/01/21 | | | 2,500,000 | | | | 2,992,925 | | |
Series 2007 B,
Insured: FSA
5.250% 08/01/32 | | | 1,150,000 | | | | 1,277,190 | | |
| Water & Sewer Total | | | 14,738,067 | | |
| Utilities Total | | | 17,276,722 | | |
Total Municipal Bonds
(cost of $125,152,932) | | | 130,570,620 | | |
See Accompanying Notes to Financial Statements.
11
Columbia Massachusetts Tax-Exempt Fund
October 31, 2009
| Investment Companies – 1.5% | |
| | | Shares | | Value ($) | |
Columbia Massachusetts
Municipal Reserves,
G-Trust Shares
(7 day yield of 0.120%) (d)(e) | | | 817,498 | | | | 817,498 | | |
Dreyfus Massachusetts
Municipal Money Market Fund
(7 day yield of 0.000%) | | | 1,156,726 | | | | 1,156,726 | | |
Total Investment Companies
(cost of $1,974,224) | | | 1,974,224 | | |
Total Investments – 98.8%
(cost of $127,127,156) (f) | | | 132,544,844 | | |
| Other Assets & Liabilities, Net – 1.2% | | | 1,628,010 | | |
| Net Assets – 100.0% | | | 134,172,854 | | |
Notes to Investment Portfolio:
(a) Represents fair value as determined in good faith under procedures approved by the Board of Trustees. At October 31, 2009, the value of this security amounted to $1,319,500, which represents 1.0% of net assets.
(b) The Fund has been informed that each issuer has placed direct obligations of the U.S. Government in an irrevocable trust, solely for the payment of principal and interest.
(c) Zero coupon bond.
(d) Investments in affiliates during the year ended October 31, 2009:
Security name: Columbia Massachusetts Municipal Reserves, G-Trust Shares (7 day yield of 0.120%).
| Shares as of 10/31/08: | | | – | | |
| Shares purchased: | | | 23,780,554 | | |
| Shares sold: | | | (22,963,056 | ) | |
| Shares as of 10/31/09: | | | 817,498 | | |
| Net realized gain(loss): | | $ | – | | |
| Dividend income earned: | | $ | 9,136 | | |
| Value at end of period: | | $ | 817,498 | | |
(e) Money market mutual fund registered under the Investment Company Act of 1940, as amended, and advised by Columbia Management Advisors, LLC.
(f) Cost for federal income tax purposes is $126,837,187.
The following table summarizes the inputs used, as of October 31, 2009, in valuing the Fund's assets:
| Description | | Quoted Prices
(Level 1) | | Other
Significant
Observable
Inputs
(Level 2) | | Significant
Unobservable
Inputs
(Level 3) | | Total | |
| Total Municipal Bonds | | $ | — | | | $ | 129,251,120 | | | $ | 1,319,500 | | | $ | 130,570,620 | | |
Total Investment
Companies | | | 1,974,224 | | | | — | | | | — | | | | 1,974,224 | | |
| Total Investments | | $ | 1,974,224 | | | $ | 129,251,120 | | | $ | 1,319,500 | | | $ | 132,544,844 | | |
The following table reconciles asset balances for the year ended October 31, 2009, in which significant unobservable inputs (Level 3) were used in determining value:
| Investments in Securities | | Balance as of
October 31, 2008 | | Accrued
Discounts
(Premiums) | | Realized
Gain (Loss) | | Change in
Unrealized
Appreciation
(Depreciation) | | Purchases
(Sales) | | Transfers
into (out of)
Level 3 | | Balance as of
October 31, 2009 | |
| Municipal Bonds | | $ | — | | | $ | — | | | $ | — | | | $ | (216,630 | ) | | $ | (70,000 | ) | | $ | 1,606,130 | | | $ | 1,319,500 | | |
The information in the above reconciliation represents fiscal year to date activity for any securities identified as using Level 3 inputs at either the beginning or the end of the current fiscal period.
The change in unrealized depreciation attributable to securities owned at October 31, 2009 which were valued using significant unobservable inputs (Level 3) amounted to $216,630. This amount is included in net change in unrealized appreciation (depreciation) on the Statement of Changes in Net Assets.
For more information on valuation inputs, and their aggregation into the levels used in the tables above, please refer to the Security Valuation section in the accompanying Notes to Financial Statements.
At October 31, 2009, the composition of the Fund by revenue source is as follows:
| Holdings by Revenue Source (Unaudited) | | % of
Net Assets | |
| Education | | | 25.5 | | |
| Other | | | 23.0 | | |
| Tax-Backed | | | 18.8 | | |
| Utilities | | | 12.9 | | |
| Health Care | | | 8.1 | | |
| Transportation | | | 4.8 | | |
| Housing | | | 3.2 | | |
| Other Revenue | | | 1.0 | | |
| | | | 97.3 | | |
| Investment Companies | | | 1.5 | | |
| Other Assets & Liabilities, Net | | | 1.2 | | |
| | | | 100.0 | | |
| Acronym | | Name | |
| AGO | | Assured Guaranty Corp. | |
|
| AMBAC | | Ambac Assurance Corp. | |
|
| AMT | | Alternative Minimum Tax | |
|
| FGIC | | Financial Guaranty Insurance Co. | |
|
| FHA | | Federal Housing Administration | |
|
| FSA | | Financial Security Assurance, Inc. | |
|
| NPFGC | | National Public Finance Guarantee Corp. | |
|
See Accompanying Notes to Financial Statements.
12
Statement of Assets and Liabilities – Columbia Massachusetts Tax-Exempt Fund
October 31, 2009
| | | | | ($) | |
| Assets | | Unaffiliated investments, at identified cost | | | 126,309,658 | | |
| | | Affiliated investments, at identified cost | | | 817,498 | | |
| | | Total investments, at identified cost | | | 127,127,156 | | |
| | | Unaffiliated investments, at value | | | 131,727,346 | | |
| | | Affiliated investments, at value | | | 817,498 | | |
| | | Total investments, at value | | | 132,544,844 | | |
| | | Cash | | | 223 | | |
| | | Receivable for: | | | | | |
| | | Fund shares sold | | | 147,552 | | |
| | | Interest | | | 2,035,449 | | |
| | | Expense reimbursement due from investment advisor | | | 9,963 | | |
| | | Trustees' deferred compensation plan | | | 26,362 | | |
| | | Prepaid expenses | | | 463 | | |
| | | Total Assets | | | 134,764,856 | | |
| Liabilities | | Payable for: | | | | | |
| | | Fund shares repurchased | | | 231,541 | | |
| | | Distributions | | | 169,432 | | |
| | | Investment advisory fee | | | 58,283 | | |
| | | Pricing and bookkeeping fees | | | 7,464 | | |
| | | Transfer agent fee | | | 9,639 | | |
| | | Trustees' fees | | | 209 | | |
| | | Audit fee | | | 33,800 | | |
| | | Custody fee | | | 1,800 | | |
| | | Distribution and service fees | | | 35,573 | | |
| | | Chief compliance officer expenses | | | 55 | | |
| | | Trustees' deferred compensation plan | | | 26,362 | | |
| | | Other liabilities | | | 17,844 | | |
| | | Total Liabilities | | | 592,002 | | |
| | | Net Assets | | | 134,172,854 | | |
| Net Assets Consist of | | Paid-in capital | | | 128,051,741 | | |
| | | Undistributed net investment income | | | 381,938 | | |
| | | Accumulated net realized gain | | | 321,487 | | |
| | | Net unrealized appreciation on investments | | | 5,417,688 | | |
| | | Net Assets | | | 134,172,854 | | |
| Class A | | Net assets | | $ | 117,192,730 | | |
| | | Shares outstanding | | | 15,474,989 | | |
| | | Net asset value per share | | $ | 7.57 | (a) | |
| | | Maximum sales charge | | | 4.75 | % | |
| | | Maximum offering price per share ($7.57/0.9525) | | $ | 7.95 | (b) | |
| Class B | | Net assets | | $ | 6,640,942 | | |
| | | Shares outstanding | | | 876,880 | | |
| | | Net asset value and offering price per share | | $ | 7.57 | (a) | |
| Class C | | Net assets | | $ | 10,339,182 | | |
| | | Shares outstanding | | | 1,365,246 | | |
| | | Net asset value and offering price per share | | $ | 7.57 | (a) | |
(a) Redemption price per share is equal to net asset value less any applicable contingent deferred sales charge.
(b) On sales of $50,000 or more the offering price is reduced.
See Accompanying Notes to Financial Statements.
13
Statement of Operations – Columbia Massachusetts Tax-Exempt Fund
For the Year Ended October 31, 2009
| | | | | ($) | |
| Investment Income | | Interest | | | 6,616,631 | | |
| | | Dividends | | | 6,959 | | |
| | | Dividends from affiliates | | | 9,136 | | |
| | | Total Investment Income | | | 6,632,726 | | |
| Expenses | | Investment advisory fee | | | 658,411 | | |
| | | Distribution fee: | | | | | |
| | | Class B | | | 67,068 | | |
| | | Class C | | | 71,441 | | |
| | | Service fee: | | | | | |
| | | Class A | | | 260,190 | | |
| | | Class B | | | 20,536 | | |
| | | Class C | | | 21,895 | | |
| | | Pricing and bookkeeping fees | | | 67,579 | | |
| | | Transfer agent fee | | | 61,637 | | |
| | | Trustees' fees | | | 20,939 | | |
| | | Custody fee | | | 9,902 | | |
| | | Chief compliance officer expenses | | | 632 | | |
| | | Other expenses | | | 120,842 | | |
| | | Total Expenses | | | 1,381,072 | | |
| | | Fees waived or expenses reimbursed by investment advisor | | | (120,205 | ) | |
| | | Fees waived by distributor—Class C | | | (28,604 | ) | |
| | | Expense reductions | | | (886 | ) | |
| | | Net Expenses | | | 1,231,377 | | |
| | | Net Investment Income | | | 5,401,349 | | |
Net Realized and Unrealized
Gain (Loss) on Investments and
Futures Contracts | | Net realized gain on: | | | | | |
| | | Investments | | | 612,708 | | |
| | | Futures contracts | | | 60,733 | | |
| | | Net realized gain | | | 673,441 | | |
| | | Net change in unrealized appreciation (depreciation) on investments | | | 10,838,357 | | |
| | | Net Gain | | | 11,511,798 | | |
| | | Net Increase Resulting from Operations | | | 16,913,147 | | |
See Accompanying Notes to Financial Statements.
14
Statement of Changes in Net Assets – Columbia Massachusetts Tax-Exempt Fund
| | | | | Year Ended October 31, | |
| Increase (Decrease) in Net Assets | | | | 2009 ($) | | 2008 ($) | |
| Operations | | Net investment income | | | 5,401,349 | | | | 5,744,890 | | |
| | | Net realized gain on investments and futures contracts | | | 673,441 | | | | 1,200,605 | | |
| | | Net change in unrealized appreciation (depreciation) on
investments and futures contracts | | | 10,838,357 | | | | (14,551,485 | ) | |
| | | Net increase (decrease) resulting from operations | | | 16,913,147 | | | | (7,605,990 | ) | |
| Distributions to Shareholders | | From net investment income: | | | | | | | | | |
| | | Class A | | | (4,698,922 | ) | | | (4,924,183 | ) | |
| | | Class B | | | (305,940 | ) | | | (443,714 | ) | |
| | | Class C | | | (351,954 | ) | | | (350,134 | ) | |
| | | From net realized gains: | | | | | | | | | |
| | | Class A | | | (719,761 | ) | | | — | | |
| | | Class B | | | (65,907 | ) | | | — | | |
| | | Class C | | | (57,814 | ) | | | — | | |
| | | Total distributions to shareholders | | | (6,200,298 | ) | | | (5,718,031 | ) | |
| | | Net Capital Stock Transactions | | | (3,877,292 | ) | | | (13,795,105 | ) | |
| | | Total increase (decrease) in net assets | | | 6,835,557 | | | | (27,119,126 | ) | |
| Net Assets | | Beginning of period | | | 127,337,297 | | | | 154,456,423 | | |
| | | End of period | | | 134,172,854 | | | | 127,337,297 | | |
| | | Undistributed net investment income at end of period | | | 381,938 | | | | 369,382 | | |
See Accompanying Notes to Financial Statements.
15
Statement of Changes in Net Assets (continued) – Columbia Massachusetts Tax-Exempt Fund
| | | Capital Stock Activity | |
| | | Year Ended
October 31, 2009 | | Year Ended
October 31, 2008 | |
| | | Shares | | Dollars ($) | | Shares | | Dollars ($) | |
| Class A | |
| Subscriptions | | | 1,204,135 | | | | 8,855,388 | | | | 882,973 | | | | 6,678,958 | | |
| Distributions reinvested | | | 464,950 | | | | 3,371,949 | | | | 392,191 | | | | 2,938,491 | | |
| Redemptions | | | (1,697,784 | ) | | | (12,387,265 | ) | | | (2,530,546 | ) | | | (19,074,394 | ) | |
| Net decrease | | | (28,699 | ) | | | (159,928 | ) | | | (1,255,382 | ) | | | (9,456,945 | ) | |
| Class B | |
| Subscriptions | | | 61,110 | | | | 448,629 | | | | 42,455 | | | | 323,103 | | |
| Distributions reinvested | | | 34,983 | | | | 251,713 | | | | 40,274 | | | | 302,130 | | |
| Redemptions | | | (726,975 | ) | | | (5,336,288 | ) | | | (518,466 | ) | | | (3,855,607 | ) | |
| Net decrease | | | (630,882 | ) | | | (4,635,946 | ) | | | (435,737 | ) | | | (3,230,374 | ) | |
| Class C | |
| Subscriptions | | | 289,237 | | | | 2,138,951 | | | | 211,865 | | | | 1,602,702 | | |
| Distributions reinvested | | | 33,263 | | | | 241,612 | | | | 26,640 | | | | 199,738 | | |
| Redemptions | | | (200,181 | ) | | | (1,461,981 | ) | | | (385,242 | ) | | | (2,910,226 | ) | |
| Net increase (decrease) | | | 122,319 | | | | 918,582 | | | | (146,737 | ) | | | (1,107,786 | ) | |
See Accompanying Notes to Financial Statements.
16
Financial Highlights – Columbia Massachusetts Tax-Exempt Fund
Selected data for a share outstanding throughout each period is as follows:
| | | Year Ended October 31, | |
| Class A Shares | | 2009 | | 2008 | | 2007 | | 2006 | | 2005 | |
| Net Asset Value, Beginning of Period | | $ | 6.98 | | | $ | 7.69 | | | $ | 7.94 | | | $ | 7.83 | | | $ | 8.17 | | |
| Income from Investment Operations: | |
| Net investment income (a) | | | 0.31 | | | | 0.31 | | | | 0.31 | | | | 0.31 | | | | 0.32 | | |
Net realized and unrealized gain (loss) on
investments and futures contracts | | | 0.63 | | | | (0.71 | ) | | | (0.18 | ) | | | 0.17 | | | | (0.23 | ) | |
| Total from investment operations | | | 0.94 | | | | (0.40 | ) | | | 0.13 | | | | 0.48 | | | | 0.09 | | |
| Less Distributions to Shareholders: | |
| From net investment income | | | (0.30 | ) | | | (0.31 | ) | | | (0.31 | ) | | | (0.31 | ) | | | (0.32 | ) | |
| From net realized gains | | | (0.05 | ) | | | — | | | | (0.07 | ) | | | (0.06 | ) | | | (0.11 | ) | |
| Total distributions to shareholders | | | (0.35 | ) | | | (0.31 | ) | | | (0.38 | ) | | | (0.37 | ) | | | (0.43 | ) | |
| Net Asset Value, End of Period | | $ | 7.57 | | | $ | 6.98 | | | $ | 7.69 | | | $ | 7.94 | | | $ | 7.83 | | |
| Total return (b) | | | 13.82 | %(c) | | | (5.46 | )% | | | 1.65 | % | | | 6.30 | % | | | 1.09 | %(c) | |
| Ratios to Average Net Assets/Supplemental Data: | |
| Net expenses before interest expense and fees (d) | | | 0.85 | % | | | 0.93 | % | | | 0.94 | % | | | 0.93 | % | | | 0.90 | % | |
| Interest expense and fees | | | — | | | | 0.03 | %(e) | | | 0.07 | %(e) | | | 0.06 | %(e) | | | 0.04 | %(e) | |
| Net expenses (d) | | | 0.85 | % | | | 0.96 | % | | | 1.01 | % | | | 0.99 | % | | | 0.94 | % | |
| Waiver/Reimbursement | | | 0.09 | % | | | — | | | | — | | | | — | | | | — | %(f) | |
| Net investment income (d) | | | 4.18 | % | | | 4.08 | % | | | 3.96 | % | | | 3.99 | % | | | 4.03 | % | |
| Portfolio turnover rate | | | 15 | % | | | 16 | % | | | 14 | % | | | 6 | % | | | 6 | % | |
| Net assets, end of period (000s) | | $ | 117,193 | | | $ | 108,149 | | | $ | 128,833 | | | $ | 137,232 | | | $ | 146,149 | | |
(a) Per share data was calculated using the average shares outstanding during the period.
(b) Total return at net asset value assuming all distributions reinvested and no initial sales charge or contingent deferred sales charge.
(c) Had the investment advisor and/or any of its affiliates not waived fees or reimbursed a portion of expenses, total return would have been reduced.
(d) The benefits derived from expense reductions had an impact of less than 0.01%.
(e) Interest expense and fees relate to the liability for floating-rate notes issued in conjunction with inverse floater securities transactions.
(f) Rounds to less than 0.01%.
See Accompanying Notes to Financial Statements.
17
Financial Highlights – Columbia Massachusetts Tax-Exempt Fund
Selected data for a share outstanding throughout each period is as follows:
| | | Year Ended October 31, | |
| Class B Shares | | 2009 | | 2008 | | 2007 | | 2006 | | 2005 | |
| Net Asset Value, Beginning of Period | | $ | 6.98 | | | $ | 7.69 | | | $ | 7.94 | | | $ | 7.83 | | | $ | 8.17 | | |
| Income from Investment Operations: | |
| Net investment income (a) | | | 0.25 | | | | 0.25 | | | | 0.25 | | | | 0.25 | | | | 0.26 | | |
Net realized and unrealized gain (loss) on
investments and futures contracts | | | 0.64 | | | | (0.71 | ) | | | (0.18 | ) | | | 0.17 | | | | (0.23 | ) | |
| Total from investment operations | | | 0.89 | | | | (0.46 | ) | | | 0.07 | | | | 0.42 | | | | 0.03 | | |
| Less Distributions to Shareholders: | |
| From net investment income | | | (0.25 | ) | | | (0.25 | ) | | | (0.25 | ) | | | (0.25 | ) | | | (0.26 | ) | |
| From net realized gains | | | (0.05 | ) | | | — | | | | (0.07 | ) | | | (0.06 | ) | | | (0.11 | ) | |
| Total distributions to shareholders | | | (0.30 | ) | | | (0.25 | ) | | | (0.32 | ) | | | (0.31 | ) | | | (0.37 | ) | |
| Net Asset Value, End of Period | | $ | 7.57 | | | $ | 6.98 | | | $ | 7.69 | | | $ | 7.94 | | | $ | 7.83 | | |
| Total return (b) | | | 12.98 | %(c) | | | (6.16 | )% | | | 0.90 | % | | | 5.50 | % | | | 0.34 | %(c) | |
| Ratios to Average Net Assets/Supplemental Data: | |
| Net expenses before interest expense and fees (d) | | | 1.60 | % | | | 1.68 | % | | | 1.69 | % | | | 1.68 | % | | | 1.65 | % | |
| Interest expense and fees | | | — | | | | 0.03 | %(e) | | | 0.07 | %(e) | | | 0.06 | %(e) | | | 0.04 | %(e) | |
| Net expenses (d) | | | 1.60 | % | | | 1.71 | % | | | 1.76 | % | | | 1.74 | % | | | 1.69 | % | |
| Waiver/Reimbursement | | | 0.09 | % | | | — | | | | — | | | | — | | | | — | %(f) | |
| Net investment income (d) | | | 3.46 | % | | | 3.32 | % | | | 3.21 | % | | | 3.25 | % | | | 3.28 | % | |
| Portfolio turnover rate | | | 15 | % | | | 16 | % | | | 14 | % | | | 6 | % | | | 6 | % | |
| Net assets, end of period (000s) | | $ | 6,641 | | | $ | 10,518 | | | $ | 14,941 | | | $ | 21,192 | | | $ | 27,208 | | |
(a) Per share data was calculated using the average shares outstanding during the period.
(b) Total return at net asset value assuming all distributions reinvested and no contingent deferred sales charge.
(c) Had the investment advisor and/or any of its affiliates not waived fees or reimbursed a portion of expenses, total return would have been reduced.
(d) The benefits derived from expense reductions had an impact of less than 0.01%.
(e) Interest expense and fees relate to the liability for floating-rate notes issued in conjunction with inverse floater securities transactions.
(f) Rounds to less than 0.01%.
See Accompanying Notes to Financial Statements.
18
Financial Highlights – Columbia Massachusetts Tax-Exempt Fund
Selected data for a share outstanding throughout each period is as follows:
| | | Year Ended October 31, | |
| Class C Shares | | 2009 | | 2008 | | 2007 | | 2006 | | 2005 | |
| Net Asset Value, Beginning of Period | | $ | 6.98 | | | $ | 7.69 | | | $ | 7.94 | | | $ | 7.83 | | | $ | 8.17 | | |
| Income from Investment Operations: | |
| Net investment income (a) | | | 0.27 | | | | 0.27 | | | | 0.27 | | | | 0.28 | | | | 0.29 | | |
Net realized and unrealized gain (loss) on
investments and futures contracts | | | 0.64 | | | | (0.71 | ) | | | (0.18 | ) | | | 0.16 | | | | (0.24 | ) | |
| Total from investment operations | | | 0.91 | | | | (0.44 | ) | | | 0.09 | | | | 0.44 | | | | 0.05 | | |
| Less Distributions to Shareholders: | |
| From net investment income | | | (0.27 | ) | | | (0.27 | ) | | | (0.27 | ) | | | (0.27 | ) | | | (0.28 | ) | |
| From net realized gains | | | (0.05 | ) | | | — | | | | (0.07 | ) | | | (0.06 | ) | | | (0.11 | ) | |
| Total distributions to shareholders | | | (0.32 | ) | | | (0.27 | ) | | | (0.34 | ) | | | (0.33 | ) | | | (0.39 | ) | |
| Net Asset Value, End of Period | | $ | 7.57 | | | $ | 6.98 | | | $ | 7.69 | | | $ | 7.94 | | | $ | 7.83 | | |
| Total return (b)(c) | | | 13.31 | % | | | (5.88 | )% | | | 1.20 | % | | | 5.82 | % | | | 0.64 | % | |
| Ratios to Average Net Assets/Supplemental Data: | |
| Net expenses before interest expense and fees (d) | | | 1.30 | % | | | 1.38 | % | | | 1.39 | % | | | 1.38 | % | | | 1.35 | % | |
| Interest expense and fees | | | — | | | | 0.03 | %(e) | | | 0.07 | %(e) | | | 0.06 | %(e) | | | 0.04 | %(e) | |
| Net expenses (d) | | | 1.30 | % | | | 1.41 | % | | | 1.46 | % | | | 1.44 | % | | | 1.39 | % | |
| Waiver/Reimbursement | | | 0.39 | % | | | 0.30 | % | | | 0.30 | % | | | 0.30 | % | | | 0.30 | % | |
| Net investment income (d) | | | 3.73 | % | | | 3.63 | % | | | 3.51 | % | | | 3.54 | % | | | 3.57 | % | |
| Portfolio turnover rate | | | 15 | % | | | 16 | % | | | 14 | % | | | 6 | % | | | 6 | % | |
| Net assets, end of period (000s) | | $ | 10,339 | | | $ | 8,670 | | | $ | 10,683 | | | $ | 13,982 | | | $ | 13,986 | | |
(a) Per share data was calculated using the average shares outstanding during the period.
(b) Total return at net asset value assuming all distributions reinvested and no contingent deferred sales charge.
(c) Had the investment advisor and/or any of its affiliates not waived fees or reimbursed a portion of expenses, total return would have been reduced.
(d) The benefits derived from expense reductions had an impact of less than 0.01%.
(e) Interest expense and fees relate to the liability for floating-rate notes issued in conjunction with inverse floater securities transactions.
See Accompanying Notes to Financial Statements.
19
Notes to Financial Statements – Columbia Massachusetts Tax-Exempt Fund
October 31, 2009
Note 1. Organization
Columbia Massachusetts Tax-Exempt Fund (the "Fund"), a series of Columbia Funds Series Trust I (the "Trust"), is a non-diversified portfolio. The Trust is registered under the Investment Company Act of 1940, as amended (the "1940 Act"), as an open-end management investment company organized as a Massachusetts business trust.
Investment Objective
The Fund seeks total return, consisting of current income exempt from federal income tax and Massachusetts individual income tax and of capital appreciation, consistent with moderate fluctuation of principal.
Fund Shares
The Trust may issue an unlimited number of shares, and the Fund offers three classes of shares: Class A, Class B and Class C. Each share class has its own expense structure and sales charges, as applicable. Effective June 22, 2009, the Fund no longer accepts investments from new or existing investors in the Fund's Class B shares, except in connection with the reinvestment of any dividend and/or capital gain distributions in Class B shares of the Fund and exchanges by existing Class B shareholders of other Columbia Funds.
Class A shares are subject to a maximum front-end sales charge of 4.75% based on the amount of initial investment. Class A shares purchased without an initial sales charge in accounts aggregating $1 million to $50 million at the time of purchase are subject to a 1.00% contingent deferred sales charge ("CDSC") if the shares are sold within one year after purchase. Class B shares are subject to a maximum CDSC of 5.00% based upon the holding period after purchase. Class B shares will convert to Class A shares eight years after purchase. Class C shares are subject to a 1.00% CDSC on shares sold within one year after purchase.
Note 2. Significant Accounting Policies
The preparation of financial statements in accordance with accounting principles generally accepted in the United States of America ("GAAP") requires management to make certain estimates and assumptions that affect the reported amounts of assets and liabilities, the disclosure of contingent assets and liabilities at the date of the financial statements and the reported amounts of revenue and expenses during the reporting period. Actual results could differ from those estimates.
Management has evaluated the events and transactions that have occurred through December 18, 2009, the date the financial statements were issued, and noted no items requiring adjustment of the financial statements or additional disclosures except as disclosed in Note 4.
The following is a summary of significant accounting policies consistently followed by the Fund in the preparation of its financial statements.
Security Valuation
Debt securities generally are valued by pricing services approved by the Trust's Board of Trustees, based upon market transactions for normal, institutional-size trading units of similar securities. The services may use various pricing techniques which take into account appropriate factors such as yield, quality, coupon rate, maturity, type of issue, trading characteristics and other data, as well as broker quotes. Debt securities for which quotations are readily available are valued at an over-the-counter or exchange bid quotation.
Certain debt securities, which tend to be more thinly traded and of lesser quality, are priced based on fundamental analysis of the financial condition of the issuer and the estimated value of any collateral. Valuations developed through pricing techniques may vary from the actual amounts realized upon sale of the securities, and the potential variation may be greater for those securities valued using fundamental analysis.
Short-term investments maturing in 60 days or less are valued at amortized cost, which approximates market value.
Investments in other open-end investment companies are valued at net asset value.
Futures contracts are valued at the settlement price established each day by the board of trade or exchange on which they are traded.
Investments for which market quotations are not readily available, or that have quotations which management believes are not reliable, are valued at fair value as determined in good faith under consistently applied procedures established by and under the general supervision of the Board of Trustees. If a security is valued at fair value, such value is likely to be
20
Columbia Massachusetts Tax-Exempt Fund, October 31, 2009
different from the last quoted market price for the security. The determination of fair value often requires significant judgment. To determine fair value, management may use assumptions including but not limited to future cash flows and estimated risk premiums. Multiple inputs from various sources may be used to determine value.
Management establishes a hierarchy that prioritizes the inputs to valuation techniques used to measure fair value giving the highest priority to unadjusted quoted prices in active markets for identical securities (level 1 measurements) and the lowest priority to unobservable inputs (level 3 measurements) when market prices are not readily available or reliable. The three levels of the fair value hierarchy are described below:
• Level 1 – quoted prices in active markets for identical securities
• Level 2 – prices determined using other significant observable inputs (including quoted prices for similar securities, interest rates, prepayment speeds, credit risk and others)
• Level 3 – prices determined using significant unobservable inputs. In situations where quoted prices or observable inputs are unavailable or less reliable, unobservable inputs may be used. Unobservable inputs may include management's own assumptions about the factors market participants would use in pricing an investment.
The inputs or methodology used for valuing securities are not necessarily an indication of the risk associated with investing in those securities.
Security Transactions
Security transactions are accounted for on the trade date. Cost is determined and gains (losses) are based upon the specific identification method for both financial statement and federal income tax purposes.
Income Recognition
Interest income is recorded on the accrual basis. Premium and discount are amortized and accreted, respectively, on all debt securities, unless otherwise noted. Original issue discount is accreted to interest income over the life of the security with a corresponding increase in the cost basis. Dividend income is recorded on the ex-date.
Expenses
General expenses of the Trust are allocated to the Fund and other series of the Trust based upon relative net assets or other expense allocation methodologies determined by the nature of the expense. Expenses directly attributable to the Fund are charged to the Fund.
Determination of Class Net Asset Value
All income, expenses (other than class-specific expenses, as shown on the Statement of Operations) and realized and unrealized gains (losses) are allocated to each class of the Fund on a daily basis for purposes of determining the net asset value of each class. Income and expenses are allocated to each class based on the settled shares method, while realized and unrealized gains (losses) are allocated based on the relative net assets of each class.
Federal Income Tax Status
The Fund intends to qualify each year as a "regulated investment company" under Subchapter M of the Internal Revenue Code, as amended, and will distribute substantially all of its tax exempt or taxable income, if any, for its tax year, and as such will not be subject to federal income taxes. In addition, the Fund intends to distribute in each calendar year substantially all of its net investment income, capital gains and certain other amounts, if any, such that the Fund should not be subject to federal excise tax. Therefore, no federal income or excise tax provision is recorded.
Distributions to Shareholders
Distributions from net investment income are declared daily and paid monthly. Net realized capital gains, if any, are distributed at least annually. Income distributions and capital gain distributions are determined in accordance with federal income tax regulations which may differ from GAAP.
Indemnification
In the normal course of business, the Fund enters into contracts that contain a variety of representations and warranties and which provide general indemnities. The Fund's maximum exposure under these arrangements is unknown because this would involve future claims against the Fund. Also, under the Trust's organizational documents and by contract, the Trustees and officers of the Trust are
21
Columbia Massachusetts Tax-Exempt Fund, October 31, 2009
indemnified against certain liabilities that may arise out of actions relating to their duties to the Trust. However, based on experience, the Fund expects the risk of loss due to these representations, warranties and indemnities to be minimal.
Note 3. Federal Tax Information
The timing and character of income and capital gain distributions are determined in accordance with income tax regulations, which may differ from GAAP. Reclassifications are made to the Fund's capital accounts for permanent tax differences to reflect income and gains available for distribution (or available capital loss carryforwards) under income tax regulations.
For the year ended October 31, 2009, permanent book and tax basis differences resulting primarily from differing treatments for discount accretion/premium amortization on debt securities were identified and reclassified among the components of the Fund's net assets as follows:
Undistributed
Net Investment
Income | | Accumulated
Net Realized
Gain | | Paid-In Capital | |
| $ | (31,977 | ) | | $ | 31,977 | | | $ | — | | |
Net investment income and net realized gains (losses), as disclosed on the Statement of Operations, and net assets were not affected by this reclassification.
The tax character of distributions paid during the years ended October 31, 2009 and October 31, 2008 was as follows:
| | | October 31, | |
| | | 2009 | | 2008 | |
| Tax-Exempt Income | | $ | 5,356,816 | | | $ | 5,714,770 | | |
| Ordinary Income* | | | — | | | | 3,261 | | |
| Long-Term Capital Gains | | | 843,482 | | | | — | | |
* For tax purposes short-term capital gain distributions, if any, are considered ordinary income distributions.
As of October 31, 2009, the components of distributable earnings on a tax basis were as follows:
Undistributed
Tax-Exempt
Income | | Undistributed
Long-Term
Capital Gains | | Net Unrealized
Appreciation* | |
| $ | 296,227 | | | $ | 622,663 | | | $ | 5,707,657 | | |
* The differences between book-basis and tax-basis net unrealized appreciation are primarily due to discount accretion/premium amortization on debt securities.
Unrealized appreciation and depreciation at October 31, 2009, based on cost of investments for federal income tax purposes, were:
| Unrealized appreciation | | $ | 9,314,576 | | |
| Unrealized depreciation | | | (3,606,919 | ) | |
| Net unrealized appreciation | | $ | 5,707,657 | | |
Management is required to determine whether a tax position of the Fund is more likely than not to be sustained upon examination by the applicable taxing authority, including resolution of any related appeals or litigation processes, based on the technical merits of the position. The tax benefit to be recognized by the Fund is measured as the largest amount of benefit that is greater than fifty percent likely of being realized upon ultimate settlement. Management is not aware of any tax positions for which it is reasonably possible that the total amounts of unrecognized tax benefits will significantly change in the next twelve months. However, management's conclusions may be subject to review and adjustment at a later date based on factors including, but not limited to, new tax laws, regulations, and administrative interpretations (including relevant court decisions). The Fund's federal tax returns for the prior three fiscal year s remain subject to examination by the Internal Revenue Service.
Note 4. Fees and Compensation Paid to Affiliates
Investment Advisory Fee
Columbia Management Advisors, LLC ("Columbia"), an indirect, wholly owned subsidiary of Bank of America Corporation ("BOA"), provides investment advisory,
22
Columbia Massachusetts Tax-Exempt Fund, October 31, 2009
administrative and other services to the Fund. Columbia receives a monthly investment advisory fee based on the Fund's pro-rata portion of the combined average daily net assets of the Fund, Columbia California Tax-Exempt Fund, Columbia Connecticut Tax-Exempt Fund and Columbia New York Tax-Exempt Fund as follows:
| Combined Average Daily Net Assets | | Annual Fee Rate | |
| First $1 billion | | | 0.50 | % | |
| $1 billion to $3 billion | | | 0.45 | % | |
| Over $3 billion | | | 0.40 | % | |
For the year ended October 31, 2009, the Fund's effective investment advisory fee rate was 0.50% of the Fund's average daily net assets.
BOA entered into an agreement dated September 29, 2009 to sell a portion of the asset management business of Columbia Management Group, LLC to Ameriprise Financial, Inc. The transaction ("Transaction") includes a sale of the part of the asset management business that advises long-term mutual funds, including the Fund. The Transaction is subject to certain approvals and other conditions to closing, and is currently expected to close in the spring of 2010.
Pricing and Bookkeeping Fees
The Fund has entered into a Financial Reporting Services Agreement (the "Financial Reporting Services Agreement") with State Street Bank & Trust Company ("State Street") and Columbia pursuant to which State Street provides financial reporting services to the Fund. The Fund has also entered into an Accounting Services Agreement (collectively with the Financial Reporting Services Agreement, the "State Street Agreements") with State Street and Columbia pursuant to which State Street provides accounting services to the Fund. Under the State Street Agreements, the Fund pays State Street an annual fee of $38,000 paid monthly plus an additional monthly fee based on an annualized percentage rate of average daily net assets of the Fund for the month. The aggregate fee will not exceed $140,000 per year (exclusive of out-of-pocket expenses and charges). The Fund also reimburses State Street for certain out-of-pocket expenses and charge s.
The Fund has entered into a Pricing and Bookkeeping Oversight and Services Agreement (the "Services Agreement") with Columbia. Under the Services Agreement, Columbia provides services related to Fund expenses and the requirements of the Sarbanes-Oxley Act of 2002, and provides oversight of the accounting and financial reporting services provided by State Street. Under the Services Agreement, the Fund reimburses Columbia for out-of-pocket expenses.
Transfer Agent Fee
Columbia Management Services, Inc. (the "Transfer Agent"), an affiliate of Columbia and an indirect, wholly owned subsidiary of BOA, provides shareholder services to the Fund and has contracted with Boston Financial Data Services ("BFDS") to serve as sub-transfer agent. The Transfer Agent is entitled to receive a fee for its services, paid monthly, at the annual rate of $17.34 per account plus reimbursement of certain sub-transfer agent fees paid by the Transfer Agent (exclusive of BFDS fees), calculated based on assets held in omnibus accounts and intended to recover the cost of payments to other parties (including affiliates of BOA) for services to those accounts. Effective November 1, 2009, the annual rate changed to $22.36 per account. The Transfer Agent pays the fees of BFDS for services as sub-transfer agent and is not entitled to reimbursement for such fees from the Fund.
The Transfer Agent may also retain, as additional compensation for its services, fees for wire, telephone and redemption orders, Individual Retirement Account ("IRA") trustee agent fees and account transcript fees due to the Transfer Agent from shareholders of the Fund and credits (net of bank charges) earned with respect to balances in accounts the Transfer Agent maintains in connection with its services to the Fund. The Transfer Agent also receives reimbursement for certain out-of-pocket expenses.
An annual minimum account balance fee of $20 may apply to certain accounts with a value below the Fund's initial minimum investment requirements to reduce the impact of small accounts on transfer agent fees. These minimum account balance fees are recorded as part of expense reductions on the Statement of Operations. For the year ended October 31, 2009, no minimum account balance fees were charged by the Fund.
23
Columbia Massachusetts Tax-Exempt Fund, October 31, 2009
Underwriting Discounts, Service and Distribution Fees
Columbia Management Distributors, Inc. (the "Distributor"), an affiliate of Columbia and an indirect, wholly owned subsidiary of BOA, is the principal underwriter of the Fund's shares. For the year ended October 31, 2009, the Distributor has retained net underwriting discounts of $10,499 on sales of the Fund's Class A shares and received net CDSC fees of $15, $6,014 and $742 on Class A, Class B and Class C share redemptions, respectively.
The Fund has adopted distribution and shareholder servicing plans (the "Plans") pursuant to Rule 12b-1 under the 1940 Act, which require the payment of distribution and service fees. The fees are intended to compensate the Distributor and/or eligible selling and/or servicing agents for selling shares of the Fund and providing services to investors. The service fee is equal to 0.10% annually of the net assets attributable to shares of the Fund issued prior to December 1, 1994 and 0.25% annually of the net assets attributable to shares issued thereafter. This arrangement results in an annual rate of service fees for all shares that is a blend between the 0.10% and 0.25% rates. For the year ended October 31, 2009, the Fund's effective service fee rate was 0.23% of the Fund's average daily net assets attributable to Class A, Class B and Class C shares.
The Plans also require the payment of a monthly distribution fee to the Distributor equal to 0.75% annually of the average daily net assets attributable to Class B and Class C shares only. The Distributor has voluntarily agreed to waive a portion of the distribution fee for Class C shares so that it does not exceed 0.45% annually of the average daily net assets attributable to Class C shares. This arrangement may be modified or terminated by the Distributor at any time.
Fee Waivers and Expense Reimbursements
Effective January 1, 2009, Columbia has voluntarily agreed to reimburse a portion of the Fund's expenses so that the Fund's ordinary operating expenses (excluding any distribution and service fees, brokerage commissions, interest, taxes and extraordinary expenses, but including custodian charges relating to overdrafts, if any), after giving effect to any balance credits from the Fund's custodian, do not exceed 0.60% of the Fund's average daily net assets on an annualized basis. Columbia, in its discretion, may revise or discontinue this arrangement any time.
Fees Paid to Officers and Trustees
All officers of the Fund are employees of Columbia or its affiliates and, with the exception of the Fund's Chief Compliance Officer, receive no compensation from the Fund. The Board of Trustees has appointed a Chief Compliance Officer to the Fund in accordance with federal securities regulations. The Fund, along with other affiliated funds, pays its pro-rata share of the expenses associated with the Chief Compliance Officer. The Fund's expenses for the Chief Compliance Officer will not exceed $15,000 per year.
The Trust's eligible Trustees may participate in a deferred compensation plan which may be terminated at any time. Obligations of the plan will be paid solely out of the Fund's assets.
Other
The Fund may make daily investments of cash balances in Columbia Massachusetts Municipal Reserves, an affiliated open-ended investment company, pursuant to an exemptive order received from the Securities and Exchange Commission. As an investing Fund, the Fund indirectly bears its proportionate share of the expenses of Columbia Massachusetts Municipal Reserves.
Note 5. Custody Credits
The Fund has an agreement with its custodian bank under which custody fees may be reduced by balance credits. These credits are recorded as part of expense reductions on the Statement of Operations. The Fund could have invested a portion of the assets utilized in connection with the expense offset arrangement in an income-producing asset if it had not entered into such an agreement.
For the year ended October 31, 2009, these custody credits reduced total expenses by $886 for the Fund.
Note 6. Objectives and Strategies for Investing in Derivatives Instruments
The Fund uses derivatives instruments including futures contracts in order to meet its investment objectives. The Fund employs strategies in differing combinations to permit it to
24
Columbia Massachusetts Tax-Exempt Fund, October 31, 2009
increase, decrease or change the level of exposure to market risk factors. The achievement of any strategy relating to derivatives depends on analysis of various risk factors, and if the strategies for use of derivatives do not work as intended, the Fund may not achieve its investment objectives.
In pursuit of its investment objectives, the Fund is exposed to the following market risks:
Interest Rate Risk: Interest rate risk relates to the fluctuation in value of fixed income securities because of the inverse relationship of price and yield. Fixed income securities generally will decline in value upon an increase in general interest rates and their value generally will increase upon a decline in general interest rates. Fixed income securities with longer durations tend to be more sensitive to changes in interest rates, usually making them more volatile than securities with shorter durations.
Futures Contracts
The Fund entered into interest rate futures contracts to manage the duration and yield curve exposure of the Fund versus the benchmark.
The use of futures contracts involves certain risks, which include: (1) imperfect correlation between the price movement of the instruments and the underlying securities, (2) inability to close out positions due to differing trading hours, or the temporary absence of a liquid market, for either the instruments or the underlying securities, or (3) an inaccurate prediction of the future direction of interest rates by Columbia.
Upon entering into a futures contract, the Fund pledges cash or securities with the broker in an amount sufficient to meet the initial margin requirement. Subsequent payments are made or received by the Fund equal to the daily change in the contract value and are recorded as variation margin receivable or payable and offset in unrealized gains or losses. The Fund recognizes a realized gain or loss when the contract is closed or expires.
Futures contracts involve, to varying degrees, risk of loss in excess of the variation margin disclosed on the Fund's Statement of Assets and Liabilities.
During the year ended October 31, 2009, the Fund entered into 47 futures contracts. The Fund did not have any open futures contracts at the end of the year.
The effect of derivative instruments on the Statement of Operations for the year ended October 31, 2009.
Amount of Realized Gain or (Loss)
on Derivatives Recognized in Income
| Risk Exposure | | Futures Contracts | |
| Interest Rate | | $ | 60,733 | | |
Note 7. Portfolio Information
For the year ended October 31, 2009, the cost of purchases and proceeds from sales of securities, excluding short-term obligations, for the Fund were $18,846,901 and $21,326,285, respectively.
Note 8. Line of Credit
The Fund and other affiliated funds participate in a $280,000,000 committed, unsecured revolving line of credit provided by State Street. The maximum amount that may be borrowed by any fund is limited to the lesser of $200,000,000 and the Fund's borrowing limit set forth in the Fund's registration statement. Borrowings are available for short-term liquidity or temporary or emergency purposes.
Effective October 15, 2009, interest is charged to each participating fund based on the fund's borrowings at a rate per annum equal to the greater of the Federal Funds Rate plus 1.25% or the overnight LIBOR Rate plus 1.25%. In addition, a commitment fee of 0.15% per annum is accrued and apportioned among the participating funds pro rata based on their relative net assets.
Prior to October 15, 2009, interest was charged to each participating fund based on the fund's borrowings at a rate per annum equal to the greater of the Federal Funds Rate plus 0.50% or the overnight LIBOR Rate plus 0.50%. In addition, an annual operations agency fee of $20,000, an amendment fee of 0.02% and a commitment fee of 0.12% per annum were accrued and apportioned among the participating funds pro rata based on their relative net assets.
For the year ended October 31, 2009, the Fund did not borrow under these arrangements.
25
Columbia Massachusetts Tax-Exempt Fund, October 31, 2009
Note 9. Significant Risks and Contingencies
Sector Focus Risk
The Fund may focus its investments in certain sectors, subjecting it to greater risk than a fund that is less focused.
Non-Diversified Risk
The Fund is a non-diversified Fund, which generally means that it may invest a greater percentage of its total assets in the securities of fewer issuers than a "diversified" fund. This increases the risk that a change in the value of any one investment held by the Fund could affect the overall value of the Fund more than it would affect that of a diversified fund holding a greater number of investments. Accordingly, the Fund's value will likely be more volatile than the value of more diversified funds. The Fund may not operate as a non-diversified fund at all times.
Geographic Concentration Risk
The Fund had greater than 5% of its total net assets at October 31, 2009, invested in debt obligations issued by each of Massachusetts and Puerto Rico and their political subdivisions, agencies and public authorities. The Fund is more susceptible to economic and political factors adversely affecting issuers of this state's municipal securities than are municipal bond funds that are not concentrated to the same extent in these issuers.
Concentration of Credit Risk
The Fund holds investments that are insured by private insurers who guarantee the payment of principal and interest in the event of default or that are supported by a letter of credit. At October 31, 2009, private insurers who insured greater than 5% of the total net assets of the Fund were as follows:
| Insurer | | % of Total
Net Assets | |
| National Public Finance Guarantee Corp. | | | 14.7 | % | |
| Ambac Assurance Corp. | | | 8.9 | | |
| Financial Guaranty Insurance Co. | | | 8.0 | | |
| Financial Security Assurance, Inc. | | | 7.4 | | |
At November 25, 2009, National Public Finance Guarantee Corp., Ambac Assurance Corp., Financial Guaranty Insurance Co., and Financial Security Assurance, Inc. were rated by Standard & Poor's A, CC, non rated and AAA, respectively.
Tax Development Risk
The Fund purchases municipal securities whose interest, in the opinion of bond counsel, is free from federal income tax. There is no assurance that the Internal Revenue Service (IRS) will agree with this opinion. In the event the IRS determines that an issuer does not comply with relevant tax requirements, interest payments from a security could become federally taxable, possibly retroactively to the date the security was issued. As a shareholder of the Fund, you may be required to file an amended tax return as a result.
Legal Proceedings
Columbia Management Advisors, LLC and Columbia Management Distributors, Inc. (collectively, the "Columbia Group") are subject to a settlement agreement with the New York Attorney General ("NYAG") (the "NYAG Settlement") and a settlement order with the SEC (the "SEC Order") on matters relating to mutual fund trading, each dated February 9, 2005. Under the terms of the SEC Order, the Columbia Group (or predecessor entities) agreed, among other things, to: pay disgorgement and civil money penalties collectively totaling $140 million; cease and desist from violations of the antifraud provisions and certain other provisions of the federal securities laws; maintain certain compliance and ethics oversight structures; and retain an independent consultant to review the Columbia Group's applicable supervisory, compliance, control and other policies and procedures. The NYAG Settlement, among other things, requires Columbia Management Advis ors, LLC and its affiliates to reduce management fees for certain funds in the Columbia family of mutual funds in a projected total of $160 million over five years through November 30, 2009 and to make certain disclosures to investors relating to expenses. In connection with the Columbia Group providing services to the Columbia Funds, the Columbia Funds have voluntarily undertaken to implement certain governance measures designed to maintain the independence of their boards of trustees and certain special consulting and compliance measures.
26
Columbia Massachusetts Tax-Exempt Fund, October 31, 2009
Pursuant to the SEC Order and related procedures, the $140 million in settlement amounts described above has been substantially distributed in accordance with a distribution plan that was developed by an independent distribution consultant and approved by the SEC on April 6, 2007.
In connection with the events described above, various parties have filed suit against certain funds, the Trustees of the Columbia Funds, FleetBoston Financial Corporation and its affiliated entities and/or Bank of America and its affiliated entities.
On February 20, 2004, the Judicial Panel on Multidistrict Litigation transferred these cases and cases against other mutual fund companies based on similar allegations to the United States District Court in Maryland for consolidated or coordinated pretrial proceedings (the "MDL"). Subsequently, additional related cases were transferred to the MDL. On September 29, 2004, the plaintiffs in the MDL filed amended and consolidated complaints. One of these amended complaints is a putative class action that includes claims under the federal securities laws and state common law, and that names Columbia Management Advisors, Inc. (which has since merged into Banc of America Capital Management, LLC (now named Columbia Management Advisors, LLC)) ("Columbia"), Columbia Funds Distributor, Inc. (now named Columbia Management Distributors, Inc.) (the "Distributor"), the Trustees of the Columbia Funds, Bank of America Corporation and others as d efendants. Another of the amended complaints is a derivative action purportedly on behalf of the Columbia Funds that asserts claims under federal securities laws and state common law.
On February 25, 2005, Columbia and other defendants filed motions to dismiss the claims in the pending cases. On March 1, 2006, for reasons stated in the court's memoranda dated November 3, 2005, the United States District Court for the District of Maryland granted in part and denied in part the defendants' motions to dismiss. The court dismissed all of the class action claims pending against the Columbia Funds Trusts. As to Columbia and the Distributor, the claims under the Securities Act of 1933, the claims under Sections 34(b) and 36(a) of the Investment Company Act of 1940 ("ICA") and the state law claims were dismissed. The claims under Sections 10(b) and 20(a) of the Securities Exchange Act of 1934 and claims under Section 36(b) of the ICA were not dismissed.
On March 21, 2005, a purported class action was filed in Massachusetts state court alleging that certain conduct, including market timing, entitled Class B shareholders in certain Columbia Funds to an exemption from contingent deferred sales charges upon early redemption (the "CDSC Lawsuit"). The CDSC Lawsuit was removed to federal court in Massachusetts and transferred to the MDL.
On September 14, 2007, the plaintiffs and the Columbia defendants named in the MDL, including the Columbia Funds, entered into a stipulation of settlement with respect to all Columbia-related claims in the MDL described above, including the CDSC Lawsuit. The settlement is subject to court approval.
27
Report of Independent Registered Public Accounting Firm
To the Trustees of Columbia Funds Series Trust I and the Shareholders of Columbia Massachusetts Tax-Exempt Fund:
In our opinion, the accompanying statement of assets and liabilities, including the investment portfolio, and the related statements of operations and of changes in net assets and the financial highlights present fairly, in all material respects, the financial position of Columbia Massachusetts Tax-Exempt Fund (the "Fund") (a series of Columbia Funds Series Trust I) at October 31, 2009, the results of its operations for the year then ended, the changes in its net assets for each of the two years in the period then ended and the financial highlights for each of the five years in the period then ended, in conformity with accounting principles generally accepted in the United States of America. These financial statements and financial highlights (hereafter referred to as "financial statements") are the responsibility of the Fund's management. Our responsibility is to express an opinion on these financial statements based on our aud its. We conducted our audits of these financial statements in accordance with the standards of the Public Company Accounting Oversight Board (United States). Those standards require that we plan and perform the audit to obtain reasonable assurance about whether the financial statements are free of material misstatement. An audit includes examining, on a test basis, evidence supporting the amounts and disclosures in the financial statements, assessing the accounting principles used and significant estimates made by management, and evaluating the overall financial statement presentation. We believe that our audits, which included confirmation of securities at October 31, 2009 by correspondence with the custodian and brokers, provide a reasonable basis for our opinion.
PricewaterhouseCoopers LLP
Boston, Massachusetts
December 18, 2009
28
Federal Income Tax Information (Unaudited)
The Fund hereby designates as a capital gain dividend with respect to the fiscal year ended October 31, 2009, $717,249, or, if subsequently determined to be different, the net capital gain of such year.
For the fiscal year ended October 31, 2009, 100.00% of the distributions from net investment income of the Fund qualifies as exempt interest dividends for federal income tax purposes. A portion of the income may be subject to federal alternative minimum tax.
The Fund will notify shareholders in January 2010 of amounts for use in preparing 2009 income tax returns.
29
Fund Governance
The Trustees serve terms of indefinite duration. The names, addresses and ages of the Trustees and officers of the Funds in the Columbia Funds Series Trust I, the year each was first elected or appointed to office, their principal business occupations during at least the last five years, the number of Funds overseen by each Trustee and other directorships they hold are shown below. Each officer listed below serves as an officer of each Fund in the Columbia Funds Complex.
Independent Trustees
Name, Address and Year of Birth,
Position with Funds, Year First
Elected or Appointed to Office | | Principal Occupation(s) During Past Five Years, Number of Funds in the Columbia
Funds Complex Overseen by Trustee, Other Directorships Held
| |
| John D. Collins (Born 1938) | |
|
c/o Columbia Management
Advisors, LLC
One Financial Center
Boston, MA 02111
Trustee (since 2007) | | Retired. Consultant, KPMG, LLP (accounting and tax firm) from July 1999 to June 2000; Partner, KPMG, LLP from March 1962 to June 1999. Oversees 66, Mrs. Fields Famous Brands LLC (consumer products); Suburban Propane Partners, L.P.; and Montpelier Re (insurance underwriting firm) | |
|
| Rodman L. Drake (Born 1943) | |
|
c/o Columbia Management
Advisors, LLC
One Financial Center
Boston, MA 02111
Trustee (since 2007)
and Chairman of the Board
(since 2009) | | Co-Founder of Baringo Capital LLC (private equity) since 2002; President, Continuation Investments Group, Inc. from 1997 to 2001. Oversees 66, Jackson Hewitt Tax Service Inc. (tax preparation services); Crystal Capital River Inc. (real estate investment trust); Student Loan Corporation (student loan provider); Celgene Corporation (global biotechnology company); and The Helios Funds (exchange-traded funds) | |
|
| Douglas A. Hacker (Born 1955) | |
|
c/o Columbia Management
Advisors, LLC
One Financial Center
Boston, MA 02111
Trustee (since 1996) | | Independent business executive since May 2006; Executive Vice President—Strategy of United Airlines (airline) from December 2002 to May 2006; President of UAL Loyalty Services (airline marketing company) from September 2001 to December 2002; Executive Vice President and Chief Financial Officer of United Airlines from July 1999 to September 2001. Oversees 66, Nash Finch Company (food distributor); Aircastle Limited (aircraft leasing) | |
|
| Janet Langford Kelly (Born 1957) | |
|
c/o Columbia Management
Advisors, LLC
One Financial Center
Boston, MA 02111
Trustee (since 1996) | | Senior Vice President, General Counsel and Corporate Secretary, ConocoPhillips (integrated energy company) since September 2007; Deputy General Counsel—Corporate Legal Services, ConocoPhillips from August 2006 to August 2007; Partner, Zelle, Hofmann, Voelbel, Mason&Gette LLP (law firm) from March 2005 to July 2006; Adjunct Professor of Law, Northwestern University, from September 2004 to June 2006; Director, UAL Corporation (airline) from February 2006 to July 2006; Oversees 66, None | |
|
| Charles R. Nelson (Born 1942) | |
|
c/o Columbia Management
Advisors, LLC
One Financial Center
Boston, MA 02111
Trustee (since 1981) | | Professor of Economics, University of Washington, since January 1976; Ford and Louisa Van Voorhis Professor of Political Economy, University of Washington, since September 1993; Adjunct Professor of Statistics, University of Washington, since September 1980; Associate Editor, Journal of Money Credit and Banking, 1993-2008 Consultant on econometric and statistical matters. Oversees 66, None | |
|
30
Fund Governance (continued)
Independent Trustees (continued)
Name, Address and Year of Birth,
Position with Funds, Year First
Elected or Appointed to Office | | Principal Occupation(s) During Past Five Years, Number of Funds in the Columbia
Funds Complex Overseen by Trustee, Other Directorships Held
| |
| John J. Neuhauser (Born 1943) | |
|
c/o Columbia Management
Advisors, LLC
One Financial Center
Boston, MA 02111
Trustee (since 1985) | | President, Saint Michael's College, since August 2007; University Professor, Boston College from November 2005 to August 2007; Academic Vice President and Dean of Faculties, Boston College from August 1999 to October 2005. Oversees 66, Liberty All-Star Equity Fund and Liberty All-Star Growth Fund, Inc. (closed-end funds) | |
|
| Jonathan Piel (Born 1938) | |
|
c/o Columbia Management
Advisors, LLC
One Financial Center
Boston, MA 02111
Trustee (since 2007) | | Cable television producer and website designer; The Editor, Scientific American from 1984 to 1994; Vice President, Scientific American, Inc., from 1984 to 1994; Member, Advisory Board, Stone Age Institute, Bloomington, Indiana (research institute that explores the effect of technology on human evolution); Member, Board of Directors of the National Institute of Social Sciences, New York City; Member, Board of Trustees of the William Alanson White Institute, New York City (institution for training psychoanalysts); and Member, Advisory Board, Mount Sinai Children's Environmental Health Center, New York. Oversees 66, None | |
|
| Patrick J. Simpson (Born 1944) | |
|
c/o Columbia Management
Advisors, LLC
One Financial Center
Boston, MA 02111
Trustee (since 2000) | | Partner, Perkins Coie LLP (law firm). Oversees 66, None | |
|
| Thomas C. Theobald (Born 1937) | |
|
c/o Columbia Management
Advisors, LLC
One Financial Center
Boston, MA 02111
Trustee (since 1996) | | Partner and Senior Advisor, Chicago Growth Partners (private equity investing) since September 2004; Managing Director, William Blair Capital Partners (private equity investing) from September 1994 to September 2004. Oversees 66, Anixter International (network support equipment distributor); Ventas, Inc. (real estate investment trust); Jones Lang LaSalle (real estate management services); Ambac Financial Group (financial guaranty insurance) | |
|
| Anne-Lee Verville (Born 1945) | |
|
c/o Columbia Management
Advisors, LLC
One Financial Center
Boston, MA 02111
Trustee (since 1998) | | Retired since 1997 (formerly General Manager—Global Education Industry (from 1994 to 1997), President-Application Systems Division (from 1991 to 1994), Chief Financial Officer—US Marketing&Services (from 1988 to 1991), and Chief Information Officer (from 1987 to 1988), IBM Corporation (computer and technology)). Oversees 66, None | |
|
31
Fund Governance (continued)
Interested Trustee
Name, Address and Year of Birth,
Position with Funds, Year First
Elected or Appointed to Office | | Principal Occupation(s) During Past Five Years, Number of Funds in the Columbia
Funds Complex Overseen by Trustee, Other Directorships Held
| |
| William E. Mayer1 (Born 1940) | |
|
c/o Columbia Management
Advisors, LLC
One Financial Center
Boston, MA 02111
Trustee (since 1994) | | Partner, Park Avenue Equity Partners (private equity) since February 1999; Dean and Professor, College of Business, University of Maryland from 1992 to 1997. Oversees 66, Lee Enterprises (print media),WRHambrecht + Co. (financial service provider); BlackRock Kelso Capital Corporation (investment company) | |
|
1 The Funds currently treat Mr. Mayer as an "interested person" (as defined in the Investment Company Act of 1940) by reason of his affiliation with WR Hambrecht + Co., a registered broker/dealer that may execute portfolio transactions for or engage in principal transactions with the Funds or other funds or accounts advised/managed by the Advisor or other Bank of America affiliates.
The Statement of Additional Information includes additional information about the Trustees of the Funds and is available, without charge, upon request by calling 1-800-345-6611.
Officers
Name, Address and Year of Birth,
Position with Funds, Year First
Elected or Appointed to Office | | Principal Occupation(s) During Past Five Years
| |
| J. Kevin Connaughton (Born 1964) | |
|
One Financial Center
Boston, MA 02111
President (since 2009) | | Managing Director of Columbia Management Advisors, LLC since December 2004; Senior Vice President and Chief Financial Officer—Columbia Funds, from June 2008 to January 2009; Treasurer—Columbia Funds, from October 2003 to May 2008; Treasurer—the Liberty Funds, Stein Roe Funds and Liberty All-Star Funds, December 2000-December 2006; Senior Vice President—Columbia Management Advisors, LLC, from April 2003 to December 2004; President—Columbia Funds, Liberty Funds and Stein Roe Funds, February 2004 to October 2004; Treasurer—Galaxy Funds, September 2002 to December 2005; Treasurer, December 2002 to December 2004, and President, February 2004 to December 2004—Columbia Management Multi-Strategy Hedge Fund, LLC; and a senior officer of various other Bank of America-affiliated entities, including other registered and unregistered funds. | |
|
| James R. Bordewick, Jr. (Born 1959) | |
|
One Financial Center
Boston, MA 02111
Senior Vice President, Secretary
and Chief Legal Officer (since 2006) | | Associate General Counsel, Bank of America since April 2005; Senior Vice President and Associate General Counsel, MFS Investment Management (investment management) prior to April 2005. | |
|
| Linda J. Wondrack (Born 1964) | |
|
One Financial Center
Boston, MA 02111
Senior Vice President and
Chief Compliance Officer
(since 2007) | | Director (Columbia Management Group LLC and Investment Product Group Compliance), Bank of America since June 2005; Director of Corporate Compliance and Conflicts Officer, MFS Investment Management (investment management), August 2004 to May 2005; Managing Director, Deutsche Asset Management (investment management) prior to August 2004. | |
|
32
Fund Governance (continued)
Officers (continued)
Name, Address and Year of Birth,
Position with Funds, Year First
Elected or Appointed to Office | | Principal Occupation(s) During Past Five Years
| |
| Michael G. Clarke (Born 1969) | |
|
One Financial Center
Boston, MA 02111
Senior Vice President and
Chief Financial Officer
(since 2009) | | Director of Fund Administration of the Advisor since January 2006; Managing Director of the Advisor September 2004 to December 2005; Vice President Fund Administration June 2002 to September 2004. | |
|
| Jeffrey R. Coleman (Born 1969) | |
|
One Financial Center
Boston, MA 02111
Deputy Treasurer (since 2006) | | Director of Fund Administration of the Advisor since January 2006; Fund Controller of the Advisor from October 2004 to January 2006; Vice President of CDC IXIS Asset Management Services, Inc. (investment management) from August 2000 to September 2004. | |
|
| Joseph F. DiMaria (Born 1968) | |
|
One Financial Center
Boston, MA 02111
Chief Accounting Officer and
Treasurer (since 2009) | | Director of Fund Administration of the Advisor since January 2006; Head of Tax/Compliance and Assistant Treasurer of the Advisor from November 2004 to December 2005; Director of Trustee Administration (Sarbanes-Oxley) of the Advisor from May 2003 to October 2004. | |
|
| Julian Quero (Born 1967) | |
|
One Financial Center
Boston, MA 02111
Deputy Treasurer (since 2008) | | Senior Tax Manager of the Advisor since August 2006; Senior Compliance Manager of the Advisor from April 2002 to August 2006. | |
|
| Barry S. Vallan (Born 1969) | |
|
One Financial Center
Boston, MA 02111
Controller (since 2006) | | Vice President—Fund Treasury of the Advisor since October 2004; Vice President—Trustee Reporting of the Advisor from April 2002 to October 2004. | |
|
| Stephen T. Welsh (Born 1957) | |
|
One Financial Center
Boston, MA 02111
Vice President (since 1996) | | President, Columbia Management Services, Inc. since July 2004; Senior Vice President and Controller, Columbia Management Services, Inc. prior to July 2004. | |
|
33
Board Consideration and Approval of Advisory Agreements
The Advisory Fees and Expenses Committee of the Board of Trustees meets several times annually to review the advisory agreements (collectively, the "Agreements") of the funds for which the Trustees serve as trustees (each a "fund") and to determine whether to recommend that the full Board approve the continuation of the Agreements for an additional one-year period. After the Committee has made its recommendation, the full Board, including the Independent Trustees, determines whether to approve the continuation of the Agreements. In addition, the full Board, including the Independent Trustees, considers matters bearing on the Agreements at most of its other meetings throughout the year and meets regularly with senior management of the funds and Columbia, the funds' investment adviser, including the senior manager of each investment area within Columbia. Through the Board's Investment Oversight Committees, Trustees also meet with selected fund portfolio managers, research analysts and traders at various times throughout the year.
The Trustees receive and review all materials that they, their legal counsel or Columbia believe to be reasonably necessary for the Trustees to evaluate the Agreements and to determine whether to approve the continuation of the Agreements. Those materials generally include, among other items, (i) information on the investment performance of each fund relative to the performance of peer groups of mutual funds and the fund's performance benchmarks, and additional information assessing performance on a risk-adjusted basis, (ii) information on each fund's advisory fees and other expenses, including information comparing the fund's expenses to those of peer groups of mutual funds and information about any applicable expense caps and fee "breakpoints," (iii) information about the profitability of the Agreements to Columbia, including potential "fall-out" or ancillary benefits that Columbia and its affiliates may receive as a result of their relationships with the funds and (iv) information obtained through Columbia's response to a questionnaire prepared at the request of the Trustees by counsel to the funds and independent legal counsel to the Independent Trustees. The Trustees also consider other information such as (v) Columbia's financial results and financial condition, (vi) each fund's investment objective and strategies and the size, education and experience of Columbia's investment staffs and their use of technology, external research and trading cost measurement tools, (vii) the allocation of the funds' brokerage and the use of "soft" commission dollars to pay for research products and services, (viii) Columbia's resources devoted to, and its record of compliance with, the funds' investment policies and restrictions, policies on personal securities transactions and other compliance policies and legal and regulatory requirements, (ix) Columbia's response to va rious legal and regulatory proceedings since 2003 and to the recent period of volatility in the securities markets and (x) the economic outlook generally and for the mutual fund industry in particular. In addition, the Advisory Fees and Expenses Committee confers with the funds' independent fee consultant and reviews materials relating to the funds' relationships with Columbia provided by the independent fee consultant. Throughout the process, the Trustees have the opportunity to ask questions of and to request additional materials from Columbia and to consult with the independent fee consultant and independent legal counsel to the Independent Trustees.
The Board of Trustees most recently approved the continuation of the Agreements at its October, 2009 meeting, following meetings of the Advisory Fees and Expenses Committee held in December, 2008 and February, May, June, August, September and October, 2009. In considering whether to approve the continuation of the Agreements, the Trustees, including the Independent Trustees, did not identify any single factor as determinative, and each weighed various factors as he or she deemed appropriate. The Trustees considered the following matters in connection with their approval of the continuation of the Agreements:
The nature, extent and quality of the services provided to the funds under the Agreements. The Trustees considered the nature, extent and quality of the services provided by Columbia and its affiliates to the funds and the resources dedicated to the funds by Columbia and its affiliates. Among other things, the Trustees considered (i) Columbia's ability (including its personnel and other resources, compensation programs for personnel involved in fund management, reputation and other attributes) to attract, motivate and retain highly qualified research, advisory and supervisory investment professionals; (ii) the portfolio management services provided by those investment professionals; and (iii) the trade execution services provided on behalf of the funds. For each fund, the Trustees also considered the benefits to shareholders of investing in a mutual f und that is part of a family of funds offering exposure to a variety of asset classes
34
and investment disciplines and providing a variety of fund and shareholder services. After reviewing those and related factors, the Trustees concluded, within the context of their overall conclusions regarding each of the Agreements, that the nature, extent and quality of services provided supported the continuation of the Agreements.
Investment performance of the funds and Columbia. The Trustees reviewed information about the performance of each fund over various time periods, including information prepared by an independent third-party data provider that compared the performance of each fund to the performance of peer groups of mutual funds and performance benchmarks. The Trustees also reviewed a description of the third party's methodology for identifying each fund's peer group for purposes of performance and expense comparisons. The Trustees also considered additional information that the Advisory Fees and Expenses Committee requested from Columbia relating to funds that presented relatively weaker performance and/or relatively higher fees or expenses. In the case of each fund whose performance lagged that of a relevant peer group for certain (although not necessarily all) peri ods, the Trustees concluded that other factors relevant to performance were sufficient, in light of other considerations, to warrant continuation of the fund's Agreements. Those factors varied from fund to fund, but included one or more of the following: (i) that the fund's performance, although lagging in certain recent periods, was stronger over the longer term; (ii) that the underperformance was attributable, to a significant extent, to investment decisions that were reasonable and consistent with the fund's investment strategy and policies and that the fund was performing within a reasonable range of expectations, given those investment decisions, market conditions and the fund's investment strategy; (iii) that the fund's performance was competitive when compared to other relevant performance benchmarks or peer groups; (iv) that Columbia had taken or was taking steps designed to help improve the fund's investment performance, including, but not limited to, replacing portfolio managers or modifying invest ment strategies; and (v) that Columbia proposed to waive advisory fees or cap the expenses of the fund.
The Trustees noted that, through April 30, 2009, Columbia Massachusetts Tax-Exempt Fund's performance was in the first quintile (where the best performance would be in the first quintile) for the one-, three-, five- and ten-year periods, of the peer group selected by an independent third-party data provider for purposes of performance comparisons.
The Trustees also considered Columbia's performance and reputation generally, the funds' performance as a fund family generally, and Columbia's historical responsiveness to Trustee concerns about performance and Columbia's willingness to take steps intended to improve performance. After reviewing those and related factors, the Trustees concluded, within the context of their overall conclusions regarding each of the Agreements, that the performance of each fund and Columbia was sufficient, in light of other considerations, to warrant the continuation of the Agreement(s) pertaining to that fund.
The costs of the services provided and profits realized by Columbia and its affiliates from their relationships with the funds. The Trustees considered the fees charged to the funds for advisory services as well as the total expense levels of the funds. That information included comparisons (provided by management and by an independent third-party data provider) of each fund's advisory fees and total expense levels to those of the fund's peer groups and information about the advisory fees charged by Columbia to comparable institutional accounts. In considering the fees charged to those accounts, the Trustees took into account, among other things, management's representations about the differences between managing mutual funds as compared to other types of accounts, including differences in the services provided, differences in the risk profile of such business for Columbia, and the additional resources required to manage mutual funds effectively. In evaluating each fund's advisory fees, the Trustees also took into account the demands, complexity and quality of the investment management of the fund. The Trustees considered existing advisory fee breakpoints, and Columbia's use of advisory fee waivers and expense caps, which benefited a number of the funds. The Trustees also noted management's stated justification for the fees charged to the funds, which included information about the investment performance of the funds and the services provided to the funds.
The Trustees considered that Columbia Massachusetts Tax-Exempt Fund's total expenses were in the third quintile and actual management fees were in the first quintile (where the lowest fees and expenses would be in the first quintile) of
35
the peer group selected by an independent third-party data provider for purposes of expense comparisons.
The Trustees also considered the compensation directly or indirectly received by Columbia and its affiliates from their relationships with the funds. The Trustees reviewed information provided by management as to the profitability to Columbia and its affiliates of their relationships with each fund, and information about the allocation of expenses used to calculate profitability. When reviewing profitability, the Trustees also considered court cases in which adviser profitability was an issue in whole or in part, the performance of the relevant funds, the expense level of each fund, and whether Columbia had implemented breakpoints and/or expense caps with respect to the fund.
After reviewing those and related factors, the Trustees concluded, within the context of their overall conclusions regarding each of the Agreements, that the advisory fees charged to each fund, and the related profitability to Columbia and its affiliates of their relationships with the fund, supported the continuation of the Agreement(s) pertaining to that fund.
Economies of Scale. The Trustees considered the existence of any economies of scale in the provision by Columbia of services to each fund, to groups of related funds, and to Columbia's investment advisory clients as a whole and whether those economies were shared with the funds through breakpoints in the investment advisory fees or other means, such as fee waivers/expense reductions and additional investments by Columbia in investment, trading and compliance resources. The Trustees noted that many of the funds benefited from breakpoints, fee waivers/expense caps, or both. In considering those issues, the Trustees also took note of the costs of the services provided (both on an absolute and a relative basis) and the profitability to Columbia and its affiliates of their relationships with the funds, as discussed above.
After reviewing those and related factors, the Trustees concluded, within the context of their overall conclusions regarding each of the Agreements, that the extent to which economies of scale were shared with the funds supported the continuation of the Agreements.
Other Factors. The Trustees also considered other factors, which included but were not limited to the following:
n the extent to which each fund had operated in accordance with its investment objective and investment restrictions, the nature and scope of the compliance programs of the funds and Columbia and the compliance-related resources that Columbia and its affiliates were providing to the funds;
n the nature, quality, cost and extent of administrative and shareholder services overseen and performed by Columbia and its affiliates, both under the Agreements and under separate agreements for the provision of transfer agency and administrative services;
n so-called "fall-out benefits" to Columbia and its affiliates, such as the engagement of its affiliates to provide distribution, brokerage and transfer agency services to the funds, and the benefits of research made available to Columbia by reason of brokerage commissions generated by the funds' securities transactions, as well as possible conflicts of interest associated with those fall-out and other benefits, and the reporting, disclosure and other processes in place to disclose and monitor those possible conflicts of interest; and
n the report provided by the funds' independent fee consultant, which included information about and analysis of the funds' fees, expenses and performance.
Based on their evaluation of all factors that they deemed to be material, including those factors described above, and assisted by the advice of independent counsel and the independent fee consultant, the Trustees, including the Independent Trustees, approved the continuance of each of the Agreements through October 31, 2010.
36
Summary of Management Fee Evaluation by
Independent Fee Consultant
EXCERPTS FROM: REPORT OF INDEPENDENT FEE CONSULTANT TO THE FUNDS SUPERVISED BY THE COLUMBIA ATLANTIC BOARD
Prepared Pursuant to the February 9, 2005
Assurance of Discontinuance among the
Office of Attorney General of New York State,
Columbia Management Advisors, LLC, and
Columbia Management Distributors, Inc.
November 6, 2009
I. Overview
On February 9, 2005, Columbia Management Advisors, LLC ("CMA") and Columbia Management Distributors, Inc.1 ("CMDI") agreed to the New York Attorney General's Assurance of Discontinuance ("AOD"). Among other things, the AOD stipulates that CMA may manage or advise a Columbia Fund ("Columbia Fund" and, together with some or all of such funds, the "Columbia Funds") only if the Independent Members of the Columbia Fund's Board of Trustees appoint a Senior Officer or retain an Independent Fee Consultant ("IFC") who is to manage the process by which proposed management fees are negotiated. The AOD further stipulates that the Senior Officer or IFC is to prepare a written annual evaluation of the fee negotiation process.
With effect from January 1, 2007, the Independent Members of the Board of Trustees for certain Columbia Funds known collectively as the "Atlantic Funds" (together with the other members of that Board, the "Trustees") retained me as IFC for the Atlantic Funds.2 In this capacity, I have prepared the fifth annual written evaluation of the fee negotiation process. As was the case with the 2007 and 2008 reports, my immediate predecessor as IFC, John Rea, provided invaluable assistance in the preparation of this year's report.
A. Role of the Independent Fee Consultant
The AOD charges the IFC with "managing the process by which proposed management fees...to be charged the Columbia Fund are negotiated so that they are negotiated in a manner which is at arms' length and reasonable and consistent with this Assurance of Discontinuance." The AOD also provides that CMA "may manage or advise a Columbia Fund only if the reasonableness of the proposed management fees is determined by the Board of Trustees...using...an annual independent written evaluation prepared by or under the direction of...the Independent Fee Consultant." Therefore, the AOD makes clear that the IFC does not supplant the Trustees in negotiating management fees with CMA, nor does the IFC substitute his or her judgment for that of the Trustees with respect to the reasonableness of proposed fees or any other matter that is committed to the business judgment of the Trustees.
B. Elements Involved in Managing the Fee Negotiation Process
In preparing the report required by the AOD, the IFC must consider at least the following six factors set forth in the AOD:
1. The nature and quality of CMA's services, including the Fund's performance;
2. Management fees (including any components thereof) charged by other mutual fund companies for like services;
3. Possible economies of scale as the Fund grows larger;
4. Management fees (including any components thereof) charged to institutional and other clients of CMA for like services;
5. Costs to CMA and its affiliates of supplying services pursuant to the management fee agreements, excluding any intra-corporate profit; and
6. Profit margins of CMA and its affiliates from supplying such services.
C. Organization of the Annual Evaluation
This report, like last year's, focuses on the six factors and contains a section for each factor except that CMA's costs and profits from managing the Funds are treated in a single section. In addition to a discussion of these factors, the report offers recommendations to improve the fee review process in future years. A review of the status of recommendations made in the 2008 Report is being provided separately with the materials for the October meeting.
1 CMA and CMDI are subsidiaries of Columbia Management Group, LLC ("CMG"), and are the successors to the entities named in the AOD.
2 I have no material relationship with Bank of America, CMG or any of its affiliates, aside from serving as IFC, and I am aware of no material relationship with any of their affiliates. I retained John Rea, an independent economic consultant, to assist me with this report.
Unless otherwise stated or required by the context, this report covers only the Atlantic Funds, which are also referred as the "Funds."
37
II. Summary of Findings
A. General
1. Based upon my examination of the information supplied by CMG in the light of the six factors set forth in the AOD, I conclude that the Trustees have the relevant information necessary to evaluate the reasonableness of the proposed management fees for each Atlantic Fund.
2 In my view, the process by which the proposed management fees of the Funds have been negotiated in 2009 thus far has been, to the extent practicable, at arms' length and reasonable and consistent with the AOD.
B. Nature and Quality of Services, Including Performance
3. The performance of the Funds has been relatively strong in recent years, although the one-year record was weaker than longer-term records. Based upon 1-, 3-, 5-, and 10-year returns through April 30, 2009, at least half of all the Funds were in the first and second performance quintiles in each of the three longest performance periods; for the one-year period, 40% of the Funds were in the top two quintiles. No more than 13% of the Funds were in the fifth quintile in any one performance period. Domestic equity, quantitative equity, and taxable fixed-income Funds were the strongest performers in 2009, while most foreign equity Funds lagged behind their competitors.
4. Performance rankings were similar in 2008 and 2009: the 1- and 3-year rankings declined slightly over the previous year, while the 5-year rankings improved modestly. Year over year, for the 1- and 3-year periods, the performance of equity Funds, both domestic and international, declined, while that of fixed-income Funds improved. Between three-fifths to two-thirds of the Funds changed quintile rankings in 2009 in the 1-, 3-, and 5-year performance periods.
5. The performance of the domestic equity Funds against their benchmarks was good for the 3- and 5-year performance periods. In contrast, gross returns of international equity and fixed-income Funds typically fell short of their benchmarks. The performance of equity Funds against their benchmarks was highly correlated to performance versus their peers; no such correlation was observed for fixed-income Funds.
6. The Atlantic equity Funds' overall performance adjusted for risk was solid. Based upon 3-year returns, nearly 57% of the equity Funds had a combination of risk-adjusted and unadjusted returns that placed them in the top half of their performance universes. About one quarter of the fixed-income Funds posted high returns and low risk relative to comparable funds. Just over half of the fixed-income Funds, primarily tax-exempt Funds, took on more risk than the typical fund in their performance universes.
7. The industry-standard procedure used by Lipper that includes all share classes in the performance universe tends to bias a Fund's ranking upward within that universe. The bias occurs because either no-12b-1 fee or low-12b-1 fee share classes of the Atlantic Funds are compared with funds in performance universes that include all share classes of multi-class funds with 12b-1 fees of up to 100 basis points. Correcting this bias by limiting the performance universe to classes of comparable funds with low or no 12b-1 fees (a "filtered universe") lowers the relative performance for the Funds, but not to a material extent. The filtering process, however, did identify one Fund for further review that had not been identified as a review fund using unfiltered universes. Conversely, two Funds that had been identified as review funds in the unfiltered universe lost that status in filtered universes.
8. A small number of Funds have consistently underperformed over the past five years. The exact number depends on the criteria used to evaluate longer-term performance. For example, only three Funds had below-median performance in each 1- and 3-year period from 2005 to 2009.
9. The services performed by CMG professionals beyond portfolio management, such as compliance, legal, information technology, risk management, finance, and fund administration, are critical to the success of the Funds and appear to be of high quality.
C. Management Fees Charged by Other Mutual Fund Companies
10. The Funds' management fees and total expenses are generally low relative to those of their peers, with over half
38
of the Funds in the most favorable two quintiles. Only 26% of the Funds ranked in the two most expensive quintiles for actual management fees, and 18% in those quintiles for total expenses. Two Funds are in the fifth quintile for total expenses; four Funds are in the fifth quintile for actual management fees.
11. The highest concentration of low-expense Funds is found among the foreign equity Funds. The 12 former Excelsior Funds have relatively high fees and expenses, with two-thirds ranking in either the fourth or fifth quintiles for actual management fees. The higher actual management fee rankings of certain former Excelsior Funds are due in part to fee schedules that are higher than standard Columbia Fund fee schedules at current asset levels.
12. The distribution of total expense and management fee rankings has improved over the prior two years. The implementation of the voluntary standardized cap system has contributed significantly to the improved rankings in 2009.
13. The management fees of the Atlantic Funds are generally in line with those of Columbia Funds supervised by the Nations Board of Trustees (the "Nations Funds"). To the extent that Atlantic Funds have higher average fees in certain investment categories than Nations Funds, the difference reflects either differences in asset size, different fee structures of the former Excelsior Funds, or special circumstances of the Funds included in the investment categories.
D. Trustees' Advisory Contract Review Process
14. The Trustees' evaluation process identified 16 Funds in 2009 for further review based upon long-standing criteria relating to their relative performance or expenses or both. When compared in filtered universes, one additional Fund met the criteria for further review. CMG provided further information about each of those Funds to assist the Trustees in their evaluation.
E. Potential Economies of Scale
15. CMG presented to the Trustees its analysis of the sources and sharing of potential economies of scale. CMG views economies of scale as arising at the complex level and would regard estimates of scale economies for individual funds as unreliable. In its analysis, CMG did not identify specific sources of economies of scale or provide any estimates of any economies of scale that might arise from future asset growth. CMG's analysis included measures taken by the Trustees and CMG that seek to share any potential economies of scale through breakpoints in management fee schedules, the establishment of expense limits for each Fund, enhanced shareholder services, fund mergers, and operational consolidation.
16. An examination of the contractual fee schedules for five Atlantic Funds shows that those with standard fee structures are generally in line with those of their competitors. The fee schedules of the former Excelsior Funds, however, have high initial fees relative to competitors but otherwise have comparable breakpoint structures.
F. Management Fees Charged to Institutional Clients
17. CMG has provided Trustees with comparisons of mutual fund management fees and institutional fees based upon standardized fee schedules and upon actual fees. The results show that, consistent with industry practice, actual and scheduled institutional fees are generally lower than the Funds' management fees. CMG provided additional data this year demonstrating that at small asset levels, the effective fee of certain Funds may be equal to or less than institutional fee levels at those asset levels, due to the effect of expense limits on small funds with high gross expenses. CMG also analyzed the differences between the services provided and risks borne on the one hand by a manager of mutual funds and on the other by institutional advisers, and suggested that these differences should be kept in mind when Trustees review the reasonableness of the Funds' management fees.
G. Revenues, Expenses, and Profits
18. The activity-based cost allocation methodology employed by CMG to allocate costs, both direct and indirect, for purposes of calculating Fund profitability is thoughtful and detailed. This year, CMG further refined the technique by allocating additional indirect expenses on an activity basis.
39
19. The materials provided on CMG's revenues and expenses with respect to the Funds and the methodology underlying their construction form a sufficient basis for Trustees to evaluate the expenses of and profitability to CMG arising out of its relationships with the Funds.
20. CMG provided a firm-wide pro forma 2009 income statement demonstrating the effect of market events beginning in the fourth quarter of 2008 on its revenues and profitability to provide an additional perspective on calendar 2008 profitability data. In particular, 2008 revenues reflected the higher market prices prevailing during the first three quarters of that year, while expenses dropped due to cost cutting in the wake of the market downturn late in 2008. The continuing effects of this downturn are expected to produce a significant decline in profitability this year.
21. In 2008, CMG's pre-tax post-distribution margin on the Atlantic Fund complex was above industry medians, based on the limited data available for publicly held mutual fund managers. However, as is to be expected in a large fund complex, some Atlantic Funds had relatively high pre-tax profit margins in 2008, when calculated solely with respect to management revenues and expenses, while other Atlantic Funds operated at a loss. There is a positive relationship between Fund size and profitability to CMG, with smaller Funds generally operating at a loss to CMG.
22. CMG pays a fixed percentage of its management fee revenues to an affiliate, U.S. Trust, Bank of America Private Wealth Management, with respect to assets of its clients invested in Atlantic Funds to compensate it for services it performs with respect to those client assets and for the effect of state law limitations on affiliates charging multiple fees. Based on our analysis of the services provided by this affiliate, we have concluded that all payments other than those for sub-transfer agent or sub-accounting services should be treated as a distribution expense.
III. Recommendations
1) Criteria for review. The Trustees may wish to consider modifying the criteria for identifying a Fund for further review (a "Review Fund") to include criteria that focus exclusively on performance. The Trustees' supplementary data request included one such criterion. They may also wish to consider whether it would be useful to apply CMG's own internal monitoring standards for Fund performance to the contract review process, or whether such criteria are more relevant to their ongoing investment oversight.
2) Presentation of Review Fund discussion. CMG should consider whether it could more systematically present in one discussion all relevant information regarding each Review Fund, which is now split into several different portions of the 15(c) materials. For any Fund that has been a Review Fund in consecutive years, CMG should address under what circumstances it could reasonably be anticipated that the Fund would lose that status.
3) Refinement of tax-exempt performance data. Certain single-state tax-exempt Funds compete in extremely small universes and are compared to a multi-state benchmark of uncertain relevance. Notwithstanding the difficulties, CMG should work to improve the reliability of the calculation of relative performance of these Funds. If that is not possible, CMG should provide guidance on how the Trustees should judge the quality of CMG's management of these Funds.
4) Development of risk metrics for asset-allocation, tax-exempt, and money market funds. CMG has developed and shared with the Trustees quantitative risk metrics comparing equity and taxable fixed-income Funds against their peers. However, reliable risk metrics have not been developed for asset-allocation, tax-exempt fixed income, and money market funds. We urge CMG to continue its efforts to provide reliable risk measures for these categories of Funds, especially in the cases of asset-allocation and money market funds, because their investors are likely to be motivated at least in part by a desire to manage risk.
5) Profitability data. For any period during which CMG is an affiliate of U.S. Trust, Bank of America Private Wealth Management, CMG should continue to present to the Trustees the profitability of each Fund, each investment style and each complex (of which Atlantic is one) calculated as follows:
a. Management-only profitability should be calculated without reference to any Private Bank expense.
b. Profitability excluding distribution (which essentially covers the management and transfer
40
agency functions) should be adjusted by removing from the expense calculation any portion of the Private Bank payment not attributable to the performance by the Private Bank of sub-transfer agency or sub-accounting functions.
c. Total profitability, including distribution: No adjustment for Private Bank expenses should be made, because all such expenses represent legitimate fund expenses to be taken into account in calculating CMG's profit margin including distribution.
d. Distribution only: This should include all Private Bank expenses other than those attributable to sub-transfer agency services.
6) Contractual fee analysis. This year CMG presented a new Lipper report comparing the contractual management fees of Funds with those of competitors in similar investment styles. However, the reliability of the conclusion—that Fund management fee breakpoints compared favorably with competitive fee rates—was limited by the use of competitive funds at all asset levels. The sponsors of a $100 million mutual fund may not have given much thought to breakpoints at $5 billion; therefore, that fund's contractual fee at that level is unlikely to compare favorably with that of a $5 billion Fund. Limiting the competitors to the Lipper expense group, whose constituents are similar in size to the relevant Fund, would make the results more meaningful. In addition, the brea kpoints of a select group of Atlantic Funds (which would differ each year) should continue to be compared to those of industry rivals to ensure that the Funds' breakpoint schedules remain within industry norms. As breakpoint schedules change relatively little each year, performing such a comparison for each Atlantic Fund each year would not be an efficient use of Trustee and CMG resources.
7) Pro forma profitability data. In any year in which CMG or the Trustees believe that the prior year's profitability is unlikely to be representative of current business results due to changes in markets or for any other reason, CMG should, consistent with this year's practice, prepare a pro forma income statement based on year-to-date actual data and reasonable projections used for its own business planning purposes.
8) Additional institutional data and analysis. While CMG provided a substantial amount of information on its institutional business, including a virtually complete database of all institutional accounts, we suggest some additional items for future years: (a) profitability data for the institutional business in the format, and based upon the same allocation methodologies, used to present Fund profitability, (b) an explanation of how CMA sets institutional fee breakpoints, which normally begin at asset levels far lower than those found in Fund management fee breakpoints, and (c) an analysis of differences in actual fees within specific investment categories, with special attention given to accounts established before and after the implementation of the standardized instit utional fee schedules in 2005.
9) Management fee disparities. In any future study of management fees, CMG and the Atlantic Trustees should analyze the differences in management fee schedules, including those arising out of the reorganization of the former Excelsior Funds as Atlantic Funds. As part of that analysis, CMG should provide an explanation for any significant fee differences among comparable funds across fund families sponsored by CMG, such as differences in the management styles of different Funds included the same Lipper category. Finally, if CMG proposes a management fee change or an expense cap for any mutual fund managed by CMA that is comparable to any Atlantic Fund, CMG should provide the Trustees with sufficient information about the proposal to allow the Trustees to assess the appli cability of the proposed change to the relevant Atlantic Fund or Funds.
10) Explanation of data supplied to Lipper. Each year, as part of the 15(c) process, CMG retains Lipper to compare the fees and expenses of each Fund to a group of competitors. In many cases, CMG, with the approval of the Trustees, adjusts the actual expense data, which is based on the most recent full fiscal year of the Fund (and each competitive fund) to reflect changes in fees or expense limits that occurred during or after the relevant fiscal year. This improves the reliability and usefulness of the comparison. However, to ensure that the Trustees know when and how CMG adjusted the data, we recommend that CMG prepare a table listing for each Fund what adjustments were made, e.g., to reflect a new expense limitation of x basis points that commenced on y date.
41
Reduction of volume of paper documents submitted. The effort to streamline and better organize the data presented to the Trustees and the process by which that data was prepared and organized continued to be well-received by all parties. Notwithstanding past success, it is always appropriate to look for opportunities to reduce and simplify the presentation of 15(c) data. One possibility would be to remove the 124 pages of biographical data, most if not all of which the Trustees have previously seen as part of their ongoing investment oversight duties, from the paper volume and post it on the Internet-based document storage and retrieval system used by the Funds to provide reference data to Trustees.
* * *
Respectfully Submitted,
Steven E. Asher
42
This page intentionally left blank.
This page intentionally left blank.
Important Information About This Report
The fund mails one shareholder report to each shareholder address. If you would like more than one report, please call shareholder services at 1-800-345-6611 and additional reports will be sent to you. This report has been prepared for shareholders of Columbia Massachusetts Tax-Exempt Fund.
A description of the policies and procedures that the fund uses to determine how to vote proxies and a copy of the fund's voting records are available (i) at www.columbiamanagement.com, (ii) on the Securities and Exchange Commission's website at www.sec.gov, and (iii) without charge, upon request, by calling 1-800-368-0346. Information regarding how the fund voted proxies relating to portfolio securities during the 12-month period ended June 30 is available from the SEC's website. Information regarding how the fund voted proxies relating to portfolio securities is also available from the fund's website, www.columbiamanagement.com.
The fund files a complete schedule of portfolio holdings with the SEC for the first and third quarters of each fiscal year on Form N-Q. The fund's Form N-Q is available on the SEC's website at www.sec.gov and may be reviewed and copied at the SEC's Public Reference Room in Washington, D.C. Information on the operation of the Public Reference Room may be obtained by calling 1-800-SEC-0330.
Please read and consider the investment objectives, risks, charges and expenses for any fund carefully before investing. For a prospectus which contains this and other important information about the fund, contact your Columbia Management representative or financial advisor or go to www.columbiamanagement.com.
Columbia Management Group, LLC ("Columbia Management") is the investment management division of Bank of America Corporation. Columbia Management entities furnish investment management services and products for institutional and individual investors. Columbia Funds are distributed by Columbia Management Distributors, Inc., member of FINRA, SIPC, part of Columbia Management and an affiliate of Bank of America Corporation.
Transfer Agent
Columbia Management Services, Inc.
P.O. Box 8081
Boston, MA 02266-8081
1-800-345-6611
Distributor
Columbia Management
Distributors, Inc.
One Financial Center
Boston, MA 02111
Investment Advisor
Columbia Management Advisors, LLC
100 Federal Street
Boston, MA 02110
45
Columbia Management®
One Financial Center
Boston, MA 02111-2621
PRSRT STD
U.S. Postage
PAID
Holliston, MA
Permit NO. 20
Columbia Management®
Columbia Massachusetts Tax-Exempt Fund
Annual Report, October 31, 2009
©2009 Columbia Management Distributors, Inc.
One Financial Center, Boston, MA 02111-2621
800-345-6611 www.columbiafunds.com
SHC-42/26723-1009 (12/09) 09/97714
Columbia Management®
Annual Report
October 31, 2009
Columbia New York Tax-Exempt Fund
| NOT FDIC INSURED | | May Lose Value | |
|
| NOT BANK ISSUED | | No Bank Guarantee | |
|
Table of Contents
| Fund Profile | | | 1 | | |
|
| Economic Update | | | 2 | | |
|
| Performance Information | | | 4 | | |
|
| Understanding Your Expenses | | | 5 | | |
|
| Portfolio Manager's Report | | | 6 | | |
|
| Investment Portfolio | | | 8 | | |
|
Statement of Assets and
Liabilities | | | 13 | | |
|
| Statement of Operations | | | 14 | | |
|
Statement of Changes in
Net Assets | | | 15 | | |
|
| Financial Highlights | | | 17 | | |
|
| Notes to Financial Statements | | | 20 | | |
|
| Report of Independent Registered Public Accounting Firm | | | 28 | | |
|
| Federal Income Tax Information | | | 29 | | |
|
| Fund Governance | | | 30 | | |
|
Board Consideration and
Approval of Advisory Agreements | | | 34 | | |
|
Summary of Management
Fee Evaluation by Independent
Fee Consultant | | | 37 | | |
|
Important Information About
This Report | | | 45 | | |
|
The views expressed in this report reflect the current views of the respective parties. These views are not guarantees of future performance and involve certain risks, uncertainties and assumptions that are difficult to predict, so actual outcomes and results may differ significantly from the views expressed. These views are subject to change at any time based upon economic, market or other conditions and the respective parties disclaim any responsibility to update such views. These views may not be relied on as investment advice and, because investment decisions for a Columbia Fund are based on numerous factors, may not be relied on as an indication of trading intent on behalf of any particular Columbia Fund. References to specific securities should not be construed as a recommendation or investment advice.
President's Message

Dear Shareholder:
We are pleased to provide this shareholder report detailing your fund's performance, portfolio holdings and financial statements. We hope this information is helpful in monitoring your investments as we work through these challenging economic times. We recognize that you have entrusted us with your money and want you to know that our professional investment teams work to interpret the latest economic and market trends with the goal of optimizing portfolio construction for our clients.
The first half of 2009 was defined by extremes. The multi-year lows we witnessed in the early months gave way to a stunning rally for the U.S. financial markets through November 2009. A global market rebound may be underway, thanks to the massive fiscal and aggressive monetary policies of governments around the world. In the third quarter 2009, the S&P 500 Index1 was up 15.61%. We believe this challenging economic environment makes it even more important to work with professional money managers while continuing to invest for life events like retirement, college planning, home improvements and career changes.
Retirement income planning has become an increasingly significant focus in the lives of millions of Americans. Recent economic conditions make it even more important to manage short-term obligations such as mortgages, monthly bills and credit card debt while also taking the steps necessary to prepare for or maximize retirement benefits. Better nutrition and medical services can result in U.S. citizens living longer, healthier lives. This means the risk of outliving one's assets in retirement is very real without proper planning. Financial security and retirement planning is an ongoing process that requires active management of your savings, investments and risks. We encourage you to review your retirement plan regularly so you'll be better able to meet your retirement needs in the future.
We recognize that economic uncertainty creates great challenges for many investors. Our professional investment teams work diligently to help investors navigate through difficult markets. Thank you for your business and for the opportunity to work together towards your investment goals.
Sincerely,

J. Kevin Connaughton
President, Columbia Funds
On September 29, 2009, Bank of America Corporation entered into an agreement to sell a portion of the asset management business of Columbia Management Group, LLC. Please see Note 4 of the Notes to Financial Statements for additional information.
1The Standard & Poor's (S&P) 500 Index tracks the performance of 500 widely held, large-capitalization U.S. stocks. Indices are not available for investment, are not professionally managed and do not reflect sales charges, fees, brokerage commissions, taxes or other expenses of investing. Securities in the fund may not match those in an index.
Past performance is no guarantee of future results.
Fund Profile – Columbia New York Tax-Exempt Fund
Performance data quoted represents past performance and current performance may be lower or higher. Past performance is no guarantee of future results. The investment return and principal value will fluctuate so that shares, when redeemed, may be worth more or less than the original cost. Please visit www.columbiafunds.com for daily and most recent month-end performance updates.
Summary
1-year return as of 10/31/09
| | +17.24% | |
|
| |  | | | Class A shares
(without sales charge) | |
|
| | +13.60% | |
|
| |  | | | Barclays Capital
Municipal Bond Index | |
|
Morningstar Style BoxTM
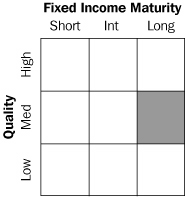
The Morningstar Style BoxTM reveals a fund's investment strategy. For fixed-income funds, the vertical axis shows the average credit quality of the bonds owned, and the horizontal axis shows interest rate sensitivity as measured by a bond's duration (short, intermediate or long). Information shown is based on the most recent data provided by Morningstar.
Summary
g For the 12-month period that ended October 31, 2009, the fund's Class A shares returned 17.24% without sales charge.
g The fund outperformed its benchmark, the Barclays Capital Municipal Bond Index1, and the average return of its peer group, the Lipper New York Municipal Debt Funds Classification.2
g An overweight in longer-maturity bonds, where issue selection was also strong, helped the fund outperform both its benchmark and peer group.
Portfolio Management
Kimberly A. Campbell has managed the fund since 2009 and has been associated with the advisor or its predecessors since 1995.
1The Barclays Capital Municipal Bond Index is considered representative of the broad market for investment grade, tax-exempt bonds with a maturity of at least one year. Indices are not available for investment, are not professionally managed and do not reflect sales charges, fees, brokerage commissions, taxes or other expenses of investing. Securities in the fund may not match those in an index.
2Lipper Inc., a widely respected data provider in the industry, calculates an average total return (assuming reinvestment of distributions) for mutual funds with investment objectives similar to those of the fund. Lipper makes no adjustment for the effect of sales loads.
Effective November 3, 2008, the Lehman Brothers indices were renamed the Barclays Capital indices.
1
Economic Update – Columbia New York Tax-Exempt Fund
Summary
For the 12-month period that ended October 31, 2009
g After a sharp decline, stock markets rebounded around the world, as measured by the S&P 500 Index and the MSCI EAFE Index.
| S&P Index | | MSCI Index | |
|
 | |  | |
|
g As investors appeared to exhibit more tolerance for risk, the Barclays Capital Aggregate Bond Index delivered solid results. High-yield bonds rebounded strongly, as measured by the JPMorgan Developed BB High Yield Index.
Barclays
Aggregate
Index | | JPMorgan
Index | |
|
 | |  | |
|
After a deep and difficult recession, the U.S. economy appeared to regain its footing midway through the 12-month period that began November 1, 2008 and ended October 31, 2009. Gross domestic product (GDP) turned positive in the third quarter of 2009, rising 2.8%, primarily on the strength of federal government stimulus spending. Now, hopes for a sustained recovery depend on a rebound in consumer spending and a shift from cost cuts to revenue gains to keep business profits moving higher.
The housing market showed some signs of improvement. Construction spending declined during most of the period, but turned slightly higher in August and September. New and existing home sales were weak in the first half of the period, but increased in the second half. However, new home sales took a surprise dip late in the period, as did housing starts, as the deadline for a generous first-time homebuyer tax credit neared. An extension of the credit into mid-2010 and an expansion of eligibility requirements, which were recently signed into law, renewed hopes for a sustained rebound in housing.
In the beleaguered labor market, the good news was that there was less bad news. Businesses continued to shed jobs throughout the period, raising the unemployment rate to 10.2% and wiping out all of the jobs gained since the last recession. However, the pace of job losses slowed markedly by the period's end, from 533,000 jobs lost in November 2008 to 190,000 jobs lost in October 2009. Yet, prospects appear dim for a quick recovery in the labor markets. In fact, consumer confidence, as measured monthly by The Conference Board, an independent research organization, took a dive in August and September. Consumers surveyed cited worsening business conditions and a bleaker outlook for the labor markets.
Manufacturing activity slowed through the first half of the period, but a key measure—the Institute for Supply Management's Index—rose above 50 in July and remained there for the remainder of the period. Any number above 50 indicates that manufacturing activity is expanding. However, several other key manufacturing indicators soured in October. Industrial production declined and manufacturing capacity utilization stalled after several months of modest improvement.
Consumer spending registered both ups and downs during the 12-month period, and the trend at the end of the period was hard to read because of the impact of the federal Cash for Clunkers program, which boosted auto sales. Spending rose sharply in August, then fell in September. New rigorous lending standards severely limited access to credit for business and consumers alike, and further hampered economic growth. In December 2008, the Federal Reserve Board (the Fed) lowered a key short-term borrowing rate—the federal funds rate—between zero and 0.25%—a record low. In light of continued uncertainty about the economy, the Fed made no further change to the federal funds rate during the period.
Bonds outperformed domestic stocks
As investors sought refuge from a volatile stock market, the highest-quality sectors of the U.S. bond market delivered solid gains during the first half of the period, Treasury prices rose and yields declined sharply as the economy faltered and stock market volatility increased. As hopes for a recovery materialized, Treasuries lagged riskier segments of the bond market. The benchmark 10-year U.S. Treasury yield began the
2
Economic Update (continued) – Columbia New York Tax-Exempt Fund
period at just under 4.0%, declined to 2.2% in December 2008, then rose to end the period at 3.4%. In this environment, the Barclays Capital Aggregate Bond Index1 returned 13.79%. Municipal bonds delivered returns that were in line with taxable investment-grade bonds even without factoring in potential tax advantages to investors in higher income tax brackets. The Barclays Capital Municipal Bond Index2 returned 13.60%. High-yield bond prices fell sharply in 2008 as economic prospects weakened and default fears rose, then rebounded strongly in 2009. For the 12-month period, the JPMorgan Developed BB High Yield Index3 returned 36.47%.
Stocks retreated, then rebounded
Against a strengthening economic backdrop, the U.S. stock market returned 9.80% for the 12-month period, as measured by the S&P 500 Index.4 Mid-cap stocks outperformed large and small-cap stocks and growth outperformed value by a solid margin, as measured by their respective Russell indices.5 Outside the U.S., stock market returns were even stronger. The MSCI EAFE Index,6 a broad gauge of stock market performance in foreign developed markets, gained 27.71% (in U.S. dollars) for the period. Emerging stock markets were caught in last year's downdraft, but they bounced back stronger than domestic or developed world markets in 2009 as economic growth generally outpaced the developed world. The MSCI Emerging Markets Index7 returned 64.13% (in U.S. dollars), led by strong gains from China, India, Indonesia, Colombia and Brazil.
Past performance is no guarantee of future results.
1The Barclays Capital Aggregate Bond Index is a market value-weighted index that tracks the daily price, coupon, pay-downs, and total return performance of fixed-rate, publicly placed, dollar-denominated, and non-convertible investment grade debt issues with at least $250 million par amount outstanding and with at least one year to final maturity.
2The Barclays Capital Municipal Bond Index is considered representative of the broad market for investment grade, tax-exempt bonds with a maturity of at least one year.
3The JPMorgan Developed BB High Yield Index is designed to mirror the investable universe of the U.S. dollar developed, BB-rated, high yield corporate debt market.
4The Standard & Poor's (S&P) 500 Index tracks the performance of 500 widely held, large-capitalization U.S. stocks.
5The Russell 1000 Index tracks the performance of 1,000 of the largest U.S. companies, based on market capitalization. The Russell MidCap Index measures the performance of the 800 smallest companies in the Russell 1000 Index, which represents approximately 25% of the total market capitalization of the Russell 1000 Index. The Russell 2000 Index measures the performance of the 2,000 smallest companies in the Russell 3000 Index, which represents approximately 8% of the total market capitalization of the Russell 3000 Index. The Russell 3000 Growth Index measures the performance of those Russell 3000 Index companies with higher price-to-book ratios and higher forecasted growth values. The stocks in this index are also members of either the Russell 1000 Growth or the Russell 2000 Growth indexes. The Russell 3000 Value Index measures the performance of those Russell 3000 Index companies with lower price-to-book ratios and lo wer forecasted growth values. The stocks in this index are also members of either the Russell 1000 Value or the Russell 2000 Value indexes.
6The Morgan Stanley Capital International Europe, Australasia, Far East (MSCI EAFE) Index is a capitalization-weighted index that tracks the total return of common stocks in 21 developed-market countries within Europe, Australasia and the Far East.
7The Morgan Stanley Capital International Emerging Markets Index (MSCI EMI) is a free float-adjusted market capitalization index that is designed to measure equity market performance in the global emerging markets. As of June 2006, the MSCI Emerging Markets Index consisted of the following 25 emerging market country indices: Argentina, Brazil, Chile, China, Colombia, Czech Republic, Egypt, Hungary, India, Indonesia, Israel, Jordan, Korea, Malaysia, Mexico, Morocco, Pakistan, Peru, Philippines, Poland, Russia, South Africa, Taiwan, Thailand and Turkey.
Indices are not available for investment, are not professionally managed and do not reflect sales charges, fees, brokerage commissions, taxes or other expenses of investing. Securities in the fund may not match those in an index.
Effective November 3, 2008, the Lehman Brothers indices were renamed the Barclays Capital indices.
3
Performance Information – Columbia New York Tax-Exempt Fund
Performance data quoted represents past performance and current performance may be lower or higher. Past performance is no guarantee of future results. The investment return and principal value will fluctuate so that shares, when redeemed, may be worth more or less than the original cost. Please visit www.columbiafunds.com for daily and most recent month-end performance updates.
Annual operating expense ratio (%)*
| Class A | | | 1.09 | | |
| Class B | | | 1.84 | | |
| Class C | | | 1.84 | | |
*The annual operating expense ratio is as stated in the fund's prospectus that is current as of the date of this report and includes the expenses incurred by the investment companies in which the fund invests. Differences in expense ratios disclosed elsewhere in this report may result from including expenses incurred by the investment companies, fee waivers and expense reimbursements as well as different time periods used in calculating the ratios.
Performance of a $10,000 investment 11/01/99 – 10/31/09
The chart above shows the change in value of a hypothetical $10,000 investment in Class A shares of Columbia New York Tax-Exempt Fund during the stated time period, and does not reflect the deduction of taxes that a shareholder may pay on fund distributions or on the redemption of fund shares.
Performance of a $10,000 investment 11/01/99 – 10/31/09 ($)
| Sales charge | | without | | with | |
| Class A | | | 17,064 | | | | 16,254 | | |
| Class B | | | 15,845 | | | | 15,845 | | |
| Class C | | | 16,322 | | | | 16,322 | | |
Average annual total return as of 10/31/09 (%)
| Share class | | A | | B | | C | |
| Inception | | 09/26/86 | | 08/04/92 | | 08/01/97 | |
| Sales charge | | without | | with | | without | | with | | without | | with | |
| 1-year | | | 17.24 | | | | 11.67 | | | | 16.38 | | | | 11.38 | | | | 16.72 | | | | 15.72 | | |
| 5-year | | | 3.38 | | | | 2.38 | | | | 2.61 | | | | 2.27 | | | | 2.92 | | | | 2.92 | | |
| 10-year | | | 5.49 | | | | 4.98 | | | | 4.71 | | | | 4.71 | | | | 5.02 | | | | 5.02 | | |
Average annual total return as of 09/30/09 (%)
| Share class | | A | | B | | C | |
| Sales charge | | without | | with | | without | | with | | without | | with | |
| 1-year | | | 16.22 | | | | 10.70 | | | | 15.36 | | | | 10.36 | | | | 15.70 | | | | 14.70 | | |
| 5-year | | | 4.10 | | | | 3.09 | | | | 3.33 | | | | 2.99 | | | | 3.64 | | | | 3.64 | | |
| 10-year | | | 5.61 | | | | 5.10 | | | | 4.83 | | | | 4.83 | | | | 5.14 | | | | 5.14 | | |
The "with sales charge" returns include the maximum initial sales charge of 4.75% for Class A shares and the applicable contingent deferred sales charge of 5.00% in the first year, declining to 1.00% in the sixth year, and eliminated thereafter for Class B shares and 1.00% for Class C shares for the first year only. The "without sales charge" returns do not include the effect of sales charges. If they had, returns would be lower.
Performance results reflect any fee waivers or reimbursements of fund expenses by the investment advisor and/or any of its affiliates. Absent these fee waivers or expense reimbursement arrangements, performance results would have been lower.
All results shown assume reinvestment of distributions. Performance for different share classes will vary based on differences in sales charges and the fees associated with each class. Please see the fund's prospectus for details.
The tables do not reflect the deduction of taxes a shareholder may pay on fund distributions or on the redemption of fund shares.
4
Understanding Your Expenses – Columbia New York Tax-Exempt Fund
As a fund shareholder, you incur two types of costs. There are transaction costs, which generally include sales charges on purchases and may include redemption fees or exchange fees. There are also ongoing costs, which generally include investment advisory fees, distribution and service (Rule 12b-1) fees and other fund expenses. The information on this page is intended to help you understand the ongoing costs of investing in the fund and to compare these costs with the ongoing costs of investing in other mutual funds.
Analyzing your fund's expenses by share class
To illustrate these ongoing costs, we have provided an example and calculated the expenses paid by investors in each share class during the period. The information in the following table is based on an initial investment of $1,000, which is invested at the beginning of the period and held for the entire period. Expense information is calculated two ways and each method provides you with different information. The amount listed in the "Actual" column is calculated using the fund's actual operating expenses and total return for the period. The amount listed in the "Hypothetical" column for each share class assumes that the return each year is 5% before expenses and is calculated based on the fund's actual operating expenses. You should not use the hypothetical account values and expenses to estimate either your actual account balance at the end of the period or the expenses you paid during this period.
Compare with other funds
Since all mutual funds are required to include the same hypothetical calculations about expenses in shareholder reports, you can use this information to compare the ongoing costs of investing in the fund with other funds. To do so, compare the 5% hypothetical example with the 5% hypothetical examples that appear in the shareholder reports of other funds. As you compare hypothetical examples of other funds, it is important to note that hypothetical examples are meant to highlight the ongoing costs of investing in a fund and do not reflect any transaction costs, such as sales charges, redemption fees or exchange fees.
Estimating your actual expenses
To estimate the expenses that you paid over the period, first you will need your account balance at the end of the period:
g For shareholders who receive their account statements from Columbia Management Services, Inc., your account balance is available online at www.columbiafunds.com or by calling Shareholder Services at 800.345.6611.
g For shareholders who receive their account statements from their financial intermediary, contact your financial intermediary to obtain your account balance.
1. Divide your ending account balance by $1,000. For example, if an account balance was $8,600 at the end of the period, the result would be 8.6.
2. In the section of the table below titled "Expenses paid during the period," locate the amount for your share class. You will find this number in the column labeled "Actual." Multiply this number by the result from step 1. Your answer is an estimate of the expenses you paid on your account during the period.
If the value of your account falls below the minimum initial investment requirement applicable to you, your account generally will be subject to a $20 annual fee. This fee is not included in the accompanying table. If you are subject to the fee, keep it in mind when you are estimating the ongoing expenses of investing in the fund and when comparing the expenses of this fund with other funds.
05/01/09 – 10/31/09
| | | Account value at the
beginning of the period ($) | | Account value at the
end of the period ($) | | Expenses paid
during the period ($) | | Fund's annualized
expense ratio (%) | |
| | | Actual | | Hypothetical | | Actual | | Hypothetical | | Actual | | Hypothetical | | Actual | |
| Class A | | | 1,000.00 | | | | 1,000.00 | | | | 1,080.10 | | | | 1,020.97 | | | | 4.40 | | | | 4.28 | | | | 0.84 | | |
| Class B | | | 1,000.00 | | | | 1,000.00 | | | | 1,076.00 | | | | 1,017.19 | | | | 8.32 | | | | 8.08 | | | | 1.59 | | |
| Class C | | | 1,000.00 | | | | 1,000.00 | | | | 1,077.60 | | | | 1,018.70 | | | | 6.76 | | | | 6.56 | | | | 1.29 | | |
Expenses paid during the period are equal to the annualized expense ratio for the share class, multiplied by the average account value over the period, then multiplied by the number of days in the fund's most recent fiscal half-year and divided by 365.
Had the investment advisor and/or any of its affiliates not waived fees or reimbursed a portion of expenses, account value at the end of the period would have been reduced.
It is important to note that the expense amounts shown in the table are meant to highlight only ongoing costs of investing in the fund and do not reflect any transaction costs, such as sales charges, redemption fees or exchange fees. Therefore, the hypothetical examples provided may not help you determine the relative total costs of owning shares of different funds. If these transaction costs were included, your costs would have been higher.
5
Portfolio Manager's Report – Columbia New York Tax-Exempt Fund
Performance data quoted represents past performance and current performance may be lower or higher. Past performance is no guarantee of future results. The investment return and principal value will fluctuate so that shares, when redeemed, may be worth more or less than the original cost. Please visit www.columbiafunds.com for daily and most recent month-end performance updates.
Net asset value per share
as of 10/31/09 ($)
| Class A | | | 7.25 | | |
| Class B | | | 7.25 | | |
| Class C | | | 7.25 | | |
Distributions declared per share
11/01/08 – 10/31/09 ($)
| Class A | | | 0.39 | | |
| Class B | | | 0.33 | | |
| Class C | | | 0.36 | | |
A portion of the fund's income may be subject to the alternative minimum tax. The fund may at times purchase tax-exempt securities at a discount. Some, or all, of this discount may be included in the fund's ordinary income, and is taxable when distributed. Distributions include $0.09 per share of taxable realized gains.
30-day SEC yields
as of 10/31/09 (%)
| Class A | | | 3.81 | | |
| Class B | | | 3.23 | | |
| Class C | | | 3.54 | | |
The 30-day SEC yields reflect the fund's earning power, net of expenses, expressed as an annualized percentage of the public offering price per share at the end of the period.
Taxable-equivalent SEC yields
as of 10/31/09 (%)
| Class A | | | 6.43 | | |
| Class B | | | 5.46 | | |
| Class C | | | 5.98 | | |
Taxable-equivalent SEC yields are calculated assuming a federal tax rate of 35.0% and a New York state income tax rate of 8.97%. These tax rates do not reflect the phase out of exemptions or the reduction of the otherwise allowable deductions that occur when adjusted gross income exceeds certain levels. Your taxable-equivalent yield may be different depending on your tax bracket.
For the 12-month period that ended October 31, 2009, the fund's Class A shares returned 17.24% without sales charge. The fund came out ahead of its benchmark, the Barclays Capital Municipal Bond Index, which returned 13.60%, and the average return of its peer group, the Lipper New York Municipal Debt Funds Classification, which gained 14.66%. The fund benefited from an overweight in and strong issue selection among long-term bonds, which were particularly strong performers in the second half of the period. An overweight in lower-quality higher-yielding BBB-rated bonds further aided performance versus the benchmark. Hospital bonds, many of which were medium- and lower-quality issues, and long-term transportation bonds were among the standouts. We believe the fund's exposure to 15 year bonds and longer helped it outperform its Lipper peer group average.
Strongest returns from longer-maturity and lower-quality issues
During the first half of the period, the economy slowed dramatically, unemployment rose, housing prices weakened and stock prices plunged. Municipal bonds faced added pressure as institutional investors sold longer-maturity high-grade issues, causing yields to rise and bond prices to fall. By late 2008, yields on 10-year high-grade municipal issues had reached roughly 140% of yields on comparable taxable bonds. This yield advantage attracted the attention of individual investors, who remained strong buyers of municipal bonds for the rest of the period. New municipal issuance, however, remained light, as liquidity dried up and insurers suffered credit-rating downgrades that increased the cost for issuers coming to market.
The economic outlook improved in the spring of 2009, thanks to government stimulus measures and low short-term interest rates. Bond investors began taking on added risk to obtain more yield, buying long-term bonds and lower-quality issues, which were among the year's best performers. New municipal bond issuance remained limited, due, in part, to the introduction of Build America bonds, which allow municipalities to sell taxable issues and collect a 35% subsidy from the federal government to help offset the cost increase over tax-exempt issues.
Focus on intermediate maturities and medium- to higher-quality
Early in the period, we maintained our focus on intermediate-term issues with maturities between 10 and 20 years. These bonds offered higher yields than short-term bonds and less risk than longer-term issues. As opportunities presented themselves, we sold some bonds with maturities of 12 years or less and reallocated the proceeds to bonds with maturities beyond 20 years, which offered higher yields. We also maintained an emphasis on medium- to higher-quality issues with ratings of A or better. Exposure to A-rated, as well as BBB- and non-rated, bonds worked well as investors favored lower-quality issues. The fund's stake in AAA-rated issues declined, as the credit ratings of some of the fund's insured AAA-rated bonds fell along with those of their insurers.
6
Portfolio Manager's Report (continued) – Columbia New York Tax-Exempt Fund
Cautious outlook for New York finances
Despite being hit hard by financial crisis and recession, New York maintained credit ratings of AA3 from Moody's and AA from Standard & Poor's. However, we believe the state may have a tough recovery ahead. Unemployment was 8.9% as of September 30th, and is expected to rise. Expectations are that hiring will come back very slowly in the beleaguered financial services sector, which faces added pressure from new securities regulations. The state has also cut government payrolls, but will most likely have to undertake more layoffs or cut services, given the shortfalls from personal income tax, sales tax and corporate tax receipts. Despite these concerns, we are encouraged that the state recently passed a budget that we believe relies on recurring solutions rather than one-time fixes to deal with declining revenues.
Portfolio holdings and characteristics are subject to change periodically and may not be representative of current holdings and characteristics. The outlook for the fund may differ from those presented for other Columbia Funds.
Tax-exempt investing offers current tax-exempt income, but it also involves certain risks. The value of the fund will be affected by interest rate changes and the creditworthiness of issues held in the fund. When interest rates go up, bond prices generally drop and vice versa.
Interest income from certain tax-exempt bonds may be subject to certain state and local taxes and, if applicable, the alternative minimum tax. Capital gains are not exempt from income taxes.
The fund is non-diversified, which generally means that it may invest a greater percentage of its total assets in the securities of fewer issuers than a "diversified" fund. This increases the risk that a change in the value of any one investment held by the Fund could affect the overall value of the Fund more than it would affect that of a diversified fund holding a greater number of investments. Accordingly, the fund's value will likely be more volatile than the value of more diversified funds.
Single-state municipal bond funds pose additional risks, due to limited geographical diversification.
Top 5 sectors
as of 10/31/09 (%)
| Education | | | 12.3 | | |
| Pool/Bond Bank | | | 10.9 | | |
| Hospitals | | | 9.5 | | |
| Special Non-Property Tax | | | 9.5 | | |
| Water & Sewer | | | 6.3 | | |
Quality breakdown
as of 10/31/09 (%)
| AAA | | | 18.0 | | |
| AA | | | 39.8 | | |
| A | | | 21.7 | | |
| BBB | | | 6.7 | | |
| BB | | | 3.7 | | |
| B | | | 1.9 | | |
| Non-Rated | | | 8.2 | | |
Maturity breakdown
as of 10/31/09 (%)
| 0-1 year | | | 1.5 | | |
| 1-3 years | | | 0.2 | | |
| 3-5 years | | | 5.3 | | |
| 5-7 years | | | 3.8 | | |
| 7-10 years | | | 9.4 | | |
| 10-15 years | | | 13.1 | | |
| 15-20 years | | | 15.7 | | |
| 20-25 years | | | 24.8 | | |
| 25 years and over | | | 24.8 | | |
| Cash & Equivalents | | | 1.4 | | |
Ratings shown in the quality breakdown represent the rating assigned to a particular bond by one of the following nationally-recognized rating agencies: Standard and Poor's, Moody's Investors Service, Inc. or Fitch Ratings Ltd. Ratings are relative and subjective and are not absolute standards of quality. The fund's credit quality does not remove market risk.
The fund is actively managed and the composition of its portfolio will change over time. Information provided is calculated as a percentage of net assets.
7
Investment Portfolio – Columbia New York Tax-Exempt Fund
October 31, 2009
| Municipal Bonds – 97.5% | |
| | | Par ($) | | Value ($) | |
| Education – 13.3% | |
| Education – 12.3% | |
| NY Dormitory Authority | |
| Columbia University, | |
Series 2008,
5.000% 07/01/38 | | | 500,000 | | | | 528,040 | | |
| Cornell University, | |
Series 2009 A,
5.000% 07/01/39 | | | 500,000 | | | | 523,390 | | |
| New York University: | |
Series 1998 A,
Insured: NPFGC
5.750% 07/01/27 | | | 2,000,000 | | | | 2,327,460 | | |
Series 2001 1,
Insured: AMBAC
5.500% 07/01/40 | | | 1,000,000 | | | | 1,141,780 | | |
| St. John's University, | |
Series 2007 C,
Insured: NPFGC
5.250% 07/01/30 | | | 1,000,000 | | | | 1,054,460 | | |
| Teachers College, | |
Series 2009,
5.500% 03/01/39 | | | 430,000 | | | | 450,034 | | |
| NY Dutchess County Industrial Development Agency | |
| Bard College, | |
Series 2007,
4.500% 08/01/36 | | | 500,000 | | | | 417,500 | | |
| NY New York City Trust for Cultural Resources | |
| The Julliard School, | |
Series 2009 A:
5.000% 01/01/34 | | | 375,000 | | | | 392,670 | | |
| 5.000% 01/01/39 | | | 500,000 | | | | 521,640 | | |
| NY St. Lawrence County Industrial Development Agency | |
| Clarkson University, | |
Series 2007,
5.000% 07/01/31 | | | 1,000,000 | | | | 985,620 | | |
| Education Total | | | 8,342,594 | | |
| Prep School – 1.0% | |
| NY New York City Industrial Development Agency | |
| Marymount School Academy, | |
Series 2001,
Insured: ACA
5.125% 09/01/21 | | | 625,000 | | | | 631,125 | | |
| Prep School Total | | | 631,125 | | |
| Education Total | | | 8,973,719 | | |
| | | Par ($) | | Value ($) | |
| Health Care – 15.2% | |
| Continuing Care Retirement – 3.6% | |
| NY Broome County Industrial Development Agency | |
| Good Shepherd Village Endwell, | |
Series 2008 A:
6.750% 07/01/28 | | | 500,000 | | | | 417,545 | | |
| 6.875% 07/01/40 | | | 250,000 | | | | 198,523 | | |
| NY Nassau County Industrial Development Agency | |
| Amsterdam at Harborside, | |
Series 2007 A,
6.700% 01/01/43 | | | 750,000 | | | | 638,572 | | |
| NY Suffolk County Industrial Development Agency | |
| Active Retirement Community, | |
Series 2006,
5.000% 11/01/28 | | | 1,335,000 | | | | 1,179,326 | | |
| Continuing Care Retirement Total | | | 2,433,966 | | |
| Hospitals – 9.5% | |
| NY Dormitory Authority | |
| Kaleida Health, | |
Series 2006,
Insured: FHA
4.700% 02/15/35 | | | 1,000,000 | | | | 919,480 | | |
| New York Hospital Medical Centre, | |
Series 2007,
Insured: FHA
4.750% 02/15/37 | | | 1,000,000 | | | | 886,850 | | |
| North Shore University Hospital, | |
Series 2007 A,
5.000% 05/01/32 | | | 1,000,000 | | | | 963,380 | | |
| NYU Hospital Center, | |
Series 2007 B,
5.625% 07/01/37 | | | 1,000,000 | | | | 978,640 | | |
| Orange Regional Medical Center, | |
Series 2008,
6.125% 12/01/29 | | | 650,000 | | | | 591,071 | | |
| University of Rochester, | |
Series 2007,
5.000% 07/01/27 | | | 1,000,000 | | | | 1,035,250 | | |
| NY Saratoga County Industrial Development Agency | |
| Saratoga Hospital: | |
Series 2004 A,
5.000% 12/01/13 | | | 250,000 | | | | 255,695 | | |
Series 2007 B,
5.250% 12/01/32 | | | 500,000 | | | | 464,625 | | |
See Accompanying Notes to Financial Statements.
8
Columbia New York Tax-Exempt Fund
October 31, 2009
| Municipal Bonds (continued) | |
| | | Par ($) | | Value ($) | |
| NY Yonkers Industrial Development Agency | |
| St. John's Riverside Hospital, | |
Series 2001 A,
6.800% 07/01/16 | | | 290,000 | | | | 294,031 | | |
| Hospitals Total | | | 6,389,022 | | |
| Nursing Homes – 2.1% | |
| NY Amherst Industrial Development Agency | |
| Beechwood Health Care Center, | |
Series 2007,
5.200% 01/01/40 | | | 750,000 | | | | 488,085 | | |
| NY Essex County Industrial Development Agency | |
| Moses Ludington Nursing Home, | |
Series 2000 A,
Insured: FHA
6.200% 02/01/30 | | | 935,000 | | | | 951,774 | | |
| Nursing Homes Total | | | 1,439,859 | | |
| Health Care Total | | | 10,262,847 | | |
| Housing – 6.7% | |
| Assisted Living/Senior – 4.2% | |
| NY Huntington Housing Authority | |
| Gurwin Jewish Senior Center, | |
Series 1999 A,
5.875% 05/01/19 | | | 1,500,000 | | | | 1,345,965 | | |
| NY Mount Vernon Industrial Development Agency | |
| Wartburg Senior Housing, Inc., | |
Series 1999:
6.150% 06/01/19 | | | 1,000,000 | | | | 976,660 | | |
| 6.200% 06/01/29 | | | 615,000 | | | | 562,344 | | |
| Assisted Living/Senior Total | | | 2,884,969 | | |
| Multi-Family – 1.0% | |
| NY New York City Housing Development Corp. | |
| Series 2009, | |
Guarantor: FNMA
4.500% 09/15/25 | | | 165,000 | | | | 165,122 | | |
| Series 2009 C1, | |
| 5.500% 11/01/34 | | | 500,000 | | | | 512,340 | | |
| Multi-Family Total | | | 677,462 | | |
| Single-Family – 1.5% | |
| NY Mortgage Agency | |
| Series 2007 148, AMT, | |
| 5.200% 10/01/32 | | | 1,000,000 | | | | 1,000,600 | | |
| Single-Family Total | | | 1,000,600 | | |
| Housing Total | | | 4,563,031 | | |
| | | Par ($) | | Value ($) | |
| Other – 16.5% | |
| Other – 0.8% | |
| NY Westchester County Industrial Development Agency | |
| Guiding Eyes for the Blind, | |
Series 2004,
5.375% 08/01/24 | | | 550,000 | | | | 549,120 | | |
| Other Total | | | 549,120 | | |
| Pool/Bond Bank – 10.9% | |
| NY Environmental Facilities Corp. | |
| Series 2005 B, | |
| 5.500% 04/15/35 | | | 1,000,000 | | | | 1,169,120 | | |
| Series 2006 A, | |
| 4.750% 06/15/31 | | | 1,000,000 | | | | 1,019,300 | | |
| Series 2008 A, | |
| 5.000% 06/15/37 | | | 1,000,000 | | | | 1,034,640 | | |
| Series 2009 A, | |
| 5.000% 06/15/34 | | | 4,000,000 | | | | 4,132,520 | | |
| Pool/Bond Bank Total | | | 7,355,580 | | |
| Refunded/Escrowed (a) – 4.8% | |
| NY Dormitory Authority | |
| Memorial Sloan-Kettering Cancer Center, | |
Series 2003,
Escrowed to Maturity,
Insured: NPFGC
(b) 07/01/25 | | | 3,000,000 | | | | 1,559,310 | | |
| Series 2000 A, | |
Pre-refunded 07/01/10,
Insured: NPFGC
(c) 07/01/14
(5.700% 07/01/10) | | | 630,000 | | | | 634,259 | | |
| University of Rochester, | |
Series 2000 A,
Insured: NPFGC
(c) 07/01/14
(5.700% 07/01/10) | | | 370,000 | | | | 371,484 | | |
| NY Greece Central School District | |
| Series 1992, | |
Escrowed to Maturity,
Insured: FGIC
6.000% 06/15/16 | | | 500,000 | | | | 610,385 | | |
| NY Urban Development Corp. | |
| Series 2002 A, | |
Pre-refunded 01/01/11,
5.500% 01/01/17 | | | 105,000 | | | | 111,075 | | |
| Refunded/Escrowed Total | | | 3,286,513 | | |
| Other Total | | | 11,191,213 | | |
See Accompanying Notes to Financial Statements.
9
Columbia New York Tax-Exempt Fund
October 31, 2009
| Municipal Bonds (continued) | |
| | | Par ($) | | Value ($) | |
| Other Revenue – 1.2% | |
| Recreation – 1.2% | |
| NY Trust Cultural Resources | |
| Museum of Modern Art, | |
Series 2008 1A,
5.000% 04/01/31 | | | 750,000 | | | | 786,825 | | |
| Recreation Total | | | 786,825 | | |
| Other Revenue Total | | | 786,825 | | |
| Tax-Backed – 19.1% | |
| Local Appropriated – 2.7% | |
| NY Dormitory Authority | |
| Series 2001 2-4, | |
| 4.750% 01/15/30 | | | 1,000,000 | | | | 1,009,410 | | |
| Westchester County, | |
Series 1998,
(b) 08/01/19 | | | 1,200,000 | | | | 833,820 | | |
| Local Appropriated Total | | | 1,843,230 | | |
| Local General Obligations – 1.8% | |
| NY Mount Sinai School District | |
| Series 1992, | |
Insured: AMBAC
6.200% 02/15/19 | | | 1,005,000 | | | | 1,230,934 | | |
| Local General Obligations Total | | | 1,230,934 | | |
| Special Non-Property Tax – 9.5% | |
| NY Dormitory Authority | |
| Series 2008-B: | |
| 5.250% 03/15/38 | | | 500,000 | | | | 523,335 | | |
| 5.750% 03/15/36 | | | 500,000 | | | | 552,180 | | |
| NY Local Government Assistance Corp. | |
| Series 1993 E, | |
| 6.000% 04/01/14 | | | 2,945,000 | | | | 3,295,779 | | |
| NY Metropolitan Transportation Authority | |
| Series 2009 B, | |
| 5.000% 11/15/34 | | | 1,000,000 | | | | 1,026,190 | | |
PR Commonwealth of Puerto Rico Sales Tax
Financing Corp. | |
| Series 2007 A, | |
| 5.250% 08/01/57 | | | 1,000,000 | | | | 1,013,900 | | |
| Special Non-Property Tax Total | | | 6,411,384 | | |
| State Appropriated – 5.1% | |
| NY Dormitory Authority | |
| Series 1993, | |
| 6.000% 07/01/20 | | | 2,000,000 | | | | 2,306,240 | | |
| | | Par ($) | | Value ($) | |
| State University, | |
Series 2000 C,
Insured: FSA
5.750% 05/15/17 | | | 1,000,000 | | | | 1,162,810 | | |
| State Appropriated Total | | | 3,469,050 | | |
| Tax-Backed Total | | | 12,954,598 | | |
| Transportation – 10.5% | |
| Air Transportation – 3.7% | |
| NY New York City Industrial Development Agency | |
| American Airlines, Inc., | |
Series 2005, AMT,
7.750% 08/01/31 | | | 1,000,000 | | | | 979,270 | | |
| Terminal One Group Association LP, | |
Series 2005, AMT,
5.500% 01/01/24 | | | 1,500,000 | | | | 1,498,410 | | |
| Air Transportation Total | | | 2,477,680 | | |
| Ports – 3.3% | |
| NY Port Authority of New York & New Jersey | |
| Series 1993, | |
| 5.375% 03/01/28 | | | 2,000,000 | | | | 2,222,740 | | |
| Ports Total | | | 2,222,740 | | |
| Toll Facilities – 1.5% | |
| NY Thruway Authority | |
| Series 2007, | |
Insured: FGIC
5.000% 01/01/27 | | | 1,000,000 | | | | 1,049,140 | | |
| Toll Facilities Total | | | 1,049,140 | | |
| Transportation – 2.0% | |
| NY Metropolitan Transportation Authority | |
| Series 2005 B, | |
Insured: AMBAC
5.250% 11/15/23 | | | 1,250,000 | | | | 1,372,787 | | |
| Transportation Total | | | 1,372,787 | | |
| Transportation Total | | | 7,122,347 | | |
| Utilities – 15.0% | |
| Independent Power Producers – 1.3% | |
| NY Suffolk County Industrial Development Agency | |
| Nissequogue Cogeneration Partners Facilities, | |
Series 1998, AMT,
5.500% 01/01/23 | | | 1,000,000 | | | | 871,490 | | |
| Independent Power Producers Total | | | 871,490 | | |
See Accompanying Notes to Financial Statements.
10
Columbia New York Tax-Exempt Fund
October 31, 2009
| Municipal Bonds (continued) | |
| | | Par ($) | | Value ($) | |
| Investor Owned – 2.3% | |
| NY Energy & Research Development Authority | |
| Brooklyn Union Gas Co., | |
Series 1993,
9.826% 04/01/20
(11/25/09) (d)(e) | | | 1,500,000 | | | | 1,561,020 | | |
| Investor Owned Total | | | 1,561,020 | | |
| Municipal Electric – 5.1% | |
| NY Long Island Power Authority | |
| Series 2000, | |
Insured: FSA
(b) 06/01/18 | | | 1,000,000 | | | | 732,660 | | |
| Series 2008 A, | |
| 6.000% 05/01/33 | | | 1,000,000 | | | | 1,118,230 | | |
PR Commonwealth of Puerto Rico Electric
Power Authority | |
| Series 2002 KK, | |
Insured: NPFGC
5.500% 07/01/15 | | | 1,500,000 | | | | 1,624,110 | | |
| Municipal Electric Total | | | 3,475,000 | | |
| Water & Sewer – 6.3% | |
| NY Great Neck North Water Authority | |
| Series 2008, | |
| 5.000% 01/01/33 | | | 690,000 | | | | 716,668 | | |
| NY New York City Municipal Water Finance Authority | |
| Series 2008, | |
| 4.500% 06/15/38 | | | 1,000,000 | | | | 940,200 | | |
| Series 2009 FF-2, | |
| 5.500% 06/15/40 | | | 1,000,000 | | | | 1,083,950 | | |
| Series 2009, | |
| 5.250% 06/15/40 | | | 500,000 | | | | 527,445 | | |
| NY Rensselaer County Water Service & Sewer Authority | |
| Series 2008, | |
| 5.250% 09/01/38 | | | 1,000,000 | | | | 1,009,780 | | |
| Water & Sewer Total | | | 4,278,043 | | |
| Utilities Total | | | 10,185,553 | | |
Total Municipal Bonds
(cost of $64,049,313) | | | 66,040,133 | | |
| Investment Companies – 1.2% | |
| | | Shares | | Value ($) | |
| Columbia New York Tax-Exempt | |
Reserves, Capital Class
(7 day yield of 0.030%) (f)(g) | | | 514,090 | | | | 514,090 | | |
| Dreyfus Municipal Cash | |
Management Plus Fund
(7 day yield of 0.110%) | | | 254,748 | | | | 254,748 | | |
Total Investment Companies
(cost of $768,838) | | | 768,838 | | |
Total Investments – 98.7%
(cost of $64,818,151) (h) | | | 66,808,971 | | |
| Other Assets & Liabilities, Net – 1.3% | | | 908,149 | | |
| Net Assets – 100.0% | | | 67,717,120 | | |
Notes to Investment Portfolio:
(a) The Fund has been informed that each issuer has placed direct obligations of the U.S. Government in an irrevocable trust, solely for the payment of principal and interest.
(b) Zero coupon bond.
(c) Step bond. This security is currently not paying coupon. Shown parenthetically is the next coupon rate to be paid and the date the security will begin accruing at this rate.
(d) The interest rate shown on floating rate or variable rate securities reflects the rate at October 31, 2009.
(e) Parenthetical date represents the next interest rate reset date for the security.
(f) Investments in affiliates during the year ended October 31, 2009:
| Security name: Columbia New York Tax-Exempt Reserves, Capital Class | |
| (7 day yield of 0.030%) | |
| Shares as of 10/31/08: | | | — | | |
| Shares purchased: | | | 16,369,282 | | |
| Shares sold: | | | (15,855,192 | ) | |
| Shares as of 10/31/09: | | | 514,090 | | |
| Net realized gain(loss): | | $ | — | | |
| Dividend income earned: | | $ | 7,347 | | |
| Value at end of period: | | $ | 514,090 | | |
(g) Money market mutual fund registered under the Investment Company Act of 1940, as amended and advised by Columbia Management Advisors, LLC.
(h) Cost for federal income tax purposes is $64,558,122.
The following table summarizes the inputs used, as of October 31, 2009, in valuing the Fund's assets:
| Description | | Quoted
Prices
(Level 1) | | Other
Significant
Observable
Inputs
(Level 2) | | Significant
Unobservable
Inputs
(Level 3) | | Total | |
| Total Municipal Bonds | | $ | — | | | $ | 66,040,133 | | | $ | — | | | $ | 66,040,133 | | |
Total Investment
Companies | | | 768,838 | | | | — | | | | — | | | | 768,838 | | |
| Total Investments | | $ | 768,838 | | | $ | 66,040,133 | | | $ | — | | | $ | 66,808,971 | | |
For more information on valuation inputs, and their aggregation into the levels used in the table above, please refer to the Security Valuation section in the accompanying Notes to Financial Statements.
See Accompanying Notes to Financial Statements.
11
Columbia New York Tax-Exempt Fund
October 31, 2009
At October 31, 2009, the composition of the Fund by revenue source is as follows:
| Holdings by Revenue Source (Unaudited) | | % of
Net Assets | |
| Tax-Backed | | | 19.1 | | |
| Health Care | | | 15.2 | | |
| Utilities | | | 15.0 | | |
| Education | | | 13.3 | | |
| Pool/Bond Bank | | | 10.9 | | |
| Transportation | | | 10.5 | | |
| Housing | | | 6.7 | | |
| Refunded/Escrowed | | | 4.8 | | |
| Other Revenue | | | 1.2 | | |
| Other | | | 0.8 | | |
| | | | 97.5 | | |
| Investment Companies | | | 1.2 | | |
| Other Assets & Liabilities, Net | | | 1.3 | | |
| | | | 100.0 | | |
| Acronym | | Name | |
| ACA | | ACA Financial Guaranty Corp. | |
|
| AMBAC | | Ambac Assurance Corp. | |
|
| AMT | | Alternative Minimum Tax | |
|
| FGIC | | Financial Guaranty Insurance Co. | |
|
| FHA | | Federal Housing Administration | |
|
| FNMA | | Federal National Mortgage Association | |
|
| FSA | | Financial Security Assurance, Inc. | |
|
| NPFGC | | National Public Finance Guarantee Corp. | |
|
See Accompanying Notes to Financial Statements.
12
Statement of Assets and Liabilities – Columbia New York Tax-Exempt Fund
October 31, 2009
| Assets | | Unaffiliated investments, at identified cost | | $ | 64,304,061 | | |
| | | Affiliated investments, at identified cost | | | 514,090 | | |
| | | Total investments, at identified cost | | | 64,818,151 | | |
| | | Unaffiliated investments, at value | | | 66,294,881 | | |
| | | Affiliated investments, at value | | | 514,090 | | |
| | | Total investments, at value | | | 66,808,971 | | |
| | | Cash | | | 325 | | |
| | | Receivable for: | | | | | |
| | | Fund shares sold | | | 101,090 | | |
| | | Interest | | | 1,055,503 | | |
| | | Expense reimbursement due from investment advisor | | | 15,181 | | |
| | | Trustees' deferred compensation plan | | | 19,998 | | |
| | | Prepaid expenses | | | 231 | | |
| | | Total Assets | | | 68,001,299 | | |
| Liabilities | | Payable for: | | | | | |
| | | Fund shares repurchased | | | 57,745 | | |
| | | Distributions | | | 89,423 | | |
| | | Investment advisory fee | | | 29,155 | | |
| | | Pricing and bookkeeping fees | | | 6,225 | | |
| | | Transfer agent fee | | | 6,375 | | |
| | | Trustees' fees | | | 188 | | |
| | | Audit fee | | | 34,299 | | |
| | | Custody fee | | | 1,926 | | |
| | | Distribution and service fees | | | 22,971 | | |
| | | Chief compliance officer expenses | | | 52 | | |
| | | Trustees' deferred compensation plan | | | 19,998 | | |
| | | Other liabilities | | | 15,822 | | |
| | | Total Liabilities | | | 284,179 | | |
| | | Net Assets | | | 67,717,120 | | |
| Net Assets Consist of | | Paid-in capital | | | 63,366,457 | | |
| | | Undistributed net investment income | | | 823,004 | | |
| | | Accumulated net realized gain | | | 1,536,839 | | |
| | | Net unrealized appreciation on investments | | | 1,990,820 | | |
| | | Net Assets | | | 67,717,120 | | |
| Class A | | Net assets | | $ | 50,468,958 | | |
| | | Shares outstanding | | | 6,959,118 | | |
| | | Net asset value per share | | $ | 7.25 | (a) | |
| | | Maximum sales charge | | | 4.75 | % | |
| | | Maximum offering price per share ($7.25/0.9525) | | $ | 7.61 | (b) | |
| Class B | | Net assets | | $ | 8,216,951 | | |
| | | Shares outstanding | | | 1,133,021 | | |
| | | Net asset value and offering price per share | | $ | 7.25 | (a) | |
| Class C | | Net assets | | $ | 9,031,211 | | |
| | | Shares outstanding | | | 1,245,264 | | |
| | | Net asset value and offering price per share | | $ | 7.25 | (a) | |
(a) Redemption price per share is equal to net asset value less any applicable contingent deferred sales charge.
(b) On sales of $50,000 or more the offering price is reduced.
See Accompanying Notes to Financial Statements.
13
Statement of Operations – Columbia New York Tax-Exempt Fund
For the Year Ended October 31, 2009
| | | | | ($) | |
| Investment Income | | Interest | | | 3,546,571 | | |
| | | Dividends | | | 3,406 | | |
| | | Dividends from affiliates | | | 7,347 | | |
| | | Total Investment Income | | | 3,557,324 | | |
| Expenses | | Investment advisory fee | | | 334,848 | | |
| | | Distribution fee: | | | | | |
| | | Class B | | | 68,789 | | |
| | | Class C | | | 63,116 | | |
| | | Service fee: | | | | | |
| | | Class A | | | 119,106 | | |
| | | Class B | | | 22,123 | | |
| | | Class C | | | 20,306 | | |
| | | Pricing and bookkeeping fees | | | 56,413 | | |
| | | Transfer agent fee | | | 40,405 | | |
| | | Trustees' fees | | | 17,874 | | |
| | | Custody fee | | | 9,516 | | |
| | | Audit fee | | | 39,482 | | |
| | | Reports to shareholders | | | 34,272 | | |
| | | Chief compliance officer expenses | | | 606 | | |
| | | Other expenses | | | 37,754 | | |
| | | Total Expenses | | | 864,610 | | |
| | | Fees waived or expenses reimbursed by investment advisor | | | (169,148 | ) | |
| | | Fees waived by distributor—Class C | | | (25,251 | ) | |
| | | Expense reductions | | | (607 | ) | |
| | | Net Expenses | | | 669,604 | | |
| | | Net Investment Income | | | 2,887,720 | | |
| Net Realized and Unrealized Gain (Loss) on Investments and Futures Contracts | |
| | | Net realized gain on: | | | | | |
| | | Investments | | | 1,975,251 | | |
| | | Futures contracts | | | 28,426 | | |
| | | Net realized gain | | | 2,003,677 | | |
| | | Net change in unrealized appreciation (depreciation) on investments | | | 5,941,093 | | |
| | | Net Gain | | | 7,944,770 | | |
| | | Net Increase Resulting from Operations | | | 10,832,490 | | |
See Accompanying Notes to Financial Statements.
14
Statement of Changes in Net Assets – Columbia New York Tax-Exempt Fund
| | | | | Year Ended October 31, | |
| Increase (Decrease) in Net Assets | | | | 2009 ($) | | 2008 ($) | |
| Operations | | Net investment income | | | 2,887,720 | | | | 2,943,238 | | |
| | | Net realized gain on investments and futures contracts | | | 2,003,677 | | | | 872,899 | | |
| | | Net change in unrealized appreciation (depreciation)
on investments and futures contracts | | | 5,941,093 | | | | (9,410,713 | ) | |
| | | Net increase (decrease) resulting from operations | | | 10,832,490 | | | | (5,594,576 | ) | |
| Distributions to Shareholders | | From net investment income: | | | | | | | | | |
| | | Class A | | | (2,152,096 | ) | | | (2,036,977 | ) | |
| | | Class B | | | (332,189 | ) | | | (448,956 | ) | |
| | | Class C | | | (329,331 | ) | | | (354,557 | ) | |
| | | From net realized gains: | | | | | | | | | |
| | | Class A | | | (562,331 | ) | | | (503,414 | ) | |
| | | Class B | | | (128,562 | ) | | | (156,300 | ) | |
| | | Class C | | | (108,984 | ) | | | (97,587 | ) | |
| | | Total distributions to shareholders | | | (3,613,493 | ) | | | (3,597,791 | ) | |
| | | Net Capital Stock Transactions | | | (724,723 | ) | | | (5,256,998 | ) | |
| | | Total increase (decrease) in net assets | | | 6,494,274 | | | | (14,449,365 | ) | |
| Net Assets | | Beginning of period | | | 61,222,846 | | | | 75,672,211 | | |
| | | End of period | | | 67,717,120 | | | | 61,222,846 | | |
| | | Undistributed net investment income at end of period | | | 823,004 | | | | 753,793 | | |
See Accompanying Notes to Financial Statements.
15
Statement of Changes in Net Assets (continued) – Columbia New York Tax-Exempt Fund
| | | Capital Stock Activity | |
| | | Year Ended
October 31, 2009 | | Year Ended
October 31, 2008 | |
| | | Shares | | Dollars ($) | | Shares | | Dollars ($) | |
| Class A | |
| Subscriptions | | | 2,440,985 | | | | 16,023,912 | | | | 1,146,528 | | | | 8,338,652 | | |
| Distributions reinvested | | | 245,488 | | | | 1,637,886 | | | | 226,091 | | | | 1,630,788 | | |
| Redemptions | | | (2,267,037 | ) | | | (15,442,027 | ) | | | (1,476,999 | ) | | | (10,519,253 | ) | |
| Net increase (decrease) | | | 419,436 | | | | 2,219,771 | | | | (104,380 | ) | | | (549,813 | ) | |
| Class B | |
| Subscriptions | | | 33,577 | | | | 225,308 | | | | 60,627 | | | | 438,310 | | |
| Distributions reinvested | | | 47,405 | | | | 313,894 | | | | 55,749 | | | | 403,425 | | |
| Redemptions | | | (488,031 | ) | | | (3,335,694 | ) | | | (738,672 | ) | | | (5,354,041 | ) | |
| Net decrease | | | (407,049 | ) | | | (2,796,492 | ) | | | (622,296 | ) | | | (4,512,306 | ) | |
| Class C | |
| Subscriptions | | | 205,131 | | | | 1,417,020 | | | | 237,969 | | | | 1,733,849 | | |
| Distributions reinvested | | | 36,280 | | | | 241,625 | | | | 34,549 | | | | 249,308 | | |
| Redemptions | | | (266,738 | ) | | | (1,806,647 | ) | | | (301,262 | ) | | | (2,178,036 | ) | |
| Net decrease | | | (25,327 | ) | | | (148,002 | ) | | | (28,744 | ) | | | (194,879 | ) | |
See Accompanying Notes to Financial Statements.
16
Financial Highlights – Columbia New York Tax-Exempt Fund
Selected data for a share outstanding throughout each period is as follows:
| | | Year Ended October 31, | |
| Class A Shares | | 2009 | | 2008 | | 2007 | | 2006 | | 2005 | |
| Net Asset Value, Beginning of Period | | $ | 6.55 | | | $ | 7.49 | | | $ | 7.70 | | | $ | 7.61 | | | $ | 7.84 | | |
| Income from Investment Operations: | |
| Net investment income (a) | | | 0.31 | | | | 0.31 | | | | 0.31 | | | | 0.32 | | | | 0.31 | | |
Net realized and unrealized gain (loss) on
investments and futures contracts | | | 0.78 | | | | (0.87 | ) | | | (0.19 | ) | | | 0.15 | | | | (0.22 | ) | |
| Total from investment operations | | | 1.09 | | | | (0.56 | ) | | | 0.12 | | | | 0.47 | | | | 0.09 | | |
| Less Distributions to Shareholders: | |
| From net investment income | | | (0.30 | ) | | | (0.30 | ) | | | (0.31 | ) | | | (0.31 | ) | | | (0.30 | ) | |
| From net realized gains | | | (0.09 | ) | | | (0.08 | ) | | | (0.02 | ) | | | (0.07 | ) | | | (0.02 | ) | |
| Total distributions to shareholders | | | (0.39 | ) | | | (0.38 | ) | | | (0.33 | ) | | | (0.38 | ) | | | (0.32 | ) | |
| Net Asset Value, End of Period | | $ | 7.25 | | | $ | 6.55 | | | $ | 7.49 | | | $ | 7.70 | | | $ | 7.61 | | |
| Total return (b)(c) | | | 17.24 | % | | | (7.86 | )% | | | 1.59 | % | | | 6.31 | % | | | 1.19 | % | |
| Ratios to Average Net Assets/Supplemental Data: | |
| Net expenses (d) | | | 0.84 | % | | | 0.84 | % | | | 0.84 | % | | | 0.84 | % | | | 0.84 | % | |
| Waiver/Reimbursement | | | 0.25 | % | | | 0.24 | % | | | 0.21 | % | | | 0.21 | % | | | 0.14 | % | |
| Net investment income (d) | | | 4.47 | % | | | 4.29 | % | | | 4.15 | % | | | 4.16 | % | | | 4.00 | % | |
| Portfolio turnover rate | | | 20 | % | | | 17 | % | | | 15 | % | | | 9 | % | | | 7 | % | |
| Net assets, end of period (000s) | | $ | 50,469 | | | $ | 42,819 | | | $ | 49,751 | | | $ | 56,050 | | | $ | 58,004 | | |
(a) Per share data was calculated using the average shares outstanding during the period.
(b) Total return at net asset value assuming all distributions reinvested and no initial sales charge or contingent deferred sales charge.
(c) Had the investment advisor and/or any of its affiliates not waived fees or reimbursed a portion of expenses, total return would have been reduced.
(d) The benefits derived from expense reductions had an impact of less than 0.01%.
See Accompanying Notes to Financial Statements.
17
Financial Highlights – Columbia New York Tax-Exempt Fund
Selected data for a share outstanding throughout each period is as follows:
| | | Year Ended October 31, | |
| Class B Shares | | 2009 | | 2008 | | 2007 | | 2006 | | 2005 | |
| Net Asset Value, Beginning of Period | | $ | 6.55 | | | $ | 7.49 | | | $ | 7.70 | | | $ | 7.61 | | | $ | 7.84 | | |
| Income from Investment Operations: | |
| Net investment income (a) | | | 0.25 | | | | 0.26 | | | | 0.26 | | | | 0.26 | | | | 0.25 | | |
Net realized and unrealized gain (loss) on
investments and futures contracts | | | 0.78 | | | | (0.88 | ) | | | (0.20 | ) | | | 0.15 | | | | (0.21 | ) | |
| Total from investment operations | | | 1.03 | | | | (0.62 | ) | | | 0.06 | | | | 0.41 | | | | 0.04 | | |
| Less Distributions to Shareholders: | |
| From net investment income | | | (0.24 | ) | | | (0.24 | ) | | | (0.25 | ) | | | (0.25 | ) | | | (0.25 | ) | |
| From net realized gains | | | (0.09 | ) | | | (0.08 | ) | | | (0.02 | ) | | | (0.07 | ) | | | (0.02 | ) | |
| Total distributions to shareholders | | | (0.33 | ) | | | (0.32 | ) | | | (0.27 | ) | | | (0.32 | ) | | | (0.27 | ) | |
| Net Asset Value, End of Period | | $ | 7.25 | | | $ | 6.55 | | | $ | 7.49 | | | $ | 7.70 | | | $ | 7.61 | | |
| Total return (b)(c) | | | 16.38 | % | | | (8.54 | )% | | | 0.83 | % | | | 5.52 | % | | | 0.44 | % | |
| Ratios to Average Net Assets/Supplemental Data: | |
| Net expenses (d) | | | 1.59 | % | | | 1.59 | % | | | 1.59 | % | | | 1.59 | % | | | 1.59 | % | |
| Waiver/Reimbursement | | | 0.25 | % | | | 0.24 | % | | | 0.21 | % | | | 0.21 | % | | | 0.14 | % | |
| Net investment income (d) | | | 3.73 | % | | | 3.54 | % | | | 3.40 | % | | | 3.41 | % | | | 3.25 | % | |
| Portfolio turnover rate | | | 20 | % | | | 17 | % | | | 15 | % | | | 9 | % | | | 7 | % | |
| Net assets, end of period (000s) | | $ | 8,217 | | | $ | 10,084 | | | $ | 16,192 | | | $ | 22,782 | | | $ | 28,278 | | |
(a) Per share data was calculated using the average shares outstanding during the period.
(b) Total return at net asset value assuming all distributions reinvested and no contingent deferred sales charge.
(c) Had the investment advisor and/or any of its affiliates not waived fees or reimbursed a portion of expenses, total return would have been reduced.
(d) The benefits derived from expense reductions had an impact of less than 0.01%.
See Accompanying Notes to Financial Statements.
18
Financial Highlights – Columbia New York Tax-Exempt Fund
Selected data for a share outstanding throughout each period is as follows:
| | | Year Ended October 31, | |
| Class C Shares | | 2009 | | 2008 | | 2007 | | 2006 | | 2005 | |
| Net Asset Value, Beginning of Period | | $ | 6.55 | | | $ | 7.49 | | | $ | 7.70 | | | $ | 7.61 | | | $ | 7.84 | | |
| Income from Investment Operations: | |
| Net investment income (a) | | | 0.28 | | | | 0.28 | | | | 0.28 | | | | 0.28 | | | | 0.28 | | |
Net realized and unrealized gain (loss) on
investments and futures contracts | | | 0.78 | | | | (0.87 | ) | | | (0.19 | ) | | | 0.15 | | | | (0.22 | ) | |
| Total from investment operations | | | 1.06 | | | | (0.59 | ) | | | 0.09 | | | | 0.43 | | | | 0.06 | | |
| Less Distributions to Shareholders: | |
| From net investment income | | | (0.27 | ) | | | (0.27 | ) | | | (0.28 | ) | | | (0.27 | ) | | | (0.27 | ) | |
| From net realized gains | | | (0.09 | ) | | | (0.08 | ) | | | (0.02 | ) | | | (0.07 | ) | | | (0.02 | ) | |
| Total distributions to shareholders | | | (0.36 | ) | | | (0.35 | ) | | | (0.30 | ) | | | (0.34 | ) | | | (0.29 | ) | |
| Net Asset Value, End of Period | | $ | 7.25 | | | $ | 6.55 | | | $ | 7.49 | | | $ | 7.70 | | | $ | 7.61 | | |
| Total return (b)(c) | | | 16.72 | % | | | (8.27 | )% | | | 1.14 | % | | | 5.84 | % | | | 0.74 | % | |
| Ratios to Average Net Assets/Supplemental Data: | |
| Net expenses (d) | | | 1.29 | % | | | 1.29 | % | | | 1.29 | % | | | 1.29 | % | | | 1.29 | % | |
| Waiver/Reimbursement | | | 0.55 | % | | | 0.54 | % | | | 0.51 | % | | | 0.51 | % | | | 0.44 | % | |
| Net investment income (d) | | | 4.02 | % | | | 3.84 | % | | | 3.69 | % | | | 3.71 | % | | | 3.55 | % | |
| Portfolio turnover rate | | | 20 | % | | | 17 | % | | | 15 | % | | | 9 | % | | | 7 | % | |
| Net assets, end of period (000s) | | $ | 9,031 | | | $ | 8,319 | | | $ | 9,729 | | | $ | 9,461 | | | $ | 9,974 | | |
(a) Per share data was calculated using the average shares outstanding during the period.
(b) Total return at net asset value assuming all distributions reinvested and no contingent deferred sales charge.
(c) Had the investment advisor and/or any of its affiliates not waived fees or reimbursed a portion of expenses, total return would have been reduced.
(d) The benefits derived from expense reductions had an impact of less than 0.01%.
See Accompanying Notes to Financial Statements.
19
Notes to Financial Statements – Columbia New York Tax-Exempt Fund
October 31, 2009
Note 1. Organization
Columbia New York Tax-Exempt Fund (the "Fund"), a series of Columbia Funds Series Trust I (the "Trust"), is a non-diversified portfolio. The Trust is registered under the Investment Company Act of 1940, as amended (the "1940 Act"), as an open-end management investment company organized as a Massachusetts business trust.
Investment Objective
The Fund seeks total return, consisting of current income exempt from federal income tax and New York individual income tax and of capital appreciation, consistent with moderate fluctuation of principal.
Fund Shares
The Trust may issue an unlimited number of shares, and the Fund offers three classes of shares: Class A, Class B and Class C. Each share class has its own expense structure and sales charges, as applicable. Effective June 22, 2009, the Fund no longer accepts investments from new or existing investors in the Fund's Class B shares, except in connection with the reinvestment of any dividend and/or capital gain distributions in Class B shares of the Fund and exchanges by existing Class B shareholders of other Columbia Funds.
Class A shares are subject to a maximum front-end sales charge of 4.75% based on the amount of initial investment. Class A shares purchased without an initial sales charge in accounts aggregating $1 million to $50 million at the time of purchase are subject to a 1.00% contingent deferred sales charge ("CDSC") if the shares are sold within one year after purchase. Class B shares are subject to a maximum CDSC of 5.00% based upon the holding period after purchase. Class B shares will convert to Class A shares eight years after purchase. Class C shares are subject to a 1.00% CDSC on shares sold within one year after purchase.
Note 2. Significant Accounting Policies
The preparation of financial statements in accordance with accounting principles generally accepted in the United States of America ("GAAP") requires management to make certain estimates and assumptions that affect the reported amounts of assets and liabilities, the disclosure of contingent assets and liabilities at the date of the financial statements and the reported amounts of revenue and expenses during the reporting period. Actual results could differ from those estimates.
Management has evaluated the events and transactions that have occurred through December 18, 2009, the date the financial statements were issued, and noted no items requiring adjustment of the financial statements or additional disclosures except as disclosed in Note 4.
The following is a summary of significant accounting policies consistently followed by the Fund in the preparation of its financial statements.
Security Valuation
Debt securities generally are valued by pricing services approved by the Trust's Board of Trustees, based upon market transactions for normal, institutional-size trading units of similar securities. The services may use various pricing techniques which take into account appropriate factors such as yield, quality, coupon rate, maturity, type of issue, trading characteristics and other data, as well as broker quotes. Debt securities for which quotations are readily available are valued at an over-the-counter or exchange bid quotation.
Certain debt securities, which tend to be more thinly traded and of lesser quality, are priced based on fundamental analysis of the financial condition of the issuer and the estimated value of any collateral. Valuations developed through pricing techniques may vary from the actual amounts realized upon sale of the securities, and the potential variation may be greater for those securities valued using fundamental analysis.
Short-term investments maturing in 60 days or less are valued at amortized cost, which approximates market value.
Investments in other open-end investment companies are valued at net asset value.
Futures contracts are valued at the settlement price established each day by the board of trade or exchange on which they are traded.
Investments for which market quotations are not readily available, or that have quotations which management believes are not reliable, are valued at fair value as determined in good faith under consistently applied procedures established by and under the general supervision of the Board of Trustees. If a security is valued at fair value, such value is likely to be different from the last quoted market price for the security.
20
Columbia New York Tax-Exempt Fund, October 31, 2009
The determination of fair value often requires significant judgment. To determine fair value, management may use assumptions including but not limited to future cash flows and estimated risk premiums. Multiple inputs from various sources may be used to determine value.
Management establishes a hierarchy that prioritizes the inputs to valuation techniques used to measure fair value giving the highest priority to unadjusted quoted prices in active markets for identical securities (level 1 measurements) and the lowest priority to unobservable inputs (level 3 measurements) when market prices are not readily available or reliable. The three levels of the fair value hierarchy are described below:
• Level 1 – quoted prices in active markets for identical securities
• Level 2 – prices determined using other significant observable inputs (including quoted prices for similar securities, interest rates, prepayment speeds, credit risk and others)
• Level 3 – prices determined using significant unobservable inputs. In situations where quoted prices or observable inputs are unavailable or less reliable, unobservable inputs may be used. Unobservable inputs may include management's own assumptions about the factors market participants would use in pricing an investment.
The inputs or methodology used for valuing securities are not necessarily an indication of the risk associated with investing in those securities.
Security Transactions
Security transactions are accounted for on the trade date. Cost is determined and gains (losses) are based upon the specific identification method for both financial statement and federal income tax purposes.
Income Recognition
Interest income is recorded on the accrual basis. Premium and discount are amortized and accreted, respectively, on all debt securities, unless otherwise noted. Original issue discount is accreted to interest income over the life of the security with a corresponding increase in the cost basis. Dividend income is recorded on the ex-date.
Expenses
General expenses of the Trust are allocated to the Fund and other series of the Trust based upon relative net assets or other expense allocation methodologies determined by the nature of the expense. Expenses directly attributable to the Fund are charged to the Fund.
Determination of Class Net Asset Value
All income, expenses (other than class-specific expenses, as shown on the Statement of Operations) and realized and unrealized gains (losses) are allocated to each class of the Fund on a daily basis for purposes of determining the net asset value of each class. Income and expenses are allocated to each class based on the settled shares method, while realized and unrealized gains (losses) are allocated based on the relative net assets of each class.
Federal Income Tax Status
The Fund intends to qualify each year as a "regulated investment company" under Subchapter M of the Internal Revenue Code, as amended, and will distribute substantially all of its tax exempt or taxable income, if any, for its tax year, and as such will not be subject to federal income taxes. In addition, the Fund intends to distribute in each calendar year substantially all of its net investment income, capital gains and certain other amounts, if any, such that the Fund should not be subject to federal excise tax. Therefore, no federal income or excise tax provision is recorded.
Distributions to Shareholders
Distributions from net investment income are declared daily and paid monthly. Net realized capital gains, if any, are distributed at least annually. Income distributions and capital gain distributions are determined in accordance with federal income tax regulations which may differ from GAAP.
Indemnification
In the normal course of business, the Fund enters into contracts that contain a variety of representations and warranties and which provide general indemnities. The Fund's maximum exposure under these arrangements is unknown because this would involve future claims against the Fund. Also, under the Trust's organizational documents and by contract, the Trustees and officers of the Trust are
21
Columbia New York Tax-Exempt Fund, October 31, 2009
indemnified against certain liabilities that may arise out of actions relating to their duties to the Trust. However, based on experience, the Fund expects the risk of loss due to these representations, warranties and indemnities to be minimal.
Note 3. Federal Tax Information
The timing and character of income and capital gain distributions are determined in accordance with income tax regulations, which may differ from GAAP. Reclassifications are made to the Fund's capital accounts for permanent tax differences to reflect income and gains available for distribution (or available capital loss carryforwards) under income tax regulations.
For the year ended October 31, 2009, permanent book and tax basis differences resulting primarily from differing treatments for discount accretion/premium amortization on debt securities were identified and reclassified among the components of the Fund's net assets as follows:
Undistributed
Net Investment
Income | | Accumulated
Net Realized
Gain | | Paid-In Capital | |
| $ | (4,893 | ) | | $ | 4,893 | | | $ | — | | |
Net investment income and net realized gains (losses), as disclosed on the Statement of Operations, and net assets were not affected by this reclassification.
The tax character of distributions paid during the years ended October 31, 2009 and October 31, 2008 was as follows:
| | | October 31, | |
| | | 2009 | | 2008 | |
| Tax-Exempt Income | | $ | 2,813,616 | | | $ | 2,840,490 | | |
| Long-Term Capital Gains | | | 799,877 | | | | 757,301 | | |
As of October 31, 2009, the components of distributable earnings on a tax basis were as follows:
Undistributed
Tax-Exempt
Income | | Undistributed
Ordinary
Income | | Undistributed
Long-Term
Capital Gains | | Net
Unrealized
Appreciation* | |
| $ | 221,842 | | | $ | 455,518 | | | $ | 1,662,391 | | | $ | 2,250,849 | | |
* The differences between book-basis and tax-basis net unrealized appreciation are primarily due to discount accretion/premium amortization on debt securities.
Unrealized appreciation and depreciation at October 31, 2009, based on cost of investments for federal income tax purposes were:
| Unrealized appreciation | | $ | 3,712,299 | | |
| Unrealized depreciation | | | (1,461,450 | ) | |
| Net unrealized appreciation | | $ | 2,250,849 | | |
Management is required to determine whether a tax position of the Fund is more likely than not to be sustained upon examination by the applicable taxing authority, including resolution of any related appeals or litigation processes, based on the technical merits of the position. The tax benefit to be recognized by the Fund is measured as the largest amount of benefit that is greater than fifty percent likely of being realized upon ultimate settlement. Management is not aware of any tax positions for which it is reasonably possible that the total amounts of unrecognized tax benefits will significantly change in the next twelve months. However, management's conclusions may be subject to review and adjustment at a later date based on factors including, but not limited to, new tax laws, regulations, and administrative interpretations (including relevant court decisions). The Fund's federal tax returns for the prior three fiscal year s remain subject to examination by the Internal Revenue Service.
22
Columbia New York Tax-Exempt Fund, October 31, 2009
Note 4. Fees and Compensation Paid to Affiliates
Investment Advisory Fee
Columbia Management Advisors, LLC ("Columbia"), an indirect, wholly owned subsidiary of Bank of America Corporation ("BOA"), provides investment advisory, administrative and other services to the Fund. Columbia receives a monthly investment advisory fee based on the Fund's pro-rata portion of the combined average daily net assets of the Fund, Columbia California Tax-Exempt Fund, Columbia Connecticut Tax-Exempt Fund and Columbia Massachusetts Tax-Exempt Fund as follows:
| Combined Average Daily Net Assets | | Annual Fee Rate | |
| First $1 billion | | | 0.50 | % | |
| $1 billion to $3 billion | | | 0.45 | % | |
| Over $3 billion | | | 0.40 | % | |
For the year ended October 31, 2009, the Fund's effective investment advisory fee rate was 0.50% of the Fund's average daily net assets.
BOA entered into an agreement dated September 29, 2009 to sell a portion of the asset management business of Columbia Management Group, LLC to Ameriprise Financial, Inc. The transaction ("Transaction") includes a sale of the part of the asset management business that advises long-term mutual funds, including the Fund. The Transaction is subject to certain approvals and other conditions to closing, and is currently expected to close in the spring of 2010.
Pricing and Bookkeeping Fees
The Fund has entered into a Financial Reporting Services Agreement (the "Financial Reporting Services Agreement") with State Street Bank & Trust Company ("State Street") and Columbia pursuant to which State Street provides financial reporting services to the Fund. The Fund has also entered into an Accounting Services Agreement (collectively with the Financial Reporting Services Agreement, the "State Street Agreements") with State Street and Columbia pursuant to which State Street provides accounting services to the Fund. Under the State Street Agreements, the Fund pays State Street an annual fee of $38,000 paid monthly plus an additional monthly fee based on an annualized percentage rate of average daily net assets of the Fund for the month. The aggregate fee will not exceed $140,000 per year (exclusive of out-of-pocket expenses and charges). The Fund also reimburses State Street for certain out-of-pocket expenses and charge s.
The Fund has entered into a Pricing and Bookkeeping Oversight and Services Agreement (the "Services Agreement") with Columbia. Under the Services Agreement, Columbia provides services related to Fund expenses and the requirements of the Sarbanes-Oxley Act of 2002, and provides oversight of the accounting and financial reporting services provided by State Street. Under the Services Agreement, the Fund reimburses Columbia for out-of-pocket expenses.
Transfer Agent Fee
Columbia Management Services, Inc. (the "Transfer Agent"), an affiliate of Columbia and an indirect, wholly owned subsidiary of BOA, provides shareholder services to the Fund and has contracted with Boston Financial Data Services ("BFDS") to serve as sub-transfer agent. The Transfer Agent is entitled to receive a fee for its services, paid monthly, at the annual rate of $17.34 per account plus reimbursement of certain sub-transfer agent fees paid by the Transfer Agent (exclusive of BFDS fees), calculated based on assets held in omnibus accounts and intended to recover the cost of payments to other parties (including affiliates of BOA) for services to those accounts. Effective November 1, 2009, the annual rate changed to $22.36 per account. The Transfer Agent pays the fees of BFDS for ser vices as sub-transfer agent and is not entitled to reimbursement for such fees from the Fund.
The Transfer Agent may also retain, as additional compensation for its services, fees for wire, telephone and redemption orders, Individual Retirement Account ("IRA") trustee agent fees and account transcript fees due to the Transfer Agent from shareholders of the Fund and credits (net of bank charges) earned with respect to balances in accounts the Transfer Agent maintains in connection with its services to the Fund. The Transfer Agent also receives reimbursement for certain out-of-pocket expenses.
An annual minimum account balance fee of $20 may apply to certain accounts with a value below the Fund's initial minimum investment requirements to reduce the impact of small accounts on transfer agent fees. These minimum
23
Columbia New York Tax-Exempt Fund, October 31, 2009
account balance fees are recorded as part of expense reductions on the Statement of Operations. For the year ended October 31, 2009, no minimum account balance fees were charged by the Fund.
Underwriting Discounts, Service and Distribution Fees
Columbia Management Distributors, Inc. (the "Distributor"), an affiliate of Columbia and an indirect, wholly owned subsidiary of BOA, is the principal underwriter of the Fund's shares. For the year ended October 31, 2009, the Distributor has retained net underwriting discounts of $8,410 on sales of the Fund's Class A shares and received net CDSC fees of $2,394 and $453 on Class B and Class C share redemptions, respectively.
The Fund has adopted distribution and shareholder servicing plans (the "Plans") pursuant to Rule 12b-1 under the 1940 Act, which require the payment of distribution and service fees. The fees are intended to compensate the Distributor and/or eligible selling and/or servicing agents for selling shares of the Fund and providing services to investors. The service fee is equal to 0.10% annually of the net assets attributable to shares of the Fund issued prior to December 1, 1994 and 0.25% annually of the net assets attributable to shares issued thereafter. This arrangement results in an annual rate of service fee for all shares that is a blend between the 0.10% and 0.25% rates. For the year ended October 31, 2009, the Fund's effective service fee rate was 0.24% of the Fund's average daily net assets attributable to Class A, Class B and Class C shares.
The Plans also require the payment of a monthly distribution fee to the Distributor equal to 0.75% annually of the average daily net assets attributable to Class B and Class C shares only. The Distributor has voluntarily agreed to waive a portion of the distribution fee for Class C shares so that it does not exceed 0.45% annually of the average daily net assets attributable to Class C shares. This arrangement may be modified or terminated by the Distributor at any time.
Fee Waivers and Expense Reimbursements
Columbia has voluntarily agreed to reimburse a portion of the Fund's expenses so that the Fund's ordinary operating expenses (excluding any distribution and service fees, brokerage commissions, interest, taxes and extraordinary expenses, but including custodian charges relating to overdrafts, if any), after giving effect to any balance credits from the Fund's custodian, do not exceed 0.60% of the Fund's average daily net assets on an annualized basis. Columbia, in its discretion, may revise or discontinue this arrangement any time.
Fees Paid to Officers and Trustees
All officers of the Fund are employees of Columbia or its affiliates and, with the exception of the Fund's Chief Compliance Officer, receive no compensation from the Fund. The Board of Trustees has appointed a Chief Compliance Officer to the Fund in accordance with federal securities regulations. The Fund, along with other affiliated funds, pays its pro-rata share of the expenses associated with the Chief Compliance Officer. The Fund's expenses for the Chief Compliance Officer will not exceed $15,000 per year.
The Trust's eligible Trustees may participate in a deferred compensation plan which may be terminated at any time. Obligations of the plan will be paid solely out of the Fund's assets.
Other
The Fund may make daily investments of cash balances in Columbia New York Tax-Exempt Reserves, an affiliated open-ended investment company, pursuant to an exemptive order received from the Securities and Exchange Commission. As an investing Fund, the Fund indirectly bears its proportionate share of the expenses of Columbia New York Tax-Exempt Reserves.
Note 5. Custody Credits
The Fund has an agreement with its custodian bank under which custody fees may be reduced by balance credits. These credits are recorded as part of expense reductions on the Statement of Operations. The Fund could have invested a portion of the assets utilized in connection with the expense offset arrangement in an income-producing asset if it had not entered into such an agreement.
For the year ended October 31, 2009, these custody credits reduced total expenses by $607 for the Fund.
24
Columbia New York Tax-Exempt Fund, October 31, 2009
Note 6. Objectives and Strategies for Investing in Derivatives Instruments
The Fund uses derivatives instruments including futures contracts in order to meet its investment objectives. The Fund employs strategies in differing combinations to permit it to increase, decrease or change the level of exposure to market risk factors. The achievement of any strategy relating to derivatives depends on analysis of various risk factors, and if the strategies for use of derivatives do not work as intended, the Fund may not achieve its investment objectives.
In pursuit of its investment objectives, the Fund is exposed to the following market risks:
Interest Rate Risk: Interest rate risk relates to the fluctuation in value of fixed income securities because of the inverse relationship of price and yield. Fixed income securities generally will decline in value upon an increase in general interest rates and their value generally will increase upon a decline in general interest rates. Fixed income securities with longer durations tend to be more sensitive to changes in interest rates, usually making them more volatile than securities with shorter durations.
Futures Contracts
The Fund entered into interest rate futures contracts to manage the duration and yield curve exposure of the Fund versus the benchmark.
The use of futures contracts involves certain risks, which include: (1) imperfect correlation between the price movement of the instruments and the underlying securities, (2) inability to close out positions due to differing trading hours, or the temporary absence of a liquid market, for either the instruments or the underlying securities, or (3) an inaccurate prediction of the future direction of interest rates by Columbia.
Upon entering into a futures contract, the Fund pledges cash or securities with the broker in an amount sufficient to meet the initial margin requirement. Subsequent payments are made or received by the Fund equal to the daily change in the contract value and are recorded as variation margin receivable or payable and offset in unrealized gains or losses. The Fund recognizes a realized gain or loss when the contract is closed or expires.
Futures contracts involve, to varying degrees, risk of loss in excess of the variation margin disclosed on the Fund's Statement of Assets and Liabilities.
During the year ended October 31, 2009, the Fund entered into 23 futures contracts. The Fund did not have any open futures contracts at the end of the year.
The effect of derivative instruments on the Statement of Operations for the year ended October 31, 2009.
Amount of Realized Gain or (Loss)
on Derivatives Recognized in Income | |
| Risk Exposure | | Futures Contracts | |
| Interest Rate | | $ | 28,426 | | |
Note 7. Portfolio Information
For the year ended October 31, 2009, the cost of purchases and proceeds from sales of securities, excluding short-term obligations, for the Fund were $12,830,848 and $12,545,250, respectively.
Note 8. Line of Credit
The Fund and other affiliated funds participate in a $280,000,000 committed, unsecured revolving line of credit provided by State Street. The maximum amount that may be borrowed by any fund is limited to the lesser of $200,000,000 and the Fund's borrowing limit set forth in the Fund's registration statement. Borrowings are available for short-term liquidity or temporary or emergency purposes.
Effective October 15, 2009, interest is charged to each participating fund based on the fund's borrowings at a rate per annum equal to the greater of the Federal Funds Rate plus 1.25% or the overnight LIBOR Rate plus 1.25%. In addition, a commitment fee of 0.15% per annum is accrued and apportioned among the participating funds pro rata based on their relative net assets.
Prior to October 15, 2009, interest was charged to each participating fund based on the fund's borrowings at a rate per annum equal to the greater of the Federal Funds Rate plus 0.50% or the overnight LIBOR Rate plus 0.50%. In addition, an annual operations agency fee of $20,000, an amendment fee of 0.02% and a commitment fee of 0.12% per
25
Columbia New York Tax-Exempt Fund, October 31, 2009
annum were accrued and apportioned among the participating funds pro rata based on their relative net assets.
For the year ended October 31, 2009, the Fund did not borrow under these arrangements.
Note 9. Shares of Beneficial Interest
As of October 31, 2009, 13.7% of the Fund's shares outstanding were beneficially owned by one participant account over which BOA and/or any of its affiliates had either sole or joint investment discretion.
As of October 31, 2009, the Fund had one shareholder that held 11.7% of the shares outstanding, over which BOA and/or any of its affiliates did not have investment discretion.
Subscription and redemption activity of these accounts may have a significant effect on the operations of the Fund.
Note 10. Significant Risks and Contingencies
Sector Focus Risk
The Fund may focus its investments in certain sectors, subjecting it to greater risk than a fund that is less focused.
Non-Diversified Risk
The Fund is a non-diversified Fund, which generally means that it may invest a greater percentage of its total assets in the securities of fewer issuers than a "diversified" fund. This increases the risk that a change in the value of any one investment held by the Fund could affect the overall value of the Fund more than it would affect that of a diversified fund holding a greater number of investments. Accordingly, the Fund's value will likely be more volatile than the value of more diversified funds. The Fund may not operate as a non-diversified fund at all times.
Geographic Concentration Risk
The Fund had greater than 5% of its total net assets at October 31, 2009, invested in debt obligations issued by New York and its political subdivisions, agencies and public authorities. The Fund is more susceptible to economic and political factors adversely affecting issuers of this state's municipal securities than are municipal bond funds that are not concentrated to the same extent in these issuers.
Concentration of Credit Risk
The Fund holds investments that are insured by private insurers who guarantee the payment of principal and interest in the event of default or that are supported by a letter of credit. At October 31, 2009, private insurers who insured greater than 5% of the total net assets of the Fund were as follows:
| Insurer | | % of Total
Net Assets | |
| National Public Finance Guarantee Corp. | | | 11.2 | | |
| Ambac Assurance Corp. | | | 5.5 | | |
At November 25, 2009, National Public Finance Guarantee Corp. and Ambac Assurance Corp. were rated by Standard & Poor's A and CC, respectively.
Tax Development Risk
The Fund purchases municipal securities whose interest, in the opinion of bond counsel, is free from federal income tax. There is no assurance that the Internal Revenue Service (IRS) will agree with this opinion. In the event the IRS determines that an issuer does not comply with relevant tax requirements, interest payments from a security could become federally taxable, possibly retroactively to the date the security was issued. As a shareholder of the Fund, you may be required to file an amended tax return as a result.
Legal Proceedings
Columbia Management Advisors, LLC and Columbia Management Distributors, Inc. (collectively, the "Columbia Group") are subject to a settlement agreement with the New York Attorney General ("NYAG") (the "NYAG Settlement") and a settlement order with the SEC (the "SEC Order") on matters relating to mutual fund trading, each dated February 9, 2005. Under the terms of the SEC Order, the Columbia Group (or predecessor entities) agreed, among other things, to: pay disgorgement and civil money penalties collectively totaling $140 million; cease and desist from violations of the antifraud provisions and certain other provisions of the federal securities laws; maintain certain compliance and ethics oversight structures; and retain an independent consultant to review the Columbia Group's applicable supervisory, compliance, control and other policies
26
Columbia New York Tax-Exempt Fund, October 31, 2009
and procedures. The NYAG Settlement, among other things, requires Columbia Management Advisors, LLC and its affiliates to reduce management fees for certain funds in the Columbia family of mutual funds in a projected total of $160 million over five years through November 30, 2009 and to make certain disclosures to investors relating to expenses. In connection with the Columbia Group providing services to the Columbia Funds, the Columbia Funds have voluntarily undertaken to implement certain governance measures designed to maintain the independence of their boards of trustees and certain special consulting and compliance measures.
Pursuant to the SEC Order and related procedures, the $140 million in settlement amounts described above has been substantially distributed in accordance with a distribution plan that was developed by an independent distribution consultant and approved by the SEC on April 6, 2007.
In connection with the events described above, various parties have filed suit against certain funds, the Trustees of the Columbia Funds, FleetBoston Financial Corporation and its affiliated entities and/or Bank of America and its affiliated entities.
On February 20, 2004, the Judicial Panel on Multidistrict Litigation transferred these cases and cases against other mutual fund companies based on similar allegations to the United States District Court in Maryland for consolidated or coordinated pretrial proceedings (the "MDL"). Subsequently, additional related cases were transferred to the MDL. On September 29, 2004, the plaintiffs in the MDL filed amended and consolidated complaints. One of these amended complaints is a putative class action that includes claims under the federal securities laws and state common law, and that names Columbia Management Advisors, Inc. (which has since merged into Banc of America Capital Management, LLC (now named Columbia Management Advisors, LLC)) ("Columbia"), Columbia Funds Distributor, Inc. (now named Columbia Management Distributors, Inc.) (the "Distributor"), the Trustees of the Columbia Funds, Bank of America Corporation and others as d efendants. Another of the amended complaints is a derivative action purportedly on behalf of the Columbia Funds that asserts claims under federal securities laws and state common law.
On February 25, 2005, Columbia and other defendants filed motions to dismiss the claims in the pending cases. On March 1, 2006, for reasons stated in the court's memoranda dated November 3, 2005, the United States District Court for the District of Maryland granted in part and denied in part the defendants' motions to dismiss. The court dismissed all of the class action claims pending against the Columbia Funds Trusts. As to Columbia and the Distributor, the claims under the Securities Act of 1933, the claims under Sections 34(b) and 36(a) of the Investment Company Act of 1940 ("ICA") and the state law claims were dismissed. The claims under Sections 10(b) and 20(a) of the Securities Exchange Act of 1934 and claims under Section 36(b) of the ICA were not dismissed.
On March 21, 2005, a purported class action was filed in Massachusetts state court alleging that certain conduct, including market timing, entitled Class B shareholders in certain Columbia Funds to an exemption from contingent deferred sales charges upon early redemption (the "CDSC Lawsuit"). The CDSC Lawsuit was removed to federal court in Massachusetts and transferred to the MDL.
On September 14, 2007, the plaintiffs and the Columbia defendants named in the MDL, including the Columbia Funds, entered into a stipulation of settlement with respect to all Columbia-related claims in the MDL described above, including the CDSC Lawsuit. The settlement is subject to court approval.
27
Report of Independent Registered Public Accounting Firm
To the Trustees of Columbia Funds Series Trust I and the Shareholders of Columbia New York Tax-Exempt Fund:
In our opinion, the accompanying statement of assets and liabilities, including the investment portfolio, and the related statements of operations and of changes in net assets and the financial highlights present fairly, in all material respects, the financial position of Columbia New York Tax-Exempt Fund (the "Fund") (a series of Columbia Funds Series Trust I) at October 31, 2009, the results of its operations for the year then ended, the changes in its net assets for each of the two years in the period then ended and the financial highlights for each of the five years in the period then ended, in conformity with accounting principles generally accepted in the United States of America. These financial statements and financial highlights (hereafter referred to as "financial statements") are the responsibility of the Fund's management. Our responsibility is to express an opinion on these financial statements based on our audits. We conducted our audits of these financial statements in accordance with the standards of the Public Company Accounting Oversight Board (United States). Those standards require that we plan and perform the audit to obtain reasonable assurance about whether the financial statements are free of material misstatement. An audit includes examining, on a test basis, evidence supporting the amounts and disclosures in the financial statements, assessing the accounting principles used and significant estimates made by management, and evaluating the overall financial statement presentation. We believe that our audits, which included confirmation of securities at October 31, 2009 by correspondence with the custodian and brokers, provide a reasonable basis for our opinion.
PricewaterhouseCoopers LLP
Boston, Massachusetts
December 18, 2009
28
Federal Income Tax Information (Unaudited)
The Fund hereby designates as a capital gain dividend with respect to the fiscal year ended October 31, 2009, $1,780,404, or, if subsequently determined to be different, the net capital gain of such year.
For the fiscal year ended October 31, 2009, 100.0% of the distributions from net investment income will be treated as exempt income for federal income tax purposes.
The Fund will notify shareholders in January 2010 of amounts for use in preparing 2009 income tax returns.
29
Fund Governance
The Trustees serve terms of indefinite duration. The names, addresses and ages of the Trustees and officers of the Funds in the Columbia Funds Series Trust I, the year each was first elected or appointed to office, their principal business occupations during at least the last five years, the number of Funds overseen by each Trustee and other directorships they hold are shown below. Each officer listed below serves as an officer of each Fund in the Columbia Funds Complex.
Independent Trustees
Name, Address and Year of Birth,
Position with Funds, Year First
Elected or Appointed to Office | | Principal Occupation(s) During Past Five Years, Number of Funds in the Columbia
Funds Complex Overseen by Trustee, Other Directorships Held
| |
| John D. Collins (Born 1938) | |
|
c/o Columbia Management
Advisors, LLC
One Financial Center
Boston, MA 02111
Trustee (since 2007) | | Retired. Consultant, KPMG, LLP (accounting and tax firm) from July 1999 to June 2000; Partner, KPMG, LLP from March 1962 to June 1999. Oversees 66, Mrs. Fields Famous Brands LLC (consumer products); Suburban Propane Partners, L.P.; and Montpelier Re (insurance underwriting firm) | |
|
| Rodman L. Drake (Born 1943) | |
|
c/o Columbia Management
Advisors, LLC
One Financial Center
Boston, MA 02111
Trustee (since 2007)
and Chairman of the Board
(since 2009) | | Co-Founder of Baringo Capital LLC (private equity) since 2002; President, Continuation Investments Group, Inc. from 1997 to 2001. Oversees 66, Jackson Hewitt Tax Service Inc. (tax preparation services); Crystal Capital River Inc. (real estate investment trust); Student Loan Corporation (student loan provider); Celgene Corporation (global biotechnology company); and The Helios Funds (exchange-traded funds) | |
|
| Douglas A. Hacker (Born 1955) | |
|
c/o Columbia Management
Advisors, LLC
One Financial Center
Boston, MA 02111
Trustee (since 1996) | | Independent business executive since May 2006; Executive Vice President—Strategy of United Airlines (airline) from December 2002 to May 2006; President of UAL Loyalty Services (airline marketing company) from September 2001 to December 2002; Executive Vice President and Chief Financial Officer of United Airlines from July 1999 to September 2001. Oversees 66, Nash Finch Company (food distributor); Aircastle Limited (aircraft leasing) | |
|
| Janet Langford Kelly (Born 1957) | |
|
c/o Columbia Management
Advisors, LLC
One Financial Center
Boston, MA 02111
Trustee (since 1996) | | Senior Vice President, General Counsel and Corporate Secretary, ConocoPhillips (integrated energy company) since September 2007; Deputy General Counsel—Corporate Legal Services, ConocoPhillips from August 2006 to August 2007; Partner, Zelle, Hofmann, Voelbel, Mason&Gette LLP (law firm) from March 2005 to July 2006; Adjunct Professor of Law, Northwestern University, from September 2004 to June 2006; Director, UAL Corporation (airline) from February 2006 to July 2006; Oversees 66, None | |
|
| Charles R. Nelson (Born 1942) | |
|
c/o Columbia Management
Advisors, LLC
One Financial Center
Boston, MA 02111
Trustee (since 1981) | | Professor of Economics, University of Washington, since January 1976; Ford and Louisa Van Voorhis Professor of Political Economy, University of Washington, since September 1993; Adjunct Professor of Statistics, University of Washington, since September 1980; Associate Editor, Journal of Money Credit and Banking, 1993-2008 Consultant on econometric and statistical matters. Oversees 66, None | |
|
30
Fund Governance (continued)
Independent Trustees (continued)
Name, Address and Year of Birth,
Position with Funds, Year First
Elected or Appointed to Office | | Principal Occupation(s) During Past Five Years, Number of Funds in the Columbia
Funds Complex Overseen by Trustee, Other Directorships Held
| |
| John J. Neuhauser (Born 1943) | |
|
c/o Columbia Management
Advisors, LLC
One Financial Center
Boston, MA 02111
Trustee (since 1985) | | President, Saint Michael's College, since August 2007; University Professor, Boston College from November 2005 to August 2007; Academic Vice President and Dean of Faculties, Boston College from August 1999 to October 2005. Oversees 66, Liberty All-Star Equity Fund and Liberty All-Star Growth Fund, Inc. (closed-end funds) | |
|
| Jonathan Piel (Born 1938) | |
|
c/o Columbia Management
Advisors, LLC
One Financial Center
Boston, MA 02111
Trustee (since 2007) | | Cable television producer and website designer; The Editor, Scientific American from 1984 to 1994; Vice President, Scientific American, Inc., from 1984 to 1994; Member, Advisory Board, Stone Age Institute, Bloomington, Indiana (research institute that explores the effect of technology on human evolution); Member, Board of Directors of the National Institute of Social Sciences, New York City; Member, Board of Trustees of the William Alanson White Institute, New York City (institution for training psychoanalysts); and Member, Advisory Board, Mount Sinai Children's Environmental Health Center, New York. Oversees 66, None | |
|
| Patrick J. Simpson (Born 1944) | |
|
c/o Columbia Management
Advisors, LLC
One Financial Center
Boston, MA 02111
Trustee (since 2000) | | Partner, Perkins Coie LLP (law firm). Oversees 66, None | |
|
| Thomas C. Theobald (Born 1937) | |
|
c/o Columbia Management
Advisors, LLC
One Financial Center
Boston, MA 02111
Trustee (since 1996) | | Partner and Senior Advisor, Chicago Growth Partners (private equity investing) since September 2004; Managing Director, William Blair Capital Partners (private equity investing) from September 1994 to September 2004. Oversees 66, Anixter International (network support equipment distributor); Ventas, Inc. (real estate investment trust); Jones Lang LaSalle (real estate management services); Ambac Financial Group (financial guaranty insurance) | |
|
| Anne-Lee Verville (Born 1945) | |
|
c/o Columbia Management
Advisors, LLC
One Financial Center
Boston, MA 02111
Trustee (since 1998) | | Retired since 1997 (formerly General Manager—Global Education Industry (from 1994 to 1997), President-Application Systems Division (from 1991 to 1994), Chief Financial Officer—US Marketing&Services (from 1988 to 1991), and Chief Information Officer (from 1987 to 1988), IBM Corporation (computer and technology)). Oversees 66, None | |
|
31
Fund Governance (continued)
Interested Trustee
Name, Address and Year of Birth,
Position with Funds, Year First
Elected or Appointed to Office | | Principal Occupation(s) During Past Five Years, Number of Funds in the Columbia
Funds Complex Overseen by Trustee, Other Directorships Held
| |
| William E. Mayer1 (Born 1940) | |
|
c/o Columbia Management
Advisors, LLC
One Financial Center
Boston, MA 02111
Trustee (since 1994) | | Partner, Park Avenue Equity Partners (private equity) since February 1999; Dean and Professor, College of Business, University of Maryland from 1992 to 1997. Oversees 66, Lee Enterprises (print media),WRHambrecht + Co. (financial service provider); BlackRock Kelso Capital Corporation (investment company) | |
|
1 The Funds currently treat Mr. Mayer as an "interested person" (as defined in the Investment Company Act of 1940) by reason of his affiliation with WR Hambrecht + Co., a registered broker/dealer that may execute portfolio transactions for or engage in principal transactions with the Funds or other funds or accounts advised/managed by the Advisor or other Bank of America affiliates.
The Statement of Additional Information includes additional information about the Trustees of the Funds and is available, without charge, upon request by calling 1-800-345-6611.
Officers
Name, Address and Year of Birth,
Position with Funds, Year First
Elected or Appointed to Office | | Principal Occupation(s) During Past Five Years
| |
| J. Kevin Connaughton (Born 1964) | |
|
One Financial Center
Boston, MA 02111
President (since 2009) | | Managing Director of Columbia Management Advisors, LLC since December 2004; Senior Vice President and Chief Financial Officer—Columbia Funds, from June 2008 to January 2009; Treasurer—Columbia Funds, from October 2003 to May 2008; Treasurer—the Liberty Funds, Stein Roe Funds and Liberty All-Star Funds, December 2000-December 2006; Senior Vice President—Columbia Management Advisors, LLC, from April 2003 to December 2004; President—Columbia Funds, Liberty Funds and Stein Roe Funds, February 2004 to October 2004; Treasurer—Galaxy Funds, September 2002 to December 2005; Treasurer, December 2002 to December 2004, and President, February 2004 to December 2004—Columbia Management Multi-Strategy Hedge Fund, LLC; and a senior officer of various other Bank of America-affiliated entities, including other registered and unregistered funds. | |
|
| James R. Bordewick, Jr. (Born 1959) | |
|
One Financial Center
Boston, MA 02111
Senior Vice President, Secretary
and Chief Legal Officer (since 2006) | | Associate General Counsel, Bank of America since April 2005; Senior Vice President and Associate General Counsel, MFS Investment Management (investment management) prior to April 2005. | |
|
| Linda J. Wondrack (Born 1964) | |
|
One Financial Center
Boston, MA 02111
Senior Vice President and
Chief Compliance Officer
(since 2007) | | Director (Columbia Management Group LLC and Investment Product Group Compliance), Bank of America since June 2005; Director of Corporate Compliance and Conflicts Officer, MFS Investment Management (investment management), August 2004 to May 2005; Managing Director, Deutsche Asset Management (investment management) prior to August 2004. | |
|
32
Fund Governance (continued)
Officers (continued)
Name, Address and Year of Birth,
Position with Funds, Year First
Elected or Appointed to Office | | Principal Occupation(s) During Past Five Years
| |
| Michael G. Clarke (Born 1969) | |
|
One Financial Center
Boston, MA 02111
Senior Vice President and
Chief Financial Officer
(since 2009) | | Director of Fund Administration of the Advisor since January 2006; Managing Director of the Advisor September 2004 to December 2005; Vice President Fund Administration June 2002 to September 2004. | |
|
| Jeffrey R. Coleman (Born 1969) | |
|
One Financial Center
Boston, MA 02111
Deputy Treasurer (since 2006) | | Director of Fund Administration of the Advisor since January 2006; Fund Controller of the Advisor from October 2004 to January 2006; Vice President of CDC IXIS Asset Management Services, Inc. (investment management) from August 2000 to September 2004. | |
|
| Joseph F. DiMaria (Born 1968) | |
|
One Financial Center
Boston, MA 02111
Chief Accounting Officer and
Treasurer (since 2009) | | Director of Fund Administration of the Advisor since January 2006; Head of Tax/Compliance and Assistant Treasurer of the Advisor from November 2004 to December 2005; Director of Trustee Administration (Sarbanes-Oxley) of the Advisor from May 2003 to October 2004. | |
|
| Julian Quero (Born 1967) | |
|
One Financial Center
Boston, MA 02111
Deputy Treasurer (since 2008) | | Senior Tax Manager of the Advisor since August 2006; Senior Compliance Manager of the Advisor from April 2002 to August 2006. | |
|
| Barry S. Vallan (Born 1969) | |
|
One Financial Center
Boston, MA 02111
Controller (since 2006) | | Vice President—Fund Treasury of the Advisor since October 2004; Vice President—Trustee Reporting of the Advisor from April 2002 to October 2004. | |
|
| Stephen T. Welsh (Born 1957) | |
|
One Financial Center
Boston, MA 02111
Vice President (since 1996) | | President, Columbia Management Services, Inc. since July 2004; Senior Vice President and Controller, Columbia Management Services, Inc. prior to July 2004. | |
|
33
Board Consideration and Approval of Advisory Agreements
The Advisory Fees and Expenses Committee of the Board of Trustees meets several times annually to review the advisory agreements (collectively, the "Agreements") of the funds for which the Trustees serve as trustees (each a "fund") and to determine whether to recommend that the full Board approve the continuation of the Agreements for an additional one-year period. After the Committee has made its recommendation, the full Board, including the Independent Trustees, determines whether to approve the continuation of the Agreements. In addition, the full Board, including the Independent Trustees, considers matters bearing on the Agreements at most of its other meetings throughout the year and meets regularly with senior management of the funds and Columbia, the funds' investment adviser, including the senior manager of each investment area within Columbia. Through the Board's Investment Oversight Committees, Trustees also meet with selected fund portfolio managers, research analysts and traders at various times throughout the year.
The Trustees receive and review all materials that they, their legal counsel or Columbia believe to be reasonably necessary for the Trustees to evaluate the Agreements and to determine whether to approve the continuation of the Agreements. Those materials generally include, among other items, (i) information on the investment performance of each fund relative to the performance of peer groups of mutual funds and the fund's performance benchmarks, and additional information assessing performance on a risk-adjusted basis, (ii) information on each fund's advisory fees and other expenses, including information comparing the fund's expenses to those of peer groups of mutual funds and information about any applicable expense caps and fee "breakpoints," (iii) information about the profitability of the Agreements to Columbia, including potential "fall-out" or ancillary benefits that Columbia and its affiliates may receive as a result of their relationships with the funds and (iv) information obtained through Columbia's response to a questionnaire prepared at the request of the Trustees by counsel to the funds and independent legal counsel to the Independent Trustees. The Trustees also consider other information such as (v) Columbia's financial results and financial condition, (vi) each fund's investment objective and strategies and the size, education and experience of Columbia's investment staffs and their use of technology, external research and trading cost measurement tools, (vii) the allocation of the funds' brokerage and the use of "soft" commission dollars to pay for research products and services, (viii) Columbia's resources devoted to, and its record of compliance with, the funds' investment policies and restrictions, policies on personal securities transactions and other compliance policies and legal and regulatory requirements, (ix) Columbia's response to various legal and regulatory proceedings since 2003 and to the recent peri od of volatility in the securities markets and (x) the economic outlook generally and for the mutual fund industry in particular. In addition, the Advisory Fees and Expenses Committee confers with the funds' independent fee consultant and reviews materials relating to the funds' relationships with Columbia provided by the independent fee consultant. Throughout the process, the Trustees have the opportunity to ask questions of and to request additional materials from Columbia and to consult with the independent fee consultant and independent legal counsel to the Independent Trustees.
The Board of Trustees most recently approved the continuation of the Agreements at its October, 2009 meeting, following meetings of the Advisory Fees and Expenses Committee held in December, 2008 and February, May, June, August, September and October, 2009. In considering whether to approve the continuation of the Agreements, the Trustees, including the Independent Trustees, did not identify any single factor as determinative, and each weighed various factors as he or she deemed appropriate. The Trustees considered the following matters in connection with their approval of the continuation of the Agreements:
The nature, extent and quality of the services provided to the funds under the Agreements. The Trustees considered the nature, extent and quality of the services provided by Columbia and its affiliates to the funds and the resources dedicated to the funds by Columbia and its affiliates. Among other things, the Trustees considered (i) Columbia's ability (including its personnel and other resources, compensation programs for personnel involved in fund management, reputation and other attributes) to attract, motivate and retain highly qualified research, advisory and supervisory investment professionals; (ii) the portfolio management services provided by those investment professionals; and (iii) the trade execution services provided on behalf of the funds. For each fund, the Trustees also considered the benefits to shareholders of investing in a mutual f und that is part of a family of funds offering exposure to a variety of asset classes
34
and investment disciplines and providing a variety of fund and shareholder services. After reviewing those and related factors, the Trustees concluded, within the context of their overall conclusions regarding each of the Agreements, that the nature, extent and quality of services provided supported the continuation of the Agreements.
Investment performance of the funds and Columbia. The Trustees reviewed information about the performance of each fund over various time periods, including information prepared by an independent third-party data provider that compared the performance of each fund to the performance of peer groups of mutual funds and performance benchmarks. The Trustees also reviewed a description of the third party's methodology for identifying each fund's peer group for purposes of performance and expense comparisons. The Trustees also considered additional information that the Advisory Fees and Expenses Committee requested from Columbia relating to funds that presented relatively weaker performance and/or relatively higher fees or expenses. In the case of each fund whose performance lagged that of a relevant peer group for certain (although not necessarily all) peri ods, the Trustees concluded that other factors relevant to performance were sufficient, in light of other considerations, to warrant continuation of the fund's Agreements. Those factors varied from fund to fund, but included one or more of the following: (i) that the fund's performance, although lagging in certain recent periods, was stronger over the longer term; (ii) that the underperformance was attributable, to a significant extent, to investment decisions that were reasonable and consistent with the fund's investment strategy and policies and that the fund was performing within a reasonable range of expectations, given those investment decisions, market conditions and the fund's investment strategy; (iii) that the fund's performance was competitive when compared to other relevant performance benchmarks or peer groups; (iv) that Columbia had taken or was taking steps designed to help improve the fund's investment performance, including, but not limited to, replacing portfolio managers or modifying invest ment strategies; and (v) that Columbia proposed to waive advisory fees or cap the expenses of the fund.
The Trustees noted that, through April 30, 2009, Columbia New York Tax-Exempt Fund's performance was in the third quintile (where the best performance would be in the first quintile) for the one-, three- and five-year periods and in the first quintile for the ten-year period, of the peer group selected by an independent third-party data provider for purposes of performance comparisons.
The Trustees also considered Columbia's performance and reputation generally, the funds' performance as a fund family generally, and Columbia's historical responsiveness to Trustee concerns about performance and Columbia's willingness to take steps intended to improve performance. After reviewing those and related factors, the Trustees concluded, within the context of their overall conclusions regarding each of the Agreements, that the performance of each fund and Columbia was sufficient, in light of other considerations, to warrant the continuation of the Agreement(s) pertaining to that fund.
The costs of the services provided and profits realized by Columbia and its affiliates from their relationships with the funds. The Trustees considered the fees charged to the funds for advisory services as well as the total expense levels of the funds. That information included comparisons (provided by management and by an independent third-party data provider) of each fund's advisory fees and total expense levels to those of the fund's peer groups and information about the advisory fees charged by Columbia to comparable institutional accounts. In considering the fees charged to those accounts, the Trustees took into account, among other things, management's representations about the differences between managing mutual funds as compared to other types of accounts, including differences in the services provided, differences in the risk profile of such business for Columbia, and the additional resources required to manage mutual funds effectively. In evaluating each fund's advisory fees, the Trustees also took into account the demands, complexity and quality of the investment management of the fund. The Trustees considered existing advisory fee breakpoints, and Columbia's use of advisory fee waivers and expense caps, which benefited a number of the funds. The Trustees also noted management's stated justification for the fees charged to the funds, which included information about the investment performance of the funds and the services provided to the funds.
The Trustees considered that Columbia New York Tax-Exempt Fund's total expenses were in the second quintile and actual management fees were in the first quintile (where the lowest fees and expenses would be in the first quintile) of the peer group selected by an independent third-party data provider for purposes of expense comparisons.
35
The Trustees also considered the compensation directly or indirectly received by Columbia and its affiliates from their relationships with the funds. The Trustees reviewed information provided by management as to the profitability to Columbia and its affiliates of their relationships with each fund, and information about the allocation of expenses used to calculate profitability. When reviewing profitability, the Trustees also considered court cases in which adviser profitability was an issue in whole or in part, the performance of the relevant funds, the expense level of each fund, and whether Columbia had implemented breakpoints and/or expense caps with respect to the fund.
After reviewing those and related factors, the Trustees concluded, within the context of their overall conclusions regarding each of the Agreements, that the advisory fees charged to each fund, and the related profitability to Columbia and its affiliates of their relationships with the fund, supported the continuation of the Agreement(s) pertaining to that fund.
Economies of Scale. The Trustees considered the existence of any economies of scale in the provision by Columbia of services to each fund, to groups of related funds, and to Columbia's investment advisory clients as a whole and whether those economies were shared with the funds through breakpoints in the investment advisory fees or other means, such as fee waivers/expense reductions and additional investments by Columbia in investment, trading and compliance resources. The Trustees noted that many of the funds benefited from breakpoints, fee waivers/expense caps, or both. In considering those issues, the Trustees also took note of the costs of the services provided (both on an absolute and a relative basis) and the profitability to Columbia and its affiliates of their relationships with the funds, as discussed above.
After reviewing those and related factors, the Trustees concluded, within the context of their overall conclusions regarding each of the Agreements, that the extent to which economies of scale were shared with the funds supported the continuation of the Agreements.
Other Factors. The Trustees also considered other factors, which included but were not limited to the following:
n the extent to which each fund had operated in accordance with its investment objective and investment restrictions, the nature and scope of the compliance programs of the funds and Columbia and the compliance-related resources that Columbia and its affiliates were providing to the funds;
n the nature, quality, cost and extent of administrative and shareholder services overseen and performed by Columbia and its affiliates, both under the Agreements and under separate agreements for the provision of transfer agency and administrative services;
n so-called "fall-out benefits" to Columbia and its affiliates, such as the engagement of its affiliates to provide distribution, brokerage and transfer agency services to the funds, and the benefits of research made available to Columbia by reason of brokerage commissions generated by the funds' securities transactions, as well as possible conflicts of interest associated with those fall-out and other benefits, and the reporting, disclosure and other processes in place to disclose and monitor those possible conflicts of interest; and
n the report provided by the funds' independent fee consultant, which included information about and analysis of the funds' fees, expenses and performance.
Based on their evaluation of all factors that they deemed to be material, including those factors described above, and assisted by the advice of independent counsel and the independent fee consultant, the Trustees, including the Independent Trustees, approved the continuance of each of the Agreements through October 31, 2010.
36
Summary of Management Fee Evaluation by
Independent Fee Consultant
EXCERPTS FROM: REPORT OF INDEPENDENT FEE CONSULTANT TO THE FUNDS SUPERVISED BY THE COLUMBIA ATLANTIC BOARD
Prepared Pursuant to the February 9, 2005
Assurance of Discontinuance among the
Office of Attorney General of New York State,
Columbia Management Advisors, LLC, and
Columbia Management Distributors, Inc.
November 6, 2009
I. Overview
On February 9, 2005, Columbia Management Advisors, LLC ("CMA") and Columbia Management Distributors, Inc.1 ("CMDI") agreed to the New York Attorney General's Assurance of Discontinuance ("AOD"). Among other things, the AOD stipulates that CMA may manage or advise a Columbia Fund ("Columbia Fund" and, together with some or all of such funds, the "Columbia Funds") only if the Independent Members of the Columbia Fund's Board of Trustees appoint a Senior Officer or retain an Independent Fee Consultant ("IFC") who is to manage the process by which proposed management fees are negotiated. The AOD further stipulates that the Senior Officer or IFC is to prepare a written annual evaluation of the fee negotiation process.
With effect from January 1, 2007, the Independent Members of the Board of Trustees for certain Columbia Funds known collectively as the "Atlantic Funds" (together with the other members of that Board, the "Trustees") retained me as IFC for the Atlantic Funds.2 In this capacity, I have prepared the fifth annual written evaluation of the fee negotiation process. As was the case with the 2007 and 2008 reports, my immediate predecessor as IFC, John Rea, provided invaluable assistance in the preparation of this year's report.
A. Role of the Independent Fee Consultant
The AOD charges the IFC with "managing the process by which proposed management fees...to be charged the Columbia Fund are negotiated so that they are negotiated in a manner which is at arms' length and reasonable and consistent with this Assurance of Discontinuance." The AOD also provides that CMA "may manage or advise a Columbia Fund only if the reasonableness of the proposed management fees is determined by the Board of Trustees...using...an annual independent written evaluation prepared by or under the direction of...the Independent Fee Consultant." Therefore, the AOD makes clear that the IFC does not supplant the Trustees in negotiating management fees with CMA, nor does the IFC substitute his or her judgment for that of the Trustees with respect to the reasonableness of proposed fees or any other matter that is committed to the business judgment of the Trustees.
B. Elements Involved in Managing the Fee Negotiation Process
In preparing the report required by the AOD, the IFC must consider at least the following six factors set forth in the AOD:
1. The nature and quality of CMA's services, including the Fund's performance;
2. Management fees (including any components thereof) charged by other mutual fund companies for like services;
3. Possible economies of scale as the Fund grows larger;
4. Management fees (including any components thereof) charged to institutional and other clients of CMA for like services;
5. Costs to CMA and its affiliates of supplying services pursuant to the management fee agreements, excluding any intra-corporate profit; and
6. Profit margins of CMA and its affiliates from supplying such services.
C. Organization of the Annual Evaluation
This report, like last year's, focuses on the six factors and contains a section for each factor except that CMA's costs and profits from managing the Funds are treated in a single section. In addition to a discussion of these factors, the report offers recommendations to improve the fee review process in future years. A review of the status of recommendations made in the 2008 Report is being provided separately with the materials for the October meeting.
1 CMA and CMDI are subsidiaries of Columbia Management Group, LLC ("CMG"), and are the successors to the entities named in the AOD.
2 I have no material relationship with Bank of America, CMG or any of its affiliates, aside from serving as IFC, and I am aware of no material relationship with any of their affiliates. I retained John Rea, an independent economic consultant, to assist me with this report.
Unless otherwise stated or required by the context, this report covers only the Atlantic Funds, which are also referred as the "Funds."
37
II. Summary of Findings
A. General
1. Based upon my examination of the information supplied by CMG in the light of the six factors set forth in the AOD, I conclude that the Trustees have the relevant information necessary to evaluate the reasonableness of the proposed management fees for each Atlantic Fund.
2. In my view, the process by which the proposed management fees of the Funds have been negotiated in 2009 thus far has been, to the extent practicable, at arms' length and reasonable and consistent with the AOD.
B. Nature and Quality of Services, Including Performance
3. The performance of the Funds has been relatively strong in recent years, although the one-year record was weaker than longer-term records. Based upon 1-, 3-, 5-, and 10-year returns through April 30, 2009, at least half of all the Funds were in the first and second performance quintiles in each of the three longest performance periods; for the one-year period, 40% of the Funds were in the top two quintiles. No more than 13% of the Funds were in the fifth quintile in any one performance period. Domestic equity, quantitative equity, and taxable fixed-income Funds were the strongest performers in 2009, while most foreign equity Funds lagged behind their competitors.
4. Performance rankings were similar in 2008 and 2009: the 1- and 3-year rankings declined slightly over the previous year, while the 5-year rankings improved modestly. Year over year, for the 1- and 3-year periods, the performance of equity Funds, both domestic and international, declined, while that of fixed-income Funds improved. Between three-fifths to two-thirds of the Funds changed quintile rankings in 2009 in the 1-, 3-, and 5-year performance periods.
5. The performance of the domestic equity Funds against their benchmarks was good for the 3- and 5-year performance periods. In contrast, gross returns of international equity and fixed-income Funds typically fell short of their benchmarks. The performance of equity Funds against their benchmarks was highly correlated to performance versus their peers; no such correlation was observed for fixed-income Funds.
6. The Atlantic equity Funds' overall performance adjusted for risk was solid. Based upon 3-year returns, nearly 57% of the equity Funds had a combination of risk-adjusted and unadjusted returns that placed them in the top half of their performance universes. About one quarter of the fixed-income Funds posted high returns and low risk relative to comparable funds. Just over half of the fixed-income Funds, primarily tax-exempt Funds, took on more risk than the typical fund in their performance universes.
7. The industry-standard procedure used by Lipper that includes all share classes in the performance universe tends to bias a Fund's ranking upward within that universe. The bias occurs because either no-12b-1 fee or low-12b-1 fee share classes of the Atlantic Funds are compared with funds in performance universes that include all share classes of multi-class funds with 12b-1 fees of up to 100 basis points. Correcting this bias by limiting the performance universe to classes of comparable funds with low or no 12b-1 fees (a "filtered universe") lowers the relative performance for the Funds, but not to a material extent. The filtering process, however, did identify one Fund for further review that had not been identified as a review fund using unfiltered universes. Conversely, two Funds that had been identified as review funds in the unfiltered universe lost that status in filtered universes.
8. A small number of Funds have consistently underperformed over the past five years. The exact number depends on the criteria used to evaluate longer-term performance. For example, only three Funds had below-median performance in each 1- and 3-year period from 2005 to 2009.
9. The services performed by CMG professionals beyond portfolio management, such as compliance, legal, information technology, risk management, finance, and fund administration, are critical to the success of the Funds and appear to be of high quality.
C. Management Fees Charged by Other Mutual Fund Companies
10. The Funds' management fees and total expenses are generally low relative to those of their peers, with over half of the Funds in the most favorable two quintiles. Only 26% of the Funds ranked in the two most expensive quintiles for actual management fees, and 18% in those quintiles for
38
total expenses. Two Funds are in the fifth quintile for total expenses; four Funds are in the fifth quintile for actual management fees.
11. The highest concentration of low-expense Funds is found among the foreign equity Funds. The 12 former Excelsior Funds have relatively high fees and expenses, with two-thirds ranking in either the fourth or fifth quintiles for actual management fees. The higher actual management fee rankings of certain former Excelsior Funds are due in part to fee schedules that are higher than standard Columbia Fund fee schedules at current asset levels.
12. The distribution of total expense and management fee rankings has improved over the prior two years. The implementation of the voluntary standardized cap system has contributed significantly to the improved rankings in 2009.
13. The management fees of the Atlantic Funds are generally in line with those of Columbia Funds supervised by the Nations Board of Trustees (the "Nations Funds"). To the extent that Atlantic Funds have higher average fees in certain investment categories than Nations Funds, the difference reflects either differences in asset size, different fee structures of the former Excelsior Funds, or special circumstances of the Funds included in the investment categories.
D. Trustees' Advisory Contract Review Process
14. The Trustees' evaluation process identified 16 Funds in 2009 for further review based upon long-standing criteria relating to their relative performance or expenses or both. When compared in filtered universes, one additional Fund met the criteria for further review. CMG provided further information about each of those Funds to assist the Trustees in their evaluation.
E. Potential Economies of Scale
15. CMG presented to the Trustees its analysis of the sources and sharing of potential economies of scale. CMG views economies of scale as arising at the complex level and would regard estimates of scale economies for individual funds as unreliable. In its analysis, CMG did not identify specific sources of economies of scale or provide any estimates of any economies of scale that might arise from future asset growth. CMG's analysis included measures taken by the Trustees and CMG that seek to share any potential economies of scale through breakpoints in management fee schedules, the establishment of expense limits for each Fund, enhanced shareholder services, fund mergers, and operational consolidation.
16. An examination of the contractual fee schedules for five Atlantic Funds shows that those with standard fee structures are generally in line with those of their competitors. The fee schedules of the former Excelsior Funds, however, have high initial fees relative to competitors but otherwise have comparable breakpoint structures.
F. Management Fees Charged to Institutional Clients
17. CMG has provided Trustees with comparisons of mutual fund management fees and institutional fees based upon standardized fee schedules and upon actual fees. The results show that, consistent with industry practice, actual and scheduled institutional fees are generally lower than the Funds' management fees. CMG provided additional data this year demonstrating that at small asset levels, the effective fee of certain Funds may be equal to or less than institutional fee levels at those asset levels, due to the effect of expense limits on small funds with high gross expenses. CMG also analyzed the differences between the services provided and risks borne on the one hand by a manager of mutual funds and on the other by institutional advisers, and suggested that these differences should be kept in mind when Trustees review the reasonableness of the Funds' management fees.
G. Revenues, Expenses, and Profits
18. The activity-based cost allocation methodology employed by CMG to allocate costs, both direct and indirect, for purposes of calculating Fund profitability is thoughtful and detailed. This year, CMG further refined the technique by allocating additional indirect expenses on an activity basis.
19. The materials provided on CMG's revenues and expenses with respect to the Funds and the methodology underlying their construction form a sufficient basis for Trustees to evaluate the expenses of and profitability to CMG arising out of its relationships with the Funds.
39
20. CMG provided a firm-wide pro forma 2009 income statement demonstrating the effect of market events beginning in the fourth quarter of 2008 on its revenues and profitability to provide an additional perspective on calendar 2008 profitability data. In particular, 2008 revenues reflected the higher market prices prevailing during the first three quarters of that year, while expenses dropped due to cost cutting in the wake of the market downturn late in 2008. The continuing effects of this downturn are expected to produce a significant decline in profitability this year.
21. In 2008, CMG's pre-tax post-distribution margin on the Atlantic Fund complex was above industry medians, based on the limited data available for publicly held mutual fund managers. However, as is to be expected in a large fund complex, some Atlantic Funds had relatively high pre-tax profit margins in 2008, when calculated solely with respect to management revenues and expenses, while other Atlantic Funds operated at a loss. There is a positive relationship between Fund size and profitability to CMG, with smaller Funds generally operating at a loss to CMG.
22. CMG pays a fixed percentage of its management fee revenues to an affiliate, U.S. Trust, Bank of America Private Wealth Management, with respect to assets of its clients invested in Atlantic Funds to compensate it for services it performs with respect to those client assets and for the effect of state law limitations on affiliates charging multiple fees. Based on our analysis of the services provided by this affiliate, we have concluded that all payments other than those for sub-transfer agent or sub-accounting services should be treated as a distribution expense.
III. Recommendations
1. Criteria for review. The Trustees may wish to consider modifying the criteria for identifying a Fund for further review (a "Review Fund") to include criteria that focus exclusively on performance. The Trustees' supplementary data request included one such criterion. They may also wish to consider whether it would be useful to apply CMG's own internal monitoring standards for Fund performance to the contract review process, or whether such criteria are more relevant to their ongoing investment oversight.
2. Presentation of Review Fund discussion. CMG should consider whether it could more systematically present in one discussion all relevant information regarding each Review Fund, which is now split into several different portions of the 15(c) materials. For any Fund that has been a Review Fund in consecutive years, CMG should address under what circumstances it could reasonably be anticipated that the Fund would lose that status.
3. Refinement of tax-exempt performance data. Certain single-state tax-exempt Funds compete in extremely small universes and are compared to a multi-state benchmark of uncertain relevance. Notwithstanding the difficulties, CMG should work to improve the reliability of the calculation of relative performance of these Funds. If that is not possible, CMG should provide guidance on how the Trustees should judge the quality of CMG's management of these Funds.
4. Development of risk metrics for asset-allocation, tax-exempt, and money market funds. CMG has developed and shared with the Trustees quantitative risk metrics comparing equity and taxable fixed-income Funds against their peers. However, reliable risk metrics have not been developed for asset-allocation, tax-exempt fixed income, and money market funds. We urge CMG to continue its efforts to provide reliable risk measures for these categories of Funds, especially in the cases of asset-allocation and money market funds, because their investors are likely to be motivated at least in part by a desire to manage risk.
5. Profitability data. For any period during which CMG is an affiliate of U.S. Trust, Bank of America Private Wealth Management, CMG should continue to present to the Trustees the profitability of each Fund, each investment style and each complex (of which Atlantic is one) calculated as follows:
a. Management-only profitability should be calculated without reference to any Private Bank expense.
b. Profitability excluding distribution (which essentially covers the management and transfer agency functions) should be adjusted by removing from the expense calculation any portion of the Private Bank payment not attributable to the performance by the Private Bank of sub-transfer agency or sub-accounting functions.
40
c. Total profitability, including distribution: No adjustment for Private Bank expenses should be made, because all such expenses represent legitimate fund expenses to be taken into account in calculating CMG's profit margin including distribution.
d. Distribution only: This should include all Private Bank expenses other than those attributable to sub-transfer agency services.
6. Contractual fee analysis. This year CMG presented a new Lipper report comparing the contractual management fees of Funds with those of competitors in similar investment styles. However, the reliability of the conclusion—that Fund management fee breakpoints compared favorably with competitive fee rates—was limited by the use of competitive funds at all asset levels. The sponsors of a $100 million mutual fund may not have given much thought to breakpoints at $5 billion; therefore, that fund's contractual fee at that level is unlikely to compare favorably with that of a $5 billion Fund. Limiting the competitors to the Lipper expense group, whose constituents are similar in size to the relevant Fund, would make the results more meaningful. In addition, the brea kpoints of a select group of Atlantic Funds (which would differ each year) should continue to be compared to those of industry rivals to ensure that the Funds' breakpoint schedules remain within industry norms. As breakpoint schedules change relatively little each year, performing such a comparison for each Atlantic Fund each year would not be an efficient use of Trustee and CMG resources.
7. Pro forma profitability data. In any year in which CMG or the Trustees believe that the prior year's profitability is unlikely to be representative of current business results due to changes in markets or for any other reason, CMG should, consistent with this year's practice, prepare a pro forma income statement based on year-to-date actual data and reasonable projections used for its own business planning purposes.
8. Additional institutional data and analysis. While CMG provided a substantial amount of information on its institutional business, including a virtually complete database of all institutional accounts, we suggest some additional items for future years: (a) profitability data for the institutional business in the format, and based upon the same allocation methodologies, used to present Fund profitability, (b) an explanation of how CMA sets institutional fee breakpoints, which normally begin at asset levels far lower than those found in Fund management fee breakpoints, and (c) an analysis of differences in actual fees within specific investment categories, with special attention given to accounts established before and after the implementation of the standardized instit utional fee schedules in 2005.
9. Management fee disparities. In any future study of management fees, CMG and the Atlantic Trustees should analyze the differences in management fee schedules, including those arising out of the reorganization of the former Excelsior Funds as Atlantic Funds. As part of that analysis, CMG should provide an explanation for any significant fee differences among comparable funds across fund families sponsored by CMG, such as differences in the management styles of different Funds included the same Lipper category. Finally, if CMG proposes a management fee change or an expense cap for any mutual fund managed by CMA that is comparable to any Atlantic Fund, CMG should provide the Trustees with sufficient information about the proposal to allow the Trustees to assess the appli cability of the proposed change to the relevant Atlantic Fund or Funds.
10. Explanation of data supplied to Lipper. Each year, as part of the 15(c) process, CMG retains Lipper to compare the fees and expenses of each Fund to a group of competitors. In many cases, CMG, with the approval of the Trustees, adjusts the actual expense data, which is based on the most recent full fiscal year of the Fund (and each competitive fund) to reflect changes in fees or expense limits that occurred during or after the relevant fiscal year. This improves the reliability and usefulness of the comparison. However, to ensure that the Trustees know when and how CMG adjusted the data, we recommend that CMG prepare a table listing for each Fund what adjustments were made, e.g., to reflect a new expense limitation of x basis points that commenced on y date.
Reduction of volume of paper documents submitted. The effort to streamline and better organize the data presented to the Trustees and the process by which that data was prepared and organized continued to be well-received by all parties.
41
Notwithstanding past success, it is always appropriate to look for opportunities to reduce and simplify the presentation of 15(c) data. One possibility would be to remove the 124 pages of biographical data, most if not all of which the Trustees have previously seen as part of their ongoing investment oversight duties, from the paper volume and post it on the Internet-based document storage and retrieval system used by the Funds to provide reference data to Trustees.
* * *
Respectfully submitted,
Steven E. Asher
42
This page intentionally left blank.
This page intentionally left blank.
Important Information About This Report
The fund mails one shareholder report to each shareholder address. If you would like more than one report, please call shareholder services at 1-800-345-6611 and additional reports will be sent to you. This report has been prepared for shareholders of Columbia New York Tax-Exempt Fund.
A description of the policies and procedures that the fund uses to determine how to vote proxies and a copy of the fund's voting records are available (i) at www.columbiamanagement.com, (ii) on the Securities and Exchange Commission's website at www.sec.gov, and (iii) without charge, upon request, by calling 1-800-368-0346. Information regarding how the fund voted proxies relating to portfolio securities during the 12-month period ended June 30 is available from the SEC's website. Information regarding how the fund voted proxies relating to portfolio securities is also available from the fund's website, www.columbiamanagement.com.
The fund files a complete schedule of portfolio holdings with the SEC for the first and third quarters of each fiscal year on Form N-Q. The fund's Form N-Q is available on the SEC's website at www.sec.gov and may be reviewed and copied at the SEC's Public Reference Room in Washington, D.C. Information on the operation of the Public Reference Room may be obtained by calling 1-800-SEC-0330.
Please read and consider the investment objectives, risks, charges and expenses for any fund carefully before investing. For a prospectus which contains this and other important information about the fund, contact your Columbia Management representative or financial advisor or go to www.columbiamanagement.com.
Columbia Management Group, LLC ("Columbia Management") is the investment management division of Bank of America Corporation. Columbia Management entities furnish investment management services and products for institutional and individual investors. Columbia Funds are distributed by Columbia Management Distributors, Inc., member of FINRA, SIPC, part of Columbia Management and an affiliate of Bank of America Corporation.
Transfer Agent
Columbia Management Services, Inc.
P.O. Box 8081
Boston, MA 02266-8081
1-800-345-6611
Distributor
Columbia Management
Distributors, Inc.
One Financial Center
Boston, MA 02111
Investment Advisor
Columbia Management Advisors, LLC
100 Federal Street
Boston, MA 02110
45
Columbia Management®
One Financial Center
Boston, MA 02111-2621
PRSRT STD
U.S. Postage
PAID
Holliston, MA
Permit NO. 20
Columbia Management®
Columbia New York Tax-Exempt Fund
Annual Report, October 31, 2009
©2009 Columbia Management Distributors, Inc.
One Financial Center, Boston, MA 02111-2621
800-345-6611 www.columbiafunds.com
SHC-42/26621-1009 (12/09) 09/97715
Columbia Management®
Annual Report
October 31, 2009
Columbia Tax-Exempt Bond Funds
g Columbia Connecticut Intermediate
Municipal Bond Fund
g Columbia Intermediate Municipal
Bond Fund
g Columbia Massachusetts Intermediate
Municipal Bond Fund
g Columbia New Jersey Intermediate
Municipal Bond Fund
g Columbia New York Intermediate
Municipal Bond Fund
g Columbia Rhode Island Intermediate
Municipal Bond Fund
| NOT FDIC INSURED | | May Lose Value | |
|
| NOT BANK ISSUED | | No Bank Guarantee | |
|
Table of Contents
| Economic Update | | | 1 | | |
|
Columbia Connecticut Intermediate
Municipal Bond Fund | | | 3 | | |
|
Columbia Intermediate Municipal
Bond Fund | | | 8 | | |
|
Columbia Massachusetts
Intermediate Municipal
Bond Fund | | | 13 | | |
|
Columbia New Jersey Intermediate
Municipal Bond Fund | | | 18 | | |
|
Columbia New York Intermediate
Municipal Bond Fund | | | 23 | | |
|
Columbia Rhode Island
Intermediate Municipal
Bond Fund | | | 28 | | |
|
| Investment Portfolios | | | 33 | | |
|
Statements of Assets and
Liabilities | | | 90 | | |
|
| Statements of Operations | | | 94 | | |
|
Statements of Changes in
Net Assets | | | 96 | | |
|
| Financial Highlights | | | 102 | | |
|
| Notes to Financial Statements | | | 132 | | |
|
| Report of Independent Registered Public Accounting Firm | | | 144 | | |
|
| Federal Income Tax Information | | | 145 | | |
|
| Fund Governance | | | 146 | | |
|
Board Consideration and
Approval of Advisory Agreements | | | 150 | | |
|
Summary of Management
Fee Evaluation by Independent
Fee Consultant | | | 154 | | |
|
Important Information About
This Report | | | 161 | | |
|
The views expressed in this report reflect the current views of the respective parties. These views are not guarantees of future performance and involve certain risks, uncertainties and assumptions that are difficult to predict, so actual outcomes and results may differ significantly from the views expressed. These views are subject to change at any time based upon economic, market or other conditions and the respective parties disclaim any responsibility to update such views. These views may not be relied on as investment advice and, because investment decisions for a Columbia Fund are based on numerous factors, may not be relied on as an indication of trading intent on behalf of any particular Columbia Fund. References to specific securities should not be construed as a recommendation or investment advice.
President's Message

Dear Shareholder:
We are pleased to provide this shareholder report detailing your fund's performance, portfolio holdings and financial statements. We hope this information is helpful in monitoring your investments as we work through these challenging economic times. We recognize that you have entrusted us with your money and want you to know that our professional investment teams work to interpret the latest economic and market trends with the goal of optimizing portfolio construction for our clients.
The first half of 2009 was defined by extremes. The multiyear lows we witnessed in the early months gave way to a stunning rally for the U.S. financial markets through November 2009. A global market rebound may be underway, thanks to the massive fiscal and aggressive monetary policies of governments around the world. In the third quarter 2009, the S&P 500 Index1 was up 15.61%. We believe this challenging economic environment makes it even more important to work with professional money managers while continuing to invest for life events like retirement, college planning, home improvements and career changes.
Retirement income planning has become an increasingly significant focus in the lives of millions of Americans. Recent economic conditions make it even more important to manage short-term obligations such as mortgages, monthly bills and credit card debt while also taking the steps necessary to prepare for or maximize retirement benefits. Better nutrition and medical services can result in U.S. citizens living longer, healthier lives. This means the risk of outliving one's assets in retirement is very real without proper planning. Financial security and retirement planning is an ongoing process that requires active management of your savings, investments and risks. We encourage you to review your retirement plan regularly so you'll be better able to meet your retirement needs in the future.
We recognize that economic uncertainty creates great challenges for many investors. Our professional investment teams work diligently to help investors navigate through difficult markets. Thank you for your business and for the opportunity to work together towards your investment goals.
Sincerely,

J. Kevin Connaughton
President, Columbia Funds
On September 29, 2009, Bank of America Corporation entered into an agreement to sell a portion of the asset management business of Columbia Management Group, LLC. Please see Note 4 of the Notes to Financial Statements for additional information.
1The Standard & Poor's (S&P) 500 Index tracks the performance of 500 widely held, large-capitalization U.S. stocks. Indices are not available for investment, are not professionally managed and do not reflect sales charges, fees, brokerage commissions, taxes or other expenses of investing. Securities in the funds may not match those in an index.
Past performance is no guarantee of future results.
Economic Update – Columbia Tax-Exempt Bond Funds
After a deep and difficult recession, the U.S. economy appeared to regain its footing midway through the 12-month period that began November 1, 2008 and ended October 31, 2009. Gross domestic product turned positive in the third quarter of 2009, rising 2.8%, primarily on the strength of federal government stimulus spending. Now, hopes for a sustained recovery likely depend on a rebound in consumer spending and a shift from cost cuts to revenue gains to keep business profits moving higher.
The housing market showed some signs of improvement. Construction spending declined during most of the period, but turned slightly higher in August and September. New and existing home sales were weak in the first half of the period, but increased in the second half. However, new home sales took a surprise dip late in the period, as did housing starts, as the deadline for a generous first-time homebuyer tax credit neared. An extension of the credit into mid-2010 and an expansion of eligibility requirements, which were recently signed into law, renewed hopes for a sustained rebound in housing.
In the beleaguered labor market, the good news was that there was less bad news. Businesses continued to shed jobs throughout the period, raising the unemployment rate to 10.2% and wiping out all of the jobs gained since the last recession. However, the pace of job losses slowed markedly by the period's end, from 533,000 jobs lost in November 2008 to 190,000 jobs lost in October 2009. Yet, prospects appear dim for a quick recovery in the labor markets. In fact, consumer confidence, as measured monthly by The Conference Board, an independent research organization, took a dive in August and September. Consumers surveyed cited worsening business conditions and a bleaker outlook for the labor markets.
Manufacturing activity slowed through the first half of the period, but a key measure—the Institute for Supply Management's Index—rose above 50 in July and remained there for the remainder of the period. Any number above 50 typically indicates that manufacturing activity is expanding. However, several other key manufacturing indicators soured in October. Industrial production declined and manufacturing capacity utilization stalled after several months of modest improvement.
Consumer spending registered both ups and downs during the 12-month period, and the trend at the end of the period was hard to read because of the impact of the federal Cash for Clunkers program, which boosted auto sales. Spending rose sharply in August, then fell in September. New rigorous lending standards severely limited access to credit for businesses and consumers alike, and further hampered economic growth. In December 2008, the Federal Reserve Board (the Fed) lowered a key short-term borrowing rate—the federal funds rate—to between zero and 0.25%—a record low. In light of continued uncertainty about the economy, the Fed made no further change to the federal funds rate during the period.
Bonds outperformed domestic stocks
As investors sought refuge from a volatile stock market, the highest-quality sectors of the U.S. bond market delivered solid gains during the first half of the period, Treasury prices rose and yields declined sharply as the economy faltered and stock market volatility increased. As hopes for a recovery materialized, Treasuries lagged riskier segments of the bond market. The benchmark 10-year U.S. Treasury yield began the
Summary
For the 12-month period that ended October 31, 2009
g After a sharp decline, stock markets rebounded around the world, as measured by the S&P 500 Index and the MSCI EAFE Index.
| S&P Index | | MSCI Index | |
|
 | |  | |
|
g As investors appeared to exhibit more tolerance for risk, the Barclays Capital Aggregate Bond Index delivered solid results. High-yield bonds rebounded strongly, as measured by the JPMorgan Developed BB High Yield Index.
Barclays
Aggregate
Index | | JPMorgan
Index | |
|
 | |  | |
|
1
Economic Update (continued) – Columbia Tax-Exempt Bond Funds
period at just under 4.0%, declined to 2.2% in December 2008, then rose to end the period at 3.4%. In this environment, the Barclays Capital Aggregate Bond Index1 returned 13.79%. Municipal bonds delivered returns that were in line with taxable investment-grade bonds even without factoring in potential tax advantages to investors in higher income tax brackets. The Barclays Capital Municipal Bond Index2 returned 13.60%. High-yield bond prices fell sharply in 2008 as economic prospects weakened and default fears rose, then rebounded strongly in 2009. For the 12-month period, the JPMorgan Developed BB High Yield Index3 returned 36.47%.
Stocks retreated, then rebounded
Against a strengthening economic backdrop, the U.S. stock market returned 9.80% for the 12-month period, as measured by the S&P 500 Index.4 Mid-cap stocks outperformed large and small-cap stocks and growth outperformed value by a solid margin, as measured by their respective Russell indices.5 Outside the U.S., stock market returns were even stronger. The MSCI EAFE Index,6 a broad gauge of stock market performance in foreign developed markets, gained 27.71% (in U.S. dollars) for the period. Emerging stock markets were caught in last year's downdraft, but they bounced back stronger than domestic or developed world markets in 2009 as economic growth generally outpaced the developed world. The MSCI Emerging Markets Index7 returned 64.13% (in U.S. dollars), led by strong gains from China, India, Indonesia, Colombia and Brazil.
Past performance is no guarantee of future results.
1The Barclays Capital Aggregate Bond Index is a market value-weighted index that tracks the daily price, coupon, pay-downs and total return performance of fixed-rate, publicly placed, dollar-denominated and non-convertible investment grade debt issues with at least $250 million par amount outstanding and with at least one year to final maturity.
2The Barclays Capital Municipal Bond Index is considered representative of the broad market for investment grade, tax-exempt bonds with a maturity of at least one year.
3The JPMorgan Developed BB High Yield Index is an unmanaged index designed to mirror the investable universe of the U.S. dollar developed, BB-rated, high yield corporate debt market.
4The Standard & Poor's (S&P) 500 Index tracks the performance of 500 widely held, large-capitalization U.S. stocks.
5The Russell 1000 Index tracks the performance of 1,000 of the largest U.S. companies, based on market capitalization. The Russell MidCap Index measures the performance of the 800 smallest companies in the Russell 1000 Index, which represents approximately 25% of the total market capitalization of the Russell 1000 Index. The Russell 2000 Index measures the performance of the 2,000 smallest companies in the Russell 3000 Index, which represents approximately 8% of the total market capitalization of the Russell 3000 Index. The Russell 3000 Growth Index measures the performance of those Russell 3000 Index companies with higher price-to-book ratios and higher forecasted growth values. The stocks in this index are also members of either the Russell 1000 Growth or the Russell 2000 Growth indexes. The Russell 3000 Value Index measures the performance of those Russell 3000 Index companies with lower price-to-book ratios and lo wer forecasted growth values. The stocks in this index are also members of either the Russell 1000 Value or the Russell 2000 Value indexes.
6The Morgan Stanley Capital International Europe, Australasia, Far East (MSCI EAFE) Index is a capitalization-weighted index that tracks the total return of common stocks in 21 developed-market countries within Europe, Australasia and the Far East.
7The Morgan Stanley Capital International Emerging Markets Index (MSCI EMI) is a free float-adjusted market capitalization index that is designed to measure equity market performance in the global emerging markets. As of June 2006, the MSCI Emerging Markets Index consisted of the following 25 emerging market country indices: Argentina, Brazil, Chile, China, Colombia, Czech Republic, Egypt, Hungary, India, Indonesia, Israel, Jordan, Korea, Malaysia, Mexico, Morocco, Pakistan, Peru, Philippines, Poland, Russia, South Africa, Taiwan, Thailand and Turkey.
Indices are not available for investment, are not professionally managed and do not reflect sales charges, fees, brokerage commissions, taxes or other expenses of investing. Securities in the fund may not match those in an index.
Effective November 3, 2008, the Lehman Brothers indices were renamed the Barclays Capital indices.
2
Fund Profile – Columbia Connecticut Intermediate Municipal Bond Fund
Summary
g For the 12-month period that ended October 31, 2009, the fund's Class A shares returned 9.87% without sales charge. Class Z shares returned 10.14%.
g The fund lagged its benchmark, the Barclays Capital 3-15 Year Blend Municipal Bond Index1, and performed in line with the average return of its peer group, the Lipper Other States Intermediate Municipal Debt Funds Classification.2
g Investments in pre-refunded bonds, an underweight in A- and BBB-rated bonds and a lack of exposure to tobacco bonds hampered returns versus the benchmark. Above-average sensitivity to interest rate changes and avoidance of any credit downgrades were beneficial relative to the peer group.
Portfolio Management
Brian M. McGreevy has managed the fund since September 2002 and has been associated with the advisor or its predecessors since 1994.
1The Barclays Capital 3-15 Year Blend Municipal Bond Index tracks the performance of municipal bonds issued after December 31, 1990 with remaining maturities between 2 and 17 years and at least $5 million in principal amount outstanding. Indices are not available for investment, are not professionally managed and do not reflect sales charges, fees, brokerage commissions, taxes or other expenses of investing. Securities in the fund may not match those in an index.
2Lipper Inc., a widely respected data provider in the industry, calculates an average total return (assuming reinvestment of distributions) for mutual funds with investment objectives similar to those of the fund. Lipper makes no adjustment for the effect of sales loads.
Performance data quoted represents past performance and current performance may be lower or higher. Past performance is no guarantee of future results. The investment return and principal value will fluctuate so that shares, when redeemed, may be worth more or less than the original cost. Please visit www.columbiafunds.com for daily and most recent month-end performance updates.
Summary
1-year return as of 10/31/09
| | +9.87% | |
|
| |  | | | Class A shares
(without sales charge) | |
|
| | +11.41% | |
|
| |  | | | Barclays Capital
3-15 Year Blend
Municipal Bond Index | |
|
Morningstar Style BoxTM

The Morningstar Style BoxTM reveals a fund's investment strategy. For fixed-income funds, the vertical axis shows the average credit quality of the bonds owned, and the horizontal axis shows interest rate sensitivity as measured by a bond's duration (short, intermediate or long). Information shown is based on the most recent data provided by Morningstar.
3
Performance Information – Columbia Connecticut Intermediate Municipal Bond Fund
Performance data quoted represents past performance and current performance may be lower or higher. Past performance is no guarantee of future results. The investment return and principal value will fluctuate so that shares, when redeemed, may be worth more or less than the original cost. Please visit www.columbiafunds.com for daily and most recent month-end performance updates.
Annual operating expense ratio (%)*
| Class A | | | 0.97 | | |
| Class B | | | 1.72 | | |
| Class C | | | 1.72 | | |
| Class T | | | 0.87 | | |
| Class Z | | | 0.72 | | |
* The annual operating expense ratio is as stated in the fund's prospectus that is current as of the date of this report and includes the expenses incurred by the investment companies in which the fund invests. Differences in expense ratios disclosed elsewhere in this report may result from including expenses incurred by the investment companies, fee waivers and expense reimbursements as well as different time periods used in calculating the ratios.
Performance of a $10,000 investment 11/01/99 – 10/31/09
The table above shows the change in value of a hypothetical $10,000 investment in Class A shares of Columbia Connecticut Intermediate Municipal Bond Fund during the stated time period, and does not reflect the deduction of taxes that a shareholder may pay on fund distributions or on the redemption of fund shares. The performance of a $10,000 investment with sales charge for Class A shares is calculated with an initial sales charge of 4.75%, which was the effective sales charge prior to August 22, 2005.
Performance of a $10,000 investment 11/01/99 – 10/31/09 ($)
| Sales charge | | without | | with | |
| Class A | | | 15,131 | | | | 14,407 | | |
| Class B | | | 14,192 | | | | 14,192 | | |
| Class C | | | 14,543 | | | | 14,543 | | |
| Class T | | | 15,246 | | | | 14,516 | | |
| Class Z | | | 15,490 | | | | n/a | | |
Average annual total return as of 10/31/09 (%)
| Share class | | A | | B | | C | | T | | Z | |
| Inception | | 11/18/02 | | 11/18/02 | | 11/18/02 | | 06/26/00 | | 08/01/94 | |
| Sales charge | | without | | with | | without | | with | | without | | with | | without | | with | | without | |
| 1-year | | | 9.87 | | | | 6.28 | | | | 9.05 | | | | 6.05 | | | | 9.43 | | | | 8.43 | | | | 9.98 | | | | 4.77 | | | | 10.14 | | |
| 5-year | | | 2.80 | | | | 1.80 | | | | 2.04 | | | | 2.04 | | | | 2.39 | | | | 2.39 | | | | 2.91 | | | | 1.91 | | | | 3.06 | | |
| 10-year | | | 4.23 | | | | 3.72 | | | | 3.56 | | | | 3.56 | | | | 3.82 | | | | 3.82 | | | | 4.31 | | | | 3.80 | | | | 4.47 | | |
Average annual total return as of 09/30/09 (%)
| Share class | | A | | B | | C | | T | | Z | |
| Sales charge | | without | | with | | without | | with | | without | | with | | without | | with | | without | |
| 1-year | | | 11.17 | | | | 7.57 | | | | 10.35 | | | | 7.35 | | | | 10.73 | | | | 9.73 | | | | 11.29 | | | | 5.97 | | | | 11.45 | | |
| 5-year | | | 3.29 | | | | 2.29 | | | | 2.53 | | | | 2.53 | | | | 2.89 | | | | 2.89 | | | | 3.40 | | | | 2.40 | | | | 3.56 | | |
| 10-year | | | 4.30 | | | | 3.80 | | | | 3.64 | | | | 3.64 | | | | 3.89 | | | | 3.89 | | | | 4.38 | | | | 3.87 | | | | 4.54 | | |
The "with sales charge" returns include the maximum initial sales charge of 3.25% for Class A shares (for the 1-year period), 4.75% for Class A shares (for the 5-year and 10-year periods) and 4.75% for Class T shares, the applicable contingent deferred sales charge of 3.00% in the first year, declining to 1.00% in the fourth year, and eliminated thereafter for Class B shares and 1.00% for Class C shares for the first year only. The "without sales charge" returns do not include the effect of sales charges. If they had, returns would be lower.
Prior to August 22, 2005, new purchases of Class A shares had a maximum initial sales charge of 4.75%.
Performance results reflect any fee waivers or reimbursements of fund expenses by the investment advisor and/or any of its affiliates. Absent these fee waivers or expense reimbursement arrangements, performance results would have been lower.
All results shown assume reinvestment of distributions. Class Z shares are sold at net asset value with no distribution and service (Rule 12b-1) fees. Class Z shares have limited eligibility and the investment minimum requirements may vary. Please see the fund's prospectus for details. Performance for different share classes will vary based on differences in sales charges and fees associated with each class.
The tables do not reflect the deduction of taxes that a shareholder may pay on fund distributions or on the redemption of fund shares.
Class A, Class B, Class C, Class T and Class Z share performance information includes returns of Retail A shares (for Class A and Class T shares), Retail B shares (for Class B and Class C shares) and Trust shares (for Class Z shares) of Galaxy Connecticut Intermediate Municipal Bond Fund, the predecessor to the Fund and a series of The Galaxy Fund (the "Galaxy Connecticut Fund"), for periods prior to November 18, 2002, the date on which Class A, Class B, Class C, Class T and Class Z shares were initially offered by the Fund. The returns shown for Class B and Class C shares also include the returns for Retail A shares for periods prior to March 1, 2001, the date on which Retail B shares were initially offered by the Galaxy Connecticut Fund. Retail A share returns include returns of the BKB shares of the Galaxy Connecticut Fund for periods prior to June 26, 2001, the date on which BKB shares were converted to Retail A shares, and Retail A and Class Z share returns include returns of shares of the Boston 1784 Connecticut Tax-Exempt Income Fund for periods prior to June 26, 2000. The returns shown for all share classes reflect any differences in sales charges, but no returns have been restated to reflect any differences in expenses such as distribution and service (Rule 12b-1) fees between any predecessor share class and the corresponding newer share class. If differences in expenses had been reflected, the returns shown for periods prior to November 18, 2002 would be lower for Class A, Class B, Class C and Class T shares.
4
Understanding Your Expenses – Columbia Connecticut Intermediate Municipal Bond Fund
As a fund shareholder, you incur two types of costs. There are transaction costs, which generally include sales charges on purchases and may include redemption fees or exchange fees. There are also ongoing costs, which generally include investment advisory fees, distribution and service (Rule 12b-1) fees and other fund expenses. The information on this page is intended to help you understand the ongoing costs of investing in the fund and to compare these costs with the ongoing costs of investing in other mutual funds.
Analyzing your fund's expenses by share class
To illustrate these ongoing costs, we have provided an example and calculated the expenses paid by investors in each share class during the period. The information in the following table is based on an initial investment of $1,000, which is invested at the beginning of the period and held for the entire period. Expense information is calculated two ways and each method provides you with different information. The amount listed in the "Actual" column is calculated using the fund's actual operating expenses and total return for the period. The amount listed in the "Hypothetical" column for each share class assumes that the return each year is 5% before expenses and is calculated based on the fund's actual operating expenses. You should not use the hypothetical account values and expenses to estimate either your actual account balance at the end of the period or the expenses you paid during this period.
Compare with other funds
Since all mutual funds are required to include the same hypothetical calculations about expenses in shareholder reports, you can use this information to compare the ongoing costs of investing in the fund with other funds. To do so, compare the 5% hypothetical example with the 5% hypothetical examples that appear in the shareholder reports of other funds. As you compare hypothetical examples of other funds, it is important to note that hypothetical examples are meant to highlight the ongoing costs of investing in a fund and do not reflect any transaction costs, such as sales charges, redemption fees or exchange fees.
Estimating your actual expenses
To estimate the expenses that you paid over the period, first you will need your account balance at the end of the period:
g For shareholders who receive their account statements from Columbia Management Services, Inc., your account balance is available online at www.columbiafunds.com or by calling Shareholder Services at 800.345.6611.
g For shareholders who receive their account statements from their financial intermediary, contact your financial intermediary to obtain your account balance.
1. Divide your ending account balance by $1,000. For example, if an account balance was $8,600 at the end of the period, the result would be 8.6.
2. In the section of the table below titled "Expenses paid during the period," locate the amount for your share class. You will find this number in the column labeled "Actual." Multiply this number by the result from step 1. Your answer is an estimate of the expenses you paid on your account during the period.
If the value of your account falls below the minimum initial investment requirement applicable to you, your account generally will be subject to a $20 annual fee. This fee is not included in the accompanying table. If you are subject to the fee, keep it in mind when you are estimating the ongoing expenses of investing in the fund and when comparing the expenses of this fund with other funds.
05/01/09 – 10/31/09
| | | Account value at the
beginning of the period ($) | | Account value at the
end of the period ($) | | Expenses paid
during the period ($) | | Fund's annualized
expense ratio (%) | |
| | | Actual | | Hypothetical | | Actual | | Hypothetical | | Actual | | Hypothetical | | Actual | |
| Class A | | | 1,000.00 | | | | 1,000.00 | | | | 1,025.80 | | | | 1,021.17 | | | | 4.08 | | | | 4.08 | | | | 0.80 | | |
| Class B | | | 1,000.00 | | | | 1,000.00 | | | | 1,022.00 | | | | 1,017.39 | | | | 7.90 | | | | 7.88 | | | | 1.55 | | |
| Class C | | | 1,000.00 | | | | 1,000.00 | | | | 1,023.70 | | | | 1,019.16 | | | | 6.12 | | | | 6.11 | | | | 1.20 | | |
| Class T | | | 1,000.00 | | | | 1,000.00 | | | | 1,026.30 | | | | 1,021.68 | | | | 3.58 | | | | 3.57 | | | | 0.70 | | |
| Class Z | | | 1,000.00 | | | | 1,000.00 | | | | 1,027.10 | | | | 1,022.43 | | | | 2.81 | | | | 2.80 | | | | 0.55 | | |
Expenses paid during the period are equal to the annualized expense ratio for the share class, multiplied by the average account value over the period, then multiplied by the number of days in the fund's most recent fiscal half-year and divided by 365.
Had the investment advisor and/or any of its affiliates not waived fees or reimbursed a portion of expenses, account value at the end of the period would have been reduced.
It is important to note that the expense amounts shown in the table are meant to highlight only ongoing costs of investing in the fund and do not reflect any transaction costs, such as sales charges, redemption fees or exchange fees. Therefore, the hypothetical examples provided may not help you determine the relative total costs of owning shares of different funds. If these transaction costs were included, your costs would have been higher.
5
Portfolio Manager's Report – Columbia Connecticut Intermediate Municipal Bond Fund
Performance data quoted represents past performance and current performance may be lower or higher. Past performance is no guarantee of future results. The investment return and principal value will fluctuate so that shares, when redeemed, may be worth more or less than the original cost. Please visit www.columbiafunds.com for daily and most recent month-end performance updates.
Net asset value per share
as of 10/31/09 ($)
| Class A | | | 10.69 | | |
| Class B | | | 10.69 | | |
| Class C | | | 10.69 | | |
| Class T | | | 10.69 | | |
| Class Z | | | 10.69 | | |
Distributions declared per share
11/01/08 – 10/31/09 ($)
| Class A | | | 0.35 | | |
| Class B | | | 0.27 | | |
| Class C | | | 0.31 | | |
| Class T | | | 0.36 | | |
| Class Z | | | 0.38 | | |
A portion of the fund's income may be subject to the alternative minimum tax. The fund may at times purchase tax-exempt securities at a discount. Some, or all, of this discount may be included in the fund's ordinary income, and is taxable when distributed.
30-day SEC yields
as of 10/31/09 (%)
| Class A | | | 2.09 | | |
| Class B | | | 1.45 | | |
| Class C | | | 1.80 | | |
| Class T | | | 2.20 | | |
| Class Z | | | 2.46 | | |
The 30-day SEC yields reflect the fund's earning power, net of expenses, expressed as an annualized percentage of the public offering price at the end of the period. Had the investment advisor and/or any of its affiliates not waived fees or reimbursed a portion of expenses, the 30-day SEC yields would have been lower.
For the 12-month period that ended October 31, 2009, the fund's Class A shares returned 9.87% without sales charge. Class Z shares returned 10.14% without sales charge. By comparison, the fund's benchmark, the Barclays Capital 3-15 Year Blend Municipal Bond Index, which is national in scope, returned 11.41%. The average return of the funds in the peer group, the Lipper Other States Intermediate Municipal Debt Funds Classification, was 9.70%. The fund's pre-refunded bonds, which had shorter maturities than those in the index, contributed to underperformance versus the index. Pre-refunding occurs when an issuer takes advantage of lower interest rates by issuing new bonds and then investing the proceeds in an escrow account until it can redeem the original higher-rate bonds. An underweight in A- and BBB-rated bonds and a lack of exposure to tobacco bonds, all of which were strong performers, further hindered results. The fund benef ited from being slightly more sensitive to interest rate changes than the peer group, which meant it experienced more price appreciation as rates fell, and also from having no significant credit problems.
Strong gains from municipal bonds
Municipal bonds rallied nicely during the period, buoyed by strong demand from individual investors and a dramatic decline in yields. New issue supply was somewhat constrained by a liquidity crunch, credit downgrades for many municipal bond insurers and the creation of Build America Bonds, which expands financing options for municipalities by allowing them to issue taxable bonds and receive a federal subsidy to cover 35% of their costs. Although higher-quality, shorter-maturity municipal bonds outperformed early on, longer-term and lower-rated issues took off as the economy stabilized and were the year's top gainers.
Enhanced yield through slightly lower credit quality
A focus on high-quality (AA and AAA) issues worked well early in the period. As the year progressed, we took advantage of attractive pricing and higher yields among A and BBB rated bonds, boosting our stake to roughly 26% of assets by period end, up from 12% a year earlier. We offset some of these purchases with the sale of Puerto Rico bonds, which were pressured by the territory's economic outlook, budget deficit and weak BAA/BBB credit rating. We also decreased exposure to bonds with maturities under two years and shifted the proceeds into eight- to 17-year bonds, which offered slightly more yield.
Continued overweights in GO and education sectors
Sector overweights included local general obligation (GO) bonds and education issues. We added to our stake in local GOs, buying mostly issues with ratings of AA or higher, which lagged GO bonds issued by cities and towns with lower credit-quality ratings. In education, we focused on A-rated and longer-maturity issues, which did well. The fund's hospital bonds were slightly higher quality and shorter maturity than those in the benchmark, which hampered relative results.
Challenges ahead for Connecticut
Connecticut ended the period with an AA3/AA credit rating, after being placed on negative credit watch by Moody's, a major ratings agency. Despite being one of the
6
Portfolio Manager's Report (continued) – Columbia Connecticut Intermediate Municipal Bond Fund
wealthiest and most diverse economies in the nation, Connecticut is still struggling with a high debt load, heavy dependence on Wall Street, decreased sales-tax revenues and a budget deficit. Unemployment, which reached 8.1% in August, is likely to rise further, especially if a recent increase in the corporate income surcharge hampers the state's ability to attract and retain businesses. Going forward, we believe that issue selection and risk management will remain critically important.
Portfolio holdings and characteristics are subject to change periodically and may not be representative of current holdings and characteristics. The outlook for this fund may differ from those presented for other Columbia Funds.
Tax-exempt investing offers current tax-exempt income, but it also involves certain risks. The value of the fund will be affected by interest rate changes and the creditworthiness of issues held in the fund. When interest rates go up, bond prices generally drop and vice versa.
Interest income from certain tax-exempt bonds may be subject to certain state and local taxes and, if applicable, the alternative minimum tax. Capital gains are not exempt from income taxes.
The fund is non-diversified, which generally means that it may invest a greater percentage of its total assets in the securities of fewer issuers than a "diversified" fund. This increases the risk that a change in the value of any one investment held by the fund could affect the overall value of the fund more than it would affect that of a diversified fund holding a greater number of investments. Accordingly, the fund's value will likely be more volatile than the value of more diversified funds.
Single-state municipal bond funds pose additional risks due to limited geographical diversification.
Taxable-equivalent SEC yields
as of 10/31/09 (%)
| Class A | | | 3.39 | | |
| Class B | | | 2.35 | | |
| Class C | | | 2.92 | | |
| Class T | | | 3.55 | | |
| Class Z | | | 3.98 | | |
Taxable-equivalent SEC yields are calculated assuming a federal income tax rate of 35.0% and a Connecticut state income tax rate of 5.0%. These tax rates do not reflect the phase out of exemptions or the reduction of the otherwise allowable deductions that occur when adjusted gross income exceeds certain levels. Your taxable-equivalent yield may be different depending on your tax bracket.
Top 5 sectors
as of 10/31/09 (%)
| Local General Obligations | | | 24.3 | | |
| Refunded/Escrowed | | | 14.1 | | |
| State General Obligations | | | 11.7 | | |
| Special Non-Property Tax | | | 10.0 | | |
| Education | | | 9.1 | | |
Sector breakdowns are calculated as a percentage of net assets.
Quality breakdown
as of 10/31/09 (%)
| AAA | | | 38.9 | | |
| AA | | | 31.5 | | |
| A | | | 21.9 | | |
| BBB | | | 3.7 | | |
| BB | | | 0.4 | | |
| Non-Rated | | | 3.6 | | |
Maturity breakdown
as of 10/31/09 (%)
| 0-1 year | | | 6.6 | | |
| 1-3 years | | | 13.1 | | |
| 3-5 years | | | 5.3 | | |
| 5-7 years | | | 12.1 | | |
| 7-10 years | | | 21.0 | | |
| 10-15 years | | | 27.2 | | |
| 15-20 years | | | 11.0 | | |
| 20-25 years | | | 1.1 | | |
| 25 years and over | | | 0.8 | | |
| Cash and Equivalents | | | 1.8 | | |
Quality and maturity breakdowns are calculated as a percentage of net assets. Ratings shown in the quality breakdown represent the rating assigned to a particular bond by one of the following nationally recognized rating agencies: Standard & Poor's, Moody's Investors Service, Inc. or Fitch Ratings Ltd. Ratings are relative and subjective and are not absolute standards of quality. The fund's credit quality does not remove market risk.
The fund is actively managed and the composition of its portfolio will change over time.
7
Fund Profile – Columbia Intermediate Municipal Bond Fund
Performance data quoted represents past performance and current performance may be lower or higher. Past performance is no guarantee of future results. The investment return and principal value will fluctuate so that shares, when redeemed, may be worth more or less than the original cost. Please visit www.columbiafunds.com for daily and most recent month-end performance updates.
Summary
1-year return as of 10/31/09
| | +10.19% | |
|
| |  | | | Class A shares
(without sales charge) | |
|
| | +11.41% | |
|
| |  | | | Barclays Capital
3-15 Year Blend
Municipal Bond Index | |
|
Morningstar Style BoxTM
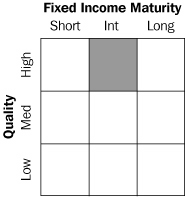
The Morningstar Style BoxTM reveals a fund's investment strategy. For fixed-income funds, the vertical axis shows the average credit quality of the bonds owned, and the horizontal axis shows interest rate sensitivity as measured by a bond's duration (short, intermediate or long). Information shown is based on the most recent data provided by Morningstar.
Summary
g For the 12-month period that ended October 31, 2009, the fund's Class A shares returned 10.19% without sales charge. Class Z shares returned 10.41%.
g The fund's return was lower than the return of its benchmark, the Barclays Capital 3-15 Year Blend Municipal Bond Index1 and in line with the average return of the fund's peer group, the Lipper Intermediate Municipal Debt Funds Classification.2
g The fund had less exposure than the benchmark to lower-quality issues, which hampered comparative results, as did some housing-related bonds. Positions in hospital and tobacco bonds aided performance.
Portfolio Management
Brian M. McGreevy has managed the fund since February 2009 and has been associated with the advisor or its predecessors since 1994.
1The Barclays Capital 3-15 Year Blend Municipal Bond Index tracks the performance of municipal bonds issued after December 31, 1990 with remaining maturities between 2 and 17 years and at least $5 million in principal amount outstanding. Indices are not available for investment, are not professionally managed and do not reflect sales charges, fees, brokerage commissions, taxes or other expenses of investing. Securities in the fund may not match those in an index.
2Lipper Inc., a widely respected data provider in the industry, calculates an average total return (assuming reinvestment of distributions) for mutual funds with investment objectives similar to those of the fund. Lipper makes no adjustment for the effect of sales loads.
8
Performance Information – Columbia Intermediate Municipal Bond Fund
Performance of a $10,000 investment 11/01/99 – 10/31/09
The table above shows the change in value of a hypothetical $10,000 investment in Class A shares of Columbia Intermediate Municipal Bond Fund during the stated time period, and does not reflect the deduction of taxes that a shareholder may pay on fund distributions or on the redemption of fund shares. The performance of a $10,000 investment with sales charge for Class A shares is calculated with an initial sales charge of 4.75%, which was the effective sales charge prior to August 22, 2005.
Performance of a $10,000 investment 11/01/99 – 10/31/09 ($)
| Sales charge | | without | | with | |
| Class A | | | 15,489 | | | | 14,749 | | |
| Class B | | | 14,654 | | | | 14,654 | | |
| Class C | | | 15,114 | | | | 15,144 | | |
| Class T | | | 15,544 | | | | 14,802 | | |
| Class Z | | | 15,798 | | | | n/a | | |
Average annual total return as of 10/31/09 (%)
| Share class | | A | | B | | C | | T | | Z | |
| Inception | | 11/25/02 | | 11/25/02 | | 11/25/02 | | 06/26/00 | | 06/14/93 | |
| Sales charge | | without | | with | | without | | with | | without | | with | | without | | with | | without | |
| 1-year | | | 10.19 | | | | 6.65 | | | | 9.48 | | | | 6.48 | | | | 9.97 | | | | 8.97 | | | | 10.25 | | | | 5.01 | | | | 10.41 | | |
| 5-year | | | 2.96 | | | | 1.97 | | | | 2.30 | | | | 2.30 | | | | 2.75 | | | | 2.75 | | | | 3.01 | | | | 2.02 | | | | 3.17 | | |
| 10-year | | | 4.47 | | | | 3.96 | | | | 3.90 | | | | 3.90 | | | | 4.22 | | | | 4.22 | | | | 4.51 | | | | 4.00 | | | | 4.68 | | |
Average annual total return as of 09/30/09 (%)
| Share class | | A | | B | | C | | T | | Z | |
| Sales charge | | without | | with | | without | | with | | without | | with | | without | | with | | without | |
| 1-year | | | 11.53 | | | | 7.88 | | | | 10.81 | | | | 7.81 | | | | 11.30 | | | | 10.30 | | | | 11.58 | | | | 6.25 | | | | 11.75 | | |
| 5-year | | | 3.58 | | | | 2.58 | | | | 2.91 | | | | 2.91 | | | | 3.37 | | | | 3.37 | | | | 3.63 | | | | 2.63 | | | | 3.78 | | |
| 10-year | | | 4.58 | | | | 4.06 | | | | 4.00 | | | | 4.00 | | | | 4.32 | | | | 4.32 | | | | 4.61 | | | | 4.10 | | | | 4.78 | | |
The "with sales charge" returns include the maximum initial sales charge of 3.25% for Class A shares (for the 1-year period), 4.75% for Class A shares (for the 5-year and 10-year periods) and 4.75% for Class T shares, the applicable contingent deferred sales charge of 3.00% in the first year, declining to 1.00% in the fourth year and eliminated thereafter for Class B shares and 1.00% for Class C shares for the first year only. The "without sales charge" returns do not include the effect of sales charges. If they had, returns would be lower.
Prior to August 22, 2005, new purchases of Class A shares had a maximum initial sales charge of 4.75%.
Performance results reflect any fee waivers or reimbursements of fund expenses by the investment advisor and/or any of its affiliates. Absent these fee waivers or expense reimbursement arrangements, performance results would have been lower.
All results shown assume reinvestment of distributions. Class Z shares are sold at net asset value with no distribution and service (Rule 12b-1) fees. Class Z shares have limited eligibility and the investment minimum requirements may vary. Please see the fund's prospectus for details. Performance for different share classes will vary based on differences in sales charges and fees associated with each class.
The tables do not reflect the deduction of taxes that a shareholder may pay on fund distributions or on the redemption of fund shares.
Class A, Class B, Class C, Class T and Class Z share performance information includes returns of Retail A shares (for Class A and Class T shares), Retail B shares (for Class B and Class C shares) and Trust shares (for Class Z shares) of Galaxy Intermediate Tax-Exempt Bond Fund, the predecessor to the Fund and a series of The Galaxy Fund (the "Galaxy Intermediate Fund"), for periods prior to November 25, 2002, the date on which Class A, Class B, Class C, Class T and Class Z shares were initially offered by the Fund. The returns shown for Class B and Class C shares also include the returns for Retail A shares for periods prior to March 1, 2001, the date on which Retail B shares were initially offered by the Galaxy Intermediate Fund. Retail A share returns include returns of the BKB shares of the Galaxy Intermediate Fund for periods prior to June 26, 2001, the date on which BKB shares were converted to Retail A shares, and Retail A and Class Z share returns include returns of shares of the Boston 1784 Tax-Exempt Medium-Term Income Fund for periods prior to June 26, 2000. The returns shown for all share classes reflect any differences in sales charges, but no returns have been restated to reflect any differences in expenses such as distribution and service (Rule 12b-1) fees between any predecessor share class and the corresponding newer share class. If differences in expenses had been reflected, the returns shown for periods prior to November 25, 2002 would be lower for Class A, Class B, Class C and Class T shares.
Performance data quoted represents past performance and current performance may be lower or higher. Past performance is no guarantee of future results. The investment return and principal value will fluctuate so that shares, when redeemed, may be worth more or less than the original cost. Please visit www.columbiafunds.com for daily and most recent month-end performance updates.
Annual operating expense ratio (%)*
| Class A | | | 0.75 | | |
| Class B | | | 1.40 | | |
| Class C | | | 1.40 | | |
| Class T | | | 0.70 | | |
| Class Z | | | 0.55 | | |
* The annual operating expense ratio is as stated in the fund's prospectus that is current as of the date of this report and includes the expenses incurred by the investment companies in which the fund invests. Differences in expense ratios disclosed elsewhere in this report may result from including expenses incurred by the investment companies, fee waivers and expense reimbursements as well as different time periods used in calculating the ratios.
9
Understanding Your Expenses – Columbia Intermediate Municipal Bond Fund
Estimating your actual expenses
To estimate the expenses that you paid over the period, first you will need your account balance at the end of the period:
g For shareholders who receive their account statements from Columbia Management Services, Inc., your account balance is available online at www.columbiafunds.com or by calling Shareholder Services at 800.345.6611.
g For shareholders who receive their account statements from their financial intermediary, contact your financial intermediary to obtain your account balance.
1. Divide your ending account balance by $1,000. For example, if an account balance was $8,600 at the end of the period, the result would be 8.6.
2. In the section of the table below titled "Expenses paid during the period," locate the amount for your share class. You will find this number in the column labeled "Actual." Multiply this number by the result from step 1. Your answer is an estimate of the expenses you paid on your account during the period.
If the value of your account falls below the minimum initial investment requirement applicable to you, your account generally will be subject to a $20 annual fee. This fee is not included in the accompanying table. If you are subject to the fee, keep it in mind when you are estimating the ongoing expenses of investing in the fund and when comparing the expenses of this fund with other funds.
As a fund shareholder, you incur two types of costs. There are transaction costs, which generally include sales charges on purchases and may include redemption fees or exchange fees. There are also ongoing costs, which generally include investment advisory fees, distribution and service (Rule 12b-1) fees and other fund expenses. The information on this page is intended to help you understand the ongoing costs of investing in the fund and to compare these costs with the ongoing costs of investing in other mutual funds.
Analyzing your fund's expenses by share class
To illustrate these ongoing costs, we have provided an example and calculated the expenses paid by investors in each share class during the period. The information in the following table is based on an initial investment of $1,000, which is invested at the beginning of the period and held for the entire period. Expense information is calculated two ways and each method provides you with different information. The amount listed in the "Actual" column is calculated using the fund's actual operating expenses and total return for the period. The amount listed in the "Hypothetical" column for each share class assumes that the return each year is 5% before expenses and is calculated based on the fund's actual operating expenses. You should not use the hypothetical account values and expenses to estimate either your actual account balance at the end of the period or the expenses you paid during this period.
Compare with other funds
Since all mutual funds are required to include the same hypothetical calculations about expenses in shareholder reports, you can use this information to compare the ongoing costs of investing in the fund with other funds. To do so, compare the 5% hypothetical example with the 5% hypothetical examples that appear in the shareholder reports of other funds. As you compare hypothetical examples of other funds, it is important to note that hypothetical examples are meant to highlight the ongoing costs of investing in a fund and do not reflect any transaction costs, such as sales charges, redemption fees or exchange fees.
05/01/09 – 10/31/09
| | | Account value at the
beginning of the period ($) | | Account value at the
end of the period ($) | | Expenses paid
during the period ($) | | Fund's annualized
expense ratio (%) | |
| | | Actual | | Hypothetical | | Actual | | Hypothetical | | Actual | | Hypothetical | | Actual | |
| Class A | | | 1,000.00 | | | | 1,000.00 | | | | 1,041.30 | | | | 1,021.42 | | | | 3.86 | | | | 3.82 | | | | 0.75 | | |
| Class B | | | 1,000.00 | | | | 1,000.00 | | | | 1,037.90 | | | | 1,018.15 | | | | 7.19 | | | | 7.12 | | | | 1.40 | | |
| Class C | | | 1,000.00 | | | | 1,000.00 | | | | 1,040.30 | | | | 1,020.42 | | | | 4.89 | | | | 4.84 | | | | 0.95 | | |
| Class T | | | 1,000.00 | | | | 1,000.00 | | | | 1,041.60 | | | | 1,021.68 | | | | 3.60 | | | | 3.57 | | | | 0.70 | | |
| Class Z | | | 1,000.00 | | | | 1,000.00 | | | | 1,042.40 | | | | 1,022.43 | | | | 2.83 | | | | 2.80 | | | | 0.55 | | |
Expenses paid during the period are equal to the annualized expense ratio for the share class, multiplied by the average account value over the period, then multiplied by the number of days in the fund's most recent fiscal half-year and divided by 365.
Had the investment advisor and/or any of its affiliates not waived fees or reimbursed a portion of expenses, account value at the end of the period would have been reduced.
It is important to note that the expense amounts shown in the table are meant to highlight only ongoing costs of investing in the fund and do not reflect any transaction costs, such as sales charges, redemption fees or exchange fees. Therefore, the hypothetical examples provided may not help you determine the relative total costs of owning shares of different funds. If these transaction costs were included, your costs would have been higher.
10
Portfolio Manager's Report – Columbia Intermediate Municipal Bond Fund
For the 12-month period that ended October 31, 2009, the fund's Class A shares returned 10.19% without sales charge. Class Z shares returned 10.41% without sales charge. By comparison, the fund's benchmark, the Barclays Capital 3-15 Year Blend Municipal Bond Index returned 11.41%. The average return of funds in its peer group, the Lipper Intermediate Municipal Debt Funds Classification, was 10.41%. The fund was less exposed than the benchmark and the average fund in its peer group to stronger-performing, lower-quality market segments, which accounted for part of its shortfall to these comparative measures. Bonds linked to housing-related sectors also held back overall returns. Lower-rated hospital bonds aided performance, as did underweights in several key sectors.
Brighter prospects boosted municipals
Investors appeared to become less risk averse early in 2009 as the economic outlook grew less grim. In this environment, municipal bonds became attractive alternatives to Treasury issues, which were outstanding performers in the previous period as a credit crisis triggered a massive flight to safety. During the period, municipal yields were often higher than Treasury yields, even without possible tax advantages. Overall credit quality was good, and the risk of default for state general obligation and rated essential service bonds was limited. Renewed buying drove strong returns across most municipal sectors. Investors focused initially on shorter-term issues, then migrated into the intermediate maturity range and lower-rated tiers, where yields were more attractive.
Lower-quality issues, housing-related bonds accounted for fund's shortfall
An overweight in higher-quality sectors detracted from performance as lower-quality issues outperformed during the period. In February 2009, we took steps to increase exposure to bonds with lower investment-grade ratings in the utility and essential services sectors. This move aided performance as the period wore on. Housing-related bonds were a drag on the fund's performance. However, these issues represented only about 1.5% of the portfolio at the end of the period. Issues secured by land intended for new homes fell sharply because developers, notably in Florida, found few buyers while the housing slump dragged on. We are in regular contact with these issuers as we monitor Florida's housing market closely. In addition, bonds issued by continuing care retirement communities came under pressure, as many retirees were unable to sell their homes in a weak market and were unable to move into these communities as planned.
Hospital and tobacco issues led results
Hospital bonds experienced strong demand as their higher yields attracted some of the money flowing into the municipal market from individuals and funds. As demand increased, the yield difference between higher- and lower-quality bonds narrowed, increasing their total return and adding to performance. Yields also narrowed on tobacco bonds, mostly rated in the BBB range, which are issued by the states and secured by payments from tobacco companies in settlement of a 1998 lawsuit. However, we have started to decrease the fund's tobacco holdings because we believe that falling cigarette sales could force issuers to extend payment periods, which would have a negative impact on the value of these longer-duration bonds. (Duration is a measure of interest-rate sensitivity.)
Performance data quoted represents past performance and current performance may be lower or higher. Past performance is no guarantee of future results. The investment return and principal value will fluctuate so that shares, when redeemed, may be worth more or less than the original cost. Please visit www.columbiafunds.com for daily and most recent month-end performance updates.
Net asset value per share
as of 10/31/09 ($)
| Class A | | | 10.22 | | |
| Class B | | | 10.22 | | |
| Class C | | | 10.22 | | |
| Class T | | | 10.22 | | |
| Class Z | | | 10.22 | | |
Distributions declared per share
11/01/08 – 10/31/09 ($)
| Class A | | | 0.37 | | |
| Class B | | | 0.30 | | |
| Class C | | | 0.35 | | |
| Class T | | | 0.37 | | |
| Class Z | | | 0.39 | | |
A portion of the fund's income may be subject to the alternative minimum tax. The fund may at times purchase tax-exempt securities at a discount. Some, or all, of this discount may be included in the fund's ordinary income, and is taxable when distributed.
30-day SEC yields
as of 10/31/09 (%)
| Class A | | | 2.59 | | |
| Class B | | | 2.06 | | |
| Class C | | | 2.51 | | |
| Class T | | | 2.63 | | |
| Class Z | | | 2.91 | | |
The 30-day SEC yields reflect the fund's earning power, net of expenses, expressed as an annualized percentage of the public offering price at the end of the period. Had the investment advisor and/or any of its affiliates not waived fees or reimbursed a portion of expenses, the 30-day SEC yields would have been lower.
11
Portfolio Manager's Report (continued) – Columbia Intermediate Municipal Bond Fund
Taxable-equivalent SEC yields
as of 10/31/09 (%)
| Class A | | | 3.98 | | |
| Class B | | | 3.17 | | |
| Class C | | | 3.86 | | |
| Class T | | | 4.05 | | |
| Class Z | | | 4.48 | | |
Taxable-equivalent SEC yields are based on the maximum effective 35.0% federal income tax rate. This tax rate does not reflect the phase out of exemptions or the reduction of the otherwise allowable deductions that occur when adjusted gross income exceeds certain levels.
Top 5 sectors
as of 10/31/09 (%)
| State General Obligations | | | 13.0 | | |
| Local General Obligations | | | 11.6 | | |
| Special Non-Property Tax | | | 10.7 | | |
| Hospitals | | | 8.4 | | |
| Refunded/Escrowed | | | 8.3 | | |
Sector breakdowns are calculated as a percentage of net assets.
Quality breakdown
as of 10/31/09 (%)
| AAA | | | 31.0 | | |
| AA | | | 37.6 | | |
| A | | | 18.7 | | |
| BBB | | | 8.0 | | |
| BB | | | 0.6 | | |
| CCC | | | 0.7 | | |
| Non-Rated | | | 3.4 | | |
Maturity breakdown
as of 10/31/09 (%)
| 1-3 years | | | 9.6 | | |
| 3-5 years | | | 14.7 | | |
| 5-7 years | | | 14.2 | | |
| 7-10 years | | | 24.0 | | |
| 10-15 years | | | 24.5 | | |
| 15-20 years | | | 10.7 | | |
| 20-25 years | | | 1.6 | | |
| 25 years and over | | | 0.2 | | |
| Cash and Equivalents | | | 0.5 | | |
Quality and maturity breakdowns are calculated as a percentage of net assets. Ratings shown in the quality breakdown represent the rating assigned to a particular bond by one of the following nationally recognized rating agencies: Standard & Poor's, Moody's Investors Service, Inc. or Fitch Ratings Ltd. Ratings are relative and subjective and are not absolute standards of quality. The fund's credit quality does not remove market risk.
The fund is actively managed and the composition of its portfolio will change over time.
Decisions to underweight certain sectors also aided performance during the period. The fund had less exposure than the index to state general obligation bonds, which underperformed lower-rated sectors, and pre-refunded bonds, which normally are shorter in maturity and lagged in the rally. The fund also had less exposure than the index to California bonds, which were hurt by the state's ongoing financial struggles.
Positioned for possible volatility
Given the stresses facing many states and municipalities, we think that some ratings downgrades are possible. We may use any resulting declines to seek opportunities among solid A-rated securities. Although hospital holdings have been trimmed, the fund still holds large stakes in the hospital and electric utility sectors. We expanded the fund's exposure to BBB-rated issues, while scaling back AAA-rated bonds, and broadened exposure to bonds with maturity dates in the 12- to 17-year range to take advantage of higher yields. To make management and trading more efficient, we also bolstered the fund's average position size by shedding small holdings in the zero- to 5-year maturity range.
Portfolio holdings and characteristics are subject to change periodically and may not be representative of current holdings and characteristics. The outlook for this fund may differ from those presented for other Columbia Funds.
Tax-exempt investing offers current tax-exempt income, but it also involves certain risks. The value of the fund will be affected by interest rate changes and the creditworthiness of issues held in the fund. When interest rates go up, bond prices generally drop and vice versa.
Interest income from certain tax-exempt bonds may be subject to certain state and local taxes and, if applicable, the alternative minimum tax. Capital gains are not exempt from income taxes.
12
Fund Profile – Columbia Massachusetts Intermediate Municipal Bond Fund
Summary
g For the 12-month period that ended October 31, 2009, the fund's Class A shares returned 10.78% without sales charge. Class Z shares returned 11.06%.
g The fund performed roughly in line with its benchmark, the Barclays Capital 3-15 Year Blend Municipal Bond Index1, and came out ahead of the average return of its peer group, the Lipper Massachusetts Intermediate Municipal Debt Funds Classification.2
g Interest-rate positioning helped performance versus the index and peer group, while an underweight in A- and BBB-rated bonds detracted from results relative to the index.
Portfolio Management
Brian M. McGreevy has managed the fund since February 2009 and has been associated with the advisor or its predecessors since 1994.
1The Barclays Capital 3-15 Year Blend Municipal Bond Index tracks the performance of municipal bonds issued after December 31, 1990 with remaining maturities between 2 and 17 years and at least $5 million in principal amount outstanding. Indices are not available for investment, are not professionally managed and do not reflect sales charges, fees, brokerage commissions, taxes or other expenses of investing. Securities in the fund may not match those in an index.
2Lipper Inc., a widely respected data provider in the industry, calculates an average total return (assuming reinvestment of distributions) for mutual funds with investment objectives similar to those of the fund. Lipper makes no adjustment for the effect of sales loads.
Performance data quoted represents past performance and current performance may be lower or higher. Past performance is no guarantee of future results. The investment return and principal value will fluctuate so that shares, when redeemed, may be worth more or less than the original cost. Please visit www.columbiafunds.com for daily and most recent month-end performance updates.
Summary
1-year return as of 10/31/09
| | +10.78% | |
|
| |  | | | Class A shares
(without sales charge) | |
|
| | +11.41% | |
|
| |  | | | Barclays Capital
3-15 Year Blend
Municipal Bond Index | |
|
Morningstar Style BoxTM

The Morningstar Style BoxTM reveals a fund's investment strategy. For fixed-income funds, the vertical axis shows the average credit quality of the bonds owned, and the horizontal axis shows interest rate sensitivity as measured by a bond's duration (short, intermediate or long). Information shown is based on the most recent data provided by Morningstar.
13
Performance Information – Columbia Massachusetts Intermediate Municipal Bond Fund
Performance data quoted represents past performance and current performance may be lower or higher. Past performance is no guarantee of future results. The investment return and principal value will fluctuate so that shares, when redeemed, may be worth more or less than the original cost. Please visit www.columbiafunds.com for daily and most recent month-end performance updates.
Annual operating expense ratio (%)*
| Class A | | | 0.92 | | |
| Class B | | | 1.67 | | |
| Class C | | | 1.67 | | |
| Class T | | | 0.82 | | |
| Class Z | | | 0.67 | | |
* The annual operating expense ratio is as stated in the fund's prospectus that is current as of the date of this report and includes the expenses incurred by the investment companies in which the fund invests. Differences in expense ratios disclosed elsewhere in this report may result from including expenses incurred by the investment companies, fee waivers and expense reimbursements as well as different time periods used in calculating the ratios.
Performance of a $10,000 investment 11/01/99 – 10/31/09
The chart above shows the change in value of a hypothetical $10,000 investment in Class A shares of Columbia Massachusetts Intermediate Municipal Bond Fund during the stated time period, and does not reflect the deduction of taxes that a shareholder may pay on fund distributions or on the redemption of fund shares. The performance of a $10,000 investment with sales charge for Class A shares is calculated with an initial sales charge of 4.75%, which was the effective sales charge prior to August 22, 2005.
Performance of a $10,000 investment 11/01/99 – 10/31/09 ($)
| Sales charge | | without | | with | |
| Class A | | | 15,541 | | | | 14,807 | | |
| Class B | | | 14,578 | | | | 14,578 | | |
| Class C | | | 14,934 | | | | 14,934 | | |
| Class T | | | 15,656 | | | | 14,916 | | |
| Class Z | | | 15,879 | | | | n/a | | |
Average annual total return as of 10/31/09 (%)
| Share class | | A | | B | | C | | T | | Z | |
| Inception | | 12/09/02 | | 12/09/02 | | 12/09/02 | | 06/26/00 | | 06/14/93 | |
| Sales charge | | without | | with | | without | | with | | without | | with | | without | | with | | without | |
| 1-year | | | 10.78 | | | | 7.21 | | | | 9.96 | | | | 6.96 | | | | 10.34 | | | | 9.34 | | | | 10.89 | | | | 5.66 | | | | 11.06 | | |
| 5-year | | | 3.20 | | | | 2.20 | | | | 2.43 | | | | 2.43 | | | | 2.79 | | | | 2.79 | | | | 3.30 | | | | 2.31 | | | | 3.46 | | |
| 10-year | | | 4.51 | | | | 4.00 | | | | 3.84 | | | | 3.84 | | | | 4.09 | | | | 4.09 | | | | 4.58 | | | | 4.08 | | | | 4.73 | | |
Average annual total return as of 09/30/09 (%)
| Share class | | A | | B | | C | | T | | Z | |
| Sales charge | | without | | with | | without | | with | | without | | with | | without | | with | | without | |
| 1-year | | | 13.28 | | | | 9.65 | | | | 12.44 | | | | 9.44 | | | | 12.83 | | | | 11.83 | | | | 13.40 | | | | 7.97 | | | | 13.56 | | |
| 5-year | | | 3.82 | | | | 2.81 | | | | 3.05 | | | | 3.05 | | | | 3.40 | | | | 3.40 | | | | 3.92 | | | | 2.92 | | | | 4.08 | | |
| 10-year | | | 4.65 | | | | 4.15 | | | | 3.99 | | | | 3.99 | | | | 4.24 | | | | 4.24 | | | | 4.73 | | | | 4.22 | | | | 4.88 | | |
The "with sales charge" returns include the maximum initial sales charge of 3.25% for Class A shares (for the 1-year period), 4.75% for Class A shares (for the 5-year and 10-year periods) and 4.75% for Class T shares, the applicable contingent deferred sales charge of 3.00% in the first year, declining to 1.00% in the fourth year and eliminated thereafter for Class B shares and 1.00% for Class C shares for the first year only. The "without sales charge" returns do not include the effect of sales charges. If they had, returns would be lower.
Prior to August 22, 2005, new purchases of Class A shares had a maximum initial sales charge of 4.75%.
Performance results reflect any fee waivers or reimbursements of fund expenses by the investment advisor and/or any of its affiliates. Absent these fee waivers or expense reimbursement arrangements, performance results would have been lower.
All results shown assume reinvestment of distributions. Class Z shares are sold at net asset value with no distribution and service (Rule 12b-1) fees. Class Z shares have limited eligibility and the investment minimum requirements may vary. Please see the fund's prospectus for details. Performance for different share classes will vary based on differences in sales charges and fees associated with each class.
The tables do not reflect the deduction of taxes that a shareholder may pay on fund distributions or on the redemption of fund shares.
Class A, Class B, Class C, Class T and Class Z share performance information includes returns of Retail A shares (for Class A and Class T shares), Retail B shares (for Class B and Class C shares) and Trust shares (for Class Z shares) of Galaxy Massachusetts Intermediate Municipal Bond Fund, the predecessor to the Fund and a series of The Galaxy Fund (the "Galaxy Massachusetts Fund"), for periods prior to December 9, 2002, the date on which Class A, Class B, Class C, Class T and Class Z shares were initially offered by the Fund. The returns shown for Class B and Class C shares also include the returns for Retail A shares for periods prior to March 1, 2001, the date on which Retail B shares were initially offered by the Galaxy Massachusetts Fund. Retail A share returns include returns of the BKB shares of the Galaxy Massachusetts Fund for periods prior to June 26, 2001, the date on which BKB shares were converted to Retail A share s, and Retail A and Class Z share returns include returns of shares of the Boston 1784 Massachusetts Tax-Exempt Income Fund for periods prior to June 26, 2000. The returns shown for all share classes reflect any differences in sales charges, but no returns have been restated to reflect any differences in expenses such as distribution and service (Rule 12b-1) fees between any predecessor share class and the corresponding newer share class. If differences in expenses had been reflected, the returns shown for periods prior to December 9, 2002 would be lower for Class A, Class B, Class C and Class T shares.
14
Understanding Your Expenses – Columbia Massachusetts Intermediate Municipal Bond Fund
As a fund shareholder, you incur two types of costs. There are transaction costs, which generally include sales charges on purchases and may include redemption fees or exchange fees. There are also ongoing costs, which generally include investment advisory fees, distribution and service (Rule 12b-1) fees and other fund expenses. The information on this page is intended to help you understand the ongoing costs of investing in the fund and to compare these costs with the ongoing costs of investing in other mutual funds.
Analyzing your fund's expenses by share class
To illustrate these ongoing costs, we have provided an example and calculated the expenses paid by investors in each share class during the period. The information in the following table is based on an initial investment of $1,000, which is invested at the beginning of the period and held for the entire period. Expense information is calculated two ways and each method provides you with different information. The amount listed in the "Actual" column is calculated using the fund's actual operating expenses and total return for the period. The amount listed in the "Hypothetical" column for each share class assumes that the return each year is 5% before expenses and is calculated based on the fund's actual operating expenses. You should not use the hypothetical account values and expenses to estimate either your actual account balance at the end of the period or the expenses you paid during this period.
Compare with other funds
Since all mutual funds are required to include the same hypothetical calculations about expenses in shareholder reports, you can use this information to compare the ongoing costs of investing in the fund with other funds. To do so, compare the 5% hypothetical example with the 5% hypothetical examples that appear in the shareholder reports of other funds. As you compare hypothetical examples of other funds, it is important to note that hypothetical examples are meant to highlight the ongoing costs of investing in a fund and do not reflect any transaction costs, such as sales charges, redemption fees or exchange fees.
Estimating your actual expenses
To estimate the expenses that you paid over the period, first you will need your account balance at the end of the period:
g For shareholders who receive their account statements from Columbia Management Services, Inc., your account balance is available online at www.columbiafunds.com or by calling Shareholder Services at 800.345.6611.
g For shareholders who receive their account statements from their financial intermediary, contact your financial intermediary to obtain your account balance.
1. Divide your ending account balance by $1,000. For example, if an account balance was $8,600 at the end of the period, the result would be 8.6.
2. In the section of the table below titled "Expenses paid during the period," locate the amount for your share class. You will find this number in the column labeled "Actual." Multiply this number by the result from step 1. Your answer is an estimate of the expenses you paid on your account during the period.
If the value of your account falls below the minimum initial investment requirement applicable to you, your account generally will be subject to a $20 annual fee. This fee is not included in the accompanying table. If you are subject to the fee, keep it in mind when you are estimating the ongoing expenses of investing in the fund and when comparing the expenses of this fund with other funds.
05/01/09 – 10/31/09
| | | Account value at the
beginning of the period ($) | | Account value at the
end of the period ($) | | Expenses paid
during the period ($) | | Fund's annualized
expense ratio (%) | |
| | | Actual | | Hypothetical | | Actual | | Hypothetical | | Actual | | Hypothetical | | Actual | |
| Class A | | | 1,000.00 | | | | 1,000.00 | | | | 1,026.00 | | | | 1,021.17 | | | | 4.09 | | | | 4.08 | | | | 0.80 | | |
| Class B | | | 1,000.00 | | | | 1,000.00 | | | | 1,022.10 | | | | 1,017.39 | | | | 7.90 | | | | 7.88 | | | | 1.55 | | |
| Class C | | | 1,000.00 | | | | 1,000.00 | | | | 1,023.90 | | | | 1,019.16 | | | | 6.12 | | | | 6.11 | | | | 1.20 | | |
| Class T | | | 1,000.00 | | | | 1,000.00 | | | | 1,026.50 | | | | 1,021.68 | | | | 3.58 | | | | 3.57 | | | | 0.70 | | |
| Class Z | | | 1,000.00 | | | | 1,000.00 | | | | 1,027.20 | | | | 1,022.43 | | | | 2.81 | | | | 2.80 | | | | 0.55 | | |
Expenses paid during the period are equal to the annualized expense ratio for the share class, multiplied by the average account value over the period, then multiplied by the number of days in the fund's most recent fiscal half-year and divided by 365.
Had the investment advisor and/or any of its affiliates not waived fees or reimbursed a portion of expenses, account value at the end of the period would have been reduced.
It is important to note that the expense amounts shown in the table are meant to highlight only ongoing costs of investing in the fund and do not reflect any transaction costs, such as sales charges, redemption fees or exchange fees. Therefore, the hypothetical examples provided may not help you determine the relative total costs of owning shares of different funds. If these transaction costs were included, your costs would have been higher.
15
Portfolio Manager's Report – Columbia Massachusetts Intermediate Municipal Bond Fund
Performance data quoted represents past performance and current performance may be lower or higher. Past performance is no guarantee of future results. The investment return and principal value will fluctuate so that shares, when redeemed, may be worth more or less than the original cost. Please visit www.columbiafunds.com for daily and most recent month-end performance updates.
Net asset value per share
as of 10/31/09 ($)
| Class A | | | 10.61 | | |
| Class B | | | 10.61 | | |
| Class C | | | 10.61 | | |
| Class T | | | 10.61 | | |
| Class Z | | | 10.61 | | |
Distributions declared per share
11/01/08 – 10/31/09 ($)
| Class A | | | 0.35 | | |
| Class B | | | 0.27 | | |
| Class C | | | 0.31 | | |
| Class T | | | 0.36 | | |
| Class Z | | | 0.37 | | |
A portion of the fund's income may be subject to the alternative minimum tax. The fund may at times purchase tax-exempt securities at a discount. Some, or all, of this discount may be included in the fund's ordinary income, and is taxable when distributed.
30-day SEC yields
as of 10/31/09 (%)
| Class A | | | 1.92 | | |
| Class B | | | 1.25 | | |
| Class C | | | 1.62 | | |
| Class T | | | 2.02 | | |
| Class Z | | | 2.27 | | |
The 30-day SEC yields reflect the fund's earning power, net of expenses, expressed as an annualized percentage of the public offering price at the end of the period. Had the investment advisor and/or any of its affiliates not waived fees or reimbursed a portion of expenses, the 30-day SEC yields would have been lower.
Taxable-equivalent SEC yields
as of 10/31/09 (%)
| Class A | | | 3.12 | | |
| Class B | | | 2.02 | | |
| Class C | | | 2.63 | | |
| Class T | | | 3.28 | | |
| Class Z | | | 3.69 | | |
Taxable-equivalent SEC yields are calculated assuming a federal income tax rate of 35.0% and a Massachusetts state income tax rate of 5.30%. These tax rates do not reflect the phase out of exemptions or the reduction of the otherwise allowable deductions that occur when adjusted gross income exceeds certain levels. Your taxable-equivalent yield may be different depending on your tax bracket.
For the 12-month period that ended October 31, 2009, the fund's Class A shares returned 10.78% without sales charge. Class Z shares returned 11.06% without sales charge. By comparison, the fund's benchmark, the Barclays Capital 3-15 Year Blend Municipal Bond Index, which is national in scope, returned 11.41%. The fund's return was higher than the 9.87% average return of the funds in its peer group, the Lipper Massachusetts Intermediate Municipal Debt Funds Classification. Being slightly more sensitive to interest rate changes than both the index and peer group helped the fund as rates fell and bond prices rose. An overweight versus the peer group in bonds with 12- to 15-year maturities further aided results, as longer-maturity issues generated stronger returns than shorter-maturity issues for the year. An underweight in A- and BBB-rated bonds and a lack of exposure to the tobacco sector hindered returns relative to both the inde x and peer group, as lower-quality issues outpaced higher-quality bonds.
Biggest gains from lower-quality and longer-maturity issues
Municipal bonds had a great year, buoyed by a dramatic decline in yields as well as strong demand, particularly from individual investors. Nationwide supply was somewhat constrained by a liquidity crunch, credit downgrades for many municipal bond insurers and the creation of Build America Bonds, which expanded financing options for municipalities by allowing them to issue taxable bonds and receive a federal subsidy to cover 35% of their costs. While higher-quality, shorter-maturity municipal bonds outperformed early in the period, longer-term and lower-rated issues took off in the spring as the economy stabilized and were the year's strongest performers.
Search for opportunities to enhance yield
A sizable stake in high-quality (AAA and AA) issues worked well early on when the financial markets were in turmoil. As conditions began to stabilize, we took advantage of buying opportunities that could increase yield. Additions included lower-quality bonds with A and BBB ratings, most of which had yields of 5% or higher. Among new purchases were A-/BBB2 bonds issued by Dominion Energy (0.9% of net assets). Despite these additions, the fund remained underweight in lower-quality bonds at period end. Elsewhere, we added to bonds with maturities between nine and 15 years, while decreasing exposure to short-maturity issues, including pre-refunded bonds and issues with maturities under two years and yields less than 1%. Pre-refunding occurs when issuers issue new bonds at lower prevailing rates and put the proceeds into an escrow account to help meet the interest payments on the older, higher-rate bonds until they can be redeemed. P re-refunding shortens maturity and boosts credit quality. Overweights in the hospital and education sectors were also helpful, as was a sizable stake in longer-maturity state general obligation (GO) bonds. Investments in shorter-maturity Puerto Rico bonds modestly hampered performance.
Improving outlook for Massachusetts
Despite well-publicized budget strains, the Commonwealth of Massachusetts maintained its Aa2/AA credit rating. A new budget for the fiscal year that began in July included a mix of spending cuts and tax increases, most notably a sales tax hike that went into effect in August. By period end, the commonwealth's economy was showing early signs of recovery, although unemployment was expected to rise further.
16
Portfolio Manager's Report (continued) – Columbia Massachusetts Intermediate Municipal Bond Fund
Looking ahead, we expect more cuts in funding to towns and cities, which will pressure their budgets and may hinder the supply of local GOs. The education sector, however, is likely to benefit from an uptick in applications as the weak job market spurs individuals to further their education. Going forward, we believe credit selection will be critical as we look for added opportunities to enhance yield.
Portfolio holdings and characteristics are subject to change periodically and may not be representative of current holdings and characteristics. The outlook for this fund may differ from those presented for other Columbia Funds.
Tax-exempt investing offers current tax-exempt income, but it also involves certain risks. The value of the fund will be affected by interest rate changes and the creditworthiness of issues held in the fund. When interest rates go up, bond prices generally drop and vice versa.
Interest income from certain tax-exempt bonds may be subject to certain state and local taxes and, if applicable, the alternative minimum tax. Capital gains are not exempt from income taxes.
The fund is non-diversified, which generally means that it may invest a greater percentage of its total assets in the securities of fewer issuers than a "diversified" fund. This increases the risk that a change in the value of any one investment held by the fund could affect the overall value of the fund more than it would affect that of a diversified fund holding a greater number of investments. Accordingly, the fund's value will likely be more volatile than the value of more diversified funds.
Single-state municipal bond funds pose additional risks due to limited geographical diversification.
Top 5 sectors
as of 10/31/09 (%)
| State General Obligations | | | 15.6 | | |
| Education | | | 14.8 | | |
| Refunded/Escrowed | | | 11.3 | | |
| Special Non-Property Tax | | | 10.7 | | |
| Local General Obligations | | | 10.8 | | |
Sector breakdowns are calculated as a percentage of net assets.
Maturity breakdown
as of 10/31/09 (%)
| 0-1 year | | | 6.4 | | |
| 1-3 years | | | 11.1 | | |
| 3-5 years | | | 13.4 | | |
| 5-7 years | | | 10.8 | | |
| 7-10 years | | | 26.1 | | |
| 10-15 years | | | 24.2 | | |
| 15-20 years | | | 3.9 | | |
| 25 years and over | | | 2.3 | | |
| Cash & Equivalents | | | 1.8 | | |
Quality breakdown
as of 10/31/09 (%)
| AAA | | | 31.5 | | |
| AA | | | 48.2 | | |
| A | | | 15.2 | | |
| BBB | | | 3.4 | | |
| Non-Rated | | | 1.7 | | |
Quality and maturity breakdowns are calculated as a percentage of net assets. Ratings shown in the quality breakdown represent the rating assigned to a particular bond by one of the following nationally recognized rating agencies: Standard & Poor's, Moody's Investors Service, Inc. or Fitch Ratings Ltd. Ratings are relative and subjective and are not absolute standards of quality. The fund's credit quality does not remove market risk.
The fund is actively managed and the composition of its portfolio will change over time.
17
Fund Profile – Columbia New Jersey Intermediate Municipal Bond Fund
Performance data quoted represents past performance and current performance may be lower or higher. Past performance is no guarantee of future results. The investment return and principal value will fluctuate so that shares, when redeemed, may be worth more or less than the original cost. Please visit www.columbiafunds.com for daily and most recent month-end performance updates.
Summary
1-year return as of 10/31/09
| | +9.63% | |
|
| |  | | | Class A shares
(without sales charge) | |
|
| | +11.41% | |
|
| |  | | | Barclays Capital
3-15 Year Blend
Municipal Bond Index | |
|
Morningstar Style BoxTM

The Morningstar Style BoxTM reveals a fund's investment strategy. For fixed-income funds, the vertical axis shows the average credit quality of the bonds owned, and the horizontal axis shows interest rate sensitivity as measured by a bond's duration (short, intermediate or long). Information shown is based on the most recent data provided by Morningstar.
Summary
g For the 12-month period that ended October 31, 2009, the fund's Class A shares returned 9.63% without sales charge. Class Z shares returned 9.91%.
g The fund's return was lower than the return of its benchmark, the Barclays Capital 3-15 Year Blend Municipal Bond Index1 and generally in line with the average return of the fund's peer group, the Lipper Other States Intermediate Municipal Debt Funds Classification.2
g Credit concerns tied to New Jersey's budget problems dampened returns compared to the benchmark, which holds bonds of many different states. Certain sector weights aided relative performance: an overweight in housing bonds and local general obligation bonds and an underweight in state general obligation bonds.
Portfolio Management
Brian M. McGreevy has managed the fund since September 1998 and has been associated with the advisor or its predecessors since 1994.
1The Barclays Capital 3-15 Year Blend Municipal Bond Index tracks the performance of municipal bonds issued after December 31, 1990 with remaining maturities between 2 and 17 years and at least $5 million in principal amount outstanding. Indices are not available for investment, are not professionally managed and do not reflect sales charges, fees, brokerage commissions, taxes or other expenses of investing. Securities in the fund may not match those in an index.
2Lipper Inc., a widely respected data provider in the industry, calculates an average total return (assuming reinvestment of distributions) for mutual funds with investment objectives similar to those of the fund. Lipper makes no adjustment for the effect of sales loads.
18
Performance Information – Columbia New Jersey Intermediate Municipal Bond Fund
Performance of a $10,000 investment 11/01/99 – 10/31/09
The chart above shows the change in value of a hypothetical $10,000 investment in Class A shares of Columbia New Jersey Intermediate Municipal Bond Fund during the stated time period, and does not reflect the deduction of taxes that a shareholder may pay on fund distributions or on the redemption of fund shares. The performance of a $10,000 investment with sales charge for Class A shares is calculated with an initial sales charge of 4.75%, which was the effective sales charge prior to August 22, 2005.
Performance of a $10,000 investment 11/01/99 – 10/31/09 ($)
| Sales charge | | without | | with | |
| Class A | | | 15,477 | | | | 14,737 | | |
| Class B | | | 14,496 | | | | 14,496 | | |
| Class C | | | 14,854 | | | | 14,854 | | |
| Class T | | | 15,584 | | | | 14,839 | | |
| Class Z | | | 15,823 | | | | n/a | | |
Average annual total return as of 10/31/09 (%)
| Share class | | A | | B | | C | | T | | Z | |
| Inception | | 11/18/02 | | 11/18/02 | | 11/18/02 | | 04/03/98 | | 04/03/98 | |
| Sales charge | | without | | with | | without | | with | | without | | with | | without | | with | | without | |
| 1-year | | | 9.63 | | | | 6.08 | | | | 8.82 | | | | 5.82 | | | | 9.20 | | | | 8.20 | | | | 9.75 | | | | 4.49 | | | | 9.91 | | |
| 5-year | | | 2.87 | | | | 1.86 | | | | 2.10 | | | | 2.10 | | | | 2.46 | | | | 2.46 | | | | 2.97 | | | | 1.97 | | | | 3.12 | | |
| 10-year | | | 4.46 | | | | 3.95 | | | | 3.78 | | | | 3.78 | | | | 4.04 | | | | 4.04 | | | | 4.54 | | | | 4.03 | | | | 4.70 | | |
Average annual total return as of 09/30/09 (%)
| Share class | | A | | B | | C | | T | | Z | |
| Sales charge | | without | | with | | without | | with | | without | | with | | without | | with | | without | |
| 1-year | | | 11.45 | | | | 7.87 | | | | 10.63 | | | | 7.63 | | | | 11.01 | | | | 10.01 | | | | 11.57 | | | | 6.28 | | | | 11.74 | | |
| 5-year | | | 3.46 | | | | 2.45 | | | | 2.70 | | | | 2.70 | | | | 3.05 | | | | 3.05 | | | | 3.57 | | | | 2.56 | | | | 3.73 | | |
| 10-year | | | 4.57 | | | | 4.07 | | | | 3.90 | | | | 3.90 | | | | 4.15 | | | | 4.15 | | | | 4.64 | | | | 4.14 | | | | 4.80 | | |
The "with sales charge" returns include the maximum initial sales charge of 3.25% for Class A shares (for the 1-year period), 4.75% for Class A shares (for the 5-year and 10-year periods) and 4.75% for Class T shares, the applicable contingent deferred sales charge of 3.00% in the first year, declining to 1.00% in the fourth year, and eliminated thereafter for Class B shares and 1.00% for Class C shares for the first year only. The "without sales charge" returns do not include the effect of sales charges. If they had, returns would be lower.
Prior to August 22, 2005, new purchases of Class A shares had a maximum initial sales charge of 4.75%.
Performance results reflect any fee waivers or reimbursements of fund expenses by the investment advisor and/or any of its affiliates. Absent these fee waivers or expense reimbursement arrangements, performance results would have been lower.
All results shown assume reinvestment of distributions. Class Z shares are sold at net asset value with no distribution and service (Rule 12b-1) fees. Class Z shares have limited eligibility and the investment minimum requirements may vary. Please see the fund's prospectus for details. Performance for different share classes will vary based on differences in sales charges and fees associated with each class.
The tables do not reflect the deduction of taxes that a shareholder may pay on fund distributions or on the redemption of fund shares.
Class A, Class B, Class C, Class T and Class Z share performance information includes returns of Retail A shares (for Class A and Class T shares), Retail B shares (for Class B and Class C shares) and Trust shares (for Class Z shares) of Galaxy New Jersey Municipal Bond Fund, the predecessor to the Fund and a series of The Galaxy Fund (the "Galaxy New Jersey Fund"), for periods prior to November 18, 2002, the date on which Class A, Class B, Class C, Class T and Class Z shares were initially offered by the Fund. The returns shown for Class B and Class C shares also include the returns for Retail A shares for periods prior to March 1, 2001, the date on which Retail B shares were initially offered by the Galaxy New Jersey Fund. The returns shown for all share classes reflect any differences in sales charges, but no returns have been restated to reflect any differences in expenses such as distribution and service (Rule 12b-1) fees be tween any predecessor share class and the corresponding newer share class. If differences in expenses had been reflected, the returns shown for periods prior to November 18, 2002 would be lower for Class A, Class B and Class C shares.
Performance data quoted represents past performance and current performance may be lower or higher. Past performance is no guarantee of future results. The investment return and principal value will fluctuate so that shares, when redeemed, may be worth more or less than the original cost. Please visit www.columbiafunds.com for daily and most recent month-end performance updates.
Annual operating expense ratio (%)*
| Class A | | | 1.19 | | |
| Class B | | | 1.94 | | |
| Class C | | | 1.94 | | |
| Class T | | | 1.09 | | |
| Class Z | | | 0.94 | | |
* The annual operating expense ratio is as stated in the fund's prospectus that is current as of the date of this report and includes the expenses incurred by the investment companies in which the fund invests. Differences in expense ratios disclosed elsewhere in this report may result from including expenses incurred by the investment companies, fee waivers and expense reimbursements as well as different time periods used in calculating the ratios.
19
Understanding Your Expenses – Columbia New Jersey Intermediate Municipal Bond Fund
Estimating your actual expenses
To estimate the expenses that you paid over the period, first you will need your account balance at the end of the period:
g For shareholders who receive their account statements from Columbia Management Services, Inc., your account balance is available online at www.columbiafunds.com or by calling Shareholder Services at 800.345.6611.
g For shareholders who receive their account statements from their financial intermediary, contact your financial intermediary to obtain your account balance.
1. Divide your ending account balance by $1,000. For example, if an account balance was $8,600 at the end of the period, the result would be 8.6.
2. In the section of the table below titled "Expenses paid during the period," locate the amount for your share class. You will find this number in the column labeled "Actual." Multiply this number by the result from step 1. Your answer is an estimate of the expenses you paid on your account during the period.
If the value of your account falls below the minimum initial investment requirement applicable to you, your account generally will be subject to a $20 annual fee. This fee is not included in the accompanying table. If you are subject to the fee, keep it in mind when you are estimating the ongoing expenses of investing in the fund and when comparing the expenses of this fund with other funds.
As a fund shareholder, you incur two types of costs. There are transaction costs, which generally include sales charges on purchases and may include redemption fees or exchange fees. There are also ongoing costs, which generally include investment advisory fees, distribution and service (Rule 12b-1) fees and other fund expenses. The information on this page is intended to help you understand the ongoing costs of investing in the fund and to compare these costs with the ongoing costs of investing in other mutual funds.
Analyzing your fund's expenses by share class
To illustrate these ongoing costs, we have provided an example and calculated the expenses paid by investors in each share class during the period. The information in the following table is based on an initial investment of $1,000, which is invested at the beginning of the period and held for the entire period. Expense information is calculated two ways and each method provides you with different information. The amount listed in the "Actual" column is calculated using the fund's actual operating expenses and total return for the period. The amount listed in the "Hypothetical" column for each share class assumes that the return each year is 5% before expenses and is calculated based on the fund's actual operating expenses. You should not use the hypothetical account values and expenses to estimate either your actual account balance at the end of the period or the expenses you paid during this period.
Compare with other funds
Since all mutual funds are required to include the same hypothetical calculations about expenses in shareholder reports, you can use this information to compare the ongoing costs of investing in the fund with other funds. To do so, compare the 5% hypothetical example with the 5% hypothetical examples that appear in the shareholder reports of other funds. As you compare hypothetical examples of other funds, it is important to note that hypothetical examples are meant to highlight the ongoing costs of investing in a fund and do not reflect any transaction costs, such as sales charges, redemption fees or exchange fees.
05/01/09 – 10/31/09
| | | Account value at the
beginning of the period ($) | | Account value at the
end of the period ($) | | Expenses paid
during the period ($) | | Fund's annualized
expense ratio (%) | |
| | | Actual | | Hypothetical | | Actual | | Hypothetical | | Actual | | Hypothetical | | Actual | |
| Class A | | | 1,000.00 | | | | 1,000.00 | | | | 1,029.30 | | | | 1,021.17 | | | | 4.09 | | | | 4.08 | | | | 0.80 | | |
| Class B | | | 1,000.00 | | | | 1,000.00 | | | | 1,025.50 | | | | 1,017.39 | | | | 7.91 | | | | 7.88 | | | | 1.55 | | |
| Class C | | | 1,000.00 | | | | 1,000.00 | | | | 1,027.30 | | | | 1,019.16 | | | | 6.13 | | | | 6.11 | | | | 1.20 | | |
| Class T | | | 1,000.00 | | | | 1,000.00 | | | | 1,029.90 | | | | 1,021.68 | | | | 3.58 | | | | 3.57 | | | | 0.70 | | |
| Class Z | | | 1,000.00 | | | | 1,000.00 | | | | 1,030.60 | | | | 1,022.43 | | | | 2.82 | | | | 2.80 | | | | 0.55 | | |
Expenses paid during the period are equal to the annualized expense ratio for the share class, multiplied by the average account value over the period, then multiplied by the number of days in the fund's most recent fiscal half-year and divided by 365.
Had the investment advisor and/or any of its affiliates not waived fees or reimbursed a portion of expenses, account value at the end of the period would have been reduced.
It is important to note that the expense amounts shown in the table are meant to highlight only ongoing costs of investing in the fund and do not reflect any transaction costs, such as sales charges, redemption fees or exchange fees. Therefore, the hypothetical examples provided may not help you determine the relative total costs of owning shares of different funds. If these transaction costs were included, your costs would have been higher.
20
Portfolio Manager's Report – Columbia New Jersey Intermediate Municipal Bond Fund
For the 12-month period that ended October 31, 2009, the fund's Class A shares returned 9.63% without sales charge. Class Z shares returned 9.91% without sales charge. By comparison, the fund's benchmark, the Barclays Capital 3-15 Year Blend Municipal Bond Index returned 11.41%. The average return of funds in its peer group, the Lipper Other States Intermediate Municipal Debt Funds Classification, was 9.70%. The state's persistent budget problems weighed on its bonds, which were generally weaker performers than the index, which is national in scope. Shorter duration water and sewer bonds also detracted from performance versus the index. Duration is a measure of interest rate sensitivity. By comparison, the fund's overweight in housing bonds and an overweight in local general obligation bonds aided relative performance as did an underweight in state general obligation bonds.
Brighter prospects boosted municipals
Investors appeared to become less risk averse early in 2009 as the economic outlook grew less grim. In this environment, municipal bonds became attractive alternatives to money markets, with their low yields, and also to Treasury issues, which were outstanding performers in the previous period as a credit crisis triggered a massive flight to safety. During the period, municipal yields were often higher than Treasury yields, even without possible tax advantages. Overall credit quality was good, and the risk of default for state general obligation bonds (GOs) and rated essential service bonds was limited. Renewed buying drove strong returns across most municipal sectors. Investors focused initially on shorter-term issues, then migrated into the intermediate maturity range and lower-rated tiers, where yields were more attractive.
Sector weights and duration positioning produced generally favorable results
We decided to underweight New Jersey's general obligation issues (GOs)—bonds backed by the state's credit and not by a dedicated revenue stream. That strategy aided returns as concerns over New Jersey's financial health pressured these issues. High-quality local GOs were not under the same cloud and fared better, rewarding a decision to overweight the sector. A focus on longer-duration local GOs also helped performance as interest rates declined. In terms of quality, we emphasized A-rated issues where we found better value and higher yields compared to AA and AAA bonds. We barbelled the funds maturity structure, with an emphasis on higher-yielding bonds maturing in 12-17 years as well as bonds with shorter maturities or short call options. Although an overweight in water and sewer bonds benefited performance, the index's longer-maturity bonds in that sector outperformed the fund's holdings.
Other disappointments for the period were primarily issue specific. Bonds of the Middlesex County Improvement Authority, tied to a hotel development (0.6% of net assets), tumbled as occupancy rates fell behind projections. Ratings downgrades or rating withdrawals (due to insurer downgrades) limited the upside of several other bonds.
Moving to enhance yield and quality
Given the fund's substantial exposure to A-rated issues, we added to the fund's AA-rated holdings. In the process, we pared back shorter-maturity issues and invested in some AA-rated water and school bonds with 11-year maturities, as well as AAA-rated issues
Performance data quoted represents past performance and current performance may be lower or higher. Past performance is no guarantee of future results. The investment return and principal value will fluctuate so that shares, when redeemed, may be worth more or less than the original cost. Please visit www.columbiafunds.com for daily and most recent month-end performance updates.
Net asset value per share
as of 10/31/09 ($)
| Class A | | | 10.11 | | |
| Class B | | | 10.11 | | |
| Class C | | | 10.11 | | |
| Class T | | | 10.11 | | |
| Class Z | | | 10.11 | | |
Distributions declared per share
11/01/08 – 10/31/09 ($)
| Class A | | | 0.35 | | |
| Class B | | | 0.27 | | |
| Class C | | | 0.31 | | |
| Class T | | | 0.36 | | |
| Class Z | | | 0.37 | | |
A portion of the fund's income may be subject to the alternative minimum tax. The fund may at times purchase tax-exempt securities at a discount. Some, or all, of this discount may be included in the fund's ordinary income, and is taxable when distributed.
30-day SEC yields
as of 10/31/09 (%)
| Class A | | | 2.05 | | |
| Class B | | | 1.42 | | |
| Class C | | | 1.76 | | |
| Class T | | | 2.15 | | |
| Class Z | | | 2.40 | | |
The 30-day SEC yields reflect the fund's earning power, net of expenses, expressed as an annualized percentage of the public offering price at the end of the period. Had the investment advisor and/or any of its affiliates not waived fees or reimbursed a portion of expenses, the 30-day SEC yields would have been lower.
21
Portfolio Manager's Report (continued) – Columbia New Jersey Intermediate Municipal Bond Fund
Taxable-equivalent SEC yields
as of 10/31/09 (%)
| Class A | | | 3.54 | | |
| Class B | | | 2.44 | | |
| Class C | | | 3.03 | | |
| Class T | | | 3.70 | | |
| Class Z | | | 4.14 | | |
Taxable-equivalent SEC yields are calculated assuming a federal income tax rate of 35.0% and a New Jersey state income tax rate of 10.75%. These tax rates do not reflect the phase out of exemptions or the reduction of the otherwise allowable deductions that occur when adjusted gross income exceeds certain levels. Your taxable-equivalent yield may be different depending on your tax bracket.
Top 5 sectors
as of 10/31/09 (%)
| Local General Obligations | | | 18.3 | | |
| State Appropriated | | | 16.1 | | |
| Refunded/Escrowed | | | 14.4 | | |
| Water & Sewer | | | 10.3 | | |
| Special Non-Property Tax | | | 6.0 | | |
Sector breakdowns are calculated as a percentage of net assets.
Maturity breakdown
as of 10/31/09 (%)
| 0-1 year | | | 6.9 | | |
| 1-3 years | | | 11.7 | | |
| 3-5 years | | | 5.1 | | |
| 5-7 years | | | 16.0 | | |
| 7-10 years | | | 23.6 | | |
| 10-15 years | | | 20.0 | | |
| 15-20 years | | | 11.5 | | |
| 25+ years | | | 0.5 | | |
| Cash and Equivalents | | | 4.7 | | |
Quality breakdown
as of 10/31/09 (%)
| AAA | | | 24.7 | | |
| AA | | | 38.3 | | |
| A | | | 25.5 | | |
| BBB | | | 7.6 | | |
| B | | | 0.5 | | |
| Non-Rated | | | 3.4 | | |
Quality and maturity breakdowns are calculated as a percentage of net assets. Ratings shown in the quality breakdown represent the rating assigned to a particular bond by one of the following nationally recognized rating agencies: Standard & Poor's, Moody's Investors Service, Inc. or Fitch Ratings Ltd. Ratings are relative and subjective and are not absolute standards of quality. The fund's credit quality does not remove market risk.
The fund is actively managed and the composition of its portfolio will change over time.
maturing in five years. We also selected one BBB-rated hospital bond that offered an attractive yield. Although exposure to tobacco bonds was positive for the fund's results during this period, we reduced the fund's tobacco exposure as falling cigarette sales decreased the revenue available for debt service payments and could potentially extend the average life of these bonds.
New Jersey enjoys a diverse industrial base, a well-educated workforce and a strong presence in international trade. But despite early signs of stabilization, the state's recovery from recession is likely to lag the national pace. While education, health care and leisure activities are expected to expand late next year, important sectors, such as financial services, will be slow to add jobs, and manufacturing employment is still trending downward. Pharmaceutical companies partially buffered the manufacturing decline, but we believe that industry consolidation and patent expirations will be costly in terms of jobs going forward. As state and local authorities try to balance their budgets, unemployment could go even higher.
Portfolio holdings and characteristics are subject to change periodically and may not be representative of current holdings and characteristics. The outlook for this fund may differ from those presented for other Columbia Funds.
Tax-exempt investing offers current tax-exempt income, but it also involves certain risks. The value of the fund will be affected by interest rate changes and the creditworthiness of issues held in the fund. When interest rates go up, bond prices generally drop and vice versa.
Interest income from certain tax-exempt bonds may be subject to certain state and local taxes and, if applicable, the alternative minimum tax. Capital gains are not exempt from income taxes.
Single-state municipal bond funds pose additional risks due to limited geographical diversification.
22
Fund Profile – Columbia New York Intermediate Municipal Bond Fund
Summary
g For the 12-month period that ended October 31, 2009, the fund's Class A shares returned 10.30% without sales charge. Class Z shares returned 10.58%.
g The fund's return was lower than the return of its benchmark, the Barclays Capital 3-15 Year Blend Municipal Bond Index1, and higher than the average return of funds in its peer group, the Lipper New York Intermediate Municipal Debt Funds Classification.2
g The fund's state focus, lack of exposure to tobacco and slight overweight in pre-refunded funds detracted from performance relative to the index. An emphasis on the hospital sector and an underweight in state general obligation bonds were positive contributors to the fund's strong return for the period.
Portfolio Management
Brian M. McGreevy has managed the fund since September 1998 and has been associated with the advisor or its predecessors since 1994.
1The Barclays Capital 3-15 Year Blend Municipal Bond Index tracks the performance of municipal bonds issued after December 31, 1990 with remaining maturities between 2 and 17 years and at least $5 million in principal amount outstanding. Indices are not available for investment, are not professionally managed and do not reflect sales charges, fees, brokerage commissions, taxes or other expenses of investing. Securities in the fund may not match those in an index.
2Lipper Inc., a widely respected data provider in the industry, calculates an average total return (assuming reinvestment of distributions) for mutual funds with investment objectives similar to those of the fund. Lipper makes no adjustment for the effect of sales loads.
Performance data quoted represents past performance and current performance may be lower or higher. Past performance is no guarantee of future results. The investment return and principal value will fluctuate so that shares, when redeemed, may be worth more or less than the original cost. Please visit www.columbiafunds.com for daily and most recent month-end performance updates.
Summary
1-year return as of 10/31/09
| | +10.30% | |
|
| |  | | | Class A shares
(without sales charge) | |
|
| | +11.41% | |
|
| |  | | | Barclays Capital
3-15 Year Blend
Municipal Bond Index | |
|
Morningstar Style BoxTM

The Morningstar Style BoxTM reveals a fund's investment strategy. For fixed-income funds, the vertical axis shows the average credit quality of the bonds owned, and the horizontal axis shows interest rate sensitivity as measured by a bond's duration (short, intermediate or long). Information shown is based on the most recent data provided by Morningstar.
23
Performance Information – Columbia New York Intermediate Municipal Bond Fund
Performance data quoted represents past performance and current performance may be lower or higher. Past performance is no guarantee of future results. The investment return and principal value will fluctuate so that shares, when redeemed, may be worth more or less than the original cost. Please visit www.columbiafunds.com for daily and most recent month-end performance updates.
Annual operating expense ratio (%)*
| Class A | | | 0.94 | | |
| Class B | | | 1.69 | | |
| Class C | | | 1.69 | | |
| Class T | | | 0.84 | | |
| Class Z | | | 0.69 | | |
* The annual operating expense ratio is as stated in the fund's prospectus that is current as of the date of this report and includes the expenses incurred by the investment companies in which the fund invests. Differences in expense ratios disclosed elsewhere in this report may result from including expenses incurred by the investment companies, fee waivers and expense reimbursements as well as different time periods used in calculating the ratios.
Performance of a $10,000 investment 11/01/99 – 10/31/09
The table above shows the change in value of a hypothetical $10,000 investment in each Class A shares of Columbia New York Intermediate Municipal Bond Fund during the stated time period, and does not reflect the deduction of taxes that a shareholder may pay on fund distributions or on the redemption of fund shares. The performance of a $10,000 investment with sales charge for Class A shares is calculated with an initial sales charge of 4.75%, which was the effective sales charge prior to August 22, 2005.
Performance of a $10,000 investment 11/01/99 – 10/31/09 ($)
| Sales charge | | without | | with | |
| Class A | | | 15,955 | | | | 15,193 | | |
| Class B | | | 14,968 | | | | 14,968 | | |
| Class C | | | 15,338 | | | | 15,338 | | |
| Class T | | | 16,065 | | | | 15,298 | | |
| Class Z | | | 16,331 | | | | n/a | | |
Average annual total return as of 10/31/09 (%)
| Share class | | A | | B | | C | | T | | Z | |
| Inception | | 11/25/02 | | 11/25/02 | | 11/25/02 | | 12/31/91 | | 12/31/91 | |
| Sales charge | | without | | with | | without | | with | | without | | with | | without | | with | | without | |
| 1-year | | | 10.30 | | | | 6.72 | | | | 9.49 | | | | 6.49 | | | | 9.87 | | | | 8.87 | | | | 10.42 | | | | 5.17 | | | | 10.58 | | |
| 5-year | | | 3.06 | | | | 2.06 | | | | 2.30 | | | | 2.30 | | | | 2.65 | | | | 2.65 | | | | 3.17 | | | | 2.16 | | | | 3.32 | | |
| 10-year | | | 4.78 | | | | 4.27 | | | | 4.12 | | | | 4.12 | | | | 4.37 | | | | 4.37 | | | | 4.86 | | | | 4.34 | | | | 5.03 | | |
Average annual total return as of 09/30/09 (%)
| Share class | | A | | B | | C | | T | | Z | |
| Sales charge | | without | | with | | without | | with | | without | | with | | without | | with | | without | |
| 1-year | | | 12.54 | | | | 8.90 | | | | 11.71 | | | | 8.71 | | | | 12.10 | | | | 11.10 | | | | 12.66 | | | | 7.33 | | | | 12.83 | | |
| 5-year | | | 3.63 | | | | 2.61 | | | | 2.86 | | | | 2.86 | | | | 3.22 | | | | 3.22 | | | | 3.74 | | | | 2.72 | | | | 3.89 | | |
| 10-year | | | 4.83 | | | | 4.32 | | | | 4.17 | | | | 4.17 | | | | 4.42 | | | | 4.42 | | | | 4.90 | | | | 4.39 | | | | 5.08 | | |
The "with sales charge" returns include the maximum initial sales charge of 3.25% for Class A shares (for the 1-year period), 4.75% for Class A shares (for the 5-year and 10-year periods) and 4.75% for Class T shares, the applicable contingent deferred sales charge of 3.00% in the first year, declining to 1.00% in the fourth year, and eliminated thereafter for Class B shares and 1.00% for Class C shares for the first year only. The "without sales charge" returns do not include the effect of sales charges. If they had, returns would be lower.
Prior to August 22, 2005, new purchases of Class A shares had a maximum initial sales charge of 4.75%.
Performance results reflect any fee waivers or reimbursements of fund expenses by the investment advisor and/or any of its affiliates. Absent these fee waivers or expense reimbursement arrangements, performance results would have been lower.
All results shown assume reinvestment of distributions. Class Z shares are sold at net asset value with no distribution and service (Rule 12b-1) fees. Class Z shares have limited eligibility and the investment minimum requirements may vary. Please see the fund's prospectus for details. Performance for different share classes will vary based on differences in sales charges and fees associated with each class.
The tables do not reflect the deduction of taxes that a shareholder may pay on fund distributions or on the redemption of fund shares.
Class A, Class B, Class C, Class T and Class Z share performance information includes returns of Retail A shares (for Class A and Class T shares), Retail B shares (for Class B and Class C shares) and Trust shares (for Class Z shares) of Galaxy New York Municipal Bond Fund, the predecessor to the Fund and a series of The Galaxy Fund (the "Galaxy New York Fund"), for periods prior to November 25, 2002, the date on which Class A, Class B, Class C, Class T and Class Z shares were initially offered by the Fund. The returns shown for Class B and Class C shares also include the returns for Retail A shares for periods prior to March 1, 2001, the date on which Retail B shares were initially offered by the Galaxy New York Fund. The returns shown for all share classes reflect any differences in sales charges, but no returns have been restated to reflect any differences in expenses such as distribution and service (Rule 12b-1) fees between any predecessor share class and the corresponding newer share class. If differences in expenses had been reflected, the returns shown for periods prior to November 25, 2002 would be lower for Class A, Class B and Class C shares.
24
Understanding Your Expenses – Columbia New York Intermediate Municipal Bond Fund
As a fund shareholder, you incur two types of costs. There are transaction costs, which generally include sales charges on purchases and may include redemption fees or exchange fees. There are also ongoing costs, which generally include investment advisory fees, distribution and service (Rule 12b-1) fees and other fund expenses. The information on this page is intended to help you understand the ongoing costs of investing in the fund and to compare these costs with the ongoing costs of investing in other mutual funds.
Analyzing your fund's expenses by share class
To illustrate these ongoing costs, we have provided an example and calculated the expenses paid by investors in each share class during the period. The information in the following table is based on an initial investment of $1,000, which is invested at the beginning of the period and held for the entire period. Expense information is calculated two ways and each method provides you with different information. The amount listed in the "Actual" column is calculated using the fund's actual operating expenses and total return for the period. The amount listed in the "Hypothetical" column for each share class assumes that the return each year is 5% before expenses and is calculated based on the fund's actual operating expenses. You should not use the hypothetical account values and expenses to estimate either your actual account balance at the end of the period or the expenses you paid during this period.
Compare with other funds
Since all mutual funds are required to include the same hypothetical calculations about expenses in shareholder reports, you can use this information to compare the ongoing costs of investing in the fund with other funds. To do so, compare the 5% hypothetical example with the 5% hypothetical examples that appear in the shareholder reports of other funds. As you compare hypothetical examples of other funds, it is important to note that hypothetical examples are meant to highlight the ongoing costs of investing in a fund and do not reflect any transaction costs, such as sales charges, redemption fees or exchange fees.
Estimating your actual expenses
To estimate the expenses that you paid over the period, first you will need your account balance at the end of the period:
g For shareholders who receive their account statements from Columbia Management Services, Inc., your account balance is available online at www.columbiafunds.com or by calling Shareholder Services at 800.345.6611.
g For shareholders who receive their account statements from their financial intermediary, contact your financial intermediary to obtain your account balance.
1. Divide your ending account balance by $1,000. For example, if an account balance was $8,600 at the end of the period, the result would be 8.6.
2. In the section of the table below titled "Expenses paid during the period," locate the amount for your share class. You will find this number in the column labeled "Actual." Multiply this number by the result from step 1. Your answer is an estimate of the expenses you paid on your account during the period.
If the value of your account falls below the minimum initial investment requirement applicable to you, your account generally will be subject to a $20 annual fee. This fee is not included in the accompanying table. If you are subject to the fee, keep it in mind when you are estimating the ongoing expenses of investing in the fund and when comparing the expenses of this fund with other funds.
05/01/09 – 10/31/09
| | | Account value at the
beginning of the period ($) | | Account value at the
end of the period ($) | | Expenses paid
during the period ($) | | Fund's annualized
expense ratio (%) | |
| | | Actual | | Hypothetical | | Actual | | Hypothetical | | Actual | | Hypothetical | | Actual | |
| Class A | | | 1,000.00 | | | | 1,000.00 | | | | 1,035.10 | | | | 1,021.17 | | | | 4.10 | | | | 4.08 | | | | 0.80 | | |
| Class B | | | 1,000.00 | | | | 1,000.00 | | | | 1,031.20 | | | | 1,017.39 | | | | 7.94 | | | | 7.88 | | | | 1.55 | | |
| Class C | | | 1,000.00 | | | | 1,000.00 | | | | 1,033.00 | | | | 1,019.16 | | | | 6.15 | | | | 6.11 | | | | 1.20 | | |
| Class T | | | 1,000.00 | | | | 1,000.00 | | | | 1,035.70 | | | | 1,021.68 | | | | 3.59 | | | | 3.57 | | | | 0.70 | | |
| Class Z | | | 1,000.00 | | | | 1,000.00 | | | | 1,036.40 | | | | 1,022.43 | | | | 2.82 | | | | 2.80 | | | | 0.55 | | |
Expenses paid during the period are equal to the annualized expense ratio for the share class, multiplied by the average account value over the period, then multiplied by the number of days in the fund's most recent fiscal half-year and divided by 365.
Had the investment advisor and/or any of its affiliates not waived fees or reimbursed a portion of expenses, account value at the end of the period would have been reduced.
It is important to note that the expense amounts shown in the table are meant to highlight only ongoing costs of investing in the fund and do not reflect any transaction costs, such as sales charges, redemption fees or exchange fees. Therefore, the hypothetical examples provided may not help you determine the relative total costs of owning shares of different funds. If these transaction costs were included, your costs would have been higher.
25
Portfolio Manager's Report – Columbia New York Intermediate Municipal Bond Fund
Performance data quoted represents past performance and current performance may be lower or higher. Past performance is no guarantee of future results. The investment return and principal value will fluctuate so that shares, when redeemed, may be worth more or less than the original cost. Please visit www.columbiafunds.com for daily and most recent month-end performance updates.
Net asset value per share
as of 10/31/09 ($)
| Class A | | | 11.76 | | |
| Class B | | | 11.76 | | |
| Class C | | | 11.76 | | |
| Class T | | | 11.76 | | |
| Class Z | | | 11.76 | | |
Distributions declared per share
11/01/08 – 10/31/09 ($)
| Class A | | | 0.39 | | |
| Class B | | | 0.31 | | |
| Class C | | | 0.35 | | |
| Class T | | | 0.40 | | |
| Class Z | | | 0.42 | | |
A portion of the fund's income may be subject to the alternative minimum tax. The fund may at times purchase tax-exempt securities at a discount. Some or all, of this discount may be included in the fund's ordinary income, and is taxable when distributed.
30-day SEC yields
as of 10/31/09 (%)
| Class A | | | 2.36 | | |
| Class B | | | 1.73 | | |
| Class C | | | 2.07 | | |
| Class T | | | 2.46 | | |
| Class Z | | | 2.73 | | |
The 30-day SEC yields reflect the fund's earning power, net of expenses, expressed as an annualized percentage of the public offering price at the end of the period. Had the investment advisor and/or any of its affiliates not waived fees or reimbursed a portion of expenses, the 30-day SEC yields would have been lower.
For the 12-month period that ended October 31, 2009, the fund's Class A shares returned 10.30% without sales charge. Class Z shares returned 10.58% without sales charge. The fund's benchmark, the Barclays Capital 3-15 Year Blend Municipal Bond Index returned 11.41%. The average return of the funds in its peer group, the Lipper New York Intermediate Municipal Debt Funds Classification, was 9.12%. The fund held no tobacco bonds, which detracted from performance relative to the index because the sector returned almost 20% versus the index return of 11.41%. In addition, the fund's overweight in pre-refunded issues, whose principal value is secured by escrowed funds, was a negative versus the index due to their shorter maturities. The fund's focus on New York also accounted for some of the shortfall relative to the index because New York bonds generally underperformed the index average. Despite these modest detractors, the fund parti cipated fully in the market rally that drove municipal bond prices higher during the period, and it outperformed the average fund in its peer group.
Brighter prospects boosted municipals
Investors appeared to become less risk averse early in 2009 as the economic outlook grew less grim. In this environment, municipal bonds became attractive alternatives to money markets, with their low yields, and also to Treasury issues, which were outstanding performers in the previous period as a credit crisis triggered a massive flight to safety. During the period, municipal yields were often higher than Treasury yields, even without possible tax advantages. Overall credit quality was good and the risk of default for state general obligation bonds (GOs) and rated essential service bonds was limited. Renewed buying drove strong returns across most municipal sectors. Investors focused initially on shorter-term issues, then migrated into the intermediate maturity range and lower-rated tiers, where yields were more attractive.
Mixed results from sector weights
The fund underperformed relative to its benchmark in part because we avoided the tobacco and airline sectors, which did not fit our risk criteria at the time. Although this decision was a slight drag on performance during this period, we believe it is a prudent longer-term strategy for the fund. We trimmed Indian tribal gaming bonds because of a deteriorating credit outlook, and also bonds backed by revenues from new stadiums, which are having trouble filling high-end luxury suites. Meanwhile, we expanded electric utility and college holdings. Utilities have fared comparatively well during the slowdown, and we believe they have the potential to recover along with the economy. College issues provide useful diversification and benefited from steady admission demand.
Hospital issues, longer portfolio maturity helped
The fund had more exposure than the index to the hospital sector, which aided performance as investors sought better return potential, boosting prices. A decision to underweight New York State GOs, those backed only by the state's credit and not by dedicated revenues, was rewarded when they lagged lower-rated sectors, as the demand for higher yields caused the yield difference between higher- and lower-quality bonds to narrow. As interest rates declined, longer-maturity bonds were generally better performers than shorter-term issues. As a result, the fund benefited by maintaining an average duration that was slightly longer than those of its benchmark and peers. Duration is a measure of interest rate sensitivity.
26
Portfolio Manager's Report (continued) – Columbia New York Intermediate Municipal Bond Fund
Recovery may come slowly to New York
New York's economic slump has shown tentative signs of moderating. Job losses are slowing and home sales have firmed. Still, hiring remains sluggish and unemployment has been rising. In addition, the financial services industry, a major source of employment and tax revenue, has yet to find its feet after last year's upheavals. Manufacturing also continues to struggle. To cope with mounting budget deficits, the state has let its work force shrink through attrition and buyouts. However, layoffs may become necessary if adequate budget cuts are not found. In the state's favor are its highly skilled labor force, high per capita income and spending power and its role as a world financial capital.
Portfolio holdings and characteristics are subject to change periodically and may not be representative of current holdings and characteristics. The outlook for this fund may differ from those presented for other Columbia Funds.
Tax-exempt investing offers current tax-exempt income, but it also involves certain risks. The value of the fund will be affected by interest rate changes and the creditworthiness of issues held in the fund. When interest rates go up, bond prices generally drop and vice versa.
Interest income from certain tax-exempt bonds may be subject to certain state and local taxes and, if applicable, the alternative minimum tax. Capital gains are not exempt from income taxes.
The fund is non-diversified, which generally means that it may invest a greater percentage of its total assets in the securities of fewer issuers than a "diversified" fund. This increases the risk that a change in the value of any one investment held by the fund could affect the overall value of the fund more than it would affect that of a diversified fund holding a greater number of investments. Accordingly, the fund's value will likely be more volatile than the value of more diversified funds.
Single-state municipal bond funds pose additional risks due to limited geographical diversification.
Taxable-equivalent SEC yields
as of 10/31/09 (%)
| Class A | | | 3.99 | | |
| Class B | | | 2.92 | | |
| Class C | | | 3.50 | | |
| Class T | | | 4.15 | | |
| Class Z | | | 4.61 | | |
Taxable-equivalent SEC yields are calculated assuming a federal income tax rate of 35.0% and a New York state income tax rate of 8.97%. These tax rates do not reflect the phase out of exemptions or the reduction of the otherwise allowable deductions that occur when adjusted gross income exceeds certain levels. Your taxable-equivalent yield may be different depending on your tax bracket.
Top 5 sectors
as of 10/31/09 (%)
| Special Non-Property Tax | | | 14.6 | | |
| Local General Obligations | | | 11.5 | | |
| Refunded/Escrowed | | | 11.4 | | |
| Education | | | 9.6 | | |
| State Appropriated | | | 8.9 | | |
Sector breakdowns are calculated as a percentage of net assets.
Maturity breakdown
as of 10/31/09 (%)
| 1-3 years | | | 15.6 | | |
| 3-5 years | | | 9.5 | | |
| 5-7 years | | | 13.4 | | |
| 7-10 years | | | 14.6 | | |
| 10-15 years | | | 32.6 | | |
| 15-20 years | | | 10.8 | | |
| 20-25 years | | | 2.2 | | |
| Cash and Equivalents | | | 1.3 | | |
Quality breakdown
as of 10/31/09 (%)
| AAA | | | 31.0 | | |
| AA | | | 39.4 | | |
| A | | | 23.2 | | |
| BBB | | | 4.7 | | |
| BB | | | 1.5 | | |
| Non-Rated | | | 0.2 | | |
Quality and maturity breakdowns are calculated as a percentage of net assets. Ratings shown in the quality breakdown represent the rating assigned to a particular bond by one of the following nationally recognized rating agencies: Standard & Poor's, Moody's Investors Service, Inc. or Fitch Ratings Ltd. Ratings are relative and subjective and are not absolute standards of quality. The fund's credit quality does not remove market risk.
The fund is actively managed and the composition of its portfolio will change over time.
27
Fund Profile – Columbia Rhode Island Intermediate Municipal Bond Fund
Performance data quoted represents past performance and current performance may be lower or higher. Past performance is no guarantee of future results. The investment return and principal value will fluctuate so that shares, when redeemed, may be worth more or less than the original cost. Please visit www.columbiafunds.com for daily and most recent month-end performance updates.
Summary
1-year return as of 10/31/09
| | +9.76% | |
|
| |  | | | Class A shares
(without sales charge) | |
|
| | +11.41% | |
|
| |  | | | Barclays Capital
3-15 Year Blend
Municipal Bond Index | |
|
Morningstar Style BoxTM

The Morningstar Style BoxTM reveals a fund's investment strategy. For fixed-income funds, the vertical axis shows the average credit quality of the bonds owned, and the horizontal axis shows interest rate sensitivity as measured by a bond's duration (short, intermediate or long). Information shown is based on the most recent data provided by Morningstar.
Summary
g For the 12-month period that ended October 31, 2009, the fund's Class A shares returned 9.76% without sales charge. Class Z shares returned 10.03%.
g The fund lagged its benchmark, the Barclays Capital 3-15 Year Blend Municipal Bond Index1, and performed in line with the average return of its peer group, the Lipper Other States Intermediate Municipal Debt Funds Classification.2
g The fund's pre-refunded bonds and local general obligation (GOs) bonds detracted from performance, while an underweight in state GOs aided results.
Portfolio Management
Brian M. McGreevy has managed the fund since July 1997 and has been associated with the advisor or its predecessors since 1994.
1The Barclays Capital 3-15 Year Blend Municipal Bond Index tracks the performance of municipal bonds issued after December 31, 1990 with remaining maturities between 2 and 17 years and at least $5 million in principal amount outstanding. Indices are not available for investment, are not professionally managed and do not reflect sales charges, fees, brokerage commissions, taxes or other expenses of investing. Securities in the fund may not match those in an index.
2Lipper Inc., a widely respected data provider in the industry, calculates an average total return (assuming reinvestment of distributions) for mutual funds with investment objectives similar to those of the fund. Lipper makes no adjustment for the effect of sales loads.
28
Performance Information – Columbia Rhode Island Intermediate Municipal Bond Fund
Performance of a $10,000 investment 11/01/99 – 10/31/09
The chart above shows the change in value of a hypothetical $10,000 investment in Class A shares of Columbia Rhode Island Intermediate Municipal Bond Fund during the stated time period, and does not reflect the deduction of taxes that a shareholder may pay on fund distributions or on the redemption of fund shares. The performance of a $10,000 investment with sales charge for Class A shares is calculated with an initial sales charge of 4.75%, which was the effective sales charge prior to August 22, 2005.
Performance of a $10,000 investment 11/01/99 – 10/31/09 ($)
| Sales charge | | without | | with | |
| Class A | | | 15,715 | | | | 14,964 | | |
| Class B | | | 14,701 | | | | 14,701 | | |
| Class C | | | 15,062 | | | | 15,062 | | |
| Class T | | | 15,988 | | | | 15,224 | | |
| Class Z | | | 15,996 | | | | n/a | | |
Average annual total return as of 10/31/09 (%)
| Share class | | A | | B | | C | | T | | Z | |
| Inception | | 11/18/02 | | 11/18/02 | | 11/18/02 | | 12/20/94 | | 06/19/00 | |
| Sales charge | | without | | with | | without | | with | | without | | with | | without | | with | | without | |
| 1-year | | | 9.76 | | | | 6.22 | | | | 8.94 | | | | 5.94 | | | | 9.32 | | | | 8.32 | | | | 10.03 | | | | 4.85 | | | | 10.03 | | |
| 5-year | | | 3.00 | | | | 1.99 | | | | 2.23 | | | | 2.23 | | | | 2.59 | | | | 2.59 | | | | 3.26 | | | | 2.25 | | | | 3.26 | | |
| 10-year | | | 4.62 | | | | 4.11 | | | | 3.93 | | | | 3.93 | | | | 4.18 | | | | 4.18 | | | | 4.80 | | | | 4.29 | | | | 4.81 | | |
Average annual total return as of 09/30/09 (%)
| Share class | | A | | B | | C | | T | | Z | |
| Sales charge | | without | | with | | without | | with | | without | | with | | without | | with | | without | |
| 1-year | | | 11.53 | | | | 7.86 | | | | 10.71 | | | | 7.71 | | | | 11.09 | | | | 10.09 | | | | 11.81 | | | | 6.47 | | | | 11.81 | | |
| 5-year | | | 3.47 | | | | 2.47 | | | | 2.70 | | | | 2.70 | | | | 3.06 | | | | 3.06 | | | | 3.73 | | | | 2.73 | | | | 3.73 | | |
| 10-year | | | 4.68 | | | | 4.16 | | | | 3.99 | | | | 3.99 | | | | 4.24 | | | | 4.24 | | | | 4.86 | | | | 4.34 | | | | 4.86 | | |
The "with sales charge" returns include the maximum initial sales charge of 3.25% for Class A shares (for the 1-year period), 4.75% for Class A shares (for the 5-year and 10-year periods) and 4.75% for Class T shares, the applicable contingent deferred sales charge of 3.00% in the first year, declining to 1.00% in the fourth year and eliminated thereafter for Class B shares and 1.00% for Class C shares for the first year only. The "without sales charge" returns do not include the effect of sales charges. If they had, returns would be lower.
Prior to August 22, 2005, new purchases of Class A shares had a maximum initial sales charge of 4.75%.
Performance results reflect any fee waivers or reimbursements of fund expenses by the investment advisor and/or any of its affiliates. Absent these fee waivers or expense reimbursement arrangements, performance results would have been lower.
All results shown assume reinvestment of distributions. Class Z shares are sold at net asset value with no distribution and service (Rule 12b-1) fees. Class Z shares have limited eligibility and the investment minimum requirements may vary. Please see the fund's prospectus for details. Performance for different share classes will vary based on differences in sales charges and fees associated with each class.
The tables do not reflect the deduction of taxes that a shareholder may pay on fund distributions or on the redemption of fund shares.
Class A, Class B, Class C, Class T and Class Z share performance information includes returns of Retail A shares (for Class A and Class T shares), Retail B shares (for Class B and Class C shares) and Trust shares (for Class Z shares) of Galaxy Rhode Island Municipal Bond Fund, the predecessor to the Fund and a series of The Galaxy Fund (the "Galaxy Rhode Island Fund"), for periods prior to November 18, 2002, the date on which Class A, Class B, Class C, Class T and Class Z shares were initially offered by the Fund. The returns shown for Class B and Class C shares also include the returns for Retail A shares for periods prior to March 1, 2001, the date on which Retail B shares were initially offered by the Galaxy Rhode Island Fund. The returns for Class Z shares include the returns of Retail A shares of the Galaxy Rhode Island Fund for periods prior to June 19, 2000, the date on which Trust shares were initially offered by the Gal axy Rhode Island Fund. The returns shown for all share classes reflect any differences in sales charges, but no returns have been restated to reflect any differences in expenses such as distribution and service (Rule 12b-1) fees between any predecessor share class and the corresponding newer share class. If differences in expenses had been reflected, the returns shown for periods prior to November 18, 2002 would be lower for Class A, Class B and Class C shares and higher for Class Z shares for periods prior to June 19, 2000.
Performance data quoted represents past performance and current performance may be lower or higher. Past performance is no guarantee of future results. The investment return and principal value will fluctuate so that shares, when redeemed, may be worth more or less than the original cost. Please visit www.columbiafunds.com for daily and most recent month-end performance updates.
Annual operating expense ratio (%)*
| Class A | | | 1.02 | | |
| Class B | | | 1.77 | | |
| Class C | | | 1.77 | | |
| Class T | | | 0.77 | | |
| Class Z | | | 0.77 | | |
* The annual operating expense ratio is as stated in the fund's prospectus that is current as of the date of this report and includes the expenses incurred by the investment companies in which the fund invests. Differences in expense ratios disclosed elsewhere in this report may result from including expenses incurred by the investment companies, fee waivers and expense reimbursements as well as different time periods used in calculating the ratios.
29
Understanding Your Expenses – Columbia Rhode Island Intermediate Municipal Bond Fund
Estimating your actual expenses
To estimate the expenses that you paid over the period, first you will need your account balance at the end of the period:
g For shareholders who receive their account statements from Columbia Management Services, Inc., your account balance is available online at www.columbiafunds.com or by calling Shareholder Services at 800.345.6611.
g For shareholders who receive their account statements from their financial intermediary, contact your financial intermediary to obtain your account balance.
1. Divide your ending account balance by $1,000. For example, if an account balance was $8,600 at the end of the period, the result would be 8.6.
2. In the section of the table below titled "Expenses paid during the period," locate the amount for your share class. You will find this number in the column labeled "Actual." Multiply this number by the result from step 1. Your answer is an estimate of the expenses you paid on your account during the period.
If the value of your account falls below the minimum initial investment requirement applicable to you, your account generally will be subject to a $20 annual fee. This fee is not included in the accompanying table. If you are subject to the fee, keep it in mind when you are estimating the ongoing expenses of investing in the fund and when comparing the expenses of this fund with other funds.
As a fund shareholder, you incur two types of costs. There are transaction costs, which generally include sales charges on purchases and may include redemption fees or exchange fees. There are also ongoing costs, which generally include investment advisory fees, distribution and service (Rule 12b-1) fees and other fund expenses. The information on this page is intended to help you understand the ongoing costs of investing in the fund and to compare these costs with the ongoing costs of investing in other mutual funds.
Analyzing your fund's expenses by share class
To illustrate these ongoing costs, we have provided an example and calculated the expenses paid by investors in each share class during the period. The information in the following table is based on an initial investment of $1,000, which is invested at the beginning of the period and held for the entire period. Expense information is calculated two ways and each method provides you with different information. The amount listed in the "Actual" column is calculated using the fund's actual operating expenses and total return for the period. The amount listed in the "Hypothetical" column for each share class assumes that the return each year is 5% before expenses and is calculated based on the fund's actual operating expenses. You should not use the hypothetical account values and expenses to estimate either your actual account balance at the end of the period or the expenses you paid during this period.
Compare with other funds
Since all mutual funds are required to include the same hypothetical calculations about expenses in shareholder reports, you can use this information to compare the ongoing costs of investing in the fund with other funds. To do so, compare the 5% hypothetical example with the 5% hypothetical examples that appear in the shareholder reports of other funds. As you compare hypothetical examples of other funds, it is important to note that hypothetical examples are meant to highlight the ongoing costs of investing in a fund and do not reflect any transaction costs, such as sales charges, redemption fees or exchange fees.
05/01/09 – 10/31/09
| | | Account value at the
beginning of the period ($) | | Account value at the
end of the period ($) | | Expenses paid
during the period ($) | | Fund's annualized
expense ratio (%) | |
| | | Actual | | Hypothetical | | Actual | | Hypothetical | | Actual | | Hypothetical | | Actual | |
| Class A | | | 1,000.00 | | | | 1,000.00 | | | | 1,028.10 | | | | 1,021.17 | | | | 4.09 | | | | 4.08 | | | | 0.80 | | |
| Class B | | | 1,000.00 | | | | 1,000.00 | | | | 1,024.30 | | | | 1,017.39 | | | | 7.91 | | | | 7.88 | | | | 1.55 | | |
| Class C | | | 1,000.00 | | | | 1,000.00 | | | | 1,026.10 | | | | 1,019.16 | | | | 6.13 | | | | 6.11 | | | | 1.20 | | |
| Class T | | | 1,000.00 | | | | 1,000.00 | | | | 1,029.40 | | | | 1,022.43 | | | | 2.81 | | | | 2.80 | | | | 0.55 | | |
| Class Z | | | 1,000.00 | | | | 1,000.00 | | | | 1,029.40 | | | | 1,022.43 | | | | 2.81 | | | | 2.80 | | | | 0.55 | | |
Expenses paid during the period are equal to the annualized expense ratio for the share class, multiplied by the average account value over the period, then multiplied by the number of days in the fund's most recent fiscal half-year and divided by 365.
Had the investment advisor and/or any of its affiliates not waived fees or reimbursed a portion of expenses, account value at the end of the period would have been reduced.
It is important to note that the expense amounts shown in the table are meant to highlight only ongoing costs of investing in the fund and do not reflect any transaction costs, such as sales charges, redemption fees or exchange fees. Therefore, the hypothetical examples provided may not help you determine the relative total costs of owning shares of different funds. If these transaction costs were included, your costs would have been higher.
30
Portfolio Manager's Report – Columbia Rhode Island Intermediate Municipal Bond Fund
For the 12-month period that ended October 31, 2009, the fund's Class A shares returned 9.76% without sales charge. Class Z shares returned 10.03% without sales charge. The fund lagged its benchmark, the Barclays Capital 3-15 Year Blend Municipal Bond Index, which returned 11.41%. Its return was slightly higher than the 9.70% average return of the funds in its peer group, the Lipper Other States Intermediate Municipal Debt Funds Classification. The fund's pre-refunded bonds, which were shorter in maturity than those in the index, lagged in performance. Several insured issues had their credit ratings withdrawn when their insurer was downgraded, which detracted from performance. An underweight in state general obligation bonds (GOs) aided results.
Biggest gains from lower-quality and longer-maturity issues
Municipal bonds enjoyed outstanding performance during the period, buoyed by a dramatic decline in yields, strong demand from individual investors and constrained supply. New municipal bond issuance was hindered by a liquidity crunch, a downgrade in credit ratings for many municipal bond insurers and the creation of Build America Bonds, which expanded financing options for municipalities by allowing them to issue taxable bonds and receive a federal subsidy to cover 35% of their costs. Issuance within Rhode Island was light early in the period, but picked up in fall 2009 as some new education, water and sewer and local GO issues came to market. Nationwide, higher-quality, shorter-maturity municipal bonds outperformed in the first half of the period, but longer-term and lower-rated issues took the lead for the period as the economy stabilized.
Effort to boost yield
Over the period, we took advantage of opportunities to add yield to the portfolio. We decreased exposure to low-yielding, shorter-maturity bonds and moved into longer-maturity issues with higher yields, including 15- to 20-year bonds issued by the University of Rhode Island (3.0% of net assets), which performed well. Elsewhere, we reduced exposure to Puerto Rico bonds, which are lower-quality issues with Baa3/BBB ratings. The territory's weak economic outlook and growing budget deficit raises concerns that further downgrades are possible. To help offset the resulting loss in yield, we added some BBB-rated bonds tied to the Providence Place Mall (1.6% of net assets) with yields around 7% and held on to a lower-rated tobacco bond, which was issued by the state and secured by a financial settlement it has with tobacco companies.
Sector weights determined by supply
An underweight in hospital bonds due to a scarcity of solid credits in Rhode Island hindered returns, as did an overweight in housing bonds, particularly issues with shorter maturities, relative to the index. In education, another overweight, results were mixed. Longer-maturity issues for the University of Rhode Island and Providence College aided returns, while bonds tied to a university in Puerto Rico and an insured issue from Johnson & Wales (1.5% of net assets), a culinary school, pressured performance.
Performance data quoted represents past performance and current performance may be lower or higher. Past performance is no guarantee of future results. The investment return and principal value will fluctuate so that shares, when redeemed, may be worth more or less than the original cost. Please visit www.columbiafunds.com for daily and most recent month-end performance updates.
Net asset value per share
as of 10/31/09 ($)
| Class A | | | 11.13 | | |
| Class B | | | 11.13 | | |
| Class C | | | 11.13 | | |
| Class T | | | 11.13 | | |
| Class Z | | | 11.13 | | |
Distributions declared per share
11/01/08 – 10/31/09 ($)
| Class A | | | 0.40 | | |
| Class B | | | 0.32 | | |
| Class C | | | 0.36 | | |
| Class T | | | 0.43 | | |
| Class Z | | | 0.43 | | |
A portion of the fund's income may be subject to the alternative minimum tax. The fund may at times purchase tax-exempt securities at a discount. Some, or all, of this discount may be included in the fund's ordinary income, and is taxable when distributed.
30-day SEC yields
as of 10/31/09 (%)
| Class A | | | 2.46 | | |
| Class B | | | 1.85 | | |
| Class C | | | 2.19 | | |
| Class T | | | 2.70 | | |
| Class Z | | | 2.84 | | |
The 30-day SEC yields reflect the fund's earning power, net of expenses, expressed as an annualized percentage of the public offering price at the end of the period. Had the investment advisor and/or any of its affiliates not waived fees or reimbursed a portion of expenses, the 30-day SEC yields would have been lower.
31
Portfolio Manager's Report (continued) – Columbia Rhode Island Intermediate Municipal Bond Fund
Taxable-equivalent SEC yields
as of 10/31/09 (%)
| Class A | | | 4.21 | | |
| Class B | | | 3.16 | | |
| Class C | | | 3.75 | | |
| Class T | | | 4.61 | | |
| Class Z | | | 4.84 | | |
Taxable-equivalent SEC yields are calculated assuming a federal income tax rate of 35.0% and a Rhode Island state income tax rate of 9.90%. These tax rates do not reflect the phase out of exemptions or the reduction of the otherwise allowable deductions that occur when adjusted gross income exceeds certain levels. Your taxable-equivalent yield may be different depending on your tax bracket.
Top 5 sectors
as of 10/31/09 (%)
| Education | | | 19.7 | | |
| Refunded/Escrowed | | | 15.3 | | |
| Local General Obligations | | | 13.7 | | |
| Local Appropriated | | | 8.6 | | |
| Water & Sewer | | | 5.9 | | |
Maturity breakdown
as of 10/31/09 (%)
| 0-1 year | | | 2.3 | | |
| 1-3 years | | | 8.1 | | |
| 3-5 years | | | 11.0 | | |
| 5-7 years | | | 12.2 | | |
| 7-10 years | | | 16.5 | | |
| 10-15 years | | | 28.8 | | |
| 15-20 years | | | 17.4 | | |
| 20-25 years | | | 1.5 | | |
| Cash & Equivalents | | | 2.2 | | |
Quality breakdown
as of 10/31/09 (%)
| AAA | | | 37.5 | | |
| AA | | | 17.3 | | |
| A | | | 36.5 | | |
| BBB | | | 2.8 | | |
| Non-Rated | | | 5.9 | | |
Quality and maturity breakdowns are calculated as a percentage of net assets. Ratings shown in the quality breakdown represent the highest rating assigned to a particular bond by one of the following nationally recognized rating agencies: Standard & Poor's, Moody's Investors Service, Inc. or Fitch Ratings Ltd. Ratings are relative and subjective and are not absolute standards of quality. The fund's credit quality does not remove market risk.
The fund is actively managed and the composition of its portfolio will change over time.
Near-term concerns for Rhode Island's economy
Rhode Island maintained its AA3/AA/AA credit rating but was put on negative credit watch by all three ratings agencies. Among the challenges facing the state are its high debt burdens, revenues below projections, housing slump and an unemployment rate that is the highest in over 30 years. Given all these pressures, we think a credit downgrade is likely and could pressure state and local GOs. Going forward, we plan to maintain an overweight in the education sector, which we believe could benefit as the weak job market pushes more individuals toward furthering their education.
Portfolio holdings and characteristics are subject to change periodically and may not be representative of current holdings and characteristics. The outlook for this fund may differ from those presented for other Columbia Funds.
Tax-exempt investing offers current tax-exempt income, but it also involves certain risks. The value of the fund will be affected by interest rate changes and the creditworthiness of issues held in the fund. When interest rates go up, bond prices generally drop and vice versa.
Interest income from certain tax-exempt bonds may be subject to certain state and local taxes and, if applicable, the alternative minimum tax. Capital gains are not exempt from income taxes.
The fund is non-diversified, which generally means that it may invest a greater percentage of its total assets in the securities of fewer issuers than a "diversified" fund. This increases the risk that a change in the value of any one investment held by the fund could affect the overall value of the fund more than it would affect that of a diversified fund holding a greater number of investments. Accordingly, the fund's value will likely be more volatile than the value of more diversified funds.
Single-state municipal bond funds pose additional risks due to limited geographical diversification.
32
Investment Portfolio – Columbia Connecticut Intermediate Municipal Bond Fund
October 31, 2009
| Municipal Bonds – 98.9% | |
| | | Par ($) | | Value ($) | |
| Education – 11.1% | |
| Education – 9.1% | |
| CT Health & Educational Facilities Authority | |
| Connecticut College: | |
Series 2002 E,
Insured: NPFGC:
5.000% 07/01/14 | | | 500,000 | | | | 533,125 | | |
| 5.250% 07/01/22 | | | 400,000 | | | | 406,904 | | |
Series 2007 F,
Insured: NPFGC
4.125% 07/01/24 | | | 1,505,000 | | | | 1,441,670 | | |
Series 2008 N:
5.000% 07/01/18 | | | 2,120,000 | | | | 2,290,045 | | |
| 5.000% 07/01/22 | | | 2,500,000 | | | | 2,640,200 | | |
| Quinnipiac University: | |
Series 2007 I,
Insured: NPFGC:
5.000% 07/01/19 | | | 2,000,000 | | | | 2,132,900 | | |
| 5.000% 07/01/22 | | | 2,000,000 | | | | 2,069,380 | | |
Series 2007 K2,
Insured: NPFGC
5.000% 07/01/28 | | | 2,000,000 | | | | 2,068,100 | | |
| Trinity College: | |
Series 1998 F,
Insured: NPFGC
5.500% 07/01/21 | | | 500,000 | | | | 575,160 | | |
Series 2004 H,
Insured: NPFGC
5.000% 07/01/25 | | | 540,000 | | | | 559,040 | | |
| Yale University, | |
Series 1997 E,
4.700% 07/01/29 | | | 4,800,000 | | | | 5,058,720 | | |
| CT University of Connecticut | |
| Student Fee, | |
Series 2002 A,
5.250% 05/15/14 | | | 1,185,000 | | | | 1,302,990 | | |
PR Commonwealth of Puerto Rico
Industrial, Tourist, Educational, Medical &
Environmental Control Facilities | |
Universidad Interamericana
de Puerto Rico, Inc., | | | |
Series 1998 A,
Insured: NPFGC
5.500% 10/01/14 | | | 650,000 | | | | 661,642 | | |
| Education Total | | | 21,739,876 | | |
| | | Par ($) | | Value ($) | |
| Prep School – 2.0% | |
| CT Health & Educational Facilities Authority | |
| Greenwich Academy, Inc., | |
Series 2007 E,
Insured: FSA
5.250% 03/01/26 | | | 2,000,000 | | | | 2,225,320 | | |
| Loomis Chaffee School, | |
Series 2005 F,
Insured: AMBAC
5.250% 07/01/27 | | | 1,670,000 | | | | 1,905,120 | | |
| Miss Porter's School, | |
Series 2006 B,
Insured: AMBAC
4.500% 07/01/29 | | | 600,000 | | | | 598,800 | | |
| Prep School Total | | | 4,729,240 | | |
| Education Total | | | 26,469,116 | | |
| Health Care – 4.6% | |
| Continuing Care Retirement – 0.6% | |
| CT Development Authority | |
| Elim Park Baptist, Inc., | |
Series 2003,
5.750% 12/01/23 | | | 1,500,000 | | | | 1,449,390 | | |
| Continuing Care Retirement Total | | | 1,449,390 | | |
| Hospitals – 3.3% | |
| CT Health & Educational Facilities Authority | |
| Ascension HealthCredit Group, | |
Series 1999 B,
3.500% 11/15/29 (02/01/12) (a)(b) | | | 850,000 | | | | 870,103 | | |
| Hospital for Special Care, | |
Series 2007 C,
Insured: RAD
5.250% 07/01/27 | | | 750,000 | | | | 663,060 | | |
| Hospital for St. Raphael, | |
Series 1993 H,
Insured: AMBAC
5.300% 07/01/10 | | | 2,740,000 | | | | 2,766,934 | | |
| Middlesex Hospital: | |
Series 1997 H,
Insured: NPFGC
5.000% 07/01/12 | | | 1,060,000 | | | | 1,060,636 | | |
Series 2006 M,
Insured: FSA
4.875% 07/01/27 | | | 500,000 | | | | 500,845 | | |
See Accompanying Notes to Financial Statements.
33
Columbia Connecticut Intermediate Municipal Bond Fund
October 31, 2009
| Municipal Bonds (continued) | |
| | | Par ($) | | Value ($) | |
| William W. Backus Hospital, | |
Series 2005 G,
Insured: FSA
5.000% 07/01/24 | | | 2,060,000 | | | | 2,097,492 | | |
| Hospitals Total | | | 7,959,070 | | |
| Intermediate Care Facilities – 0.1% | |
| CT Health & Educational Facilities Authority | |
| Village for Families & Children, Inc., | |
Series 2002 A,
Insured: AMBAC
5.000% 07/01/23 | | | 260,000 | | | | 244,270 | | |
| Intermediate Care Facilities Total | | | 244,270 | | |
| Nursing Homes – 0.6% | |
| CT Development Authority | |
| Alzheimers Resources Center, Inc., | |
Series 2007:
5.200% 08/15/17 | | | 1,185,000 | | | | 1,012,416 | | |
| 5.400% 08/15/21 | | | 500,000 | | | | 396,990 | | |
| Nursing Homes Total | | | 1,409,406 | | |
| Health Care Total | | | 11,062,136 | | |
| Housing – 7.4% | |
| Multi-Family – 1.5% | |
| CT Bridgeport Housing Authority | |
Series 2009:
5.000% 06/01/22 | | | 1,035,000 | | | | 1,031,895 | | |
| 5.000% 06/01/23 | | | 1,085,000 | | | | 1,074,616 | | |
PR Commonwealth of Puerto Rico
Housing Finance Authority | |
Series 2008,
5.000% 12/01/13 | | | 1,300,000 | | | | 1,408,368 | | |
| Multi-Family Total | | | 3,514,879 | | |
| Single-Family – 5.9% | |
| CT Housing Finance Authority | |
| Housing Mortgage Finance Program, | |
Series 2003 D,
4.400% 11/15/15 | | | 2,000,000 | | | | 2,057,280 | | |
| Mortgage Finance Program: | |
Series 1996 C-1,
6.000% 11/15/10 | | | 815,000 | | | | 817,869 | | |
Series 2008 B-1,
4.750% 11/15/23 | | | 3,000,000 | | | | 3,124,560 | | |
| Series 2003 C-1, | |
| 4.850% 11/15/23 | | | 4,000,000 | | | | 4,054,840 | | |
| | | Par ($) | | Value ($) | |
| Series 2009, | |
| 4.550% 11/15/24 | | | 4,000,000 | | | | 4,071,240 | | |
| Single-Family Total | | | 14,125,789 | | |
| Housing Total | | | 17,640,668 | | |
| Industrials – 0.4% | |
| Manufacturing – 0.4% | |
| CT Development Authority | |
| Ethan Allen, Inc., | |
Series 1993,
7.500% 06/01/11 | | | 905,000 | | | | 946,911 | | |
| Manufacturing Total | | | 946,911 | | |
| Industrials Total | | | 946,911 | | |
| Other – 17.5% | |
| Pool/Bond Bank – 3.4% | |
| CT Revolving Fund | |
Series 2003 A,
5.000% 10/01/19 | | | 4,290,000 | | | | 4,723,376 | | |
| Series 2003 B: | |
| 5.000% 10/01/12 | | | 1,000,000 | | | | 1,112,500 | | |
| 5.000% 10/01/15 | | | 1,000,000 | | | | 1,147,710 | | |
| Series 2009 C, | |
| 5.000% 10/01/18 | | | 1,000,000 | | | | 1,157,760 | | |
| Pool/Bond Bank Total | | | 8,141,346 | | |
| Refunded/Escrowed (c) – 14.1% | |
| CT Bridgeport | |
| Series 2000 A, | |
Pre-refunded 07/15/10,
Insured: FGIC
6.000% 07/15/13 | | | 2,000,000 | | | | 2,097,380 | | |
| CT Clean Water Fund | |
| Series 1993, | |
Escrowed to Maturity,
6.000% 10/01/12 | | | 1,200,000 | | | | 1,293,096 | | |
| CT Easton | |
| Series 2001, | |
Pre-refunded 10/15/11,
4.750% 10/15/21 | | | 855,000 | | | | 878,718 | | |
| CT Fairfield | |
| Series 2002 A, | |
Pre-refunded 04/01/12,
5.000% 04/01/22 | | | 2,200,000 | | | | 2,409,814 | | |
See Accompanying Notes to Financial Statements.
34
Columbia Connecticut Intermediate Municipal Bond Fund
October 31, 2009
| Municipal Bonds (continued) | |
| | | Par ($) | | Value ($) | |
| CT Farmington | |
| Series 2002, | |
Pre-refunded 09/15/12,
5.000% 09/15/19 | | | 820,000 | | | | 917,621 | | |
| CT Health & Educational Facilities Authority | |
| Connecticut College, | |
Series 2000 D-1,
Pre-refunded 07/01/10,
Insured: NPFGC
5.750% 07/01/30 | | | 1,250,000 | | | | 1,307,825 | | |
| Trinity College, | |
Series 2001 G,
Pre-refunded 07/01/11,
Insured: AMBAC:
5.000% 07/01/31 | | | 1,000,000 | | | | 1,079,890 | | |
| 5.500% 07/01/15 | | | 2,825,000 | | | | 3,074,080 | | |
| CT New Haven | |
| Series 2002 B, | |
Escrowed to Maturity,
Insured: FGIC | |
| 5.375% 11/01/12 | | | 5,000 | | | | 5,634 | | |
| Series 2002 C: | |
Escrowed to Maturity,
Insured: NPFGC | |
| 5.000% 11/01/18 | | | 15,000 | | | | 16,647 | | |
Pre-refunded 11/01/12,
Insured: NPFGC | |
| 5.000% 11/01/18 | | | 1,985,000 | | | | 2,221,949 | | |
| Series 2003 A, | |
Pre-refunded 11/01/13,
Insured: FGIC | |
| 5.250% 11/01/16 | | | 170,000 | | | | 196,085 | | |
| CT Seymour | |
| Series 2001 B, | |
Pre-refunded 08/01/11,
Insured: NPFGC | |
| 5.250% 08/01/15 | | | 1,100,000 | | | | 1,187,230 | | |
| CT Special Assessment Second Injury Fund | |
| Series 2000 A, | |
Escrowed to Maturity,
Insured: FSA | |
| 5.250% 01/01/10 | | | 2,000,000 | | | | 2,016,780 | | |
| CT Stamford | |
| Series 2002, | |
Pre-refunded 08/15/12,
5.000% 08/15/19 | | | 1,000,000 | | | | 1,108,670 | | |
| | | Par ($) | | Value ($) | |
| CT State | |
| Series 1993 E, | |
Escrowed to Maturity,
6.000% 03/15/12 | | | 25,000 | | | | 27,924 | | |
| Series 1999 B, | |
Pre-refunded 11/01/09,
5.750% 11/01/11 | | | 1,000,000 | | | | 1,010,150 | | |
| Series 2000 A, | |
Pre-refunded 04/15/10,
5.500% 04/15/19 | | | 865,000 | | | | 893,147 | | |
| Series 2003 F, | |
Pre-refunded 10/15/13,
Insured: NPFGC | |
| 5.250% 10/15/20 | | | 3,670,000 | | | | 4,195,140 | | |
| CT University of Connecticut | |
| Series 2000 A, | |
Pre-refunded 03/01/10,
Insured: FGIC | |
| 5.375% 03/01/19 | | | 2,000,000 | | | | 2,054,060 | | |
| Series 2002 A, | |
Pre-refunded 04/01/12,
5.375% 04/01/13 | | | 1,000,000 | | | | 1,104,060 | | |
| CT Westport | |
| Series 2000, | |
Pre-refunded 08/15/10:
5.375% 08/15/14 | | | 550,000 | | | | 571,896 | | |
| 5.375% 08/15/15 | | | 1,550,000 | | | | 1,611,705 | | |
| Series 2001, | |
Pre-refunded 12/01/11,
5.000% 12/01/16 | | | 1,155,000 | | | | 1,255,554 | | |
PR Commonwealth of Puerto Rico
Infrastructure Financing Authority | |
| Series 2000 A, | |
Economically Defeased to Maturity,
5.500% 10/01/40 | | | 1,000,000 | | | | 1,057,680 | | |
| Refunded/Escrowed Total | | | 33,592,735 | | |
| Other Total | | | 41,734,081 | | |
| Other Revenue – 0.8% | |
| Recreation – 0.8% | |
| CT Development Authority | |
| Mystic Marinelife Aquarium, | |
Series 2007 A,
LOC: Citibank N.A. | |
| 4.625% 05/01/37 | | | 2,000,000 | | | | 1,811,060 | | |
| Recreation Total | | | 1,811,060 | | |
| Other Revenue Total | | | 1,811,060 | | |
See Accompanying Notes to Financial Statements.
35
Columbia Connecticut Intermediate Municipal Bond Fund
October 31, 2009
| Municipal Bonds (continued) | |
| | | Par ($) | | Value ($) | |
| Resource Recovery – 0.7% | |
| Disposal – 0.7% | |
CT New Haven Solid Waste & Recycling
Authority | |
Series 2008,
5.125% 06/01/23 | | | 1,520,000 | | | | 1,605,819 | | |
| Disposal Total | | | 1,605,819 | | |
| Resource Recovery Total | | | 1,605,819 | | |
| Tax-Backed – 50.0% | |
| Local General Obligations – 24.3% | |
| CT Bridgeport | |
| Series 2002 A, | |
Insured: FGIC
5.375% 08/15/14 | | | 1,600,000 | | | | 1,678,208 | | |
| Series 2004 C, | |
Insured: NPFGC
5.250% 08/15/17 | | | 1,500,000 | | | | 1,623,840 | | |
| CT Colchester | |
| Series 1997 A, | |
Insured: AMBAC
5.400% 08/15/10 | | | 885,000 | | | | 920,250 | | |
| CT Danbury | |
| Series 1995, | |
| 5.625% 02/01/13 | | | 200,000 | | | | 226,774 | | |
| Series 2004, | |
Insured: FGIC
4.750% 08/01/16 | | | 1,270,000 | | | | 1,408,417 | | |
| CT Darien | |
| Series 2009 A, | |
| 5.000% 08/01/16 | | | 500,000 | | | | 579,495 | | |
| CT East Haven | |
| Series 2003, | |
Insured: NPFGC
5.000% 09/01/15 | | | 640,000 | | | | 713,222 | | |
| CT Fairfield | |
| Series 2004, | |
| 4.500% 01/01/16 | | | 1,690,000 | | | | 1,829,256 | | |
| Series 2008: | |
| 5.000% 01/01/20 | | | 1,000,000 | | | | 1,163,650 | | |
| 5.000% 01/01/22 | | | 500,000 | | | | 582,420 | | |
| CT Hartford County Metropolitan District | |
| Series 2002, | |
| 5.000% 04/01/19 | | | 1,205,000 | | | | 1,305,617 | | |
| | | Par ($) | | Value ($) | |
| CT Hartford | |
| Series 2003, | |
Insured: FSA
4.750% 12/01/15 | | | 2,065,000 | | | | 2,245,109 | | |
| Series 2005 C, | |
Insured: NPFGC
5.000% 09/01/19 | | | 2,085,000 | | | | 2,315,768 | | |
| Series 2006, | |
Insured: AMBAC
5.000% 07/15/22 | | | 600,000 | | | | 635,976 | | |
| Series 2009 A, | |
Insured: AGO
5.000% 08/15/17 | | | 695,000 | | | | 780,381 | | |
| CT Montville | |
| Series 1994, | |
| 5.300% 12/01/09 | | | 370,000 | | | | 371,561 | | |
| CT New Britain | |
| Series 2006, | |
Insured: AMBAC
5.000% 04/15/17 | | | 1,165,000 | | | | 1,296,610 | | |
| CT New Haven | |
| Series 2002 B, | |
Insured: FGIC
5.375% 11/01/12 | | | 995,000 | | | | 1,093,923 | | |
| Series 2003 A, | |
Insured: FGIC
5.250% 11/01/16 | | | 1,830,000 | | | | 2,059,354 | | |
| Series 2008, | |
Insured: FSA
5.000% 11/01/18 | | | 4,260,000 | | | | 4,934,401 | | |
| CT New London | |
| Series 2003 C, | |
Insured: AMBAC
5.000% 02/01/17 | | | 1,290,000 | | | | 1,412,782 | | |
| CT New Milford | |
| Series 2004, | |
Insured: AMBAC
5.000% 01/15/16 | | | 1,025,000 | | | | 1,176,874 | | |
| CT Newtown | |
| Series 2009, | |
| 4.000% 07/01/16 | | | 750,000 | | | | 819,180 | | |
| CT North Haven | |
| Series 2007: | |
| 4.750% 07/15/24 | | | 1,150,000 | | | | 1,297,131 | | |
| 4.750% 07/15/25 | | | 1,150,000 | | | | 1,295,751 | | |
See Accompanying Notes to Financial Statements.
36
Columbia Connecticut Intermediate Municipal Bond Fund
October 31, 2009
| Municipal Bonds (continued) | |
| | | Par ($) | | Value ($) | |
| CT Regional School District No. 15 | |
| Series 2003, | |
Insured: FGIC:
5.000% 02/01/15 | | | 1,105,000 | | | | 1,251,203 | | |
| 5.000% 02/01/16 | | | 1,025,000 | | | | 1,165,446 | | |
| CT Ridgefield | |
| Series 2009, | |
| 5.000% 09/15/20 | | | 2,130,000 | | | | 2,459,170 | | |
| CT Stamford | |
| Series 2003 B: | |
| 5.250% 08/15/16 | | | 1,650,000 | | | | 1,937,710 | | |
| 5.250% 08/15/17 | | | 1,125,000 | | | | 1,329,559 | | |
| Series 2009 B, | |
| 4.000% 07/01/16 | | | 2,500,000 | | | | 2,741,875 | | |
| CT Trumbull | |
| Series 2009: | |
| 4.000% 09/15/20 | | | 575,000 | | | | 604,751 | | |
| 4.000% 09/15/21 | | | 600,000 | | | | 619,674 | | |
| CT Watertown | |
| Series 2005, | |
Insured: NPFGC
5.000% 08/01/17 | | | 1,060,000 | | | | 1,209,407 | | |
| Series 2009 B, | |
| 5.000% 07/01/17 | | | 2,000,000 | | | | 2,286,880 | | |
| CT West Hartford | |
| Series 2009, | |
| 4.000% 10/01/23 | | | 3,275,000 | | | | 3,374,265 | | |
| CT Weston | |
| Series 2004, | |
| 5.250% 07/15/15 | | | 1,300,000 | | | | 1,509,677 | | |
| CT Westport | |
| Series 2003, | |
| 5.000% 08/15/18 | | | 1,200,000 | | | | 1,312,788 | | |
| CT Windham | |
| Series 2004, | |
Insured: NPFGC
5.000% 06/15/15 | | | 785,000 | | | | 897,326 | | |
PR Commonwealth of Puerto Rico
Municipal Finance Agency | |
| Series 1999 A, | |
Insured: FSA
5.750% 08/01/12 | | | 1,500,000 | | | | 1,518,690 | | |
| Local General Obligations Total | | | 57,984,371 | | |
| | | Par ($) | | Value ($) | |
| Special Non-Property Tax – 10.0% | |
| CT Special Tax Obligation | |
| Transportation Infrastructure: | |
| Series 1992 B, | |
| 6.125% 09/01/12 | | | 400,000 | | | | 430,688 | | |
Series 1998 A,
Insured: FGIC: | |
| 5.250% 10/01/14 | | | 2,100,000 | | | | 2,117,640 | | |
| 5.500% 10/01/12 | | | 3,250,000 | | | | 3,636,783 | | |
Series 2003 B,
Insured: FGIC | |
| 5.000% 01/01/23 | | | 800,000 | | | | 837,744 | | |
Series 2009 A,
4.500% 12/01/19 (d) | | | 3,765,000 | | | | 4,084,874 | | |
Series 2009:
4.250% 02/01/17 | | | 3,000,000 | | | | 3,222,420 | | |
| 5.000% 02/01/19 | | | 3,450,000 | | | | 3,877,041 | | |
| OH Hamilton County Sales Tax | |
| Series 2000 B, | |
| Insured: AMBAC | |
| (e) 12/01/28 | | | 3,000,000 | | | | 1,073,010 | | |
PR Commonwealth of Puerto Rico
Highway & Transportation Authority | |
| Series 2002 E, | |
Insured: FSA
5.500% 07/01/17 | | | 1,870,000 | | | | 2,054,232 | | |
| Series 2006 BB, | |
Insured: FSA
5.250% 07/01/22 | | | 2,500,000 | | | | 2,676,900 | | |
| Special Non-Property Tax Total | | | 24,011,332 | | |
| State Appropriated – 4.0% | |
| CT Health & Educational Facilities Authority | |
| State University System, | |
Series 2007 I,
Insured: FSA | |
| 5.250% 11/01/17 | | | 1,000,000 | | | | 1,165,440 | | |
| CT State Certificates of Participation | |
| Juvenile Training School, | |
Series 2001,
5.250% 12/15/14 | | | 1,565,000 | | | | 1,712,266 | | |
| CT University of Connecticut | |
| Series 2004 A, | |
Insured: NPFGC
5.000% 01/15/13 | | | 2,000,000 | | | | 2,224,480 | | |
| Series 2006 A, | |
Insured: NPFGC
5.000% 02/15/16 | | | 1,400,000 | | | | 1,589,014 | | |
See Accompanying Notes to Financial Statements.
37
Columbia Connecticut Intermediate Municipal Bond Fund
October 31, 2009
| Municipal Bonds (continued) | |
| | | Par ($) | | Value ($) | |
| Series 2007 A, | |
| 4.000% 04/01/24 | | | 2,100,000 | | | | 2,100,609 | | |
PR Commonwealth of Puerto Rico
Public Finance Corp. | |
| Series 2004 A, | |
LOC: Government Development Bank
for Puerto Rico
5.750% 08/01/27 (02/01/12) (a)(b) | | | 700,000 | | | | 721,868 | | |
| State Appropriated Total | | | 9,513,677 | | |
| State General Obligations – 11.7% | |
| CT Housing Finance Authority | |
| Series 2005 D-1, | |
| 4.100% 05/15/17 | | | 2,200,000 | | | | 2,254,252 | | |
| Series 2009: | |
| 5.000% 06/15/18 | | | 1,755,000 | | | | 1,973,936 | | |
| 5.000% 06/15/19 | | | 1,840,000 | | | | 2,070,865 | | |
| CT State | |
| Series 1993 E, | |
| 6.000% 03/15/12 | | | 975,000 | | | | 1,087,583 | | |
| Series 2000 C, | |
| 5.375% 12/15/10 | | | 1,000,000 | | | | 1,054,940 | | |
| Series 2001, | |
Insured: FSA
5.500% 12/15/14 | | | 1,500,000 | | | | 1,754,970 | | |
| Series 2003 E, | |
Insured: FGIC
5.000% 08/15/21 | | | 1,000,000 | | | | 1,094,040 | | |
| Series 2005 B, | |
Insured: AMBAC
5.250% 06/01/20 | | | 600,000 | | | | 708,336 | | |
| Series 2005 D, | |
Insured: FGIC
5.000% 11/15/23 | | | 4,000,000 | | | | 4,304,720 | | |
| Series 2006 E, | |
| 5.000% 12/15/20 | | | 3,000,000 | | | | 3,326,190 | | |
| Series 2008 B, | |
| 5.000% 04/15/22 | | | 5,415,000 | | | | 6,027,383 | | |
| CT University of Connecticut | |
| Series 2009 A, | |
| 5.000% 02/15/23 | | | 2,000,000 | | | | 2,210,380 | | |
| State General Obligations Total | | | 27,867,595 | | |
| Tax-Backed Total | | | 119,376,975 | | |
| | | Par ($) | | Value ($) | |
| Utilities – 6.4% | |
| Investor Owned – 2.4% | |
| CT Development Authority | |
| Pollution Control Revenue: | |
Connecticut Light & Power Co.,
Series 1993 A,
5.850% 09/01/28 | | | 5,285,000 | | | | 5,292,557 | | |
United Illuminating Co.,
Series 2009,
5.750% 06/01/26 (02/01/12) (a)(b) | | | 500,000 | | | | 525,755 | | |
| Investor Owned Total | | | 5,818,312 | | |
| Joint Power Authority – 1.6% | |
CT State Municipal Electric Energy
Cooperative Power Supply Systems | |
| Series 2006 A, | |
Insured: AMBAC
5.000% 01/01/22 | | | 2,000,000 | | | | 2,146,680 | | |
| Series 2009 A, | |
Insured: AGO
5.000% 01/01/17 | | | 1,525,000 | | | | 1,693,360 | | |
| Joint Power Authority Total | | | 3,840,040 | | |
| Municipal Electric – 0.1% | |
PR Commonwealth of Puerto Rico Electric
Power Authority | |
| Series 2003 NN, | |
Insured: NPFGC
5.250% 07/01/19 | | | 285,000 | | | | 299,877 | | |
| Municipal Electric Total | | | 299,877 | | |
| Water & Sewer – 2.3% | |
CT Greater New Haven Water Pollution
Control Authority | |
| Series 2005 A, | |
Insured: NPFGC
5.000% 11/15/30 | | | 2,500,000 | | | | 2,535,050 | | |
| CT South Central Regional Water Authority | |
| Series 2007 A, | |
Insured: NPFGC:
5.250% 08/01/22 | | | 1,370,000 | | | | 1,524,440 | | |
| 5.250% 08/01/23 | | | 500,000 | | | | 555,110 | | |
| Series 2008 B, | |
Insured: NPFGC
5.250% 08/01/29 (a) | | | 750,000 | | | | 792,263 | | |
| Water & Sewer Total | | | 5,406,863 | | |
| Utilities Total | | | 15,365,092 | | |
Total Municipal Bonds
(cost of $229,566,559) | | | 236,011,858 | | |
See Accompanying Notes to Financial Statements.
38
Columbia Connecticut Intermediate Municipal Bond Fund
October 31, 2009
| Investment Companies – 1.9% | |
| | | Shares | | Value ($) | |
Columbia Connecticut Municipal
Reserves, G-Trust Shares
(7 day yield of 0.160%) (f)(g) | | | 2,339,181 | | | | 2,339,181 | | |
Dreyfus Municipal Cash
Management Plus
(7 day yield of 0.210%) | | | 2,072,022 | | | | 2,072,022 | | |
Total Investment Companies
(cost of $4,411,203) | | | 4,411,203 | | |
| Short-Term Obligation – 0.0% | |
| | | Par ($) | | | |
| Variable Rate Demand Note – 0.0% | |
| MI Higher Education Facilities Authority | |
| University of Detroit Mercy, | |
Series 2007,
LOC: JPMorgan Chase Bank
0.250% 11/01/36
(11/02/09) (a)(b)(h) | | | 5,000 | | | | 5,000 | | |
| Variable Rate Demand Note Total | | | 5,000 | | |
Total Short-Term Obligation
(cost of $5,000) | | | 5,000 | | |
Total Investments – 100.8%
(cost of $233,982,762) (i) | | | 240,428,061 | | |
| Other Assets & Liabilities, Net – (0.8)% | | | (1,803,867 | ) | |
| Net Assets – 100.0% | | | 238,624,194 | | |
Notes to Investment Portfolio:
(a) The interest rate shown on floating rate or variable rate securities reflects the rate at October 31, 2009.
(b) Parenthetical date represents the next interest rate reset date for the security.
(c) The Fund has been informed that each issuer has placed direct obligations of the U.S. Government in an irrevocable trust, solely for the payment of principal and interest.
(d) Security purchased on a delayed delivery basis.
(e) Zero coupon bond.
(f) Investments in affiliates during the year ended October 31, 2009:
| Security name: Columbia Connecticut Municipal Reserves, G-Trust Shares (7 day yield of 0.160%) | |
| Shares as of 10/31/08: | | | — | | |
| Shares purchased: | | | 49,405,149 | | |
| Shares sold: | | | (47,065,968 | ) | |
| Shares as of 10/31/09: | | | 2,339,181 | | |
| Net realized gain (loss): | | $ | — | | |
| Dividend income earned: | | $ | 9,497 | | |
| Value at end of period: | | $ | 2,339,181 | | |
(g) Money market mutual fund registered under the Investment Company Act of 1940, as amended, and advised by Columbia Management Advisors, LLC.
(h) Variable rate demand note. This security is payable upon demand and is secured by letters of credit or other credit support agreements from banks. The interest rate changes periodically and the interest rate shown reflects the rate as of October 31, 2009.
(i) Cost for federal income tax purposes is $233,963,322.
The following table summarizes the inputs used, as of October 31, 2009, in valuing the Fund's assets:
| Description | |
Quoted Prices
(Level 1) | | Other
Significant
Observable
Inputs
(Level 2) | | Significant
Unobservable
Inputs
(Level 3) | | Total | |
| Total Municipal Bonds | | $ | — | | | $ | 236,011,858 | | | $ | — | | | $ | 236,011,858 | | |
Total Investment
Companies | | | 4,411,203 | | | | — | | | | — | | | | 4,411,203 | | |
Total Short-Term
Obligation | | | — | | | | 5,000 | | | | — | | | | 5,000 | | |
| Total Investments | | $ | 4,411,203 | | | $ | 236,016,858 | | | $ | — | | | $ | 240,428,061 | | |
For more information on valuation inputs, and their aggregation into the levels used in the table above, please refer to the Security Valuation section in the accompanying Notes to Financial Statements.
At October 31, 2009, the composition of the Fund by revenue source is as follows:
| Holdings by Revenue Source (Unaudited) | | % of
Net Assets | |
| Tax-Backed | | | 50.0 | | |
| Refunded/Escrowed | | | 14.1 | | |
| Education | | | 11.1 | | |
| Housing | | | 7.4 | | |
| Utilities | | | 6.4 | | |
| Health Care | | | 4.6 | | |
| Pool/Bond Bank | | | 3.4 | | |
| Other Revenue | | | 0.8 | | |
| Resource Recovery | | | 0.7 | | |
| Industrials | | | 0.4 | | |
| | | | 98.9 | | |
| Investment Companies | | | 1.9 | | |
| Short-Term Obligation | | | 0.0 | * | |
| Other Assets & Liabilities, Net | | | (0.8 | ) | |
| | | | 100.0 | | |
* Round to less than 0.1%
| Acronym | | Name | |
| AGO | | Assured Guaranty Ltd. | |
|
| AMBAC | | Ambac Assurance Corp. | |
|
| FGIC | | Financial Guaranty Insurance Co. | |
|
| FSA | | Financial Security Assurance, Inc. | |
|
| LOC | | Letter of Credit | |
|
| NPFGC | | National Public Finance Guarantee Corp. | |
|
| RAD | | Radian Asset Assurance, Inc. | |
|
See Accompanying Notes to Financial Statements.
39
Investment Portfolio – Columbia Intermediate Municipal Bond Fund
October 31, 2009
| Municipal Bonds – 98.7% | |
| | | Par ($) | | Value ($) | |
| Education – 2.8% | |
| Education – 2.8% | |
| CA Municipal Finance Authority | |
| Biola University, | |
Series 2008 A,
5.625% 10/01/23 | | | 3,000,000 | | | | 3,075,630 | | |
| CA University | |
Series 2008 A,
Insured: FSA
5.000% 11/01/22 | | | 5,000,000 | | | | 5,253,600 | | |
CT Health & Educational Facilities
Authority | |
| Trinity College, | |
Series 1998 F,
Insured: NPFGC
5.500% 07/01/21 | | | 1,000,000 | | | | 1,150,320 | | |
FL Volusia County Educational Facilities
Authority | |
| Embry-Riddle Aeronautical University, | |
Series 1999 A,
5.750% 10/15/29 | | | 2,380,000 | | | | 2,380,809 | | |
| IL Finance Authority | |
| DePaul University, | |
Series 2004 A:
5.375% 10/01/17 | | | 1,000,000 | | | | 1,077,730 | | |
| 5.375% 10/01/18 | | | 2,000,000 | | | | 2,147,080 | | |
| KS Development Finance Authority | |
| Board of Regents Scientific Research, | |
Series 2003,
Insured: AMBAC
5.000% 10/01/19 | | | 2,000,000 | | | | 2,148,800 | | |
| Regents-Wichita University, | |
Series 2000 B,
Insured: AMBAC
5.900% 04/01/15 | | | 2,000,000 | | | | 2,041,760 | | |
| KS Washburn University | |
| Topeka Living Learning Center, | |
Series 2004,
Insured: AMBAC
5.000% 07/01/18 | | | 900,000 | | | | 919,467 | | |
| MA College Building Authority | |
Series 1994 A,
7.500% 05/01/14 | | | 500,000 | | | | 579,245 | | |
MA Health & Educational Facilities
Authority | |
| Boston College, | |
Series 2008,
5.500% 06/01/24 | | | 2,670,000 | | | | 3,118,934 | | |
| | | Par ($) | | Value ($) | |
MO Health & Educational Facilities
Authority | |
| St. Louis University, | |
Series 1998,
5.500% 10/01/16 | | | 1,000,000 | | | | 1,160,560 | | |
| Washington University, | |
Series 2001 A,
5.500% 06/15/16 | | | 1,000,000 | | | | 1,177,740 | | |
| NH Health & Education Facilities Authority | |
Series 2009 A,
5.000% 07/01/23 | | | 8,370,000 | | | | 8,849,433 | | |
| NY Dormitory Authority | |
Series 2005 B,
Insured: FGIC
5.500% 07/01/21 | | | 6,345,000 | | | | 7,202,971 | | |
| St. John's University, | |
Series 2007 C,
Insured: NPFGC
5.250% 07/01/23 | | | 5,245,000 | | | | 5,732,890 | | |
| OH University | |
Series 2009 A,
5.000% 12/01/16 | | | 4,000,000 | | | | 4,518,880 | | |
| PA Higher Educational Facilities Authority | |
| University of Sciences, | |
Series 2005 A,
Insured: SYNC
5.000% 11/01/16 | | | 360,000 | | | | 391,720 | | |
| RI Health & Educational Building Corp. | |
Series 2003,
Insured: SYNC
5.250% 04/01/15 | | | 1,500,000 | | | | 1,541,790 | | |
TN Metropolitan Government, Nashville &
Davidson County, Health & Educational
Facilities Board | |
| Meharry Medical College, | |
Series 1996,
Insured: AMBAC
6.000% 12/01/16 | | | 500,000 | | | | 561,205 | | |
| TX Public Finance Authority | |
| Stephen F. Austin University, | |
Series 2005,
Insured: NPFGC
5.000% 10/15/19 | | | 2,000,000 | | | | 2,123,460 | | |
| TX University of Texas | |
Series 2004 A,
5.250% 08/15/17 | | | 2,000,000 | | | | 2,310,960 | | |
See Accompanying Notes to Financial Statements.
40
Columbia Intermediate Municipal Bond Fund
October 31, 2009
| Municipal Bonds (continued) | |
| | | Par ($) | | Value ($) | |
Series 2006 D,
5.000% 08/15/18 | | | 10,000,000 | | | | 11,174,300 | | |
| Education Total | | | 70,639,284 | | |
| Education Total | | | 70,639,284 | | |
| Health Care – 10.7% | |
| Continuing Care Retirement – 2.1% | |
| CO Health Facilities Authority | |
| Covenant Retirement Communities, Inc., | |
Series 2005,
5.000% 12/01/18 | | | 1,000,000 | | | | 956,300 | | |
| FL Lakeland | |
| Carpenters Retirement Community, | |
Series 2008,
5.875% 01/01/19 | | | 1,875,000 | | | | 1,823,756 | | |
FL Lee County Industrial Development
Authority | |
| Shell Point, | |
Series 2007,
5.000% 11/15/22 | | | 7,650,000 | | | | 6,718,918 | | |
FL Orange County Health Facilities
Authority | |
| Orlando Lutheran Towers, | |
Series 2005,
5.000% 07/01/13 | | | 3,670,000 | | | | 3,569,846 | | |
FL Sarasota County Health Facilities
Authority | |
| Village on the Isle, | |
Series 2007,
5.500% 01/01/27 | | | 4,000,000 | | | | 3,349,320 | | |
| IL Finance Authority | |
| Monarch Landing, Inc., | |
Series 2007 A:
5.500% 12/01/13 | | | 2,200,000 | | | | 1,055,032 | | |
| 6.000% 12/01/17 | | | 3,590,000 | | | | 1,613,095 | | |
| Sedgebrook, Inc., | |
Series 2007 A:
5.400% 11/15/16 | | | 2,165,000 | | | | 1,080,876 | | |
| 5.875% 11/15/22 | | | 8,000,000 | | | | 3,592,800 | | |
IN Health & Educational Facility
Financing Authority | |
| Baptist Homes of Indiana, | |
Series 2005,
5.250% 11/15/25 | | | 10,640,000 | | | | 9,866,259 | | |
| | | Par ($) | | Value ($) | |
| KS Lenexa | |
| Lakeview Village, Inc., | |
Series 2007,
5.250% 05/15/22 | | | 2,650,000 | | | | 2,157,577 | | |
| MA Development Finance Agency | |
| First Mortgage Orchard Cove, | |
Series 2007,
5.000% 10/01/17 | | | 1,040,000 | | | | 919,121 | | |
| MD Howard County Retirement Authority | |
| Columbia Vantage House Corp., | |
Series 2007 A,
5.250% 04/01/27 | | | 1,500,000 | | | | 1,234,170 | | |
MO St. Louis Industrial Development
Authority | |
| St. Andrew's Resources for Seniors, | |
Series 2007 A,
6.250% 12/01/26 | | | 7,000,000 | | | | 6,307,560 | | |
| NC Medical Care Commission | |
| Givens Estates, | |
Series 2007,
5.000% 07/01/27 | | | 3,375,000 | | | | 2,927,239 | | |
NY Nassau County Industrial
Development Agency | |
| Amsterdam Harborside, | |
Series 2007 A,
5.875% 01/01/18 | | | 2,375,000 | | | | 2,217,775 | | |
TX Tarrant County Cultural Education
Facilities Finance Corp. | |
| Air Force Village, | |
Series 2007,
5.125% 05/15/27 | | | 3,750,000 | | | | 3,326,138 | | |
| Continuing Care Retirement Total | | | 52,715,782 | | |
| Hospitals – 8.4% | |
AZ Maricopa County Industrial
Development Authority | |
| Catholic Healthcare West, | |
Series 2007 A,
5.000% 07/01/18 | | | 3,500,000 | | | | 3,609,935 | | |
| CA Health Facilities Financing Authority | |
| St. Joseph Health System, | |
Series 2009 B,
5.000% 07/01/18 | | | 10,445,000 | | | | 10,992,005 | | |
Series 2009 F,
5.000% 07/01/27
(07/01/14) (a)(b)(c) | | | 3,000,000 | | | | 3,140,490 | | |
See Accompanying Notes to Financial Statements.
41
Columbia Intermediate Municipal Bond Fund
October 31, 2009
| Municipal Bonds (continued) | |
| | | Par ($) | | Value ($) | |
CA Rancho Mirage Joint Powers
Financing Authority | |
| Eisenhower Medical Center, | |
Series 1997 B,
Insured: NPFGC
4.875% 07/01/22 | | | 1,730,000 | | | | 1,647,306 | | |
| CO Health Facilities Authority | |
| Catholic Health Initiatives, | |
Series 2008 D,
5.500% 10/01/38 | | | 5,000,000 | | | | 5,537,600 | | |
FL Escambia County Health Facilities
Authority | |
| Ascension Health, | |
Series 2003 A,
5.250% 11/15/11 | | | 2,125,000 | | | | 2,290,920 | | |
FL Highlands County Health Facilities
Authority | |
| Adventist Health Systems: | |
Series 2005 A,
5.000% 11/15/20 (a) | | | 1,000,000 | | | | 1,018,760 | | |
Series 2005 B:
5.000% 11/15/20 | | | 875,000 | | | | 891,415 | | |
| 5.000% 11/15/22 | | | 740,000 | | | | 746,897 | | |
| Adventist Hinsdale Hospital, | |
Series 2005 A,
5.000% 11/15/22 (a) | | | 1,000,000 | | | | 1,009,320 | | |
FL Hillsborough County Industrial
Development Authority | |
| Tampa General Hospital, | |
Series 2003 A,
5.000% 10/01/18 | | | 1,000,000 | | | | 1,005,610 | | |
FL Orange County Health Facilities
Authority | |
Series 1996 A,
Insured: NPFGC
6.250% 10/01/16 | | | 1,700,000 | | | | 1,895,976 | | |
| FL South Broward Hospital District | |
Series 2003 A,
Insured: NPFGC:
5.250% 05/01/12 | | | 3,955,000 | | | | 4,239,879 | | |
| 5.250% 05/01/13 | | | 1,500,000 | | | | 1,625,985 | | |
| FL St. Petersburg Health Facilities Authority | |
| All Children's Hospital, | |
Series 2002,
Insured: AMBAC:
5.500% 11/15/14 | | | 1,720,000 | | | | 1,812,828 | | |
| 5.500% 11/15/15 | | | 1,995,000 | | | | 2,079,807 | | |
| 5.500% 11/15/16 | | | 1,980,000 | | | | 2,047,320 | | |
| | | Par ($) | | Value ($) | |
| FL Tampa Health Systems | |
| Catholic Health East, | |
Series 1998 A-1,
Insured: NPFGC:
5.500% 11/15/13 | | | 6,080,000 | | | | 6,462,614 | | |
| 5.500% 11/15/14 | | | 6,000,000 | | | | 6,395,280 | | |
| KS Wichita Hospital | |
Series 2001 III,
6.250% 11/15/18 | | | 5,000,000 | | | | 5,218,400 | | |
MA Health & Educational Facilities
Authority | |
| CareGroup, Inc., | |
Series 2008 E-2:
5.375% 07/01/20 | | | 9,720,000 | | | | 9,993,812 | | |
| 5.375% 07/01/22 | | | 13,345,000 | | | | 13,514,615 | | |
| MI Saginaw Hospital Finance Authority | |
| Covenant Medical Center, | |
Series 2004 G,
5.125% 07/01/22 | | | 10,000,000 | | | | 9,511,300 | | |
| NC Albemarle Hospital Authority | |
Series 2007:
5.250% 10/01/21 | | | 3,000,000 | | | | 2,703,750 | | |
| 5.250% 10/01/27 | | | 3,700,000 | | | | 3,094,236 | | |
| NH Health & Education Facilities Authority | |
| Southern New Hampshire Medical Center, | |
Series 2007,
5.250% 10/01/23 | | | 7,000,000 | | | | 6,931,610 | | |
| NY Albany Industrial Development Agency | |
| St. Peter's Hospital, | |
Series 2008 A:
5.250% 11/15/16 | | | 1,750,000 | | | | 1,816,973 | | |
| 5.250% 11/15/17 | | | 1,250,000 | | | | 1,294,725 | | |
| NY Dormitory Authority | |
| Long Island Jewish Medical Center, | |
Series 2009,
5.250% 05/01/30 | | | 4,750,000 | | | | 4,795,980 | | |
| Mount Sinai School of Medicine, | |
Series 2009:
5.500% 07/01/26 (b) | | | 14,635,000 | | | | 15,121,467 | | |
| 5.500% 07/01/27 (b) | | | 10,675,000 | | | | 10,968,242 | | |
NY Monroe County Industrial
Development Agency | |
| Highland Hospital of Rochester, | |
Series 2005:
5.000% 08/01/14 | | | 730,000 | | | | 756,090 | | |
| 5.000% 08/01/15 | | | 545,000 | | | | 559,361 | | |
See Accompanying Notes to Financial Statements.
42
Columbia Intermediate Municipal Bond Fund
October 31, 2009
| Municipal Bonds (continued) | |
| | | Par ($) | | Value ($) | |
| OH Lorain County Hospital | |
| Catholic Healthcare Partnerships, | |
Series 2001 A:
5.625% 10/01/14 | | | 6,135,000 | | | | 6,442,732 | | |
| 5.625% 10/01/15 | | | 3,000,000 | | | | 3,122,280 | | |
| 5.625% 10/01/16 | | | 3,000,000 | | | | 3,112,380 | | |
| OH Montgomery County | |
| Catholic Health Initiatives, | |
Series 2008 D,
5.250% 10/01/38
(11/12/13) (a)(c) | | | 8,000,000 | | | | 8,679,200 | | |
| PA Higher Educational Facilities Authority | |
| University of Pennsylvania Health Systems, | |
Series 2005 A,
Insured: AMBAC
5.000% 08/15/18 | | | 250,000 | | | | 265,570 | | |
PA Northampton County General Purpose
Authority | |
| St. Luke's Hospital Bethlehem, | |
Series 2008 A:
5.000% 08/15/20 | | | 3,480,000 | | | | 3,473,980 | | |
| 5.125% 08/15/21 | | | 3,715,000 | | | | 3,716,003 | | |
| 5.250% 08/15/22 | | | 1,965,000 | | | | 1,971,701 | | |
TN Sullivan County Health, Educational &
Housing Facilities Board | |
Series 2006 C,
5.000% 09/01/22 | | | 3,750,000 | | | | 3,373,800 | | |
| TX Amarillo Health Facilities Corp. | |
| Baptist St. Anthony's Hospital Corp., | |
Series 1998,
Insured: FSA
5.500% 01/01/14 | | | 1,000,000 | | | | 1,074,900 | | |
TX Harris County Health Facilities
Development Corp. | |
| Memorial Hospital Systems, | |
Series 1997 A,
Insured: NPFGC
6.000% 06/01/13 | | | 2,170,000 | | | | 2,313,415 | | |
TX Tarrant County Cultural Education
Facilities Finance Corp. | |
| Texas Health Resources, | |
Series 2007 A,
5.000% 02/15/21 | | | 5,000,000 | | | | 5,109,950 | | |
VA Augusta County Industrial
Development Authority | |
| Augusta Health Care, Inc., | |
Series 2003,
5.250% 09/01/18 | | | 1,500,000 | | | | 1,589,040 | | |
| | | Par ($) | | Value ($) | |
WI Health & Educational Facilities
Authority | |
| Wheaton Franciscan Healthcare, | |
Series 2006:
5.125% 08/15/23 | | | 13,065,000 | | | | 11,830,619 | | |
| 5.125% 08/15/26 | | | 10,000,000 | | | | 8,754,500 | | |
| Hospitals Total | | | 209,560,578 | | |
| Nursing Homes – 0.2% | |
| IA Finance Authority Health Facilities | |
| Development Care Initiatives, | |
Series 2006 A:
5.250% 07/01/18 | | | 2,695,000 | | | | 2,360,443 | | |
| 5.500% 07/01/21 | | | 1,530,000 | | | | 1,297,929 | | |
| MN Eveleth Health Care | |
Series 2007,
5.000% 10/01/17 | | | 1,000,000 | | | | 896,140 | | |
MO St. Louis County Industrial
Development Authority | |
| Ranken Jordan, | |
Series 2007,
5.000% 11/15/27 | | | 1,350,000 | | | | 1,054,971 | | |
| Nursing Homes Total | | | 5,609,483 | | |
| Health Care Total | | | 267,885,843 | | |
| Housing – 0.6% | |
| Assisted Living/Senior – 0.1% | |
AZ Maricopa County Industrial
Development Authority Health Facilities | |
Series 1999 A,
Guarantor: GNMA
6.300% 09/20/38 | | | 3,715,000 | | | | 3,807,949 | | |
| Assisted Living/Senior Total | | | 3,807,949 | | |
| Multi-Family – 0.3% | |
| FL Capital Trust Agency | |
| Atlantic Housing Foundation, | |
Series 2008 B,
7.000% 07/15/32 (d) | | | 1,940,000 | | | | 869,295 | | |
| FL Collier County Finance Authority | |
| Goodlette Arms, | |
Series 2002 A-1,
LIQ FAC: FNMA
4.900% 02/15/32 (a) | | | 3,250,000 | | | | 3,457,220 | | |
| LA Housing Finance Agency | |
Series 2006 A,
Insured: FHA
4.750% 12/01/31 | | | 1,465,000 | | | | 1,399,324 | | |
See Accompanying Notes to Financial Statements.
43
Columbia Intermediate Municipal Bond Fund
October 31, 2009
| Municipal Bonds (continued) | |
| | | Par ($) | | Value ($) | |
| NC Medical Care Commission | |
| ARC/HDS Alamance Housing Corp., | |
Series 2004 A,
5.500% 10/01/24 | | | 1,575,000 | | | | 1,520,552 | | |
| Multi-Family Total | | | 7,246,391 | | |
| Single-Family – 0.2% | |
| CA Department of Veteran Affairs | |
Series 2006,
4.500% 12/01/23 | | | 5,000,000 | | | | 4,740,450 | | |
| Single-Family Total | | | 4,740,450 | | |
| Housing Total | | | 15,794,790 | | |
| Industrials – 1.3% | |
| Forest Products & Paper – 0.8% | |
| FL Bay County Pollution Control | |
| International Paper Co., | |
Series 1998 A,
5.100% 09/01/12 | | | 2,375,000 | | | | 2,427,891 | | |
| FL Escambia County Pollution Control | |
| International Paper Co., | |
Series 2003 A,
4.700% 04/01/15 | | | 500,000 | | | | 490,845 | | |
| LA Morehouse Parish Pollution Control | |
| International Paper Co., | |
Series 2001 A,
5.250% 11/15/13 | | | 8,525,000 | | | | 8,720,734 | | |
MS Warren County Environmental
Improvement | |
| International Paper Co., | |
Series 2000 A, AMT,
6.700% 08/01/18 | | | 2,600,000 | | | | 2,632,032 | | |
| TX Gulf Coast Waste Disposal Authority | |
| International Paper Co., | |
Series 2002 A, AMT,
6.100% 08/01/24 | | | 5,750,000 | | | | 5,756,555 | | |
| Forest Products & Paper Total | | | 20,028,057 | | |
| Oil & Gas – 0.5% | |
CA Southern California Public Power
Authority | |
Series 2007,
5.250% 11/01/22 | | | 2,500,000 | | | | 2,554,425 | | |
TX Municipal Gas Acquisition &
Supply Corp. | |
Series 2006 A,
5.000% 12/15/12 | | | 5,500,000 | | | | 5,758,280 | | |
| | | Par ($) | | Value ($) | |
TX Energy Acquisition Public
Facility Corp. | |
Series 2007,
5.250% 08/01/16 | | | 4,450,000 | | | | 4,760,833 | | |
| Oil & Gas Total | | | 13,073,538 | | |
| Industrials Total | | | 33,101,595 | | |
| Other – 11.6% | |
| Pool/Bond Bank – 2.5% | |
| FL Gulf Breeze | |
Series 1985 C,
Insured: FGIC
5.000% 12/01/15 | | | 1,000,000 | | | | 1,007,570 | | |
| FL Municipal Loan Council | |
Series 2005 A,
Insured: NPFGC
5.000% 02/01/19 | | | 1,015,000 | | | | 1,047,835 | | |
| IN Bond Bank | |
Series 2001 A,
5.375% 02/01/13 | | | 1,910,000 | | | | 2,133,795 | | |
| KS Development Finance Authority | |
| Water Pollution Control Revolving Fund, | |
Series 2001 II,
5.500% 05/01/14 | | | 1,000,000 | | | | 1,153,720 | | |
| MA Water Pollution Abatement Trust | |
Series 1999 A,
6.000% 08/01/19 | | | 2,500,000 | | | | 3,077,125 | | |
Series 2004 A,
5.250% 08/01/17 | | | 2,920,000 | | | | 3,397,216 | | |
Series 2009,
5.000% 08/01/24 | | | 11,530,000 | | | | 12,755,178 | | |
MO Environmental Improvement &
Energy Resources Authority | |
Series 2004 B,
5.250% 01/01/18 | | | 7,470,000 | | | | 8,738,406 | | |
| NY Dormitory Authority | |
Series 2002 A,
Insured: NPFGC
5.250% 10/01/12 | | | 2,420,000 | | | | 2,668,147 | | |
PA Delaware Valley Regional Financing
Authority | |
| Local Government: | |
Series 1997 B,
Insured: AMBAC
5.600% 07/01/17 | | | 2,000,000 | | | | 2,256,160 | | |
See Accompanying Notes to Financial Statements.
44
Columbia Intermediate Municipal Bond Fund
October 31, 2009
| Municipal Bonds (continued) | |
| | | Par ($) | | Value ($) | |
Series 2002:
5.500% 07/01/12 | | | 15,000,000 | | | | 16,510,050 | | |
| 5.750% 07/01/17 | | | 2,000,000 | | | | 2,268,620 | | |
| PA Finance Authority | |
| Penn Hills, | |
Series 2000 A,
Insured: FGIC
5.500% 12/01/22 | | | 835,000 | | | | 837,438 | | |
| VA Resources Authority | |
Series 2007,
5.000% 10/01/17 | | | 3,760,000 | | | | 4,376,301 | | |
| Pool/Bond Bank Total | | | 62,227,561 | | |
| Refunded/Escrowed (e) – 8.3% | |
AL Birmingham Waterworks & Sewer
Board | |
| Series 2002 B, | |
Pre-refunded 01/01/13,
Insured: NPFGC
5.000% 01/01/37 | | | 15,000,000 | | | | 16,663,200 | | |
| AZ School Facilities Board | |
| Certificates of Participation, | |
Series 2003 A,
Pre-refunded 03/01/13,
Insured: NPFGC
5.250% 09/01/14 | | | 10,000,000 | | | | 11,251,800 | | |
CA San Joaquin Hills Transportation
Corridor Agency | |
| Series 1993, | |
Escrowed to maturity,
(f) 01/01/25 | | | 22,405,000 | | | | 11,543,280 | | |
CO Douglas County School
District No. RE-1 | |
| Series 2001, | |
Pre-refunded 12/15/11,
Insured: NPFGC
5.250% 12/15/13 | | | 7,385,000 | | | | 8,077,491 | | |
CO Northwest Parkway Public Highway
Authority | |
| Series 2001 C, | |
Pre-refunded 06/15/16,
Insured: AMBAC
(g) 06/15/21
(5.700% 06/15/11) | | | 4,000,000 | | | | 4,212,680 | | |
| | | Par ($) | | Value ($) | |
FL Orange County Health Facilities
Authority | |
| Orlando Regional Health Care System, | |
Series 1996 A,
Escrowed to Maturity,
Insured: NPFGC
6.250% 10/01/16 | | | 4,705,000 | | | | 5,665,196 | | |
FL Orlando Utilities Commission Water &
Electric | |
| Series 1989 D, | |
Escrowed to Maturity,
6.750% 10/01/17 | | | 1,800,000 | | | | 2,136,636 | | |
| FL South Broward Hospital District | |
| Series 2002, | |
Pre-refunded 05/01/12,
5.600% 05/01/27 | | | 4,000,000 | | | | 4,453,240 | | |
| IL Chicago Housing Authority | |
| Capital Program, | |
Series 2001:
Escrowed to Maturity,
5.250% 07/01/12 | | | 5,975,000 | | | | 6,647,187 | | |
Pre-refunded 07/01/12,
5.375% 07/01/13 | | | 5,000,000 | | | | 5,578,950 | | |
IL Chicago Metropolitan Water
Reclamation District-Greater Chicago | |
| Series 2006, | |
Pre-refunded 12/01/16,
5.000% 12/01/35 | | | 31,950,000 | | | | 36,983,403 | | |
IL Kendall & Kane Counties Community
Unit School District No. 115 | |
| Series 2002, | |
Escrowed to Maturity,
Insured: FGIC
(f) 01/01/17 | | | 600,000 | | | | 470,838 | | |
| IL State | |
| Series 2002, | |
Pre-refunded 12/01/12,
Insured: FSA
5.375% 12/01/13 | | | 10,000,000 | | | | 11,275,000 | | |
| IN Toll Road Commission | |
| Series 1980, | |
Escrowed to Maturity,
9.000% 01/01/15 | | | 2,240,000 | | | | 2,717,658 | | |
| KS Department of Transportation | |
| Series 1998, | |
Escrowed to Maturity,
5.500% 09/01/14 | | | 1,575,000 | | | | 1,839,175 | | |
See Accompanying Notes to Financial Statements.
45
Columbia Intermediate Municipal Bond Fund
October 31, 2009
| Municipal Bonds (continued) | |
| | | Par ($) | | Value ($) | |
KS Labette County Single Family
Mortgage | |
| Capital Accumulator Bonds, | |
Series 1998 A,
Escrowed to Maturity,
(f) 12/01/14 | | | 2,175,000 | | | | 1,919,699 | | |
| MA State | |
| Series 2001 C, | |
Pre-refunded 12/01/11,
5.375% 12/01/16 | | | 3,000,000 | | | | 3,268,710 | | |
| MI Building Authority | |
| Series 2003 II, | |
Pre-refunded 10/15/13,
Insured: NPFGC
5.000% 10/15/17 | | | 1,000,000 | | | | 1,132,280 | | |
| MI Detroit Sewage Disposal Revenue | |
| Series 2003 A, | |
Pre-refunded 07/01/13,
Insured: FSA
5.000% 07/01/14 | | | 7,180,000 | | | | 8,057,396 | | |
| NJ Tobacco Settlement Financing Corp. | |
| Series 2003, | |
Pre-refunded 06/01/13,
6.750% 06/01/39 | | | 4,000,000 | | | | 4,710,480 | | |
| NJ Transportation Trust Fund Authority | |
| Series 1999 A, | |
Escrowed to Maturity,
5.625% 06/15/14 | | | 2,000,000 | | | | 2,338,360 | | |
| NV Clark County School District | |
| Series 2003 D, | |
Pre-refunded 12/15/13,
Insured: NPFGC
5.000% 06/15/16 | | | 10,760,000 | | | | 12,184,194 | | |
| NY Metropolitan Transportation Authority | |
| Series 1993 O, | |
Escrowed to Maturity,
5.500% 07/01/17 | | | 3,000,000 | | | | 3,566,850 | | |
| OH Water Development Authority | |
| Water Pollution Control, | |
Series 2002,
Pre-refunded 06/01/12,
5.250% 06/01/18 | | | 5,535,000 | | | | 6,120,990 | | |
| PA Elizabeth Forward School District | |
| Series 1994 B, | |
Escrowed to Maturity,
Insured: NPFGC
(f) 09/01/21 | | | 2,210,000 | | | | 1,373,360 | | |
| | | Par ($) | | Value ($) | |
| TX Houston Area Water Corp. | |
| Series 2002, | |
Pre-refunded 03/01/12,
Insured: FGIC
5.500% 03/01/18 | | | 3,000,000 | | | | 3,305,790 | | |
| TX Lower Colorado River Authority | |
| Junior Lien, | |
Series 1993 5th,
Escrowed to Maturity,
5.375% 01/01/16 | | | 2,100,000 | | | | 2,393,391 | | |
TX North Central Health Facilities
Development Corp. | |
| Presbyterian Healthcare Residential, | |
Series 1996 B,
Escrowed to Maturity,
Insured: NPFGC
5.500% 06/01/16 | | | 10,000,000 | | | | 11,320,300 | | |
| TX Northside Independent School District | |
| Series 2002 A, | |
Pre-refunded 02/15/12,
Guarantor: PSFG
5.250% 02/15/20 | | | 2,485,000 | | | | 2,725,126 | | |
| VA Public School Authority | |
| Series 2001 A, | |
Pre-refunded 08/01/11,
5.000% 08/01/17 | | | 3,500,000 | | | | 3,791,095 | | |
| WI Badger Tobacco Asset Securitization Corp. | |
| Series 2002, | |
Pre-refunded 06/01/12,
6.000% 06/01/17 | | | 5,000,000 | | | | 5,558,200 | | |
| WV Hospital Finance Authority | |
| Charleston Area Medical Center, | |
Series 1993 A,
Escrowed to Maturity,
6.500% 09/01/23 | | | 3,980,000 | | | | 5,021,606 | | |
| Refunded/Escrowed Total | | | 208,303,561 | | |
| Tobacco – 0.8% | |
| AR Development Finance Authority | |
| Tobacco Settlement, | |
Series 2006,
Insured: AMBAC:
(f) 07/01/21 | | | 1,400,000 | | | | 846,328 | | |
| (f) 07/01/23 | | | 1,000,000 | | | | 530,270 | | |
| NJ Tobacco Settlement Financing Corp. | |
| Series 2007 1-A: | |
| 4.500% 06/01/23 | | | 2,540,000 | | | | 2,274,316 | | |
| 4.625% 06/01/26 | | | 6,560,000 | | | | 5,339,577 | | |
See Accompanying Notes to Financial Statements.
46
Columbia Intermediate Municipal Bond Fund
October 31, 2009
| Municipal Bonds (continued) | |
| | | Par ($) | | Value ($) | |
OH Buckeye Tobacco Settlement
Financing Authority | |
| Series 2007 A-2, | |
| 5.125% 06/01/24 | | | 10,745,000 | | | | 9,532,534 | | |
| Tobacco Total | | | 18,523,025 | | |
| Other Total | | | 289,054,147 | | |
| Other Revenue – 0.4% | |
| Recreation – 0.4% | |
| FL Board of Education | |
| Series 2002 A, | |
Insured: FGIC:
5.250% 07/01/18 | | | 2,675,000 | | | | 2,862,517 | | |
| 5.375% 07/01/17 | | | 1,450,000 | | | | 1,568,538 | | |
| FL Seminole Indian Tribe | |
| Series 2007 A, | |
| 5.750% 10/01/22 (h) | | | 2,000,000 | | | | 1,948,400 | | |
| OK Chickasaw Nation Health Systems | |
| Series 2007, | |
| 5.375% 12/01/17 (h) | | | 4,115,000 | | | | 4,334,947 | | |
| Recreation Total | | | 10,714,402 | | |
| Other Revenue Total | | | 10,714,402 | | |
| Resource Recovery – 0.3% | |
| Resource Recovery – 0.3% | |
NY Niagara County Industrial
Development Agency | |
| Series 2001 B, AMT, | |
5.550% 11/15/24
(11/15/13) (a)(c) | | | 8,000,000 | | | | 7,917,520 | | |
| Resource Recovery Total | | | 7,917,520 | | |
| Resource Recovery Total | | | 7,917,520 | | |
| Tax-Backed – 46.8% | |
| Local Appropriated – 2.3% | |
CA Orange County Public Financing
Authority | |
| Series 2005, | |
Insured: NPFGC
5.000% 07/01/16 | | | 10,000,000 | | | | 10,780,000 | | |
| CA San Bernardino County | |
| Certificates of Participation, | |
Series 2002 A,
Insured: NPFGC
5.000% 07/01/15 | | | 1,000,000 | | | | 1,050,220 | | |
| | | Par ($) | | Value ($) | |
| FL Broward County School Board | |
| Certificates of Participation, | |
Series 2006,
Insured: FSA
5.000% 07/01/14 | | | 1,580,000 | | | | 1,725,312 | | |
| FL Flagler County School Board | |
| Certificates of Participation, | |
Series 2005 A,
Insured: FSA
5.000% 08/01/18 | | | 2,320,000 | | | | 2,425,653 | | |
| FL Hillsborough County School Board | |
| Certificates of Participation, | |
Series 1998 A,
Insured: NPFGC
5.500% 07/01/14 | | | 2,000,000 | | | | 2,227,320 | | |
| FL Lake County School Board | |
| Certificates of Participation, | |
Series 2006 C,
Insured: AMBAC
5.250% 06/01/18 | | | 1,500,000 | | | | 1,596,255 | | |
| FL Miami-Dade County Public Facilities | |
| Series 2005 B, | |
Insured: NPFGC
5.000% 06/01/19 | | | 2,000,000 | | | | 2,022,240 | | |
| FL Orange County School Board | |
| Certificates of Participation, | |
Series 2005 A,
Insured: NPFGC
5.000% 08/01/18 | | | 1,000,000 | | | | 1,057,400 | | |
| NC Charlotte | |
| Certificates of Participation, | |
Series 2003 A,
5.000% 06/01/28 | | | 11,890,000 | | | | 12,223,158 | | |
| NC Iredell County | |
| Certificates of Participation, | |
Series 2008,
Insured: FSA
5.250% 06/01/17 | | | 1,710,000 | | | | 1,945,638 | | |
| SC Berkeley County School District | |
| Series 2003, | |
| 5.250% 12/01/18 | | | 1,000,000 | | | | 1,042,480 | | |
SC Charleston Educational Excellence
Financing Corp. | |
| Charleston County School District, | |
Series 2005,
5.250% 12/01/24 | | | 10,000,000 | | | | 10,439,400 | | |
See Accompanying Notes to Financial Statements.
47
Columbia Intermediate Municipal Bond Fund
October 31, 2009
| Municipal Bonds (continued) | |
| | | Par ($) | | Value ($) | |
SC Dorchester County School
District No. 2 | |
| Series 2004, | |
| 5.250% 12/01/17 | | | 2,000,000 | | | | 2,143,600 | | |
| SC Greenville County School District | |
| Series 2005, | |
| 5.500% 12/01/18 | | | 5,000,000 | | | | 5,623,650 | | |
SC Newberry Investing in Children's
Education | |
| Series 2005, | |
| 5.250% 12/01/19 | | | 1,500,000 | | | | 1,512,360 | | |
| Local Appropriated Total | | | 57,814,686 | | |
| Local General Obligations – 11.6% | |
| AK Anchorage | |
| Series 2004 B, | |
Insured: AMBAC
5.250% 12/01/15 | | | 5,000,000 | | | | 5,745,850 | | |
AZ Maricopa County Unified High School
District No. 210 | |
| Series 2003, | |
Insured: NPFGC
5.000% 07/01/15 | | | 6,300,000 | | | | 7,116,858 | | |
| AZ Tucson | |
| Series 1998, | |
| 5.500% 07/01/18 | | | 4,760,000 | | | | 5,528,169 | | |
| CA Los Angeles Unified School District | |
| Series 2007 A-1, | |
Insured: FSA
4.500% 07/01/24 | | | 4,000,000 | | | | 3,936,480 | | |
| Series 2007, | |
Insured: FSA:
5.000% 07/01/20 | | | 6,230,000 | | | | 6,695,132 | | |
| 5.000% 07/01/32 | | | 25,000,000 | | | | 25,380,000 | | |
| CA Manteca Unified School District | |
| Series 2006, | |
Insured: NPFGC
(f) 08/01/24 | | | 5,000,000 | | | | 2,137,200 | | |
| CA Monrovia Unified School District | |
| Series 2005, | |
Insured: NPFGC
5.250% 08/01/21 | | | 5,600,000 | | | | 6,253,688 | | |
| CA Oakland Unified School District | |
| Series 2009, | |
| 6.125% 08/01/29 | | | 8,000,000 | | | | 8,335,920 | | |
| | | Par ($) | | Value ($) | |
CA San Mateo County Community
College | |
| Series 2006 A, | |
Insured: NPFGC
(f) 09/01/20 | | | 9,310,000 | | | | 5,734,122 | | |
| CA Union Elementary School District | |
| Series 1999 A, | |
Insured: NPFGC
(f) 09/01/20 | | | 1,000,000 | | | | 584,780 | | |
CA West Contra Costa Unified School
District | |
| Series 2005, | |
Insured: NPFGC
(f) 08/01/20 | | | 7,285,000 | | | | 3,994,584 | | |
| CO Adams County School District No. 12 | |
| Series 1995 A, | |
Insured: NPFGC
(f) 12/15/12 | | | 1,300,000 | | | | 1,234,701 | | |
CO Jefferson County School
District R-001 | |
| Series 1997 1, | |
Insured: NPFGC
6.500% 12/15/11 | | | 10,000,000 | | | | 11,162,900 | | |
| FL Reedy Creek Improvement District | |
| Series 2004 A, | |
Insured: NPFGC
5.000% 06/01/17 | | | 1,000,000 | | | | 1,033,560 | | |
| IL Chicago Board of Education | |
| Series 1996, | |
Insured: NPFGC
6.250% 12/01/12 | | | 2,100,000 | | | | 2,370,291 | | |
| Series 2005 A, | |
Insured: AMBAC
5.500% 12/01/22 | | | 5,000,000 | | | | 5,456,550 | | |
| IL Chicago | |
| Series 1999, | |
Insured: FGIC
5.250% 01/01/18 | | | 7,540,000 | | | | 8,492,981 | | |
| Series 2004 A, | |
Insured: FSA
5.250% 01/01/17 | | | 1,000,000 | | | | 1,097,400 | | |
IL Kendall & Kane Counties Community
Unit School District No. 115 | |
| Series 2002, | |
Insured: NPFGC
(f) 01/01/17 | | | 3,050,000 | | | | 2,232,478 | | |
See Accompanying Notes to Financial Statements.
48
Columbia Intermediate Municipal Bond Fund
October 31, 2009
| Municipal Bonds (continued) | |
| | | Par ($) | | Value ($) | |
KS Leavenworth County Unified School
District No. 464 | |
| Series 2005 A, | |
Insured: NPFGC
5.000% 09/01/19 | | | 1,030,000 | | | | 1,106,086 | | |
| MI Detroit City School District | |
| Series 2002 A, | |
Insured: FGIC
6.000% 05/01/19 | | | 2,000,000 | | | | 2,185,720 | | |
| Series 2003 B, | |
Insured: FGIC
5.250% 05/01/14 | | | 6,335,000 | | | | 6,705,407 | | |
MN Elk River Independent School
District No. 728 | |
| Series 2001 A, | |
Insured: NPFGC
5.000% 02/01/17 | | | 2,000,000 | | | | 2,092,980 | | |
ND West Fargo Public School
District No. 6 | |
| Series 2002, | |
Insured: NPFGC
5.250% 05/01/17 | | | 3,600,000 | | | | 3,817,044 | | |
| NH Manchester | |
| Series 2004, | |
Insured: NPFGC
5.500% 06/01/19 | | | 4,450,000 | | | | 5,321,132 | | |
| NY New York City | |
| Series 2002 D, | |
| 5.625% 06/01/14 | | | 2,500,000 | | | | 2,705,200 | | |
| Series 2002 G, | |
Insured: NPFGC
5.625% 08/01/13 | | | 2,500,000 | | | | 2,738,300 | | |
| Series 2005 D, | |
| 5.000% 08/01/13 | | | 4,000,000 | | | | 4,411,800 | | |
| Series 2005, | |
| 5.000% 08/01/20 | | | 10,000,000 | | | �� | 10,559,700 | | |
| Series 2007 D-1, | |
| 5.000% 12/01/21 | | | 5,900,000 | | | | 6,267,570 | | |
| Series 2008 B-1, | |
| 5.250% 09/01/22 | | | 7,200,000 | | | | 7,830,432 | | |
| OH Cleveland | |
| Series 2005, | |
Insured: AMBAC
5.500% 10/01/16 | | | 7,710,000 | | | | 8,696,572 | | |
| OH Marion City School District | |
| Series 2000, | |
Insured: FSA
6.500% 12/01/14 | | | 500,000 | | | | 603,740 | | |
| | | Par ($) | | Value ($) | |
| OH Mason City School District | |
| Series 2005, | |
Insured: NPFGC
5.250% 12/01/19 | | | 2,250,000 | | | | 2,589,773 | | |
OR Linn County Community School
District No. 9 Lebanon | |
| Series 2001, | |
Insured: NPFGC
5.250% 06/15/17 | | | 1,120,000 | | | | 1,195,566 | | |
OR Yamhill County School
District No. 29J Newberg | |
| Series 2005, | |
Insured: FGIC
5.500% 06/15/17 | | | 2,500,000 | | | | 2,889,150 | | |
| PA Westmoreland County | |
| Series 1997, | |
Insured: NPFGC
(f) 12/01/18 | | | 1,000,000 | | | | 655,020 | | |
TN Blount County Public Building
Authority | |
| Local Government Public Improvement, | |
Series 2004 B-5-A,
Insured: FGIC
5.000% 06/01/16 | | | 1,075,000 | | | | 1,061,348 | | |
| TN Chattanooga | |
| Series 2005 A, | |
Insured: FSA
5.000% 09/01/14 | | | 4,150,000 | | | | 4,730,502 | | |
| TN Hamilton County | |
| Series 1998 B, | |
| 5.100% 08/01/24 | | | 500,000 | | | | 572,250 | | |
| TN Kingsport | |
| Series 2004, | |
Insured: AMBAC
5.000% 03/01/14 | | | 1,000,000 | | | | 1,108,460 | | |
TN Lawrenceburg Public Building
Authority | |
| Series 2001 B, | |
Insured: FSA
5.500% 07/01/16 | | | 1,330,000 | | | | 1,422,049 | | |
| TN Overton County | |
| Series 2004, | |
Insured: NPFGC
5.000% 04/01/16 | | | 1,000,000 | | | | 1,083,550 | | |
See Accompanying Notes to Financial Statements.
49
Columbia Intermediate Municipal Bond Fund
October 31, 2009
| Municipal Bonds (continued) | |
| | | Par ($) | | Value ($) | |
| TX Aldine Independent School District | |
| Series 2005, | |
Guarantor: PSFG
5.250% 02/15/15 | | | 1,655,000 | | | | 1,848,701 | | |
TX Barbers Hill Independent School
District | |
| Series 2003, | |
Guarantor: PSFG
5.000% 02/15/22 | | | 1,030,000 | | | | 1,101,410 | | |
TX Brownsville Independent School
District | |
| Series 2005, | |
Guarantor: PSFG
5.000% 08/15/15 | | | 1,000,000 | | | | 1,136,290 | | |
TX Brownwood Independent School
District | |
| Series 2005, | |
Insured: NPFGC
5.250% 02/15/17 | | | 1,310,000 | | | | 1,410,805 | | |
| TX Conroe Independent School District | |
| Series 2005 C, | |
Guarantor: PSFG
5.000% 02/15/19 | | | 1,650,000 | | | | 1,792,527 | | |
| TX Corpus Christi | |
| Series 2002, | |
Insured: FSA
5.500% 09/01/15 | | | 1,655,000 | | | | 1,841,519 | | |
| TX Dickinson Independent School District | |
| Series 2006, | |
Guarantor: PSFG
5.000% 02/15/20 | | | 2,405,000 | | | | 2,622,749 | | |
TX Duncanville Independent School
District | |
| Series 2005, | |
Guarantor: PSFG
(f) 02/15/22 | | | 2,000,000 | | | | 1,178,020 | | |
| TX El Paso | |
| Series 2005, | |
Insured: FGIC
5.250% 08/15/14 | | | 2,000,000 | | | | 2,229,140 | | |
| TX Fort Bend Independent School District | |
| Series 2000, | |
Guarantor: PSFG
5.250% 08/15/19 | | | 1,000,000 | | | | 1,028,470 | | |
| | | Par ($) | | Value ($) | |
| TX Harris County Flood Control District | |
| Series 2006, | |
| 4.750% 10/01/29 | | | 12,700,000 | | | | 13,061,442 | | |
| TX Harris County | |
| Series 1997, | |
| 5.125% 08/15/24 | | | 13,500,000 | | | | 15,426,585 | | |
| Series 2001, | |
| 5.000% 10/01/12 | | | 10,990,000 | | | | 11,776,334 | | |
| TX Houston Independent School District | |
| Series 2007, | |
Guarantor: PSFG
4.500% 02/15/25 | | | 5,000,000 | | | | 5,127,550 | | |
| TX Houston | |
| Series 2005 D, | |
Insured: AMBAC
5.000% 03/01/17 | | | 1,000,000 | | | | 1,115,920 | | |
| Series 2005 E, | |
Insured: AMBAC
5.000% 03/01/20 | | | 2,525,000 | | | | 2,695,008 | | |
| TX Irving | |
| Series 2005 A, | |
| 5.000% 11/15/18 | | | 2,000,000 | | | | 2,215,300 | | |
| TX Katy Independent School District | |
| Series 1992, | |
Guarantor: PSFG
(f) 08/15/11 | | | 1,775,000 | | | | 1,744,026 | | |
| TX La Joya Independent School District | |
| Series 2005, | |
Guarantor: PSFG
5.000% 02/15/20 | | | 1,000,000 | | | | 1,077,390 | | |
TX La Marque Independent School
District | |
| Series 2003, | |
Guarantor: PSFG
5.000% 02/15/21 | | | 1,740,000 | | | | 1,878,869 | | |
| TX Laredo | |
| Series 2005, | |
Insured: AMBAC
5.000% 08/15/20 | | | 1,065,000 | | | | 1,132,872 | | |
TX San Antonio Independent School
District | |
| Series 2001 B, | |
Guarantor: PSFG
(f) 08/15/11 | | | 3,500,000 | | | | 3,438,925 | | |
See Accompanying Notes to Financial Statements.
50
Columbia Intermediate Municipal Bond Fund
October 31, 2009
| Municipal Bonds (continued) | |
| | | Par ($) | | Value ($) | |
TX San Benito Consolidated Independent
School District | |
| Series 2005, | |
Guarantor: PSFG
5.000% 02/15/16 | | | 2,260,000 | | | | 2,515,222 | | |
| TX Sherman Independent School District | |
| Series 2005 A, | |
Guarantor: PSFG
5.000% 02/15/16 | | | 1,000,000 | | | | 1,112,930 | | |
| TX Webb County | |
| Series 2005, | |
Insured: AMBAC
5.000% 02/01/17 | | | 1,600,000 | | | | 1,725,952 | | |
| TX West University Place | |
| Series 2002, | |
| 5.500% 02/01/15 | | | 1,440,000 | | | | 1,572,970 | | |
TX White Settlement Independent
School District | |
| Series 2003, | |
Guarantor: PSFG
5.375% 08/15/19 | | | 1,910,000 | | | | 2,096,492 | | |
| TX Williamson County | |
| Series 2005, | |
Insured: NPFGC
5.000% 02/15/16 | | | 1,985,000 | | | | 2,192,452 | | |
| WA Clark County School District No. 37 | |
| Series 2001 C, | |
Insured: FGIC
(f) 12/01/16 | | | 1,000,000 | | | | 789,740 | | |
| WI Milwaukee County | |
| Series 2001 A: | |
5.000% 10/01/12 2,500,000 2,682,425
5.000% 10/01/13 | | | 2,500,000 | | | | 2,678,875 | | |
| Local General Obligations Total | | | 291,119,905 | | |
| Special Non-Property Tax – 10.7% | |
| CA Economic Recovery | |
| Series 2004 A, | |
Insured: NPFGC
5.000% 07/01/15 | | | 5,000,000 | | | | 5,322,500 | | |
| Series 2009 A, | |
| 5.000% 07/01/20 (b) | | | 12,500,000 | | | | 12,984,500 | | |
CA Los Angeles County Metropolitan
Transportation Authority | |
| Series 2003 A, | |
Insured: FSA:
5.000% 07/01/17 | | | 6,280,000 | | | | 6,798,728 | | |
| 5.000% 07/01/18 | | | 7,700,000 | | | | 8,204,966 | | |
| | | Par ($) | | Value ($) | |
| CO Department of Transportation | |
| Series 2002 B, | |
Insured: NPFGC:
5.500% 06/15/14 | | | 3,000,000 | | | | 3,445,680 | | |
| 5.500% 06/15/15 | | | 1,000,000 | | | | 1,155,570 | | |
FL Broward County Professional Sports
Facilities | |
| Series 2006 A, | |
Insured: AMBAC
5.000% 09/01/18 | | | 2,500,000 | | | | 2,606,625 | | |
| FL Division Bond Finance Department | |
| Series 1998, | |
Insured: FSA
6.000% 07/01/13 | | | 10,000,000 | | | | 11,385,300 | | |
FL Hillsborough County Industrial
Development Authority | |
| Series 2002 B, | |
Insured: AMBAC
5.500% 09/01/15 | | | 2,335,000 | | | | 2,577,560 | | |
FL Hurricane Catastrophe Fund
Finance Corp. | |
| Series 2006 A, | |
| 5.250% 07/01/12 | | | 12,000,000 | | | | 12,896,520 | | |
| Series 2008 A, | |
| 5.000% 07/01/14 | | | 15,000,000 | | | | 16,148,250 | | |
FL Jacksonville Guaranteed Entitlement
Improvement | |
| Series 2002, | |
Insured: FGIC:
5.375% 10/01/18 | | | 3,450,000 | | | | 3,596,487 | | |
| 5.375% 10/01/19 | | | 3,720,000 | | | | 3,865,526 | | |
| FL Jacksonville Sales Tax | |
| Series 2001, | |
Insured: FGIC
5.500% 10/01/12 | | | 2,000,000 | | | | 2,218,560 | | |
| Series 2002, | |
Insured: FGIC
5.375% 10/01/18 | | | 1,000,000 | | | | 1,073,920 | | |
| Series 2003, | |
Insured: NPFGC
5.250% 10/01/19 | | | 1,080,000 | | | | 1,134,605 | | |
| FL Miami-Dade County Transit Sales Tax | |
| Series 2006, | |
Insured: SYNC
5.000% 07/01/19 | | | 5,040,000 | | | | 5,285,599 | | |
See Accompanying Notes to Financial Statements.
51
Columbia Intermediate Municipal Bond Fund
October 31, 2009
| Municipal Bonds (continued) | |
| | | Par ($) | | Value ($) | |
FL Osceola County Tourist
Development Tax | |
| Series 2002 A, | |
Insured: FGIC
5.500% 10/01/14 | | | 1,555,000 | | | | 1,673,911 | | |
FL Palm Beach County Public
Improvement | |
| Series 2004, | |
| 5.000% 08/01/17 | | | 1,000,000 | | | | 1,089,470 | | |
| FL Tampa Sports Authority | |
| Series 1995, | |
Insured: NPFGC:
5.750% 10/01/15 | | | 2,500,000 | | | | 2,622,475 | | |
| 5.750% 10/01/20 | | | 1,000,000 | | | | 1,057,900 | | |
| IL Dedicated Tax Capital Appreciation | |
| Series 1990, | |
Insured: AMBAC
(f) 12/15/17 | | | 2,540,000 | | | | 1,852,143 | | |
| IL State | |
| Series 2002, | |
Insured: FGIC
5.500% 06/15/15 | | | 1,000,000 | | | | 1,144,280 | | |
| KS Wyandotte County Unified Government | |
| Series 2005 B: | |
| 4.750% 12/01/16 | | | 1,665,000 | | | | 1,705,593 | | |
| 5.000% 12/01/20 | | | 7,500,000 | | | | 7,570,125 | | |
| MA State | |
| Series 2005 A, | |
Insured: FSA
5.500% 06/01/16 | | | 13,615,000 | | | | 15,760,179 | | |
| MD Department of Transportation | |
| Series 2002, | |
| 5.500% 02/01/15 | | | 3,750,000 | | | | 4,340,400 | | |
| MI Trunk Line | |
| Series 1998 A, | |
| 5.500% 11/01/16 | | | 2,000,000 | | | | 2,242,700 | | |
| Series 2005, | |
Insured: FSA
5.250% 11/01/17 | | | 5,050,000 | | | | 5,669,685 | | |
| NJ Economic Development Authority | |
| Series 2004: | |
5.375% 06/15/15 4,000,000 4,064,680
5.500% 06/15/16 | | | 5,500,000 | | | | 5,567,485 | | |
| NM Bernalillo County | |
| Series 1998, | |
| 5.250% 04/01/27 | | | 3,000,000 | | | | 3,293,430 | | |
| | | Par ($) | | Value ($) | |
| NM Dona Ana County | |
| Series 1998, | |
Insured: AMBAC
5.500% 06/01/16 | | | 750,000 | | | | 800,670 | | |
NV Sparks Tourism Improvement
District No. 1 | |
| Series 2008 A, | |
| 6.500% 06/15/20 (h) | | | 5,000,000 | | | | 4,894,800 | | |
| NY Metropolitan Transportation Authority | |
| Series 2004 A, | |
Insured: FGIC:
5.250% 11/15/16 3,000,000 3,386,160
5.250% 11/15/17 | | | 4,000,000 | | | | 4,516,200 | | |
NY Nassau County Interim Finance
Authority | |
| Series 2003 B, | |
Insured: AMBAC
5.000% 11/15/14 | | | 5,720,000 | | | | 6,396,733 | | |
NY New York City Transitional Finance
Authority | |
| Series 1998 A, | |
| 5.500% 11/15/16 | | | 1,330,000 | | | | 1,484,772 | | |
| Series 2002 A, | |
5.500% 11/01/26
(14.000% 11/01/11) (i) | | | 10,000,000 | | | | 10,754,000 | | |
| Series 2004 C, | |
| 5.250% 02/01/18 | | | 3,500,000 | | | | 3,886,505 | | |
| Series 2007 C-1, | |
| 5.000% 11/01/20 | | | 10,300,000 | | | | 11,318,979 | | |
| Series 2009 A, | |
| 5.000% 05/01/27 | | | 10,430,000 | | | | 11,154,155 | | |
| NY Urban Development Corp. | |
| Series 2004 A, | |
Insured: NPFGC
5.500% 03/15/20 | | | 29,450,000 | | | | 34,274,204 | | |
| PA Pittsburgh & Allegheny County | |
| Series 1999, | |
Insured: AMBAC
5.250% 02/01/12 | | | 500,000 | | | | 505,770 | | |
PR Commonwealth of Puerto Rico
Highway & Transportation Authority | |
| Series 2005 L, | |
Insured: CIFG
5.250% 07/01/18 | | | 2,000,000 | | | | 2,161,720 | | |
See Accompanying Notes to Financial Statements.
52
Columbia Intermediate Municipal Bond Fund
October 31, 2009
| Municipal Bonds (continued) | |
| | | Par ($) | | Value ($) | |
TX Corpus Christi Business & Job
Development Corp. | |
| Series 2002, | |
Insured: AMBAC:
5.500% 09/01/14 | | | 2,065,000 | | | | 2,283,023 | | |
| 5.500% 09/01/18 | | | 1,250,000 | | | | 1,332,613 | | |
| TX Harris County | |
| Series 2004 B, | |
Insured: FSA
5.000% 08/15/32
(08/15/12) (a)(c) | | | 2,000,000 | | | | 2,174,920 | | |
| TX Houston Hotel Occupancy | |
| Series 2001 B, | |
Insured: AMBAC:
(f) 09/01/17 | | | 2,000,000 | | | | 1,369,360 | | |
| 5.250% 09/01/19 | | | 1,195,000 | | | | 1,216,187 | | |
| 5.250% 09/01/20 | | | 1,265,000 | | | | 1,283,532 | | |
VA Peninsula Town Center Community
Development Authority | |
| Series 2007, | |
| 6.250% 09/01/24 | | | 2,375,000 | | | | 2,092,423 | | |
| Special Non-Property Tax Total | | | 267,642,078 | | |
| Special Property Tax – 1.2% | |
FL Ave Maria Stewardship Community
Development District | |
| Series 2006, | |
| 4.800% 11/01/12 | | | 1,000,000 | | | | 780,400 | | |
FL Oakmont Grove Community
Development District | |
| Series 2007 B, | |
| 5.250% 05/01/12 (d) | | | 2,000,000 | | | | 1,036,640 | | |
FL Parker Road Community Development
District | |
| Series 2007 B, | |
| 5.350% 05/01/15 | | | 2,000,000 | | | | 1,263,420 | | |
FL Six Mile Creek Community
Development District | |
| Series 2007: | |
| 5.500% 05/01/17 | | | 1,865,000 | | | | 1,024,575 | | |
| 5.650% 05/01/22 | | | 3,000,000 | | | | 1,432,920 | | |
FL Sweetwater Creek Community
Development District | |
| Series 2007 B-1, | |
| 5.300% 05/01/17 | | | 4,445,000 | | | | 2,983,262 | | |
| Series 2007 B-2, | |
| 5.125% 05/01/13 | | | 2,625,000 | | | | 1,805,396 | | |
| | | Par ($) | | Value ($) | |
FL Tolomato Community Development
District | |
| Series 2007, | |
| 6.450% 05/01/23 | | | 7,500,000 | | | | 5,997,975 | | |
FL Viera East Community Development
District | |
| Series 2006, | |
Insured: NPFGC
5.750% 05/01/19 | | | 1,910,000 | | | | 2,060,317 | | |
FL Waterset North Community
Development District | |
| Series 2007 B, | |
| 6.550% 11/01/15 | | | 10,000,000 | | | | 6,097,200 | | |
FL West Palm Beach Community
Redevelopment | |
| Series 2005 A, | |
| 5.000% 03/01/25 | | | 980,000 | | | | 959,391 | | |
| MO Fenton | |
| Tax Increment Revenue, | |
Series 2006,
4.500% 04/01/21 | | | 1,095,000 | | | | 1,044,367 | | |
| NV Las Vegas Redevelopment Agency | |
| Sub Lien-Fremont Street, | |
Series 2003 A,
5.000% 06/15/13 | | | 3,685,000 | | | | 3,876,620 | | |
| Special Property Tax Total | | | 30,362,483 | | |
| State Appropriated – 8.0% | |
| AL Public School & College Authority | |
| Series 2009 A, | |
| 5.000% 05/01/19 | | | 10,000,000 | | | | 10,861,500 | | |
| AZ School Facilities Board | |
| Series 2008, | |
| 5.500% 09/01/15 | | | 7,500,000 | | | | 8,463,675 | | |
| CA Public Works Board | |
| Department of Mental Health, | |
Coalinga State Hospital,
Series 2004 A,
5.500% 06/01/19 | | | 2,000,000 | | | | 2,071,980 | | |
| Series 2003 C, | |
| 5.500% 06/01/18 | | | 1,500,000 | | | | 1,533,615 | | |
| Series 2006 F, | |
Insured: FGIC
5.250% 11/01/18 | | | 4,000,000 | | | | 4,102,400 | | |
See Accompanying Notes to Financial Statements.
53
Columbia Intermediate Municipal Bond Fund
October 31, 2009
| Municipal Bonds (continued) | |
| | | Par ($) | | Value ($) | |
FL Department Management Services
Division | |
| Series 2003 A, | |
Insured: FSA
5.250% 09/01/15 | | | 1,515,000 | | | | 1,692,149 | | |
| Series 2005 A, | |
Insured: AMBAC
5.000% 09/01/21 | | | 3,000,000 | | | | 3,176,430 | | |
| MI Building Authority | |
| Series 2003, | |
Insured: FSA
5.250% 10/15/14 | | | 10,000,000 | | | | 10,807,400 | | |
| NJ Economic Development Authority | |
| Series 2005 K, | |
Insured: AMBAC
5.500% 12/15/19 | | | 2,500,000 | | | | 2,862,025 | | |
| NJ Transit Corp. | |
| Certificates of Participation, | |
Series 2002 A,
Insured: AMBAC
5.500% 09/15/15 | | | 6,725,000 | | | | 7,481,697 | | |
| NJ Transportation Trust Fund Authority | |
| Series 2001 C, | |
Insured: FSA
5.500% 12/15/18 | | | 2,000,000 | | | | 2,275,880 | | |
| Series 2003 A, | |
Insured: AMBAC
5.500% 12/15/15 | | | 3,260,000 | | | | 3,696,612 | | |
| Series 2006 A, | |
Insured: FSA:
5.250% 12/15/22 | | | 4,000,000 | | | | 4,404,120 | | |
| 5.500% 12/15/21 | | | 4,700,000 | | | | 5,300,942 | | |
| NY Dormitory Authority | |
| Series 1993 A: | |
| 5.250% 05/15/15 | | | 5,850,000 | | | | 6,447,460 | | |
Insured: FSA
5.250% 05/15/15 | | | 4,000,000 | | | | 4,408,520 | | |
| Series 1993 B, | |
Insured: FSA
5.250% 05/15/11 | | | 10,000,000 | | | | 10,663,000 | | |
| Series 1995 A: | |
Insured: AMBAC
5.625% 07/01/16 | | | 1,250,000 | | | | 1,365,137 | | |
Insured: FGIC
5.625% 07/01/16 | | | 5,000,000 | | | | 5,446,850 | | |
Insured: FSA
5.625% 07/01/16 | | | 500,000 | | | | 546,025 | | |
| | | Par ($) | | Value ($) | |
| Series 2005 A: | |
Insured: AMBAC
5.250% 05/15/18 | | | 6,000,000 | | | | 6,548,040 | | |
Insured: FGIC:
5.500% 05/15/17 | | | 10,000,000 | | | | 11,307,000 | | |
| 5.500% 05/15/22 | | | 6,730,000 | | | | 7,429,382 | | |
| Series 2009 A, | |
| 5.000% 07/01/24 | | | 3,500,000 | | | | 3,697,645 | | |
| NY Tollway Authority | |
| Series 2002, | |
| 5.500% 04/01/13 | | | 4,510,000 | | | | 4,893,756 | | |
| NY Urban Development Corp. | |
| Series 2008 B: | |
| 5.000% 01/01/19 | | | 4,000,000 | | | | 4,323,880 | | |
| 5.000% 01/01/20 | | | 10,460,000 | | | | 11,235,191 | | |
PR Commonwealth of Puerto Rico Public
Finance Corp. | |
| Series 2004 A: | |
Insured: AMBAC
5.250% 08/01/30
(02/01/12) (a)(c) | | | 4,240,000 | | | | 4,327,641 | | |
LOC: Government Development Bank
for Puerto Rico
5.750% 08/01/27
(02/01/12) (a)(c) | | | 4,175,000 | | | | 4,305,427 | | |
| UT Building Ownership Authority | |
| Series 1998, | |
Insured: FSA
5.500% 05/15/14 | | | 5,000,000 | | | | 5,722,450 | | |
| VA Public School Authority | |
| Series 2005 B, | |
| 5.250% 08/01/16 | | | 13,995,000 | | | | 16,210,128 | | |
| Series 2005, | |
| 5.000% 08/01/16 | | | 6,285,000 | | | | 7,060,192 | | |
| WI State | |
| Series 2009 A, | |
| 5.125% 05/01/23 | | | 14,000,000 | | | | 15,051,540 | | |
| State Appropriated Total | | | 199,719,689 | | |
| State General Obligations – 13.0% | |
| CA State | |
| Series 2002, | |
Insured: AMBAC
6.000% 02/01/18 | | | 5,000,000 | | | | 5,555,900 | | |
| Series 2003, | |
| 5.250% 11/01/18 | | | 1,000,000 | | | | 1,050,640 | | |
| Series 2004, | |
| 5.000% 02/01/20 | | | 750,000 | | | | 760,605 | | |
| Series 2007, | |
| 4.500% 08/01/26 | | | 11,500,000 | | | | 10,652,335 | | |
See Accompanying Notes to Financial Statements.
54
Columbia Intermediate Municipal Bond Fund
October 31, 2009
| Municipal Bonds (continued) | |
| | | Par ($) | | Value ($) | |
| Series 2009, | |
| 5.250% 10/01/22 | | | 25,000,000 | | | | 25,739,250 | | |
| FL Board of Education | |
| Series 2005 B, | |
| 5.000% 01/01/14 | | | 17,395,000 | | | | 19,390,902 | | |
| Series 2005 C, | |
| 5.000% 06/01/13 | | | 11,830,000 | | | | 13,159,219 | | |
| FL Department of Transportation | |
| Series 2002, | |
| 5.250% 07/01/13 | | | 7,290,000 | | | | 8,021,989 | | |
| FL State | |
| Series 2004 A, | |
| 5.000% 07/01/30 | | | 1,000,000 | | | | 1,031,280 | | |
| HI State | |
| Series 2002 CY, | |
Insured: FSA
5.500% 02/01/12 | | | 10,000,000 | | | | 10,984,400 | | |
| Series 2008 DK, | |
| 5.000% 05/01/22 | | | 10,750,000 | | | | 11,827,365 | | |
| MA Bay Transportation Authority | |
| Series 1991 A, | |
Insured: NPFGC
7.000% 03/01/21 | | | 5,750,000 | | | | 6,934,442 | | |
| MA State | |
| Series 1998 C, | |
| 5.250% 08/01/17 | | | 1,775,000 | | | | 2,042,457 | | |
| Series 2002 C, | |
| 5.500% 11/01/17 | | | 10,000,000 | | | | 11,691,800 | | |
| Series 2002 D, | |
Insured: AMBAC
5.500% 08/01/18 | | | 6,500,000 | | | | 7,607,080 | | |
| Series 2003 D, | |
| 5.500% 10/01/17 | | | 5,000,000 | | | | 5,842,550 | | |
| Series 2004 A, | |
| 5.250% 08/01/13 | | | 11,605,000 | | | | 13,129,317 | | |
| Series 2004 C, | |
Insured: FSA
5.500% 12/01/16 | | | 10,000,000 | | | | 11,627,200 | | |
| Series 2006, | |
| 5.000% 11/01/25 | | | 18,000,000 | | | | 20,340,540 | | |
| Series 2007 A, | |
0.874% 11/01/25
(11/01/09) (a)(c) | | | 10,000,000 | | | | 8,445,000 | | |
| MI State | |
| Series 2001, | |
| 5.500% 12/01/15 | | | 1,250,000 | | | | 1,396,313 | | |
| | | Par ($) | | Value ($) | |
| MS State | |
| Series 2002 A, | |
| 5.500% 12/01/14 | | | 3,000,000 | | | | 3,486,570 | | |
| NJ State | |
| Series 2001 H, | |
| 5.250% 07/01/14 | | | 5,000,000 | | | | 5,694,500 | | |
| OH State | |
| Series 2009 C, | |
| 5.000% 09/15/17 | | | 20,000,000 | | | | 22,584,400 | | |
| PA State | |
| Series 2002, | |
| 5.500% 02/01/15 | | | 3,000,000 | | | | 3,461,100 | | |
| Series 2004: | |
Insured: FSA
5.375% 07/01/18 | | | 12,000,000 | | | | 14,061,000 | | |
Insured: NPFGC
5.375% 07/01/16 | | | 10,000,000 | | | | 11,615,700 | | |
| Series 2005, | |
| 5.000% 01/01/15 | | | 5,500,000 | | | | 6,211,150 | | |
| PR Commonwealth of Puerto Rico | |
| Series 1997, | |
Insured: NPFGC
6.500% 07/01/15 | | | 4,190,000 | | | | 4,651,319 | | |
| Series 2001 A, | |
| 5.500% 07/01/13 | | | 6,395,000 | | | | 6,807,925 | | |
| Series 2006 B, | |
| 5.250% 07/01/16 | | | 5,000,000 | | | | 5,238,600 | | |
| TX State | |
| Series 2008, | |
| 5.000% 04/01/19 | | | 11,935,000 | | | | 13,441,794 | | |
| WA State | |
| Series 2002, | |
Insured: NPFGC
5.000% 01/01/18 | | | 10,000,000 | | | | 10,737,500 | | |
| Series 2009, | |
| 5.000% 08/01/26 | | | 18,270,000 | | | | 19,778,371 | | |
| State General Obligations Total | | | 325,000,513 | | |
| Tax-Backed Total | | | 1,171,659,354 | | |
| Transportation – 7.7% | |
| Air Transportation – 0.1% | |
TN Memphis Shelby County Airport
Authority | |
| FedEx Corp., | |
Series 1997,
5.350% 09/01/12 | | | 3,530,000 | | | | 3,645,078 | | |
| Air Transportation Total | | | 3,645,078 | | |
See Accompanying Notes to Financial Statements.
55
Columbia Intermediate Municipal Bond Fund
October 31, 2009
| Municipal Bonds (continued) | |
| | | Par ($) | | Value ($) | |
| Airports – 2.0% | |
| DC Metropolitan WA Airports Authority | |
| Series 2009 C, | |
| 5.250% 10/01/25 | | | 8,920,000 | | | | 9,562,418 | | |
| FL Greater Orlando Aviation Authority | |
| Series 2003 A, | |
Insured: FSA
5.000% 10/01/13 | | | 1,500,000 | | | | 1,661,040 | | |
| IL Chicago O'Hare International Airport | |
| Series 2005, | |
Insured: NPFGC
5.250% 01/01/17 | | | 10,000,000 | | | | 11,060,600 | | |
| MA Port Authority | |
| Series 2007 D, | |
Insured: FSA
5.000% 07/01/17 | | | 8,000,000 | | | | 8,954,800 | | |
| MO St. Louis Airport Revenue | |
| Series 2007, | |
Insured: FSA
5.000% 07/01/21 | | | 12,150,000 | | | | 12,720,200 | | |
| TX Houston Airport Systems | |
| Sub-Lien, | |
Series 2002,
Insured: FSA
5.000% 07/01/27 | | | 5,000,000 | | | | 5,043,150 | | |
| Airports Total | | | 49,002,208 | | |
| Toll Facilities – 4.4% | |
CA San Joaquin Hills Transportation
Corridor Agency | |
| Series 1997 A, | |
Insured: NPFGC
(f) 01/15/12 | | | 7,600,000 | | | | 6,655,776 | | |
| CO E-470 Public Highway Authority | |
| Series 1997 B, | |
Insured: NPFGC
(f) 09/01/12 | | | 10,000,000 | | | | 8,892,000 | | |
| Series 2000, | |
Insured: NPFGC
(f) 09/01/18 | | | 1,500,000 | | | | 884,115 | | |
| DC Metropolitan WA Airports Authority | |
| Series 2009, | |
| Insured: AGO: | |
| (f) 10/01/24 | | | 20,980,000 | | | | 8,955,733 | | |
| (f) 10/01/25 | | | 7,500,000 | | | | 2,999,700 | | |
| (f) 10/01/26 | | | 5,000,000 | | | | 1,838,950 | | |
| | | Par ($) | | Value ($) | |
| GA Road & Tollway Authority | |
| Series 2009 A, | |
| 5.000% 06/01/19 | | | 10,000,000 | | | | 11,244,400 | | |
| IL Toll Highway Authority | |
| Series 2006 A-1, | |
Insured: FSA
5.000% 01/01/18 | | | 2,000,000 | | | | 2,194,440 | | |
| KS Turnpike Authority | |
| Series 2002, | |
Insured: FSA:
5.250% 09/01/15 1,855,000 2,140,485
5.250% 09/01/16 | | | 1,230,000 | | | | 1,424,217 | | |
| NY Thruway Authority | |
Second General Highway & Bridge Trust
Fund: | | | |
Series 2003 A,
Insured: NPFGC
5.250% 04/01/12 | | | 2,145,000 | | | | 2,344,249 | | |
Series 2005 B,
Insured: AMBAC
5.500% 04/01/20 | | | 10,840,000 | | | | 12,456,352 | | |
| Series 2007 B, | |
| 5.000% 04/01/19 | | | 5,000,000 | | | | 5,451,500 | | |
| NY Triborough Bridge & Tunnel Authority | |
| Series 2008 B-1, | |
5.000% 11/15/25
(11/15/13) (a)(c) | | | 5,000,000 | | | | 5,487,750 | | |
| Series 2008 D, | |
| 5.000% 11/15/22 | | | 10,000,000 | | | | 10,804,300 | | |
| OH Turnpike Commission | |
| Series 1998 A, | |
Insured: FGIC
5.500% 02/15/21 | | | 2,000,000 | | | | 2,327,880 | | |
| TX North Tollway Authority | |
| First Tier: | |
Series 2008 A,
6.000% 01/01/22 | | | 14,000,000 | | | | 15,093,820 | | |
Series 2008 E-3,
5.750% 01/01/38 (a) | | | 8,650,000 | | | | 9,168,913 | | |
| Toll Facilities Total | | | 110,364,580 | | |
| Transportation – 1.2% | |
| FL Osceola County Transportation | |
| Series 2004, | |
Insured: NPFGC
5.000% 04/01/18 | | | 1,000,000 | | | | 1,031,520 | | |
| IL Chicago Transit Authority | |
Series 2008 A,
5.000% 06/01/16 | | | 2,500,000 | | | | 2,747,500 | | |
See Accompanying Notes to Financial Statements.
56
Columbia Intermediate Municipal Bond Fund
October 31, 2009
| Municipal Bonds (continued) | |
| | | Par ($) | | Value ($) | |
| IN Transportation Finance Authority | |
| Series 2000, | |
| 5.750% 12/01/14 | | | 2,485,000 | | | | 2,615,885 | | |
| KS Department of Transportation | |
| Series 2004 A, | |
| 5.500% 03/01/18 | | | 11,775,000 | | | | 13,916,166 | | |
| NY Metropolitan Transportation Authority | |
| Series 2007 A, | |
Insured: FSA:
5.000% 11/15/20 | | | 5,000,000 | | | | 5,326,350 | | |
| 5.000% 11/15/21 | | | 3,000,000 | | | | 3,172,590 | | |
| Transportation Total | | | 28,810,011 | | |
| Transportation Total | | | 191,821,877 | | |
| Utilities – 16.5% | |
| Independent Power Producers – 0.3% | |
| CA Sacramento Power Authority | |
| Series 2005, | |
Insured: AMBAC
5.250% 07/01/14 | | | 6,680,000 | | | | 7,416,136 | | |
| Independent Power Producers Total | | | 7,416,136 | | |
| Investor Owned – 2.7% | |
| AR Independence County | |
| Entergy Mississippi, Inc., | |
Series 1999,
Insured: AMBAC
4.900% 07/01/22 | | | 4,600,000 | | | | 4,582,520 | | |
AZ Maricopa County Pollution
Control Corp. | |
| Arizona Public Service Co., | |
Series 2009 D,
6.000% 05/01/29
(05/01/14) (a)(c) | | | 10,000,000 | | | | 10,356,800 | | |
| CO Adams County Pollution Control | |
| Public Service Co., | |
Series 2005 A,
Insured: NPFGC
4.375% 09/01/17 | | | 11,550,000 | | | | 11,006,688 | | |
FL Hillsborough County Industrial
Development Authority | |
| Tampa Electric Co., | |
Series 2007 B,
5.150% 09/01/25 (a) | | | 2,000,000 | | | | 2,075,160 | | |
| IN Finance Authority | |
| Indianapolis Power & Light Co., | |
Series 2009 B,
4.900% 01/01/16 | | | 11,000,000 | | | | 11,365,750 | | |
| | | Par ($) | | Value ($) | |
| NH Business Finance Authority | |
| Series 2001 C, | |
Insured: NPFGC
5.450% 05/01/21 | | | 1,500,000 | | | | 1,522,260 | | |
| TX Brazos River Authority | |
| TXU Energy Co., LLC: | |
Series 2001 C, AMT,
5.750% 05/01/36
(11/01/11) (a)(c) | | | 3,000,000 | | | | 2,713,680 | | |
Series 2003 D,
5.400% 10/01/29 (a) | | | 6,100,000 | | | | 4,635,939 | | |
| TX Sabine River Authority | |
| TXU Energy Co., LLC: | |
Series 2001 A,
5.500% 05/01/22
(11/01/11) (a)(c) | | | 9,265,000 | | | | 8,384,269 | | |
Series 2001 B, AMT,
5.750% 05/01/30
(11/01/11) (a)(c) | | | 2,995,000 | | | | 2,709,157 | | |
| WV Economic Development Authority | |
| Pollution Control Revenue, | |
Appalachian Power,
Series 2008 C,
4.850% 05/01/19
(09/04/13) (a)(c) | | | 6,500,000 | | | | 6,756,295 | | |
| Investor Owned Total | | | 66,108,518 | | |
| Joint Power Authority – 2.9% | |
| FL Municipal Power Agency | |
| Series 2002, | |
Insured: AMBAC
5.500% 10/01/21 | | | 1,850,000 | | | | 1,975,097 | | |
| GA Municipal Electric Authority | |
| Series 1998 Y, | |
Insured: AMBAC
6.400% 01/01/13 | | | 4,205,000 | | | | 4,593,374 | | |
| MI Public Power Agency | |
| Series 2002 A, | |
Insured: NPFGC
5.250% 01/01/16 | | | 1,000,000 | | | | 1,116,870 | | |
| NC Eastern Municipal Power Agency | |
| Series 2008 A, | |
Insured: AGO
5.250% 01/01/19 | | | 5,415,000 | | | | 5,870,672 | | |
| Series 2009 B, | |
| 5.000% 01/01/26 | | | 20,000,000 | | | | 20,366,800 | | |
| TX Sam Rayburn Municipal Power Agency | |
| Series 2002: | |
| 5.500% 10/01/11 | | | 8,355,000 | | | | 8,808,844 | | |
| 6.000% 10/01/16 | | | 3,000,000 | | | | 3,135,900 | | |
See Accompanying Notes to Financial Statements.
57
Columbia Intermediate Municipal Bond Fund
October 31, 2009
| Municipal Bonds (continued) | |
| | | Par ($) | | Value ($) | |
| UT Intermountain Power Agency | |
| Series 2007, | |
| 5.000% 07/01/17 | | | 15,000,000 | | | | 16,586,250 | | |
| WA Energy Northwest Electric | |
| Series 2002 A, | |
Insured: NPFGC
5.500% 07/01/16 | | | 4,675,000 | | | | 5,094,301 | | |
| WI Sheboygan Pollution Control | |
| Wisconsin Power, | |
Series 2008,
Insured: FGIC
5.000% 09/01/15 | | | 5,000,000 | | | | 5,429,150 | | |
| Joint Power Authority Total | | | 72,977,258 | | |
| Municipal Electric – 4.0% | |
| CA Department of Water Resources | |
| Series 2002 A: | |
| 5.500% 05/01/11 | | | 10,000,000 | | | | 10,625,700 | | |
| 6.000% 05/01/13 | | | 2,000,000 | | | | 2,218,060 | | |
Insured: AMBAC
5.500% 05/01/14 | | | 6,000,000 | | | | 6,517,980 | | |
| Series 2008 H, | |
| 5.000% 05/01/21 | | | 12,500,000 | | | | 13,381,375 | | |
CA Los Angeles Department of Water &
Power | |
| Series 2006 A, | |
Insured: NPFGC
5.000% 07/01/13 | | | 10,000,000 | | | | 11,157,500 | | |
| FL Gainesville Utilities Systems | |
| Series 1992 B, | |
| 6.500% 10/01/11 | | | 3,000,000 | | | | 3,302,880 | | |
FL JEA St. John's River Power Park
Systems | |
| Series 1997, | |
Insured: NPFGC
5.000% 10/01/19 | | | 1,000,000 | | | | 1,044,890 | | |
FL Kissimmee Utilities Authority
Electrical System | |
| Series 2003, | |
Insured: FSA
5.250% 10/01/15 | | | 2,235,000 | | | | 2,431,680 | | |
FL Orlando Utilities Commission Utility
Systems | |
| Series 2005 B, | |
| 5.000% 10/01/24 | | | 3,000,000 | | | | 3,146,160 | | |
| OH American Municipal Power, Inc. | |
| Series 2008: | |
5.250% 02/15/20 4,060,000 4,430,150
5.250% 02/15/22 | | | 4,810,000 | | | | 5,171,760 | | |
| | | Par ($) | | Value ($) | |
PR Commonwealth of Puerto Rico
Electric Power Authority | |
| Series 1997 BB, | |
Insured: NPFGC
6.000% 07/01/12 | | | 3,000,000 | | | | 3,257,250 | | |
| Series 2002 KK, | |
Insured: FSA
5.500% 07/01/15 | | | 10,000,000 | | | | 11,014,500 | | |
TN Metropolitan Government Nashville &
Davidson County | |
| Series 1998 B, | |
| 5.500% 05/15/13 | | | 3,000,000 | | | | 3,396,720 | | |
| TX Austin | |
| Series 2002 A, | |
Insured: AMBAC
5.500% 11/15/13 | | | 2,000,000 | | | | 2,245,140 | | |
| Series 2002, | |
Insured: FSA
5.500% 11/15/12 | | | 2,410,000 | | | | 2,694,043 | | |
| Subordinated Lien, | |
Series 1998,
Insured: NPFGC
5.250% 05/15/18 | | | 1,100,000 | | | | 1,213,872 | | |
| TX San Antonio Electric & Gas | |
| Series 2002, | |
| 5.375% 02/01/14 | | | 2,500,000 | | | | 2,831,675 | | |
| Series 2005, | |
| 5.000% 02/01/18 | | | 10,000,000 | | | | 10,813,200 | | |
| Municipal Electric Total | | | 100,894,535 | | |
| Water & Sewer – 6.6% | |
| CA Citrus Heights Water District | |
| Series 2000, | |
Insured: FGIC
5.250% 10/01/20 | | | 1,800,000 | | | | 1,816,758 | | |
| CA Fresno Sewer Revenue | |
| Series 1993 A-1, | |
Insured: AMBAC
5.250% 09/01/19 | | | 5,000,000 | | | | 5,439,150 | | |
| CA Pico Rivera Water Authority | |
| Series 1999 A, | |
Insured: NPFGC
5.500% 05/01/29 | | | 3,000,000 | | | | 3,312,540 | | |
| FL Brevard County Utilities | |
| Series 2002, | |
Insured: FGIC
5.250% 03/01/14 | | | 2,000,000 | | | | 2,162,380 | | |
See Accompanying Notes to Financial Statements.
58
Columbia Intermediate Municipal Bond Fund
October 31, 2009
| Municipal Bonds (continued) | |
| | | Par ($) | | Value ($) | |
| FL Cocoa Water & Sewer | |
| Series 2003, | |
Insured: AMBAC
5.500% 10/01/19 | | | 1,000,000 | | | | 1,105,570 | | |
| FL Governmental Utility Authority | |
| Series 2003, | |
Insured: AMBAC
5.000% 10/01/17 | | | 1,180,000 | | | | 1,228,675 | | |
| FL Hollywood Water & Sewer | |
| Series 2003, | |
Insured: FSA
5.000% 10/01/17 | | | 1,070,000 | | | | 1,131,086 | | |
FL Miami-Dade County Florida Water &
Sewer | |
| Series 2008 B, | |
Insured: FSA
5.250% 10/01/21 | | | 20,000,000 | | | | 22,146,800 | | |
| FL Miami-Dade County Stormwater | |
| Series 2004, | |
Insured: NPFGC
5.000% 04/01/24 | | | 2,445,000 | | | | 2,484,316 | | |
| FL Municipal Loan Council | |
| Series 2002 B, | |
Insured: NPFGC
5.375% 08/01/16 | | | 1,485,000 | | | | 1,553,280 | | |
FL Tallahassee Consolidated Utility
System | |
| Series 2001, | |
Insured: FGIC:
5.500% 10/01/14 1,330,000 1,506,996
5.500% 10/01/17 1,900,000 2,160,794
5.500% 10/01/18 | | | 1,000,000 | | | | 1,131,840 | | |
| FL Tampa Bay Water Utility Systems | |
| Series 2005, | |
Insured: FGIC
5.500% 10/01/19 | | | 1,500,000 | | | | 1,712,115 | | |
| GA Atlanta Water & Wastewater | |
| Series 1999 A, | |
Insured: FGIC
5.500% 11/01/18 | | | 15,305,000 | | | | 16,472,312 | | |
KY Louisville & Jefferson County
Metropolitan Sewer District | |
| Series 2009: | |
5.000% 05/15/21 7,445,000 8,039,185
5.000% 05/15/22 | | | 7,825,000 | | | | 8,387,852 | | |
| | | Par ($) | | Value ($) | |
| MA Water Resource Authority | |
| Series 1998 B, | |
Insured: FSA
5.500% 08/01/15 | | | 1,000,000 | | | | 1,163,620 | | |
| MI Sewage Disposal Revenue | |
| Series 2003 A, | |
Insured: FSA
5.000% 07/01/14 | | | 2,820,000 | | | | 2,989,285 | | |
| NY Municipal Water Finance Authority | |
| Series 2002, | |
Insured: FSA
5.375% 06/15/16 | | | 10,000,000 | | | | 10,995,800 | | |
| Series 2009 EE, | |
| 5.000% 06/15/17 | | | 10,000,000 | | | | 11,249,300 | | |
NY New York City Municipal Water
Finance Authority | |
| Series 2000 B, | |
| 5.125% 06/15/31 | | | 7,000,000 | | | | 7,071,820 | | |
| OH Hamilton County Sewer System | |
| Series 2005 A, | |
Insured: NPFGC
5.000% 12/01/15 | | | 5,535,000 | | | | 6,275,306 | | |
| PA Allegheny County | |
| Series 2005 A, | |
Insured: NPFGC
5.000% 12/01/17 | | | 265,000 | | | | 280,089 | | |
| TX Colorado River Municipal Water | |
| Series 2003, | |
Insured: AMBAC
5.000% 01/01/12 | | | 4,030,000 | | | | 4,311,093 | | |
| TX Corpus Christi | |
| Series 2005 A, | |
Insured: AMBAC
5.000% 07/15/19 | | | 2,000,000 | | | | 2,121,160 | | |
| TX Dallas Waterworks & Sewer Systems | |
| Series 2003, | |
Insured: FSA
5.375% 10/01/12 | | | 10,000,000 | | | | 11,186,500 | | |
| TX Houston Utility System | |
| Series 2004 A, | |
Insured: FGIC
5.250% 05/15/24 | | | 5,000,000 | | | | 5,251,400 | | |
| TX Houston Water & Sewer System | |
| Junior Lien, | |
Series 2001 A,
Insured: FSA
5.500% 12/01/17 | | | 4,720,000 | | | | 5,107,984 | | |
See Accompanying Notes to Financial Statements.
59
Columbia Intermediate Municipal Bond Fund
October 31, 2009
| Municipal Bonds (continued) | |
| | | Par ($) | | Value ($) | |
| Series 1991 C, | |
Insured: AMBAC
(f) 12/01/11 | | | 4,000,000 | | | | 3,879,640 | | |
| TX McKinney | |
| Series 2005, | |
Insured: FGIC
5.250% 08/15/17 | | | 1,125,000 | | | | 1,247,558 | | |
TX North Harris County Regional Water
Authority | |
| Series 2008, | |
| 5.250% 12/15/20 | | | 4,415,000 | | | | 4,830,761 | | |
| TX Nueces River Authority | |
| Series 2005, | |
Insured: FSA
5.000% 07/15/15 | | | 1,000,000 | | | | 1,110,980 | | |
| TX San Antonio | |
| Series 2005, | |
Insured: NPFGC
5.000% 05/15/14 | | | 1,000,000 | | | | 1,121,120 | | |
| TX Trinity River Authority | |
| Series 2005, | |
Insured: NPFGC:
5.000% 02/01/17 | | | 1,000,000 | | | | 1,089,350 | | |
| 5.000% 02/01/18 | | | 1,000,000 | | | | 1,078,520 | | |
| Water & Sewer Total | | | 164,152,935 | | |
| Utilities Total | | | 411,549,382 | | |
Total Municipal Bonds
(cost of $2,421,619,007) | | | 2,470,138,194 | | |
| Investment Companies – 1.2% | |
| | | Shares | | | |
| Columbia Tax-Exempt Reserves, | |
Capital Class
(7 day yield of 0.170%) (j)(k) | | | 15,716,386 | | | | 15,716,386 | | |
| Dreyfus Tax-Exempt Cash | |
Management Fund
(7 day yield of 0.110%) | | | 14,786,786 | | | | 14,786,786 | | |
Total Investment Companies
(cost of $30,503,172) | | | 30,503,172 | | |
Total Investments – 99.9%
(cost of $2,452,122,179) (l) | | | 2,500,641,366 | | |
| Other Assets & Liabilities, Net – 0.1% | | | 2,875,853 | | |
| Net Assets – 100.0% | | | 2,503,517,219 | | |
Notes to Investment Portfolio:
(a) The interest rate shown on floating rate or variable rate securities reflects the rate at October 31, 2009.
(b) Security purchased on a delayed delivery basis.
(c) Parenthetical date represents the next interest rate reset date for the security.
(d) The issuer is in default of certain debt covenants. Income is not being accrued. At October 31, 2009, the value of these securities amounted to $1,905,935, which represents less than 0.1% of net assets.
(e) The Fund has been informed that each issuer has placed direct obligations of the U.S. Government in an irrevocable trust, solely for the payment of principal and interest.
(f) Zero coupon bond.
(g) Step bond. This security is currently not paying coupon. Shown parenthetically is the next coupon rate to be paid and the date the security will begin accruing at this rate.
(h) Security exempt from registration pursuant to Rule 144A under the Securities Act of 1933. These securities may be resold in transactions exempt from registration, normally to qualified institutional buyers. At October 31, 2009, these securities, which are not illiquid except for the following, amounted to $11,178,147, which represents 0.4% of net assets.
| Security | | Acquisition
Date | | Par | | Cost | | Value | |
FL Seminole
Indian Tribe
Series 2007 A,
5.750%
10/01/22 | | | 09/27/07 | | | $ | 2,000,000 | | | $ | 2,064,053 | | | $ | 1,948,400 | | |
(i) Step bond. Shown parenthetically is the next coupon rate to be paid and the date the Fund will begin accruing at this rate.
(j) Investments in affiliates during the year ended October 31, 2009:
| Security name: Columbia Tax-Exempt Reserves, Capital Class (7 day yield of 0.170%) | |
| Shares as of 10/31/08: | | | — | | |
| Shares purchased: | | | 303,650,486 | | |
| Shares sold: (287,934,100) Shares as of 10/31/09: | | | 15,716,386 | | |
| Net realized gain (loss): | | $ | — | | |
| Dividend income earned: | | $ | 111,915 | | |
| Value at end of period: | | $ | 15,716,386 | | |
(k) Money market mutual fund registered under the Investment Company Act of 1940, as amended, and advised by Columbia Management Advisors, LLC.
(l) Cost for federal income tax purposes is $2,452,122,176.
The following table summarizes the inputs used, as of October 31, 2009, in valuing the Fund's assets:
| Description | | Quoted Prices
(Level 1) | | Other
Significant
Observable
Inputs
(Level 2) | | Significant
Unobservable
Inputs
(Level 3) | | Total | |
| Total Municipal Bonds | | $ | — | | | $ | 2,470,138,194 | | | $ | — | | | $ | 2,470,138,194 | | |
Total Investment
Companies | | | 30,503,172 | | | | — | | | | — | | | | 30,503,172 | | |
| Total Investments | | $ | 30,503,172 | | | $ | 2,470,138,194 | | | $ | — | | | $ | 2,500,641,366 | | |
For more information on valuation inputs, and their aggregation into the levels used in the table above, please refer to the Security Valuation section in the accompanying Notes to Financial Statements.
See Accompanying Notes to Financial Statements.
60
Columbia Intermediate Municipal Bond Fund
October 31, 2009
At October 31, 2009, the composition of the Fund by revenue source is as follows:
| Holdings by Revenue Source (Unaudited) | | % of
Net Assets | |
| Tax-Backed | | | 46.8 | | |
| Utilities | | | 16.5 | | |
| Health Care | | | 10.7 | | |
| Refunded/Escrowed | | | 8.3 | | |
| Transportation | | | 7.7 | | |
| Education | | | 2.8 | | |
| Pool/Bond Bank | | | 2.5 | | |
| Industrials | | | 1.3 | | |
| Tobacco | | | 0.8 | | |
| Housing | | | 0.6 | | |
| Other Revenue | | | 0.4 | | |
| Resource Recovery | | | 0.3 | | |
| | | | 98.7 | | |
| Investment Companies | | | 1.2 | | |
| Other Assets & Liabilities, Net | | | 0.1 | | |
| | | | 100.0 | | |
| Acronym | | Name | |
| AGO | | Assured Guaranty Ltd. | |
|
| AMBAC | | Ambac Assurance Corp. | |
|
| AMT | | Alternative Minimum Tax | |
|
| CIFG | | CIFG Assurance North America, Inc. | |
|
| FGIC | | Financial Guaranty Insurance Co. | |
|
| FHA | | Federal Housing Administration | |
|
| FNMA | | Federal National Mortgage Association | |
|
| FSA | | Financial Security Assurance, Inc. | |
|
| GNMA | | Government National Mortgage Association | |
|
| LIQ FAC | | Liquidity Facility | |
|
| LOC | | Letter of Credit | |
|
| NPFGC | | National Public Finance Guarantee Corp. | |
|
| PSFG | | Permanent School Fund Guarantee | |
|
| SYNC | | Syncora Guarantee, Inc. | |
|
See Accompanying Notes to Financial Statements.
61
Investment Portfolio – Columbia Massachusetts Intermediate Municipal Bond Fund
October 31, 2009
| Municipal Bonds – 97.3% | |
| | | Par ($) | | Value ($) | |
| Education – 16.2% | |
| Education – 14.8% | |
| MA College Building Authority | |
| Series 2004 A, | |
Insured: NPFGC
5.000% 05/01/16 | | | 530,000 | | | | 563,920 | | |
| MA Development Finance Agency | |
| Boston College, | |
Series 2007 P,
5.000% 07/01/20 | | | 3,260,000 | | | | 3,571,363 | | |
| Clark University, | |
Series 1998,
5.250% 07/01/16 | | | 1,445,000 | | | | 1,457,109 | | |
| Emerson College, | |
| Series 2006: | |
| 5.000% 01/01/21 | | | 2,500,000 | | | | 2,513,300 | | |
| 5.000% 01/01/23 | | | 1,000,000 | | | | 994,210 | | |
| Hampshire College, | |
Series 2004,
5.150% 10/01/14 | | | 200,000 | | | | 204,154 | | |
| Mount Holyoke College: | |
Series 2001,
5.500% 07/01/13 | | | 1,355,000 | | | | 1,458,386 | | |
Series 2008,
5.000% 07/01/23 | | | 1,285,000 | | | | 1,374,886 | | |
| Wheelock College, | |
Series 2007 C,
5.000% 10/01/17 | | | 1,190,000 | | | | 1,185,335 | | |
| Worcester Polytechnic Institute, | |
Series 2007,
Insured: NPFGC
5.000% 09/01/22 | | | 1,710,000 | | | | 1,786,505 | | |
MA Health & Educational Facilities
Authority | |
| Boston College: | |
Series 2003 N,
5.250% 06/01/15 | | | 1,000,000 | | | | 1,110,410 | | |
Series 2008,
5.500% 06/01/24 | | | 3,000,000 | | | | 3,504,420 | | |
| Brandeis University, | |
Series 1999 J,
Insured: NPFGC
5.000% 10/01/26 | | | 1,000,000 | | | | 1,011,590 | | |
| Harvard University: | |
Series 2000 Z,
5.500% 01/15/11 | | | 1,000,000 | | | | 1,059,550 | | |
Series 2001 DD,
5.000% 07/15/35 | | | 2,500,000 | | | | 2,535,775 | | |
| | | Par ($) | | Value ($) | |
| Massachusetts Institute of Technology, | |
Series 2002 K:
5.250% 07/01/12 | | | 1,000,000 | | | | 1,112,780 | | |
| 5.375% 07/01/17 | | | 2,275,000 | | | | 2,696,535 | | |
| 5.500% 07/01/22 | | | 1,000,000 | | | | 1,222,760 | | |
Series 2004 M,
5.250% 07/01/19 | | | 610,000 | | | | 722,185 | | |
| Northeastern University, | |
Series 1998 G,
Insured: NPFGC
5.500% 10/01/12 | | | 1,110,000 | | | | 1,216,049 | | |
| Simmons College, | |
Series 2008 I,
6.750% 10/01/18 | | | 1,365,000 | | | | 1,538,273 | | |
| Tufts University: | |
Series 2001 I,
5.500% 02/15/36 | | | 2,000,000 | | | | 2,021,920 | | |
Series 2002 J,
5.500% 08/15/16 | | | 1,500,000 | | | | 1,743,810 | | |
Series 2008:
5.000% 08/15/14 | | | 1,250,000 | | | | 1,411,650 | | |
| 5.000% 08/15/17 | | | 1,145,000 | | | | 1,295,785 | | |
| Wellesley College, | |
Series 2003,
5.000% 07/01/15 | | | 610,000 | | | | 674,532 | | |
| Williams College, | |
Series 2003 H,
5.000% 07/01/16 | | | 1,740,000 | | | | 1,920,821 | | |
| MA Industrial Finance Agency | |
| Tufts University, | |
Series 1998 H,
Insured: NPFGC
5.500% 02/15/13 | | | 1,830,000 | | | | 2,054,962 | | |
MA University of Massachusetts Building
Authority | |
| Series 2004 1, | |
Insured: AMBAC
5.250% 11/01/12 | | | 500,000 | | | | 549,200 | | |
| Series 2008, | |
Insured: FSA
5.000% 05/01/21 | | | 1,510,000 | | | | 1,637,988 | | |
| Series 2009 1, | |
| 5.000% 05/01/23 | | | 5,000,000 | | | | 5,322,850 | | |
| Education Total | | | 51,473,013 | | |
| Prep School – 0.2% | |
| MA Development Finance Agency | |
| Milton Academy, | |
Series 2003 A,
5.000% 09/01/19 | | | 500,000 | | | | 527,360 | | |
| Prep School Total | | | 527,360 | | |
See Accompanying Notes to Financial Statements.
62
Columbia Massachusetts Intermediate Municipal Bond Fund
October 31, 2009
| Municipal Bonds (continued) | |
| | | Par ($) | | Value ($) | |
| Student Loan – 1.2% | |
| MA Educational Financing Authority | |
| Series 2009 I, | |
| 5.125% 01/01/18 | | | 4,000,000 | | | | 4,225,080 | | |
| Student Loan Total | | | 4,225,080 | | |
| Education Total | | | 56,225,453 | | |
| Health Care – 8.1% | |
| Continuing Care Retirement – 0.5% | |
| MA Development Finance Agency | |
| First Mortgage Orchard Cove, | |
Series 2007:
5.000% 10/01/17 | | | 1,540,000 | | | | 1,361,006 | | |
| 5.000% 10/01/18 | | | 515,000 | | | | 446,829 | | |
| Continuing Care Retirement Total | | | 1,807,835 | | |
| Hospitals – 7.3% | |
| MA Health & Educational Facilities Authority | |
| Baystate Medical Center, | |
Series 2002 F,
5.750% 07/01/13 | | | 890,000 | | | | 942,893 | | |
| Boston Medical Center, | |
Series 1998 A,
Insured: NPFGC
5.250% 07/01/15 | | | 2,500,000 | | | | 2,505,025 | | |
| Caregroup, Inc.: | |
Series 1998 B-2,
Insured: NPFGC
5.375% 02/01/27 | | | 1,585,000 | | | | 1,568,183 | | |
Series 2004 D,
Insured: NPFGC
5.250% 07/01/22 | | | 1,000,000 | | | | 1,001,990 | | |
Series 2008 E-2,
5.375% 07/01/19 | | | 3,000,000 | | | | 3,082,380 | | |
| Milford Regional Medical Center, | |
Series 2007 E:
5.000% 07/15/17 | | | 1,050,000 | | | | 1,012,179 | | |
| 5.000% 07/15/22 | | | 2,500,000 | | | | 2,204,425 | | |
| Partners Healthcare Systems, Inc.: | |
Series 1999 B,
5.250% 07/01/10 | | | 4,670,000 | | | | 4,733,886 | | |
Series 2001 C,
5.750% 07/01/21 | | | 750,000 | | | | 773,902 | | |
Series 2003 E,
5.000% 07/01/15 | | | 1,140,000 | | | | 1,198,357 | | |
Series 2005 F,
5.000% 07/01/17 | | | 2,000,000 | | | | 2,148,700 | | |
Series 2007,
5.000% 07/01/18 | | | 1,950,000 | | | | 2,108,359 | | |
| | | Par ($) | | Value ($) | |
| UMass Memorial Health Care, Inc., | |
Series 1998 A,
Insured: AMBAC
5.250% 07/01/14 | | | 2,000,000 | | | | 2,017,000 | | |
| Hospitals Total | | | 25,297,279 | | |
| Intermediate Care Facilities – 0.3% | |
| MA Development Finance Agency | |
| Evergreen Center, Inc., | |
Series 2005,
5.500% 01/01/20 | | | 1,355,000 | | | | 1,217,847 | | |
| Intermediate Care Facilities Total | | | 1,217,847 | | |
| Health Care Total | | | 28,322,961 | | |
| Housing – 1.1% | |
| Assisted Living/Senior – 0.5% | |
| MA Development Finance Agency | |
First Mortgage VOA Concord
Assisted Living, Inc., | | | |
Series 2007:
5.000% 11/01/17 | | | 825,000 | | | | 683,471 | | |
| 5.125% 11/01/27 | | | 1,500,000 | | | | 1,056,855 | | |
| Assisted Living/Senior Total | | | 1,740,326 | | |
| Single-Family – 0.6% | |
| MA Housing Finance Agency | |
Series 143,
5.000% 12/01/24 | | | 2,000,000 | | | | 2,067,640 | | |
| Single-Family Total | | | 2,067,640 | | |
| Housing Total | | | 3,807,966 | | |
| Other – 17.6% | |
| Other – 1.5% | |
MA Boston Housing Authority Capital
Program | |
| Series 2008, | |
Insured: FSA:
5.000% 04/01/20 | | | 2,135,000 | | | | 2,336,245 | | |
| 5.000% 04/01/23 | | | 1,570,000 | | | | 1,678,111 | | |
| MA Development Finance Agency | |
| Combined Jewish Philanthropies, | |
Series 2002 A,
5.250% 02/01/22 | | | 1,000,000 | | | | 1,066,560 | | |
| Other Total | | | 5,080,916 | | |
| Pool/Bond Bank – 4.8% | |
| MA Water Pollution Abatement | |
| Series 1995 A, | |
| 5.400% 08/01/11 | | | 25,000 | | | | 25,099 | | |
See Accompanying Notes to Financial Statements.
63
Columbia Massachusetts Intermediate Municipal Bond Fund
October 31, 2009
| Municipal Bonds (continued) | |
| | | Par ($) | | Value ($) | |
| Series 1999 5, | |
| 5.750% 08/01/16 | | | 95,000 | | | | 96,361 | | |
| Series 2002, | |
| 5.000% 08/01/11 | | | 1,000,000 | | | | 1,074,150 | | |
| Series 2004 A, | |
| 5.250% 08/01/15 | | | 3,000,000 | | | | 3,461,280 | | |
| Series 2005 11, | |
| 5.250% 08/01/19 | | | 4,465,000 | | | | 5,229,676 | | |
| Series 2006, | |
| 5.250% 08/01/20 | | | 3,000,000 | | | | 3,522,510 | | |
| Series 2009, | |
| 5.000% 08/01/24 | | | 3,100,000 | | | | 3,429,406 | | |
| Pool/Bond Bank Total | | | 16,838,482 | | |
| Refunded/Escrowed (a) – 11.3% | |
| MA Bay Transportation Authority | |
| Series 2000 A, | |
Pre-refunded 07/01/10,
5.750% 07/01/18 | | | 915,000 | | | | 948,196 | | |
| MA College Building Authority | |
| Series 1999 A, | |
Escrowed to Maturity,
Insured: NPFGC
(b) 05/01/28 | | | 4,000,000 | | | | 1,765,320 | | |
| MA Consolidated Loan | |
| Series 2001 C, | |
Pre-refunded 12/01/11,
5.375% 12/01/18 | | | 3,000,000 | | | | 3,268,710 | | |
| MA Development Finance Agency | |
| Belmont Hill School, | |
Series 1998,
Pre-refunded 09/01/11,
5.000% 09/01/31 | | | 1,000,000 | | | | 1,086,030 | | |
| Higher Education, | |
Smith College,
Series 2000,
Pre-refunded 07/01/10,
5.750% 07/01/23 | | | 2,000,000 | | | | 2,090,980 | | |
MA College of Pharmacy &
Allied Health Sciences, | | | |
Series 2003 C,
Pre-refunded 07/01/13,
6.375% 07/01/23 | | | 1,000,000 | | | | 1,181,680 | | |
| Western New England College, | |
Series 2002,
Pre-refunded 12/01/12,
5.875% 12/01/22 | | | 600,000 | | | | 666,024 | | |
| | | Par ($) | | Value ($) | |
| MA Health & Educational Facilities Authority | |
| Simmons College, | |
Series 2003 F,
Pre-refunded 10/01/13,
Insured: FGIC:
5.000% 10/01/15 | | | 1,015,000 | | | | 1,150,137 | | |
| 5.000% 10/01/17 | | | 510,000 | | | | 577,901 | | |
| University of Massachusetts: | |
Series 2000 A,
Pre-refunded 10/01/10,
Insured: FGIC
5.875% 10/01/29 | | | 1,000,000 | | | | 1,060,450 | | |
Series 2002 C,
Pre-refunded 10/01/12,
Insured: NPFGC
5.250% 10/01/13 | | | 1,475,000 | | | | 1,651,734 | | |
| MA Port Authority | |
| Series 1973, | |
Escrowed to Maturity,
5.625% 07/01/12 | | | 275,000 | | | | 297,611 | | |
MA Route 3 North Transit Improvement
Association | |
| Series 2000, | |
Pre-refunded 06/15/10,
Insured: NPFGC:
5.375% 06/15/33 | | | 2,500,000 | | | | 2,578,900 | | |
| 5.750% 06/15/14 | | | 2,000,000 | | | | 2,067,800 | | |
| 5.750% 06/15/15 | | | 2,000,000 | | | | 2,067,800 | | |
| MA Sandwich | |
| Series 2000, | |
Pre-refunded 08/15/10,
5.750% 08/15/11 | | | 1,050,000 | | | | 1,105,429 | | |
| MA Special Obligation | |
| Consolidated Loan, | |
Series 2002 A,
Pre-refunded 06/01/12,
Insured: FGIC
5.375% 06/01/19 | | | 1,125,000 | | | | 1,239,480 | | |
| MA Springfield | |
| Municipal Purpose Loan, | |
Series 2003,
Pre-refunded 01/15/13,
Insured: NPFGC
5.250% 01/15/15 | | | 1,500,000 | | | | 1,680,225 | | |
| MA State | |
| Series 2002 E, | |
Pre-refunded 01/01/13,
Insured: FSA
5.250% 01/01/18 | | | 4,000,000 | | | | 4,450,680 | | |
See Accompanying Notes to Financial Statements.
64
Columbia Massachusetts Intermediate Municipal Bond Fund
October 31, 2009
| Municipal Bonds (continued) | |
| | | Par ($) | | Value ($) | |
| Series 2004 B, | |
Pre-refunded 08/01/14,
5.000% 08/01/22 | | | 2,000,000 | | | | 2,261,760 | | |
| MA Turnpike Authority | |
| Series 1993 A, | |
Escrowed to Maturity,
5.000% 01/01/13 | | | 205,000 | | | | 218,321 | | |
MA University of Massachusetts Building
Authority | |
| Series 2003 1, | |
Pre-refunded 11/01/13,
Insured: AMBAC
5.250% 11/01/15 | | | 2,000,000 | | | | 2,288,900 | | |
| MA Water Pollution Abatement | |
| Series 1993 A, | |
Escrowed to Maturity,
5.450% 02/01/13 | | | 720,000 | | | | 767,758 | | |
| Series 1995 A, | |
Escrowed to Maturity,
5.400% 08/01/11 | | | 225,000 | | | | 243,511 | | |
| Series 2001 7, | |
Pre-refunded 08/01/11,
5.250% 02/01/13 | | | 250,000 | | | | 268,048 | | |
| MA Water Resources Authority | |
| Series 1993 C, | |
Escrowed to Maturity,
6.000% 12/01/11 | | | 1,220,000 | | | | 1,283,696 | | |
| Series 2000 D, | |
Escrowed to Maturity,
Insured: NPFGC
5.500% 08/01/10 | | | 1,000,000 | | | | 1,038,310 | | |
| Refunded/Escrowed Total | | | 39,305,391 | | |
| Other Total | | | 61,224,789 | | |
| Tax-Backed – 39.8% | |
| Local General Obligations – 10.8% | |
| MA Bellingham | |
| Series 2001, | |
Insured: AMBAC
5.250% 03/01/13 | | | 1,605,000 | | | | 1,710,785 | | |
| MA Boston | |
| Metropolitan District, | |
Series 2002 A,
5.250% 12/01/14 | | | 2,010,000 | | | | 2,241,291 | | |
| Series 2002 B, | |
Insured: FGIC
5.000% 02/01/12 | | | 6,000,000 | | | | 6,535,320 | | |
| | | Par ($) | | Value ($) | |
| Series 2004 A, | |
| 5.000% 01/01/14 | | | 1,000,000 | | | | 1,127,530 | | |
| MA Brookline | |
| Series 2000, | |
| 5.750% 04/01/14 | | | 1,905,000 | | | | 1,964,512 | | |
| MA Dudley Charlton Regional School District | |
| Series 1999 A, | |
Insured: NPFGC
5.125% 06/15/14 | | | 2,305,000 | | | | 2,544,098 | | |
| MA Everett | |
| Series 2000, | |
Insured: NPFGC
6.000% 12/15/11 | | | 2,015,000 | | | | 2,213,679 | | |
| MA Falmouth | |
| Series 2002, | |
| 5.000% 02/01/11 | | | 1,450,000 | | | | 1,529,547 | | |
| MA Hopedale | |
| Series 2004, | |
Insured: AMBAC
5.000% 11/15/17 | | | 1,000,000 | | | | 1,109,210 | | |
| MA Lawrence | |
| Series 2006, | |
Insured: FSA
5.000% 02/01/18 | | | 1,500,000 | | | | 1,689,060 | | |
| MA Lowell | |
| Series 2002, | |
Insured: AMBAC:
5.000% 08/01/10 | | | 1,000,000 | | | | 1,031,930 | | |
| 5.000% 02/01/13 | | | 1,215,000 | | | | 1,306,307 | | |
| MA Pioneer Valley Regional School District | |
| Series 2002, | |
Insured: AMBAC
5.000% 06/15/12 | | | 1,000,000 | | | | 1,078,830 | | |
| MA Pittsfield | |
| Series 2002, | |
Insured: NPFGC
5.000% 04/15/11 | | | 1,000,000 | | | | 1,058,860 | | |
| MA Plymouth | |
| Series 2000, | |
Insured: NPFGC
5.000% 10/15/18 | | | 1,725,000 | | | | 1,818,357 | | |
| MA Sandwich | |
| Series 2005, | |
Insured: NPFGC
5.000% 07/15/18 | | | 1,575,000 | | | | 1,705,725 | | |
See Accompanying Notes to Financial Statements.
65
Columbia Massachusetts Intermediate Municipal Bond Fund
October 31, 2009
| Municipal Bonds (continued) | |
| | | Par ($) | | Value ($) | |
| MA Springfield | |
| Series 2007, | |
Insured: FSA
4.500% 08/01/21 | | | 2,000,000 | | | | 2,082,640 | | |
| MA Westborough | |
| Series 2003, | |
| 5.000% 11/15/16 | | | 1,000,000 | | | | 1,084,220 | | |
| MA Westfield | |
| Series 2003, | |
Insured: NPFGC
5.000% 09/01/18 | | | 500,000 | | | | 531,525 | | |
| MA Worcester | |
| Series 2004 A, | |
Insured: NPFGC
5.250% 08/15/13 | | | 2,810,000 | | | | 3,119,184 | | |
PR Commonwealth of Puerto Rico
Municipal Finance Agency | |
| Series 1997 A, | |
Insured: FSA
5.500% 07/01/17 | | | 245,000 | | | | 245,287 | | |
| Local General Obligations Total | | | 37,727,897 | | |
| Other – 1.5% | |
| MA Boston Special Obligation | |
| Boston Medical Center, | |
Series 2002 A,
Insured: NPFGC
5.000% 08/01/14 | | | 5,000,000 | | | | 5,270,250 | | |
| Other Total | | | 5,270,250 | | |
| Special Non-Property Tax – 10.7% | |
| MA Bay Transportation Authority | |
| Series 2000 A: | |
| 5.750% 07/01/14 | | | 85,000 | | | | 87,788 | | |
| 5.750% 07/01/18 | | | 85,000 | | | | 87,788 | | |
| Series 2002 A, | |
| 5.000% 07/01/11 | | | 1,000,000 | | | | 1,070,540 | | |
| Series 2003 A: | |
| 5.250% 07/01/11 | | | 5,000,000 | | | | 5,373,400 | | |
| 5.250% 07/01/17 | | | 1,000,000 | | | | 1,150,870 | | |
| 5.250% 07/01/19 | | | 625,000 | | | | 722,644 | | |
| Series 2004 C, | |
| 5.250% 07/01/18 | | | 1,000,000 | | | | 1,151,630 | | |
| Series 2005 B, | |
Insured: NPFGC
5.500% 07/01/23 | | | 2,890,000 | | | | 3,404,796 | | |
| Series 2005, | |
| 5.000% 07/01/20 | | | 2,500,000 | | | | 2,839,725 | | |
| | | Par ($) | | Value ($) | |
| Series 2006 A, | |
| 5.250% 07/01/22 | | | 3,500,000 | | | | 4,056,115 | | |
| Series 2008 B, | |
| 5.000% 07/01/23 | | | 910,000 | | | | 1,025,024 | | |
| MA Boston Special Obligation | |
| Convention Center, | |
Series 2002 A,
Insured: AMBAC
5.000% 05/01/19 | | | 1,500,000 | | | | 1,581,195 | | |
| MA School Building Authority | |
| Series 2007 A, | |
Insured: AMBAC:
5.000% 08/15/18 | | | 5,000,000 | | | | 5,581,400 | | |
| 5.000% 08/15/19 | | | 2,000,000 | | | | 2,214,440 | | |
| MA Special Obligation | |
| Consolidated Loan: | |
Series 1997 A,
5.500% 06/01/13 | | | 1,000,000 | | | | 1,132,690 | | |
| Series 2002 A, | |
Insured: FGIC
5.000% 06/01/10 | | | 1,500,000 | | | | 1,540,530 | | |
| Series 2004 A, | |
Insured: FGIC
5.250% 01/01/19 | | | 750,000 | | | | 836,572 | | |
| PR Commonwealth of Puerto Rico Highway & Transportation Authority | |
| Series 2006 BB, | |
Insured: FSA
5.250% 07/01/22 | | | 3,000,000 | | | | 3,212,280 | | |
| Special Non-Property Tax Total | | | 37,069,427 | | |
| State Appropriated – 1.2% | |
| MA Development Finance Agency | |
| Visual & Performing Arts Project, | |
Series 2000:
5.750% 08/01/13 | | | 1,030,000 | | | | 1,148,728 | | |
| 6.000% 08/01/17 | | | 540,000 | | | | 619,407 | | |
| 6.000% 08/01/21 | | | 1,750,000 | | | | 1,999,305 | | |
PR Commonwealth of Puerto Rico
Public Finance Corp. | |
| Series 2004 A, | |
Insured: AMBAC
5.250% 08/01/30
(02/01/12) (c)(d) | | | 500,000 | | | | 510,335 | | |
| State Appropriated Total | | | 4,277,775 | | |
See Accompanying Notes to Financial Statements.
66
Columbia Massachusetts Intermediate Municipal Bond Fund
October 31, 2009
| Municipal Bonds (continued) | |
| | | Par ($) | | Value ($) | |
| State General Obligations – 15.6% | |
| MA State | |
| Series 2002 C: | |
| 5.500% 11/01/15 | | | 3,000,000 | | | | 3,470,910 | | |
| 5.500% 11/01/17 | | | 1,500,000 | | | | 1,753,770 | | |
| Series 2002 D, | |
Insured: AMBAC
5.500% 08/01/18 | | | 3,500,000 | | | | 4,096,120 | | |
| Series 2003 D: | |
| 5.500% 10/01/17 | | | 5,000,000 | | | | 5,842,550 | | |
Insured: AMBAC
5.500% 10/01/19 | | | 5,000,000 | | | | 5,887,800 | | |
Insured: FSA
5.500% 10/01/19 | | | 3,500,000 | | | | 4,121,460 | | |
Insured: NPFGC
5.500% 10/01/20 | | | 2,500,000 | | | | 2,952,200 | | |
| Series 2004 B, | |
| 5.250% 08/01/20 | | | 3,000,000 | | | | 3,472,470 | | |
| Series 2004 C: | |
Insured: AMBAC
5.500% 12/01/24 | | | 5,000,000 | | | | 5,937,250 | | |
Insured: NPFGC
5.500% 12/01/19 | | | 3,795,000 | | | | 4,473,053 | | |
| Series 2006 B, | |
Insured: FSA
5.250% 09/01/22 | | | 4,000,000 | | | | 4,624,360 | | |
| Series 2008 A: | |
| 5.000% 09/01/15 | | | 3,000,000 | | | | 3,387,960 | | |
| 5.000% 08/01/16 | | | 2,000,000 | | | | 2,260,780 | | |
| PR Commonwealth of Puerto Rico | |
| Series 2007 A, | |
| 5.500% 07/01/18 | | | 1,750,000 | | | | 1,815,170 | | |
| State General Obligations Total | | | 54,095,853 | | |
| Tax-Backed Total | | | 138,441,202 | | |
| Transportation – 4.8% | |
| Airports – 2.5% | |
| MA Port Authority | |
| Series 2005 C, | |
Insured: AMBAC:
5.000% 07/01/15 | | | 1,500,000 | | | | 1,689,420 | | |
| 5.000% 07/01/22 | | | 3,500,000 | | | | 3,719,590 | | |
| Series 2007 D, | |
Insured: FSA
5.000% 07/01/17 | | | 3,000,000 | | | | 3,358,050 | | |
| Airports Total | | | 8,767,060 | | |
| | | Par ($) | | Value ($) | |
| Toll Facilities – 1.0% | |
| MA Turnpike Authority | |
| Metropolitan Highway Systems: | |
Series 1997 A,
Insured: NPFGC
5.000% 01/01/37 | | | 2,000,000 | | | | 1,875,720 | | |
Series 1999 A,
Insured: AMBAC
5.000% 01/01/39 | | | 1,500,000 | | | | 1,412,265 | | |
| Toll Facilities Total | | | 3,287,985 | | |
| Transportation – 1.3% | |
| MA Federal Highway Capital Appreciation | |
| Series 1998 A, | |
| (b) 06/15/15 | | | 4,000,000 | | | | 3,396,440 | | |
MA Woods Hole, Martha's Vineyard &
Nantucket Steamship Authority | |
| Series 2004 B, | |
| 5.000% 03/01/18 | | | 975,000 | | | | 1,052,093 | | |
| Transportation Total | | | 4,448,533 | | |
| Transportation Total | | | 16,503,578 | | |
| Utilities – 9.7% | |
| Investor Owned – 0.9% | |
| MA Development Finance Agency | |
| Dominion Energy Brayton, | |
Series 2009,
5.750% 12/01/42
(05/01/19) (c)(d) | | | 3,000,000 | | | | 3,153,960 | | |
| Investor Owned Total | | | 3,153,960 | | |
| Joint Power Authority – 0.7% | |
| MA Municipal Wholesale Electric Co. | |
| Series 2001 A, | |
Insured: NPFGC
5.000% 07/01/11 | | | 2,500,000 | | | | 2,627,575 | | |
| Joint Power Authority Total | | | 2,627,575 | | |
| Municipal Electric – 1.1% | |
PR Commonwealth of Puerto Rico Electric
Power Authority | |
| Series 1997 BB, | |
Insured: NPFGC
6.000% 07/01/12 | | | 1,000,000 | | | | 1,085,750 | | |
| Series 2002 LL, | |
| 5.500% 07/01/17 | | | 2,400,000 | | | | 2,608,368 | | |
| Municipal Electric Total | | | 3,694,118 | | |
See Accompanying Notes to Financial Statements.
67
Columbia Massachusetts Intermediate Municipal Bond Fund
October 31, 2009
| Municipal Bonds (continued) | |
| | | Par ($) | | Value ($) | |
| Water & Sewer – 7.0% | |
| MA Water Resource Authority | |
| Series 1993 C, | |
| 6.000% 12/01/11 | | | 780,000 | | | | 821,442 | | |
| Series 1998 B, | |
Insured: FSA
5.500% 08/01/15 | | | 1,165,000 | | | | 1,355,617 | | |
| Series 2002 J, | |
Insured: FSA:
5.250% 08/01/14 | | | 2,870,000 | | | | 3,294,731 | | |
| 5.250% 08/01/15 | | | 3,000,000 | | | | 3,456,060 | | |
| 5.250% 08/01/18 | | | 1,000,000 | | | | 1,163,000 | | |
| Series 2005 A, | |
Insured: NPFGC
5.250% 08/01/17 | | | 6,000,000 | | | | 6,900,480 | | |
| Series 2007 B, | |
Insured: FSA
5.250% 08/01/23 | | | 5,500,000 | | | | 6,204,660 | | |
PR Commonwealth of Puerto Rico
Aqueduct & Sewer Authority | |
| Refunding Senior Lien, | |
Series 2008 A,
Insured: AGO
5.000% 07/01/16 | | | 1,000,000 | | | | 1,084,160 | | |
| Water & Sewer Total | | | 24,280,150 | | |
| Utilities Total | | | 33,755,803 | | |
Total Municipal Bonds
(cost of $324,501,828) | | | 338,281,752 | | |
| Investment Companies – 1.6% | |
| | | Shares | | | |
| Columbia Massachusetts Municipal | |
Reserves, G-Trust Shares
(7 day yield of 0.120%) (e)(f) | | | 2,917,706 | | | | 2,917,706 | | |
| Dreyfus Massachusetts Municipal | |
Money Market Fund
(7 day yield of 0.000%) | | | 2,477,223 | | | | 2,477,223 | | |
Total Investment Companies
(cost of $5,394,929) | | | 5,394,929 | | |
| Short-Term Obligation – 0.1% | |
| | | Par ($) | | Value ($) | |
| Variable Rate Demand Note (c) – 0.1% | |
MA Health & Educational Facilities
Authority | |
| Harvard University, | |
Series 1999 R,
0.130% 11/01/49
(11/02/09) (d) | | | 500,000 | | | | 500,000 | | |
| Variable Rate Demand Note Total | | | 500,000 | | |
Total Short-Term Obligation
(cost of $500,000) | | | 500,000 | | |
Total Investments – 99.0%
(cost of $330,396,757) (g) | | | 344,176,681 | | |
| Other Assets & Liabilities, Net – 1.0% | | | 3,643,668 | | |
| Net Assets – 100.0% | | | 347,820,349 | | |
Notes to Investment Portfolio:
(a) The Fund has been informed that each issuer has placed direct obligations of the U.S. Government in an irrevocable trust, solely for the payment of principal and interest.
(b) Zero coupon bond.
(c) The interest rate shown on floating rate or variable rate securities reflects the rate at October 31, 2009.
(d) Parenthetical date represents the next interest rate reset date for the security.
(e) Investments in affiliates during the year ended October 31, 2009:
| Security name: Columbia Massachusetts Municipal Reserves, G-Trust Shares (7 day yield of 0.120%) | |
| Shares as of 10/31/08: | | | — | | |
| Shares purchased: | | | 46,233,421 | | |
| Shares sold: | | | (43,315,715 | ) | |
| Shares as of 10/31/09: | | | 2,917,706 | | |
| Net realized gain (loss): | | $ | — | | |
| Dividend income earned: | | $ | 10,882 | | |
| Value at end of period: | | $ | 2,917,706 | | |
(f) Money market mutual fund registered under the Investment Company Act of 1940, as amended, and advised by Columbia Management Advisors, LLC.
(g) Cost for federal income tax purposes is $330,350,514.
See Accompanying Notes to Financial Statements.
68
Columbia Massachusetts Intermediate Municipal Bond Fund
October 31, 2009
The following table summarizes the inputs used, as of October 31, 2009, in valuing the Fund's assets:
| Description | | Quoted
Prices
(Level 1) | | Other
Significant
Observable
Inputs
(Level 2) | | Significant
Unobservable
Inputs
(Level 3) | | Total | |
| Total Municipal Bonds | | $ | — | | | $ | 338,281,752 | | | $ | — | | | $ | 338,281,752 | | |
Total Investment
Companies | | | 5,394,929 | | | | — | | | | — | | | | 5,394,929 | | |
Total Short-Term
Obligation | | | — | | | | 500,000 | | | | — | | | | 500,000 | | |
| Total Investments | | $ | 5,394,929 | | | $ | 338,781,752 | | | $ | — | | | $ | 344,176,681 | | |
For more information on valuation inputs, and their aggregation into the levels used in the table above, please refer to the Security Valuation section in the accompanying Notes to Financial Statements.
At October 31, 2009, the composition of the Fund by revenue source is as follows:
| Holdings by Revenue Source (Unaudited) | | % of
Net Assets | |
| Tax-Backed | | | 39.8 | | |
| Education | | | 16.2 | | |
| Refunded/Escrowed | | | 11.3 | | |
| Utilities | | | 9.7 | | |
| Health Care | | | 8.1 | | |
| Pool/Bond Bank | | | 4.8 | | |
| Transportation | | | 4.8 | | |
| Other | | | 1.5 | | |
| Housing | | | 1.1 | | |
| | | | 97.3 | | |
| Investment Companies | | | 1.6 | | |
| Short-Term Obligation | | | 0.1 | | |
| Other Assets & Liabilities, Net | | | 1.0 | | |
| | | | 100.0 | | |
| Acronym | | Name | |
| AGO | | Assured Guaranty Ltd. | |
|
| AMBAC | | Ambac Assurance Corp. | |
|
| FGIC | | Financial Guaranty Insurance Co. | |
|
| FSA | | Financial Security Assurance, Inc. | |
|
| NPFGC | | National Public Finance Guarantee Corp. | |
|
See Accompanying Notes to Financial Statements.
69
Investment Portfolio – Columbia New Jersey Intermediate Municipal Bond Fund
October 31, 2009
| Municipal Bonds – 94.8% | |
| | | Par ($) | | Value ($) | |
| Education – 4.6% | |
| Education – 4.6% | |
| NJ Educational Facilities Authority | |
Drew University,
Series 2003 A,
Insured: FGIC
5.250% 07/01/20 | | | 1,000,000 | | | | 1,098,070 | | |
Georgian Court University,
Series 2007 D,
5.250% 07/01/27 | | | 500,000 | | | | 496,265 | | |
Kean University,
Series 2009 A,
4.000% 09/01/15 | | | 500,000 | | | | 516,625 | | |
Montclair State University,
Series 2009,
5.000% 07/01/19 | | | 455,000 | | | | 490,281 | | |
Rowan University,
Series 2008 B,
Insured: AGO
5.000% 07/01/23 | | | 750,000 | | | | 810,157 | | |
Seton Hall University,
Series 2001 A,
Insured: AMBAC
5.250% 07/01/16 | | | 200,000 | | | | 211,786 | | |
| Education Total | | | 3,623,184 | | |
| Education Total | | | 3,623,184 | | |
| Health Care – 5.2% | |
| Continuing Care Retirement – 1.2% | |
| NJ Economic Development Authority | |
Lutheran Social Ministries,
Series 2005,
5.100% 06/01/27 | | | 675,000 | | | | 581,216 | | |
Marcus L. Ward Home,
Series 2004,
5.750% 11/01/24 | | | 400,000 | | | | 394,864 | | |
| Continuing Care Retirement Total | | | 976,080 | | |
| Hospitals – 4.0% | |
| NJ Health Care Facilities Financing Authority | |
Children's Specialized Hospital,
Series 2005 A,
5.000% 07/01/18 | | | 575,000 | | | | 557,267 | | |
Hackensack University Medical Center:
Series 1998 A,
Insured: NPFGC
5.000% 01/01/18 | | | 500,000 | | | | 494,030 | | |
Series 2000:
5.700% 01/01/11 | | | 500,000 | | | | 507,210 | | |
| 5.875% 01/01/15 | | | 500,000 | | | | 506,305 | | |
| | | Par ($) | | Value ($) | |
South Jersey Hospital,
Series 2006,
5.000% 07/01/20 | | | 500,000 | | | | 512,210 | | |
St. Joseph's Hospital & Medical Center,
Series 2008,
6.000% 07/01/18 | | | 500,000 | | | | 520,840 | | |
| Hospitals Total | | | 3,097,862 | | |
| Health Care Total | | | 4,073,942 | | |
| Housing – 4.8% | |
| Multi-Family – 4.1% | |
| NJ Housing & Mortgage Finance Agency | |
Multi-Family Housing:
Series 2000 B,
Insured: FSA
6.050% 11/01/17 | | | 165,000 | | | | 166,096 | | |
Series 2000 E-2,
Insured: FSA
5.750% 11/01/25 | | | 135,000 | | | | 135,935 | | |
| NJ Middlesex County Improvement Authority | |
Student Housing Urban Renewal,
Series 2004 A,
5.000% 08/15/18 | | | 500,000 | | | | 522,910 | | |
| NJ Housing & Mortgage Finance Agency | |
| Series 2009 B, | |
| 4.700% 11/01/29 | | | 1,000,000 | | | | 984,700 | | |
| Series 2009 C, | |
| 2.550% 11/01/12 | | | 1,000,000 | | | | 996,850 | | |
PR Commonwealth of Puerto Rico Housing
Finance Authority | |
| Series 2008, | |
| 5.000% 12/01/13 | | | 400,000 | | | | 433,344 | | |
| Multi-Family Total | | | 3,239,835 | | |
| Single-Family – 0.7% | |
| NJ Housing & Mortgage Finance Agency | |
| Series 2008, | |
| 6.375% 10/01/28 | | | 495,000 | | | | 546,282 | | |
| Single-Family Total | | | 546,282 | | |
| Housing Total | | | 3,786,117 | | |
| Other – 16.1% | |
| Pool/Bond Bank – 0.7% | |
| NJ Environmental Infrastructure Trust | |
| Series 1998, | |
Insured: FGIC
5.000% 04/01/12 | | | 500,000 | | | | 506,525 | | |
| Pool/Bond Bank Total | | | 506,525 | | |
See Accompanying Notes to Financial Statements.
70
Columbia New Jersey Intermediate Municipal Bond Fund
October 31, 2009
| Municipal Bonds (continued) | |
| | | Par ($) | | Value ($) | |
| Refunded/Escrowed (a) – 14.4% | |
| NJ Atlantic County Improvement Authority | |
| Series 1985, | |
Escrowed to Maturity,
Insured: NPFGC
7.375% 07/01/10 | | | 65,000 | | | | 67,683 | | |
| NJ Bayonne Municipal Utilities Authority | |
| Series 1997, | |
Escrowed to Maturity,
Insured: NPFGC
5.000% 01/01/12 | | | 385,000 | | | | 400,947 | | |
| NJ Burlington County Bridge Commissioner | |
| Series 2002, | |
Pre-refunded 08/15/12,
5.250% 08/15/18 | | | 1,130,000 | | | | 1,260,549 | | |
| NJ Delaware River & Bay Authority | |
| Series 2000 A, | |
Pre-refunded 01/01/10,
Insured: AMBAC
5.400% 01/01/14 | | | 250,000 | | | | 254,630 | | |
| NJ Economic Development Authority | |
School Facilities Construction,
Series 2001 A,
Pre-refunded 06/15/11,
Insured: AMBAC
5.250% 06/15/18 | | | 200,000 | | | | 214,870 | | |
| NJ Educational Facilities Authority | |
Rowan University,
Series 2000 B,
Pre-refunded 07/01/10,
Insured: FGIC
5.250% 07/01/19 | | | 250,000 | | | | 258,182 | | |
Stevens Institute of Technology,
Series 2002 C,
Escrowed to Maturity,
5.000% 07/01/10 | | | 1,120,000 | | | | 1,154,485 | | |
William Paterson University,
Series 2000 A,
Pre-refunded 07/01/10,
Insured: FGIC
5.375% 07/01/21 | | | 500,000 | | | | 516,505 | | |
| NJ Environmental Infrastructure Trust | |
| Series 2000 A, | |
Pre-refunded 09/01/10,
5.250% 09/01/20 | | | 500,000 | | | | 525,495 | | |
| | | Par ($) | | Value ($) | |
| NJ Essex County Improvement Authority | |
Lease Revenue,
Series 2000,
Pre-refunded 10/01/10,
Insured: FGIC
5.250% 10/01/11 | | | 500,000 | | | | 521,995 | | |
| NJ Highway Authority | |
Garden State Parkway:
Series 1989,
Escrowed to Maturity,
6.000% 01/01/19 | | | 1,000,000 | | | | 1,207,220 | | |
Series 1999,
Pre-refunded 01/01/10,
Insured: FGIC
5.600% 01/01/17 | | | 300,000 | | | | 305,694 | | |
| NJ Monmouth County Improvement Authority | |
| Series 2000, | |
Pre-refunded 12/01/10,
Insured: AMBAC
5.000% 12/01/12 | | | 390,000 | | | | 409,480 | | |
| NJ Sports & Exposition Authority | |
| Series 2000 C, | |
Escrowed to Maturity,
5.000% 03/01/11 | | | 305,000 | | | | 322,720 | | |
| NJ State | |
Certificates of Participation,
Series 1998 A,
Escrowed to Maturity,
Insured: AMBAC
5.000% 06/15/14 | | | 500,000 | | | | 570,785 | | |
| NJ Tobacco Settlement Financing Corp. | |
| Series 2002, | |
| Pre-refunded 06/01/12, | |
| 5.375% 06/01/18 | | | 1,000,000 | | | | 1,109,050 | | |
| NJ Transportation Trust Fund Authority | |
Transportation Systems,
Series 1999 A,
Escrowed to Maturity,
5.750% 06/15/15 | | | 1,000,000 | | | | 1,186,660 | | |
| NJ Turnpike Authority | |
| Series 2000 A, | |
Pre-refunded 01/01/10,
Insured: NPFGC
5.750% 01/01/19 | | | 295,000 | | | | 297,726 | | |
See Accompanying Notes to Financial Statements.
71
Columbia New Jersey Intermediate Municipal Bond Fund
October 31, 2009
| Municipal Bonds (continued) | |
| | | Par ($) | | Value ($) | |
| NJ Vernon Township Board of Education | |
| Series 1999, | |
Pre-refunded 12/01/09,
Insured: FGIC
5.375% 12/01/19 | | | 300,000 | | | | 301,323 | | |
| NJ West Deptford Township | |
| Series 2000, | |
Pre-refunded 09/01/10,
Insured: FGIC
5.500% 09/01/20 | | | 400,000 | | | | 417,240 | | |
| Refunded/Escrowed Total | | | 11,303,239 | | |
| Tobacco – 1.0% | |
| NJ Tobacco Settlement Financing Corp. | |
| Series 2007 1-A: | |
| 4.500% 06/01/23 | | | 385,000 | | | | 344,729 | | |
| 4.625% 06/01/26 | | | 500,000 | | | | 406,980 | | |
| Tobacco Total | | | 751,709 | | |
| Other Total | | | 12,561,473 | | |
| Other Revenue – 0.5% | |
| Hotels – 0.5% | |
| NJ Middlesex County Improvement Authority | |
Heldrich Associates,
Series 2005 A,
5.000% 01/01/20 | | | 815,000 | | | | 408,535 | | |
| Hotels Total | | | 408,535 | | |
| Other Revenue Total | | | 408,535 | | |
| Tax-Backed – 46.6% | |
| Local Appropriated – 5.8% | |
| NJ Bergen County Improvement Authority | |
| Series 2005, | |
| 5.000% 11/15/23 | | | 1,000,000 | | | | 1,154,910 | | |
| Series 2009 A, | |
| 4.000% 08/15/13 | | | 750,000 | | | | 815,520 | | |
| NJ Camden County Improvement Authority | |
| Series 2006, | |
Insured: AMBAC
4.000% 09/01/21 | | | 1,140,000 | | | | 1,164,806 | | |
| NJ East Orange Board of Education | |
Certificates of Participation,
Series 1998,
Insured: FSA
(b) 02/01/18 | | | 1,000,000 | | | | 698,870 | | |
| | | Par ($) | | Value ($) | |
| NJ Middlesex County | |
Certificates of Participation,
Series 2001,
Insured: NPFGC
5.500% 08/01/17 | | | 250,000 | | | | 268,122 | | |
| NJ Monmouth County Improvement Authority | |
| Series 1995, | |
Insured: FSA
5.450% 07/15/13 | | | 305,000 | | | | 306,031 | | |
| Series 2000, | |
Insured: AMBAC
5.000% 12/01/12 | | | 110,000 | | | | 113,186 | | |
| Local Appropriated Total | | | 4,521,445 | | |
| Local General Obligations – 18.3% | |
| NJ Atlantic City | |
| Series 2008, | |
| 5.500% 02/15/18 | | | 500,000 | | | | 561,605 | | |
| NJ Atlantic County | |
| Series 2009, | |
| 5.000% 02/01/18 | | | 500,000 | | | | 566,350 | | |
| NJ Board of Education | |
Tom Rivers School District,
Series 2007,
Insured: NPFGC
4.500% 01/15/20 | | | 500,000 | | | | 536,430 | | |
| NJ Cherry Hill Township | |
| Series 1999 B, | |
| 5.250% 07/15/11 | | | 500,000 | | | | 538,250 | | |
NJ Cumberland County Improvement
Authority | |
| Series 2009 A, | |
| 4.000% 04/15/19 | | | 750,000 | | | | 778,988 | | |
| NJ Essex County Improvement Authority | |
| Series 2004, | |
Insured: NPFGC
5.500% 10/01/26 | | | 750,000 | | | | 846,728 | | |
NJ Flemington Raritan Regional School
District | |
| Series 2000, | |
Insured: FGIC
5.700% 02/01/15 | | | 400,000 | | | | 459,860 | | |
| NJ Freehold Regional High School District | |
| Series 2001, | |
Insured: FGIC
5.000% 03/01/20 | | | 1,205,000 | | | | 1,375,965 | | |
See Accompanying Notes to Financial Statements.
72
Columbia New Jersey Intermediate Municipal Bond Fund
October 31, 2009
| Municipal Bonds (continued) | |
| | | Par ($) | | Value ($) | |
| NJ Greenwich Township Board of Education | |
| Series 1998, | |
Insured: FSA:
5.000% 01/15/13 | | | 165,000 | | | | 165,563 | | |
| 5.000% 01/15/14 | | | 250,000 | | | | 250,853 | | |
NJ Manalapan Englishtown Regional Board
of Education | |
| Series 2004, | |
Insured: FGIC
5.750% 12/01/20 | | | 1,325,000 | | | | 1,599,248 | | |
| NJ Mercer County Improvement Authority | |
| Series 1998 B, | |
Insured: FGIC
5.000% 02/15/14 | | | 250,000 | | | | 250,790 | | |
| NJ Middlesex County | |
Certificates of Participation,
Series 2001,
Insured: NPFGC
5.000% 08/01/12 | | | 500,000 | | | | 531,900 | | |
| NJ Newark Housing Authority | |
| Series 2009, | |
Insured: AGO
4.500% 12/01/18 | | | 600,000 | | | | 622,230 | | |
| NJ Passaic County | |
| Series 2003, | |
Insured: FSA
5.200% 09/01/16 | | | 1,500,000 | | | | 1,735,440 | | |
| NJ Summit | |
| Series 2001, | |
| 5.250% 06/01/16 | | | 1,205,000 | | | | 1,397,908 | | |
NJ Washington Township Board of Education
Mercer County | |
| Series 2005, | |
Insured: FSA:
5.250% 01/01/26 | | | 1,330,000 | | | | 1,536,828 | | |
| 5.250% 01/01/28 | | | 500,000 | | | | 577,320 | | |
| Local General Obligations Total | | | 14,332,256 | | |
| Special Non-Property Tax – 6.0% | |
| IL Dedicated Tax Capital Appreciation | |
| Series 1990, | |
Insured: AMBAC
(b) 12/15/17 | | | 3,000,000 | | | | 2,187,570 | | |
| NJ Economic Development Authority | |
| Series 2004 A, | |
| 5.500% 06/15/24 | | | 750,000 | | | | 715,875 | | |
| | | Par ($) | | Value ($) | |
| Series 2004, | |
Insured: NPFGC:
(b) 07/01/21 | | | 1,255,000 | | | | 735,656 | | |
| 5.250% 07/01/17 | | | 1,000,000 | | | | 1,055,320 | | |
| Special Non-Property Tax Total | | | 4,694,421 | | |
| Special Property Tax – 0.4% | |
| NJ Economic Development Authority | |
| Series 2007, | |
| 5.125% 06/15/27 | | | 400,000 | | | | 351,140 | | |
| Special Property Tax Total | | | 351,140 | | |
| State Appropriated – 16.1% | |
| NJ Economic Development Authority | |
| Series 2001 C, | |
Insured: AMBAC
5.500% 06/15/12 | | | 500,000 | | | | 549,160 | | |
| Series 2005 A, | |
Insured: FSA
5.000% 03/01/19 | | | 2,000,000 | | | | 2,156,060 | | |
| Series 2009, | |
| 5.250% 12/15/20 | | | 1,000,000 | | | | 1,105,140 | | |
| NJ Educational Facilities Authority | |
| Series 2001 A, | |
| 5.000% 03/01/15 | | | 1,855,000 | | | | 1,945,209 | | |
| NJ Health Care Facilities Financing Authority | |
| Series 2005, | |
Insured: AMBAC
5.000% 09/15/13 | | | 970,000 | | | | 1,043,089 | | |
| NJ Sports & Exposition Authority | |
| Series 2000 C, | |
| 5.000% 03/01/11 | | | 195,000 | | | | 204,783 | | |
| NJ State | |
Certificates of Participation:
Series 2008 A,
5.000% 06/15/21 | | | 250,000 | | | | 263,003 | | |
Series 2009 A,
5.000% 06/15/17 | | | 1,000,000 | | | | 1,087,510 | | |
| NJ Transit Corp. | |
Certificates of Participation,
Series 2002 A,
Insured: AMBAC
5.500% 09/15/15 | | | 1,000,000 | | | | 1,112,520 | | |
| NJ Transportation Trust Fund Authority | |
| Series 1999 A, | |
| 5.625% 06/15/12 | | | 400,000 | | | | 439,524 | | |
| Series 2003 A, | |
Insured: AMBAC
5.500% 12/15/15 | | | 1,000,000 | | | | 1,133,930 | | |
See Accompanying Notes to Financial Statements.
73
Columbia New Jersey Intermediate Municipal Bond Fund
October 31, 2009
| Municipal Bonds (continued) | |
| | | Par ($) | | Value ($) | |
| Series 2005 B, | |
Insured: AMBAC
5.250% 12/15/23 | | | 1,000,000 | | | | 1,100,860 | | |
| Series 2006 C, | |
Insured: AMBAC
(b) 12/15/24 | | | 1,000,000 | | | | 422,890 | | |
| State Appropriated Total | | | 12,563,678 | | |
| Tax-Backed Total | | | 36,462,940 | | |
| Transportation – 5.7% | |
| Ports – 1.3% | |
| NY Port Authority of New York & New Jersey | |
| Series 2009, | |
| 4.750% 09/01/26 | | | 1,000,000 | | | | 1,046,790 | | |
| Ports Total | | | 1,046,790 | | |
| Toll Facilities – 4.4% | |
| NJ Turnpike Authority | |
| Series 2004 B, | |
Insured: AMBAC
(c) 01/01/35
(5.150% 01/01/15) | | | 500,000 | | | | 386,025 | | |
| Series 2009 G, | |
| 5.000% 01/01/18 | | | 800,000 | | | | 878,032 | | |
| Series 2009 H, | |
| 5.000% 01/01/20 (d) | | | 1,000,000 | | | | 1,068,160 | | |
PA Delaware River Joint Toll Bridge
Commission | |
| Series 2003, | |
| 5.250% 07/01/11 | | | 1,000,000 | | | | 1,064,490 | | |
| Toll Facilities Total | | | 3,396,707 | | |
| Transportation Total | | | 4,443,497 | | |
| Utilities – 11.3% | |
| Municipal Electric – 1.0% | |
PR Commonwealth of Puerto Rico Electric
Power Authority | |
| Series 2003 NN, | |
Insured: NPFGC
5.250% 07/01/19 | | | 750,000 | | | | 789,150 | | |
| Municipal Electric Total | | | 789,150 | | |
| Water & Sewer – 10.3% | |
| NJ Bergen County Improvement Authority | |
| Series 2008, | |
| 5.000% 12/15/26 | | | 500,000 | | | | 546,445 | | |
| | | Par ($) | | Value ($) | |
NJ Cape May County Municipal Utilities
Sewer Authority | |
| Series 2002 A, | |
Insured: FSA
5.750% 01/01/16 | | | 1,000,000 | | | | 1,172,840 | | |
| NJ Essex County Utilities Authority | |
| Series 2009, | |
Insured: AGO
5.000% 04/01/20 | | | 1,000,000 | | | | 1,087,880 | | |
| NJ Jersey City Municipal Utilities Authority | |
| Series 2007, | |
Insured: FGIC
5.250% 01/01/19 | | | 1,000,000 | | | | 1,000,650 | | |
| NJ North Hudson Sewerage Authority | |
| Sewer Revenue, | |
Series 2006 A,
Insured: NPFGC
5.125% 08/01/17 | | | 600,000 | | | | 617,070 | | |
| NJ Ocean County Utilities Authority | |
| Wastewater Revenue: | |
Series 2001,
5.250% 01/01/18 | | | 1,000,000 | | | | 1,065,770 | | |
Series 2006,
Insured: NPFGC
4.000% 01/01/15 | | | 990,000 | | | | 1,070,052 | | |
| NJ Rahway Valley Sewerage Authority | |
| Series 2005 A, | |
Insured: NPFGC
(b) 09/01/25 | | | 1,000,000 | | | | 426,570 | | |
NJ Southeast Morris County Municipal
Utilities Authority | |
| Series 2001, | |
Insured: NPFGC
5.000% 01/01/10 | | | 1,055,000 | | | | 1,063,060 | | |
| Water & Sewer Total | | | 8,050,337 | | |
| Utilities Total | | | 8,839,487 | | |
Total Municipal Bonds
(cost of $72,060,396) | | | 74,199,175 | | |
See Accompanying Notes to Financial Statements.
74
Columbia New Jersey Intermediate Municipal Bond Fund
October 31, 2009
| Investment Companies – 5.6% | |
| | | Shares | | Value ($) | |
| Columbia Tax-Exempt Reserves, | |
Capital Class
(7 day yield of 0.170%) (e)(f) | | | 2,087,016 | | | | 2,087,016 | | |
| Dreyfus Tax-Exempt Cash | |
Management Fund
(7 day yield of 0.110%) | | | 2,332,152 | | | | 2,332,152 | | |
Total Investment Companies
(cost of $4,419,168) | | | 4,419,168 | | |
Total Investments – 100.4%
(cost of $76,479,564) (g) | | | 78,618,343 | | |
| Other Assets & Liabilities, Net – (0.4)% | | | (333,083 | ) | |
| Net Assets – 100.0% | | | 78,285,260 | | |
Notes to Investment Portfolio:
(a) The Fund has been informed that each issuer has placed direct obligations of the U.S. Government in an irrevocable trust, solely for the payment of principal and interest.
(b) Zero coupon bond.
(c) Step bond. This security is currently not paying coupon. Shown parenthetically is the next interest rate to be paid and the date the Fund will begin accruing at this rate.
(d) Security purchased on a delayed delivery basis.
(e) Investments in affiliates during the year ended October 31, 2009:
| Security name: Columbia Tax-Exempt Reserves, Capital Class (7 day yield of 0.170%) | |
| Shares as of 10/31/08: | | | — | | |
| Shares purchased: | | | 20,402,921 | | |
| Shares sold: | | | (18,315,905 | ) | |
| Shares as of 10/31/09: | | | 2,087,016 | | |
| Net realized gain (loss): | | $ | — | | |
| Dividend income earned: | | $ | 9,314 | | |
| Value at end of period: | | $ | 2,087,016 | | |
(f) Money market mutual fund registered under the Investment Company Act of 1940, as amended, and advised by Columbia Management Advisors, LLC.
(g) Cost for federal income tax purposes is $76,464,769.
The following table summarizes the inputs used, as of October 31, 2009, in valuing the Fund's assets:
| Description | |
Quoted Prices
(Level 1) | | Other
Significant
Observable
Inputs
(Level 2) | | Significant
Unobservable
Inputs
(Level 3) | | Total | |
| Total Municipal Bonds | | $ | — | | | $ | 74,199,175 | | | $ | — | | | $ | 74,199,175 | | |
Total Investment
Companies | | | 4,419,168 | | | | — | | | | — | | | | 4,419,168 | | |
| Total Investments | | $ | 4,419,168 | | | $ | 74,199,175 | | | $ | — | | | $ | 78,618,343 | | |
For more information on valuation inputs, and their aggregation into the levels used in the table above, please refer to the Security Valuation section in the accompanying Notes to Financial Statements.
At October 31, 2009, the composition of the Fund by revenue source is as follows:
| Holdings by Revenue Source (Unaudited) | | % of
Net Assets | |
| Tax-Backed | | | 46.6 | | |
| Refunded/Escrowed | | | 14.4 | | |
| Utilities | | | 11.3 | | |
| Transportation | | | 5.7 | | |
| Health Care | | | 5.2 | | |
| Housing | | | 4.8 | | |
| Education | | | 4.6 | | |
| Tobacco | | | 1.0 | | |
| Pool/Bond Bank | | | 0.7 | | |
| Other Revenue | | | 0.5 | | |
| | | | 94.8 | | |
| Investment Companies | | | 5.6 | | |
| Other Assets & Liabilities, Net | | | (0.4 | ) | |
| | | | 100.0 | | |
| Acronym | | Name | |
| AGO | | Assured Guaranty Ltd. | |
|
| AMBAC | | Ambac Assurance Corp. | |
|
| FGIC | | Financial Guaranty Insurance Co. | |
|
| FSA | | Financial Security Assurance, Inc. | |
|
| NPFGC | | National Public Finance Guarantee Corp. | |
|
See Accompanying Notes to Financial Statements.
75
Investment Portfolio – Columbia New York Intermediate Municipal Bond Fund
October 31, 2009
| Municipal Bonds – 97.6% | |
| | | Par ($) | | Value ($) | |
| Education – 9.6% | |
| Education – 9.6% | |
| NY Dormitory Authority | |
| Barnard College, | |
Series 2007 A,
Insured: FGIC
5.000% 07/01/18 | | | 1,745,000 | | | | 1,923,356 | | |
| Cornell University: | |
Series 2006 A,
5.000% 07/01/21 | | | 2,350,000 | | | | 2,568,174 | | |
Series 2009 A,
5.000% 07/01/25 | | | 1,000,000 | | | | 1,097,570 | | |
| Mount Sinai School of Medicine, | |
Series 1995 B,
Insured: NPFGC
5.700% 07/01/11 | | | 370,000 | | | | 379,239 | | |
| New York University: | |
Series 1998 A,
Insured: NPFGC:
5.750% 07/01/20 | | | 2,000,000 | | | | 2,357,640 | | |
| 6.000% 07/01/17 | | | 2,475,000 | | | | 2,907,927 | | |
Series 2001 1,
Insured: AMBAC
5.500% 07/01/15 | | | 1,205,000 | | | | 1,375,773 | | |
Series 2001 2,
Insured: AMBAC
5.500% 07/01/21 | | | 900,000 | | | | 946,494 | | |
| Series 2001 A, | |
Insured: AMBAC
5.750% 07/01/12 | | | 5,000,000 | | | | 5,573,400 | | |
| St. John's University, | |
Series 2007 C,
Insured: NPFGC
5.250% 07/01/22 | | | 2,000,000 | | | | 2,192,200 | | |
| Teachers College, | |
Series 2009,
5.000% 03/01/24 | | | 1,000,000 | | | | 1,062,790 | | |
NY Oneida County Industrial Development
Agency | |
| Hamilton College, | |
Series 2007 A,
Insured: NPFGC:
(a) 07/01/18 | | | 1,000,000 | | | | 721,560 | | |
| (a) 07/01/20 | | | 1,000,000 | | | | 645,700 | | |
NY St. Lawrence County Industrial
Development Agency | |
| Series 2009 A, | |
| 5.000% 10/01/16 | | | 3,000,000 | | | | 3,291,720 | | |
| | | Par ($) | | Value ($) | |
| NY Troy Industrial Development Authority | |
| Rensselaer Polytechnic Institute, | |
Series 2002 E,
4.050% 04/01/37
(09/01/11) (b)(c) | | | 3,750,000 | | | | 3,841,763 | | |
| Education Total | | | 30,885,306 | | |
| Education Total | | | 30,885,306 | | |
| Health Care – 10.6% | |
| Continuing Care Retirement – 0.2% | |
NY Nassau County Industrial Development
Agency | |
| Amsterdam Harborside, | |
Series 2007 A,
5.875% 01/01/18 | | | 250,000 | | | | 233,450 | | |
NY Suffolk County Industrial Development
Agency | |
| Active Retirement Community, | |
Series 2006,
5.000% 11/01/28 | | | 335,000 | | | | 295,936 | | |
| Continuing Care Retirement Total | | | 529,386 | | |
| Hospitals – 8.6% | |
| NY Albany Industrial Development Agency | |
| St. Peter's Hospital: | |
Series 2008 A:
5.250% 11/15/27 | | | 1,000,000 | | | | 987,350 | | |
| 5.750% 11/15/22 | | | 500,000 | | | | 519,205 | | |
Series 2008 E,
5.250% 11/15/22 | | | 500,000 | | | | 502,920 | | |
| NY Dormitory Authority | |
| Kaleida Health, | |
Series 2006,
Insured: FHA
4.600% 08/15/27 | | | 1,840,000 | | | | 1,766,382 | | |
| Long Island Jewish Medical Center: | |
Series 2003,
5.000% 05/01/11 | | | 820,000 | | | | 861,697 | | |
Series 2009,
5.250% 05/01/30 | | | 4,000,000 | | | | 4,038,720 | | |
| Mount Sinai School of Medicine, | |
Series 2009,
5.500% 07/01/27 (d) | | | 4,000,000 | | | | 4,109,880 | | |
| New York Hospital Medical Center Queens, | |
Series 2007,
Insured: FHA
4.650% 08/15/27 | | | 1,000,000 | | | | 925,480 | | |
| New York Methodist Hospital, | |
Series 2004,
5.250% 07/01/24 | | | 1,000,000 | | | | 902,110 | | |
See Accompanying Notes to Financial Statements.
76
Columbia New York Intermediate Municipal Bond Fund
October 31, 2009
| Municipal Bonds (continued) | |
| | | Par ($) | | Value ($) | |
| New York University Hospital Center: | |
Series 2006,
5.000% 07/01/20 | | | 3,000,000 | | | | 2,992,440 | | |
Series 2007 A
5.000% 07/01/12 | | | 1,000,000 | | | | 1,034,370 | | |
| North Shore Long Island Jewish Health, | |
Series 2006 A,
5.000% 11/01/19 | | | 1,000,000 | | | | 1,023,110 | | |
| Orange Regional Medical Center, | |
Series 2008,
6.125% 12/01/29 | | | 1,350,000 | | | | 1,227,609 | | |
| Presbyterian Hospital, | |
Series 2007,
Insured: FSA
5.250% 08/15/23 | | | 250,000 | | | | 260,390 | | |
| United Health Services Hospitals, | |
Series 2009
Insured: FHA
4.500% 08/01/18 | | | 1,000,000 | | | | 1,028,590 | | |
| White Plains Hospital, | |
Series 2004,
Insured: FHA
4.625% 02/15/18 | | | 605,000 | | | | 629,605 | | |
NY Madison County Industrial Development
Agency | |
| Oneida Health Systems, Inc., | |
Series 2007,
5.250% 02/01/27 | | | 675,000 | | | | 604,280 | | |
NY Monroe County Industrial Development
Agency | |
| Series 2005, | |
| 5.000% 08/01/22 | | | 700,000 | | | | 687,652 | | |
| NY New York City Health & Hospital Corp. | |
| Series 2003 A, | |
Insured: AMBAC
5.000% 02/15/11 | | | 2,000,000 | | | | 2,086,140 | | |
NY Saratoga County Industrial
Development Agency | |
| Saratoga Hospital: | |
Series 2004 A,
5.000% 12/01/13 | | | 485,000 | | | | 496,048 | | |
Series 2007 B:
5.000% 12/01/22 | | | 500,000 | | | | 488,715 | | |
| 5.125% 12/01/27 | | | 500,000 | | | | 475,365 | | |
| Hospitals Total | | | 27,648,058 | | |
| | | Par ($) | | Value ($) | |
| Nursing Homes – 1.8% | |
| NY Amherst Industrial Development Agency | |
| Beechwood Health Care Center, Inc., | |
Series 2007,
4.875% 01/01/13 | | | 500,000 | | | | 463,510 | | |
| NY Dormitory Authority | |
| AIDS Long-Term Health Care Facility, | |
Series 2005,
Insured: SONYMA
5.000% 11/01/12 | | | 500,000 | | | | 518,005 | | |
| Gurwin Nursing Home, | |
Series 2005 A,
Insured: FHA
4.400% 02/15/20 | | | 770,000 | | | | 773,604 | | |
| NY Rensselaer Municipal Leasing Corp. | |
| Series 2009 A, | |
| 5.000% 06/01/19 | | | 4,000,000 | | | | 4,045,520 | | |
| Nursing Homes Total | | | 5,800,639 | | |
| Health Care Total | | | 33,978,083 | | |
| Housing – 1.6% | |
| Multi-Family – 1.2% | |
| NY Dormitory Authority | |
| Gateway-Longview, Inc., | |
Series 2008 A-1,
Insured: SONYMA
5.000% 06/01/33 | | | 1,700,000 | | | | 1,741,174 | | |
PR Commonwealth of Puerto Rico
Housing Finance Authority | |
| Series 2008, | |
| 5.000% 12/01/13 | | | 2,000,000 | | | | 2,166,720 | | |
| Multi-Family Total | | | 3,907,894 | | |
| Single-Family – 0.4% | |
| NY Mortgage Agency | |
| Series 2000 96, | |
| 5.200% 10/01/14 | | | 345,000 | | | | 346,697 | | |
| Series 2005 128, | |
| 4.350% 10/01/16 | | | 1,000,000 | | | | 1,032,970 | | |
| Single-Family Total | | | 1,379,667 | | |
| Housing Total | | | 5,287,561 | | |
| Other – 18.7% | |
| Other – 0.4% | |
NY New York City Industrial Development
Agency | |
| United Jewish Appeal, | |
Series 2004 A,
5.000% 07/01/27 | | | 625,000 | | | | 649,725 | | |
See Accompanying Notes to Financial Statements.
77
Columbia New York Intermediate Municipal Bond Fund
October 31, 2009
| Municipal Bonds (continued) | |
| | | Par ($) | | Value ($) | |
NY Westchester County Industrial
Development Agency | |
| Guiding Eyes for the Blind, | |
Series 2004,
5.375% 08/01/24 | | | 500,000 | | | | 499,200 | | |
| Other Total | | | 1,148,925 | | |
| Pool/Bond Bank – 6.9% | |
| NY Dormitory Authority | |
| Series 2008 A, | |
Insured: FSA
5.000% 10/01/23 | | | 3,000,000 | | | | 3,204,060 | | |
| Series 2009 C | |
Insured: AGO
5.000% 10/01/22 | | | 3,000,000 | | | | 3,234,630 | | |
| NY Environmental Facilities Corp. | |
| Series 1994 2, | |
| 5.750% 06/15/12 | | | 185,000 | | | | 206,939 | | |
| Series 2002 K, | |
| 5.000% 06/15/12 | | | 6,000,000 | | | | 6,620,220 | | |
| Series 2008 B, | |
| 5.000% 06/15/21 | | | 3,000,000 | | | | 3,296,790 | | |
| Series 2009 A, | |
| 5.000% 06/15/17 | | | 2,000,000 | | | | 2,260,000 | | |
| NY Municipal Bond Bank Agency | |
| Series 2003 C, | |
| 5.250% 12/01/21 | | | 3,330,000 | | | | 3,458,971 | | |
| Pool/Bond Bank Total | | | 22,281,610 | | |
| Refunded/Escrowed (e) – 11.4% | |
| NY Dormitory Authority | |
City University Systems Consolidated
4th Generation, | | | | | | | | | |
Series 2001 A,
Pre-refunded 07/01/11,
Insured: FGIC
5.500% 07/01/16 | | | 2,280,000 | | | | 2,466,869 | | |
| Columbia University, | |
Series 2002 B,
Pre-refunded 07/01/12
5.375% 07/01/15 | | | 1,000,000 | | | | 1,117,200 | | |
| Memorial Sloan-Kettering Cancer Center, | |
Series 2003,
Escrowed to Maturity,
Insured: NPFGC
(a) 07/01/25 | | | 3,750,000 | | | | 1,949,137 | | |
| University Dormitory Facilities, | |
Series 2002,
Pre-refunded 07/01/12,
5.375% 07/01/19 | | | 1,130,000 | | | | 1,261,476 | | |
| | | Par ($) | | Value ($) | |
| NY Environmental Facilities Corp. | |
| New York City Municipal Water, | |
Series 1994 A,
Escrowed to Maturity,
5.750% 06/15/12 | | | 1,815,000 | | | | 2,040,339 | | |
| NY Long Island Power Authority | |
| Electric Systems, | |
Series 1998 A,
Escrowed to Maturity,
Insured: FSA
5.500% 12/01/13 | | | 2,000,000 | | | | 2,319,000 | | |
| Series 1998 A, | |
Escrowed to Maturity,
Insured: FSA
5.250% 12/01/14 | | | 5,000,000 | | | | 5,729,400 | | |
| Series 2003 C, | |
Pre-refunded 09/01/13,
5.500% 09/01/21 | | | 1,000,000 | | | | 1,152,590 | | |
| NY Metropolitan Transportation Authority | |
| Series 1997 8, | |
Pre-refunded 07/01/13,
Insured: FSA
5.375% 07/01/21 | | | 5,000,000 | | | | 5,706,450 | | |
| Series 1998 A, | |
Pre-refunded 10/01/15,
Insured: FGIC
5.000% 04/01/23 | | | 2,000,000 | | | | 2,308,580 | | |
| NY New York City | |
| Series 2003 J, | |
Pre-refunded 06/01/13,
5.500% 06/01/16 | | | 1,085,000 | | | | 1,240,459 | | |
| NY Thruway Authority | |
| Second General Highway & Bridge, | |
Series 2003 A,
Pre-refunded 04/01/13,
Insured: NPFGC
5.250% 04/01/17 | | | 1,750,000 | | | | 1,982,330 | | |
| NY Triborough Bridge & Tunnel Authority | |
| Series 1991 X, | |
Escrowed to Maturity,
6.625% 01/01/12 | | | 300,000 | | | | 327,162 | | |
| Series 1992 Y, | |
Escrowed to Maturity:
5.500% 01/01/17 | | | 2,000,000 | | | | 2,306,560 | | |
| 6.000% 01/01/12 | | | 585,000 | | | | 619,737 | | |
| Series 1999 B, | |
Pre-refunded 01/01/22,
5.500% 01/01/30 | | | 2,000,000 | | | | 2,440,220 | | |
See Accompanying Notes to Financial Statements.
78
Columbia New York Intermediate Municipal Bond Fund
October 31, 2009
| Municipal Bonds (continued) | |
| | | Par ($) | | Value ($) | |
| PA Elizabeth Forward School District | |
| Series 1994 B, | |
Escrowed to Maturity,
Insured: NPFGC
(a) 09/01/20 | | | 2,210,000 | | | | 1,452,191 | | |
| Refunded/Escrowed Total | | | 36,419,700 | | |
| Other Total | | | 59,850,235 | | |
| Other Revenue – 2.6% | |
| Recreation – 2.6% | |
| NY Cultural Resources | |
| Museum of Modern Art, | |
Series 2008-1A,
5.000% 04/01/26 | | | 4,850,000 | | | | 5,233,344 | | |
| NY Industrial Development Agency | |
| Series 2006, | |
Insured: NPFGC
5.000% 03/01/15 | | | 1,150,000 | | | | 1,223,968 | | |
| YMCA of Greater New York, | |
Series 2006,
5.000% 08/01/26 | | | 1,000,000 | | | | 993,200 | | |
NY Seneca Nation Indians Capital
Improvements Authority | |
| Series 2007 A, | |
| 5.250% 12/01/16 (f) | | | 1,000,000 | | | | 908,270 | | |
| Recreation Total | | | 8,358,782 | | |
| Other Revenue Total | | | 8,358,782 | | |
| Resource Recovery – 1.2% | |
| Disposal – 1.2% | |
| NY Babylon Industrial Development Agency | |
| Covanta Babylon, Inc., | |
Series 2009 A,
5.000% 01/01/18 | | | 3,500,000 | | | | 3,724,105 | | |
| Disposal Total | | | 3,724,105 | | |
| Resource Recovery Total | | | 3,724,105 | | |
| Tax-Backed – 37.9% | |
| Local Appropriated – 1.2% | |
| NY Dormitory Authority | |
| Court Facilities, | |
Series 2001 2-2,
5.000% 01/15/21 | | | 2,500,000 | | | | 2,645,850 | | |
| | | Par ($) | | Value ($) | |
NY Erie County Industrial Development
Agency | |
| City School District of Buffalo, | |
Series 2008 A,
Insured: FSA
5.000% 05/01/18 | | | 1,000,000 | | | | 1,097,690 | | |
| Local Appropriated Total | | | 3,743,540 | | |
| Local General Obligations – 11.5% | |
| NY Albany County | |
| Series 2006, | |
Insured: SYNC
4.125% 09/15/20 | | | 1,000,000 | | | | 1,042,270 | | |
| NY City of Yonkers | |
| Series 2005 B, | |
Insured: NPFGC:
5.000% 08/01/21 | | | 2,425,000 | | | | 2,450,050 | | |
| 5.000% 08/01/22 | | | 2,545,000 | | | | 2,551,744 | | |
| NY Monroe County Public Improvement | |
| Series 1996, | |
Insured: NPFGC
6.000% 03/01/16 | | | 1,210,000 | | | | 1,379,763 | | |
| NY Monroe County | |
| Series 2009 A, | |
Insured: AGO
5.000% 06/01/14 | | | 3,000,000 | | | | 3,263,940 | | |
| NY New York City | |
| Series 2003 J, | |
| 5.500% 06/01/16 | | | 165,000 | | | | 180,325 | | |
| Series 2004 B, | |
| 5.250% 08/01/15 | | | 2,000,000 | | | | 2,196,280 | | |
| Series 2004 G, | |
| 5.000% 12/01/19 | | | 2,430,000 | | | | 2,557,211 | | |
| Series 2005 G, | |
| 5.250% 08/01/16 | | | 500,000 | | | | 558,945 | | |
| Series 2007 C: | |
| 4.250% 01/01/27 | | | 800,000 | | | | 779,952 | | |
| 5.000% 01/01/15 | | | 4,000,000 | | | | 4,386,320 | | |
| Series 2007 D, | |
| 5.000% 02/01/24 | | | 2,000,000 | | | | 2,088,840 | | |
| Series 2007 D-1, | |
| 5.000% 12/01/21 | | | 2,000,000 | | | | 2,124,600 | | |
| Series 2008 I-1, | |
| 5.000% 02/01/23 | | | 2,000,000 | | | | 2,104,780 | | |
| NY Red Hook Central School District | |
| Series 2002, | |
Insured: FSA
5.125% 06/15/17 | | | 890,000 | | | | 966,914 | | |
See Accompanying Notes to Financial Statements.
79
Columbia New York Intermediate Municipal Bond Fund
October 31, 2009
| Municipal Bonds (continued) | |
| | | Par ($) | | Value ($) | |
| NY Rensselaer County | |
| Series 1998 A, | |
Insured: AMBAC
5.250% 06/01/11 | | | 545,000 | | | | 584,556 | | |
NY Sachem Central School District of
Holbrook | |
| Series 2006, | |
Insured: NPFGC
4.250% 10/15/24 | | | 1,000,000 | | | | 1,008,620 | | |
| NY Somers Central School District | |
| Series 2006, | |
Insured: NPFGC:
4.000% 12/01/21 | | | 500,000 | | | | 509,350 | | |
| 4.000% 12/01/22 | | | 500,000 | | | | 504,940 | | |
| NY Three Village Central School District | |
| Series 2005, | |
Insured: NPFGC
5.000% 06/01/18 | | | 1,000,000 | | | | 1,139,010 | | |
| NY Town of Babylon | |
| Series 2004, | |
Insured: AMBAC
5.000% 01/01/13 | | | 2,565,000 | | | | 2,805,084 | | |
| NY Town of Oyster Bay | |
| Series 2009 A: | |
| 5.000% 02/15/15 | | | 1,000,000 | | | | 1,139,010 | | |
| 5.000% 02/15/16 | | | 500,000 | | | | 572,150 | | |
| Local General Obligations Total | | | 36,894,654 | | |
| Special Non-Property Tax – 14.6% | |
| NY Dormitory Authority | |
| Series 2005 B, | |
Insured: AMBAC
5.500% 03/15/26 | | | 1,000,000 | | | | 1,165,730 | | |
| NY Environmental Facilities Corp. | |
| Series 2004 A, | |
Insured: NPFGC
5.000% 12/15/21 | | | 2,685,000 | | | | 2,892,631 | | |
| NY Housing Finance Agency | |
| Series 2008 A, | |
| 5.000% 09/15/19 | | | 1,400,000 | | | | 1,532,202 | | |
| NY Local Government Assistance Corp. | |
| Series 1993 E, | |
| 6.000% 04/01/14 | | | 3,540,000 | | | | 3,961,649 | | |
| Series 2003 A-1, | |
Insured: FSA
5.000% 04/01/12 | | | 5,000,000 | | | | 5,473,700 | | |
| | | Par ($) | | Value ($) | |
| NY Metropolitan Transportation Authority | |
| Series 2004 A, | |
Insured: FGIC
5.250% 11/15/18 | | | 800,000 | | | | 901,488 | | |
NY Nassau County Interim Finance
Authority | |
| Series 2004 I-1H, | |
Insured: AMBAC
5.250% 11/15/15 | | | 5,000,000 | | | | 5,677,900 | | |
NY New York City Transitional Finance
Authority | |
| Series 2009 A, | |
| 5.000% 05/01/27 | | | 5,000,000 | | | | 5,347,150 | | |
| NY Sales Tax Asset Receivables Corp. | |
| Series 2004 A, | |
Insured: NPFGC
5.000% 10/15/22 | | | 4,000,000 | | | | 4,346,440 | | |
| NY Thruway Authority | |
| Series 2007, | |
| 5.000% 03/15/22 | | | 1,000,000 | | | | 1,087,350 | | |
| NY Transitional Finance Authority | |
| Series 2003 B, | |
| 5.250% 08/01/17 | | | 2,000,000 | | | | 2,232,360 | | |
| Series 2005 A-1, | |
| 5.000% 11/01/19 | | | 3,000,000 | | | | 3,229,080 | | |
| Series 2006, | |
| 5.000% 07/15/11 | | | 3,000,000 | | | | 3,198,810 | | |
| Series 2007, | |
Insured: FGIC
5.000% 01/15/21 | | | 4,300,000 | | | | 4,579,758 | | |
PR Commonwealth of Puerto Rico
Highway & Transportation Authority | |
| Series 2006 BB, | |
Insured: FSA
5.250% 07/01/22 | | | 1,000,000 | | | | 1,070,760 | | |
| Special Non-Property Tax Total | | | 46,697,008 | | |
| Special Property Tax – 0.3% | |
| NY Industrial Development Agency | |
| Series 2006, | |
Insured: AMBAC
5.000% 01/01/19 | | | 850,000 | | | | 874,693 | | |
| Special Property Tax Total | | | 874,693 | | |
| State Appropriated – 8.9% | |
| NY Dormitory Authority | |
| 4201 Schools Program, | |
Series 2000,
6.250% 07/01/20 | | | 1,685,000 | | | | 1,757,623 | | |
See Accompanying Notes to Financial Statements.
80
Columbia New York Intermediate Municipal Bond Fund
October 31, 2009
| Municipal Bonds (continued) | |
| | | Par ($) | | Value ($) | |
| City University, | |
Series 2002 B,
Insured: AMBAC
5.250% 11/15/26
(05/15/12) (b)(c) | | | 1,500,000 | | | | 1,623,750 | | |
| Consolidated 2nd Generation, | |
Series 2000 A,
Insured: AMBAC
6.125% 07/01/13 | | | 2,000,000 | | | | 2,086,600 | | |
| Series 1993 A: | |
| 5.250% 05/15/15 | | | 2,000,000 | | | | 2,204,260 | | |
| 5.500% 05/15/19 | | | 2,500,000 | | | | 2,794,225 | | |
| Series 2005 A, | |
Insured: FGIC
5.500% 05/15/21 | | | 1,000,000 | | | | 1,129,070 | | |
| Series 2009 A, | |
| 5.000% 07/01/24 | | | 3,000,000 | | | | 3,169,410 | | |
| Series 2009, | |
| 5.500% 02/15/18 | | | 1,000,000 | | | | 1,120,940 | | |
| State University, | |
Series 2000 C,
Insured: FSA
5.750% 05/15/17 | | | 1,250,000 | | | | 1,453,513 | | |
| NY Thruway Authority | |
| Local Highway & Bridge, | |
Series 2001,
5.250% 04/01/11 | | | 2,000,000 | | | | 2,117,740 | | |
| NY Urban Development Corp. | |
| Series 2002 A, | |
| 5.000% 01/01/17 | | | 2,000,000 | | | | 2,084,860 | | |
| Series 2008 B, | |
| 5.000% 01/01/26 | | | 3,125,000 | | | | 3,238,219 | | |
| Series 2008, | |
| 5.000% 01/01/22 | | | 2,000,000 | | | | 2,115,140 | | |
PR Commonwealth of Puerto Rico
Public Finance Corp. | |
| Series 2004 A, | |
LOC: Government Development Bank
for Puerto Rico | |
5.750% 08/01/27
(02/01/12) (b)(c) | | | 1,675,000 | | | | 1,727,327 | | |
| State Appropriated Total | | | 28,622,677 | | |
| State General Obligations – 1.4% | |
| NY State | |
| Series 2009 A, | |
| (a) 02/15/19 | | | 3,000,000 | | | | 2,104,560 | | |
| | | Par ($) | | Value ($) | |
PR Commonwealth of Puerto Rico
Public Buildings Authority | |
| Series 2007, | |
| 6.250% 07/01/23 | | | 2,250,000 | | | | 2,437,537 | | |
| State General Obligations Total | | | 4,542,097 | | |
| Tax-Backed Total | | | 121,374,669 | | |
| Transportation – 7.8% | |
| Ports – 0.5% | |
NY Port Authority of New York &
New Jersey | |
| Series 2004, | |
Insured: SYNC
5.000% 09/15/28 | | | 1,500,000 | | | | 1,559,325 | | |
| Ports Total | | | 1,559,325 | | |
| Toll Facilities – 3.4% | |
| NY Thruway Authority | |
Second General Highway & Bridge
Trust Fund, | |
Series 2005 A,
Insured: NPFGC
5.000% 04/01/22 | | | 500,000 | | | | 524,875 | | |
| Series 2005 B, | |
Insured: AMBAC
5.000% 04/01/19 | | | 2,500,000 | | | | 2,674,700 | | |
| Series 2008 A, | |
| 5.000% 04/01/21 | | | 1,000,000 | | | | 1,080,730 | | |
| NY Triborough Bridge & Tunnel Authority | |
| Series 2002, | |
| 5.250% 11/15/13 | | | 2,015,000 | | | | 2,282,532 | | |
| Series 2006 A, | |
| 5.000% 11/15/19 | | | 2,000,000 | | | | 2,190,080 | | |
| Series 2008 A, | |
| 5.000% 11/15/21 | | | 2,000,000 | | | | 2,199,500 | | |
| Toll Facilities Total | | | 10,952,417 | | |
| Transportation – 3.9% | |
| NY Metropolitan Transportation Authority | |
| Series 2005 B, | |
Insured: AMBAC
5.250% 11/15/24 | | | 750,000 | | | | 821,318 | | |
| Series 2005 C, | |
| 5.000% 11/15/16 | | | 750,000 | | | | 824,872 | | |
| Series 2006 A, | |
Insured: CIFG
5.000% 11/15/22 | | | 2,280,000 | | | | 2,379,978 | | |
| Series 2006 B, | |
| 5.000% 11/15/16 | | | 1,500,000 | | | | 1,649,745 | | |
See Accompanying Notes to Financial Statements.
81
Columbia New York Intermediate Municipal Bond Fund
October 31, 2009
| Municipal Bonds (continued) | |
| | | Par ($) | | Value ($) | |
| Series 2007 B, | |
| 5.000% 11/15/22 | | | 1,500,000 | | | | 1,575,720 | | |
| Series 2008 C, | |
| 6.250% 11/15/23 | | | 3,570,000 | | | | 4,062,517 | | |
| Series 2008, | |
| 5.000% 11/15/30 (b) | | | 1,000,000 | | | | 1,093,650 | | |
| Transportation Total | | | 12,407,800 | | |
| Transportation Total | | | 24,919,542 | | |
| Utilities – 7.6% | |
| Investor Owned – 0.8% | |
NY Energy Research & Development
Authority | |
| Rochester Gas & Electric, | |
Series 2004 A,
Insured: NPFGC
4.750% 05/15/32
(07/01/16) (b)(c) | | | 2,650,000 | | | | 2,692,241 | | |
| Investor Owned Total | | | 2,692,241 | | |
| Municipal Electric – 3.2% | |
| NY Long Island Power Authority | |
| Series 2009 A: | |
| 5.250% 04/01/21 | | | 1,000,000 | | | | 1,081,200 | | |
| 5.500% 04/01/22 | | | 5,000,000 | | | | 5,454,450 | | |
PR Commonwealth of Puerto Rico
Electric Power Authority | |
| Series 1997 BB, | |
Insured: NPFGC:
6.000% 07/01/11 | | | 2,500,000 | | | | 2,646,950 | | |
| 6.000% 07/01/12 | | | 1,000,000 | | | | 1,085,750 | | |
| Municipal Electric Total | | | 10,268,350 | | |
| Water & Sewer – 3.6% | |
| NY Municipal Water Finance Authority | |
| Series 2002, | |
Insured: FSA
5.375% 06/15/16 | | | 5,000,000 | | | | 5,497,900 | | |
| NY Onondaga County Water Authority | |
| Series 2005 A, | |
Insured: AMBAC:
5.000% 09/15/22 | | | 895,000 | | | | 941,907 | | |
| 5.000% 09/15/23 | | | 940,000 | | | | 992,217 | | |
NY Rensselaer County Water Service &
Sewer Authority | |
| Series 2008: | |
| 5.100% 09/01/28 | | | 1,155,000 | | | | 1,192,237 | | |
| 5.100% 09/01/28 | | | 1,060,000 | | | | 1,088,758 | | |
| | | Par ($) | | Value ($) | |
| NY Western Nassau County Water Authority | |
| Series 2005, | |
Insured: AMBAC
5.000% 05/01/22 | | | 1,765,000 | | | | 1,839,006 | | |
| Water & Sewer Total | | | 11,552,025 | | |
| Utilities Total | | | 24,512,616 | | |
Total Municipal Bonds
(cost of $301,663,835) | | | 312,890,899 | | |
| Investment Companies – 1.2% | |
| | | Shares | | | |
| Columbia New York Tax-Exempt | |
Reserves, Capital Class
(7 day yield of 0.130%) (g)(h) | | | 2,168,911 | | | | 2,168,911 | | |
| Dreyfus Cash Management | |
Plus Fund, Inc.
(7 day yield of 0.110%) | | | 1,638,392 | | | | 1,638,392 | | |
Total Investment Companies
(cost of $3,807,303) | | | 3,807,303 | | |
Total Investments – 98.8%
(cost of $305,471,138) (i) | | | 316,698,202 | | |
| Other Assets & Liabilities, Net – 1.2% | | | 3,894,668 | | |
| Net Assets – 100.0% | | | 320,592,870 | | |
Notes to Investment Portfolio:
(a) Zero coupon bond.
(b) The interest rate shown on floating rate or variable rate securities reflects the rate at October 31, 2009.
(c) Parenthetical date represents the next interest rate reset date for the security.
(d) Security purchased on a delayed delivery basis.
(e) The Fund has been informed that each issuer has placed direct obligations of the U.S. Government in an irrevocable trust, solely for the payment of principal and interest.
(f) Security exempt from registration pursuant to Rule 144A under the Securities Act of 1933. This security may be resold in transactions exempt from registration, normally to qualified institutional buyers. At October 31, 2009, this security, which is not illiquid, amounted to $908,270, which represents 0.3% of net assets.
(g) Investments in affiliates during the year ended October 31, 2009:
Security name: Columbia New York Tax-Exempt Reserves, Capital Class (7 day yield of 0.130%)
| Shares as of 10/31/08: | | | — | | |
| Shares purchased: | | | 60,188,086 | | |
| Shares sold: | | | (58,019,175 | ) | |
| Shares as of 10/31/09: | | | 2,168,911 | | |
| Net realized gain/loss: | | $ | — | | |
| Dividend income earned: | | $ | 18,366 | | |
| Value at end of period: | | $ | 2,168,911 | | |
(h) Money market mutual fund registered under the Investment Company Act of 1940, as amended, and advised by Columbia Management Advisors, LLC.
(i) Cost for federal income tax purposes is $305,405,572.
See Accompanying Notes to Financial Statements.
82
Columbia New York Intermediate Municipal Bond Fund
October 31, 2009
The following table summarizes the inputs used, as of October 31, 2009, in valuing the Fund's assets:
| Description | | Quoted Prices
(Level 1) | | Other
Significant
Observable
Inputs
(Level 2) | | Significant
Unobservable
Inputs
(Level 3) | | Total | |
| Total Municipal Bonds | | $ | — | | | $ | 312,890,899 | | | $ | — | | | $ | 312,890,899 | | |
Total Investment
Companies | | | 3,807,303 | | | | — | | | | — | | | | 3,807,303 | | |
| Total Investments | | $ | 3,807,303 | | | $ | 312,890,899 | | | $ | — | | | $ | 316,698,202 | | |
For more information on valuation inputs, and their aggregation into the levels used in the table above, please refer to the Security Valuation section in the accompanying Notes to Financial Statements.
At October 31, 2009, the composition of the Fund by revenue source is as follows:
| Holdings by Revenue Source (Unaudited) | | % of
Net Assets | |
| Tax-Backed | | | 37.9 | | |
| Refunded/Escrowed | | | 11.4 | | |
| Health Care | | | 10.6 | | |
| Education | | | 9.6 | | |
| Transportation | | | 7.8 | | |
| Utilities | | | 7.6 | | |
| Pool/Bond Bank | | | 6.9 | | |
| Other Revenue | | | 2.6 | | |
| Housing | | | 1.6 | | |
| Resource Recovery | | | 1.2 | | |
| Other | | | 0.4 | | |
| | | | 97.6 | | |
| Investment Companies | | | 1.2 | | |
| Other Assets & Liabilities, Net | | | 1.2 | | |
| | | | 100.0 | | |
| Acronym | | Name | |
| AGO | | Assured Guaranty Ltd. | |
|
| AMBAC | | Ambac Assurance Corp. | |
|
| CIFG | | CIFG Assurance North America, Inc. | |
|
| FGIC | | Financial Guaranty Insurance Co. | |
|
| FHA | | Federal Housing Administration | |
|
| FSA | | Financial Security Assurance, Inc. | |
|
| LOC | | Letter of Credit | |
|
| NPFGC | | National Public Finance Guarantee Corp. | |
|
| SONYMA | | State of New York Mortgage Agency | |
|
| SYNC | | Syncora Guarantee, Inc. | |
|
See Accompanying Notes to Financial Statements.
83
Investment Portfolio – Columbia Rhode Island Intermediate Municipal Bond Fund
October 31, 2009
| Municipal Bonds – 97.2% | |
| | | Par ($) | | Value ($) | |
| Education – 21.1% | |
| Education – 19.7% | |
PR Commonwealth of Puerto Rico
Industrial, Tourist, Educational, Medical &
Environmental Control Facilities | |
Universidad Interamericana de
Puerto Rico, Inc., | | | |
Series 1998 A,
Insured: NPFGC
5.500% 10/01/14 | | | 350,000 | | | | 356,269 | | |
| RI Economic Development Corp. | |
Higher Education Facility,
University of Rhode Island, | | | |
Series 1999,
Insured: FSA
5.000% 11/01/19 | | | 750,000 | | | | 758,175 | | |
| RI Health & Educational Building Corp. | |
| Higher Education Facility: | |
Brown University,
Series 2007,
5.000% 09/01/18 | | | 1,000,000 | | | | 1,134,440 | | |
Johnson & Wales:
Series 1999,
Insured: NPFGC:
5.500% 04/01/15 | | | 1,000,000 | | | | 1,081,660 | | |
| 5.500% 04/01/17 | | | 1,000,000 | | | | 1,074,520 | | |
| 5.500% 04/01/18 | | | 1,420,000 | | | | 1,517,824 | | |
Series 2003,
Insured: SYNC
5.250% 04/01/16 | | | 1,485,000 | | | | 1,514,596 | | |
New England Institute,
Series 2007,
Insured: AMBAC
4.500% 03/01/26 | | | 500,000 | | | | 466,455 | | |
Providence College,
Series 2003 A,
Insured: SYNC
5.000% 11/01/24 | | | 2,500,000 | | | | 2,547,150 | | |
Rhode Island School of Design:
Series 2003 A,
Insured: AMBAC
5.000% 09/15/13 | | | 1,040,000 | | | | 1,145,778 | | |
Series 2004 A,
Insured: AMBAC
5.250% 09/15/20 | | | 1,020,000 | | | | 1,094,246 | | |
Series 2004 D,
Insured: SYNC:
5.500% 08/15/16 | | | 1,340,000 | | | | 1,452,841 | | |
| 5.500% 08/15/17 | | | 1,345,000 | | | | 1,446,238 | | |
| | | Par ($) | | Value ($) | |
Series 2008 A,
6.500% 09/15/28 | | | 3,000,000 | | | | 3,351,060 | | |
Roger Williams College,
Series 1998,
Insured: AMBAC
5.125% 11/15/14 | | | 1,000,000 | | | | 1,012,790 | | |
| Series 2009 A | |
Insured: AGO
4.750% 09/15/24 | | | 1,000,000 | | | | 1,022,110 | | |
| Education Total | | | 20,976,152 | | |
| Prep School – 1.4% | |
| RI Health & Educational Building Corp. | |
| Educational Institution Revenue, | |
Times2 Academy,
Series 2004,
LOC: Citizens Bank
5.000% 12/15/24 | | | 1,500,000 | | | | 1,504,620 | | |
| Prep School Total | | | 1,504,620 | | |
| Education Total | | | 22,480,772 | | |
| Health Care – 3.0% | |
| Hospitals – 3.0% | |
| RI Health & Educational Building Corp. | |
| Rhode Island Hospital: | |
Series 2002,
6.375% 08/15/21 | | | 205,000 | | | | 211,271 | | |
Series 2006,
Insured: FSA
5.000% 05/15/26 | | | 2,000,000 | | | | 2,027,780 | | |
Series 2009,
Insured: AGO:
6.125% 05/15/27 | | | 400,000 | | | | 437,620 | | |
| 6.250% 05/15/30 | | | 500,000 | | | | 544,185 | | |
| Hospitals Total | | | 3,220,856 | | |
| Health Care Total | | | 3,220,856 | | |
| Housing – 3.8% | |
| Assisted Living/Senior – 0.4% | |
| RI Health & Educational Building Corp. | |
| The Frassati Residence, | |
Series 1999 A,
Pre-Refunded 11/15/09,
LOC: Allied Irish Bank PLC
6.125% 11/15/18 | | | 450,000 | | | | 455,180 | | |
| Assisted Living/Senior Total | | | 455,180 | | |
See Accompanying Notes to Financial Statements.
84
Columbia Rhode Island Intermediate Municipal Bond Fund
October 31, 2009
| Municipal Bonds (continued) | |
| | | Par ($) | | Value ($) | |
| Multi-Family – 1.0% | |
PR Commonwealth of Puerto Rico
Housing Finance Authority | |
| Series 2008, | |
| 5.000% 12/01/13 | | | 800,000 | | | | 866,688 | | |
| RI Housing & Mortgage Finance Corp. | |
| Multi-Family Housing: | |
Series 1995 A,
Insured: AMBAC
6.150% 07/01/17 | | | 70,000 | | | | 70,119 | | |
Series 1997 A,
Insured: AMBAC
5.600% 07/01/10 | | | 75,000 | | | | 75,251 | | |
| Multi-Family Total | | | 1,012,058 | | |
| Single-Family – 2.4% | |
| RI Housing & Mortgage Finance Corp. | |
| Series 2003, | |
| 4.450% 04/01/17 | | | 2,000,000 | | | | 2,008,800 | | |
| RI Providence Housing Authority | |
| Series 2008, | |
| 5.000% 09/01/24 | | | 565,000 | | | | 596,894 | | |
| Single-Family Total | | | 2,605,694 | | |
| Housing Total | | | 4,072,932 | | |
| Other – 23.2% | |
| Other – 1.5% | |
| RI Providence Housing Authority | |
| Series 2008: | |
| 5.000% 09/01/25 | | | 590,000 | | | | 620,296 | | |
| 5.000% 09/01/26 | | | 310,000 | | | | 325,246 | | |
| 5.000% 09/01/27 | | | 690,000 | | | | 720,705 | | |
| Other Total | | | 1,666,247 | | |
| Pool/Bond Bank – 5.3% | |
| RI Clean Water Finance Agency | |
Water Pollution Control Revenue,
Revolving Fund, | | | |
Pooled Loan Association:
Series 1999 A,
Insured: AMBAC:
5.250% 10/01/16 | | | 500,000 | | | | 500,920 | | |
Series 2004 A,
4.750% 10/01/23 | | | 1,000,000 | | | | 1,054,030 | | |
Series 2006 A,
4.500% 10/01/22 | | | 1,000,000 | | | | 1,058,750 | | |
| | | Par ($) | | Value ($) | |
Series 2007 A,
4.750% 10/01/21 | | | 1,000,000 | | | | 1,097,240 | | |
| Series 2009 A | |
| 5.000% 10/01/25 | | | 720,000 | | | | 792,266 | | |
| Safe Drinking Water Revolving, | |
Series 2004 A,
5.000% 10/01/18 | | | 1,000,000 | | | | 1,109,600 | | |
| Pool/Bond Bank Total | | | 5,612,806 | | |
| Refunded/Escrowed (a) – 15.3% | |
| RI & Providence Plantations | |
| Series 2001 C, | |
Economically Defeased to Maturity,
5.000% 09/01/11 | | | 2,000,000 | | | | 2,156,180 | | |
| RI Depositors Economic Protection Corp. | |
| Special Obligation: | |
Series 1993 A:
Escrowed to Maturity:
Insured: FSA:
5.750% 08/01/14 | | | 1,000,000 | | | | 1,142,670 | | |
| 5.750% 08/01/21 | | | 2,165,000 | | | | 2,621,274 | | |
Insured: NPFGC
5.875% 08/01/11 | | | 2,500,000 | | | | 2,688,650 | | |
Pre-refunded 08/01/13,
Insured: FSA
5.750% 08/01/14 | | | 2,105,000 | | | | 2,427,128 | | |
Series 1993 B:
Escrowed to Maturity,
Insured: NPFGC
5.800% 08/01/12 | | | 1,000,000 | | | | 1,125,830 | | |
Pre-refunded 02/01/11,
Insured: NPFGC
5.250% 08/01/21 | | | 250,000 | | | | 264,278 | | |
| RI Health & Educational Building Corp. | |
| Higher Education Facility, | |
University of Rhode Island,
Series 2000 B,
Pre-refunded 09/15/10:
Insured: AMBAC
5.700% 09/15/30 | | | 2,250,000 | | | | 2,373,682 | | |
| Hospital Financing Lifespan, | |
Series 2002,
Pre-refunded 08/15/12,
6.375% 08/15/21 | | | 1,295,000 | | | | 1,465,034 | | |
| Refunded/Escrowed Total | | | 16,264,726 | | |
See Accompanying Notes to Financial Statements.
85
Columbia Rhode Island Intermediate Municipal Bond Fund
October 31, 2009
| Municipal Bonds (continued) | |
| | | Par ($) | | Value ($) | |
| Tobacco – 1.1% | |
| RI Tobacco Settlement Financing Corp. | |
| Rhode Island Revenue, Asset Backed, | |
Series 2002 A,
6.000% 06/01/23 | | | 1,150,000 | | | | 1,158,395 | | |
| Tobacco Total | | | 1,158,395 | | |
| Other Total | | | 24,702,174 | | |
| Tax-Backed – 32.2% | |
| Local Appropriated – 8.6% | |
| RI Health & Educational Building Corp. | |
| Series 2006 A, | |
Insured: FSA
5.000% 05/15/23 | | | 2,000,000 | | | | 2,095,200 | | |
| Series 2007 A, | |
Insured: FSA
5.000% 05/15/22 | | | 2,000,000 | | | | 2,118,120 | | |
| Series 2007 C, | |
Insured: FSA
5.000% 05/15/21 | | | 1,500,000 | | | | 1,598,205 | | |
| RI Providence Public Building Authority | |
| School & Public Facilities Project: | |
Series 1998 A,
Insured: FSA
5.250% 12/15/14 | | | 1,000,000 | | | | 1,023,260 | | |
Series 1999 A,
Insured: AMBAC
5.125% 12/15/14 | | | 500,000 | | | | 511,045 | | |
| RI Smithfield | |
| Lease Participation Certificates, | |
Wastewater Treatment Facility Loan,
Series 2003 A,
Insured: NPFGC:
5.000% 11/15/11 | | | 810,000 | | | | 866,198 | | |
| 5.000% 11/15/12 | | | 855,000 | | | | 933,130 | | |
| Local Appropriated Total | | | 9,145,158 | | |
| Local General Obligations – 13.7% | |
PR Commonwealth of Puerto Rico
Municipal Finance Agency | |
| Series 1997 A, | |
Insured: FSA
5.500% 07/01/17 | | | 75,000 | | | | 75,088 | | |
| RI City of Cranston | |
| Series 2005, | |
Insured: AMBAC
5.000% 07/15/15 | | | 2,280,000 | | | | 2,535,588 | | |
| | | Par ($) | | Value ($) | |
| Series 2008, | |
Insured: FSA:
4.750% 07/01/26 | | | 900,000 | | | | 928,998 | | |
| 4.750% 07/01/27 | | | 945,000 | | | | 971,318 | | |
| 4.750% 07/01/28 | | | 990,000 | | | | 1,012,542 | | |
| RI Coventry | |
| Series 2002, | |
Insured: AMBAC:
5.000% 06/15/21 | | | 750,000 | | | | 784,470 | | |
| 5.000% 06/15/22 | | | 750,000 | | | | 782,355 | | |
| RI Health & Educational Building Corp. | |
| Series 2009 A, | |
| 5.000% 05/15/25 | | | 1,515,000 | | | | 1,573,918 | | |
| RI Johnston | |
| Series 2004, | |
Insured: SYNC
5.250% 06/01/19 | | | 525,000 | | | | 535,484 | | |
| Series 2005, | |
Insured: FSA:
4.750% 06/01/21 | | | 390,000 | | | | 404,855 | | |
| 4.750% 06/01/22 | | | 405,000 | | | | 418,665 | | |
| 4.750% 06/01/23 | | | 425,000 | | | | 438,439 | | |
| 4.750% 06/01/24 | | | 445,000 | | | | 458,177 | | |
| 4.750% 06/01/25 | | | 460,000 | | | | 470,856 | | |
| Various Purpose, | |
Series 2004,
Insured: SYNC
5.250% 06/01/20 | | | 555,000 | | | | 562,365 | | |
| RI Providence | |
| Series 2001 C, | |
Insured: FGIC
5.500% 01/15/13 | | | 1,890,000 | | | | 2,091,587 | | |
| RI Woonsocket | |
| Series 2005, | |
Insured: AMBAC
4.250% 03/01/25 | | | 550,000 | | | | 530,717 | | |
| Local General Obligations Total | | | 14,575,422 | | |
| Special Non-Property Tax – 2.7% | |
| RI Economic Development Corp. | |
| Series 2000, | |
Insured: RAD
6.125% 07/01/20 | | | 1,850,000 | | | | 1,831,426 | | |
| RI Convention Center Authority Revenue | |
| Series 2005 A, | |
Insured: FSA
5.000% 05/15/23 | | | 1,005,000 | | | | 1,034,346 | | |
| Special Non-Property Tax Total | | | 2,865,772 | | |
See Accompanying Notes to Financial Statements.
86
Columbia Rhode Island Intermediate Municipal Bond Fund
October 31, 2009
| Municipal Bonds (continued) | |
| | | Par ($) | | Value ($) | |
| State Appropriated – 2.0% | |
| RI & Providence Plantations | |
| Series 2005 A, | |
Insured: NPFGC
5.000% 10/01/19 | | | 1,200,000 | | | | 1,261,560 | | |
| RI Economic Development Corp. | |
Economic Development Revenue,
East Greenwich Free Library Association, | | | |
Series 2004:
4.500% 06/15/14 | | | 245,000 | | | | 239,385 | | |
| 5.750% 06/15/24 | | | 415,000 | | | | 382,941 | | |
| RI Health & Educational Building Corp. | |
| Series 2007 B, | |
Insured: AMBAC
4.250% 05/15/19 | | | 250,000 | | | | 257,165 | | |
| State Appropriated Total | | | 2,141,051 | | |
| State General Obligations – 5.2% | |
| RI & Providence Plantations | |
| Series 2005 A, | |
Insured: FSA
5.000% 08/01/17 | | | 2,000,000 | | | | 2,255,160 | | |
| Series 2006 A, | |
Insured: FSA
4.500% 08/01/20 | | | 2,000,000 | | | | 2,134,020 | | |
| Series 2006 C, | |
Insured: NPFGC
5.000% 11/15/18 | | | 1,000,000 | | | | 1,118,220 | | |
| State General Obligations Total | | | 5,507,400 | | |
| Tax-Backed Total | | | 34,234,803 | | |
| Transportation – 7.3% | |
| Airports – 3.0% | |
| RI Economic Development Corp. | |
| Rhode Island Airport Corp., | |
Series 2008 C,
Insured: AGO
5.000% 07/01/17 | | | 2,245,000 | | | | 2,495,205 | | |
| Series 1998 B, | |
Insured: FSA
5.000% 07/01/23 | | | 685,000 | | | | 690,165 | | |
| Airports Total | | | 3,185,370 | | |
| Transportation – 4.3% | |
| RI Economic Development Corp. | |
Grant Anticipation Note,
Rhode Island Department Transportation, | | | |
Series 2003 C,
Insured: FSA
5.000% 06/15/14 | | | 2,225,000 | | | | 2,419,621 | | |
| | | Par ($) | | Value ($) | |
| Series 2009, | |
Insured: AGO
5.250% 06/15/21 | | | 2,000,000 | | | | 2,190,980 | | |
| Transportation Total | | | 4,610,601 | | |
| Transportation Total | | | 7,795,971 | | |
| Utilities – 6.6% | |
| Municipal Electric – 0.7% | |
PR Commonwealth of Puerto Rico Electric
Power Authority | |
| Series 1998 EE, | |
Insured: NPFGC
5.250% 07/01/15 | | | 500,000 | | | | 504,280 | | |
| Series 2003 NN, | |
Insured: NPFGC
5.250% 07/01/19 | | | 215,000 | | | | 226,223 | | |
| Municipal Electric Total | | | 730,503 | | |
| Water & Sewer – 5.9% | |
| RI Bristol County Water Authority Revenue | |
| Series 1997 A, | |
Insured: NPFGC
5.000% 07/01/16 | | | 500,000 | | | | 501,345 | | |
| RI Kent County Water Authority | |
| Series 2002 A, | |
Insured: NPFGC:
5.000% 07/15/15 | | | 750,000 | | | | 813,622 | | |
| 5.000% 07/15/16 | | | 1,265,000 | | | | 1,372,310 | | |
RI Narragansett Bay Commission
Wastewater System Revenue | |
| Series 2005 A, | |
Insured: NPFGC
5.000% 08/01/26 | | | 2,500,000 | | | | 2,558,750 | | |
| RI Narragansett Bay Commission | |
| Series 2007 A, | |
Insured: NPFGC
5.000% 02/01/32 | | | 1,000,000 | | | | 1,007,180 | | |
| Water & Sewer Total | | | 6,253,207 | | |
| Utilities Total | | | 6,983,710 | | |
Total Municipal Bonds
(cost of $99,627,229) | | | 103,491,218 | | |
See Accompanying Notes to Financial Statements.
87
Columbia Rhode Island Intermediate Municipal Bond Fund
October 31, 2009
| Investment Companies – 1.7% | |
| | | Shares | | Value ($) | |
Columbia Tax-Exempt Reserves,
Capital Class
(7 day yield of 0.170%) (b)(c) | | | 948,880 | | | | 948,880 | | |
Dreyfus Tax-Exempt Cash
Management Fund
(7 day yield of 0.110%) | | | 871,566 | | | | 871,566 | | |
Total Investment Companies
(cost of $1,820,446) | | | 1,820,446 | | |
Total Investments – 98.9%
(cost of $101,447,675) (d) | | | 105,311,664 | | |
| Other Assets & Liabilities, Net – 1.1% | | | 1,188,889 | | |
| Net Assets – 100.0% | | | 106,500,553 | | |
Notes to Investment Portfolio:
(a) The Fund has been informed that each issuer has placed direct obligations of the U.S. Government in an irrevocable trust, solely for the payment of principal and interest.
(b) Investments in affiliates during the year ended October 31, 2009:
| Security name: Columbia Tax-Exempt Reserves, Capital Class (7 day yield of 0.170%). | |
| Shares as of 10/31/08: | | | — | | |
| Shares purchased: | | | 16,029,131 | | |
| Shares sold: | | | (15,080,251 | ) | |
| Shares as of 10/31/09: | | | 948,880 | | |
| Net realized gain/loss: | | $ | — | | |
| Dividend income earned: | | $ | 3,280 | | |
| Value at end of period: | | $ | 948,880 | | |
(c) Money market mutual fund registered under the Investment Company Act of 1940, as amended, and advised by Columbia Management Advisors, LLC.
(d) Cost for federal income tax purposes is $101,399,464.
The following table summarizes the inputs used, as of October 31, 2009, in valuing the Fund's assets:
| Description | | Quoted Prices
(Level 1) | | Other
Significant
Observable
Inputs
(Level 2) | | Significant
Unobservable
Inputs
(Level 3) | | Total | |
| Total Municipal Bonds | | $ | — | | | $ | 103,491,218 | | | $ | — | | | $ | 103,491,218 | | |
Total Investment
Companies | | | 1,820,446 | | | | — | | | | — | | | | 1,820,446 | | |
| Total Investments | | $ | 1,820,446 | | | $ | 103,491,218 | | | $ | — | | | $ | 105,311,664 | | |
For more information on valuation inputs, and their aggregation into the levels used in the table above, please refer to the Security Valuation section in the accompanying Notes to Financial Statements.
At October 31, 2009, the composition of the Fund by revenue source is as follows:
| Holdings by Revenue Source (Unaudited) | | % of
Net Assets | |
| Tax-Backed | | | 32.2 | | |
| Education | | | 21.1 | | |
| Refunded/Escrowed | | | 15.3 | | |
| Transportation | | | 7.3 | | |
| Utilities | | | 6.6 | | |
| Pool/Bond Bank | | | 5.3 | | |
| Housing | | | 3.8 | | |
| Health Care | | | 3.0 | | |
| Other | | | 1.5 | | |
| Tobacco | | | 1.1 | | |
| | | | 97.2 | | |
| Investment Companies | | | 1.7 | | |
| Other Assets & Liabilities, Net | | | 1.1 | | |
| | | | 100.0 | | |
| Acronym | | Name | |
| AGO | | Assured Guaranty Ltd. | |
|
| AMBAC | | Ambac Assurance Corp. | |
|
| FGIC | | Financial Guaranty Insurance Co. | |
|
| FSA | | Financial Security Assurance, Inc. | |
|
| LOC | | Letter of Credit | |
|
| NPFGC | | National Public Finance Guarantee Corp. | |
|
| RAD | | Radian Asset Assurance, Inc. | |
|
| SYNC | | Syncora Guarantee, Inc. | |
|
See Accompanying Notes to Financial Statements.
88
This page intentionally left blank.
Statements of Assets and Liabilities – Columbia Tax-Exempt Bond Funds
October 31, 2009
| | | ($) | | ($) | | ($) | |
| | | Columbia
Connecticut
Intermediate
Municipal
Bond Fund | | Columbia
Intermediate
Municipal
Bond Fund | | Columbia
Massachusetts
Intermediate
Municipal
Bond Fund | |
| Assets | |
| Unaffiliated investments, at identified cost | | | 231,643,581 | | | | 2,436,405,793 | | | | 327,479,051 | | |
| Affiliated investments, at identified cost | | | 2,339,181 | | | | 15,716,386 | | | | 2,917,706 | | |
| Total investments, at identified cost | | | 233,982,762 | | | | 2,452,122,179 | | | | 330,396,757 | | |
| Unaffiliated investments, at value | | | 238,088,880 | | | | 2,484,924,980 | | | | 341,258,975 | | |
| Affiliated investments, at value | | | 2,339,181 | | | | 15,716,386 | | | | 2,917,706 | | |
| Total investments, at value | | | 240,428,061 | | | | 2,500,641,366 | | | | 344,176,681 | | |
| Cash | | | 446 | | | | 698 | | | | 42 | | |
| Receivable for: | |
| Investments sold | | | — | | | | 18,897,381 | | | | — | | |
| Fund shares sold | | | 57,605 | | | | 1,852,530 | | | | 220,170 | | |
| Interest | | | 3,010,491 | | | | 35,456,988 | | | | 4,506,985 | | |
| Expense reimbursement due from investment advisor | | | 30,598 | | | | — | | | | 58,187 | | |
| Trustees' deferred compensation plan | | | 22,103 | | | | 115,126 | | | | 30,293 | | |
| Prepaid expenses | | | 713 | | | | 25,598 | | | | 1,108 | | |
| Total Assets | | | 243,550,017 | | | | 2,556,989,687 | | | | 348,993,466 | | |
| Liabilities | |
| Payable for: | |
| Investments purchased on a delayed delivery basis | | | 4,081,825 | | | | 42,067,996 | | | | — | | |
| Fund shares repurchased | | | 27,225 | | | | 2,784,115 | | | | 62,348 | | |
| Distributions | | | 605,870 | | | | 7,064,977 | | | | 830,757 | | |
| Investment advisory fee | | | 98,021 | | | | 879,277 | | | | 142,703 | | |
| Administration fee | | | 13,682 | | | | 143,841 | | | | 19,919 | | |
| Pricing and bookkeeping fees | | | 10,791 | | | | 32,015 | | | | 13,258 | | |
| Transfer agent fee | | | 6,413 | | | | 60,172 | | | | 3,344 | | |
| Trustees' fees | | | 263 | | | | 205,474 | | | | 999 | | |
| Audit fee | | | 35,901 | | | | 40,700 | | | | 35,900 | | |
| Custody fee | | | 2,298 | | | | 10,641 | | | | 2,767 | | |
| Distribution and service fees | | | 10,843 | | | | 25,785 | | | | 14,491 | | |
| Chief compliance officer expenses | | | 44 | | | | 104 | | | | 47 | | |
| Trustees' deferred compensation plan | | | 22,103 | | | | 115,126 | | | | 30,293 | | |
| Other liabilities | | | 10,544 | | | | 42,245 | | | | 16,291 | | |
| Total Liabilities | | | 4,925,823 | | | | 53,472,468 | | | | 1,173,117 | | |
| Net Assets | | | 238,624,194 | | | | 2,503,517,219 | | | | 347,820,349 | | |
| Net Assets Consist of | |
| Paid-in capital | | | 233,061,375 | | | | 2,463,457,776 | | | | 334,599,706 | | |
| Undistributed net investment income | | | 110,411 | | | | 1,640,134 | | | | 53,828 | | |
| Accumulated net realized loss | | | (992,891 | ) | | | (10,099,878 | ) | | | (613,109 | ) | |
| Net unrealized appreciation on investments | | | 6,445,299 | | | | 48,519,187 | | | | 13,779,924 | | |
| Net Assets | | | 238,624,194 | | | | 2,503,517,219 | | | | 347,820,349 | | |
See Accompanying Notes to Financial Statements.
90
| | | ($) | | ($) | | ($) | |
| | | Columbia
New Jersey
Intermediate
Municipal
Bond Fund | | Columbia
New York
Intermediate
Municipal
Bond Fund | | Columbia
Rhode Island
Intermediate
Municipal
Bond Fund | |
| Assets | |
| Unaffiliated investments, at identified cost | | | 74,392,548 | | | | 303,302,227 | | | | 100,498,795 | | |
| Affiliated investments, at identified cost | | | 2,087,016 | | | | 2,168,911 | | | | 948,880 | | |
| Total investments, at identified cost | | | 76,479,564 | | | | 305,471,138 | | | | 101,447,675 | | |
| Unaffiliated investments, at value | | | 76,531,327 | | | | 314,529,291 | | | | 104,362,784 | | |
| Affiliated investments, at value | | | 2,087,016 | | | | 2,168,911 | | | | 948,880 | | |
| Total investments, at value | | | 78,618,343 | | | | 316,698,202 | | | | 105,311,664 | | |
| Cash | | | 58 | | | | 107 | | | | 530 | | |
| Receivable for: | |
| Investments sold | | | — | | | | 4,163,461 | | | | — | | |
| Fund shares sold | | | 53,075 | | | | 559,522 | | | | 172,805 | | |
| Interest | | | 937,552 | | | | 4,325,553 | | | | 1,424,698 | | |
| Expense reimbursement due from investment advisor | | | 35,166 | | | | 65,993 | | | | 30,024 | | |
| Trustees' deferred compensation plan | | | 15,149 | | | | 20,509 | | | | 19,213 | | |
| Prepaid expenses | | | 232 | | | | 7,254 | | | | 394 | | |
| Total Assets | | | 79,659,575 | | | | 325,840,601 | | | | 106,959,328 | | |
| Liabilities | |
| Payable for: | |
| Investments purchased on a delayed delivery basis | | | 1,065,630 | | | | 4,114,360 | | | | — | | |
| Fund shares repurchased | | | 13,055 | | | | 80,381 | | | | 40,865 | | |
| Distributions | | | 185,749 | | | | 810,852 | | | | 299,402 | | |
| Investment advisory fee | | | 32,086 | | | | 131,354 | | | | 43,641 | | |
| Administration fee | | | 4,479 | | | | 18,335 | | | | 6,091 | | |
| Pricing and bookkeeping fees | | | 9,813 | | | | 12,829 | | | | 7,829 | | |
| Transfer agent fee | | | 1,900 | | | | 2,069 | | | | 1,397 | | |
| Trustees' fees | | | 79 | | | | 373 | | | | 113 | | |
| Audit fee | | | 31,199 | | | | 33,200 | | | | 31,200 | | |
| Custody fee | | | 1,799 | | | | 2,910 | | | | 670 | | |
| Distribution and service fees | | | 5,123 | | | | 7,740 | | | | 1,644 | | |
| Chief compliance officer expenses | | | 44 | | | | 56 | | | | 41 | | |
| Trustees' deferred compensation plan | | | 15,149 | | | | 20,509 | | | | 19,213 | | |
| Other liabilities | | | 8,210 | | | | 12,763 | | | | 6,669 | | |
| Total Liabilities | | | 1,374,315 | | | | 5,247,731 | | | | 458,775 | | |
| Net Assets | | | 78,285,260 | | | | 320,592,870 | | | | 106,500,553 | | |
| Net Assets Consist of | |
| Paid-in capital | | | 76,309,939 | | | | 311,441,554 | | | | 102,789,806 | | |
| Undistributed net investment income | | | 8,750 | | | | 112,524 | | | | 27,117 | | |
| Accumulated net realized loss | | | (172,208 | ) | | | (2,188,272 | ) | | | (180,359 | ) | |
| Net unrealized appreciation on investments | | | 2,138,779 | | | | 11,227,064 | | | | 3,863,989 | | |
| Net Assets | | | 78,285,260 | | | | 320,592,870 | | | | 106,500,553 | | |
See Accompanying Notes to Financial Statements.
91
Statements of Assets and Liabilities (continued) – Columbia Tax-Exempt Bond Funds
October 31, 2009
| | | Columbia
Connecticut
Intermediate
Municipal
Bond Fund | | Columbia
Intermediate
Municipal
Bond Fund | | Columbia
Massachusetts
Intermediate
Municipal
Bond Fund | |
| Class A | |
| Net assets | | $ | 10,862,968 | | | $ | 85,641,584 | | | $ | 16,049,149 | | |
| Shares outstanding | | | 1,016,508 | | | | 8,381,855 | | | | 1,513,243 | | |
| Net asset value per share (a) | | $ | 10.69 | | | $ | 10.22 | | | $ | 10.61 | | |
| Maximum sales charge | | | 3.25 | % | | | 3.25 | % | | | 3.25 | % | |
| Maximum offering price per share (b) | | $ | 11.05 | | | $ | 10.56 | | | $ | 10.97 | | |
| Class B | |
| Net assets | | $ | 1,995,310 | | | $ | 5,293,875 | | | $ | 1,222,113 | | |
| Shares outstanding | | | 186,699 | | | | 518,122 | | | | 115,231 | | |
| Net asset value and offering price per share (a) | | $ | 10.69 | | | $ | 10.22 | | | $ | 10.61 | | |
| Class C | |
| Net assets | | $ | 8,046,921 | | | $ | 17,304,279 | | | $ | 8,859,147 | | |
| Shares outstanding | | | 752,945 | | | | 1,693,586 | | | | 835,305 | | |
| Net asset value and offering price per share (a) | | $ | 10.69 | | | $ | 10.22 | | | $ | 10.61 | | |
| Class T | |
| Net assets | | $ | 16,888,733 | | | $ | 10,462,224 | | | $ | 39,221,201 | | |
| Shares outstanding | | | 1,580,272 | | | | 1,023,957 | | | | 3,698,147 | | |
| Net asset value per share (a) | | $ | 10.69 | | | $ | 10.22 | | | $ | 10.61 | | |
| Maximum sales charge | | | 4.75 | % | | | 4.75 | % | | | 4.75 | % | |
| Maximum offering price per share (b) | | $ | 11.22 | | | $ | 10.73 | | | $ | 11.14 | | |
| Class Z | |
| Net assets | | $ | 200,830,262 | | | $ | 2,384,815,257 | | | $ | 282,468,739 | | |
| Shares outstanding | | | 18,791,831 | | | | 233,408,772 | | | | 26,633,771 | | |
| Net asset value, offering and redemption price per share | | $ | 10.69 | | | $ | 10.22 | | | $ | 10.61 | | |
(a) Redemption price per share is equal to net asset value less any applicable contingent deferred sales charge.
(b) On sales of $50,000 or more the offering price is reduced.
See Accompanying Notes to Financial Statements.
92
| | | Columbia
New Jersey
Intermediate
Municipal
Bond Fund | | Columbia
New York
Intermediate
Municipal
Bond Fund | | Columbia
Rhode Island
Intermediate
Municipal
Bond Fund | |
| Class A | |
| Net assets | | $ | 4,974,262 | | | $ | 8,451,786 | | | $ | 2,432,108 | | |
| Shares outstanding | | | 491,913 | | | | 718,535 | | | | 218,447 | | |
| Net asset value per share (a) | | $ | 10.11 | | | $ | 11.76 | | | $ | 11.13 | | |
| Maximum sales charge | | | 3.25 | % | | | 3.25 | % | | | 3.25 | % | |
| Maximum offering price per share (b) | | $ | 10.45 | | | $ | 12.16 | | | $ | 11.50 | | |
| Class B | |
| Net assets | | $ | 1,205,120 | | | $ | 1,453,076 | | | $ | 282,118 | | |
| Shares outstanding | | | 119,179 | | | | 123,533 | | | | 25,338 | | |
| Net asset value and offering price per share (a) | | $ | 10.11 | | | $ | 11.76 | | | $ | 11.13 | | |
| Class C | |
| Net assets | | $ | 4,622,771 | | | $ | 5,861,049 | | | $ | 1,604,939 | | |
| Shares outstanding | | | 457,187 | | | | 498,294 | | | | 144,150 | | |
| Net asset value and offering price per share (a) | | $ | 10.11 | | | $ | 11.76 | | | $ | 11.13 | | |
| Class T | |
| Net assets | | $ | 3,725,909 | | | $ | 11,666,915 | | | $ | 8,759,737 | | |
| Shares outstanding | | | 368,477 | | | | 991,881 | | | | 786,780 | | |
| Net asset value per share (a) | | $ | 10.11 | | | $ | 11.76 | | | $ | 11.13 | | |
| Maximum sales charge | | | 4.75 | % | | | 4.75 | % | | | 4.75 | % | |
| Maximum offering price per share (b) | | $ | 10.61 | | | $ | 12.35 | | | $ | 11.69 | | |
| Class Z | |
| Net assets | | $ | 63,757,198 | | | $ | 293,160,044 | | | $ | 93,421,651 | | |
| Shares outstanding | | | 6,305,385 | | | | 24,923,400 | | | | 8,390,892 | | |
| Net asset value, offering and redemption price per share | | $ | 10.11 | | | $ | 11.76 | | | $ | 11.13 | | |
See Accompanying Notes to Financial Statements.
93
Statements of Operations – Columbia Tax-Exempt Bond Funds
For the Year Ended October 31, 2009
| | | ($) | | ($) | | ($) | |
| | | Columbia
Connecticut
Intermediate
Municipal
Bond Fund | |
Columbia
Intermediate
Municipal
Bond Fund | | Columbia
Massachusetts
Intermediate
Municipal
Bond Fund | |
| Investment Income | |
| Interest | | | 9,366,007 | | | | 107,235,781 | | | | 13,765,077 | | |
| Dividends | | | 23,793 | | | | 235,418 | | | | 13,637 | | |
| Dividends from affiliates | | | 9,497 | | | | 111,915 | | | | 10,882 | | |
| Total Investment Income | | | 9,399,297 | | | | 107,583,114 | | | | 13,789,596 | | |
| Expenses | |
| Investment advisory fee | | | 1,091,965 | | | | 10,049,028 | | | | 1,610,500 | | |
| Administration fee | | | 152,420 | | | | 1,638,608 | | | | 224,799 | | |
| Distribution fee: | |
| Class B | | | 18,197 | | | | 37,679 | | | | 10,423 | | |
| Class C | | | 52,195 | | | | 99,971 | | | | 47,375 | | |
| Service fee: | |
| Class A | | | 33,616 | | | | 160,061 | | | | 39,310 | | |
| Class B | | | 6,066 | | | | 11,594 | | | | 3,474 | | |
| Class C | | | 17,398 | | | | 30,748 | | | | 15,788 | | |
| Shareholder service fee—Class T | | | 26,408 | | | | 15,947 | | | | 58,747 | | |
| Pricing and bookkeeping fees | | | 92,354 | | | | 225,008 | | | | 110,446 | | |
| Transfer agent fee | | | 33,012 | | | | 649,065 | | | | 28,295 | | |
| Trustees' fees | | | 24,592 | | | | 138,434 | | | | 30,827 | | |
| Custody fee | | | 12,857 | | | | 55,442 | | | | 13,677 | | |
| Registration fees | | | 38,694 | | | | 55,958 | | | | 39,354 | | |
| Audit fee | | | 44,613 | | | | 47,804 | | | | 42,538 | | |
| Chief compliance officer expenses | | | 656 | | | | 1,545 | | | | 696 | | |
| Other expenses | | | 79,142 | | | | 385,605 | | | | 98,831 | | |
| Total Expenses | | | 1,724,185 | | | | 13,602,497 | | | | 2,375,080 | | |
| Fees waived or expenses reimbursed by investment advisor | | | (353,794 | ) | | | (201,056 | ) | | | (407,124 | ) | |
| Fees waived by distributor—Class C | | | (24,357 | ) | | | (69,183 | ) | | | (22,104 | ) | |
| Expense reductions | | | (1,760 | ) | | | (4,778 | ) | | | (1,423 | ) | |
| Net Expenses | | | 1,344,274 | | | | 13,327,480 | | | | 1,944,429 | | |
| Net Investment Income | | | 8,055,023 | | | | 94,255,634 | | | | 11,845,167 | | |
| Net Realized and Unrealized Gain (Loss) on Investments | |
| Net realized loss on investments | | | (492,173 | ) | | | (3,339,214 | ) | | | (297,655 | ) | |
| Net change in unrealized appreciation (depreciation) on investments | | | 13,832,643 | | | | 148,190,263 | | | | 22,331,983 | | |
| Net Gain | | | 13,340,470 | | | | 144,851,049 | | | | 22,034,328 | | |
| Net Increase Resulting from Operations | | | 21,395,493 | | | | 239,106,683 | | | | 33,879,495 | | |
See Accompanying Notes to Financial Statements.
94
| | | ($) | | ($) | | ($) | |
| | | Columbia
New Jersey
Intermediate
Municipal
Bond Fund | | Columbia
New York
Intermediate
Municipal
Bond Fund | | Columbia
Rhode Island
Intermediate
Municipal
Bond Fund | |
| Investment Income | |
| Interest | | | 3,111,058 | | | | 12,627,600 | | | | 4,908,550 | | |
| Dividends | | | 13,575 | | | | 8,638 | | | | 3,039 | | |
| Dividends from affiliates | | | 9,314 | | | | 18,366 | | | | 3,280 | | |
| Total Investment Income | | | 3,133,947 | | | | 12,654,604 | | | | 4,914,869 | | |
| Expenses | |
| Investment advisory fee | | | 350,495 | | | | 1,447,859 | | | | 525,720 | | |
| Administration fee | | | 48,923 | | | | 202,097 | | | | 73,382 | | |
| Distribution fee: | |
| Class B | | | 9,739 | | | | 11,757 | | | | 2,382 | | |
| Class C | | | 26,601 | | | | 27,844 | | | | 9,149 | | |
| Service fee: | |
| Class A | | | 10,489 | | | | 14,234 | | | | 7,394 | | |
| Class B | | | 3,245 | | | | 3,919 | | | | 794 | | |
| Class C | | | 8,865 | | | | 9,281 | | | | 3,051 | | |
| Shareholder service fee—Class T | | | 5,583 | | | | 17,583 | | | | — | | |
| Pricing and bookkeeping fees | | | 65,150 | | | | 105,046 | | | | 68,705 | | |
| Transfer agent fee | | | 14,826 | | | | 28,390 | | | | 8,199 | | |
| Trustees' fees | | | 17,526 | | | | 29,256 | | | | 19,468 | | |
| Custody fee | | | 7,909 | | | | 12,593 | | | | 7,036 | | |
| Registration fees | | | 35,128 | | | | 40,015 | | | | 39,115 | | |
| Audit fee | | | 37,864 | | | | 39,364 | | | | 45,212 | | |
| Chief compliance officer expenses | | | 597 | | | | 707 | | | | 608 | | |
| Other expenses | | | 51,535 | | | | 95,880 | | | | 51,690 | | |
| Total Expenses | | | 694,475 | | | | 2,085,825 | | | | 861,905 | | |
| Fees waived or expenses reimbursed by investment advisor | | | (239,649 | ) | | | (389,875 | ) | | | (254,908 | ) | |
| Fees waived by distributor—Class C | | | (12,410 | ) | | | (12,994 | ) | | | (4,268 | ) | |
| Expense reductions | | | (255 | ) | | | (514 | ) | | | (200 | ) | |
| Net Expenses | | | 442,161 | | | | 1,682,442 | | | | 602,529 | | |
| Net Investment Income | | | 2,691,786 | | | | 10,972,162 | | | | 4,312,340 | | |
| Net Realized and Unrealized Gain (Loss) on Investments | |
| Net realized loss on investments | | | (73,736 | ) | | | (1,264,724 | ) | | | (35,554 | ) | |
| Net change in unrealized appreciation (depreciation) on investments | | | 4,073,699 | | | | 20,051,345 | | | | 6,301,420 | | |
| Net Gain | | | 3,999,963 | | | | 18,786,621 | | | | 6,265,866 | | |
| Net Increase Resulting from Operations | | | 6,691,749 | | | | 29,758,783 | | | | 10,578,206 | | |
See Accompanying Notes to Financial Statements.
95
Statements of Changes in Net Assets – Columbia Tax-Exempt Bond Funds
| Increase (Decrease) in Net Assets | | Columbia
Connecticut Intermediate
Municipal Bond Fund | | Columbia
Intermediate Municipal
Bond Fund | | Columbia
Massachusetts Intermediate
Municipal Bond Fund | |
| | | Year Ended October 31, | | Year Ended October 31, | | Year Ended October 31, | |
| | | 2009 ($) | | 2008 ($) | | 2009 ($) | | 2008 ($) | | 2009 ($) | | 2008 ($) | |
| Operations | |
| Net investment income | | | 8,055,023 | | | | 7,183,576 | | | | 94,255,634 | | | | 97,023,128 | | | | 11,845,167 | | | | 12,236,550 | | |
| Net realized gain (loss) on investments and futures contracts | | | (492,173 | ) | | | (151,110 | ) | | | (3,339,214 | ) | | | (1,608,297 | ) | | | (297,655 | ) | | | (215,302 | ) | |
Net change in unrealized appreciation (depreciation)
on investments and futures contracts | | | 13,832,643 | | | | (11,312,779 | ) | | | 148,190,263 | | | | (152,317,172 | ) | | | 22,331,983 | | | | (14,469,234 | ) | |
| Net increase (decrease) resulting from operations | | | 21,395,493 | | | | (4,280,313 | ) | | | 239,106,683 | | | | (56,902,341 | ) | | | 33,879,495 | | | | (2,447,986 | ) | |
| Distributions to Shareholders | |
| From net investment income: | |
| Class A | | | (450,639 | ) | | | (185,224 | ) | | | (2,933,217 | ) | | | (3,212,569 | ) | | | (519,720 | ) | | | (314,030 | ) | |
| Class B | | | (63,278 | ) | | | (77,931 | ) | | | (175,510 | ) | | | (220,033 | ) | | | (35,883 | ) | | | (43,078 | ) | |
| Class C | | | (204,367 | ) | | | (174,326 | ) | | | (530,626 | ) | | | (403,945 | ) | | | (182,209 | ) | | | (124,485 | ) | |
| Class T | | | (607,460 | ) | | | (700,158 | ) | | | (395,429 | ) | | | (471,517 | ) | | | (1,342,105 | ) | | | (1,488,651 | ) | |
| Class Z | | | (6,716,949 | ) | | | (6,041,271 | ) | | | (90,216,298 | ) | | | (92,703,384 | ) | | | (9,752,336 | ) | | | (10,255,310 | ) | |
| From net realized gains: | |
| Class A | | | — | | | | — | | | | — | | | | — | | | | — | | | | (2,176 | ) | |
| Class B | | | — | | | | — | | | | — | | | | — | | | | — | | | | (493 | ) | |
| Class C | | | — | | | | — | | | | — | | | | — | | | | — | | | | (1,189 | ) | |
| Class T | | | — | | | | — | | | | — | | | | — | | | | — | | | | (12,944 | ) | |
| Class Z | | | — | | | | — | | | | — | | | | — | | | | — | | | | (81,124 | ) | |
| Total distributions to shareholders | | | (8,042,693 | ) | | | (7,178,910 | ) | | | (94,251,080 | ) | | | (97,011,448 | ) | | | (11,832,253 | ) | | | (12,323,480 | ) | |
| Net Capital Stock Transactions | | | 17,891,268 | | | | 49,942,836 | | | | (59,743,337 | ) | | | 242,880,150 | | | | 10,919,161 | | | | 20,163,292 | | |
| Increase from regulatory settlements | | | — | | | | — | | | | 15,125 | | | | — | | | | — | | | | — | | |
| Total increase (decrease) in net assets | | | 31,244,068 | | | | 38,483,613 | | | | 85,127,391 | | | | 88,966,361 | | | | 32,966,403 | | | | 5,391,826 | | |
| Net Assets | |
| Beginning of period | | | 207,380,126 | | | | 168,896,513 | | | | 2,418,389,828 | | | | 2,329,423,467 | | | | 314,853,946 | | | | 309,462,120 | | |
| End of period | | | 238,624,194 | | | | 207,380,126 | | | | 2,503,517,219 | | | | 2,418,389,828 | | | | 347,820,349 | | | | 314,853,946 | | |
| Undistributed net investment income at end of period | | | 110,411 | | | | 110,661 | | | | 1,640,134 | | | | 1,687,001 | | | | 53,828 | | | | 53,337 | | |
See Accompanying Notes to Financial Statements.
96
| Increase (Decrease) in Net Assets | | Columbia
New Jersey Intermediate
Municipal Bond Fund | | Columbia
New York Intermediate
Municipal Bond Fund | | Columbia
Rhode Island Intermediate
Municipal Bond Fund | |
| | | Year Ended October 31, | | Year Ended October 31, | | Year Ended October 31, | |
| | | 2009 ($) | | 2008 ($) | | 2009 ($) | | 2008 ($) | | 2009 ($) | | 2008 ($) | |
| Operations | |
| Net investment income | | | 2,691,786 | | | | 2,634,878 | | | | 10,972,162 | | | | 8,477,341 | | | | 4,312,340 | | | | 4,694,216 | | |
| Net realized gain (loss) on investments and futures contracts | | | (73,736 | ) | | | (25,725 | ) | | | (1,264,724 | ) | | | 171,381 | | | | (35,554 | ) | | | 87,227 | | |
Net change in unrealized appreciation (depreciation)
on investments and futures contracts | | | 4,073,699 | | | | (3,624,737 | ) | | | 20,051,345 | | | | (14,173,089 | ) | | | 6,301,420 | | | | (5,799,586 | ) | |
| Net increase (decrease) resulting from operations | | | 6,691,749 | | | | (1,015,584 | ) | | | 29,758,783 | | | | (5,524,367 | ) | | | 10,578,206 | | | | (1,018,143 | ) | |
| Distributions to Shareholders | |
| From net investment income: | |
| Class A | | | (146,448 | ) | | | (120,967 | ) | | | (193,342 | ) | | | (125,808 | ) | | | (110,020 | ) | | | (98,502 | ) | |
| Class B | | | (35,839 | ) | | | (35,740 | ) | | | (41,787 | ) | | | (46,205 | ) | | | (9,340 | ) | | | (10,936 | ) | |
| Class C | | | (109,078 | ) | | | (89,601 | ) | | | (110,077 | ) | | | (66,602 | ) | | | (39,745 | ) | | | (29,824 | ) | |
| Class T | | | (134,487 | ) | | | (164,338 | ) | | | (411,917 | ) | | | (460,687 | ) | | | (361,856 | ) | | | (405,504 | ) | |
| Class Z | | | (2,261,741 | ) | | | (2,221,145 | ) | | | (10,203,987 | ) | | | (7,763,230 | ) | | | (3,778,397 | ) | | | (4,140,499 | ) | |
| From net realized gains: | |
| Class A | | | — | | | | — | | | | — | | | | — | | | | — | | | | — | | |
| Class B | | | — | | | | — | | | | — | | | | — | | | | — | | | | — | | |
| Class C | | | — | | | | — | | | | — | | | | — | | | | — | | | | — | | |
| Class T | | | — | | | | — | | | | — | | | | — | | | | — | | | | — | | |
| Class Z | | | — | | | | — | | | | — | | | | — | | | | — | | | | — | | |
| Total distributions to shareholders | | | (2,687,593 | ) | | | (2,631,791 | ) | | | (10,961,110 | ) | | | (8,462,532 | ) | | | (4,299,358 | ) | | | (4,685,265 | ) | |
| Net Capital Stock Transactions | | | 8,081,346 | | | | 4,365,783 | | | | 9,784,444 | | | | 156,314,790 | | | | (12,753,431 | ) | | | 2,055,992 | | |
| Increase from regulatory settlements | | | — | | | | — | | | | — | | | | — | | | | — | | | | — | | |
| Total increase (decrease) in net assets | | | 12,085,502 | | | | 718,408 | | | | 28,582,117 | | | | 142,327,891 | | | | (6,474,583 | ) | | | (3,647,416 | ) | |
| Net Assets | |
| Beginning of period | | | 66,199,758 | | | | 65,481,350 | | | | 292,010,753 | | | | 149,682,862 | | | | 112,975,136 | | | | 116,622,552 | | |
| End of period | | | 78,285,260 | | | | 66,199,758 | | | | 320,592,870 | | | | 292,010,753 | | | | 106,500,553 | | | | 112,975,136 | | |
| Undistributed net investment income at end of period | | | 8,750 | | | | 12,045 | | | | 112,524 | | | | 105,523 | | | | 27,117 | | | | 33,654 | | |
See Accompanying Notes to Financial Statements.
97
Statements of Changes in Net Assets – Capital Stock Activity
| | | Columbia Connecticut Intermediate
Municipal Bond Fund | | Columbia Intermediate
Municipal Bond Fund | |
| | | Year Ended
October 31, 2009 | | Year Ended
October 31, 2008 | | Year Ended
October 31, 2009 | | Year Ended
October 31, 2008 | |
| | | Shares | | Dollars ($) | | Shares | | Dollars ($) | | Shares | | Dollars ($) | | Shares | | Dollars ($) | |
| Class A | |
| Subscriptions | | | 405,219 | | | | 4,244,909 | | | | 1,185,308 | | | | 12,291,366 | | | | 2,387,216 | | | | 24,001,620 | | | | 762,780 | | | | 7,762,097 | | |
| Distributions reinvested | | | 12,785 | | | | 135,265 | | | | 4,962 | | | | 51,874 | | | | 170,633 | | | | 1,709,779 | | | | 173,229 | | | | 1,747,705 | | |
| Redemptions | | | (606,123 | ) | | | (6,438,933 | ) | | | (227,141 | ) | | | (2,261,436 | ) | | | (2,300,100 | ) | | | (22,642,655 | ) | | | (1,610,469 | ) | | | (16,315,353 | ) | |
| Net increase (decrease) | | | (188,119 | ) | | | (2,058,759 | ) | | | 963,129 | | | | 10,081,804 | | | | 257,749 | | | | 3,068,744 | | | | (674,460 | ) | | | (6,805,551 | ) | |
| Class B | |
| Subscriptions | | | 15,429 | | | | 160,451 | | | | 21,982 | | | | 231,632 | | | | 118,032 | | | | 1,165,454 | | | | 88,019 | | | | 893,475 | | |
| Distributions reinvested | | | 3,235 | | | | 34,050 | | | | 3,865 | | | | 40,566 | | | | 9,143 | | | | 91,486 | | | | 11,362 | | | | 114,716 | | |
| Redemptions | | | (83,321 | ) | | | (883,798 | ) | | | (34,946 | ) | | | (367,132 | ) | | | (219,857 | ) | | | (2,187,645 | ) | | | (284,480 | ) | | | (2,885,009 | ) | |
| Net decrease | | | (64,657 | ) | | | (689,297 | ) | | | (9,099 | ) | | | (94,934 | ) | | | (92,682 | ) | | | (930,705 | ) | | | (185,099 | ) | | | (1,876,818 | ) | |
| Class C | |
| Subscriptions | | | 205,202 | | | | 2,176,753 | | | | 180,356 | | | | 1,891,276 | | | | 691,693 | | | | 6,924,435 | | | | 449,462 | | | | 4,531,183 | | |
| Distributions reinvested | | | 9,422 | | | | 99,381 | | | | 9,221 | | | | 96,685 | | | | 25,982 | | | | 260,876 | | | | 13,458 | | | | 135,457 | | |
| Redemptions | | | (78,486 | ) | | | (829,845 | ) | | | (42,709 | ) | | | (452,885 | ) | | | (336,932 | ) | | | (3,375,628 | ) | | | (178,240 | ) | | | (1,794,071 | ) | |
| Net increase | | | 136,138 | | | | 1,446,289 | | | | 146,868 | | | | 1,535,076 | | | | 380,743 | | | | 3,809,683 | | | | 284,680 | | | | 2,872,569 | | |
| Class T | |
| Subscriptions | | | 9,086 | | | | 94,195 | | | | 3,148 | | | | 33,324 | | | | 10,647 | | | | 106,415 | | | | 3,613 | | | | 36,386 | | |
| Distributions reinvested | | | 36,984 | | | | 389,682 | | | | 42,273 | | | | 443,744 | | | | 31,960 | | | | 319,889 | | | | 37,544 | | | | 379,009 | | |
| Redemptions | | | (202,016 | ) | | | (2,122,037 | ) | | | (168,431 | ) | | | (1,773,397 | ) | | | (140,315 | ) | | | (1,398,136 | ) | | | (208,373 | ) | | | (2,091,503 | ) | |
| Net decrease | | | (155,946 | ) | | | (1,638,160 | ) | | | (123,010 | ) | | | (1,296,329 | ) | | | (97,708 | ) | | | (971,832 | ) | | | (167,216 | ) | | | (1,676,108 | ) | |
| Class Z | |
| Subscriptions | | | 5,818,292 | | | | 61,114,833 | | | | 5,907,090 | | | | 62,290,945 | | | | 50,746,846 | | | | 505,763,698 | | | | 33,179,886 | | | | 336,944,459 | | |
| Proceeds received in connection with merger | | | — | | | | — | | | | — | | | | — | | | | — | | | | — | | | | 36,795,116 | | | | 374,435,646 | | |
| Distributions reinvested | | | 19,180 | | | | 201,904 | | | | 28,221 | | | | 296,980 | | | | 470,049 | | | | 4,704,407 | | | | 436,777 | | | | 4,405,036 | | |
| Redemptions | | | (3,856,922 | ) | | | (40,485,542 | ) | | | (2,189,985 | ) | | | (22,870,706 | ) | | | (58,121,757 | ) | | | (575,187,332 | ) | | | (46,154,154 | ) | | | (465,419,083 | ) | |
| Net increase (decrease) | | | 1,980,550 | | | | 20,831,195 | | | | 3,745,326 | | | | 39,717,219 | | | | (6,904,862 | ) | | | (64,719,227 | ) | | | 24,257,625 | | | | 250,366,058 | | |
See Accompanying Notes to Financial Statements.
98
| | | Columbia Massachusetts Intermediate
Municipal Bond Fund | |
| | | Year Ended
October 31, 2009 | | Year Ended
October 31, 2008 | |
| | | Shares | | Dollars ($) | | Shares | | Dollars ($) | |
| Class A | |
| Subscriptions | | | 1,282,523 | | | | 13,459,991 | | | | 746,892 | | | | 7,714,968 | | |
| Distributions reinvested | | | 40,530 | | | | 424,695 | | | | 23,747 | | | | 243,505 | | |
| Redemptions | | | (1,015,055 | ) | | | (10,675,957 | ) | | | (233,450 | ) | | | (2,432,020 | ) | |
| Net increase (decrease) | | | 307,998 | | | | 3,208,729 | | | | 537,189 | | | | 5,526,453 | | |
| Class B | |
| Subscriptions | | | 11,902 | | | | 126,007 | | | | 8,569 | | | | 88,446 | | |
| Distributions reinvested | | | 2,437 | | | | 25,464 | | | | 3,201 | | | | 32,942 | | |
| Redemptions | | | (44,490 | ) | | | (464,998 | ) | | | (25,799 | ) | | | (262,951 | ) | |
| Net decrease | | | (30,151 | ) | | | (313,527 | ) | | | (14,029 | ) | | | (141,563 | ) | |
| Class C | |
| Subscriptions | | | 474,966 | | | | 5,005,078 | | | | 88,218 | | | | 919,403 | | |
| Distributions reinvested | | | 10,473 | | | | 110,155 | | | | 6,745 | | | | 69,379 | | |
| Redemptions | | | (57,720 | ) | | | (603,162 | ) | | | (53,759 | ) | | | (557,837 | ) | |
| Net increase | | | 427,719 | | | | 4,512,071 | | | | 41,204 | | | | 430,945 | | |
| Class T | |
| Subscriptions | | | 43,452 | | | | 458,691 | | | | 50,579 | | | | 529,883 | | |
| Distributions reinvested | | | 100,026 | | | | 1,046,355 | | | | 114,142 | | | | 1,174,651 | | |
| Redemptions | | | (251,063 | ) | | | (2,617,394 | ) | | | (462,260 | ) | | | (4,732,706 | ) | |
| Net decrease | | | (107,585 | ) | | | (1,112,348 | ) | | | (297,539 | ) | | | (3,028,172 | ) | |
| Class Z | |
| Subscriptions | | | 4,735,509 | | | | 49,585,669 | | | | 5,714,637 | | | | 59,383,887 | | |
| Proceeds received in connection with merger | | | — | | | | — | | | | — | | | | — | | |
| Distributions reinvested | | | 35,326 | | | | 368,506 | | | | 34,748 | | | | 358,484 | | |
| Redemptions | | | (4,365,772 | ) | | | (45,329,939 | ) | | | (4,124,569 | ) | | | (42,366,742 | ) | |
| Net increase (decrease) | | | 405,063 | | | | 4,624,236 | | | | 1,624,816 | | | | 17,375,629 | | |
See Accompanying Notes to Financial Statements.
99
Statements of Changes in Net Assets – Capital Stock Activity
| | | Columbia New Jersey Intermediate
Municipal Bond Fund | | Columbia New York Intermediate
Municipal Bond Fund | |
| | | Year Ended
October 31, 2009 | | Year Ended
October 31, 2008 | | Year Ended
October 31, 2009 | | Year Ended
October 31, 2008 | |
| | | Shares | | Dollars ($) | | Shares | | Dollars ($) | | Shares | | Dollars ($) | | Shares | | Dollars ($) | |
| Class A | |
| Subscriptions | | | 243,991 | | | | 2,429,810 | | | | 142,658 | | | | 1,422,795 | | | | 505,381 | | | | 5,839,572 | | | | 570,779 | | | | 6,634,385 | | |
| Distributions reinvested | | | 11,084 | | | | 110,606 | | | | 9,696 | | | | 96,369 | | | | 10,827 | | | | 125,608 | | | | 5,051 | | | | 57,658 | | |
| Redemptions | | | (130,819 | ) | | | (1,295,924 | ) | | | (83,059 | ) | | | (831,945 | ) | | | (178,567 | ) | | | (2,036,606 | ) | | | (357,353 | ) | | | (4,064,654 | ) | |
| Net increase (decrease) | | | 124,256 | | | | 1,244,492 | | | | 69,295 | | | | 687,219 | | | | 337,641 | | | | 3,928,574 | | | | 218,477 | | | | 2,627,389 | | |
| Class B | |
| Subscriptions | | | 26,683 | | | | 263,413 | | | | 22,224 | | | | 224,718 | | | | 20,131 | | | | 229,804 | | | | 8,981 | | | | 103,898 | | |
| Distributions reinvested | | | 2,627 | | | | 26,188 | | | | 2,575 | | | | 25,611 | | | | 2,177 | | | | 25,103 | | | | 2,402 | | | | 27,485 | | |
| Redemptions | | | (30,538 | ) | | | (305,025 | ) | | | (28,859 | ) | | | (287,414 | ) | | �� | (35,083 | ) | | | (406,546 | ) | | | (31,378 | ) | | | (359,454 | ) | |
| Net increase (decrease) | | | (1,228 | ) | | | (15,424 | ) | | | (4,060 | ) | | | (37,085 | ) | | | (12,775 | ) | | | (151,639 | ) | | | (19,995 | ) | | | (228,071 | ) | |
| Class C | |
| Subscriptions | | | 198,665 | | | | 1,986,065 | | | | 60,462 | | | | 598,624 | | | | 310,595 | | | | 3,624,543 | | | | 110,495 | | | | 1,263,805 | | |
| Distributions reinvested | | | 5,310 | | | | 53,060 | | | | 4,178 | | | | 41,581 | | | | 6,228 | | | | 72,131 | | | | 4,122 | | | | 47,085 | | |
| Redemptions | | | (17,129 | ) | | | (172,998 | ) | | | (102,793 | ) | | | (1,035,802 | ) | | | (58,753 | ) | | | (687,170 | ) | | | (49,371 | ) | | | (573,490 | ) | |
| Net increase (decrease) | | | 186,846 | | | | 1,866,127 | | | | (38,153 | ) | | | (395,597 | ) | | | 258,070 | | | | 3,009,504 | | | | 65,246 | | | | 737,400 | | |
| Class T | |
| Subscriptions | | | 1,072 | | | | 10,700 | | | | 820 | | | | 8,210 | | | | 6,973 | | | | 80,110 | | | | 3,412 | | | | 39,214 | | |
| Distributions reinvested | | | 11,742 | | | | 116,938 | | | | 14,320 | | | | 142,504 | | | | 27,508 | | | | 317,260 | | | | 31,007 | | | | 354,764 | | |
| Redemptions | | | (47,174 | ) | | | (462,865 | ) | | | (112,202 | ) | | | (1,133,079 | ) | | | (87,403 | ) | | | (1,005,333 | ) | | | (166,051 | ) | | | (1,898,291 | ) | |
| Net decrease | | | (34,360 | ) | | | (335,227 | ) | | | (97,062 | ) | | | (982,365 | ) | | | (52,922 | ) | | | (607,963 | ) | | | (131,632 | ) | | | (1,504,313 | ) | |
| Class Z | |
| Subscriptions | | | 2,037,952 | | | | 20,181,627 | | | | 1,522,626 | | | | 15,296,862 | | | | 7,038,673 | | | | 80,899,423 | | | | 3,628,383 | | | | 41,630,556 | | |
| Proceeds received in connection with merger | | | — | | | | — | | | | — | | | | — | | | | — | | | | — | | | | 12,980,728 | | | | 149,608,565 | | |
| Distributions reinvested | | | 9,035 | | | | 90,223 | | | | 9,733 | | | | 97,004 | | | | 98,497 | | | | 1,133,982 | | | | 63,950 | | | | 729,833 | | |
| Redemptions | | | (1,511,173 | ) | | | (14,950,472 | ) | | | (1,030,214 | ) | | | (10,300,255 | ) | | | (6,895,445 | ) | | | (78,427,437 | ) | | | (3,292,910 | ) | | | (37,286,569 | ) | |
| Net increase (decrease) | | | 535,814 | | | | 5,321,378 | | | | 502,145 | | | | 5,093,611 | | | | 241,725 | | | | 3,605,968 | | | | 13,380,151 | | | | 154,682,385 | | |
See Accompanying Notes to Financial Statements.
100
| | | Columbia Rhode Island Intermediate
Municipal Bond Fund | |
| | | Year Ended
October 31, 2009 | | Year Ended
October 31, 2008 | |
| | | Shares | | Dollars ($) | | Shares | | Dollars ($) | |
| Class A | |
| Subscriptions | | | 38,275 | | | | 412,636 | | | | 221,465 | | | | 2,462,390 | | |
| Distributions reinvested | | | 8,994 | | | | 98,384 | | | | 8,407 | | | | 91,495 | | |
| Redemptions | | | (137,327 | ) | | | (1,500,072 | ) | | | (23,685 | ) | | | (254,858 | ) | |
| Net increase (decrease) | | | (90,058 | ) | | | (989,052 | ) | | | 206,187 | | | | 2,299,027 | | |
| Class B | |
| Subscriptions | | | 231 | | | | 2,527 | | | | 9,848 | | | | 108,599 | | |
| Distributions reinvested | | | 403 | | | | 4,423 | | | | 372 | | | | 4,057 | | |
| Redemptions | | | (4,445 | ) | | | (50,156 | ) | | | (8,521 | ) | | | (92,835 | ) | |
| Net increase (decrease) | | | (3,811 | ) | | | (43,206 | ) | | | 1,699 | | | | 19,821 | | |
| Class C | |
| Subscriptions | | | 62,236 | | | | 681,349 | | | | 21,192 | | | | 235,053 | | |
| Distributions reinvested | | | 1,782 | | | | 19,616 | | | | 1,224 | | | | 13,350 | | |
| Redemptions | | | (7,056 | ) | | | (75,624 | ) | | | (9,937 | ) | | | (106,856 | ) | |
| Net increase (decrease) | | | 56,962 | | | | 625,341 | | | | 12,479 | | | | 141,547 | | |
| Class T | |
| Subscriptions | | | 7,072 | | | | 75,796 | | | | 4,397 | | | | 48,210 | | |
| Distributions reinvested | | | 23,056 | | | | 252,812 | | | | 26,726 | | | | 292,153 | | |
| Redemptions | | | (99,563 | ) | | | (1,102,004 | ) | | | (157,222 | ) | | | (1,730,642 | ) | |
| Net decrease | | | (69,435 | ) | | | (773,396 | ) | | | (126,099 | ) | | | (1,390,279 | ) | |
| Class Z | |
| Subscriptions | | | 440,871 | | | | 4,877,187 | | | | 1,061,333 | | | | 11,690,278 | | |
| Proceeds received in connection with merger | | | — | | | | — | | | | — | | | | — | | |
| Distributions reinvested | | | 11,608 | | | | 127,128 | | | | 12,550 | | | | 137,290 | | |
| Redemptions | | | (1,515,384 | ) | | | (16,577,433 | ) | | | (989,737 | ) | | | (10,841,692 | ) | |
| Net increase (decrease) | | | (1,062,905 | ) | | | (11,573,118 | ) | | | 84,146 | | | | 985,876 | | |
See Accompanying Notes to Financial Statements.
101
Financial Highlights – Columbia Connecticut Intermediate Municipal Bond Fund
Selected data for a share outstanding throughout each period is as follows:
| | | Year Ended October 31, | |
| Class A Shares | | 2009 | | 2008 | | 2007 | | 2006 | | 2005 | |
| Net Asset Value, Beginning of Period | | $ | 10.06 | | | $ | 10.62 | | | $ | 10.76 | | | $ | 10.69 | | | $ | 11.04 | | |
| Income from Investment Operations: | |
| Net investment income (a) | | | 0.35 | | | | 0.37 | | | | 0.36 | | | | 0.36 | | | | 0.37 | | |
Net realized and unrealized gain (loss) on investments
and futures contracts | | | 0.63 | | | | (0.55 | ) | | | (0.15 | ) | | | 0.07 | | | | (0.35 | ) | |
| Total from investment operations | | | 0.98 | | | | (0.18 | ) | | | 0.21 | | | | 0.43 | | | | 0.02 | | |
| Less Distributions to Shareholders: | |
| From net investment income | | | (0.35 | ) | | | (0.38 | ) | | | (0.35 | ) | | | (0.36 | ) | | | (0.37 | ) | |
| Net Asset Value, End of Period | | $ | 10.69 | | | $ | 10.06 | | | $ | 10.62 | | | $ | 10.76 | | | $ | 10.69 | | |
| Total return (b) | | | 9.87 | %(c) | | | (1.80 | )%(c) | | | 2.03 | % | | | 4.13 | % | | | 0.15 | %(c) | |
| Ratios to Average Net Assets/Supplemental Data: | |
| Net expenses (d) | | | 0.78 | % | | | 0.75 | % | | | 1.06 | % | | | 1.00 | % | | | 0.94 | % | |
| Waiver/Reimbursement | | | 0.16 | % | | | 0.21 | % | | | — | | | | — | | | | — | %(e) | |
| Net investment income (d) | | | 3.35 | % | | | 3.55 | % | | | 3.35 | % | | | 3.41 | % | | | 3.38 | % | |
| Portfolio turnover rate | | | 12 | % | | | 4 | % | | | 10 | % | | | 10 | % | | | 9 | % | |
| Net assets, end of period (000s) | | $ | 10,863 | | | $ | 12,115 | | | $ | 2,566 | | | $ | 7,586 | | | $ | 10,701 | | |
(a) Per share data was calculated using the average shares outstanding during the period.
(b) Total return at net asset value assuming all distributions reinvested and no initial sales charge or contingent deferred sales charge.
(c) Had the investment advisor and/or any of its affiliates not waived fees or reimbursed a portion of expenses, total return would have been reduced.
(d) The benefits derived from expense reductions had an impact of less than 0.01%.
(e) Rounds to less than 0.01%.
See Accompanying Notes to Financial Statements.
102
Financial Highlights – Columbia Connecticut Intermediate Municipal Bond Fund
Selected data for a share outstanding throughout each period is as follows:
| | | Year Ended October 31, | |
| Class B Shares | | 2009 | | 2008 | | 2007 | | 2006 | | 2005 | |
| Net Asset Value, Beginning of Period | | $ | 10.06 | | | $ | 10.62 | | | $ | 10.76 | | | $ | 10.69 | | | $ | 11.04 | | |
| Income from Investment Operations: | |
| Net investment income (a) | | | 0.28 | | | | 0.30 | | | | 0.28 | | | | 0.28 | | | | 0.29 | | |
Net realized and unrealized gain (loss) on investments
and futures contracts | | | 0.62 | | | | (0.56 | ) | | | (0.15 | ) | | | 0.07 | | | | (0.35 | ) | |
| Total from investment operations | | | 0.90 | | | | (0.26 | ) | | | 0.13 | | | | 0.35 | | | | (0.06 | ) | |
| Less Distributions to Shareholders: | |
| From net investment income | | | (0.27 | ) | | | (0.30 | ) | | | (0.27 | ) | | | (0.28 | ) | | | (0.29 | ) | |
| Net Asset Value, End of Period | | $ | 10.69 | | | $ | 10.06 | | | $ | 10.62 | | | $ | 10.76 | | | $ | 10.69 | | |
| Total return (b) | | | 9.05 | %(c) | | | (2.52 | )%(c) | | | 1.27 | % | | | 3.35 | % | | | (0.60 | )%(c) | |
| Ratios to Average Net Assets/Supplemental Data: | |
| Net expenses (d) | | | 1.53 | % | | | 1.50 | % | | | 1.81 | % | | | 1.75 | % | | | 1.69 | % | |
| Waiver/Reimbursement | | | 0.16 | % | | | 0.21 | % | | | — | | | | — | | | | — | %(e) | |
| Net investment income (d) | | | 2.62 | % | | | 2.86 | % | | | 2.58 | % | | | 2.66 | % | | | 2.63 | % | |
| Portfolio turnover rate | | | 12 | % | | | 4 | % | | | 10 | % | | | 10 | % | | | 9 | % | |
| Net assets, end of period (000s) | | $ | 1,995 | | | $ | 2,528 | | | $ | 2,767 | | | $ | 3,941 | | | $ | 5,039 | | |
(a) Per share data was calculated using the average shares outstanding during the period.
(b) Total return at net asset value assuming all distributions reinvested and no contingent deferred sales charge.
(c) Had the investment advisor and/or any of its affiliates not waived fees or reimbursed a portion of expenses, total return would have been reduced.
(d) The benefits derived from expense reductions had an impact of less than 0.01%.
(e) Rounds to less than 0.01%.
See Accompanying Notes to Financial Statements.
103
Financial Highlights – Columbia Connecticut Intermediate Municipal Bond Fund
Selected data for a share outstanding throughout each period is as follows:
| | | Year Ended October 31, | |
| Class C Shares | | 2009 | | 2008 | | 2007 | | 2006 | | 2005 | |
| Net Asset Value, Beginning of Period | | $ | 10.06 | | | $ | 10.62 | | | $ | 10.76 | | | $ | 10.69 | | | $ | 11.04 | | |
| Income from Investment Operations: | |
| Net investment income (a) | | | 0.31 | | | | 0.34 | | | | 0.31 | | | | 0.32 | | | | 0.32 | | |
Net realized and unrealized gain (loss) on investments
and futures contracts | | | 0.63 | | | | (0.56 | ) | | | (0.14 | ) | | | 0.07 | | | | (0.35 | ) | |
| Total from investment operations | | | 0.94 | | | | (0.22 | ) | | | 0.17 | | | | 0.39 | | | | (0.03 | ) | |
| Less Distributions to Shareholders: | |
| From net investment income | | | (0.31 | ) | | | (0.34 | ) | | | (0.31 | ) | | | (0.32 | ) | | | (0.32 | ) | |
| Net Asset Value, End of Period | | $ | 10.69 | | | $ | 10.06 | | | $ | 10.62 | | | $ | 10.76 | | | $ | 10.69 | | |
| Total return (b)(c) | | | 9.43 | % | | | (2.18 | )% | | | 1.63 | % | | | 3.72 | % | | | (0.25 | )% | |
| Ratios to Average Net Assets/Supplemental Data: | |
| Net expenses (d) | | | 1.18 | % | | | 1.15 | % | | | 1.46 | % | | | 1.40 | % | | | 1.34 | % | |
| Waiver/Reimbursement | | | 0.51 | % | | | 0.56 | % | | | 0.35 | % | | | 0.35 | % | | | 0.35 | % | |
| Net investment income (d) | | | 2.94 | % | | | 3.20 | % | | | 2.93 | % | | | 3.01 | % | | | 2.98 | % | |
| Portfolio turnover rate | | | 12 | % | | | 4 | % | | | 10 | % | | | 10 | % | | | 9 | % | |
| Net assets, end of period (000s) | | $ | 8,047 | | | $ | 6,203 | | | $ | 4,993 | | | $ | 6,436 | | | $ | 8,780 | | |
(a) Per share data was calculated using the average shares outstanding during the period.
(b) Total return at net asset value assuming all distributions reinvested and no contingent deferred sales charge.
(c) Had the investment advisor and/or any of its affiliates not waived fees or reimbursed a portion of expenses, total return would have been reduced.
(d) The benefits derived from expense reductions had an impact of less than 0.01%.
See Accompanying Notes to Financial Statements.
104
Financial Highlights – Columbia Connecticut Intermediate Municipal Bond Fund
Selected data for a share outstanding throughout each period is as follows:
| | | Year Ended October 31, | |
| Class T Shares | | 2009 | | 2008 | | 2007 | | 2006 | | 2005 | |
| Net Asset Value, Beginning of Period | | $ | 10.06 | | | $ | 10.62 | | | $ | 10.76 | | | $ | 10.69 | | | $ | 11.04 | | |
| Income from Investment Operations: | |
| Net investment income (a) | | | 0.36 | | | | 0.39 | | | | 0.37 | | | | 0.37 | | | | 0.38 | | |
Net realized and unrealized gain (loss) on investments
and futures contracts | | | 0.63 | | | | (0.56 | ) | | | (0.15 | ) | | | 0.07 | | | | (0.35 | ) | |
| Total from investment operations | | | 0.99 | | | | (0.17 | ) | | | 0.22 | | | | 0.44 | | | | 0.03 | | |
| Less Distributions to Shareholders: | |
| From net investment income | | | (0.36 | ) | | | (0.39 | ) | | | (0.36 | ) | | | (0.37 | ) | | | (0.38 | ) | |
| Net Asset Value, End of Period | | $ | 10.69 | | | $ | 10.06 | | | $ | 10.62 | | | $ | 10.76 | | | $ | 10.69 | | |
| Total return (b) | | | 9.98 | %(c) | | | (1.68 | )%(c) | | | 2.14 | % | | | 4.23 | % | | | 0.25 | %(c) | |
| Ratios to Average Net Assets/Supplemental Data: | |
| Net expenses (d) | | | 0.68 | % | | | 0.65 | % | | | 0.96 | % | | | 0.90 | % | | | 0.84 | % | |
| Waiver/Reimbursement | | | 0.16 | % | | | 0.21 | % | | | — | | | | — | | | | — | %(e) | |
| Net investment income (d) | | | 3.46 | % | | | 3.71 | % | | | 3.43 | % | | | 3.51 | % | | | 3.48 | % | |
| Portfolio turnover rate | | | 12 | % | | | 4 | % | | | 10 | % | | | 10 | % | | | 9 | % | |
| Net assets, end of period (000s) | | $ | 16,889 | | | $ | 17,461 | | | $ | 19,753 | | | $ | 22,676 | | | $ | 25,418 | | |
(a) Per share data was calculated using the average shares outstanding during the period.
(b) Total return at net asset value assuming all distributions reinvested and no initial sales charge or contingent deferred sales charge.
(c) Had the investment advisor and/or any of its affiliates not waived fees or reimbursed a portion of expenses, total return would have been reduced.
(d) The benefits derived from expense reductions had an impact of less than 0.01%.
(e) Rounds to less than 0.01%.
See Accompanying Notes to Financial Statements.
105
Financial Highlights – Columbia Connecticut Intermediate Municipal Bond Fund
Selected data for a share outstanding throughout each period is as follows:
| | | Year Ended October 31, | |
| Class Z Shares | | 2009 | | 2008 | | 2007 | | 2006 | | 2005 | |
| Net Asset Value, Beginning of Period | | $ | 10.06 | | | $ | 10.62 | | | $ | 10.76 | | | $ | 10.69 | | | $ | 11.04 | | |
| Income from Investment Operations: | |
| Net investment income (a) | | | 0.38 | | | | 0.41 | | | | 0.38 | | | | 0.39 | | | | 0.39 | | |
Net realized and unrealized gain (loss) on investments
and futures contracts | | | 0.63 | | | | (0.56 | ) | | | (0.14 | ) | | | 0.07 | | | | (0.35 | ) | |
| Total from investment operations | | | 1.01 | | | | (0.15 | ) | | | 0.24 | | | | 0.46 | | | | 0.04 | | |
| Less Distributions to Shareholders: | |
| From net investment income | | | (0.38 | ) | | | (0.41 | ) | | | (0.38 | ) | | | (0.39 | ) | | | (0.39 | ) | |
| Net Asset Value, End of Period | | $ | 10.69 | | | $ | 10.06 | | | $ | 10.62 | | | $ | 10.76 | | | $ | 10.69 | | |
| Total return (b) | | | 10.14 | %(c) | | | (1.53 | )%(c) | | | 2.29 | % | | | 4.39 | % | | | 0.40 | %(c) | |
| Ratios to Average Net Assets/Supplemental Data: | |
| Net expenses (d) | | | 0.53 | % | | | 0.50 | % | | | 0.81 | % | | | 0.75 | % | | | 0.69 | % | |
| Waiver/Reimbursement | | | 0.16 | % | | | 0.21 | % | | | — | | | | — | | | | — | %(e) | |
| Net investment income (d) | | | 3.60 | % | | | 3.86 | % | | | 3.58 | % | | | 3.65 | % | | | 3.63 | % | |
| Portfolio turnover rate | | | 12 | % | | | 4 | % | | | 10 | % | | | 10 | % | | | 9 | % | |
| Net assets, end of period (000s) | | $ | 200,830 | | | $ | 169,072 | | | $ | 138,817 | | | $ | 138,865 | | | $ | 134,144 | | |
(a) Per share data was calculated using the average shares outstanding during the period.
(b) Total return at net asset value assuming all distributions reinvested.
(c) Had the investment advisor and/or any of its affiliates not waived fees or reimbursed a portion of expenses, total return would have been reduced.
(d) The benefits derived from expense reductions had an impact of less than 0.01%.
(e) Rounds to less than 0.01%.
See Accompanying Notes to Financial Statements.
106
Financial Highlights – Columbia Intermediate Municipal Bond Fund
Selected data for a share outstanding throughout each period is as follows:
| | | Year Ended October 31, | |
| Class A Shares | | 2009 | | 2008 | | 2007 | | 2006 | | 2005 (a) | |
| Net Asset Value, Beginning of Period | | $ | 9.62 | | | $ | 10.22 | | | $ | 10.39 | | | $ | 10.31 | | | $ | 10.72 | | |
| Income from Investment Operations: | |
| Net investment income (b) | | | 0.37 | | | | 0.38 | | | | 0.38 | | | | 0.38 | | | | 0.38 | | |
Net realized and unrealized gain (loss) on investments
and futures contracts | | | 0.60 | | | | (0.60 | ) | | | (0.17 | ) | | | 0.10 | | | | (0.33 | ) | |
| Total from investment operations | | | 0.97 | | | | (0.22 | ) | | | 0.21 | | | | 0.48 | | | | 0.05 | | |
| Less Distributions to Shareholders: | |
| From net investment income | | | (0.37 | ) | | | (0.38 | ) | | | (0.38 | ) | | | (0.38 | ) | | | (0.39 | ) | |
| From net realized gains | | | — | | | | — | | | | — | | | | (0.02 | ) | | | (0.07 | ) | |
| Total distributions to shareholders | | | (0.37 | ) | | | (0.38 | ) | | | (0.38 | ) | | | (0.40 | ) | | | (0.46 | ) | |
| Increase from regulatory settlements | | | — | (c) | | | — | | | | — | | | | — | | | | — | | |
| Net Asset Value, End of Period | | $ | 10.22 | | | $ | 9.62 | | | $ | 10.22 | | | $ | 10.39 | | | $ | 10.31 | | |
| Total return (d)(e) | | | 10.19 | % | | | (2.25 | )% | | | 2.08 | % | | | 4.76 | % | | | 0.45 | % | |
| Ratios to Average Net Assets/Supplemental Data: | |
| Net expenses (f) | | | 0.73 | % | | | 0.70 | % | | | 0.70 | % | | | 0.70 | % | | | 0.81 | % | |
| Waiver/Reimbursement | | | 0.01 | % | | | 0.02 | % | | | 0.02 | % | | | 0.05 | % | | | 0.01 | % | |
| Net investment income (f) | | | 3.66 | % | | | 3.76 | % | | | 3.72 | % | | | 3.74 | % | | | 3.67 | % | |
| Portfolio turnover rate | | | 23 | % | | | 14 | % | | | 25 | % | | | 18 | % | | | 21 | % | |
| Net assets, end of period (000s) | | $ | 85,642 | | | $ | 78,126 | | | $ | 89,905 | | | $ | 102,899 | | | $ | 70,711 | | |
(a) On September 23, 2005, the Columbia Intermediate Tax-Exempt Bond Fund was renamed Columbia Intermediate Municipal Bond Fund.
(b) Per share data was calculated using the average shares outstanding during the period.
(c) Rounds to less then $0.01 per share.
(d) Total return at net asset value assuming all distributions reinvested and no initial sales charge or contingent deferred sales charge.
(e) Had the investment advisor and/or any of its affiliates not waived fees or reimbursed a portion of expenses, total return would have been reduced.
(f) The benefits derived from expense reductions had an impact of less than 0.01%.
See Accompanying Notes to Financial Statements.
107
Financial Highlights – Columbia Intermediate Municipal Bond Fund
Selected data for a share outstanding throughout each period is as follows:
| | | Year Ended October 31, | |
| Class B Shares | | 2009 | | 2008 | | 2007 | | 2006 | | 2005 (a) | |
| Net Asset Value, Beginning of Period | | $ | 9.62 | | | $ | 10.22 | | | $ | 10.39 | | | $ | 10.31 | | | $ | 10.72 | | |
| Income from Investment Operations: | |
| Net investment income (b) | | | 0.30 | | | | 0.32 | | | | 0.32 | | | | 0.32 | | | | 0.32 | | |
Net realized and unrealized gain (loss) on investments
and futures contracts | | | 0.60 | | | | (0.60 | ) | | | (0.18 | ) | | | 0.09 | | | | (0.34 | ) | |
| Total from investment operations | | | 0.90 | | | | (0.28 | ) | | | 0.14 | | | | 0.41 | | | | (0.02 | ) | |
| Less Distributions to Shareholders: | |
| From net investment income | | | (0.30 | ) | | | (0.32 | ) | | | (0.31 | ) | | | (0.31 | ) | | | (0.32 | ) | |
| From net realized gains | | | — | | | | — | | | | — | | | | (0.02 | ) | | | (0.07 | ) | |
| Total distributions to shareholders | | | (0.30 | ) | | | (0.32 | ) | | | (0.31 | ) | | | (0.33 | ) | | | (0.39 | ) | |
| Increase from regulatory settlements | | | — | (c) | | | — | | | | — | | | | — | | | | — | | |
| Net Asset Value, End of Period | | $ | 10.22 | | | $ | 9.62 | | | $ | 10.22 | | | $ | 10.39 | | | $ | 10.31 | | |
| Total return (d)(e) | | | 9.48 | % | | | (2.88 | )% | | | 1.42 | % | | | 4.09 | % | | | (0.20 | )% | |
| Ratios to Average Net Assets/Supplemental Data: | |
| Net expenses (f) | | | 1.38 | % | | | 1.35 | % | | | 1.35 | % | | | 1.35 | % | | | 1.46 | % | |
| Waiver/Reimbursement | | | 0.01 | % | | | 0.02 | % | | | 0.02 | % | | | 0.05 | % | | | 0.01 | % | |
| Net investment income (f) | | | 3.03 | % | | | 3.11 | % | | | 3.07 | % | | | 3.10 | % | | | 3.02 | % | |
| Portfolio turnover rate | | | 23 | % | | | 14 | % | | | 25 | % | | | 18 | % | | �� | 21 | % | |
| Net assets, end of period (000s) | | $ | 5,294 | | | $ | 5,874 | | | $ | 8,133 | | | $ | 12,203 | | | $ | 7,040 | | |
(a) On September 23, 2005, the Columbia Intermediate Tax-Exempt Bond Fund was renamed Columbia Intermediate Municipal Bond Fund.
(b) Per share data was calculated using the average shares outstanding during the period.
(c) Rounds to less then $0.01 per share.
(d) Total return at net asset value assuming all distributions reinvested and no contingent deferred sales charge.
(e) Had the investment advisor and/or any of its affiliates not waived fees or reimbursed a portion of expenses, total return would have been reduced.
(f) The benefits derived from expense reductions had an impact of less than 0.01%.
See Accompanying Notes to Financial Statements.
108
Financial Highlights – Columbia Intermediate Municipal Bond Fund
Selected data for a share outstanding throughout each period is as follows:
| | | Year Ended October 31, | |
| Class C Shares | | 2009 | | 2008 | | 2007 | | 2006 | | 2005 (a) | |
| Net Asset Value, Beginning of Period | | $ | 9.62 | | | $ | 10.22 | | | $ | 10.39 | | | $ | 10.31 | | | $ | 10.72 | | |
| Income from Investment Operations: | |
| Net investment income (b) | | | 0.35 | | | | 0.36 | | | | 0.36 | | | | 0.36 | | | | 0.36 | | |
Net realized and unrealized gain (loss) on investments
and futures contracts | | | 0.60 | | | | (0.60 | ) | | | (0.17 | ) | | | 0.10 | | | | (0.33 | ) | |
| Total from investment operations | | | 0.95 | | | | (0.24 | ) | | | 0.19 | | | | 0.46 | | | | 0.03 | | |
| Less Distributions to Shareholders: | |
| From net investment income | | | (0.35 | ) | | | (0.36 | ) | | | (0.36 | ) | | | (0.36 | ) | | | (0.37 | ) | |
| From net realized gains | | | — | | | | — | | | | — | | | | (0.02 | ) | | | (0.07 | ) | |
| Total distributions to shareholders | | | (0.35 | ) | | | (0.36 | ) | | | (0.36 | ) | | | (0.38 | ) | | | (0.44 | ) | |
| Increase from regulatory settlements | | | — | (c) | | | — | | | | — | | | | — | | | | — | | |
| Net Asset Value, End of Period | | $ | 10.22 | | | $ | 9.62 | | | $ | 10.22 | | | $ | 10.39 | | | $ | 10.31 | | |
| Total return (d)(e) | | | 9.97 | % | | | (2.45 | )% | | | 1.88 | % | | | 4.55 | % | | | 0.25 | % | |
| Ratios to Average Net Assets/Supplemental Data: | |
| Net expenses (f) | | | 0.93 | % | | | 0.90 | % | | | 0.90 | % | | | 0.90 | % | | | 1.01 | % | |
| Waiver/Reimbursement | | | 0.46 | % | | | 0.47 | % | | | 0.47 | % | | | 0.50 | % | | | 0.46 | % | |
| Net investment income (f) | | | 3.45 | % | | | 3.56 | % | | | 3.52 | % | | | 3.55 | % | | | 3.47 | % | |
| Portfolio turnover rate | | | 23 | % | | | 14 | % | | | 25 | % | | | 18 | % | | | 21 | % | |
| Net assets, end of period (000s) | | $ | 17,304 | | | $ | 12,625 | | | $ | 10,506 | | | $ | 11,796 | | | $ | 8,318 | | |
(a) On September 23, 2005, the Columbia Intermediate Tax-Exempt Bond Fund was renamed Columbia Intermediate Municipal Bond Fund.
(b) Per share data was calculated using the average shares outstanding during the period.
(c) Rounds to less then $0.01 per share.
(d) Total return at net asset value assuming all distributions reinvested and no contingent deferred sales charge.
(e) Had the investment advisor and/or any of its affiliates not waived fees or reimbursed a portion of expenses, total return would have been reduced.
(f) The benefits derived from expense reductions had an impact of less than 0.01%.
See Accompanying Notes to Financial Statements.
109
Financial Highlights – Columbia Intermediate Municipal Bond Fund
Selected data for a share outstanding throughout each period is as follows:
| | | Year Ended October 31, | |
| Class T Shares | | 2009 | | 2008 | | 2007 (a) | | 2006 | | 2005 (b) | |
| Net Asset Value, Beginning of Period | | $ | 9.62 | | | $ | 10.22 | | | $ | 10.39 | | | $ | 10.31 | | | $ | 10.72 | | |
| Income from Investment Operations: | |
| Net investment income (c) | | | 0.37 | | | | 0.39 | | | | 0.39 | | | | 0.39 | | | | 0.39 | | |
Net realized and unrealized gain (loss) on investments
and futures contracts | | | 0.60 | | | | (0.60 | ) | | | (0.17 | ) | | | 0.10 | | | | (0.34 | ) | |
| Total from investment operations | | | 0.97 | | | | (0.21 | ) | | | 0.22 | | | | 0.49 | | | | 0.05 | | |
| Less Distributions to Shareholders: | |
| From net investment income | | | (0.37 | ) | | | (0.39 | ) | | | (0.39 | ) | | | (0.39 | ) | | | (0.39 | ) | |
| From net realized gains | | | — | | | | — | | | | — | | | | (0.02 | ) | | | (0.07 | ) | |
| Total distributions to shareholders | | | (0.37 | ) | | | (0.39 | ) | | | (0.39 | ) | | | (0.41 | ) | | | (0.46 | ) | |
| Increase from regulatory settlements | | | — | (d) | | | — | | | | — | | | | — | | | | — | | |
| Net Asset Value, End of Period | | $ | 10.22 | | | $ | 9.62 | | | $ | 10.22 | | | $ | 10.39 | | | $ | 10.31 | | |
| Total return (e)(f) | | | 10.25 | % | | | (2.20 | )% | | | 2.14 | % | | | 4.81 | % | | | 0.50 | % | |
| Ratios to Average Net Assets/Supplemental Data: | |
| Net expenses (g) | | | 0.68 | % | | | 0.65 | % | | | 0.65 | % | | | 0.65 | % | | | 0.76 | % | |
| Waiver/Reimbursement | | | 0.01 | % | | | 0.02 | % | | | 0.02 | % | | | 0.05 | % | | | 0.01 | % | |
| Net investment income (g) | | | 3.72 | % | | | 3.81 | % | | | 3.77 | % | | | 3.80 | % | | | 3.72 | % | |
| Portfolio turnover rate | | | 23 | % | | | 14 | % | | | 25 | % | | | 18 | % | | | 21 | % | |
| Net assets, end of period (000s) | | $ | 10,462 | | | $ | 10,786 | | | $ | 13,170 | | | $ | 14,998 | | | $ | 17,261 | | |
(a) On August 8, 2007, Class G shares were exchanged for Class T shares.
(b) On September 23, 2005, the Columbia Intermediate Tax-Exempt Bond Fund was renamed Columbia Intermediate Municipal Bond Fund.
(c) Per share data was calculated using the average shares outstanding during the period.
(d) Rounds to less than $0.01 per share.
(e) Total return at net asset value assuming all distributions reinvested and no initial sales charge or contingent deferred sales charge.
(f) Had the investment advisor and/or any of its affiliates not waived fees or reimbursed a portion of expenses, total return would have been reduced.
(g) The benefits derived from expense reductions had an impact of less than 0.01%.
See Accompanying Notes to Financial Statements.
110
Financial Highlights – Columbia Intermediate Municipal Bond Fund
Selected data for a share outstanding throughout each period is as follows:
| | | Year Ended October 31, | |
| Class Z Shares | | 2009 | | 2008 | | 2007 | | 2006 | | 2005 (a) | |
| Net Asset Value, Beginning of Period | | $ | 9.62 | | | $ | 10.22 | | | $ | 10.39 | | | $ | 10.31 | | | $ | 10.72 | | |
| Income from Investment Operations: | |
| Net investment income (b) | | | 0.39 | | | | 0.40 | | | | 0.40 | | | | 0.40 | | | | 0.40 | | |
Net realized and unrealized gain (loss) on investments
and futures contracts | | | 0.60 | | | | (0.60 | ) | | | (0.17 | ) | | | 0.10 | | | | (0.33 | ) | |
| Total from investment operations | | | 0.99 | | | | (0.20 | ) | | | 0.23 | | | | 0.50 | | | | 0.07 | | |
| Less Distributions to Shareholders: | |
| From net investment income | | | (0.39 | ) | | | (0.40 | ) | | | (0.40 | ) | | | (0.40 | ) | | | (0.41 | ) | |
| From net realized gains | | | — | | | | — | | | | — | | | | (0.02 | ) | | | (0.07 | ) | |
| Total distributions to shareholders | | | (0.39 | ) | | | (0.40 | ) | | | (0.40 | ) | | | (0.42 | ) | | | (0.48 | ) | |
| Increase from regulatory settlements | | | — | (c) | | | — | | | | — | | | | — | | | | — | | |
| Net Asset Value, End of Period | | $ | 10.22 | | | $ | 9.62 | | | $ | 10.22 | | | $ | 10.39 | | | $ | 10.31 | | |
| Total return (d)(e) | | | 10.41 | % | | | (2.05 | )% | | | 2.29 | % | | | 4.97 | % | | | 0.65 | % | |
| Ratios to Average Net Assets/Supplemental Data: | |
| Net expenses (f) | | | 0.53 | % | | | 0.50 | % | | | 0.50 | % | | | 0.50 | % | | | 0.61 | % | |
| Waiver/Reimbursement | | | 0.01 | % | | | 0.02 | % | | | 0.02 | % | | | 0.05 | % | | | 0.01 | % | |
| Net investment income (f) | | | 3.87 | % | | | 3.96 | % | | | 3.92 | % | | | 3.94 | % | | | 3.87 | % | |
| Portfolio turnover rate | | | 23 | % | | | 14 | % | | | 25 | % | | | 18 | % | | | 21 | % | |
| Net assets, end of period (000s) | | $ | 2,384,815 | | | $ | 2,310,978 | | | $ | 2,207,710 | | | $ | 2,331,279 | | | $ | 2,063,124 | | |
(a) On September 23, 2005, the Columbia Intermediate Tax-Exempt Bond Fund was renamed Columbia Intermediate Municipal Bond Fund.
(b) Per share data was calculated using the average shares outstanding during the period.
(c) Rounds to less than $0.01 per share.
(d) Total return at net asset value assuming all distributions reinvested.
(e) Had the investment advisor and/or any of its affiliates not waived fees or reimbursed a portion of expenses, total return would have been reduced.
(f) The benefits derived from expense reductions had an impact of less than 0.01%.
See Accompanying Notes to Financial Statements.
111
Financial Highlights – Columbia Massachusetts Intermediate Municipal Bond Fund
Selected data for a share outstanding throughout each period is as follows:
| | | Year Ended October 31, | |
| Class A Shares | | 2009 | | 2008 | | 2007 | | 2006 | | 2005 | |
| Net Asset Value, Beginning of Period | | $ | 9.90 | | | $ | 10.35 | | | $ | 10.50 | | | $ | 10.49 | | | $ | 10.87 | | |
| Income from Investment Operations: | |
| Net investment income (a) | | | 0.35 | | | | 0.36 | | | | 0.34 | | | | 0.35 | | | | 0.37 | | |
Net realized and unrealized gain (loss) on investments
and futures contracts | | | 0.71 | | | | (0.44 | ) | | | (0.14 | ) | | | 0.09 | | | | (0.35 | ) | |
| Total from investment operations | | | 1.06 | | | | (0.08 | ) | | | 0.20 | | | | 0.44 | | | | 0.02 | | |
| Less Distributions to Shareholders: | |
| From net investment income | | | (0.35 | ) | | | (0.37 | ) | | | (0.34 | ) | | | (0.35 | ) | | | (0.37 | ) | |
| From net realized gains | | | — | | | | — | (b) | | | (0.01 | ) | | | (0.08 | ) | | | (0.03 | ) | |
| Total distributions to shareholders | | | (0.35 | ) | | | (0.37 | ) | | | (0.35 | ) | | | (0.43 | ) | | | (0.40 | ) | |
| Net Asset Value, End of Period | | $ | 10.61 | | | $ | 9.90 | | | $ | 10.35 | | | $ | 10.50 | | | $ | 10.49 | | |
| Total return (c) | | | 10.78 | %(d) | | | (0.88 | )%(d) | | | 2.00 | % | | | 4.33 | % | | | 0.18 | %(d) | |
| Ratios to Average Net Assets/Supplemental Data: | |
| Net expenses (e) | | | 0.78 | % | | | 0.75 | % | | | 0.99 | % | | | 0.95 | % | | | 0.91 | % | |
| Waiver/Reimbursement | | | 0.12 | % | | | 0.17 | % | | | — | | | | — | | | | — | %(f) | |
| Net investment income (e) | | | 3.30 | % | | | 3.51 | % | | | 3.29 | % | | | 3.39 | % | | | 3.43 | % | |
| Portfolio turnover rate | | | 8 | % | | | 10 | % | | | 15 | % | | | 18 | % | | | 15 | % | |
| Net assets, end of period (000s) | | $ | 16,049 | | | $ | 11,936 | | | $ | 6,914 | | | $ | 7,603 | | | $ | 8,332 | | |
(a) Per share data was calculated using the average shares outstanding during the period.
(b) Rounds to less than $0.01 per share.
(c) Total return at net asset value assuming all distributions reinvested and no initial sales charge or contingent deferred sales charge.
(d) Had the investment advisor and/or any of its affiliates not waived fees or reimbursed a portion of expenses, total return would have been reduced.
(e) The benefits derived from expense reductions had an impact of less than 0.01%.
(f) Rounds to less than 0.01%.
See Accompanying Notes to Financial Statements.
112
Financial Highlights – Columbia Massachusetts Intermediate Municipal Bond Fund
Selected data for a share outstanding throughout each period is as follows:
| | | Year Ended October 31, | |
| Class B Shares | | 2009 | | 2008 | | 2007 | | 2006 | | 2005 | |
| Net Asset Value, Beginning of Period | | $ | 9.90 | | | $ | 10.35 | | | $ | 10.50 | | | $ | 10.49 | | | $ | 10.87 | | |
| Income from Investment Operations: | |
| Net investment income (a) | | | 0.27 | | | | 0.29 | | | | 0.26 | | | | 0.27 | | | | 0.29 | | |
Net realized and unrealized gain (loss) on investments
and futures contracts | | | 0.71 | | | | (0.45 | ) | | | (0.13 | ) | | | 0.09 | | | | (0.35 | ) | |
| Total from investment operations | | | 0.98 | | | | (0.16 | ) | | | 0.13 | | | | 0.36 | | | | (0.06 | ) | |
| Less Distributions to Shareholders: | |
| From net investment income | | | (0.27 | ) | | | (0.29 | ) | | | (0.27 | ) | | | (0.27 | ) | | | (0.29 | ) | |
| From net realized gains | | | — | | | | — | (b) | | | (0.01 | ) | | | (0.08 | ) | | | (0.03 | ) | |
| Total distributions to shareholders | | | (0.27 | ) | | | (0.29 | ) | | | (0.28 | ) | | | (0.35 | ) | | | (0.32 | ) | |
| Net Asset Value, End of Period | | $ | 10.61 | | | $ | 9.90 | | | $ | 10.35 | | | $ | 10.50 | | | $ | 10.49 | | |
| Total return (c) | | | 9.96 | %(d) | | | (1.61 | )%(d) | | | 1.24 | % | | | 3.55 | % | | | (0.57 | )%(d) | |
| Ratios to Average Net Assets/Supplemental Data: | |
| Net expenses (e) | | | 1.53 | % | | | 1.50 | % | | | 1.74 | % | | | 1.70 | % | | | 1.66 | % | |
| Waiver/Reimbursement | | | 0.12 | % | | | 0.17 | % | | | — | | | | — | | | | — | %(f) | |
| Net investment income (e) | | | 2.59 | % | | | 2.78 | % | | | 2.55 | % | | | 2.64 | % | | | 2.67 | % | |
| Portfolio turnover rate | | | 8 | % | | | 10 | % | | | 15 | % | | | 18 | % | | | 15 | % | |
| Net assets, end of period (000s) | | $ | 1,222 | | | $ | 1,440 | | | $ | 1,650 | | | $ | 2,496 | | | $ | 3,220 | | |
(a) Per share data was calculated using the average shares outstanding during the period.
(b) Rounds to less than $0.01 per share.
(c) Total return at net asset value assuming all distributions reinvested and no contingent deferred sales charge.
(d) Had the investment advisor and/or any of its affiliates not waived fees or reimbursed a portion of expenses, total return would have been reduced.
(e) The benefits derived from expense reductions had an impact of less than 0.01%.
(f) Rounds to less than 0.01%.
See Accompanying Notes to Financial Statements.
113
Financial Highlights – Columbia Massachusetts Intermediate Municipal Bond Fund
Selected data for a share outstanding throughout each period is as follows:
| | | Year Ended October 31, | |
| Class C Shares | | 2009 | | 2008 | | 2007 | | 2006 | | 2005 | |
| Net Asset Value, Beginning of Period | | $ | 9.90 | | | $ | 10.35 | | | $ | 10.50 | | | $ | 10.49 | | | $ | 10.87 | | |
| Income from Investment Operations: | |
| Net investment income (a) | | | 0.30 | | | | 0.32 | | | | 0.30 | | | | 0.31 | | | | 0.32 | | |
Net realized and unrealized gain (loss) on investments
and futures contracts | | | 0.72 | | | | (0.44 | ) | | | (0.14 | ) | | | 0.09 | | | | (0.34 | ) | |
| Total from investment operations | | | 1.02 | | | | (0.12 | ) | | | 0.16 | | | | 0.40 | | | | (0.02 | ) | |
| Less Distributions to Shareholders: | |
| From net investment income | | | (0.31 | ) | | | (0.33 | ) | | | (0.30 | ) | | | (0.31 | ) | | | (0.33 | ) | |
| From net realized gains | | | — | | | | — | (b) | | | (0.01 | ) | | | (0.08 | ) | | | (0.03 | ) | |
| Total distributions to shareholders | | | (0.31 | ) | | | (0.33 | ) | | | (0.31 | ) | | | (0.39 | ) | | | (0.36 | ) | |
| Net Asset Value, End of Period | | $ | 10.61 | | | $ | 9.90 | | | $ | 10.35 | | | $ | 10.50 | | | $ | 10.49 | | |
| Total return (c)(d) | | | 10.34 | % | | | (1.27 | )% | | | 1.59 | % | | | 3.91 | % | | | (0.22 | )% | |
| Ratios to Average Net Assets/Supplemental Data: | |
| Net expenses (e) | | | 1.18 | % | | | 1.15 | % | | | 1.39 | % | | | 1.35 | % | | | 1.31 | % | |
| Waiver/Reimbursement | | | 0.47 | % | | | 0.52 | % | | | 0.35 | % | | | 0.35 | % | | | 0.35 | % | |
| Net investment income (e) | | | 2.88 | % | | | 3.13 | % | | | 2.89 | % | | | 2.99 | % | | | 3.02 | % | |
| Portfolio turnover rate | | | 8 | % | | | 10 | % | | | 15 | % | | | 18 | % | | | 15 | % | |
| Net assets, end of period (000s) | | $ | 8,859 | | | $ | 4,036 | | | $ | 3,792 | | | $ | 4,974 | | | $ | 6,866 | | |
(a) Per share data was calculated using the average shares outstanding during the period.
(b) Rounds to less than $0.01 per share.
(c) Total return at net asset value assuming all distributions reinvested and no contingent deferred sales charge.
(d) Had the investment advisor and/or any of its affiliates not waived fees or reimbursed a portion of expenses, total return would have been reduced.
(e) The benefits derived from expense reductions had an impact of less than 0.01%.
See Accompanying Notes to Financial Statements.
114
Financial Highlights – Columbia Massachusetts Intermediate Municipal Bond Fund
Selected data for a share outstanding throughout each period is as follows:
| | | Year Ended October 31, | |
| Class T Shares | | 2009 | | 2008 | | 2007 (a) | | 2006 | | 2005 | |
| Net Asset Value, Beginning of Period | | $ | 9.90 | | | $ | 10.35 | | | $ | 10.50 | | | $ | 10.49 | | | $ | 10.87 | | |
| Income from Investment Operations: | |
| Net investment income (b) | | | 0.36 | | | | 0.38 | | | | 0.35 | | | | 0.36 | | | | 0.38 | | |
Net realized and unrealized gain (loss) on investments
and futures contracts | | | 0.71 | | | | (0.45 | ) | | | (0.13 | ) | | | 0.09 | | | | (0.35 | ) | |
| Total from investment operations | | | 1.07 | | | | (0.07 | ) | | | 0.22 | | | | 0.45 | | | | 0.03 | | |
| Less Distributions to Shareholders: | |
| From net investment income | | | (0.36 | ) | | | (0.38 | ) | | | (0.36 | ) | | | (0.36 | ) | | | (0.38 | ) | |
| From net realized gains | | | — | | | | — | (c) | | | (0.01 | ) | | | (0.08 | ) | | | (0.03 | ) | |
| Total distributions to shareholders | | | (0.36 | ) | | | (0.38 | ) | | | (0.37 | ) | | | (0.44 | ) | | | (0.41 | ) | |
| Net Asset Value, End of Period | | $ | 10.61 | | | $ | 9.90 | | | $ | 10.35 | | | $ | 10.50 | | | $ | 10.49 | | |
| Total return (d) | | | 10.89 | %(e) | | | (0.77 | )%(e) | | | 2.10 | % | | | 4.43 | % | | | 0.28 | %(e) | |
| Ratios to Average Net Assets/Supplemental Data: | |
| Net expenses (f) | | | 0.68 | % | | | 0.65 | % | | | 0.89 | % | | | 0.85 | % | | | 0.81 | % | |
| Waiver/Reimbursement | | | 0.12 | % | | | 0.17 | % | | | — | | | | — | | | | — | %(g) | |
| Net investment income (f) | | | 3.43 | % | | | 3.63 | % | | | 3.40 | % | | | 3.49 | % | | | 3.52 | % | |
| Portfolio turnover rate | | | 8 | % | | | 10 | % | | | 15 | % | | | 18 | % | | | 15 | % | |
| Net assets, end of period (000s) | | $ | 39,221 | | | $ | 37,689 | | | $ | 42,468 | | | $ | 46,787 | | | $ | 54,474 | | |
(a) On August 8, 2007, Class G shares were exchanged for Class T shares.
(b) Per share data was calculated using the average shares outstanding during the period.
(c) Rounds to less than $0.01 per share.
(d) Total return at net asset value assuming all distributions reinvested and no initial sales charge or contingent deferred sales charge.
(e) Had the investment advisor and/or any of its affiliates not waived fees or reimbursed a portion of expenses, total return would have been reduced.
(f) The benefits derived from expense reductions had an impact of less than 0.01%.
(g) Rounds to less than 0.01%.
See Accompanying Notes to Financial Statements.
115
Financial Highlights – Columbia Massachusetts Intermediate Municipal Bond Fund
Selected data for a share outstanding throughout each period is as follows:
| | | Year Ended October 31, | |
| Class Z Shares | | 2009 | | 2008 | | 2007 | | 2006 | | 2005 | |
| Net Asset Value, Beginning of Period | | $ | 9.90 | | | $ | 10.35 | | | $ | 10.50 | | | $ | 10.49 | | | $ | 10.87 | | |
| Income from Investment Operations: | |
| Net investment income (a) | | | 0.37 | | | | 0.39 | | | | 0.37 | | | | 0.38 | | | | 0.39 | | |
Net realized and unrealized gain (loss) on investments
and futures contracts | | | 0.71 | | | | (0.45 | ) | | | (0.14 | ) | | | 0.09 | | | | (0.34 | ) | |
| Total from investment operations | | | 1.08 | | | | (0.06 | ) | | | 0.23 | | | | 0.47 | | | | 0.05 | | |
| Less Distributions to Shareholders: | |
| From net investment income | | | (0.37 | ) | | | (0.39 | ) | | | (0.37 | ) | | | (0.38 | ) | | | (0.40 | ) | |
| From net realized gains | | | — | | | | — | (b) | | | (0.01 | ) | | | (0.08 | ) | | | (0.03 | ) | |
| Total distributions to shareholders | | | (0.37 | ) | | | (0.39 | ) | | | (0.38 | ) | | | (0.46 | ) | | | (0.43 | ) | |
| Net Asset Value, End of Period | | $ | 10.61 | | | $ | 9.90 | | | $ | 10.35 | | | $ | 10.50 | | | $ | 10.49 | | |
| Total return (c) | | | 11.06 | %(d) | | | (0.62 | )%(d) | | | 2.25 | % | | | 4.59 | % | | | 0.43 | %(d) | |
| Ratios to Average Net Assets/Supplemental Data: | |
| Net expenses (e) | | | 0.53 | % | | | 0.50 | % | | | 0.74 | % | | | 0.70 | % | | | 0.66 | % | |
| Waiver/Reimbursement | | | 0.12 | % | | | 0.17 | % | | | — | | | | — | | | | — | %(f) | |
| Net investment income (e) | | | 3.58 | % | | | 3.78 | % | | | 3.55 | % | | | 3.64 | % | | | 3.67 | % | |
| Portfolio turnover rate | | | 8 | % | | | 10 | % | | | 15 | % | | | 18 | % | | | 15 | % | |
| Net assets, end of period (000s) | | $ | 282,469 | | | $ | 259,753 | | | $ | 254,639 | | | $ | 250,224 | | | $ | 247,122 | | |
(a) Per share data was calculated using the average shares outstanding during the period.
(b) Rounds to less than $0.01 per share.
(c) Total return at net asset value assuming all distributions reinvested.
(d) Had the investment advisor and/or any of its affiliates not waived fees or reimbursed a portion of expenses, total return would have been reduced.
(e) The benefits derived from expense reductions had an impact of less than 0.01%.
(f) Rounds to less than 0.01%.
See Accompanying Notes to Financial Statements.
116
Financial Highlights – Columbia New Jersey Intermediate Municipal Bond Fund
Selected data for a share outstanding throughout each period is as follows:
| | | Year Ended October 31, | |
| Class A Shares | | 2009 | | 2008 | | 2007 | | 2006 | | 2005 | |
| Net Asset Value, Beginning of Period | | $ | 9.55 | | | $ | 10.08 | | | $ | 10.26 | | | $ | 10.23 | | | $ | 10.57 | | |
| Income from Investment Operations: | |
| Net investment income (a) | | | 0.35 | | | | 0.37 | | | | 0.33 | | | | 0.34 | | | | 0.35 | | |
Net realized and unrealized gain (loss) on investments
and futures contracts | | | 0.56 | | | | (0.53 | ) | | | (0.15 | ) | | | 0.10 | | | | (0.30 | ) | |
| Total from investment operations | | | 0.91 | | | | (0.16 | ) | | | 0.18 | | | | 0.44 | | | | 0.05 | | |
| Less Distributions to Shareholders: | |
| From net investment income | | | (0.35 | ) | | | (0.37 | ) | | | (0.33 | ) | | | (0.34 | ) | | | (0.35 | ) | |
| From net realized gains | | | — | | | | — | | | | (0.03 | ) | | | (0.07 | ) | | | (0.04 | ) | |
| Total distributions to shareholders | | | (0.35 | ) | | | (0.37 | ) | | | (0.36 | ) | | | (0.41 | ) | | | (0.39 | ) | |
| Net Asset Value, End of Period | | $ | 10.11 | | | $ | 9.55 | | | $ | 10.08 | | | $ | 10.26 | | | $ | 10.23 | | |
| Total return (b) | | | 9.63 | %(c) | | | (1.64 | )%(c) | | | 1.84 | % | | | 4.41 | % | | | 0.44 | %(c) | |
| Ratios to Average Net Assets/Supplemental Data: | |
| Net expenses (d) | | | 0.78 | % | | | 0.75 | % | | | 1.25 | % | | | 1.18 | % | | | 1.06 | % | |
| Waiver/Reimbursement | | | 0.33 | % | | | 0.43 | % | | | — | | | | — | | | | — | %(e) | |
| Net investment income (d) | | | 3.49 | % | | | 3.75 | % | | | 3.28 | % | | | 3.36 | % | | | 3.33 | % | |
| Portfolio turnover rate | | | 10 | % | | | 6 | % | | | 6 | % | | | 3 | % | | | 14 | % | |
| Net assets, end of period (000s) | | $ | 4,974 | | | $ | 3,512 | | | $ | 3,007 | | | $ | 2,472 | | | $ | 3,909 | | |
(a) Per share data was calculated using the average shares outstanding during the period.
(b) Total return at net asset value assuming all distributions reinvested and no initial sales charge or contingent deferred sales charge.
(c) Had the investment advisor and/or any of its affiliates not waived fees or reimbursed a portion of expenses, total return would have been reduced.
(d) The benefits derived from expense reductions had an impact of less than 0.01%.
(e) Rounds to less than 0.01%.
See Accompanying Notes to Financial Statements.
117
Financial Highlights – Columbia New Jersey Intermediate Municipal Bond Fund
Selected data for a share outstanding throughout each period is as follows:
| | | Year Ended October 31, | |
| Class B Shares | | 2009 | | 2008 | | 2007 | | 2006 | | 2005 | |
| Net Asset Value, Beginning of Period | | $ | 9.55 | | | $ | 10.08 | | | $ | 10.26 | | | $ | 10.23 | | | $ | 10.57 | | |
| Income from Investment Operations: | |
| Net investment income (a) | | | 0.28 | | | | 0.30 | | | | 0.26 | | | | 0.27 | | | | 0.27 | | |
Net realized and unrealized gain (loss) on investments
and futures contracts | | | 0.55 | | | | (0.53 | ) | | | (0.15 | ) | | | 0.09 | | | | (0.30 | ) | |
| Total from investment operations | | | 0.83 | | | | (0.23 | ) | | | 0.11 | | | | 0.36 | | | | (0.03 | ) | |
| Less Distributions to Shareholders: | |
| From net investment income | | | (0.27 | ) | | | (0.30 | ) | | | (0.26 | ) | | | (0.26 | ) | | | (0.27 | ) | |
| From net realized gains | | | — | | | | — | | | | (0.03 | ) | | | (0.07 | ) | | | (0.04 | ) | |
| Total distributions to shareholders | | | (0.27 | ) | | | (0.30 | ) | | | (0.29 | ) | | | (0.33 | ) | | | (0.31 | ) | |
| Net Asset Value, End of Period | | $ | 10.11 | | | $ | 9.55 | | | $ | 10.08 | | | $ | 10.26 | | | $ | 10.23 | | |
| Total return (b) | | | 8.82 | %(c) | | | (2.36 | )%(c) | | | 1.08 | % | | | 3.63 | % | | | (0.30 | )%(c) | |
| Ratios to Average Net Assets/Supplemental Data: | |
| Net expenses (d) | | | 1.53 | % | | | 1.50 | % | | | 2.00 | % | | | 1.93 | % | | | 1.81 | % | |
| Waiver/Reimbursement | | | 0.33 | % | | | 0.43 | % | | | — | | | | — | | | | — | %(e) | |
| Net investment income (d) | | | 2.77 | % | | | 3.01 | % | | | 2.53 | % | | | 2.62 | % | | | 2.58 | % | |
| Portfolio turnover rate | | | 10 | % | | | 6 | % | | | 6 | % | | | 3 | % | | | 14 | % | |
| Net assets, end of period (000s) | | $ | 1,205 | | | $ | 1,150 | | | $ | 1,254 | | | $ | 1,518 | | | $ | 1,873 | | |
(a) Per share data was calculated using the average shares outstanding during the period.
(b) Total return at net asset value assuming all distributions reinvested and no contingent deferred sales charge.
(c) Had the investment advisor and/or any of its affiliates not waived fees or reimbursed a portion of expenses, total return would have been reduced.
(d) The benefits derived from expense reductions had an impact of less than 0.01%.
(e) Rounds to less than 0.01%.
See Accompanying Notes to Financial Statements.
118
Financial Highlights – Columbia New Jersey Intermediate Municipal Bond Fund
Selected data for a share outstanding throughout each period is as follows:
| | | Year Ended October 31, | |
| Class C Shares | | 2009 | | 2008 | | 2007 | | 2006 | | 2005 | |
| Net Asset Value, Beginning of Period | | $ | 9.55 | | | $ | 10.08 | | | $ | 10.26 | | | $ | 10.23 | | | $ | 10.57 | | |
| Income from Investment Operations: | |
| Net investment income (a) | | | 0.31 | | | | 0.34 | | | | 0.29 | | | | 0.30 | | | | 0.30 | | |
Net realized and unrealized gain (loss) on investments
and futures contracts | | | 0.56 | | | | (0.54 | ) | | | (0.15 | ) | | | 0.10 | | | | (0.29 | ) | |
| Total from investment operations | | | 0.87 | | | | (0.20 | ) | | | 0.14 | | | | 0.40 | | | | 0.01 | | |
| Less Distributions to Shareholders: | |
| From net investment income | | | (0.31 | ) | | | (0.33 | ) | | | (0.29 | ) | | | (0.30 | ) | | | (0.31 | ) | |
| From net realized gains | | | — | | | | — | | | | (0.03 | ) | | | (0.07 | ) | | | (0.04 | ) | |
| Total distributions to shareholders | | | (0.31 | ) | | | (0.33 | ) | | | (0.32 | ) | | | (0.37 | ) | | | (0.35 | ) | |
| Net Asset Value, End of Period | | $ | 10.11 | | | $ | 9.55 | | | $ | 10.08 | | | $ | 10.26 | | | $ | 10.23 | | |
| Total return (b)(c) | | | 9.20 | % | | | (2.02 | )% | | | 1.44 | % | | | 3.99 | % | | | 0.04 | % | |
| Ratios to Average Net Assets/Supplemental Data: | |
| Net expenses (d) | | | 1.18 | % | | | 1.15 | % | | | 1.65 | % | | | 1.58 | % | | | 1.46 | % | |
| Waiver/Reimbursement | | | 0.68 | % | | | 0.78 | % | | | 0.35 | % | | | 0.35 | % | | | 0.35 | % | |
| Net investment income (d) | | | 3.07 | % | | | 3.36 | % | | | 2.88 | % | | | 2.96 | % | | | 2.92 | % | |
| Portfolio turnover rate | | | 10 | % | | | 6 | % | | | 6 | % | | | 3 | % | | | 14 | % | |
| Net assets, end of period (000s) | | $ | 4,623 | | | $ | 2,582 | | | $ | 3,108 | | | $ | 4,192 | | | $ | 4,590 | | |
(a) Per share data was calculated using the average shares outstanding during the period.
(b) Total return at net asset value assuming all distributions reinvested and no contingent deferred sales charge.
(c) Had the investment advisor and/or any of its affiliates not waived fees or reimbursed a portion of expenses, total return would have been reduced.
(d) The benefits derived from expense reductions had an impact of less than 0.01%.
See Accompanying Notes to Financial Statements.
119
Financial Highlights – Columbia New Jersey Intermediate Municipal Bond Fund
Selected data for a share outstanding throughout each period is as follows:
| | | Year Ended October 31, | |
| Class T Shares | | 2009 | | 2008 | | 2007 (a) | | 2006 | | 2005 | |
| Net Asset Value, Beginning of Period | | $ | 9.55 | | | $ | 10.08 | | | $ | 10.26 | | | $ | 10.23 | | | $ | 10.57 | | |
| Income from Investment Operations: | |
| Net investment income (b) | | | 0.36 | | | | 0.39 | | | | 0.34 | | | | 0.35 | | | | 0.36 | | |
Net realized and unrealized gain (loss) on investments
and futures contracts | | | 0.56 | | | | (0.54 | ) | | | (0.14 | ) | | | 0.10 | | | | (0.30 | ) | |
| Total from investment operations | | | 0.92 | | | | (0.15 | ) | | | 0.20 | | | | 0.45 | | | | 0.06 | | |
| Less Distributions to Shareholders: | |
| From net investment income | | | (0.36 | ) | | | (0.38 | ) | | | (0.35 | ) | | | (0.35 | ) | | | (0.36 | ) | |
| From net realized gains | | | — | | | | — | | | | (0.03 | ) | | | (0.07 | ) | | | (0.04 | ) | |
| Total distributions to shareholders | | | (0.36 | ) | | | (0.38 | ) | | | (0.38 | ) | | | (0.42 | ) | | | (0.40 | ) | |
| Net Asset Value, End of Period | | $ | 10.11 | | | $ | 9.55 | | | $ | 10.08 | | | $ | 10.26 | | | $ | 10.23 | | |
| Total return (c) | | | 9.75 | %(d) | | | (1.53 | )%(d) | | | 1.94 | % | | | 4.51 | % | | | 0.55 | %(d) | |
| Ratios to Average Net Assets/Supplemental Data: | |
| Net expenses (e) | | | 0.68 | % | | | 0.65 | % | | | 1.15 | % | | | 1.08 | % | | | 0.96 | % | |
| Waiver/Reimbursement | | | 0.33 | % | | | 0.43 | % | | | — | | | | — | | | | — | %(f) | |
| Net investment income (e) | | | 3.62 | % | | | 3.85 | % | | | 3.38 | % | | | 3.46 | % | | | 3.43 | % | |
| Portfolio turnover rate | | | 10 | % | | | 6 | % | | | 6 | % | | | 3 | % | | | 14 | % | |
| Net assets, end of period (000s) | | $ | 3,726 | | | $ | 3,848 | | | $ | 5,037 | | | $ | 5,489 | | | $ | 6,484 | | |
(a) On August 8, 2007, Class G shares were exchanged for Class T shares.
(b) Per share data was calculated using the average shares outstanding during the period.
(c) Total return at net asset value assuming all distributions reinvested and no initial sales charge or contingent deferred sales charge.
(d) Had the investment advisor and/or any of its affiliates not waived fees or reimbursed a portion of expenses, total return would have been reduced.
(e) The benefits derived from expense reductions had an impact of less than 0.01%.
(f) Rounds to less than 0.01%.
See Accompanying Notes to Financial Statements.
120
Financial Highlights – Columbia New Jersey Intermediate Municipal Bond Fund
Selected data for a share outstanding throughout each period is as follows:
| | | Year Ended October 31, | |
| Class Z Shares | | 2009 | | 2008 | | 2007 | | 2006 | | 2005 | |
| Net Asset Value, Beginning of Period | | $ | 9.55 | | | $ | 10.08 | | | $ | 10.26 | | | $ | 10.23 | | | $ | 10.57 | | |
| Income from Investment Operations: | |
| Net investment income (a) | | | 0.37 | | | | 0.40 | | | | 0.36 | | | | 0.37 | | | | 0.37 | | |
Net realized and unrealized gain (loss) on investments
and futures contracts | | | 0.56 | | | | (0.53 | ) | | | (0.15 | ) | | | 0.09 | | | | (0.30 | ) | |
| Total from investment operations | | | 0.93 | | | | (0.13 | ) | | | 0.21 | | | | 0.46 | | | | 0.07 | | |
| Less Distributions to Shareholders: | |
| From net investment income | | | (0.37 | ) | | | (0.40 | ) | | | (0.36 | ) | | | (0.36 | ) | | | (0.37 | ) | |
| From net realized gains | | | — | | | | — | | | | (0.03 | ) | | | (0.07 | ) | | | (0.04 | ) | |
| Total distributions to shareholders | | | (0.37 | ) | | | (0.40 | ) | | | (0.39 | ) | | | (0.43 | ) | | | (0.41 | ) | |
| Net Asset Value, End of Period | | $ | 10.11 | | | $ | 9.55 | | | $ | 10.08 | | | $ | 10.26 | | | $ | 10.23 | | |
| Total return (b) | | | 9.91 | %(c) | | | (1.38 | )%(c) | | | 2.10 | % | | | 4.67 | % | | | 0.70 | %(c) | |
| Ratios to Average Net Assets/Supplemental Data: | |
| Net expenses (d) | | | 0.53 | % | | | 0.50 | % | | | 1.00 | % | | | 0.93 | % | | | 0.81 | % | |
| Waiver/Reimbursement | | | 0.33 | % | | | 0.43 | % | | | — | | | | — | | | | — | %(e) | �� |
| Net investment income (d) | | | 3.76 | % | | | 4.00 | % | | | 3.52 | % | | | 3.61 | % | | | 3.58 | % | |
| Portfolio turnover rate | | | 10 | % | | | 6 | % | | | 6 | % | | | 3 | % | | | 14 | % | |
| Net assets, end of period (000s) | | $ | 63,757 | | | $ | 55,108 | | | $ | 53,075 | | | $ | 50,453 | | | $ | 58,181 | | |
(a) Per share data was calculated using the average shares outstanding during the period.
(b) Total return at net asset value assuming all distributions reinvested.
(c) Had the investment advisor and/or any of its affiliates not waived fees or reimbursed a portion of expenses, total return would have been reduced.
(d) The benefits derived from expense reductions had an impact of less than 0.01%.
(e) Rounds to less than 0.01%.
See Accompanying Notes to Financial Statements.
121
Financial Highlights – Columbia New York Intermediate Municipal Bond Fund
Selected data for a share outstanding throughout each period is as follows:
| | | Year Ended October 31, | |
| Class A Shares | | 2009 | | 2008 | | 2007 | | 2006 | | 2005 | |
| Net Asset Value, Beginning of Period | | $ | 11.03 | | | $ | 11.54 | | | $ | 11.68 | | | $ | 11.61 | | | $ | 11.98 | | |
| Income from Investment Operations: | |
| Net investment income (a) | | | 0.39 | | | | 0.40 | | | | 0.38 | | | | 0.38 | | | | 0.39 | | |
Net realized and unrealized gain (loss) on investments
and futures contracts | | | 0.73 | | | | (0.51 | ) | | | (0.14 | ) | | | 0.08 | | | | (0.36 | ) | |
| Total from investment operations | | | 1.12 | | | | (0.11 | ) | | | 0.24 | | | | 0.46 | | | | 0.03 | | |
| Less Distributions to Shareholders: | |
| From net investment income | | | (0.39 | ) | | | (0.40 | ) | | | (0.38 | ) | | | (0.38 | ) | | | (0.39 | ) | |
| From net realized gains | | | — | | | | — | | | | — | (b) | | | (0.01 | ) | | | (0.01 | ) | |
| Total distributions to shareholders | | | (0.39 | ) | | | (0.40 | ) | | | (0.38 | ) | | | (0.39 | ) | | | (0.40 | ) | |
| Net Asset Value, End of Period | | $ | 11.76 | | | $ | 11.03 | | | $ | 11.54 | | | $ | 11.68 | | | $ | 11.61 | | |
| Total return (c) | | | 10.30 | %(d) | | | (1.02 | )%(d) | | | 2.12 | % | | | 4.04 | % | | | 0.22 | %(d) | |
| Ratios to Average Net Assets/Supplemental Data: | |
| Net expenses (e) | | | 0.78 | % | | | 0.75 | % | | | 1.07 | % | | | 1.06 | % | | | 0.97 | % | |
| Waiver/Reimbursement | | | 0.13 | % | | | 0.18 | % | | | — | | | | — | | | | — | %(f) | |
| Net investment income (e) | | | 3.39 | % | | | 3.44 | % | | | 3.30 | % | | | 3.30 | % | | | 3.26 | % | |
| Portfolio turnover rate | | | 20 | % | | | 9 | % | | | 9 | % | | | 4 | % | | | 4 | % | |
| Net assets, end of period (000s) | | $ | 8,452 | | | $ | 4,200 | | | $ | 1,874 | | | $ | 2,529 | | | $ | 2,858 | | |
(a) Per share data was calculated using the average shares outstanding during the period.
(b) Rounds to less than $0.01 per share.
(c) Total return at net asset value assuming all distributions reinvested and no initial sales charge or contingent deferred sales charge.
(d) Had the investment advisor and/or any of its affiliates not waived fees or reimbursed a portion of expenses, total return would have been reduced.
(e) The benefits derived from expense reductions had an impact of less than 0.01%.
(f) Rounds to less than 0.01%.
See Accompanying Notes to Financial Statements.
122
Financial Highlights – Columbia New York Intermediate Municipal Bond Fund
Selected data for a share outstanding throughout each period is as follows:
| | | Year Ended October 31, | |
| Class B Shares | | 2009 | | 2008 | | 2007 | | 2006 | | 2005 | |
| Net Asset Value, Beginning of Period | | $ | 11.03 | | | $ | 11.54 | | | $ | 11.68 | | | $ | 11.61 | | | $ | 11.98 | | |
| Income from Investment Operations: | |
| Net investment income (a) | | | 0.31 | | | | 0.32 | | | | 0.30 | | | | 0.30 | | | | 0.30 | | |
Net realized and unrealized gain (loss) on investments
and futures contracts | | | 0.73 | | | | (0.51 | ) | | | (0.14 | ) | | | 0.07 | | | | (0.36 | ) | |
| Total from investment operations | | | 1.04 | | | | (0.19 | ) | | | 0.16 | | | | 0.37 | | | | (0.06 | ) | |
| Less Distributions to Shareholders: | |
| From net investment income | | | (0.31 | ) | | | (0.32 | ) | | | (0.30 | ) | | | (0.29 | ) | | | (0.30 | ) | |
| From net realized gains | | | — | | | | — | | | | — | (b) | | | (0.01 | ) | | | (0.01 | ) | |
| Total distributions to shareholders | | | (0.31 | ) | | | (0.32 | ) | | | (0.30 | ) | | | (0.30 | ) | | | (0.31 | ) | |
| Net Asset Value, End of Period | | $ | 11.76 | | | $ | 11.03 | | | $ | 11.54 | | | $ | 11.68 | | | $ | 11.61 | | |
| Total return (c) | | | 9.49 | %(d) | | | (1.74 | )%(d) | | | 1.36 | % | | | 3.27 | % | | | (0.53 | )%(d) | |
| Ratios to Average Net Assets/Supplemental Data: | |
| Net expenses (e) | | | 1.53 | % | | | 1.50 | % | | | 1.82 | % | | | 1.81 | % | | | 1.72 | % | |
| Waiver/Reimbursement | | | 0.13 | % | | | 0.18 | % | | | — | | | | — | | | | — | %(f) | |
| Net investment income (e) | | | 2.67 | % | | | 2.77 | % | | | 2.55 | % | | | 2.55 | % | | | 2.52 | % | |
| Portfolio turnover rate | | | 20 | % | | | 9 | % | | | 9 | % | | | 4 | % | | | 4 | % | |
| Net assets, end of period (000s) | | $ | 1,453 | | | $ | 1,503 | | | $ | 1,804 | | | $ | 2,965 | | | $ | 3,586 | | |
(a) Per share data was calculated using the average shares outstanding during the period.
(b) Rounds to less than $0.01 per share.
(c) Total return at net asset value assuming all distributions reinvested and no contingent deferred sales charge.
(d) Had the investment advisor and/or any of its affiliates not waived fees or reimbursed a portion of expenses, total return would have been reduced.
(e) The benefits derived from expense reductions had an impact of less than 0.01%.
(f) Rounds to less than 0.01%.
See Accompanying Notes to Financial Statements.
123
Financial Highlights – Columbia New York Intermediate Municipal Bond Fund
Selected data for a share outstanding throughout each period is as follows:
| | | Year Ended October 31, | |
| Class C Shares | | 2009 | | 2008 | | 2007 | | 2006 | | 2005 | |
| Net Asset Value, Beginning of Period | | $ | 11.03 | | | $ | 11.54 | | | $ | 11.68 | | | $ | 11.61 | | | $ | 11.98 | | |
| Income from Investment Operations: | |
| Net investment income (a) | | | 0.34 | | | | 0.36 | | | | 0.33 | | | | 0.34 | | | | 0.34 | | |
Net realized and unrealized gain (loss) on investments
and futures contracts | | | 0.74 | | | | (0.51 | ) | | | (0.13 | ) | | | 0.07 | | | | (0.36 | ) | |
| Total from investment operations | | | 1.08 | | | | (0.15 | ) | | | 0.20 | | | | 0.41 | | | | (0.02 | ) | |
| Less Distributions to Shareholders: | |
| From net investment income | | | (0.35 | ) | | | (0.36 | ) | | | (0.34 | ) | | | (0.33 | ) | | | (0.34 | ) | |
| From net realized gains | | | — | | | | — | | | | — | (b) | | | (0.01 | ) | | | (0.01 | ) | |
| Total distributions to shareholders | | | (0.35 | ) | | | (0.36 | ) | | | (0.34 | ) | | | (0.34 | ) | | | (0.35 | ) | |
| Net Asset Value, End of Period | | $ | 11.76 | | | $ | 11.03 | | | $ | 11.54 | | | $ | 11.68 | | | $ | 11.61 | | |
| Total return (c)(d) | | | 9.87 | % | | | (1.40 | )% | | | 1.71 | % | | | 3.63 | % | | | (0.18 | )% | |
| Ratios to Average Net Assets/Supplemental Data: | |
| Net expenses (e) | | | 1.18 | % | | | 1.15 | % | | | 1.47 | % | | | 1.46 | % | | | 1.37 | % | |
| Waiver/Reimbursement | | | 0.48 | % | | | 0.53 | % | | | 0.35 | % | | | 0.35 | % | | | 0.35 | % | |
| Net investment income (e) | | | 2.96 | % | | | 3.09 | % | | | 2.89 | % | | | 2.91 | % | | | 2.84 | % | |
| Portfolio turnover rate | | | 20 | % | | | 9 | % | | | 9 | % | | | 4 | % | | | 4 | % | |
| Net assets, end of period (000s) | | $ | 5,861 | | | $ | 2,649 | | | $ | 2,019 | | | $ | 2,544 | | | $ | 3,360 | | |
(a) Per share data was calculated using the average shares outstanding during the period.
(b) Rounds to less than $0.01 per share.
(c) Total return at net asset value assuming all distributions reinvested and no contingent deferred sales charge.
(d) Had the investment advisor and/or any of its affiliates not waived fees or reimbursed a portion of expenses, total return would have been reduced.
(e) The benefits derived from expense reductions had an impact of less than 0.01%.
See Accompanying Notes to Financial Statements.
124
Financial Highlights – Columbia New York Intermediate Municipal Bond Fund
Selected data for a share outstanding throughout each period is as follows:
| | | Year Ended October 31, | |
| Class T Shares | | 2009 | | 2008 | | 2007 (a) | | 2006 | | 2005 | |
| Net Asset Value, Beginning of Period | | $ | 11.03 | | | $ | 11.54 | | | $ | 11.68 | | | $ | 11.61 | | | $ | 11.98 | | |
| Income from Investment Operations: | |
| Net investment income (b) | | | 0.41 | | | | 0.42 | | | | 0.39 | | | | 0.39 | | | | 0.40 | | |
Net realized and unrealized gain (loss) on investments
and futures contracts | | | 0.72 | | | | (0.52 | ) | | | (0.14 | ) | | | 0.08 | | | | (0.36 | ) | |
| Total from investment operations | | | 1.13 | | | | (0.10 | ) | | | 0.25 | | | | 0.47 | | | | 0.04 | | |
| Less Distributions to Shareholders: | |
| From net investment income | | | (0.40 | ) | | | (0.41 | ) | | | (0.39 | ) | | | (0.39 | ) | | | (0.40 | ) | |
| From net realized gains | | | — | | | | — | | | | — | (c) | | | (0.01 | ) | | | (0.01 | ) | |
| Total distributions to shareholders | | | (0.40 | ) | | | (0.41 | ) | | | (0.39 | ) | | | (0.40 | ) | | | (0.41 | ) | |
| Net Asset Value, End of Period | | $ | 11.76 | | | $ | 11.03 | | | $ | 11.54 | | | $ | 11.68 | | | $ | 11.61 | | |
| Total return (d) | | | 10.42 | %(e) | | | (0.90 | )%(e) | | | 2.22 | % | | | 4.15 | % | | | 0.32 | %(e) | |
| Ratios to Average Net Assets/Supplemental Data: | |
| Net expenses (f) | | | 0.68 | % | | | 0.65 | % | | | 0.97 | % | | | 0.96 | % | | | 0.87 | % | |
| Waiver/Reimbursement | | | 0.13 | % | | | 0.18 | % | | | — | | | | — | | | | — | %(g) | |
| Net investment income (f) | | | 3.52 | % | | | 3.62 | % | | | 3.40 | % | | | 3.41 | % | | | 3.36 | % | |
| Portfolio turnover rate | | | 20 | % | | | 9 | % | | | 9 | % | | | 4 | % | | | 4 | % | |
| Net assets, end of period (000s) | | $ | 11,667 | | | $ | 11,520 | | | $ | 13,575 | | | $ | 14,634 | | | $ | 17,943 | | |
(a) On August 8, 2007 Class G shares were exchanged for Class T shares.
(b) Per share data was calculated using the average shares outstanding during the period.
(c) Rounds to less than $0.01 per share.
(d) Total return at net asset value assuming all distributions reinvested and no initial sales charge or contingent deferred sales charge.
(e) Had the investment advisor and/or any of its affiliates not waived fees or reimbursed a portion of expenses, total return would have been reduced.
(f) The benefits derived from expense reductions had an impact of less than 0.01%.
(g) Rounds to less than 0.01%.
See Accompanying Notes to Financial Statements.
125
Financial Highlights – Columbia New York Intermediate Municipal Bond Fund
Selected data for a share outstanding throughout each period is as follows:
| | | Year Ended October 31, | |
| Class Z Shares | | 2009 | | 2008 | | 2007 | | 2006 | | 2005 | |
| Net Asset Value, Beginning of Period | | $ | 11.03 | | | $ | 11.54 | | | $ | 11.68 | | | $ | 11.61 | | | $ | 11.98 | | |
| Income from Investment Operations: | |
| Net investment income (a) | | | 0.42 | | | | 0.42 | | | | 0.41 | | | | 0.41 | | | | 0.42 | | |
Net realized and unrealized gain (loss) on investments
and futures contracts | | | 0.73 | | | | (0.50 | ) | | | (0.14 | ) | | | 0.08 | | | | (0.36 | ) | |
| Total from investment operations | | | 1.15 | | | | (0.08 | ) | | | 0.27 | | | | 0.49 | | | | 0.06 | | |
| Less Distributions to Shareholders: | |
| From net investment income | | | (0.42 | ) | | | (0.43 | ) | | | (0.41 | ) | | | (0.41 | ) | | | (0.42 | ) | |
| From net realized gains | | | — | | | | — | | | | — | (b) | | | (0.01 | ) | | | (0.01 | ) | |
| Total distributions to shareholders | | | (0.42 | ) | | | (0.43 | ) | | | (0.41 | ) | | | (0.42 | ) | | | (0.43 | ) | |
| Net Asset Value, End of Period | | $ | 11.76 | | | $ | 11.03 | | | $ | 11.54 | | | $ | 11.68 | | | $ | 11.61 | | |
| Total return (c) | | | 10.58 | %(d) | | | (0.75 | )%(d) | | | 2.37 | % | | | 4.30 | % | | | 0.47 | %(d) | |
| Ratios to Average Net Assets/Supplemental Data: | |
| Net expenses (e) | | | 0.53 | % | | | 0.50 | % | | | 0.82 | % | | | 0.81 | % | | | 0.72 | % | |
| Waiver/Reimbursement | | | 0.13 | % | | | 0.18 | % | | | — | | | | — | | | | — | %(f) | |
| Net investment income (e) | | | 3.66 | % | | | 3.73 | % | | | 3.55 | % | | | 3.55 | % | | | 3.51 | % | |
| Portfolio turnover rate | | | 20 | % | | | 9 | % | | | 9 | % | | | 4 | % | | | 4 | % | |
| Net assets, end of period (000s) | | $ | 293,160 | | | $ | 272,139 | | | $ | 130,411 | | | $ | 119,457 | | | $ | 105,300 | | |
(a) Per share data was calculated using the average shares outstanding during the period.
(b) Rounds to less than $0.01 per share.
(c) Total return at net asset value assuming all distributions reinvested.
(d) Had the investment advisor and/or any of its affiliates not waived fees or reimbursed a portion of expenses, total return would have been reduced.
(e) The benefits derived from expense reductions had an impact of less than 0.01%.
(f) Rounds to less than 0.01%.
See Accompanying Notes to Financial Statements.
126
Financial Highlights – Columbia Rhode Island Intermediate Municipal Bond Fund
Selected data for a share outstanding throughout each period is as follows:
| | | Year Ended October 31, | |
| Class A Shares | | 2009 | | 2008 | | 2007 | | 2006 | | 2005 | |
| Net Asset Value, Beginning of Period | | $ | 10.52 | | | $ | 11.05 | | | $ | 11.21 | | | $ | 11.20 | | | $ | 11.54 | | |
| Income from Investment Operations: | |
| Net investment income (a) | | | 0.41 | | | | 0.41 | | | | 0.38 | | | | 0.40 | | | | 0.40 | | |
Net realized and unrealized gain (loss) on investments
and futures contracts | | | 0.60 | | | | (0.53 | ) | | | (0.15 | ) | | | 0.04 | | | | (0.33 | ) | |
| Total from investment operations | | | 1.01 | | | | (0.12 | ) | | | 0.23 | | | | 0.44 | | | | 0.07 | | |
| Less Distributions to Shareholders: | |
| From net investment income | | | (0.40 | ) | | | (0.41 | ) | | | (0.38 | ) | | | (0.40 | ) | | | (0.40 | ) | |
| From net realized gains | | | — | | | | — | | | | (0.01 | ) | | | (0.03 | ) | | | (0.01 | ) | |
| Total distributions to shareholders | | | (0.40 | ) | | | (0.41 | ) | | | (0.39 | ) | | | (0.43 | ) | | | (0.41 | ) | |
| Net Asset Value, End of Period | | $ | 11.13 | | | $ | 10.52 | | | $ | 11.05 | | | $ | 11.21 | | | $ | 11.20 | | |
| Total return (b) | | | 9.76 | %(c) | | | (1.16 | )%(c) | | | 2.11 | % | | | 3.98 | % | | | 0.63 | %(c) | |
| Ratios to Average Net Assets/Supplemental Data: | |
| Net expenses (d) | | | 0.79 | % | | | 0.75 | % | | | 1.11 | % | | | 1.02 | % | | | 0.97 | % | |
| Waiver/Reimbursement | | | 0.23 | % | | | 0.27 | % | | | — | | | | — | | | | — | %(e) | |
| Net investment income (d) | | | 3.74 | % | | | 3.71 | % | | | 3.44 | % | | | 3.57 | % | | | 3.50 | % | |
| Portfolio turnover rate | | | 13 | % | | | 14 | % | | | 11 | % | | | 10 | % | | | 12 | % | |
| Net assets, end of period (000s) | | $ | 2,432 | | | $ | 3,247 | | | $ | 1,130 | | | $ | 979 | | | $ | 1,544 | | |
(a) Per share data was calculated using the average shares outstanding during the period.
(b) Total return at net asset value assuming all distributions reinvested and no initial sales charge or contingent deferred sales charge.
(c) Had the investment advisor and/or any of its affiliates not waived fees or reimbursed a portion of expenses, total return would have been reduced.
(d) The benefits derived from expense reductions had an impact of less than 0.01%.
(e) Rounds to less than 0.01%.
See Accompanying Notes to Financial Statements.
127
Financial Highlights – Columbia Rhode Island Intermediate Municipal Bond Fund
Selected data for a share outstanding throughout each period is as follows:
| | | Year Ended October 31, | |
| Class B Shares | | 2009 | | 2008 | | 2007 | | 2006 | | 2005 | |
| Net Asset Value, Beginning of Period | | $ | 10.52 | | | $ | 11.05 | | | $ | 11.21 | | | $ | 11.20 | | | $ | 11.54 | | |
| Income from Investment Operations: | |
| Net investment income (a) | | | 0.32 | | | | 0.33 | | | | 0.30 | | | | 0.31 | | | | 0.31 | | |
Net realized and unrealized gain (loss) on investments
and futures contracts | | | 0.61 | | | | (0.53 | ) | | | (0.15 | ) | | | 0.04 | | | | (0.32 | ) | |
| Total from investment operations | | | 0.93 | | | | (0.20 | ) | | | 0.15 | | | | 0.35 | | | | (0.01 | ) | |
| Less Distributions to Shareholders: | |
| From net investment income | | | (0.32 | ) | | | (0.33 | ) | | | (0.30 | ) | | | (0.31 | ) | | | (0.32 | ) | |
| From net realized gains | | | — | | | | — | | | | (0.01 | ) | | | (0.03 | ) | | | (0.01 | ) | |
| Total distributions to shareholders | | | (0.32 | ) | | | (0.33 | ) | | | (0.31 | ) | | | (0.34 | ) | | | (0.33 | ) | |
| Net Asset Value, End of Period | | $ | 11.13 | | | $ | 10.52 | | | $ | 11.05 | | | $ | 11.21 | | | $ | 11.20 | | |
| Total return (b) | | | 8.94 | %(c) | | | (1.88 | )%(c) | | | 1.35 | % | | | 3.21 | % | | | (0.12 | )%(c) | |
| Ratios to Average Net Assets/Supplemental Data: | |
| Net expenses (d) | | | 1.54 | % | | | 1.50 | % | | | 1.86 | % | | | 1.77 | % | | | 1.72 | % | |
| Waiver/Reimbursement | | | 0.23 | % | | | 0.27 | % | | | — | | | | — | | | | — | %(e) | |
| Net investment income (d) | | | 2.95 | % | | | 3.00 | % | | | 2.73 | % | | | 2.82 | % | | | 2.75 | % | |
| Portfolio turnover rate | | | 13 | % | | | 14 | % | | | 11 | % | | | 10 | % | | | 12 | % | |
| Net assets, end of period (000s) | | $ | 282 | | | $ | 307 | | | $ | 303 | | | $ | 638 | | | $ | 899 | | |
(a) Per share data was calculated using the average shares outstanding during the period.
(b) Total return at net asset value assuming all distributions reinvested and no contingent deferred sales charge.
(c) Had the investment advisor and/or any of its affiliates not waived fees or reimbursed a portion of expenses, total return would have been reduced.
(d) The benefits derived from expense reductions had an impact of less than 0.01%.
(e) Rounds to less than 0.01%.
See Accompanying Notes to Financial Statements.
128
Financial Highlights – Columbia Rhode Island Intermediate Municipal Bond Fund
Selected data for a share outstanding throughout each period is as follows:
| | | Year Ended October 31, | |
| Class C Shares | | 2009 | | 2008 | | 2007 | | 2006 | | 2005 | |
| Net Asset Value, Beginning of Period | | $ | 10.52 | | | $ | 11.05 | | | $ | 11.21 | | | $ | 11.20 | | | $ | 11.54 | | |
| Income from Investment Operations: | |
| Net investment income (a) | | | 0.36 | | | | 0.37 | | | | 0.34 | | | | 0.35 | | | | 0.35 | | |
Net realized and unrealized gain (loss) on investments
and futures contracts | | | 0.61 | | | | (0.53 | ) | | | (0.15 | ) | | | 0.04 | | | | (0.32 | ) | |
| Total from investment operations | | | 0.97 | | | | (0.16 | ) | | | 0.19 | | | | 0.39 | | | | 0.03 | | |
| Less Distributions to Shareholders: | |
| From net investment income | | | (0.36 | ) | | | (0.37 | ) | | | (0.34 | ) | | | (0.35 | ) | | | (0.36 | ) | |
| From net realized gains | | | — | | | | — | | | | (0.01 | ) | | | (0.03 | ) | | | (0.01 | ) | |
| Total distributions to shareholders | | | (0.36 | ) | | | (0.37 | ) | | | (0.35 | ) | | | (0.38 | ) | | | (0.37 | ) | |
| Net Asset Value, End of Period | | $ | 11.13 | | | $ | 10.52 | | | $ | 11.05 | | | $ | 11.21 | | | $ | 11.20 | | |
| Total return (b)(c) | | | 9.32 | % | | | (1.54 | )% | | | 1.70 | % | | | 3.57 | % | | | 0.23 | % | |
| Ratios to Average Net Assets/Supplemental Data: | |
| Net expenses (d) | | | 1.19 | % | | | 1.15 | % | | | 1.51 | % | | | 1.42 | % | | | 1.37 | % | |
| Waiver/Reimbursement | | | 0.58 | % | | | 0.62 | % | | | 0.35 | % | | | 0.35 | % | | | 0.35 | % | |
| Net investment income (d) | | | 3.26 | % | | | 3.35 | % | | | 3.06 | % | | | 3.17 | % | | | 3.10 | % | |
| Portfolio turnover rate | | | 13 | % | | | 14 | % | | | 11 | % | | | 10 | % | | | 12 | % | |
| Net assets, end of period (000s) | | $ | 1,605 | | | $ | 918 | | | $ | 825 | | | $ | 1,365 | | | $ | 1,487 | | |
(a) Per share data was calculated using the average shares outstanding during the period.
(b) Total return at net asset value assuming all distributions reinvested and no contingent deferred sales charge.
(c) Had the investment advisor and/or any of its affiliates not waived fees or reimbursed a portion of expenses, total return would have been reduced.
(d) The benefits derived from expense reductions had an impact of less than 0.01%.
See Accompanying Notes to Financial Statements.
129
Financial Highlights – Columbia Rhode Island Intermediate Municipal Bond Fund
Selected data for a share outstanding throughout each period is as follows:
| | | Year Ended October 31, | |
| Class T Shares | | 2009 | | 2008 | | 2007 (a) | | 2006 | | 2005 | |
| Net Asset Value, Beginning of Period | | $ | 10.52 | | | $ | 11.05 | | | $ | 11.21 | | | $ | 11.20 | | | $ | 11.54 | | |
| Income from Investment Operations: | |
| Net investment income (b) | | | 0.43 | | | | 0.44 | | | | 0.41 | | | | 0.42 | | | | 0.43 | | |
Net realized and unrealized gain (loss) on investments
and futures contracts | | | 0.61 | | | | (0.53 | ) | | | (0.15 | ) | | | 0.04 | | | | (0.33 | ) | |
| Total from investment operations | | | 1.04 | | | | (0.09 | ) | | | 0.26 | | | | 0.46 | | | | 0.10 | | |
| Less Distributions to Shareholders: | |
| From net investment income | | | (0.43 | ) | | | (0.44 | ) | | | (0.41 | ) | | | (0.42 | ) | | | (0.43 | ) | |
| From net realized gains | | | — | | | | — | | | | (0.01 | ) | | | (0.03 | ) | | | (0.01 | ) | |
| Total distributions to shareholders | | | (0.43 | ) | | | (0.44 | ) | | | (0.42 | ) | | | (0.45 | ) | | | (0.44 | ) | |
| Net Asset Value, End of Period | | $ | 11.13 | | | $ | 10.52 | | | $ | 11.05 | | | $ | 11.21 | | | $ | 11.20 | | |
| Total return (c) | | | 10.03 | %(d) | | | (0.89 | )%(d) | | | 2.36 | % | | | 4.25 | % | | | 0.88 | %(d) | |
| Ratios to Average Net Assets/Supplemental Data: | |
| Net expenses (e) | | | 0.54 | % | | | 0.50 | % | | | 0.86 | % | | | 0.77 | % | | | 0.72 | % | |
| Waiver/Reimbursement | | | 0.23 | % | | | 0.27 | % | | | — | | | | — | | | | — | %(f) | |
| Net investment income (e) | | | 3.95 | % | | | 4.00 | % | | | 3.69 | % | | | 3.81 | % | | | 3.75 | % | |
| Portfolio turnover rate | | | 13 | % | | | 14 | % | | | 11 | % | | | 10 | % | | | 12 | % | |
| Net assets, end of period (000s) | | $ | 8,760 | | | $ | 9,011 | | | $ | 10,852 | | | $ | 11,879 | | | $ | 12,284 | | |
(a) On August 8, 2007, Class G shares were exchanged for Class T shares.
(b) Per share data was calculated using the average shares outstanding during the period.
(c) Total return at net asset value assuming all distributions reinvested and no initial sales charge or contingent deferred sales charge.
(d) Had the investment advisor and/or any of its affiliates not waived fees or reimbursed a portion of expenses, total return would have been reduced.
(e) The benefits derived from expense reductions had an impact of less than 0.01%.
(f) Rounds to less than 0.01%.
See Accompanying Notes to Financial Statements.
130
Financial Highlights – Columbia Rhode Island Intermediate Municipal Bond Fund
Selected data for a share outstanding throughout each period is as follows:
| | | Year Ended October 31, | |
| Class Z Shares | | 2009 | | 2008 | | 2007 | | 2006 | | 2005 | |
| Net Asset Value, Beginning of Period | | $ | 10.52 | | | $ | 11.05 | | | $ | 11.21 | | | $ | 11.20 | | | $ | 11.54 | | |
| Income from Investment Operations: | |
| Net investment income (a) | | | 0.43 | | | | 0.44 | | | | 0.41 | | | | 0.42 | | | | 0.43 | | |
Net realized and unrealized gain (loss) on investments
and futures contracts | | | 0.61 | | | | (0.53 | ) | | | (0.15 | ) | | | 0.04 | | | | (0.33 | ) | |
| Total from investment operations | | | 1.04 | | | | (0.09 | ) | | | 0.26 | | | | 0.46 | | | | 0.10 | | |
| Less Distributions to Shareholders: | |
| From net investment income | | | (0.43 | ) | | | (0.44 | ) | | | (0.41 | ) | | | (0.42 | ) | | | (0.43 | ) | |
| From net realized gains | | | — | | | | — | | | | (0.01 | ) | | | (0.03 | ) | | | (0.01 | ) | |
| Total distributions to shareholders | | | (0.43 | ) | | | (0.44 | ) | | | (0.42 | ) | | | (0.45 | ) | | | (0.44 | ) | |
| Net Asset Value, End of Period | | $ | 11.13 | | | $ | 10.52 | | | $ | 11.05 | | | $ | 11.21 | | | $ | 11.20 | | |
| Total return (b) | | | 10.03 | %(c) | | | (0.89 | )%(c) | | | 2.36 | % | | | 4.25 | % | | | 0.88 | %(c) | |
| Ratios to Average Net Assets/Supplemental Data: | |
| Net expenses (d) | | | 0.54 | % | | | 0.50 | % | | | 0.86 | % | | | 0.77 | % | | | 0.72 | % | |
| Waiver/Reimbursement | | | 0.23 | % | | | 0.27 | % | | | — | | | | — | | | | — | %(e) | |
| Net investment income (d) | | | 3.95 | % | | | 4.01 | % | | | 3.69 | % | | | 3.81 | % | | | 3.75 | % | |
| Portfolio turnover rate | | | 13 | % | | | 14 | % | | | 11 | % | | | 10 | % | | | 12 | % | |
| Net assets, end of period (000s) | | $ | 93,422 | | | $ | 99,493 | | | $ | 103,512 | | | $ | 103,708 | | | $ | 104,062 | | |
(a) Per share data was calculated using the average shares outstanding during the period.
(b) Total return at net asset value assuming all distributions reinvested.
(c) Had the investment advisor and/or any of its affiliates not waived fees or reimbursed a portion of expenses, total return would have been reduced.
(d) The benefits derived from expense reductions had an impact of less than 0.01%.
(e) Rounds to less than 0.01%.
See Accompanying Notes to Financial Statements.
131
Notes to Financial Statements – Columbia Tax-Exempt Bond Funds
October 31, 2009
Note 1. Organization
Columbia Funds Series Trust I (the "Trust") is a Massachusetts business trust registered under the Investment Company Act of 1940, as amended (the "1940 Act"), as an open-end management investment company. Information presented in these financial statements pertains to the following series of the Trust (each, a "Fund", and collectively, the "Funds"):
Columbia Connecticut Intermediate Municipal Bond Fund ("Connecticut")
Columbia Intermediate Municipal Bond Fund ("Intermediate Municipal")
Columbia Massachusetts Intermediate Municipal Bond Fund ("Massachusetts")
Columbia New Jersey Intermediate Municipal Bond Fund ("New Jersey")
Columbia New York Intermediate Municipal Bond Fund ("New York")
Columbia Rhode Island Intermediate Municipal Bond Fund ("Rhode Island")
Investment Objectives
Each Fund, with the exception of Intermediate Municipal, seeks as high a level of current interest income exempt from federal income tax and, to the extent possible, from the individual income tax of its state, as is consistent with relative stability of principal. Intermediate Municipal seeks current income exempt from federal income tax, consistent with preservation of principal. All Funds are non-diversified investment companies, except for Intermediate Municipal and New Jersey which are diversified investment companies.
Fund Shares
The Trust may issue an unlimited number of shares, and each Fund offers five classes of shares: Class A, Class B, Class C, Class T and Class Z. Each share class has its own expense structure and sales charges, as applicable. Effective June 22, 2009, each Fund no longer accepts investments from new or existing investors in the Fund's Class B shares, except in connection with the reinvestment of any dividend and/or capital gain distributions in Class B shares of the Fund and exchanges by existing Class B shareholders of other Columbia Funds.
Class A and Class T shares are subject to a maximum front-end sales charge of 3.25% and 4.75%, respectively, based on the amount of initial investment. Class A and Class T shares purchased without an initial sales charge in accounts aggregating $1 million to $50 million at the time of purchase are subject to a 1.00% contingent deferred sales charge ("CDSC") if the shares are sold within one year after purchase. Class B shares are subject to a maximum CDSC of 3.00% based upon the holding period after purchase. Class B shares will convert to Class A shares eight years after purchase. Class C shares are subject to a 1.00% CDSC on shares sold within one year after purchase. Class Z shares are offered continuously at net asset value. There are certain restrictions on the purchase of Class T and Class Z shares, as described in each Fund's prospectus.
Note 2. Significant Accounting Policies
The preparation of financial statements in accordance with accounting principles generally accepted in the United States of America ("GAAP") requires management to make certain estimates and assumptions that affect the reported amounts of assets and liabilities, the disclosure of contingent assets and liabilities at the date of the financial statements and the reported amounts of revenue and expenses during the reporting period. Actual results could differ from those estimates.
Management has evaluated the events and transactions that have occurred through December 18, 2009, the date the financial statements were issued, and noted no items requiring adjustment of the financial statements or additional disclosures except as disclosed in Note 4.
The following is a summary of significant accounting policies consistently followed by the Funds in the preparation of their financial statements.
Security Valuation
Debt securities generally are valued by pricing services approved by the Trust's Board of Trustees, based upon market transactions for normal, institutional-size trading units of similar securities. The services may use various pricing techniques which take into account appropriate factors such as yield, quality, coupon rate, maturity, type of issue, trading characteristics and other data, as well as broker quotes. Debt
132
Columbia Tax-Exempt Bond Funds, October 31, 2009 (continued)
securities for which quotations are readily available are valued at an over-the-counter or exchange bid quotation.
Certain debt securities, which tend to be more thinly traded and of lesser quality, are priced based on fundamental analysis of the financial condition of the issuer and the estimated value of any collateral. Valuations developed through pricing techniques may vary from the actual amounts realized upon sale of the securities, and the potential variation may be greater for those securities valued using fundamental analysis.
Short-term investments maturing in 60 days or less are valued at amortized cost, which approximates market value.
Investments in other open-end investment companies are valued at net asset value.
Investments for which market quotations are not readily available, or that have quotations which management believes are not reliable, are valued at fair value as determined in good faith under consistently applied procedures established by and under the general supervision of the Board of Trustees. If a security is valued at fair value, such value is likely to be different from the last quoted market price for the security. The determination of fair value often requires significant judgment. To determine fair value, management may use assumptions including but not limited to future cash flows and estimated risk premiums. Multiple inputs from various sources may be used to determine value.
Management establishes a hierarchy that prioritizes the inputs to valuation techniques used to measure fair value giving the highest priority to unadjusted quoted prices in active markets for identical securities (level 1 measurements) and the lowest priority to unobservable inputs (level 3 measurements) when market prices are not readily available or reliable. The three levels of the fair value hierarchy are described below:
• Level 1 – quoted prices in active markets for identical securities
• Level 2 – prices determined using other significant observable inputs (including quoted prices for similar securities, interest rates, prepayment speeds, credit risk and others)
• Level 3 – prices determined using significant unobservable inputs. In situations where quoted prices or observable inputs are unavailable or less reliable, unobservable inputs may be used. Unobservable inputs may include management's own assumptions about the factors market participants would use in pricing an investment.
The inputs or methodology used for valuing securities are not necessarily an indication of the risk associated with investing in those securities.
Security Transactions
Security transactions are accounted for on the trade date. Cost is determined and gains (losses) are based upon the specific identification method for both financial statement and federal income tax purposes.
Delayed Delivery Securities
Each Fund may trade securities on other than normal settlement terms, including securities purchased or sold on a "when-issued" basis. This may increase the risk if the other party to the transaction fails to deliver and causes the Funds to subsequently invest at less advantageous prices. Each Fund holds until the settlement date, in a segregated account, cash or liquid securities in an amount equal to the delayed delivery commitment.
Income Recognition
Interest income is recorded on the accrual basis. Premium and discount are amortized and accreted, respectively, on all debt securities, unless otherwise noted.
Original issue discount is accreted to interest income over the life of the security with a corresponding increase in the cost basis.
Dividend income is recorded on the ex-date.
Expenses
General expenses of the Trust are allocated to the Funds and other series of the Trust based upon relative net assets or other expense allocation methodologies determined by the nature of the expense. Expenses directly attributable to a Fund are charged to such Fund.
Determination of Class Net Asset Value
All income, expenses (other than class-specific expenses, as shown on the Statements of Operations) and realized and unrealized gains (losses) are allocated to each class of a Fund
133
Columbia Tax-Exempt Bond Funds, October 31, 2009 (continued)
on a daily basis for purposes of determining the net asset value of each class. Income and expenses are allocated to each class based on the settled shares method, while realized and unrealized gains (losses) are allocated based on the relative net assets of each class.
Federal Income Tax Status
Each Fund intends to qualify each year as a "regulated investment company" under Subchapter M of the Internal Revenue Code, as amended, and will distribute substantially all of its tax-exempt or taxable income, if any, for its tax year, and as such will not be subject to federal income taxes. In addition, each Fund intends to distribute in each calendar year substantially all of its net investment income, capital gains and certain other amounts, if any, such that each Fund should not be subject to federal excise tax. Therefore, no federal income or excise tax provision is recorded.
Distributions to Shareholders
Distributions from net investment income are declared daily and paid monthly. Net realized capital gains, if any, are declared and distributed at least annually. Income distributions and capital gain distributions are determined in accordance with federal income tax regulations which may differ from GAAP.
Indemnification
In the normal course of business, each Fund enters into contracts that contain a variety of representations and warranties and which provide general indemnities. A Fund's maximum exposure under these arrangements is unknown because this would involve future claims against a Fund. Also, under the Trust's organizational documents and by contract, the Trustees and officers of the Trust are indemnified against certain liabilities that may arise out of actions relating to their duties to the Trust. However, based on experience, the Funds expect the risk of loss due to these representations, warranties and indemnities to be minimal.
Note 3. Federal Tax Information
The timing and character of income and capital gain distributions are determined in accordance with income tax regulations, which may differ from GAAP. Reclassifications are made to each Fund's capital accounts for permanent tax differences to reflect income and gains available for distribution (or available capital loss carryforwards) under income tax regulations.
For the year ended October 31, 2009, permanent book and tax basis differences resulting primarily from differing treatments for distributions and amortization/accretion adjustments on debt securities were identified and reclassified among the components of each Fund's net assets as follows:
| | | Undistributed
Net Investment
Income | | Accumulated
Net Realized
Loss | | Paid-In Capital | |
| Connecticut | | $ | (12,580 | ) | | $ | 12,578 | | | $ | 2 | | |
| Intermediate Municipal | | | (51,421 | ) | | | 66,546 | | | | (15,125 | ) | |
| Massachusetts | | | (12,423 | ) | | | 12,423 | | | | — | | |
| New Jersey | | | (7,488 | ) | | | 7,489 | | | | (1 | ) | |
| New York | | | (4,051 | ) | | | 4,051 | | | | — | | |
| Rhode Island | | | (19,519 | ) | | | 19,519 | | | | — | | |
Net investment income and net realized gains (losses), as disclosed on the Statements of Operations, and net assets were not affected by these reclassifications.
134
Columbia Tax-Exempt Bond Funds, October 31, 2009 (continued)
The tax character of distributions paid during the years ended October 31, 2009 and October 31, 2008 was as follows:
| | October 31, 2009 | |
| | | Tax-Exempt
Income | | Ordinary
Income* | | Long-Term
Capital Gains | |
| Connecticut | | $ | 8,042,693 | | | $ | — | | | $ | — | | |
| Intermediate Municipal | | | 94,030,243 | | | | 220,837 | | | | — | | |
| Massachusetts | | | 11,832,253 | | | | — | | | | — | | |
| New Jersey | | | 2,687,593 | | | | — | | | | — | | |
| New York | | | 10,961,110 | | | | — | | | | — | | |
| Rhode Island | | | 4,299,358 | | | | — | | | | — | | |
| | | October 31, 2008 | |
| | | Tax-Exempt
Income | | Ordinary
Income* | | Long-Term
Capital Gains | |
| Connecticut | | $ | 7,178,910 | | | $ | — | | | $ | — | | |
| Intermediate Municipal | | | 96,828,789 | | | | 182,659 | | | | — | | |
| Massachusetts | | | 12,237,125 | | | | — | | | | 86,355 | | |
| New Jersey | | | 2,631,791 | | | | — | | | | — | | |
| New York | | | 8,426,813 | | | | 35,719 | | | | — | | |
| Rhode Island | | | 4,685,265 | | | | — | | | | — | | |
* For tax purposes short-term capital gain distributions, if any, are considered ordinary income distributions.
As of October 31, 2009, the components of distributable earnings on a tax basis were as follows:
| | | Undistributed
Tax-Exempt
Income | | Undistributed
Ordinary
Income | | Undistributed
Long-Term
Capital Gains | | Net Unrealized
Appreciation* | |
| Connecticut | | $ | 721,106 | | | $ | — | | | $ | — | | | $ | 6,464,739 | | |
| Intermediate Municipal | | | 8,492,986 | | | | — | | | | — | | | | 48,519,190 | | |
| Massachusetts | | | 870,667 | | | | — | | | | — | | | | 13,826,167 | | |
| New Jersey | | | 197,420 | | | | — | | | | — | | | | 2,153,574 | | |
| New York | | | 879,801 | | | | — | | | | — | | | | 11,292,630 | | |
| Rhode Island | | | 300,477 | | | | — | | | | — | | | | 3,912,200 | | |
* The differences between book-basis and tax-basis net unrealized appreciation/depreciation are primarily due to discount accretion/premium amortization on debt securities.
135
Columbia Tax-Exempt Bond Funds, October 31, 2009 (continued)
Unrealized appreciation and depreciation at October 31, 2009, based on cost of investments for federal income tax purposes, were:
| | | Unrealized
Appreciation | | Unrealized
Depreciation | | Net
Unrealized
Appreciation | |
| Connecticut | | $ | 7,699,408 | | | $ | (1,234,669 | ) | | $ | 6,464,739 | | |
| Intermediate Municipal | | | 97,979,290 | | | | (49,460,100 | ) | | | 48,519,190 | | |
| Massachusetts | | | 15,846,057 | | | | (2,019,890 | ) | | | 13,826,167 | | |
| New Jersey | | | 3,188,849 | | | | (1,035,275 | ) | | | 2,153,574 | | |
| New York | | | 12,705,964 | | | | (1,413,334 | ) | | | 11,292,630 | | |
| Rhode Island | | | 4,243,307 | | | | (331,107 | ) | | | 3,912,200 | | |
The following capital loss carryforwards, determined as of October 31, 2009, may be available to reduce taxable income arising from future net realized gains on investments, if any, to the extent permitted by the Internal Revenue Code:
| | | Year of Expiration | |
| | | 2012 | | 2013 | | 2014 | | 2015 | | 2016 | | 2017 | | Total | |
| Connecticut | | $ | — | | | $ | — | | | $ | — | | | $ | 160,577 | | | $ | 254,849 | | | $ | 550,750 | | | $ | 966,176 | | |
| Intermediate Municipal | | | — | | | | 1,549,704 | | | | 183,686 | | | | 1,157,101 | | | | 3,404,128 | | | | 3,520,399 | | | | 9,815,018 | | |
| Massachusetts | | | — | | | | — | | | | — | | | | — | | | | 327,878 | | | | 285,231 | | | | 613,109 | | |
| New Jersey | | | — | | | | — | | | | — | | | | 16,265 | | | | 57,516 | | | | 66,538 | | | | 140,319 | | |
| New York | | | 92,115 | | | | 580,517 | | | | 131,725 | | | | 89,191 | | | | — | | | | 1,269,982 | | | | 2,163,530 | | |
| Rhode Island | | | — | | | | — | | | | — | | | | 129,446 | | | | — | | | | 16,035 | | | | 145,481 | | |
Of the capital loss carryforwards attributable to Intermediate Municipal, $1,733,390, (of which $1,549,704 and $183,686 will expire on October 31, 2013 and October 31, 2014, respectively) were acquired from fund mergers. The availability of a portion of the remaining capital loss carryforwards acquired from fund mergers may be limited in a given year.
Of the capital loss carryforwards attributable to New York, $804,357 (of which $92,115, $580,517 and $131,725 will expire on October 31, 2012, October 31, 2013 and October 31, 2014, respectively) were acquired from the merger with New York Intermediate-Term Tax-Exempt Fund (referenced in Note 11 below).
Management is required to determine whether a tax position of the Funds is more likely than not to be sustained upon examination by the applicable taxing authority, including resolution of any related appeals or litigation processes, based on the technical merits of the position. The tax benefit to be recognized by each Fund is measured as the largest amount of benefit that is greater than fifty percent likely of being realized upon ultimate settlement. Management is not aware of any tax positions for which it is reasonably possible that the total amounts of unrecognized tax benefits will significantly change in the next twelve months. However, management's conclusions may be subject to review and adjustment at a later date based on factors including, but not limited to, new tax laws, regulations, and administrative interpretations (including relevant court decisions). The Funds' federal tax returns for the prior three fiscal ye ars remain subject to examination by the Internal Revenue Service.
Note 4. Fees and Compensation Paid to Affiliates
Investment Advisory Fee
Columbia Management Advisors, LLC ("Columbia"), an indirect, wholly owned subsidiary of Bank of America
136
Columbia Tax-Exempt Bond Funds, October 31, 2009 (continued)
Corporation ("BOA"), provides investment advisory services to the Funds. Columbia receives a monthly investment advisory fee based on each Fund's average daily net assets as follows:
| Average Daily Net Assets | | Annual Fee Rate | |
| First $500 million | | | 0.48 | % | |
| $500 million to $1 billion | | | 0.43 | % | |
| $1 billion to $1.5 billion | | | 0.40 | % | |
| $1.5 billion to $3 billion | | | 0.37 | % | |
| $3 billion to $6 billion | | | 0.36 | % | |
| Over $6 billion | | | 0.35 | % | |
For the year ended October 31, 2009, the effective investment advisory fee rates for each Fund, as a percentage of each Fund's average daily net assets, were as follows:
| | | Effective
Fee Rate | |
| Connecticut | | | 0.48 | % | |
| Intermediate Municipal | | | 0.41 | % | |
| Massachusetts | | | 0.48 | % | |
| New Jersey | | | 0.48 | % | |
| New York | | | 0.48 | % | |
| Rhode Island | | | 0.48 | % | |
BOA entered into an agreement dated September 29, 2009 to sell a portion of the asset management business of Columbia Management Group, LLC to Ameriprise Financial, Inc. The transaction ("Transaction") includes a sale of the part of the asset management business that advises long-term mutual funds, including the Funds. The Transaction is subject to certain approvals and other conditions to closing, and is currently expected to close in the spring of 2010.
Administration Fee
Columbia provides administrative and other services to the Funds for a monthly administration fee at the annual rate of 0.067% of each Fund's average daily net assets.
Pricing and Bookkeeping Fees
The Funds have entered into a Financial Reporting Services Agreement (the "Financial Reporting Services Agreement") with State Street Bank & Trust Company ("State Street") and Columbia pursuant to which State Street provides financial reporting services to the Funds. The Funds have also entered into an Accounting Services Agreement (collectively with the Financial Reporting Services Agreement, the "State Street Agreements") with State Street and Columbia pursuant to which State Street provides accounting services to the Funds. Under the State Street Agreements, each Fund pays State Street an annual fee of $38,000 paid monthly plus an additional monthly fee based on an annualized percentage rate of average daily net assets of each Fund for the month. The aggregate fee per Fund will not exceed $140,000 per year (exclusive of out-of-pocket expenses and charges). The Funds also reimburse State Street for certain out-of-pocket ex penses and charges.
The Funds have entered into a Pricing and Bookkeeping Oversight and Services Agreement (the "Services Agreement") with Columbia. Under the Services Agreement, Columbia provides services related to Fund expenses and the requirements of the Sarbanes-Oxley Act of 2002, and provides oversight of the accounting and financial reporting services provided by State Street. Under the Services Agreement, the Funds reimburse Columbia for out-of-pocket expenses.
Transfer Agent Fee
Columbia Management Services, Inc. (the "Transfer Agent"), an affiliate of Columbia and an indirect, wholly owned subsidiary of BOA, provides shareholder services to the Funds and has contracted with Boston Financial Data Services ("BFDS") to serve as sub-transfer agent. The Transfer Agent is entitled to receive a fee for its services, paid monthly, at the annual rate of $17.34 per account plus reimbursement of certain sub-transfer agent fees paid by the Transfer Agent (exclusive of BFDS fees), calculated based on assets held in omnibus accounts and intended to recover the cost of payments to other parties (including affiliates of BOA) for services to those accounts. Effective November 1, 2009, the annual rate will change to $22.36 per account. The Transfer Agent pays the fees of BFDS for services as sub-transfer agent and is not entitled to reimbursement for such fees from the Funds.
The Transfer Agent may also retain, as additional compensation for its services, fees for wire, telephone and redemption orders, Individual Retirement Account ("IRA") trustee agent fees and account transcript fees due to the
137
Columbia Tax-Exempt Bond Funds, October 31, 2009 (continued)
Transfer Agent from shareholders of the Funds and credits (net of bank charges) earned with respect to balances in accounts the Transfer Agent maintains in connection with its services to the Funds. The Transfer Agent also receives reimbursement for certain out-of-pocket expenses.
An annual minimum account balance fee of $20 may apply to certain accounts with a value below each Fund's initial minimum investment requirements to reduce the impact of small accounts on transfer agent fees. These minimum account balance fees are recorded as part of expense reductions on the Statements of Operations. For the year ended October 31, 2009, there were no minimum account balance fees charged by the Funds.
Underwriting Discounts, Service and Distribution Fees
Columbia Management Distributors, Inc. (the "Distributor"), an affiliate of Columbia and an indirect, wholly owned subsidiary of BOA, is the principal underwriter of the Funds' shares. For the year ended October 31, 2009, the Distributor has retained net underwriting discounts on the sales of the Funds' Class A and Class T shares, and received net CDSC fees on Class A, Class B and Class C share redemptions as follows:
| | | Front-End Sales Charge | | CDSC | |
| | | Class A | | Class T | | Class A | | Class B | | Class C | |
| Connecticut | | $ | 1,999 | | | $ | 22 | | | $ | 16,810 | | | $ | 4,348 | | | $ | 24 | | |
| Intermediate Municipal | | | 7,431 | | | | 19 | | | | — | | | | 3,507 | | | | 3,169 | | |
| Massachusetts | | | 3,132 | | | | 192 | | | | 24,420 | | | | 1,002 | | | | 1,024 | | |
| New Jersey | | | 1,672 | | | | 67 | | | | — | | | | 1,232 | | | | 118 | | |
| New York | | | 3,369 | | | | 17 | | | | — | | | | 1,620 | | | | 1,018 | | |
| Rhode Island | | | 214 | | | | 204 | | | | 7,304 | | | | 300 | | | | — | | |
The Funds have adopted distribution and shareholder servicing plans (the "Plans") pursuant to Rule 12b-1 under the 1940 Act, which require the payment of distribution and service fees. The fees are intended to compensate the Distributor and/or eligible selling and/or servicing agents for selling shares of the Funds and providing services to investors. Payments under the Plans, which are calculated daily and paid monthly, are based on the average daily net assets of each Fund at the following annual rates:
| | | Distribution Fee | | Service Fee | |
| | | Class B | | Class C | | Class A | | Class B | | Class C | |
| Connecticut1 | | | 0.75 | % | | | 0.75 | % | | | 0.25 | % | | | 0.25 | % | | | 0.25 | % | |
| Intermediate Municipal2 | | | 0.65 | % | | | 0.65 | % | | | 0.20 | % | | | 0.20 | % | | | 0.20 | % | |
| Massachusetts1 | | | 0.75 | % | | | 0.75 | % | | | 0.25 | % | | | 0.25 | % | | | 0.25 | % | |
| New Jersey1 | | | 0.75 | % | | | 0.75 | % | | | 0.25 | % | | | 0.25 | % | | | 0.25 | % | |
| New York1 | | | 0.75 | % | | | 0.75 | % | | | 0.25 | % | | | 0.25 | % | | | 0.25 | % | |
| Rhode Island1 | | | 0.75 | % | | | 0.75 | % | | | 0.25 | % | | | 0.25 | % | | | 0.25 | % | |
1 The Distributor has voluntarily agreed to waive a portion of the distribution fee for Class C shares so that the combined distribution and service fees do not exceed 0.65% annually of average net assets. This arrangement may be modified or terminated by the Distributor at any time.
2 The Distributor has voluntarily agreed to waive a portion of Intermediate Municipal's Class C share distribution fees so that the combined distribution and service fees do not exceed 0.40% annually of average net assets. This arrangement may be modified or terminated by the Distributor at any time.
138
Columbia Tax-Exempt Bond Funds, October 31, 2009 (continued)
Shareholder Services Fee
Each Fund has adopted shareholder services plans that permit them to pay for certain services provided to Class T shareholders by their financial advisors. The Funds may pay shareholder service fees up to a maximum of 0.40% of each Fund's average daily net assets attributable to Class T shares (comprised of up to 0.20% for shareholder liaison services and up to 0.20% for administrative support services) but such fees will not exceed each Fund's net investment income attributable to Class T shares. Prior to October 29, 2008, the Funds were subject to a shareholder service fee up to a maximum of 0.50% of each Fund's average daily net assets attributed to Class T shares. Connecticut, Intermediate Municipal, Massachusetts, New Jersey and New York do not intend to pay more than 0.15% annually during the current fiscal year for Class T shareholder services fees. No fees were charged during the year ended October 31, 2009 under the Cla ss T service plan with respect to Rhode Island.
Fee Waivers and Expense Reimbursements
Effective March 1, 2009, Columbia has voluntarily agreed to reimburse a portion of the Funds' expenses so that ordinary operating expenses (excluding any distribution and service fees, brokerage commissions, interest, taxes and extraordinary expenses, but including custodian charges relating to overdrafts, if any), after giving effect to any balance credits from the Funds' custodian, do not exceed 0.55% of each Fund's average daily net assets on an annualized basis. Columbia, in its discretion, may revise or discontinue these arrangements any time.
Prior to March 1, 2009, Columbia had contractually agreed to waive fees and/or reimburse each Fund for certain expenses so that ordinary operating expenses (excluding any distribution and service fees, brokerage commissions, interest, taxes and extraordinary expenses, but including custodian charges relating to overdrafts, if any), after giving effect to any balance credits from the Funds' custodian, would not exceed 0.50% annually of each Fund's average daily net assets.
Fees Paid to Officers and Trustees
All officers of the Funds are employees of Columbia or its affiliates and, with the exception of the Funds' Chief Compliance Officer, receive no compensation from the Funds. The Board of Trustees has appointed a Chief Compliance Officer to the Funds in accordance with federal securities regulations. The Funds, along with other affiliated funds, pay their pro-rata share of the expenses associated with the Chief Compliance Officer. Each Fund's expenses for the Chief Compliance Officer will not exceed $15,000 per year.
The Trust's eligible Trustees may participate in a deferred compensation plan which may be terminated at any time. Obligations of the plan will be paid solely out of the Funds' assets.
As a result of fund mergers, certain Funds assumed the liabilities of the deferred compensation plan of the acquired fund, which are included in "Trustees' fees" on the Statements of Assets and Liabilities. The deferred compensation plan may be terminated at any time. Any payments to plan participants are paid solely out of the Funds' assets.
Other
Each Fund may make daily investments of cash balances in affiliated open-ended investment companies, pursuant to an exemptive order received from the Securities and Exchange Commission. As an investing Fund, each Fund indirectly bears its proportionate share of the expenses of the fund in which it invests.
Note 5. Custody Credits
Each Fund has an agreement with its custodian bank under which custody fees may be reduced by balance credits. These credits are recorded as part of expense reductions on the Statements of Operations. The Funds could have invested a portion of the assets utilized in connection with the expense offset arrangement in an income-producing asset if they had not entered into such an agreement.
For the year ended October 31, 2009, these custody credits reduced total expenses for the Funds as follows:
| | | Custody
Credits | |
| Connecticut | | $ | 1,760 | | |
| Intermediate Municipal | | | 4,778 | | |
| Massachusetts | | | 1,423 | | |
| New Jersey | | | 255 | | |
| New York | | | 514 | | |
| Rhode Island | | | 200 | | |
139
Columbia Tax-Exempt Bond Funds, October 31, 2009 (continued)
Note 6. Portfolio Information
For the year ended October 31, 2009, the cost of purchases and proceeds from sales of securities, excluding short-term obligations, for the Funds were as follows:
| | | Purchases | | Sales | |
| Connecticut | | $ | 58,453,909 | | | $ | 25,878,532 | | |
| Intermediate Municipal | | | 538,183,364 | | | | 552,070,207 | | |
| Massachusetts | | | 42,123,412 | | | | 24,441,044 | | |
| New Jersey | | | 15,254,026 | | | | 6,632,811 | | |
| New York | | | 64,987,795 | | | | 57,914,324 | | |
| Rhode Island | | | 13,664,260 | | | | 25,382,242 | | |
Note 7. Line of Credit
The Funds and other affiliated funds participate in a $280,000,000 committed, unsecured revolving line of credit provided by State Street. The maximum amount that may be borrowed by any fund is limited to the lesser of $200,000,000 and the Fund's borrowing limit set forth in the Fund's registration statement. Borrowings are available for short-term liquidity or temporary or emergency purposes.
Effective October 15, 2009, interest is charged to each participating fund based on the fund's borrowings at a rate per annum equal to the greater of the Federal Funds Rate plus 1.25% or the overnight LIBOR Rate plus 1.25%. In addition, a commitment fee of 0.15% per annum is accrued and apportioned among the participating funds pro rata based on their relative net assets.
Prior to October 15, 2009, interest was charged to each participating fund based on the fund's borrowings at a rate per annum equal to the greater of the Federal Funds Rate plus 0.50% or the overnight LIBOR Rate plus 0.50%. In addition, an annual operations agency fee of $20,000, an amendment fee of 0.02% and a commitment fee of 0.12% per annum were accrued and apportioned among the participating funds pro rata based on their relative net assets.
For the year ended October 31, 2009, the Funds did not borrow under these arrangements.
Note 8. Shares of Beneficial Interest
As of October 31, 2009, the Funds had shareholders that held greater than 5% of the shares outstanding of a Fund, whose shares were beneficially owned by participant accounts over which BOA and/or any of its affiliates had either sole or joint investment discretion. The percentages of shares of beneficial interest outstanding held therein are as follows:
| | | % of Shares
Outstanding
Held | |
| Connecticut | | | 80.8 | | |
| Intermediate Municipal | | | 88.7 | | |
| Massachusetts | | | 77.8 | | |
| New Jersey | | | 75.3 | | |
| New York | | | 82.2 | | |
| Rhode Island | | | 83.5 | | |
Subscription and redemption activity of these accounts may have a significant effect on the operations of the Funds.
Note 9. Regulatory Settlements with Third Parties
During the year ended October 31, 2009, Columbia Intermediate Municipal Bond Fund received payments totaling $15,125 relating to certain regulatory settlements with third parties that the Fund had participated in during the year. The payments have been included in "Increase from regulatory settlements" on the Statement of Changes in Net Assets.
Note 10. Significant Risks and Contingencies
Non-Diversification Risk
Connecticut, Massachusetts, New York and Rhode Island are non-diversified funds, which generally mean that they may invest a greater percentage of their total assets in the securities of fewer issuers than a "diversified" fund. This increases the risk that a change in the value of any one investment held by these Funds could affect the overall value of such Funds more than it would affect that of a diversified fund holding a greater number of investments. Accordingly, these Funds' value will likely be more volatile than the value of more diversified funds. These Funds may not operate as non-diversified funds at all times.
Geographic Concentration Risk
Each of Connecticut, Intermediate Municipal, Massachusetts, New Jersey, New York and Rhode Island had greater than 5% of its total net assets on October 31, 2009, invested in debt
140
Columbia Tax-Exempt Bond Funds, October 31, 2009 (continued)
obligations issued by its respective state and political subdivisions, agencies and public authorities, as well as in such obligations of Puerto Rico. The Funds are more susceptible to economic and political factors adversely affecting issuers of their respective state's and Puerto Rico's municipal securities than are municipal bond funds that are not concentrated to the same extent in these issuers.
Concentration of Credit Risk
Each Fund holds investments that are insured by private insurers who guarantee the payment of principal and interest in the event of default or that are supported by a letter of credit. At October 31, 2009, private insurers who insured greater than 5% of the total net assets of the Funds were as follows:
Connecticut
| Insurer | | % of Total
Net Assets | |
| National Public Finance Guarantee Corp. | | | 15.4 | | |
| Financial Security Assurance, Inc. | | | 9.7 | | |
| Financial Guaranty Insurance Co. | | | 9.6 | | |
| Ambac Assurance Corp. | | | 8.0 | | |
Intermediate Municipal
| Insurer | | % of Total
Net Assets | |
| National Public Finance Guarantee Corp. | | | 14.3 | | |
| Financial Security Assurance, Inc. | | | 13.0 | | |
| Ambac Assurance Corp. | | | 6.9 | | |
| Financial Guaranty Insurance Co. | | | 5.3 | | |
Massachusetts
| Insurer | | % of Total
Net Assets | |
| National Public Finance Guarantee Corp. | | | 19.8 | | |
| Financial Security Assurance, Inc. | | | 12.9 | | |
| Ambac Assurance Corp. | | | 12.6 | | |
New Jersey
| Insurer | | % of Total
Net Assets | |
| Ambac Assurance Corp. | | | 13.9 | | |
| National Public Finance Guarantee Corp. | | | 11.8 | | |
| Financial Security Assurance, Inc. | | | 11.4 | | |
| Financial Guaranty Insurance Co. | | | 10.6 | | |
New York
| Insurer | | % of Total
Net Assets | |
| National Public Finance Guarantee Corp. | | | 11.5 | | |
| Financial Security Assurance, Inc. | | | 10.2 | | |
| Ambac Assurance Corp. | | | 10.0 | | |
Rhode Island
| Insurer | | % of Total
Net Assets | |
| Financial Security Assurance, Inc. | | | 27.7 | | |
| National Public Finance Guarantee Corp. | | | 18.1 | | |
| Ambac Assurance Corp. | | | 11.4 | | |
| Syncora Guarantee, Inc. | | | 7.6 | | |
| Assured Guaranty Ltd. | | | 6.3 | | |
At November 25, 2009, National Public Finance Guarantee Corp., Ambac Assurance Corp., Financial Guaranty Insurance Co., Financial Security Assurance, Inc., Syncora Guarantee, Inc. and Assured Guaranty Ltd. were rated by Standard & Poor's A, CC, Non Rated, AAA, R and AAA, respectively.
Tax Development Risk
Each Fund purchases municipal securities whose interest, in the opinion of bond counsel, is free from federal income tax. There is no assurance that the Internal Revenue Service (IRS) will agree with this opinion. In the event the IRS determines that an issuer does not comply with relevant tax requirements, interest payments from a security could become federally taxable, possibly retroactively to the date the security was issued. As a shareholder of the Funds, you may be required to file an amended tax return as a result.
141
Columbia Tax-Exempt Bond Funds, October 31, 2009 (continued)
Legal Proceedings
Columbia Management Advisors, LLC and Columbia Management Distributors, Inc. (collectively, the "Columbia Group") are subject to a settlement agreement with the New York Attorney General ("NYAG") (the "NYAG Settlement") and a settlement order with the SEC (the "SEC Order") on matters relating to mutual fund trading, each dated February 9, 2005. Under the terms of the SEC Order, the Columbia Group (or predecessor entities) agreed, among other things, to: pay disgorgement and civil money penalties collectively totaling $140 million; cease and desist from violations of the antifraud provisions and certain other provisions of the federal securities laws; maintain certain compliance and ethics oversight structures; and retain an independent consultant to review the Columbia Group's applicable supervisory, compliance, control and other policies and procedures. The NYAG Settlement, among other things, requires Columbia Management Advis ors, LLC and its affiliates to reduce management fees for certain funds in the Columbia family of mutual funds in a projected total of $160 million over five years through November 30, 2009 and to make certain disclosures to investors relating to expenses. In connection with the Columbia Group providing services to the Columbia Funds, the Columbia Funds have voluntarily undertaken to implement certain governance measures designed to maintain the independence of their boards of trustees and certain special consulting and compliance measures.
Pursuant to the SEC Order and related procedures, the $140 million in settlement amounts described above has been substantially distributed in accordance with a distribution plan that was developed by an independent distribution consultant and approved by the SEC on April 6, 2007.
In connection with the events described above, various parties have filed suit against certain funds, the Trustees of the Columbia Funds, FleetBoston Financial Corporation and its affiliated entities and/or Bank of America and its affiliated entities.
On February 20, 2004, the Judicial Panel on Multidistrict Litigation transferred these cases and cases against other mutual fund companies based on similar allegations to the United States District Court in Maryland for consolidated or coordinated pretrial proceedings (the "MDL"). Subsequently, additional related cases were transferred to the MDL. On September 29, 2004, the plaintiffs in the MDL filed amended and consolidated complaints. One of these amended complaints is a putative class action that includes claims under the federal securities laws and state common law, and that names Columbia Management Advisors, Inc. (which has since merged into Banc of America Capital Management, LLC (now named Columbia Management Advisors, LLC)) ("Columbia"), Columbia Funds Distributor, Inc. (now named Columbia Management Distributors, Inc.) (the "Distributor"), the Trustees of the Columbia Funds, Bank of America Corporation and others as d efendants. Another of the amended complaints is a derivative action purportedly on behalf of the Columbia Funds that asserts claims under federal securities laws and state common law.
On February 25, 2005, Columbia and other defendants filed motions to dismiss the claims in the pending cases. On March 1, 2006, for reasons stated in the court's memoranda dated November 3, 2005, the United States District Court for the District of Maryland granted in part and denied in part the defendants' motions to dismiss. The court dismissed all of the class action claims pending against the Columbia Funds Trusts. As to Columbia and the Distributor, the claims under the Securities Act of 1933, the claims under Sections 34(b) and 36(a) of the Investment Company Act of 1940 ("ICA") and the state law claims were dismissed. The claims under Sections 10(b) and 20(a) of the Securities Exchange Act of 1934 and claims under Section 36(b) of the ICA were not dismissed.
On March 21, 2005, a purported class action was filed in Massachusetts state court alleging that certain conduct, including market timing, entitled Class B shareholders in certain Columbia Funds to an exemption from contingent deferred sales charges upon early redemption (the "CDSC Lawsuit"). The CDSC Lawsuit was removed to federal court in Massachusetts and transferred to the MDL.
On September 14, 2007, the plaintiffs and the Columbia defendants named in the MDL, including the Columbia Funds, entered into a stipulation of settlement with respect to all Columbia-related claims in the MDL described above, including the CDSC Lawsuit. The settlement is subject to court approval.
142
Columbia Tax-Exempt Bond Funds, October 31, 2009 (continued)
Note 11. Business Combinations and Mergers
On May 5, 2008, Intermediate-Term Tax-Exempt Fund, a series of Excelsior Tax-Exempt Funds, Inc., merged into Columbia Intermediate Municipal Bond Fund. Columbia Intermediate Municipal Bond Fund received a tax-free transfer of assets from Intermediate-Term Tax-Exempt Fund as follows:
Class Z Shares
Issued | | Net Assets
Received | | Unrealized
Appreciation* | |
| | 36,795,116 | | | $ | 374,435,646 | | | $ | 1,901,189 | | |
Net Assets
of Columbia
Intermediate
Municipal
Bond Fund
Prior to
Combination | | Net Assets
of Intermediate-
Term Tax-Exempt
Fund Immediately
Prior to Combination | | Net Assets
of Columbia
Intermediate
Municipal
Bond Fund
Immediately
After Combination | |
| $ | 2,308,865,838 | | | $ | 374,435,646 | | | $ | 2,683,301,484 | | |
On May 5, 2008, New York Intermediate-Term Tax-Exempt Fund, a series of Excelsior Tax-Exempt Funds, Inc., merged into Columbia New York Intermediate Municipal Bond Fund. Columbia New York Intermediate Municipal Bond Fund received a tax-free transfer of assets from New York Intermediate-Term Tax-Exempt Fund as follows:
Class Z Shares
Issued | | Net Assets
Received | | Unrealized
Appreciation* | |
| | 12,980,728 | | | $ | 149,608,565 | | | $ | 1,194,768 | | |
Net Assets
of Columbia
New York
Intermediate
Municipal
Bond Fund
Prior to
Combination | | Net Assets
of New York
Intermediate-
Term Tax-Exempt
Fund Immediately
Prior to Combination | | Net Assets
of Columbia
New York
Intermediate
Municipal
Bond Fund
Immediately
After Combination | |
| $ | 157,874,795 | | | $ | 149,608,565 | | | $ | 307,483,360 | | |
* Unrealized appreciation is included in the Net Assets Received.
143
Report of Independent Registered Public Accounting Firm
To the Board of Trustees and the Shareholders of Columbia Funds Series Trust I
In our opinion, the accompanying statements of assets and liabilities, including the investment portfolios, and the related statements of operations and of changes in net assets and the financial highlights present fairly, in all material respects, the financial position of Columbia Connecticut Intermediate Municipal Bond Fund, Columbia Intermediate Municipal Bond Fund, Columbia Massachusetts Intermediate Municipal Bond Fund, Columbia New Jersey Intermediate Municipal Bond Fund, Columbia New York Intermediate Municipal Bond Fund and Columbia Rhode Island Intermediate Municipal Bond Fund (constituting part of Columbia Funds Series Trust I, hereafter collectively referred to as the "Funds") at October 31, 2009, the results of each of their operations for the year then ended, the changes in each of their net assets for each of the two years in the period then ended, and the financial highlights for each of the five years in the per iod then ended, in conformity with accounting principles generally accepted in the United States of America. These financial statements and financial highlights (hereafter referred to as "financial statements") are the responsibility of the Funds' management. Our responsibility is to express an opinion on these financial statements based on our audits. We conducted our audits of these financial statements in accordance with the standards of the Public Company Accounting Oversight Board (United States). Those standards require that we plan and perform the audits to obtain reasonable assurance about whether the financial statements are free of material misstatement. An audit includes examining, on a test basis, evidence supporting the amounts and disclosures in the financial statements, assessing the accounting principles used and significant estimates made by management, and evaluating the overall financial statement presentation. We believe that our audits, which included confirmation of securities at Octobe r 31, 2009 by correspondence with the custodian and brokers, provide a reasonable basis for our opinion.
PricewaterhouseCoopers LLP
Boston, Massachusetts
December 18, 2009
144
Federal Income Tax Information (Unaudited)
Columbia Connecticut Intermediate Municipal Bond Fund
For the fiscal year ended October 31, 2009, 100.0% of the distributions from net investment income of the Fund qualifies as exempt interest dividends for federal income tax purposes. A portion of the income may be subject to federal alternative minimum tax.
The Fund will notify shareholders in January 2010 of amounts for use in preparing 2009 income tax returns.
Columbia Intermediate Municipal Bond Fund
For the fiscal year ended October 31, 2009, 99.8% of the distributions from net investment income of the Fund qualifies as exempt interest dividends for federal income tax purposes. A portion of the income may be subject to federal alternative minimum tax.
The Fund will notify shareholders in January 2010 of amounts for use in preparing 2009 income tax returns.
Columbia Massachusetts Intermediate Municipal Bond Fund
For the fiscal year ended October 31, 2009, 100.0% of the distributions from net investment income of the Fund qualifies as exempt interest dividends for federal income tax purposes. A portion of the income may be subject to federal alternative minimum tax.
The Fund will notify shareholders in January 2010 of amounts for use in preparing 2009 income tax returns.
Columbia New Jersey Intermediate Municipal Bond Fund
For the fiscal year ended October 31, 2009, 100.0% of the distributions from net investment income of the Fund qualifies as exempt interest dividends for federal income tax purposes. A portion of the income may be subject to federal alternative minimum tax.
The Fund will notify shareholders in January 2010 of amounts for use in preparing 2009 income tax returns.
Columbia New York Intermediate Municipal Bond Fund
For the fiscal year ended October 31, 2009, 100.0% of the distributions from net investment income of the Fund qualifies as exempt interest dividends for federal income tax purposes. A portion of the income may be subject to federal alternative minimum tax.
The Fund will notify shareholders in January 2010 of amounts for use in preparing 2009 income tax returns.
Columbia Rhode Island Intermediate Municipal Bond Fund
For the fiscal year ended October 31, 2009, 100.0% of the distributions from net investment income of the Fund qualifies as exempt interest dividends for federal income tax purposes. A portion of the income may be subject to federal alternative minimum tax.
The Fund will notify shareholders in January 2010 of amounts for use in preparing 2009 income tax returns.
145
Fund Governance
The Trustees serve terms of indefinite duration. The names, addresses and ages of the Trustees and officers of the Funds in Columbia Funds Series Trust I, the year each was first elected or appointed to office, their principal business occupations during at least the last five years, the number of Funds overseen by each Trustee and other directorships they hold are shown below. Each officer listed below serves as an officer of each Fund in the Columbia Funds Complex.
Independent Trustees
Name, Address and Year of Birth,
Position with Funds, Year First
Elected or Appointed to Office | | Principal Occupation(s) During Past Five Years, Number of Funds in the Columbia
Funds Complex Overseen by Trustee, Other Directorships Held
| |
| John D. Collins (Born 1938) | |
|
c/o Columbia Management
Advisors, LLC
One Financial Center
Boston, MA 02111
Trustee (since 2007) | | Retired. Consultant, KPMG, LLP (accounting and tax firm) from July 1999 to June 2000; Partner, KPMG, LLP from March 1962 to June 1999. Oversees 66; Mrs. Fields Famous Brands LLC (consumer products); Suburban Propane Partners, L.P.; and Montpelier Re (insurance underwriting firm) | |
|
| Rodman L. Drake (Born 1943) | |
|
c/o Columbia Management
Advisors, LLC
One Financial Center
Boston, MA 02111
Trustee (since 2007)
and Chairman of the Board
(since 2009) | | Co-Founder of Baringo Capital LLC (private equity) since 2002; President, Continuation Investments Group, Inc. from 1997 to 2001. Oversees 66; Jackson Hewitt Tax Service Inc. (tax preparation services); Crystal Capital River Inc. (real estate investment trust); Student Loan Corporation (student loan provider); Celgene Corporation (global biotechnology company); and The Helios Funds (exchange-traded funds) | |
|
| Douglas A. Hacker (Born 1955) | |
|
c/o Columbia Management
Advisors, LLC
One Financial Center
Boston, MA 02111
Trustee (since 1996) | | Independent business executive since May 2006; Executive Vice President—Strategy of United Airlines (airline) from December 2002 to May 2006; President of UAL Loyalty Services (airline marketing company) from September 2001 to December 2002; Executive Vice President and Chief Financial Officer of United Airlines from July 1999 to September 2001. Oversees 66; Nash Finch Company (food distributor); Aircastle Limited (aircraft leasing) | |
|
| Janet Langford Kelly (Born 1957) | |
|
c/o Columbia Management
Advisors, LLC
One Financial Center
Boston, MA 02111
Trustee (since 1996) | | Senior Vice President, General Counsel and Corporate Secretary, ConocoPhillips (integrated energy company) since September 2007; Deputy General Counsel—Corporate Legal Services, ConocoPhillips from August 2006 to August 2007; Partner, Zelle, Hofmann, Voelbel, Mason&Gette LLP (law firm) from March 2005 to July 2006; Adjunct Professor of Law, Northwestern University, from September 2004 to June 2006; Director, UAL Corporation (airline) from February 2006 to July 2006; Oversees 66; None | |
|
| Charles R. Nelson (Born 1942) | |
|
c/o Columbia Management
Advisors, LLC
One Financial Center
Boston, MA 02111
Trustee (since 1981) | | Professor of Economics, University of Washington, since January 1976; Ford and Louisa Van Voorhis Professor of Political Economy, University of Washington, since September 1993; Adjunct Professor of Statistics, University of Washington, since September 1980; Associate Editor, Journal of Money Credit and Banking, 1993-2008 Consultant on econometric and statistical matters. Oversees 66; None | |
|
146
Fund Governance (continued)
Independent Trustees (continued)
Name, Address and Year of Birth,
Position with Funds, Year First
Elected or Appointed to Office | | Principal Occupation(s) During Past Five Years, Number of Funds in the Columbia
Funds Complex Overseen by Trustee, Other Directorships Held
| |
| John J. Neuhauser (Born 1943) | |
|
c/o Columbia Management
Advisors, LLC
One Financial Center
Boston, MA 02111
Trustee (since 1985) | | President, Saint Michael's College, since August 2007; University Professor, Boston College from November 2005 to August 2007; Academic Vice President and Dean of Faculties, Boston College from August 1999 to October 2005. Oversees 66; Liberty All-Star Equity Fund and Liberty All-Star Growth Fund, Inc. (closed-end funds) | |
|
| Jonathan Piel (Born 1938) | |
|
c/o Columbia Management
Advisors, LLC
One Financial Center
Boston, MA 02111
Trustee (since 2007) | | Cable television producer and website designer; The Editor, Scientific American from 1984 to 1994; Vice President, Scientific American, Inc., from 1984 to 1994; Member, Advisory Board, Stone Age Institute, Bloomington, Indiana (research institute that explores the effect of technology on human evolution); Member, Board of Directors of the National Institute of Social Sciences, New York City; Member, Board of Trustees of the William Alanson White Institute, New York City (institution for training psychoanalysts); and Member, Advisory Board, Mount Sinai Children's Environmental Health Center, New York. Oversees 66; None | |
|
| Patrick J. Simpson (Born 1944) | |
|
c/o Columbia Management
Advisors, LLC
One Financial Center
Boston, MA 02111
Trustee (since 2000) | | Partner, Perkins Coie LLP (law firm). Oversees 66; None | |
|
| Thomas C. Theobald (Born 1937) | |
|
c/o Columbia Management
Advisors, LLC
One Financial Center
Boston, MA 02111
Trustee (since 1996) | | Partner and Senior Advisor, Chicago Growth Partners (private equity investing) since September 2004; Managing Director, William Blair Capital Partners (private equity investing) from September 1994 to September 2004. Oversees 66; Anixter International (network support equipment distributor); Ventas, Inc. (real estate investment trust); Jones Lang LaSalle (real estate management services); Ambac Financial Group (financial guaranty insurance) | |
|
| Anne-Lee Verville (Born 1945) | |
|
c/o Columbia Management
Advisors, LLC
One Financial Center
Boston, MA 02111
Trustee (since 1998) | | Retired since 1997 (formerly General Manager—Global Education Industry (from 1994 to 1997), President-Application Systems Division (from 1991 to 1994), Chief Financial Officer—US Marketing&Services (from 1988 to 1991), and Chief Information Officer (from 1987 to 1988), IBM Corporation (computer and technology)). Oversees 66; None | |
|
147
Fund Governance (continued)
Interested Trustee
Name, Address and Year of Birth,
Position with Funds, Year First
Elected or Appointed to Office | | Principal Occupation(s) During Past Five Years, Number of Funds in the Columbia
Funds Complex Overseen by Trustee, Other Directorships Held
| |
| William E. Mayer1 (Born 1940) | |
|
c/o Columbia Management
Advisors, LLC
One Financial Center
Boston, MA 02111
Trustee (since 1994) | | Partner, Park Avenue Equity Partners (private equity) since February 1999; Dean and Professor, College of Business, University of Maryland from 1992 to 1997. Oversees 66; Lee Enterprises (print media),WRHambrecht + Co. (financial (investment company) service provider); BlackRock Kelso Capital Corporation | |
|
1 The Funds currently treat Mr. Mayer as an "interested person" (as defined in the Investment Company Act of 1940) by reason of his affiliation with WR Hambrecht + Co., a registered broker/dealer that may execute portfolio transactions for or engage in principal transactions with the Funds or other funds or accounts advised/managed by the Advisor or other Bank of America affiliates.
The Statement of Additional Information includes additional information about the Trustees of the Funds and is available, without charge, upon request by calling 1-800-345-6611.
Officers
Name, Address and Year of Birth,
Position with Funds, Year First
Elected or Appointed to Office | | Principal Occupation(s) During Past Five Years
| |
| J. Kevin Connaughton (Born 1964) | |
|
One Financial Center
Boston, MA 02111
President (since 2009) | | Managing Director of Columbia Management Advisors, LLC since December 2004; Senior Vice President and Chief Financial Officer—Columbia Funds, from June 2008 to January 2009; Treasurer—Columbia Funds, from October 2003 to May 2008; Treasurer—the Liberty Funds, Stein Roe Funds and Liberty All-Star Funds, December 2000-December 2006; Senior Vice President—Columbia Management Advisors, LLC, from April 2003 to December 2004; President—Columbia Funds, Liberty Funds and Stein Roe Funds, February 2004 to October 2004; Treasurer—Galaxy Funds, September 2002 to December 2005; Treasurer, December 2002 to December 2004, and President, February 2004 to December 2004—Columbia Management Multi-Strategy Hedge Fund, LLC; and a senior officer of various other Bank of America-affiliated entities, including other registered and unregistered funds. | |
|
| James R. Bordewick, Jr. (Born 1959) | |
|
One Financial Center
Boston, MA 02111
Senior Vice President, Secretary
and Chief Legal Officer (since 2006) | | Associate General Counsel, Bank of America since April 2005; Senior Vice President and Associate General Counsel, MFS Investment Management (investment management) prior to April 2005. | |
|
| Linda J. Wondrack (Born 1964) | |
|
One Financial Center
Boston, MA 02111
Senior Vice President and
Chief Compliance Officer
(since 2007) | | Director (Columbia Management Group LLC and Investment Product Group Compliance), Bank of America since June 2005; Director of Corporate Compliance and Conflicts Officer, MFS Investment Management (investment management), August 2004 to May 2005; Managing Director, Deutsche Asset Management (investment management) prior to August 2004. | |
|
148
Fund Governance (continued)
Officers (continued)
Name, Address and Year of Birth,
Position with Funds, Year First
Elected or Appointed to Office | | Principal Occupation(s) During Past Five Years
| |
| Michael G. Clarke (Born 1969) | |
|
One Financial Center
Boston, MA 02111
Senior Vice President and
Chief Financial Officer
(since 2009) | | Director of Fund Administration of the Advisor since January 2006; Managing Director of the Advisor September 2004 to December 2005; Vice President Fund Administration June 2002 to September 2004. | |
|
| Jeffrey R. Coleman (Born 1969) | |
|
One Financial Center
Boston, MA 02111
Deputy Treasurer (since 2006) | | Director of Fund Administration of the Advisor since January 2006; Fund Controller of the Advisor from October 2004 to January 2006; Vice President of CDC IXIS Asset Management Services, Inc. (investment management) from August 2000 to September 2004. | |
|
| Joseph F. DiMaria (Born 1968) | |
|
One Financial Center
Boston, MA 02111
Chief Accounting Officer and
Treasurer (since 2009) | | Director of Fund Administration of the Advisor since January 2006; Head of Tax/Compliance and Assistant Treasurer of the Advisor from November 2004 to December 2005; Director of Trustee Administration (Sarbanes-Oxley) of the Advisor from May 2003 to October 2004. | |
|
| Julian Quero (Born 1967) | |
|
One Financial Center
Boston, MA 02111
Deputy Treasurer (since 2008) | | Senior Tax Manager of the Advisor since August 2006; Senior Compliance Manager of the Advisor from April 2002 to August 2006. | |
|
| Barry S. Vallan (Born 1969) | |
|
One Financial Center
Boston, MA 02111
Controller (since 2006) | | Vice President—Fund Treasury of the Advisor since October 2004; Vice President—Trustee Reporting of the Advisor from April 2002 to October 2004. | |
|
| Stephen T. Welsh (Born 1957) | |
|
One Financial Center
Boston, MA 02111
Vice President (since 1996) | | President, Columbia Management Services, Inc. since July 2004; Senior Vice President and Controller, Columbia Management Services, Inc. prior to July 2004. | |
|
149
Board Consideration and Approval of Advisory Agreements
The Advisory Fees and Expenses Committee of the Board of Trustees meets several times annually to review the advisory agreements (collectively, the "Agreements") of the funds for which the Trustees serve as trustees (each a "fund") and to determine whether to recommend that the full Board approve the continuation of the Agreements for an additional one-year period. After the Committee has made its recommendation, the full Board, including the Independent Trustees, determines whether to approve the continuation of the Agreements. In addition, the full Board, including the Independent Trustees, considers matters bearing on the Agreements at most of its other meetings throughout the year and meets regularly with senior management of the funds and Columbia, the funds' investment adviser, including the senior manager of each investment area within Columbia. Through the Board's Investment Oversight Committees, Trustees also meet with selected fund portfolio managers, research analysts and traders at various times throughout the year.
The Trustees receive and review all materials that they, their legal counsel or Columbia believe to be reasonably necessary for the Trustees to evaluate the Agreements and to determine whether to approve the continuation of the Agreements. Those materials generally include, among other items, (i) information on the investment performance of each fund relative to the performance of peer groups of mutual funds and the fund's performance benchmarks, and additional information assessing performance on a risk-adjusted basis, (ii) information on each fund's advisory fees and other expenses, including information comparing the fund's expenses to those of peer groups of mutual funds and information about any applicable expense caps and fee "breakpoints," (iii) information about the profitability of the Agreements to Columbia, including potential "fall-out" or ancillary benefits that Columbia and its affiliates may receive as a result of their relationships with the funds and (iv) information obtained through Columbia's response to a questionnaire prepared at the request of the Trustees by counsel to the funds and independent legal counsel to the Independent Trustees. The Trustees also consider other information such as (v) Columbia's financial results and financial condition, (vi) each fund's investment objective and strategies and the size, education and experience of Columbia's investment staffs and their use of technology, external research and trading cost measurement tools, (vii) the allocation of the funds' brokerage and the use of "soft" commission dollars to pay for research products and services, (viii) Columbia's resources devoted to, and its record of compliance with, the funds' investment policies and restrictions, policies on personal securities transactions and other compliance policies and legal and regulatory requirements, (ix) Columbia's response to various legal and regulatory proceedings since 2003 and to the recent peri od of volatility in the securities markets and (x) the economic outlook generally and for the mutual fund industry in particular. In addition, the Advisory Fees and Expenses Committee confers with the funds' independent fee consultant and reviews materials relating to the funds' relationships with Columbia provided by the independent fee consultant. Throughout the process, the Trustees have the opportunity to ask questions of and to request additional materials from Columbia and to consult with the independent fee consultant and independent legal counsel to the Independent Trustees.
The Board of Trustees most recently approved the continuation of the Agreements at its October, 2009 meeting, following meetings of the Advisory Fees and Expenses Committee held in December, 2008 and February, May, June, August, September and October, 2009. In considering whether to approve the continuation of the Agreements, the Trustees, including the Independent Trustees, did not identify any single factor as determinative, and each weighed various factors as he or she deemed appropriate. The Trustees considered the following matters in connection with their approval of the continuation of the Agreements:
The nature, extent and quality of the services provided to the funds under the Agreements. The Trustees considered the nature, extent and quality of the services provided by Columbia and its affiliates to the funds and the resources dedicated to the funds by Columbia and its affiliates. Among other things, the Trustees considered (i) Columbia's ability (including its personnel and other resources, compensation programs for personnel involved in fund management, reputation and other attributes) to attract, motivate and retain highly qualified research, advisory and supervisory investment professionals; (ii) the portfolio management services provided by those investment professionals; and (iii) the trade execution services provided on behalf of the funds. For each fund, the T rustees also considered the benefits to shareholders of investing in a mutual fund that is part of a family of funds offering exposure to a variety of asset classes
150
and investment disciplines and providing a variety of fund and shareholder services. After reviewing those and related factors, the Trustees concluded, within the context of their overall conclusions regarding each of the Agreements, that the nature, extent and quality of services provided supported the continuation of the Agreements.
Investment performance of the funds and Columbia. The Trustees reviewed information about the performance of each fund over various time periods, including information prepared by an independent third-party data provider that compared the performance of each fund to the performance of peer groups of mutual funds and performance benchmarks. The Trustees also reviewed a description of the third party's methodology for identifying each fund's peer group for purposes of performance and expense comparisons. The Trustees also considered additional information that the Advisory Fees and Expenses Committee requested from Columbia relating to funds that presented relatively weaker performance and/or relatively higher fees or expenses. In the case of each fund whose performance lagged that of a relevant peer group for certain (although not necessarily all) peri ods, the Trustees concluded that other factors relevant to performance were sufficient, in light of other considerations, to warrant continuation of the fund's Agreements. Those factors varied from fund to fund, but included one or more of the following: (i) that the fund's performance, although lagging in certain recent periods, was stronger over the longer term; (ii) that the underperformance was attributable, to a significant extent, to investment decisions that were reasonable and consistent with the fund's investment strategy and policies and that the fund was performing within a reasonable range of expectations, given those investment decisions, market conditions and the fund's investment strategy; (iii) that the fund's performance was competitive when compared to other relevant performance benchmarks or peer groups; (iv) that Columbia had taken or was taking steps designed to help improve the fund's investment performance, including, but not limited to, replacing portfolio managers or modifying invest ment strategies; and (v) that Columbia proposed to waive advisory fees or cap the expenses of the fund.
The Trustees noted the performance of each Fund through April 30, 2009 relative to that of a peer group selected by an independent third-party data provider for the purposes of performance comparisons. Specifically, Columbia Intermediate Municipal Bond Fund's performance was in the fourth quintile (where the best performance would be in the first quintile) for the one, three- and ten-year periods and in the third quintile for the five-year period; Columbia Connecticut Intermediate Municipal Bond Fund's performance was in the third quintile for the one-, three- and five-year periods and in the fourth quintile for the ten-year period; Columbia Massachusetts Intermediate Municipal Bond Fund's performance was in the second quintile for the one-year period, and in the third quintile for the three-, five- and ten-year periods; Columbia New Jersey Intermediate Municipal Bond Fund's performance was in the fourth quintile for the one-yea r period and in the third quintile for the three-, five- and ten-year periods; Columbia New York Intermediate Municipal Bond Fund's performance was in the third quintile for the one-, three-, five- and ten-year periods; and Columbia Rhode Island Intermediate Municipal Bond Fund's performance was in the third quintile for the one-, three-, five- and ten-year periods.
The Trustees also considered Columbia's performance and reputation generally, the funds' performance as a fund family generally, and Columbia's historical responsiveness to Trustee concerns about performance and Columbia's willingness to take steps intended to improve performance. After reviewing those and related factors, the Trustees concluded, within the context of their overall conclusions regarding each of the Agreements, that the performance of each fund and Columbia was sufficient, in light of other considerations, to warrant the continuation of the Agreement(s) pertaining to that fund.
The costs of the services provided and profits realized by Columbia and its affiliates from their relationships with the funds. The Trustees considered the fees charged to the funds for advisory services as well as the total expense levels of the funds. That information included comparisons (provided by management and by an independent third-party data provider) of each fund's advisory fees and total expense levels to those of the fund's peer groups and information about the advisory fees charged by Columbia to comparable institutional accounts. In considering the fees charged to those accounts, the Trustees took into account, among other things, management's representations about the differences between managing mutual funds as compared to other types of accounts, including differences in the services provided, differences in the risk profile of such business for Columbia,
151
and the additional resources required to manage mutual funds effectively. In evaluating each fund's advisory fees, the Trustees also took into account the demands, complexity and quality of the investment management of the fund. The Trustees considered existing advisory fee breakpoints, and Columbia's use of advisory fee waivers and expense caps, which benefited a number of the funds. The Trustees also noted management's stated justification for the fees charged to the funds, which included information about the investment performance of the funds and the services provided to the funds.
The Trustees considered each fund's total expenses and actual management fees relative to those of a peer group selected by an independent third-party data provider for purposes of expense comparisons. Specifically, Columbia Intermediate Municipal Bond Fund's total expenses were in the second quintile and actual management fees were in the third quintile (where the lowest fees and expenses would be in the first quintile); Columbia Connecticut Intermediate Municipal Bond Fund's total expenses were in the second quintile and actual management fees were in the first quintile; Columbia Massachusetts Intermediate Municipal Bond Fund's total expenses were in the fourth quintile and actual management fees were in the first quintile; Columbia New Jersey Intermediate Municipal Bond Fund's total expenses were in the second quintile and actual management fees were in the first quintile; Columbia New York Intermediate Municipal Bond Fund's total expenses were in the fifth quintile and actual management fees were in the first quintile; and Columbia Rhode Island Intermediate Municipal Bond Fund's total expenses were in the second quintile and actual management fees were in the first quintile.
The Trustees also considered the compensation directly or indirectly received by Columbia and its affiliates from their relationships with the funds. The Trustees reviewed information provided by management as to the profitability to Columbia and its affiliates of their relationships with each fund, and information about the allocation of expenses used to calculate profitability. When reviewing profitability, the Trustees also considered court cases in which adviser profitability was an issue in whole or in part, the performance of the relevant funds, the expense level of each fund, and whether Columbia had implemented breakpoints and/or expense caps with respect to the fund.
After reviewing those and related factors, the Trustees concluded, within the context of their overall conclusions regarding each of the Agreements, that the advisory fees charged to each fund, and the related profitability to Columbia and its affiliates of their relationships with the fund, supported the continuation of the Agreement(s) pertaining to that fund.
Economies of Scale. The Trustees considered the existence of any economies of scale in the provision by Columbia of services to each fund, to groups of related funds, and to Columbia's investment advisory clients as a whole and whether those economies were shared with the funds through breakpoints in the investment advisory fees or other means, such as fee waivers/expense reductions and additional investments by Columbia in investment, trading and compliance resources. The Trustees noted that many of the funds benefited from breakpoints, fee waivers/expense caps, or both. In considering those issues, the Trustees also took note of the costs of the services provided (both on an absolute and a relative basis) and the profitability to Columbia and its affiliates of their relationships with the funds, as discussed above.
After reviewing those and related factors, the Trustees concluded, within the context of their overall conclusions regarding each of the Agreements, that the extent to which economies of scale were shared with the funds supported the continuation of the Agreements.
Other Factors. The Trustees also considered other factors, which included but were not limited to the following:
n the extent to which each fund had operated in accordance with its investment objective and investment restrictions, the nature and scope of the compliance programs of the funds and Columbia and the compliance-related resources that Columbia and its affiliates were providing to the funds;
n the nature, quality, cost and extent of administrative and shareholder services overseen and performed by Columbia and its affiliates, both under the Agreements and under separate agreements for the provision of transfer agency and administrative services;
n so-called "fall-out benefits" to Columbia and its affiliates, such as the engagement of its affiliates to provide
152
distribution, brokerage and transfer agency services to the funds, and the benefits of research made available to Columbia by reason of brokerage commissions generated by the funds' securities transactions, as well as possible conflicts of interest associated with those fall-out and other benefits, and the reporting, disclosure and other processes in place to disclose and monitor those possible conflicts of interest; and
n the report provided by the funds' independent fee consultant, which included information about and analysis of the funds' fees, expenses and performance.
Based on their evaluation of all factors that they deemed to be material, including those factors described above, and assisted by the advice of independent counsel and the independent fee consultant, the Trustees, including the Independent Trustees, approved the continuance of each of the Agreements through October 31, 2010.
153
Summary of Management Fee Evaluation by
Independent Fee Consultant
[EXCERPTS FROM:] REPORT OF INDEPENDENT FEE CONSULTANT TO THE FUNDS
SUPERVISED BY THE COLUMBIA ATLANTIC BOARD
Prepared Pursuant to the February 9, 2005
Assurance of Discontinuance among the
Office of Attorney General of New York State,
Columbia Management Advisors, LLC, and
Columbia Management Distributors, Inc.
November 6, 2009
I. Overview
On February 9, 2005, Columbia Management Advisors, LLC ("CMA") and Columbia Management Distributors, Inc.1 ("CMDI") agreed to the New York Attorney General's Assurance of Discontinuance ("AOD"). Among other things, the AOD stipulates that CMA may manage or advise a Columbia Fund ("Columbia Fund" and, together with some or all of such funds, the "Columbia Funds") only if the Independent Members of the Columbia Fund's Board of Trustees appoint a Senior Officer or retain an Independent Fee Consultant ("IFC") who is to manage the process by which proposed management fees are negotiated. The AOD further stipulates that the Senior Officer or IFC is to prepare a written annual evaluation of the fee negotiation process.
With effect from January 1, 2007, the Independent Members of the Board of Trustees for certain Columbia Funds known collectively as the "Atlantic Funds" (together with the other members of that Board, the "Trustees") retained me as IFC for the Atlantic Funds.2 In this capacity, I have prepared the fifth annual written evaluation of the fee negotiation process. As was the case with the 2007 and 2008 reports, my immediate predecessor as IFC, John Rea, provided invaluable assistance in the preparation of this year's report.
A. Role of the Independent Fee Consultant
The AOD charges the IFC with "managing the process by which proposed management fees...to be charged the Columbia Fund are negotiated so that they are negotiated in a manner which is at arms' length and reasonable and consistent with this Assurance of Discontinuance." The AOD also provides that CMA "may manage or advise a Columbia Fund only if the reasonableness of the proposed management fees is determined by the Board of Trustees...using...an annual independent written evaluation prepared by or under the direction of...the Independent Fee Consultant." Therefore, the AOD makes clear that the IFC does not supplant the Trustees in negotiating management fees with CMA, nor does the IFC substitute his or her judgment for that of the Trustees with respect to the reasonableness of proposed fees or any other matter that is committed to the business judgment of the Trustees.
B. Elements Involved in Managing the Fee Negotiation Process
In preparing the report required by the AOD, the IFC must consider at least the following six factors set forth in the AOD:
1. The nature and quality of CMA's services, including the Fund's performance;
2. Management fees (including any components thereof) charged by other mutual fund companies for like services;
3. Possible economies of scale as the Fund grows larger;
4. Management fees (including any components thereof) charged to institutional and other clients of CMA for like services;
5. Costs to CMA and its affiliates of supplying services pursuant to the management fee agreements, excluding any intra-corporate profit; and
6. Profit margins of CMA and its affiliates from supplying such services.
C. Organization of the Annual Evaluation
This report, like last year's, focuses on the six factors and contains a section for each factor except that CMA's costs and profits from managing the Funds are treated in a single section. In addition to a discussion of these factors, the report offers recommendations to improve the fee review process in future years. A review of the status of recommendations made
1 CMA and CMDI are subsidiaries of Columbia Management Group, LLC ("CMG"), and are the successors to the entities named in the AOD.
2 I have no material relationship with Bank of America, CMG or any of its affiliates, aside from serving as IFC, and I am aware of no material relationship with any of their affiliates. I retained John Rea, an independent economic consultant, to assist me with this report.
Unless otherwise stated or required by the context, this report covers only the Atlantic Funds, which are also referred as the "Funds."
154
in the 2008 Report is being provided separately with the materials for the October meeting.
II. Summary of Findings
A. General
1. Based upon my examination of the information supplied by CMG in the light of the six factors set forth in the AOD, I conclude that the Trustees have the relevant information necessary to evaluate the reasonableness of the proposed management fees for each Atlantic Fund.
2. In my view, the process by which the proposed management fees of the Funds have been negotiated in 2009 thus far has been, to the extent practicable, at arms' length and reasonable and consistent with the AOD.
B. Nature and Quality of Services, Including Performance
3. The performance of the Funds has been relatively strong in recent years, although the one-year record was weaker than longer-term records. Based upon 1-, 3-, 5-, and 10-year returns through April 30, 2009, at least half of all the Funds were in the first and second performance quintiles in each of the three longest performance periods; for the one-year period, 40% of the Funds were in the top two quintiles. No more than 13% of the Funds were in the fifth quintile in any one performance period. Domestic equity, quantitative equity, and taxable fixed-income Funds were the strongest performers in 2009, while most foreign equity Funds lagged behind their competitors.
4. Performance rankings were similar in 2008 and 2009: the 1- and 3-year rankings declined slightly over the previous year, while the 5-year rankings improved modestly. Year over year, for the 1- and 3-year periods, the performance of equity Funds, both domestic and international, declined, while that of fixed-income Funds improved. Between three-fifths to two-thirds of the Funds changed quintile rankings in 2009 in the 1-, 3-, and 5-year performance periods.
5. The performance of the domestic equity Funds against their benchmarks was good for the 3- and 5-year performance periods. In contrast, gross returns of international equity and fixed-income Funds typically fell short of their benchmarks. The performance of equity Funds against their benchmarks was highly correlated to performance versus their peers; no such correlation was observed for fixed-income Funds.
6. The Atlantic equity Funds' overall performance adjusted for risk was solid. Based upon 3-year returns, nearly 57% of the equity Funds had a combination of risk-adjusted and unadjusted returns that placed them in the top half of their performance universes. About one quarter of the fixed-income Funds posted high returns and low risk relative to comparable funds. Just over half of the fixed-income Funds, primarily tax-exempt Funds, took on more risk than the typical fund in their performance universes.
7. The industry-standard procedure used by Lipper that includes all share classes in the performance universe tends to bias a Fund's ranking upward within that universe. The bias occurs because either no-12b-1 fee or low-12b-1 fee share classes of the Atlantic Funds are compared with funds in performance universes that include all share classes of multi-class funds with 12b-1 fees of up to 100 basis points. Correcting this bias by limiting the performance universe to classes of comparable funds with low or no 12b-1 fees (a "filtered universe") lowers the relative performance for the Funds, but not to a material extent. The filtering process, however, did identify one Fund for further review that had not been identified as a review fund using unfiltered universes. Conversely, two Funds that had been identified as review funds in the unfiltered universe lost that status in filtered universes.
8. A small number of Funds have consistently underperformed over the past five years. The exact number depends on the criteria used to evaluate longer-term performance. For example, only three Funds had below-median performance in each 1- and 3-year period from 2005 to 2009.
9. The services performed by CMG professionals beyond portfolio management, such as compliance, legal, information technology, risk management, finance, and fund administration, are critical to the success of the Funds and appear to be of high quality.
C. Management Fees Charged by Other Mutual Fund Companies
10. The Funds' management fees and total expenses are generally low relative to those of their peers, with over half
155
of the Funds in the most favorable two quintiles. Only 26% of the Funds ranked in the two most expensive quintiles for actual management fees, and 18% in those quintiles for total expenses. Two Funds are in the fifth quintile for total expenses; four Funds are in the fifth quintile for actual management fees.
11. The highest concentration of low-expense Funds is found among the foreign equity Funds. The 12 former Excelsior Funds have relatively high fees and expenses, with two-thirds ranking in either the fourth or fifth quintiles for actual management fees. The higher actual management fee rankings of certain former Excelsior Funds are due in part to fee schedules that are higher than standard Columbia Fund fee schedules at current asset levels.
12. The distribution of total expense and management fee rankings has improved over the prior two years. The implementation of the voluntary standardized cap system has contributed significantly to the improved rankings in 2009.
13. The management fees of the Atlantic Funds are generally in line with those of Columbia Funds supervised by the Nations Board of Trustees (the "Nations Funds"). To the extent that Atlantic Funds have higher average fees in certain investment categories than Nations Funds, the difference reflects either differences in asset size, different fee structures of the former Excelsior Funds, or special circumstances of the Funds included in the investment categories.
D. Trustees' Advisory Contract Review Process
14. The Trustees' evaluation process identified 16 Funds in 2009 for further review based upon long-standing criteria relating to their relative performance or expenses or both. When compared in filtered universes, one additional Fund met the criteria for further review. CMG provided further information about each of those Funds to assist the Trustees in their evaluation.
E. Potential Economies of Scale
15. CMG presented to the Trustees its analysis of the sources and sharing of potential economies of scale. CMG views economies of scale as arising at the complex level and would regard estimates of scale economies for individual funds as unreliable. In its analysis, CMG did not identify specific sources of economies of scale or provide any estimates of any economies of scale that might arise from future asset growth. CMG's analysis included measures taken by the Trustees and CMG that seek to share any potential economies of scale through breakpoints in management fee schedules, the establishment of expense limits for each Fund, enhanced shareholder services, fund mergers, and operational consolidation.
16. An examination of the contractual fee schedules for five Atlantic Funds shows that those with standard fee structures are generally in line with those of their competitors. The fee schedules of the former Excelsior Funds, however, have high initial fees relative to competitors but otherwise have comparable breakpoint structures.
F. Management Fees Charged to Institutional Clients
17. CMG has provided Trustees with comparisons of mutual fund management fees and institutional fees based upon standardized fee schedules and upon actual fees. The results show that, consistent with industry practice, actual and scheduled institutional fees are generally lower than the Funds' management fees. CMG provided additional data this year demonstrating that at small asset levels, the effective fee of certain Funds may be equal to or less than institutional fee levels at those asset levels, due to the effect of expense limits on small funds with high gross expenses. CMG also analyzed the differences between the services provided and risks borne on the one hand by a manager of mutual funds and on the other by institutional advisers, and suggested that these differences should be kept in mind when Trustees review the reasonableness of the Funds' management fees.
G. Revenues, Expenses, and Profits
18. The activity-based cost allocation methodology employed by CMG to allocate costs, both direct and indirect, for purposes of calculating Fund profitability is thoughtful and detailed. This year, CMG further refined the technique by allocating additional indirect expenses on an activity basis.
19. The materials provided on CMG's revenues and expenses with respect to the Funds and the methodology underlying
156
their construction form a sufficient basis for Trustees to evaluate the expenses of and profitability to CMG arising out of its relationships with the Funds.
20. CMG provided a firm-wide pro forma 2009 income statement demonstrating the effect of market events beginning in the fourth quarter of 2008 on its revenues and profitability to provide an additional perspective on calendar 2008 profitability data. In particular, 2008 revenues reflected the higher market prices prevailing during the first three quarters of that year, while expenses dropped due to cost cutting in the wake of the market downturn late in 2008. The continuing effects of this downturn are expected to produce a significant decline in profitability this year.
21. In 2008, CMG's pre-tax post-distribution margin on the Atlantic Fund complex was above industry medians, based on the limited data available for publicly held mutual fund managers. However, as is to be expected in a large fund complex, some Atlantic Funds had relatively high pre-tax profit margins in 2008, when calculated solely with respect to management revenues and expenses, while other Atlantic Funds operated at a loss. There is a positive relationship between Fund size and profitability to CMG, with smaller Funds generally operating at a loss to CMG.
22. CMG pays a fixed percentage of its management fee revenues to an affiliate, U.S. Trust, Bank of America Private Wealth Management, with respect to assets of its clients invested in Atlantic Funds to compensate it for services it performs with respect to those client assets and for the effect of state law limitations on affiliates charging multiple fees. Based on our analysis of the services provided by this affiliate, we have concluded that all payments other than those for sub-transfer agent or sub-accounting services should be treated as a distribution expense.
III. Recommendations
1) Criteria for review. The Trustees may wish to consider modifying the criteria for identifying a Fund for further review (a "Review Fund") to include criteria that focus exclusively on performance. The Trustees' supplementary data request included one such criterion. They may also wish to consider whether it would be useful to apply CMG's own internal monitoring standards for Fund performance to the contract review process, or whether such criteria are more relevant to their ongoing investment oversight.
2) Presentation of Review Fund discussion. CMG should consider whether it could more systematically present in one discussion all relevant information regarding each Review Fund, which is now split into several different portions of the 15(c) materials. For any Fund that has been a Review Fund in consecutive years, CMG should address under what circumstances it could reasonably be anticipated that the Fund would lose that status.
3) Refinement of tax-exempt performance data. Certain single-state tax-exempt Funds compete in extremely small universes and are compared to a multi-state benchmark of uncertain relevance. Notwithstanding the difficulties, CMG should work to improve the reliability of the calculation of relative performance of these Funds. If that is not possible, CMG should provide guidance on how the Trustees should judge the quality of CMG's management of these Funds.
4) Development of risk metrics for asset-allocation, tax-exempt, and money market funds. CMG has developed and shared with the Trustees quantitative risk metrics comparing equity and taxable fixed-income Funds against their peers. However, reliable risk metrics have not been developed for asset-allocation, tax-exempt fixed income, and money market funds. We urge CMG to continue its efforts to provide reliable risk measures for these categories of Funds, especially in the cases of asset-allocation and money market funds, because their investors are likely to be motivated at least in part by a desire to manage risk.
5) Profitability data. For any period during which CMG is an affiliate of U.S. Trust, Bank of America Private Wealth Management, CMG should continue to present to the Trustees the profitability of each Fund, each investment style and each complex (of which Atlantic is one) calculated as follows:
a. Management-only profitability should be calculated without reference to any Private Bank expense.
b. Profitability excluding distribution (which essentially covers the management and transfer agency functions) should be adjusted by removing from the expense calculation any
157
portion of the Private Bank payment not attributable to the performance by the Private Bank of sub-transfer agency or sub-accounting functions.
c. Total profitability, including distribution: No adjustment for Private Bank expenses should be made, because all such expenses represent legitimate fund expenses to be taken into account in calculating CMG's profit margin including distribution.
d. Distribution only: This should include all Private Bank expenses other than those attributable to sub-transfer agency services.
6) Contractual fee analysis. This year CMG presented a new Lipper report comparing the contractual management fees of Funds with those of competitors in similar investment styles. However, the reliability of the conclusion—that Fund management fee breakpoints compared favorably with competitive fee rates—was limited by the use of competitive funds at all asset levels. The sponsors of a $100 million mutual fund may not have given much thought to breakpoints at $5 billion; therefore, that fund's contractual fee at that level is unlikely to compare favorably with that of a $5 billion Fund. Limiting the competitors to the Lipper expense group, whose constituents are similar in size to the relevant Fund, would make the results more meaningful. In addition, the bre akpoints of a select group of Atlantic Funds (which would differ each year) should continue to be compared to those of industry rivals to ensure that the Funds' breakpoint schedules remain within industry norms. As breakpoint schedules change relatively little each year, performing such a comparison for each Atlantic Fund each year would not be an efficient use of Trustee and CMG resources.
7) Pro forma profitability data. In any year in which CMG or the Trustees believe that the prior year's profitability is unlikely to be representative of current business results due to changes in markets or for any other reason, CMG should, consistent with this year's practice, prepare a pro forma income statement based on year-to-date actual data and reasonable projections used for its own business planning purposes.
8) Additional institutional data and analysis. While CMG provided a substantial amount of information on its institutional business, including a virtually complete database of all institutional accounts, we suggest some additional items for future years: (a) profitability data for the institutional business in the format, and based upon the same allocation methodologies, used to present Fund profitability, (b) an explanation of how CMA sets institutional fee breakpoints, which normally begin at asset levels far lower than those found in Fund management fee breakpoints, and (c) an analysis of differences in actual fees within specific investment categories, with special attention given to accounts established before and after the implementation of the standardized insti tutional fee schedules in 2005.
9) Management fee disparities. In any future study of management fees, CMG and the Atlantic Trustees should analyze the differences in management fee schedules, including those arising out of the reorganization of the former Excelsior Funds as Atlantic Funds. As part of that analysis, CMG should provide an explanation for any significant fee differences among comparable funds across fund families sponsored by CMG, such as differences in the management styles of different Funds included the same Lipper category. Finally, if CMG proposes a management fee change or an expense cap for any mutual fund managed by CMA that is comparable to any Atlantic Fund, CMG should provide the Trustees with sufficient information about the proposal to allow the Trustees to assess the appl icability of the proposed change to the relevant Atlantic Fund or Funds.
10) Explanation of data supplied to Lipper. Each year, as part of the 15(c) process, CMG retains Lipper to compare the fees and expenses of each Fund to a group of competitors. In many cases, CMG, with the approval of the Trustees, adjusts the actual expense data, which is based on the most recent full fiscal year of the Fund (and each competitive fund) to reflect changes in fees or expense limits that occurred during or after the relevant fiscal year. This improves the reliability and usefulness of the comparison. However, to ensure that the Trustees know when and how CMG adjusted the data, we recommend that CMG prepare a table listing for each Fund what
158
adjustments were made, e.g., to reflect a new expense limitation of x basis points that commenced on y date.
Reduction of volume of paper documents submitted. The effort to streamline and better organize the data presented to the Trustees and the process by which that data was prepared and organized continued to be well-received by all parties. Notwithstanding past success, it is always appropriate to look for opportunities to reduce and simplify the presentation of 15(c) data. One possibility would be to remove the 124 pages of biographical data, most if not all of which the Trustees have previously seen as part of their ongoing investment oversight duties, from the paper volume and post it on the Internet-based document storage and retrieval system used by the Funds to provide reference data to Trustees.
* * *
Respectfully submitted,
Steven E. Asher
159
This page intentionally left blank.
Important Information About This Report
The funds mail one shareholder report to each shareholder address. If you would like more than one report, please call shareholder services at 1-800-345-6611 and additional reports will be sent to you. This report has been prepared for shareholders of the Columbia Tax-Exempt Bond Funds listed on the front cover.
A description of the policies and procedures that each fund uses to determine how to vote proxies and a copy of each fund's voting records are available (i) at www.columbiamanagement.com, (ii) on the Securities and Exchange Commission's website at www.sec.gov, and (iii) without charge, upon request, by calling 1-800-368-0346. Information regarding how each fund voted proxies relating to portfolio securities during the 12-month period ended June 30 is available from the SEC's website. Information regarding how each fund voted proxies relating to portfolio securities is also available from the funds' website, www.columbiamanagement.com.
Each fund files a complete schedule of portfolio holdings with the SEC for the first and third quarters of each fiscal year on Form N-Q. Each fund's Form N-Q is available on the SEC's website at www.sec.gov and may be reviewed and copied at the SEC's Public Reference Room in Washington, D.C. Information on the operation of the Public Reference Room may be obtained by calling 1-800-SEC-0330.
Please read and consider the investment objectives, risks, charges and expenses for any fund carefully before investing. For a prospectus which contains this and other important information about the fund, contact your Columbia Management representative or financial advisor or go to www.columbiamanagement.com.
Columbia Management Group, LLC ("Columbia Management") is the investment management division of Bank of America Corporation. Columbia Management entities furnish investment management services and products for institutional and individual investors. Columbia Funds are distributed by Columbia Management Distributors, Inc., member of FINRA, SIPC, part of Columbia Management and an affiliate of Bank of America Corporation.
Transfer Agent
Columbia Management Services, Inc.
P.O. Box 8081
Boston, MA 02266-8081
1-800-345-6611
Distributor
Columbia Management
Distributors, Inc.
One Financial Center
Boston, MA 02111
Investment Advisor
Columbia Management Advisors, LLC
100 Federal Street
Boston, MA 02110
161
Columbia Management®
One Financial Center
Boston, MA 02111-2621
PRSRT STD
U.S. Postage
PAID
Holliston, MA
Permit NO. 20
Columbia Management®
Columbia Tax-Exempt Bond Funds
Annual Report, October 31, 2009
©2009 Columbia Management Distributors, Inc.
One Financial Center, Boston, MA 02111-2621
800-345-6611 www.columbiafunds.com
SHC-42/26822-1009 (12/09) 09/97824
Item 2. Code of Ethics.
(a) The registrant has, as of the end of the period covered by this report, adopted a code of ethics that applies to the registrant’s principal executive officer, principal financial officer, principal accounting officer or controller, or persons performing similar functions, regardless of whether these individuals are employed by the registrant or a third party.
(b) During the period covered by this report, there were not any amendments to a provision of the code of ethics adopted in 2(a) above.
(c) During the period covered by this report, there were no waivers, including any implicit waivers, from a provision of the code of ethics described in 2(a) above that relates to one or more of the items set forth in paragraph (b) of this item’s instructions.
Item 3. Audit Committee Financial Expert.
The registrant’s Board of Trustees has determined that John D. Collins, Douglas A. Hacker, Charles R. Nelson and Anne-Lee Verville, each of whom are members of the registrant’s Board of Trustees and Audit Committee, each qualify as an audit committee financial expert. Mr. Collins, Mr. Hacker, Mr. Nelson and Ms. Verville are each independent trustees, as defined in paragraph (a)(2) of this item’s instructions.
Item 4. Principal Accountant Fees and Services.
Fee information below is disclosed for the ten series of the registrant whose reports to stockholders are included in this annual filing. Fee information for fiscal year ended October 31, 2008 also includes fees for two series that were merged into the registrant during the period.
(a) Audit Fees. Aggregate Audit Fees billed by the principal accountant for professional services rendered during the fiscal years ended October 31, 2009 and October 31, 2008 are approximately as follows:
2009 | | 2008 | |
$ | 308,200 | | $ | 308,200 | |
| | | | | |
Audit Fees include amounts related to the audit of the registrant’s annual financial statements or services that are normally provided by the accountant in connection with statutory and regulatory filings or engagements for those fiscal years.
(b) Audit-Related Fees. Aggregate Audit-Related Fees billed to the registrant by the principal accountant for professional services rendered during the fiscal years ended October 31, 2009 and October 31, 2008 are approximately as follows:
2009 | | 2008 | |
$ | 46,000 | | $ | 64,100 | |
| | | | | |
Audit-Related Fees include amounts for assurance and related services by the principal accountant that are reasonably related to the performance of the audit of the registrant’s financial statements and are not reported in Audit Fees above. In both fiscal years 2009 and 2008, Audit-Related Fees consist of agreed-upon procedures performed for semi-annual shareholder reports. Fiscal year 2008 also includes Audit-Related Fees for agreed-upon procedures related to fund mergers.
During the fiscal years ended October 31, 2009 and October 31, 2008, there were no Audit-Related Fees billed by the registrant’s principal accountant to the registrant’s investment adviser (not including any sub-adviser whose role is primarily portfolio management and is subcontracted with or overseen by another investment adviser) and any entity controlling, controlled by, or under common control with the adviser that provides ongoing services to the registrant for an engagement that related directly to the operations and financial reporting of the registrant.
(c) Tax Fees. Aggregate Tax Fees billed by the principal accountant to the registrant for professional services rendered during the fiscal years ended October 31, 2009 and October 31, 2008 are approximately as follows:
2009 | | 2008 | |
$ | 46,900 | | $ | 65,400 | |
| | | | | |
Tax Fees include amounts for the review of annual tax returns, the review of required shareholder distribution calculations and typically include amounts for professional services by the principal accountant for tax compliance, tax advice and tax planning. Fiscal year 2008 also includes tax fees for agreed-upon procedures related to fund mergers and the review of final tax returns.
During the fiscal years ended October 31, 2009 and October 31, 2008, there were no Tax Fees billed by the registrant’s principal accountant to the registrant’s investment adviser (not including any sub-adviser whose role is primarily portfolio management and is subcontracted with or overseen by another investment adviser) and any entity controlling, controlled by, or under common control with the adviser that provides ongoing services
to the registrant for an engagement that related directly to the operations and financial reporting of the registrant.
(d) All Other Fees. Aggregate All Other Fees billed by the principal accountant to the registrant for professional services rendered during the fiscal years ended October 31, 2009 and October 31, 2008 are approximately as follows:
All Other Fees include amounts for products and services provided by the principal accountant, other than the services reported in paragraphs (a) through (c) above.
Aggregate All Other Fees billed by the registrant’s principal accountant to the registrant’s investment adviser (not including any sub-adviser whose role is primarily portfolio management and is subcontracted with or overseen by another investment adviser) and any entity controlling, controlled by, or under common control with the adviser that provides ongoing services to the registrant for an engagement that related directly to the operations and financial reporting of the registrant during the fiscal years ended October 31, 2009 and October 31, 2008 are approximately as follows:
2009 | | 2008 | |
$ | 1,147,400 | | $ | 916,300 | |
| | | | | |
In both fiscal years 2009 and 2008, All Other Fees consist of fees billed for internal control examinations of the registrant’s transfer agent and investment advisor. Fiscal year 2009 also includes fees for agreed upon procedures related to the sale of the long-term asset management business.
(e)(1) Audit Committee Pre-Approval Policies and Procedures
The registrant’s Audit Committee is required to pre-approve the engagement of the registrant’s independent accountants to provide audit and non-audit services to the registrant and non-audit services to its investment adviser (not including any sub-adviser whose role is primarily portfolio management and is subcontracted with or overseen by another investment adviser) or any entity controlling, controlled by or under common control with such investment adviser that provides ongoing services to the registrant (“Adviser Affiliates”), if the engagement relates directly to the operations and financial reporting of the registrant.
The Audit Committee has adop ted a Policy for Engagement of Independent Accountants for Audit and Non-Audit Services (“Policy”). The Policy sets forth the understanding of the Audit Committee regarding the engagement of the registrant’s independent accountants to provide (i) audit and permissible audit-related, tax and other services to the registrant (collectively “Fund Services”); (ii) non-audit services to the registrant’s investment adviser (not including any sub-adviser whose role is primarily
portfolio management and is subcontracted with or overseen by another investment adviser) and Adviser Affiliates, if the engagement relates directly to the operations or financial reporting of a Fund (collectively “Fund-related Adviser Services”); and (iii) certain other audit and non-audit services to the registrant’s investment adviser (not including any sub-adviser whose role is primarily portfolio management and is subcontracted with or overseen by another investment adviser) and Adviser Affiliates. Unless a type of service receives general pre-approval under the Policy, it requires specific pre-approval by the Audit Committee if it is to be provided by the independent accountants. Pre-approval of non-audit services to the registrant, the registrant’s investment adviser (not including any sub-adviser whose role is primarily portfolio management and is subcontracted with or overseen by another investment adviser) and Adviser Affiliates may be waived provided that the “de minimis” requirements set forth under paragraph (c)(7)(i)(C) of Rule 2-01 of Regulation S-X are met.
Under the Policy, the Audit Committee may delegate pre-approval authority to any pre-designated member or members who are Independent Trustees/Directors. The member(s) to whom such authority is delegated must report, for informational purposes only, any pre-approval decisions to the Audit Committee at its next regular meeting. The Audit Committee’s responsibilities with respect to the pre-approval of services performed by the independent accou ntants may not be delegated to management.
The Policy requires the Fund Treasurer and/or Director of Board Administration to submit to the Audit Committee, on an annual basis, a schedule of the types of services that are subject to general pre-approval. The schedule(s) provide a description of each type of service that is subject to general pre-approval and, where possible, will provide estimated fee caps for each instance of providing each service. The Audit Committees will review and approve the types of services and review the projected fees for the next fiscal year and may add to, or subtract from, the list of general pre-approved services from time to time based on subsequent determinations. That approval acknowledges that the Audit Committee is in agreement with the specific types of services that the independent accountants will be permitted to perform.
The Fund Treasurer and/or Director of Board Administration shall report to the Audit Committee at each of its regular meetings regarding all Fund Services or Fund-related Adviser Services initiated since the last such report was rendered, including a general description of the services, actual billed and projected fees, and the means by which such Fund Services or Fund-related Adviser Services were pre-approved by the Audit Committee.
*****
(e)(2) The percentage of services described in paragraphs (b) through (d) of this Item approved pursuant to the “de minimis” exception under paragraph (c)(7)(i)(C) of Rule 2-01 of Regulation S-X during both fiscal years ended October 31, 2009 and October 31, 2008 was zero.
(f) Not applicable.
(g) The aggregate non-audit fees billed by the registrant’s accountant for services rendered to the registrant, and rendered to the registrant’s investment adviser (not including any sub-adviser whose role is primarily portfolio management and is subcontracted with or overseen by another investment adviser), and any entity controlling, controlled by, or under common control with the adviser that provides ongoing services to the registrant for the fiscal years ended October 31, 2009 and October 31, 2008 are approximately as follows:
2009 | | 2008 | |
$ | 1,240,300 | | $ | 1,045,800 | |
| | | | | |
(h) The registrant’s Audit Committee of the Board of Directors has considered whether the provision of non-audit services that were rendered to the registrant’s adviser (not including any sub-adviser whose role is primarily portfolio management and is subcontracted with or overseen by another investment adviser), and any entity controlling, controlled by, or under common control with the investment adviser that provides ongoing services to the registrant that were not pre-approved pursuant to paragraph (c)(7)(ii) of Rule 2-01 of Regulation S-X, is compatible with maintaining the principal accountant’s independence.
Item 5. Audit Committee of Listed Registrants.
Not applicable.
Item 6. Investments
(a) The registrant’s “Schedule I — Investments in securities of unaffiliated issuers” (as set forth in 17 CFR 210.12-12) is included in Item 1 of this Form N-CSR.
(b) Not applicable.
Item 7. Disclosure of Proxy Voting Policies and Procedures for Closed-End Management Investment Companies.
Not applicable.
Item 8. Portfolio Managers of Closed-End Management Investment Companies.
Not applicable.
Item 9. Purchases of Equity Securities by Closed-End Management Investment Company and Affiliated Purchasers.
Not applicable.
Item 10. Submission of Matters to a Vote of Security Holders.
There have not been any material changes to the procedures by which shareholders may recommend nominees to the registrant’s board of directors, since those procedures were last disclosed in response to requirements of Item 407(c)(2)(iv) of Regulation S-K (as required by Item 22(b)(15) of Schedule 14A) or this Item.
Item 11. Controls and Procedures.
(a) The registrant’s principal executive officer and principal financial officers, based on their evaluation of the registrant’s disclosure controls and procedures as of a date within 90 days of the filing of this report, have concluded that such controls and procedures are adequately designed to ensure that information required to be disclosed by the registrant in Form N-CSR is accumulated and communicated to the registrant’s management, including the principal executive officer and principal financial officer, or persons performing similar functions, as appropriate to allow timely decisions regarding required disclosure.
(b) There was no change in the registrant’s internal control over financial reporting that occurred during the registrant’s second fiscal quarter of the period covered by this report that has materially affected, or is reasonably likely to materially affect, the registrant’s internal control over financial reporting.
Item 12. Exhibits.
(a)(1) Code of ethics required to be disclosed under Item 2 of Form N-CSR attached hereto as Exhibit 99.CODE ETH.
(a)(2) Certifications pursuant to Rule 30a-2(a) under the Investment Company Act of 1940 (17 CFR 270.30a-2(a)) attached hereto as Exhibit 99.CERT.
(a)(3) Not applicable.
(b) Certification pursuant to Rule 30a-2(b) under the Investment Company Act of 1940 (17 CFR 270.30a-2(b)) attached hereto as Exhibit 99.906CERT.
SIGNATURES
Pursuant to the requirements of the Securities Exchange Act of 1934 and the Investment Company Act of 1940, the registrant has duly caused this report to be signed on its behalf by the undersigned, thereunto duly authorized.
(registrant) | Columbia Funds Series Trust I | |
| | |
| | |
By (Signature and Title) | /s/ J. Kevin Connaughton | |
| J. Kevin Connaughton, President | |
| | |
| | |
Date | December 18, 2009 | |
Pursuant to the requirements of the Securities Exchange Act of 1934 and the Investment Company Act of 1940, this report has been signed below by the following persons on behalf of the registrant and in the capacities and on the dates indicated.
By (Signature and Title) | /s/ J. Kevin Connaughton | |
| J. Kevin Connaughton, President | |
| | |
| | |
Date | December 18, 2009 | |
| | |
| | |
By (Signature and Title) | /s/ Michael G. Clarke | |
| Michael G. Clarke, Chief Financial Officer | |
| | |
| | |
Date | December 18, 2009 | |