UNITED STATES
SECURITIES AND EXCHANGE COMMISSION
Washington, D.C. 20549
FORM N-CSR
CERTIFIED SHAREHOLDER REPORT OF REGISTERED MANAGEMENT
INVESTMENT COMPANIES
Investment Company Act file number 811-04367
Columbia Funds Series Trust I
(Exact name of registrant as specified in charter)
One Financial Center, Boston, Massachusetts 02111
(Address of principal executive offices) (Zip code)
James R. Bordewick, Jr., Esq.
Columbia Management Advisors, LLC
One Financial Center
Boston, MA 02111
(Name and address of agent for service)
Registrant’s telephone number, including area code: 1-617-426-3750
Date of fiscal year end: December 31
Date of reporting period: December 31, 2009
Form N-CSR is to be used by management investment companies to file reports with the Commission not later than 10 days after the transmission to stockholders of any report that is required to be transmitted to stockholders under Rule 30e-1 under the Investment Company Act of 1940 (17 CFR 270.30e-1). The Commission may use the information provided on Form N-CSR in its regulatory, disclosure review, inspection, and policymaking roles.
A registrant is required to disclose the information specified by Form N-CSR, and the Commission will make this information public. A registrant is not required to respond to the collection of information contained in Form N-CSR unless the Form displays a currently valid Office of Management and Budget (“OMB”) control number. Please direct comments concerning the accuracy of the information collection burden estimate and any suggestions for reducing the burden to Secretary, Securities and Exchange Commission, 450 Fifth Street, NW, Washington, DC 20549-0609. The OMB has reviewed this collection of information under the clearance requirements of 44 U.S.C. § 3507.
| Item 1. | Reports to Stockholders. |

Annual Report
December 31, 2009
Columbia Real Estate Equity Fund
| | |
| NOT FDIC INSURED | | May Lose Value |
| NOT BANK ISSUED | | No Bank Guarantee |
Table of contents
The views expressed in this report reflect the current views of the respective parties. These views are not guarantees of future performance and involve certain risks, uncertainties and assumptions that are difficult to predict, so actual outcomes and results may differ significantly from the views expressed. These views are subject to change at any time based upon economic, market or other conditions and the respective parties disclaim any responsibility to update such views. These views may not be relied on as investment advice and, because investment decisions for a Columbia Fund are based on numerous factors, may not be relied on as an indication of trading intent on behalf of any particular Columbia Fund. References to specific securities should not be construed as a recommendation or investment advice.
President’s Message

Dear Shareholder:
We are pleased to provide this shareholder report detailing your fund’s performance, portfolio holdings and financial statements. We hope this information is helpful in monitoring your investments as we work through these challenging economic times. We recognize that you have entrusted us with your money and want you to know that our professional investment teams work to interpret the latest economic and market trends with the goal of optimizing portfolio construction for our clients.
The first half of 2009 was defined by extremes. The multiyear lows we witnessed in the early months gave way to a stunning rally for the U.S. financial markets into the fourth quarter of 2009. A global market rebound may be underway, thanks to the massive fiscal and aggressive monetary policies of governments around the world. The S&P 500 Index1 was up 15.61% in the third quarter and 6.04% in the fourth quarter. We believe this challenging economic environment makes it even more important to work with professional money managers while continuing to invest for life events like retirement, college planning, home improvements and career changes.
Retirement income planning has become an increasingly significant focus in the lives of millions of Americans. Recent economic conditions make it even more important to manage short-term obligations such as mortgages, monthly bills and credit card debt while also taking the steps necessary to prepare for or maximize retirement benefits. Better nutrition and medical services can result in U.S. citizens living longer, healthier lives. This means the risk of outliving one’s assets in retirement is very real without proper planning. Financial security and retirement planning is an ongoing process that requires active management of your savings, investments and risks. We encourage you to review your retirement plan regularly so you’ll be better able to meet your retirement needs in the future.
We recognize that economic uncertainty creates great challenges for many investors. Our professional investment teams work diligently to help investors navigate through difficult markets. Thank you for your business and for the opportunity to work together towards your investment goals.
Sincerely,

J. Kevin Connaughton
President, Columbia Funds
On September 29, 2009, Bank of America, N.A. entered into an agreement to sell a portion of the asset management business of Columbia Management Group, LLC. Please see Note 4 of the Notes to Financial Statements for additional information.
| 1 | The Standard & Poor’s (S&P) 500 Index tracks the performance of 500 widely held, large-capitalization U.S. stocks. Indices are not available for investment, are not professionally managed and do not reflect sales charges, fees, brokerage commissions, taxes or other expenses of investing. Securities in the fund may not match those in an index. |
Past performance is no guarantee of future results.
Fund Profile – Columbia Real Estate Equity Fund
Performance data quoted represents past performance and current performance may be lower or higher. Past performance is no guarantee of future results. The investment return and principal value will fluctuate so that shares, when redeemed, may be worth more or less than the original cost. Please visit www.columbiafunds.com for daily and most recent month-end performance updates.
Summary
4-month (cumulative) return as of 12/31/09
| | |
| |
 | | +12.86% Class A shares |
| | (without sales charge) |
| |
| | +16.39% FTSE NAREIT Equity REITs Index |
The Board of Trustees for Columbia Real Estate Equity Fund approved the change of the fund’s fiscal year end from August 31 to December 31. As a result, this report covers the four-month period since the last annual report. The next report you receive will be a report for the six-month period through June 30, 2010.
Summary
| n | | For the four-month period that ended December 31, 2009, the fund’s Class A shares returned 12.86% without sales charge. |
| n | | The fund underperformed its benchmark, the FTSE NAREIT Equity REITs Index,1 and its peer group, the Lipper Real Estate Funds Classification.2 |
| n | | The portfolio’s defensive positioning, which emphasized higher-quality companies, detracted from performance. An overweight in mid-cap REITs also held back results. |
Portfolio Management
Arthur Hurley has managed the fund since September 2006 and has been associated with the advisor or its predecessors since 2006.
Portfolio holdings and characteristics are subject to change periodically and may not be representative of current holdings and characteristics. The outlook for the fund may differ from those presented for other Columbia Funds.
Equity investments are affected by stock market fluctuations that occur in response to economic and business developments.
The fund may be subject to the same types of risks associated with direct ownership of real estate, including the decline of property values due to general, local and regional economic conditions. In addition, the fund’s share price will likely be subject to more volatility than the overall stock market because it concentrates in real estate stocks.
| 1 | The FTSE National Association of Real Estate Investment Trusts (NAREIT) Equity REITs Index tracks performance of all publicly traded equity real estate investment trusts (REITs). Indices are not available for investment, are not professionally managed and do not reflect sales charges, fees, brokerage commissions, taxes or other expenses of investing. Securities in the fund may not match those in an index. |
| 2 | Lipper Inc., a widely respected data provider in the industry, calculates an average total return (assuming reinvestment of distributions) for mutual funds with investment objectives similar to those of the fund. Lipper makes no adjustment for the effect of sales loads. |
1
Economic Update – Columbia Real Estate Equity Fund
Summary
For the four-month period from September 1, 2009 through December 31, 2009
| | n | | Stock markets continued to rebound around the world, as measured by the S&P 500 Index and the MSCI EAFE Index. | |
| | |
| S&P Index | | MSCI Index |
| |

| |
|
10.00% | | 6.09% |
| | n | | As investors appeared to exhibit more tolerance for risk, the Barclays Capital Aggregate Bond Index delivered modest results. High-yield bonds continued to lead the fixed-income markets, as measured by the JPMorgan Developed BB High Yield Index. | |
| | |
| Barclays Aggregate Index | | JPMorgan
Index |
| |
| |
|
1.26% | | 8.50% |
After regaining its footing midway through 2009, gross domestic product, a common measure of the goods and services produced by the American economy, rose 2.2% in the third quarter. Prospects for fourth quarter 2009 growth were even higher, as federal government stimulus spending continued to work its way through the economy. However, hopes for a sustained recovery in 2010 likely depend on a steady rebound in consumer spending and a shift from cost cuts to revenue gains to keep business profits moving higher.
The housing market showed some signs of improvement during the four-month period covered by this report, but fell short of a turnaround. Construction spending turned slightly higher in the final months of the period. Existing home sales increased but new home sales slipped as the deadline for a generous first-time homebuyer tax credit neared. An extension of the credit into mid-2010 and an expansion of eligibility requirements, which were recently signed into law, coupled with relatively low mortgage rates, renewed hopes for a sustained rebound in housing in the year ahead.
In the beleaguered labor market, the only good news was that there was less bad news as the year came to an end. Businesses continued to shed jobs, but the pace of job losses slowed markedly. In November 4,000 new jobs were added to the economy — the first positive monthly figure since the nation fell into recession late in 2007 — and only 85,000 jobs were lost in December 2009 compared with 681,000 jobs lost in December 2008. The unemployment rate stood at 10% at the end of the year. Prospects appear dim for a quick recovery in the labor markets.
Consumers took a cautious view of business conditions, as measured monthly by The Conference Board, an independent research organization. However, the survey showed a slight improvement in November and December, as fewer consumers expected conditions to worsen and more respondents expect the labor market to improve. Manufacturing activity continued to improve during the period. Industrial production increased and manufacturing capacity utilization edged higher.
Consumer spending fell in September but increased modestly again in October. Early reports of holiday spending were positive. U.S. retail sales rose 1.7% in both November and December, according to data released by ShopperTrak, boosted by a post-Christmas surge that made up for sales lost from a massive East Coast winter storm just before Christmas.
The Federal Reserve Board (the Fed) maintained a key short-term borrowing rate — the federal funds rate — to between zero and 0.25% — a record low. In light of continued uncertainty about the economy, the Fed has indicated that it is inclined to keep rates low for some time.
Stocks continued to rebound
Against a strengthening economic backdrop, the U.S. stock market returned 10.00% for the four-month period covered by this report, as measured by the S&P 500 Index.1 Mid-cap stocks outperformed large and small-cap stocks and growth outperformed
| 1 | The Standard & Poor’s (S&P) 500 Index tracks the performance of 500 widely held, large-capitalization U.S. stocks. |
2
Economic Update (continued) – Columbia Real Estate Equity Fund
value by a solid margin, as measured by their respective Russell indices.2 Outside the U.S., stock market returns were positive. The MSCI EAFE Index,3 a broad gauge of stock market performance in foreign developed markets, gained 6.09% (in U.S. dollars) for the period. Emerging stock markets were caught in last year’s downdraft, but they bounced back stronger than domestic or developed world markets in 2009 as economic growth generally outpaced the developed world. The MSCI Emerging Markets Index4 returned 18.40% (in U.S. dollars) for the period.
High-yield bonds led the fixed-income markets
Treasury yields edged higher and prices moved lower as the U.S. economic recovery strengthened in the final months of the calendar year. Riskier segments of the bond market benefited from an increase in risk tolerance among investors. The benchmark 10-year U.S. Treasury yield began the period at just over 3.4%, then rose to 3.8% by the end of the period. In this environment, the Barclays Capital Aggregate Bond Index5 returned 1.26%. Municipal bonds delivered returns that were even higher than returns on taxable investment-grade bonds, even without factoring in potential tax advantages to investors in higher income tax brackets. The Barclays Capital Municipal Bond Index6 returned 2.60%. High-yield bond prices continued their steady climb. For the four-month period, the JPMorgan Developed BB High Yield Index7 returned 8.50%.
Past performance is no guarantee of future results.
| 2 | The Russell 1000 Index tracks the performance of 1,000 of the largest U.S. companies, based on market capitalization. The Russell MidCap Index measures the performance of the 800 smallest companies in the Russell 1000 Index, which represents approximately 25% of the total market capitalization of the Russell 1000 Index. The Russell 2000 Index measures the performance of the 2,000 smallest companies in the Russell 3000 Index, which represents approximately 8% of the total market capitalization of the Russell 3000 Index. The Russell 3000 Growth Index measures the performance of those Russell 3000 Index companies with higher price-to-book ratios and higher forecasted growth values. The stocks in this index are also members of either the Russell 1000 Growth or the Russell 2000 Growth indexes. The Russell 3000 Value Index measures the performance of those Russell 3000 Index companies with lower price-to-book ratios and lower forecasted growth values. The stocks in this index are also members of either the Russell 1000 Value or the Russell 2000 Value indexes. |
| 3 | The Morgan Stanley Capital International Europe, Australasia, Far East (MSCI EAFE) Index is a capitalization-weighted index that tracks the total return of common stocks in 21 developed-market countries within Europe, Australasia and the Far East. |
| 4 | The Morgan Stanley Capital International Emerging Markets Index (MSCI EMI) is a free float-adjusted market capitalization index that is designed to measure equity market performance in the global emerging markets. As of June 2006, the MSCI Emerging Markets Index consisted of the following 25 emerging market country indices: Argentina, Brazil, Chile, China, Colombia, Czech Republic, Egypt, Hungary, India, Indonesia, Israel, Jordan, Korea, Malaysia, Mexico, Morocco, Pakistan, Peru, Philippines, Poland, Russia, South Africa, Taiwan, Thailand and Turkey. |
| 5 | The Barclays Capital Aggregate Bond Index is a market value-weighted index that tracks the daily price, coupon, pay-downs and total return performance of fixed-rate, publicly placed, dollar-denominated and non-convertible investment grade debt issues with at least $250 million par amount outstanding and with at least one year to final maturity. |
| 6 | The Barclays Capital Municipal Bond Index is considered representative of the broad market for investment grade, tax-exempt bonds with a maturity of at least one year. |
| 7 | The JPMorgan Developed BB High Yield Index is an unmanaged index designed to mirror the investable universe of the U.S. dollar developed, BB-rated, high yield corporate debt market. |
Indices are not available for investment, are not professionally managed and do not reflect sales charges, fees, brokerage commissions, taxes or other expenses of investing. Securities in the fund may not match those in an index.
3
Performance Information – Columbia Real Estate Equity Fund
Performance data quoted represents past performance and current performance may be lower or higher. Past performance is no guarantee of future results. The investment return and principal value will fluctuate so that shares, when redeemed, may be worth more or less than the original cost. Please visit www.columbiafunds.com for daily and most recent month-end performance updates.
| | |
| Annual operating expense ratio (%)* |
| |
Class A | | 1.37 |
Class B | | 2.12 |
Class C | | 2.12 |
Class Z | | 1.12 |
| * | The annual operating expense ratio is as stated in the fund’s prospectus that is current as of the date of this report and includes the expenses incurred by the investment companies in which the fund invests. Differences in expense ratios disclosed elsewhere in this report may result from including expenses incurred by the investment companies, fee waivers and expense reimbursements as well as different time periods used in calculating the ratios. | |
| | |
| Net asset value per share |
| |
as of 12/31/09 ($) | | |
Class A | | 10.07 |
Class B | | 10.09 |
Class C | | 10.07 |
Class Z | | 10.09 |
| | |
| Distributions declared per share |
| |
09/01/09 – 12/31/09 ($) | | |
Class A | | 0.20 |
Class B | | 0.17 |
Class C | | 0.17 |
Class Z | | 0.21 |
|
| Performance of a $10,000 investment 01/01/00 – 12/31/09 |
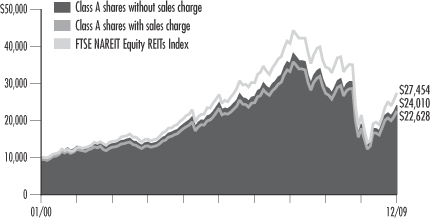
The chart above shows the change in value of a hypothetical $10,000 investment in Class A shares of Columbia Real Estate Equity Fund during the stated time period, and does not reflect the deduction of taxes that a shareholder may pay on fund distributions or on the redemption of fund shares.
| | | | |
| Performance of a $10,000 investment 01/01/00 – 12/31/09 ($) |
| | |
| Sales charge | | without | | with |
Class A | | 24,010 | | 22,628 |
Class B | | 22,790 | | 22,790 |
Class C | | 22,782 | | 22,782 |
Class Z | | 24,520 | | n/a |
| | | | | | | | | | | | | | |
| Average annual total return as of 12/31/09 (%) |
| | | | |
| Share class | | A | | B | | C | | Z |
| Inception | | 11/01/02 | | 11/01/02 | | 10/13/03 | | 04/01/94 |
| Sales charge | | without | | with | | without | | with | | without | | with | | without |
4-month (cumulative) | | 12.86 | | 6.33 | | 12.57 | | 7.57 | | 12.60 | | 11.60 | | 12.97 |
1- year | | 26.86 | | 19.52 | | 26.01 | | 21.01 | | 26.07 | | 25.07 | | 27.27 |
5-year | | –0.54 | | –1.71 | | –1.27 | | –1.43 | | –1.27 | | –1.27 | | –0.28 |
10-year | | 9.15 | | 8.51 | | 8.59 | | 8.59 | | 8.58 | | 8.58 | | 9.38 |
The “with sales charge” returns include the maximum initial sales charge of 5.75% for Class A shares and the applicable contingent deferred sales charge of 5.00% in the first year, declining to 1.00% in the sixth year, and eliminated thereafter for Class B shares and 1.00% for Class C shares for the first year only. The “without sales charge” returns do not include the effect of sales charges. If they had, returns would be lower.
Performance results reflect any fee waivers or reimbursements of fund expenses by the investment advisor and/or any of its affiliates. Absent these fee waivers or expense reimbursement arrangements, performance results would have been lower.
All results shown assume reinvestment of distributions. Class Z shares are sold at net asset value with no distribution and service (Rule 12b-1) fees. Class Z shares have limited eligibility and the investment minimum requirements may vary. Please see the fund’s prospectus for details. Performance for different share classes will vary based on differences in sales charges and fees associated with each class.
The tables do not reflect the deduction of taxes that a shareholder may pay on fund distributions or on the redemption of fund shares.
Class A, Class B and Class C are newer classes of shares. Class A and Class B share performance information includes the performance of Class Z shares (the oldest existing share class) for periods prior to their inception. Class C share performance information includes returns of Class B shares for the period from November 1, 2002 through October 12, 2003, and the returns of Class Z shares for periods prior thereto. These returns reflect differences in sales charges, but have not been restated to reflect any differences in expenses (such as distribution and service (Rule 12b-1) fees) between Class Z shares and the newer classes of shares. If differences in expenses had been reflected, the returns shown for periods prior to the inception of the newer classes of shares would have been lower, since the newer classes of shares are subject to distribution and service (Rule 12b-1) fees. Class A and Class B shares were initially offered on November 1, 2002, Class C shares were initially offered on October 13, 2003, and Class Z shares were initially offered on April 1, 1994.
4
Understanding Your Expenses – Columbia Real Estate Equity Fund
As a fund shareholder, you incur two types of costs. There are transaction costs, which generally include sales charges on purchases and may include redemption fees or exchange fees. There are also ongoing costs, which generally include investment advisory fees, distribution and service (Rule 12b-1) fees and other fund expenses. The information on this page is intended to help you understand the ongoing costs of investing in the fund and to compare these costs with the ongoing costs of investing in other mutual funds.
Analyzing your fund’s expenses by share class
To illustrate these ongoing costs, we have provided an example and calculated the expenses paid by investors in each share class during the period. The information in the following table is based on an initial investment of $1,000, which is invested at the beginning of the period and held for the entire period. Expense information is calculated two ways and each method provides you with different information. The amount listed in the “Actual” column is calculated using the fund’s actual operating expenses and total return for the period. The amount listed in the “Hypothetical” column for each share class assumes that the return each year is 5% before expenses and is calculated based on the fund’s actual operating expenses. You should not use the hypothetical account values and expenses to estimate either your actual account balance at the end of the period or the expenses you paid during this period.
Compare with other funds
Since all mutual funds are required to include the same hypothetical calculations about expenses in shareholder reports, you can use this information to compare the ongoing costs of investing in the fund with other funds. To do so, compare the 5% hypothetical example with the 5% hypothetical examples that appear in the shareholder reports of other funds. As you compare hypothetical examples of other funds, it is important to note that hypothetical examples are meant to highlight the ongoing costs of investing in a fund and do not reflect any transaction costs, such as sales charges, redemption fees or exchange fees.
Estimating your actual expenses
To estimate the expenses that you paid over the period, first you will need your account balance at the end of the period:
| | n | | For shareholders who receive their account statements from Columbia Management Services, Inc., your account balance is available online at www.columbiafunds.com or by calling Shareholder Services at 800.345.6611. | |
| | n | | For shareholders who receive their account statements from their financial intermediary, contact your financial intermediary to obtain your account balance. | |
| | 1. | Divide your ending account balance by $1,000. For example, if an account balance was $8,600 at the end of the period, the result would be 8.6. | |
| | 2. | In the section of the table below titled “Expenses paid during the period,” locate the amount for your share class. You will find this number in the column labeled “Actual.” Multiply this number by the result from step 1. Your answer is an estimate of the expenses you paid on your account during the period. | |
If the value of your account falls below the minimum initial investment requirement applicable to you, your account generally will be subject to a $20 annual fee. This fee is not included in the accompanying table. If you are subject to the fee, keep it in mind when you are estimating the ongoing expenses of investing in the fund and when comparing the expenses of this fund with other funds.
| | | | | | | | | | | | | | |
| 09/01/09 – 12/31/09 |
| | | | |
| | | Account value at the
beginning of the period ($) | | Account value at the
end of the period ($) | | Expenses paid
during the period ($) | | Fund’s annualized
expense ratio (%) |
| | | Actual | | Hypothetical | | Actual | | Hypothetical | | Actual | | Hypothetical | | Actual |
Class A | | 1,000.00 | | 1,000.00 | | 1,128.60 | | 1,018.20 | | 4.94 | | 7.07 | | 1.39 |
Class B | | 1,000.00 | | 1,000.00 | | 1,125.70 | | 1,014.42 | | 7.60 | | 10.87 | | 2.14 |
Class C | | 1,000.00 | | 1,000.00 | | 1,126.00 | | 1,014.42 | | 7.60 | | 10.87 | | 2.14 |
Class Z | | 1,000.00 | | 1,000.00 | | 1,129.70 | | 1,019.46 | | 4.06 | | 5.80 | | 1.14 |
Actual expenses paid for period of 09/01/09 - 12/31/09.
Hypothetical expenses paid for period of 07/01/09 - 12/31/09.
Expenses paid during the period are equal to the annualized expense ratio for the share class, multiplied by the average account value over the period, then multiplied by the number of days in the fund’s most recent fiscal half-year and divided by 365.
It is important to note that the expense amounts shown in the table are meant to highlight only ongoing costs of investing in the fund and do not reflect any transaction costs, such as sales charges, redemption fees or exchange fees. Therefore, the hypothetical examples provided may not help you determine the relative total costs of owning shares of different funds. If these transaction costs were included, your costs would have been higher.
5
Portfolio Manager’s Report – Columbia Real Estate Equity Fund
Performance data quoted represents past performance and current performance may be lower or higher. Past performance is no guarantee of future results. The investment return and principal value will fluctuate so that shares, when redeemed, may be worth more or less than the original cost. Please visit www.columbiafunds.com for daily and most recent month-end performance updates.
| | |
| Top 10 holdings |
| |
as of 12/31/09 (%) | | |
Simon Property Group | | 10.8 |
Ventas | | 5.9 |
Digital Realty Trust | | 5.5 |
Vornado Realty Trust | | 5.3 |
Alexandria Real Estate Equities | | 4.9 |
Federal Realty Investment Trust | | 4.8 |
Corporate Office Properties Trust | | 4.6 |
BioMed Realty Trust | | 4.6 |
Entertainment Properties Trust | | 4.4 |
Boston Properties | | 4.3 |
| | |
Top sectors |
| |
as of 12/31/09 (%) | | |
Office REITs | | 26.1 |
Specialized REITs | | 21.9 |
Retail REITs | | 18.7 |
Residential REITs | | 16.5 |
Diversified REITs | | 6.9 |
Hotel Resorts & Cruise Lines | | 4.6 |
Industrial REITs | | 3.0 |
Leisure Facilities | | 1.2 |
Health Care Facilities | | 1.1 |
The fund is actively managed and the composition of its portfolio will change over time. Top sectors are calculated as a percentage of total investments. Top 10 holdings and holdings discussed in this report are calculated as a percentage of net assets.
For the four-month period that ended December 31, 2009, the fund’s Class A shares returned 12.86% without sales charge. The fund’s benchmark, the FTSE NAREIT Equity REITs Index, returned 16.39%. The average return of the fund’s peer group, the Lipper Real Estate Funds Classification, was 16.17%. During the period, the market rewarded lower-quality companies with improving balance sheets. While the portfolio has been slowly moving away from its defensive positioning, it was more conservative than the index or the average competing fund. Also, an overweight in mid-cap REITs held back results at a time when large-cap REITs outperformed.
A positive impact from selected holdings
As the real estate market rebounded, Simon Property Group, an owner-operator primarily of regional malls, had a positive impact on fund performance. The company gained momentum as it strengthened its balance sheet and as investors became more positive about the prospects for an upturn in consumer spending. Starwood Hotels & Resorts was buoyed by an improving economy and a rebound in travel. In the office sector, a focus on life-science names, such as BioMed Realty Trust and Alexandria Realty, contributed to return.
Property sector allocation and stock selection affected return
Relative to the benchmark, overweights in residential REITs and office REITs worked against the fund. A relative underweight in hotel REITs was also disappointing. Individual companies that detracted from performance included: Corporate Office Properties, an owner-operator of suburban office properties; Equity Lifestyle Properties, an owner-operator of manufactured homes; and Boardwalk Real Estate Investment Trust, an owner-operator of multi-family rental communities in Canada.
Looking ahead
In 2009, many REITs repositioned themselves to take advantage of future discounted acquisition opportunities and a rebound in business by raising capital and streamlining their portfolios through sales of non-core assets. While this repositioning resulted in a rally in REITs, some of the issues that have weighed on the REIT market for the past two years remain unresolved. Over the past several months, better-capitalized REITs have been able to obtain credit; however, we do not know how much credit will be available to lower-quality REITs with maturing loans. Also, we do not know the extent to which these maturing loans will create distressed real estate opportunities. We expect these issues to be clarified in the months ahead.
An unprecedented level of government stimulus fueled positive economic growth in the second half of 2009. However, it is unclear whether these stimulus programs will result in sustainable economic growth or in job growth, which is the key driver of commercial real estate demand. As economic growth stabilizes, we believe that business prospects for commercial real estate will improve. However, we believe positive business prospects for commercial real estate are unlikely to develop until the latter half of 2010 or 2011. Nevertheless, REIT share prices could continue to rise. We expect that the next positive move in the market will be by the strongest REITs with the lowest capital costs and those that have the potential to take advantage of opportunities in distressed properties before they are widely recognized by the market.
6
Investment Portfolio – Columbia Real Estate Equity Fund
December 31, 2009
Common Stocks – 98.2%
| | | | |
| | | Shares | | Value ($) |
| Consumer Discretionary – 2.1% |
| Hotels, Restaurants & Leisure – 2.1% | | |
Starwood Hotels & Resorts Worldwide, Inc. | | 77,198 | | 2,823,131 |
Vail Resorts, Inc. (a) | | 93,900 | | 3,549,420 |
| | | | |
Hotels, Restaurants & Leisure Total | | | | 6,372,551 |
| | | | |
Consumer Discretionary Total | | | | 6,372,551 |
| | | | |
| Financials – 95.0% |
| Real Estate Investment Trusts (REITs) – 95.0% | | |
Alexandria Real Estate Equities, Inc. | | 230,700 | | 14,831,703 |
AvalonBay Communities, Inc. | | 110,100 | | 9,040,311 |
BioMed Realty Trust, Inc. | | 872,200 | | 13,763,316 |
Boardwalk Real Estate Investment Trust (c) CAD | | 215,108 | | 7,620,358 |
Boston Properties, Inc. | | 193,000 | | 12,944,510 |
Brandywine Realty Trust | | 470,827 | | 5,367,428 |
CBL & Associates Properties, Inc. | | 410,346 | | 3,968,046 |
Corporate Office Properties Trust SBI MD | | 378,262 | | 13,855,737 |
Digital Realty Trust, Inc. | | 327,265 | | 16,454,884 |
Entertainment Properties Trust | | 377,300 | | 13,307,371 |
Equity Lifestyle Properties, Inc. | | 234,456 | | 11,832,994 |
Equity Residential Property Trust | | 258,738 | | 8,740,170 |
Federal Realty Investment Trust | | 212,102 | | 14,363,547 |
Host Hotels & Resorts, Inc. | | 850,404 | | 9,924,215 |
Liberty Property Trust | | 143,000 | | 4,577,430 |
LTC Properties, Inc. | | 84,600 | | 2,263,050 |
Mid-America Apartment Communities, Inc. | | 201,402 | | 9,723,688 |
National Retail Properties, Inc. | | 193,496 | | 4,105,985 |
Nationwide Health Properties, Inc. | | 292,287 | | 10,282,657 |
Potlatch Corp. | | 327,919 | | 10,454,058 |
ProLogis | | 635,100 | | 8,694,519 |
Public Storage | | 131,109 | | 10,678,828 |
Simon Property Group, Inc. | | 407,551 | | 32,522,570 |
Sun Communities, Inc. | | 78,031 | | 1,541,112 |
Sunstone Hotel Investors, Inc. (a) | | 85,100 | | 755,688 |
Ventas, Inc. | | 400,837 | | 17,532,610 |
Vornado Realty Trust | | 227,120 | | 15,884,773 |
| | | | |
Real Estate Investment Trusts (REITs) Total | | 285,031,558 |
| | | | |
Financials Total | | | | 285,031,558 |
| | | | |
| | | Shares | | Value ($) |
| Health Care – 1.1% |
| Health Care Providers & Services – 1.1% | | |
Emeritus Corp. (a) | | 174,600 | | 3,273,750 |
| | | | |
Health Care Providers & Services Total | | 3,273,750 |
| | | | |
Health Care Total | | 3,273,750 |
| | | | |
Total Common Stocks
(cost of $235,232,303) | | 294,677,859 |
| |
Short-Term Obligation – 1.3% | | |
| | | Par ($) | | |
Repurchase agreement with Fixed Income Clearing Corp., dated 12/31/09, due 01/04/09 at 0.000%, collateralized by a U.S. Treasury obligation maturing 12/31/11, market value $3,945,150 (repurchase proceeds $3,866,000) | | 3,866,000 | | 3,866,000 |
| | | | |
Total Short-Term Obligation
(cost of $3,866,000) | | 3,866,000 |
| | | | |
Total Investments – 99.5%
(cost of $239,098,303) (b) | | 298,543,859 |
| | | | |
Other Assets & Liabilities, Net – 0.5% | | 1,354,608 |
| | | | |
Net Assets – 100.0% | | | | 299,898,467 |
Notes to Investment Portfolio:
| (a) | Non-income producing security. |
| (b) | Cost for federal income tax purposes is $239,898,643. |
| (c) | This security denominated in Canadian dollars. |
The following table summarizes the inputs used, as of December 31, 2009, in valuing the Fund’s assets:
| | | | | | | | | | | | |
Description | | Quoted
Prices
(Level 1) | | Other
Significant
Observable
Inputs
(Level 2) | | Significant
Unobservable
Inputs
(Level 3) | | Total |
Total Common Stocks | | $ | 294,677,859 | | $ | — | | $ | — | | $ | 294,677,859 |
| | | | | | | | | | | | |
Total Short-Term Obligation | | | — | | | 3,866,000 | | | — | | | 3,866,000 |
| | | | | | | | | | | | |
Total Investments | | $ | 294,677,859 | | $ | 3,866,000 | | $ | — | | $ | 298,543,859 |
| | | | | | | | | | | | |
For more information on valuation inputs, and their aggregation into the levels used in the table above, please refer to the Security Valuation section in the Accompanying Notes to Financial Statements.
See Accompanying Notes to Financial Statements.
7
Columbia Real Estate Equity Fund
December 31, 2009
At December 31, 2009, the asset allocation of the Fund is as follows:
| | |
Asset Allocation (Unaudited) | | % of
Net Assets |
Financials | | 95.0 |
Consumer Discretionary | | 2.1 |
HealthCare | | 1.1 |
| | |
| | 98.2 |
Short-Term Obligation | | 1.3 |
Other Assets & Liabilities, Net | | 0.5 |
| | |
| | 100.0 |
| | |
| | |
Acronym | | Name |
| CAD | | Canadian Dollar |
See Accompanying Notes to Financial Statements.
8
Statement of Assets and Liabilities – Columbia Real Estate Equity Fund
December 31, 2009
| | | | | | |
| | | | | ($) | |
| Assets | | Investments, at cost | | | 239,098,303 | |
| | | | | | |
| | Investments, at value | | | 298,543,859 | |
| | Cash | | | 536 | |
| | Receivable for: | | | | |
| | Fund shares sold | | | 870,273 | |
| | Dividends | | | 1,366,353 | |
| | Trustees’ deferred compensation plan | | | 41,569 | |
| | Prepaid expenses | | | 10,075 | |
| | | |
| | Total Assets | | | 300,832,665 | |
| | |
| Liabilities | | Payable for: | | | | |
| | Fund shares repurchased | | | 482,185 | |
| | Investment advisory fee | | | 186,135 | |
| | Pricing and bookkeeping fees | | | 6,762 | |
| | Transfer agent fee | | | 75,498 | |
| | Trustees’ fees | | | 269 | |
| | Custody fee | | | 840 | |
| | Distribution and service fees | | | 10,257 | |
| | Chief compliance officer expenses | | | 170 | |
| | Reports to shareholders | | | 91,999 | |
| | Trustees’ deferred compensation plan | | | 41,569 | |
| | Other liabilities | | | 38,514 | |
| | | |
| | Total Liabilities | | | 934,198 | |
| |
| | | |
| | Net Assets | | | 299,898,467 | |
| | |
| Net Assets Consist of | | Paid-in capital | | | 293,599,940 | |
| | Overdistributed net investment income | | | (387,652 | ) |
| | Accumulated net realized loss | | | (52,759,237 | ) |
| | Net unrealized appreciation (depreciation) on: | | | | |
| | Investments | | | 59,445,556 | |
| | Foreign currency translations | | | (140 | ) |
| | | |
| | Net Assets | | | 299,898,467 | |
| | |
| Class A | | Net assets | | $ | 18,244,887 | |
| | Shares outstanding | | | 1,811,213 | |
| | Net asset value per share | | $ | 10.07 | (a) |
| | Maximum sales charge | | | 5.75 | % |
| | Maximum offering price per share ($10.07/0.9425) | | $ | 10.68 | (b) |
| | |
| Class B | | Net assets | | $ | 3,348,329 | |
| | Shares outstanding | | | 331,735 | |
| | Net asset value and offering price per share | | $ | 10.09 | (a) |
| | |
| Class C | | Net assets | | $ | 4,776,820 | |
| | Shares outstanding | | | 474,349 | |
| | Net asset value and offering price per share | | $ | 10.07 | (a) |
| | |
| Class Z | | Net assets | | $ | 273,528,431 | |
| | Shares outstanding | | | 27,107,465 | |
| | Net asset value, offering and redemption price per share | | $ | 10.09 | |
| (a) | Redemption price per share is equal to net asset value less any applicable contingent deferred sales charge. |
| (b) | On sales of $50,000 or more the offering price is reduced. |
See Accompanying Notes to Financial Statements.
9
Statements of Operations – Columbia Real Estate Equity Fund
| | | | | | | | |
| | | | | Period from
September 1, 2009
through
December 31, 2009
($) (a) | | | For the
Year Ended
August 31, 2009
($) | |
| Investment Income | | Dividends | | 3,145,207 | | | 8,973,191 | |
| | Interest | | 326 | | | 20,957 | |
| | Foreign taxes withheld | | (18,238 | ) | | (47,168 | ) |
| | | | | | |
| | Total Investment Income | | 3,127,295 | | | 8,946,980 | |
| | | |
| Expenses | | Investment advisory fee | | 686,031 | | | 1,670,236 | |
| | Distribution fee: | | | | | | |
| | Class B | | 8,375 | | | 26,912 | |
| | Class C | | 9,509 | | | 26,164 | |
| | Service fee: | | | | | | |
| | Class A | | 14,539 | | | 35,816 | |
| | Class B | | 2,791 | | | 8,971 | |
| | Class C | | 3,170 | | | 8,721 | |
| | Transfer agent fee | | 141,742 | | | 387,916 | |
| | Pricing and bookkeeping fees | | 27,743 | | | 74,509 | |
| | Trustees’ fees | | 9,400 | | | 23,322 | |
| | Custody fee | | 3,553 | | | 8,708 | |
| | Reports to shareholders | | 79,646 | | | 125,065 | |
| | Chief compliance officer expenses | | 237 | | | 653 | |
| | Other expenses | | 92,194 | | | 71,846 | |
| | | | | | |
| | Total Expenses | | 1,078,930 | | | 2,468,839 | |
| | Expense reductions | | (1 | ) | | (11 | ) |
| | | | | | |
| | Net Expenses | | 1,078,929 | | | 2,468,828 | |
| | |
| | | | | | |
| | Net Investment Income | | 2,048,366 | | | 6,478,152 | |
| | | |
| Net Realized and Unrealized Gain (Loss) on Investments and Foreign Currency | | Net realized gain (loss) on: | | | | | | |
| | Investments | | 24,304,417 | | | (91,399,705 | ) |
| | Foreign currency transactions | | 1,819 | | | 1,637 | |
| | | | | | |
| | Net realized gain (loss) | | 24,306,236 | | | (91,398,068 | ) |
| | | |
| | Net change in unrealized appreciation (depreciation) on: | | | | | | |
| | Investments | | 7,629,789 | | | (8,110,583 | ) |
| | Foreign currency translations | | (171 | ) | | 304 | |
| | | | | | |
| | Net change in unrealized appreciation (depreciation) | | 7,629,618 | | | (8,110,279 | ) |
| | | | | | |
| | Net Gain (Loss) | | 31,935,854 | | | (99,508,347 | ) |
| | |
| | | | | | |
| | Net Increase (Decrease) Resulting from Operations | | 33,984,220 | | | (93,030,195 | ) |
| (a) | The Fund changed its fiscal year end from August 31 to December 31. |
See Accompanying Notes to Financial Statements.
10
Statements of Changes in Net Assets – Columbia Real Estate Equity Fund
| | | | | | | | | | | |
| | | | | Period from September 1, 2009 through December 31, 2009 | | | Year Ended August 31, | |
| Increase (Decrease) in Net Assets | | | | ($) (a) | | | 2009 ($) | | | 2008 ($) | |
| Operations | | Net investment income | | 2,048,366 | | | 6,478,152 | | | 7,017,632 | |
| | Net realized gain (loss) on investments and foreign currency transactions | | 24,306,236 | | | (91,398,068 | ) | | 49,736,685 | |
| | Net change in unrealized appreciation (depreciation) on investments and foreign currency translations | | 7,629,618 | | | (8,110,279 | ) | | (74,425,849 | ) |
| | | |
| | Net increase (decrease) resulting from operations | | 33,984,220 | | | (93,030,195 | ) | | (17,671,532 | ) |
| | | | |
| Distributions to Shareholders | | From net investment income: | | | | | | | | | |
| | Class A | | (217,802 | ) | | (551,971 | ) | | (231,829 | ) |
| | Class B | | (29,707 | ) | | (117,661 | ) | | (37,874 | ) |
| | Class C | | (33,297 | ) | | (110,966 | ) | | (32,873 | ) |
| | Class Z | | (3,425,286 | ) | | (8,341,582 | ) | | (3,748,998 | ) |
| | From net realized gains: | | | | | | | | | |
| | Class A | | — | | | — | | | (6,859,068 | ) |
| | Class B | | — | | | — | | | (2,737,380 | ) |
| | Class C | | — | | | — | | | (2,361,785 | ) |
| | Class Z | | — | | | — | | | (93,321,186 | ) |
| | From return of capital: | | | | | | | | | |
| | Class A | | (151,558 | ) | | (299,968 | ) | | — | |
| | Class B | | (29,124 | ) | | (73,441 | ) | | — | |
| | Class C | | (33,092 | ) | | (72,111 | ) | | — | |
| | Class Z | | (2,168,787 | ) | | (4,249,735 | ) | | — | |
| | | |
| | Total distributions to shareholders | | (6,088,653 | ) | | (13,817,435 | ) | | (109,330,993 | ) |
| | | | |
| | Net Capital Stock Transactions | | 9,494,663 | | | 51,156,494 | | | 18,819,376 | |
| | | |
| | Total increase (decrease) in net assets | | 37,390,230 | | | (55,691,136 | ) | | (108,183,149 | ) |
| | | | |
| Net Assets | | Beginning of period | | 262,508,237 | | | 318,199,373 | | | 426,382,522 | |
| | End of period | | 299,898,467 | | | 262,508,237 | | | 318,199,373 | |
| | Undistributed (Overdistributed) net investment income at end of period | | (387,652 | ) | | 1,268,255 | | | 1,348,655 | |
| (a) | The Fund changed its fiscal year end from August 31 to December 31. |
See Accompanying Notes to Financial Statements.
11
Statements of Changes in Net Assets (continued) – Columbia Real Estate Equity Fund
| | | | | | | | | | | | | | | | | | |
| | | Capital Stock Activity | |
| | | Period from
September 1, 2009
through
December 31, 2009 (a) | | | Year Ended
August 31, 2009 | | | Year Ended
August 31, 2008 | |
| | | Shares | | | Dollars ($) | | | Shares | | | Dollars ($) | | | Shares | | | Dollars ($) | |
Class A | | | | | | | | | | | | | | | | | | |
Subscriptions | | 148,133 | | | 1,400,964 | | | 897,568 | | | 7,501,890 | | | 616,079 | | | 8,565,733 | |
Distributions reinvested | | 36,378 | | | 347,579 | | | 103,384 | | | 796,102 | | | 455,084 | | | 6,729,883 | |
Redemptions | | (251,800 | ) | | (2,376,319 | ) | | (733,801 | ) | | (5,988,913 | ) | | (959,008 | ) | | (15,547,187 | ) |
| | | | | | | | | | | | | | | | | | |
Net increase (decrease) | | (67,289 | ) | | (627,776 | ) | | 267,151 | | | 2,309,079 | | | 112,155 | | | (251,571 | ) |
| | | | | | |
Class B | | | | | | | | | | | | | | | | | | |
Subscriptions | | 4,866 | | | 44,893 | | | 26,122 | | | 254,768 | | | 82,549 | | | 1,472,374 | |
Distributions reinvested | | 5,598 | | | 53,604 | | | 22,182 | | | 170,811 | | | 164,393 | | | 2,432,022 | |
Redemptions | | (46,753 | ) | | (442,409 | ) | | (194,445 | ) | | (1,599,367 | ) | | (198,348 | ) | | (3,015,576 | ) |
| | | | | | | | | | | | | | | | | | |
Net increase (decrease) | | (36,289 | ) | | (343,912 | ) | | (146,141 | ) | | (1,173,788 | ) | | 48,594 | | | 888,820 | |
| | | | | | |
Class C | | | | | | | | | | | | | | | | | | |
Subscriptions | | 126,941 | | | 1,237,016 | | | 97,202 | | | 833,369 | | | 106,346 | | | 1,756,270 | |
Distributions reinvested | | 6,394 | | | 61,091 | | | 22,330 | | | 170,897 | | | 151,036 | | | 2,229,869 | |
Redemptions | | (49,543 | ) | | (470,948 | ) | | (196,401 | ) | | (1,646,317 | ) | | (188,638 | ) | | (2,822,085 | ) |
| | | | | | | | | | | | | | | | | | |
Net increase (decrease) | | 83,792 | | | 827,159 | | | (76,869 | ) | | (642,051 | ) | | 68,744 | | | 1,164,054 | |
| | | | | | |
Class Z | | | | | | | | | | | | | | | | | | |
Subscriptions | | 2,795,492 | | | 26,785,491 | | | 15,480,870 | | | 128,665,264 | | | 4,334,071 | | | 58,822,815 | |
Proceeds received in connection with merger | | — | | | — | | | — | | | — | | | 1,924,145 | | | 25,873,534 | |
Distributions reinvested | | 334,240 | | | 3,200,691 | | | 976,848 | | | 7,579,012 | | | 4,827,796 | | | 71,469,590 | |
Redemptions | | (2,147,820 | ) | | (20,346,990 | ) | | (10,673,077 | ) | | (85,581,022 | ) | | (8,939,020 | ) | | (139,147,866 | ) |
| | | | | | | | | | | | | | | | | | |
Net increase | | 981,912 | | | 9,639,192 | | | 5,784,641 | | | 50,663,254 | | | 2,146,992 | | | 17,018,073 | |
| (a) | The Fund changed its fiscal year end from August 31 to December 31. |
See Accompanying Notes to Financial Statements.
12
Financial Highlights – Columbia Real Estate Equity Fund
Selected data for a share outstanding throughout each period is as follows:
| | | | | | | | | | | | | | | | | | | | | | | | |
| | | Period
Ended
December 31, | | | Year Ended August 31, | |
| Class A Shares | | 2009 (a) | | | 2009 | | | 2008 | | | 2007 | | | 2006 | | | 2005 | |
Net Asset Value, Beginning of Period | | $ | 9.11 | | | $ | 13.85 | | | $ | 20.72 | | | $ | 29.07 | | | $ | 27.84 | | | $ | 25.59 | |
| | | | | | |
Income from Investment Operations: | | | | | | | | | | | | | | | | | | | | | | | | |
Net investment income (b) | | | 0.06 | | | | 0.22 | | | | 0.29 | | | | 0.22 | | | | 0.39 | | | | 0.79 | (c) |
Net realized and unrealized gain (loss) on investments and foreign currency | | | 1.10 | | | | (4.46 | ) | | | (1.10 | ) | | | 1.24 | | | | 4.90 | | | | 4.73 | |
| | | | | | | | | | | | | | | | | | | | | | | | |
Total from investment operations | | | 1.16 | | | | (4.24 | ) | | | (0.81 | ) | | | 1.46 | | | | 5.29 | | | | 5.52 | |
| | | | | | |
Less Distributions to Shareholders: | | | | | | | | | | | | | | | | | | | | | | | | |
From net investment income | | | (0.12 | ) | | | (0.33 | ) | | | (0.16 | ) | | | (0.33 | ) | | | (0.78 | ) | | | (0.75 | ) |
From net realized gains | | | — | | | | — | | | | (5.90 | ) | | | (9.48 | ) | | | (3.28 | ) | | | (2.52 | ) |
From return of capital | | | (0.08 | ) | | | (0.17 | ) | | | — | | | | — | | | | — | | | | — | |
| | | | | | | | | | | | | | | | | | | | | | | | |
Total distributions to shareholders | | | (0.20 | ) | | | (0.50 | ) | | | (6.06 | ) | | | (9.81 | ) | | | (4.06 | ) | | | (3.27 | ) |
| | | | | | |
Net Asset Value, End of Period | | $ | 10.07 | | | $ | 9.11 | | | $ | 13.85 | | | $ | 20.72 | | | $ | 29.07 | | | $ | 27.84 | |
Total return (d) | | | 12.86 | %(g) | | | (29.89 | )% | | | (5.46 | )% | | | 1.72 | % | | | 21.66 | % | | | 22.65 | % |
| | | | | | |
Ratios to Average Net Assets/Supplemental Data: | | | | | | | | | | | | | | | | | | | | | | | | |
Net expenses before interest expense (e) | | | 1.39 | %(h) | | | 1.31 | % | | | 1.28 | % | | | 1.21 | % | | | 1.19 | % | | | 1.18 | % |
Interest expense | | | — | | | | — | | | | — | %(f) | | | — | %(f) | | | — | %(f) | | | — | |
Net expenses (e) | | | 1.39 | %(h) | | | 1.31 | % | | | 1.28 | % | | | 1.21 | % | | | 1.19 | % | | | 1.18 | % |
Net investment income (e) | | | 1.99 | %(h) | | | 2.69 | % | | | 1.93 | % | | | 0.84 | % | | | 1.45 | % | | | 2.98 | % |
Portfolio turnover rate | | | 32 | %(g) | | | 110 | % | | | 78 | % | | | 67 | % | | | 10 | % | | | 10 | % |
Net assets, end of period (000s) | | $ | 18,245 | | | $ | 17,114 | | | $ | 22,321 | | | $ | 31,069 | | | $ | 44,685 | | | $ | 45,756 | |
| (a) | The Fund changed its fiscal year end from August 31 to December 31. Per share data and total return reflect activity from September 1, 2009 through December 31, 2009. |
| (b) | Per share data was calculated using the average shares outstanding during the period. |
| (c) | Net investment income per share reflects a special dividend. The effect of this dividend amounted to $0.24 per share. |
| (d) | Total return at net asset value assuming all distributions reinvested and no initial sales charge or contingent deferred sales charge. |
| (e) | The benefits derived from expense reductions had an impact of less than 0.01%. |
| (f) | Rounds to less than 0.01%. |
See Accompanying Notes to Financial Statements.
13
Financial Highlights – Columbia Real Estate Equity Fund
Selected data for a share outstanding throughout each period is as follows:
| | | | | | | | | | | | | | | | | | | | | | | | |
| | | Period
Ended
December 31, | | | Year Ended August 31, | |
| Class B Shares | | 2009 (a) | | | 2009 | | | 2008 | | | 2007 | | | 2006 | | | 2005 | |
Net Asset Value, Beginning of Period | | $ | 9.12 | | | $ | 13.85 | | | $ | 20.76 | | | $ | 29.09 | | | $ | 27.85 | | | $ | 25.60 | |
| | | | | | |
Income from Investment Operations: | | | | | | | | | | | | | | | | | | | | | | | | |
Net investment income (b) | | | 0.04 | | | | 0.16 | | | | 0.20 | | | | 0.03 | | | | 0.19 | | | | 0.60 | (c) |
Net realized and unrealized gain (loss) on investments and foreign currency | | | 1.10 | | | | (4.46 | ) | | | (1.14 | ) | | | 1.24 | | | | 4.90 | | | | 4.73 | |
| | | | | | | | | | | | | | | | | | | | | | | | |
Total from investment operations | | | 1.14 | | | | (4.30 | ) | | | (0.94 | ) | | | 1.27 | | | | 5.09 | | | | 5.33 | |
| | | | | | |
Less Distributions to Shareholders: | | | | | | | | | | | | | | | | | | | | | | | | |
From net investment income | | | (0.09 | ) | | | (0.26 | ) | | | (0.07 | ) | | | (0.12 | ) | | | (0.57 | ) | | | (0.56 | ) |
From net realized gains | | | — | | | | — | | | | (5.90 | ) | | | (9.48 | ) | | | (3.28 | ) | | | (2.52 | ) |
From return of capital | | | (0.08 | ) | | | (0.17 | ) | | | — | | | | — | | | | — | | | | — | |
| | | | | | | | | | | | | | | | | | | | | | | | |
Total distributions to shareholders | | | (0.17 | ) | | | (0.43 | ) | | | (5.97 | ) | | | (9.60 | ) | | | (3.85 | ) | | | (3.08 | ) |
| | | | | | |
Net Asset Value, End of Period | | $ | 10.09 | | | $ | 9.12 | | | $ | 13.85 | | | $ | 20.76 | | | $ | 29.09 | | | $ | 27.85 | |
Total return (d) | | | 12.57 | %(g) | | | (30.38 | )% | | | (6.21 | )% | | | 0.99 | % | | | 20.78 | % | | | 21.74 | % |
| | | | | | |
Ratios to Average Net Assets/ Supplemental Data: | | | | | | | | | | | | | | | | | | | | | | | | |
Net expenses before interest expense (e) | | | 2.14 | %(h) | | | 2.06 | % | | | 2.03 | % | | | 1.96 | % | | | 1.94 | % | | | 1.93 | % |
Interest expense | | | — | | | | — | | | | — | %(f) | | | — | %(f) | | | — | %(f) | | | — | |
Net expenses (e) | | | 2.14 | %(h) | | | 2.06 | % | | | 2.03 | % | | | 1.96 | % | | | 1.94 | % | | | 1.93 | % |
Net investment income (e) | | | 1.22 | %(h) | | | 1.96 | % | | | 1.30 | % | | | 0.10 | % | | | 0.72 | % | | | 2.26 | % |
Portfolio turnover rate | | | 32 | %(g) | | | 110 | % | | | 78 | % | | | 67 | % | | | 10 | % | | | 10 | % |
Net assets, end of period (000s) | | $ | 3,348 | | | $ | 3,356 | | | $ | 7,123 | | | $ | 9,663 | | | $ | 13,309 | | | $ | 14,393 | |
| (a) | The Fund changed its fiscal year end from August 31 to December 31. Per share data and total return reflect activity from September 1, 2009 through December 31, 2009. |
| (b) | Per share data was calculated using the average shares outstanding during the period. |
| (c) | Net investment income per share reflects a special dividend. The effect of this dividend amounted to $0.24 per share. |
| (d) | Total return at net asset value assuming all distributions reinvested and no contingent deferred sales charge. |
| (e) | The benefits derived from expense reductions had an impact of less than 0.01%. |
| (f) | Rounds to less than 0.01%. |
See Accompanying Notes to Financial Statements.
14
Financial Highlights – Columbia Real Estate Equity Fund
Selected data for a share outstanding throughout each period is as follows:
| | | | | | | | | | | | | | | | | | | | | | | | |
| | | Period
Ended
December 31, | | | Year Ended August 31, | |
| Class C Shares | | 2009 (a) | | | 2009 | | | 2008 | | | 2007 | | | 2006 | | | 2005 | |
Net Asset Value, Beginning of Period | | $ | 9.10 | | | $ | 13.82 | | | $ | 20.72 | | | $ | 29.06 | | | $ | 27.83 | | | $ | 25.58 | |
| | | | | | |
Income from Investment Operations: | | | | | | | | | | | | | | | | | | | | | | | | |
Net investment income (b) | | | 0.04 | | | | 0.16 | | | | 0.19 | | | | 0.03 | | | | 0.18 | | | | 0.55 | (c) |
Net realized and unrealized gain (loss) on investments and foreign currency | | | 1.10 | | | | (4.45 | ) | | | (1.12 | ) | | | 1.23 | | | | 4.90 | | | | 4.78 | |
| | | | | | | | | | | | | | | | | | | | | | | | |
Total from investment operations | | | 1.14 | | | | (4.29 | ) | | | (0.93 | ) | | | 1.26 | | | | 5.08 | | | | 5.33 | |
| | | | | | |
Less Distributions to Shareholders: | | | | | | | | | | | | | | | | | | | | | | | | |
From net investment income | | | (0.09 | ) | | | (0.26 | ) | | | (0.07 | ) | | | (0.12 | ) | | | (0.57 | ) | | | (0.56 | ) |
From net realized gains | | | — | | | | — | | | | (5.90 | ) | | | (9.48 | ) | | | (3.28 | ) | | | (2.52 | ) |
From return of capital | | | (0.08 | ) | | | (0.17 | ) | | | — | | | | — | | | | — | | | | — | |
| | | | | | | | | | | | | | | | | | | | | | | | |
Total distributions to shareholders | | | (0.17 | ) | | | (0.43 | ) | | | (5.97 | ) | | | (9.60 | ) | | | (3.85 | ) | | | (3.08 | ) |
| | | | | | |
Net Asset Value, End of Period | | $ | 10.07 | | | $ | 9.10 | | | $ | 13.82 | | | $ | 20.72 | | | $ | 29.06 | | | $ | 27.83 | |
Total return (d) | | | 12.60 | %(g) | | | (30.37 | )% | | | (6.18 | )% | | | 0.94 | % | | | 20.75 | % | | | 21.75 | % |
| | | | | | |
Ratios to Average Net Assets/ Supplemental Data: | | | | | | | | | | | | | | | | | | | | | | | | |
Net expenses before interest expense (e) | | | 2.14 | %(h) | | | 2.06 | % | | | 2.03 | % | | | 1.96 | % | | | 1.94 | % | | | 1.93 | % |
Interest expense | | | — | | | | — | | | | — | %(f) | | | — | %(f) | | | — | %(f) | | | — | |
Net expenses (e) | | | 2.14 | %(h) | | | 2.06 | % | | | 2.03 | % | | | 1.96 | % | | | 1.94 | % | | | 1.93 | % |
Net investment income (e) | | | 1.37 | %(h) | | | 1.95 | % | | | 1.26 | % | | | 0.11 | % | | | 0.66 | % | | | 2.08 | % |
Portfolio turnover rate | | | 32 | %(g) | | | 110 | % | | | 78 | % | | | 67 | % | | | 10 | % | | | 10 | % |
Net assets, end of period (000s) | | $ | 4,777 | | | $ | 3,553 | | | $ | 6,462 | | | $ | 8,263 | | | $ | 5,486 | | | $ | 4,821 | |
| (a) | The Fund changed its fiscal year end from August 31 to December 31. Per share data and total return reflect activity from September 1, 2009 through December 31, 2009. |
| (b) | Per share data was calculated using the average shares outstanding during the period. |
| (c) | Net investment income per share reflects a special dividend. The effect of this dividend amounted to $0.24 per share. |
| (d) | Total return at net asset value assuming all distributions reinvested and no contingent deferred sales charge. |
| (e) | The benefits derived from expense reductions had an impact of less than 0.01%. |
| (f) | Rounds to less than 0.01%. |
See Accompanying Notes to Financial Statements.
15
Financial Highlights – Columbia Real Estate Equity Fund
Selected data for a share outstanding throughout each period is as follows:
| | | | | | | | | | | | | | | | | | | | | | | | |
| | | Period
Ended
December 31, | | | Year Ended August 31, | |
| Class Z Shares | | 2009 (a) | | | 2009 | | | 2008 | | | 2007 | | | 2006 | | | 2005 | |
Net Asset Value, Beginning of Period | | $ | 9.13 | | | $ | 13.88 | | | $ | 20.74 | | | $ | 29.10 | | | $ | 27.86 | | | $ | 25.60 | |
| | | | | | |
Income from Investment Operations: | | | | | | | | | | | | | | | | | | | | | | | | |
Net investment income (b) | | | 0.07 | | | | 0.24 | | | | 0.33 | | | | 0.29 | | | | 0.48 | | | | 0.90 | (c) |
Net realized and unrealized gain (loss) on investments and foreign currency | | | 1.10 | | | | (4.47 | ) | | | (1.10 | ) | | | 1.22 | | | | 4.88 | | | | 4.70 | |
| | | | | | | | | | | | | | | | | | | | | | | | |
Total from investment operations | | | 1.17 | | | | (4.23 | ) | | | (0.77 | ) | | | 1.51 | | | | 5.36 | | | | 5.60 | |
| | | | | | |
Less Distributions to Shareholders: | | | | | | | | | | | | | | | | | | | | | | | | |
From net investment income | | | (0.13 | ) | | | (0.35 | ) | | | (0.19 | ) | | | (0.39 | ) | | | (0.84 | ) | | | (0.82 | ) |
From net realized gains | | | — | | | | — | | | | (5.90 | ) | | | (9.48 | ) | | | (3.28 | ) | | | (2.52 | ) |
From return of capital | | | (0.08 | ) | | | (0.17 | ) | | | — | | | | — | | | | — | | | | — | |
| | | | | | | | | | | | | | | | | | | | | | | | |
Total distributions to shareholders | | | (0.21 | ) | | | (0.52 | ) | | | (6.09 | ) | | | (9.87 | ) | | | (4.12 | ) | | | (3.34 | ) |
| | | | | | |
Net Asset Value, End of Period | | $ | 10.09 | | | $ | 9.13 | | | $ | 13.88 | | | $ | 20.74 | | | $ | 29.10 | | | $ | 27.86 | |
Total return (d) | | | 12.97 | %(g) | | | (29.71 | )% | | | (5.21 | )% | | | 1.95 | % | | | 21.99 | % | | | 22.99 | % |
| | | | | | |
Ratios to Average Net Assets/ Supplemental Data: | | | | | | | | | | | | | | | | | | | | | | | | |
Net expenses before interest expense (e) | | | 1.14 | %(h) | | | 1.06 | % | | | 1.03 | % | | | 0.96 | % | | | 0.94 | % | | | 0.93 | % |
Interest expense | | | — | | | | — | | | | — | %(f) | | | — | %(f) | | | — | %(f) | | | — | |
Net expenses (e) | | | 1.14 | %(h) | | | 1.06 | % | | | 1.03 | % | | | 0.96 | % | | | 0.94 | % | | | 0.93 | % |
Net investment income (e) | | | 2.28 | %(h) | | | 2.96 | % | | | 2.17 | % | | | 1.11 | % | | | 1.78 | % | | | 3.40 | % |
Portfolio turnover rate | | | 32 | %(g) | | | 110 | % | | | 78 | % | | | 67 | % | | | 10 | % | | | 10 | % |
Net assets, end of period (000s) | | $ | 273,528 | | | $ | 238,485 | | | $ | 282,293 | | | $ | 377,388 | | | $ | 578,899 | | | $ | 758,147 | |
| (a) | The Fund changed its fiscal year end from August 31 to December 31. Per share data and total return reflect activity from September 1, 2009 through December 31, 2009. |
| (b) | Per share data was calculated using the average shares outstanding during the period. |
| (c) | Net investment income per share reflects a special dividend. The effect of this dividend amounted to $0.24 per share. |
| (d) | Total return at net asset value assuming all distributions reinvested. |
| (e) | The benefits derived from expense reductions had an impact of less than 0.01%. |
| (f) | Rounds to less than 0.01%. |
See Accompanying Notes to Financial Statements.
16
Notes to Financial Statements – Columbia Real Estate Equity Fund
December 31, 2009
Note 1. Organization
Columbia Real Estate Fund (the “Fund”), a series of Columbia Funds Series Trust I (the “Trust”), is a non-diversified fund. The Trust is registered under the Investment Company Act of 1940, as amended (the “1940 Act”), as an open-end management investment company organized as a Massachusetts business trust.
The Board of Trustees of the Trust approved a proposal to change the fiscal year-end of the Fund from August 31 to December 31. Accordingly, the accompanying financial statements pertain to the period from September 1, 2009 through December 31, 2009.
Investment Objective
The Fund seeks capital appreciation and above-average income by investing, under normal market conditions, at least 80% of its net assets (plus any borrowings for investment purposes) in stocks of companies principally engaged in the real estate industry, including real estate investment trusts (REITs).
Fund Shares
The Trust may issue an unlimited number of shares, and the Fund offers four classes of shares: Class A, Class B, Class C and Class Z. Each share class has its own expense structure and sales charges, as applicable. The Fund no longer accepts investments from new or existing investors in the Fund’s Class B shares, except in connection with the reinvestment of any dividend and/or capital gain distributions in Class B shares of the Fund and exchanges by existing Class B shareholders of the other Columbia Funds.
Class A shares are subject to a maximum front-end sales charge of 5.75% based on the amount of initial investment. Class A shares purchased without an initial sales charge in accounts aggregating $1 million to $50 million at the time of purchase are subject to a 1.00% contingent deferred sales charge (“CDSC”) if the shares are sold within one year after purchase. Class B shares are subject to a maximum CDSC of 5.00% based upon the holding period after purchase. Class B shares will convert to Class A shares eight years after purchase. Class C shares are subject to a 1.00% CDSC on shares sold within one year after purchase. Class Z shares are offered continuously at net asset value. There are certain restrictions on the purchase of Class Z shares, as described in the Fund’s prospectus.
Note 2. Significant Accounting Policies
The preparation of financial statements in accordance with accounting principles generally accepted in the United States of America (“GAAP”) requires management to make certain estimates and assumptions that affect the reported amounts of assets and liabilities, the disclosure of contingent assets and liabilities at the date of the financial statements and the reported amounts of revenue and expenses during the reporting period. Actual results could differ from those estimates.
Management has evaluated the events and transactions that have occurred through February 19, 2010, the date the financial statements were issued, and noted no items requiring adjustment of the financial statements or additional disclosures.
The following is a summary of significant accounting policies consistently followed by the Fund in the preparation of its financial statements.
Security Valuation
Equity securities and securities of certain investment companies are valued at the last sale price on the principal exchange on which they trade, except for securities traded on the NASDAQ, which are valued at the NASDAQ official close price. Unlisted securities or listed securities for which there were no sales during the day are valued at the closing bid price on such exchanges or over-the-counter markets.
Short-term investments maturing in 60 days or less are valued at amortized cost, which approximates market value.
Investments in other open-end investment companies are valued at net asset value.
Investments for which market quotations are not readily available, or that have quotations which management believes are not reliable, are valued at fair value as determined in good faith under consistently applied procedures established by and under the general supervision of the Board of Trustees. If a security is valued at fair value, such value is likely to be different from the last quoted market price for the security. The determination of fair value often requires significant judgment. To determine fair value, management may use assumptions including but not limited to future cash flows and estimated risk premiums. Multiple inputs from various sources may be used to determine value.
17
Columbia Real Estate Equity Fund
December 31, 2009
Management establishes a hierarchy that prioritizes the inputs to valuation techniques used to measure fair value giving the highest priority to unadjusted quoted prices in active markets for identical securities (level 1 measurements) and the lowest priority to unobservable inputs (level 3 measurements) when market prices are not readily available or reliable. The three levels of the fair value hierarchy are described below:
| n | | Level 1 – quoted prices in active markets for identical securities |
| n | | Level 2 – prices determined using other significant observable inputs (including quoted prices for similar securities, interest rates, prepayment speeds, credit risk and others) |
| n | | Level 3 – prices determined using significant unobservable inputs. In situations where quoted prices or observable inputs are unavailable or less reliable, unobservable inputs may be used. Unobservable inputs may include management’s own assumptions about the factors market participants would use in pricing an investment. |
The inputs or methodology used for valuing securities are not necessarily an indication of the risk associated with investing in those securities.
Security Transactions
Security transactions are accounted for on the trade date. Cost is determined and gains (losses) are based upon the specific identification method for both financial statement and federal income tax purposes.
Repurchase Agreements
The Fund may engage in repurchase agreement transactions with institutions that Columbia Management Advisors, LLC (“Columbia”), the Fund’s investment advisor, has determined are creditworthy. The Fund, through its custodian, receives delivery of the underlying securities collateralizing a repurchase agreement. Columbia is responsible for determining that the collateral is at least equal, at all times, to the value of the repurchase obligation including interest. A repurchase agreement transaction involves certain risks in the event of default or insolvency of the counterparty. These risks include possible delays in or restrictions on the Fund’s ability to dispose of the underlying securities and a possible decline in the value of the underlying securities during the period while the Fund seeks to assert its rights.
Income Recognition
Interest income is recorded on the accrual basis. Distributions received from real estate investment trusts (REITs) in excess of their income are recorded as a reduction of the cost of the related investments. If the Fund no longer owns the applicable securities, any distributions received in excess of income are recorded as realized gains.
Expenses
General expenses of the Trust are allocated to the Fund and other series of the Trust based upon relative net assets or other expense allocation methodologies determined by the nature of the expense. Expenses directly attributable to the Fund are charged to the Fund.
Determination of Class Net Asset Value
All income, expenses (other than class-specific expenses, as shown on the Statement of Operations) and realized and unrealized gains (losses) are allocated to each class of the Fund on a daily basis, based on the relative net assets of each class, for purposes of determining the net asset value of each class.
Federal Income Tax Status
The Fund intends to qualify each year as a “regulated investment company” under Subchapter M of the Internal Revenue Code, as amended, and will distribute substantially all of its taxable income, if any, for its tax year, and as such will not be subject to federal income taxes. In addition, the Fund intends to distribute in each calendar year substantially all of its net investment income, capital gains and certain other amounts, if any, such that the Fund should not be subject to federal excise tax. Therefore, no provision is made for federal income or excise taxes.
Distributions to Shareholders
Distributions from net investment income are declared and paid quarterly. Net realized capital gains, if any, are distributed at least annually. Income distributions and capital gain distributions are determined in accordance with federal income tax regulations which may differ from GAAP.
Indemnification
In the normal course of business, the Fund enters into contracts that contain a variety of representations and
18
Columbia Real Estate Equity Fund
December 31, 2009
warranties and which provide general indemnities. The Fund’s maximum exposure under these arrangements is unknown because this would involve future claims against the Fund. Also, under the Trust’s organizational documents and by contract, the Trustees and officers of the Trust are indemnified against certain liabilities that may arise out of actions relating to their duties to the Trust. However, based on experience, the Fund expects the risk of loss due to these representations, warranties and indemnities to be minimal.
Note 3. Federal Tax Information
The timing and character of income and capital gain distributions are determined in accordance with income tax regulations, which may differ from GAAP. Reclassifications are made to the Fund’s capital accounts for permanent tax differences to reflect income and gains available for distribution (or available capital loss carryforwards) under income tax regulations.
For the year ended December 31, 2009, permanent book and tax basis differences resulting primarily from differing treatments for foreign currency transactions and REIT adjustments were identified and reclassified among the components of the Fund’s net assets as follows:
| | | | |
| | | | | |
Overdistributed Net Investment
Income | | Accumulated Net Realized
Loss | | Paid-In
Capital |
| $1,819 | | $(1,819) | | $— |
Net investment income and net realized gains (losses), as disclosed on the Statement of Operations, and net assets were not affected by this reclassification.
The tax character of distributions paid during the four month period ended December 31, 2009 and the year ended August 31, 2009 was as follows:
| | | | | | |
| | | December 31, 2009 | | August 31, 2009 |
Distributions
paid from: | | | | |
Ordinary Income* | | $ | 3,706,092 | | $ | 9,122,180 |
Long-Term Capital Gains | | | — | | | — |
Tax Return of Capital (if any) | | | 2,382,561 | | | 4,695,255 |
| * | For tax purposes short-term capital gain distributions, if any, are considered ordinary income distributions. |
As of December 31, 2009, the components of distributable earnings on a tax basis were as follows:
| | | | |
| | | | | |
Undistributed
Ordinary Income | | Undistributed Long-Term Capital Gains | | Net
Unrealized Appreciation* |
| $ — | | $ — | | $58,645,216 |
| * | The differences between book-basis and tax-basis net unrealized appreciation are primarily due to deferral of losses from wash sales. |
Unrealized appreciation and depreciation at December 31, 2009, based on cost of investments for federal income tax purposes were:
| | | | |
| | | | |
Unrealized appreciation | | $ | 65,083,008 | |
Unrealized depreciation | | | (6,437,792 | ) |
Net unrealized appreciation | | $ | 58,645,216 | |
The following capital loss carryforwards, determined as of December 31, 2009, may be available to reduce taxable income arising from future net realized gains on investments, if any, to the extent permitted by the Internal Revenue Code:
| | |
| | | |
| Year of Expiration | | Capital Loss Carryforwards |
| 2016 | | $ 2,766,637 |
| 2017 | | 49,528,562 |
| Total | | $52,295,199 |
Management is required to determine whether a tax position of the Fund is more likely than not to be sustained upon examination by the applicable taxing authority, including resolution of any related appeals or litigation processes, based on the technical merits of the position. The tax benefit to be recognized by the Fund is measured as the largest amount of benefit that is greater than fifty percent likely of being realized upon ultimate settlement. Management is not aware of any tax positions for which it is reasonably possible that the total amounts of unrecognized tax benefits will significantly change in the next twelve months. However, management’s conclusions may be subject to review and adjustment at a later date based on factors including, but not limited to, new tax laws, regulations, and administrative interpretations (including relevant court decisions). The Fund’s federal tax returns for the prior three fiscal years remain subject to examination by the Internal Revenue Service.
19
Columbia Real Estate Equity Fund
December 31, 2009
Note 4. Fees and Compensation Paid to Affiliates
Investment Advisory Fee
Columbia, an indirect, wholly owned subsidiary of Bank of America Corporation (“BOA”), provides investment advisory, administrative and other services to the Fund. In rendering investment advisory services to the Fund, Columbia may use the portfolio management and research resources of Columbia Management Pte. Ltd, an affiliate of Columbia. Columbia receives a monthly investment advisory fee at the annual rate of 0.75% of the Fund’s average daily net assets.
Bank of America, N.A., an indirect parent company of Columbia, entered into an agreement dated September 29, 2009 to sell a portion of the asset management business of Columbia Management Group, LLC to Ameriprise Financial, Inc. The transaction (“Transaction”) includes the sale of the part of the asset management business that advises long-term mutual funds, including the Fund. The Transaction is subject to certain approvals and other conditions to closing, and is currently expected to close in the spring of 2010.
Pricing and Bookkeeping Fees
The Fund has entered into a Financial Reporting Services Agreement (the “Financial Reporting Services Agreement”) with State Street Bank and Trust Company (“State Street”) and Columbia pursuant to which State Street provides financial reporting services to the Fund. The Fund has also entered into an Accounting Services Agreement (collectively with the Financial Reporting Services Agreement, the “State Street Agreements”) with State Street and Columbia pursuant to which State Street provides accounting services to the Fund. Under the State Street Agreements, the Fund pays State Street an annual fee of $38,000 paid monthly plus an additional monthly fee based on an annualized percentage rate of average daily net assets of the Fund for the month. The aggregate fee will not exceed $140,000 per year (exclusive of out-of-pocket expenses and charges). The Fund also reimburses State Street for certain out-of-pocket expenses and charges.
The Fund has entered into a Pricing and Bookkeeping Oversight and Services Agreement (the “Services Agreement”) with Columbia. Under the Services Agreement, Columbia provides services related to Fund expenses and the requirements of the Sarbanes-Oxley Act of 2002, and provides oversight of the accounting and financial reporting services provided by State Street. Under the Services Agreement, the Fund reimburses Columbia for out-of-pocket expenses.
Transfer Agent Fee
Columbia Management Services, Inc. (the “Transfer Agent”), an affiliate of Columbia and an indirect, wholly owned subsidiary of BOA, provides shareholder services to the Fund and has contracted with Boston Financial Data Services (“BFDS”) to serve as sub-transfer agent. Effective November 1, 2009, the Transfer Agent is entitled to receive a fee for its services, paid monthly, at the annual rate of $22.36 per account plus reimbursement of certain sub-transfer agent fees paid by the Transfer Agent (exclusive of BFDS fees), calculated based on assets held in omnibus accounts and intended to recover the cost of payments to other parties (including affiliates of BOA) for services to those accounts. Prior to November 1, 2009, the annual rate was $17.34 per account. The Transfer Agent pays the fees of BFDS for services as sub-transfer agent and is not entitled to reimbursement for such fees from the Fund.
The Transfer Agent may also retain, as additional compensation for its services, fees for wire, telephone and redemption orders, Individual Retirement Account (“IRA”) trustee agent fees and account transcript fees due to the Transfer Agent from shareholders of the Fund and credits (net of bank charges) earned with respect to balances in accounts the Transfer Agent maintains in connection with its services to the Fund. The Transfer Agent also receives reimbursement for certain out-of-pocket expenses.
An annual minimum account balance fee of $20 may apply to certain accounts with a value below the Fund’s initial minimum investment requirements to reduce the impact of small accounts on transfer agent fees. These minimum account balance fees are recorded as part of expense reductions on the Statement of Operations. For the four month period ended December 31, 2009, no minimum account balance fees were charged by the Fund.
Underwriting Discounts, Service and Distribution Fees
Columbia Management Distributors, Inc. (the “Distributor”), an affiliate of Columbia and an indirect, wholly owned subsidiary of BOA, is the principal underwriter of the Fund’s shares. For the four month period ended December 31, 2009,
20
Columbia Real Estate Equity Fund
December 31, 2009
the Distributor has retained net underwriting discounts of $3,518 on sales of the Fund’s Class A shares and received net CDSC fees of $2,585 and $431 on Class B and Class C share redemptions, respectively.
The Fund has adopted distribution and shareholder servicing plans (the “Plans”) pursuant to Rule 12b-1 under the 1940 Act for Class A, Class B and Class C shares, which require the payment of distribution and service fees. The fees are intended to compensate the Distributor and/or eligible selling and/or servicing agents for selling shares of the Fund and providing services to investors.
Payments under the Plans, which are calculated daily and paid monthly, are based on the average daily net assets of the applicable class of the Fund at the following annual rates:
| | | | | | | | | | |
| Distribution Fee | | Service Fee |
| Class A(a) | | Class B | | Class C | | Class A(a) | | Class B | | Class C |
| 0.10% | | 0.75% | | 0.75% | | 0.25% | | 0.25% | | 0.25% |
| (a) | The Fund may pay distribution and service fees up to a maximum of 0.35% of the Fund’s average daily net assets attributable to Class A shares (comprised of up to 0.10% for distribution services and 0.25% for shareholder liaison services), but currently limits such fees to an aggregate fee of not more than 0.25% of the Fund’s average daily net assets attributable to Class A shares. |
Fee Waivers and Expense Reimbursements
Columbia has voluntarily agreed to reimburse a portion of the Fund’s expenses so that the Fund’s ordinary operating expenses (excluding any distribution and service fees, brokerage commissions, interest, taxes and extraordinary expenses, but including custodian charges relating to overdrafts, if any), after giving effect to any balance credits from the Fund’s custodian, do not exceed 1.20% of the Fund’s average daily net assets on an annualized basis. Columbia, in its discretion, may revise or discontinue this arrangement at any time.
Fees Paid to Officers and Trustees
All officers of the Fund are employees of Columbia or its affiliates and, with the exception of the Fund’s Chief Compliance Officer, receive no compensation from the Fund. The Board of Trustees has appointed a Chief Compliance Officer to the Fund in accordance with federal securities regulations. The Fund, along with other affiliated funds, pays its pro-rata share of the expenses associated with the Chief Compliance Officer. The Fund’s expenses for the Chief Compliance Officer will not exceed $15,000 per year.
The Trust’s eligible Trustees may participate in a deferred compensation plan which may be terminated at any time. Obligations of the plan will be paid solely out of the Fund’s assets.
Note 5. Custody Credits
The Fund has an agreement with its custodian bank under which custody fees may be reduced by balance credits. These credits are recorded as part of expense reductions on the Statement of Operations. The Fund could have invested a portion of the assets utilized in connection with the expense offset arrangement in an income-producing asset if it had not entered into such an agreement.
For the four month period ended December 31, 2009, these custody credits reduced total expenses by $1 for the Fund.
Note 6. Portfolio Information
For the four month period ended December 31, 2009, the cost of purchases and proceeds from sales of securities, excluding short-term obligations, for the Fund were $90,539,093 and $86,213,243, respectively.
Note 7. Line of Credit
The Fund and other affiliated funds participate in a $280,000,000 committed, unsecured revolving line of credit provided by State Street. The maximum amount that may be borrowed by any fund is limited to the lesser of $200,000,000 and the Fund’s borrowing limit set forth in the Fund’s registration statement. Borrowings are available for short-term liquidity or temporary or emergency purposes.
Effective October 15, 2009, interest is charged to each participating fund based on the fund’s borrowings at a rate per annum equal to the greater of the Federal Funds Rate plus 1.25% or the overnight LIBOR Rate plus 1.25%. In addition, a commitment fee of 0.15% per annum is accrued and apportioned among the participating funds pro rata based on their relative net assets.
Prior to October 15, 2009, interest was charged to each participating fund based on the fund’s borrowings at a rate per annum equal to the greater of the Federal Funds Rate plus 0.50% or the overnight LIBOR Rate plus 0.50%. In addition, an annual operations agency fee of $20,000, an amendment fee of 0.02% and a commitment fee of 0.12% per annum were accrued and apportioned among the participating funds pro rata based on their relative net assets.
21
Columbia Real Estate Equity Fund
December 31, 2009
For the four month period ended December 31, 2009, the Fund did not borrow under these arrangements.
Note 8. Shares of Beneficial Interest
As of December 31, 2009, 37.4% of the Fund’s shares outstanding were beneficially owned by one participant account over which BOA and/or any of its affiliates had either sole or joint investment discretion.
As of December 31, 2009, the Fund had one shareholder that held 23.2% of the shares outstanding, over which BOA and/or any of its affiliates did not have investment discretion.
Subscription and redemption activity of these accounts may have a significant effect on the operations of the Fund.
Note 9. Significant Risks and Contingencies
Non-Diversified Mutual Fund Risk
The Fund is a non-diversified fund, which generally means that it may invest a greater percentage of its total assets in the securities of fewer issuers than a “diversified” fund. This increases the risk that a change in the value of any one investment held by the Fund could affect the overall value of the Fund more than it would affect that of a diversified fund holding a greater number of investments. Accordingly, the Fund’s value will likely be more volatile than the value of more diversified funds. The Fund may not operate as a non-diversified fund at all times.
Sector Focus Risk
The Fund may focus its investments in certain sectors, subjecting it to greater risk than a fund that is less focused.
Real Estate Sector Risk
Interests held in REITs and other companies principally engaged in the real estate industry are subject to risks similar to those of direct investments in real estate. These risks include fluctuating property values, locally, regionally and nationally, which are affected by various factors including interest rates, property taxes, operating expenses, occupancy rates, environmental regulations and contamination, availability of credit, uninsured casualty and condemnation. The value of REITs and other companies principally engaged in the real estate industry are also affected by, among other factors, changes in the prospect for earnings and/or cash flow growth of the REIT or such real estate-related company itself. Because the value of REITs and real estate-related companies may fluctuate widely in response to changes in factors affecting the real estate markets, the value of an investment in the Fund may be more volatile than the value of an investment in a fund that is invested in a more diverse range of market sectors.
Legal Proceedings
Columbia Management Advisors, LLC and Columbia Management Distributors, Inc. (collectively, the “Columbia Group”) are subject to a settlement agreement with the New York Attorney General (“NYAG”) (the “NYAG Settlement”) and a settlement order with the Securities and Exchange Commission (“SEC”) (the “SEC Order”) on matters relating to mutual fund trading, each dated February 9, 2005. Under the terms of the SEC Order, the Columbia Group (or predecessor entities) agreed, among other things, to: pay disgorgement and civil money penalties collectively totaling $140 million; cease and desist from violations of the antifraud provisions and certain other provisions of the federal securities laws; maintain certain compliance and ethics oversight structures; and retain an independent consultant to review the Columbia Group’s applicable supervisory, compliance, control and other policies and procedures. The NYAG Settlement, among other things, requires Columbia Management Advisors, LLC and its affiliates to make certain disclosures to investors relating to expenses. In connection with the Columbia Group providing services to the Columbia Funds, the Columbia Funds have voluntarily undertaken to implement certain governance measures designed to maintain the independence of their boards of trustees and certain special consulting and compliance measures.
Pursuant to the SEC Order and related procedures, the $140 million in settlement amounts described above has been substantially distributed in accordance with a distribution plan that was developed by an independent distribution consultant and approved by the SEC on April 6, 2007.
In connection with the events described above, various parties have filed suit against certain funds, the Trustees of the Columbia Funds, FleetBoston Financial Corporation and its affiliated entities and/or Bank of America and its affiliated entities.
On February 20, 2004, the Judicial Panel on Multidistrict Litigation transferred these cases and cases against other
22
Columbia Real Estate Equity Fund
December 31, 2009
mutual fund companies based on similar allegations to the United States District Court in Maryland for consolidated or coordinated pretrial proceedings (the “MDL”). Subsequently, additional related cases were transferred to the MDL. On September 29, 2004, the plaintiffs in the MDL filed amended and consolidated complaints. One of these amended complaints is a putative class action that includes claims under the federal securities laws and state common law, and that names Columbia Management Advisors, Inc. (which has since merged into Banc of America Capital Management, LLC (now named Columbia Management Advisors, LLC)) (“Columbia”), Columbia Funds Distributor, Inc. (now named Columbia Management Distributors, Inc.) (the “Distributor”), the Trustees of the Columbia Funds, Bank of America Corporation and others as defendants. Another of the amended complaints is a derivative action purportedly on behalf of the Columbia Funds that asserts claims under federal securities laws and state common law.
On February 25, 2005, Columbia and other defendants filed motions to dismiss the claims in the pending cases. On March 1, 2006, for reasons stated in the court’s memoranda dated November 3, 2005, the United States District Court for the District of Maryland granted in part and denied in part the defendants’ motions to dismiss. The court dismissed all of the class action claims pending against the Columbia Funds Trusts. As to Columbia and the Distributor, the claims under the Securities Act of 1933, the claims under Sections 34(b) and 36(a) of the Investment Company Act of 1940 (“ICA”) and the state law claims were dismissed. The claims under Sections 10(b) and 20(a) of the Securities Exchange Act of 1934 and claims under Section 36(b) of the ICA were not dismissed.
On March 21, 2005, a purported class action was filed in Massachusetts state court alleging that certain conduct, including market timing, entitled Class B shareholders in certain Columbia Funds to an exemption from contingent deferred sales charges upon early redemption (the “CDSC Lawsuit”). The CDSC Lawsuit was removed to federal court in Massachusetts and transferred to the MDL.
On September 14, 2007, the plaintiffs and the Columbia defendants named in the MDL, including the Columbia Funds, entered into a stipulation of settlement with respect to all Columbia-related claims in the MDL described above, including the CDSC Lawsuit. The settlement is subject to court approval.
Note 10. Business Combinations and Mergers
As of March 24, 2008, Real Estate Fund, a series of Excelsior Funds, Inc., merged into Columbia Real Estate Equity Fund. Columbia Real Estate Equity Fund received a tax-free transfer of assets from Excelsior Real Estate Fund as follows:
| | | | |
| | | | | |
Class Z
Shares Issued | | Net Assets Received | | Unrealized Depreciation1 |
| 1,924,145 | | $25,873,534 | | $(1,417,264) |
| | | | | |
| | | | | |
Net Assets of Columbia
Real Estate
Equity Fund Immediately Prior to Combination | | Net Assets of Real Estate
Fund
Immediately Prior to
Combination | | Net Assets of
Columbia
Real Estate
Equity Fund
Immediately After
Combination |
| $294,500,389 | | $25,873,534 | | $320,373,923 |
| 1 | Unrealized depreciation is included in the Net Assets Received. |
23
Report of Independent Registered Public Accounting Firm
To the Trustees of the Columbia Funds Series Trust I and the Shareholders of Columbia Real Estate Equity Fund
In our opinion, the accompanying statement of assets and liabilities, including the investment portfolio, and the related statements of operations and of changes in net assets and the financial highlights present fairly, in all material respects, the financial position of Columbia Real Estate Equity Fund (the “Fund”) (a series of Columbia Funds Series Trust I), at December 31, 2009, the results of its operations for the period from September 1, 2009 to December 31, 2009 and the twelve month period ended August 31, 2009, the changes in its net assets for the periods presented and the financial highlights for the period from September 1, 2009 to December 31, 2009 and for each of the fiscal years presented in the period from September 1, 2004 to August 31, 2009, in conformity with accounting principles generally accepted in the United States of America. These financial statements and financial highlights (hereafter referred to as “financial statements”) are the responsibility of the Fund’s management. Our responsibility is to express an opinion on these financial statements based on our audits. We conducted our audits of these financial statements in accordance with the standards of the Public Company Accounting Oversight Board (United States). Those standards require that we plan and perform the audit to obtain reasonable assurance about whether the financial statements are free of material misstatement. An audit includes examining, on a test basis, evidence supporting the amounts and disclosures in the financial statements, assessing the accounting principles used and significant estimates made by management, and evaluating the overall financial statement presentation. We believe that our audits, which included confirmation of securities at December 31, 2009 by correspondence with the custodian and brokers, provide a reasonable basis for our opinion.
PricewaterhouseCoopers LLP
Boston, Massachusetts
February 19, 2010
24
Federal Income Tax Information (Unaudited) – Columbia Real Estate Equity Fund
6.20% of the ordinary income distributed by the Fund for the fiscal year ended December 31, 2009, qualifies for the corporate dividends received deduction.
For non-corporate shareholders, 7.73% or the maximum amount allowable under the Jobs and Growth Tax Relief Reconciliation Act of 2003, of the ordinary income distributed by the Fund for the fiscal year ended December 31, 2009 may represent qualified dividend income.
The Fund will notify shareholders in February 2010 of amounts for use in preparing 2009 income tax returns.
25
Fund Governance
The Trustees serve terms of indefinite duration. The names, addresses and ages of the Trustees and Officers of the Funds in the Columbia Funds Series Trust I, the year each was first elected or appointed to office, their principal business occupations during at least the last five years, the number of Funds overseen by each Trustee and other directorships they hold are shown below. Each officer listed below serves as an officer of each Fund in the Columbia Funds Complex.
Independent Trustees
| | |
Name, Address and Year of
Birth, Position with Funds, Year
First Elected or Appointed to Office | | Principal Occupation(s) During Past Five Years, Number of Funds in the
Columbia Funds Complex Overseen by Trustee, Other Directorships Held |
| |
| John D. Collins (Born 1938) | | |
c/o Columbia Management Advisors, LLC One Financial Center Boston, MA 02111 Trustee (since 2007) | | Retired. Consultant, KPMG, LLP (accounting and tax firm) from July 1999 to June 2000; Partner, KPMG, LLP from March 1962 to June 1999. Oversees 66; Mrs. Fields Famous Brands LLC (consumer products); Suburban Propane Partners, L.P.; and Montpelier Re (insurance underwriting firm) |
| |
| Rodman L. Drake (Born 1943) | | |
c/o Columbia Management Advisors, LLC One Financial Center Boston, MA 02111 Trustee (since 2007) and Chairman of the Board (since 2009) | | Co-Founder of Baringo Capital LLC (private equity) since 2002; President, Continuation Investments Group, Inc. from 1997 to 2001. Oversees 66; Jackson Hewitt Tax Service Inc. (tax preparation services); Crystal Capital River Inc. (real estate investment trust); Student Loan Corporation (student loan provider); Celgene Corporation (global biotechnology company); and The Helios Funds (exchange-traded funds) |
| |
| Douglas A. Hacker (Born 1955) | | |
c/o Columbia Management Advisors, LLC One Financial Center Boston, MA 02111 Trustee (since 1996) | | Independent business executive since May 2006; Executive Vice President–Strategy of United Airlines (airline) from December 2002 to May 2006; President of UAL Loyalty Services (airline marketing company) from September 2001 to December 2002; Executive Vice President and Chief Financial Officer of United Airlines from July 1999 to September 2001. Oversees 66; Nash Finch Company (food distributor); Aircastle Limited (aircraft leasing) |
|
| Janet Langford Kelly (Born 1957) |
c/o Columbia Management Advisors, LLC One Financial Center Boston, MA 02111 Trustee (since 1996) | | Senior Vice President, General Counsel and Corporate Secretary, ConocoPhillips (integrated energy company) since September 2007; Deputy General Counsel–Corporate Legal Services, ConocoPhillips from August 2006 to August 2007; Partner, Zelle, Hofmann, Voelbel, Mason & Gette LLP (law firm) from March 2005 to July 2006; Adjunct Professor of Law, Northwestern University, from September 2004 to June 2006; Director, UAL Corporation (airline) from February 2006 to July 2006; Oversees 66; None |
| |
| Charles R. Nelson (Born 1942) | | |
c/o Columbia Management Advisors, LLC One Financial Center Boston, MA 02111 Trustee (since 1981) | | Professor of Economics, University of Washington, since January 1976; Ford and Louisa Van Voorhis Professor of Political Economy, University of Washington, since September 1993; Adjunct Professor of Statistics, University of Washington, since September 1980; Associate Editor, Journal of Money Credit and Banking, 1993-2008 Consultant on econometric and statistical matters. Oversees 66; None |
26
Fund Governance (continued)
Independent Trustees (continued)
| | |
Name, Address and Year of
Birth, Position with Funds, Year
First Elected or Appointed to Office | | Principal Occupation(s) During Past Five Years, Number of Funds in the
Columbia Funds Complex Overseen by Trustee, Other Directorships Held |
| |
| John J. Neuhauser (Born 1943) | | |
c/o Columbia Management Advisors, LLC One Financial Center Boston, MA 02111 Trustee (since 1985) | | President, Saint Michael’s College, since August 2007; University Professor, Boston College from November 2005 to August 2007; Academic Vice President and Dean of Faculties, Boston College from August 1999 to October 2005. Oversees 66; Liberty All-Star Equity Fund and Liberty All-Star Growth Fund, Inc. (closed-end funds) |
| |
| Jonathan Piel (Born 1938) | | |
c/o Columbia Management Advisors, LLC One Financial Center Boston, MA 02111 Trustee (since 2007) | | Cable television producer and website designer; The Editor, Scientific American from 1984 to 1994; Vice President, Scientific American, Inc., from 1984 to 1994; Member, Advisory Board, Stone Age Institute, Bloomington, Indiana (research institute that explores the effect of technology on human evolution); Member, Board of Directors of the National Institute of Social Sciences, New York City; Member, Board of Trustees of the William Alanson White Institute, New York City (institution for training psychoanalysts); and Member, Advisory Board, Mount Sinai Children’s Environmental Health Center, New York. Oversees 66; None |
| |
| Patrick J. Simpson (Born 1944) | | |
c/o Columbia Management Advisors, LLC One Financial Center Boston, MA 02111 Trustee (since 2000) | | Partner, Perkins Coie LLP (law firm). Oversees 66; None |
|
| Thomas C. Theobald (Born 1937) |
c/o Columbia Management Advisors, LLC One Financial Center Boston, MA 02111 Trustee (since 1996) | | Partner and Senior Advisor, Chicago Growth Partners (private equity investing) since September 2004; Managing Director, William Blair Capital Partners (private equity investing) from September 1994 to September 2004. Oversees 66; Anixter International (network support equipment distributor); Ventas, Inc. (real estate investment trust); Jones Lang LaSalle (real estate management services); Ambac Financial Group (financial guaranty insurance) |
| |
| Anne-Lee Verville (Born 1945) | | |
c/o Columbia Management Advisors, LLC One Financial Center Boston, MA 02111 Trustee (since 1998) | | Retired since 1997 (formerly General Manager–Global Education Industry (from 1994 to 1997), President–Application Systems Division (from 1991 to 1994), Chief Financial Officer–US Marketing & Services (from 1988 to 1991), and Chief Information Officer (from 1987 to 1988), IBM Corporation (computer and technology)). Oversees 66; None |
27
Fund Governance (continued)
Interested Trustee
| | |
Name, Address and Year of Birth,
Position with Funds, Year First
Elected or Appointed to Office | | Principal Occupation(s) During Past Five Years, Number of Funds in the Columbia
Funds Complex Overseen by Trustee, Other Directorships Held |
| |
| William E. Mayer1 (Born 1940) | | |
c/o Columbia Management Advisors, LLC One Financial Center Boston, MA 02111 Trustee (since 1994) | | Partner, Park Avenue Equity Partners (private equity) since February 1999; Dean and Professor, College of Business, University of Maryland from 1992 to 1997. Oversees 66; Lee Enterprises (print media), WR Hambrecht + Co. (financial service provider); BlackRock Kelso Capital Corporation (investment company) |
| 1 | The Funds currently treat Mr. Mayer as an “interested person” (as defined in the Investment Company Act of 1940) by reason of his affiliation with WR Hambrecht + Co., a registered broker/dealer that may execute portfolio transactions for or engage in principal transactions with the Funds or other funds or accounts advised/managed by the Advisor or other Bank of America affiliates. |
The Statement of Additional Information includes additional information about the Trustees of the Funds and is available, without charge, upon request by calling 1-800-345-6611.
28
Fund Governance (continued)
Officers
| | |
Name, Address and Year of Birth,
Position with Funds, Year First
Elected or Appointed to Office | | Principal Occupation(s) During Past Five Years |
|
| J. Kevin Connaughton (Born 1964) |
One Financial Center Boston, MA 02111 President (since 2009) | | Managing Director of Columbia Management Advisors, LLC since December 2004; Senior Vice President and Chief Financial Officer–Columbia Funds, from June 2008 to January 2009; Treasurer–Columbia Funds, from October 2003 to May 2008; Treasurer–the Liberty Funds, Stein Roe Funds and Liberty All-Star Funds, December 2000–December 2006; Senior Vice President–Columbia Management Advisors, LLC, from April 2003 to December 2004; President–Columbia Funds, Liberty Funds and Stein Roe Funds, February 2004 to October 2004; Treasurer–Galaxy Funds, September 2002 to December 2005; Treasurer, December 2002 to December 2004, and President, February 2004 to December 2004–Columbia Management Multi-Strategy Hedge Fund, LLC; and a senior officer of various other Bank of America-affiliated entities, including other registered and unregistered funds. |
|
| James R. Bordewick, Jr. (Born 1959) |
One Financial Center Boston, MA 02111 Senior Vice President, Secretary and Chief Legal Officer (since 2006) | | Associate General Counsel, Bank of America since April 2005; Senior Vice President and Associate General Counsel, MFS Investment Management (investment management) prior to April 2005. |
| |
| Linda J. Wondrack (Born 1964) | | |
One Financial Center Boston, MA 02111 Senior Vice President and Chief Compliance Officer (since 2007) | | Director (Columbia Management Group LLC and Investment Product Group Compliance), Bank of America since June 2005; Director of Corporate Compliance and Conflicts Officer, MFS Investment Management (investment management), August 2004 to May 2005; Managing Director, Deutsche Asset Management (investment management) prior to August 2004. |
| |
| Michael G. Clarke (Born 1969) | | |
One Financial Center Boston, MA 02111 Senior Vice President and Chief Financial Officer (since 2009) | | Director of Fund Administration of the Advisor since January 2006; Managing Director of the Advisor September 2004 to December 2005; Vice President Fund Administration June 2002 to September 2004. |
| |
| Jeffrey R. Coleman (Born 1969) | | |
One Financial Center Boston, MA 02111 Deputy Treasurer (since 2006) | | Director of Fund Administration of the Advisor since January 2006; Fund Controller of the Advisor from October 2004 to January 2006; Vice President of CDC IXIS Asset Management Services, Inc. (investment management) from August 2000 to September 2004. |
| |
| Joseph F. DiMaria (Born 1968) | | |
One Financial Center Boston, MA 02111 Chief Accounting Officer and Treasurer (since 2009) | | Director of Fund Administration of the Advisor since January 2006; Head of Tax/Compliance and Assistant Treasurer of the Advisor from November 2004 to December 2005; Director of Trustee Administration (Sarbanes-Oxley) of the Advisor from May 2003 to October 2004. |
29
Fund Governance (continued)
Officers (continued)
| | |
Name, Address and Year of Birth,
Position with Funds, Year First
Elected or Appointed to Office | | Principal Occupation(s) During Past Five Years |
| |
| Julian Quero (Born 1967) | | |
One Financial Center Boston, MA 02111 Deputy Treasurer (since 2008) | | Senior Tax Manager of the Advisor since August 2006; Senior Compliance Manager of the Advisor from April 2002 to August 2006. |
| |
| Barry S. Vallan (Born 1969) | | |
One Financial Center Boston, MA 02111 Controller (since 2006) | | Vice President–Fund Treasury of the Advisor since October 2004; Vice President–Trustee Reporting of the Advisor from April 2002 to October 2004. |
| |
| Stephen T. Welsh (Born 1957) | | |
One Financial Center Boston, MA 02111 Vice President (since 1996) | | President, Columbia Management Services, Inc. since July 2004; Senior Vice President and Controller, Columbia Management Services, Inc. prior to July 2004. |
30
-
Board Consideration and Approval of Advisory Agreements
The Advisory Fees and Expenses Committee of the Board of Trustees meets several times annually to review the advisory agreements (collectively, the ���Agreements”) of the funds for which the Trustees serve as trustees (each a “fund”) and to determine whether to recommend that the full Board approve the continuation of the Agreements for an additional one-year period. After the Committee has made its recommendation, the full Board, including the Independent Trustees, determines whether to approve the continuation of the Agreements. In addition, the full Board, including the Independent Trustees, considers matters bearing on the Agreements at most of its other meetings throughout the year and meets regularly with senior management of the funds and Columbia, the funds’ investment adviser, including the senior manager of each investment area within Columbia. Through the Board’s Investment Oversight Committees, Trustees also meet with selected fund portfolio managers, research analysts and traders at various times throughout the year.
The Trustees receive and review all materials that they, their legal counsel or Columbia believe to be reasonably necessary for the Trustees to evaluate the Agreements and to determine whether to approve the continuation of the Agreements. Those materials generally include, among other items, (i) information on the investment performance of each fund relative to the performance of peer groups of mutual funds and the fund’s performance benchmarks, and additional information assessing performance on a risk-adjusted basis, (ii) information on each fund’s advisory fees and other expenses, including information comparing the fund’s expenses to those of peer groups of mutual funds and information about any applicable expense caps and fee “breakpoints,” (iii) information about the profitability of the Agreements to Columbia, including potential “fall-out” or ancillary benefits that Columbia and its affiliates may receive as a result of their relationships with the funds and (iv) information obtained through Columbia’s response to a questionnaire prepared at the request of the Trustees by counsel to the funds and independent legal counsel to the Independent Trustees. The Trustees also consider other information such as (v) Columbia’s financial results and financial condition, (vi) each fund’s investment objective and strategies and the size, education and experience of Columbia’s investment staffs and their use of technology, external research and trading cost measurement tools, (vii) the allocation of the funds’ brokerage and the use of “soft” commission dollars to pay for research products and services, (viii) Columbia’s resources devoted to, and its record of compliance with, the funds’ investment policies and restrictions, policies on personal securities transactions and other compliance policies and legal and regulatory requirements, (ix) Columbia’s response to various legal and regulatory proceedings since 2003 and to the recent period of volatility in the securities markets and (x) the economic outlook generally and for the mutual fund industry in particular. In addition, the Advisory Fees and Expenses Committee confers with the funds’ independent fee consultant and reviews materials relating to the funds’ relationships with Columbia provided by the independent fee consultant. Throughout the process, the Trustees have the opportunity to ask questions of and to request additional materials from Columbia and to consult with the independent fee consultant and independent legal counsel to the Independent Trustees.
The Board of Trustees most recently approved the continuation of the Agreements at its October, 2009 meeting, following meetings of the Advisory Fees and Expenses Committee held in December, 2008 and February, May, June, August, September and October, 2009. In considering whether to approve the continuation of the Agreements, the Trustees, including the Independent Trustees, did not identify any single factor as determinative, and each weighed various factors as he or she deemed appropriate. The Trustees considered the following matters in connection with their approval of the continuation of the Agreements:
The nature, extent and quality of the services provided to the funds under the Agreements. The Trustees considered the nature, extent and quality of the services provided by Columbia and its affiliates to the funds and the resources dedicated to the funds by Columbia and its affiliates. Among other things, the Trustees considered (i) Columbia’s ability (including its personnel and other resources, compensation programs for personnel involved in fund management, reputation and other attributes) to attract, motivate and retain highly qualified research, advisory and supervisory investment professionals; (ii) the portfolio management services provided by those investment professionals; and (iii) the trade execution services provided on behalf of the funds. For each fund, the Trustees also considered the benefits to shareholders of investing in a mutual fund that is part of a
31
family of funds offering exposure to a variety of asset classes and investment disciplines and providing a variety of fund and shareholder services. After reviewing those and related factors, the Trustees concluded, within the context of their overall conclusions regarding each of the Agreements, that the nature, extent and quality of services provided supported the continuation of the Agreements.
Investment performance of the funds and Columbia. The Trustees reviewed information about the performance of each fund over various time periods, including information prepared by an independent third-party data provider that compared the performance of each fund to the performance of peer groups of mutual funds and performance benchmarks. The Trustees also reviewed a description of the third party’s methodology for identifying each fund’s peer group for purposes of performance and expense comparisons. The Trustees also considered additional information that the Advisory Fees and Expenses Committee requested from Columbia relating to funds that presented relatively weaker performance and/or relatively higher fees or expenses. In the case of each fund whose performance lagged that of a relevant peer group for certain (although not necessarily all) periods, the Trustees concluded that other factors relevant to performance were sufficient, in light of other considerations, to warrant continuation of the fund’s Agreements. Those factors varied from fund to fund, but included one or more of the following: (i) that the fund’s performance, although lagging in certain recent periods, was stronger over the longer term; (ii) that the underperformance was attributable, to a significant extent, to investment decisions that were reasonable and consistent with the fund’s investment strategy and policies and that the fund was performing within a reasonable range of expectations, given those investment decisions, market conditions and the fund’s investment strategy; (iii) that the fund’s performance was competitive when compared to other relevant performance benchmarks or peer groups; (iv) that Columbia had taken or was taking steps designed to help improve the fund’s investment performance, including, but not limited to, replacing portfolio managers or modifying investment strategies; and (v) that Columbia proposed to waive advisory fees or cap the expenses of the fund.
The Trustees noted that, through April 30, 2009, Columbia Real Estate Equity Fund’s performance was in the first quintile (where the best performance would be in the first quintile) for the one- and three-year periods, and in the second quintile for the five- and ten-year periods, of the peer group selected by an independent third-party data provider for purposes of performance comparisons.
The Trustees also considered Columbia’s performance and reputation generally, the funds’ performance as a fund family generally, and Columbia’s historical responsiveness to Trustee concerns about performance and Columbia’s willingness to take steps intended to improve performance. After reviewing those and related factors, the Trustees concluded, within the context of their overall conclusions regarding each of the Agreements, that the performance of each fund and Columbia was sufficient, in light of other considerations, to warrant the continuation of the Agreement(s) pertaining to that fund.
The costs of the services provided and profits realized by Columbia and its affiliates from their relationships with the funds. The Trustees considered the fees charged to the funds for advisory services as well as the total expense levels of the funds. That information included comparisons (provided by management and by an independent third-party data provider) of each fund’s advisory fees and total expense levels to those of the fund’s peer groups and information about the advisory fees charged by Columbia to comparable institutional accounts. In considering the fees charged to those accounts, the Trustees took into account, among other things, management’s representations about the differences between managing mutual funds as compared to other types of accounts, including differences in the services provided, differences in the risk profile of such business for Columbia, and the additional resources required to manage mutual funds effectively. In evaluating each fund’s advisory fees, the Trustees also took into account the demands, complexity and quality of the investment management of the fund. The Trustees considered existing advisory fee breakpoints, and Columbia’s use of advisory fee waivers and expense caps, which benefited a number of the funds. The Trustees also noted management’s stated justification for the fees charged to the funds, which included information about the investment performance of the funds and the services provided to the funds.
The Trustees considered that Columbia Real Estate Equity Fund’s total expenses were in the first quintile and actual management fees were in the second quintile (where the
32
lowest fees and expenses would be in the first quintile) of the peer group selected by an independent third-party data provider for purposes of expense comparisons.
The Trustees also considered the compensation directly or indirectly received by Columbia and its affiliates from their relationships with the funds. The Trustees reviewed information provided by management as to the profitability to Columbia and its affiliates of their relationships with each fund, and information about the allocation of expenses used to calculate profitability. When reviewing profitability, the Trustees also considered court cases in which adviser profitability was an issue in whole or in part, the performance of the relevant funds, the expense level of each fund, and whether Columbia had implemented breakpoints and/or expense caps with respect to the fund.
After reviewing those and related factors, the Trustees concluded, within the context of their overall conclusions regarding each of the Agreements, that the advisory fees charged to each fund, and the related profitability to Columbia and its affiliates of their relationships with the fund, supported the continuation of the Agreement(s) pertaining to that fund.
Economies of Scale. The Trustees considered the existence of any economies of scale in the provision by Columbia of services to each fund, to groups of related funds, and to Columbia’s investment advisory clients as a whole and whether those economies were shared with the funds through breakpoints in the investment advisory fees or other means, such as fee waivers/expense reductions and additional investments by Columbia in investment, trading and compliance resources. The Trustees noted that many of the funds benefited from breakpoints, fee waivers/expense caps, or both. In considering those issues, the Trustees also took note of the costs of the services provided (both on an absolute and a relative basis) and the profitability to Columbia and its affiliates of their relationships with the funds, as discussed above.
After reviewing those and related factors, the Trustees concluded, within the context of their overall conclusions regarding each of the Agreements, that the extent to which economies of scale were shared with the funds supported the continuation of the Agreements.
Other Factors. The Trustees also considered other factors, which included but were not limited to the following:
| n | | the extent to which each fund had operated in accordance with its investment objective and investment restrictions, the nature and scope of the compliance programs of the funds and Columbia and the compliance-related resources that Columbia and its affiliates were providing to the funds; |
| n | | the nature, quality, cost and extent of administrative and shareholder services overseen and performed by Columbia and its affiliates, both under the Agreements and under separate agreements for the provision of transfer agency and administrative services; |
| n | | so-called “fall-out benefits” to Columbia and its affiliates, such as the engagement of its affiliates to provide distribution, brokerage and transfer agency services to the funds, and the benefits of research made available to Columbia by reason of brokerage commissions generated by the funds’ securities transactions, as well as possible conflicts of interest associated with those fall-out and other benefits, and the reporting, disclosure and other processes in place to disclose and monitor those possible conflicts of interest; and |
| n | | the report provided by the funds’ independent fee consultant, which included information about and analysis of the funds’ fees, expenses and performance. |
Based on their evaluation of all factors that they deemed to be material, including those factors described above, and assisted by the advice of independent counsel and the independent fee consultant, the Trustees, including the Independent Trustees, approved the continuance of each of the Agreements through October 31, 2010.
33
Summary of Management Fee Evaluation by Independent Fee Consultant
REPORT OF INDEPENDENT FEE CONSULTANT TO THE FUNDS SUPERVISED BY THE COLUMBIA ATLANTIC BOARD
Prepared Pursuant to the February 9, 2005 Assurance of Discontinuance among the Office of Attorney General of New York State, Columbia Management Advisors, LLC, and Columbia Management Distributors, Inc. November 6, 2009
I. Overview
On February 9, 2005, Columbia Management Advisors, LLC (“CMA”) and Columbia Management Distributors, Inc.1 (“CMDI”) agreed to the New York Attorney General’s Assurance of Discontinuance (“AOD”). Among other things, the AOD stipulates that CMA may manage or advise a Columbia Fund (“Columbia Fund” and, together with some or all of such funds, the “Columbia Funds”) only if the Independent Members of the Columbia Fund’s Board of Trustees appoint a Senior Officer or retain an Independent Fee Consultant (“IFC”) who is to manage the process by which proposed management fees are negotiated. The AOD further stipulates that the Senior Officer or IFC is to prepare a written annual evaluation of the fee negotiation process.
With effect from January 1, 2007, the Independent Members of the Board of Trustees for certain Columbia Funds known collectively as the “Atlantic Funds” (together with the other members of that Board, the “Trustees”) retained me as IFC for the Atlantic Funds.2 In this capacity, I have prepared the fifth annual written evaluation of the fee negotiation process. As was the case with the 2007 and 2008 reports, my immediate predecessor as IFC, John Rea, provided invaluable assistance in the preparation of this year’s report.
A. Role of the Independent Fee Consultant
The AOD charges the IFC with “managing the process by which proposed management fees … to be charged the Columbia Fund are negotiated so that they are negotiated in a manner which is at arms’ length and reasonable and consistent with this Assurance of Discontinuance.” The AOD also provides that CMA “may manage or advise a Columbia Fund only if the reasonableness of the proposed management fees is determined by the Board of Trustees … using … an annual independent written evaluation prepared by or under the direction of … the Independent Fee Consultant.” Therefore, the AOD makes clear that the IFC does not supplant the Trustees in negotiating management fees with CMA, nor does the IFC substitute his or her judgment for that of the Trustees with respect to the reasonableness of proposed fees or any other matter that is committed to the business judgment of the Trustees.
B. Elements Involved in Managing the Fee Negotiation Process
In preparing the report required by the AOD, the IFC must consider at least the following six factors set forth in the AOD:
| 1. | The nature and quality of CMA’s services, including the Fund’s performance; |
| 2. | Management fees (including any components thereof) charged by other mutual fund companies for like services; |
| 3. | Possible economies of scale as the Fund grows larger; |
| 4. | Management fees (including any components thereof) charged to institutional and other clients of CMA for like services; |
| 5. | Costs to CMA and its affiliates of supplying services pursuant to the management fee agreements, excluding any intra-corporate profit; and |
| 6. | Profit margins of CMA and its affiliates from supplying such services. |
C. Organization of the Annual Evaluation
This report, like last year’s, focuses on the six factors and contains a section for each factor except that CMA’s costs and profits from managing the Funds are treated in a single section. In addition to a discussion of these factors, the report
| 1 | CMA and CMDI are subsidiaries of Columbia Management Group, LLC (“CMG”), and are the successors to the entities named in the AOD. |
| 2 | I have no material relationship with Bank of America, CMG or any of its affiliates, aside from serving as IFC, and I am aware of no material relationship with any of their affiliates. I retained John Rea, an independent economic consultant, to assist me with this report. |
| | Unless otherwise stated or required by the context, this report covers only the Atlantic Funds, which are also referred as the “Funds.” |
34
offers recommendations to improve the fee review process in future years. A review of the status of recommendations made in the 2008 Report is being provided separately with the materials for the October meeting.
II. Summary of Findings
A. General
| 1. | Based upon my examination of the information supplied by CMG in the light of the six factors set forth in the AOD, I conclude that the Trustees have the relevant information necessary to evaluate the reasonableness of the proposed management fees for each Atlantic Fund. |
| 2. | In my view, the process by which the proposed management fees of the Funds have been negotiated in 2009 thus far has been, to the extent practicable, at arms’ length and reasonable and consistent with the AOD. |
B. Nature and Quality of Services, Including Performance
| 3. | The performance of the Funds has been relatively strong in recent years, although the one-year record was weaker than longer-term records. Based upon 1-, 3-, 5-, and 10-year returns through April 30, 2009, at least half of all the Funds were in the first and second performance quintiles in each of the three longest performance periods; for the one-year period, 40% of the Funds were in the top two quintiles. No more than 13% of the Funds were in the fifth quintile in any one performance period. Domestic equity, quantitative equity, and taxable fixed-income Funds were the strongest performers in 2009, while most foreign equity Funds lagged behind their competitors. |
| 4. | Performance rankings were similar in 2008 and 2009: the 1- and 3-year rankings declined slightly over the previous year, while the 5-year rankings improved modestly. Year over year, for the 1- and 3-year periods, the performance of equity Funds, both domestic and international, declined, while that of fixed-income Funds improved. Between three-fifths to two-thirds of the Funds changed quintile rankings in 2009 in the 1-, 3-, and 5-year performance periods. |
| 5. | The performance of the domestic equity Funds against their benchmarks was good for the 3- and 5-year performance periods. In contrast, gross returns of international equity and fixed-income Funds typically fell short of their benchmarks. The performance of equity Funds against their benchmarks was highly correlated to performance versus their peers; no such correlation was observed for fixed-income Funds. |
| 6. | The Atlantic equity Funds’ overall performance adjusted for risk was solid. Based upon 3-year returns, nearly 57% of the equity Funds had a combination of risk-adjusted and unadjusted returns that placed them in the top half of their performance universes. About one quarter of the fixed-income Funds posted high returns and low risk relative to comparable funds. Just over half of the fixed-income Funds, primarily tax-exempt Funds, took on more risk than the typical fund in their performance universes. |
| 7. | The industry-standard procedure used by Lipper that includes all share classes in the performance universe tends to bias a Fund’s ranking upward within that universe. The bias occurs because either no-12b-1 fee or low-12b-1 fee share classes of the Atlantic Funds are compared with funds in performance universes that include all share classes of multi-class funds with 12b-1 fees of up to 100 basis points. Correcting this bias by limiting the performance universe to classes of comparable funds with low or no 12b-1 fees (a “filtered universe”) lowers the relative performance for the Funds, but not to a material extent. The filtering process, however, did identify one Fund for further review that had not been identified as a review fund using unfiltered universes. Conversely, two Funds that had been identified as review funds in the unfiltered universe lost that status in filtered universes. |
| 8. | A small number of Funds have consistently underperformed over the past five years. The exact number depends on the criteria used to evaluate longer-term performance. For example, only three Funds had below-median performance in each 1- and 3-year period from 2005 to 2009. |
| 9. | The services performed by CMG professionals beyond portfolio management, such as compliance, legal, information technology, risk management, finance, and fund administration, are critical to the success of the Funds and appear to be of high quality. |
35
C. Management Fees Charged by Other Mutual Fund Companies
| 10. | The Funds’ management fees and total expenses are generally low relative to those of their peers, with over half of the Funds in the most favorable two quintiles. Only 26% of the Funds ranked in the two most expensive quintiles for actual management fees, and 18% in those quintiles for total expenses. Two Funds are in the fifth quintile for total expenses; four Funds are in the fifth quintile for actual management fees. |
| 11. | The highest concentration of low-expense Funds is found among the foreign equity Funds. The 12 former Excelsior Funds have relatively high fees and expenses, with two-thirds ranking in either the fourth or fifth quintiles for actual management fees. The higher actual management fee rankings of certain former Excelsior Funds are due in part to fee schedules that are higher than standard Columbia Fund fee schedules at current asset levels. |
| 12. | The distribution of total expense and management fee rankings has improved over the prior two years. The implementation of the voluntary standardized cap system has contributed significantly to the improved rankings in 2009. |
| 13. | The management fees of the Atlantic Funds are generally in line with those of Columbia Funds supervised by the Nations Board of Trustees (the “Nations Funds”). To the extent that Atlantic Funds have higher average fees in certain investment categories than Nations Funds, the difference reflects either differences in asset size, different fee structures of the former Excelsior Funds, or special circumstances of the Funds included in the investment categories. |
D. Trustees’ Advisory Contract Review Process
| 14. | The Trustees’ evaluation process identified 16 Funds in 2009 for further review based upon long-standing criteria relating to their relative performance or expenses or both. When compared in filtered universes, one additional Fund met the criteria for further review. CMG provided further information about each of those Funds to assist the Trustees in their evaluation. |
E. Potential Economies of Scale
| 15. | CMG presented to the Trustees its analysis of the sources and sharing of potential economies of scale. CMG views economies of scale as arising at the complex level and would regard estimates of scale economies for individual funds as unreliable. In its analysis, CMG did not identify specific sources of economies of scale or provide any estimates of any economies of scale that might arise from future asset growth. CMG’s analysis included measures taken by the Trustees and CMG that seek to share any potential economies of scale through breakpoints in management fee schedules, the establishment of expense limits for each Fund, enhanced shareholder services, fund mergers, and operational consolidation. |
| 16. | An examination of the contractual fee schedules for five Atlantic Funds shows that those with standard fee structures are generally in line with those of their competitors. The fee schedules of the former Excelsior Funds, however, have high initial fees relative to competitors but otherwise have comparable breakpoint structures. |
F. Management Fees Charged to Institutional Clients
| 17. | CMG has provided Trustees with comparisons of mutual fund management fees and institutional fees based upon standardized fee schedules and upon actual fees. The results show that, consistent with industry practice, actual and scheduled institutional fees are generally lower than the Funds’ management fees. CMG provided additional data this year demonstrating that at small asset levels, the effective fee of certain Funds may be equal to or less than institutional fee levels at those asset levels, due to the effect of expense limits on small funds with high gross expenses. CMG also analyzed the differences between the services provided and risks borne on the one hand by a manager of mutual funds and on the other by institutional advisers, and suggested that these differences should be kept in mind when Trustees review the reasonableness of the Funds’ management fees. |
36
G. Revenues, Expenses, and Profits
| 18. | The activity-based cost allocation methodology employed by CMG to allocate costs, both direct and indirect, for purposes of calculating Fund profitability is thoughtful and detailed. This year, CMG further refined the technique by allocating additional indirect expenses on an activity basis. |
| 19. | The materials provided on CMG’s revenues and expenses with respect to the Funds and the methodology underlying their construction form a sufficient basis for Trustees to evaluate the expenses of and profitability to CMG arising out of its relationships with the Funds. |
| 20. | CMG provided a firm-wide pro forma 2009 income statement demonstrating the effect of market events beginning in the fourth quarter of 2008 on its revenues and profitability to provide an additional perspective on calendar 2008 profitability data. In particular, 2008 revenues reflected the higher market prices prevailing during the first three quarters of that year, while expenses dropped due to cost cutting in the wake of the market downturn late in 2008. The continuing effects of this downturn are expected to produce a significant decline in profitability this year. |
| 21. | In 2008, CMG’s pre-tax post-distribution margin on the Atlantic Fund complex was above industry medians, based on the limited data available for publicly held mutual fund managers. However, as is to be expected in a large fund complex, some Atlantic Funds had relatively high pre-tax profit margins in 2008, when calculated solely with respect to management revenues and expenses, while other Atlantic Funds operated at a loss. There is a positive relationship between Fund size and profitability to CMG, with smaller Funds generally operating at a loss to CMG. |
| 22. | CMG pays a fixed percentage of its management fee revenues to an affiliate, U.S. Trust, Bank of America Private Wealth Management, with respect to assets of its clients invested in Atlantic Funds to compensate it for services it performs with respect to those client assets and for the effect of state law limitations on affiliates charging multiple fees. Based on our analysis of the services provided by this affiliate, we have concluded that all payments other than those for sub-transfer agent or sub-accounting services should be treated as a distribution expense. |
III. Recommendations
| 1) | Criteria for review. The Trustees may wish to consider modifying the criteria for identifying a Fund for further review (a “Review Fund”) to include criteria that focus exclusively on performance. The Trustees’ supplementary data request included one such criterion. They may also wish to consider whether it would be useful to apply CMG’s own internal monitoring standards for Fund performance to the contract review process, or whether such criteria are more relevant to their ongoing investment oversight. |
| 2) | Presentation of Review Fund discussion. CMG should consider whether it could more systematically present in one discussion all relevant information regarding each Review Fund, which is now split into several different portions of the 15(c) materials. For any Fund that has been a Review Fund in consecutive years, CMG should address under what circumstances it could reasonably be anticipated that the Fund would lose that status. |
| 3) | Refinement of tax-exempt performance data. Certain single-state tax-exempt Funds compete in extremely small universes and are compared to a multi-state benchmark of uncertain relevance. Notwithstanding the difficulties, CMG should work to improve the reliability of the calculation of relative performance of these Funds. If that is not possible, CMG should provide guidance on how the Trustees should judge the quality of CMG’s management of these Funds. |
| 4) | Development of risk metrics for asset-allocation, tax-exempt, and money market funds. CMG has developed and shared with the Trustees quantitative risk metrics comparing equity and taxable fixed-income Funds against their peers. However, reliable risk metrics have not been developed for asset-allocation, tax-exempt fixed income, and money market funds. We urge CMG to continue its efforts to provide reliable risk measures for these categories of Funds, especially in the cases of asset-allocation and money market funds, because their investors are likely to be motivated at least in part by a desire to manage risk. |
| 5) | Profitability data. For any period during which CMG is an affiliate of U.S. Trust, Bank of America Private Wealth Management, CMG should continue to present to the Trustees the profitability of each Fund, each investment |
37
| | style and each complex (of which Atlantic is one) calculated as follows: |
| | a. | Management-only profitability should be calculated without reference to any Private Bank expense. |
| | b. | Profitability excluding distribution (which essentially covers the management and transfer agency functions) should be adjusted by removing from the expense calculation any portion of the Private Bank payment not attributable to the performance by the Private Bank of sub-transfer agency or sub-accounting functions. |
| | c. | Total profitability, including distribution: No adjustment for Private Bank expenses should be made, because all such expenses represent legitimate fund expenses to be taken into account in calculating CMG’s profit margin including distribution. |
| | d. | Distribution only: This should include all Private Bank expenses other than those attributable to sub-transfer agency services. |
| 6) | Contractual fee analysis. This year CMG presented a new Lipper report comparing the contractual management fees of Funds with those of competitors in similar investment styles. However, the reliability of the conclusion — that Fund management fee breakpoints compared favorably with competitive fee rates — was limited by the use of competitive funds at all asset levels. The sponsors of a $100 million mutual fund may not have given much thought to breakpoints at $5 billion; therefore, that fund’s contractual fee at that level is unlikely to compare favorably with that of a $5 billion Fund. Limiting the competitors to the Lipper expense group, whose constituents are similar in size to the relevant Fund, would make the results more meaningful. In addition, the breakpoints of a select group of Atlantic Funds (which would differ each year) should continue to be compared to those of industry rivals to ensure that the Funds’ breakpoint schedules remain within industry norms. As breakpoint schedules change relatively little each year, performing such a comparison for each Atlantic Fund each year would not be an efficient use of Trustee and CMG resources. |
| 7) | Pro forma profitability data. In any year in which CMG or the Trustees believe that the prior year’s profitability is unlikely to be representative of current business results due to changes in markets or for any other reason, CMG should, consistent with this year’s practice, prepare a pro forma income statement based on year-to-date actual data and reasonable projections used for its own business planning purposes. |
| 8) | Additional institutional data and analysis. While CMG provided a substantial amount of information on its institutional business, including a virtually complete database of all institutional accounts, we suggest some additional items for future years: (a) profitability data for the institutional business in the format, and based upon the same allocation methodologies, used to present Fund profitability, (b) an explanation of how CMA sets institutional fee breakpoints, which normally begin at asset levels far lower than those found in Fund management fee breakpoints, and (c) an analysis of differences in actual fees within specific investment categories, with special attention given to accounts established before and after the implementation of the standardized institutional fee schedules in 2005. |
| 9) | Management fee disparities. In any future study of management fees, CMG and the Atlantic Trustees should analyze the differences in management fee schedules, including those arising out of the reorganization of the former Excelsior Funds as Atlantic Funds. As part of that analysis, CMG should provide an explanation for any significant fee differences among comparable funds across fund families sponsored by CMG, such as differences in the management styles of different Funds included the same Lipper category. Finally, if CMG proposes a management fee change or an expense cap for any mutual fund managed by CMA that is comparable to any Atlantic Fund, CMG should provide the Trustees with sufficient information about the proposal to allow the Trustees to assess the applicability of the proposed change to the relevant Atlantic Fund or Funds. |
| 10) | Explanation of data supplied to Lipper. Each year, as part of the 15(c) process, CMG retains Lipper to compare the fees and expenses of each Fund to a group of competitors. In many cases, CMG, with the approval of the Trustees, adjusts the actual expense data, which is based on the most recent full fiscal year of the Fund (and each competitive fund) to reflect changes in fees or expense limits that occurred during or after the relevant fiscal year. |
38
| | This improves the reliability and usefulness of the comparison. However, to ensure that the Trustees know when and how CMG adjusted the data, we recommend that CMG prepare a table listing for each Fund what adjustments were made, e.g., to reflect a new expense limitation of x basis points that commenced on y date. |
Reduction of volume of paper documents submitted. The effort to streamline and better organize the data presented to the Trustees and the process by which that data was prepared and organized continued to be well-received by all parties. Notwithstanding past success, it is always appropriate to look for opportunities to reduce and simplify the presentation of 15(c) data. One possibility would be to remove the 124 pages of biographical data, most if not all of which the Trustees have previously seen as part of their ongoing investment oversight duties, from the paper volume and post it on the Internet-based document storage and retrieval system used by the Funds to provide reference data to Trustees.
Respectfully Submitted,
Steven E. Asher
39
[THIS PAGE INTENTIONALLY LEFT BLANK]
40
Important Information About This Report
The fund mails one shareholder report to each shareholder address. If you would like more than one report, please call shareholder services at 1-800-345-6611 and additional reports will be sent to you. This report has been prepared for shareholders of Columbia Real Estate Equity Fund.
A description of the policies and procedures that the fund uses to determine how to vote proxies and a copy of the fund’s voting records are available (i) at www.columbiamanagement.com, (ii) on the Securities and Exchange Commission’s website at www.sec.gov, and (iii) without charge, upon request, by calling 1-800-368-0346. Information regarding how the fund voted proxies relating to portfolio securities during the 12-month period ended June 30 is available from the SEC’s website. Information regarding how the fund voted proxies relating to portfolio securities is also available from the fund’s website, www.columbiamanagement.com.
The fund files a complete schedule of portfolio holdings with the SEC for the first and third quarters of each fiscal year on Form N-Q. The fund’s Form N-Q is available on the SEC’s website at www.sec.gov and may be reviewed and copied at the SEC’s Public Reference Room in Washington, D.C. Information on the operation of the Public Reference Room may be obtained by calling 1-800-SEC-0330.
Please read and consider the investment objectives, risks, charges and expenses for any fund carefully before investing. For a prospectus which contains this and other important information about the fund, contact your Columbia Management representative or financial advisor or go to www.columbiamanagement.com.
Columbia Management Group, LLC (“Columbia Management”) is the investment management division of Bank of America Corporation. Columbia Management entities furnish investment management services and products for institutional and individual investors. Columbia Funds are distributed by Columbia Management Distributors, Inc., member of FINRA, SIPC, part of Columbia Management and an affiliate of Bank of America Corporation.
Transfer Agent
Columbia Management Services, Inc.
P.O. Box 8081
Boston, MA 02266-8081
1-800-345-6611
Distributor
Columbia Management
Distributors, Inc.
One Financial Center
Boston, MA 02111
Investment Advisor
Columbia Management Advisors, LLC
100 Federal Street
Boston, MA 02110
41

One Financial Center
Boston, MA 02111-2621
Columbia Real Estate Equity Fund
Annual Report, December 31, 2009
©2010 Columbia Management Distributors, Inc.
One Financial Center, Boston, MA 02111-2621
800.345.6611 www.columbiafunds.com
SHC-42/30403-1209 (02/10) 10/103115
| | (a) | The registrant has, as of the end of the period covered by this report, adopted a code of ethics that applies to the registrant’s principal executive officer, principal financial officer, principal accounting officer or controller, or persons performing similar functions, regardless of whether these individuals are employed by the registrant or a third party. |
| | (b) | During the period covered by this report, there were not any amendments to a provision of the code of ethics adopted in 2(a) above. |
| | (c) | During the period covered by this report, there were no waivers, including any implicit waivers, from a provision of the code of ethics described in 2(a) above that relates to one or more of the items set forth in paragraph (b) of this item’s instructions. |
| Item 3. | Audit Committee Financial Expert. |
The registrant’s Board of Trustees has determined that John D. Collins, Douglas A. Hacker, Charles R. Nelson and Anne-Lee Verville, each of whom are members of the registrant’s Board of Trustees and Audit Committee, each qualify as an audit committee financial expert. Mr. Collins, Mr. Hacker, Mr. Nelson and Ms. Verville are each independent trustees, as defined in paragraph (a)(2) of this item’s instructions.
| Item 4. | Principal Accountant Fees and Services. |
Fee information below is disclosed for the one series of the registrant whose report to stockholders is included in this annual filing. The Board of Trustees approved a proposal to change the year end of the series from August 31 to December 31. Accordingly, prior fiscal year comparative information represents fiscal year ended August 31, 2009.
(a) Audit Fees. Aggregate Audit Fees billed by the principal accountant for professional services rendered during the fiscal years ended December 31, 2009 and August 31, 2009 are approximately $28,400 and $31,500, respectively.
Audit Fees include amounts related to the audit of the registrant’s annual financial statements or services that are normally provided by the accountant in connection with statutory and regulatory filings or engagements for those fiscal years.
(b) Audit-Related Fees. Aggregate Audit-Related Fees billed to the registrant by the principal accountant for professional services rendered during the fiscal years ended December 31, 2009 and August 31, 2009 are approximately $0 and $4,600, respectively.
Audit-Related Fees include amounts for assurance and related services by the principal accountant that are reasonably related to the performance of the audit of the registrant’s financial statements and are not reported in Audit Fees above. August 31, 2009 Audit-Related Fees consist of agreed-upon procedures performed for semi-annual shareholder reports.
During the fiscal years ended December 31, 2009 and August 31, 2009, there were no Audit-Related Fees billed by the registrant’s principal accountant to the registrant’s investment adviser (not including any sub-adviser whose role is primarily portfolio management and is subcontracted with or overseen by another investment adviser) and any entity controlling, controlled by, or under common control with the adviser that provides ongoing services to the registrant for an engagement that related directly to the operations and financial reporting of the registrant.
(c) Tax Fees. Aggregate Tax Fees billed by the principal accountant to the registrant for professional services rendered during the fiscal years ended December 31, 2009 and August 31, 2009 are approximately $0 and $7,200, respectively.
Tax Fees include amounts for the review of annual tax returns, the review of required shareholder distribution calculations and typically include amounts for professional services by the principal accountant for tax compliance, tax advice and tax planning.
During the fiscal years ended December 31, 2009 and August 31, 2009, there were no Tax Fees billed by the registrant’s principal accountant to the registrant’s investment adviser (not including any sub-adviser whose role is primarily portfolio management and is subcontracted with or overseen by another investment adviser) and any entity controlling, controlled by, or under common control with the adviser that provides ongoing services to the registrant for an engagement that related directly to the operations and financial reporting of the registrant.
(d) All Other Fees. There were no Aggregate All Other Fees billed by the principal accountant to the registrant for professional services rendered during the fiscal years ended December 31, 2009 and August 31, 2009.
All Other Fees include amounts for products and services provided by the principal accountant, other than the services reported in paragraphs (a) through (c) above.
Aggregate All Other Fees billed by the registrant’s principal accountant to the registrant’s investment adviser (not including any sub-adviser whose role is primarily portfolio management and is subcontracted with or overseen by another investment adviser) and any entity controlling, controlled by, or under common control with the adviser that
provides ongoing services to the registrant for an engagement that related directly to the operations and financial reporting of the registrant during the fiscal years ended December 31, 2009 and August 31, 2009 are approximately $968,700 and $829,700, respectively.
In both fiscal years ended December 31, 2009 and August 31, 2009, All Other Fees consist of fees billed for internal control examinations of the registrant’s transfer agent and investment advisor. December 31, 2009 fiscal year end also includes fees for agreed upon procedures related to the sale of the long-term asset management business.
(e)(1) Audit Committee Pre-Approval Policies and Procedures
The registrant’s Audit Committee is required to pre-approve the engagement of the registrant’s independent accountants to provide audit and non-audit services to the registrant and non-audit services to its investment adviser (not including any sub-adviser whose role is primarily portfolio management and is subcontracted with or overseen by another investment adviser) or any entity controlling, controlled by or under common control with such investment adviser that provides ongoing services to the registrant (“Adviser Affiliates”), if the engagement relates directly to the operations and financial reporting of the registrant.
The Audit Committee has adopted a Policy for Engagement of Independent Accountants for Audit and Non-Audit Services (“Policy”). The Policy sets forth the understanding of the Audit Committee regarding the engagement of the registrant’s independent accountants to provide (i) audit and permissible audit-related, tax and other services to the registrant (collectively “Fund Services”); (ii) non-audit services to the registrant’s investment adviser (not including any sub-adviser whose role is primarily portfolio management and is subcontracted with or overseen by another investment adviser) and Adviser Affiliates, if the engagement relates directly to the operations or financial reporting of a Fund (collectively “Fund-related Adviser Services”); and (iii) certain other audit and non-audit services to the registrant’s investment adviser (not including any sub-adviser whose role is primarily portfolio management and is subcontracted with or overseen by another investment adviser) and Adviser Affiliates. Unless a type of service receives general pre-approval under the Policy, it requires specific pre-approval by the Audit Committee if it is to be provided by the independent accountants. Pre-approval of non-audit services to the registrant, the registrant’s investment adviser (not including any sub-adviser whose role is primarily portfolio management and is subcontracted with or overseen by another investment adviser) and Adviser Affiliates may be waived provided that the “de minimis” requirements set forth under paragraph (c)(7)(i)(C) of Rule 2-01 of Regulation S-X are met.
Under the Policy, the Audit Committee may delegate pre-approval authority to any pre-designated member or members who are Independent Trustees/Directors. The member(s) to whom such authority is delegated must report, for informational purposes only, any pre-approval decisions to the Audit Committee at its next regular meeting. The Audit Committee’s responsibilities with respect to the pre-approval of services performed by the independent accountants may not be delegated to management.
The Policy requires the Fund Treasurer and/or Director of Board Administration to submit to the Audit Committee, on an annual basis, a schedule of the types of services that are subject to general pre-approval. The schedule(s) provide a description of each type of service that is subject to general pre-approval and, where possible, will provide estimated fee caps for each instance of providing each service. The Audit Committees will review and approve the types of services and review the projected fees for the next fiscal year and may add to, or subtract from, the list of general pre-approved services from time to time based on subsequent determinations. That approval acknowledges that the Audit Committee is in agreement with the specific types of services that the independent accountants will be permitted to perform.
The Fund Treasurer and/or Director of Board Administration shall report to the Audit Committee at each of its regular meetings regarding all Fund Services or Fund-related Adviser Services initiated since the last such report was rendered, including a general description of the services, actual billed and projected fees, and the means by which such Fund Services or Fund-related Adviser Services were pre-approved by the Audit Committee.
*****
(e)(2) The percentage of services described in paragraphs (b) through (d) of this Item approved pursuant to the “de minimis” exception under paragraph (c)(7)(i)(C) of Rule 2-01 of Regulation S-X during both fiscal years ended December 31, 2009 and August 31, 2009 was zero.
(f) Not applicable.
(g) The aggregate non-audit fees billed by the registrant’s accountant for services rendered to the registrant, and rendered to the registrant’s investment adviser (not including any sub-adviser whose role is primarily portfolio management and is subcontracted with or overseen by another investment adviser), and any entity controlling, controlled by, or under common control with the adviser that provides ongoing services to the registrant for the fiscal years ended December 31, 2009 and August 31, 2009 are approximately $968,700 and $841,500, respectively.
(h) The registrant’s Audit Committee of the Board of Directors has considered whether the provision of non-audit services that were rendered to the registrant’s adviser (not including any sub-adviser whose role is primarily portfolio management and is subcontracted with or overseen by another investment adviser), and any entity controlling, controlled by, or under common control with the investment adviser that provides ongoing services to the registrant that were not pre-approved pursuant to paragraph (c)(7)(ii) of Rule 2-01 of Regulation S-X, is compatible with maintaining the principal accountant’s independence.
| Item 5. | Audit Committee of Listed Registrants. |
Not applicable.
| | (a) | The registrant’s “Schedule I – Investments in securities of unaffiliated issuers” (as set forth in 17 CFR 210.12-12) is included in Item 1 of this Form N-CSR. |
| Item 7. | Disclosure of Proxy Voting Policies and Procedures for Closed-End Management Investment Companies. |
Not applicable.
| Item 8. | Portfolio Managers of Closed-End Management Investment Companies. |
Not applicable.
| Item 9. | Purchases of Equity Securities by Closed-End Management Investment Company and Affiliated Purchasers. |
Not applicable.
| Item 10. | Submission of Matters to a Vote of Security Holders. |
There have not been any material changes to the procedures by which shareholders may recommend nominees to the registrant’s board of directors, since those procedures were last disclosed in response to requirements of Item 407(c)(2)(iv) of Regulation S-K (as required by Item 22(b)(15) of Schedule 14A) or this Item.
| Item 11. | Controls and Procedures. |
| | (a) | The registrant’s principal executive officer and principal financial officers, based on their evaluation of the registrant’s disclosure controls and procedures as of a date within 90 days of the filing of this report, have concluded that such controls and procedures are adequately designed to ensure that information required to be disclosed by the registrant in Form N-CSR is accumulated and communicated to the registrant’s management, including the principal executive officer and principal financial officer, or persons performing similar functions, as appropriate to allow timely decisions regarding required disclosure. |
| | (b) | There was no change in the registrant’s internal control over financial reporting that occurred during the registrant’s second fiscal quarter of the period covered by this report that has materially affected, or is reasonably likely to materially affect, the registrant’s internal control over financial reporting. |
| | |
| (a)(1) | | Code of ethics required to be disclosed under Item 2 of Form N-CSR attached hereto as Exhibit 99.CODE ETH. |
| |
| (a)(2) | | Certifications pursuant to Rule 30a-2(a) under the Investment Company Act of 1940 (17 CFR 270.30a-2(a)) attached hereto as Exhibit 99.CERT. |
| |
| (a)(3) | | Not applicable. |
| |
| (b) | | Certification pursuant to Rule 30a-2(b) under the Investment Company Act of 1940 (17 CFR 270.30a-2(b)) attached hereto as Exhibit 99.906CERT. |
SIGNATURES
Pursuant to the requirements of the Securities Exchange Act of 1934 and the Investment Company Act of 1940, the registrant has duly caused this report to be signed on its behalf by the undersigned, thereunto duly authorized.
(registrant) Columbia Funds Series Trust I
| | |
| By (Signature and Title) | | /s/ J. Kevin Connaughton |
| | J. Kevin Connaughton, President |
Date February 19, 2010
Pursuant to the requirements of the Securities Exchange Act of 1934 and the Investment Company Act of 1940, this report has been signed below by the following persons on behalf of the registrant and in the capacities and on the dates indicated.
| | |
| By (Signature and Title) | | /s/ J. Kevin Connaughton |
| | J. Kevin Connaughton, President |
Date February 19, 2010
| | |
| By (Signature and Title) | | /s/ Michael G. Clarke |
| | Michael G. Clarke, Chief Financial Officer |
Date February 19, 2010