UNITED STATES
SECURITIES AND EXCHANGE COMMISSION
Washington, D.C. 20549
FORM N-CSR
CERTIFIED SHAREHOLDER REPORT OF REGISTERED
MANAGEMENT INVESTMENT COMPANIES
Investment Company Act file number 811-04367
Columbia Funds Series Trust I
(Exact name of registrant as specified in charter)
50606 Ameriprise Financial Center, Minneapolis, Minnesota 55474
(Address of principal executive offices) (Zip code)
Scott R. Plummer
5228 Ameriprise Financial Center
Minneapolis, MN 55474
(Name and address of agent for service)
Registrant’s telephone number, including area code: 1-612-671-1947
Date of fiscal year end: April 30
Date of reporting period: April 30, 2010
Form N-CSR is to be used by management investment companies to file reports with the Commission not later than 10 days after the transmission to stockholders of any report that is required to be transmitted to stockholders under Rule 30e-1 under the Investment Company Act of 1940 (17 CFR 270.30e-1). The Commission may use the information provided on Form N-CSR in its regulatory, disclosure review, inspection, and policymaking roles.
A registrant is required to disclose the information specified by Form N-CSR, and the Commission will make this information public. A registrant is not required to respond to the collection of information contained in Form N-CSR unless the Form displays a currently valid Office of Management and Budget (“OMB”) control number. Please direct comments concerning the accuracy of the information collection burden estimate and any suggestions for reducing the burden to Secretary, Securities and Exchange Commission, 450 Fifth Street, NW, Washington, DC 20549-0609. The OMB has reviewed this collection of information under the clearance requirements of 44 U.S.C. § 3507.
| Item 1. | Reports to Stockholders. |

Columbia Core Bond Fund
Annual Report for the Period Ended April 30, 2010
Table of Contents
The views expressed in this report reflect the current views of the respective parties. These views are not guarantees of future performance and involve certain risks, uncertainties and assumptions that are difficult to predict, so actual outcomes and results may differ significantly from the views expressed. These views are subject to change at any time based upon economic, market or other conditions and the respective parties disclaim any responsibility to update such views. These views may not be relied on as investment advice and, because investment decisions for a Columbia Fund are based on numerous factors, may not be relied on as an indication of trading intent on behalf of any particular Columbia Fund. References to specific securities should not be construed as a recommendation or investment advice.
President’s Message

Dear Shareholder:
On May 3, 2010, Ameriprise Financial, Inc. announced that it had completed the acquisition of the long-term asset management business of Columbia Management from Bank of America. This includes the business of managing its equity and fixed-income mutual funds. Ameriprise Financial has combined its current U.S. asset management business, RiverSource Investments, LLC, with Columbia Management. This transaction puts together two leading asset management firms to create one entity that ranks as the eighth largest manager of long-term mutual fund assets in the United States.1 This combined business will operate under the well-regarded Columbia Management brand, where we will build on the strengths of our combined investment capabilities and talent, our broad and diversified product lineup and exceptional service.
Our combined business has a new breadth and depth of investment choices. William “Ted” Truscott, CEO, U.S. asset management and president of annuities for Ameriprise Financial, leads the combined U.S. asset management business. Michael Jones serves as president, U.S. asset management. Colin Moore continues to serve as chief investment officer. I am also continuing in my role as head of mutual funds, responsible for the delivery of mutual fund products and services to investors. The Columbia funds’ advisers, distributor and transfer agent are now subsidiaries of our parent company, Ameriprise Financial but operate under the Columbia Management name. You will begin to see these names used in communications and statements going forward.
| | |
| | | Service provider name |
| Advisers | | Columbia Management Investment Advisers, LLC Columbia Wanger Asset Management, LLC |
| Distributor | | Columbia Management Investment Distributors, Inc. |
| Transfer Agent | | Columbia Management Investment Services Corp. |
As a valued investor in Columbia funds, please know that our goal is to ensure a smooth transition and provide the highest quality products and services. Transition teams across the organization continue their efforts to build on best practices from both legacy organizations with integration efforts including rebranding, vendor and system consolidations and client communications. Additionally, we want to assure you that the funds’ portfolio managers also continue to focus on providing uninterrupted service to all fund shareholders.
Although we have a lot of work ahead of us in 2010, Columbia Management and Ameriprise Financial are excited about the opportunities for our combined organization. I share this optimism and believe it positions us as a best-in-class asset management business with the ability to deliver more for our clients than ever before.
Sincerely,

J. Kevin Connaughton
President, Columbia Funds
| 1 | Source: Ameriprise Financial, Inc., based on March 31, 2010 data from the Investment Company Institute |
Investors should consider the investment objectives, risks, charges and expenses of a mutual fund carefully before investing. For a free prospectus, which contains this and other important information about the funds, visit columbiamanagement.com. Read the prospectus carefully before investing.
Securities products offered through Columbia Management Investment Distributors, Inc. (formerly known as RiverSource Fund Distributors, Inc.), member FINRA. Advisory services provided by Columbia Management Investment Advisers, LLC (formerly known as RiverSource Investments, LLC).
© 2010 Columbia Management Investment Advisers, LLC. All rights reserved.
Fund Profile – Columbia Core Bond Fund
Summary
| n | | For the 12-month period that ended April 30, 2010, the fund’s Class A shares returned 11.29% without sales charge. |
| n | | The fund outperformed its benchmark, the Barclays Capital Aggregate Bond Index1 , but underperformed the average return of the funds in its peer group, the Lipper Corporate Debt Funds A Rated Classification.2 |
| n | | The fund’s short-maturity profile aided performance relative to the benchmark, while its conservative orientation was a slight handicap relative to competing funds. |
Portfolio Management
Alexander D. Powers has co-managed the fund since 2007 and has been associated with the advisor since May 2010. Prior to joining the advisor, Mr. Powers was associated with the fund’s previous advisor or its predecessors since 1996.
Michael Zazzarino has co-managed the fund since 2007 and has been associated with the advisor since May 2010. Prior to joining the advisor, Mr. Zazzarino was associated with the fund’s previous advisor or its predecessors since 2005.
Carl Pappo has co-managed the fund since 2008 and has been associated with the advisor since May 2010. Prior to joining the advisor, Mr. Pappo was associated with the fund’s previous advisor or its predecessors since 1993.
Effective May 1, 2010, RiverSource Investments, LLC, a subsidiary of Ameriprise Financial, Inc., became the investment advisor to the fund and changed its name to Columbia Management Investment Advisers, LLC. Please see the fund’s prospectus, as supplemented, for more information regarding the change in investment advisor and certain other changes.
| 1 | The Barclays Capital Aggregate Bond Index is a market value-weighted index that tracks the daily price, coupon, pay-downs and total return performance of fixed-rate, publicly placed, dollar-denominated and non-convertible investment grade debt issues with at least $250 million par amount outstanding and with at least one year to final maturity. Indices are not available for investment, are not professionally managed and do not reflect sales charges, fees, brokerage commissions, taxes or other expenses of investing. Securities in the fund may not match those in an index. |
| 2 | Lipper Inc., a widely respected data provider in the industry, calculates an average total return (assuming reinvestment of distributions) for mutual funds with investment objectives similar to those of the fund. Lipper makes no adjustment for the effect of sales loads. |
Performance data quoted represents past performance and current performance may be lower or higher. Past performance is no guarantee of future results. The investment return and principal value will fluctuate so that shares, when redeemed, may be worth more or less than the original cost. Please visit www.columbiafunds.com for daily and most recent month-end performance updates.
Summary
1-year return as of 04/30/10
| | |
| |
 | | +11.29% Class A shares |
| | (without sales charge) |
| |
| | +8.30% Barclays Capital Aggregate Bond Index |
1
Economic Update – Columbia Core Bond Fund
After a deep and difficult recession, the U.S. economy regained its footing midway through calendar year 2009. Gross domestic product (GDP) turned positive in the third quarter of 2009, rising 2.2%, and then gained 5.6% in the fourth quarter and 3.0% in the first quarter of 2010, according to the estimates released by the Bureau of Economic Analysis. Growth was primarily the result of a slowdown in inventory reduction and federal government stimulus spending. Hopes for a sustained recovery now depend on a variety of factors, including continued improvement in consumer spending, an increase in revenues to keep business profits moving higher and a turnaround in the labor market.
The housing market showed signs of stabilizing during the period. Home sales moved higher, as mortgage rates remained low and new homebuyers took advantage of a federal tax credit. However, as the tax credit was set to expire in November 2009, sales slipped — and did not revive until March 2010 as the tax credit extension deadline neared at the end of April. Housing prices remained relatively flat, but that was progress compared to 2008, when the average home price fell sharply. Since then distressed properties, which account for approximately 40% of all housing sales, have held prices down because they are heavily discounted.
In the beleaguered labor market, there was some good news. While businesses continued to shed jobs through most of 2009, raising the unemployment rate at the end of the period, job data turned positive in January 2010, buoyed by a swell of temporary workers hired to conduct the national once-in-a-decade census. Consumer spending also trended higher in the second half of the period. In fact, March year-over-year sales made a significant jump upward. Consumer confidence, as measured monthly by The Conference Board, an independent research organization, gained ground in the final months of the period. Consumers surveyed reported that they were more optimistic about business conditions and labor prospects.
On the business side of the economy, manufacturing activity gained momentum. A key measure of the nation’s manufacturing situation — the Institute for Supply Management’s Index — rose above 50 in July 2009 — then rose for nine consecutive months to end the period above 60. (An index value of 50+ indicates a growing economy.) Industrial production moved higher as the year wore on, and manufacturing capacity utilization inched upward to 73.2% according to the monthly Federal Reserve Statistical Release dated May 14, 2010. Durable goods orders declined near the end of the period, but the decrease followed three consecutive monthly increases.
Bond returns ranged from solid to strong
As hopes for a recovery materialized, bonds from non-Treasury sectors delivered solid returns. The Barclays Capital Aggregate Bond Index1 returned 8.30%. Municipal bonds gained more than taxable investment-grade bonds even without factoring in potential tax advantages to investors in higher income-tax brackets. The Barclays Capital Municipal Bond Index2 returned 8.85%. The high-yield bond market was even stronger than the broad stock market during the period. For the 12 months covered by this report, the BofA Merrill Lynch U.S. High Yield Cash Pay Index3 returned 42.95%.
Summary
For the 12-month period that ended April 30, 2010
| | n | | As investors grew more comfortable with risk, non-Treasury sectors of the bond market rebounded. The Barclays Capital Aggregate Bond Index delivered solid results. High-yield bonds outperformed stocks, as measured by the BofA Merrill Lynch U.S. High Yield Cash Pay Index. | |
| | |
| Barclays Aggregate Index | | BofA ML Index |
| |

| |
|
8.30% | | 42.95% |
| | n | | Stock markets rebounded around the world, as measured by the S&P 500 Index and the MSCI EAFE Index. | |
| | |
| S&P Index | | MSCI Index |
| |
| |
|
38.84% | | 34.43% |
2
Economic Update (continued) – Columbia Core Bond Fund
The yield on the 10-year U.S. Treasury, a common bellwether for the bond market, rose from 3.1% to 3.7% during the 12-month period. Yet, despite the pickup in economic activity, the Federal Reserve Board kept a key short-term interest rate — the federal funds rate — close to zero throughout the period.
Stocks staged a solid comeback
Against a strengthening economic backdrop, a stock market rally that began in mid-March 2009 continued with little interruption through the end of the period. The U.S. stock market returned 38.84% for the 12-month period, as measured by the S&P 500 Index.4 Small-cap stocks outperformed large- and mid-cap stocks, and value stocks outperformed growth stocks by a solid margin, as measured by their respective Russell indices.5
Outside the United States, stock market returns were also strong. The MSCI EAFE Index,6 a broad gauge of stock market performance in foreign developed markets, gained 34.43% (net of dividends, in U.S. dollars) for the period. Emerging stock markets were caught in a downdraft in 2008, but they bounced back stronger than domestic or developed world markets in 2009 as their economic growth generally outpaced the developed world. The MSCI Emerging Markets Index7 returned 57.13% (net of dividends, in U.S. dollars) for the 12-month period, after giving back some gains in the first quarter of 2010.
Past performance is no guarantee of future results.
| 1 | The Barclays Capital Aggregate Bond Index is a market value-weighted index that tracks the daily price, coupon, pay-downs and total return performance of fixed-rate, publicly placed, dollar-denominated and non-convertible investment grade debt issues with at least $250 million par amount outstanding and with at least one year to final maturity. |
| 2 | The Barclays Capital Municipal Bond Index is considered representative of the broad market for investment-grade, tax-exempt bonds with a maturity of at least one year. |
| 3 | The BofA Merrill Lynch U.S. High Yield Cash Pay Index tracks the performance of non-investment-grade corporate bonds. |
| 4 | The Standard & Poor’s (S&P) 500 Index tracks the performance of 500 widely held, large-capitalization U.S. stocks. |
| 5 | The Russell 1000 Index tracks the performance of 1,000 of the largest U.S. companies, based on market capitalization. The Russell Midcap Index measures the performance of the 800 smallest companies in the Russell 1000 Index, which represents approximately 25% of the total market capitalization of the Russell 1000 Index. The Russell 2000 Index measures the performance of the 2,000 smallest companies in the Russell 3000 Index, which represents approximately 8% of the total market capitalization of the Russell 3000 Index. The Russell 3000 Growth Index measures the performance of those Russell 3000 Index companies with higher price-to-book ratios and higher forecasted growth values. The stocks in this index are also members of either the Russell 1000 Growth or the Russell 2000 Growth indexes. The Russell 3000 Value Index measures the performance of those Russell 3000 Index companies with lower price-to-book ratios and lower forecasted growth values. The stocks in this index are also members of either the Russell 1000 Value or the Russell 2000 Value indices. |
| 6 | The Morgan Stanley Capital International Europe, Australasia, Far East (MSCI EAFE) Index is a capitalization-weighted index that tracks the total return of common stocks in 21 developed-market countries within Europe, Australasia and the Far East. |
| 7 | The Morgan Stanley Capital International Emerging Markets Index (MSCI EMI) is a free float-adjusted market capitalization index that is designed to measure equity market performance of emerging markets. As of June 2009, the MSCI Emerging Markets Index consisted of the following 22 emerging market country indices: Brazil, Chile, China, Colombia, Czech Republic, Egypt, Hungary, India, Indonesia, Israel, Korea, Malaysia, Mexico, Morocco, Peru, Philippines, Poland, Russia, South Africa, Taiwan, Thailand, and Turkey. |
Indices are not available for investment, are not professionally managed and do not reflect sales charges, fees, brokerage commissions, taxes or other expenses of investing. Securities in the fund may not match those in an index.
3
Performance Information – Columbia Core Bond Fund
Performance data quoted represents past performance and current performance may be lower or higher. Past performance is no guarantee of future results. The investment return and principal value will fluctuate so that shares, when redeemed, may be worth more or less than the original cost. Please visit www.columbiafunds.com for daily and most recent month-end performance updates.
| | |
| Annual operating expense ratio (%)* |
| |
Class A | | 0.86 |
Class B | | 1.61 |
Class C | | 1.61 |
Class T | | 0.76 |
Class Z | | 0.61 |
| * | The annual operating expense ratio is as stated in the fund’s prospectus that is current as of the date of this report. Differences in expense ratios disclosed elsewhere in this report may result from the inclusion of fee waivers and expense reimbursements as well as the use of different time periods to calculate the ratios. |
|
| Performance of a $10,000 investment 05/01/00 – 04/30/10 |
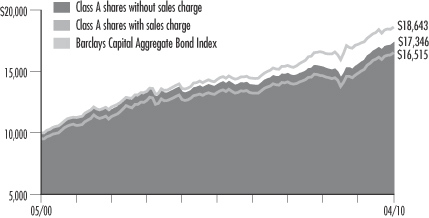
The chart above shows the change in value of a hypothetical $10,000 investment in Class A shares of Columbia Core Bond Fund during the stated time period, and does not reflect the deduction of taxes a shareholder may pay on fund distributions or on the redemption of fund shares.
| | | | |
| Performance of a $10,000 investment 05/01/00 – 04/30/10 ($) |
| Sales charge | | without | | with |
Class A | | 17,346 | | 16,515 |
Class B | | 16,109 | | 16,109 |
Class C | | 16,285 | | 16,285 |
Class T | | 17,469 | | 16,632 |
Class Z | | 17,782 | | n/a |
| | | | | | | | | | | | | | | | | | |
| Average annual total return as of 04/30/10 (%) |
| Share class | | A | | B | | C | | T | | Z |
| Inception | | 11/01/98 | | 11/01/98 | | 11/25/02 | | 12/14/90 | | 12/14/90 |
| Sales charge | | without | | with | | without | | with | | without | | with | | without | | with | | without |
1-year | | 11.29 | | 5.96 | | 10.47 | | 5.47 | | 10.63 | | 9.63 | | 11.40 | | 6.06 | | 11.57 |
5-year | | 4.48 | | 3.46 | | 3.70 | | 3.35 | | 3.85 | | 3.85 | | 4.58 | | 3.57 | | 4.74 |
10-year | | 5.66 | | 5.14 | | 4.88 | | 4.88 | | 5.00 | | 5.00 | | 5.74 | | 5.22 | | 5.93 |
| Average annual total return as of 03/31/10 (%) |
| Share class | | A | | B | | C | | T | | Z |
| Sales charge | | without | | with | | without | | with | | without | | with | | without | | with | | without |
1-year | | 11.10 | | 5.84 | | 10.28 | | 5.28 | | 10.44 | | 9.44 | | 11.21 | | 5.95 | | 11.38 |
5-year | | 4.47 | | 3.46 | | 3.69 | | 3.34 | | 3.84 | | 3.84 | | 4.57 | | 3.57 | | 4.73 |
10-year | | 5.48 | | 4.97 | | 4.70 | | 4.70 | | 4.82 | | 4.82 | | 5.56 | | 5.04 | | 5.74 |
The “with sales charge” returns include the maximum initial sales charge of 4.75% for Class A and T shares and the applicable contingent deferred sales charge of 5.00% in the first year, declining to 1.00% in the sixth year and eliminated thereafter for Class B shares and 1.00% for Class C shares for the first year only. The “without sales charge” returns do not include the effect of sales charges. If they had, returns would be lower.
Performance results reflect any fee waivers or reimbursements of fund expenses by the investment advisor and/or any of its affiliates. Absent these fee waivers or expense reimbursement arrangements, performance results would have been lower.
All results shown assume reinvestment of distributions. Class Z shares are sold at net asset value with no distribution and service (Rule 12b-1) fees. Class Z shares have limited eligibility and the investment minimum requirements may vary. Please see the fund’s prospectus for details. Performance for different share classes will vary based on differences in sales charges and fees associated with each class.
The tables do not reflect the deduction of taxes that a shareholder may pay on fund distributions or on the redemption of fund shares.
Class A, Class B, Class C, Class T and Class Z share performance information includes returns of Prime A shares (for Class A shares), Prime B shares (for Class B and Class C shares), Retail A shares (for Class T shares) and Trust shares (for Class Z shares) of Galaxy Quality Plus Bond Fund, the predecessor to the fund and a series of The Galaxy Fund (the “Predecessor Fund”), for periods prior to November 25, 2002, the date on which Class A, Class B, Class C, Class T and Class Z shares were initially offered by the fund. The returns shown for all share classes reflect any differences in sales charges.
The 10-year returns for Class C shares include the returns of Prime B shares of the Predecessor Fund for the period prior to November 25, 2002, the date on which Class C shares were first offered. The returns have not been adjusted to reflect any differences in expenses between Class C shares and Prime B shares of the Predecessor Fund.
4
Understanding Your Expenses – Columbia Core Bond Fund
Estimating your actual expenses
To estimate the expenses that you paid over the period, first you will need your account balance at the end of the period:
| | n | | For shareholders who receive their account statements from Columbia Management Investment Services Corp., your account balance is available online at www.columbiafunds.com or by calling Shareholder Services at 800.345.6611. | |
| | n | | For shareholders who receive their account statements from their financial intermediary, contact your financial intermediary to obtain your account balance. | |
| | 1. | Divide your ending account balance by $1,000. For example, if an account balance was $8,600 at the end of the period, the result would be 8.6. | |
| | 2. | In the section of the table below titled “Expenses paid during the period,” locate the amount for your share class. You will find this number in the column labeled “Actual.” Multiply this number by the result from step 1. Your answer is an estimate of the expenses you paid on your account during the period. | |
If the value of your account falls below the minimum initial investment requirement applicable to you, your account may be subject to a $20 annual fee. This fee is not included in the accompanying table. If you are subject to the fee, keep it in mind when you are estimating the ongoing expenses of investing in the fund and when comparing the expenses of this fund with other funds.
As a fund shareholder, you incur two types of costs. There are transaction costs, which generally include sales charges on purchases and may include redemption fees or exchange fees. There are also ongoing costs, which generally include investment advisory fees, distribution and service (Rule 12b-1) fees and other fund expenses. The information on this page is intended to help you understand the ongoing costs of investing in the fund and to compare these costs with the ongoing costs of investing in other mutual funds.
Analyzing your fund’s expenses by share class
To illustrate these ongoing costs, we have provided an example and calculated the expenses paid by investors in each share class during the period. The information in the following table is based on an initial investment of $1,000, which is invested at the beginning of the period and held for the entire period. Expense information is calculated two ways and each method provides you with different information. The amount listed in the “Actual” column is calculated using the fund’s actual operating expenses and total return for the period. The amount listed in the “Hypothetical” column for each share class assumes that the return each year is 5% before expenses and is calculated based on the fund’s actual operating expenses. You should not use the hypothetical account values and expenses to estimate either your actual account balance at the end of the period or the expenses you paid during this period.
Compare with other funds
Since all mutual funds are required to include the same hypothetical calculations about expenses in shareholder reports, you can use this information to compare the ongoing cost of investing in the fund with other funds. To do so, compare the 5% hypothetical example with the 5% hypothetical examples that appear in the shareholder reports of other funds. As you compare hypothetical examples of other funds, it is important to note that hypothetical examples are meant to highlight the ongoing costs of investing in a fund and do not reflect any transaction costs, such as sales charges, redemption fees or exchange fees.
| | | | | | | | | | | | | | |
| 11/01/09 – 04/30/10 |
| | | Account value at the
beginning of the period ($) | | Account value at the
end of the period ($) | | Expenses paid
during the period ($) | | Fund’s annualized
expense ratio (%) |
| | | Actual | | Hypothetical | | Actual | | Hypothetical | | Actual | | Hypothetical | | Actual |
Class A | | 1,000.00 | | 1,000.00 | | 1,033.10 | | 1,020.83 | | 4.03 | | 4.01 | | 0.80 |
Class B | | 1,000.00 | | 1,000.00 | | 1,029.30 | | 1,017.11 | | 7.80 | | 7.75 | | 1.55 |
Class C | | 1,000.00 | | 1,000.00 | | 1,030.00 | | 1,017.85 | | 7.05 | | 7.00 | | 1.40 |
Class T | | 1,000.00 | | 1,000.00 | | 1,033.60 | | 1,021.32 | | 3.53 | | 3.51 | | 0.70 |
Class Z | | 1,000.00 | | 1,000.00 | | 1,034.30 | | 1,022.07 | | 2.77 | | 2.76 | | 0.55 |
Expenses paid during the period are equal to the annualized expense ratio for the share class, multiplied by the average account value over the period, then multiplied by the number of days in the fund’s most recent fiscal half-year and divided by 365.
Had the investment advisor and/or any of its affiliates not waived fees or reimbursed a portion of expenses, account value at the end of the period would have been reduced.
It is important to note that the expense amounts shown in the table are meant to highlight only ongoing costs of investing in the fund and do not reflect any transaction costs, such as sales charges, redemption fees or exchange fees. Therefore, the hypothetical examples provided may not help you determine the relative total costs of owning shares of different funds. If these transaction costs were included, your costs would have been higher.
5
Portfolio Managers’ Report – Columbia Core Bond Fund
Performance data quoted represents past performance and current performance may be lower or higher. Past performance is no guarantee of future results. The investment return and principal value will fluctuate so that shares, when redeemed, may be worth more or less than the original cost. Please visit www.columbiafunds.com for daily and most recent month-end performance updates.
| | |
| Net asset value per share |
| |
as of 04/30/10 ($) | | |
Class A | | 10.87 |
Class B | | 10.87 |
Class C | | 10.87 |
Class T | | 10.87 |
Class Z | | 10.87 |
| | |
| Distributions declared per share |
| |
05/01/09 – 04/30/10 ($) | | |
Class A | | 0.39 |
Class B | | 0.31 |
Class C | | 0.32 |
Class T | | 0.40 |
Class Z | | 0.41 |
| | |
| |
as of 04/30/10 (%) | | |
Class A | | 3.01 |
Class B | | 2.40 |
Class C | | 2.56 |
Class T | | 3.10 |
Class Z | | 3.41 |
The 30-day SEC yields reflect the fund’s earning power net of expenses, expressed as an annualized percentage of the public offering price per share at the end of the period. Had the investment advisor not waived fees or reimbursed a portion of expenses, the 30-day SEC yields would have been lower.
For the 12-month period that ended April 30, 2010, the fund’s Class A shares returned 11.29% without sales charge. The fund’s Class Z shares returned 11.57%. The fund’s return was above the 8.30% return of its benchmark, the Barclays Capital Aggregate Bond Index, for the same period. The fund underperformed the average return of the funds in its peer group, the Lipper Corporate Debt Funds A Rated Classification, which was 16.22% for the 12-month period. The fund’s maturity profile enabled it to outpace its benchmark. Its relatively conservative orientation hampered performance versus the more aggressively positioned funds in its peer group. However, this conservative positioning is consistent with our long-term investment strategy.
Maturity profile aided results
The fund’s maturity profile aided overall results. Early in 2009, we shortened portfolio duration (duration is a measure of interest rate sensitivity) on the expectation that an improvement in the national economy would lead to higher long-term interest rates, a thesis that was borne out as the year progressed. We also purchased some long-term corporate bonds, which did quite well for the period. Within these and other corporate purchases, our emphasis on the financial sector benefited returns and helped the fund outperform its benchmark.
Quality focus hampered return
The past twelve months were characterized by a dramatic recovery in the lower-quality asset classes that had suffered the most during a credit crisis that began in late 2008. In May 2009, when the reporting period began, many classes of corporate bonds and mortgage-backed investments were trading at extraordinary yield premiums to comparable Treasury securities. However, as the economy improved, so did the financial strength of issuers and the quality of any underlying collateral. Fixed-income investors who sat on the sidelines during the worst days of the crisis gained the confidence to move back in, thereby pushing the yield premiums back down to more normal levels. In this environment, high-yield bonds were the best performing sector of the fixed-income market. Because this fund, like the benchmark index, has no exposure to high-yield securities, it lagged behind competing funds that have high-yield exposure.
An emphasis on less-risky, seasoned commercial mortgage-backed securities (CMBS) also detracted from relative return. Low-quality securities generated from the lax underwriting standards of the late housing boom produced the biggest rebounds during the period, but these securities did not measure up to our quality standards for the fund. However, an overweight in CMBS benefited performance.
6
Portfolio Managers’ Report (continued) – Columbia Core Bond Fund
| | | |
| Portfolio structure | |
|
as of 04/30/10 (%) | |
Corporate Fixed-Income Bonds & Notes | | 27.3 | |
Mortgage-Backed Securities | | 25.5 | |
Commercial Mortgage-Backed Securities | | 18.8 | |
Government & Agency Obligations | | 17.0 | |
Asset-Backed Securities | | 7.1 | |
Collateralized Mortgage Obligations | | 0.4 | |
Municipal Bonds | | 0.4 | |
Short Term Obligation | | 6.0 | |
Other Assets & Liabilities, Net | | (2.5 | ) |
The fund is actively managed and the composition of its portfolio will change over time. Portfolio structure is calculated as a percentage of total net assets.
| | |
| Maturity breakdown | | |
| |
as of 04/30/10 (%) | | |
0-1 year | | 7.7 |
1-5 years | | 37.3 |
5–10 years | | 38.6 |
10-20 years | | 3.9 |
20-30 years | | 8.6 |
30 years and over | | 1.0 |
Cash & Equivalents | | 2.9 |
Maturity breakdown is based on weighted average life and calculated as a percentage of total investments. Swaps are not calculated in maturity years.
| | |
| Quality breakdown | | |
| |
as of 04/30/10 (%) | | |
AAA | | 26.0 |
AA | | 4.1 |
A | | 8.9 |
BBB | | 16.3 |
BB | | 0.7 |
CCC | | 0.1 |
Treasury | | 11.4 |
Agency | | 29.5 |
Cash and Equivalents | | 3.0 |
Quality breakdown is calculated as a percentage of total investments.
Ratings shown represent the rating assigned to a particular bond by one of the following nationally-recognized rating agencies: Standard and Poor’s, Moody’s Investors Service, Inc. or Fitch Ratings Ltd. Ratings are relative and subjective and are not absolute standards of quality. The fund’s credit quality does not remove market risk.
Looking ahead
The fund continues to be overweight in CMBS, with a corresponding underweight in securities backed by residential mortgages. Although the government’s extensive support for the secondary mortgage market has offered some interesting trading opportunities in this sector, it has not translated into a meaningful improvement for the residential housing market, hence our concern about the prevailing valuations of mortgage-backed securities. More generally, we will continue to maintain a relatively conservative investment style for this fund. Our conservative approach served the fund well in the crisis that preceded this period and is the basis, we believe, of a sound long-term investment strategy.
Portfolio characteristics and holdings are subject to change periodically and may not be representative of current characteristics and holdings. The outlook for the fund may differ from that presented for other Columbia Funds.
Investing in fixed-income securities may involve certain risks, including the credit quality of individual issuers, possible prepayments, market or economic developments and yields and share price fluctuations due to changes in interest rates. When interest rates go up, bond prices typically drop, and vice versa.
7
Investment Portfolio – Columbia Core Bond Fund
April 30, 2010
Corporate Fixed-Income Bonds & Notes – 27.3%
| | | | |
| | | Par ($) | | Value ($) |
| Basic Materials – 1.6% |
| Chemicals – 0.8% | | | | |
| Dow Chemical Co. | | | | |
5.700% 05/15/18 | | 2,485,000 | | 2,613,914 |
5.900% 02/15/15 | | 5,955,000 | | 6,531,736 |
8.550% 05/15/19 | | 1,650,000 | | 2,016,163 |
| | |
| Lubrizol Corp. | | | | |
8.875% 02/01/19 | | 1,450,000 | | 1,813,268 |
| | | | |
Chemicals Total | | | | 12,975,081 |
| | |
| Iron/Steel – 0.6% | | | | |
| ArcelorMittal | | | | |
7.000% 10/15/39 | | 530,000 | | 570,478 |
9.850% 06/01/19 | | 2,335,000 | | 3,040,800 |
| | |
| Nucor Corp. | | | | |
5.000% 06/01/13 | | 2,880,000 | | 3,118,453 |
5.850% 06/01/18 | | 1,560,000 | | 1,733,500 |
| | | | |
Iron/Steel Total | | | | 8,463,231 |
| | | | |
| Metals & Mining – 0.2% | | | | |
| Vale Overseas Ltd. | | | | |
6.875% 11/21/36 | | 3,185,000 | | 3,343,699 |
| | | | |
Metals & Mining Total | | | | 3,343,699 |
| | | | |
Basic Materials Total | | | | 24,782,011 |
| | | | |
| Communications – 3.9% |
| Media – 1.8% | | | | |
| Comcast Corp. | | | | |
5.850% 11/15/15 | | 5,985,000 | | 6,641,507 |
6.950% 08/15/37 | | 1,135,000 | | 1,264,094 |
| | |
| DirecTV Holdings LLC | | | | |
6.375% 06/15/15 | | 1,470,000 | | 1,523,287 |
| | |
| News America, Inc. | | | | |
6.400% 12/15/35 | | 1,920,000 | | 2,018,713 |
6.550% 03/15/33 | | 575,000 | | 611,128 |
| | |
| Time Warner Cable, Inc. | | | | |
3.500% 02/01/15 | | 8,105,000 | | 8,189,138 |
5.850% 05/01/17 | | 1,330,000 | | 1,441,532 |
7.300% 07/01/38 | | 2,630,000 | | 3,032,516 |
| | |
| Time Warner, Inc. | | | | |
6.500% 11/15/36 | | 3,505,000 | | 3,674,302 |
| | | | |
Media Total | | | | 28,396,217 |
| | | | |
| Telecommunication Services – 2.1% | | |
| AT&T, Inc. | | | | |
5.625% 06/15/16 | | 2,275,000 | | 2,526,790 |
6.550% 02/15/39 | | 2,490,000 | | 2,669,504 |
| | | | |
| | | Par ($) | | Value ($) |
| BellSouth Corp. | | | | |
5.200% 09/15/14 | | 5,985,000 | | 6,547,201 |
| | |
| British Telecommunications PLC | | | | |
5.150% 01/15/13 | | 4,565,000 | | 4,862,296 |
5.950% 01/15/18 | | 7,590,000 | | 7,965,667 |
|
| Cellco Partnership/Verizon Wireless Capital LLC |
5.550% 02/01/14 | | 1,565,000 | | 1,723,068 |
8.500% 11/15/18 | | 1,505,000 | | 1,904,078 |
| | |
| Telefonica Emisiones SAU | | | | |
6.221% 07/03/17 | | 1,325,000 | | 1,453,753 |
6.421% 06/20/16 | | 2,400,000 | | 2,679,480 |
| | | | |
Telecommunication Services Total | | 32,331,837 |
| | | | |
Communications Total | | | | 60,728,054 |
| | | | |
| Consumer Cyclical – 0.5% |
| Airlines – 0.1% | | | | |
| Continental Airlines, Inc. | | | | |
7.461% 04/01/15 | | 562,841 | | 576,912 |
| | | | |
Airlines Total | | | | 576,912 |
| | | | |
| Home Builders – 0.0% | | | | |
D.R. Horton, Inc. | | | | |
5.625% 09/15/14 | | 365,000 | | 363,175 |
| | | | |
Home Builders Total | | | | 363,175 |
| | | | |
| Retail – 0.4% | | | | |
| CVS Pass-Through Trust | | | | |
5.298% 01/11/27 (a) | | 713,228 | | 684,334 |
8.353% 07/10/31 (a) | | 3,560,256 | | 4,261,698 |
| | |
| Macy’s Retail Holdings, Inc. | | | | |
5.350% 03/15/12 | | 455,000 | | 475,475 |
| | |
| McDonald’s Corp. | | | | |
5.700% 02/01/39 | | 990,000 | | 1,028,576 |
| | | | |
Retail Total | | | | 6,450,083 |
| | | | |
Consumer Cyclical Total | | | | 7,390,170 |
| | | | |
| Consumer Non-Cyclical – 3.7% |
| Beverages – 0.4% | | | | |
| Anheuser-Busch InBev Worldwide, Inc. | | |
7.200% 01/15/14 (a) | | 1,460,000 | | 1,680,623 |
7.750% 01/15/19 (a) | | 1,775,000 | | 2,136,454 |
8.000% 11/15/39 (a) | | 1,705,000 | | 2,214,466 |
| | | | |
Beverages Total | | | | 6,031,543 |
See Accompanying Notes to Financial Statements.
8
Columbia Core Bond Fund
April 30, 2010
Corporate Fixed-Income Bonds & Notes (continued)
| | | | |
| | | Par ($) | | Value ($) |
| Consumer Non-Cyclical (continued) |
| Food – 2.3% | | | | |
| Campbell Soup Co. | | | | |
4.500% 02/15/19 | | 1,730,000 | | 1,792,111 |
| | |
| ConAgra Foods, Inc. | | | | |
7.000% 10/01/28 | | 3,060,000 | | 3,453,161 |
| | |
| General Mills, Inc. | | | | |
5.200% 03/17/15 | | 4,040,000 | | 4,451,066 |
| | |
| Kraft Foods, Inc. | | | | |
4.125% 02/09/16 | | 16,260,000 | | 16,674,581 |
| | |
| Kroger Co. | | | | |
3.900% 10/01/15 | | 8,875,000 | | 9,064,659 |
| | | | |
Food Total | | | | 35,435,578 |
| | | | |
| Healthcare Services – 0.4% | | | | |
| Roche Holdings, Inc. | | | | |
6.000% 03/01/19 (a) | | 4,230,000 | | 4,743,133 |
| | |
| WellPoint, Inc. | | | | |
7.000% 02/15/19 | | 1,700,000 | | 1,957,281 |
| | | | |
Healthcare Services Total | | | | 6,700,414 |
| | | | |
| Household Products/Wares – 0.2% | | |
| Fortune Brands, Inc. | | | | |
5.125% 01/15/11 | | 3,815,000 | | 3,918,623 |
| | | | |
Household Products/Wares Total | | 3,918,623 |
| | | | |
| Pharmaceuticals – 0.4% | | | | |
| Novartis Securities Investment Ltd. | | |
5.125% 02/10/19 | | 3,540,000 | | 3,804,389 |
| | |
| Wyeth | | | | |
5.500% 02/15/16 | | 2,105,000 | | 2,358,867 |
| | | | |
Pharmaceuticals Total | | | | 6,163,256 |
| | | | |
Consumer Non-Cyclical Total | | | | 58,249,414 |
| | | | |
| Energy – 3.1% | | | | |
| Oil & Gas – 1.7% | | | | |
| Canadian Natural Resources Ltd. | | | | |
6.250% 03/15/38 | | 1,445,000 | | 1,522,005 |
| | |
| Devon Energy Corp. | | | | |
6.300% 01/15/19 | | 1,230,000 | | 1,406,790 |
| | |
| Hess Corp. | | | | |
7.300% 08/15/31 | | 1,980,000 | | 2,307,908 |
| | |
| Marathon Oil Corp. | | | | |
6.000% 07/01/12 | | 3,065,000 | | 3,328,403 |
7.500% 02/15/19 | | 138,000 | | 164,248 |
| | | | |
| | | Par ($) | | Value ($) |
| Nexen, Inc. | | | | |
5.875% 03/10/35 | | 515,000 | | 510,039 |
7.500% 07/30/39 | | 1,825,000 | | 2,180,129 |
| | |
| Qatar Petroleum | | | | |
5.579% 05/30/11 (a) | | 931,853 | | 955,827 |
| |
Ras Laffan Liquefied Natural Gas Co.,
Ltd. III | | |
5.832% 09/30/16 (a) | | 2,130,000 | | 2,295,139 |
| | |
| Shell International Finance BV | | | | |
5.500% 03/25/40 | | 4,830,000 | | 4,894,471 |
| | |
| Talisman Energy, Inc. | | | | |
5.850% 02/01/37 | | 855,000 | | 849,308 |
7.750% 06/01/19 | | 4,595,000 | | 5,604,646 |
| | | | |
Oil & Gas Total | | | | 26,018,913 |
| | | | |
| Oil & Gas Services – 0.5% | | | | |
| Halliburton Co. | | | | |
5.900% 09/15/18 | | 1,095,000 | | 1,224,229 |
| | |
| Smith International, Inc. | | | | |
9.750% 03/15/19 | | 2,515,000 | | 3,417,822 |
| | |
| Weatherford International Ltd. | | | | |
5.150% 03/15/13 | | 2,305,000 | | 2,454,505 |
7.000% 03/15/38 | | 1,090,000 | | 1,207,978 |
| | | | |
Oil & Gas Services Total | | | | 8,304,534 |
| | | | |
| Pipelines – 0.9% | | | | |
| Enbridge Energy Partners LP | | | | |
7.500% 04/15/38 | | 1,000,000 | | 1,205,300 |
| |
| Kinder Morgan Energy Partners LP | | |
5.625% 02/15/15 | | 1,275,000 | | 1,396,704 |
6.500% 09/01/39 | | 365,000 | | 386,858 |
6.950% 01/15/38 | | 1,945,000 | | 2,170,087 |
| | |
| ONEOK Partners LP | | | | |
6.850% 10/15/37 | | 835,000 | | 914,449 |
| | |
| Plains All American Pipeline LP | | | | |
5.750% 01/15/20 | | 490,000 | | 511,034 |
6.500% 05/01/18 | | 1,420,000 | | 1,570,679 |
| |
| Plains All American Pipeline LP/PAA Finance Corp. | | |
8.750% 05/01/19 | | 2,445,000 | | 3,040,023 |
|
| TransCanada Pipelines Ltd. |
6.350% 05/15/67 (05/15/17) (b)(c) | | 3,725,000 | | 3,582,116 |
| | | | |
Pipelines Total | | | | 14,777,250 |
| | | | |
Energy Total | | | | 49,100,697 |
See Accompanying Notes to Financial Statements.
9
Columbia Core Bond Fund
April 30, 2010
Corporate Fixed-Income Bonds & Notes (continued)
| | | | |
| | | Par ($) | | Value ($) |
| Financials – 9.8% | | | | |
| Banks – 5.6% | | | | |
| Bank of New York Mellon Corp. | | | | |
5.450% 05/15/19 | | 2,630,000 | | 2,857,224 |
| | |
| Barclays Bank PLC | | | | |
3.900% 04/07/15 | | 4,970,000 | | 5,026,544 |
5.000% 09/22/16 | | 1,165,000 | | 1,207,040 |
| | |
| Capital One Capital IV | | | | |
6.745% 02/17/37 (c) | | 2,790,000 | | 2,483,100 |
| | |
| Capital One Capital V | | | | |
10.250% 08/15/39 | | 3,230,000 | | 3,876,000 |
| | |
| Capital One Financial Corp. | | | | |
5.700% 09/15/11 | | 3,135,000 | | 3,283,511 |
7.375% 05/23/14 | | 825,000 | | 953,505 |
| | |
| Citigroup, Inc. | | | | |
6.010% 01/15/15 | | 6,250,000 | | 6,660,944 |
| | |
| Comerica Bank | | | | |
0.363% 06/30/10 (05/28/10) (b)(c) | | 500,000 | | 499,962 |
5.200% 08/22/17 | | 2,295,000 | | 2,280,539 |
5.750% 11/21/16 | | 545,000 | | 568,969 |
| | |
| Deutsche Bank AG/London | | | | |
4.875% 05/20/13 | | 3,580,000 | | 3,843,223 |
| | |
| Discover Bank/Greenwood | | | | |
8.700% 11/18/19 | | 5,905,000 | | 6,705,895 |
| | |
| Discover Financial Services | | | | |
10.250% 07/15/19 | | 1,255,000 | | 1,538,422 |
| | |
| JPMorgan Chase Capital XVIII | | | | |
6.950% 08/17/36 | | 405,000 | | 413,390 |
| | |
| JPMorgan Chase Capital XX | | | | |
6.550% 09/29/36 | | 5,805,000 | | 5,539,444 |
| | |
| JPMorgan Chase Capital XXII | | | | |
6.450% 02/02/37 | | 2,245,000 | | 2,119,280 |
| | |
| KeyBank NA | | | | |
5.800% 07/01/14 | | 1,920,000 | | 2,036,769 |
| | |
| Keycorp | | | | |
6.500% 05/14/13 | | 3,580,000 | | 3,895,448 |
| | |
| Lloyds TSB Bank PLC | | | | |
4.375% 01/12/15 (a) | | 3,820,000 | | 3,793,283 |
| | |
| Marshall & Ilsley Bank | | | | |
5.300% 09/08/11 | | 1,076,000 | | 1,075,763 |
| | | | |
| | | Par ($) | | Value ($) |
| Merrill Lynch & Co., Inc. | | | | |
5.700% 05/02/17 (d) | | 2,645,000 | | 2,654,993 |
6.050% 08/15/12 (d) | | 385,000 | | 413,111 |
6.150% 04/25/13 (d) | | 1,400,000 | | 1,514,960 |
7.750% 05/14/38 (d) | | 2,075,000 | | 2,283,865 |
| | |
| National City Bank of Cleveland | | | | |
6.200% 12/15/11 | | 715,000 | | 767,831 |
| | |
| National City Bank of Kentucky | | | | |
6.300% 02/15/11 | | 1,275,000 | | 1,309,480 |
| | |
| National City Corp. | | | | |
4.900% 01/15/15 | | 655,000 | | 697,188 |
6.875% 05/15/19 | | 2,135,000 | | 2,387,923 |
| | |
| Northern Trust Corp. | | | | |
5.500% 08/15/13 | | 450,000 | | 499,534 |
| | |
| PNC Funding Corp. | | | | |
3.625% 02/08/15 | | 2,615,000 | | 2,639,657 |
5.125% 02/08/20 | | 3,965,000 | | 4,037,008 |
| |
| Scotland International Finance No. 2 | | |
4.250% 05/23/13 (a) | | 1,700,000 | | 1,651,268 |
| | |
| USB Capital IX | | | | |
6.189% 04/15/42 (04/15/11) (b)(c) | | 5,840,000 | | 5,073,500 |
| | |
| Wachovia Bank NA | | | | |
5.850% 02/01/37 | | 340,000 | | 328,597 |
| | | | |
Banks Total | | | | 86,917,170 |
| | | | |
| Diversified Financial Services – 0.6% | | |
| Eaton Vance Corp. | | | | |
6.500% 10/02/17 | | 1,530,000 | | 1,702,353 |
| | |
| General Electric Capital Corp. | | | | |
5.500% 01/08/20 | | 2,280,000 | | 2,375,726 |
| | |
| International Lease Finance Corp. | | | | |
4.875% 09/01/10 | | 4,572,000 | | 4,571,927 |
| | |
| Lehman Brothers Holdings, Inc. | | | | |
5.625% 01/24/13 (e) | | 3,890,000 | | 865,525 |
6.875% 05/02/18 (e) | | 505,000 | | 112,362 |
| | | | |
Diversified Financial Services Total | | 9,627,893 |
| | | | |
| Insurance – 2.6% | | | | |
| CNA Financial Corp. | | | | |
5.850% 12/15/14 | | 1,096,000 | | 1,141,578 |
7.350% 11/15/19 | | 2,164,000 | | 2,310,797 |
| |
| Hartford Financial Services Group, Inc. | | |
6.625% 03/30/40 | | 2,100,000 | | 2,058,277 |
See Accompanying Notes to Financial Statements.
10
Columbia Core Bond Fund
April 30, 2010
Corporate Fixed-Income Bonds & Notes (continued)
| | | | |
| | | Par ($) | | Value ($) |
| Financials (continued) | | | | |
| ING Groep NV | | |
5.775% 12/29/49 (12/08/15) (b)(c) | | 3,790,000 | | 3,270,505 |
| |
| Liberty Mutual Group, Inc. | | |
7.500% 08/15/36 (a) | | 6,465,000 | | 6,441,830 |
| |
| Lincoln National Corp. | | |
8.750% 07/01/19 | | 3,715,000 | | 4,634,210 |
| |
| MetLife Capital Trust X | | |
9.250% 04/08/38 (a)(c) | | 915,000 | | 1,070,550 |
| |
| MetLife, Inc. | | |
10.750% 08/01/39 | | 3,285,000 | | 4,232,240 |
| |
| Principal Life Income Funding Trusts | | |
5.300% 04/24/13 | | 4,930,000 | | 5,298,527 |
| |
| Prudential Financial, Inc. | | |
7.375% 06/15/19 | | 3,145,000 | | 3,704,335 |
| |
| Transatlantic Holdings, Inc. | | |
8.000% 11/30/39 | | 2,840,000 | | 2,980,018 |
| |
| Unum Group | | |
7.125% 09/30/16 | | 3,420,000 | | 3,757,253 |
| | | | |
Insurance Total | | | | 40,900,120 |
| | | | |
| Real Estate Investment Trusts (REITs) – 1.0% |
| Brandywine Operating Partnership LP | | |
7.500% 05/15/15 | | 4,055,000 | | 4,457,856 |
| |
| Camden Property Trust | | |
5.375% 12/15/13 | | 1,744,000 | | 1,836,463 |
| |
| Duke Realty LP | | |
7.375% 02/15/15 | | 1,480,000 | | 1,644,748 |
8.250% 08/15/19 | | 5,335,000 | | 6,061,542 |
| |
| Highwoods Properties, Inc. | | |
5.850% 03/15/17 | | 995,000 | | 975,827 |
| | | | |
Real Estate Investment Trusts (REITs) Total | | 14,976,436 |
| | | | |
Financials Total | | | | 152,421,619 |
| | | | |
| Industrials – 2.3% | | | | |
| Aerospace & Defense – 0.4% | | | | |
| Embraer Overseas Ltd. | | | | |
6.375% 01/15/20 | | 3,070,000 | | 3,131,400 |
| |
| Raytheon Co. | | |
7.200% 08/15/27 | | 2,595,000 | | 3,136,307 |
| | | | |
Aerospace & Defense Total | | | | 6,267,707 |
| | | | |
| | | Par ($) | | Value ($) |
| Machinery-Construction & Mining – 0.2% | | |
| Caterpillar, Inc. | | |
8.250% 12/15/38 | | 2,040,000 | | 2,802,652 |
| | | | |
Machinery-Construction & Mining Total | | 2,802,652 |
| | | | |
| Miscellaneous Manufacturing – 0.5% | | |
| Ingersoll Rand Global Holding Co., Ltd. | | |
9.500% 04/15/14 | | 2,975,000 | | 3,647,638 |
| |
| Tyco International Ltd./Tyco International Finance SA | | |
6.875% 01/15/21 | | 2,900,000 | | 3,398,232 |
| | | | |
Miscellaneous Manufacturing Total | | 7,045,870 |
| | | | |
| Transportation – 1.2% | | |
| BNSF Funding Trust I | | | | |
6.613% 12/15/55 (01/15/26) (b)(c) | | 3,560,000 | | 3,515,500 |
| |
| Burlington Northern Santa Fe Corp. | | |
7.950% 08/15/30 | | 1,260,000 | | 1,569,901 |
| |
| CSX Corp. | | |
6.250% 04/01/15 | | 5,985,000 | | 6,761,039 |
| |
| Union Pacific Corp. | | |
5.700% 08/15/18 | | 1,735,000 | | 1,870,098 |
6.650% 01/15/11 | | 5,550,000 | | 5,763,447 |
| | | | |
Transportation Total | | | | 19,479,985 |
| | | | |
Industrials Total | | | | 35,596,214 |
| | | | |
| Technology – 0.4% | | | | |
| Networking Products – 0.2% | | | | |
| Cisco Systems, Inc. | | | | |
5.900% 02/15/39 | | 2,860,000 | | 2,998,518 |
| | | | |
Networking Products Total | | | | 2,998,518 |
| | |
| Software – 0.2% | | | | |
Oracle Corp. | | | | |
6.500% 04/15/38 | | 2,500,000 | | 2,858,568 |
| | | | |
Software Total | | | | 2,858,568 |
| | | | |
Technology Total | | | | 5,857,086 |
| | | | |
| Utilities – 2.0% | | | | |
| Electric – 1.5% | | | | |
| American Electric Power Co., Inc. | | |
5.250% 06/01/15 | | 820,000 | | 886,497 |
| | |
| Carolina Power & Light Co. | | | | |
5.125% 09/15/13 | | 2,545,000 | | 2,785,790 |
See Accompanying Notes to Financial Statements.
11
Columbia Core Bond Fund
April 30, 2010
Corporate Fixed-Income Bonds & Notes (continued)
| | | | |
| | | Par ($) | | Value ($) |
| Utilities (continued) | | | | |
| Commonwealth Edison Co. | | | | |
5.900% 03/15/36 | | 790,000 | | 835,638 |
5.950% 08/15/16 | | 2,825,000 | | 3,121,196 |
6.150% 09/15/17 | | 1,200,000 | | 1,341,866 |
6.950% 07/15/18 | | 1,575,000 | | 1,806,527 |
| |
| Consolidated Edison Co. of New York, Inc. | | |
6.750% 04/01/38 | | 610,000 | | 715,262 |
| | |
| Duke Energy Corp. | | | | |
5.300% 10/01/15 | | 2,400,000 | | 2,668,301 |
| | |
| Exelon Generation Co. LLC | | | | |
6.200% 10/01/17 | | 1,000,000 | | 1,108,600 |
| | |
| FPL Energy National Wind LLC | | | | |
5.608% 03/10/24 (a) | | 708,470 | | 715,179 |
| | |
| Hydro Quebec | | | | |
8.500% 12/01/29 | | 1,195,000 | | 1,607,464 |
| |
| MidAmerican Energy Holdings Co. | | |
5.875% 10/01/12 | | 1,655,000 | | 1,811,935 |
| | |
| Niagara Mohawk Power Corp. | | | | |
4.881% 08/15/19 (a) | | 1,395,000 | | 1,439,025 |
| | |
| Southern California Edison Co. | | | | |
5.000% 01/15/16 | | 2,500,000 | | 2,729,592 |
| | | | |
Electric Total | | | | 23,572,872 |
| | |
Gas – 0.5% | | | | |
| Atmos Energy Corp. | | | | |
6.350% 06/15/17 | | 1,760,000 | | 1,926,927 |
8.500% 03/15/19 | | 2,120,000 | | 2,661,164 |
| | |
| Nakilat, Inc. | | | | |
6.067% 12/31/33 (a) | | 2,280,000 | | 2,084,376 |
| | |
| Sempra Energy | | | | |
6.500% 06/01/16 | | 1,315,000 | | 1,495,108 |
| | | | |
Gas Total | | | | 8,167,575 |
| | | | |
Utilities Total | | | | 31,740,447 |
| | | | |
Total Corporate Fixed-Income Bonds & Notes
(cost of $400,415,912) | | 425,865,712 |
| |
Mortgage-Backed Securities – 25.5% | | |
| Federal Home Loan Mortgage Corp. | | |
4.500% 09/01/24 | | 9,552,731 | | 9,943,693 |
4.500% 11/01/24 | | 40,196,928 | | 41,842,056 |
5.583% 08/01/37 (05/01/10) (b)(c) | | 6,305,126 | | 6,664,094 |
| | | | |
| | | Par ($) | | Value ($) |
5.626% 06/01/37 (05/01/10) (b)(c) | | 4,782,477 | | 5,056,086 |
5.707% 06/01/36 (05/01/10) (b)(c) | | 7,611,014 | | 8,050,869 |
6.000% 02/01/39 | | 4,113,446 | | 4,407,797 |
7.000% 12/01/10 | | 3,903 | | 3,984 |
7.000% 12/01/14 | | 24,259 | | 26,218 |
7.000% 11/01/25 | | 3,907 | | 4,388 |
7.000% 03/01/27 | | 2,744 | | 3,075 |
7.000% 10/01/31 | | 22,330 | | 24,902 |
7.500% 09/01/25 | | 1,491 | | 1,691 |
7.500% 10/01/29 | | 80,000 | | 91,079 |
8.000% 06/01/26 | | 1,881 | | 2,164 |
9.500% 04/01/11 | | 47 | | 48 |
9.500% 09/01/16 | | 703 | | 793 |
10.000% 05/01/11 | | 663 | | 673 |
| |
| Federal National Mortgage Association | | |
3.199% 08/01/36 (05/01/10) (b)(c) | | 100,600 | | 104,821 |
4.000% 03/01/39 | | 8,919,697 | | 8,736,193 |
4.000% 10/01/39 | | 14,506,450 | | 14,203,477 |
4.000% 11/01/39 | | 2,962,488 | | 2,900,615 |
4.000% 12/01/39 | | 4,111,849 | | 4,025,972 |
4.500% 07/01/24 | | 6,979,962 | | 7,264,539 |
4.500% 11/01/24 | | 10,016,448 | | 10,424,824 |
4.500% 02/01/39 | | 22,738,935 | | 22,952,349 |
4.500% 02/01/40 | | 27,000,016 | | 27,253,423 |
4.500% 04/01/40 | | 27,000,000 | | 27,253,407 |
4.760% 09/01/19 | | 4,334,991 | | 4,566,929 |
4.770% 06/01/19 | | 4,494,849 | | 4,753,350 |
4.847% 04/01/38 (05/01/10) (b)(c) | | 5,935,709 | | 6,280,482 |
4.901% 04/01/38 (05/01/10) (b)(c) | | 7,129,551 | | 7,539,547 |
5.240% 09/01/12 | | 2,287,090 | | 2,438,832 |
5.532% 10/01/37 (05/01/10) (b)(c) | | 4,831,245 | | 5,079,722 |
5.783% 09/01/37 (05/01/10) (b)(c) | | 5,640,216 | | 5,956,308 |
6.000% 05/01/37 | | 15,308,299 | | 16,304,454 |
6.000% 08/01/38 | | 37,537,502 | | 39,956,714 |
6.000% 12/01/38 | | 12,378,704 | | 13,176,485 |
7.000% 06/01/32 | | 12,379 | | 13,854 |
7.500% 10/01/15 | | 16,593 | | 18,181 |
7.500% 01/01/30 | | 11,891 | | 13,427 |
7.785% 02/01/19 | | 1,626,172 | | 1,835,141 |
8.000% 12/01/29 | | 208,075 | | 240,793 |
8.000% 02/01/30 | | 17,924 | | 20,733 |
8.000% 03/01/30 | | 32,865 | | 37,999 |
8.000% 04/01/30 | | 31,926 | | 36,914 |
8.000% 05/01/30 | | 4,971 | | 5,747 |
8.500% 08/01/17 | | 962 | | 1,058 |
10.000% 10/01/20 | | 58,219 | | 64,204 |
10.000% 12/01/20 | | 133,755 | | 149,858 |
See Accompanying Notes to Financial Statements.
12
Columbia Core Bond Fund
April 30, 2010
Mortgage-Backed Securities (continued)
| | | | |
| | | Par ($) | | Value ($) |
| TBA, | | | | |
4.500% 04/01/40 (f) | | 50,000,000 | | 50,406,250 |
|
| Government National Mortgage Association |
3.625% 07/20/21 (05/01/10) (b)(c) | | 40,841 | | 42,130 |
3.625% 07/20/22 (05/01/10) (b)(c) | | 46,910 | | 48,390 |
4.375% 04/20/22 (05/01/10) (b)(c) | | 197,149 | | 204,356 |
4.500% 07/15/39 | | 24,755,033 | | 25,189,792 |
4.500% 02/15/40 | | 9,973,183 | | 10,148,337 |
7.000% 05/15/12 | | 11,059 | | 11,764 |
7.000% 09/15/13 | | 18,968 | | 20,287 |
7.000% 11/15/22 | | 47,545 | | 53,007 |
7.000% 10/15/23 | | 8,222 | | 9,179 |
7.000% 06/15/26 | | 140,100 | | 156,838 |
7.000% 10/15/27 | | 15,830 | | 17,739 |
7.000% 05/15/28 | | 27,523 | | 30,865 |
7.000% 06/15/28 | | 6,343 | | 7,114 |
7.000% 12/15/28 | | 36,753 | | 41,216 |
7.000% 08/15/29 | | 19,988 | | 22,429 |
7.000% 02/15/30 | | 4,406 | | 4,947 |
7.000% 05/15/32 | | 101,307 | | 113,827 |
7.500% 04/15/26 | | 89,402 | | 100,799 |
7.500% 02/15/27 | | 13,206 | | 14,902 |
7.500% 09/15/29 | | 288,496 | | 325,949 |
7.500% 03/15/30 | | 79,019 | | 89,325 |
8.000% 06/15/25 | | 3,347 | | 3,838 |
8.000% 10/15/25 | | 17,100 | | 19,613 |
8.000% 01/15/26 | | 5,675 | | 6,516 |
8.000% 02/15/26 | | 2,055 | | 2,359 |
8.000% 06/15/26 | | 8,236 | | 9,457 |
8.000% 03/15/27 | | 12,187 | | 13,986 |
9.000% 11/15/17 | | 31,955 | | 35,396 |
9.500% 08/15/20 | | 1,744 | | 2,010 |
9.500% 12/15/20 | | 1,138 | | 1,312 |
10.000% 05/15/16 | | 2,488 | | 2,725 |
10.000% 07/15/17 | | 13,498 | | 15,022 |
10.000% 08/15/17 | | 3,533 | | 3,932 |
11.500% 06/15/13 | | 12,887 | | 14,320 |
| | | | |
Total Mortgage-Backed Securities
(cost of $394,492,092) | | 396,923,890 |
|
Commercial Mortgage-Backed Securities – 18.8% |
| Bear Stearns Commercial Mortgage Securities |
4.740% 03/13/40 | | 14,889,000 | | 15,636,715 |
4.830% 08/15/38 | | 2,275,000 | | 2,379,162 |
4.933% 02/13/42 (05/01/10) (b)(c) | | 2,707,000 | | 2,820,395 |
| | | | |
| | | Par ($) | | Value ($) |
5.145% 01/12/45 | | 5,358,602 | | 5,456,296 |
5.201% 12/11/38 | | 2,425,000 | | 2,450,856 |
5.540% 09/11/41 | | 2,110,000 | | 2,183,430 |
5.588% 09/11/42 | | 9,635,000 | | 10,179,397 |
5.742% 09/11/42 (05/01/10) (b)(c) | | 4,970,000 | | 5,224,542 |
5.908% 06/11/40 (05/01/10) (b)(c) | | 8,079,000 | | 8,226,632 |
6.480% 02/15/35 | | 16,149,167 | | 16,608,417 |
|
Chase Commercial Mortgage Securities Corp. |
6.484% 02/12/16 (05/01/10) (a)(b)(c) | | 12,500,768 | | 12,910,174 |
|
Citigroup Commercial Mortgage Trust |
4.733% 10/15/41 | | 3,765,000 | | 3,921,439 |
| |
Citigroup/Deutsche Bank Commercial Mortgage Trust | | |
5.399% 07/15/44 (05/01/10) (b)(c) | | 8,510,000 | | 8,886,144 |
|
Credit Suisse Mortgage Capital Certificates |
5.912% 06/15/39 (05/01/10) (b)(c) | | 6,860,000 | | 6,552,553 |
|
CW Capital Cobalt Ltd. |
6.015% 05/15/46 (05/01/10) (b)(c) | | 10,495,000 | | 10,225,383 |
| |
| Greenwich Capital Commercial Funding Corp. | | |
5.317% 06/10/36 (05/01/10) (b)(c) | | 11,481,000 | | 12,141,348 |
6.085% 07/10/38 (05/01/10) (b)(c) | | 3,075,000 | | 3,197,602 |
| | |
| GS Mortgage Securities Corp. II | | | | |
5.560% 11/10/39 | | 7,745,000 | | 7,870,535 |
| |
| JPMorgan Chase Commercial Mortgage Securities Corp. | | |
5.255% 07/12/37 | | 3,875,000 | | 4,131,229 |
5.552% 05/12/45 | | 8,500,000 | | 8,705,107 |
6.068% 02/12/51 | | 2,823,000 | | 2,695,066 |
|
| LB-UBS Commercial Mortgage Trust |
4.853% 09/15/31 | | 15,070,000 | | 15,861,838 |
5.124% 11/15/32 (05/11/10) (b)(c) | | 6,865,000 | | 7,291,419 |
5.430% 02/15/40 | | 5,495,000 | | 5,364,862 |
5.611% 04/15/41 | | 2,728,277 | | 2,839,765 |
5.866% 09/15/45 (05/11/10) (b)(c) | | 3,005,000 | | 2,994,033 |
|
Merrill Lynch Mortgage Investors, Inc. |
I.O., | | |
0.571% 12/15/30 (05/01/10) (b)(c) | | 3,348,282 | | 65,465 |
| | |
| Merrill Lynch Mortgage Trust | | | | |
4.747% 06/12/43 (05/01/10) (b)(c) | | 7,500,000 | | 7,681,933 |
| | |
| Morgan Stanley Capital I | | | | |
4.970% 12/15/41 | | 7,949,000 | | 8,334,499 |
5.150% 06/13/41 | | 11,945,000 | | 12,706,881 |
5.328% 11/12/41 | | 6,000,000 | | 6,163,198 |
5.802% 06/11/42 (05/01/10) (b)(c) | | 2,500,000 | | 2,621,871 |
See Accompanying Notes to Financial Statements.
13
Columbia Core Bond Fund
April 30, 2010
Commercial Mortgage-Backed Securities (continued)
| | | | |
| | | Par ($) | | Value ($) |
| Morgan Stanley Dean Witter Capital I |
4.920% 03/12/35 | | 10,270,000 | | 10,814,473 |
5.080% 09/15/37 | | 3,695,000 | | 3,877,489 |
5.980% 01/15/39 | | 4,010,000 | | 4,251,494 |
6.390% 07/15/33 | | 6,294,902 | | 6,536,316 |
|
| Wachovia Bank Commercial Mortgage Trust |
4.039% 10/15/41 | | 7,157,838 | | 7,219,899 |
5.037% 03/15/42 | | 5,487,404 | | 5,780,875 |
5.308% 11/15/48 | | 4,535,000 | | 4,614,767 |
5.383% 10/15/44 (05/01/10) (b)(c) | | 5,960,000 | | 6,313,283 |
5.609% 03/15/45 (05/01/10) (b)(c) | | 5,052,000 | | 4,833,329 |
5.726% 06/15/45 | | 1,172,273 | | 1,179,377 |
5.765% 07/15/45 (05/01/10) (b)(c) | | 10,365,000 | | 10,727,497 |
5.997% 06/15/45 | | 2,610,000 | | 2,787,825 |
| | | | |
Total Commercial Mortgage-Backed Securities
(cost of $273,399,882) | | 293,264,810 |
|
Government & Agency Obligations – 17.0% |
| | | | |
| Foreign Government Obligations – 1.9% |
| European Investment Bank | | | | |
3.000% 04/08/14 | | 3,295,000 | | 3,388,683 |
5.125% 05/30/17 | | 2,985,000 | | 3,318,371 |
| | |
| Export-Import Bank of Korea | | | | |
5.500% 10/17/12 | | 700,000 | | 751,202 |
| |
| International Bank for Reconstruction & Development | | |
5.000% 04/01/16 | | 10,570,000 | | 11,721,718 |
|
| Pemex Project Funding Master Trust |
5.750% 03/01/18 | | 2,885,000 | | 2,981,743 |
| | |
| Province of Quebec | | | | |
4.625% 05/14/18 | | 6,395,000 | | 6,803,340 |
| | |
| Republic of Italy | | | | |
5.375% 06/12/17 | | 1,275,000 | | 1,382,577 |
| | | | |
Foreign Government Obligations Total | | 30,347,634 |
| | | | |
| U.S. Government Agencies – 3.7% |
| Federal Home Loan Banks | | | | |
0.700% 06/23/11 | | 23,280,000 | | 23,289,824 |
|
| Resolution Funding Corp., STRIPS |
(g) 10/15/19 | | 11,225,000 | | 7,494,124 |
(g) 10/15/20 | | 10,840,000 | | 6,782,155 |
| | | | |
| | | Par ($) | | Value ($) |
(g) 01/15/21 | | 19,755,000 | | 12,196,480 |
(g) 01/15/30 | | 20,000,000 | | 7,455,060 |
| | | | |
U.S. Government Agencies Total | | 57,217,643 |
| | | | |
| U.S. Government Obligations – 11.4% |
| U.S. Treasury Bonds | | | | |
4.375% 11/15/39 | | 4,425,000 | | 4,314,375 |
4.500% 02/15/36 | | 23,000,000 | | 23,122,176 |
6.125% 11/15/27 | | 15,900,000 | | 19,482,461 |
|
| U.S. Treasury Inflation Indexed Note |
1.625% 01/15/18 | | 21,229,376 | | 22,209,579 |
3.000% 07/15/12 | | 3,104,034 | | 3,360,601 |
| | |
| U.S. Treasury Notes | | | | |
0.875% 01/31/12 (h) | | 79,890,000 | | 79,930,584 |
3.125% 05/15/19 | | 55,000 | | 53,139 |
3.375% 11/15/19 | | 2,997,000 | | 2,934,486 |
3.625% 08/15/19 | | 9,314,000 | | 9,328,549 |
3.625% 02/15/20 | | 1,815,000 | | 1,809,611 |
| | |
| U.S. Treasury STRIPS | | | | |
(g) 05/15/39 | | 42,000,000 | | 10,692,234 |
| | | | |
U.S. Government Obligations Total | | 177,237,795 |
| | | | |
Total Government & Agency Obligations (cost of $258,684,192) | | 264,803,072 |
| | |
Asset-Backed Securities – 7.1% | | | | |
| Ally Auto Receivables Trust | | | | |
1.450% 05/15/14 | | 1,800,000 | | 1,798,337 |
|
| American Express Credit Account Master Trust |
0.294% 02/15/13 (05/17/10) (b)(c) | | 7,460,000 | | 7,459,252 |
0.534% 01/15/13 (05/17/10) (a)(b)(c) | | 2,855,000 | | 2,851,745 |
|
| AmeriCredit Automobile Receivables Trust |
0.970% 01/15/13 | | 7,025,000 | | 7,021,379 |
|
| Bay View Auto Trust |
5.310% 06/25/14 | | 2,550,000 | | 2,579,246 |
|
| BMW Vehicle Lease Trust |
2.040% 04/15/11 | | 3,039,407 | | 3,047,168 |
| |
| Bombardier Capital Mortgage Securitization Corp. | | |
6.230% 04/15/28 | | 2,036 | | 1,945 |
|
| Capital Auto Receivables Asset Trust |
5.730% 03/15/11 | | 4,000,000 | | 4,003,962 |
See Accompanying Notes to Financial Statements.
14
Columbia Core Bond Fund
April 30, 2010
Asset-Backed Securities (continued)
| | | | |
| | | Par ($) | | Value ($) |
| Capital One Multi-Asset Execution Trust |
1.354% 04/15/13 (05/17/10) (b)(c) | | 4,570,000 | | 4,575,692 |
|
| Capital One Prime Auto Receivables Trust |
4.890% 01/15/12 | | 1,343,926 | | 1,354,795 |
|
| Chrysler Financial Lease Trust |
1.780% 06/15/11 (a) | | 2,750,000 | | 2,747,364 |
|
| Citibank Credit Card Issuance Trust |
0.241% 05/21/12 (05/21/10) (b)(c) | | 2,405,000 | | 2,404,707 |
2.250% 12/23/14 | | 7,140,000 | | 7,221,579 |
6.300% 06/20/14 | | 325,000 | | 346,783 |
6.950% 02/18/14 | | 1,130,000 | | 1,211,256 |
|
| Citigroup Mortgage Loan Trust, Inc. |
5.517% 08/25/35 (05/01/10) (b)(c) | | 2,800,000 | | 204,907 |
5.666% 08/25/35 (05/01/10) (b)(c) | | 1,885,000 | | 108,416 |
|
| Daimler Chrysler Auto Trust |
4.940% 02/08/12 | | 5,975,314 | | 6,028,733 |
|
| Discover Card Master Trust |
0.597% 06/15/15 (06/15/10) (b)(c) | | 1,620,000 | | 1,617,227 |
0.904% 09/15/15 (05/17/10) (b)(c) | | 7,775,000 | | 7,823,187 |
1.554% 12/15/14 (05/17/10) (b)(c) | | 3,375,000 | | 3,407,161 |
1.554% 02/17/15 (05/17/10) (b)(c) | | 2,820,000 | | 2,880,278 |
|
| Equity One ABS, Inc. |
0.603% 07/25/34 (05/25/10) (b)(c) | | 366,903 | | 276,427 |
|
| Ford Credit Auto Owner Trust |
1.320% 06/15/14 | | 3,700,000 | | 3,701,718 |
5.150% 11/15/11 | | 2,959,812 | | 3,003,036 |
5.160% 04/15/13 | | 9,405,000 | | 9,988,001 |
5.680% 06/15/12 | | 2,300,000 | | 2,387,671 |
|
| Franklin Auto Trust |
5.360% 05/20/16 | | 4,980,000 | | 5,143,209 |
7.160% 05/20/16 (a) | | 2,425,000 | | 2,607,117 |
|
| GE Capital Credit Card Master Note Trust |
4.130% 06/15/13 | | 3,966,000 | | 3,982,633 |
|
| Green Tree Financial Corp. |
8.250% 07/15/27 (c) | | 309,525 | | 317,943 |
|
| GSAA Trust |
4.316% 11/25/34 (05/01/10) (b)(c) | | 575,737 | | 551,739 |
|
| Long Beach Auto Receivables Trust |
4.522% 06/15/12 | | 747,134 | | 748,038 |
|
| Oakwood Mortgage Investors, Inc. |
7.100% 08/15/27 | | 87 | | 87 |
| | | | |
| | | Par ($) | | Value ($) |
| Origen Manufactured Housing |
4.490% 05/15/18 | | 80,704 | | 81,127 |
|
| USAA Auto Owner Trust |
4.900% 02/15/12 (02/15/11) (b)(c) | | 1,401,623 | | 1,411,858 |
|
| Wachovia Auto Loan Owner Trust |
5.650% 02/20/13 | | 5,000,000 | | 5,171,218 |
| | | | |
Total Asset-Backed Securities (cost of $112,980,791) | | | | 110,066,941 |
|
Collateralized Mortgage Obligations – 0.4% |
| | | | |
| Agency – 0.4% | | | | |
| Federal National Mortgage Association |
4.717% 08/25/12 | | 3,573,070 | | 3,758,206 |
5.500% 09/25/35 | | 1,681,975 | | 1,719,268 |
| | |
| Vendee Mortgage Trust | | | | |
I.O.: | | | | |
0.301% 03/15/29 (05/01/10) (b)(c) | | 6,665,842 | | 63,332 |
0.441% 03/15/28 (05/01/10) (b)(c) | | 5,011,498 | | 65,855 |
| | | | |
Agency Total | | | | 5,606,661 |
| | | | |
| Non-Agency – 0.0% | | | | |
| |
| Countrywide Alternative Loan Trust | | |
5.500% 09/25/35 | | 4,657,027 | | 302,798 |
| | | | |
Non-Agency Total | | | | 302,798 |
| | | | |
Total Collateralized Mortgage Obligations
(cost of $9,811,743) | | 5,909,459 |
| | |
Municipal Bonds – 0.4% | | | | |
| | | | |
| California – 0.4% | | | | |
| CA State | | | | |
Series 2009, 7.550% 04/01/39 | | 2,850,000 | | 3,169,400 |
| |
| CA Los Angeles Unified School District | | |
Series 2009, 5.750% 07/01/34 | | 2,430,000 | | 2,317,661 |
| | | | |
California Total | | | | 5,487,061 |
| | | | |
Total Municipal Bonds
(cost of $5,200,888) | | | | 5,487,061 |
See Accompanying Notes to Financial Statements.
15
Columbia Core Bond Fund
April 30, 2010
Short-Term Obligation – 6.0%
| | | | | |
| | | Par ($) | | Value ($) | |
| Repurchase Agreement – 6.0% | |
Repurchase agreement with Fixed Income Clearing Corp., dated 04/30/10, due 05/03/10 at 0.130%, collateralized by U.S. Government Agency obligations with various maturities to 08/18/11, market value $95,152,803 (repurchase proceeds $93,284,011) | | 93,283,000 | | 93,283,000 | |
| | | | | |
Total Short-Term Obligation (cost of $93,283,000) | | | | 93,283,000 | |
| | | | | |
Total Investments – 102.5%
(cost of $1,548,268,500) (i) | | 1,595,603,945 | |
| | | | | |
Other Assets & Liabilities, Net – (2.5)% | | (38,341,809 | ) |
| | | | | |
Net Assets – 100.0% | | | | 1,557,262,136 | |
Notes to Investment Portfolio:
| (a) | Security exempt from registration pursuant to Rule 144A under the Securities Act of 1933. These securities may be resold in transactions exempt from registration, normally to qualified institutional buyers. At April 30, 2010, these securities, which are not illiquid, except for the following, amounted to $57,283,585, which represents 3.7% of net assets. |
| | | | | | | | | | | |
Security | | Acquisition Date | | Par | | Cost | | Value |
Qatar Petroleum
5.579% 05/30/11 | | 05/19/06 | | $ | 931,853 | | $ | 931,853 | | $ | 955,827 |
| (b) | Parenthetical date represents the next interest rate reset date for the security. |
| (c) | The interest rate shown on floating rate or variable rate securities reflects the rate at April 30, 2010. |
| (d) | Investment in affiliates during the year ended April 30, 2010: |
| | | | | | | | | | | | | | | |
Affiliate | | Value,
beginning
of period | | Purchases | | Sales
Proceeds | | Interest
Income | | Value, end
of period |
Merrill Lynch & Co., Inc.
5.700% 05/02/17 | | $ | 2,524,029 | | $ | — | | $ | 1,205,870 | | $ | 215,698 | | $ | 2,654,993 |
Merrill Lynch & Co., Inc. 6.050% 08/15/12 | | | 593,260 | | | — | | | 279,380 | | | 31,551 | | | 413,111 |
Merrill Lynch & Co., Inc. 6.150% 04/25/13 | | | 2,022,680 | | | — | | | 854,608 | | | 111,793 | | | 1,514,960 |
Merrill Lynch & Co., Inc. 7.750% 05/14/38 | | | 1,417,161 | | | — | | | — | | | 160,813 | | | 2,283,865 |
| | | | | | | | | | | | | | | |
Total | | $ | 6,557,130 | | $ | — | | $ | 2,339,858 | | $ | 519,855 | | $ | 6,866,929 |
| | | | | | | | | | | | | | | |
| (e) | The issuer has filed for bankruptcy protection under Chapter 11, and is in default of certain debt covenants. Income is not being accrued. At April 30, 2010, the value of these securities amounted to $977,887, which represents 0.1% of net assets. |
| (f) | Security purchased on a delayed delivery basis. |
| (h) | A portion of this security with a market value of $3,001,524 is pledged as collateral for open futures contracts. |
| (i) | Cost for federal income tax purposes is $1,546,778,650. |
The following table summarizes the inputs used, as of April 30, 2010, in valuing the Fund’s assets:
| | | | | | | | | | | | |
Description | | Quoted Prices
(Level 1) | | Other
Significant
Observable
Inputs
(Level 2) | | Significant
Unobservable
Inputs
(Level 3) | | Total |
Corporate Fixed-
Income Bonds & Notes | | | | | | | | | | | | |
Basic Materials | | $ | — | | $ | 24,782,011 | | $ | — | | $ | 24,782,011 |
Communications | | | — | | | 60,728,054 | | | — | | | 60,728,054 |
Consumer Cyclical | | | — | | | 6,813,258 | | | 576,912 | | | 7,390,170 |
Consumer Non-Cyclical | | | — | | | 58,249,414 | | | — | | | 58,249,414 |
Energy | | | — | | | 49,100,697 | | | — | | | 49,100,697 |
Financials | | | — | | | 152,421,619 | | | — | | | 152,421,619 |
Industrials | | | — | | | 35,596,214 | | | — | | | 35,596,214 |
Technology | | | — | | | 5,857,086 | | | — | | | 5,857,086 |
Utilities | | | — | | | 31,740,447 | | | — | | | 31,740,447 |
| | | | | | | | | | | | |
Total Corporate Fixed-Income Bonds & Notes | | | — | | | 425,288,800 | | | 576,912 | | | 425,865,712 |
| | | | | | | | | | | | |
Total Mortgage-
Backed Securities | | | 50,406,250 | | | 346,517,640 | | | — | | | 396,923,890 |
| | | | | | | | | | | | |
Total Commercial Mortgage-Backed Securities | | | — | | | 293,264,810 | | | — | | | 293,264,810 |
| | | | | | | | | | | | |
Government & Agency Obligations | | | | | | | | | | | | |
Foreign Government Obligations | | | — | | | 30,347,634 | | | — | | | 30,347,634 |
U.S. Government Agencies | | | — | | | 57,217,643 | | | — | | | 57,217,643 |
U.S. Government Obligations | | | 177,237,795 | | | — | | | — | | | 177,237,795 |
| | | | | | | | | | | | |
Total Government & Agency Obligations | | | 177,237,795 | | | 87,565,277 | | | — | | | 264,803,072 |
| | | | | | | | | | | | |
Total Asset-Backed Securities | | | — | | | 110,066,941 | | | — | | | 110,066,941 |
| | | | | | | | | | | | |
See Accompanying Notes to Financial Statements.
16
Columbia Core Bond Fund
April 30, 2010
| | | | | | | | | | | | | | | |
Description | | Quoted Prices
(Level 1) | | | Other
Significant
Observable
Inputs
(Level 2) | | | Significant
Unobservable
Inputs
(Level 3) | | Total | |
Collateralized
Mortgage Obligations | | | | | | | | | | | | | | | |
Agency | | $ | — | | | $ | 5,606,661 | | | $ | — | | $ | 5,606,661 | |
Non-Agency | | | — | | | | 302,798 | | | | — | | | 302,798 | |
| | | | | | | | | | | | | | | |
Total Collateralized Mortgage Obligations | | | — | | | | 5,909,459 | | | | — | | | 5,909,459 | |
| | | | | | | | | | | | | | | |
Total Municipal
Bonds | | | — | | | | 5,487,061 | | | | — | | | 5,487,061 | |
| | | | | | | | | | | | | | | |
Total Short-Term Obligation | | | — | | | | 93,283,000 | | | | — | | | 93,283,000 | |
| | | | | | | | | | | | | | | |
Total Investments | | | 227,644,045 | | | | 1,367,382,988 | | | | 576,912 | | | 1,595,603,945 | |
| | | | | | | | | | | | | | | |
Unrealized
Appreciation on Futures Contracts | | | 78,360 | | | | — | | | | — | | | 78,360 | |
Unrealized
Depreciation on Futures Contracts | | | (1,776,217 | ) | | | — | | | | — | | | (1,776,217 | ) |
Value of
Credit Default
Swap Contracts-
Appreciation | | | — | | | | 77,116 | | | | — | | | 77,116 | |
Value of
Credit Default
Swap Contracts-
Depreciation | | | — | | | | (758,309 | ) | | | — | | | (758,309 | ) |
| | | | | | | | | | | | | | | |
Total | | $ | 225,946,188 | | | $ | 1,366,701,795 | | | $ | 576,912 | | $ | 1,593,224,895 | |
| | | | | | | | | | | | | | | |
The following table reconciles asset balances for the year ended April 30, 2010, in which significant unobservable inputs (Level 3) were used in determining value:
| | | | | | | | | | | | | | | | | | | | | | | | | | | | |
Investment in Securities | | Balance
as of
April 30, 2009 | | Accrued
Discounts (Premiums) | | Realized
Gain
(Loss) | | Change in
Unrealized
Appreciation
(Depreciation) | | Purchases | | Sales | | | Transfers
into
Level 3 | | Transfers
out of
Level 3 | | Balance
as of
April 30, 2010 |
Corporate Fixed-Income Bonds & Notes | | | | | | | | | | | | | | | | | | | | | | | | | |
Consumer Cyclical | | $ | 485,617 | | $ | — | | $ | 6,844 | | $ | 186,838 | | $ | — | | $ | (102,387 | ) | | $ | — | | $ | — | | $ | 576,912 |
The information in the above reconciliation represents fiscal year to date activity for any securities identified as using Level 3 inputs at either the beginning or the end of the current fiscal period.
The change in unrealized appreciation attributable to the security owned at April 30, 2010, which were valued using significant unobservable inputs (Level 3) amounted to $186,838. This amount is included in net change in unrealized appreciation on the Statement of Changes in Net Assets.
For more information on valuation inputs, and their aggregation into the levels used in the tables above, please refer to the Security Valuation section in the accompanying Notes to the Financial Statements.
At April 30, 2010, the Fund has entered into the following credit default swap contracts:
Credit Risk
| | | | | | | | | | | | | | | | | | | | |
Swap Counterparty | | Referenced Obligation | | Receive Buy Protection | | Fixed Rate | | | Expiration Date | | Notional Amount | | Upfront Premium Paid (Received) | | | Value of Contract | |
Barclays Capital | | D.R. Horton, Inc. | | Buy | | 1.000 | % | | 03/20/15 | | $ | 5,500,000 | | $ | 240,043 | | | $ | (31,121 | ) |
Barclays Capital | | Limited Brands, Inc. | | Buy | | 1.000 | % | | 03/20/15 | | | 4,500,000 | | | 251,315 | | | | (132,298 | ) |
Barclays Capital | | Macy’s, Inc. | | Buy | | 1.000 | % | | 03/20/15 | | | 5,500,000 | | | 282,866 | | | | (157,260 | ) |
Barclays Capital | | The Home Depot, Inc. | | Buy | | 1.000 | % | | 03/20/15 | | | 6,200,000 | | | (29,433 | ) | | | (87,981 | ) |
Barclays Capital | | Toll Brothers, Inc. 5.150% 05/15/15 | | Buy | | 1.000 | % | | 09/20/14 | | | 4,395,000 | | | 34,526 | | | | 30,682 | |
Barclays Capital | | Toll Brothers, Inc. 5.150% 05/15/15 | | Buy | | 1.000 | % | | 09/20/14 | | | 4,300,000 | | | 14,947 | | | | 46,434 | |
JPMorgan | | D.R. Horton, Inc. | | Buy | | 1.000 | % | | 03/20/15 | | | 5,500,000 | | | 240,020 | | | | (31,225 | ) |
JPMorgan | | Macy’s, Inc. | | Buy | | 1.000 | % | | 03/20/15 | | | 6,000,000 | | | 321,834 | | | | (184,135 | ) |
Morgan Stanley | | Limited Brands, Inc. | | Buy | | 1.000 | % | | 03/20/15 | | | 4,700,000 | | | 221,572 | | | | (99,910 | ) |
Morgan Stanley | | The Home Depot, Inc. | | Buy | | 1.000 | % | | 03/20/15 | | | 3,000,000 | | | (22,713 | ) | | | (34,379 | ) |
| | | | | | | | | | | | | | | | | | | | |
| | | | | | | | | | | | | | | | | | $ | (681,193 | ) |
| | | | | | | | | | | | | | | | | | | | |
See Accompanying Notes to Financial Statements.
17
Columbia Core Bond Fund
April 30, 2010
At April 30, 2010 the Fund held the following open long futures contracts:
| | | | | | | | | | | | | |
Interest
Rate Risk
Type | | Number of
Contracts | | Value | | Aggregate
Face Value | | Expiration
Date | | Unrealized
Appreciation |
2-Year U.S. Treasury Notes | | 120 | | $ | 26,109,375 | | $ | 26,031,015 | | June-2010 | | $ | 78,360 |
| | | | | | | | | | | | | |
At April 30, 2010, the Fund held the following open short futures contracts:
| | | | | | | | | | | | | | |
Interest
Rate Risk
Type | | Number of
Contracts | | Value | | Aggregate
Face Value | | Expiration
Date | | Unrealized
Depreciation | |
5-Year U.S. Treasury Notes | | 617 | | $ | 71,485,234 | | $ | 70,932,432 | | June-2010 | | $ | (552,802 | ) |
10-Year U.S. Treasury Notes | | 543 | | | 64,023,094 | | | 63,126,876 | | June-2010 | | | (896,218 | ) |
30-Year U.S. Treasury Bonds | | 75 | | | 8,929,688 | | | 8,602,491 | | June-2010 | | | (327,197 | ) |
| | | | | | | | | | | | | | |
| | | | | | | | | | | | $ | (1,776,217 | ) |
| | | | | | | | | | | | | | |
At April 30, 2010, the asset allocation of the Fund is as follows:
| | | |
Asset Allocation (Unaudited) | | % of Net Assets | |
Corporate Fixed-Income Bonds & Notes | | 27.3 | |
Mortgage- Backed Securities | | 25.5 | |
Commercial Mortgage – Backed Securities | | 18.8 | |
Government & Agency Obligations | | 17.0 | |
Asset-Backed Securities | | 7.1 | |
Collateralized Mortgage Obligations | | 0.4 | |
Municipal Bonds | | 0.4 | |
| | | |
| | 96.5 | |
Short-Term Obligation | | 6.0 | |
Other Assets & Liabilities, Net | | (2.5 | ) |
| | | |
| | 100.0 | |
| | | |
| | |
Acronym | | Name |
I.O. | | Interest Only |
STRIPS | | Separate Trading of Registered Interest and Principal of Securities |
TBA | | To Be Announced |
See Accompanying Notes to Financial Statements.
18
Statement of Assets and Liabilities – Columbia Core Bond Fund
April 30, 2010
| | | | | |
| | | | | ($) | |
| Assets | | Unaffiliated investments, at identified cost | | 1,541,797,497 | |
| | Affiliated investments, at identified cost | | 6,471,003 | |
| | | | | |
| | Total investments, at identified cost | | 1,548,268,500 | |
| | | | | |
| | Unaffiliated investments, at value | | 1,588,737,016 | |
| | Affiliated investments, at value | | 6,866,929 | |
| | | | | |
| | Total investments, at value | | 1,595,603,945 | |
| | | | | |
| | Cash | | 143 | |
| | Open credit default swap contracts | | 77,116 | |
| | Credit default swap contracts premiums paid | | 1,544,037 | |
| | Receivable for: | | | |
| | Fund shares sold | | 4,098,826 | |
| | Interest | | 11,774,037 | |
| | Foreign tax reclaims | | 16,012 | |
| | Expense reimbursement due from investment advisor | | 214,818 | |
| | Trustees’ deferred compensation plan | | 105,896 | |
| | Prepaid expenses | | 28,340 | |
| | Other assets | | 5,625 | |
| | | | | |
| | Total Assets | | 1,613,468,795 | |
| | |
| Liabilities | | Open credit default swap contracts | | 758,309 | |
| | Credit default swap contracts premiums received | | 49,948 | |
| | Payable for: | | | |
| | Investments purchased on a delayed delivery basis | | 50,332,813 | |
| | Fund shares repurchased | | 612,210 | |
| | Futures variation margin | | 497,766 | |
| | Distributions | | 2,767,157 | |
| | Investment advisory fee | | 548,530 | |
| | Administration fee | | 84,445 | |
| | Pricing and bookkeeping fees | | 16,731 | |
| | Transfer agent fee | | 248,448 | |
| | Trustees’ fees | | 40,033 | |
| | Custody fee | | 9,983 | |
| | Distribution and service fees | �� | 30,401 | |
| | Chief compliance officer expenses | | 243 | |
| | Trustees’ deferred compensation plan | | 105,896 | |
| | Other liabilities | | 103,746 | |
| | | | | |
| | Total Liabilities | | 56,206,659 | |
| | |
| | | | | |
| | Net Assets | | 1,557,262,136 | |
| | |
| Net Assets Consist of | | Paid-in capital | | 1,553,385,569 | |
| | Undistributed net investment income | | 1,999,748 | |
| | Accumulated net realized loss | | (43,072,974 | ) |
| | Net unrealized appreciation (depreciation) on: | | | |
| | Investments | | 47,335,445 | |
| | Futures contracts | | (1,697,857 | ) |
| | Credit default swap contracts | | (687,795 | ) |
| | | | | |
| | Net Assets | | 1,557,262,136 | |
See Accompanying Notes to Financial Statements.
19
Statement of Assets and Liabilities (continued) – Columbia Core Bond Fund
April 30, 2010
| | | | | | |
| | | | | | |
| Class A | | Net assets | | $ | 58,732,837 | |
| | Shares outstanding | | | 5,403,830 | |
| | Net asset value per share | | $ | 10.87 | (a) |
| | Maximum sales charge | | | 4.75 | % |
| | Maximum offering price per share ($10.87/0.9525) | | $ | 11.41 | (b) |
| | |
| Class B | | Net assets | | $ | 9,223,999 | |
| | Shares outstanding | | | 848,676 | |
| | Net asset value and offering price per share | | $ | 10.87 | (a) |
| | |
| Class C | | Net assets | | $ | 10,773,182 | |
| | Shares outstanding | | | 991,213 | |
| | Net asset value and offering price per share | | $ | 10.87 | (a) |
| | |
| Class T | | Net assets | | $ | 18,147,154 | |
| | Shares outstanding | | | 1,669,674 | |
| | Net asset value per share | | $ | 10.87 | (a) |
| | Maximum sales charge | | | 4.75 | % |
| | Maximum offering price per share ($10.87/0.9525) | | $ | 11.41 | (b) |
| | |
| Class Z | | Net assets | | $ | 1,460,384,964 | |
| | Shares outstanding | | | 134,364,668 | |
| | Net asset value, offering and redemption price per share | | $ | 10.87 | |
| (a) | Redemption price per share is equal to net asset value less any applicable contingent deferred sales charge. |
| (b) | On sales of $50,000 or more the offering price is reduced. |
See Accompanying Notes to Financial Statements.
20
Statement of Operations – Columbia Core Bond Fund
For the Year Ended April 30, 2010
| | | | | |
| | | | | ($) | |
| Investment Income | | Interest | | 67,826,551 | |
| | Interest from affiliates | | 519,855 | |
| | Securities lending | | 35,674 | |
| | | | | |
| | Total Investment Income | | 68,382,080 | |
| | |
| Expenses | | Investment advisory fee | | 6,728,570 | |
| | Administration fee | | 1,037,336 | |
| | Distribution fee: | | | |
| | Class B | | 90,193 | |
| | Class C | | 81,227 | |
| | Service fee: | | | |
| | Class A | | 136,200 | |
| | Class B | | 30,064 | |
| | Class C | | 27,076 | |
| | Shareholders services fees – Class T | | 27,825 | |
| | Transfer agent fee | | 944,238 | |
| | Pricing and bookkeeping fees | | 170,586 | |
| | Trustees’ fees | | 97,498 | |
| | Custody fee | | 54,419 | |
| | Chief compliance officer expenses | | 1,268 | |
| | Other expenses | | 551,713 | |
| | | | | |
| | Total Expenses | | 9,978,213 | |
| | |
| | Fees waived or expenses reimbursed by investment advisor | | (1,587,624 | ) |
| | Fees waived by distributor – Class C | | (16,245 | ) |
| | Expense reductions | | (76 | ) |
| | | | | |
| | Net Expenses | | 8,374,268 | |
| | |
| | | | | |
| | Net Investment Income | | 60,007,812 | |
| | |
| Net Realized and Unrealized Gain (Loss) on Investments, Futures Contracts and Credit Default Swap Contracts | | Net realized gain (loss) on: | | | |
| | Unaffiliated investments | | 35,442,778 | |
| | Affiliated investments | | 77,387 | |
| | Futures contracts | | 369,638 | |
| | Credit default swap contracts | | (1,979,691 | ) |
| | | | | |
| | Net realized gain | | 33,910,112 | |
| | |
| | Net change in unrealized appreciation (depreciation) on: | | | |
| | Investments | | 77,715,523 | |
| | Futures contracts | | (1,837,723 | ) |
| | Credit default swap contracts | | (263,386 | ) |
| | | | | |
| | Net change in unrealized appreciation (depreciation) | | 75,614,414 | |
| | | | | |
| | Net Gain | | 109,524,526 | |
| | |
| | | | | |
| | Net Increase Resulting from Operations | | 169,532,338 | |
See Accompanying Notes to Financial Statements.
21
Statement of Changes in Net Assets – Columbia Core Bond Fund
| | | | | | | | |
| | | | | Year Ended April 30, | |
| Increase (Decrease) in Net Assets | | | | 2010 ($) | | | 2009 ($) | |
| Operations | | Net investment income | | 60,007,812 | | | 71,904,953 | |
| | Net realized gain (loss) on investments, futures contracts and credit default swap contracts | | 33,910,112 | | | (36,308,073 | ) |
| | Net change in unrealized appreciation (depreciation) on investments, futures contracts and credit default swap contracts | | 75,614,414 | | | (13,944,920 | ) |
| | | | | | | | |
| | Net increase resulting from operations | | 169,532,338 | | | 21,651,960 | |
| | | |
| Distributions to Shareholders | | From net investment income: | | | | | | |
| | Class A | | (1,998,487 | ) | | (2,141,011 | ) |
| | Class B | | (353,582 | ) | | (495,010 | ) |
| | Class C | | (333,218 | ) | | (304,638 | ) |
| | Class T | | (699,863 | ) | | (886,840 | ) |
| | Class Z | | (56,951,640 | ) | | (67,016,734 | ) |
| | | | | | | | |
| | Total distributions to shareholders | | (60,336,790 | ) | | (70,844,233 | ) |
| | | |
| | Net Capital Stock Transactions | | (68,513,448 | ) | | (51,466,764 | ) |
| | Increase from regulatory settlements | | 64,003 | | | — | |
| | | | | | | | |
| | Total increase (decrease) in net assets | | 40,746,103 | | | (100,659,037 | ) |
| | | |
| Net Assets | | Beginning of period | | 1,516,516,033 | | | 1,617,175,070 | |
| | End of period | | 1,557,262,136 | | | 1,516,516,033 | |
| | Undistributed net investment income at end of period | | 1,999,748 | | | 2,417,142 | |
See Accompanying Notes to Financial Statements.
22
Statement of Changes in Net Assets (continued) – Columbia Core Bond Fund
| | | | | | | | | | | | |
| | | Capital Stock Activity | |
| | | Year Ended April 30, 2010 | | | Year Ended April 30, 2009 | |
| | | Shares | | | Dollars ($) | | | Shares | | | Dollars ($) | |
Class A | | | | | | | | | | | | |
Subscriptions | | 1,356,645 | | | 14,391,450 | | | 1,460,417 | | | 14,673,774 | |
Distributions reinvested | | 158,671 | | | 1,684,419 | | | 183,205 | | | 1,840,015 | |
Redemptions | | (1,107,289 | ) | | (11,703,064 | ) | | (1,490,353 | ) | | (14,954,699 | ) |
| | | | | | | | | | | | |
Net increase | | 408,027 | | | 4,372,805 | | | 153,269 | | | 1,559,090 | |
| | | | |
Class B | | | | | | | | | | | | |
Subscriptions | | 167,094 | | | 1,763,857 | | | 485,359 | | | 4,868,353 | |
Distributions reinvested | | 25,454 | | | 269,503 | | | 38,473 | | | 386,376 | |
Redemptions | | (707,300 | ) | | (7,490,537 | ) | | (568,412 | ) | | (5,700,069 | ) |
| | | | | | | | | | | | |
Net decrease | | (514,752 | ) | | (5,457,177 | ) | | (44,580 | ) | | (445,340 | ) |
| | | | |
Class C | | | | | | | | | | | | |
Subscriptions | | 297,463 | | | 3,127,995 | | | 695,422 | | | 6,958,451 | |
Distributions reinvested | | 14,931 | | | 158,490 | | | 13,433 | | | 134,800 | |
Redemptions | | (407,463 | ) | | (4,284,457 | ) | | (279,345 | ) | | (2,822,254 | ) |
| | | | | | | | | | | | |
Net increase (decrease) | | (95,069 | ) | | (997,972 | ) | | 429,510 | | | 4,270,997 | |
| | | | |
Class T | | | | | | | | | | | | |
Subscriptions | | 8,980 | | | 94,991 | | | 25,521 | | | 257,061 | |
Distributions reinvested | | 57,688 | | | 612,092 | | | 76,812 | | | 771,485 | |
Redemptions | | (201,579 | ) | | (2,141,769 | ) | | (362,996 | ) | | (3,645,900 | ) |
| | | | | | | | | | | | |
Net decrease | | (134,911 | ) | | (1,434,686 | ) | | (260,663 | ) | | (2,617,354 | ) |
| | | | |
Class Z | | | | | | | | | | | | |
Subscriptions | | 23,637,532 | | | 249,743,749 | | | 26,589,690 | | | 267,735,587 | |
Distributions reinvested | | 1,957,715 | | | 20,777,764 | | | 2,003,439 | | | 20,117,839 | |
Redemptions | | (31,707,424 | ) | | (335,517,931 | ) | | (34,039,804 | ) | | (342,087,583 | ) |
| | | | | | | | | | | | |
Net decrease | | (6,112,177 | ) | | (64,996,418 | ) | | (5,446,675 | ) | | (54,234,157 | ) |
See Accompanying Notes to Financial Statements.
23
Financial Highlights – Columbia Core Bond Fund
Selected data for a share outstanding throughout each period is as follows:
| | | | | | | | | | | | | | | | | | | | |
| | | Year Ended April 30, | |
| Class A Shares | | 2010 | | | 2009 | | | 2008 | | | 2007 | | | 2006 (a) | |
Net Asset Value, Beginning of Period | | $ | 10.13 | | | $ | 10.44 | | | $ | 10.57 | | | $ | 10.36 | | | $ | 10.81 | |
| | | | | |
Income from Investment Operations: | | | | | | | | | | | | | | | | | | | | |
Net investment income (b) | | | 0.39 | | | | 0.46 | | | | 0.49 | | | | 0.48 | | | | 0.42 | |
Net realized and unrealized gain (loss) on investments, credit default swap contracts and futures contracts | | | 0.74 | | | | (0.32 | ) | | | (0.13 | ) | | | 0.21 | | | | (0.44 | ) |
| | | | | | | | | | | | | | | | | | | | |
Total from investment operations | | | 1.13 | | | | 0.14 | | | | 0.36 | | | | 0.69 | | | | (0.02 | ) |
| | | | | |
Less Distributions to Shareholders: | | | | | | | | | | | | | | | | | | | | |
From net investment income | | | (0.39 | ) | | | (0.45 | ) | | | (0.49 | ) | | | (0.48 | ) | | | (0.43 | ) |
| | | | | |
Increase from regulatory settlements | | | — | (c) | | | — | | | | — | | | | — | | | | — | |
| | | | | |
Net Asset Value, End of Period | | $ | 10.87 | | | $ | 10.13 | | | $ | 10.44 | | | $ | 10.57 | | | $ | 10.36 | |
Total return (d) | | | 11.29 | %(e) | | | 1.48 | %(e) | | | 3.47 | %(e) | | | 6.81 | % | | | (0.27 | )%(e) |
| | | | | |
Ratios to Average Net Assets/Supplemental Data: | | | | | | | | | | | | | | | | | | | | |
Net expenses (f) | | | 0.77 | % | | | 0.70 | % | | | 0.81 | % | | | 0.90 | % | | | 0.91 | % |
Waiver/Reimbursement | | | 0.10 | % | | | 0.16 | % | | | 0.06 | % | | | — | | | | — | %(g) |
Net investment income (f) | | | 3.64 | % | | | 4.55 | % | | | 4.73 | % | | | 4.58 | % | | | 3.90 | % |
Portfolio turnover rate | | | 216 | % | | | 214 | % | | | 195 | % | | | 175 | % | | | 105 | % |
Net assets, end of period (000s) | | $ | 58,733 | | | $ | 50,600 | | | $ | 50,558 | | | $ | 52,116 | | | $ | 24,417 | |
| (a) | On October 7, 2005, the Columbia Quality Plus Bond Fund was renamed the Columbia Core Bond Fund. |
| (b) | Per share data was calculated using the average shares outstanding during the period. |
| (c) | Rounds to less than $0.01 per share. |
| (d) | Total return at net asset value assuming all distributions reinvested and no initial sales charge or contingent deferred sales charge. |
| (e) | Had the investment advisor and/or any of its affiliates not waived fees or reimbursed a portion of expenses, total return would have been reduced. |
| (f) | The benefits derived from expense reductions had an impact of less than 0.01%. |
| (g) | Rounds to less than 0.01%. |
See Accompanying Notes to Financial Statements.
24
Financial Highlights – Columbia Core Bond Fund
Selected data for a share outstanding throughout each period is as follows:
| | | | | | | | | | | | | | | | | | | | |
| | | Year Ended April 30, | |
| Class B Shares | | 2010 | | | 2009 | | | 2008 | | | 2007 | | | 2006 (a) | |
Net Asset Value, Beginning of Period | | $ | 10.13 | | | $ | 10.44 | | | $ | 10.57 | | | $ | 10.36 | | | $ | 10.81 | |
| | | | | |
Income from Investment Operations: | | | | | | | | | | | | | | | | | | | | |
Net investment income (b) | | | 0.31 | | | | 0.38 | | | | 0.42 | | | | 0.40 | | | | 0.34 | |
Net realized and unrealized gain (loss) on investments, credit default swap contracts and futures contracts | | | 0.74 | | | | (0.31 | ) | | | (0.14 | ) | | | 0.21 | | | | (0.44 | ) |
| | | | | | | | | | | | | | | | | | | | |
Total from investment operations | | | 1.05 | | | | 0.07 | | | | 0.28 | | | | 0.61 | | | | (0.10 | ) |
| | | | | |
Less Distributions to Shareholders: | | | | | | | | | | | | | | | | | | | | |
From net investment income | | | (0.31 | ) | | | (0.38 | ) | | | (0.41 | ) | | | (0.40 | ) | | | (0.35 | ) |
| | | | | |
Increase from regulatory settlements | | | — | (c) | | | — | | | | — | | | | — | | | | — | |
| | | | | |
Net Asset Value, End of Period | | $ | 10.87 | | | $ | 10.13 | | | $ | 10.44 | | | $ | 10.57 | | | $ | 10.36 | |
Total return (d) | | | 10.47 | %(e) | | | 0.72 | %(e) | | | 2.70 | %(e) | | | 6.01 | % | | | (1.01 | )%(e) |
| | | | | |
Ratios to Average Net Assets/Supplemental Data: | | | | | | | | | | | | | | | | | | | | |
Net expenses (f) | | | 1.52 | % | | | 1.45 | % | | | 1.56 | % | | | 1.65 | % | | | 1.66 | % |
Waiver/Reimbursement | | | 0.10 | % | | | 0.16 | % | | | 0.06 | % | | | — | | | | — | %(g) |
Net investment income (f) | | | 2.92 | % | | | 3.81 | % | | | 3.99 | % | | | 3.83 | % | | | 3.15 | % |
Portfolio turnover rate | | | 216 | % | | | 214 | % | | | 195 | % | | | 175 | % | | | 105 | % |
Net assets, end of period (000s) | | $ | 9,224 | | | $ | 13,809 | | | $ | 14,700 | | | $ | 15,710 | | | $ | 9,704 | |
| (a) | On October 7, 2005, the Columbia Quality Plus Bond Fund was renamed the Columbia Core Bond Fund. |
| (b) | Per share data was calculated using the average shares outstanding during the period. |
| (c) | Rounds to less than $0.01 per share. |
| (d) | Total return at net asset value assuming all distributions reinvested and no contingent deferred sales charge. |
| (e) | Had the investment advisor and/or any of its affiliates not waived fees or reimbursed a portion of expenses, total return would have been reduced. |
| (f) | The benefits derived from expense reductions had an impact of less than 0.01%. |
| (g) | Rounds to less than 0.01%. |
See Accompanying Notes to Financial Statements.
25
Financial Highlights – Columbia Core Bond Fund
Selected data for a share outstanding throughout each period is as follows:
| | | | | | | | | | | | | | | | | | | | |
| | | Year Ended April 30, | |
| Class C Shares | | 2010 | | | 2009 | | | 2008 | | | 2007 | | | 2006 (a) | |
Net Asset Value, Beginning of Period | | $ | 10.13 | | | $ | 10.44 | | | $ | 10.57 | | | $ | 10.36 | | | $ | 10.81 | |
| | | | | |
Income from Investment Operations: | | | | | | | | | | | | | | | | | | | | |
Net investment income (b) | | | 0.32 | | | | 0.39 | | | | 0.43 | | | | 0.42 | | | | 0.35 | |
Net realized and unrealized gain (loss) on investments, credit default swap contracts and futures contracts | | | 0.74 | | | | (0.31 | ) | | | (0.14 | ) | | | 0.21 | | | | (0.44 | ) |
| | | | | | | | | | | | | | | | | | | | |
Total from investment operations | | | 1.06 | | | | 0.08 | | | | 0.29 | | | | 0.63 | | | | (0.09 | ) |
| | | | | |
Less Distributions to Shareholders: | | | | | | | | | | | | | | | | | | | | |
From net investment income | | | (0.32 | ) | | | (0.39 | ) | | | (0.42 | ) | | | (0.42 | ) | | | (0.36 | ) |
| | | | | |
Increase from regulatory settlements | | | — | (c) | | | — | | | | — | | | | — | | | | — | |
| | | | | |
Net Asset Value, End of Period | | $ | 10.87 | | | $ | 10.13 | | | $ | 10.44 | | | $ | 10.57 | | | $ | 10.36 | |
Total return (d)(e) | | | 10.63 | % | | | 0.87 | % | | | 2.84 | % | | | 6.17 | % | | | (0.86 | )% |
| | | | | |
Ratios to Average Net Assets/Supplemental Data: | | | | | | | | | | | | | | | | | | | | |
Net expenses (f) | | | 1.37 | % | | | 1.30 | % | | | 1.41 | % | | | 1.50 | % | | | 1.51 | % |
Waiver/Reimbursement | | | 0.25 | % | | | 0.31 | % | | | 0.21 | % | | | 0.15 | % | | | 0.15 | % |
Net investment income (f) | | | 3.06 | % | | | 3.90 | % | | | 4.13 | % | | | 3.99 | % | | | 3.30 | % |
Portfolio turnover rate | | | 216 | % | | | 214 | % | | | 195 | % | | | 175 | % | | | 105 | % |
Net assets, end of period (000s) | | $ | 10,773 | | | $ | 11,002 | | | $ | 6,857 | | | $ | 5,695 | | | $ | 4,073 | |
| (a) | On October 7, 2005, the Columbia Quality Plus Bond Fund was renamed the Columbia Core Bond Fund. |
| (b) | Per share data was calculated using the average shares outstanding during the period. |
| (c) | Rounds to less than $0.01 per share. |
| (d) | Total return at net asset value assuming all distributions reinvested and no contingent deferred sales charge. |
| (e) | Had the investment advisor and/or any of its affiliates not waived fees or reimbursed a portion of expenses, total return would have been reduced. |
| (f) | The benefits derived from expense reductions had an impact of less than 0.01%. |
See Accompanying Notes to Financial Statements.
26
Financial Highlights – Columbia Core Bond Fund
Selected data for a share outstanding throughout each period is as follows:
| | | | | | | | | | | | | | | | | | | | |
| | | Year Ended April 30, | |
| Class T Shares | | 2010 | | | 2009 | | | 2008 (a) | | | 2007 | | | 2006 (b) | |
Net Asset Value, Beginning of Period | | $ | 10.13 | | | $ | 10.44 | | | $ | 10.57 | | | $ | 10.36 | | | $ | 10.81 | |
| | | | | |
Income from Investment Operations: | | | | | | | | | | | | | | | | | | | | |
Net investment income (c) | | | 0.40 | | | | 0.47 | | | | 0.51 | | | | 0.49 | | | | 0.42 | |
Net realized and unrealized gain (loss) on investments, credit default swap contracts and futures contracts | | | 0.74 | | | | (0.32 | ) | | | (0.14 | ) | | | 0.21 | | | | (0.43 | ) |
| | | | | | | | | | | | | | | | | | | | |
Total from investment operations | | | 1.14 | | | | 0.15 | | | | 0.37 | | | | 0.70 | | | | (0.01 | ) |
| | | | | |
Less Distributions to Shareholders: | | | | | | | | | | | | | | | | | | | | |
From net investment income | | | (0.40 | ) | | | (0.46 | ) | | | (0.50 | ) | | | (0.49 | ) | | | (0.44 | ) |
| | | | | |
Increase from regulatory settlements | | | — | (d) | | | — | | | | — | | | | — | | | | — | |
| | | | | |
Net Asset Value, End of Period | | $ | 10.87 | | | $ | 10.13 | | | $ | 10.44 | | | $ | 10.57 | | | $ | 10.36 | |
Total return (e) | | | 11.40 | %(f) | | | 1.58 | %(f) | | | 3.57 | %(f) | | | 6.91 | % | | | (0.17 | )%(f) |
| | | | | |
Ratios to Average Net Assets/Supplemental Data: | | | | | | | | | | | | | | | | | | | | |
Net expenses (g) | | | 0.67 | % | | | 0.60 | % | | | 0.71 | % | | | 0.80 | % | | | 0.81 | % |
Waiver/Reimbursement | | | 0.10 | % | | | 0.16 | % | | | 0.06 | % | | | — | | | | — | %(h) |
Net investment income (g) | | | 3.75 | % | | | 4.66 | % | | | 4.83 | % | | | 4.68 | % | | | 4.01 | % |
Portfolio turnover rate | | | 216 | % | | | 214 | % | | | 195 | % | | | 175 | % | | | 105 | % |
Net assets, end of period (000s) | | $ | 18,147 | | | $ | 18,278 | | | $ | 21,562 | | | $ | 23,582 | | | $ | 26,372 | |
| (a) | On August 8, 2007, Class G shares were exchanged for Class T shares. |
| (b) | On October 7, 2005, the Columbia Quality Plus Bond Fund was renamed the Columbia Core Bond Fund. |
| (c) | Per share data was calculated using the average shares outstanding during the period. |
| (d) | Rounds to less than $0.01 per share. |
| (e) | Total return at net asset value assuming all distributions reinvested and no initial sales charge or contingent deferred sales charge. |
| (f) | Had the investment advisor and/or any of its affiliates not waived fees or reimbursed a portion of expenses, total return would have been reduced. |
| (g) | The benefits derived from expense reductions had an impact of less than 0.01%. |
| (h) | Rounds to less than 0.01%. |
See Accompanying Notes to Financial Statements.
27
Financial Highlights – Columbia Core Bond Fund
Selected data for a share outstanding throughout each period is as follows:
| | | | | | | | | | | | | | | | | | | | |
| | | Year Ended April 30, | |
| Class Z Shares | | 2010 | | | 2009 | | | 2008 | | | 2007 | | | 2006 (a) | |
Net Asset Value, Beginning of Period | | $ | 10.13 | | | $ | 10.44 | | | $ | 10.57 | | | $ | 10.36 | | | $ | 10.81 | |
| | | | | |
Income from Investment Operations: | | | | | | | | | | | | | | | | | | | | |
Net investment income (b) | | | 0.41 | | | | 0.48 | | | | 0.52 | | | | 0.51 | | | | 0.44 | |
Net realized and unrealized gain (loss) on investments, credit default swap contracts and futures contracts | | | 0.74 | | | | (0.31 | ) | | | (0.14 | ) | | | 0.21 | | | | (0.44 | ) |
| | | | | | | | | | | | | | | | | | | | |
Total from investment operations | | | 1.15 | | | | 0.17 | | | | 0.38 | | | | 0.72 | | | | — | |
| | | | | |
Less Distributions to Shareholders: | | | | | | | | | | | | | | | | | | | | |
From net investment income | | | (0.41 | ) | | | (0.48 | ) | | | (0.51 | ) | | | (0.51 | ) | | | (0.45 | ) |
| | | | | |
Increase from regulatory settlements | | | — | (c) | | | — | | | | — | | | | — | | | | — | |
| | | | | |
Net Asset Value, End of Period | | $ | 10.87 | | | $ | 10.13 | | | $ | 10.44 | | | $ | 10.57 | | | $ | 10.36 | |
Total return (d) | | | 11.57 | %(e) | | | 1.73 | %(e) | | | 3.72 | %(e) | | | 7.07 | % | | | (0.02 | )%(e) |
| | | | | |
Ratios to Average Net Assets/Supplemental Data: | | | | | | | | | | | | | | | | | | | | |
Net expenses (f) | | | 0.52 | % | | | 0.45 | % | | | 0.56 | % | | | 0.65 | % | | | 0.66 | % |
Waiver/Reimbursement | | | 0.10 | % | | | 0.16 | % | | | 0.06 | % | | | — | | | | — | %(g) |
Net investment income (f) | | | 3.90 | % | | | 4.80 | % | | | 4.98 | % | | | 4.83 | % | | | 4.16 | % |
Portfolio turnover rate | | | 216 | % | | | 214 | % | | | 195 | % | | | 175 | % | | | 105 | % |
Net assets, end of period (000s) | | $ | 1,460,385 | | | $ | 1,422,826 | | | $ | 1,523,499 | | | $ | 1,606,867 | | | $ | 948,279 | |
| (a) | On October 7, 2005, the Columbia Quality Plus Bond Fund was renamed the Columbia Core Bond Fund. |
| (b) | Per share data was calculated using the average shares outstanding during the period. |
| (c) | Rounds to less than $0.01 per share. |
| (d) | Total return at net asset value assuming all distributions reinvested. |
| (e) | Had the investment advisor and/or any of its affiliates not waived fees or reimbursed a portion of expenses, total return would have been reduced. |
| (f) | The benefits derived from expense reductions had an impact of less than 0.01%. |
| (g) | Rounds to less than 0.01%. |
See Accompanying Notes to Financial Statements.
28
Notes to Financial Statements – Columbia Core Bond Fund
April 30, 2010
Note 1. Organization
Columbia Core Bond Fund (the “Fund”), a series of Columbia Funds Series Trust I (the “Trust”), is a diversified portfolio. The Trust is registered under the Investment Company Act of 1940, as amended (the “1940 Act”), as an open-end management investment company organized as a Massachusetts business trust.
Investment Objective
The Fund seeks total return, consisting of current income and capital appreciation.
Fund Shares
The Trust may issue an unlimited number of shares, and the Fund offers five classes of shares: Class A, Class B, Class C, Class T and Class Z. Each share class has its own expense structure and sales charges, as applicable. Effective June 22, 2009, the Fund no longer accepts investments from new or existing investors in the Fund’s Class B shares, except in connection with the reinvestment of any dividend and/or capital gain distributions in Class B shares of the Fund and exchanges by existing Class B shareholders of other Columbia Funds.
Class A and Class T shares are subject to a maximum front-end sales charge of 4.75% based on the amount of initial investment. Class A and Class T shares purchased without an initial sales charge in accounts aggregating $1 million to $50 million at the time of purchase are subject to a 1.00% contingent deferred sales charge (“CDSC”) if the shares are sold within one year after purchase. Class B shares are subject to a maximum CDSC of 5.00% based upon the holding period after purchase. Class B shares will convert to Class A shares eight years after purchase. Class C shares are subject to a 1.00% CDSC on shares sold within one year after purchase. Class Z shares are offered continuously at net asset value. There are certain restrictions on the purchase of Class T and Class Z shares, as described in the Fund’s prospectus.
Note 2. Significant Accounting Policies
The preparation of financial statements in accordance with accounting principles generally accepted in the United States of America (“GAAP”) requires management to make certain estimates and assumptions that affect the reported amounts of assets and liabilities, the disclosure of contingent assets and liabilities at the date of the financial statements and the reported amounts of revenue and expenses during the reporting period. Actual results could differ from those estimates.
The following is a summary of significant accounting policies consistently followed by the Fund in the preparation of its financial statements.
Security Valuation
Debt securities generally are valued by pricing services approved by the Trust’s Board of Trustees, based upon market transactions for normal, institutional-size trading units of similar securities. The services may use various pricing techniques which take into account appropriate factors such as yield, quality, coupon rate, maturity, type of issue, trading characteristics and other data, as well as broker quotes. Debt securities for which quotations are readily available may also be valued based upon an over-the-counter or exchange bid quotation.
Certain debt securities, which tend to be more thinly traded and of lesser quality, are priced based on fundamental analysis of the financial condition of the issuer and the estimated value of any collateral. Valuations developed through pricing techniques may vary from the actual amounts realized upon sale of the securities, and the potential variation may be greater for those securities valued using fundamental analysis.
Short-term investments maturing in 60 days or less are valued at amortized cost, which approximates market value.
Futures contracts are valued at the settlement price established each day by the board of trade or exchange on which they are traded.
Credit default swap contracts are marked to market daily based upon spread quotations from market makers.
Investments for which market quotations are not readily available, or that have quotations which management believes are not reliable, are valued at fair value as determined in good faith under consistently applied procedures established by and under the general supervision of the Board of Trustees. If a security is valued at fair value, such value is likely to be different from the last quoted market
29
Columbia Core Bond Fund
April 30, 2010
price for the security. The determination of fair value often requires significant judgment. To determine fair value, management may use assumptions including but not limited to future cash flows and estimated risk premiums. Multiple inputs from various sources may be used to determine value.
GAAP establishes a hierarchy that prioritizes the inputs to valuation techniques used to measure fair value giving the highest priority to unadjusted quoted prices in active markets for identical securities (level 1 measurements) and the lowest priority to unobservable inputs (level 3 measurements) when market prices are not readily available or reliable. The three levels of the fair value hierarchy are described below:
| n | | Level 1 – quoted prices in active markets for identical securities |
| n | | Level 2 – prices determined using other significant observable inputs (including quoted prices for similar securities, interest rates, prepayment speeds, credit risk and others) |
| n | | Level 3 – prices determined using significant unobservable inputs. In situations where quoted prices or observable inputs are unavailable or less reliable, unobservable inputs may be used. Unobservable inputs may include management’s own assumptions about the factors market participants would use in pricing an investment. |
The inputs or methodology used for valuing securities are not necessarily an indication of the risk associated with investing in those securities.
On January 21, 2010, the FASB issued an Accounting Standards Update (the amendment), Fair Value Measurements and Disclosures (Topic 820): Improving Disclosures about Fair Value Measurements, which provides guidance on how investment assets and liabilities are to be valued and disclosed. Specifically, the amendment requires reporting entities to disclose the input and valuation techniques used to measure fair value for both recurring and nonrecurring fair value measurements for Level 2 and Level 3 positions. The amendment also requires that transfers between all levels (including Level 1 and Level 2) be disclosed on a gross basis (i.e., transfers out must be disclosed separately from transfers in), and the reason(s) for the transfer. Additionally, purchases, sales, issuances and settlements must be disclosed on a gross basis in the Level 3 rollforward. The effective date of the amendment is for interim and annual periods beginning after December 15, 2009; except for the requirement to provide the Level 3 activity for purchases, sales, issuances and settlements on a gross basis, which will be effective for interim and annual periods beginning after December 15, 2010. At this time, management is evaluating the implications of the amendment and the impact to the financial statements.
Security Transactions
Security transactions are accounted for on the trade date. Cost is determined and gains (losses) are based upon the specific identification method for both financial statement and federal income tax purposes.
Derivative Instruments
The Fund may invest in derivative instruments. For additional information on derivative instruments, please see Note 6.
Repurchase Agreements
The Fund may engage in repurchase agreement transactions with institutions that the Fund’s investment advisor has determined are creditworthy. The Fund, through its custodian, receives delivery of the underlying securities collateralizing a repurchase agreement. The investment advisor is responsible for determining that the collateral is at least equal, at all times, to the value of the repurchase obligation including interest. A repurchase agreement transaction involves certain risks in the event of default or insolvency of the counterparty. These risks include possible delays in or restrictions on the Fund’s ability to dispose of the underlying securities and a possible decline in the value of the underlying securities during the period while the Fund seeks to assert its rights.
Delayed Delivery Securities
The Fund may trade securities on other than normal settlement terms, including securities purchased or sold on a “when-issued” basis. This may increase the risk if the other party to the transaction fails to deliver and causes the Fund to subsequently invest at less advantageous prices. The Fund identifies within its portfolio of investments cash or liquid securities in an amount equal to the delayed delivery commitment.
30
Columbia Core Bond Fund
April 30, 2010
Treasury Inflation Protected Securities
The Fund may invest in treasury inflation protected securities (“TIPS”). The principal amount of TIPS is increased for inflation or decreased for deflation based on a monthly published index. Interest payments are based on the adjusted principal at the time the interest is paid. These adjustments are recorded as interest income on the Statement of Operations.
Stripped Securities
The Fund may invest in Interest Only (“IO”) and Principal Only (“PO”) Stripped mortgage-backed securities. These securities are derivative multi-class mortgage securities structured so that one class receives most, if not all, of the principal from the underlying mortgage assets, while the other class receives most, if not all, of the interest and the remainder of the principal. If the underlying mortgage assets experience greater than anticipated prepayments of principal, the Fund may fail to fully recoup its initial investment in an IO security, therefore the daily interest accrual factor is adjusted each month to reflect the paydown of principal. The market value of these securities can be extremely volatile in response to changes in interest rates. Credit risk reflects the risk that the Fund may not receive all or part of its principal because the issuer or credit enhancer has defaulted on its obligation.
Income Recognition
Interest income is recorded on the accrual basis and includes accretion of discounts, amortization of premiums and paydown gains and losses. Fee income attributable to mortgage dollar roll transactions is recorded on the accrual basis over the term of the transaction. The value of additional securities received as an income payment is recorded as income and as the cost basis of such securities.
Expenses
General expenses of the Trust are allocated to the Fund and other series of the Trust based upon relative net assets or other expense allocation methodologies determined by the nature of the expense. Expenses directly attributable to the Fund are charged to the Fund.
Determination of Class Net Asset Value
All income, expenses (other than class-specific expenses, as shown on the Statement of Operations) and realized and unrealized gains (losses) are allocated to each class of the Fund on a daily basis for purposes of determining the net asset value of each class. Income and expenses are allocated to each class based on the settled shares method, while realized and unrealized gains (losses) are allocated based on the relative net assets of each class.
Federal Income Tax Status
The Fund intends to qualify each year as a “regulated investment company” under Subchapter M of the Internal Revenue Code, as amended, and will distribute substantially all of its tax exempt or taxable income, if any, for its tax year, and as such will not be subject to federal income taxes. In addition, the Fund intends to distribute in each calendar year substantially all of its net investment income, capital gains and certain other amounts, if any, such that the Fund should not be subject to federal excise tax. Therefore, no federal income or excise tax provision is recorded.
Distributions to Shareholders
Distributions from net investment income are declared daily and paid monthly. Net realized capital gains, if any, are distributed at least annually. Income distributions and capital gain distributions are determined in accordance with federal income tax regulations which may differ from GAAP.
Indemnification
In the normal course of business, the Fund enters into contracts that contain a variety of representations and warranties and which provide general indemnities. The Fund’s maximum exposure under these arrangements is unknown because this would involve future claims against the Fund. Also, under the Trust’s organizational documents and by contract, the Trustees and officers of the Trust are indemnified against certain liabilities that may arise out of actions relating to their duties to the Trust. However, based on experience, the Fund expects the risk of loss due to these representations, warranties and indemnities to be minimal.
Note 3. Federal Tax Information
The timing and character of income and capital gain distributions are determined in accordance with income tax regulations, which may differ from GAAP. Reclassifications are made to the Fund’s capital accounts for permanent tax differences to reflect income and gains available for
31
Columbia Core Bond Fund
April 30, 2010
distribution (or available capital loss carryforwards) under income tax regulations.
For the year ended April 30, 2010, permanent book and tax basis differences resulting primarily from differing treatments for partnership adjustments, proceeds from litigation settlements, discount accretion/premium amortization on debt securities and market discount were identified and reclassified among the components of the Fund’s net assets as follows:
| | | | |
| | | | | |
Undistributed Net Investment
Income | | Accumulated Net Realized
Loss | | Paid-In Capital |
| $(88,416) | | $(152,293) | | $240,709 |
Net investment income and net realized gains (losses), as disclosed on the Statement of Operations, and net assets were not affected by this reclassification.
The tax character of distributions paid during the years ended April 30, 2010 and April 30, 2009 was as follows:
| | | | | | |
| | | 2010 | | 2009 |
| Distributions paid from: | | | | |
Ordinary Income* | | $ | 60,336,790 | | $ | 70,844,233 |
| * | For tax purposes short-term capital gain distributions, if any, are considered ordinary income distributions. |
As of April 30, 2010, the components of distributable earnings on a tax basis were as follows:
| | | | |
| | | | | |
Undistributed
Ordinary Income | | Undistributed Long-Term Capital Gains | | Net Unrealized Appreciation* |
| $2,177,905 | | $— | | $48,825,295 |
| * | The differences between book-basis and tax-basis net unrealized appreciation are primarily due to deferral of losses from wash sales and discount accretion/premium amortization on debt securities. |
Unrealized appreciation and depreciation at April 30, 2010, based on cost of investments for federal income tax purposes were:
| | | | |
| | | | |
Unrealized appreciation | | $ | 63,780,613 | |
Unrealized depreciation | | | (14,955,318 | ) |
Net unrealized appreciation | | $ | 48,825,295 | |
The following capital loss carryforwards may be available to reduce taxable income arising from future net realized gains on investments, if any, to the extent permitted by the Internal Revenue Code:
| | | |
| | | |
| Year of Expiration | | Capital Loss Carryforwards |
| 2014 | | $ | 2,130,740 |
| 2015 | | | 5,076,609 |
| 2017 | | | 35,127,545 |
| | | |
| Total | | $ | 42,334,894 |
Capital loss carryforwards of $25,300,484 were utilized by the Fund during the year ended April 30, 2010.
Management is required to determine whether a tax position of the Fund is more likely than not to be sustained upon examination by the applicable taxing authority, including resolution of any related appeals or litigation processes, based on the technical merits of the position. The tax benefit to be recognized by the Fund is measured as the largest amount of benefit that is greater than fifty percent likely of being realized upon ultimate settlement. Management is not aware of any tax positions for which it is reasonably possible that the total amounts of unrecognized tax benefits will significantly change in the next twelve months. However, management’s conclusions may be subject to review and adjustment at a later date based on factors including, but not limited to, new tax laws, regulations, and administrative interpretations (including relevant court decisions). The Fund’s federal tax returns for the prior three fiscal years remain subject to examination by the Internal Revenue Service.
Note 4. Fees and Compensation Paid to Affiliates
Investment Advisory Fee
After the close of business on April 30, 2010, Ameriprise Financial, Inc. (“Ameriprise Financial”) acquired a portion of the asset management business of Columbia Management Group, LLC (the “Transaction”), including the business of managing the Fund. In connection with the closing of the Transaction (the “Closing”), RiverSource Investments, LLC, a wholly owned subsidiary of Ameriprise Financial, became the investment advisor of the Fund and subsequently changed its name to Columbia Management Investment Advisers, LLC
32
Columbia Core Bond Fund
April 30, 2010
(the “New Advisor”). The advisory fee rates paid by the Fund did not change as a result of the New Advisor.
Prior to the Closing, Columbia Management Advisors, LLC (“Columbia”), an indirect, wholly owned subsidiary of Bank of America Corporation (“BOA”), provided investment advisory services to the Fund. Columbia received a monthly investment advisory fee based on the Fund’s average daily net assets at the following annual rates:
| | | |
| | | | |
| Average Daily Net Assets | | Annual Fee Rate | |
First $500 million | | 0.48 | % |
$500 million to $1 billion | | 0.43 | % |
$1 billion to $1.5 billion | | 0.40 | % |
$1.5 billion to $3 billion | | 0.37 | % |
$3 billion to $6 billion | | 0.36 | % |
Over $6 billion | | 0.35 | % |
For the year ended April 30, 2010, the Fund’s annualized effective investment advisory fee rate was 0.43% of the Fund’s average daily net assets.
Administration Fee
In connection with the Closing, the New Advisor became the administrator of the Fund. Prior to April 30, 2010, Columbia provided administrative and other services to the Fund for a monthly administration fee at the annual rate of 0.067% of the Fund’s average daily net assets. There was no change in the administration fee rate paid by the Fund as a result of the change in administrator.
Pricing and Bookkeeping Fees
In connection with the Closing, the New Advisor provides financial reporting and accounting services to the Fund. In addition, under the administrative services agreement, the New Advisor provides services related to Fund expenses and the requirements of the Sarbanes-Oxley Act of 2002.
Prior to April 30, 2010, the Fund entered into a Financial Reporting Services Agreement (the “Financial Reporting Services Agreement”) with State Street Bank and Trust Company (“State Street”) and Columbia pursuant to which State Street provided financial reporting services to the Fund. The Fund also entered into an Accounting Services Agreement (collectively with the Financial Reporting Services Agreement, the “State Street Agreements”) with State Street and Columbia pursuant to which State Street provided accounting services to the Fund. Under the State Street Agreements, the Fund paid State Street an annual fee of $38,000 paid monthly plus an additional monthly fee based on an annualized percentage rate of average daily net assets of the Fund for the month. The aggregate fee did not exceed $140,000 per year (exclusive of out-of-pocket expenses and charges). The Fund also reimbursed State Street for certain out-of-pocket expenses and charges. Upon the Closing, Columbia assigned and delegated its rights and obligations under the State Street Agreements to the New Advisor.
Also prior to April 30, 2010, the Fund entered into a Pricing and Bookkeeping Oversight and Services Agreement (the “Services Agreement”) with Columbia. Under the Services Agreement, Columbia provided services related to Fund expenses and the requirements of the Sarbanes-Oxley Act of 2002, and provided oversight of the accounting and financial reporting services provided by State Street. Under the Services Agreement, the Fund reimbursed Columbia for out-of-pocket expenses. The Services Agreement was terminated upon the Closing.
Transfer Agent Fee
In connection with the Closing, RiverSource Service Corporation, a wholly owned subsidiary of Ameriprise Financial, became the transfer agent of the Fund and subsequently changed its name to Columbia Management Investment Services Corp. (the “New Transfer Agent”). The transfer agent fee rates paid by the Fund did not change as a result of the change in transfer agent.
Prior to April 30, 2010, Columbia Management Services, Inc. (the “Former Transfer Agent”), an affiliate of Columbia and an indirect, wholly owned subsidiary of BOA, provided shareholder services to the Fund and contracted with Boston Financial Data Services (“BFDS”) to serve as sub-transfer agent. Effective November 1, 2009, the Former Transfer Agent was entitled to receive a fee for its services, paid monthly, at the annual rate of $22.36 per account plus reimbursement of certain sub-transfer agent fees paid by the Former Transfer Agent (exclusive of BFDS fees), calculated based on assets held in omnibus accounts and intended to recover the cost of payments to other parties (including affiliates of BOA) for services to those accounts. Prior to November 1, 2009, the annual rate was $17.34 per account. The Former Transfer Agent paid the fees of BFDS for services as sub-transfer
33
Columbia Core Bond Fund
April 30, 2010
agent and was not entitled to reimbursement for such fees from the Fund. The arrangement with BFDS has been continued by the New Transfer Agent.
The Former Transfer Agent retained, as additional compensation for its services, fees for wire, telephone and redemption orders, Individual Retirement Account (“IRA”) trustee agent fees and account transcript fees due to the Former Transfer Agent from shareholders of the Fund and credits (net of bank charges) earned with respect to balances in accounts the Former Transfer Agent maintained in connection with its services to the Fund. The Former Transfer Agent also received reimbursement for certain out-of-pocket expenses.
An annual minimum account balance fee of $20 may apply to certain accounts with a value below the Fund’s initial minimum investment requirements to reduce the impact of small accounts on transfer agent fees. These minimum account balance fees are recorded as part of expense reductions on the Statement of Operations. For the year ended April 30, 2010, no minimum account balance fees were charged.
Underwriting Discounts, Service and Distribution Fees
In connection with the Closing, RiverSource Fund Distributors, Inc., an indirect wholly owned subsidiary of Ameriprise Financial, became the distributor of the Fund and subsequently changed its name to Columbia Management Investment Distributors, Inc. (the “New Distributor”). There were no changes to the underwriting discount structure of the Fund or the service or distribution fee rates paid by the Fund as a result of the Transaction.
Prior to the close of business on April 30, 2010, Columbia Management Distributors, Inc. (the “Former Distributor”), an affiliate of Columbia and an indirect, wholly owned subsidiary of BOA, was the principal underwriter of the Fund’s shares. For the year ended April 30, 2010, the Former Distributor retained net underwriting discounts of $6,689 and $109 on sales of the Fund’s Class A and Class T shares, respectively. For the same period, the Former Distributor received net CDSC fees of $11,508 and $2,992 on Class B and Class C shares redemptions, respectively.
The Fund has adopted distribution and shareholder servicing plans (the “Plans”) pursuant to Rule 12b-1 under the 1940 Act, which require the payment of distribution and service fees. The fees are intended to compensate the distributor and/or eligible selling and/or servicing agents for selling shares of the Fund and providing services to investors. Payments under the Plans, which are calculated daily and paid monthly, are based on the average daily net assets of the applicable class of the Fund at the following annual rates:
| | | | | | | | | | | | |
| Distribution Fee | | | Service Fee | |
| Class B | | Class C1 | | | Class A | | | Class B | | | Class C1 | |
| 0.75% | | 0.75 | % | | 0.25 | % | | 0.25 | % | | 0.25 | % |
| 1 | The Former Distributor voluntarily waived a portion of the distribution and service fees for Class C shares so that the combined distribution and service fees did not exceed 0.85% annually of the average daily net assets attributable to Class C shares. This arrangement has been continued by the New Distributor and may be modified or terminated by the New Distributor at any time. |
Shareholder Service Fee
The Fund may pay shareholder service fees up to a maximum of 0.40% of the Fund’s average daily net assets attributable to Class T shares (comprised of up to 0.20% for shareholder liaison services and up to 0.20% for administrative support services) but will limit such fees to an aggregate annual rate of not more than 0.15% of the Fund’s average daily net assets attributable to Class T shares.
For the year ended April 30, 2010, the effective shareholder service fee was 0.15% of the Funds average daily net assets attributable to Class T shares.
Fee Waivers and Expense Reimbursements
Effective September 1, 2009, Columbia voluntarily agreed to reimburse a portion of the Fund’s expenses so that the Fund’s ordinary operating expenses (excluding any distribution and service fees, brokerage commissions, interest, taxes and extraordinary expenses, but including custodian charges relating to overdrafts, if any), after giving effect to any balance credits from the Fund’s custodian, did not exceed 0.55% of the Fund’s average daily net assets on an annualized basis. This arrangement has been continued by the New Advisor and may be revised or discontinued by the New Advisor at any time.
Prior to September 1, 2009, Columbia had contractually agreed to bear a portion of the Fund’s expenses so that the Fund’s ordinary operating expenses (excluding any distribution and service fees, brokerage commissions, interest, taxes and extraordinary expenses, but including
34
Columbia Core Bond Fund
April 30, 2010
custodian charges relating to overdrafts, if any), after giving effect to any balance credits from the Fund’s custodian, would not exceed 0.45% of the Fund’s average daily net assets.
Fees Paid to Officers and Trustees
As of May 1, 2010, all officers of the Fund are employees of the New Advisor or its affiliates and, with the exception of the Fund’s Chief Compliance Officer, receive no compensation from the Fund. The Board of Trustees has appointed a Chief Compliance Officer to the Fund in accordance with federal securities regulations. The Fund, along with other affiliated funds, pays its pro-rata share of the expenses associated with the Chief Compliance Officer. The Fund’s expenses for the Chief Compliance Officer will not exceed $15,000 per year.
Trustees are compensated for their services to the Funds, as set forth on the Statements of Operations. The Trust’s eligible Trustees may participate in a deferred compensation plan which may be terminated at any time. Obligations of the plan will be paid solely out of the Fund’s assets.
Note 5. Custody Credits
The Fund has an agreement with its custodian bank under which custody fees may be reduced by balance credits. These credits are recorded as part of expense reductions on the Statement of Operations. The Fund could have invested a portion of the assets utilized in connection with the expense offset arrangement in an income-producing asset if it had not entered into such an agreement. For the year ended April 30, 2010, these custody credits reduced total expenses by $76 for the Fund.
Note 6. Objectives and Strategies for Investing in Derivative Instruments
The Fund uses derivatives instruments including futures contracts and credit default swaps in order to meet its investment objectives. The Fund employs strategies in differing combinations to permit it to increase, decrease or change the level of exposure to market risk factors. The achievement of any strategy relating to derivatives depends on an analysis of various risk factors, and if the strategies for the use of derivatives do not work as intended, the Fund may not achieve its investment objectives.
In pursuit of its investment objectives, the Fund is exposed to the following market risks:
Credit Risk: Credit risk relates to the ability of the issuer or guarantor of a fixed income security, or counterparty to a derivative contract to make timely principal and /or interest payments, or to otherwise honor its obligations. Securities are subject to varying degrees of credit risk, which are often reflected in credit ratings. Generally, lower-yield higher-quality bonds are subject to credit risk to a lesser extent than lower-grade higher-yield bonds.
Interest Rate Risk: Interest rate risk relates to the fluctuation in value of fixed income securities because of the inverse relationship of price and yield. Fixed income securities generally will decline in value upon an increase in general interest rates and their value generally will increase upon a decline in general interest rates. Fixed income securities with longer durations tend to be more sensitive to changes in interest rates, usually making them more volatile than securities with shorter durations.
The following notes provide more detailed information about each derivative type held by the Fund:
Futures Contracts — The Fund entered into interest rate futures contracts to manage the duration and yield curve exposure of the Fund versus the benchmark.
The use of futures contracts involves certain risks, which include, among others: (1) imperfect correlation between the price movement of the instruments and the underlying securities, (2) inability to close out positions due to differing trading hours, or the temporary absence of a liquid market, for either the instruments or the underlying securities, and (3) an inaccurate prediction of the future direction of interest rates by Columbia.
Upon entering into a futures contract, the Fund pledges cash or securities in an amount sufficient to meet the initial margin requirement. Subsequent payments are made or received by the Fund equal to the daily change in the contract value and are recorded as variation margin receivable or payable and offset in unrealized gains or losses. The Fund recognizes a realized gain or loss when the contract is closed or expires.
Futures contracts involve, to varying degrees, risk of loss in excess of the variation margin disclosed on the Statement of Assets and Liabilities.
35
Columbia Core Bond Fund
April 30, 2010
During the year ended April 30, 2010, the Fund entered into 7,140 futures contracts.
Credit Default Swap Contracts — The Fund entered into credit default swap transactions as a protection buyer to reduce overall credit exposure.
Credit default swaps are agreements in which one party pays fixed periodic payments to a counterparty in consideration for a guarantee from the counterparty to make a specific payment should a negative credit event take place. The Fund may receive or make an upfront payment as the protection buyer or seller. Credit default swaps are marked to market daily based on quotations from market makers and any change is recorded as unrealized appreciation/depreciation on the Statement of Assets and Liabilities. Periodic payments received or made are recorded as a realized gain or loss and premiums received or made are amortized on the Statement of Operations.
If the Fund is a buyer of protection and a credit event occurs, as defined under the terms of that particular swap agreement, the Fund will either (i) receive from the seller of protection an amount equal to the notional amount of the swap and deliver the referenced obligation or underlying securities comprising the referenced index or (ii) receive a net settlement amount in the form of cash or securities equal to the notional amount of the swap less the recovery value of the referenced obligation or underlying securities comprising the referenced index.
If the Fund is a seller of protection and a credit event occurs, as defined under the terms of that particular swap agreement, the Fund will either (i) pay to the buyer of protection an amount equal to the notional amount of the swap and take delivery of the referenced obligation or underlying securities comprising the referenced index or (ii) pay a net settlement amount in the form of cash or securities equal to the notional amount of the swap less the recovery value of the referenced obligation or underlying securities comprising the referenced index.
Credit default swap agreements involve greater risks than if the Fund had invested in the reference obligation directly since, in addition to general market risks, credit default swaps are subject to illiquidity risk, counterparty risk and credit risk.
During the year ended April 30, 2010, the Fund purchased credit default swaps with a notional amount of $108,045,000.
The following table is a summary of the value of the Fund’s derivative instruments as of April 30, 2010.
| | | | | | | |
| Fair Value of Derivative Instruments |
| Statement of Assets and Liabilities |
| Asset | | Fair Value | | Liability | | Fair Value |
Futures
variation
margin | | | — | | Futures
variation
margin | | $497,766* |
Open credit
default
swaps/
Premiums | | $ | 1,621,153 | | Open credit
default
swaps/
Premiums | | 808,257 |
| * | Includes only the current day’s variation margin. |
The effect of derivative instruments on the Statement of Operations for the year ended April 30, 2010.
| | | | | | | | | | |
| | | | | | | | | |
| | | Amount of Realized Gain or (Loss) and
Change in Unrealized Appreciation or
(Depreciation) on Derivatives
Recognized in Income | |
| | | Risk
Exposure | | Net
Realized Gain
(Loss) | | | Change in Unrealized Appreciation (Depreciation) | |
| Futures Contracts | | Interest
Rate | | $ | 369,638 | | | $ | (1,837,723 | ) |
| Credit Default Swap Contracts | | Credit | | | (1,979,691 | ) | | | (263,386 | ) |
Note 7. Portfolio Information
For the year ended April 30, 2010, the cost of purchases and proceeds from sales of securities, excluding short-term obligations, for the Fund were $3,273,948,299 and $3,381,204,966, respectively, of which $2,468,087,197 and $2,724,908,514, respectively, were U.S. Government securities.
Note 8. Regulatory Settlements
During the year ended April 30, 2010, the Fund received payments totaling $64,003 relating to certain regulatory settlements with third parties that the Fund had participated in during the year. The payments have been included in “Increase from regulatory settlements” on the Statement of Changes in Net Assets.
36
Columbia Core Bond Fund
April 30, 2010
Note 9. Line of Credit
The Fund and other affiliated funds participate in a $280,000,000 committed, unsecured revolving line of credit provided by State Street. The maximum amount that may be borrowed by any fund is limited to the lesser of $200,000,000 and the Fund’s borrowing limit set forth in the Fund’s registration statement. Borrowings are available for short-term liquidity or temporary or emergency purposes.
Effective October 15, 2009, interest is charged to each participating fund based on the fund’s borrowings at a rate per annum equal to the greater of the Federal Funds Rate plus 1.25% or the overnight LIBOR Rate plus 1.25%. In addition, a commitment fee of 0.15% per annum is accrued and apportioned among the participating funds pro rata based on their relative net assets.
Prior to October 15, 2009, interest was charged to each participating fund based on the fund’s borrowings at a rate per annum equal to the greater of the Federal Funds Rate plus 0.50% or the overnight LIBOR Rate plus 0.50%. In addition, an annual operations agency fee of $20,000, an amendment fee of 0.02% and a commitment fee of 0.12% per annum were accrued and apportioned among the participating funds pro rata based on their relative net assets.
For the year ended April 30, 2010, the Fund did not borrow under these arrangements.
Note 10. Securities Lending
The Fund may lend its securities to certain approved brokers, dealers and other financial institutions. Each loan is collateralized by cash, in an amount at least equal to the market value of the securities loaned plus accrued income from the investment of collateral. The market value of the loaned securities is determined at the close of business of the Fund and any additional required collateral is delivered to the Fund on the next business day. The collateral received is invested and the income generated by the investment of the collateral, net of any fees remitted to State Street as the lending agent and borrower rebates, is paid to the Fund. Generally, in the event of borrower default, the Fund has the right to use the collateral to offset any losses incurred. In the event the Fund is delayed or prevented from exercising its right to dispose of the collateral, there may be a potential loss to the Fund. The Fund bears the risk of loss with respect to the investment of collateral.
Note 11. Shareholder Concentration
As of April 30, 2010, two shareholder accounts owned 73.8% of the outstanding shares of the Fund. Purchase and redemption activity of these accounts may have a significant effect on the operations of the Fund.
Note 12. Significant Risks and Contingencies
Asset-Backed Securities Risk
The value of asset-backed securities may be affected by, among other factors, changes in interest rates, the market’s assessment of the quality of underlying assets, the creditworthiness of the servicer for the underlying assets, factors concerning the interests in and structure of the issuer or the originator of the underlying assets, or the creditworthiness or rating of the entities that provide any supporting letters of credit, surety bonds, derivative instruments, or other credit enhancement. The value of asset-backed securities also will be affected by the exhaustion, termination or expiration of any credit enhancement. Most asset-backed securities are subject to prepayment risk, which is the possibility that the underlying debt may be refinanced or prepaid prior to maturity during periods of declining or low interest rates, causing the Fund to have to reinvest the money received in securities that have lower yields. In addition, the impact of prepayments on the value of asset-backed securities may be difficult to predict and may result in greater volatility.
Mortgage-Backed Securities Risk
The value of mortgage-backed securities may be affected by, among other things, changes in interest rates, factors concerning the interests in and structure of the issuer or the originator of the mortgages, the creditworthiness of the entities that provide any supporting letters of credit, surety bonds or other credit enhancements or the quality of underlying assets or the market’s assessment thereof. Mortgage-backed securities are subject to prepayment risk, which is the possibility that the underlying mortgage may be refinanced or prepaid prior to maturity during periods of declining or low interest rates, causing the Fund to have to reinvest the money received in securities that have lower
37
Columbia Core Bond Fund
April 30, 2010
yields. In addition, the impact of prepayments on the value of mortgage-backed securities may be difficult to predict and may result in greater volatility.
Information Regarding Pending and Settled Legal Proceedings
In June 2004, an action captioned John E. Gallus et al. v. American Express Financial Corp. and American Express Financial Advisors Inc. was filed in the United States District Court for the District of Arizona. The plaintiffs allege that they are investors in several American Express Company (now known as RiverSource) mutual funds and they purport to bring the action derivatively on behalf of those funds under the Investment Company Act of 1940. The plaintiffs allege that fees allegedly paid to the defendants by the funds for investment advisory and administrative services are excessive. The plaintiffs seek remedies including restitution and rescission of investment advisory and distribution agreements. The plaintiffs voluntarily agreed to transfer this case to the United States District Court for the District of Minnesota (the District Court). In response to defendants’ motion to dismiss the complaint, the District Court dismissed one of plaintiffs’ four claims and granted plaintiffs limited discovery. Defendants moved for summary judgment in April 2007. Summary judgment was granted in the defendants’ favor on July 9, 2007. The plaintiffs filed a notice of appeal with the Eighth Circuit Court of Appeals (the Eighth Circuit) on August 8, 2007. On April 8, 2009, the Eighth Circuit reversed summary judgment and remanded to the District Court for further proceedings. On August 6, 2009, defendants filed a writ of certiorari with the U.S. Supreme Court (the Supreme Court), asking the Supreme Court to stay the District Court proceedings while the Supreme Court considers and rules in a case captioned Jones v. Harris Associates, which involves issues of law similar to those presented in the Gallus case. On March 30, 2010, the Supreme Court issued its ruling in Jones v. Harris Associates, and on April 5, 2010, the Supreme Court vacated the Eighth Circuit’s decision in the Gallus case and remanded the case to the Eighth Circuit for further consideration in light of the Supreme Court’s decision in Jones v. Harris Associates.
In December 2005, without admitting or denying the allegations, American Express Financial Corporation (AEFC, which is now known as Ameriprise Financial, Inc. (Ameriprise Financial)), entered into settlement agreements with the Securities and Exchange Commission (SEC) and Minnesota Department of Commerce (MDOC) related to market timing activities. As a result, AEFC was censured and ordered to cease and desist from committing or causing any violations of certain provisions of the Investment Advisers Act of 1940, the Investment Company Act of 1940, and various Minnesota laws. AEFC agreed to pay disgorgement of $10 million and civil money penalties of $7 million. AEFC also agreed to retain an independent distribution consultant to assist in developing a plan for distribution of all disgorgement and civil penalties ordered by the SEC in accordance with various undertakings detailed at http://www.sec.gov/litigation/admin/ia-2451.pdf. Ameriprise Financial and its affiliates have cooperated with the SEC and the MDOC in these legal proceedings, and have made regular reports to the RiverSource Funds’ Boards of Directors/Trustees.
Ameriprise Financial and certain of its affiliates have historically been involved in a number of legal, arbitration and regulatory proceedings, including routine litigation, class actions, and governmental actions, concerning matters arising in connection with the conduct of their business activities. Ameriprise Financial believes that the Funds are not currently the subject of, and that neither Ameriprise Financial nor any of its affiliates are the subject of, any pending legal, arbitration or regulatory proceedings that are likely to have a material adverse effect on the Funds or the ability of Ameriprise Financial or its affiliates to perform under their contracts with the Funds. Ameriprise Financial is required to make 10-Q, 10-K and, as necessary, 8-K filings with the Securities and Exchange Commission on legal and regulatory matters that relate to Ameriprise Financial and its affiliates. Copies of these filings may be obtained by accessing the SEC website at www.sec.gov.
There can be no assurance that these matters, or the adverse publicity associated with them, will not result in increased fund redemptions, reduced sale of fund shares or other adverse consequences to the Funds. Further, although we believe proceedings are not likely to have a material adverse effect on the Funds or the ability of Ameriprise Financial or its affiliates to perform under their contracts with the Funds, these proceedings are subject to uncertainties and, as such, we are unable to estimate the possible loss or range of loss that may result. An adverse outcome in one or more of these proceedings could result in adverse judgments, settlements, fines, penalties or other relief that could have a material adverse effect on the consolidated financial condition or results of operations of Ameriprise Financial.
38
Report of Independent Registered Public Accounting Firm
To the Trustees of Columbia Funds Series Trust I and Shareholders of Columbia Core Bond Fund
In our opinion, the accompanying statement of assets and liabilities, including the portfolio of investments, and the related statements of operations and of changes in net assets and the financial highlights present fairly, in all material respects, the financial position of the Columbia Core Bond Fund (the “Fund”) (a series of Columbia Funds Series Trust I) at April 30, 2010, the results of its operations for the year then ended, the changes in its net assets for each of the two years in the period then ended and the financial highlights for each of the five years in the period then ended, in conformity with accounting principles generally accepted in the United States of America. These financial statements and financial highlights (hereafter referred to as “financial statements”) are the responsibility of the Fund’s management. Our responsibility is to express an opinion on these financial statements based on our audits. We conducted our audits of these financial statements in accordance with the standards of the Public Company Accounting Oversight Board (United States). Those standards require that we plan and perform the audit to obtain reasonable assurance about whether the financial statements are free of material misstatement. An audit includes examining, on a test basis, evidence supporting the amounts and disclosures in the financial statements, assessing the accounting principles used and significant estimates made by management, and evaluating the overall financial statement presentation. We believe that our audits, which included confirmation of securities at April 30, 2010 by correspondence with the custodian and brokers, provide a reasonable basis for our opinion.
PricewaterhouseCoopers LLP
Boston, Massachusetts
June 21, 2010
39
Fund Governance
The Trustees serve terms of indefinite duration. The names, addresses and birth years of the Trustees and Officers of the Funds of Columbia Funds Series Trust I, the year each was first elected or appointed to office, their principal business occupations during at least the last five years, the number of Funds overseen by each Trustee and other directorships they hold are shown below. Each officer listed below serves as an officer of each Fund in the Columbia Funds Complex.
Independent Trustees
| | |
Name, Address and Year of Birth,
Position with Funds, Year First
Elected or Appointed to Office | | Principal Occupation(s) During Past Five Years, Number of Funds in the
Columbia Funds Complex Overseen by Trustee, Other Directorships Held |
| |
| John D. Collins (Born 1938) | | |
c/o Columbia Management Investment Advisers, LLC One Financial Center Boston, MA 02111 Trustee (since 2005) | | Retired. Consultant, KPMG, LLP (accounting and tax firm) from July 1999 to June 2000; Partner, KPMG, LLP from March 1962 to June 1999. Oversees 65; Mrs. Fields Famous Brands LLC (consumer products); Suburban Propane Partners, L.P.; and Montpelier Re (insurance underwriting firm) |
| |
| Rodman L. Drake (Born 1943) | | |
c/o Columbia Management Investment Advisers, LLC One Financial Center Boston, MA 02111 Trustee (since 1994) and Chairman of the Board (since 2009) | | Co-Founder of Baringo Capital LLC (private equity) since 2002; CEO of Crystal River Capital, Inc. (real estate investment trust) since 2003; President, Continuation Investments Group, Inc. from 1997 to 2001. Oversees 65; Jackson Hewitt Tax Service Inc. (tax preparation services); Crystal Capital River Inc. (real estate investment trust); Student Loan Corporation (student loan provider); Celgene Corporation (global biotechnology company); and The Helios Funds (exchange-traded funds) |
| |
| Douglas A. Hacker (Born 1955) | | |
c/o Columbia Management Investment Advisers, LLC One Financial Center Boston, MA 02111 Trustee (since 1996) | | Independent business executive since May 2006; Executive Vice President–Strategy of United Airlines (airline) from December 2002 to May 2006; President of UAL Loyalty Services (airline marketing company) from September 2001 to December 2002; Executive Vice President and Chief Financial Officer of United Airlines from July 1999 to September 2001. Oversees 65; Nash Finch Company (food distributor); Aircastle Limited (aircraft leasing) |
|
| Janet Langford Kelly (Born 1957) |
c/o Columbia Management Investment Advisers, LLC One Financial Center Boston, MA 02111 Trustee (since 1996) | | Senior Vice President, General Counsel and Corporate Secretary, ConocoPhillips (integrated energy company) since September 2007; Deputy General Counsel–Corporate Legal Services, ConocoPhillips from August 2006 to August 2007; Partner, Zelle, Hofmann, Voelbel, Mason & Gette LLP (law firm) from March 2005 to July 2006; Adjunct Professor of Law, Northwestern University, from September 2004 to June 2006; Director, UAL Corporation (airline) from February 2006 to July 2006; Oversees 65; None |
| |
| Charles R. Nelson (Born 1942) | | |
c/o Columbia Management Investment Advisers, LLC One Financial Center Boston, MA 02111 Trustee (since 1981) | | Professor of Economics, University of Washington, since January 1976; Ford and Louisa Van Voorhis Professor of Political Economy, University of Washington, since September 1993; Adjunct Professor of Statistics, University of Washington, since September 1980; Associate Editor, Journal of Money Credit and Banking, 1993-2008 Consultant on econometric and statistical matters. Oversees 65; None |
40
Fund Governance (continued)
Independent Trustees (continued)
| | |
Name, Address and Year of Birth,
Position with Funds, Year First
Elected or Appointed to Office | | Principal Occupation(s) During Past Five Years, Number of Funds in the
Columbia Funds Complex Overseen by Trustee, Other Directorships Held |
| |
| John J. Neuhauser (Born 1943) | | |
c/o Columbia Management Investment Advisers, LLC One Financial Center Boston, MA 02111 Trustee (since 1984) | | President, Saint Michael’s College, since August 2007; University Professor, Boston College from November 2005 to August 2007; Academic Vice President and Dean of Faculties, Boston College from August 1999 to October 2005. Oversees 65; Liberty All-Star Equity Fund and Liberty All-Star Growth Fund, Inc. (closed-end funds) |
| |
| Jonathan Piel (Born 1938) | | |
c/o Columbia Management Investment Advisers, LLC One Financial Center Boston, MA 02111 Trustee (since 1994) | | Cable television producer and website designer; The Editor, Scientific American from 1984 to 1994; Vice President, Scientific American, Inc., from 1984 to 1994; Member, Advisory Board, Stone Age Institute, Bloomington, Indiana (research institute that explores the effect of technology on human evolution); Member, Board of Directors of the National Institute of Social Sciences, New York City; Member, Board of Trustees of the William Alanson White Institute, New York City (institution for training psychoanalysts); and Member, Advisory Board, Mount Sinai Children’s Environmental Health Center, New York. Oversees 65; None |
| |
| Patrick J. Simpson (Born 1944) | | |
c/o Columbia Management Investment Advisers, LLC One Financial Center Boston, MA 02111 Trustee (since 2000) | | Partner, Perkins Coie LLP (law firm). Oversees 65; None |
| |
| Anne-Lee Verville (Born 1945) | | |
c/o Columbia Management Investment Advisers, LLC One Financial Center Boston, MA 02111 Trustee (since 1998) | | Retired since 1997 (formerly General Manager–Global Education Industry (from 1994 to 1997), President–Application Systems Division (from 1991 to 1994), Chief Financial Officer–US Marketing & Services (from 1988 to 1991), and Chief Information Officer (from 1987 to 1988), IBM Corporation (computer and technology)). Oversees 65; None |
41
Fund Governance (continued)
Interested Trustee
| | |
Name, Address and Year of Birth,
Position with Funds, Year First
Elected or Appointed to Office | | Principal Occupation(s) During Past Five Years, Number of Funds in the
Columbia Funds Complex Overseen by Trustee, Other Directorships Held |
| |
| William E. Mayer1 (Born 1940) | | |
c/o Columbia Management Investment Advisers, LLC One Financial Center Boston, MA 02111 Trustee (since 1994) | | Partner, Park Avenue Equity Partners (private equity) since February 1999; Dean and Professor, College of Business, University of Maryland from 1992 to 1997. Oversees 65; Lee Enterprises (print media), WR Hambrecht + Co. (financial service provider); BlackRock Kelso Capital Corporation (investment company) |
| 1 | Mr. Mayer may technically be an “interested person” (as defined in the Investment Company Act of 1940) by reason of his affiliation with WR Hambrecht + Co., a registered broker/dealer that may execute portfolio transactions for, engage in principal transactions with or distribute shares of a Fund or other funds or accounts advised/managed by the Advisor or any sub-advisor to a Fund. |
The Statement of Additional Information includes additional information about the Trustees of the Funds and is available, without charge, upon request by calling 1-800-345-6611.
42
Fund Governance (continued)
Officers
| | |
| Name, Year of Birth and Address | | Principal Occupation(s) During the Past Five Years |
| |
| J. Kevin Connaughton (Born 1964) | | |
One Financial Center Boston, MA 02111 President (since 2009) | | Senior Vice President and General Manager–Mutual Fund Products, Columbia Management Investment Advisers, LLC since May 2010; President, Columbia Funds, since 2009, and RiverSource Funds, since May 2010 (previously Senior Vice President and Chief Financial Officer, Columbia Funds, from June 2008 to January 2009, Treasurer, Columbia Funds, from October 2003 to May 2008, and senior officer of various other affiliated funds since 2000); Managing Director, Columbia Management Advisors, LLC from December 2004 to April 2010. |
| |
| Michael G. Clarke (Born 1969) | | |
One Financial Center Boston, MA 02111 Senior Vice President and Chief Financial Officer (since 2009) | | Vice President, Columbia Management Investment Advisers, LLC since May 2010; Managing Director of Fund Administration, Columbia Management Advisors, LLC, from September 2004 to April 2010; senior officer of Columbia Funds and affiliated funds since 2002. |
| |
| Scott R. Plummer (Born 1959) | | |
5228 Ameriprise Financial Center Minneapolis, MN 55474 Senior Vice President, Secretary and Chief Legal Officer (since 2010) | | Chief Legal Officer and Assistant Secretary, Columbia Management Investment Advisers, LLC since June 2005; Vice President and Lead Chief Counsel–Asset Management, Ameriprise Financial, Inc. since May 2010 (previously Vice President and Chief Counsel–Asset Management, from 2005 to April 2010, and Vice President–Asset Management Compliance from 2004 to 2005); Vice President, Chief Counsel and Assistant Secretary, Columbia Management Investment Distributors, Inc. since 2008; Vice President, General Counsel and Secretary, Ameriprise Certificate Company since 2005; Chief Counsel, RiverSource Distributors, Inc. since 2006; Vice President, General Counsel and Secretary, RiverSource Funds, since December 2006; Senior Vice President, Secretary and Chief Legal Officer, Columbia Funds, since May 2010. |
| |
| Linda J. Wondrack (Born 1964) | | |
One Financial Center Boston, MA 02111 Senior Vice President and Chief Compliance Officer (since 2007) | | Vice President and Chief Compliance Officer, Columbia Management Investment Advisers, LLC since May 2010; Chief Compliance Officer, Columbia Funds, since 2007, and RiverSource Funds, since May 2010; Director (Columbia Management Group, LLC and Investment Product Group Compliance), Bank of America, from June 2005 to April 2010; Director of Corporate Compliance and Conflicts Officer of MFS Investment Management (investment management) from August 2004 to May 2005. |
| |
| William F. Truscott (Born 1960) | | |
53600 Ameriprise Financial Center Minneapolis, MN 55474 Senior Vice President (since 2010) | | Chairman of the Board, Columbia Management Investment Advisers, LLC since May 2010 (previously President, Chairman of the Board and Chief Investment Officer, from 2001 to April 2010); Chief Executive Officer, U.S. Asset Management & President, Annuities, Ameriprise Financial, Inc. since May 2010 (previously President–U.S. Asset Management and Chief Investment Officer from 2005 to April 2010, and Senior Vice President — Chief Investment Officer, from 2001 to 2005); Director, President and Chief Executive Officer, Ameriprise Certificate Company since 2006; Director, Columbia Management Investment Distributors, Inc. since May 2010 (previously Chairman of the Board and Chief Executive Officer from 2008 to April 2010); Chairman of the Board and Chief Executive Officer, RiverSource Distributors, Inc. since 2006. |
43
Fund Governance (continued)
Officers (continued)
| | |
| Name, Year of Birth and Address | | Principal Occupation(s) During the Past Five Years |
|
| Colin Moore (Born 1958) |
One Financial Center Boston, MA 02111 Senior Vice President (since 2010) | | Director and Chief Investment Officer, Columbia Management Investment Advisers, LLC since May 2010; Manager, Managing Director and Chief Investment Officer of Columbia Management Advisors, LLC from 2007 to April 2010; Head of Equities, Columbia Management Advisors, LLC from 2002 to 2007. |
| |
| Michael A. Jones (Born 1959) | | |
100 Federal Street Boston, MA 02110 Senior Vice President (since 2010) | | Director and President, Columbia Management Investment Advisers, LLC since May 2010; President and Director, Columbia Management Investment Distributors, Inc. since May 2010; Manager, Chairman, Chief Executive Officer and President, Columbia Management Advisors, LLC from 2007 to April 2010; Chief Executive Officer, President and Director, Columbia Management Distributors, Inc. from November 2006 to April 2010; previously, co-president and senior managing director at Robeco Investment Management. |
| |
| Amy Johnson (Born 1965) | | |
5228 Ameriprise Financial Center Minneapolis, MN 55474 Senior Vice President (since 2010) | | Senior Vice President and Chief Operating Officer, Columbia Management Investment Advisers, LLC since May 2010 (previously Chief Administrative Officer, from 2009 until April 2010, Vice President–Asset Management and Trust Company Services, from 2006 to 2009, and Vice President–Operations and Compliance from 2004 to 2006). |
| |
| Joseph F. DiMaria (Born 1968) | | |
One Financial Center Boston, MA 02111 Treasurer (since 2009) and Chief Accounting Officer (since 2008) | | Vice President, Mutual Fund Administration, Columbia Management Investment Advisers, LLC, since May 2010; Director of Fund Administration, Columbia Management Advisors, LLC from January 2006 to April 2010; Head of Tax/Compliance and Assistant Treasurer, Columbia Management Advisors, LLC, from November 2004 to December 2005. |
| |
| Marybeth Pilat (Born 1968) | | |
One Financial Center Boston, MA 02111 Deputy Treasurer (since 2010) | | Vice President, Mutual Fund Administration, Columbia Management Investment Advisers, LLC, since May 2010; Vice President, Investment Operations, Bank of America, from October 2008 to April 2010; Finance Manager, Boston Children’s Hospital from August 2008 to October 2008; Director, Mutual Fund Administration, Columbia Management Advisors, LLC, from May 2007 to July 2008; Vice President, Mutual Fund Valuation, Columbia Management Advisors, LLC, from January 2006 to May 2007; Vice President, Mutual Fund Accounting Oversight, Columbia Management Advisors, LLC from January 2005 to January 2006. |
| |
| Julian Quero (Born 1967) | | |
One Financial Center Boston, MA 02111 Deputy Treasurer (since 2008) | | Vice President, Mutual Fund Administration, Columbia Management Investment Advisers, LLC since May 2010; Director of Fund Administration, Columbia Management Advisors, LLC, from August 2008 to April 2010; Senior Tax Manager, Columbia Management Advisors, LLC from August 2006 to July 2008; Senior Compliance Manager, Columbia Management Advisors, LLC from April 2002 to August 2006. |
| |
| Stephen T. Welsh (Born 1957) | | |
One Financial Center Boston, MA 02111 Vice President (since 2006) | | President and Director, Columbia Management Investment Services Corp. since May 2010; President and Director, Columbia Management Services, Inc. from July 2004 to April 2010; Managing Director, Columbia Management Distributors, Inc. from August 2007 to April 2010. |
44
Board Consideration and Approval of Advisory Agreements
The Board unanimously approved the Advisory Agreements at a meeting held on December 17, 2009. These agreements were approved by shareholders on March 3, 2010, and took effect upon the closing of the acquisition of the long-term asset management business of Columbia by Ameriprise Financial, Inc. (“Ameriprise”) (the “Transaction”).
The Advisory Fees and Expenses Committee (the “Committee”) of the Board met on multiple occasions to review the investment management services agreements (the “Advisory Agreements”) for the funds for which the Trustees serve as trustees (each a “Fund,” and collectively, the “Funds”). On December 14, 2009, the Committee recommended that the full Board approve the Advisory Agreements. On December 17, 2009, the full Board, including a majority of the Trustees who have no direct or indirect interest in the Advisory Agreements and who are not “interested persons” (as defined in the 1940 Act) of the Trust (the “Independent Trustees”), approved the Advisory Agreement with Columbia Management Investment Advisers, LLC (formerly, RiverSource Investments, LLC) (“CMIA”) for each Fund. Prior to their approval of the Advisory Agreements, the Committee and the Independent Trustees requested and evaluated materials from, and were provided materials and information about the Transaction and matters related to the proposals by, BOA, Columbia, CMIA and Ameriprise. In connection with their most recent approval of the Funds’ previous advisory agreements (the “Former Advisory Agreements”) on October 28, 2009, the Committee and the Trustees requested and evaluated materials from Columbia, and discussed such materials with representatives of Columbia. The Committee, at meetings held on August 11, 2009, September 23, 2009, October 27, 2009, November 30, 2009, December 7, 2009 and December 14, 2009, and the Independent Trustees, at meetings held on August 12, 2009, August 20, 2009, October 28, 2009, December 8, 2009, December 14, 2009 and December 17, 2009, discussed the materials provided in connection with the October 28, 2009 approvals and the materials provided in connection with their consideration of the Advisory Agreements and other matters relating to the Transaction with representatives of BOA, Columbia, CMIA and Ameriprise. The Trustees consulted with experienced legal counsel, who advised on the legal standards for consideration by the Trustees. The Independent Trustees also discussed the proposed approvals with independent legal counsel in private sessions.
The Trustees reviewed each Advisory Agreement, as well as certain information obtained through CMIA’s responses to initial and supplemental questionnaires prepared at the request of the Trustees by counsel to the Funds and independent legal counsel to the Independent Trustees. The Committee and the Trustees also met with, and reviewed and considered a report prepared and provided by, the independent fee consultant (the “Fee Consultant”) appointed by the Independent Trustees pursuant to an assurance of discontinuance entered into by Columbia with the New York Attorney General (“NYAG”) to settle a civil complaint filed by the NYAG relating to trading in mutual fund shares (the “NYAG Settlement”). Under the NYAG Settlement, the Fee Consultant’s role is to manage the process by which management fees are negotiated so that they are negotiated in a manner that is at arms’ length and reasonable.
The Trustees considered all materials that they, their legal counsel or CMIA believed reasonably necessary to evaluate and to determine whether to approve the Advisory Agreements. In their deliberations, the Trustees did not identify any particular information that was all-important or controlling, and individual Trustees may have attributed different weights to the various factors. The material factors that formed the basis for the Trustees’ approvals included the factors set forth below:
| (i) | the reputation, financial strength, regulatory histories and resources of CMIA and its parent, Ameriprise; |
| (ii) | the capabilities of CMIA with respect to compliance, including an assessment of CMIA’s compliance system by the Funds’ Chief Compliance Officer; |
| (iii) | the qualifications of the personnel of CMIA that would be expected to provide advisory services to each Fund, including CMIA’s representations that the Chief Investment Officer of Columbia would serve as the Chief Investment Officer of CMIA, and that the process for determining the portfolio management team for each Fund would be substantially the same process as has customarily been followed by Columbia, and reported to the Trustees, in evaluating the performance of Columbia’s portfolio management teams; |
| (iv) | the terms and conditions of the Advisory Agreements, including the differences between the Advisory Agreements and Former Advisory Agreements in |
45
| | connection with CMIA’s efforts to standardize such agreements across the Columbia Fund complex and the legacy RiverSource fund complex; |
| (v) | the terms and conditions of other agreements and arrangements relating to the future operations of the Funds, including an administrative services agreement and the Master Services and Distribution Agreement; |
| (vi) | the commitment of CMIA and Ameriprise that there would not be any diminution in the nature, quality and extent of services provided to each Fund or its shareholders following closing of the Transaction; |
| (vii) | that the Trustees recently had completed a full annual review of the Former Advisory Agreements, as required by the 1940 Act, for each Fund and had determined that they were satisfied with the nature, extent and quality of services provided thereunder and that the management fee rate for each Fund were sufficient to warrant their approval; |
| (viii) | that the advisory fee rates payable by each Fund would not change; |
| (ix) | that CMIA and BOA, and not any Fund, would bear the costs of obtaining approvals of the Advisory Agreements; |
| (x) | that Ameriprise and CMIA had agreed to exercise reasonable best efforts to assure that, for a period of two years after the Closing, there would not be imposed on any Fund any “unfair burden” (within the meaning of Section 15(f) of 1940 Act) with respect to the Transaction; and |
| (xi) | that certain members of CMIA’s management had a significant amount of experience integrating other fund families; that certain current Columbia personnel that would be integrated into CMIA and its affiliates as a result of the Transaction also had experience in integrating fund families; and that the senior management of CMIA following the Transaction would include certain senior executives of Columbia who were, at that time, responsible for oversight of services provided to the Funds. |
Nature, Extent and Quality of Services to be Provided. The Trustees considered the expected nature, extent and quality of services to be provided to the Funds by CMIA and its affiliates and the resources to be dedicated to the Funds by CMIA and its affiliates. The Trustees considered, among other things, the expected effect of the Transaction on the operations of the Funds, the information provided by CMIA with respect to the nature, extent and quality of services to be provided by it, CMIA’s compliance programs and compliance records, the ability of CMIA (including personnel and other resources, compensation programs for personnel involved in fund management, reputation and other attributes) to attract, motivate and retain highly qualified research, advisory and supervisory investment professionals, the trade execution services to be provided on behalf of the Funds and the quality of CMIA’s investment research capabilities and the other resources that it indicated it would devote to each Fund. As noted above, the Trustees also considered CMIA’s representations that the Chief Investment Officer of Columbia would serve as the Chief Investment Officer of CMIA following the Transaction, and that the process for determining the portfolio management team for each Fund would be substantially the same process as has customarily been followed by Columbia, and reported to the Trustees, in evaluating the performance of Columbia’s portfolio management teams.
The Trustees noted the professional experience and qualifications of the senior personnel of CMIA. The Trustees also considered the compliance programs of and the compliance-related resources proposed to be provided to the Funds by CMIA and its affiliates, including discussions with the Funds’ Chief Compliance Officer regarding CMIA’s compliance program. The Trustees also discussed CMIA’s compliance program with the Chief Compliance Officer for the legacy RiverSource funds. The Trustees also considered CMIA’s representation that the Funds’ Chief Compliance Officer would serve as the Chief Compliance Officer of CMIA following the Transaction. The Trustees considered CMIA’s ability to provide administrative services to the Funds, noting that while some Former Advisory Agreements contemplated the provision of certain administrative services, following the Transaction, all administrative services were anticipated to be provided pursuant to a new administrative services agreement. The Trustees also considered CMIA’s ability to coordinate the activities of each Fund’s other service providers. The Trustees considered performance information provided by CMIA with respect to other mutual funds advised by CMIA, and discussed with senior executives of CMIA its
46
process for identifying which portfolio management teams of the legacy Columbia and legacy CMIA organizations would be responsible for the management of the Funds following the Transaction. After reviewing these and related factors, the Trustees concluded, within the context of their overall conclusions, that the expected nature, extent and quality of the services to be provided to each Fund under the Advisory Agreements supported the approval of such agreements.
Investment Advisory Fee Rates and Other Expenses. The Trustees considered the fact that the advisory fee rates payable by each Fund to CMIA under the Advisory Agreements were the same as those that were paid by each Fund to Columbia under the Former Advisory Agreements. The Trustees noted that in connection with their October 28, 2009 approval of the Former Advisory Agreements, they had concluded, within the context of their overall conclusions regarding each such agreement, that the advisory fees charged to each Fund supported the continuation of the agreement(s) pertaining to that Fund.
The Trustees noted that in certain cases the effective advisory fee rate for a legacy RiverSource fund was lower than the proposed investment advisory fee rate for a Fund with generally similar investment objectives and strategies. The Trustees also noted that CMIA’s investment advisory fee rates for equity and balanced funds generally are subject to adjustments based on investment performance, whereas the proposed investment advisory fee rates for the Funds, consistent with those in the Former Advisory Agreements, do not reflect performance adjustments. The Trustees considered existing advisory fee breakpoints and CMIA’s undertaking not to change expense caps previously implemented by Columbia with respect to the Funds without further discussion with the Independent Trustees.
The Trustees received and considered information about the advisory fees charged by CMIA to institutional accounts. In considering the fees charged to those accounts, the Trustees took into account, among other things, CMIA’s representations about the differences between managing mutual funds as compared to other types of accounts, including differences in the services provided, differences in the risk profile of such business for CMIA and the additional resources required to manage mutual funds effectively. In evaluating each Fund’s advisory fees, the Trustees also took into account the demands, complexity and quality of the investment management of the Fund.
The Trustees also considered that for certain Funds, certain administrative services that were provided under the Former Advisory Agreements would not be provided under the Advisory Agreements, but under a separate administrative services agreement. The Trustees noted that, unlike fees under an advisory agreement, fees under the administrative services agreement could be changed without shareholder approval, although CMIA had not proposed any increase in such administrative fees and any such increase would require Board approval. The Trustees also noted Ameriprise’s and CMIA’s covenants regarding compliance with Section 15(f) of the 1940 Act.
After reviewing these and related factors, the Trustees concluded, within the context of their overall conclusions, that the expected advisory fee rates and expenses of each Fund supported the approval of the Advisory Agreements.
Costs of Services to be Provided and Profitability. The Trustees noted that in connection with their October 28, 2009 approval of the Former Advisory Agreements, they had concluded, within the context of their overall conclusions regarding each such agreement, that profitability to Columbia and its affiliates of their relationships with each Fund supported the continuation of the agreement(s) pertaining to that Fund. In connection with the integration of the legacy Columbia and legacy CMIA organizations, the Trustees considered, among other things, CMIA’s projected annual net expense synergies (reductions in the cost of providing services to the Funds), the timetable over which such synergies are expected to be realized and the extent to which any such synergies are expected to be shared with the Funds. The Trustees also considered information provided by CMIA regarding their respective financial conditions. The Trustees considered that CMIA proposed to continue voluntary expense caps currently in effect for the Funds and that CMIA had undertaken not to change these caps without further discussion with the Independent Trustees. After reviewing these and related factors, the Trustees concluded, within the context of their overall conclusions, that the expected profitability to CMIA and its affiliates from its relationship with each Fund supported the approval of the Advisory Agreements.
Economies of Scale. The Trustees considered the existence of any anticipated economies of scale in the provision by CMIA of services to each Fund, to groups of related Funds
47
and to CMIA’s investment advisory clients as a whole, and whether those economies of scale were expected to be shared with the Funds. The Trustees considered Ameriprise’s anticipated net expense synergies resulting from the Transaction, and considered the possibility that the Funds might benefit from economies of scale over time as part of the larger, combined fund complex. The Trustees considered how expected synergies and potential economies of scale might benefit the Funds and their shareholders. The Trustees considered the potential impact of the Transaction on the distribution of the Funds, and noted that the proposed management fee schedules for the Funds generally contained breakpoints that would reduce the fee rate on assets above specified threshold levels. After reviewing these and related factors, the Trustees concluded, within the context of their overall conclusions, that the extent to which economies of scale were expected to be shared with the Funds supported the approval of the Advisory Agreements.
Other Benefits to CMIA. The Trustees received and considered information regarding any expected “fall-out” or ancillary benefits to be received by CMIA and its affiliates as a result of their relationships with the Funds, such as the engagement of CMIA to provide administrative services to the Funds and the engagement of CMIA’s affiliates to provide distribution and transfer agency services to the Funds. The Trustees considered that the Funds’ distributor, which would be an affiliate of CMIA, retains a portion of the distribution fees from the Funds and receives a portion of the sales charges on sales or redemptions of certain classes of shares of the Funds. The Trustees also considered the benefits of research made available to CMIA by reason of brokerage commissions generated by the Funds’ securities transactions, and reviewed information about CMIA’s practices with respect to allocating portfolio brokerage for brokerage and research services. The Trustees considered the possible conflicts of interest associated with certain fall-out or other ancillary benefits and the reporting, disclosure and other processes that would be in place to disclose and to monitor such possible conflicts of interest. The Trustees recognized that CMIA’s profitability would be somewhat lower without these benefits.
Conclusion. Based on their evaluation of all factors that they deemed to be material, including those factors described above, and assisted by the advice of independent legal counsel and the Fee Consultant, the Trustees, including the Independent Trustees, approved, and recommended that Fund shareholders approve, each Advisory Agreement.
48
Summary of Management Fee Evaluation by Independent Fee Consultant (RiverSource Investments, LLC)
EXCERPTS FROM REPORT OF INDEPENDENT FEE CONSULTANT TO THE FUNDS SUPERVISED BY THE COLUMBIA ATLANTIC BOARD
Prepared Pursuant to the February 9, 2005 Assurance of Discontinuance among the Office of Attorney General of New York State, Columbia Management Advisors, LLC, and Columbia Management Distributors, Inc. December 21, 2009
I. Overview
On February 9, 2005, Columbia Management Advisors, LLC (“CMA”) and Columbia Management Distributors, Inc.1 (“CMD”) agreed to the New York Attorney General’s Assurance of Discontinuance (“AOD”). Among other things, the AOD stipulates that CMA may manage or advise a Columbia Fund (“Columbia Fund” and, together with some or all of such funds, the “Columbia Funds”) only if the Independent Members of the Columbia Fund’s Board of Trustees appoint a Senior Officer or retain an Independent Fee Consultant (“IFC”) who is to manage the process by which proposed management fees are negotiated. The AOD further stipulates that the Senior Officer or IFC is to prepare a written annual evaluation of the fee negotiation process.
With effect from January 1, 2007, the Independent Members of the Board of Trustees for certain Columbia Funds known collectively as the “Atlantic Funds” (together with the other members of that Board, the “Trustees”) retained me as IFC for the Atlantic Funds.2 In this capacity, I have prepared this written evaluation of the fee negotiation process. As was the case with the last three annual reports, my immediate predecessor as IFC, John Rea, provided invaluable assistance in the preparation of this report.
On September 29, 2009, Ameriprise entered into an asset purchase agreement with Bank of America, N.A. and its parent, Bank of America Corporation (together, the “Bank”) pursuant to which the Bank agreed to sell certain CMG assets relating to Columbia’s long-term asset management business, including management of the Atlantic Funds (the “Transaction”).3 The Transaction if completed would result in the termination of the existing Investment Management Agreements with CMA. Therefore, the Trustees have been requested to approve and recommend to the shareholders of each Atlantic Fund new Investment Management and Sub-Advisory Agreements (together, the “Management Agreements”) with RiverSource Investments, LLC (“RI”),4 investment manager of the RiverSource Funds and a subsidiary of Ameriprise. This report is intended to fulfill the requirements of the AOD with respect to the Trustees’ consideration of the new Management Agreements.
A. Role of the Independent Fee Consultant
The AOD charges the IFC with “managing the process by which proposed management fees … to be charged the Columbia Fund are negotiated so that they are negotiated in a manner which is at arms’ length and reasonable and consistent with this Assurance of Discontinuance.” The AOD also provides that CMA “may manage or advise a Columbia Fund only if the reasonableness of the proposed management fees is determined by the Board of Trustees … using … an annual independent written evaluation prepared by or under the direction of … the Independent Fee Consultant.” Therefore, the AOD makes clear that the IFC does not supplant the Trustees in negotiating management fees with CMA (or RI), nor does the IFC substitute his or her judgment for that of the Trustees with respect to the reasonableness of proposed fees or any other matter that is committed to the business judgment of the Trustees.
| 1 | CMA and CMD are subsidiaries of Columbia Management Group, LLC (“CMG”), and are the successors to the entities named in the AOD. |
| 2 | I have no material relationship with Bank of America, CMG or Ameriprise Financial, Inc. (“Ameriprise”), aside from serving as IFC, and I am aware of no material relationship with any of their affiliates. I retained John Rea, an independent economic consultant, to assist me with this report. |
| | Unless otherwise stated or required by the context, this report covers only the Atlantic Funds. |
| 3 | Preliminary Response of Ameriprise to Information Request of Columbia Atlantic Board dated October 21, 2009 (hereafter, the “Preliminary Response”), p. 1. The one money market Atlantic Fund, Money Market Fund VS, was included in the Transaction because it was an integral part of CMG's array of Funds used as investment vehicles by variable annuity and similar insurance products. |
| 4 | Ameriprise intends to re-brand RI with the “Columbia” name (which is one of the assets being sold in the Transaction). Preliminary Response, pp. 4-5. In the case of new Sub-Advisory Agreements, the current sub-adviser would also be a party. |
49
B. Elements Involved in Managing the Fee Negotiation Process
In preparing the report required by the AOD, the IFC must consider at least the following six factors set forth in the AOD:
| 1. | The nature and quality of the adviser’s services, including the Fund’s performance; |
| 2. | Management fees (including any components thereof) charged by other mutual fund companies for like services; |
| 3. | Possible economies of scale as the Fund grows larger; |
| 4. | Management fees (including any components thereof) charged to institutional and other clients of the adviser for like services; |
| 5. | Costs to the adviser and its affiliates of supplying services pursuant to the management fee agreements, excluding any intra-corporate profit; and |
| 6. | Profit margins of the adviser and its affiliates from supplying such services. |
C. Data Presented to the Trustees
In considering the proposed new Management Agreements with RI, the Trustees relied in part on the data that had been prepared as part of their annual contract review process, which concluded in late October. This data remained relevant because the fees in the proposed Management Agreements were identical to the fees approved at that time. The annual review materials included a Lipper report on the performance of each Atlantic Fund compared to its peers and its benchmark, comparisons of the fees and expenses of each Atlantic Fund to similar CMG-sponsored Funds, comparable competitive funds chosen by Lipper, and institutional accounts advised by CMA, revenues, expenses, and profits of CMG from managing the Atlantic Funds, calculated both by Fund and collectively, and CMG’s views on the existence and sharing of economies of scale.
In addition, the Trustees reviewed materials specific to the proposed new Management Agreements with RI in response to requests for information made on behalf of the Trustees, including the following:
| n | | Performance data for the RiverSource Funds showing percentile and quartile rankings of each fund within its Lipper performance universe for periods up to five years and net returns of each fund relative to its benchmark returns. This data was arguably relevant due to the possibility that some RiverSource investment teams would be providing investment management services to certain Columbia Funds. 5 |
| n | | tables comparing the fee schedules and effective fee rates of funds managed by CMA and RI and institutional accounts advised by the two firms. |
| n | | extensive discussion of the process by which the various components of the two asset management businesses would be integrated including investment management, compliance, transfer agency, custody, fund accounting, and distribution. |
| n | | information about the financial condition of Ameriprise, including its most recent annual report on Form 10-K, RI’s profit margins from managing the RiverSource Funds in 2007 and 2008, and pro forma income statements for the combined Columbia and RiverSource fund complex. |
| n | | disclosure that certain senior CMG executives, including President Michael Jones, Chief Investment Officer Colin Moore, Head of Mutual Funds J. Kevin Connaughton, and Chief Compliance Officer Linda Wondrack would continue in analogous capacities following the consummation of the Transaction, and |
| n | | a breakdown of the synergies RI expects to realize in the two years following the Transaction and the extent to which those potential synergies are expected to be shared with shareholders of funds advised by RI. |
| 5 | On page 20 of its Supplemental Response to the Atlantic Trustees (undated but delivered November 24, 2009), Ameriprise said that “most personnel decisions, including with respect to the portfolio management teams for the Atlantic Funds . . . will be made primarily by [current CMA CIO] Colin Moore using the Columbia 5P process.” |
50
II. Findings
| 1. | Based upon my examination of the information supplied by CMG and Ameriprise in the light of the six factors set forth in the AOD, I conclude that the Trustees have the relevant information necessary to evaluate the reasonableness of the proposed management fees for each Atlantic Fund. |
| 2. | In my view, the process by which the proposed management fees of the Atlantic Funds have been negotiated with RI thus far has been, to the extent practicable, at arms’ length and reasonable and consistent with the AOD. |
Respectfully submitted,
Steven E. Asher
51
Shareholder Meeting Results
Columbia Core Bond Fund
On March 3, 2010, a special meeting of shareholders of Columbia Funds Series Trust I was held to consider the approval of several proposals listed in the proxy statement for the meeting. Proposal 1 and Proposal 2 were voted on at the March 3, 2010 meeting of shareholders and Proposal 3 was voted on at an adjourned meeting of shareholders held on March 31, 2010. The shareholder meeting results are as follows:
Proposal 1: A proposed Investment Management Services Agreement with Columbia Management Investment Advisers, LLC (formerly, RiverSource Investments, LLC) (CMIA) was approved as follows:
| | | | | | |
| | | | | | | |
| Votes For | | Votes Against | | Abstentions | | Broker Non-Votes |
| 1,421,608,806 | | 3,472,180 | | 2,960,035 | | 40,944,226 |
Proposal 2: A proposal authorizing CMIA to enter into and materially amend subadvisory agreements for the Fund in the future, with the approval of the Trust’s Board of Trustees, but without obtaining additional shareholder approval, was approved as follows:
| | | | | | |
| | | | | | | |
| Votes For | | Votes Against | | Abstentions | | Broker Non-Votes |
| 1,405,826,066 | | 19,218,986 | | 2,995,958 | | 40,944,236 |
Proposal 3: Each of the nominees for trustees was elected to the Trust’s Board of Trustees, as follows:
| | | | | | |
| | | | | | | |
| Trustee | | Votes For | | Votes Withheld | | Abstentions |
| John D. Collins | | 30,977,072,412 | | 859,827,038 | | 0 |
Rodman L. Drake | | 30,951,179,004 | | 885,720,446 | | 0 |
| Douglas A. Hacker | | 30,989,793,279 | | 847,106,171 | | 0 |
Janet Langford Kelly | | 30,999,020,814 | | 837,878,636 | | 0 |
| William E. Mayer | | 16,291,139,483 | | 15,545,759,967 | | 0 |
Charles R. Nelson | | 30,997,700,700 | | 839,198,750 | | 0 |
| John J. Neuhauser | | 30,988,095,661 | | 848,803,789 | | 0 |
Jonathon Piel | | 30,968,801,048 | | 868,098,402 | | 0 |
| Patrick J. Simpson | | 30,999,065,030 | | 837,834,420 | | 0 |
Anne-Lee Verville | | 30,996,227,913 | | 840,671,537 | | 0 |
52
Important Information About This Report
The fund mails one shareholder report to each shareholder address. If you would like more than one report, please call shareholder services at 1-800-345-6611 and additional reports will be sent to you. This report has been prepared for shareholders of Columbia Core Bond Fund.
A description of the policies and procedures that the fund uses to determine how to vote proxies and a copy of the fund’s voting records are available (i) at www.columbiamanagement.com, (ii) on the Securities and Exchange Commission’s website at www.sec.gov, and (iii) without charge, upon request, by calling 1-800-368-0346. Information regarding how the fund voted proxies relating to portfolio securities during the 12-month period ended June 30 is available from the SEC’s website. Information regarding how the fund voted proxies relating to portfolio securities is also available from the fund’s website, columbiamanagement.com.
The fund files a complete schedule of portfolio holdings with the SEC for the first and third quarters of each fiscal year on Form N-Q. The fund’s Form N-Q is available on the SEC’s website at www.sec.gov and may be reviewed and copied at the SEC’s Public Reference Room in Washington, D.C. Information on the operation of the Public Reference Room may be obtained by calling
1-800-SEC-0330.
Investors should consider the investment objectives, risks, charges and expenses of a mutual fund carefully before investing. For a free prospectus, which contains this and other important information about the funds, visit columbiamanagement.com. Read the prospectus carefully before investing.
On April 30, 2010, Ameriprise Financial, Inc., the parent company of RiverSource Investments, LLC, acquired the long-term asset management business of Columbia Management Group, LLC, including certain of its affiliates, which were, prior to this acquisition, part of Bank of America, N.A. In connection with the acquisition of the long-term assets, the Columbia Funds have a new investment adviser, RiverSource Investments, LLC, which is now known as Columbia Management Investment Advisers, LLC. For those clients that use the services of a subadviser, those arrangements are continuing unless notified otherwise. RiverSource Fund Distributors, Inc., now known as Columbia Management Investment Distributors, Inc., member FINRA, will act as the principal distributor of the Columbia Funds.
Transfer Agent*
Columbia Management Investment Services Corp.
P.O. Box 8081
Boston, MA 02266-8081
1-800-345-6611
Distributor*
Columbia Management Investment
Distributors, Inc.
One Financial Center
Boston, MA 02111
Investment Advisor*
Columbia Management Investment Advisers, LLC
100 Federal Street
Boston, MA 02110
* As of May 1, 2010.
53

Columbia Core Bond Fund
One Financial Center
Boston, MA 02111-2621
columbiafunds.com
This report must be accompanied or preceeded by the Fund’s current prospectus. Columbia Management mutual funds are distributed by Columbia Management Investment Distributors, Inc.
©2010 Columbia Management Investment Advisers, LLC. All rights reserved.
C-1001 A (6/10)
| | (a) | The registrant has, as of the end of the period covered by this report, adopted a code of ethics that applies to the registrant’s principal executive officer, principal financial officer, principal accounting officer or controller, or persons performing similar functions, regardless of whether these individuals are employed by the registrant or a third party. |
| | (b) | During the period covered by this report, there were not any amendments to a provision of the code of ethics adopted in 2(a) above. |
| | (c) | During the period covered by this report, there were no waivers, including any implicit waivers, from a provision of the code of ethics described in 2(a) above that relates to one or more of the items set forth in paragraph (b) of this item’s instructions. |
| Item 3. | Audit Committee Financial Expert. |
The registrant’s Board of Trustees has determined that John D. Collins, Douglas A. Hacker, Charles R. Nelson and Anne-Lee Verville, each of whom are members of the registrant’s Board of Trustees and Audit Committee, each qualify as an audit committee financial expert. Mr. Collins, Mr. Hacker, Mr. Nelson and Ms. Verville are each independent trustees, as defined in paragraph (a)(2) of this item’s instructions.
| Item 4. | Principal Accountant Fees and Services. |
Fee information below is disclosed for the one series of the registrant whose report to stockholders is included in this annual filing.
(a) Audit Fees. Aggregate Audit Fees billed by the principal accountant for professional services rendered during the fiscal years ended April 30, 2010 and April 30, 2009 are approximately as follows:
Audit Fees include amounts related to the audit of the registrant’s annual financial statements or services that are normally provided by the accountant in connection with statutory and regulatory filings or engagements for those fiscal years.
(b) Audit-Related Fees. Aggregate Audit-Related Fees billed to the registrant by the principal accountant for professional services rendered during the fiscal years ended April 30, 2010 and April 30, 2009 are approximately as follows:
Audit-Related Fees include amounts for assurance and related services by the principal accountant that are reasonably related to the performance of the audit of the registrant’s financial statements and are not reported in Audit Fees above. In both fiscal years 2010 and 2009, Audit-Related Fees consist of agreed-upon procedures performed for semi-annual shareholder reports.
During the fiscal years ended April 30, 2010 and April 30, 2009, there were no Audit-Related Fees billed by the registrant’s principal accountant to the registrant’s investment adviser (not including any sub-adviser whose role is primarily portfolio management and is subcontracted with or overseen by another investment adviser) and any entity controlling, controlled by, or under common control with the adviser that provides ongoing services to the registrant for an engagement that related directly to the operations and financial reporting of the registrant.
(c) Tax Fees. Aggregate Tax Fees billed by the principal accountant to the registrant for professional services rendered during the fiscal years ended April 30, 2010 and April 30, 2009 are approximately as follows:
Tax Fees include amounts for the review of annual tax returns, the review of required shareholder distribution calculations and typically include amounts for professional services by the principal accountant for tax compliance, tax advice and tax planning.
During the fiscal years ended April 30, 2010 and April 30, 2009, there were no Tax Fees billed by the registrant’s principal accountant to the registrant’s investment adviser (not including any sub-adviser whose role is primarily portfolio management and is subcontracted with or overseen by another investment adviser) and any entity controlling, controlled by, or under common control with the adviser that provides ongoing services to the registrant for an engagement that related directly to the operations and financial reporting of the registrant.
(d) All Other Fees. Aggregate All Other Fees billed by the principal accountant to the registrant for professional services rendered during the fiscal years ended April 30, 2010 and April 30, 2009 are approximately as follows:
All Other Fees include amounts for products and services provided by the principal accountant, other than the services reported in paragraphs (a) through (c) above.
Aggregate All Other Fees billed by the registrant’s principal accountant to the registrant’s investment adviser (not including any sub-adviser whose role is primarily portfolio management and is subcontracted with or overseen by another investment adviser) and any entity controlling, controlled by, or under common control with the adviser that provides ongoing services to the registrant for an engagement that related directly to the operations and financial reporting of the registrant during the fiscal years ended April 30, 2010 and April 30, 2009 are approximately as follows:
| | |
| 2010 | | 2009 |
| $1,499,400 | | $636,800 |
In both fiscal years 2010 and 2009, All Other Fees consist of fees billed for internal control examinations of the registrant’s transfer agent and investment advisor. Fiscal year 2010 also includes fees for agreed upon procedures related to the sale of the long-term asset management business and fees related to the review of revenue modeling schedules.
(e)(1) Audit Committee Pre-Approval Policies and Procedures
The registrant’s Audit Committee is required to pre-approve the engagement of the registrant’s independent accountants to provide audit and non-audit services to the registrant and non-audit services to its investment adviser (not including any sub-adviser whose role is primarily portfolio management and is subcontracted with or overseen by another investment adviser) or any entity controlling, controlled by or under common control with such investment adviser that provides ongoing services to the registrant (“Adviser Affiliates”), if the engagement relates directly to the operations and financial reporting of the registrant.
The Audit Committee has adopted a Policy for Engagement of Independent Accountants for Audit and Non-Audit Services (“Policy”). The Policy sets forth the understanding of the Audit Committee regarding the engagement of the registrant’s independent accountants to provide (i) audit and permissible audit-related, tax and other services to the registrant (collectively “Fund Services”); (ii) non-audit services to the registrant’s investment adviser (not including any sub-adviser whose role is primarily portfolio management and is subcontracted with or overseen by another investment
adviser) and Adviser Affiliates, if the engagement relates directly to the operations or financial reporting of a Fund (collectively “Fund-related Adviser Services”); and (iii) certain other audit and non-audit services to the registrant’s investment adviser (not including any sub-adviser whose role is primarily portfolio management and is subcontracted with or overseen by another investment adviser) and Adviser Affiliates. Unless a type of service receives general pre-approval under the Policy, it requires specific pre-approval by the Audit Committee if it is to be provided by the independent accountants. Pre-approval of non-audit services to the registrant, the registrant’s investment adviser (not including any sub-adviser whose role is primarily portfolio management and is subcontracted with or overseen by another investment adviser) and Adviser Affiliates may be waived provided that the “de minimis” requirements set forth under paragraph (c)(7)(i)(C) of Rule 2-01 of Regulation S-X are met.
Under the Policy, the Audit Committee may delegate pre-approval authority to any pre-designated member or members who are Independent Trustees/Directors. The member(s) to whom such authority is delegated must report, for informational purposes only, any pre-approval decisions to the Audit Committee at its next regular meeting. The Audit Committee’s responsibilities with respect to the pre-approval of services performed by the independent accountants may not be delegated to management.
The Policy requires the Fund Treasurer and/or Director of Board Administration to submit to the Audit Committee, on an annual basis, a schedule of the types of services that are subject to general pre-approval. The schedule(s) provide a description of each type of service that is subject to general pre-approval and, where possible, will provide estimated fee caps for each instance of providing each service. The Audit Committees will review and approve the types of services and review the projected fees for the next fiscal year and may add to, or subtract from, the list of general pre-approved services from time to time based on subsequent determinations. That approval acknowledges that the Audit Committee is in agreement with the specific types of services that the independent accountants will be permitted to perform.
The Fund Treasurer and/or Director of Board Administration shall report to the Audit Committee at each of its regular meetings regarding all Fund Services or Fund-related Adviser Services initiated since the last such report was rendered, including a general description of the services, actual billed and projected fees, and the means by which such Fund Services or Fund-related Adviser Services were pre-approved by the Audit Committee.
*****
(e)(2) The percentage of services described in paragraphs (b) through (d) of this Item approved pursuant to the “de minimis” exception under paragraph (c)(7)(i)(C) of Rule 2-01 of Regulation S-X during both fiscal years ended April 30, 2010 and April 30, 2009 was zero.
(f) Not applicable.
(g) The aggregate non-audit fees billed by the registrant’s accountant for services rendered to the registrant, and rendered to the registrant’s investment adviser (not including any sub-adviser whose role is primarily portfolio management and is subcontracted with or overseen by another investment adviser), and any entity controlling, controlled by, or under common control with the adviser that provides ongoing services to the registrant for the fiscal years ended April 30, 2010 and April 30, 2009 are approximately as follows:
| | |
| 2010 | | 2009 |
| $1,508,200 | | $646,500 |
(h) The registrant’s Audit Committee of the Board of Directors has considered whether the provision of non-audit services that were rendered to the registrant’s adviser (not including any sub-adviser whose role is primarily portfolio management and is subcontracted with or overseen by another investment adviser), and any entity controlling, controlled by, or under common control with the investment adviser that provides ongoing services to the registrant that were not pre-approved pursuant to paragraph (c)(7)(ii) of Rule 2-01 of Regulation S-X, is compatible with maintaining the principal accountant’s independence.
| Item 5. | Audit Committee of Listed Registrants. |
Not applicable.
| | (a) | The registrant’s “Schedule I – Investments in securities of unaffiliated issuers” (as set forth in 17 CFR 210.12-12) is included in Item 1 of this Form N-CSR. |
| Item 7. | Disclosure of Proxy Voting Policies and Procedures for Closed-End Management Investment Companies. |
Not applicable.
| Item 8. | Portfolio Managers of Closed-End Management Investment Companies. |
Not applicable.
| Item 9. | Purchases of Equity Securities by Closed-End Management Investment Company and Affiliated Purchasers. |
Not applicable.
| Item 10. | Submission of Matters to a Vote of Security Holders. |
There have not been any material changes to the procedures by which shareholders may recommend nominees to the registrant’s board of directors, since those procedures were last disclosed in response to requirements of Item 407(c)(2)(iv) of Regulation S-K (as required by Item 22(b)(15) of Schedule 14A) or this Item.
| Item 11. | Controls and Procedures. |
| | (a) | The registrant’s principal executive officer and principal financial officers, based on their evaluation of the registrant’s disclosure controls and procedures as of a date within 90 days of the filing of this report, have concluded that such controls and procedures are adequately designed to ensure that information required to be disclosed by the registrant in Form N-CSR is accumulated and communicated to the registrant’s management, including the principal executive officer and principal financial officer, or persons performing similar functions, as appropriate to allow timely decisions regarding required disclosure. |
| | (b) | There was no change in the registrant’s internal control over financial reporting that occurred during the registrant’s second fiscal quarter of the period covered by this report that has materially affected, or is reasonably likely to materially affect, the registrant’s internal control over financial reporting. |
(a)(1) Code of ethics required to be disclosed under Item 2 of Form N-CSR attached hereto as Exhibit 99.CODE ETH.
(a)(2) Certifications pursuant to Rule 30a-2(a) under the Investment Company Act of 1940 (17 CFR 270.30a-2(a)) attached hereto as Exhibit 99.CERT.
(a)(3) Not applicable.
(b) Certification pursuant to Rule 30a-2(b) under the Investment Company Act of 1940 (17 CFR 270.30a-2(b)) attached hereto as Exhibit 99.906CERT.
SIGNATURES
Pursuant to the requirements of the Securities Exchange Act of 1934 and the Investment Company Act of 1940, the registrant has duly caused this report to be signed on its behalf by the undersigned, thereunto duly authorized.
| | | | | | | | | | | | | | | | |
| (registrant) | | | | | | | | | | | | Columbia Funds Series Trust I | | | | |
| | | | |
| By (Signature and Title) | | | | /s/ J. Kevin Connaughton | | | | |
| | | | | | | | | | | | J. Kevin Connaughton, President | | | | |
| | | | | | | | |
| Date | | | | | | | | | | | | June 21, 2010 | | | | |
Pursuant to the requirements of the Securities Exchange Act of 1934 and the Investment Company Act of 1940, this report has been signed below by the following persons on behalf of the registrant and in the capacities and on the dates indicated. |
| By (Signature and Title) | | | | /s/ J. Kevin Connaughton | | | | |
| | | | | | | | | | | | J. Kevin Connaughton, President | | | | |
| | | | | | | | |
| Date | | | | | | | | | | | | June 21, 2010 | | | | |
| | | | |
| By (Signature and Title) | | | | /s/ Michael G. Clarke | | | | |
| | | | | | | | | | | | Michael G. Clarke, Chief Financial Officer | | | | |
| | | | | | | | |
| Date | | | | | | | | | | | | June 21, 2010 | | | | |
