UNITED STATES
SECURITIES AND EXCHANGE COMMISSION
Washington, D.C. 20549
FORM N-CSR
CERTIFIED SHAREHOLDER REPORT OF REGISTERED
MANAGEMENT INVESTMENT COMPANIES
Investment Company Act file number | 811-04367 |
|
Columbia Funds Series Trust I |
(Exact name of registrant as specified in charter) |
|
50606 Ameriprise Financial Center, Minneapolis, Minnesota | | 55474 |
(Address of principal executive offices) | | (Zip code) |
|
Scott R. Plummer 5228 Ameriprise Financial Center Minneapolis, MN 55474 |
(Name and address of agent for service) |
|
Registrant’s telephone number, including area code: | 1-612-671-1947 | |
|
Date of fiscal year end: | May 31 | |
|
Date of reporting period: | May 31, 2010 | |
| | | | | | | | |
Form N-CSR is to be used by management investment companies to file reports with the Commission not later than 10 days after the transmission to stockholders of any report that is required to be transmitted to stockholders under Rule 30e-1 under the Investment Company Act of 1940 (17 CFR 270.30e-1). The Commission may use the information provided on Form N-CSR in its regulatory, disclosure review, inspection, and policymaking roles.
A registrant is required to disclose the information specified by Form N-CSR, and the Commission will make this information public. A registrant is not required to respond to the collection of information contained in Form N-CSR unless the Form displays a currently valid Office of Management and Budget (“OMB”) control number. Please direct comments concerning the accuracy of the information collection burden estimate and any suggestions for reducing the burden to Secretary, Securities and Exchange Commission, 450 Fifth Street, NW, Washington, DC 20549-0609. The OMB has reviewed this collection of information under the clearance requirements of 44 U.S.C. § 3507.
Item 1. Reports to Stockholders.

Columbia Strategic Income Fund
Annual Report for the Period Ended May 31, 2010
Not FDIC insured • No bank guarantee • May lose value
Table of Contents
| Fund Profile | | | 1 | | |
|
| Economic Update | | | 2 | | |
|
| Performance Information | | | 4 | | |
|
| Understanding Your Expenses | | | 5 | | |
|
| Portfolio Managers' Report | | | 6 | | |
|
| Financial Statements | | | | | |
|
| Investment Portfolio | | | 8 | | |
|
Statement of Assets and
Liabilities | | | 27 | | |
|
| Statement of Operations | | | 29 | | |
|
Statement of Changes in
Net Assets | | | 30 | | |
|
| Financial Highlights | | | 32 | | |
|
| Notes to Financial Statements | | | 36 | | |
|
Report of Independent Registered
Public Accounting Firm | | | 47 | | |
|
| Fund Governance | | | 48 | | |
|
Board Consideration and
Approval of Advisory Agreements | | | 53 | | |
|
Summary of Management Fee
Evaluation by Independent Fee
Consultant (RiverSource
Investments, LLC) | | | 57 | | |
|
| Shareholder Meeting Results | | | 59 | | |
|
Important Information About
This Report | | | 61 | | |
|
The views expressed in this report reflect the current views of the respective parties. These views are not guarantees of future performance and involve certain risks, uncertainties and assumptions that are difficult to predict, so actual outcomes and results may differ significantly from the views expressed. These views are subject to change at any time based upon economic, market or other conditions and the respective parties disclaim any responsibility to update such views. These views may not be relied on as investment advice and, because investment decisions for a Columbia Fund are based on numerous factors, may not be relied on as an indication of trading intent on behalf of any particular Columbia Fund. References to specific securities should not be construed as a recommendation or investment advice.
President's Message

Dear Shareholder:
On May 3, 2010, Ameriprise Financial, Inc. announced that it had completed the acquisition of the long-term asset management business of Columbia Management Group, LLC from Bank of America. This includes the business of managing its equity and fixed-income mutual funds. Ameriprise Financial has combined its current U.S. asset management business, RiverSource Investments, LLC, with Columbia Management. This transaction puts together two leading asset management firms to create one entity that ranks as one of the largest managers of long-term mutual fund assets in the United States. This combined business will operate under the well-regarded Columbia Management brand, where we will build on the strengths of our combined investment capabilities and talent, our broad and diversified product lineup and exceptional service.
Our combined business has a new breadth and depth of investment choices. William "Ted" Truscott, CEO, U.S. asset management and president of annuities for Ameriprise Financial, leads the combined U.S. asset management business. Michael Jones serves as president, U.S. asset management.1 Colin Moore continues to serve as chief investment officer.1 I am also continuing in my role as head of mutual funds, responsible for the delivery of mutual fund products and services to investors. The Columbia funds' advisers, distributor and transfer agent are now subsidiaries of our parent company, Ameriprise Financial but operate under the Columbia Management name. You will begin to see these names used in communications and statements going forward.
| | | Service provider name | |
| Advisers | | Columbia Management Investment Advisers, LLC
Columbia Wanger Asset Management, LLC | |
|
| Distributor | | Columbia Management Investment Distributors, Inc. | |
|
| Transfer Agent | | Columbia Management Investment Services Corp. | |
|
As a valued investor in Columbia funds, please know that our goal is to ensure a smooth transition and provide the highest quality products and services. Transition teams across the organization continue their efforts to build on best practices from both legacy organizations with integration efforts including rebranding, vendor and system consolidations and client communications. Additionally, we want to assure you that the funds' portfolio managers also continue to focus on providing uninterrupted service to all fund shareholders.
Although we have a lot of work ahead of us in 2010, Columbia Management and Ameriprise Financial are excited about the opportunities for our combined organization. I share this optimism and believe it positions us as a best-in-class asset management business with the ability to deliver more for our clients than ever before.
Sincerely,

J. Kevin Connaughton
President, Columbia Funds
1Associate joined Columbia Management Investment Advisers, LLC as part of its 2010 acquisition of the long-term asset management business of Columbia Management Group, LLC from Bank of America.
Investors should consider the investment objectives, risks, charges and expenses of a mutual fund carefully before investing. For a free prospectus, which contains this and other important information about the funds, visit www.columbiamanagement.com. Read the prospectus carefully before investing.
Securities products offered through Columbia Management Investment Distributors, Inc. (formerly known as RiverSource Fund Distributors, Inc.), member FINRA. Advisory services provided by Columbia Management Investment Advisers, LLC (formerly known as RiverSource Investments, LLC).
© 2010 Columbia Management Investment Advisers, LLC. All rights reserved.
Fund Profile – Columbia Strategic Income Fund
Summary
g For the 12-month period that ended May 31, 2010, the fund's Class A shares returned 13.14% without sales charge.
g The fund outperformed its primary benchmark, the Barclays Capital Government/Credit Bond Index1, but trailed its blended benchmark, which consists of 35% Barclays Capital Aggregate Bond Index, 35% JPMorgan Global High Yield Index, 15% Citigroup Non-U.S. World Government Bond Index—Unhedged and 15% JPMorgan EMBI Global Diversified Index.2 The fund also lagged its peer group, the Lipper Multi-Sector Income Funds Classification.3
g Allocations to high-yield and emerging market debt aided performance relative to the fund's former benchmark, while an underweight in riskier assets hurt performance relative to the new blended benchmark and the average return of competing funds.
Portfolio Management
Laura A. Ostrander, lead manager of the fund, has managed or co-managed the fund since 2000 and has been associated with the advisor since May 2010. Prior to joining the advisor, Ms. Ostrander was associated with the fund's previous advisor or its predecessors since 1996.
Brian Lavin, CFA has co-managed the fund since 2010 and has been associated with the advisor since 1994.
Colin J. Lundgren, CFA has co-managed the fund since 2010 and has been associated with the advisor since 1986.
Gene R. Tannuzzo, CFA has co-managed the fund since 2010 and has been associated with the advisor since 2003.
Effective July 16, 2010, Laura A. Ostrander will no longer co-manage the fund.
1The Barclays Capital Government/Credit Bond Index is an index that tracks the performance of U.S. government and corporate bonds rated investment grade or better, with maturities of at least one year.
2The Barclays Capital Aggregate Bond Index is a market value-weighted index that tracks the daily price, coupon, pay-downs and total return performance of fixed-rate, publicly placed, dollar-denominated and non-convertible investment grade debt issues with at least $250 million par amount outstanding and with at least one year to final maturity. The JPMorgan Global High Yield Index is designed to mirror the investable universe of the U.S. dollar global high yield corporate debt market, including domestic and international issues. The Citigroup Non-U.S. World Government Bond Index—Unhedged is calculated on a market-weighted basis and includes all fixed-rate bonds with a remaining maturity of one year or longer and with amounts outstanding of at least the equivalent of U.S. $25 million. The index excludes floating or variable rate bonds, securities aimed principally at non-institutional investors and private placem ent-type securities. The JPMorgan Emerging Markets Bond Index Global Diversified Index ("EMBI Global") tracks total returns for traded external debt instruments in the emerging markets and is an expanded version of the JPMorgan Emerging Markets Bond Index Plus ("EMBI+"). As with EMBI+, the EMBI Global includes U.S. dollar-denominated Brady bonds, loans and Eurobonds with an outstanding face value of at least $500 million. It covers more of the eligible instruments than the EMBI+ by relaxing somewhat the strict EMBI+ limits on secondary market trading liquidity.
Indices are not available for investment, are not professionally managed and do not reflect sales charges, fees, brokerage commissions, taxes or other expenses of investing. Securities in the fund may not match those in an index.
3Lipper Inc., a widely respected data provider in the industry, calculates an average total return (assuming reinvestment of distributions) for mutual funds with investment objectives similar to those of the fund. Lipper makes no adjustments for the effect of sales loads.
Performance data quoted represents past performance and current performance may be lower or higher. Past performance is no guarantee of future results. The investment return and principal value will fluctuate so that shares, when redeemed, may be worth more or less than the original cost. Please visit www.columbiafunds.com for daily and most recent month-end performance updates.
Summary
1-year return as of 05/31/10
| | +13.14% | |
|
| |  | | | Class A shares
(without sales charge) | |
|
| | +8.64% | |
|
| |  | | | Barclays Capital
Government/Credit Bond Index | |
|
| | +16.19% | |
|
| |  | | | Blended Benchmark | |
|
1
Economic Update – Columbia Strategic Income Fund
Summary
For the 12-month period that ended May 31, 2010
g Solid economic growth and relatively low interest rates boosted bond market returns. The Barclays Capital Aggregate Bond Index delivered solid results. High-yield bonds outperformed stocks, as measured by the Credit Suisse High Yield Index.
Barclays
Aggregate Index | | Credit Suisse
Index | |
|
 | |  | |
|
g The U.S. stock market delivered solid returns, despite a correction in the final weeks of the period. Emerging market stocks, as measured by the MSCI Emerging Markets Index, outperformed U.S. stocks as well as stock markets in developed foreign markets.
| S&P Index | | MSCI Index | |
|
 | |  | |
|
Although it has been nearly a year since U.S. economic growth turned positive, the economy continues to send mixed signals about the sustainability of this recovery. Consumer spending on items such as cars, clothing and other goods, for example, was solid throughout most of the year. However, in May 2010, spending fell 1.2%. By contrast, consumer confidence gained ground near the end of the period as consumers surveyed indicated they were increasingly optimistic about business conditions and job prospects.
The housing market showed some signs of stabilizing. However, a full recovery remained out of reach. Home sales moved generally higher, as mortgage rates remained low and new homebuyers took advantage of a federal tax credit, which was extended through June of 2010—the second such extension in the past six months. Distressed properties continued to pressure prices and a huge backlog of foreclosed homes is likely to continue to keep a lid on prices for some time. Yet, housing prices were higher at the end of May 2010 than they were one year ago.
News on the job front was mostly positive. Approximately 290,000 new jobs were added to the economy in April 2010—the second consecutive month of significant job gains in 2010. Yet, a good portion of those jobs are government sponsored and temporary.
Reports from the business side of the economy were generally positive. A key measure of the nation's manufacturing situation—the Institute for Supply Management's Index—rose for nine consecutive months before a slight downtick in May and industrial production moved higher. Perhaps the best news was about corporate profits. Of the S&P 500 companies announcing first-quarter results, 77% exceeded Wall Street earnings forecasts.
Bond returns ranged from solid to strong
As the economy strengthened, bonds delivered solid returns. The Barclays Capital Aggregate Bond Index1 returned 8.42%. Municipal bonds gained slightly more than taxable investment-grade bonds even without factoring in potential tax advantages to investors in higher income-tax brackets. The Barclays Capital Municipal Bond Index2 returned 8.52%. The high-yield bond market outpaced stocks during the period. For the 12 months covered by this report, the Credit Suisse High Yield Index3 returned 29.96%. Even the Treasury market was positive as the yield on the 10-year U.S. Treasury, a common bellwether for the bond market, fell from 3.5% to 3.3% during the 12-month period. Despite the pickup in economic activity, the Federal Reserve Board kept a key short-term interest rate—the federal funds rate—close to zero.
1The Barclays Capital Aggregate Bond Index is a market value-weighted index that tracks the daily price, coupon, pay-downs and total return performance of fixed-rate, publicly placed, dollar-denominated and non-convertible investment grade debt issues with at least $250 million par amount outstanding and with at least one year to final maturity.
2The Barclays Capital Municipal Bond Index is considered representative of the broad market for investment-grade, tax-exempt bonds with a maturity of at least one year.
3The Credit Suisse High Yield Index is a broad-based index that tracks the performance of high-yield bonds.
2
Economic Update (continued) – Columbia Strategic Income Fund
Stocks staged a solid comeback
Against a strengthening economic backdrop, a stock market rally that began in mid-March 2009 continued into April 2010, when a debt crisis brewing in Europe spilled over and undermined investor confidence in the United States. The S&P 500 Index lost on the order of 10% in the final six weeks of the period. Yet, the U.S. stock market returned 20.99% for the 12-month period, as measured by the S&P 500 Index.4
Outside the United States, stock market returns were also strong. The MSCI EAFE Index,5 a broad gauge of stock market performance in foreign developed markets, returned 6.38% (net of dividends, in U.S. dollars) for the period, as concerns about the impact of a bailout for weak eurozone economies weighed on the markets. Emerging stock markets were more resilient. The MSCI Emerging Markets Index6 returned 22.39% (net of dividends, in U.S. dollars) for the 12-month period.
Past performance is no guarantee of future results.
4The S&P 500 Index tracks the performance of 500 widely held, large-capitalization U.S. stocks.
5The Morgan Stanley Capital International Europe, Australasia, Far East (MSCI EAFE) Index is a capitalization-weighted index that tracks the total return of common stocks in 21 developed-market countries within Europe, Australasia and the Far East.
6The Morgan Stanley Capital International Emerging Markets Index (MSCI EMI) is a free float-adjusted market capitalization index that is designed to measure equity market performance of emerging markets. As of June 2009, the MSCI Emerging Markets Index consisted of the following 22 emerging market country indices: Brazil, Chile, China, Colombia, Czech Republic, Egypt, Hungary, India, Indonesia, Israel, Korea, Malaysia, Mexico, Morocco, Peru, Philippines, Poland, Russia, South Africa, Taiwan, Thailand and Turkey.
Indices are not available for investment, are not professionally managed and do not reflect sales charges, fees, brokerage commissions, taxes or other expenses of investing. Securities in the fund may not match those in an index.
3
Performance Information – Columbia Strategic Income Fund
Performance data quoted represents past performance and current performance may be lower or higher. Past performance is no guarantee of future results. The investment return and principal value will fluctuate so that shares, when redeemed, may be worth more or less than the original cost. Please visit www.columbiafunds.com for daily and most recent month-end performance updates.
Annual operating expense ratio (%)*
| Class A | | | 0.98 | | |
| Class B | | | 1.73 | | |
| Class C | | | 1.73 | | |
| Class Z | | | 0.73 | | |
* The annual operating expense ratio is as stated in the fund's prospectus that is current as of the date of this report. Differences in expense ratios disclosed elsewhere in this report may result from the inclusion of fee waivers and expense reimbursements as well as the use of different time periods to calculate the ratios.
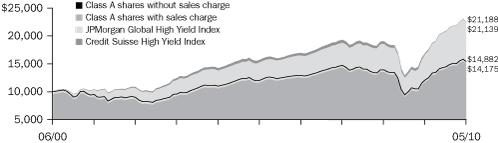
Performance of a $10,000 investment 06/01/00 – 05/31/10
The chart above shows the change in value of a hypothetical $10,000 investment in Class A shares of Columbia Strategic Income Fund during the stated time period, and does not reflect the deduction of taxes that a shareholder may pay on fund distributions or on the redemption of fund shares.
Performance of a $10,000 investment 06/01/00 – 05/31/10 ($)
| Sales charge | | without | | with | |
| Class A | | | 19,136 | | | | 18,227 | | |
| Class B | | | 17,761 | | | | 17,761 | | |
| Class C | | | 18,019 | | | | 18,019 | | |
| Class Z | | | 19,499 | | | | n/a | | |
Average annual total return as of 05/31/10 (%)
| Share class | | A | | B | | C | | Z | |
| Inception | | 04/21/77 | | 05/15/92 | | 07/01/97 | | 01/29/99 | |
| Sales charge | | without | | with | | without | | with | | without | | with | | without | |
| 1-year | | | 13.14 | | | | 7.76 | | | | 12.30 | | | | 7.30 | | | | 12.26 | | | | 11.26 | | | | 13.36 | | |
| 5-year | | | 5.41 | | | | 4.38 | | | | 4.62 | | | | 4.30 | | | | 4.77 | | | | 4.77 | | | | 5.68 | | |
| 10-year | | | 6.71 | | | | 6.19 | | | | 5.91 | | | | 5.91 | | | | 6.07 | | | | 6.07 | | | | 6.91 | | |
Average annual total return as of 06/30/10 (%)
| Share class | | A | | B | | C | | Z | |
| Sales charge | | without | | with | | without | | with | | without | | with | | without | |
| 1-year | | | 13.34 | | | | 7.95 | | | | 12.50 | | | | 7.50 | | | | 12.66 | | | | 11.66 | | | | 13.77 | | |
| 5-year | | | 5.48 | | | | 4.46 | | | | 4.73 | | | | 4.41 | | | | 4.85 | | | | 4.85 | | | | 5.76 | | |
| 10-year | | | 6.64 | | | | 6.12 | | | | 5.84 | | | | 5.84 | | | | 6.00 | | | | 6.00 | | | | 6.84 | | |
The "with sales charge" returns include the maximum initial sales charge of 4.75% for Class A shares and the applicable contingent deferred sales charge of 5.00% in the first year, declining to 1.00% in the sixth year and eliminated thereafter for Class B shares and 1.00% for Class C shares for the first year only. The "without sales charge" returns do not include the effect of sales charges. If they had, returns would be lower.
Performance results reflect any fee waivers or reimbursements of fund expenses by the investment advisor and/or any of its affiliates. Absent these fee waivers or expense reimbursement arrangements, performance results would have been lower.
All results shown assume reinvestment of distributions. Class Z shares are sold at net asset value with no distribution and service (Rule 12b-1) fees. Class Z shares have limited eligibility and the investment minimum requirements may vary. Please see the fund's prospectus for details. Performance for different share classes will vary based on differences in sales charges and fees associated with each class.
The tables do not reflect the deduction of taxes that a shareholder may pay on fund distributions or on the redemption of fund shares.
4
Understanding Your Expenses – Columbia Strategic Income Fund
As a fund shareholder, you incur two types of costs. There are transaction costs, which generally include sales charges on purchases and may include redemption fees or exchange fees. There are also ongoing costs, which generally include investment advisory fees, distribution and service (Rule 12b-1) fees and other fund expenses. The information on this page is intended to help you understand the ongoing costs of investing in the fund and to compare these costs with the ongoing costs of investing in other mutual funds.
Analyzing your fund's expenses by share class
To illustrate these ongoing costs, we have provided an example and calculated the expenses paid by investors in each share class during the period. The information in the following table is based on an initial investment of $1,000, which is invested at the beginning of the period and held for the entire period. Expense information is calculated two ways and each method provides you with different information. The amount listed in the "Actual" column is calculated using the fund's actual operating expenses and total return for the period. The amount listed in the "Hypothetical" column for each share class assumes that the return each year is 5% before expenses and is calculated based on the fund's actual operating expenses. You should not use the hypothetical account values and expenses to estimate either your actual account balance at the end of the period or the expenses you paid during this period.
Compare with other funds
Since all mutual funds are required to include the same hypothetical calculations about expenses in shareholder reports, you can use this information to compare the ongoing cost of investing in the fund with other funds. To do so, compare the 5% hypothetical example with the 5% hypothetical examples that appear in the shareholder reports of other funds. As you compare hypothetical examples of other funds, it is important to note that hypothetical examples are meant to highlight the ongoing costs of investing in a fund and do not reflect any transaction costs, such as sales charges, redemption fees or exchange fees.
Estimating your actual expenses
To estimate the expenses that you paid over the period, first you will need your account balance at the end of the period:
g For shareholders who receive their account statements from Columbia Management Investment Services Corp., your account balance is available online at www.columbiafunds.com or by calling Shareholder Services at 800.345.6611.
g For shareholders who receive their account statements from their financial intermediary, contact your financial intermediary to obtain your account balance.
1. Divide your ending account balance by $1,000. For example, if an account balance was $8,600 at the end of the period, the result would be 8.6.
2. In the section of the table below titled "Expenses paid during the period," locate the amount for your share class. You will find this number in the column labeled "Actual." Multiply this number by the result from step 1. Your answer is an estimate of the expenses you paid on your account during the period.
If the value of your account falls below the minimum initial investment requirement applicable to you, your account may be subject to a $20 annual fee. This fee is not included in the accompanying table. If you are subject to the fee, keep it in mind when you are estimating the ongoing expenses of investing in the fund and when comparing the expenses of this fund with other funds.
12/01/09 – 05/31/10
| | | Account value at the
beginning of the period ($) | | Account value at the
end of the period ($) | | Expenses paid
during the period ($) | | Fund's annualized
expense ratio (%) | |
| | | Actual | | Hypothetical | | Actual | | Hypothetical | | Actual | | Hypothetical | | Actual | |
| Class A | | | 1,000.00 | | | | 1,000.00 | | | | 1,014.60 | | | | 1,019.85 | | | | 5.12 | | | | 5.14 | | | | 1.02 | | |
| Class B | | | 1,000.00 | | | | 1,000.00 | | | | 1,010.90 | | | | 1,016.11 | | | | 8.87 | | | | 8.90 | | | | 1.77 | | |
| Class C | | | 1,000.00 | | | | 1,000.00 | | | | 1,011.60 | | | | 1,016.85 | | | | 8.12 | | | | 8.15 | | | | 1.62 | | |
| Class Z | | | 1,000.00 | | | | 1,000.00 | | | | 1,016.10 | | | | 1,021.09 | | | | 3.87 | | | | 3.88 | | | | 0.77 | | |
Expenses paid during the period are equal to the annualized expense ratio for the share class, multiplied by the average account value over the period, then multiplied by the number of days in the fund's most recent fiscal half-year and divided by 365.
Had the investment advisor and/or any of its affiliates not waived fees or reimbursed a portion of expenses for Class C shares, account value at the end of the period for Class C shares would have been reduced.
It is important to note that the expense amounts shown in the table are meant to highlight only ongoing costs of investing in the fund and do not reflect any transaction costs, such as sales charges, redemption fees or exchange fees. Therefore, the hypothetical examples provided may not help you determine the relative total costs of owning shares of different funds. If these transaction costs were included, your costs would have been higher.
5
Portfolio Managers' Report – Columbia Strategic Income Fund
Performance data quoted represents past performance and current performance may be lower or higher. Past performance is no guarantee of future results. The investment return and principal value will fluctuate so that shares, when redeemed, may be worth more or less than the original cost. Please visit www.columbiafunds.com for daily and most recent month-end performance updates.
Net asset value per share
as of 05/31/10 ($)
| Class A | | | 5.84 | | |
| Class B | | | 5.84 | | |
| Class C | | | 5.84 | | |
| Class Z | | | 5.78 | | |
Distributions declared per share
06/01/09 – 05/31/10 ($)
| Class A | | | 0.26 | | |
| Class B | | | 0.22 | | |
| Class C | | | 0.23 | | |
| Class Z | | | 0.27 | | |
For the 12-month period that ended May 31, 2010, the fund's Class A shares returned 13.14% without sales charge. The fund's return was higher than the 8.64% return of its primary benchmark, the Barclays Capital Government/Credit Bond Index but lower than the 16.19% return of its blended benchmark, which consists of 35% Barclays Capital Aggregate Bond Index, 35% JPMorgan Global High Yield Index, 15% Citigroup Non-U.S. World Government Bond Index—Unhedged and 15% JPMorgan EMBI Global Diversified Index. The fund also trailed the 19.48% average return of its peer group, the Lipper Multi-Sector Income Funds Classification. High-yield bond and emerging market debt allocations helped the fund outperform its former benchmark. An underweight in high-yield bonds early on in the period and an underweight in investment-grade corporate bonds throughout the period hampered returns relative to the blended benchmark. Underperformance from high-yield and emerging market bond investments also detracted from relative return. We believe the fund underperformed the average fund in its peer group because it had less exposure to risk within the high-yield, investment grade corporate and emerging market bond sectors.
Investors favored riskier assets for higher yields
As the global economy improved and interest rates stayed near historical lows, investors moved into higher-risk, higher-yielding assets. Demand was strong for high-yield and emerging market debt and for low-quality investment grade corporate bonds. Late in the period, however, the European sovereign debt crisis escalated, and the euro weakened significantly versus the U.S. dollar and other major currencies. Concerns about fiscal problems in Greece and other smaller European Union countries quickly dampened investors' risk appetite, sparking a flight into higher-quality assets.
Biggest contribution from high-yield bonds
For the 12-month period, the high-yield bond sector generated returns of over 30%, benefiting from strong investor demand as an improving economy lowered the risk of default. The best performers were the lowest-quality (CCC-rated) issues, with returns that were more than double those of the overall sector. The fund benefited from having more than 30% of its assets, on average, in high-yield bonds, but was hurt by an underweight in the sector, especially early in the period, as well as an underweight versus the peer group in CCC-rated issues. As the economic outlook improved, we increased the fund's stake in both CCC- and B-rated securities. A decision to trim exposure to defensive industries, such as utilities and health care, and add to more economically-sensitive areas, including financials and housing, also aided performance.
Mixed results from foreign government bonds
Roughly one-third of the fund's assets were in foreign government bonds, split approximately equally between emerging and developed markets. Emerging market bonds posted much stronger gains than developed market government bonds. The fund's underweights in riskier emerging market countries and in emerging market currency exposure, however, hindered results. As the global economic outlook
6
Portfolio Managers' Report (continued) – Columbia Strategic Income Fund
improved, we added to emerging market debt, focusing on markets that we thought would be among the first to benefit from a global economic recovery.
An overweight in foreign developed market government bonds relative to the fund's new blended benchmark further hindered results, as did an overweight versus the peer group in euro currency exposure. Underweights in the hardest hit European markets, such as Greece, and overweights in more stable markets, such as Germany and France, however, were helpful, as was our decision to reduce foreign developed market exposure. A 20% stake in U.S. government bonds, which outperformed foreign developed market government issues, also added modestly to returns. An underweight in investment grade corporate bonds relative to the peer group, however, hampered results, as the sector posted strong gains.
Opportunities ahead
We believe that high-yield bond valuations are attractive, especially given their late-period decline and the likelihood, in our opinion, of fewer defaults going forward. Prospects for emerging market debt also look strong, as faster growing economies can remove stimulus policies more quickly than major industrialized economies faced with tepid growth. In the near term, however, sustainability of the global economic recovery remains uncertain and could result in more market volatility. We plan to take advantage of buying opportunities created by further volatility, using our disciplined approach to credit selection to add to high-yield and emerging market debt exposure.
Portfolio characteristics and holdings are subject to change and may not be representative of current characteristics and holdings. The outlook for the fund may differ from that presented for other Columbia Funds.
Investing in fixed-income securities may involve certain risks, including the credit quality of individual issuers, possible prepayments, market or economic developments and yield and share price fluctuations due to changes in interest rates. When interest rates go up, bond prices typically drop, and vice versa.
Investments in high-yield bonds (sometimes referred to as "junk" bonds) offer the potential for high current income and attractive total return, but involve certain risks. Changes in economic conditions or other circumstances may adversely affect a high-yield bond issuer's ability to make principal and interest payments.
International investing involves special risks, including foreign taxation, currency fluctuations, risks associated with possible differences in financial standards and other risks associated with future political and economic developments.
Investing in emerging markets may involve greater risks than investing in more developed countries. In addition, concentration of investments in a single region may result in greater volatility.
30-day SEC yields
as of 05/31/10 (%)
| Class A | | | 4.42 | | |
| Class B | | | 3.90 | | |
| Class C | | | 4.02 | | |
| Class Z | | | 4.89 | | |
The 30-day SEC yields reflect the fund's earning power net of expenses, expressed as an annualized percentage of the public offering price per share at the end of the period. Had the investment advisor not waived fees or reimbursed a portion of expenses, the 30-day SEC yields would have been lower.
Maturity breakdown
as of 05/31/10 (%)
| 0–1 year | | | 4.0 | | |
| 1–3 years | | | 9.1 | | |
| 3–5 years | | | 18.9 | | |
| 5–7 years | | | 23.4 | | |
| 7–10 years | | | 17.1 | | |
| 10–15 years | | | 5.0 | | |
| 15–20 years | | | 4.0 | | |
| 20–30 years | | | 11.8 | | |
| 30 years and over | | | 1.9 | | |
| Other | | | 4.8 | | |
Portfolio structure
as of 05/31/10 (%)
Corporate fixed-income
bonds & notes | | | 46.4 | | |
Foreign government
obligations | | | 26.2 | | |
| U.S. government obligations | | | 13.5 | | |
| Mortgage-backed securities | | | 4.8 | | |
Commercial mortgage-backed
securities | | | 2.2 | | |
| Municipal bonds | | | 0.2 | | |
| U.S. government agencies | | | 0.2 | | |
| Asset-backed securities | | | 0.1 | | |
| Warrants | | | 0.0 | * | |
| Preferred stock | | | 0.0 | * | |
| Others | | | 6.4 | | |
*Rounds to less than 0.1%
Quality breakdown
as of 05/31/10 (%)
| AAA | | | 35.0 | | |
| AA | | | 3.1 | | |
| A | | | 4.7 | | |
| BBB | | | 13.5 | | |
| BB | | | 15.3 | | |
| B | | | 20.2 | | |
| CCC | | | 6.6 | | |
| CC | | | 0.9 | | |
| D | | | 0.1 | | |
| Not Rated | | | 0.6 | | |
The fund is actively managed and the composition of its portfolio will change over time. Maturity breakdown, portfolio structure and quality breakdown are calculated as a percentage of total investments excluding securities lending collateral. Ratings shown in the quality breakdown are assigned to individual bonds by taking the lower of the ratings available from one of the following nationally recognized rating agencies: Standard & Poor's or Moody's Investor Services. If a security is rated by only one of the two agencies, that rating is used. If a security is not rated by either of the two agencies, it is designated as Non-Rated. Ratings are relative and subjective and are not absolute standards of quality. The fund's credit quality does not remove market risk.
7
Investment Portfolio – Columbia Strategic Income Fund
May 31, 2010
| Corporate Fixed-Income Bonds & Notes – 47.4% | |
| | | Par (a) | | Value ($) | |
| Basic Materials – 4.0% | |
| Chemicals – 1.3% | |
| Chemicals-Diversified – 1.0% | |
| Dow Chemical Co. | |
| 5.900% 02/15/15 | | | 3,400,000 | | | | 3,663,497 | | |
| 8.550% 05/15/19 | | | 790,000 | | | | 936,946 | | |
| 9.400% 05/15/39 | | | 395,000 | | | | 516,780 | | |
| INEOS Finance PLC | |
| 9.000% 05/15/15 (b) | | | 1,200,000 | | | | 1,194,000 | | |
| INEOS Group Holdings PLC | |
| 8.500% 02/15/16 (b) | | | 4,530,000 | | | | 3,431,475 | | |
| INVISTA | |
| 9.250% 05/01/12 (b) | | | 4,525,000 | | | | 4,599,300 | | |
| Nova Chemicals Corp. | |
| 8.375% 11/01/16 | | | 1,095,000 | | | | 1,100,475 | | |
| 8.625% 11/01/19 | | | 1,870,000 | | | | 1,879,350 | | |
| Solutia, Inc. | |
| 8.750% 11/01/17 | | | 2,425,000 | | | | 2,485,625 | | |
| | | | 19,807,448 | | |
| Chemicals-Plastics – 0.3% | |
| Hexion Finance Escrow LLC/Hexion Escrow Corp. | |
| 8.875% 02/01/18 (b) | | | 5,860,000 | | | | 5,420,500 | | |
| | | | 5,420,500 | | |
| Chemicals Total | | | 25,227,948 | | |
| Forest Products & Paper – 1.0% | |
| Paper & Related Products – 1.0% | |
| Cascades, Inc. | |
| 7.750% 12/15/17 (b) | | | 2,700,000 | | | | 2,605,500 | | |
| Clearwater Paper Corp. | |
| 10.625% 06/15/16 (b) | | | 1,080,000 | | | | 1,185,300 | | |
| Domtar Corp. | |
| 10.750% 06/01/17 | | | 2,110,000 | | | | 2,468,700 | | |
| Georgia-Pacific LLC | |
| 8.000% 01/15/24 | | | 6,315,000 | | | | 6,583,387 | | |
| NewPage Corp. | |
| 10.000% 05/01/12 | | | 3,290,000 | | | | 1,912,313 | | |
| 11.375% 12/31/14 | | | 2,670,000 | | | | 2,496,450 | | |
| PE Paper Escrow GmbH | |
| 12.000% 08/01/14 (b) | | | 3,305,000 | | | | 3,618,975 | | |
| | | | 20,870,625 | | |
| Forest Products & Paper Total | | | 20,870,625 | | |
| Iron/Steel – 0.4% | |
| Steel-Producers – 0.4% | |
| ArcelorMittal | |
| 7.000% 10/15/39 | | | 185,000 | | | | 178,257 | | |
| Nucor Corp. | |
| 5.000% 06/01/13 | | | 140,000 | | | | 151,691 | | |
| | | Par (a) | | Value ($) | |
| Russel Metals, Inc. | |
| 6.375% 03/01/14 | | | 2,275,000 | | | | 2,178,312 | | |
| Steel Dynamics, Inc. | |
| 7.750% 04/15/16 | | | 3,890,000 | | | | 3,870,550 | | |
| United States Steel Corp. | |
| 7.000% 02/01/18 | | | 1,885,000 | | | | 1,861,438 | | |
| | | | 8,240,248 | | |
| Iron/Steel Total | | | 8,240,248 | | |
| Metals & Mining – 1.3% | |
| Diversified Minerals – 0.3% | |
| Teck Resources Ltd. | |
| 10.750% 05/15/19 | | | 3,895,000 | | | | 4,693,475 | | |
| Vale Overseas Ltd. | |
| 6.875% 11/21/36 | | | 1,115,000 | | | | 1,111,322 | | |
| | | | 5,804,797 | | |
| Metal-Diversified – 0.3% | |
| Freeport-McMoRan Copper & Gold, Inc. | |
| 8.375% 04/01/17 | | | 1,215,000 | | | | 1,321,312 | | |
| Vedanta Resources PLC | |
| 9.500% 07/18/18 (b) | | | 4,415,000 | | | | 4,503,300 | | |
| | | | 5,824,612 | | |
| Mining Services – 0.1% | |
| Noranda Aluminium Holding Corp. | |
PIK,
7.123% 11/15/14
(11/15/10) (c)(d) | | | 2,536,893 | | | | 2,532,033 | | |
| | | | 2,532,033 | | |
| Non-Ferrous Metals – 0.6% | |
| Codelco, Inc. | |
| 5.500% 10/15/13 | | | 3,000,000 | | | | 3,237,450 | | |
| 7.500% 01/15/19 (b) | | | 7,500,000 | | | | 8,837,610 | | |
| | | | 12,075,060 | | |
| Metals & Mining Total | | | 26,236,502 | | |
| Basic Materials Total | | | 80,575,323 | | |
| Communications – 9.1% | |
| Advertising – 0.1% | |
| Advertising Agencies – 0.1% | |
| Interpublic Group of Companies, Inc. | |
| 6.250% 11/15/14 | | | 780,000 | | | | 772,200 | | |
| | | | 772,200 | | |
| Advertising Total | | | 772,200 | | |
See Accompanying Notes to Financial Statements.
8
Columbia Strategic Income Fund
May 31, 2010
| Corporate Fixed-Income Bonds & Notes (continued) | |
| | | Par (a) | | Value ($) | |
| Media – 2.7% | |
| Broadcast Services/Programs – 0.5% | |
| Clear Channel Worldwide Holdings, Inc. | |
| 9.250% 12/15/17 (b) | | | 6,590,000 | | | | 6,705,325 | | |
| Liberty Media LLC | |
| 8.250% 02/01/30 | | | 3,170,000 | | | | 2,932,250 | | |
| | | | 9,637,575 | | |
| Cable TV – 1.4% | |
| CCH II LLC/CCH II Capital Corp. | |
| 13.500% 11/30/16 | | | 3,246,188 | | | | 3,720,943 | | |
| Cequel Communications Holdings I LLC & Cequel Capital Corp. | |
| 8.625% 11/15/17 (b) | | | 2,455,000 | | | | 2,369,075 | | |
| Comcast Corp. | |
| 6.950% 08/15/37 | | | 3,430,000 | | | | 3,823,143 | | |
| CSC Holdings LLC | |
| 8.500% 04/15/14 (b) | | | 3,515,000 | | | | 3,655,600 | | |
| 8.500% 06/15/15 (b) | | | 1,795,000 | | | | 1,857,825 | | |
| DirecTV Holdings LLC | |
| 6.375% 06/15/15 | | | 335,000 | | | | 345,469 | | |
| DISH DBS Corp. | |
| 6.625% 10/01/14 | | | 4,545,000 | | | | 4,476,825 | | |
| 7.875% 09/01/19 | | | 1,825,000 | | | | 1,843,250 | | |
| Mediacom LLC/Mediacom Capital Corp. | |
| 9.125% 08/15/19 (b) | | | 1,525,000 | | | | 1,509,750 | | |
| Time Warner Cable, Inc. | |
| 3.500% 02/01/15 | | | 1,505,000 | | | | 1,520,067 | | |
| 5.000% 02/01/20 | | | 650,000 | | | | 648,823 | | |
| 5.850% 05/01/17 | | | 405,000 | | | | 440,079 | | |
| 7.300% 07/01/38 | | | 1,585,000 | | | | 1,810,339 | | |
| | | | 28,021,188 | | |
| Multimedia – 0.0% | |
| News America, Inc. | |
| 6.400% 12/15/35 | | | 150,000 | | | | 157,291 | | |
| 6.550% 03/15/33 | | | 620,000 | | | | 650,082 | | |
| | | | 807,373 | | |
| Publishing-Books – 0.3% | |
| TL Acquisitions, Inc. | |
| 10.500% 01/15/15 (b) | | | 6,760,000 | | | | 6,134,700 | | |
| | | | 6,134,700 | | |
| Radio – 0.3% | |
| CMP Susquehanna Corp. | |
3.430% 05/15/14
(08/12/10) (c)(d)(e) | | | 175,000 | | | | 103,250 | | |
| Salem Communications Corp. | |
| 9.625% 12/15/16 | | | 2,570,000 | | | | 2,602,125 | | |
| Sirius XM Radio, Inc. | |
| 9.750% 09/01/15 (b) | | | 4,230,000 | | | | 4,483,800 | | |
| | | | 7,189,175 | | |
| | | Par (a) | | Value ($) | |
| Television – 0.2% | |
| Sinclair Television Group, Inc. | |
| 9.250% 11/01/17 (b) | | | 3,300,000 | | | | 3,267,000 | | |
| | | | 3,267,000 | | |
| Media Total | | | 55,057,011 | | |
| Telecommunication Services – 6.3% | |
| Cellular Telecommunications – 1.7% | |
| Cellco Partnership/Verizon Wireless Capital LLC | |
| 5.550% 02/01/14 | | | 1,050,000 | | | | 1,160,718 | | |
| 8.500% 11/15/18 | | | 570,000 | | | | 712,677 | | |
| Cricket Communications, Inc. | |
| 9.375% 11/01/14 | | | 4,965,000 | | | | 5,002,238 | | |
| Digicel Group Ltd. | |
| 8.875% 01/15/15 (b) | | | 7,360,000 | | | | 7,120,800 | | |
| MetroPCS Wireless, Inc. | |
| 9.250% 11/01/14 | | | 5,620,000 | | | | 5,788,600 | | |
| Nextel Communications, Inc. | |
| 7.375% 08/01/15 | | | 5,975,000 | | | | 5,631,438 | | |
| NII Capital Corp. | |
| 10.000% 08/15/16 | | | 1,585,000 | | | | 1,695,950 | | |
| Wind Acquisition Finance SA | |
| 11.750% 07/15/17 (b) | | | 7,102,000 | | | | 7,244,040 | | |
| | | | 34,356,461 | | |
| Media – 0.5% | |
| Nielsen Finance LLC/Nielsen Finance Co. | |
| 11.500% 05/01/16 | | | 4,375,000 | | | | 4,637,500 | | |
| Quebecor Media, Inc. | |
| 7.750% 03/15/16 | | | 6,125,000 | | | | 5,895,312 | | |
| | | | 10,532,812 | | |
| Satellite Telecommunications – 0.6% | |
| Intelsat Bermuda SA | |
| 11.250% 02/04/17 | | | 6,155,000 | | | | 6,062,675 | | |
| Intelsat Jackson Holdings SA | |
| 11.250% 06/15/16 | | | 5,845,000 | | | | 6,166,475 | | |
| | | | 12,229,150 | | |
| Telecommunication Equipment – 0.3% | |
| Lucent Technologies, Inc. | |
| 6.450% 03/15/29 | | | 7,325,000 | | | | 4,981,000 | | |
| WireCo WorldGroup | |
| 9.500% 05/15/17 (b) | | | 1,490,000 | | | | 1,454,612 | | |
| | | | 6,435,612 | | |
| Telecommunication Services – 1.0% | |
| Clearwire Communications LLC/Clearwire Finance, Inc. | |
| 12.000% 12/01/15 (b) | | | 3,220,000 | | | | 3,128,775 | | |
| Global Crossing Ltd. | |
| 12.000% 09/15/15 (b) | | | 3,660,000 | | | | 3,989,400 | | |
See Accompanying Notes to Financial Statements.
9
Columbia Strategic Income Fund
May 31, 2010
| Corporate Fixed-Income Bonds & Notes (continued) | |
| | | Par (a) | | Value ($) | |
| ITC Deltacom, Inc. | |
| 10.500% 04/01/16 (b) | | | 2,430,000 | | | | 2,332,800 | | |
| PAETEC Holding Corp. | |
| 8.875% 06/30/17 (b) | | | 1,445,000 | | | | 1,426,937 | | |
| SBA Telecommunications, Inc. | |
| 8.250% 08/15/19 (b) | | | 1,540,000 | | | | 1,605,450 | | |
| Syniverse Technologies, Inc. | |
| 7.750% 08/15/13 | | | 2,415,000 | | | | 2,366,700 | | |
| West Corp. | |
| 11.000% 10/15/16 | | | 4,870,000 | | | | 4,918,700 | | |
| | | | 19,768,762 | | |
| Telephone-Integrated – 2.1% | |
| BellSouth Corp. | |
| 5.200% 09/15/14 | | | 2,205,000 | | | | 2,423,101 | | |
| British Telecommunications PLC | |
| 5.950% 01/15/18 | | | 665,000 | | | | 687,421 | | |
| Cincinnati Bell, Inc. | |
| 8.250% 10/15/17 | | | 3,825,000 | | | | 3,605,062 | | |
| Frontier Communications Corp. | |
| 7.875% 01/15/27 | | | 6,114,000 | | | | 5,594,310 | | |
| Level 3 Financing, Inc. | |
| 8.750% 02/15/17 | | | 1,925,000 | | | | 1,636,250 | | |
| 9.250% 11/01/14 | | | 1,150,000 | | | | 1,046,500 | | |
| Qwest Communications International, Inc. | |
| 7.500% 02/15/14 | | | 5,090,000 | | | | 5,013,650 | | |
| Qwest Corp. | |
| 7.500% 10/01/14 | | | 2,455,000 | | | | 2,583,888 | | |
| 7.500% 06/15/23 | | | 5,245,000 | | | | 5,087,650 | | |
| Sprint Capital Corp. | |
| 6.875% 11/15/28 | | | 1,500,000 | | | | 1,246,875 | | |
| Telefonica Emisiones SAU | |
| 6.421% 06/20/16 | | | 1,425,000 | | | | 1,583,124 | | |
| Virgin Media Finance PLC | |
| 9.500% 08/15/16 | | | 5,210,000 | | | | 5,340,250 | | |
| Windstream Corp. | |
| 8.625% 08/01/16 | | | 6,245,000 | | | | 6,182,550 | | |
| | | | 42,030,631 | | |
| Wireless Equipment – 0.1% | |
| Crown Castle International Corp. | |
| 9.000% 01/15/15 | | | 2,235,000 | | | | 2,349,544 | | |
| | | | 2,349,544 | | |
| Telecommunication Services Total | | | 127,702,972 | | |
| Communications Total | | | 183,532,183 | | |
| | | Par (a) | | Value ($) | |
| Consumer Cyclical – 5.5% | |
| Auto Manufacturers – 0.1% | |
| Auto-Cars/Light Trucks – 0.1% | |
| General Motors Corp. | |
| 7.200% 01/15/11 (f) | | | 2,775,000 | | | | 860,250 | | |
| 8.375% 07/15/33 (f) | | | 2,785,000 | | | | 905,125 | | |
| | | | 1,765,375 | | |
| Auto Manufacturers Total | | | 1,765,375 | | |
| Auto Parts & Equipment – 0.5% | |
| Auto/Truck Parts & Equipment-Original – 0.3% | |
| American Axle & Manufacturing Holdings, Inc. | |
| 9.250% 01/15/17 (b) | | | 1,170,000 | | | | 1,228,500 | | |
| Lear Corp. | |
| 7.875% 03/15/18 | | | 900,000 | | | | 877,500 | | |
| 8.125% 03/15/20 | | | 325,000 | | | | 317,687 | | |
| TRW Automotive, Inc. | |
| 7.000% 03/15/14 (b) | | | 3,320,000 | | | | 3,261,900 | | |
| | | | 5,685,587 | | |
| Rubber-Tires – 0.2% | |
| Goodyear Tire & Rubber Co. | |
| 10.500% 05/15/16 | | | 4,430,000 | | | | 4,695,800 | | |
| | | | 4,695,800 | | |
| Auto Parts & Equipment Total | | | 10,381,387 | | |
| Distribution/Wholesale – 0.3% | |
| Distribution/Wholesale – 0.3% | |
| McJunkin Red Man Corp. | |
| 9.500% 12/15/16 (b) | | | 6,125,000 | | | | 5,941,250 | | |
| | | | 5,941,250 | | |
| Distribution/Wholesale Total | | | 5,941,250 | | |
| Entertainment – 0.7% | |
| Casino Services – 0.1% | |
| Tunica-Biloxi Gaming Authority | |
| 9.000% 11/15/15 (b) | | | 1,390,000 | | | | 1,251,000 | | |
| | | | 1,251,000 | | |
| Gambling (Non-Hotel) – 0.5% | |
| Boyd Gaming Corp. | |
| 6.750% 04/15/14 | | | 1,250,000 | | | | 1,125,000 | | |
| 7.125% 02/01/16 | | | 1,225,000 | | | | 1,047,375 | | |
| Jacobs Entertainment, Inc. | |
| 9.750% 06/15/14 | | | 2,640,000 | | | | 2,468,400 | | |
| Pinnacle Entertainment, Inc. | |
| 8.625% 08/01/17 (b) | | | 2,405,000 | | | | 2,429,050 | | |
| Shingle Springs Tribal Gaming Authority | |
| 9.375% 06/15/15 (b) | | | 3,205,000 | | | | 2,499,900 | | |
| | | | 9,569,725 | | |
See Accompanying Notes to Financial Statements.
10
Columbia Strategic Income Fund
May 31, 2010
| Corporate Fixed-Income Bonds & Notes (continued) | |
| | | Par (a) | | Value ($) | |
| Music – 0.1% | |
| WMG Acquisition Corp. | |
| 7.375% 04/15/14 | | | 1,330,000 | | | | 1,251,862 | | |
| WMG Holdings Corp. | |
| 9.500% 12/15/14 | | | 1,455,000 | | | | 1,425,900 | | |
| | | | 2,677,762 | | |
| Resorts/Theme Parks – 0.0% | |
| Six Flags, Inc. | |
| 9.625% 06/01/14 (e)(g) | | | 1,557,000 | | | | — | | |
| | | | — | | |
| Entertainment Total | | | 13,498,487 | | |
| Home Builders – 0.8% | |
| Building-Residential/Commercial – 0.8% | |
| Beazer Homes USA, Inc. | |
| 9.125% 06/15/18 | | | 3,075,000 | | | | 2,890,500 | | |
| D.R. Horton, Inc. | |
| 5.625% 09/15/14 | | | 2,785,000 | | | | 2,757,150 | | |
| 5.625% 01/15/16 | | | 1,483,000 | | | | 1,408,850 | | |
| KB Home | |
| 5.875% 01/15/15 | | | 4,970,000 | | | | 4,553,762 | | |
| Ryland Group, Inc. | |
| 8.400% 05/15/17 | | | 1,400,000 | | | | 1,470,000 | | |
| Standard Pacific Corp. | |
| 7.000% 08/15/15 | | | 2,685,000 | | | | 2,470,200 | | |
| | | | 15,550,462 | | |
| Home Builders Total | | | 15,550,462 | | |
| Home Furnishings – 0.1% | |
| Home Furnishings – 0.1% | |
| Norcraft Companies LP/Norcraft Finance Corp. | |
| 10.500% 12/15/15 (b) | | | 1,435,000 | | | | 1,506,750 | | |
| Simmons Co. | |
PIK,
7.351% 02/15/12
(08/16/10) (c)(d)(f)(h) | | | 2,601,458 | | | | 6,504 | | |
| | | | 1,513,254 | | |
| Home Furnishings Total | | | 1,513,254 | | |
| Housewares – 0.1% | |
| Housewares – 0.1% | |
| Libbey Glass, Inc. | |
| 10.000% 02/15/15 (b) | | | 3,000,000 | | | | 3,112,500 | | |
| | | | 3,112,500 | | |
| Housewares Total | | | 3,112,500 | | |
| | | Par (a) | | Value ($) | |
| Leisure Time – 0.2% | |
| Cruise Lines – 0.2% | |
| Royal Caribbean Cruises Ltd. | |
| 7.500% 10/15/27 | | | 4,450,000 | | | | 4,005,000 | | |
| | | | 4,005,000 | | |
| Leisure Time Total | | | 4,005,000 | | |
| Lodging – 1.4% | |
| Casino Hotels – 0.9% | |
| FireKeepers Development Authority | |
| 13.875% 05/01/15 (b) | | | 2,800,000 | | | | 3,206,000 | | |
| Harrah's Operating Co., Inc. | |
| 11.250% 06/01/17 | | | 3,840,000 | | | | 4,022,400 | | |
| MGM Mirage | |
| 6.750% 09/01/12 | | | 5,525,000 | | | | 5,096,812 | | |
| 11.375% 03/01/18 (b) | | | 1,085,000 | | | | 1,003,625 | | |
| Pokagon Gaming Authority | |
| 10.375% 06/15/14 (b) | | | 2,390,000 | | | | 2,473,650 | | |
| Snoqualmie Entertainment Authority | |
| 9.125% 02/01/15 (b) | | | 2,015,000 | | | | 1,692,600 | | |
| | | | 17,495,087 | | |
| Gambling (Non-Hotel) – 0.2% | |
| Mashantucket Western Pequot Tribe | |
| 8.500% 11/15/15 (b)(i) | | | 4,265,000 | | | | 938,300 | | |
| Seminole Indian Tribe of Florida | |
| 6.535% 10/01/20 (b) | | | 675,000 | | | | 602,269 | | |
| 7.804% 10/01/20 (b) | | | 3,055,000 | | | | 2,777,331 | | |
| | | | 4,317,900 | | |
| Hotels & Motels – 0.3% | |
| Host Hotels & Resorts LP | |
| 6.750% 06/01/16 | | | 3,270,000 | | | | 3,204,600 | | |
| Starwood Hotels & Resorts Worldwide, Inc. | |
| 6.750% 05/15/18 | | | 3,305,000 | | | | 3,263,688 | | |
| | | | 6,468,288 | | |
| Lodging Total | | | 28,281,275 | | |
| Retail – 1.2% | |
| Retail-Apparel/Shoe – 0.1% | |
| Limited Brands, Inc. | |
| 8.500% 06/15/19 | | | 3,140,000 | | | | 3,344,100 | | |
| | | | 3,344,100 | | |
| Retail-Drug Stores – 0.3% | |
| CVS Pass-Through Trust | |
| 8.353% 07/10/31 (b) | | | 1,863,844 | | | | 2,226,045 | | |
| Rite Aid Corp. | |
| 9.500% 06/15/17 | | | 4,525,000 | | | | 3,631,313 | | |
| | | | 5,857,358 | | |
See Accompanying Notes to Financial Statements.
11
Columbia Strategic Income Fund
May 31, 2010
| Corporate Fixed-Income Bonds & Notes (continued) | |
| | | Par (a) | | Value ($) | |
| Retail-Mail Order – 0.1% | |
| QVC, Inc. | |
| 7.500% 10/01/19 (b) | | | 1,365,000 | | | | 1,330,875 | | |
| | | | 1,330,875 | | |
| Retail-Propane Distributors – 0.4% | |
| AmeriGas Partners LP | |
| 7.125% 05/20/16 | | | 2,815,000 | | | | 2,800,925 | | |
| 7.250% 05/20/15 | | | 990,000 | | | | 990,000 | | |
| Inergy LP/Inergy Finance Corp. | |
| 8.250% 03/01/16 | | | 1,365,000 | | | | 1,378,650 | | |
| 8.750% 03/01/15 | | | 2,645,000 | | | | 2,697,900 | | |
| | | | 7,867,475 | | |
| Retail-Restaurants – 0.1% | |
| McDonald's Corp. | |
| 5.700% 02/01/39 | | | 1,050,000 | | | | 1,119,536 | | |
| | | | 1,119,536 | | |
| Retail-Toy Store – 0.2% | |
| Toys R US, Inc. | |
| 7.375% 10/15/18 | | | 5,440,000 | | | | 5,154,400 | | |
| | | | 5,154,400 | | |
| Retail-Vitamins/Nutritional Supplements – 0.0% | |
| General Nutrition Centers, Inc. | |
PIK,
5.750% 03/15/14
(09/15/10) (c)(d) | | | 980,000 | | | | 899,150 | | |
| | | | 899,150 | | |
| Retail Total | | | 25,572,894 | | |
| Storage/Warehousing – 0.1% | |
| Storage/Warehousing – 0.1% | |
Niska Gas Storage U.S. LLC/Niska Gas Storage
Canada ULC | |
| 8.875% 03/15/18 (b) | | | 1,760,000 | | | | 1,768,800 | | |
| | | | 1,768,800 | | |
| Storage/Warehousing Total | | | 1,768,800 | | |
| Consumer Cyclical Total | | | 111,390,684 | | |
| Consumer Non-Cyclical – 5.9% | |
| Beverages – 0.1% | |
| Brewery – 0.1% | |
| Anheuser-Busch InBev Worldwide, Inc. | |
| 7.750% 01/15/19 (b) | | | 420,000 | | | | 497,759 | | |
| 8.000% 11/15/39 (b) | | | 645,000 | | | | 820,123 | | |
| | | | 1,317,882 | | |
| Beverages Total | | | 1,317,882 | | |
| | | Par (a) | | Value ($) | |
| Commercial Services – 1.4% | |
| Commercial Services – 0.4% | |
| ARAMARK Corp. | |
| 8.500% 02/01/15 | | | 4,625,000 | | | | 4,613,437 | | |
| Iron Mountain, Inc. | |
| 8.000% 06/15/20 | | | 3,755,000 | | | | 3,726,838 | | |
| | | | 8,340,275 | | |
| Commercial Services-Finance – 0.1% | |
| Cardtronics, Inc. | |
| 9.250% 08/15/13 | | | 1,785,000 | | | | 1,785,000 | | |
| | | | 1,785,000 | | |
| Funeral Services & Related Items – 0.2% | |
| Service Corp. International | |
| 6.750% 04/01/16 | | | 1,980,000 | | | | 1,955,250 | | |
| 7.000% 06/15/17 | | | 1,930,000 | | | | 1,872,100 | | |
| | | | 3,827,350 | | |
| Private Corrections – 0.1% | |
| Corrections Corp. of America | |
| 6.250% 03/15/13 | | | 2,480,000 | | | | 2,483,100 | | |
| | | | 2,483,100 | | |
| Rental Auto/Equipment – 0.5% | |
| Ashtead Holdings PLC | |
| 8.625% 08/01/15 (b) | | | 3,149,000 | | | | 3,117,510 | | |
| Hertz Corp. | |
| 8.875% 01/01/14 | | | 2,000,000 | | | | 2,010,000 | | |
| Rental Service Corp. | |
| 9.500% 12/01/14 | | | 3,230,000 | | | | 3,068,500 | | |
| United Rentals North America, Inc. | |
| 10.875% 06/15/16 | | | 2,070,000 | | | | 2,204,550 | | |
| | | | 10,400,560 | | |
| Security Services – 0.1% | |
| Garda World Security Corp. | |
| 9.750% 03/15/17 (b) | | | 825,000 | | | | 847,688 | | |
| | | | 847,688 | | |
| Commercial Services Total | | | 27,683,973 | | |
| Cosmetics/Personal Care – 0.1% | |
| Cosmetics & Toiletries – 0.1% | |
| Revlon Consumer Products Corp. | |
| 9.750% 11/15/15 (b) | | | 2,225,000 | | | | 2,263,938 | | |
| | | | 2,263,938 | | |
| Cosmetics/Personal Care Total | | | 2,263,938 | | |
| Food – 0.8% | |
| Food-Meat Products – 0.2% | |
| JBS USA LLC/JBS USA Finance, Inc. | |
| 11.625% 05/01/14 | | | 1,765,000 | | | | 1,938,146 | | |
See Accompanying Notes to Financial Statements.
12
Columbia Strategic Income Fund
May 31, 2010
| Corporate Fixed-Income Bonds & Notes (continued) | |
| | | Par (a) | | Value ($) | |
| Smithfield Foods, Inc. | |
| 10.000% 07/15/14 (b) | | | 2,545,000 | | | | 2,724,741 | | |
| | | | 4,662,887 | | |
| Food-Miscellaneous/Diversified – 0.5% | |
| Campbell Soup Co. | |
| 4.500% 02/15/19 | | | 435,000 | | | | 460,664 | | |
| ConAgra Foods, Inc. | |
| 7.000% 10/01/28 | | | 855,000 | | | | 972,908 | | |
| Kraft Foods, Inc. | |
| 6.500% 02/09/40 | | | 3,715,000 | | | | 3,943,792 | | |
| Pinnacle Foods Finance LLC | |
| 9.250% 04/01/15 (b) | | | 1,095,000 | | | | 1,092,263 | | |
| 9.250% 04/01/15 | | | 3,315,000 | | | | 3,306,712 | | |
| | | | 9,776,339 | | |
| Retail-Hypermarkets – 0.1% | |
| New Albertsons, Inc. | |
| 8.000% 05/01/31 | | | 2,700,000 | | | | 2,349,000 | | |
| | | | 2,349,000 | | |
| Food Total | | | 16,788,226 | | |
| Healthcare Products – 0.5% | |
| Medical Products – 0.5% | |
| Biomet, Inc. | |
PIK,
10.375% 10/15/17 | | | 7,340,000 | | | | 7,807,925 | | |
| DJO Finance LLC/DJO Finance Corp. | |
| 10.875% 11/15/14 | | | 730,000 | | | | 759,200 | | |
| 10.875% 11/15/14 (b) | | | 1,365,000 | | | | 1,419,600 | | |
| | | | 9,986,725 | | |
| Healthcare Products Total | | | 9,986,725 | | |
| Healthcare Services – 2.0% | |
| Dialysis Centers – 0.1% | |
| DaVita, Inc. | |
| 7.250% 03/15/15 | | | 2,245,000 | | | | 2,233,775 | | |
| | | | 2,233,775 | | |
| Medical Labs & Testing Services – 0.1% | |
| Roche Holdings, Inc. | |
| 6.000% 03/01/19 (b) | | | 1,650,000 | | | | 1,865,363 | | |
| | | | 1,865,363 | | |
| Medical-HMO – 0.2% | |
| Health Net, Inc. | |
| 6.375% 06/01/17 | | | 3,440,000 | | | | 3,147,600 | | |
| WellPoint, Inc. | |
| 7.000% 02/15/19 | | | 960,000 | | | | 1,119,828 | | |
| | | | 4,267,428 | | |
| | | Par (a) | | Value ($) | |
| Medical-Hospitals – 1.1% | |
| Community Health Systems, Inc. | |
| 8.875% 07/15/15 | | | 5,810,000 | | | | 5,947,987 | | |
| HCA, Inc. | |
| 9.250% 11/15/16 | | | 2,655,000 | | | | 2,781,113 | | |
PIK,
9.625% 11/15/16 | | | 13,000,000 | | | | 13,682,500 | | |
| | | | 22,411,600 | | |
| Medical-Outpatient/Home Medical – 0.1% | |
| Select Medical Corp. | |
| 7.625% 02/01/15 | | | 1,900,000 | | | | 1,786,000 | | |
| | | | 1,786,000 | | |
| Physical Therapy/Rehab Centers – 0.2% | |
| Healthsouth Corp. | |
| 8.125% 02/15/20 | | | 1,475,000 | | | | 1,430,750 | | |
| 10.750% 06/15/16 | | | 2,190,000 | | | | 2,365,200 | | |
| | | | 3,795,950 | | |
| Physician Practice Management – 0.2% | |
| U.S. Oncology Holdings, Inc. | |
PIK,
6.643% 03/15/12
(09/15/10) (c)(d) | | | 2,769,000 | | | | 2,501,567 | | |
| U.S. Oncology, Inc. | |
| 9.125% 08/15/17 | | | 2,355,000 | | | | 2,375,606 | | |
| | | | 4,877,173 | | |
| Healthcare Services Total | | | 41,237,289 | | |
| Household Products/Wares – 0.3% | |
| Consumer Products-Miscellaneous – 0.3% | |
| American Greetings Corp. | |
| 7.375% 06/01/16 | | | 2,365,000 | | | | 2,388,650 | | |
| Central Garden & Pet Co. | |
| 8.250% 03/01/18 | | | 2,000,000 | | | | 1,980,000 | | |
| Jostens IH Corp. | |
| 7.625% 10/01/12 | | | 1,430,000 | | | | 1,429,821 | | |
| | | | 5,798,471 | | |
| Household Products/Wares Total | | | 5,798,471 | | |
| Pharmaceuticals – 0.7% | |
| Medical-Drugs – 0.5% | |
| Elan Finance PLC | |
4.436% 11/15/11
(08/15/10) (c)(d) | | | 975,000 | | | | 950,625 | | |
| 8.875% 12/01/13 | | | 1,505,000 | | | | 1,508,763 | | |
| Novartis Securities Investment Ltd. | |
| 5.125% 02/10/19 | | | 950,000 | | | | 1,043,585 | | |
| Patheon, Inc. | |
| 8.625% 04/15/17 (b) | | | 1,880,000 | | | | 1,880,000 | | |
See Accompanying Notes to Financial Statements.
13
Columbia Strategic Income Fund
May 31, 2010
| Corporate Fixed-Income Bonds & Notes (continued) | |
| | | Par (a) | | Value ($) | |
| Valeant Pharmaceuticals International | |
| 7.625% 03/15/20 (b) | | | 770,000 | | | | 752,675 | | |
| 8.375% 06/15/16 | | | 2,815,000 | | | | 2,878,337 | | |
| Wyeth | |
| 5.500% 02/15/16 | | | 800,000 | | | | 912,285 | | |
| | | | 9,926,270 | | |
| Medical-Generic Drugs – 0.1% | |
| Mylan, Inc./PA | |
| 7.875% 07/15/20 (b) | | | 1,410,000 | | | | 1,411,763 | | |
| | | | 1,411,763 | | |
| Pharmacy Services – 0.1% | |
| Omnicare, Inc. | |
| 6.875% 12/15/15 | | | 650,000 | | | | 641,875 | | |
| 7.750% 06/01/20 | | | 2,345,000 | | | | 2,350,862 | | |
| | | | 2,992,737 | | |
| Pharmaceuticals Total | | | 14,330,770 | | |
| Consumer Non-Cyclical Total | | | 119,407,274 | | |
| Diversified – 0.3% | |
| Diversified Holding Companies – 0.3% | |
| Reynolds Group Issuer, Inc./Reynolds Group Issuer LLC | |
| 7.750% 10/15/16 (b) | | | 5,300,000 | | | | 5,247,000 | | |
| Diversified Holding Companies Total | | | 5,247,000 | | |
| Diversified Total | | | 5,247,000 | | |
| Energy – 7.3% | |
| Coal – 0.3% | |
| Coal – 0.3% | |
| Arch Western Finance LLC | |
| 6.750% 07/01/13 | | | 5,110,000 | | | | 5,046,125 | | |
| Consol Energy, Inc. | |
| 8.250% 04/01/20 (b) | | | 450,000 | | | | 459,563 | | |
| | | | 5,505,688 | | |
| Coal Total | | | 5,505,688 | | |
| Energy-Alternate Sources – 0.1% | |
| Energy-Alternate Sources – 0.1% | |
| Power Sector Assets & Liabilities Management Corp. | |
| 7.250% 05/27/19 (b) | | | 2,500,000 | | | | 2,731,250 | | |
| | | | 2,731,250 | | |
| Energy-Alternate Sources Total | | | 2,731,250 | | |
| Oil & Gas – 4.6% | |
| Oil Companies-Exploration & Production – 4.1% | |
| Anadarko Petroleum Corp. | |
| 6.200% 03/15/40 | | | 4,905,000 | | | | 4,530,665 | | |
| | | Par (a) | | Value ($) | |
| Antero Resources Finance Corp. | |
| 9.375% 12/01/17 (b) | | | 2,840,000 | | | | 2,783,200 | | |
| Berry Petroleum Co. | |
| 10.250% 06/01/14 | | | 535,000 | | | | 569,775 | | |
| Chesapeake Energy Corp. | |
| 6.375% 06/15/15 | | | 7,875,000 | | | | 7,855,312 | | |
| Cimarex Energy Co. | |
| 7.125% 05/01/17 | | | 3,989,000 | | | | 3,969,055 | | |
| Forest Oil Corp. | |
| 8.500% 02/15/14 | | | 4,445,000 | | | | 4,567,237 | | |
| Hilcorp Energy I LP/Hilcorp Finance Co. | |
| 7.750% 11/01/15 (b) | | | 2,815,000 | | | | 2,744,625 | | |
| KazMunaiGaz Finance Sub BV | |
| 9.125% 07/02/18 (b) | | | 3,500,000 | | | | 3,850,000 | | |
| NAK Naftogaz Ukraine | |
| 9.500% 09/30/14 | | | 5,625,000 | | | | 5,765,625 | | |
| Newfield Exploration Co. | |
| 6.625% 04/15/16 | | | 3,810,000 | | | | 3,790,950 | | |
| 6.875% 02/01/20 | | | 2,095,000 | | | | 2,021,675 | | |
| Nexen, Inc. | |
| 5.875% 03/10/35 | | | 960,000 | | | | 900,845 | | |
| 7.500% 07/30/39 | | | 1,080,000 | | | | 1,218,426 | | |
| Pemex Project Funding Master Trust | |
| 9.150% 11/15/18 | | | 2,485,000 | | | | 3,058,767 | | |
| 10.610% 08/15/17 | | | 1,650,000 | | | | 2,029,451 | | |
| Petrobras International Finance Co. | |
| 5.875% 03/01/18 | | | 4,150,000 | | | | 4,282,821 | | |
| 7.875% 03/15/19 | | | 3,200,000 | | | | 3,620,221 | | |
| PetroHawk Energy Corp. | |
| 7.875% 06/01/15 | | | 6,420,000 | | | | 6,219,375 | | |
| Pioneer Natural Resources Co. | |
| 7.500% 01/15/20 | | | 285,000 | | | | 284,983 | | |
| Quicksilver Resources, Inc. | |
| 7.125% 04/01/16 | | | 5,250,000 | | | | 4,738,125 | | |
| 8.250% 08/01/15 | | | 3,000,000 | | | | 2,925,000 | | |
| Range Resources Corp. | |
| 7.500% 05/15/16 | | | 1,590,000 | | | | 1,593,975 | | |
| Ras Laffan Liquefied Natural Gas Co., Ltd. III | |
| 5.500% 09/30/14 (b) | | | 1,000,000 | | | | 1,068,555 | | |
| 5.832% 09/30/16 (b) | | | 4,200,000 | | | | 4,435,200 | | |
| Southwestern Energy Co. | |
| 7.500% 02/01/18 | | | 1,595,000 | | | | 1,674,750 | | |
| Talisman Energy, Inc. | |
| 7.750% 06/01/19 | | | 1,094,000 | | | | 1,318,348 | | |
| XTO Energy, Inc. | |
| 7.500% 04/15/12 | | | 340,000 | | | | 378,090 | | |
| | | | 82,195,051 | | |
| Oil Company-Integrated – 0.1% | |
| Shell International Finance BV | |
| 5.500% 03/25/40 | | | 1,450,000 | | | | 1,455,809 | | |
| | | | 1,455,809 | | |
See Accompanying Notes to Financial Statements.
14
Columbia Strategic Income Fund
May 31, 2010
| Corporate Fixed-Income Bonds & Notes (continued) | |
| | | Par (a) | | Value ($) | |
| Oil Refining & Marketing – 0.2% | |
| Frontier Oil Corp. | |
| 8.500% 09/15/16 | | | 1,905,000 | | | | 1,943,100 | | |
| Tesoro Corp. | |
| 6.625% 11/01/15 | | | 3,225,000 | | | | 3,047,625 | | |
| | | | 4,990,725 | | |
| Oil-Field Services – 0.2% | |
| Gazprom International SA | |
| 7.201% 02/01/20 | | | 4,574,272 | | | | 4,668,502 | | |
| | | | 4,668,502 | | |
| Oil & Gas Total | | | 93,310,087 | | |
| Oil & Gas Services – 0.3% | |
| Oil-Field Services – 0.3% | |
| American Petroleum Tankers LLC/AP Tankers Co. | |
| 10.250% 05/01/15 (b) | | | 1,120,000 | | | | 1,108,800 | | |
| Expro Finance Luxembourg SCA | |
| 8.500% 12/15/16 (b) | | | 3,095,000 | | | | 3,002,150 | | |
| Halliburton Co. | |
| 5.900% 09/15/18 | | | 515,000 | | | | 556,957 | | |
| Smith International, Inc. | |
| 9.750% 03/15/19 | | | 470,000 | | | | 637,103 | | |
| Weatherford International Ltd. | |
| 5.150% 03/15/13 | | | 700,000 | | | | 739,005 | | |
| | | | 6,044,015 | | |
| Oil & Gas Services Total | | | 6,044,015 | | |
| Oil, Gas & Consumable Fuels – 0.6% | |
| Oil Company-Integrated – 0.6% | |
| Ecopetrol SA | |
| 7.625% 07/23/19 | | | 5,000,000 | | | | 5,562,500 | | |
| Petronas Capital Ltd. | |
| 5.250% 08/12/19 | | | 5,500,000 | | | | 5,616,270 | | |
| | | | 11,178,770 | | |
| Oil, Gas & Consumable Fuels Total | | | 11,178,770 | | |
| Pipelines – 1.4% | |
| Pipelines – 1.4% | |
| Atlas Pipeline Partners LP | |
| 8.125% 12/15/15 | | | 3,125,000 | | | | 2,953,125 | | |
| El Paso Corp. | |
| 6.875% 06/15/14 | | | 2,970,000 | | | | 2,977,740 | | |
| 7.250% 06/01/18 | | | 3,525,000 | | | | 3,452,265 | | |
| Kinder Morgan Energy Partners LP | |
| 6.500% 09/01/39 | | | 550,000 | | | | 535,212 | | |
| 6.950% 01/15/38 | | | 670,000 | | | | 685,759 | | |
| Kinder Morgan Finance Co. ULC | |
| 5.700% 01/05/16 | | | 2,445,000 | | | | 2,334,975 | | |
| | | Par (a) | | Value ($) | |
| MarkWest Energy Partners LP | |
| 6.875% 11/01/14 | | | 2,800,000 | | | | 2,674,000 | | |
| 8.500% 07/15/16 | | | 1,905,000 | | | | 1,914,525 | | |
| Plains All American Pipeline LP/PAA Finance Corp. | |
| 5.750% 01/15/20 | | | 140,000 | | | | 142,892 | | |
| 6.500% 05/01/18 | | | 1,360,000 | | | | 1,471,425 | | |
| 8.750% 05/01/19 | | | 2,715,000 | | | | 3,224,328 | | |
| Regency Energy Partners LP/Regency Energy Finance Corp. | |
| 8.375% 12/15/13 | | | 370,000 | | | | 381,100 | | |
| 9.375% 06/01/16 (b) | | | 1,740,000 | | | | 1,809,600 | | |
| Southern Natural Gas Co. | |
| 8.000% 03/01/32 | | | 755,000 | | | | 856,239 | | |
| Southern Star Central Corp. | |
| 6.750% 03/01/16 | | | 680,000 | | | | 680,000 | | |
| TransCanada Pipelines Ltd. | |
6.350% 05/15/67
(05/15/17) (c)(d) | | | 1,450,000 | | | | 1,315,409 | | |
| 7.625% 01/15/39 | | | 575,000 | | | | 683,894 | | |
| Williams Companies, Inc. | |
| 7.875% 09/01/21 | | | 763,000 | | | | 881,862 | | |
| | | | 28,974,350 | | |
| Pipelines Total | | | 28,974,350 | | |
| Energy Total | | | 147,744,160 | | |
| Financials – 7.8% | |
| Banks – 4.0% | |
| Commercial Banks-Central US – 0.2% | |
| Fifth Third Bank/Ohio | |
0.546% 05/17/13
(08/17/10) (c)(d) | | | 380,000 | | | | 356,069 | | |
| Northern Trust Co. | |
| 6.500% 08/15/18 | | | 2,920,000 | | | | 3,382,849 | | |
| | | | 3,738,918 | | |
| Commercial Banks-Eastern US – 0.1% | |
| Discover Bank/Greenwood DE | |
| 8.700% 11/18/19 | | | 2,385,000 | | | | 2,609,457 | | |
| | | | 2,609,457 | | |
| Commercial Banks-Non US – 0.8% | |
| Barclays Bank PLC | |
| 3.900% 04/07/15 | | | 935,000 | | | | 914,011 | | |
| 5.000% 09/22/16 | | | 760,000 | | | | 750,913 | | |
| 6.860% 09/29/49 (b)(d) | | | 365,000 | | | | 281,050 | | |
7.375% 06/29/49
(12/01/11) (b)(c)(d) | | | 275,000 | | | | 247,500 | | |
| 7.434% 09/29/49 (b)(d) | | | 1,055,000 | | | | 933,675 | | |
See Accompanying Notes to Financial Statements.
15
Columbia Strategic Income Fund
May 31, 2010
| Corporate Fixed-Income Bonds & Notes (continued) | |
| | | Par (a) | | Value ($) | |
| BES Investimento do Brasil SA | |
| 5.625% 03/25/15 (b) | | | 2,000,000 | | | | 1,867,722 | | |
| IKB Deutsche Industriebank AG | |
| 2.125% 09/10/12 | | EUR | 8,315,000 | | | | 10,386,097 | | |
| Lloyds TSB Group PLC | |
6.267% 11/29/49
(11/14/16) (b)(c)(d) | | | 300,000 | | | | 159,000 | | |
| | | | 15,539,968 | | |
| Commercial Banks-Southern US – 0.0% | |
| Regions Financial Corp. | |
| 7.000% 03/01/11 | | | 235,000 | | | | 238,201 | | |
| | | | 238,201 | | |
| Commercial Banks-Western U.S. – 1.1% | |
| Citibank NA | |
| 1.875% 05/07/12 | | | 20,000,000 | | | | 20,320,060 | | |
| Zions Bancorporation | |
| 7.750% 09/23/14 | | | 1,640,000 | | | | 1,650,635 | | |
| | | | 21,970,695 | | |
| Diversified Banking Institutional – 0.1% | |
| Citigroup, Inc. | |
| 6.010% 01/15/15 | | | 990,000 | | | | 1,030,042 | | |
| JPMorgan Chase & Co. | |
| 7.900% 04/29/49 (d) | | | 460,000 | | | | 467,935 | | |
| | | | 1,497,977 | | |
| Diversified Financial Services – 1.0% | |
| Capital One Capital IV | |
6.745% 02/17/37
(02/17/32) (c)(d) | | | 2,990,000 | | | | 2,466,750 | | |
| Capital One Capital V | |
| 10.250% 08/15/39 | | | 1,465,000 | | | | 1,574,875 | | |
| CIT Group, Inc. | |
| 7.000% 05/01/17 | | | 14,700,000 | | | | 13,266,750 | | |
| JPMorgan Chase Capital XVIII | |
| 6.950% 08/17/36 | | | 195,000 | | | | 192,157 | | |
| JPMorgan Chase Capital XX | |
| 6.550% 09/29/36 | | | 2,690,000 | | | | 2,522,959 | | |
| JPMorgan Chase Capital XXII | |
| 6.450% 02/02/37 | | | 150,000 | | | | 138,867 | | |
| �� | | | 20,162,358 | | |
| Fiduciary Banks – 0.1% | |
| Bank of New York Mellon Corp. | |
| 5.450% 05/15/19 | | | 1,520,000 | | | | 1,647,727 | | |
| Northern Trust Corp. | |
| 5.500% 08/15/13 | | | 535,000 | | | | 594,253 | | |
| | | | 2,241,980 | | |
| | | Par (a) | | Value ($) | |
| Finance-Investment Banker/Broker – 0.0% | |
| Merrill Lynch & Co., Inc. | |
| 5.700% 05/02/17 | | | 435,000 | | | | 430,517 | | |
| | | | 430,517 | | |
| Money Center Banks – 0.2% | |
| Comerica Bank | |
| 5.200% 08/22/17 | | | 500,000 | | | | 496,076 | | |
| Deutsche Bank AG/London | |
| 4.875% 05/20/13 | | | 2,280,000 | | | | 2,401,741 | | |
| Lloyds TSB Bank PLC | |
| 4.375% 01/12/15 (b) | | | 1,182,000 | | | | 1,129,566 | | |
| | | | 4,027,383 | | |
| Super-Regional Banks-US – 0.4% | |
| Capital One Financial Corp. | |
| 5.700% 09/15/11 | | | 1,920,000 | | | | 2,002,067 | | |
| Keycorp | |
| 6.500% 05/14/13 | | | 920,000 | | | | 996,081 | | |
| National City Corp. | |
| 4.900% 01/15/15 | | | 1,940,000 | | | | 2,072,007 | | |
| PNC Funding Corp. | |
| 3.625% 02/08/15 | | | 660,000 | | | | 673,321 | | |
| 5.125% 02/08/20 | | | 1,000,000 | | | | 1,015,027 | | |
| USB Capital IX | |
6.189% 10/29/49
(04/15/11) (c)(d) | | | 855,000 | | | | 666,900 | | |
| | | | 7,425,403 | | |
| Banks Total | | | 79,882,857 | | |
| Diversified Financial Services – 2.3% | |
| Diversified Financial Services – 0.2% | |
| General Electric Capital Corp. | |
| 5.500% 01/08/20 | | | 3,024,000 | | | | 3,102,131 | | |
| 6.000% 08/07/19 | | | 700,000 | | | | 741,566 | | |
| | | | 3,843,697 | | |
| Finance-Auto Loans – 1.1% | |
| Ally Financial, Inc. | |
| 6.875% 09/15/11 | | | 6,270,000 | | | | 6,270,000 | | |
| 8.000% 11/01/31 | | | 6,063,000 | | | | 5,517,330 | | |
| Ford Motor Credit Co., LLC | |
| 7.000% 04/15/15 | | | 1,160,000 | | | | 1,148,132 | | |
| 7.500% 08/01/12 | | | 380,000 | | | | 386,654 | | |
| 7.800% 06/01/12 | | | 3,700,000 | | | | 3,773,630 | | |
| 8.000% 12/15/16 | | | 5,025,000 | | | | 5,034,759 | | |
| | | | 22,130,505 | | |
| Finance-Consumer Loans – 0.4% | |
| American General Finance Corp. | |
| 4.875% 07/15/12 | | | 445,000 | | | | 400,500 | | |
| 6.900% 12/15/17 | | | 5,685,000 | | | | 4,519,575 | | |
See Accompanying Notes to Financial Statements.
16
Columbia Strategic Income Fund
May 31, 2010
| Corporate Fixed-Income Bonds & Notes (continued) | |
| | | Par (a) | | Value ($) | |
| SLM Corp. | |
| 8.000% 03/25/20 | | | 3,950,000 | | | | 3,513,517 | | |
| | | | 8,433,592 | | |
| Finance-Investment Banker/Broker – 0.2% | |
| Cemex Finance LLC | |
| 9.500% 12/14/16 (b) | | | 3,760,000 | | | | 3,431,000 | | |
| | | | 3,431,000 | | |
| Finance-Leasing Company – 0.1% | |
| International Lease Finance Corp. | |
| 4.875% 09/01/10 | | | 825,000 | | | | 820,875 | | |
| 5.625% 09/15/10 | | | 2,250,000 | | | | 2,233,125 | | |
| | | | 3,054,000 | | |
| Finance-Other Services – 0.3% | |
| Icahn Enterprises LP/Icahn Enterprises Finance Corp. | |
| 8.000% 01/15/18 (b) | | | 5,420,000 | | | | 5,094,800 | | |
| | | | 5,094,800 | | |
| Diversified Financial Services Total | | | 45,987,594 | | |
| Insurance – 1.3% | |
| Insurance Brokers – 0.1% | |
| HUB International Holdings, Inc. | |
| 10.250% 06/15/15 (b) | | | 1,160,000 | | | | 1,061,400 | | |
| | | | 1,061,400 | | |
| Life/Health Insurance – 0.4% | |
| Lincoln National Corp. | |
| 8.750% 07/01/19 | | | 1,720,000 | | | | 2,116,262 | | |
| Principal Life Income Funding Trusts | |
| 5.300% 04/24/13 | | | 960,000 | | | | 1,032,673 | | |
| Provident Companies, Inc. | |
| 7.000% 07/15/18 | | | 990,000 | | | | 1,036,422 | | |
| Prudential Financial, Inc. | |
| 7.375% 06/15/19 | | | 1,680,000 | | | | 1,923,365 | | |
8.875% 06/15/38
(06/15/18) (c)(d) | | | 1,730,000 | | | | 1,833,800 | | |
| Unum Group | |
| 7.125% 09/30/16 | | | 680,000 | | | | 760,747 | | |
| | | | 8,703,269 | | |
| Multi-Line Insurance – 0.3% | |
| CNA Financial Corp. | |
| 5.850% 12/15/14 | | | 391,000 | | | | 402,958 | | |
| 7.350% 11/15/19 | | | 779,000 | | | | 818,846 | | |
| ING Groep NV | |
5.775% 12/29/49
(12/08/15) (c)(d) | | | 2,825,000 | | | | 2,068,719 | | |
| MetLife Capital Trust X | |
| 9.250% 04/08/38 (b)(d) | | | 460,000 | | | | 501,400 | | |
| | | Par (a) | | Value ($) | |
| MetLife, Inc. | |
| 6.750% 06/01/16 | | | 1,520,000 | | | | 1,703,295 | | |
| 10.750% 08/01/39 | | | 1,270,000 | | | | 1,517,137 | | |
| | | | 7,012,355 | | |
| Mutual Insurance – 0.1% | |
| Liberty Mutual Group, Inc. | |
| 10.750% 06/15/58 (b)(d) | | | 1,060,000 | | | | 1,134,200 | | |
| | | | 1,134,200 | | |
| Property/Casualty Insurance – 0.3% | |
| Asurion Corp. | |
6.849% 07/02/15
(06/11/10) (c)(d)(h) | | | 1,609,397 | | | | 1,542,146 | | |
2nd lien,
6.849% 07/02/15
(06/11/10) (c)(d)(h) | | | 2,200,603 | | | | 2,151,090 | | |
| Crum & Forster Holdings Corp. | |
| 7.750% 05/01/17 | | | 3,060,000 | | | | 3,025,575 | | |
| | | | 6,718,811 | | |
| Reinsurance – 0.1% | |
| Transatlantic Holdings, Inc. | |
| 8.000% 11/30/39 | | | 1,005,000 | | | | 1,002,501 | | |
| | | | 1,002,501 | | |
| Insurance Total | | | 25,632,536 | | |
| Real Estate Investment Trusts (REITs) – 0.2% | |
| REITS-Diversified – 0.1% | |
| Duke Realty LP | |
| 7.375% 02/15/15 | | | 785,000 | | | | 868,487 | | |
| 8.250% 08/15/19 | | | 1,339,800 | | | | 1,527,161 | | |
| | | | 2,395,648 | | |
| REITS-Office Property – 0.1% | |
| Brandywine Operating Partnership LP | |
| 7.500% 05/15/15 | | | 2,125,000 | | | | 2,343,883 | | |
| Highwoods Properties, Inc. | |
| 5.850% 03/15/17 | | | 140,000 | | | | 140,939 | | |
| | | | 2,484,822 | | |
| Real Estate Investment Trusts (REITs) Total | | | 4,880,470 | | |
| Financials Total | | | 156,383,457 | | |
| Industrials – 4.6% | |
| Aerospace & Defense – 0.8% | |
| Aerospace/Defense – 0.1% | |
| Embraer Overseas Ltd. | |
| 6.375% 01/15/20 | | | 500,000 | | | | 501,250 | | |
| Kratos Defense & Security Solutions, Inc. | |
| 10.000% 06/01/17 (b) | | | 1,390,000 | | | | 1,376,100 | | |
| | | | 1,877,350 | | |
See Accompanying Notes to Financial Statements.
17
Columbia Strategic Income Fund
May 31, 2010
| Corporate Fixed-Income Bonds & Notes (continued) | |
| | | Par (a) | | Value ($) | |
| Aerospace/Defense-Equipment – 0.5% | |
| BE Aerospace, Inc. | |
| 8.500% 07/01/18 | | | 3,140,000 | | | | 3,249,900 | | |
| Sequa Corp. | |
| 11.750% 12/01/15 (b) | | | 4,105,000 | | | | 4,105,000 | | |
| TransDigm, Inc. | |
| 7.750% 07/15/14 | | | 3,000,000 | | | | 2,992,500 | | |
| | | | 10,347,400 | | |
| Electronics-Military – 0.2% | |
| L-3 Communications Corp. | |
| 6.375% 10/15/15 | | | 4,780,000 | | | | 4,780,000 | | |
| | | | 4,780,000 | | |
| Aerospace & Defense Total | | | 17,004,750 | | |
| Building Materials – 0.4% | |
| Building & Construction Products-Miscellaneous – 0.3% | |
| Associated Materials LLC/Associated Materials Finance, Inc. | |
| 9.875% 11/15/16 | | | 3,500,000 | | | | 3,762,500 | | |
| Building Materials Corp. of America | |
| 7.500% 03/15/20 (b) | | | 680,000 | | | | 664,700 | | |
| Nortek, Inc. | |
| 11.000% 12/01/13 | | | 1,717,599 | | | | 1,786,303 | | |
| Ply Gem Industries, Inc. | |
| 11.750% 06/15/13 | | | 1,350,000 | | | | 1,383,750 | | |
| | | | 7,597,253 | | |
| Building Products-Cement/Aggregation – 0.1% | |
| Texas Industries, Inc. | |
| 7.250% 07/15/13 | | | 1,575,000 | | | | 1,523,812 | | |
| | | | 1,523,812 | | |
| Building Materials Total | | | 9,121,065 | | |
| Electrical Components & Equipment – 0.3% | |
| Wire & Cable Products – 0.3% | |
| Belden, Inc. | |
| 7.000% 03/15/17 | | | 3,780,000 | | | | 3,609,900 | | |
| General Cable Corp. | |
| 7.125% 04/01/17 | | | 2,420,000 | | | | 2,377,650 | | |
| | | | 5,987,550 | | |
| Electrical Components & Equipment Total | | | 5,987,550 | | |
| Electronics – 0.1% | |
| Electronic Components-Miscellaneous – 0.1% | |
| Flextronics International Ltd. | |
| 6.250% 11/15/14 | | | 1,367,000 | | | | 1,353,330 | | |
| | | | 1,353,330 | | |
| Electronics Total | | | 1,353,330 | | |
| | | Par (a) | | Value ($) | |
| Engineering & Construction – 0.1% | |
| Building & Construction-Miscellaneous – 0.1% | |
| Esco Corp. | |
| 8.625% 12/15/13 (b) | | | 1,645,000 | | | | 1,673,788 | | |
| | | | 1,673,788 | | |
| Engineering & Construction Total | | | 1,673,788 | | |
| Environmental Control – 0.1% | |
| Hazardous Waste Disposal – 0.1% | |
| Clean Harbors, Inc. | |
| 7.625% 08/15/16 | | | 2,000,000 | | | | 2,050,000 | | |
| | | | 2,050,000 | | |
| Environmental Control Total | | | 2,050,000 | | |
| Machinery-Construction & Mining – 0.2% | |
| Machinery-Construction & Mining – 0.2% | |
| Terex Corp. | |
| 8.000% 11/15/17 | | | 4,195,000 | | | | 3,890,863 | | |
| | | | 3,890,863 | | |
| Machinery-Construction & Mining Total | | | 3,890,863 | | |
| Machinery-Diversified – 0.4% | |
| Machinery-General Industry – 0.4% | |
| CPM Holdings, Inc. | |
| 10.625% 09/01/14 (b) | | | 2,255,000 | | | | 2,404,394 | | |
| Manitowoc Co., Inc. | |
| 7.125% 11/01/13 | | | 3,500,000 | | | | 3,530,625 | | |
| 9.500% 02/15/18 | | | 2,200,000 | | | | 2,161,500 | | |
| | | | 8,096,519 | | |
| Machinery-Diversified Total | | | 8,096,519 | | |
| Miscellaneous Manufacturing – 0.5% | |
| Diversified Manufacturing Operators – 0.2% | |
| Amsted Industries, Inc. | |
| 8.125% 03/15/18 (b) | | | 1,500,000 | | | | 1,485,000 | | |
| Bombardier, Inc. | |
| 6.300% 05/01/14 (b) | | | 2,385,000 | | | | 2,432,700 | | |
| Ingersoll-Rand Global Holding Co., Ltd. | |
| 9.500% 04/15/14 | | | 550,000 | | | | 675,484 | | |
| Tyco International Ltd./Tyco International Finance SA | |
| 6.875% 01/15/21 | | | 155,000 | | | | 182,304 | | |
| | | | 4,775,488 | | |
| Miscellaneous Manufacturing – 0.3% | |
| American Railcar Industries, Inc. | |
| 7.500% 03/01/14 | | | 2,700,000 | | | | 2,558,250 | | |
| TriMas Corp. | |
| 9.750% 12/15/17 (b) | | | 3,165,000 | | | | 3,212,475 | | |
| | | | 5,770,725 | | |
| Miscellaneous Manufacturing Total | | | 10,546,213 | | |
See Accompanying Notes to Financial Statements.
18
Columbia Strategic Income Fund
May 31, 2010
| Corporate Fixed-Income Bonds & Notes (continued) | |
| | | Par (a) | | Value ($) | |
| Packaging & Containers – 0.8% | |
| Containers-Metal/Glass – 0.3% | |
| BWAY Corp. | |
| 10.000% 04/15/14 | | | 2,195,000 | | | | 2,425,475 | | |
| Crown Americas LLC & Crown Americas Capital Corp. | |
| 7.750% 11/15/15 | | | 2,440,000 | | | | 2,482,700 | | |
| Crown Americas LLC & Crown Americas Capital Corp. II | |
| 7.625% 05/15/17 (b) | | | 1,265,000 | | | | 1,271,325 | | |
| | | | 6,179,500 | | |
| Containers-Paper/Plastic – 0.5% | |
| Graham Packaging Co., LP/GPC Capital Corp. I | |
| 8.250% 01/01/17 (b) | | | 3,350,000 | | | | 3,257,875 | | |
| Graphic Packaging International, Inc. | |
| 9.500% 06/15/17 | | | 3,065,000 | | | | 3,187,600 | | |
| Solo Cup Co. | |
| 8.500% 02/15/14 | | | 3,285,000 | | | | 3,030,412 | | |
| | | | 9,475,887 | | |
| Packaging & Containers Total | | | 15,655,387 | | |
| Transportation – 0.9% | |
| Transportation-Marine – 0.4% | |
| Navios Maritime Holdings, Inc. | |
| 9.500% 12/15/14 | | | 3,335,000 | | | | 3,243,287 | | |
| Ship Finance International Ltd. | |
| 8.500% 12/15/13 | | | 2,515,000 | | | | 2,426,975 | | |
| Teekay Corp. | |
| 8.500% 01/15/20 | | | 1,830,000 | | | | 1,848,300 | | |
| | | | 7,518,562 | | |
| Transportation-Railroad – 0.4% | |
| BNSF Funding Trust I | |
6.613% 12/15/55
(01/15/26) (c)(d) | | | 920,000 | | | | 885,500 | | |
| Kansas City Southern de Mexico SA de CV | |
| 7.625% 12/01/13 | | | 3,770,000 | | | | 3,732,300 | | |
| RailAmerica, Inc. | |
| 9.250% 07/01/17 | | | 1,336,000 | | | | 1,389,440 | | |
| Union Pacific Corp. | |
| 5.700% 08/15/18 | | | 1,440,000 | | | | 1,575,919 | | |
| | | | 7,583,159 | | |
| Transportation-Services – 0.1% | |
| Bristow Group, Inc. | |
| 7.500% 09/15/17 | | | 2,360,000 | | | | 2,289,200 | | |
| | | | 2,289,200 | | |
| Transportation Total | | | 17,390,921 | | |
| Industrials Total | | | 92,770,386 | | |
| | | Par (a) | | Value ($) | |
| Technology – 0.7% | |
| Computers – 0.3% | |
| Computer Services – 0.2% | |
| Sungard Data Systems, Inc. | |
| 9.125% 08/15/13 | | | 6,155,000 | | | | 6,216,550 | | |
| | | | 6,216,550 | | |
| Computers-Memory Devices – 0.1% | |
| Seagate Technology International | |
| 10.000% 05/01/14 (b) | | | 1,080,000 | | | | 1,210,950 | | |
| | | | 1,210,950 | | |
| Computers Total | | | 7,427,500 | | |
| Networking Products – 0.1% | |
| Networking Products – 0.1% | |
| Cisco Systems, Inc. | |
| 5.500% 01/15/40 | | | 900,000 | | | | 902,563 | | |
| 5.900% 02/15/39 | | | 755,000 | | | | 800,530 | | |
| | | | 1,703,093 | | |
| Networking Products Total | | | 1,703,093 | | |
| Semiconductors – 0.2% | |
| Electronic Components-Semiconductors – 0.2% | |
| Amkor Technology, Inc. | |
| 9.250% 06/01/16 | | | 3,805,000 | | | | 3,990,494 | | |
| | | | 3,990,494 | | |
| Semiconductors Total | | | 3,990,494 | | |
| Software – 0.1% | |
| Data Processing/Management – 0.0% | |
| First Data Corp. | |
| 9.875% 09/24/15 | | | 805,000 | | | | 656,075 | | |
| | | | 656,075 | | |
| Enterprise Software/Services – 0.1% | |
| Oracle Corp. | |
| 6.500% 04/15/38 | | | 925,000 | | | | 1,066,238 | | |
| | | | 1,066,238 | | |
| Software Total | | | 1,722,313 | | |
| Technology Total | | | 14,843,400 | | |
| Utilities – 2.2% | |
| Electric – 2.1% | |
| Electric-Generation – 0.2% | |
| Intergen NV | |
| 9.000% 06/30/17 (b) | | | 4,660,000 | | | | 4,660,000 | | |
| | | | 4,660,000 | | |
See Accompanying Notes to Financial Statements.
19
Columbia Strategic Income Fund
May 31, 2010
| Corporate Fixed-Income Bonds & Notes (continued) | |
| | | Par (a) | | Value ($) | |
| Electric-Integrated – 1.0% | |
| CMS Energy Corp. | |
| 6.875% 12/15/15 | | | 1,615,000 | | | | 1,715,834 | | |
| Commonwealth Edison Co. | |
| 5.950% 08/15/16 | | | 950,000 | | | | 1,066,502 | | |
| Consolidated Edison Co. of New York, Inc. | |
| 6.750% 04/01/38 | | | 895,000 | | | | 1,036,093 | | |
| Energy Future Holdings Corp. | |
| 10.000% 01/15/20 (b) | | | 3,895,000 | | | | 3,875,525 | | |
| Ipalco Enterprises, Inc. | |
| 7.250% 04/01/16 (b) | | | 2,415,000 | | | | 2,457,263 | | |
| Kansas City Power & Light Co. | |
| 7.150% 04/01/19 | | | 835,000 | | | | 994,468 | | |
| Mirant Americas Generation LLC | |
| 8.500% 10/01/21 | | | 4,545,000 | | | | 4,158,675 | | |
| Nevada Power Co. | |
| 6.650% 04/01/36 | | | 950,000 | | | | 1,027,564 | | |
| Niagara Mohawk Power Corp. | |
| 4.881% 08/15/19 (b) | | | 865,000 | | | | 880,863 | | |
| Texas Competitive Electric Holdings Co. LLC | |
| 10.250% 11/01/15 | | | 3,580,000 | | | | 2,398,600 | | |
| | | | 19,611,387 | | |
| Independent Power Producer – 0.9% | |
| AES Corp. | |
| 7.750% 03/01/14 | | | 3,625,000 | | | | 3,625,000 | | |
| 8.000% 10/15/17 | | | 2,465,000 | | | | 2,421,863 | | |
| Dynegy Holdings, Inc. | |
| 7.750% 06/01/19 | | | 2,610,000 | | | | 1,885,725 | | |
| Mirant North America LLC | |
| 7.375% 12/31/13 | | | 1,005,000 | | | | 1,007,512 | | |
| NRG Energy, Inc. | |
| 7.375% 02/01/16 | | | 2,170,000 | | | | 2,099,475 | | |
| 7.375% 01/15/17 | | | 7,505,000 | | | | 7,129,750 | | |
| | | | 18,169,325 | | |
| Electric Total | | | 42,440,712 | | |
| Gas – 0.1% | |
| Gas-Distribution – 0.1% | |
| Atmos Energy Corp. | |
| 8.500% 03/15/19 | | | 580,000 | | | | 727,376 | | |
| Sempra Energy | |
| 6.500% 06/01/16 | | | 310,000 | | | | 354,208 | | |
| | | | 1,081,584 | | |
| Gas Total | | | 1,081,584 | | |
| Utilities Total | | | 43,522,296 | | |
Total Corporate Fixed-Income Bonds & Notes
(cost of $913,164,490) | | | 955,416,163 | | |
| Government & Agency Obligations – 40.8% | |
| | | Par (a) | | Value ($) | |
| Foreign Government Obligations – 26.8% | |
| Banco Nacional de Desenvolvimento Economico e Social | |
| 5.500% 07/12/20 (b) | | | 2,850,000 | | | | 2,764,500 | | |
| European Investment Bank | |
0.026% 09/21/11
(06/21/10) (c)(d) | | JPY | 1,280,000,000 | | | | 14,029,467 | | |
| 1.250% 09/20/12 | | JPY | 1,135,000,000 | | | | 12,752,988 | | |
| 1.400% 06/20/17 | | JPY | 1,457,000,000 | | | | 16,494,503 | | |
| 5.500% 12/07/11 | | GBP | 5,250,000 | | | | 8,082,531 | | |
| Federal Republic of Germany | |
| 4.250% 07/04/17 | | EUR | 1,850,000 | | | | 2,577,640 | | |
| 5.000% 07/04/12 | | EUR | 2,285,000 | | | | 3,063,749 | | |
| 6.000% 06/20/16 | | EUR | 12,600,000 | | | | 18,978,331 | | |
| Federative Republic of Brazil | |
| 6.000% 01/17/17 | | | 8,250,000 | | | | 8,938,875 | | |
| 7.375% 02/03/15 | | EUR | 6,950,000 | | | | 9,871,965 | | |
| 8.250% 01/20/34 | | | 9,360,000 | | | | 12,097,800 | | |
| 8.500% 09/24/12 | | EUR | 1,480,000 | | | | 2,057,735 | | |
| 11.000% 08/17/40 | | | 6,200,000 | | | | 8,222,440 | | |
| 12.500% 01/05/22 | | BRL | 10,275,000 | | | | 6,318,339 | | |
| Government of Belgium | |
| 3.250% 09/28/16 | | EUR | 3,220,000 | | | | 4,120,941 | | |
| Government of Canada | |
| 4.250% 06/01/18 | | CAD | 4,100,000 | | | | 4,197,825 | | |
| 8.000% 06/01/23 | | CAD | 3,380,000 | | | | 4,729,174 | | |
| Government of Japan | |
| 1.400% 12/20/18 | | JPY | 1,360,000,000 | | | | 15,456,622 | | |
| 1.500% 09/20/18 | | JPY | 930,000,000 | | | | 10,658,091 | | |
| Government of New Zealand | |
| 6.000% 05/15/21 | | NZD | 8,150,000 | | | | 5,711,152 | | |
| 6.500% 04/15/13 | | NZD | 5,270,000 | | | | 3,778,075 | | |
| Instituto de Credito Oficial | |
| 1.500% 09/20/12 | | JPY | 680,000,000 | | | | 7,481,249 | | |
| International Finance Corp. | |
| 7.500% 02/28/13 | | AUD | 2,675,000 | | | | 2,394,375 | | |
| Kingdom of Bahrain | |
| 5.500% 03/31/20 (b) | | | 1,000,000 | | | | 979,657 | | |
| Kingdom of Netherlands | |
| 4.000% 07/15/16 | | EUR | 1,580,000 | | | | 2,145,836 | | |
| Kingdom of Norway | |
| 4.250% 05/19/17 | | NOK | 73,185,000 | | | | 12,352,312 | | |
| Kingdom of Spain | |
| 3.800% 01/31/17 | | EUR | 5,680,000 | | | | 6,965,963 | | |
| Kingdom of Sweden | |
| 3.750% 08/12/17 | | SEK | 40,000,000 | | | | 5,545,453 | | |
| Pemex Project Funding Master Trust | |
| 5.750% 03/01/18 | | | 10,370,000 | | | | 10,528,744 | | |
| Penerbangan Malaysia Bhd | |
| 5.625% 03/15/16 | | | 3,200,000 | | | | 3,517,174 | | |
See Accompanying Notes to Financial Statements.
20
Columbia Strategic Income Fund
May 31, 2010
| Government & Agency Obligations (continued) | |
| | | Par (a) | | Value ($) | |
| Republic of Argentina | |
| 8.280% 12/31/33 | | | 10,024,326 | | | | 6,465,690 | | |
| Republic of Bulgaria | |
| 8.250% 01/15/15 | | | 2,700,000 | | | | 3,013,875 | | |
| Republic of Colombia | |
| 7.375% 03/18/19 | | | 6,150,000 | | | | 7,087,875 | | |
| 8.125% 05/21/24 | | | 6,525,000 | | | | 7,732,125 | | |
| 9.750% 04/09/11 | | | 1,211,207 | | | | 1,295,991 | | |
| Republic of Egypt | |
| 5.750% 04/29/20 (b) | | | 1,000,000 | | | | 1,007,500 | | |
| Republic of Finland | |
| 4.250% 07/04/15 | | EUR | 2,720,000 | | | | 3,732,884 | | |
| Republic of France | |
| 4.000% 04/25/13 | | EUR | 7,845,000 | | | | 10,450,392 | | |
| 5.500% 04/25/29 | | EUR | 5,920,000 | | | | 9,190,756 | | |
| Republic of Hungary | |
| 4.750% 02/03/15 | | | 2,435,000 | | | | 2,408,186 | | |
| Republic of Indonesia | |
| 5.875% 03/13/20 (b) | | | 10,425,000 | | | | 10,789,875 | | |
| 7.250% 04/20/15 (b) | | | 3,000,000 | | | | 3,397,500 | | |
| 10.375% 05/04/14 (b) | | | 9,180,000 | | | | 11,291,400 | | |
| Republic of Ireland | |
| 4.500% 10/18/18 | | EUR | 1,755,000 | | | | 2,140,576 | | |
| Republic of Italy | |
| 4.500% 08/01/18 | | EUR | 10,395,000 | | | | 13,375,544 | | |
| 5.250% 08/01/17 | | EUR | 5,090,000 | | | | 6,917,037 | | |
| Republic of Panama | |
| 6.700% 01/26/36 | | | 9,300,000 | | | | 10,253,250 | | |
| 8.875% 09/30/27 | | | 7,270,000 | | | | 9,741,800 | | |
| Republic of Peru | |
| 7.350% 07/21/25 | | | 5,200,000 | | | | 6,084,000 | | |
| 8.750% 11/21/33 | | | 9,847,000 | | | | 13,022,658 | | |
| Republic of Philippines | |
| 6.500% 01/20/20 | | | 3,810,000 | | | | 4,148,138 | | |
| 8.875% 03/17/15 | | | 10,615,000 | | | | 13,003,375 | | |
| Republic of Poland | |
| 5.500% 10/25/19 | | PLN | 14,475,000 | | | | 4,254,430 | | |
| 6.250% 10/24/15 | | PLN | 20,180,000 | | | | 6,310,936 | | |
| 6.375% 07/15/19 | | | 1,470,000 | | | | 1,600,831 | | |
| Republic of South Africa | |
| 5.500% 03/09/20 | | | 5,500,000 | | | | 5,541,250 | | |
| 8.250% 09/15/17 | | ZAR | 37,000,000 | | | | 4,782,886 | | |
| Republic of Turkey | |
| 7.000% 09/26/16 | | | 8,735,000 | | | | 9,717,688 | | |
| 7.375% 02/05/25 | | | 8,680,000 | | | | 9,678,200 | | |
| Republic of Uruguay | |
PIK,
7.875% 01/15/33 | | | 8,000,000 | | | | 9,200,000 | | |
| Republic of Venezuela | |
| 9.250% 09/15/27 | | | 20,955,000 | | | | 13,725,525 | | |
| | | Par (a) | | Value ($) | |
| Russian Federation | |
| 3.625% 04/29/15 (b) | | | 13,450,000 | | | | 12,864,925 | | |
| 7.500% 03/31/30 | | | 25,033,200 | | | | 27,974,601 | | |
| State of Qatar | |
| 5.250% 01/20/20 (b) | | | 2,000,000 | | | | 2,055,000 | | |
| 6.550% 04/09/19 (b) | | | 3,000,000 | | | | 3,337,500 | | |
| Treasury Corp. of Victoria | |
| 5.750% 11/15/16 | | AUD | 4,600,000 | | | | 3,898,323 | | |
| 6.000% 06/15/20 | | AUD | 4,580,000 | | | | 3,913,816 | | |
| United Kingdom Treasury | |
| 5.000% 03/07/25 | | GBP | 2,510,000 | | | | 3,996,996 | | |
| United Mexican States | |
| 5.125% 01/15/20 | | | 13,645,000 | | | | 13,883,787 | | |
| 6.050% 01/11/40 | | | 5,350,000 | | | | 5,376,750 | | |
| 8.500% 12/13/18 | | MXN | 55,860,000 | | | | 4,711,553 | | |
| 11.375% 09/15/16 | | | 7,590,000 | | | | 10,512,150 | | |
| Foreign Government Obligations Total | | | 540,701,080 | | |
| U.S. Government Agencies – 0.2% | |
| Federal Home Loan Mortgage Corp. | |
| 6.750% 03/15/31 | | | 406,000 | | | | 516,897 | | |
| Federal National Mortgage Association | |
| 4.375% 07/17/13 | | | 3,003,000 | | | | 3,257,895 | | |
| U.S. Government Agencies Total | | | 3,774,792 | | |
| U.S. Government Obligations – 13.8% | |
| U.S. Treasury Bonds | |
| 5.375% 02/15/31 | | | 10,000,000 | | | | 11,812,500 | | |
| 7.500% 11/15/24 (j) | | | 18,400,000 | | | | 25,857,741 | | |
| 8.875% 02/15/19 (j) | | | 21,000,000 | | | | 30,221,961 | | |
| 10.625% 08/15/15 (j) | | | 29,415,000 | | | | 41,658,994 | | |
| U.S. Treasury Notes | |
| 4.125% 05/15/15 | | | 16,800,000 | | | | 18,403,879 | | |
| 4.250% 09/30/12 | | | 40,000,000 | | | | 43,125,000 | | |
| 5.000% 02/15/11 | | | 47,600,000 | | | | 49,163,755 | | |
| 5.125% 05/15/16 | | | 46,000,000 | | | | 52,842,500 | | |
| U.S. Treasury STRIPS | |
| (k) 05/15/23 | | | 4,550,000 | | | | 2,677,825 | | |
P.O.,
(k) 11/15/13 (j) | | | 2,250,000 | | | | 2,135,954 | | |
| U.S. Government Obligations Total | | | 277,900,109 | | |
Total Government & Agency Obligations
(cost of $797,496,132) | | | 822,375,981 | | |
| Mortgage-Backed Securities – 4.9% | |
| Federal Home Loan Mortgage Corp. | |
| 5.000% 05/01/21 | | | 9,662,066 | | | | 10,346,060 | | |
| 9.000% 12/01/18 | | | 405 | | | | 451 | | |
| 9.000% 01/01/22 | | | 13,301 | | | | 15,236 | | |
See Accompanying Notes to Financial Statements.
21
Columbia Strategic Income Fund
May 31, 2010
| Mortgage-Backed Securities (continued) | |
| | | Par (a) | | Value ($) | |
| 9.250% 05/01/16 | | | 39,648 | | | | 44,417 | | |
| 9.500% 08/01/16 | | | 353 | | | | 396 | | |
| 9.750% 09/01/16 | | | 582 | | | | 625 | | |
| 10.000% 10/01/19 | | | 1,726 | | | | 1,951 | | |
| 10.000% 11/01/19 | | | 3,612 | | | | 4,146 | | |
| 10.500% 01/01/20 | | | 4,838 | | | | 5,438 | | |
| 10.750% 07/01/11 | | | 5,255 | | | | 5,348 | | |
| 11.250% 08/01/13 | | | 180 | | | | 184 | | |
| 11.250% 09/01/15 | | | 5,081 | | | | 5,893 | | |
| Federal National Mortgage Association | |
| 4.000% 01/01/39 | | | 17,808,993 | | | | 17,704,992 | | |
| 5.000% 09/01/37 | | | 9,901,641 | | | | 10,382,737 | | |
| 5.500% 11/01/36 | | | 7,008,079 | | | | 7,485,470 | | |
| 6.000% 10/01/36 | | | 2,550,789 | | | | 2,757,841 | | |
| 6.000% 02/01/37 | | | 8,685,380 | | | | 9,390,388 | | |
| 6.000% 08/01/37 | | | 12,471,003 | | | | 13,459,914 | | |
| 6.500% 12/01/31 | | | 14,400 | | | | 15,972 | | |
| 6.500% 05/01/32 | | | 18,916 | | | | 20,982 | | |
| 6.500% 01/01/33 | | | 10,657 | | | | 11,821 | | |
| 6.500% 05/01/33 | | | 48,596 | | | | 53,902 | | |
| 6.500% 11/01/36 | | | 16,625,126 | | | | 18,138,921 | | |
| 6.500% 11/01/37 | | | 8,055,705 | | | | 8,776,628 | | |
| 8.500% 06/01/15 | | | 94 | | | | 103 | | |
| 8.500% 09/01/21 | | | 3,164 | | | | 3,487 | | |
| 9.000% 07/01/14 | | | 410 | | | | 441 | | |
| 9.000% 04/01/16 | | | 33 | | | | 34 | | |
| 9.000% 08/01/21 | | | 18,479 | | | | 21,260 | | |
| 10.000% 04/01/14 | | | 32,079 | | | | 35,264 | | |
| 10.500% 07/01/14 | | | 13,263 | | | | 14,850 | | |
| 10.500% 03/01/16 | | | 94,586 | | | | 106,906 | | |
| Government National Mortgage Association | |
| 9.000% 05/15/16 | | | 17,129 | | | | 18,996 | | |
| 9.000% 06/15/16 | | | 13,435 | | | | 14,899 | | |
| 9.000% 07/15/16 | | | 31,777 | | | | 35,238 | | |
| 9.000% 08/15/16 | | | 31,590 | | | | 35,033 | | |
| 9.000% 09/15/16 | | | 26,490 | | | | 29,141 | | |
| 9.000% 09/15/16 | | | 21,067 | | | | 23,361 | | |
| 9.000% 10/15/16 | | | 7,377 | | | | 8,181 | | |
| 9.000% 11/15/16 | | | 22,825 | | | | 25,181 | | |
| 9.000% 12/15/16 | | | 26,069 | | | | 28,908 | | |
| 9.000% 01/15/17 | | | 1,939 | | | | 2,165 | | |
| 9.000% 02/15/17 | | | 4,252 | | | | 4,748 | | |
| 9.000% 04/15/17 | | | 6,457 | | | | 7,210 | | |
| 9.000% 07/15/17 | | | 21,754 | | | | 24,290 | | |
| 9.000% 10/15/17 | | | 7,136 | | | | 7,968 | | |
| 9.000% 12/15/17 | | | 6,891 | | | | 7,772 | | |
| 9.500% 10/15/16 | | | 5,663 | | | | 6,333 | | |
| 9.500% 09/15/17 | | | 1,668 | | | | 1,898 | | |
| 10.000% 09/15/17 | | | 19,915 | | | | 22,274 | | |
| 10.000% 11/15/17 | | | 2,804 | | | | 3,103 | | |
| 10.000% 02/15/18 | | | 10,411 | | | | 11,942 | | |
| | | Par (a) | | Value ($) | |
| 10.000% 08/15/18 | | | 233 | | | | 268 | | |
| 10.000% 09/15/18 | | | 2,189 | | | | 2,510 | | |
| 10.000% 11/15/18 | | | 6,128 | | | | 6,992 | | |
| 10.000% 03/15/19 | | | 4,917 | | | | 5,669 | | |
| 10.000% 06/15/19 | | | 1,148 | | | | 1,310 | | |
| 10.000% 08/15/19 | | | 447 | | | | 516 | | |
| 10.000% 11/15/20 | | | 1,418 | | | | 1,637 | | |
| 10.500% 10/15/15 | | | 4,123 | | | | 4,590 | | |
| 10.500% 12/15/15 | | | 548 | | | | 610 | | |
| 10.500% 01/15/16 | | | 2,501 | | | | 2,803 | | |
| 10.500% 10/15/17 | | | 3,545 | | | | 3,981 | | |
| 10.500% 12/15/17 | | | 2,328 | | | | 2,614 | | |
| 10.500% 01/15/18 | | | 4,341 | | | | 4,897 | | |
| 10.500% 07/15/18 | | | 858 | | | | 968 | | |
| 10.500% 12/15/18 | | | 786 | | | | 880 | | |
| 10.500% 06/15/19 | | | 1,468 | | | | 1,664 | | |
| 10.500% 07/15/19 | | | 694 | | | | 786 | | |
| 11.000% 09/15/15 | | | 38,491 | | | | 43,246 | | |
| 11.000% 10/15/15 | | | 23,818 | | | | 26,705 | | |
| 11.750% 08/15/13 | | | 4,022 | | | | 4,426 | | |
| 12.000% 05/15/14 | | | 176 | | | | 195 | | |
Total Mortgage-Backed Securities
(cost of $94,391,783) | | | 99,247,966 | | |
| Commercial Mortgage-Backed Securities – 2.2% | |
| Commercial Mortgage-Backed Securities – 2.2% | |
| Bear Stearns Commercial Mortgage Securities | |
4.933% 02/13/42
(06/01/10) (c)(d) | | | 4,845,000 | | | | 5,004,563 | | |
| 5.201% 12/11/38 | | | 5,000,000 | | | | 4,975,549 | | |
| Greenwich Capital Commercial Funding Corp. | |
5.317% 06/10/36
(06/01/10) (c)(d) | | | 1,395,000 | | | | 1,463,223 | | |
| GS Mortgage Securities Corp. II | |
| 4.751% 07/10/39 | | | 4,825,000 | | | | 4,923,178 | | |
5.553% 04/10/38
(06/01/10) (c)(d) | | | 4,898,000 | | | | 4,873,674 | | |
| JPMorgan Chase Commercial Mortgage Securities Corp. | |
| 5.440% 06/12/47 | | | 4,000,000 | | | | 3,874,036 | | |
5.790% 06/12/43
(06/01/10) (c)(d) | | | 4,825,000 | | | | 5,072,618 | | |
| Morgan Stanley Capital I | |
| 4.989% 08/13/42 | | | 4,825,000 | | | | 4,952,864 | | |
5.797% 08/12/41
(06/01/10) (c)(d) | | | 3,575,000 | | | | 3,842,465 | | |
See Accompanying Notes to Financial Statements.
22
Columbia Strategic Income Fund
May 31, 2010
| Commercial Mortgage-Backed Securities (continued) | |
| | | Par (a) | | Value ($) | |
| Wachovia Bank Commercial Mortgage Trust | |
5.208% 10/15/44
(06/01/10) (c)(d) | | | 4,825,000 | | | | 5,076,147 | | |
| 5.726% 06/15/45 | | | 929,666 | | | | 933,878 | | |
Commercial Mortgage-Backed
Securities Total | | | 44,992,195 | | |
Total Commercial Mortgage-Backed Securities
(cost of $42,655,174) | | | 44,992,195 | | |
| Municipal Bonds – 0.2% | |
| California – 0.2% | |
| CA Cabazon Band Mission Indians | |
Series 2004,
7.358% 10/01/11
(10/01/10) (c)(d) | | | 2,820,000 | | | | 1,852,853 | | |
| CA Los Angeles Unified School District | |
Series 2009,
5.750% 07/01/34 | | | 625,000 | | | | 602,106 | | |
| CA State | |
Series 2009,
7.550% 04/01/39 | | | 1,465,000 | | | | 1,565,983 | | |
| California Total | | | 4,020,942 | | |
Total Municipal Bonds
(cost of $4,897,665) | | | 4,020,942 | | |
| Asset-Backed Securities – 0.1% | |
| GMAC Mortgage Corp. | |
4.865% 09/25/34
(06/01/10) (c)(d) | | | 3,000,432 | | | | 2,309,584 | | |
Total Asset-Backed Securities
(cost of $3,000,432) | | | 2,309,584 | | |
| Common Stock – 0.1% | |
| | | Shares | | | |
| Consumer Discretionary – 0.1% | |
| Hotels, Restaurants & Leisure – 0.1% | |
| Six Flags Entertainment Corp. (l) | | | 35,561 | | | | 1,244,652 | | |
| Hotels, Restaurants & Leisure Total | | | 1,244,652 | | |
| Consumer Discretionary Total | | | 1,244,652 | | |
Total Common Stock
(cost of $2,486,560) | | | 1,244,652 | | |
| Warrants – 0.0% | |
| | | Units | | Value ($) | |
| Financials – 0.0% | |
| Banks – 0.0% | |
| CNB Capital Trust I | |
| Expires 03/23/19 (b)(e)(l) | | | 46,584 | | | | 466 | | |
| Banks Total | | | 466 | | |
| Financials Total | | | 466 | | |
Total Warrants
(cost of $466) | | | 466 | | |
| Preferred Stock – 0.0% | |
| | | Shares | | | |
| Communications – 0.0% | |
| Media – 0.0% | |
CMP Susquehanna Radio Holdings Corp.,
Series A (b)(e)(l) | | | 40,765 | | | | 408 | | |
| Media Total | | | 408 | | |
| Communications Total | | | 408 | | |
Total Preferred Stock
(cost of $408) | | | 408 | | |
| Securities Lending Collateral – 0.6% | |
State Street Navigator
Securities Lending
Prime Portfolio
(7 day yield of 0.250%) (m) | | | 12,541,041 | | | | 12,541,041 | | |
Total Securities Lending Collateral
(cost of $12,541,041) | | | 12,541,041 | | |
See Accompanying Notes to Financial Statements.
23
Columbia Strategic Income Fund
May 31, 2010
| Short-Term Obligation – 6.5% | |
| | | Par ($) | | Value ($) | |
Repurchase agreement with
Fixed Income Clearing Corp.,
dated 05/28/10, due 06/01/10
at 0.140% collateralized by a
U.S. Government Agency
obligation maturing 10/10/12,
market value $133,628,600
(repurchase proceeds
$131,008,038) | | | 131,006,000 | | | | 131,006,000 | | |
Total Short-Term Obligation
(cost of $131,006,000) | | | 131,006,000 | | |
Total Investments – 102.8%
(cost of $2,001,640,151)(n) | | | 2,073,155,398 | | |
Obligation to Return Collateral for
Securities Loaned – (0.6)% | | | (12,541,041 | ) | |
| Other Assets & Liabilities, Net – (2.2)% | | | (44,211,932 | ) | |
| Net Assets – 100.0% | | | 2,016,402,425 | | |
Notes to Investment Portfolio:
(a) Principal amount is stated in U.S. dollars unless otherwise noted.
(b) Security exempt from registration pursuant to Rule 144A under the Securities Act of 1933. These securities may be resold in transactions exempt from registration, normally to qualified institutional buyers. At May 31, 2010, these securities, which are not illiquid except for the following, amounted to $280,163,562, which represents 13.9% of net assets.
| Security | | Acquisition
Date | | Par/
Shares/
Units | | Cost | | Value | |
| | CMP Susquehanna
Radio Holdings | | | | | | | | | | | | | | | | |
| | Corp., Series A | | | 03/26/09 | | | 40,765 | | | $ | 408 | | | $ | 408 | | |
| | CNB Capital Trust I | | | | | | | | | | | | | | | | |
| | Expires 03/23/19 | | | 03/26/09 | | | 46,584 | | | | 466 | | | | 466 | | |
| | Hexion Finance
Escrow LLC/Hexion
Escrow. Corp.
8.875%
02/01/18 | | | 05/11/10 -
05/27/10 | | | 5,860,000 | | | | 5,403,825 | | | | 5,420,500 | | |
| | Regency Energy
Partners LP/
Regency Energy
Finance Corp.
9.375%
06/01/16 | | | 05/11/10 -
05/26/10 | | | 1,740,000 | | | | 1,815,975 | | | | 1,809,600 | | |
| | Seminole Indian
Tribe of Florida
7.804%
10/01/20 | | | 09/26/07 -
10/04/07 | | $ | 3,055,000 | | | | 3,105,055 | | | | 2,777,331 | | |
| | | $ | 10,008,305 | | |
(c) Parenthetical date represents the next interest rate reset date for the security.
(d) The interest rate shown on floating rate or variable rate securities reflects the rate at May 31, 2010.
(e) Represents fair value as determined in good faith under procedures approved by the Board of Trustees. At May 31, 2010, the value of these securities amounted to $104,124, which represents less than 0.1% of net assets.
(f) The issuer has filed for bankruptcy protection under Chapter 11, and is in default of certain debt covenants. Income is not being accrued. At May 31, 2010, the value of these securities amounted to $1,771,879, which represents 0.1% of net assets.
(g) Security has no value.
(h) Loan participation agreement.
(i) The issuer is in default of certain debt covenants. Income is not being accrued. At May 31, 2010, the value of this security amounted to $938,300 which represents less than 0.1% of net assets.
(j) All or a portion of this security was on loan at May 31, 2010. The total market value of securities on loan at May 31, 2010 was $12,273,643.
(k) Zero coupon bond.
(l) Non-income producing security.
(m) Investment made with cash collateral received from securities lending activity.
(n) Cost for federal income tax purposes is $2,016,406,873.
The following table summarizes the inputs used, as of May 31, 2010 in valuing the Fund's assets:
| Description | | Quoted
Prices
(Level 1) | | Other
Significant
Observable
Inputs
(Level 2) | | Significant
Unobservable
Inputs
(Level 3) | | Total | |
Corporate Fixed-Income
Bonds & Notes | |
| Basic Materials | | $ | — | | | $ | 80,575,323 | | | $ | — | | | $ | 80,575,323 | | |
| Communications | | | — | | | | 183,428,933 | | | | 103,250 | | | | 183,532,183 | | |
| Consumer Cyclical | | | — | | | | 111,390,684 | | | | — | | | | 111,390,684 | | |
| Consumer Non-Cyclical | | | — | | | | 119,407,274 | | | | — | | | | 119,407,274 | | |
| Diversified | | | — | | | | 5,247,000 | | | | — | | | | 5,247,000 | | |
| Energy | | | — | | | | 147,744,160 | | | | — | | | | 147,744,160 | | |
| Financials | | | — | | | | 156,383,457 | | | | — | | | | 156,383,457 | | |
| Industrials | | | — | | | | 92,770,386 | | | | — | | | | 92,770,386 | | |
| Technology | | | — | | | | 14,843,400 | | | | — | | | | 14,843,400 | | |
| Utilities | | | — | | | | 43,522,296 | | | | — | | | | 43,522,296 | | |
Total Corporate
Fixed-Income
Bonds & Notes | | | — | | | | 955,312,913 | | | | 103,250 | | | | 955,416,163 | | |
Government & Agency
Obligations | |
Foreign Government
Obligations | | | — | | | | 540,701,080 | | | | — | | | | 540,701,080 | | |
U.S. Government
Agencies | | | — | | | | 3,774,792 | | | | — | | | | 3,774,792 | | |
U.S. Government
Obligations | | | 273,086,330 | | | | 4,813,779 | | | | — | | | | 277,900,109 | | |
Total Government &
Agency Obligations | | | 273,086,330 | | | | 549,289,651 | | | | — | | | | 822,375,981 | | |
Total Mortgage-Backed
Securities | | | — | | | | 99,247,966 | | | | — | | | | 99,247,966 | | |
Total Commercial
Mortgage-Backed
Securities | | | — | | | | 44,992,195 | | | | — | | | | 44,992,195 | | |
| Total Municipal Bonds | | | — | | | | 4,020,942 | | | | — | | | | 4,020,942 | | |
Total Asset-Backed
Securities | | | — | | | | 2,309,584 | | | | — | | | | 2,309,584 | | |
| Total Common Stock | | | 1,244,652 | | | | — | | | | — | | | | 1,244,652 | | |
| Total Warrants | | | — | | | | — | | | | 466 | | | | 466 | | |
| Total Preferred Stock | | | — | | | | — | | | | 408 | | | | 408 | | |
Total Securities Lending
Collateral | | | 12,541,041 | | | | — | | | | — | | | | 12,541,041 | | |
Total Short-Term
Obligation | | | — | | | | 131,006,000 | | | | — | | | | 131,006,000 | | |
| Total Investments | | | 286,872,023 | | | | 1,786,179,251 | | | | 104,124 | | | | 2,073,155,398 | | |
See Accompanying Notes to Financial Statements.
24
Columbia Strategic Income Fund
May 31, 2010
| Description | | Quoted
Prices
(Level 1) | | Other
Significant
Observable
Inputs
(Level 2) | | Significant
Unobservable
Inputs
(Level 3) | | Total | |
Unrealized Appreciation
on Forward Foreign
Currency Exchange
Contracts | | $ | — | | | $ | 1,263,782 | | | $ | — | | | $ | 1,263,782 | | |
Unrealized Depreciation
on Forward Foreign
Currency Exchange
Contracts | | | — | | | | (487,353 | ) | | | — | | | | (487,353 | ) | |
Value of Credit Default
Swap Contract-
Depreciation | | | — | | | | (108,242 | ) | | | — | | | | (108,242 | ) | |
| Total | | $ | 286,872,023 | | | $ | 1,786,847,438 | | | $ | 104,124 | | | $ | 2,073,823,585 | | |
The Fund's assets assigned to the Level 2 input category include certain foreign securities for which a third party statistical pricing service may be employed for purposes of fair market valuation.
The following table reconciles asset balances for the year ending May 31, 2010, in which significant unobservable inputs (Level 3) were used in determining value:
Investments in
Securities | | Balance
as of
May 31,
2009 | | Accrued
Discounts
(Premiums) | | Realized
Gain
(Loss) | | Change in
Unrealized
Appreciation
(Depreciation) | | Purchases | | Sales | | Transfers
into
Level 3 | | Transfers
out of
Level 3 | | Balance
as of
May 31, 2010 | |
Corporate Fixed-Income
Bonds & Notes
Communications | | $ | 78,750 | | | $ | — | | | $ | — | | | $ | 24,500 | | | $ | — | | | $ | — | | | $ | — | | | $ | — | | | $ | 103,250 | | |
| Utilities | | | 335,397 | | | | — | | | | (29,091 | ) | | | 32,513 | | | | — | | | | (338,819 | ) | | | — | | | | — | | | | — | | |
Warrants
Financials | | | 466 | | | | — | | | | — | | | | — | | | | — | | | | — | | | | — | | | | — | | | | 466 | | |
Preferred Stock
Communications | | | 408 | | | | — | | | | — | | | | — | | | | — | | | | — | | | | — | | | | — | | | | 408 | | |
| | | $ | 415,021 | | | $ | — | | | $ | (29,091 | ) | | $ | 57,013 | | | $ | — | | | $ | (338,819 | ) | | $ | — | | | $ | — | | | $ | 104,124 | | |
The information in the above reconciliation represents fiscal year to date activity for any securities identified as using Level 3 inputs at either the beginning or the end of the current fiscal period.
The change in unrealized appreciation attributable to securities owned at May 31, 2010 which were valued using significant unobservable inputs (Level 3) amounted to $24,500. This amount is included in net change in unrealized appreciation (depreciation) on the Statement of Changes in Net Assets.
For more information on valuation inputs, and their aggregation into the levels used in the tables above, please refer to the Security Valuation section in the accompanying Notes to Financial Statements.
Forward foreign currency exchange contracts outstanding on May 31, 2010 are:
Foreign Exchange Rate Risk
Forward
Foreign
Currency
Exchange
Contracts
to Buy | | Value | | Aggregate
Face Value | | Settlement
Date | | Unrealized
Appreciation
(Depreciation) | |
| EUR | | | | $ | 901,976 | | | $ | 900,337 | | | 06/04/10 | | $ | 1,639 | | |
| EUR | | | | | 1,619,986 | | | | 1,616,399 | | | 06/10/10 | | | 3,587 | | |
| JPY | | | | | 8,635,841 | | | | 8,748,078 | | | 06/09/10 | | | (112,237 | ) | |
| | | | | | | | | | | | | | | $ | (107,011 | ) | |
See Accompanying Notes to Financial Statements.
25
Columbia Strategic Income Fund
May 31, 2010
Foreign Exchange Rate Risk
Forward
Foreign
Currency
Exchange
Contracts
to Sell | | Value | | Aggregate
Face Value | | Settlement
Date | | Unrealized
Appreciation
(Depreciation) | |
| EUR | | | | $ | 7,761,903 | | | $ | 8,135,531 | | | 06/04/10 | | $ | 373,628 | | |
| EUR | | | | | 7,761,904 | | | | 8,103,957 | | | 06/04/10 | | | 342,053 | | |
| EUR | | | | | 1,619,986 | | | | 1,675,641 | | | 06/10/10 | | | 55,655 | | |
| EUR | | | | | 6,983,202 | | | | 7,160,546 | | | 06/11/10 | | | 177,344 | | |
| EUR | | | | | 9,566,619 | | | | 9,814,840 | | | 06/11/10 | | | 248,221 | | |
| JPY | | | | | 8,635,841 | | | | 8,447,309 | | | 06/09/10 | | | (188,532 | ) | |
| JPY | | | | | 10,122,229 | | | | 9,935,645 | | | 06/17/10 | | | (186,584 | ) | |
| JPY | | | | | 6,987,182 | | | | 7,019,522 | | | 06/23/10 | | | 32,340 | | |
| JPY | | | | | 6,987,182 | | | | 7,016,497 | | | 06/23/10 | | | 29,315 | | |
| | | | | | | | | | | | | | | $ | 883,440 | | |
At May 31, 2010, the Fund has entered into the following credit default swap contract:
Credit Risk
Swap
Counterparty | | Referenced
Obligation | | Receive Buy
Protection | | Fixed Rate | | Expiration
Date | | Notional
Amount | | Upfront
Premium Paid
(Received) | | Value of
Contract | |
| Barclays Capital | | Federative Republic of Brazil
12.250% 03/06/30 | | Buy | | | 1.470 | % | | | 09/20/14 | | | $ | 10,000,000 | | | $ | — | | | $ | (108,242 | ) | |
At May 31, 2010, cash of $330,000 was pledged as collateral for the open credit default swap contract.
At May 31, 2010, the asset allocation of the Fund is as follows:
| Asset Allocation (Unaudited) | | % of
Net Assets | |
| Corporate Fixed-Income Bonds & Notes | | | 47.4 | | |
| Government & Agency Obligations | | | 40.8 | | |
| Mortgage-Backed Securities | | | 4.9 | | |
| Commercial Mortgage-Backed Securities | | | 2.2 | | |
| Municipal Bonds | | | 0.2 | | |
| Asset-Backed Securities | | | 0.1 | | |
| Common Stock | | | 0.1 | | |
| Warrants | | | 0.0 | * | |
| Preferred Stock | | | 0.0 | * | |
| | | | 95.7 | | |
| Securities Lending Collateral | | | 0.6 | | |
| Short-Term Obligation | | | 6.5 | | |
| Obligation to Return Collateral for Securities Loaned | | | (0.6 | ) | |
| Other Assets & Liabilities, Net | | | (2.2 | ) | |
| | | | 100.0 | | |
* Rounds to less than 0.1%.
| Acronym | | Name | |
| AUD | | Australian Dollar | |
|
| BRL | | Brazilian Real | |
|
| CAD | | Canadian Dollar | |
|
| EUR | | Euro | |
|
| GBP | | Pound Sterling | |
|
| JPY | | Japanese Yen | |
|
| MXN | | Mexican Peso | |
|
| NOK | | Norwegian Krone | |
|
| NZD | | New Zealand Dollar | |
|
| PIK | | Payment-In-Kind | |
|
| PLN | | Polish Zloty | |
|
| P.O. | | Principal Only | |
|
| SEK | | Swedish Krona | |
|
| STRIPS | | Separate Trading of Registered Interest and Principal of Securities | |
|
| ZAR | | South African Rand | |
|
See Accompanying Notes to Financial Statements.
26
Statement of Assets and Liabilities – Columbia Strategic Income Fund
May 31, 2010
| | | | | ($) | |
| Assets | | Investments, at cost | | | 2,001,640,151 | | |
| | | Investments at value (including securities on loan of $12,273,643) | | | 2,073,155,398 | | |
| | | Cash collateral for open credit default swap contract | | | 330,000 | | |
| | | Unrealized appreciation on forward foreign currency exchange contracts | | | 1,263,782 | | |
| | Receivable for: | | | | | |
| | | Investments sold | | | 25,289,971 | | |
| | | Fund shares sold | | | 2,039,139 | | |
| | | Interest | | | 33,539,389 | | |
| | | Securities lending | | | 2,266 | | |
| | | Foreign tax reclaims | | | 6,227 | | |
| | | Trustees' deferred compensation plan | | | 133,773 | | |
| | | Prepaid expenses | | | 57,469 | | |
| | | Total Assets | | | 2,135,817,414 | | |
| Liabilities | | Collateral on securities loaned | | | 12,541,041 | | |
| | | Payable to custodian bank | | | 1,209 | | |
| | | Foreign currency overdraft, at value (cost of $1,340,442) | | | 1,329,183 | | |
| | | Unrealized depreciation on forward foreign currency exchange contracts | | | 487,353 | | |
| | | Open credit default swap contract | | | 108,242 | | |
| | | Payable for: | | | | | |
| | | Investments purchased | | | 99,346,522 | | |
| | | Fund shares repurchased | | | 3,380,851 | | |
| | | Investment advisory fee | | | 937,344 | | |
| | | Pricing and bookkeeping fees | | | 20,446 | | |
| | | Transfer agent fee | | | 456,667 | | |
| | | Trustees' fees | | | 36,354 | | |
| | | Custody fee | | | 40,446 | | |
| | | Distribution and service fees | | | 438,196 | | |
| | | Chief compliance officer expenses | | | 653 | | |
| | | Trustees' deferred compensation plan | | | 133,773 | | |
| | | Other liabilities | | | 156,709 | | |
| | | Total Liabilities | | | 119,414,989 | | |
| | | Net Assets | | | 2,016,402,425 | | |
| Net Assets Consist of | | Paid-in capital | | | 2,063,326,329 | | |
| | | Undistributed net investment income | | | 11,466,073 | | |
| | | Accumulated net realized loss | | | (130,116,116 | ) | |
| | | Net unrealized appreciation (depreciation) on: | | | | | |
| | | Investments | | | 71,515,247 | | |
| | | Foreign currency translations and forward foreign currency
exchange contracts | | | 319,134 | | |
| | | Credit default swap contracts | | | (108,242 | ) | |
| | | Net Assets | | | 2,016,402,425 | | |
See Accompanying Notes to Financial Statements.
27
Statement of Assets and Liabilities – Columbia Strategic Income Fund
May 31, 2010 (continued)
| Class A | | Net assets | | $ | 1,013,941,300 | | |
| | | Shares outstanding | | | 173,611,140 | | |
| | | Net asset value per share | | $ | 5.84 | (a) | |
| | | Maximum sales charge | | | 4.75 | % | |
| | | Maximum offering price per share ($5.84/0.9525) | | $ | 6.13 | (b) | |
| Class B | | Net assets | | $ | 91,784,039 | | |
| | | Shares outstanding | | | 15,726,330 | | |
| | | Net asset value and offering price per share | | $ | 5.84 | (a) | |
| Class C | | Net assets | | $ | 196,319,428 | | |
| | | Shares outstanding | | | 33,603,669 | | |
| | | Net asset value and offering price per share | | $ | 5.84 | (a) | |
| Class Z | | Net assets | | $ | 714,357,658 | | |
| | | Shares outstanding | | | 123,682,559 | | |
| | | Net asset value, offering and redemption price per share | | $ | 5.78 | | |
(a) Redemption price per share is equal to net asset value less any applicable contingent deferred sales charge.
(b) On sales of $50,000 or more the offering price is reduced.
See Accompanying Notes to Financial Statements.
28
Statement of Operations – Columbia Strategic Income Fund
For the Year Ended May 31, 2010
| | | | | ($) (a) | |
| Investment Income | | Interest | | | 125,695,232 | | |
| | | Securities lending | | | 271,732 | | |
| | | Total Investment Income | | | 125,966,964 | | |
| Expenses | | Investment advisory fee | | | 11,174,533 | | |
| | | Distribution fee: | | | | | |
| | | Class B | | | 834,688 | | |
| | | Class C | | | 1,447,007 | | |
| | | Class J | | | 28,560 | | |
| | | Printing fee—Class J | | | 12,824 | | |
| | | Legal fee—Class J | | | 4,424 | | |
| | | Service fee: | | | | | |
| | | Class A | | | 2,517,697 | | |
| | | Class B | | | 275,223 | | |
| | | Class C | | | 478,263 | | |
| | | Class J | | | 20,076 | | |
| | | Transfer agent fee | | | 2,863,736 | | |
| | | Pricing and bookkeeping fees | | | 193,287 | | |
| | | Trustees' fees | | | 123,813 | | |
| | | Custody fee | | | 241,280 | | |
| | | Chief compliance officer expenses | | | 1,721 | | |
| | | Other expenses | | | 715,828 | | |
| | | Total Expenses | | | 20,932,960 | | |
| | | Fees waived by distributor—Class C | | | (287,333 | ) | |
| | | Expense reductions | | | (292 | ) | |
| | | Net Expenses | | | 20,645,335 | | |
| | | Net Investment Income | | | 105,321,629 | | |
| Net Realized and Unrealized Gain (Loss) on Investments, Foreign Currency and Credit Default Swap Contracts | |
| | | Net realized gain (loss) on: | | | | | |
| | | Investments | | | 38,769,567 | | |
| | | Foreign currency transactions and forward foreign currency
exchange contracts | | | (866,881 | ) | |
| | | Credit default swap contracts | | | (98,000 | ) | |
| | | Net realized gain | | | 37,804,686 | | |
| | | Net change in unrealized appreciation (depreciation) on: | | | | | |
| | | Investments | | | 103,461,795 | | |
| | | Foreign currency translations and forward foreign currency
exchange contracts | | | 5,810,975 | | |
| | | Credit default swap contracts | | | (108,242 | ) | |
| | | Net change in unrealized appreciation (depreciation) | | | 109,164,528 | | |
| | | Net Gain | | | 146,969,214 | | |
| | | Net Increase Resulting from Operations | | | 252,290,843 | | |
(a) Class J shares liquidated as of the close of business on July 27, 2009.
See Accompanying Notes to Financial Statements.
29
Statement of Changes in Net Assets – Columbia Strategic Income Fund
| | | | | Year Ended May 31, | |
| Increase (Decrease) in Net Assets | | | | 2010 ($)(a) | | 2009 ($) | |
| Operations | | Net investment income | | | 105,321,629 | | | | 99,118,483 | | |
| | | Net realized gain (loss) on investments, foreign
currency transactions, forward foreign currency
exchange contracts and credit default swap contracts | | | 37,804,686 | | | | (66,140,387 | ) | |
| | | Net change in unrealized appreciation (depreciation)
on investments, foreign currency translations,
forward foreign currency exchange contracts and
credit default swap contracts | | | 109,164,528 | | | | (70,620,046 | ) | |
| | | Net increase (decrease) resulting from operations | | | 252,290,843 | | | | (37,641,950 | ) | |
| Distributions to Shareholders | | From net investment income: | | | | | | | | | |
| | | Class A | | | (45,728,859 | ) | | | (57,060,432 | ) | |
| | | Class B | | | (4,162,812 | ) | | | (8,611,936 | ) | |
| | | Class C | | | (7,513,696 | ) | | | (7,993,115 | ) | |
| | | Class J | | | (401,498 | ) | | | (5,287,255 | ) | |
| | | Class Z | | | (35,781,204 | ) | | | (49,353,292 | ) | |
| | | From return of capital: | | | | | | | | | |
| | | Class A | | | — | | | | (702,945 | ) | |
| | | Class B | | | — | | | | (119,557 | ) | |
| | | Class C | | | — | | | | (108,706 | ) | |
| | | Class J | | | — | | | | (69,207 | ) | |
| | | Class Z | | | — | | | | (579,621 | ) | |
| | | Total distributions to shareholders | | | (93,588,069 | ) | | | (129,886,066 | ) | |
| | | Net Capital Stock Transactions | | | (108,698,488 | ) | | | 141,335,342 | | |
| | | Total increase (decrease) in net assets | | | 50,004,286 | | | | (26,192,674 | ) | |
| Net Assets | | Beginning of period | | | 1,966,398,139 | | | | 1,992,590,813 | | |
| | | End of period | | | 2,016,402,425 | | | | 1,966,398,139 | | |
| | | Undistributed (overdistributed) net investment income
at end of period | | | 11,466,073 | | | | (36,718,149 | ) | |
(a) Class J shares liquidated as of the close of business on July 27, 2009.
See Accompanying Notes to Financial Statements.
30
Statement of Changes in Net Assets (continued) – Columbia Strategic Income Fund
| | | Capital Stock Activity | |
| | | Year Ended
May 31, 2010 | | Year Ended
May 31, 2009 | |
| | | Shares | | Dollars ($) | | Shares | | Dollars ($) | |
| Class A | |
| Subscriptions | | | 44,764,586 | | | | 256,688,153 | | | | 53,577,581 | | | | 283,555,235 | | |
| Distributions reinvested | | | 6,141,676 | | | | 35,355,066 | | | | 8,141,052 | | | | 43,338,175 | | |
| Redemptions | | | (46,242,720 | ) | | | (267,867,373 | ) | | | (39,168,426 | ) | | | (208,915,943 | ) | |
| Net increase | | | 4,663,542 | | | | 24,175,846 | | | | 22,550,207 | | | | 117,977,467 | | |
| Class B | |
| Subscriptions | | | 1,173,175 | | | | 6,680,312 | | | | 4,621,544 | | | | 24,896,368 | | |
| Distributions reinvested | | | 470,990 | | | | 2,700,137 | | | | 1,030,847 | | | | 5,497,354 | | |
| Redemptions | | | (8,675,260 | ) | | | (50,017,718 | ) | | | (11,507,422 | ) | | | (61,525,583 | ) | |
| Net decrease | | | (7,031,095 | ) | | | (40,637,269 | ) | | | (5,855,031 | ) | | | (31,131,861 | ) | |
| Class C | |
| Subscriptions | | | 11,456,717 | | | | 65,253,232 | | | | 13,411,529 | | | | 71,085,228 | | |
| Distributions reinvested | | | 824,665 | | | | 4,752,182 | | | | 1,024,271 | | | | 5,457,973 | | |
| Redemptions | | | (7,807,939 | ) | | | (45,308,794 | ) | | | (7,365,007 | ) | | | (39,434,647 | ) | |
| Net increase | | | 4,473,443 | | | | 24,696,620 | | | | 7,070,793 | | | | 37,108,554 | | |
| Class J (a) | |
| Subscriptions | | | — | | | | — | | | | 38,700 | | | | 204,097 | | |
| Redemptions | | | (12,782,816 | ) | | | (69,808,201 | ) | | | (4,516,219 | ) | | | (24,428,285 | ) | |
| Net decrease | | | (12,782,816 | ) | | | (69,808,201 | ) | | | (4,477,519 | ) | | | (24,224,188 | ) | |
| Class Z | |
| Subscriptions | | | 33,564,084 | | | | 190,800,424 | | | | 41,547,367 | | | | 220,065,372 | | |
| Distributions reinvested | | | 1,389,689 | | | | 7,904,514 | | | | 1,571,363 | | | | 8,280,720 | | |
| Redemptions | | | (42,944,059 | ) | | | (245,830,422 | ) | | | (35,525,281 | ) | | | (186,740,722 | ) | |
| Net increase (decrease) | | | (7,990,286 | ) | | | (47,125,484 | ) | | | 7,593,449 | | | | 41,605,370 | | |
(a) Class J shares liquidated as of the close of business on July 27, 2009.
See Accompanying Notes to Financial Statements.
31
Financial Highlights – Columbia Strategic Income Fund
Selected data for a share outstanding throughout each period is as follows:
| | | Year Ended May 31, | |
| Class A Shares | | 2010 | | 2009 | | 2008 | | 2007 | | 2006 | |
| Net Asset Value, Beginning of Period | | $ | 5.40 | | | $ | 5.91 | | | $ | 6.01 | | | $ | 5.88 | | | $ | 6.15 | | |
| Income from Investment Operations: | |
| Net investment income (a) | | | 0.29 | | | | 0.29 | | | | 0.31 | | | | 0.33 | | | | 0.34 | | |
Net realized and unrealized gain (loss) on investments,
foreign currency, futures contracts and credit default
swap contracts | | | 0.41 | | | | (0.41 | ) | | | (0.05 | ) | | | 0.16 | | | | (0.15 | ) | |
| Total from investment operations | | | 0.70 | | | | (0.12 | ) | | | 0.26 | | | | 0.49 | | | | 0.19 | | |
| Less Distributions to Shareholders: | |
| From net investment income | | | (0.26 | ) | | | (0.38 | ) | | | (0.36 | ) | | | (0.36 | ) | | | (0.46 | ) | |
| From return of capital | | | — | | | | (0.01 | ) | | | — | | | | — | | | | — | | |
| Total distributions to shareholders | | | (0.26 | ) | | | (0.39 | ) | | | (0.36 | ) | | | (0.36 | ) | | | (0.46 | ) | |
| Net Asset Value, End of Period | | $ | 5.84 | | | $ | 5.40 | | | $ | 5.91 | | | $ | 6.01 | | | $ | 5.88 | | |
| Total return (b) | | | 13.14 | % | | | (1.79 | )% | | | 4.47 | % | | | 8.57 | %(c)(d) | | | 3.24 | %(c) | |
| Ratios to Average Net Assets/Supplemental Data: | |
| Net expenses (e) | | | 0.99 | % | | | 0.98 | % | | | 0.95 | % | | | 0.95 | % | | | 0.99 | % | |
| Waiver/Reimbursement | | | — | | | | — | | | | — | | | | 0.01 | % | | | 0.01 | % | |
| Net investment income (e) | | | 5.09 | % | | | 5.46 | % | | | 5.24 | % | | | 5.49 | % | | | 5.56 | % | |
| Portfolio turnover rate | | | 50 | % | | | 43 | % | | | 41 | % | | | 49 | % | | | 56 | % | |
| Net assets, end of period (000s) | | $ | 1,013,941 | | | $ | 913,087 | | | $ | 865,282 | | | $ | 835,878 | | | $ | 703,746 | | |
(a) Per share data was calculated using the average shares outstanding during the period.
(b) Total return at net asset value assuming all distributions reinvested and no initial sales charge or contingent deferred sales charge.
(c) Had the investment advisor and/or any of its affiliates not waived fees or reimbursed a portion of expenses, total return would have been reduced.
(d) Total return includes a voluntary reimbursement by the investment advisor for a realized investment loss due to a trading error. This reimbursement increased total return and net asset value per share by less than 0.01% and less than $0.01, respectively.
(e) The benefits derived from expense reductions had an impact of less than 0.01%.
See Accompanying Notes to Financial Statements.
32
Financial Highlights – Columbia Strategic Income Fund
Selected data for a share outstanding throughout each period is as follows:
| | | Year Ended May 31, | |
| Class B Shares | | 2010 | | 2009 | | 2008 | | 2007 | | 2006 | |
| Net Asset Value, Beginning of Period | | $ | 5.40 | | | $ | 5.91 | | | $ | 6.00 | | | $ | 5.88 | | | $ | 6.15 | | |
| Income from Investment Operations: | |
| Net investment income (a) | | | 0.25 | | | | 0.25 | | | | 0.27 | | | | 0.28 | | | | 0.29 | | |
Net realized and unrealized gain (loss) on investments,
foreign currency, futures contracts and credit default
swap contracts | | | 0.41 | | | | (0.41 | ) | | | (0.05 | ) | | | 0.16 | | | | (0.14 | ) | |
| Total from investment operations | | | 0.66 | | | | (0.16 | ) | | | 0.22 | | | | 0.44 | | | | 0.15 | | |
| Less Distributions to Shareholders: | |
| From net investment income | | | (0.22 | ) | | | (0.34 | ) | | | (0.31 | ) | | | (0.32 | ) | | | (0.42 | ) | |
| From return of capital | | | — | | | | (0.01 | ) | | | — | | | | — | | | | — | | |
| Total distributions to shareholders | | | (0.22 | ) | | | (0.35 | ) | | | (0.31 | ) | | | (0.32 | ) | | | (0.42 | ) | |
| Net Asset Value, End of Period | | $ | 5.84 | | | $ | 5.40 | | | $ | 5.91 | | | $ | 6.00 | | | $ | 5.88 | | |
| Total return (b) | | | 12.30 | % | | | (2.52 | )% | | | 3.86 | % | | | 7.59 | %(c)(d) | | | 2.48 | %(c) | |
| Ratios to Average Net Assets/Supplemental Data: | |
| Net expenses (e) | | | 1.74 | % | | | 1.73 | % | | | 1.70 | % | | | 1.70 | % | | | 1.74 | % | |
| Waiver/Reimbursement | | | — | | | | — | | | | — | | | | 0.01 | % | | | 0.01 | % | |
| Net investment income (e) | | | 4.43 | % | | | 4.71 | % | | | 4.50 | % | | | 4.75 | % | | | 4.82 | % | |
| Portfolio turnover rate | | | 50 | % | | | 43 | % | | | 41 | % | | | 49 | % | | | 56 | % | |
| Net assets, end of period (000s) | | $ | 91,784 | | | $ | 122,915 | | | $ | 169,001 | | | $ | 217,270 | | | $ | 295,983 | | |
(a) Per share data was calculated using the average shares outstanding during the period.
(b) Total return at net asset value assuming all distributions reinvested and no contingent deferred sales charge.
(c) Had the investment advisor and/or any of its affiliates not waived fees or reimbursed a portion of expenses, total return would have been reduced.
(d) Total return includes a voluntary reimbursement by the investment advisor for a realized investment loss due to a trading error. This reimbursement increased total return and net asset value per share by less than 0.01% and less than $0.01, respectively.
(e) The benefits derived from expense reductions had an impact of less than 0.01%.
See Accompanying Notes to Financial Statements.
33
Financial Highlights – Columbia Strategic Income Fund
Selected data for a share outstanding throughout each period is as follows:
| | | Year Ended May 31, | |
| Class C Shares | | 2010 | | 2009 | | 2008 | | 2007 | | 2006 | |
| Net Asset Value, Beginning of Period | | $ | 5.41 | | | $ | 5.91 | | | $ | 6.01 | | | $ | 5.89 | | | $ | 6.15 | | |
| Income from Investment Operations: | |
| Net investment income (a) | | | 0.26 | | | | 0.26 | | | | 0.28 | | | | 0.29 | | | | 0.30 | | |
Net realized and unrealized gain (loss) on investments,
foreign currency, futures contracts and credit default
swap contracts | | | 0.40 | | | | (0.41 | ) | | | (0.06 | ) | | | 0.15 | | | | (0.13 | ) | |
| Total from investment operations | | | 0.66 | | | | (0.15 | ) | | | 0.22 | | | | 0.44 | | | | 0.17 | | |
| Less Distributions to Shareholders: | |
| From net investment income | | | (0.23 | ) | | | (0.34 | ) | | | (0.32 | ) | | | (0.32 | ) | | | (0.43 | ) | |
| From return of capital | | | — | | | | (0.01 | ) | | | — | | | | — | | | | — | | |
| Total distributions to shareholders | | | (0.23 | ) | | | (0.35 | ) | | | (0.32 | ) | | | (0.32 | ) | | | (0.43 | ) | |
| Net Asset Value, End of Period | | $ | 5.84 | | | $ | 5.41 | | | $ | 5.91 | | | $ | 6.01 | | | $ | 5.89 | | |
| Total return (b)(c) | | | 12.26 | % | | | (2.21 | )% | | | 3.84 | % | | | 7.74 | %(d) | | | 2.79 | % | |
| Ratios to Average Net Assets/Supplemental Data: | |
| Net expenses (e) | | | 1.59 | % | | | 1.58 | % | | | 1.55 | % | | | 1.55 | % | | | 1.59 | % | |
| Waiver/Reimbursement | | | 0.15 | % | | | 0.15 | % | | | 0.15 | % | | | 0.16 | % | | | 0.16 | % | |
| Net investment income (e) | | | 4.47 | % | | | 4.85 | % | | | 4.63 | % | | | 4.89 | % | | | 4.95 | % | |
| Portfolio turnover rate | | | 50 | % | | | 43 | % | | | 41 | % | | | 49 | % | | | 56 | % | |
| Net assets, end of period (000s) | | $ | 196,319 | | | $ | 157,492 | | | $ | 130,420 | | | $ | 106,401 | | | $ | 72,221 | | |
(a) Per share data was calculated using the average shares outstanding during the period.
(b) Total return at net asset value assuming all distributions reinvested and no contingent deferred sales charge.
(c) Had the investment advisor and/or any of its affiliates not waived fees or reimbursed a portion of expenses, total return would have been reduced.
(d) Total return includes a voluntary reimbursement by the investment advisor for a realized investment loss due to a trading error. This reimbursement increased total return and net asset value per share by less than 0.01% and less than $0.01, respectively.
(e) The benefits derived from expense reductions had an impact of less than 0.01%.
See Accompanying Notes to Financial Statements.
34
Financial Highlights – Columbia Strategic Income Fund
Selected data for a share outstanding throughout each period is as follows:
| | | Year Ended May 31, | |
| Class Z Shares | | 2010 | | 2009 | | 2008 | | 2007 | | 2006 | |
| Net Asset Value, Beginning of Period | | $ | 5.35 | | | $ | 5.85 | | | $ | 5.95 | | | $ | 5.83 | | | $ | 6.10 | | |
| Income from Investment Operations: | |
| Net investment income (a) | | | 0.31 | | | | 0.30 | | | | 0.32 | | | | 0.34 | | | | 0.34 | | |
Net realized and unrealized gain (loss) on investments,
foreign currency, futures contracts and credit default
swap contracts | | | 0.39 | | | | (0.40 | ) | | | (0.05 | ) | | | 0.15 | | | | (0.13 | ) | |
| Total from investment operations | | | 0.70 | | | | (0.10 | ) | | | 0.27 | | | | 0.49 | | | | 0.21 | | |
| Less Distributions to Shareholders: | |
| From net investment income | | | (0.27 | ) | | | (0.39 | ) | | | (0.37 | ) | | | (0.37 | ) | | | (0.48 | ) | |
| From return of capital | | | — | | | | (0.01 | ) | | | — | | | | — | | | | — | | |
| Total distributions to shareholders | | | (0.27 | ) | | | (0.40 | ) | | | (0.37 | ) | | | (0.37 | ) | | | (0.48 | ) | |
| Net Asset Value, End of Period | | $ | 5.78 | | | $ | 5.35 | | | $ | 5.85 | | | $ | 5.95 | | | $ | 5.83 | | |
| Total return (b) | | | 13.36 | % | | | (1.38 | )% | | | 4.77 | % | | | 8.73 | %(c)(d) | | | 3.51 | %(c) | |
| Ratios to Average Net Assets/Supplemental Data: | |
| Net expenses (e) | | | 0.74 | % | | | 0.73 | % | | | 0.70 | % | | | 0.71 | % | | | 0.75 | % | |
| Waiver/Reimbursement | | | — | | | | — | | | | — | | | | 0.01 | % | | | 0.01 | % | |
| Net investment income (e) | | | 5.35 | % | | | 5.71 | % | | | 5.47 | % | | | 5.73 | % | | | 5.76 | % | |
| Portfolio turnover rate | | | 50 | % | | | 43 | % | | | 41 | % | | | 49 | % | | | 56 | % | |
| Net assets, end of period (000s) | | $ | 714,358 | | | $ | 704,118 | | | $ | 726,217 | | | $ | 524,975 | | | $ | 308,295 | | |
(a) Per share data was calculated using the average shares outstanding during the period.
(b) Total return at net asset value assuming all distributions reinvested.
(c) Had the investment advisor and/or any of its affiliates not waived fees or reimbursed a portion of expenses, total return would have been reduced.
(d) Total return includes a voluntary reimbursement by the investment advisor for a realized investment loss due to a trading error. This reimbursement increased total return and net asset value per share by less than 0.01% and less than $0.01, respectively.
(e) The benefits derived from expense reductions had an impact of less than 0.01%.
See Accompanying Notes to Financial Statements.
35
Notes to Financial Statements – Columbia Strategic Income Fund
May 31, 2010
Note 1. Organization
Columbia Strategic Income Fund (the "Fund"), a series of Columbia Funds Series Trust I (the "Trust"), is a diversified portfolio. The Trust is registered under the Investment Company Act of 1940, as amended (the "1940 Act"), as an open-end management investment company organized as a Massachusetts business trust.
Investment Objective
The Fund seeks total return, consisting of current income and capital appreciation.
Fund Shares
The Trust may issue an unlimited number of shares, and the Fund offers four classes of shares: Class A, Class B, Class C and Class Z. Each share class has its own expense structure and sales charges, as applicable. The Fund's Class J shares were liquidated as of the close of business on July 27, 2009. Effective June 22, 2009, the Fund no longer accepts investments from new or existing investors in the Fund's Class B shares, except in connection with the reinvestment of any dividend and/or capital gain distributions in Class B shares of the Fund and exchanges by existing Class B shareholders of the other Columbia Funds.
Class A shares are subject to a maximum front-end sales charge of 4.75% based on the amount of initial investment. Class A shares purchased without an initial sales charge in accounts aggregating $1 million to $50 million at the time of purchase are subject to a 1.00% contingent deferred sales charge ("CDSC") if the shares are sold within one year after purchase. Class B shares are subject to a maximum CDSC of 5.00% based upon the holding period after purchase. Class B shares will convert to Class A shares eight years after purchase. Class C shares are subject to a 1.00% CDSC on shares sold within one year after purchase. Class Z shares are offered continuously at net asset value. There are certain restrictions on the purchase of Class Z shares, as described in the Fund's prospectus.
Note 2. Significant Accounting Policies
The preparation of financial statements in accordance with accounting principles generally accepted in the United States of America ("GAAP") requires management to make certain estimates and assumptions that affect the reported amounts of assets and liabilities, the disclosure of contingent assets and liabilities at the date of the financial statements and the reported amounts of revenue and expenses during the reporting period. Actual results could differ from those estimates.
Management has evaluated the events and transactions that have occurred through the date the financial statements were issued and noted no items requiring adjustment of the financial statements or additional disclosures.
The following is a summary of significant accounting policies consistently followed by the Fund in the preparation of its financial statements.
Security Valuation
Debt securities generally are valued by pricing services approved by the Trust's Board of Trustees, based upon market transactions for normal, institutional-size trading units of similar securities. The services may use various pricing techniques which take into account appropriate factors such as yield, quality, coupon rate, maturity, type of issue, trading characteristics and other data, as well as broker quotes. Debt securities for which quotations are readily available may also be valued based upon an over-the-counter or exchange bid quotation.
Certain debt securities, which tend to be more thinly traded and of lesser quality, are priced based on fundamental analysis of the financial condition of the issuer and the estimated value of any collateral. Valuations developed through pricing techniques may vary from the actual amounts realized upon sale of the securities, and the potential variation may be greater for those securities valued using fundamental analysis.
Short-term investments maturing in 60 days or less are valued at amortized cost, which approximates market value.
Futures contracts are valued at the settlement price established each day by the board of trade or exchange on which they are traded.
Forward foreign currency exchange contracts are valued at the prevailing forward exchange rate of the underlying currencies.
Credit default swap contracts are marked to market daily based upon spread quotations from market makers.
36
Columbia Strategic Income Fund, May 31, 2010
Foreign securities are generally valued at the last sale price on the foreign exchange or market on which they trade. If any foreign share prices are not readily available as a result of limited share activity, the securities are valued at the last sale price of the local shares in the principal market in which such securities are normally traded.
Generally, trading in foreign securities is substantially completed each day at various times prior to the close of the New York Stock Exchange ("NYSE"). The values of such securities used in computing the net asset value of the Fund's shares are determined as of such times. Foreign currency exchange rates are generally determined at 4:00 p.m. Eastern (U.S.) time. Occasionally, events affecting the values of such foreign securities may occur between the times at which they are determined and the close of the customary trading session of the NYSE, which would not be reflected in the computation of the Fund's net asset value. If events materially affecting the values of such foreign securities occur and it is determined that market quotations are not reliable, then these foreign securities will be valued at their fair value using procedures approved by the Board of Trustees.
Investments for which market quotations are not readily available, or that have quotations which management believes are not reliable, are valued at fair value as determined in good faith under consistently applied procedures established by and under the general supervision of the Board of Trustees. If a security is valued at fair value, such value is likely to be different from the last quoted market price for the security. The determination of fair value often requires significant judgment. To determine fair value, management may use assumptions including but not limited to future cash flows and estimated risk premiums. Multiple inputs from various sources may be used to determine value.
GAAP establishes a hierarchy that prioritizes the inputs to valuation techniques used to measure fair value giving the highest priority to unadjusted quoted prices in active markets for identical securities (level 1 measurements) and the lowest priority to unobservable inputs (level 3 measurements) when market prices are not readily available or reliable. The three levels of the fair value hierarchy are described below:
• Level 1 – quoted prices in active markets for identical securities
• Level 2 – prices determined using other significant observable inputs (including quoted prices for similar securities, interest rates, prepayment speeds, credit risk and others)
• Level 3 – prices determined using significant unobservable inputs. In situations where quoted prices or observable inputs are unavailable or less reliable, unobservable inputs may be used. Unobservable inputs may include management's own assumptions about the factors market participants would use in pricing an investment.
The inputs or methodology used for valuing securities are not necessarily an indication of the risk associated with investing in those securities.
On January 21, 2010, the Financial Accounting Standards Board issued an Accounting Standards Update (the "amendment"), Fair Value Measurements and Disclosures (Topic 820): Improving Disclosures about Fair Value Measurements, which provides guidance on how investment assets and liabilities are to be valued and disclosed. Specifically, the amendment requires reporting entities to disclose the input and valuation techniques used to measure fair value for both recurring and nonrecurring fair value measurements for Level 2 or Level 3 positions. The amendment also requires that transfers between all levels (including Level 1 and Level 2) be disclosed on a gross basis (i.e., transfers out must be disclosed separately from transfers in), and requires disclosure of the reason(s) for the tr ansfer. Additionally purchases, sales, issuances and settlements must be disclosed on a gross basis in the Level 3 rollforward. The effective date of the amendment is for interim and annual periods beginning after December 15, 2009; except for the requirement to provide the Level 3 activity for purchases, sales, issuances and settlements on a gross basis, which will be effective for interim and annual periods beginning after December 15, 2010. At this time, management is evaluating the implications of the amendment and the impact to the financial statements.
Security Transactions
Security transactions are accounted for on the trade date. Cost is determined and gains (losses) are based upon the specific identification method for both financial statement and federal income tax purposes.
37
Columbia Strategic Income Fund, May 31, 2010
Derivative Instruments
The Fund may invest in derivative instruments. For additional information on derivative instruments, please see Note 6.
Repurchase Agreements
The Fund may engage in repurchase agreement transactions with institutions that management has determined are creditworthy. The Fund, through its custodian, receives delivery of the underlying securities collateralizing a repurchase agreement. Management is responsible for determining that the collateral is at least equal, at all times, to the value of the repurchase obligation including interest. A repurchase agreement transaction involves certain risks in the event of default or insolvency of the counterparty. These risks include possible delays in or restrictions on the Fund's ability to dispose of the underlying securities and a possible decline in the value of the underlying securities during the period while the Fund seeks to assert its rights.
Loan Participations and Commitments
The Fund may invest in loan participations. When the Fund purchases a loan participation, the Fund typically enters into a contractual relationship with the lender or third party selling such participation ("Selling Participant"), but not the borrower. However, the Fund assumes the credit risk of the borrower, Selling Participant and any other persons interpositioned between the Fund and the borrower. The Fund may not directly benefit from the collateral supporting the senior loan which it has purchased from the Selling Participant.
Delayed Delivery Securities
The Fund may trade securities on other than normal settlement terms, including securities purchased or sold on a "when-issued" basis. This may increase the risk if the other party to the transaction fails to deliver and causes the Fund to subsequently invest at less advantageous prices. The Fund identifies within its portfolio of investments cash or liquid securities in an amount equal to the delayed delivery commitment.
Stripped Securities
Stripped mortgage-backed securities are derivative multi-class mortgage securities structured so that one class receives most, if not all, of the principal from the underlying mortgage assets (Principal Only Securities ("PO security")), while the other class receives most, if not all, of the interest and the remainder of the principal (Interest Only Securities ("IO security")). If the underlying mortgage assets experience greater than anticipated prepayments of principal, the Fund may fail to fully recoup its initial investment in an IO security, therefore the daily interest accrual factor is adjusted each month to reflect the paydown of principal. The market value of these securities can be extremely volatile in response to changes in interest rates. Credit risk reflects the risk that the Fund may not receive all or part of its principal because the issuer or credit enhancer has defaulted on its obligation.
Foreign Currency Transactions and Translations
The values of all assets and liabilities quoted in foreign currencies are translated into U.S. dollars at that day's exchange rates. Net realized and unrealized gains (losses) on foreign currency transactions and translations include gains (losses) arising from the fluctuation in exchange rates between trade and settlement dates on securities transactions, gains (losses) arising from the disposition of foreign currency and currency gains (losses) between the accrual and payment dates on dividends, interest income and foreign withholding taxes.
For financial statement purposes, the Fund does not distinguish that portion of gains (losses) on investments which is due to changes in foreign exchange rates from that which is due to changes in market prices of the investments. Such fluctuations are included with the net realized and unrealized gains (losses) on investments on the Statement of Operations.
Income Recognition
Interest income is recorded on the accrual basis. Premium and discount are amortized and accreted, respectively, on all debt securities, unless otherwise noted.
The value of additional securities received as an income payment is recorded as income and as the cost basis of such securities.
38
Columbia Strategic Income Fund, May 31, 2010
Expenses
General expenses of the Trust are allocated to the Fund and other series of the Trust based upon relative net assets or other expense allocation methodologies determined by the nature of the expense. Expenses directly attributable to the Fund are charged to the Fund.
Determination of Class Net Asset Value
All income, expenses (other than class-specific expenses, as shown on the Statement of Operations) and realized and unrealized gains (losses) are allocated to each class of the Fund on a daily basis for purposes of determining the net asset value of each class. Income and expenses are allocated to each class based on the settled shares method, while realized and unrealized gains (losses) are allocated based on the relative net assets of each class.
Federal Income Tax Status
The Fund intends to qualify each year as a "regulated investment company" under Subchapter M of the Internal Revenue Code, as amended, and will distribute substantially all of its tax exempt or taxable income, if any, for its tax year, and as such will not be subject to federal income taxes. In addition, the Fund intends to distribute in each calendar year substantially all of its net investment income, capital gains and certain other amounts, if any, such that the Fund should not be subject to federal excise tax. Therefore, no federal income or excise tax provision is recorded.
Distributions to Shareholders
Distributions from net investment income are declared and paid monthly. Net realized capital gains, if any, are distributed at least annually. Income distributions and capital gain distributions are determined in accordance with federal income tax regulations which may differ from GAAP.
Indemnification
In the normal course of business, the Fund enters into contracts that contain a variety of representations and warranties and which provide general indemnities. The Fund's maximum exposure under these arrangements is unknown because this would involve future claims against the Fund. Also, under the Trust's organizational documents and by contract, the Trustees and officers of the Trust are indemnified against certain liabilities that may arise out of actions relating to their duties to the Trust. However, based on experience, the Fund expects the risk of loss due to these representations, warranties and indemnities to be minimal.
Note 3. Federal Tax Information
The timing and character of income and capital gain distributions are determined in accordance with income tax regulations, which may differ from GAAP. Reclassifications are made to the Fund's capital accounts for permanent tax differences to reflect income and gains available for distribution (or available capital loss carryforwards) under income tax regulations.
For the year ended May 31, 2010, permanent book and tax basis differences resulting primarily from differing treatments for discount accretion/premium amortization on debt securities, Section 988 bond bifurcation, expired capital loss carryforwards, defaulted bond sales, paydown reclasses and market discount adjustments were identified and reclassified among the components of the Fund's net assets as follows:
Overdistributed
Net Investment
Income | | Accumulated
Net Realized
Loss | | Paid-In Capital | |
| $ | 36,450,662 | | | $ | 101,836,403 | | | $ | (138,287,065 | ) | |
Net investment income and net realized gains (losses), as disclosed on the Statement of Operations, and net assets were not affected by this reclassification.
The tax character of distributions paid during the years ended May 31, 2010 and May 31, 2009 was as follows:
| | | May 31, | |
| Distributions paid from: | | 2010 | | 2009 | |
| Ordinary Income* | | $ | 93,588,069 | | | $ | 128,306,030 | | |
| Tax Return of Capital | | | — | | | | 1,580,036 | | |
* For tax purposes short-term capital gain distributions, if any, are considered ordinary income distributions.
39
Columbia Strategic Income Fund, May 31, 2010
As of May 31, 2010, the components of distributable earnings on a tax basis were as follows:
Undistributed
Ordinary
Income | | Undistributed
Long-Term
Capital Gains | | Net
Unrealized
Appreciation* | |
| $ | 27,100,883 | | | $ | — | | | $ | 56,748,525 | | |
* The differences between book-basis and tax-basis net unrealized appreciation/depreciation are primarily due to deferral of losses from wash sales and discount accretion/premium amortization on debt securities.
Unrealized appreciation and depreciation at May 31, 2010, based on cost of investments for federal income tax purposes were:
| Unrealized appreciation | | $ | 98,489,886 | | |
| Unrealized depreciation | | | (41,741,361 | ) | |
| Net unrealized appreciation | | $ | 56,748,525 | | |
The following capital loss carryforwards may be available to reduce taxable income arising from future net realized gains on investments, if any, to the extent permitted by the Internal Revenue Code:
| Year of Expiration | | Capital Loss
Carryforwards | |
| 2011 | | $ | 318,608 | | |
| 2013 | | | 234,018 | | |
| 2014 | | | 8,752,148 | | |
| 2015 | | | 703,478 | | |
| 2016 | | | 3,552,128 | | |
| 2017 | | | 44,798,651 | | |
| 2018 | | | 63,620,367 | | |
| Total | | $ | 121,979,398 | | |
Capital loss carryforwards of $138,626,928 expired during the year ended May 31, 2010.
Under current tax rules, certain currency and capital losses realized after October 31 may be deferred and treated as occurring on the first day of the following fiscal year. As of May 31, 2010, post-October capital losses of $7,649,372 attributed to security transactions were deferred to June 1, 2010.
Management is required to determine whether a tax position of the Fund is more likely than not to be sustained upon examination by the applicable taxing authority, including resolution of any related appeals or litigation processes, based on the technical merits of the position. The tax benefit to be recognized by the Fund is measured as the largest amount of benefit that is greater than fifty percent likely of being realized upon ultimate settlement. Management is not aware of any tax positions for which it is reasonably possible that the total amounts of unrecognized tax benefits will significantly change in the next twelve months. However, management's conclusions may be subject to review and adjustment at a later date based on factors including, but not limited to, new tax laws, regulations, and administrative interpretations (including relevant court decisions). The Fund's federal tax returns for the prior three fiscal year s remain subject to examination by the Internal Revenue Service.
Note 4. Fees and Compensation Paid to Affiliates
Investment Advisory Fee
After the close of business on April 30, 2010, Ameriprise Financial, Inc. ("Ameriprise Financial") acquired a portion of the asset management business of Columbia Management Group, LLC (the "Transaction"), including the business of managing the Fund. In connection with the closing of the Transaction (the "Closing"), RiverSource Investments, LLC, a wholly owned subsidiary of Ameriprise Financial, became the investment advisor of the Fund and subsequently changed its name to Columbia Management Investment Advisers, LLC (the "New Advisor"). The New Advisor receives a monthly investment advisory fee based on the Fund's average daily net assets at the following annual rates:
| Average Daily Net Assets | | Annual Fee Rate | |
| First $500 million | | | 0.60 | % | |
| $500 million to $1 billion | | | 0.55 | % | |
| $1 billion to $1.5 billion | | | 0.52 | % | |
| Over $1.5 billion | | | 0.49 | % | |
Prior to the Closing, Columbia Management Advisors, LLC ("Columbia"), an indirect, wholly owned subsidiary of Bank of
40
Columbia Strategic Income Fund, May 31, 2010
America Corporation ("BOA"), provided investment advisory services to the Fund under the same fee structure.
For the year ended May 31, 2010, the Fund's effective investment advisory fee rate was 0.54% of the Fund's average daily net assets.
Administration Fee
Effective upon the Closing, the New Advisor became the administrator of the Fund under a new Administrative Services Agreement (the "Administrative Agreement"). Under the Administrative Agreement, the New Advisor provides administrative and other services to the Fund, including services previously performed under the Pricing and Bookkeeping Oversight and Services Agreement discussed below. The New Advisor does not receive a fee for its services under the Administrative Agreement.
Pricing and Bookkeeping Fees
Prior to the Closing, the Fund entered into a Financial Reporting Services Agreement (the "Financial Reporting Services Agreement") with State Street Bank and Trust Company ("State Street") and Columbia pursuant to which State Street provides financial reporting services to the Fund. The Fund also entered into an Accounting Services Agreement (collectively with the Financial Reporting Services Agreement, the "State Street Agreements") with State Street and Columbia pursuant to which State Street provides accounting services to the Fund. Upon the Closing, Columbia assigned and delegated its rights and obligations under the State Street Agreements to the New Advisor. Under the State Street Agreements, the Fund pays State Street an annual fee of $38,000 paid monthly plus an additional monthly fee based on an annualized percentage rate of average daily net assets of the Fund for the month. The aggregate fee will not exceed $140,000 per year (exclusive of out-of-pocket expenses and charges). The Fund also reimburses State Street for certain out-of-pocket expenses and charges.
Also prior to the Closing, the Fund entered into a Pricing and Bookkeeping Oversight and Services Agreement (the "Services Agreement") with Columbia. Under the Services Agreement, Columbia provided services related to Fund expenses and the requirements of the Sarbanes-Oxley Act of 2002, and provided oversight of the accounting and financial reporting services provided by State Street. Under the Services Agreement, the Fund reimbursed Columbia for out-of-pocket expenses. The Services Agreement was terminated upon the Closing. These services are now provided under the Administrative Agreement discussed above.
Transfer Agent Fee
In connection with the Closing, RiverSource Service Corporation, a wholly owned subsidiary of Ameriprise Financial, became the transfer agent of the Fund and subsequently changed its name to Columbia Management Investment Services Corp. (the "New Transfer Agent"). The transfer agent fee rates paid by the Fund did not change as a result of the change in transfer agent.
Prior to the Closing, Columbia Management Services, Inc. (the "Former Transfer Agent"), an affiliate of Columbia and an indirect, wholly owned subsidiary of BOA, provided shareholder services to the Fund and contracted with Boston Financial Data Services ("BFDS") to serve as sub-transfer agent. The Former Transfer Agent was entitled to receive a fee for its services, paid monthly, at the annual rate of $22.36 per account plus reimbursement of certain sub-transfer agent fees paid by the Former Transfer Agent (exclusive of BFDS fees), calculated based on assets held in omnibus accounts and intended to recover the cost of payments to other parties (including affiliates of BOA) for services to those accounts. Prior to November 1, 2009, the annual rate was $17.34 per account. The Former Transfer Agent paid the fees of BFDS for services as sub-transfer agent and was not entitled to reimbursement for such fees from the Fund. The arrang ement with BFDS has been continued by the New Transfer Agent.
The Former Transfer Agent retained, as additional compensation for its services, fees for wire, telephone and redemption orders, Individual Retirement Account ("IRA") trustee agent fees and account transcript fees due to the Former Transfer Agent from shareholders of the Fund and credits (net of bank charges) earned with respect to balances in accounts the Former Transfer Agent maintained in connection with its services to the Fund. The Former Transfer Agent also received reimbursement for certain out-of-pocket expenses.
An annual minimum account balance fee of $20 may apply to certain accounts with a value below the Fund's initial minimum investment requirements to reduce the impact of small accounts on transfer agent fees. These minimum
41
Columbia Strategic Income Fund, May 31, 2010
account balance fees are recorded as part of expense reductions on the Statement of Operations. For the year ended May 31, 2010, no minimum account balance fees were charged.
Underwriting Discounts, Service and Distribution Fees
In connection with the Closing, RiverSource Fund Distributors, Inc., an indirect wholly owned subsidiary of Ameriprise Financial, became the distributor of the Fund and subsequently changed its name to Columbia Management Investment Distributors, Inc. (the "New Distributor"). Prior to the Closing, Columbia Management Distributors, Inc. (the "Former Distributor"), an affiliate of Columbia and an indirect, wholly owned subsidiary of BOA, was the principal underwriter of the Fund's shares. There were no changes to the underwriting discount structure of the Fund or the service or distribution fee rates paid by the Fund as a result of the Transaction.
For the year ended May 31, 2010, the New Distributor and Former Distributor retained net underwriting discounts of $166,580 on sales of the Fund's Class A shares and received net CDSC fees of $45,525, $112,534 and $55,451 on Class A, Class B and Class C share redemptions, respectively.
The Fund has adopted distribution and shareholder servicing plans (the "Plans") pursuant to Rule 12b-1 under the 1940 Act, which require the payment of distribution and service fees. The fees are intended to compensate the New Distributor and/or eligible selling and/or servicing agents for selling shares of the Fund and providing services to investors. The service fee is equal to 0.15% annually of the average daily net assets attributable to outstanding Class A and Class B shares of the Fund issued prior to January 1, 1993 and 0.25% annually of the average daily net assets attributable to outstanding Class A, Class B, and Class C shares issued thereafter. This arrangement results in an annual rate of service fee for shares that is a blend between the 0.15% and 0.25% rates. Prior to July 27, 2009, the service fee was equal to 0.15% annually of the average daily net assets attributable to outstanding Class A and Class B shares of the Fund issued prior to January 1, 1993 and 0.25% annually of the average daily net assets attributable to outstanding Class A, Class B, Class C and Class J shares issued thereafter. For the year ended May 31, 2010, the Fund's effective service fee rate was 0.25% of the Fund's average daily net assets attributable to Class A, Class B and Class C shares.
The Plans also require the payment of a monthly distribution fee to the New Distributor equal to 0.75% annually of the average daily net assets attributable to Class B and Class C shares. Prior to July 27, 2009, the Plans also required the payment of a monthly distribution fee equal to 0.35% annually of the average daily net assets attributable to Class J shares. The Former Distributor voluntarily waived a portion of the distribution fee for Class C shares so that the combined distribution and service fees did not exceed 0.85% annually of Class C shares average daily net assets. This arrangement has been continued by the New Distributor and may be modified or terminated by the New Distributor at any time.
Fee Waivers and Expense Reimbursements
In connection with the Closing, the New Advisor has voluntarily agreed to reimburse a portion of the Fund's expenses so that the Fund's ordinary operating expenses (excluding any distribution and service fees, brokerage commissions, interest, taxes and extraordinary expenses, but including custodian charges relating to overdrafts, if any), after giving effect to any balance credits from the Fund's custodian, do not exceed 0.80% of the Fund's average daily net assets on an annualized basis. The New Advisor, in its discretion, may revise or discontinue this arrangement any time. Prior to the Closing, Columbia voluntarily reimbursed a portion of the Fund's expenses in the same manner.
Fees Paid to Officers and Trustees
As of May 1, 2010, all officers of the Fund are employees of the New Advisor or its affiliates and, with the exception of the Fund's Chief Compliance Officer, receive no compensation from the Fund. The Board of Trustees has appointed a Chief Compliance Officer to the Fund in accordance with federal securities regulations. The Fund, along with other affiliated funds, pays its pro-rata share of the expenses associated with the Chief Compliance Officer. The Fund's expenses for the Chief Compliance Officer will not exceed $15,000 per year.
Trustees are compensated for their services to the Fund, as set forth on the Statement of Operations. The Trust's eligible Trustees may participate in a deferred compensation plan which may be terminated at any time. Obligations of the plan will be paid solely out of the Fund's assets.
42
Columbia Strategic Income Fund, May 31, 2010
Note 5. Custody Credits
The Fund has an agreement with its custodian bank under which custody fees may be reduced by balance credits. These credits are recorded as part of expense reductions on the Statement of Operations. The Fund could have invested a portion of the assets utilized in connection with the expense offset arrangement in an income-producing asset if it had not entered into such an agreement. For the year ended May 31, 2010, these custody credits reduced total expenses by $292 for the Fund.
Note 6. Objectives and Strategies for Investing in Derivative Instruments
The Fund uses derivatives instruments including credit default swaps and forward foreign currency contracts in order to meet its investment objectives. The Fund employs strategies in differing combinations to permit it to increase, decrease or change the level of exposure to market risk factors. The achievement of any strategy relating to derivatives depends on an analysis of various risk factors, and if the strategies for the use of derivatives do not work as intended, the Fund may not achieve its investment objectives.
In pursuit of its investment objectives, the Fund is exposed to the following market risks:
Credit Risk: Credit risk relates to the ability of the issuer or guarantor of a fixed income security, or counter party to a derivative contract to make timely principal and/or interest payments, or to otherwise honor its obligations. Securities are subject to varying degrees of credit risk, which are often reflected in credit ratings. Generally, lower-yield higher-quality bonds are subject to credit risk to a lesser extent than lower-grade higher-yield bonds.
Foreign Exchange Rate Risk: Foreign exchange rate risk relates to the change in the U.S. dollar value of a security held that is denominated in a foreign currency. The U.S. dollar value of a foreign-currency-denominated security will decrease as the dollar appreciates against the currency, while the U.S. dollar value will increase as the dollar depreciates against the currency.
The following notes provide more detailed information about each derivative type held by the Fund:
Forward Foreign Currency Exchange Contracts—The Fund entered into forward foreign currency exchange contracts for the purpose of shifting foreign currency exposure back to U.S. dollars.
Forward foreign currency exchange contracts are agreements to exchange one currency for another at a future date at a specified price. These contracts are used to minimize the exposure to foreign exchange rate fluctuations during the period between the trade and settlement dates of the contract. The Fund may utilize forward foreign currency exchange contracts in connection with the settlement of purchases and sales of securities. The Fund may also enter into these contracts to reduce the exposure to adverse price movements in certain other foreign-currency-denominated assets. Contracts to buy generally are used to acquire exposure to foreign currencies, while contracts to sell are generally used to reduce the exposure to foreign exchange rate fluctuations. Forward foreign currency exchange contracts are valued daily at the current exchange rate of the underlying currency, resulting in unrealized gains (losses) which become reali zed at the time the forward foreign currency exchange contracts are closed or mature. Realized and unrealized gains (losses) arising from such transactions are included in net realized and unrealized gains (losses) on foreign currency transactions. The use of forward foreign currency exchange contracts does not eliminate fluctuations in the prices of the Fund's portfolio securities. While the maximum potential loss from such contracts is the aggregate face value in U.S. dollars at the time the contract was opened, exposure is typically limited to the change in value of the contract (in U.S. dollars) over the period it remains open. The Fund could also be exposed to risk that counterparties of the contracts may be unable to fulfill the terms of the contracts.
During the year ended May 31, 2010, the Fund entered into 222 forward foreign currency exchange contracts.
Credit Default Swaps—The Fund entered into credit default swap transactions as a protection buyer to reduce credit exposure to a given issuer or issuers.
Credit default swaps are agreements in which one party pays fixed periodic payments to a counterparty in consideration for a guarantee from the counterparty to make a specific payment should a negative credit event take place. The Fund may receive or make an upfront payment as the protection buyer or seller. Credit default swaps are marked to market daily based on quotations from market makers and any change is recorded as unrealized appreciation/depreciation on the
43
Columbia Strategic Income Fund, May 31, 2010
Statement of Assets and Liabilities. Periodic payments received or made are recorded as a realized gain or loss and premiums received or made are amortized on the Statement of Operations.
If the Fund is a buyer of protection and a credit event occurs, as defined under the terms of that particular swap agreement, the Fund will either (i) receive from the seller of protection an amount equal to the notional amount of the swap and deliver the referenced obligation or underlying securities comprising the referenced index or (ii) receive a net settlement amount in the form of cash or securities equal to the notional amount of the swap less the recovery value of the referenced obligation or underlying securities comprising the referenced index.
If the Fund is a seller of protection and a credit event occurs, as defined under the terms of that particular swap agreement, the Fund will either (i) pay to the buyer of protection an amount equal to the notional amount of the swap and take delivery of the referenced obligation or underlying securities comprising the referenced index or (ii) pay a net settlement amount in the form of cash or securities equal to the notional amount of the swap less the recovery value of the referenced obligation or underlying securities comprising the referenced index.
Credit default swap agreements involve greater risks than if the Fund had invested in the reference obligation directly since, in addition to general market risks, credit default swaps are subject to illiquidity risk, counterparty risk and credit risk.
During the year ended May 31, 2010, the Fund purchased credit default swaps with a notional amount of $10,000,000.
The following table is a summary of the value of the Fund's derivative instruments as of May 31, 2010.
Fair Value of Derivative Instruments
Statement of Assets and Liabilities | |
| Asset | | Fair Value | | Liability | | Fair Value | |
Unrealized appreciation on
forward foreign currency
exchange contracts | |
$1,263,782 | | Unrealized depreciation on
forward foreign currency
exchange contracts | |
$(487,353) | |
| Open credit default swaps | | — | | Open credit default swaps | | (108,242) | |
The effect of derivative instruments on the Fund's Statement of Operations for the year ended May 31, 2010:
| Appreciation or (Depreciation) on Derivatives Recognized in Income | | Amount of Realized Gain or (Loss) and Change in Unrealized | |
| | | Risk Exposure | | Net Realized Gain (Loss) | | Change in Unrealized
Appreciation (Depreciation) | |
Forward Foreign Currency
Exchange Contracts | | Foreign Exchange
Rate Risk | | $ | (948,971 | ) | | $ | 6,733,935 | | |
| Credit Default Swap Contracts | | Credit Risk | | | (98,000 | ) | | | (108,242 | ) | |
Note 7. Portfolio Information
For the year ended May 31, 2010, the cost of purchases and proceeds from sales of securities, excluding short-term obligations, for the Fund were $979,449,669 and $998,094,514, respectively, of which $18,450,746 and $94,565,283, respectively, were U.S. Government securities.
44
Columbia Strategic Income Fund, May 31, 2010
Note 8. Line of Credit
The Fund and other affiliated funds participate in a $280,000,000 committed, unsecured revolving line of credit provided by State Street. The maximum amount that may be borrowed by any fund is limited to the lesser of $200,000,000 and the Fund's borrowing limit set forth in the Fund's registration statement. Borrowings are available for short-term liquidity or temporary or emergency purposes.
Effective October 15, 2009, interest is charged to each participating fund based on the fund's borrowings at a rate per annum equal to the greater of the Federal Funds Rate plus 1.25% or the overnight LIBOR Rate plus 1.25%. In addition, a commitment fee of 0.15% per annum is accrued and apportioned among the participating funds pro rata based on their relative net assets.
Prior to October 15, 2009, interest was charged to each participating fund based on the fund's borrowings at a rate per annum equal to the greater of the Federal Funds Rate plus 0.50% or the overnight LIBOR Rate plus 0.50%. In addition, an annual operations agency fee of $20,000, an amendment fee of 0.02% and a commitment fee of 0.12% per annum were accrued and apportioned among the participating funds pro rata based on their relative net assets.
For the year ended May 31, 2010, the Fund did not borrow under these arrangements.
Note 9. Securities Lending
The Fund may lend its securities to certain approved brokers, dealers and other financial institutions. Each loan is collateralized by cash, in an amount at least equal to the market value of the securities loaned plus accrued income from the investment of collateral. The market value of the loaned securities is determined at the close of business of the Fund and any additional required collateral is delivered to the Fund on the next business day. The collateral received is invested and the income generated by the investment of the collateral, net of any fees remitted to State Street as the lending agent and borrower rebates, is paid to the Fund. Generally, in the event of borrower default, the Fund has the right to use the collateral to offset any losses incurred. In the event the Fund is delayed or prevented from exercising its right to dispose of the collateral, there may be a potential loss to the Fund. The Fund bears the ri sk of loss with respect to the investment of collateral.
Note 10. Shareholder Concentration
As of May 31, 2010, one shareholder account owned 26.4% of the outstanding shares of the Fund. Purchase and redemption activity of this account may have a significant effect on the operations of the Fund.
Note 11. Significant Risks and Contingencies
Sector Focus Risk
The Fund may focus its investments in certain sectors, subjecting it to greater risk than a fund that is less focused.
High-Yield Securities Risk
Investing in high-yield securities may involve greater credit risk and considerations not typically associated with investing in U.S. Government bonds and other higher quality fixed income securities. These securities are non-investment grade securities, often referred to as "junk" bonds. Economic downturns may disrupt the high yield market and impair the ability of issuers to repay principal and interest. Also, an increase in interest rates would likely have an adverse impact on the value of such obligations. Moreover, high-yield securities may be less liquid to the extent that there is no established secondary market.
Foreign Securities Risk
There are certain additional risks involved when investing in foreign securities. These risks may involve foreign currency exchange rate fluctuations, adverse political and economic developments and the possible prevention of currency exchange or other foreign governmental laws or restrictions. In addition, the liquidity of foreign securities may be more limited than that of domestic securities.
Investments in emerging market countries are subject to additional risk. The risk of foreign investments is typically increased in less developed countries. These countries are also more likely to experience high levels of inflation, deflation or currency devaluation which could hurt their economies and securities markets.
Information Regarding Pending and Settled Legal Proceedings
In June 2004, an action captioned John E. Gallus et al. v. American Express Financial Corp. and American Express Financial Advisors Inc. was filed in the United States District
45
Columbia Strategic Income Fund, May 31, 2010
Court for the District of Arizona. The plaintiffs allege that they are investors in several American Express Company (now known as RiverSource) mutual funds and they purport to bring the action derivatively on behalf of those funds under the Investment Company Act of 1940. The plaintiffs allege that fees allegedly paid to the defendants by the funds for investment advisory and administrative services are excessive. The plaintiffs seek remedies including restitution and rescission of investment advisory and distribution agreements. The plaintiffs voluntarily agreed to transfer this case to the United States District Court for the District of Minnesota (the District Court). In response to defendants' motion to dismiss the complaint, the District Court dismissed one of plaintiffs' four claims and granted plaintiffs limited discovery. Defendants moved for summary judgment in April 2007. Summary judgment was granted in the defendants ' favor on July 9, 2007. The plaintiffs filed a notice of appeal with the Eighth Circuit Court of Appeals (the Eighth Circuit) on August 8, 2007. On April 8, 2009, the Eighth Circuit reversed summary judgment and remanded to the District Court for further proceedings. On August 6, 2009, defendants filed a writ of certiorari with the U.S. Supreme Court (the Supreme Court), asking the Supreme Court to stay the District Court proceedings while the Supreme Court considers and rules in a case captioned Jones v. Harris Associates, which involves issues of law similar to those presented in the Gallus case. On March 30, 2010, the Supreme Court issued its ruling in Jones v. Harris Associates, and on April 5, 2010, the Su preme Court vacated the Eighth Circuit's decision in the Gallus case and remanded the case to the Eighth Circuit for further consideration in light of the Supreme Court's decision in Jones v. Harris Associates. On June 4, 2010, the Eighth Circuit remanded the Gallus case to the District Court for further consideration in light of the Supreme Court's decision in Jones v. Harris Associates.
In December 2005, without admitting or denying the allegations, American Express Financial Corporation (AEFC, which is now known as Ameriprise Financial, Inc. (Ameriprise Financial)), entered into settlement agreements with the Securities and Exchange Commission (SEC) and Minnesota Department of Commerce (MDOC) related to market timing activities. As a result, AEFC was censured and ordered to cease and desist from committing or causing any violations of certain provisions of the Investment Advisers Act of 1940, the Investment Company Act of 1940, and various Minnesota laws. AEFC agreed to pay disgorgement of $10 million and civil money penalties of $7 million. AEFC also agreed to retain an independent distribution consultant to assist in developing a plan for distribution of all disgorgement and civil penalties ordered by the SEC in accordance with various undertakings detailed at http://www.sec.gov/litigation/admin/ia-2451.pdf. Ameriprise Financial and its affiliates have cooperated with the SEC and the MDOC in these legal proceedings, and have made regular reports to the RiverSource Funds' Boards of Directors/Trustees.
Ameriprise Financial and certain of its affiliates have historically been involved in a number of legal, arbitration and regulatory proceedings, including routine litigation, class actions, and governmental actions, concerning matters arising in connection with the conduct of their business activities. Ameriprise Financial believes that the Funds are not currently the subject of, and that neither Ameriprise Financial nor any of its affiliates are the subject of, any pending legal, arbitration or regulatory proceedings that are likely to have a material adverse effect on the Funds or the ability of Ameriprise Financial or its affiliates to perform under their contracts with the Funds. Ameriprise Financial is required to make 10-Q, 10-K and, as necessary, 8-K filings with the Securities and Exchange Commission on legal and regulatory matters that relate to Ameriprise Financial and its affiliates. Copies of these filings may be obt ained by accessing the SEC website at www.sec.gov.
There can be no assurance that these matters, or the adverse publicity associated with them, will not result in increased fund redemptions, reduced sale of fund shares or other adverse consequences to the Funds. Further, although we believe proceedings are not likely to have a material adverse effect on the Funds or the ability of Ameriprise Financial or its affiliates to perform under their contracts with the Funds, these proceedings are subject to uncertainties and, as such, we are unable to estimate the possible loss or range of loss that may result. An adverse outcome in one or more of these proceedings could result in adverse judgments, settlements, fines, penalties or other relief that could have a material adverse effect on the consolidated financial condition or results of operations of Ameriprise Financial.
46
Report of Independent Registered Public Accounting Firm
To the Trustees of Columbia Funds Series Trust I and the Shareholders of Columbia Strategic Income Fund
In our opinion, the accompanying statement of assets and liabilities, including the investment portfolio, and the related statements of operations and of changes in net assets and the financial highlights present fairly, in all material respects, the financial position of Columbia Strategic Income Fund (the "Fund")(a series of Columbia Funds Series Trust I) at May 31, 2010, the results of its operations for the year then ended, the changes in its net assets for each of the two years in the period then ended and the financial highlights for each of the five years in the period then ended, in conformity with accounting principles generally accepted in the United States of America. These financial statements and financial highlights (hereafter referred to as "financial statements") are the responsibility of the Fund's management. Our responsibility is to express an opinion on these financial statements based on our audits. We condu cted our audits of these financial statements in accordance with the standards of the Public Company Accounting Oversight Board (United States). Those standards require that we plan and perform the audit to obtain reasonable assurance about whether the financial statements are free of material misstatement. An audit includes examining, on a test basis, evidence supporting the amounts and disclosures in the financial statements, assessing the accounting principles used and significant estimates made by management, and evaluating the overall financial statement presentation. We believe that our audits, which included confirmation of securities at May 31, 2010 by correspondence with the custodian and brokers, provide a reasonable basis for our opinion.
PricewaterhouseCoopers LLP
Boston, Massachusetts
July 22, 2010
47
Fund Governance – Columbia Strategic Income Fund
The Trustees serve terms of indefinite duration. The names, addresses and birth years of the Trustees and Officers of the Funds in the Columbia Funds Series Trust I, the year each was first elected or appointed to office, their principal business occupations during at least the last five years, the number of Funds overseen by each Trustee and other directorships they hold are shown below. Each officer listed below serves as an officer of each Fund in the Columbia Funds Complex.
Independent Trustees
Name, Address and Year of Birth,
Position with Funds, Year First
Elected or Appointed to Office | | Principal Occupation(s) During Past Five Years, Number of Funds in the Columbia
Funds Complex Overseen by Trustee, Other Directorships Held
| |
| John D. Collins (Born 1938) | |
|
c/o Columbia Management
Investment Advisers, LLC
One Financial Center
Boston, MA 02111
Trustee (since 2005) | | Retired. Consultant, KPMG, LLP (accounting and tax firm) from July 1999 to June 2000; Partner, KPMG, LLP from March 1962 to June 1999. Oversees 64; Mrs. Fields Famous Brands LLC (consumer products); Suburban Propane Partners, L.P.; and Montpelier Re (insurance underwriting firm) | |
|
| Rodman L. Drake (Born 1943) | |
|
c/o Columbia Management
Investment Advisers, LLC
One Financial Center
Boston, MA 02111
Trustee (since 1994) and Chairman of the Board (since 2009) | | Co-Founder of Baringo Capital LLC (private equity) since 2002; CEO of Crystal River Capital, Inc. (real estate investment trust) since 2003; President, Continuation Investments Group, Inc. from 1997 to 2001. Oversees 64; Jackson Hewitt Tax Service Inc. (tax preparation services); Crystal Capital River Inc. (real estate investment trust); Student Loan Corporation (student loan provider); Celgene Corporation (global biotechnology company); and The Helios Funds (exchange-traded funds) | |
|
| Douglas A. Hacker (Born 1955) | |
|
c/o Columbia Management
Investment Advisers, LLC
One Financial Center
Boston, MA 02111
Trustee (since 1996) | | Independent business executive since May 2006; Executive Vice President—Strategy of United Airlines (airline) from December 2002 to May 2006; President of UAL Loyalty Services (airline marketing company) from September 2001 to December 2002; Executive Vice President and Chief Financial Officer of United Airlines from July 1999 to September 2001. Oversees 64; Nash Finch Company (food distributor); Aircastle Limited (aircraft leasing) | |
|
| Janet Langford Kelly (Born 1957) | |
|
c/o Columbia Management
Investment Advisers, LLC
One Financial Center
Boston, MA 02111
Trustee (since 1996) | | Senior Vice President, General Counsel and Corporate Secretary, ConocoPhillips (integrated energy company) since September 2007; Deputy General Counsel—Corporate Legal Services, ConocoPhillips from August 2006 to August 2007; Partner, Zelle, Hofmann, Voelbel, Mason & Gette LLP (law firm) from March 2005 to July 2006; Adjunct Professor of Law, Northwestern University, from September 2004 to June 2006; Director, UAL Corporation (airline) from February 2006 to July 2006; Oversees 64; None | |
|
| Charles R. Nelson (Born 1942) | |
|
c/o Columbia Management
Investment Advisers, LLC
One Financial Center
Boston, MA 02111
Trustee (since 1981) | | Professor of Economics, University of Washington, since January 1976; Ford and Louisa Van Voorhis Professor of Political Economy, University of Washington, since September 1993; Adjunct Professor of Statistics, University of Washington, since September 1980; Associate Editor, Journal of Money Credit and Banking, 1993—2008 Consultant on econometric and statistical matters. Oversees 64; None | |
|
48
Fund Governance (continued)
Independent Trustees (continued)
Name, Address and Year of Birth,
Position with Funds, Year First
Elected or Appointed to Office | | Principal Occupation(s) During Past Five Years, Number of Funds in the Columbia
Funds Complex Overseen by Trustee, Other Directorships Held
| |
| John J. Neuhauser (Born 1943) | |
|
c/o Columbia Management Investment Advisers, LLC
One Financial Center
Boston, MA 02111
Trustee (since 1984) | | President, Saint Michael's College, since August 2007; University Professor, Boston College from November 2005 to August 2007; Academic Vice President and Dean of Faculties, Boston College from August 1999 to October 2005. Oversees 64; Liberty All-Star Equity Fund and Liberty All-Star Growth Fund, Inc. (closed-end funds) | |
|
| Jonathan Piel (Born 1938) | |
|
c/o Columbia Management Investment Advisers, LLC
One Financial Center
Boston, MA 02111
Trustee (since 1994) | | Cable television producer and website designer; The Editor, Scientific American from 1984 to 1994; Vice President, Scientific American, Inc., from 1984 to 1994; Member, Advisory Board, Stone Age Institute, Bloomington, Indiana (research institute that explores the effect of technology on human evolution); Member, Board of Directors of the National Institute of Social Sciences, New York City; Member, Board of Trustees of the William Alanson White Institute, New York City (institution for training psychoanalysts); Member, Advisory Board, Mount Sinai Children's Environmental Health Center, New York. Oversees 64; None | |
|
| Patrick J. Simpson (Born 1944) | |
|
c/o Columbia Management Investment Advisers, LLC
One Financial Center
Boston, MA 02111
Trustee (since 2000) | | Partner, Perkins Coie LLP (law firm). Oversees 64; None | |
|
| Anne-Lee Verville (Born 1945) | |
|
c/o Columbia Management Investment Advisers, LLC
One Financial Center
Boston, MA 02111
Trustee (since 1998) | | Retired since 1997 (formerly General Manager—Global Education Industry (from 1994 to 1997), President—Application Systems Division (from 1991 to 1994), Chief Financial Officer—US Marketing & Services (from 1988 to 1991), and Chief Information Officer (from 1987 to 1988), IBM Corporation (computer and technology)). Oversees 64; None | |
|
49
Fund Governance (continued)
Interested Trustee
Name, Address and Year of Birth,
Position with Funds, Year First
Elected or Appointed to Office | | Principal Occupation(s) During Past Five Years, Number of Funds in the Columbia
Funds Complex Overseen by Trustee, Other Directorships Held
| |
| William E. Mayer1 (Born 1940) | |
|
c/o Columbia Management
Investment Advisers, LLC
One Financial Center
Boston, MA 02111
Trustee (since 1994) | | Partner, Park Avenue Equity Partners (private equity) since February 1999; Dean and Professor, College of Business, University of Maryland from 1992 to 1997. Oversees 65; Lee Enterprises (print media), WR Hambrecht + Co. (financial service provider); BlackRock Kelso Capital Corporation (investment company) | |
|
1 Mr. Mayer may technically be an "interested person" (as defined in the Investment Company Act of 1940) by reason of his affiliation with WR Hambrecht + Co., a registered broker/dealer that may execute portfolio transactions for, engage in principal transactions with or distribute shares of a Fund or other funds or accounts advised/managed by the Advisor or any sub-advisor to a Fund.
The Statement of Additional Information includes additional information about the Trustees of the Funds and is available, without charge, upon request by calling 1-800-345-6611.
Officers
| Name, Year of Birth and Address | | Principal Occupation(s) During the Past Five Years | |
| J. Kevin Connaughton (Born 1964) | |
|
One Financial Center
Boston, MA 02111
President (since 2009) | | Senior Vice President and General Manager—Mutual Fund Products, Columbia Management Investment Advisers, LLC since May 2010; President, Columbia Funds, since 2009, and RiverSource Funds, since May 2010 (previously Senior Vice President and Chief Financial Officer, Columbia Funds, from June 2008 to January 2009, Treasurer, Columbia Funds, from October 2003 to May 2008, and senior officer of various other affiliated funds since 2000); Managing Director, Columbia Management Advisors, LLC from December 2004 to April 2010. | |
|
| Michael G. Clarke (Born 1969) | |
|
One Financial Center
Boston, MA 02111
Senior Vice President and Chief Financial Officer (since 2009) | | Vice President, Columbia Management Investment Advisers, LLC since May 2010; Managing Director of Fund Administration, Columbia Management Advisors, LLC, from September 2004 to April 2010; senior officer of Columbia Funds and affiliated funds since 2002. | |
|
| Scott R. Plummer (Born 1959) | |
|
5228 Ameriprise Financial Center
Minneapolis, MN 55474
Senior Vice President, Secretary and Chief Legal Officer (since 2010) | | Chief Legal Officer and Assistant Secretary, Columbia Management Investment Advisers, LLC since June 2005; Vice President and Lead Chief Counsel—Asset Management, Ameriprise Financial, Inc. since May 2010 (previously Vice President and Chief Counsel—Asset Management, from 2005 to April 2010, and Vice President—Asset Management Compliance from 2004 to 2005); Vice President, Chief Counsel and Assistant Secretary, Columbia Management Investment Distributors, Inc. since 2008; Vice President, General Counsel and Secretary, Ameriprise Certificate Company since 2005; Chief Counsel, RiverSource Distributors, Inc. since 2006; Vice President, General Counsel and Secretary, RiverSource Funds, since December 2006; Senior Vice President, Secretary and Chief Legal Officer, Columbia Funds, since May 2010. | |
|
50
Fund Governance (continued)
Officers (continued)
| Name, Year of Birth and Address | | Principal Occupation(s) During the Past Five Years | |
| Linda J. Wondrack (Born 1964) | |
|
One Financial Center
Boston, MA 02111
Senior Vice President and Chief Compliance Officer (since 2007) | | Vice President and Chief Compliance Officer, Columbia Management Investment Advisers, LLC since May 2010; Chief Compliance Officer, Columbia Funds, since 2007, and RiverSource Funds, since May 2010; Director (Columbia Management Group, LLC and Investment Product Group Compliance), Bank of America, from June 2005 to April 2010; Director of Corporate Compliance and Conflicts Officer of MFS Investment Management (investment management) from August 2004 to May 2005. | |
|
| William F. Truscott (Born 1960) | |
|
53600 Ameriprise Financial Center
Minneapolis, MN 55474
Senior Vice President (since 2010) | | Chairman of the Board, Columbia Management Investment Advisers, LLC since May 2010 (previously President, Chairman of the Board and Chief Investment Officer, from 2001 to April 2010); Chief Executive Officer, U.S. Asset Management&President, Annuities, Ameriprise Financial, Inc. since May 2010 (previously President—U.S. Asset Management and Chief Investment Officer from 2005 to April 2010, and Senior Vice President—Chief Investment Officer, from 2001 to 2005); Director, President and Chief Executive Officer, Ameriprise Certificate Company since 2006; Director, Columbia Management Investment Distributors, Inc. since May 2010 (previously Chairman of the Board and Chief Executive Officer from 2008 to April 2010); Chairman of the Board and Chief Executive Officer, RiverSource Distributors, Inc. since 2006. | |
|
| Colin Moore (Born 1958) | |
|
One Financial Center
Boston, MA 02111
Senior Vice President (since 2010) | | Director and Chief Investment Officer, Columbia Management Investment Advisers, LLC since May 2010; Manager, Managing Director and Chief Investment Officer of Columbia Management Advisors, LLC from 2007 to April 2010; Head of Equities, Columbia Management Advisors, LLC from 2002 to 2007. | |
|
| Michael A. Jones (Born 1959) | |
|
100 Federal Street
Boston, MA 02110
Senior Vice President (since 2010) | | Director and President, Columbia Management Investment Advisers, LLC since May 2010; President and Director, Columbia Management Investment Distributors, Inc. since May 2010; Manager, Chairman, Chief Executive Officer and President, Columbia Management Advisors, LLC from 2007 to April 2010; Chief Executive Officer, President and Director, Columbia Management Distributors, Inc. from November 2006 to April 2010; previously, co-president and senior managing director at Robeco Investment Management. | |
|
| Amy Johnson (Born 1965) | |
|
5228 Ameriprise Financial Center
Minneapolis, MN 55474
Senior Vice President (since 2010) | | Senior Vice President and Chief Operating Officer, Columbia Management Investment Advisers, LLC since May 2010 (previously Chief Administrative Officer, from 2009 until April 2010, Vice President—AssetManagement and Trust Company Services, from 2006 to 2009, and Vice President—Operations and Compliance from 2004 to 2006). | |
|
| Joseph F. DiMaria (Born 1968) | |
|
One Financial Center
Boston, MA 02111
Treasurer (since 2009) and Chief Accounting Officer (since 2008) | | Vice President, Mutual Fund Administration, Columbia Management Investment Advisers, LLC, since May 2010; Director of Fund Administration, Columbia Management Advisors, LLC from January 2006 to April 2010; Head of Tax/Compliance and Assistant Treasurer, Columbia Management Advisors, LLC, from November 2004 to December 2005. | |
|
51
Fund Governance (continued)
Officers (continued)
| Name, Year of Birth and Address | | Principal Occupation(s) During the Past Five Years | |
| Marybeth Pilat (Born 1968) | |
|
One Financial Center
Boston, MA 02111
Deputy Treasurer (since 2010) | | Vice President, Mutual Fund Administration, Columbia Management Investment Advisers, LLC, since May 2010; Vice President, Investment Operations, Bank of America, from October 2008 to April 2010; Finance Manager, Boston Children's Hospital from August 2008 to October 2008; Director, Mutual Fund Administration, Columbia Management Advisors, LLC, from May 2007 to July 2008; Vice President, Mutual Fund Valuation, Columbia Management Advisors, LLC, from January 2006 to May 2007; Vice President, Mutual Fund Accounting Oversight, Columbia Management Advisors, LLC from January 2005 to January 2006. | |
|
| Julian Quero (Born 1967) | |
|
One Financial Center
Boston, MA 02111
Deputy Treasurer (since 2008) | | Vice President, Mutual Fund Administration, Columbia Management Investment Advisers, LLC since May 2010; Director of Fund Administration, Columbia Management Advisors, LLC, from August 2008 to April 2010; Senior Tax Manager, Columbia Management Advisors, LLC from August 2006 to July 2008; Senior Compliance Manager, Columbia Management Advisors, LLC from April 2002 to August 2006. | |
|
| Stephen T. Welsh (Born 1957) | |
|
One Financial Center
Boston, MA 02111
Vice President (since 2006) | | President and Director, Columbia Management Investment Services Corp. since May 2010; President and Director, Columbia Management Services, Inc. from July 2004 to April 2010; Managing Director, Columbia Management Distributors, Inc. from August 2007 to April 2010. | |
|
52
Board Consideration and Approval of Advisory Agreements
The Board unanimously approved the Advisory Agreements at a meeting held on December 17, 2009. These agreements were approved by shareholders on March 3, 2010, and took effect upon the closing of the acquisition of the long-term asset management business of Columbia by Ameriprise Financial, Inc. ("Ameriprise") (the "Transaction").
The Advisory Fees and Expenses Committee (the "Committee") of the Board met on multiple occasions to review the investment management services agreements (the "Advisory Agreements") for the funds for which the Trustees serve as trustees (each a "Fund," and collectively, the "Funds"). On December 14, 2009, the Committee recommended that the full Board approve the Advisory Agreements. On December 17, 2009, the full Board, including a majority of the Trustees who have no direct or indirect interest in the Advisory Agreements and who are not "interested persons" (as defined in the 1940 Act) of the Trust (the "Independent Trustees"), approved the Advisory Agreement with Columbia Management Investment Advisers, LLC (formerly, RiverSource Investments, LLC) ("CMIA") for each Fund. Prior to their approval of the Advisory Agreements, the Committee and the Independent Trustees requested and evaluated materials from, and were provided mater ials and information about the Transaction and matters related to the proposals by, BOA, Columbia, CMIA and Ameriprise. In connection with their most recent approval of the Funds' previous advisory agreements (the "Former Advisory Agreements") on October 28, 2009, the Committee and the Trustees requested and evaluated materials from Columbia, and discussed such materials with representatives of Columbia. The Committee, at meetings held on August 11, 2009, September 23, 2009, October 27, 2009, November 30, 2009, December 7, 2009 and December 14, 2009, and the Independent Trustees, at meetings held on August 12, 2009, August 20, 2009, October 28, 2009, December 8, 2009, December 14, 2009 and December 17, 2009, discussed the materials provided in connection with the October 28, 2009 approvals and the materials provided in connection with their consideration of the Advisory Agreements and other matters relating to the Transaction with representatives of BOA, Columbia, CMIA and Ameriprise. The Trustees consulted with experienced legal counsel, who advised on the legal standards for consideration by the Trustees. The Independent Trustees also discussed the proposed approvals with independent legal counsel in private sessions.
The Trustees reviewed each Advisory Agreement, as well as certain information obtained through CMIA's responses to initial and supplemental questionnaires prepared at the request of the Trustees by counsel to the Funds and independent legal counsel to the Independent Trustees. The Committee and the Trustees also met with, and reviewed and considered a report prepared and provided by, the independent fee consultant (the "Fee Consultant") appointed by the Independent Trustees pursuant to an assurance of discontinuance entered into by Columbia with the New York Attorney General ("NYAG") to settle a civil complaint filed by the NYAG relating to trading in mutual fund shares (the "NYAG Settlement"). Under the NYAG Settlement, the Fee Consultant's role is to manage the process by which management fees are negotiated so that they are negotiated in a manner that is at arms' length and reasonable.
The Trustees considered all materials that they, their legal counsel or CMIA believed reasonably necessary to evaluate and to determine whether to approve the Advisory Agreements. In their deliberations, the Trustees did not identify any particular information that was all-important or controlling, and individual Trustees may have attributed different weights to the various factors. The material factors that formed the basis for the Trustees' approvals included the factors set forth below:
(i) the reputation, financial strength, regulatory histories and resources of CMIA and its parent, Ameriprise;
(ii) the capabilities of CMIA with respect to compliance, including an assessment of CMIA's compliance system by the Funds' Chief Compliance Officer;
(iii) the qualifications of the personnel of CMIA that would be expected to provide advisory services to each Fund, including CMIA's representations that the Chief Investment Officer of Columbia would serve as the Chief Investment Officer of CMIA, and that the process for determining the portfolio management team for each Fund would be substantially the same process as has customarily been followed by Columbia, and reported to the Trustees, in evaluating the performance of Columbia's portfolio management teams;
(iv) the terms and conditions of the Advisory Agreements, including the differences between the Advisory Agreements and Former Advisory Agreements in
53
connection with CMIA's efforts to standardize such agreements across the Columbia Fund complex and the legacy RiverSource fund complex;
(v) the terms and conditions of other agreements and arrangements relating to the future operations of the Funds, including an administrative services agreement and the Master Services and Distribution Agreement;
(vi) the commitment of CMIA and Ameriprise that there would not be any diminution in the nature, quality and extent of services provided to each Fund or its shareholders following closing of the Transaction;
(vii) that the Trustees recently had completed a full annual review of the Former Advisory Agreements, as required by the 1940 Act, for each Fund and had determined that they were satisfied with the nature, extent and quality of services provided thereunder and that the management fee rate for each Fund were sufficient to warrant their approval;
(viii) that the advisory fee rates payable by each Fund would not change;
(ix) that CMIA and BOA, and not any Fund, would bear the costs of obtaining approvals of the Advisory Agreements;
(x) that Ameriprise and CMIA had agreed to exercise reasonable best efforts to assure that, for a period of two years after the Closing, there would not be imposed on any Fund any "unfair burden" (within the meaning of Section 15(f) of 1940 Act) with respect to the Transaction; and
(xi) that certain members of CMIA's management had a significant amount of experience integrating other fund families; that certain current Columbia personnel that would be integrated into CMIA and its affiliates as a result of the Transaction also had experience in integrating fund families; and that the senior management of CMIA following the Transaction would include certain senior executives of Columbia who were, at that time, responsible for oversight of services provided to the Funds.
Nature, Extent and Quality of Services to be Provided. The Trustees considered the expected nature, extent and quality of services to be provided to the Funds by CMIA and its affiliates and the resources to be dedicated to the Funds by CMIA and its affiliates. The Trustees considered, among other things, the expected effect of the Transaction on the operations of the Funds, the information provided by CMIA with respect to the nature, extent and quality of services to be provided by it, CMIA's compliance programs and compliance records, the ability of CMIA (including personnel and other resources, compensation programs for personnel involved in fund management, reputation and other attributes) to attract, motivate and retain highly qualified research, advisory and supervisory investment professionals, the trade execution services to be provided on beha lf of the Funds and the quality of CMIA's investment research capabilities and the other resources that it indicated it would devote to each Fund. As noted above, the Trustees also considered CMIA's representations that the Chief Investment Officer of Columbia would serve as the Chief Investment Officer of CMIA following the Transaction, and that the process for determining the portfolio management team for each Fund would be substantially the same process as has customarily been followed by Columbia, and reported to the Trustees, in evaluating the performance of Columbia's portfolio management teams.
The Trustees noted the professional experience and qualifications of the senior personnel of CMIA. The Trustees also considered the compliance programs of and the compliance-related resources proposed to be provided to the Funds by CMIA and its affiliates, including discussions with the Funds' Chief Compliance Officer regarding CMIA's compliance program. The Trustees also discussed CMIA's compliance program with the Chief Compliance Officer for the legacy RiverSource funds. The Trustees also considered CMIA's representation that the Funds' Chief Compliance Officer would serve as the Chief Compliance Officer of CMIA following the Transaction. The Trustees considered CMIA's ability to provide administrative services to the Funds, noting that while some Former Advisory Agreements contemplated the provision of certain administrative services, following the Transaction, all administrative services were anticipated to be provided purs uant to a new administrative services agreement. The Trustees also considered CMIA's ability to coordinate the activities of each Fund's other service providers. The Trustees considered performance information provided by CMIA with respect to other mutual funds advised
54
by CMIA, and discussed with senior executives of CMIA its process for identifying which portfolio management teams of the legacy Columbia and legacy CMIA organizations would be responsible for the management of the Funds following the Transaction. After reviewing these and related factors, the Trustees concluded, within the context of their overall conclusions, that the expected nature, extent and quality of the services to be provided to each Fund under the Advisory Agreements supported the approval of such agreements.
Investment Advisory Fee Rates and Other Expenses. The Trustees considered the fact that the advisory fee rates payable by each Fund to CMIA under the Advisory Agreements were the same as those that were paid by each Fund to Columbia under the Former Advisory Agreements. The Trustees noted that in connection with their October 28, 2009 approval of the Former Advisory Agreements, they had concluded, within the context of their overall conclusions regarding each such agreement, that the advisory fees charged to each Fund supported the continuation of the agreement(s) pertaining to that Fund.
The Trustees noted that in certain cases the effective advisory fee rate for a legacy RiverSource fund was lower than the proposed investment advisory fee rate for a Fund with generally similar investment objectives and strategies. The Trustees also noted that CMIA's investment advisory fee rates for equity and balanced funds generally are subject to adjustments based on investment performance, whereas the proposed investment advisory fee rates for the Funds, consistent with those in the Former Advisory Agreements, do not reflect performance adjustments. The Trustees considered existing advisory fee breakpoints and CMIA's undertaking not to change expense caps previously implemented by Columbia with respect to the Funds without further discussion with the Independent Trustees.
The Trustees received and considered information about the advisory fees charged by CMIA to institutional accounts. In considering the fees charged to those accounts, the Trustees took into account, among other things, CMIA's representations about the differences between managing mutual funds as compared to other types of accounts, including differences in the services provided, differences in the risk profile of such business for CMIA and the additional resources required to manage mutual funds effectively. In evaluating each Fund's advisory fees, the Trustees also took into account the demands, complexity and quality of the investment management of the Fund.
The Trustees also considered that for certain Funds, certain administrative services that were provided under the Former Advisory Agreements would not be provided under the Advisory Agreements, but under a separate administrative services agreement. The Trustees noted that, unlike fees under an advisory agreement, fees under the administrative services agreement could be changed without shareholder approval, although CMIA had not proposed any increase in such administrative fees and any such increase would require Board approval. The Trustees also noted Ameriprise's and CMIA's covenants regarding compliance with Section 15(f) of the 1940 Act.
After reviewing these and related factors, the Trustees concluded, within the context of their overall conclusions, that the expected advisory fee rates and expenses of each Fund supported the approval of the Advisory Agreements.
Costs of Services to be Provided and Profitability. The Trustees noted that in connection with their October 28, 2009 approval of the Former Advisory Agreements, they had concluded, within the context of their overall conclusions regarding each such agreement, that profitability to Columbia and its affiliates of their relationships with each Fund supported the continuation of the agreement(s) pertaining to that Fund. In connection with the integration of the legacy Columbia and legacy CMIA organizations, the Trustees considered, among other things, CMIA's projected annual net expense synergies (reductions in the cost of providing services to the Funds), the timetable over which such synergies are expected to be realized and the extent to which any such synergies are expected to be shared with the Funds. The Trustees also considered information provide d by CMIA regarding their respective financial conditions. The Trustees considered that CMIA proposed to continue voluntary expense caps currently in effect for the Funds and that CMIA had undertaken not to change these caps without further discussion with the Independent Trustees. After reviewing these and related factors, the Trustees concluded, within the context of their overall conclusions, that the expected profitability to CMIA and its affiliates from its relationship with each Fund supported the approval of the Advisory Agreements.
55
Economies of Scale. The Trustees considered the existence of any anticipated economies of scale in the provision by CMIA of services to each Fund, to groups of related Funds and to CMIA's investment advisory clients as a whole, and whether those economies of scale were expected to be shared with the Funds. The Trustees considered Ameriprise's anticipated net expense synergies resulting from the Transaction, and considered the possibility that the Funds might benefit from economies of scale over time as part of the larger, combined fund complex. The Trustees considered how expected synergies and potential economies of scale might benefit the Funds and their shareholders. The Trustees considered the potential impact of the Transaction on the distribution of the Funds, and noted that the proposed management fee schedules for the Funds generally contained breakpoints that would reduce the fee rate on assets above specified threshold levels. After reviewing these and related factors, the Trustees concluded, within the context of their overall conclusions, that the extent to which economies of scale were expected to be shared with the Funds supported the approval of the Advisory Agreements.
Other Benefits to CMIA. The Trustees received and considered information regarding any expected "fall-out" or ancillary benefits to be received by CMIA and its affiliates as a result of their relationships with the Funds, such as the engagement of CMIA to provide administrative services to the Funds and the engagement of CMIA's affiliates to provide distribution and transfer agency services to the Funds. The Trustees considered that the Funds' distributor, which would be an affiliate of CMIA, retains a portion of the distribution fees from the Funds and receives a portion of the sales charges on sales or redemptions of certain classes of shares of the Funds. The Trustees also considered the benefits of research made available to CMIA by reason of brokerage commissions generated by the Funds' securities transactions, and reviewed information about CMIA 's practices with respect to allocating portfolio brokerage for brokerage and research services. The Trustees considered the possible conflicts of interest associated with certain fall-out or other ancillary benefits and the reporting, disclosure and other processes that would be in place to disclose and to monitor such possible conflicts of interest. The Trustees recognized that CMIA's profitability would be somewhat lower without these benefits.
Conclusion. Based on their evaluation of all factors that they deemed to be material, including those factors described above, and assisted by the advice of independent legal counsel and the Fee Consultant, the Trustees, including the Independent Trustees, approved, and recommended that Fund shareholders approve, each Advisory Agreement.
56
Summary of Management Fee Evaluation by Independent Fee Consultant (RiverSource Investments, LLC)
EXCERPT FROM REPORT OF INDEPENDENT FEE CONSULTANT TO THE FUNDS SUPERVISED BY THE COLUMBIA ATLANTIC BOARD
Prepared Pursuant to the February 9, 2005
Assurance of Discontinuance among the
Office of Attorney General of New York State,
Columbia Management Advisors, LLC, and
Columbia Management Distributors, Inc.
December 21, 2009
I. Overview
On February 9, 2005, Columbia Management Advisors, LLC ("CMA") and Columbia Management Distributors, Inc.1 ("CMD") agreed to the New York Attorney General's Assurance of Discontinuance ("AOD"). Among other things, the AOD stipulates that CMA may manage or advise a Columbia Fund ("Columbia Fund" and, together with some or all of such funds, the "Columbia Funds") only if the Independent Members of the Columbia Fund's Board of Trustees appoint a Senior Officer or retain an Independent Fee Consultant ("IFC") who is to manage the process by which proposed management fees are negotiated. The AOD further stipulates that the Senior Officer or IFC is to prepare a written annual evaluation of the fee negotiation process.
With effect from January 1, 2007, the Independent Members of the Board of Trustees for certain Columbia Funds known collectively as the "Atlantic Funds" (together with the other members of that Board, the "Trustees") retained me as IFC for the Atlantic Funds.2 In this capacity, I have prepared this written evaluation of the fee negotiation process. As was the case with the last three annual reports, my immediate predecessor as IFC, John Rea, provided invaluable assistance in the preparation of this report.
On September 29, 2009, Ameriprise entered into an asset purchase agreement with Bank of America, N.A. and its parent, Bank of America Corporation (together, the "Bank") pursuant to which the Bank agreed to sell certain CMG assets relating to Columbia's long-term asset management business, including management of the Atlantic Funds (the "Transaction").3 The Transaction if completed would result in the termination of the existing Investment Management Agreements with CMA. Therefore, the Trustees have been requested to approve and recommend to the shareholders of each Atlantic Fund new Investment Management and Sub-Advisory Agreements (together, the "Management Agreements") with RiverSource Investments, LLC ("RI"),4 investment manager of the RiverSource Funds and a subsidiary of Ameriprise. This report is intended to fulfill the requiremen ts of the AOD with respect to the Trustees' consideration of the new Management Agreements.
A. Role of the Independent Fee Consultant
The AOD charges the IFC with "managing the process by which proposed management fees ... to be charged the Columbia Fund are negotiated so that they are negotiated in a manner which is at arms' length and reasonable and consistent with this Assurance of Discontinuance." The AOD also provides that CMA "may manage or advise a Columbia Fund only if the reasonableness of the proposed management fees is determined by the Board of Trustees ... using ... an annual independent written evaluation prepared by or under the direction of ... the Independent Fee Consultant." Therefore, the AOD makes clear that the IFC does not supplant the Trustees in negotiating management fees with CMA (or RI), nor does the IFC substitute his or her judgment for that of the Trustees with respect to the reasonableness of proposed fees or any other matter that is committed to the business judgment of the Trustees.
B. Elements Involved in Managing the Fee Negotiation Process
In preparing the report required by the AOD, the IFC must consider at least the following six factors set forth in the AOD:
1. The nature and quality of the adviser's services, including the Fund's performance;
1 CMA and CMD are subsidiaries of Columbia Management Group, LLC ("CMG"), and are the successors to the entities named in the AOD.
2 I have no material relationship with Bank of America, CMG or Ameriprise Financial, Inc. ("Ameriprise"), aside from serving as IFC, and I am aware of no material relationship with any of their affiliates. I retained John Rea, an independent economic consultant, to assist me with this report.
Unless otherwise stated or required by the context, this report covers only the Atlantic Funds.
3 Preliminary Response of Ameriprise to Information Request of Columbia Atlantic Board dated October 21, 2009 (hereafter, the "Preliminary Response"), p. 1. The one money market Atlantic Fund, Money Market Fund VS, was included in the Transaction because it was an integral part of CMG's array of Funds used as investment vehicles by variable annuity and similar insurance products.
4 Ameriprise intends to re-brand RI with the "Columbia" name (which is one of the assets being sold in the Transaction). Preliminary Response, pp. 4-5. In the case of new Sub-Advisory Agreements, the current sub-adviser would also be a party.
57
2. Management fees (including any components thereof) charged by other mutual fund companies for like services;
3. Possible economies of scale as the Fund grows larger;
4. Management fees (including any components thereof) charged to institutional and other clients of the adviser for like services;
5. Costs to the adviser and its affiliates of supplying services pursuant to the management fee agreements, excluding any intra-corporate profit; and
6. Profit margins of the adviser and its affiliates from supplying such services.
C. Data Presented to the Trustees
In considering the proposed new Management Agreements with RI, the Trustees relied in part on the data that had been prepared as part of their annual contract review process, which concluded in late October. This data remained relevant because the fees in the proposed Management Agreements were identical to the fees approved at that time. The annual review materials included a Lipper report on the performance of each Atlantic Fund compared to its peers and its benchmark, comparisons of the fees and expenses of each Atlantic Fund to similar CMG-sponsored Funds, comparable competitive funds chosen by Lipper, and institutional accounts advised by CMA, revenues, expenses, and profits of CMG from managing the Atlantic Funds, calculated both by Fund and collectively, and CMG's views on the existence and sharing of economies of scale.
In addition, the Trustees reviewed materials specific to the proposed new Management Agreements with RI in response to requests for information made on behalf of the Trustees, including the following:
• Performance data for the RiverSource Funds showing percentile and quartile rankings of each fund within its Lipper performance universe for periods up to five years and net returns of each fund relative to its benchmark returns. This data was arguably relevant due to the possibility that some RiverSource investment teams would be providing investment management services to certain Columbia Funds.5
• tables comparing the fee schedules and effective fee rates of funds managed by CMA and RI and institutional accounts advised by the two firms.
• extensive discussion of the process by which the various components of the two asset management businesses would be integrated including investment management, compliance, transfer agency, custody, fund accounting, and distribution.
• information about the financial condition of Ameriprise, including its most recent annual report on Form 10-K, RI's profit margins from managing the RiverSource Funds in 2007 and 2008, and pro forma income statements for the combined Columbia and RiverSource fund complex.
• disclosure that certain senior CMG executives, including President Michael Jones, Chief Investment Officer Colin Moore, Head of Mutual Funds J. Kevin Connaughton, and Chief Compliance Officer Linda Wondrack would continue in analogous capacities following the consummation of the Transaction, and
• a breakdown of the synergies RI expects to realize in the two years following the Transaction and the extent to which those potential synergies are expected to be shared with shareholders of funds advised by RI.
II. Findings
1. Based upon my examination of the information supplied by CMG and Ameriprise in the light of the six factors set forth in the AOD, I conclude that the Trustees have the relevant information necessary to evaluate the reasonableness of the proposed management fees for each Atlantic Fund.
2. In my view, the process by which the proposed management fees of the Atlantic Funds have been negotiated with RI thus far has been, to the extent practicable, at arms' length and reasonable and consistent with the AOD.
Respectfully submitted,
Steven E. Asher
5 On page 20 of its Supplemental Response to the Atlantic Trustees (undated but delivered November 24, 2009), Ameriprise said that "most personnel decisions, including with respect to the portfolio management teams for the Atlantic Funds . . . will be made primarily by [current CMA CIO] Colin Moore using the Columbia 5P process."
58
Shareholder Meeting Results
On March 3, 2010, a special meeting of shareholders of Columbia Funds Series Trust I was held to consider the approval of several proposals listed in the proxy statement for the meeting. Proposal 1 and Proposal 2 were voted on at the March 3, 2010 meeting of shareholders and Proposal 3 was voted on at an adjourned meeting of shareholders held on March 31, 2010. The shareholder meeting results are as follows:
Proposal 1: A proposed Investment Management Services Agreement with Columbia Management Investment Advisers, LLC (formerly, RiverSource Investments, LLC) (CMIA) was approved as follows:
| Votes For | | Votes Against | | Abstentions | | Broker Non-Votes | |
| | 1,379,907,093 | | | | 27,443,061 | | | | 31,889,579 | | | | 491,610,351 | | |
Proposal 2: A proposal authorizing CMIA to enter into and materially amend subadvisory agreements for the Fund in the future, with the approval of the Trust's Board of Trustees, but without obtaining additional shareholder approval, was approved as follows:
| Votes For | | Votes Against | | Abstentions | | Broker Non-Votes | |
| | 1,313,863,303 | | | | 91,021,715 | | | | 34,354,710 | | | | 491,610,357 | | |
Proposal 3: Each of the nominees for trustees was elected to the Trust's Board of Trustees, as follows:
| Trustee | | | Votes For | | | | Votes Withheld | | | | Abstentions | | |
| John D. Collins | | | 30,977,072,412 | | | | 859,827,038 | | | | 0 | | |
| Rodman L. Drake | | | 30,951,179,004 | | | | 885,720,446 | | | | 0 | | |
| Douglas A. Hacker | | | 30,989,793,279 | | | | 847,106,171 | | | | 0 | | |
| Janet Langford Kelly | | | 30,999,020,814 | | | | 837,878,636 | | | | 0 | | |
| William E. Mayer | | | 16,291,139,483 | | | | 15,545,759,967 | | | | 0 | | |
| Charles R. Nelson | | | 30,997,700,700 | | | | 839,198,750 | | | | 0 | | |
| John J. Neuhauser | | | 30,988,095,661 | | | | 848,803,789 | | | | 0 | | |
| Jonathon Piel | | | 30,968,801,048 | | | | 868,098,402 | | | | 0 | | |
| Patrick J. Simpson | | | 30,999,065,030 | | | | 837,834,420 | | | | 0 | | |
| Anne-Lee Verville | | | 30,996,227,913 | | | | 840,671,537 | | | | 0 | | |
59
This page intentionally left blank.
Important Information About This Report
The fund mails one shareholder report to each shareholder address. If you would like more than one report, please call shareholder services at 1-800-345-6611 and additional reports will be sent to you. This report has been prepared for shareholders of the Columbia Strategic Income Fund.
A description of the policies and procedures that the fund uses to determine how to vote proxies and a copy of the fund's voting records are available (i) at www.columbiamanagement.com, (ii) on the Securities and Exchange Commission's website at www.sec.gov, and (iii) without charge, upon request, by calling 1-800-368-0346. Information regarding how the fund voted proxies relating to portfolio securities during the 12-month period ended June 30 is available from the SEC's website. Information regarding how each fund voted proxies relating to portfolio securities is also available from the fund's website, www.columbiamanagement.com.
The fund files a complete schedule of portfolio holdings with the SEC for the first and third quarters of each fiscal year on Form N-Q. The fund's Form N-Q is available on the SEC's website at www.sec.gov and may be reviewed and copied at the SEC's Public Reference Room in Washington, D.C. Information on the operation of the Public Reference Room may be obtained by calling 1-800-SEC-0330.
Investors should consider the investment objectives, risks, charges and expenses of a mutual fund carefully before investing. For a free prospectus, which contains this and other important information about the funds, visit www.columbiamanagement.com. Read the prospectus carefully before investing.
On April 30, 2010, Ameriprise Financial, Inc., the parent company of RiverSource Investments, LLC, acquired the long-term asset management business of Columbia Management Group, LLC, including certain of its affiliates, which were, prior to this acquisition, part of Bank of America. In connection with the acquisition of the long-term assets, the Columbia Funds have a new investment adviser, RiverSource Investments, LLC, which is now known as Columbia Management Investment Advisers, LLC. For those clients that use the services of a subadviser, those arrangements are continuing unless notified otherwise. RiverSource Fund Distributors, Inc., now known as Columbia Management Investment Distributors, Inc., member FINRA, will act as the principal distributor of the Columbia Funds.
Transfer Agent*
Columbia Management Investment
Services Corp.
P.O. Box 8081
Boston, MA 02266-8081
1-800-345-6611
Distributor*
Columbia Management Investment
Distributors, Inc.
One Financial Center
Boston, MA 02111
Investment Advisor*
Columbia Management Investment Advisers, LLC
100 Federal Street
Boston, MA 02110
61

PRSRT STD
U.S. Postage
PAID
Holliston, MA
Permit NO. 20
Columbia Strategic Income Fund
One Financial Center
Boston, MA 02111-2621
www.columbiafunds.com
This report must be accompanied or preceeded by the Fund's current prospectus. Columbia Management mutual funds are distributed by Columbia Management Investment Distributors, Inc.
©2010 Columbia Management Investment Advisers, LLC. All rights reserved.
C-1036 A (7/10)

Columbia Strategic Income Fund
This report must be accompanied or preceeded by the Fund's current prospectus. Columbia Management mutual funds are distributed by Columbia Management Investment Distributors, Inc.
©2010 Columbia Management Investment Advisers, LLC. All rights reserved.
C-1036 A (7/10)

Columbia High Yield Opportunity Fund
Annual Report for the Period Ended May 31, 2010
Not FDIC insured • No bank guarantee • May lose value
Table of Contents
| Fund Profile | | | 1 | | |
|
| Economic Update | | | 2 | | |
|
| Performance Information | | | 4 | | |
|
| Understanding Your Expenses | | | 5 | | |
|
| Portfolio Managers' Report | | | 6 | | |
|
| Financial Statements | | | | | |
|
| Investment Portfolio | | | 8 | | |
|
Statement of Assets and
Liabilities | | | 21 | | |
|
| Statement of Operations | | | 23 | | |
|
Statement of Changes in
Net Assets | | | 24 | | |
|
| Financial Highlights | | | 26 | | |
|
| Notes to Financial Statements | | | 30 | | |
|
Report of Independent Registered
Public Accounting Firm | | | 40 | | |
|
| Fund Governance | | | 41 | | |
|
Board Consideration and
Approval of Advisory Agreements | | | 46 | | |
|
Summary of Management Fee
Evaluation by Independent Fee
Consultant (RiverSource
Investments, LLC) | | | 50 | | |
|
| Shareholder Meeting Results | | | 52 | | |
|
Important Information About
This Report | | | 53 | | |
|
The views expressed in this report reflect the current views of the respective parties. These views are not guarantees of future performance and involve certain risks, uncertainties and assumptions that are difficult to predict, so actual outcomes and results may differ significantly from the views expressed. These views are subject to change at any time based upon economic, market or other conditions and the respective parties disclaim any responsibility to update such views. These views may not be relied on as investment advice and, because investment decisions for a Columbia Fund are based on numerous factors, may not be relied on as an indication of trading intent on behalf of any particular Columbia Fund. References to specific securities should not be construed as a recommendation or investment advice.
President's Message

Dear Shareholder:
On May 3, 2010, Ameriprise Financial, Inc. announced that it had completed the acquisition of the long-term asset management business of Columbia Management Group, LLC from Bank of America. This includes the business of managing its equity and fixed-income mutual funds. Ameriprise Financial has combined its current U.S. asset management business, RiverSource Investments, LLC, with Columbia Management. This transaction puts together two leading asset management firms to create one entity that ranks as one of the largest managers of long-term mutual fund assets in the United States. This combined business will operate under the well-regarded Columbia Management brand, where we will build on the strengths of our combined investment capabilities and talent, our broad and diversified product lineup and exceptional service.
Our combined business has a new breadth and depth of investment choices. William "Ted" Truscott, CEO, U.S. asset management and president of annuities for Ameriprise Financial, leads the combined U.S. asset management business. Michael Jones serves as president, U.S. asset management.1 Colin Moore continues to serve as chief investment officer.1 I am also continuing in my role as head of mutual funds, responsible for the delivery of mutual fund products and services to investors. The Columbia funds' advisers, distributor and transfer agent are now subsidiaries of our parent company, Ameriprise Financial, but operate under the Columbia Management name. You will begin to see these names used in communications and statements going forward.
| | | Service provider name | |
| Advisers | | Columbia Management Investment Advisers, LLC
Columbia Wanger Asset Management, LLC | |
|
| Distributor | | Columbia Management Investment Distributors, Inc. | |
|
| Transfer Agent | | Columbia Management Investment Services Corp. | |
|
As a valued investor in Columbia funds, please know that our goal is to ensure a smooth transition and provide the highest quality products and services. Transition teams across the organization continue their efforts to build on best practices from both legacy organizations with integration efforts including rebranding, vendor and system consolidations and client communications. Additionally, we want to assure you that the funds' portfolio managers also continue to focus on providing uninterrupted service to all fund shareholders.
Although we have a lot of work ahead of us in 2010, Columbia Management and Ameriprise Financial are excited about the opportunities for our combined organization. I share this optimism and believe it positions us as a best-in-class asset management business with the ability to deliver more for our clients than ever before.
Sincerely,

J. Kevin Connaughton
President, Columbia Funds
1Associate joined Columbia Management Investment Advisers, LLC as part of its 2010 acquisition of the long-term asset management business of Columbia Management Group, LLC from Bank of America.
Investors should consider the investment objectives, risks, charges and expenses of a mutual fund carefully before investing. For a free prospectus, which contains this and other important information about the funds, visit www.columbiamanagement.com. Read the prospectus carefully before investing.
Securities products offered through Columbia Management Investment Distributors, Inc. (formerly known as RiverSource Fund Distributors, Inc.), member FINRA. Advisory services provided by Columbia Management Investment Advisers, LLC (formerly known as RiverSource Investments, LLC).
© 2010 Columbia Management Investment Advisers, LLC. All rights reserved.
Fund Profile – Columbia High Yield Opportunity Fund
Summary
g For the 12-month period that ended May 31, 2010, the fund's Class A shares returned 24.50% without sales charge.
g The fund underperformed the average return of the funds in its peer group, the Lipper High Current Yield Funds Classification1, and its benchmarks, the JP Morgan Global High Yield Index and Credit Suisse High Yield Index.2
g The fund lagged its benchmarks, and to a lesser extent its peer group, because it had an underweight in the lowest quality (CCC-rated3) bonds in the sector, which by far were the year's best performers.
Portfolio Management
Brian Lavin, CFA has co-managed the fund since May 2010 and has been associated with the advisor or its predecessors since 1994.
Jennifer Ponce de Leon has co-managed the fund since May 2010 and has been associated with the advisor or its predecessors since 1997.
Effective May 26, 2010, Brian Lavin, CFA and Jennifer Ponce de Leon became the co-managers of the fund.
Effective May 1, 2010, RiverSource Investments, LLC, a subsidiary of Ameriprise Financial, Inc., became the investment advisor to the fund and changed its name to Columbia Management Investment Advisers, LLC. Please see the fund's prospectus, as supplemented, for more information regarding the change in investment advisor and certain other changes.
1Lipper Inc., a widely respected data provider in the industry, calculates an average total return (assuming reinvestment of distributions) for mutual funds with investment objectives similar to those of the fund. Lipper makes no adjustment for the effect of sales loads.
2The Credit Suisse High Yield Index is a broad-based index that tracks the performance of high-yield bonds. The JP Morgan Global High Yield Index is designed to mirror the investable universe of the U.S. dollar global high-yield corporate debt market, including domestic and international issues. Indices are not available for investment, are not professionally managed and do not reflect sales charges, fees, brokerage commisisions, taxes or other expenses of investing. Securities in the fund may not match those in an index.
3Ratings shown represent the rating assigned to a particular bond by one of the following nationally-recognized rating agencies: Standard and Poor's, Moody's Investors Service, Inc. or Fitch Ratings Ltd. Ratings are relative and subjective and are not absolute standards of quality. The fund's credit quality does not remove market risk.
Performance data quoted represents past performance and current performance may be lower or higher. Past performance is no guarantee of future results. The investment return and principal value will fluctuate so that shares, when redeemed, may be worth more or less than the original cost. Please visit www.columbiafunds.com for daily and most recent month-end performance updates.
Summary
1-year return as of 05/31/2010
| | +24.50% | |
|
| |  | | | Class A shares
(without sales charge) | |
|
| | +31.38% | |
|
| |  | | | JP Morgan Global
High Yield Index | |
|
| | +29.96% | |
|
| |  | | | Credit Suisse High
Yield Index | |
|
1
Economic Update – Columbia High Yield Opportunity Fund
Summary
For the 12-month period that ended May 31, 2010
g Solid economic growth and relatively low interest rates boosted bond market returns. The Barclays Capital Aggregate Bond Index delivered solid results. High-yield bonds outperformed stocks, as measured by the Credit Suisse High Yield Index.
Barclays
Aggregate Index | | Credit Suisse
Index | |
|
 | |  | |
|
g The U.S. stock market delivered solid returns, despite a correction in the final weeks of the period. Emerging market stocks, as measured by the MSCI Emerging Markets Index, outperformed U.S. stocks as well as stock markets in developed foreign markets.
| S&P Index | | MSCI Index | |
|
 | |  | |
|
Although it has been nearly a year since U.S. economic growth turned positive, the economy continues to send mixed signals about the sustainability of this recovery. Consumer spending on items such as cars, clothing and other goods, for example, was solid throughout most of the year. However in May 2010, spending fell 1.2%. By contrast, consumer confidence gained ground near the end of the period as consumers surveyed indicated they were increasingly optimistic about business conditions and job prospects.
The housing market showed some signs of stabilizing. However, a full recovery remained out of reach. Home sales moved generally higher, as mortgage rates remained low and new homebuyers took advantage of a federal tax credit, which was extended through June of 2010—the second such extension in the past six months. Distressed properties continued to pressure prices and a huge backlog of foreclosed homes is likely to continue to keep a lid on prices for some time. Yet, housing prices were higher at the end of May 2010 than they were one year ago.
News on the job front was mostly positive. Approximately 290,000 new jobs were added to the economy in April 2010—the second consecutive month of significant job gains in 2010. Yet, a good portion of those jobs are government sponsored and temporary.
Reports from the business side of the economy were generally positive. A key measure of the nation's manufacturing situation—the Institute for Supply Management's Index—rose for nine consecutive months before a slight downtick in May 2010 and industrial production moved higher. Perhaps the best news was about corporate profits. Of the S&P 500 companies announcing first-quarter results, 77% exceeded Wall Street earnings forecasts.
Bond returns ranged from solid to strong
As the economy strengthened, bonds delivered solid returns. The Barclays Capital Aggregate Bond Index1 returned 8.42%. Municipal bonds gained slightly more than taxable investment-grade bonds even without factoring in potential tax advantages to investors in higher income-tax brackets. The Barclays Capital Municipal Bond Index2 returned 8.52%. The high-yield bond market outpaced stocks during the period. For the 12 months covered by this report, the Credit Suisse High Yield Index3 returned 29.96%.
Even the Treasury market was positive as the yield on the 10-year U.S. Treasury, a common bellwether for the bond market, fell from 3.5% to 3.3% during the 12-month period. Despite the pickup in economic activity, the Federal Reserve Board kept a key short-term interest rate—the federal funds rate—close to zero.
1The Barclays Capital Aggregate Bond Index is a market value-weighted index that tracks the daily price, coupon, pay-downs and total return performance of fixed-rate, publicly placed, dollar-denominated and non-convertible investment grade debt issues with at least $250 million par amount outstanding and with at least one year to final maturity.
2The Barclays Capital Municipal Bond Index is considered representative of the broad market for investment-grade, tax-exempt bonds with a maturity of at least one year.
3The Credit Suisse High Yield Index is a broad-based index that tracks the performance of high-yield bonds.
2
Economic Update (continued) – Columbia High Yield Opportunity Fund
Stocks staged a solid comeback
Against a strengthening economic backdrop, a stock market rally that began in mid-March 2009 continued into April 2010, when a debt crisis brewing in Europe spilled over and undermined investor confidence in the United States. The S&P 500 Index lost on the order of 10% in the final six weeks of the period. Yet, the U.S. stock market returned 20.99% for the 12-month period, as measured by the S&P 500 Index.4
Outside the United States, stock market returns were also strong. The MSCI EAFE Index,5 a broad gauge of stock market performance in foreign developed markets, returned 6.38% (net of dividends, in U.S. dollars) for the period, as concerns about the impact of a bailout for weak eurozone economies weighed on the markets. Emerging stock markets were more resilient. The MSCI Emerging Markets Index6 returned 22.39% (net of dividends, in U.S. dollars) for the 12-month period.
Past performance is no guarantee of future results.
4The Standard & Poor's (S&P) 500 Index tracks the performance of 500 widely held, large-capitalization U.S. stocks.
5The Morgan Stanley Capital International Europe, Australasia, Far East (MSCI EAFE) Index is a capitalization-weighted index that tracks the total return of common stocks in 21 developed-market countries within Europe, Australasia and the Far East.
6The Morgan Stanley Capital International Emerging Markets Index (MSCI EMI) is a free float-adjusted market capitalization index that is designed to measure equity market performance of emerging markets. As of June 2009, the MSCI Emerging Markets Index consisted of the following 22 emerging market country indices: Brazil, Chile, China, Colombia, Czech Republic, Egypt, Hungary, India, Indonesia, Israel, Korea, Malaysia, Mexico, Morocco, Peru, Philippines, Poland, Russia, South Africa, Taiwan, Thailand, and Turkey.
Indices are not available for investment, are not professionally managed and do not reflect sales charges, fees, brokerage commissions, taxes or other expenses of investing. Securities in the fund may not match those in an index.
3
Performance Information – Columbia High Yield Opportunity Fund
Performance data quoted represents past performance and current performance may be lower or higher. Past performance is no guarantee of future results. The investment return and principal value will fluctuate so that shares, when redeemed, may be worth more or less than the original cost. Please visit www.columbiafunds.com for daily and most recent month-end performance updates.
Annual operating expense ratio (%)*
| Class A | | | 1.10 | | |
| Class B | | | 1.85 | | |
| Class C | | | 1.85 | | |
| Class Z | | | 0.85 | | |
* The annual operating expense ratio is as stated in the fund's prospectus that is current as of the date of this report. Differences in expense ratios disclosed elsewhere in this report may result from the inclusion of fee waivers and expense reimbursements as well as the use of different time periods to calculate the ratios.
Performance of a $10,000 investment 06/01/00 – 05/31/10
The chart above shows the change in value of a hypothetical $10,000 investment in Class A shares of Columbia High Yield Opportunity Fund during the stated time period, and does not reflect the deduction of taxes that a shareholder may pay on fund distributions or on the redemption of fund shares.
Performance of a $10,000 investment 06/01/00 – 05/31/10 ($)
| Sales charge | | without | | with | |
| Class A | | | 14,882 | | | | 14,175 | | |
| Class B | | | 13,819 | | | | 13,819 | | |
| Class C | | | 14,026 | | | | 14,026 | | |
| Class Z | | | 15,255 | | | | n/a | | |
Average annual total return as of 05/31/10 (%)
| Share class | | A | | B | | C | | Z | |
| Inception | | 10/21/71 | | 06/08/92 | | 01/15/96 | | 01/08/99 | |
| Sales charge | | without | | with | | without | | with | | without | | with | | without | |
| 1-year | | | 24.50 | | | | 18.58 | | | | 23.59 | | | | 18.59 | | | | 23.76 | | | | 22.76 | | | | 24.80 | | |
| 5-year | | | 4.63 | | | | 3.61 | | | | 3.86 | | | | 3.57 | | | | 4.01 | | | | 4.01 | | | | 4.89 | | |
| 10-year | | | 4.06 | | | | 3.55 | | | | 3.29 | | | | 3.29 | | | | 3.44 | | | | 3.44 | | | | 4.31 | | |
Average annual total return as of 06/30/10 (%)
| Share class | | A | | B | | C | | Z | |
| Sales charge | | without | | with | | without | | with | | without | | with | | without | |
| 1-year | | | 22.32 | | | | 16.51 | | | | 21.43 | | | | 16.43 | | | | 21.60 | | | | 20.60 | | | | 22.62 | | |
| 5-year | | | 4.46 | | | | 3.44 | | | | 3.69 | | | | 3.40 | | | | 3.83 | | | | 3.83 | | | | 4.71 | | |
| 10-year | | | 4.10 | | | | 3.59 | | | | 3.33 | | | | 3.33 | | | | 3.48 | | | | 3.48 | | | | 4.35 | | |
The "with sales charge" returns include the maximum initial sales charge of 4.75% for Class A shares and the applicable contingent deferred sales charge of 5.00% in the first year, declining to 1.00% in the sixth year and eliminated thereafter for Class B shares and 1.00% for Class C shares for the first year only. The "without sales charge" returns do not include the effect of sales charges. If they had, returns would be lower.
Performance results reflect any fee waivers or reimbursements of fund expenses by the investment advisor and/or any of its affiliates. Absent these fee waivers or expense reimbursement arrangements, performance results would have been lower.
All results shown assume reinvestment of distributions. Class Z shares are sold at net asset value with no distribution and service (Rule 12b-1) fees. Class Z shares have limited eligibility and the investment minimum requirements may vary. Please see the fund's prospectus for details. Performance for different share classes will vary based on differences in sales charges and fees associated with each class.
The tables do not reflect the deduction of taxes that a shareholder may pay on fund distributions or on the redemption of fund shares.
4
Understanding Your Expenses – Columbia High Yield Opportunity Fund
As a fund shareholder, you incur two types of costs. There are transaction costs, which generally include sales charges on purchases and may include redemption fees or exchange fees. There are also ongoing costs, which generally include investment advisory fees, distribution and service (Rule 12b-1) fees and other fund expenses. The information on this page is intended to help you understand the ongoing costs of investing in the fund and to compare these costs with the ongoing costs of investing in other mutual funds.
Analyzing your fund's expenses by share class
To illustrate these ongoing costs, we have provided an example and calculated the expenses paid by investors in each share class during the period. The information in the following table is based on an initial investment of $1,000, which is invested at the beginning of the period and held for the entire period. Expense information is calculated two ways and each method provides you with different information. The amount listed in the "Actual" column is calculated using the fund's actual operating expenses and total return for the period. The amount listed in the "Hypothetical" column for each share class assumes that the return each year is 5% before expenses and is calculated based on the fund's actual operating expenses. You should not use the hypothetical account values and expenses to estimate either your actual account balance at the end of the period or the expenses you paid during this period.
Compare with other funds
Since all mutual funds are required to include the same hypothetical calculations about expenses in shareholder reports, you can use this information to compare the ongoing cost of investing in the fund with other funds. To do so, compare the 5% hypothetical example with the 5% hypothetical examples that appear in the shareholder reports of other funds. As you compare hypothetical examples of other funds, it is important to note that hypothetical examples are meant to highlight the ongoing costs of investing in a fund and do not reflect any transaction costs, such as sales charges, redemption fees or exchange fees.
Estimating your actual expenses
To estimate the expenses that you paid over the period, first you will need your account balance at the end of the period:
g For shareholders who receive their account statements from Columbia Management Investment Services Corp., your account balance is available online at www.columbiafunds.com or by calling Shareholder Services at 800.345.6611.
g For shareholders who receive their account statements from their financial intermediary, contact your financial intermediary to obtain your account balance.
1. Divide your ending account balance by $1,000. For example, if an account balance was $8,600 at the end of the period, the result would be 8.6.
2. In the section of the table below titled "Expenses paid during the period," locate the amount for your share class. You will find this number in the column labeled "Actual." Multiply this number by the result from step 1. Your answer is an estimate of the expenses you paid on your account during the period.
If the value of your account falls below the minimum initial investment requirement applicable to you, your account may be subject to a $20 annual fee. This fee is not included in the accompanying table. If you are subject to the fee, keep it in mind when you are estimating the ongoing expenses of investing in the fund and when comparing the expenses of this fund with other funds.
12/01/09 – 05/31/10
| | | Account value at the
beginning of the period ($) | | Account value at the
end of the period ($) | | Expenses paid
during the period ($) | | Fund's annualized
expense ratio (%) | |
| | | Actual | | Hypothetical | | Actual | | Hypothetical | | Actual | | Hypothetical | | Actual | |
| Class A | | | 1,000.00 | | | | 1,000.00 | | | | 1,057.10 | | | | 1,019.70 | | | | 5.39 | | | | 5.29 | | | | 1.05 | | |
| Class B | | | 1,000.00 | | | | 1,000.00 | | | | 1,053.20 | | | | 1,015.96 | | | | 9.21 | | | | 9.05 | | | | 1.80 | | |
| Class C | | | 1,000.00 | | | | 1,000.00 | | | | 1,053.90 | | | | 1,016.70 | | | | 8.45 | | | | 8.30 | | | | 1.65 | | |
| Class Z | | | 1,000.00 | | | | 1,000.00 | | | | 1,058.40 | | | | 1,020.94 | | | | 4.11 | | | | 4.03 | | | | 0.80 | | |
Expenses paid during the period are equal to the annualized expense ratio for the share class, multiplied by the average account value over the period, then multiplied by the number of days in the fund's most recent fiscal half-year and divided by 365.
Had the investment advisor and/or any of its affiliates not waived fees or reimbursed a portion of expenses, account value at the end of the period would have been reduced.
It is important to note that the expense amounts shown in the table are meant to highlight only ongoing costs of investing in the fund and do not reflect any transaction costs, such as sales charges, redemption fees or exchange fees. Therefore, the hypothetical examples provided may not help you determine the relative total costs of owning shares of different funds. If these transaction costs were included, your costs would have been higher.
5
Portfolio Managers' Report – Columbia High Yield Opportunity Fund
Performance data quoted represents past performance and current performance may be lower or higher. Past performance is no guarantee of future results. The investment return and principal value will fluctuate so that shares, when redeemed, may be worth more or less than the original cost. Please visit www.columbiafunds.com for daily and most recent month-end performance updates.
Net asset value per share
as of 05/31/10 ($)
| Class A | | | 3.79 | | |
| Class B | | | 3.79 | | |
| Class C | | | 3.79 | | |
| Class Z | | | 3.79 | | |
Distributions declared per share
06/01/09 – 05/31/10 ($)
| Class A | | | 0.34 | | |
| Class B | | | 0.31 | | |
| Class C | | | 0.31 | | |
| Class Z | | | 0.35 | | |
Top 10 issuers
as of 05/31/10 (%)
| HCA, Inc. | | | 2.3 | | |
| CIT Group, Inc. | | | 1.8 | | |
| Intelsat Luxembourg SA | | | 1.7 | | |
| Ally Financial, Inc. | | | 1.6 | | |
| NRG Energy, Inc. | | | 1.6 | | |
Qwest Communications
International, Inc. | | | 1.6 | | |
| Ford Motor Credit Co., LLC | | | 1.3 | | |
| Chesapeake Energy Corp. | | | 1.0 | | |
| Biomet, Inc. | | | 1.0 | | |
| Digicel Group Ltd. | | | 1.0 | | |
Top 10 issuers is calculated as a percentage of net assets.
Maturity breakdown
as of 05/31/10 (%)
| 0–1 year | | | 0.5 | | |
| 1–3 years | | | 4.1 | | |
| 3–5 years | | | 24.1 | | |
| 5–7 years | | | 39.1 | | |
| 7–10 years | | | 23.5 | | |
| 10–15 years | | | 4.2 | | |
| 15–20 years | | | 2.7 | | |
| 20–30 years | | | 1.8 | | |
Maturity breakdown is based on weighted average life and calculated as a percentage of total investments.
For the 12-month period that ended May 31, 2010, the fund's Class A shares returned 24.50% without sales charge. The fund's benchmarks, the Credit Suisse High Yield Index and the JP Morgan Global High Yield Index, returned 29.96% and 31.38%, respectively. The average return of the fund's peer group, the Lipper High Current Yield Funds Classification, was 26.17%. The fund came out behind its benchmarks, and to a lesser extent its peer group, because it had an underweight in the lowest-quality segment of the high-yield bond market, which outperformed higher-quality issues.
Strong performance from high-yield sector
High-yield bonds posted outsized gains during the past 12 months, after bottoming in December 2008. Investors, reaching for yield, poured money into high-yield bonds as government stimulus measures helped stabilize the economy and interest rates hovered at historical lows. Prices on high-yield bonds began to rise in 2009 despite weak corporate earnings, rising default rates and a volatile equity market. As the economy steadied, many companies were able to issue new debt to refinance near-term maturities and boost liquidity, reducing future default risk. As a result, 12-month trailing default rates dropped from a peak of 13.5% in November 2009 to below 9% in May 2010.
Biggest gains from lowest-quality issues
During the period, CCC-rated high yield bonds were the best performers, returning approximately 60%. The fund had less exposure than the index to CCC-rated bonds, including highly leveraged leveraged buyout (LBO) issues, which hampered performance. This underweight was most pronounced early in the period, when we were concerned about continued economic weakness. Underweights in more economically sensitive industries, such as housing and services, combined with overweights in more defensive industries, including cable and wireline telecommunications, also undermined relative results.
Shift toward more aggressive positioning
An underweight in higher-quality BB-rated bonds aided results, as did our decision to further reduce the fund's stake in this segment as the economic outlook improved. The fund further benefited as we added to lower-quality issues, reducing an underweight in CCC bonds and increasing an overweight in B-rated issues. An overweight in transportation and chemicals, industries that are highly sensitive to the economy's moves, and an underweight in the more defensive food and drug industry were also helpful. The fund picked up ground relative to the index as we shed exposure to the more defensive utilities, cable, health care, food and tobacco industries, and added to more economically-sensitive and higher-yielding areas, such as airlines, financials, broadcasting, housing and wireless telecommunications.
Rationale for cautious optimism
Our outlook for high-yield bonds is positive. Despite a sea of challenges — including the European debt crisis, the potential for moderating economic growth in China and continued high unemployment in the United States, we believe the domestic economy is
6
Portfolio Managers' Report (continued) – Columbia High Yield Opportunity Fund
on the mend. We also believe an improving economy should increase consumer demand, driving improved revenue growth for many high-yield issuers. Valuations in the sector are attractive, following the late-period shift toward higher-quality assets. In addition, yields on high-yield debt look very attractive relative to Treasuries. Many issuers are also better positioned because they refinanced over the past year, which should help lower default rates going forward. We remain excited about opportunities in the sector, and plan to apply our disciplined approach to credit selection to help us take advantage of future market pullbacks.
Portfolio characteristics and holdings are subject to change periodically and may not be representative of current characteristics and holdings. The outlook for the fund may differ from that presented for other Columbia Funds.
Investing in fixed-income securities may involve certain risks, including the credit quality of individual issuers, possible prepayments, market or economic developments and yield and share price fluctuations due to changes in interest rates. When interest rates go up, bond prices typically drop, and vice versa.
Investing in high-yield or "junk" bonds offers the potential for higher income than investments in investment-grade bonds, but also has a higher degree of risk. Changes in economic conditions or other circumstances may adversely affect a high-yield bond issuer's ability to make timely principal and interest payments. Rising interest rates tend to lower the value of all bonds. International investing involves special risks, including foreign taxation, currency fluctuations, risks associated with possible differences in financial standards and other monetary and political risks.
Portfolio structure
as of 05/31/10 (%)
Corporate Fixed-Income
Bonds & Notes | | | 90.7 | | |
| Municipal Bond | | | 0.6 | | |
| Common Stocks | | | 0.2 | | |
| Warrants | | | 0.0 | * | |
| Preferred Stocks | | | 0.0 | * | |
| Short-Term Obligation | | | 8.5 | | |
*Rounds to less than 0.1%
The fund is actively managed and the composition of its portfolio will change over time. Portfolio structure is calculated as a percentage of total investments.
Quality breakdown
as of 05/31/10 (%)
| *AAA | | | 1.9 | | |
| BBB | | | 3.9 | | |
| BB | | | 28.6 | | |
| B | | | 48.9 | | |
| CCC | | | 15.8 | | |
| Other | | | 0.9 | | |
*Repurchase agreement included.
Quality breakdown is calculated as a percentage of total net assets. Ratings shown in the quality breakdown are assigned to individual bonds by taking the lower of the ratings available from one of the following nationally recognized rating agencies: Standard & Poor's or Moody's Investor Services. If a security is rated by only one of the two agencies, that rating is used. If a security is not rated by either of the two agencies, it is designated as Non-Rated. Ratings are relative and subjective and are not absolute standards of quality. The credit quality of the fund's investments does not remove market risk.
30-day SEC yields
as of 05/31/10 (%)
| Class A | | | 7.06 | | |
| Class B | | | 6.67 | | |
| Class C | | | 6.80 | | |
| Class Z | | | 7.67 | | |
The 30-day SEC yields reflect the fund's earning power, net of expenses, expressed as an annualized percentage of the public offering price per share at the end of the period. Had the investment advisor not waived fees or reimbursed a portion of expenses, the 30-day SEC yields would have been reduced.
7
Investment Portfolio – Columbia High Yield Opportunity Fund
May 31, 2010
| Corporate Fixed-Income Bonds & Notes – 95.7% | |
| | | | | Par ($) | | Value ($) | |
| Basic Materials – 8.2% | |
| Chemicals – 2.7% | |
| Chemical-Plastics – 0.7% | |
| Hexion Finance Escrow LLC/Hexion Escrow Corp. | |
| 8.875% 02/01/18 (a) | | | | | 2,610,000 | | | | 2,414,250 | | |
| | | 2,414,250 | | |
| Chemicals-Diversified – 2.0% | |
| INEOS Finance PLC | |
| 9.000% 05/15/15 (a) | | | | | 530,000 | | | | 527,350 | | |
| INEOS Group Holdings PLC | |
| 8.500% 02/15/16 (a) | | | | | 1,835,000 | | | | 1,390,012 | | |
| INVISTA | |
| 9.250% 05/01/12 (a) | | | | | 2,055,000 | | | | 2,088,743 | | |
| Nova Chemicals Corp. | |
| 8.375% 11/01/16 | | | | | 500,000 | | | | 502,500 | | |
| 8.625% 11/01/19 | | | | | 805,000 | | | | 809,025 | | |
| Solutia, Inc. | |
| 8.750% 11/01/17 | | | | | 1,000,000 | | | | 1,025,000 | | |
| | | 6,342,630 | | |
| Chemicals Total | | | 8,756,880 | | |
| Forest Products & Paper – 2.8% | |
| Paper & Related Products – 2.8% | |
| Cascades, Inc. | |
| 7.750% 12/15/17 (a) | | | | | 1,195,000 | | | | 1,153,175 | | |
| Clearwater Paper Corp. | |
| 10.625% 06/15/16 (a) | | | | | 510,000 | | | | 559,725 | | |
| Domtar Corp. | |
| 10.750% 06/01/17 | | | | | 885,000 | | | | 1,035,450 | | |
| Georgia-Pacific Corp. | |
| 8.000% 01/15/24 | | | | | 2,585,000 | | | | 2,694,862 | | |
| NewPage Corp. | |
| 10.000% 05/01/12 | | | | | 1,290,000 | | | | 749,813 | | |
| 11.375% 12/31/14 | | | | | 1,195,000 | | | | 1,117,325 | | |
| PE Paper Escrow GmbH | |
| 12.000% 08/01/14 (a) | | | | | 1,495,000 | | | | 1,637,025 | | |
| | | 8,947,375 | | |
| Forest Products & Paper Total | | | 8,947,375 | | |
| Iron/Steel – 1.1% | |
| Steel-Producers – 1.1% | |
| Russel Metals, Inc. | |
| 6.375% 03/01/14 | | | | | 1,045,000 | | | | 1,000,587 | | |
| Steel Dynamics, Inc. | |
| 7.750% 04/15/16 | | | | | 1,680,000 | | | | 1,671,600 | | |
| | | | | Par (a) | | Value ($) | |
| United States Steel Corp. | |
| 7.000% 02/01/18 | | | | | 845,000 | | | | 834,438 | | |
| | | 3,506,625 | | |
| Iron/Steel Total | | | 3,506,625 | | |
| Metals & Mining – 1.6% | |
| Diversified Minerals – 0.4% | |
| Teck Resources Ltd. | |
| 10.750% 05/15/19 | | | | | 1,240,000 | | | | 1,494,200 | | |
| | | 1,494,200 | | |
| Metal-Diversified – 0.7% | |
| Freeport-McMoRan Copper & Gold, Inc. | |
| 8.375% 04/01/17 | | | | | 130,000 | | | | 141,375 | | |
| Vedanta Resources PLC | |
| 9.500% 07/18/18 (a) | | | | | 1,970,000 | | | | 2,009,400 | | |
| | | 2,150,775 | | |
| Mining Services – 0.5% | |
| Noranda Aluminium Holding Corp. | |
PIK,
7.123% 11/15/14
(11/15/10) (b)(c) | | | | | 1,597,510 | | | | 1,594,450 | | |
| | | 1,594,450 | | |
| Metals & Mining Total | | | 5,239,425 | | |
| Basic Materials Total | | | 26,450,305 | | |
| Communications – 22.3% | |
| Advertising – 0.7% | |
| Advertising Agencies – 0.7% | |
| Interpublic Group of Companies, Inc. | |
| 6.250% 11/15/14 | | | | | 385,000 | | | | 381,150 | | |
| 10.000% 07/15/17 | | | | | 1,700,000 | | | | 1,863,625 | | |
| | | 2,244,775 | | |
| Advertising Total | | | 2,244,775 | | |
| Media – 5.7% | |
| Broadcast Services/Programs – 1.1% | |
| Clear Channel Worldwide Holdings, Inc. | |
| 9.250% 12/15/17 (a) | | | | | 2,075,000 | | | | 2,111,312 | | |
| Liberty Media LLC | |
| 8.250% 02/01/30 | | | | | 1,385,000 | | | | 1,281,125 | | |
| | | 3,392,437 | | |
| Cable TV – 2.5% | |
Cequel Communications Holdings I LLC &
Cequel Capital Corp. | |
| 8.625% 11/15/17 (a) | | | | | 1,005,000 | | | | 969,825 | | |
See Accompanying Notes to Financial Statements.
8
Columbia High Yield Opportunity Fund
May 31, 2010
| Corporate Fixed-Income Bonds & Notes (continued) | |
| | | | | Par (a) | | Value ($) | |
| Charter Communications Holdings II LLC/Charter Communications Holdings II Capital Corp. | |
| 13.500% 11/30/16 | | | | | 1,408,095 | | | | 1,614,029 | | |
| CSC Holdings, Inc. | |
| 8.500% 04/15/14 (a) | | | | | 1,280,000 | | | | 1,331,200 | | |
| 8.500% 06/15/15 (a) | | | | | 1,000,000 | | | | 1,035,000 | | |
| DISH DBS Corp. | |
| 6.625% 10/01/14 | | | | | 1,560,000 | | | | 1,536,600 | | |
| 7.875% 09/01/19 | | | | | 835,000 | | | | 843,350 | | |
| Mediacom LLC/Mediacom Capital Corp. | |
| 9.125% 08/15/19 (a) | | | | | 685,000 | | | | 678,150 | | |
| | | 8,008,154 | | |
| Publishing-Books – 0.8% | |
| TL Acquisitions, Inc. | |
| 10.500% 01/15/15 (a) | | | | | 2,765,000 | | | | 2,509,238 | | |
| | | 2,509,238 | | |
| Radio – 0.9% | |
| CMP Susquehanna Corp. | |
3.430% 05/15/14
(08/12/10) (b)(c)(d) | | | | | 112,000 | | | | 66,080 | | |
| Salem Communications Corp. | |
| 9.625% 12/15/16 | | | | | 1,150,000 | | | | 1,164,375 | | |
| Sirius XM Radio, Inc. | |
| 9.750% 09/01/15 (a) | | | | | 1,640,000 | | | | 1,738,400 | | |
| | | 2,968,855 | | |
| Television – 0.4% | |
| Sinclair Television Group, Inc. | |
| 9.250% 11/01/17 (a) | | | | | 1,345,000 | | | | 1,331,550 | | |
| | | 1,331,550 | | |
| Media Total | | | 18,210,234 | | |
| Telecommunication Services – 15.9% | |
| Cellular Telecommunications – 4.2% | |
| Cricket Communications, Inc. | |
| 9.375% 11/01/14 | | | | | 1,990,000 | | | | 2,004,925 | | |
| Digicel Group Ltd. | |
| 8.875% 01/15/15 (a) | | | | | 3,190,000 | | | | 3,086,325 | | |
| MetroPCS Wireless, Inc. | |
| 9.250% 11/01/14 | | | | | 2,450,000 | | | | 2,523,500 | | |
| Nextel Communications, Inc. | |
| 7.375% 08/01/15 | | | | | 2,585,000 | | | | 2,436,362 | | |
| NII Capital Corp. | |
| 10.000% 08/15/16 | | | | | 600,000 | | | | 642,000 | | |
| Wind Acquisition Finance SA | |
| 11.750% 07/15/17 (a) | | | | | 2,816,000 | | | | 2,872,320 | | |
| | | 13,565,432 | | |
| | | | | Par (a) | | Value ($) | |
| Media – 1.3% | |
| Nielsen Finance LLC/Nielsen Finance Co. | |
| 11.500% 05/01/16 | | | | | 1,925,000 | | | | 2,040,500 | | |
| Quebecor Media, Inc. | |
| 7.750% 03/15/16 | | | | | 2,365,000 | | | | 2,276,312 | | |
| | | 4,316,812 | | |
| Satellite Telecommunications – 1.7% | |
| Intelsat Bermuda SA | |
| 11.250% 02/04/17 | | | | | 2,605,000 | | | | 2,565,925 | | |
| Intelsat Jackson Holdings Ltd. | |
| 11.250% 06/15/16 | | | | | 2,620,000 | | | | 2,764,100 | | |
| | | 5,330,025 | | |
| Telecommunication Equipment – 0.9% | |
| Lucent Technologies, Inc. | |
| 6.450% 03/15/29 | | | | | 3,315,000 | | | | 2,254,200 | | |
| WireCo WorldGroup | |
| 9.500% 05/15/17 (a) | | | | | 660,000 | | | | 644,325 | | |
| | | 2,898,525 | | |
| Telecommunication Services – 2.6% | |
| Clearwire Communications LLC/Clearwire Finance, Inc. | |
| 12.000% 12/01/15 (a) | | | | | 1,440,000 | | | | 1,399,200 | | |
| Global Crossing Ltd. | |
| 12.000% 09/15/15 (a) | | | | | 1,640,000 | | | | 1,787,600 | | |
| ITC Deltacom, Inc. | |
| 10.500% 04/01/16 (a) | | | | | 1,125,000 | | | | 1,080,000 | | |
| PAETEC Holding Corp. | |
| 8.875% 06/30/17 (a) | | | | | 570,000 | | | | 562,875 | | |
| SBA Telecommunications, Inc. | |
| 8.250% 08/15/19 (a) | | | | | 540,000 | | | | 562,950 | | |
| Syniverse Technologies, Inc. | |
| 7.750% 08/15/13 | | | | | 1,095,000 | | | | 1,073,100 | | |
| West Corp. | |
| 11.000% 10/15/16 | | | | | 1,995,000 | | | | 2,014,950 | | |
| | | 8,480,675 | | |
| Telephone-Integrated – 4.9% | |
| Cincinnati Bell, Inc. | |
| 8.250% 10/15/17 | | | | | 1,690,000 | | | | 1,592,825 | | |
| Frontier Communications Corp. | |
| 7.875% 01/15/27 | | | | | 2,670,000 | | | | 2,443,050 | | |
| Level 3 Financing, Inc. | |
| 8.750% 02/15/17 | | | | | 805,000 | | | | 684,250 | | |
| 9.250% 11/01/14 | | | | | 510,000 | | | | 464,100 | | |
| Qwest Communications International, Inc. | |
| 7.500% 02/15/14 | | | | | 1,895,000 | | | | 1,866,575 | | |
| Qwest Corp. | |
| 7.500% 10/01/14 | | | | | 935,000 | | | | 984,088 | | |
| 7.500% 06/15/23 | | | | | 2,260,000 | | | | 2,192,200 | | |
See Accompanying Notes to Financial Statements.
9
Columbia High Yield Opportunity Fund
May 31, 2010
| Corporate Fixed-Income Bonds & Notes (continued) | |
| | | | | Par (a) | | Value ($) | |
| Sprint Capital Corp. | |
| 6.875% 11/15/28 | | | | | 645,000 | | | | 536,156 | | |
| Virgin Media Finance PLC | |
| 9.500% 08/15/16 | | | | | 2,230,000 | | | | 2,285,750 | | |
| Windstream Corp. | |
| 8.625% 08/01/16 | | | | | 2,680,000 | | | | 2,653,200 | | |
| | | 15,702,194 | | |
| Wireless Equipment – 0.3% | |
| Crown Castle International Corp. | |
| 9.000% 01/15/15 | | | | | 870,000 | | | | 914,588 | | |
| | | 914,588 | | |
| Telecommunication Services Total | | | 51,208,251 | | |
| Communications Total | | | 71,663,260 | | |
| Consumer Cyclical – 13.6% | |
| Auto Manufacturers – 0.3% | |
| Auto-Cars/Light Trucks – 0.3% | |
| General Motors Corp. | |
| 7.200% 01/15/11 (e) | | | | | 1,330,000 | | | | 412,300 | | |
| 8.375% 07/15/33 (e) | | | | | 1,150,000 | | | | 373,750 | | |
| | | 786,050 | | |
| Auto Manufacturers Total | | | 786,050 | | |
| Auto Parts & Equipment – 1.4% | |
| Auto/Truck Parts & Equipment-Original – 0.8% | |
| American Axle & Manufacturing Holdings, Inc. | |
| 9.250% 01/15/17 (a) | | | | | 535,000 | | | | 561,750 | | |
| Lear Corp. | |
| 7.875% 03/15/18 | | | | | 410,000 | | | | 399,750 | | |
| 8.125% 03/15/20 | | | | | 140,000 | | | | 136,850 | | |
| TRW Automotive, Inc. | |
| 7.000% 03/15/14 (a) | | | | | 1,475,000 | | | | 1,449,188 | | |
| | | 2,547,538 | | |
| Rubber-Tires – 0.6% | |
| Goodyear Tire & Rubber Co. | |
| 10.500% 05/15/16 | | | | | 1,750,000 | | | | 1,855,000 | | |
| | | 1,855,000 | | |
| Auto Parts & Equipment Total | | | 4,402,538 | | |
| Distribution/Wholesale – 0.3% | |
| Distribution/Wholesale – 0.3% | |
| McJunkin Red Man Corp. | |
| 9.500% 12/15/16 (a) | | | | | 1,045,000 | | | | 1,013,650 | | |
| | | 1,013,650 | | |
| Distribution/Wholesale Total | | | 1,013,650 | | |
| | | | | Par (a) | | Value ($) | |
| Entertainment – 2.1% | |
| Casino Services – 0.2% | |
| Tunica-Biloxi Gaming Authority | |
| 9.000% 11/15/15 (a) | | | | | 625,000 | | | | 562,500 | | |
| | | 562,500 | | |
| Gambling (Non-Hotel) – 1.3% | |
| Boyd Gaming Corp. | |
| 6.750% 04/15/14 | | | | | 250,000 | | | | 225,000 | | |
| 7.125% 02/01/16 | | | | | 690,000 | | | | 589,950 | | |
| Jacobs Entertainment, Inc. | |
| 9.750% 06/15/14 | | | | | 1,225,000 | | | | 1,145,375 | | |
| Pinnacle Entertainment, Inc. | |
| 8.625% 08/01/17 (a) | | | | | 990,000 | | | | 999,900 | | |
| Shingle Springs Tribal Gaming Authority | |
| 9.375% 06/15/15 (a) | | | | | 1,435,000 | | | | 1,119,300 | | |
| | | 4,079,525 | | |
| Music – 0.3% | |
| WMG Acquisition Corp. | |
| 7.375% 04/15/14 | | | | | 550,000 | | | | 517,688 | | |
| WMG Holdings Corp. | |
| 9.500% 12/15/14 | | | | | 610,000 | | | | 597,800 | | |
| | | 1,115,488 | | |
| Racetracks – 0.3% | |
| Speedway Motorsports, Inc. | |
| 8.750% 06/01/16 | | | | | 850,000 | | | | 888,250 | | |
| | | 888,250 | | |
| Resorts/Theme Parks – 0.0% | |
| Six Flags, Inc. | |
| 9.625% 06/01/14 (d)(i) | | | | | 950,000 | | | | — | | |
| | | — | | |
| Entertainment Total | | | 6,645,763 | | |
| Home Builders – 2.2% | |
| Building-Residential/Commercial – 2.2% | |
| Beazer Homes USA, Inc. | |
| 9.125% 06/15/18 | | | | | 1,366,000 | | | | 1,284,040 | | |
| D.R. Horton, Inc. | |
| 5.625% 09/15/14 | | | | | 1,150,000 | | | | 1,138,500 | | |
| 5.625% 01/15/16 | | | | | 720,000 | | | | 684,000 | | |
| KB Home | |
| 5.875% 01/15/15 | | | | | 2,305,000 | | | | 2,111,956 | | |
| Ryland Group, Inc. | |
| 8.400% 05/15/17 | | | | | 680,000 | | | | 714,000 | | |
| Standard Pacific Corp. | |
| 7.000% 08/15/15 | | | | | 1,200,000 | | | | 1,104,000 | | |
| | | 7,036,496 | | |
| Home Builders Total | | | 7,036,496 | | |
See Accompanying Notes to Financial Statements.
10
Columbia High Yield Opportunity Fund
May 31, 2010
| Corporate Fixed-Income Bonds & Notes (continued) | |
| | | | | Par (a) | | Value ($) | |
| Home Furnishings – 0.2% | |
| Home Furnishings – 0.2% | |
| Norcraft Companies LP/Norcraft Finance Corp. | |
| 10.500% 12/15/15 (a) | | | | | 650,000 | | | | 682,500 | | |
| Simmons Co. | |
PIK,
7.351% 02/15/12
(08/16/10) (b)(c)(e)(f) | | | | | 1,922,817 | | | | 4,807 | | |
| | | 687,307 | | |
| Home Furnishings Total | | | 687,307 | | |
| Leisure Time – 0.5% | |
| Cruise Lines – 0.5% | |
| Royal Caribbean Cruises Ltd. | |
| 7.500% 10/15/27 | | | | | 1,855,000 | | | | 1,669,500 | | |
| | | 1,669,500 | | |
| Leisure Time Total | | | 1,669,500 | | |
| Lodging – 3.4% | |
| Casino Hotels – 1.8% | |
| Harrah's Operating Co., Inc. | |
| 11.250% 06/01/17 | | | | | 1,560,000 | | | | 1,634,100 | | |
| MGM Mirage | |
| 6.750% 09/01/12 | | | | | 2,345,000 | | | | 2,163,262 | | |
| Pokagon Gaming Authority | |
| 10.375% 06/15/14 (a) | | | | | 1,070,000 | | | | 1,107,450 | | |
| Snoqualmie Entertainment Authority | |
| 9.125% 02/01/15 (a) | | | | | 1,115,000 | | | | 936,600 | | |
| | | 5,841,412 | | |
| Gambling (Non-Hotel) – 0.8% | |
| Mashantucket Western Pequot Tribe | |
| 8.500% 11/15/15 (a)(g) | | | | | 2,420,000 | | | | 532,400 | | |
| Seminole Indian Tribe of Florida | |
| 6.535% 10/01/20 (a) | | | | | 310,000 | | | | 276,598 | | |
| 7.804% 10/01/20 (a) | | | | | 1,900,000 | | | | 1,727,309 | | |
| | | 2,536,307 | | |
| Hotels & Motels – 0.8% | |
| Host Hotels & Resorts LP | |
| 6.750% 06/01/16 | | | | | 1,325,000 | | | | 1,298,500 | | |
| Starwood Hotels & Resorts Worldwide, Inc. | |
| 6.750% 05/15/18 | | | | | 1,395,000 | | | | 1,377,562 | | |
| | | 2,676,062 | | |
| Lodging Total | | | 11,053,781 | | |
| Retail – 3.0% | |
| Retail-Apparel/Shoe – 0.4% | |
| Limited Brands, Inc. | |
| 8.500% 06/15/19 | | | | | 1,290,000 | | | | 1,373,850 | | |
| | | 1,373,850 | | |
| | | | | Par (a) | | Value ($) | |
| Retail-Drug Stores – 0.5% | |
| Rite Aid Corp. | |
| 9.500% 06/15/17 | | | | | 1,990,000 | | | | 1,596,975 | | |
| | | 1,596,975 | | |
| Retail-Mail Order – 0.2% | |
| QVC, Inc. | |
| 7.500% 10/01/19 (a) | | | | | 685,000 | | | | 667,875 | | |
| | | 667,875 | | |
| Retail-Propane Distributors – 1.1% | |
| AmeriGas Partners LP | |
| 7.125% 05/20/16 | | | | | 1,285,000 | | | | 1,278,575 | | |
| 7.250% 05/20/15 | | | | | 405,000 | | | | 405,000 | | |
| Inergy LP/Inergy Finance Corp. | |
| 8.250% 03/01/16 | | | | | 555,000 | | | | 560,550 | | |
| 8.750% 03/01/15 | | | | | 1,220,000 | | | | 1,244,400 | | |
| | | 3,488,525 | | |
| Retail-Toy Store – 0.7% | |
| Toys R US, Inc. | |
| 7.375% 10/15/18 | | | | | 2,265,000 | | | | 2,146,087 | | |
| | | 2,146,087 | | |
| Retail-Vitamins/Nutritional Supplements – 0.1% | |
| General Nutrition Centers, Inc. | |
PIK,
5.750% 03/15/14
(09/15/10) (b)(c) | | | | | 440,000 | | | | 403,700 | | |
| | | 403,700 | | |
| Retail Total | | | 9,677,012 | | |
| Storage/Warehousing – 0.2% | |
| Storage/Warehousing – 0.2% | |
| Niska Gas Storage U.S. LLC/Niska Gas Storage Canada ULC | |
| 8.875% 03/15/18 (a) | | | | | 690,000 | | | | 693,450 | | |
| | | 693,450 | | |
| Storage/Warehousing Total | | | 693,450 | | |
| Consumer Cyclical Total | | | 43,665,547 | | |
| Consumer Non-Cyclical – 14.0% | |
| Commercial Services – 3.8% | |
| Commercial Services – 1.2% | |
| ARAMARK Corp. | |
| 8.500% 02/01/15 | | | | | 2,020,000 | | | | 2,014,950 | | |
| Iron Mountain, Inc. | |
| 8.000% 06/15/20 | | | | | 1,690,000 | | | | 1,677,325 | | |
| | | 3,692,275 | | |
See Accompanying Notes to Financial Statements.
11
Columbia High Yield Opportunity Fund
May 31, 2010
| Corporate Fixed-Income Bonds & Notes (continued) | |
| | | | | Par (a) | | Value ($) | |
| Commercial Services-Finance – 0.3% | |
| Cardtronics, Inc. | |
| 9.250% 08/15/13 | | | | | 940,000 | | | | 940,000 | | |
| | | 940,000 | | |
| Funeral Services & Related Items – 0.4% | |
| Service Corp. International | |
| 6.750% 04/01/16 | | | | | 595,000 | | | | 587,562 | | |
| 7.000% 06/15/17 | | | | | 800,000 | | | | 776,000 | | |
| | | 1,363,562 | | |
| Private Corrections – 0.3% | |
| Corrections Corp. of America | |
| 6.250% 03/15/13 | | | | | 1,030,000 | | | | 1,031,288 | | |
| | | 1,031,288 | | |
| Rental Auto/Equipment – 1.5% | |
| Ashtead Holdings PLC | |
| 8.625% 08/01/15 (a) | | | | | 1,450,000 | | | | 1,435,500 | | |
| Hertz Corp. | |
| 8.875% 01/01/14 | | | | | 1,000,000 | | | | 1,005,000 | | |
| Rental Service Corp. | |
| 9.500% 12/01/14 | | | | | 1,440,000 | | | | 1,368,000 | | |
| United Rentals North America, Inc. | |
| 10.875% 06/15/16 | | | | | 925,000 | | | | 985,125 | | |
| | | 4,793,625 | | |
| Security Services – 0.1% | |
| Garda World Security Corp. | |
| 9.750% 03/15/17 (a) | | | | | 370,000 | | | | 380,175 | | |
| | | 380,175 | | |
| Commercial Services Total | | | 12,200,925 | | |
| Cosmetics/Personal Care – 0.3% | |
| Cosmetics & Toiletries – 0.3% | |
| Revlon Consumer Products Corp. | |
| 9.750% 11/15/15 (a) | | | | | 990,000 | | | | 1,007,325 | | |
| | | 1,007,325 | | |
| Cosmetics/Personal Care Total | | | 1,007,325 | | |
| Food – 1.5% | |
| Food-Meat Products – 0.6% | |
| JBS USA LLC/JBS USA Finance, Inc. | |
| 11.625% 05/01/14 | | | | | 695,000 | | | | 763,180 | | |
| Smithfield Foods, Inc. | |
| 10.000% 07/15/14 (a) | | | | | 1,170,000 | | | | 1,252,631 | | |
| | | 2,015,811 | | |
| | | | | Par (a) | | Value ($) | |
| Food-Miscellaneous/Diversified – 0.6% | |
| Pinnacle Foods Finance LLC | |
| 9.250% 04/01/15 (a) | | | | | 450,000 | | | | 448,875 | | |
| 9.250% 04/01/15 | | | | | 1,460,000 | | | | 1,456,350 | | |
| | | 1,905,225 | | |
| Retail-Hypermarkets – 0.3% | |
| New Albertsons, Inc. | |
| 8.000% 05/01/31 | | | | | 1,130,000 | | | | 983,100 | | |
| | | 983,100 | | |
| Food Total | | | 4,904,136 | | |
| Healthcare Products – 1.3% | |
| Medical Products – 1.3% | |
| Biomet, Inc. | |
PIK,
10.375% 10/15/17 | | | | | 2,910,000 | | | | 3,095,512 | | |
| DJO Finance LLC/DJO Finance Corp. | |
| 10.875% 11/15/14 | | | | | 320,000 | | | | 332,800 | | |
| 10.875% 11/15/14 (a) | | | | | 590,000 | | | | 613,600 | | |
| | | 4,041,912 | | |
| Healthcare Products Total | | | 4,041,912 | | |
| Healthcare Services – 5.0% | |
| Dialysis Centers – 0.3% | |
| DaVita, Inc. | |
| 7.250% 03/15/15 | | | | | 1,075,000 | | | | 1,069,625 | | |
| | | 1,069,625 | | |
| Medical-HMO – 0.4% | |
| Health Net, Inc. | |
| 6.375% 06/01/17 | | | | | 1,490,000 | | | | 1,363,350 | | |
| | | 1,363,350 | | |
| Medical-Hospitals – 3.1% | |
| Community Health Systems, Inc. | |
| 8.875% 07/15/15 | | | | | 2,590,000 | | | | 2,651,512 | | |
| HCA, Inc. | |
| 9.250% 11/15/16 | | | | | 905,000 | | | | 947,988 | | |
PIK,
9.625% 11/15/16 | | | | | 5,981,000 | | | | 6,295,002 | | |
| | | 9,894,502 | | |
| Physical Therapy/Rehab Centers – 0.6% | |
| Healthsouth Corp. | |
| 8.125% 02/15/20 | | | | | 660,000 | | | | 640,200 | | |
| 10.750% 06/15/16 | | | | | 1,030,000 | | | | 1,112,400 | | |
| | | 1,752,600 | | |
See Accompanying Notes to Financial Statements.
12
Columbia High Yield Opportunity Fund
May 31, 2010
| Corporate Fixed-Income Bonds & Notes (continued) | |
| | | | | Par (a) | | Value ($) | |
| Physician Practice Management – 0.6% | |
| U.S. Oncology Holdings, Inc. | |
PIK,
6.643% 03/15/12
(09/15/10) (b)(c) | | | | | 1,220,000 | | | | 1,102,171 | | |
| U.S. Oncology, Inc. | |
| 9.125% 08/15/17 | | | | | 985,000 | | | | 993,619 | | |
| | | 2,095,790 | | |
| Healthcare Services Total | | | 16,175,867 | | |
| Household Products/Wares – 0.5% | |
| Consumer Products-Miscellaneous – 0.5% | |
| American Greetings Corp. | |
| 7.375% 06/01/16 | | | | | 920,000 | | | | 929,200 | | |
| Jostens IH Corp. | |
| 7.625% 10/01/12 | | | | | 595,000 | | | | 594,926 | | |
| | | 1,524,126 | | |
| Household Products/Wares Total | | | 1,524,126 | | |
| Pharmaceuticals – 1.6% | |
| Medical-Drugs – 1.1% | |
| Elan Finance PLC | |
4.436% 11/15/11
(08/15/10) (b)(c) | | | | | 455,000 | | | | 443,625 | | |
| 8.875% 12/01/13 | | | | | 660,000 | | | | 661,650 | | |
| Patheon, Inc. | |
| 8.625% 04/15/17 (a) | | | | | 825,000 | | | | 825,000 | | |
| Valeant Pharmaceuticals International | |
| 7.625% 03/15/20 (a) | | | | | 300,000 | | | | 293,250 | | |
| 8.375% 06/15/16 | | | | | 1,255,000 | | | | 1,283,237 | | |
| | | 3,506,762 | | |
| Medical-Generic Drugs – 0.2% | |
| Mylan, Inc./PA | |
| 7.875% 07/15/20 (a) | | | | | 620,000 | | | | 620,775 | | |
| | | 620,775 | | |
| Pharmacy Services – 0.3% | |
| Omnicare, Inc. | |
| 6.875% 12/15/15 | | | | | 80,000 | | | | 79,000 | | |
| 7.750% 06/01/20 | | | | | 1,035,000 | | | | 1,037,588 | | |
| | | 1,116,588 | | |
| Pharmaceuticals Total | | | 5,244,125 | | |
| Consumer Non-Cyclical Total | | | 45,098,416 | | |
| | | | | Par (a) | | Value ($) | |
| Diversified – 0.5% | |
| Diversified Holding Companies – 0.5% | |
Reynolds Group DL Escrow, Inc./Reynolds
Group Escrow LLC | |
| 7.750% 10/15/16 (a) | | | | | 1,655,000 | | | | 1,638,450 | | |
| Diversified Holding Companies Total | | | 1,638,450 | | |
| Diversified Total | | | 1,638,450 | | |
| Energy – 10.1% | |
| Coal – 0.4% | |
| Coal – 0.4% | |
| Arch Western Finance LLC | |
| 6.750% 07/01/13 | | | | | 1,210,000 | | | | 1,194,875 | | |
| Consol Energy, Inc. | |
| 8.250% 04/01/20 (a) | | | | | 215,000 | | | | 219,569 | | |
| | | 1,414,444 | | |
| Coal Total | | | 1,414,444 | | |
| Oil & Gas – 7.0% | |
| Oil Companies-Exploration & Production – 6.3% | |
| Antero Resources Finance Corp. | |
| 9.375% 12/01/17 (a) | | | | | 1,290,000 | | | | 1,264,200 | | |
| Berry Petroleum Co. | |
| 10.250% 06/01/14 | | | | | 240,000 | | | | 255,600 | | |
| Chesapeake Energy Corp. | |
| 6.375% 06/15/15 | | | | | 3,315,000 | | | | 3,306,712 | | |
| Cimarex Energy Co. | |
| 7.125% 05/01/17 | | | | | 1,680,000 | | | | 1,671,600 | | |
| Comstock Resources, Inc. | |
| 8.375% 10/15/17 | | | | | 740,000 | | | | 743,700 | | |
| Concho Resources, Inc./Midland TX | |
| 8.625% 10/01/17 | | | | | 850,000 | | | | 860,625 | | |
| Denbury Resources, Inc. | |
| 7.500% 12/15/15 | | | | | 850,000 | | | | 847,875 | | |
| Forest Oil Corp. | |
| 8.500% 02/15/14 | | | | | 1,980,000 | | | | 2,034,450 | | |
| Hilcorp Energy I LP/Hilcorp Finance Co. | |
| 7.750% 11/01/15 (a) | | | | | 1,260,000 | | | | 1,228,500 | | |
| Newfield Exploration Co. | |
| 6.625% 04/15/16 | | | | | 1,170,000 | | | | 1,164,150 | | |
| 6.875% 02/01/20 | | | | | 965,000 | | | | 931,225 | | |
| PetroHawk Energy Corp. | |
| 7.875% 06/01/15 | | | | | 2,770,000 | | | | 2,683,438 | | |
| Pioneer Natural Resources Co. | |
| 7.500% 01/15/20 | | | | | 130,000 | | | | 129,992 | | |
| Quicksilver Resources, Inc. | |
| 7.125% 04/01/16 | | | | | 2,030,000 | | | | 1,832,075 | | |
| Range Resources Corp. | |
| 7.500% 05/15/16 | | | | | 640,000 | | | | 641,600 | | |
See Accompanying Notes to Financial Statements.
13
Columbia High Yield Opportunity Fund
May 31, 2010
| Corporate Fixed-Income Bonds & Notes (continued) | |
| | | | | Par (a) | | Value ($) | |
| Southwestern Energy Co. | |
| 7.500% 02/01/18 | | | | | 655,000 | | | | 687,750 | | |
| | | 20,283,492 | | |
| Oil Refining & Marketing – 0.7% | |
| Frontier Oil Corp. | |
| 8.500% 09/15/16 | | | | | 910,000 | | | | 928,200 | | |
| Tesoro Corp. | |
| 6.625% 11/01/15 | | | | | 1,415,000 | | | | 1,337,175 | | |
| | | 2,265,375 | | |
| Oil & Gas Total | | | 22,548,867 | | |
| Oil & Gas Services – 0.6% | |
| Oil-Field Services – 0.6% | |
| American Petroleum Tankers LLC/AP Tankers Co. | |
| 10.250% 05/01/15 (a) | | | | | 495,000 | | | | 490,050 | | |
| Expro Finance Luxembourg SCA | |
| 8.500% 12/15/16 (a) | | | | | 1,385,000 | | | | 1,343,450 | | |
| | | 1,833,500 | | |
| Oil & Gas Services Total | | | 1,833,500 | | |
| Pipelines – 2.1% | |
| Pipelines – 2.1% | |
| Atlas Pipeline Partners LP | |
| 8.125% 12/15/15 | | | | | 1,295,000 | | | | 1,223,775 | | |
| El Paso Corp. | |
| 6.875% 06/15/14 | | | | | 340,000 | | | | 340,886 | | |
| 7.250% 06/01/18 | | | | | 625,000 | | | | 612,104 | | |
| Kinder Morgan Finance Co. ULC | |
| 5.700% 01/05/16 | | | | | 1,115,000 | | | | 1,064,825 | | |
| MarkWest Energy Partners LP | |
| 6.875% 11/01/14 | | | | | 1,390,000 | | | | 1,327,450 | | |
| 8.500% 07/15/16 | | | | | 720,000 | | | | 723,600 | | |
| Regency Energy Partners LP/Regency Energy Finance Corp. | |
| 8.375% 12/15/13 | | | | | 165,000 | | | | 169,950 | | |
| 9.375% 06/01/16 (a) | | | | | 480,000 | | | | 499,200 | | |
| Southern Star Central Corp. | |
| 6.750% 03/01/16 | | | | | 315,000 | | | | 315,000 | | |
| Williams Companies, Inc. | |
| 7.875% 09/01/21 | | | | | 404,000 | | | | 466,936 | | |
| | | 6,743,726 | | |
| Pipelines Total | | | 6,743,726 | | |
| Energy Total | | | 32,540,537 | | |
| | | | | Par (a) | | Value ($) | |
| Financials – 9.2% | |
| Banks – 2.6% | |
| Commercial Banks-Western U.S. – 0.2% | |
| Zions Bancorporation | |
| 7.750% 09/23/14 | | | | | 755,000 | | | | 759,896 | | |
| | | 759,896 | | |
| Diversified Financial Services – 2.4% | |
| Capital One Capital IV | |
6.745% 02/17/37
(02/17/32) (b)(c) | | | | | 1,115,000 | | | | 919,875 | | |
| Capital One Capital V | |
| 10.250% 08/15/39 | | | | | 885,000 | | | | 951,375 | | |
| CIT Group, Inc. | |
| 7.000% 05/01/17 | | | | | 6,375,000 | | | | 5,753,438 | | |
| | | 7,624,688 | | |
| Banks Total | | | 8,384,584 | | |
| Diversified Financial Services – 5.0% | |
| Finance-Auto Loans – 2.9% | |
| Ally Financial, Inc. | |
| 6.875% 09/15/11 | | | | | 2,801,000 | | | | 2,801,000 | | |
| 8.000% 11/01/31 | | | | | 2,685,000 | | | | 2,443,350 | | |
| Ford Motor Credit Co., LLC | |
| 7.000% 04/15/15 | | | | | 470,000 | | | | 465,191 | | |
| 7.800% 06/01/12 | | | | | 1,540,000 | | | | 1,570,646 | | |
| 8.000% 12/15/16 | | | | | 2,225,000 | | | | 2,229,321 | | |
| | | 9,509,508 | | |
| Finance-Consumer Loans – 0.7% | |
| American General Finance Corp. | |
| 4.875% 07/15/12 | | | | | 200,000 | | | | 180,000 | | |
| 6.900% 12/15/17 | | | | | 585,000 | | | | 465,075 | | |
| SLM Corp. | |
| 8.000% 03/25/20 | | | | | 1,660,000 | | | | 1,476,567 | | |
| | | 2,121,642 | | |
| Finance-Investment Banker/Broker – 0.5% | |
| Cemex Finance LLC | |
| 9.500% 12/14/16 (a) | | | | | 1,650,000 | | | | 1,505,625 | | |
| | | 1,505,625 | | |
| Finance-Leasing Company – 0.3% | |
| International Lease Finance Corp. | |
| 5.625% 09/15/10 | | | | | 975,000 | | | | 967,687 | | |
| | | 967,687 | | |
See Accompanying Notes to Financial Statements.
14
Columbia High Yield Opportunity Fund
May 31, 2010
| Corporate Fixed-Income Bonds & Notes (continued) | |
| | | | | Par (a) | | Value ($) | |
| Finance-Other Services – 0.6% | |
| Icahn Enterprises LP/Icahn Enterprises Finance Corp. | |
| 8.000% 01/15/18 (a) | | | | | 2,160,000 | | | | 2,030,400 | | |
| | | 2,030,400 | | |
| Diversified Financial Services Total | | | 16,134,862 | | |
| Insurance – 1.6% | |
| Insurance Brokers – 0.2% | |
| HUB International Holdings, Inc. | |
| 10.250% 06/15/15 (a) | | | | | 600,000 | | | | 549,000 | | |
| | | 549,000 | | |
| Life/Health Insurance – 0.2% | |
| Provident Companies, Inc. | |
| 7.000% 07/15/18 | | | | | 465,000 | | | | 486,804 | | |
| | | 486,804 | | |
| Multi-Line Insurance – 0.3% | |
| ING Groep NV | |
5.775% 12/29/49
(12/08/15) (b)(c) | | | | | 1,230,000 | | | | 900,717 | | |
| | | 900,717 | | |
| Property/Casualty Insurance – 0.9% | |
| Asurion Corp. | |
6.849% 07/02/15
(06/11/10) (b)(c)(f) | | | | | 713,879 | | | | 684,049 | | |
2nd lien,
6.848% 07/02/15
(06/11/10) (b)(c)(f) | | | | | 976,121 | | | | 954,158 | | |
| Crum & Forster Holdings Corp. | |
| 7.750% 05/01/17 | | | | | 1,425,000 | | | | 1,408,969 | | |
| | | 3,047,176 | | |
| Insurance Total | | | 4,983,697 | | |
| Financials Total | | | 29,503,143 | | |
| Industrials – 10.7% | |
| Aerospace & Defense – 1.5% | |
| Aerospace/Defense – 0.2% | |
| Kratos Defense & Security Solutions, Inc. | |
| 10.000% 06/01/17 (a) | | | | | 615,000 | | | | 608,850 | | |
| | | 608,850 | | |
| Aerospace/Defense-Equipment – 1.0% | |
| BE Aerospace, Inc. | |
| 8.500% 07/01/18 | | | | | 1,265,000 | | | | 1,309,275 | | |
| Sequa Corp. | |
| 11.750% 12/01/15 (a) | | | | | 1,790,000 | | | | 1,790,000 | | |
| | | 3,099,275 | | |
| | | | | Par (a) | | Value ($) | |
| Electronics-Military – 0.3% | |
| L-3 Communications Corp. | |
| 6.375% 10/15/15 | | | | | 1,145,000 | | | | 1,145,000 | | |
| | | 1,145,000 | | |
| Aerospace & Defense Total | | | 4,853,125 | | |
| Building Materials – 0.7% | |
| Building & Construction Products-Miscellaneous – 0.5% | |
| Building Materials Corp. of America | |
| 7.500% 03/15/20 (a) | | | | | 290,000 | | | | 283,475 | | |
| Nortek, Inc. | |
| 11.000% 12/01/13 | | | | | 662,933 | | | | 689,450 | | |
| Ply Gem Industries, Inc. | |
| 11.750% 06/15/13 | | | | | 610,000 | | | | 625,250 | | |
| | | 1,598,175 | | |
| Building Products-Cement/Aggregation – 0.2% | |
| Texas Industries, Inc. | |
| 7.250% 07/15/13 | | | | | 610,000 | | | | 590,175 | | |
| | | 590,175 | | |
| Building Materials Total | | | 2,188,350 | | |
| Electrical Components & Equipment – 0.8% | |
| Wire & Cable Products – 0.8% | |
| Belden, Inc. | |
| 7.000% 03/15/17 | | | | | 1,695,000 | | | | 1,618,725 | | |
| General Cable Corp. | |
| 7.125% 04/01/17 | | | | | 1,045,000 | | | | 1,026,713 | | |
| | | 2,645,438 | | |
| Electrical Components & Equipment Total | | | 2,645,438 | | |
| Electronics – 0.2% | |
| Electronic Components-Miscellaneous – 0.2% | |
| Flextronics International Ltd. | |
| 6.250% 11/15/14 | | | | | 626,000 | | | | 619,740 | | |
| | | 619,740 | | |
| Electronics Total | | | 619,740 | | |
| Engineering & Construction – 0.3% | |
| Building & Construction-Miscellaneous – 0.3% | |
| Esco Corp. | |
| 8.625% 12/15/13 (a) | | | | | 945,000 | | | | 961,538 | | |
| | | 961,538 | | |
| Engineering & Construction Total | | | 961,538 | | |
See Accompanying Notes to Financial Statements.
15
Columbia High Yield Opportunity Fund
May 31, 2010
| Corporate Fixed-Income Bonds & Notes (continued) | |
| | | | | Par (a) | | Value ($) | |
| Environmental Control – 0.3% | |
| Hazardous Waste Disposal – 0.3% | |
| Clean Harbors, Inc. | |
| 7.625% 08/15/16 | | | | | 975,000 | | | | 999,375 | | |
| | | 999,375 | | |
| Environmental Control Total | | | 999,375 | | |
| Machinery-Construction & Mining – 0.5% | |
| Machinery-Construction & Mining – 0.5% | |
| Terex Corp. | |
| 8.000% 11/15/17 | | | | | 1,830,000 | | | | 1,697,325 | | |
| | | 1,697,325 | | |
| Machinery-Construction & Mining Total | | | 1,697,325 | | |
| Machinery-Diversified – 1.0% | |
| Machinery-General Industry – 1.0% | |
| CPM Holdings, Inc. | |
| 10.625% 09/01/14 (a) | | | | | 835,000 | | | | 890,319 | | |
| Manitowoc Co., Inc. | |
| 7.125% 11/01/13 | | | | | 1,495,000 | | | | 1,508,081 | | |
| 9.500% 02/15/18 | | | | | 850,000 | | | | 835,125 | | |
| | | 3,233,525 | | |
| Machinery-Diversified Total | | | 3,233,525 | | |
| Miscellaneous Manufacturing – 1.4% | |
| Diversified Manufacturing Operators – 0.6% | |
| Amsted Industries, Inc. | |
| 8.125% 03/15/18 (a) | | | | | 1,000,000 | | | | 990,000 | | |
| Bombardier, Inc. | |
| 6.300% 05/01/14 (a) | | | | | 1,006,000 | | | | 1,026,120 | | |
| | | 2,016,120 | | |
| Miscellaneous Manufacturing – 0.8% | |
| American Railcar Industries, Inc. | |
| 7.500% 03/01/14 | | | | | 1,125,000 | | | | 1,065,938 | | |
| Trimas Corp. | |
| 9.750% 12/15/17 (a) | | | | | 1,275,000 | | | | 1,294,125 | | |
| | | 2,360,063 | | |
| Miscellaneous Manufacturing Total | | | 4,376,183 | | |
| Packaging & Containers – 2.0% | |
| Containers-Metal/Glass – 0.7% | |
| BWAY Corp. | |
| 10.000% 04/15/14 | | | | | 990,000 | | | | 1,093,950 | | |
| Crown Americas LLC & Crown Americas Capital Corp. | |
| 7.750% 11/15/15 | | | | | 1,135,000 | | | | 1,154,862 | | |
| Crown Americas LLC & Crown Americas Capital Corp. II | |
| 7.625% 05/15/17 (a) | | | | | 95,000 | | | | 95,475 | | |
| | | 2,344,287 | | |
| | | | | Par (a) | | Value ($) | |
| Containers-Paper/Plastic – 1.3% | |
| Graham Packaging Co., LP/GPC Capital Corp. I | |
| 8.250% 01/01/17 (a) | | | | | 1,455,000 | | | | 1,414,987 | | |
| Graphic Packaging International, Inc. | |
| 9.500% 06/15/17 | | | | | 1,250,000 | | | | 1,300,000 | | |
| Solo Cup Co. | |
| 8.500% 02/15/14 | | | | | 1,395,000 | | | | 1,286,888 | | |
| | | 4,001,875 | | |
| Packaging & Containers Total | | | 6,346,162 | | |
| Transportation – 2.0% | |
| Transportation-Marine – 1.0% | |
| Navios Maritime Holdings, Inc. | |
| 9.500% 12/15/14 | | | | | 1,305,000 | | | | 1,269,112 | | |
| Ship Finance International Ltd. | |
| 8.500% 12/15/13 | | | | | 1,085,000 | | | | 1,047,025 | | |
| Teekay Corp. | |
| 8.500% 01/15/20 | | | | | 825,000 | | | | 833,250 | | |
| | | 3,149,387 | | |
| Transportation-Railroad – 0.7% | |
| Kansas City Southern de Mexico SA de CV | |
| 7.625% 12/01/13 | | | | | 1,695,000 | | | | 1,678,050 | | |
| RailAmerica, Inc. | |
| 9.250% 07/01/17 | | | | | 594,000 | | | | 617,760 | | |
| | | 2,295,810 | | |
| Transportation-Services – 0.3% | |
| Bristow Group, Inc. | |
| 7.500% 09/15/17 | | | | | 1,090,000 | | | | 1,057,300 | | |
| | | 1,057,300 | | |
| Transportation Total | | | 6,502,497 | | |
| Industrials Total | | | 34,423,258 | | |
| Technology – 1.7% | |
| Computers – 1.0% | |
| Computer Services – 0.8% | |
| Sungard Data Systems, Inc. | |
| 9.125% 08/15/13 | | | | | 2,650,000 | | | | 2,676,500 | | |
| | | 2,676,500 | | |
| Computers-Memory Devices – 0.2% | |
| Seagate Technology International | |
| 10.000% 05/01/14 (a) | | | | | 555,000 | | | | 622,294 | | |
| | | 622,294 | | |
| Computers Total | | | 3,298,794 | | |
See Accompanying Notes to Financial Statements.
16
Columbia High Yield Opportunity Fund
May 31, 2010
| Corporate Fixed-Income Bonds & Notes (continued) | |
| | | | | Par (a) | | Value ($) | |
| Semiconductors – 0.6% | |
| Electronic Components-Semiconductors – 0.6% | |
| Amkor Technology, Inc. | |
| 9.250% 06/01/16 | | | | | 1,640,000 | | | | 1,719,950 | | |
| | | 1,719,950 | | |
| Semiconductors Total | | | 1,719,950 | | |
| Software – 0.1% | |
| Data Processing/Management – 0.1% | |
| First Data Corp. | |
| 9.875% 09/24/15 | | | | | 360,000 | | | | 293,400 | | |
| | | 293,400 | | |
| Software Total | | | 293,400 | | |
| Technology Total | | | 5,312,144 | | |
| Utilities – 5.4% | |
| Electric – 5.4% | |
| Electric-Generation – 0.6% | |
| Intergen NV | |
| 9.000% 06/30/17 (a) | | | | | 2,060,000 | | | | 2,060,000 | | |
| | | 2,060,000 | | |
| Electric-Integrated – 2.1% | |
| CMS Energy Corp. | |
| 6.875% 12/15/15 | | | | | 660,000 | | | | 701,208 | | |
| Energy Future Holdings Corp. | |
| 10.000% 01/15/20 (a) | | | | | 1,760,000 | | | | 1,751,200 | | |
| Ipalco Enterprises, Inc. | |
| 7.250% 04/01/16 (a) | | | | | 1,025,000 | | | | 1,042,937 | | |
| Mirant Americas Generation LLC | |
| 8.500% 10/01/21 | | | | | 2,280,000 | | | | 2,086,200 | | |
| Texas Competitive Electric Holdings Co. LLC | |
| 10.250% 11/01/15 | | | | | 1,625,000 | | | | 1,088,750 | | |
| | | 6,670,295 | | |
| Independent Power Producer – 2.7% | |
| AES Corp. | |
| 7.750% 03/01/14 | | | | | 1,440,000 | | | | 1,440,000 | | |
| 8.000% 10/15/17 | | | | | 1,165,000 | | | | 1,144,613 | | |
| Dynegy Holdings, Inc. | |
| 7.750% 06/01/19 | | | | | 1,145,000 | | | | 827,263 | | |
| NRG Energy, Inc. | |
| 7.375% 02/01/16 | | | | | 1,065,000 | | | | 1,030,387 | | |
| 7.375% 01/15/17 | | | | | 4,410,000 | | | | 4,189,500 | | |
| | | 8,631,763 | | |
| Electric Total | | | 17,362,058 | | |
| Utilities Total | | | 17,362,058 | | |
Total Corporate Fixed-Income Bonds & Notes
(cost of $305,141,869) | | | 307,657,118 | | |
| Municipal Bond – 0.7% | |
| | | | | Par (a) | | Value ($) | |
| California – 0.7% | |
| CA Cabazon Band Mission Indians | |
Series 2004,
7.358% 10/01/11
(10/01/10) (b)(c) | | | | | 3,250,000 | | | | 2,135,380 | | |
| California Total | | | 2,135,380 | | |
Total Municipal Bond
(cost of $3,250,000) | | | 2,135,380 | | |
| Common Stocks – 0.2% | |
| | | | | Shares | | | |
| Consumer Discretionary – 0.2% | |
| Hotels, Restaurants & Leisure – 0.2% | |
| Six Flags Entertainment Corp. (h) | | | | | 21,698 | | | | 759,420 | | |
| Hotels, Restaurants & Leisure Total | | | 759,420 | | |
| Consumer Discretionary Total | | | 759,420 | | |
| Industrials – 0.0% | |
| Commercial Services & Supplies – 0.0% | |
| Fairlane Management Corp. (d)(h)(i) | | | | | 50,004 | | | | — | | |
| Commercial Services & Supplies Total | | | — | | |
| Industrials Total | | | — | | |
| Materials – 0.0% | |
| Metals & Mining – 0.0% | |
| Ormet Corp. (h) | | | | | 380 | | | | 1,330 | | |
| Metals & Mining Total | | | 1,330 | | |
| Materials Total | | | 1,330 | | |
Total Common Stocks
(cost of $1,518,991) | | | 760,750 | | |
| Warrants – 0.0% | |
| | | | | Units | | | |
| Communications – 0.0% | |
| Telecommunication Services – 0.0% | |
Jazztel PLC
Expires 07/15/10 (a)(d)(h)(i) | | | | | 1,435 | | | | — | | |
| Telecommunication Services Total | | | — | | |
| Communications Total | | | — | | |
See Accompanying Notes to Financial Statements.
17
Columbia High Yield Opportunity Fund
May 31, 2010
| Warrants (continued) | |
| | | | | Units | | Value ($) | |
| Consumer Non-Cyclical – 0.0% | |
| Food – 0.0% | |
Pathmark Stores, Inc.
Expires 09/19/10 (d)(h)(i) | | | | | 58,758 | | | | — | | |
| Food Total | | | — | | |
| Consumer Non-Cyclical Total | | | — | | |
| Financials – 0.0% | |
| Banks – 0.0% | |
CNB Capital Trust I
Expires 03/23/19 (a)(d)(h) | | | | | 29,954 | | | | 300 | | |
| Banks Total | | | 300 | | |
| Financials Total | | | 300 | | |
Total Warrants
(cost of $7,281,695) | | | 300 | | |
| Preferred Stocks – 0.0% | |
| | | | | Shares | | | |
| Communications – 0.0% | |
| Media – 0.0% | |
CMP Susquehanna Radio Holdings Corp.,
Series A (a)(d)(h) | | | | | 26,213 | | | | 262 | | |
| PTV, Inc., Series A 10.000% | | | | | 18 | | | | 2 | | |
| Media Total | | | 264 | | |
| Communications Total | | | 264 | | |
Total Preferred Stocks
(cost of $262) | | | 264 | | |
| Short-Term Obligation – 9.0% | |
| | | | | Par ($) | | | |
Repurchase agreement with
Fixed Income Clearing Corp.,
dated 05/28/10, due 06/01/10
at 0.140%, collateralized by a
U.S. Government Agency
obligation maturing
03/29/13, market value
$29,399,838 (repurchase
p roceeds $28,823,448) | | | | | 28,823,000 | | | | 28,823,000 | | |
Total Short-Term Obligation
(cost of $28,823,000) | | | 28,823,000 | | |
Total Investments – 105.6%
(cost of $346,015,817) (j) | | | 339,376,812 | | |
| Other Assets & Liabilities, Net – (5.6)% | | | (18,111,984 | ) | |
| Net Assets – 100.0% | | | 321,264,828 | | |
Notes to Investment Portfolio:
(a) Security exempt from registration pursuant to Rule 144A under the Securities Act of 1933. These securities may be resold in transactions exempt from registration, normally to qualified institutional buyers. At May 31, 2010, these securities, which are not illiquid except for the following, amounted to $80,287,877, which represents 25.0% of net assets.
| Security | | Acquisition
Date(s) | | Par/
Shares/
Units | | Cost | | Value | |
CMP Susquehanna
Radio Holdings Corp.,
Series A | | 03/26/09 | | | 26,213 | | | $ | 262 | | | $ | 262 | | |
CNB Capital Trust I
Warrants
Expiring 03/23/19 | | 03/26/06 | | | 29,954 | | | | 300 | | | | 300 | | |
Hexion Finance
Escrow LLC/Hexion
Escrow Corp.
8.875% 02/01/18 | | 05/13/10-
05/28/10 | | $ | 2,610,000 | | | | 2,406,738 | | | | 2,414,250 | | |
Jazztel PLC Warrants
Expiring 07/15/10 | | 10/21/02 | | $ | 1,435 | | | | 2,467 | | | | — | | |
Regency Energy Partners
9.375% 06/01/16 | | 05/12/10-
05/27/10 | | $ | 480,000 | | | | 501,250 | | | | 499,200 | | |
Seminole Indian
Tribe of Florida
7.804% 10/01/20 | | 09/26/07-
10/04/07 | | $ | 1,900,000 | | | | 1,928,200 | | | | 1,727,309 | | |
| | | | | | | $ | 4,641,321 | | |
(b) The interest rate shown on floating rate or variable rate securities reflects the rate at May 31, 2010.
(c) Parenthetical date represents the next interest rate reset date for the security.
(d) Represents fair value as determined in good faith under procedures approved by the Board of Trustees. At May 31, 2010, the value of these securities amounted to $66,642, which represents less than 0.1% of net assets.
(e) The issuer has filed for bankruptcy protection under Chapter 11, and is in default of certain debt covenants. Income is not being accrued. At May 31, 2010, the value of these securities amounted to $790,857, which represents 0.2% of net assets.
(f) Loan participation agreement.
(g) The issuer is in default of certain debt covenants. Income is not being accrued. At May 31, 2010, the value of this security amounted to $532,400, which represents 0.2% of net assets.
(h) Non-income producing security.
(i) Security has no value.
(j) Cost for federal income tax purposes is $346,679,978.
See Accompanying Notes to Financial Statements.
18
Columbia High Yield Opportunity Fund
May 31, 2010
The following table summarizes the inputs used, as of May 31, 2010, in valuing the Fund's assets:
| Description | | Quoted
Prices
(Level 1) | | Other
Significant
Observable
Inputs
(Level 2) | | Significant
Unobservable
Inputs
(Level 3) | | Total | |
Corporate Fixed-Income
Bonds & Notes | |
| Basic Materials | | $ | — | | | $ | 26,450,305 | | | $ | — | | | $ | 26,450,305 | | |
| Communications | | | — | | | | 71,597,180 | | | | 66,080 | | | | 71,663,260 | | |
| Consumer Cyclical | | | — | | | | 43,665,547 | | | | — | | | | 43,665,547 | | |
| Consumer Non-Cyclical | | | — | | | | 45,098,416 | | | | — | | | | 45,098,416 | | |
| Diversified | | | — | | | | 1,638,450 | | | | — | | | | 1,638,450 | | |
| Energy | | | — | | | | 32,540,537 | | | | — | | | | 32,540,537 | | |
| Financials | | | — | | | | 29,503,143 | | | | — | | | | 29,503,143 | | |
| Industrials | | | — | | | | 34,423,258 | | | | — | | | | 34,423,258 | | |
| Technology | | | — | | | | 5,312,144 | | | | — | | | | 5,312,144 | | |
| Utilities | | | — | | | | 17,362,058 | | | | — | | | | 17,362,058 | | |
Total Corporate Fixed-Income
Bonds & Notes | | | — | | | | 307,591,038 | | | | 66,080 | | | | 307,657,118 | | |
| Total Municipal Bond | | | — | | | | 2,135,380 | | | | — | | | | 2,135,380 | | |
| Total Common Stocks | | | 760,750 | | | | — | | | | — | | | | 760,750 | | |
| Total Warrants | | | — | | | | — | | | | 300 | | | | 300 | | |
| Total Preferred Stocks | | | 2 | | | | — | | | | 262 | | | | 264 | | |
| Total Short-Term Obligation | | | — | | | | 28,823,000 | | | | — | | | | 28,823,000 | | |
| Total Investments | | | 760,752 | | | | 338,549,418 | | | | 66,642 | | | | 339,376,812 | | |
Unrealized Appreciation on
Forward Foreign Currency
Exchange Contracts | | | — | | | | 39,751 | | | | — | | | | 39,751 | | |
Unrealized Depreciation on
Forward Foreign Currency
Exchange Contracts | | | — | | | | (11,778 | ) | | | — | | | | (11,778 | ) | |
| Total | | $ | 760,752 | | | $ | 338,577,391 | | | $ | 66,642 | | | $ | 339,404,785 | | |
The Fund's assets assigned to the Level 2 input category include certain foreign securities for which a third party statistical pricing service may be employed for purposes of fair market valuation.
The following table reconciles asset balances for the twelve month period ending May 31, 2010, in which significant unobservable inputs (Level 3) were used in determining value:
Investments in
Securities | | Balance
as of
May 31,
2009 | | Accrued
Discounts
(Premiums) | | Realized
Gain
(Loss) | | Change in
Unrealized
Appreciation
(Depreciation) | | Purchases | | Sales | | Transfers
into
Level 3 | | Transfers
out of
Level 3 | | Balance
as of
May 31, 2010 | |
Corporate Fixed-Income
Bonds & Notes | | | | | | | | | | | | | | | | | | | | | | | | | | | | | | | | | | | | | |
| Communications | | $ | 50,400 | | | $ | 1,941 | | | $ | — | | | $ | 13,739 | | | $ | — | | | $ | — | | | $ | — | | | $ | — | | | $ | 66,080 | | |
| Preferred Stocks | | | | | | | | | | | | | | | | | | | | | | | | | | | | | | | | | | | | | |
| Communications | | | 262 | | | | — | | | | — | | | | — | | | | — | | | | — | | | | — | | | | — | | | | 262 | | |
| Warrants | | | | | | | | | | | | | | | | | | | | | | | | | | | | | | | | | | | | | |
| Consumer Non-Cyclical | | | 7 | | | | — | | | | — | | | | (7 | ) | | | — | | | | — | | | | — | | | | — | | | | — | | |
| Financials | | | 300 | | | | — | | | | — | | | | — | | | | — | | | | — | | | | — | | | | — | | | | 300 | | |
| | | $ | 50,969 | | | $ | 1,941 | | | $ | — | | | $ | 13,732 | | | $ | — | | | $ | — | | | $ | — | | | $ | — | | | $ | 66,642 | | |
The information in the above reconciliation represents fiscal year to date activity for any securities identified as using Level 3 inputs at either the beginning or the end of the current fiscal period.
The change in unrealized appreciation attributed to securities owned at May 31, 2010, which were valued using significant unobservable inputs (Level 3) amounted to $13,732. This amount is included in net change in unrealized appreciation on the Statement of Changes in Net Assets.
For more information on valuation inputs, and their aggregation into the levels used in the tables above, please refer to the Security Valuation section in the accompanying Notes to Financial Statements.
See Accompanying Notes to Financial Statements.
19
Columbia High Yield Opportunity Fund
May 31, 2010
Forward foreign currency exchange contracts outstanding on May 31, 2010 are:
Foreign Exchange Rate Risk
Forward
Foreign
Currency
Exchange
Contracts
to Buy | | Value | | Aggregate
Face Value | | Settlement
Date | | Unrealized
Depreciation | |
| EUR | | | | $ | 202,484 | | | $ | 204,509 | | | 06/04/10 | | $ | (2,025 | ) | |
| EUR | | | | | 978,128 | | | | 987,881 | | | 06/10/10 | | | (9,753 | ) | |
| | | | | | | | | $ | (11,778 | ) | |
Forward
Foreign
Currency
Exchange
Contracts
to Sell | | Value | | Aggregate
Face Value | | Settlement
Date | | Unrealized
Appreciation | |
| EUR | | | | $ | 202,484 | | | $ | 212,218 | | | 06/04/10 | | $ | 9,734 | | |
| EUR | | | | | 978,128 | | | | 1,008,145 | | | 06/10/10 | | | 30,017 | | |
| | | | | | | | | $ | 39,751 | | |
At May 31, 2010, the asset allocation of the Fund is as follows:
| Asset Allocation (Unaudited) | | % of
Net Assets | |
| Corporate Fixed-Income Bonds & Notes | | | 95.7 | | |
| Municipal Bond | | | 0.7 | | |
| Common Stocks | | | 0.2 | | |
| Warrants | | | 0.0 | * | |
| Preferred Stocks | | | 0.0 | * | |
| | | | 96.6 | | |
| Short-Term Obligation | | | 9.0 | | |
| Other Assets & Liabilities, Net | | | (5.6 | ) | |
| | | | 100.0 | | |
* Rounds to less than 0.1%.
| Acronym | | Name | |
| | EUR | | | Euro | |
|
| | PIK | | | Payment-In-Kind | |
|
See Accompanying Notes to Financial Statements.
20
Statement of Assets and Liabilities – Columbia High Yield Opportunity Fund
May 31, 2010
| | | | | ($) | |
| Assets | | Investments, at cost | | | 346,015,817 | | |
| | | Investments, at value | | | 339,376,812 | | |
| | | Cash | | | 34 | | |
| | | Unrealized appreciation on forward foreign currency exchange contracts | | | 39,751 | | |
| | | Receivable for: | | | | | |
| | | Investments sold | | | 8,262,843 | | |
| | | Fund shares sold | | | 216,952 | | |
| | | Interest | | | 7,524,281 | | |
| | | Foreign tax reclaims | | | 503 | | |
| | | Expense reimbursement due from investment advisor | | | 57,179 | | |
| | | Trustees' deferred compensation plan | | | 61,953 | | |
| | | Prepaid expenses | | | 12,331 | | |
| | | Total Assets | | | 355,552,639 | | |
| Liabilities | | Unrealized depreciation on forward foreign currency exchange contracts | | | 11,778 | | |
| | | Payable for: | | | | | |
| | | Investments purchased | | | 32,126,776 | | |
| | | Fund shares repurchased | | | 435,289 | | |
| | | Distributions | | | 1,248,018 | | |
| | | Investment advisory fee | | | 170,557 | | |
| | | Pricing and bookkeeping fees | | | 11,219 | | |
| | | Transfer agent fee | | | 70,238 | | |
| | | Trustees' fees | | | 250 | | |
| | | Audit fee | | | 53,650 | | |
| | | Custody fee | | | 2,300 | | |
| | | Distribution and service fees | | | 64,744 | | |
| | | Chief compliance officer expenses | | | 327 | | |
| | | Trustees' deferred compensation plan | | | 61,953 | | |
| | | Other liabilities | | | 30,712 | | |
| | | Total Liabilities | | | 34,287,811 | | |
| | | Net Assets | | | 321,264,828 | | |
| Net Assets Consist of | | Paid-in capital | | | 449,669,461 | | |
| | | Overdistributed net investment income | | | (2,292,629 | ) | |
| | | Accumulated net realized loss | | | (119,500,972 | ) | |
| | | Net unrealized appreciation (depreciation) on: | | | | | |
| | | Investments | | | (6,639,005 | ) | |
| | | Forward foreign currency exchange contracts | | | 27,973 | | |
| | | Net Assets | | | 321,264,828 | | |
See Accompanying Notes to Financial Statements.
21
Statement of Assets and Liabilities – Columbia High Yield Opportunity Fund
May 31, 2010 (continued)
| Class A | | Net assets | | $ | 184,252,510 | | |
| | | Shares outstanding | | | 48,637,125 | | |
| | | Net asset value per share | | $ | 3.79 | (a) | |
| | | Maximum sales charge | | | 4.75 | % | |
| | | Maximum offering price per share ($3.79/0.9525) | | $ | 3.98 | (b) | |
| Class B | | Net assets | | $ | 16,148,606 | | |
| | | Shares outstanding | | | 4,262,628 | | |
| | | Net asset value and offering price per share | | $ | 3.79 | (a) | |
| Class C | | Net assets | | $ | 12,769,392 | | |
| | | Shares outstanding | | | 3,370,880 | | |
| | | Net asset value and offering price per share | | $ | 3.79 | (a) | |
| Class Z | | Net assets | | $ | 108,094,320 | | |
| | | Shares outstanding | | | 28,533,729 | | |
| | | Net asset value, offering and redemption price per share | | $ | 3.79 | | |
(a) Redemption price per share is equal to net asset value less any applicable contingent deferred sales charge.
(b) On sales of $50,000 or more the offering price is reduced.
See Accompanying Notes to Financial Statements.
22
Statement of Operations – Columbia High Yield Opportunity Fund
For the Year Ended May 31, 2010
| | | | | ($) | |
| Investment Income | | Interest | | | 28,407,207 | | |
| Expenses | | Investment advisory fee | | | 2,049,448 | | |
| | | Distribution fee: | | | | | |
| | | Class B | | | 157,948 | | |
| | | Class C | | | 97,822 | | |
| | | Service fee: | | | | | |
| | | Class A | | | 470,938 | | |
| | | Class B | | | 52,642 | | |
| | | Class C | | | 32,566 | | |
| | | Transfer agent fee | | | 477,108 | | |
| | | Pricing and bookkeeping fees | | | 113,155 | | |
| | | Trustees' fees | | | 32,369 | | |
| | | Custody fee | | | 14,515 | | |
| | | Chief compliance officer expenses | | | 925 | | |
| | | Other expenses | | | 282,258 | | |
| | | Expenses before interest expense | | | 3,781,694 | | |
| | | Interest expense | | | 1,248 | | |
| | | Total Expenses | | | 3,782,942 | | |
| | | Fees waived or expenses reimbursed by investment advisor | | | (141,185 | ) | |
| | | Fees waived by distributor—Class C | | | (19,591 | ) | |
| | | Expense reductions | | | (39 | ) | |
| | | Net Expenses | | | 3,622,127 | | |
| | | Net Investment Income | | | 24,785,080 | | |
Net Realized and Unrealized Gain
(Loss) on Investments, Foreign
Currency and Forward Foreign
Currency Exchange Contracts | |
| | | Net realized gain on: | | | | | |
| | | Investments | | | 246,308 | | |
| | | Foreign currency transactions and forward foreign currency
exchange contracts | | | 75,167 | | |
| | Net realized gain | | | 321,475 | | |
| | | Net change in unrealized appreciation (depreciation) on: | | | | | |
| | | Investments | | | 48,792,676 | | |
| | | Foreign currency translations and forward foreign currency
exchange contracts | | | 109,443 | | |
| | | Net change in unrealized appreciation (depreciation) | | | 48,902,119 | | |
| | | Net Gain | | | 49,223,594 | | |
| | | Net Increase Resulting from Operations | | | 74,008,674 | | |
See Accompanying Notes to Financial Statements.
23
Statement of Changes in Net Assets – Columbia High Yield Opportunity Fund
| | | | | Year Ended May 31, | |
| Increase (Decrease) in Net Assets | | | | 2010 ($) | | 2009 ($) | |
| Operations | | Net investment income | | | 24,785,080 | | | | 28,026,019 | | |
| | | Net realized gain (loss) on investments, foreign currency
transactions, forward foreign currency exchange
contracts and credit default swap contracts | | | 321,475 | | | | (50,936,194 | ) | |
| | | Net change in unrealized appreciation (depreciation) on
investments, foreign currency translations, forward
foreign currency exchange contracts and credit default
swap contracts | | | 48,902,119 | | | | (26,518,865 | ) | |
| | | Net increase (decrease) resulting from operations | | | 74,008,674 | | | | (49,429,040 | ) | |
| Distributions to Shareholders | | From net investment income: | | | | | | | | | |
| | | Class A | | | (17,071,049 | ) | | | (15,203,927 | ) | |
| | | Class B | | | (1,751,647 | ) | | | (2,672,149 | ) | |
| | | Class C | | | (1,106,430 | ) | | | (1,026,219 | ) | |
| | | Class Z | | | (11,127,296 | ) | | | (10,359,634 | ) | |
| | | Total distributions to shareholders | | | (31,056,422 | ) | | | (29,261,929 | ) | |
| | | Net Capital Stock Transactions | | | (39,502,420 | ) | | | 5,521,355 | | |
| | | Increase from regulatory settlements | | | 133,454 | | | | 821,549 | | |
| | | Total increase (decrease) in net assets | | | 3,583,286 | | | | (72,348,065 | ) | |
| Net Assets | | Beginning of period | | | 317,681,542 | | | | 390,029,607 | | |
| | | End of period | | | 321,264,828 | | | | 317,681,542 | | |
| | | Undistributed (overdistributed) net investment income
at end of period | | | (2,292,629 | ) | | | 406,326 | | |
See Accompanying Notes to Financial Statements.
24
Statement of Changes in Net Assets (continued) – Columbia High Yield Opportunity Fund
| | | Capital Stock Activity | |
| | | Year Ended
May 31, 2010 | | Year Ended
May 31, 2009 | |
| | | Shares | | Dollars ($) | | Shares | | Dollars ($) | |
| Class A | |
| Subscriptions | | | 8,318,813 | | | | 31,487,410 | | | | 12,818,180 | | | | 39,971,078 | | |
| Distributions reinvested | | | 2,581,565 | | | | 9,663,388 | | | | 2,840,215 | | | | 9,319,400 | | |
| Redemptions | | | (13,378,029 | ) | | | (50,009,107 | ) | | | (13,799,446 | ) | | | (44,568,251 | ) | |
| Net increase (decrease) | | | (2,477,651 | ) | | | (8,858,309 | ) | | | 1,858,949 | | | | 4,722,227 | | |
| Class B | |
| Subscriptions | | | 184,940 | | | | 661,584 | | | | 461,001 | | | | 1,434,268 | | |
| Distributions reinvested | | | 262,227 | | | | 978,083 | | | | 442,379 | | | | 1,464,723 | | |
| Redemptions | | | (3,287,225 | ) | | | (12,223,852 | ) | | | (5,010,704 | ) | | | (16,819,376 | ) | |
| Net decrease | | | (2,840,058 | ) | | | (10,584,185 | ) | | | (4,107,324 | ) | | | (13,920,385 | ) | |
| Class C | |
| Subscriptions | | | 418,033 | | | | 1,537,653 | | | | 630,374 | | | | 1,984,895 | | |
| Distributions reinvested | | | 177,579 | | | | 664,707 | | | | 190,993 | | | | 625,997 | | |
| Redemptions | | | (723,614 | ) | | | (2,708,990 | ) | | | (969,194 | ) | | | (3,241,767 | ) | |
| Net decrease | | | (128,002 | ) | | | (506,630 | ) | | | (147,827 | ) | | | (630,875 | ) | |
| Class Z | |
| Subscriptions | | | 7,510,656 | | | | 27,350,410 | | | | 17,063,143 | | | | 56,882,748 | | |
| Distributions reinvested | | | 501,381 | | | | 1,871,962 | | | | 417,658 | | | | 1,373,247 | | |
| Redemptions | | | (13,102,656 | ) | | | (48,775,668 | ) | | | (13,306,620 | ) | | | (42,905,607 | ) | |
| Net increase (decrease) | | | (5,090,619 | ) | | | (19,553,296 | ) | | | 4,174,181 | | | | 15,350,388 | | |
See Accompanying Notes to Financial Statements.
25
Financial Highlights – Columbia High Yield Opportunity Fund
Selected data for a share outstanding throughout each period is as follows:
| | | Year Ended May 31, | |
| Class A Shares | | 2010 | | 2009 | | 2008 | | 2007 | | 2006 | |
| Net Asset Value, Beginning of Period | | $ | 3.33 | | | $ | 4.17 | | | $ | 4.72 | | | $ | 4.50 | | | $ | 4.56 | | |
| Income from Investment Operations: | |
| Net investment income (a) | | | 0.27 | | | | 0.30 | | | | 0.31 | | | | 0.33 | | | | 0.33 | | |
Net realized and unrealized gain (loss) on investments,
foreign currency and credit default swap contracts | | | 0.53 | | | | (0.83 | ) | | | (0.55 | ) | | | 0.23 | | | | (0.03 | ) | |
| Total from investment operations | | | 0.80 | | | | (0.53 | ) | | | (0.24 | ) | | | 0.56 | | | | 0.30 | | |
| Less Distributions to Shareholders: | |
| From net investment income | | | (0.34 | ) | | | (0.32 | ) | | | (0.31 | ) | | | (0.34 | ) | | | (0.36 | ) | |
| Increase from regulatory settlements | | | — | (b) | | | 0.01 | | | | — | | | | — | | | | — | | |
| Net Asset Value, End of Period | | $ | 3.79 | | | $ | 3.33 | | | $ | 4.17 | | | $ | 4.72 | | | $ | 4.50 | | |
| Total return (c) | | | 24.50 | %(d) | | | (12.04 | )% | | | (5.03 | )%(d) | | | 12.98 | % | | | 6.70 | %(d) | |
| Ratios to Average Net Assets/Supplemental Data: | |
| Net expenses before interest expense (e) | | | 1.08 | % | | | 1.10 | % | | | 1.13 | % | | | 1.12 | % | | | 1.12 | % | |
| Interest expense | | | — | %(f) | | | — | | | | — | %(f) | | | — | %(f) | | | — | | |
| Net expenses (e) | | | 1.08 | % | | | 1.10 | % | | | 1.13 | % | | | 1.12 | % | | | 1.12 | % | |
| Waiver/Reimbursement | | | 0.04 | % | | | — | | | | 0.01 | % | | | — | | | | 0.02 | % | |
| Net investment income (e) | | | 7.23 | % | | | 9.08 | % | | | 7.23 | % | | | 7.19 | % | | | 7.28 | % | |
| Portfolio turnover rate | | | 60 | % | | | 44 | % | | | 50 | % | | | 75 | % | | | 61 | % | |
| Net assets, end of period (000s) | | $ | 184,253 | | | $ | 170,321 | | | $ | 205,330 | | | $ | 270,866 | | | $ | 245,713 | | |
(a) Per share data was calculated using the average shares outstanding during the period.
(b) Rounds to less than $0.01 per share.
(c) Total return at net asset value assuming all distributions reinvested and no initial sales charge or contingent deferred sales charge.
(d) Had the investment advisor and/or any of its affiliates not waived fees or reimbursed a portion of expenses, total return would have been reduced.
(e) The benefits derived from expense reductions had an impact of less than 0.01%.
(f) Rounds to less than 0.01%.
See Accompanying Notes to Financial Statements.
26
Financial Highlights – Columbia High Yield Opportunity Fund
Selected data for a share outstanding throughout each period is as follows:
| | | Year Ended May 31, | |
| Class B Shares | | 2010 | | 2009 | | 2008 | | 2007 | | 2006 | |
| Net Asset Value, Beginning of Period | | $ | 3.33 | | | $ | 4.17 | | | $ | 4.72 | | | $ | 4.50 | | | $ | 4.56 | | |
| Income from Investment Operations: | |
| Net investment income (a) | | | 0.24 | | | | 0.28 | | | | 0.28 | | | | 0.29 | | | | 0.30 | | |
Net realized and unrealized gain (loss) on investments,
foreign currency and credit default swap contracts | | | 0.53 | | | | (0.84 | ) | | | (0.55 | ) | | | 0.24 | | | | (0.04 | ) | |
| Total from investment operations | | | 0.77 | | | | (0.56 | ) | | | (0.27 | ) | | | 0.53 | | | | 0.26 | | |
| Less Distributions to Shareholders: | |
| From net investment income | | | (0.31 | ) | | | (0.29 | ) | | | (0.28 | ) | | | (0.31 | ) | | | (0.32 | ) | |
| Increase from regulatory settlements | | | — | (b) | | | 0.01 | | | | — | | | | — | | | | — | | |
| Net Asset Value, End of Period | | $ | 3.79 | | | $ | 3.33 | | | $ | 4.17 | | | $ | 4.72 | | | $ | 4.50 | | |
| Total return (c) | | | 23.59 | %(d) | | | (12.69 | )% | | | (5.73 | )%(d) | | | 12.15 | % | | | 5.91 | %(d) | |
| Ratios to Average Net Assets/Supplemental Data: | |
| Net expenses before interest expense (e) | | | 1.83 | % | | | 1.85 | % | | | 1.88 | % | | | 1.87 | % | | | 1.87 | % | |
| Interest expense | | | — | %(f) | | | — | | | | — | %(f) | | | — | %(f) | | | — | | |
| Net expenses (e) | | | 1.83 | % | | | 1.85 | % | | | 1.88 | % | | | 1.87 | % | | | 1.87 | % | |
| Waiver/Reimbursement | | | 0.04 | % | | | — | | | | 0.01 | % | | | — | | | | 0.02 | % | |
| Net investment income (e) | | | 6.50 | % | | | 8.35 | % | | | 6.47 | % | | | 6.46 | % | | | 6.55 | % | |
| Portfolio turnover rate | | | 60 | % | | | 44 | % | | | 50 | % | | | 75 | % | | | 61 | % | |
| Net assets, end of period (000s) | | $ | 16,149 | | | $ | 23,665 | | | $ | 46,732 | | | $ | 88,774 | | | $ | 135,122 | | |
(a) Per share data was calculated using the average shares outstanding during the period.
(b) Rounds to less than $0.01 per share.
(c) Total return at net asset value assuming all distributions reinvested and no contingent deferred sales charge.
(d) Had the investment advisor and/or any of its affiliates not waived fees or reimbursed a portion of expenses, total return would have been reduced.
(e) The benefits derived from expense reductions had an impact of less than 0.01%.
(f) Rounds to less than 0.01%.
See Accompanying Notes to Financial Statements.
27
Financial Highlights – Columbia High Yield Opportunity Fund
Selected data for a share outstanding throughout each period is as follows:
| | | Year Ended May 31, | |
| Class C Shares | | 2010 | | 2009 | | 2008 | | 2007 | | 2006 | |
| Net Asset Value, Beginning of Period | | $ | 3.33 | | | $ | 4.17 | | | $ | 4.72 | | | $ | 4.50 | | | $ | 4.56 | | |
| Income from Investment Operations: | |
| Net investment income (a) | | | 0.25 | | | | 0.28 | | | | 0.29 | | | | 0.30 | | | | 0.31 | | |
Net realized and unrealized gain (loss) on investments,
foreign currency and credit default swap contracts | | | 0.52 | | | | (0.83 | ) | | | (0.55 | ) | | | 0.23 | | | | (0.04 | ) | |
| Total from investment operations | | | 0.77 | | | | (0.55 | ) | | | (0.26 | ) | | | 0.53 | | | | 0.27 | | |
| Less Distributions to Shareholders: | |
| From net investment income | | | (0.31 | ) | | | (0.30 | ) | | | (0.29 | ) | | | (0.31 | ) | | | (0.33 | ) | |
| Increase from regulatory settlements | | | — | (b) | | | 0.01 | | | | — | | | | — | | | | — | | |
| Net Asset Value, End of Period | | $ | 3.79 | | | $ | 3.33 | | | $ | 4.17 | | | $ | 4.72 | | | $ | 4.50 | | |
| Total return (c)(d) | | | 23.76 | % | | | (12.57 | )% | | | (5.59 | )% | | | 12.31 | % | | | 6.07 | % | |
| Ratios to Average Net Assets/Supplemental Data: | |
| Net expenses before interest expense (e) | | | 1.68 | % | | | 1.70 | % | | | 1.73 | % | | | 1.72 | % | | | 1.72 | % | |
| Interest expense | | | — | %(f) | | | — | | | | — | %(f) | | | — | %(f) | | | — | | |
| Net expenses (e) | | | 1.68 | % | | | 1.70 | % | | | 1.73 | % | | | 1.72 | % | | | 1.72 | % | |
| Waiver/Reimbursement | | | 0.19 | % | | | 0.15 | % | | | 0.16 | % | | | 0.15 | % | | | 0.17 | % | |
| Net investment income (e) | | | 6.63 | % | | | 8.49 | % | | | 6.63 | % | | | 6.60 | % | | | 6.70 | % | |
| Portfolio turnover rate | | | 60 | % | | | 44 | % | | | 50 | % | | | 75 | % | | | 61 | % | |
| Net assets, end of period (000s) | | $ | 12,769 | | | $ | 11,658 | | | $ | 15,202 | | | $ | 21,161 | | | $ | 23,084 | | |
(a) Per share data was calculated using the average shares outstanding during the period.
(b) Rounds to less than $0.01 per share.
(c) Total return at net asset value assuming all distributions reinvested and no contingent deferred sales charge.
(d) Had the investment advisor and/or any of its affiliates not waived fees or reimbursed a portion of expenses, total return would have been reduced.
(e) The benefits derived from expense reductions had an impact of less than 0.01%.
(f) Rounds to less than 0.01%.
See Accompanying Notes to Financial Statements.
28
Financial Highlights – Columbia High Yield Opportunity Fund
Selected data for a share outstanding throughout each period is as follows:
| | | Year Ended May 31, | |
| Class Z Shares | | 2010 | | 2009 | | 2008 | | 2007 | | 2006 | |
| Net Asset Value, Beginning of Period | | $ | 3.33 | | | $ | 4.17 | | | $ | 4.72 | | | $ | 4.50 | | | $ | 4.56 | | |
| Income from Investment Operations: | |
| Net investment income (a) | | | 0.28 | | | | 0.31 | | | | 0.31 | | | | 0.34 | | | | 0.34 | | |
Net realized and unrealized gain (loss) on investments,
foreign currency and credit default swap contracts | | | 0.53 | | | | (0.83 | ) | | | (0.54 | ) | | | 0.23 | | | | (0.03 | ) | |
| Total from investment operations | | | 0.81 | | | | (0.52 | ) | | | (0.23 | ) | | | 0.57 | | | | 0.31 | | |
| Less Distributions to Shareholders: | |
| From net investment income | | | (0.35 | ) | | | (0.33 | ) | | | (0.32 | ) | | | (0.35 | ) | | | (0.37 | ) | |
| Increase from regulatory settlements | | | — | (b) | | | 0.01 | | | | — | | | | — | | | | — | | |
| Net Asset Value, End of Period | | $ | 3.79 | | | $ | 3.33 | | | $ | 4.17 | | | $ | 4.72 | | | $ | 4.50 | | |
| Total return (c) | | | 24.80 | %(d) | | | (11.83 | )% | | | (4.79 | )%(d) | | | 13.26 | % | | | 6.97 | %(d) | |
| Ratios to Average Net Assets/Supplemental Data: | |
| Net expenses before interest expense (e) | | | 0.83 | % | | | 0.85 | % | | | 0.88 | % | | | 0.87 | % | | | 0.87 | % | |
| Interest expense | | | — | %(f) | | | — | | | | — | %(f) | | | — | %(f) | | | — | | |
| Net expenses (e) | | | 0.83 | % | | | 0.85 | % | | | 0.88 | % | | | 0.87 | % | | | 0.87 | % | |
| Waiver/Reimbursement | | | 0.04 | % | | | — | | | | 0.01 | % | | | — | | | | 0.02 | % | |
| Net investment income (e) | | | 7.48 | % | | | 9.39 | % | | | 7.47 | % | | | 7.44 | % | | | 7.53 | % | |
| Portfolio turnover rate | | | 60 | % | | | 44 | % | | | 50 | % | | | 75 | % | | | 61 | % | |
| Net assets, end of period (000s) | | $ | 108,094 | | | $ | 112,037 | | | $ | 122,766 | | | $ | 29,220 | | | $ | 11,190 | | |
(a) Per share data was calculated using the average shares outstanding during the period.
(b) Rounds to less than $0.01 per share.
(c) Total return at net asset value assuming all distributions reinvested.
(d) Had the investment advisor and/or any of its affiliates not waived fees or reimbursed a portion of expenses, total return would have been reduced.
(e) The benefits derived from expense reductions had an impact of less than 0.01%.
(f) Rounds to less than 0.01%.
See Accompanying Notes to Financial Statements.
29
Notes to Financial Statements – Columbia High Yield Opportunity Fund
May 31, 2010
Note 1. Organization
Columbia High Yield Opportunity Fund (the "Fund"), a series of Columbia Funds Series Trust I (the "Trust"), is a diversified portfolio. The Trust is registered under the Investment Company Act of 1940, as amended (the "1940 Act"), as an open-end management investment company organized as a Massachusetts business trust.
Investment Objective
The Fund seeks total return, consisting of current income and capital appreciation.
Fund Shares
The Trust may issue an unlimited number of shares, and the Fund offers four classes of shares: Class A, Class B, Class C and Class Z. Each share class has its own expense structure and sales charges, as applicable. Effective June 22, 2009, the Fund no longer accepts investments from new or existing investors in the Fund's Class B shares, except in connection with the reinvestment of any dividend and/or capital gain distributions in Class B shares of the Fund and exchanges by existing Class B shareholders of the other Columbia Funds.
Class A shares are subject to a maximum front-end sales charge of 4.75% based on the amount of initial investment. Class A shares purchased without an initial sales charge in accounts aggregating $1 million to $50 million at the time of purchase are subject to a 1.00% contingent deferred sales charge ("CDSC") if the shares are sold within one year after purchase. Class B shares are subject to a maximum CDSC of 5.00% based upon the holding period after purchase. Class B shares will convert to Class A shares eight years after purchase. Class C shares are subject to a 1.00% CDSC on shares sold within one year after purchase. Class Z shares are offered continuously at net asset value. There are certain restrictions on the purchase of Class Z shares, as described in the Fund's prospectus.
Note 2. Significant Accounting Policies
The preparation of financial statements in accordance with accounting principles generally accepted in the United States of America ("GAAP") requires management to make certain estimates and assumptions that affect the reported amounts of assets and liabilities, the disclosure of contingent assets and liabilities at the date of the financial statements and the reported amounts of revenue and expenses during the reporting period. Actual results could differ from those estimates.
Management has evaluated the events and transactions that have occurred through the date the financial statements were issued and noted no items requiring adjustment of the financial statements or additional disclosures.
The following is a summary of significant accounting policies consistently followed by the Fund in the preparation of its financial statements.
Security Valuation
Debt securities generally are valued by pricing services approved by the Trust's Board of Trustees, based upon market transactions for normal, institutional-size trading units of similar securities. The services may use various pricing techniques which take into account appropriate factors such as yield, quality, coupon rate, maturity, type of issue, trading characteristics and other data, as well as broker quotes. Debt securities for which quotations are readily available are valued at an over-the-counter or exchange bid quotation.
Certain debt securities, which tend to be more thinly traded and of lesser quality, are priced based on fundamental analysis of the financial condition of the issuer and the estimated value of any collateral. Valuations developed through pricing techniques may vary from the actual amounts realized upon sale of the securities, and the potential variation may be greater for those securities valued using fundamental analysis.
Equity securities are valued at the last sale price on the principal exchange on which they trade, except for securities traded on the NASDAQ, which are valued at the NASDAQ official close price. Unlisted securities or listed securities for which there were no sales during the day are valued at the closing bid price on such exchanges or over-the-counter markets.
Short-term investments maturing in 60 days or less are valued at amortized cost, which approximates market value.
Forward foreign currency exchange contracts are valued at the prevailing forward exchange rate of the underlying currencies.
Foreign securities are generally valued at the last sale price on the foreign exchange or market on which they trade. If any foreign share prices are not readily available as a result of limited share activity, the securities are valued at the last sale
30
Columbia High Yield Opportunity Fund, May 31, 2010
price of the local shares in the principal market in which such securities are normally traded.
Generally, trading in foreign securities is substantially completed each day at various times prior to the close of the New York Stock Exchange ("NYSE"). The values of such securities used in computing the net asset value of the Fund's shares are determined as of such times. Foreign currency exchange rates are generally determined at 4:00 p.m. Eastern (U.S.) time. Occasionally, events affecting the values of such foreign securities and such exchange rates may occur between the times at which they are determined and the close of the customary trading session of the NYSE, which would not be reflected in the computation of the Fund's net asset value. If events materially affecting the values of such foreign securities occur and it is determined that market quotations are not reliable, then these foreign securities will be valued at their fair value using procedures approved by the Board of Trustees.
Investments for which market quotations are not readily available, or that have quotations which management believes are not reliable, are valued at fair value as determined in good faith under consistently applied procedures established by and under the general supervision of the Board of Trustees. If a security is valued at fair value, such value is likely to be different from the last quoted market price for the security. The determination of fair value often requires significant judgment. To determine fair value, management may use assumptions including but not limited to future cash flows and estimated risk premiums. Multiple inputs from various sources may be used to determine value.
GAAP establishes a hierarchy that prioritizes the inputs to valuation techniques used to measure fair value giving the highest priority to unadjusted quoted prices in active markets for identical securities (level 1 measurements) and the lowest priority to unobservable inputs (level 3 measurements) when market prices are not readily available or reliable. The three levels of the fair value hierarchy are described below:
• Level 1 – quoted prices in active markets for identical securities
• Level 2 – prices determined using other significant observable inputs (including quoted prices for similar securities, interest rates, prepayment speeds, credit risk and others)
• Level 3 – prices determined using significant unobservable inputs. In situations where quoted prices or observable inputs are unavailable or less reliable, unobservable inputs may be used. Unobservable inputs may include management's own assumptions about the factors market participants would use in pricing an investment.
The inputs or methodology used for valuing securities are not necessarily an indication of the risk associated with investing in those securities.
On January 21, 2010, the Financial Accounting Standards Board issued an Accounting Standards Update (the "amendment"), Fair Value Measurements and Disclosures (Topic 820): Improving Disclosures about Fair Value Measurements, which provides guidance on how investment assets and liabilities are to be valued and disclosed. Specifically, the amendment requires reporting entities to disclose the input and valuation techniques used to measure fair value for both recurring and nonrecurring fair value measurements for Level 2 or Level 3 positions. The amendment also requires that transfers between all levels (including Level 1 and Level 2) be disclosed on a gross basis (i.e., transfers out must be disclosed separately from transfers in), and requires disclosure of the reason(s) for the tr ansfer. Additionally purchases, sales, issuances and settlements must be disclosed on a gross basis in the Level 3 rollforward. The effective date of the amendment is for interim and annual periods beginning after December 15, 2009; except for the requirement to provide the Level 3 activity for purchases, sales, issuances and settlements on a gross basis, which will be effective for interim and annual periods beginning after December 15, 2010. At this time, management is evaluating the implications of the amendment and the impact to the financial statements.
Security Transactions
Security transactions are accounted for on the trade date. Cost is determined and gains (losses) are based upon the specific identification method for both financial statement and federal income tax purposes.
Derivative Instruments
The Fund may invest in derivative instruments. For additional information on derivative instruments, please see Note 6.
31
Columbia High Yield Opportunity Fund, May 31, 2010
Repurchase Agreements
The Fund may engage in repurchase agreement transactions with institutions that the Fund's investment advisor has determined are creditworthy. The Fund, through its custodian, receives delivery of the underlying securities collateralizing a repurchase agreement. The investment advisor is responsible for determining that the collateral is at least equal, at all times, to the value of the repurchase obligation including interest. A repurchase agreement transaction involves certain risks in the event of default or insolvency of the counterparty. These risks include possible delays in or restrictions on the Fund's ability to dispose of the underlying securities and a possible decline in the value of the underlying securities during the period while the Fund seeks to assert its rights.
Loan Participations and Commitments
The Fund may invest in loan participations. When the Fund purchases a loan participation, the Fund typically enters into a contractual relationship with the lender or third party selling such participation ("Selling Participant"), but not the borrower. However, the Fund assumes the credit risk of the borrower, Selling Participant and any other persons interpositioned between the Fund and the borrower. The Fund may not directly benefit from the collateral supporting the senior loan which it has purchased from the Selling Participant.
Delayed Delivery Securities
The Fund may trade securities on other than normal settlement terms, including securities purchased or sold on a "when-issued" basis. This may increase the risk if the other party to the transaction fails to deliver and causes the Fund to subsequently invest at less advantageous prices. The Fund identifies within its portfolio of investments cash or liquid securities in an amount equal to the delayed delivery commitment.
Foreign Currency Transactions and Translations
The values of all assets and liabilities quoted in foreign currencies are translated into U.S. dollars at that day's exchange rates. Net realized and unrealized gains (losses) on foreign currency transactions and translations include gains (losses) arising from the fluctuation in exchange rates between trade and settlement dates on securities transactions, gains (losses) arising from the disposition of foreign currency and currency gains (losses) between the accrual and payment dates on dividends, interest income and foreign withholding taxes.
For financial statement purposes, the Fund does not distinguish that portion of gains (losses) on investments which is due to changes in foreign exchange rates from that which is due to changes in market prices of the investments. Such fluctuations are included with the net realized and unrealized gains (losses) on investments on the Statement of Operations.
Income Recognition
Interest income is recorded on the accrual basis. Premium and discount are amortized and accreted, respectively, on all debt securities, unless otherwise noted.
Corporate actions and dividend income are recorded on the ex-date.
The value of additional securities received as an income payment is recorded as income and as the cost basis of such securities.
Expenses
General expenses of the Trust are allocated to the Fund and other series of the Trust based upon relative net assets or other expense allocation methodologies determined by the nature of the expense. Expenses directly attributable to the Fund are charged to the Fund.
Determination of Class Net Asset Value
All income, expenses (other than class-specific expenses, as shown on the Statement of Operations) and realized and unrealized gains (losses) are allocated to each class of the Fund on a daily basis for purposes of determining the net asset value of each class. Income and expenses are allocated to each class based on the settled shares method, while realized and unrealized gains (losses) are allocated based on the relative net assets of each class.
Federal Income Tax Status
The Fund intends to qualify each year as a "regulated investment company" under Subchapter M of the Internal
32
Columbia High Yield Opportunity Fund, May 31, 2010
Revenue Code, as amended, and will distribute substantially all of its tax exempt or taxable income, if any, for its tax year, and as such will not be subject to federal income taxes. In addition, the Fund intends to distribute in each calendar year substantially all of its net investment income, capital gains and certain other amounts, if any, such that the Fund should not be subject to federal excise tax. Therefore, no federal income or excise tax provision is recorded.
Distributions to Shareholders
Distributions from net investment income are declared daily and paid monthly. Net realized capital gains, if any, are distributed at least annually. Income distributions and capital gain distributions are determined in accordance with federal income tax regulations which may differ from GAAP.
Indemnification
In the normal course of business, the Fund enters into contracts that contain a variety of representations and warranties and which provide general indemnities. The Fund's maximum exposure under these arrangements is unknown because this would involve future claims against the Fund. Also, under the Trust's organizational documents and by contract, the Trustees and officers of the Trust are indemnified against certain liabilities that may arise out of actions relating to their duties to the Trust. However, based on experience, the Fund expects the risk of loss due to these representations, warranties and indemnities to be minimal.
Note 3. Federal Tax Information
The timing and character of income and capital gain distributions are determined in accordance with income tax regulations, which may differ from GAAP. Reclassifications are made to the Fund's capital accounts for permanent tax differences to reflect income and gains available for distribution (or available capital loss carryforwards) under income tax regulations.
For the year ended May 31, 2010, permanent book and tax basis differences resulting primarily from differing treatments for post-October loss deferral, paydowns, discount accretion/premium amortization on debt securities, Section 988 bond bifurcation, expired capital loss carryforwards and proceeds from litigation settlements were identified and reclassified among the components of the Fund's net assets as follows:
Overdistributed
Net Investment
Income | | Accumulated
Net Realized
Loss | | Paid-In Capital | |
| $ | 3,572,387 | | | $ | 167,315,965 | | | $ | (170,888,352 | ) | |
Net investment income and net realized gains (losses), as disclosed on the Statement of Operations, and net assets were not affected by this reclassification.
The tax character of distributions paid during the years ended May 31, 2010 and May 31, 2009 was as follows:
| | | May 31, | |
| Distributions paid from | | 2010 | | 2009 | |
| Ordinary Income* | | $ | 31,056,422 | | | $ | 29,261,929 | | |
* For tax purposes short-term capital gain distributions, if any, are considered ordinary income distributions.
As of May 31, 2010, the components of distributable earnings on a tax basis were as follows:
Undistributed
Ordinary
Income | | Undistributed
Long-Term
Capital Gains | | Net Unrealized
Depreciation* | |
| $ | — | | | $ | — | | | $ | (7,303,166 | ) | |
* The differences between book-basis and tax-basis net unrealized depreciation are primarily due to deferral of losses from wash sales and discount accretion/premium amortization on debt securities.
Unrealized appreciation and depreciation at May 31, 2010, based on cost of investments for federal income tax purposes were:
| Unrealized appreciation | | $ | 12,550,631 | | |
| Unrealized depreciation | | | (19,853,797 | ) | |
| Net unrealized depreciation | | $ | (7,303,166 | ) | |
The following capital loss carryforwards may be available to reduce taxable income arising from future net realized gains
33
Columbia High Yield Opportunity Fund, May 31, 2010
on investments, if any, to the extent permitted by the Internal Revenue Code:
| Year of Expiration | | Capital Loss
Carryforwards | |
| | 2011 | | | $ | 26,917,567 | | |
| | 2012 | | | | 1,461,417 | | |
| | 2013 | | | | 3,844,857 | | |
| | 2014 | | | | 7,033,993 | | |
| | 2015 | | | | 6,703,180 | | |
| | 2016 | | | | 378,711 | | |
| | 2017 | | | | 25,681,397 | | |
| | 2018 | | | | 44,544,886 | | |
| | Total | | | $ | 116,566,008 | | |
Capital loss carryforwards of $170,855,160 expired during the year ended May 31, 2010.
The availability of a portion of the capital loss carryforwards acquired by the Fund as a result of its merger with High Yield Fund, a series of Excelsior Funds Trust, has been limited in certain years and has been excluded from the schedule of available loss carryforwards above.
Of the capital loss carryforwards attributable to the Fund, $47,582,376 ($40,103,941 expiring May 31, 2011, $1,461,417 expiring May 31, 2012 and $6,017,018 expiring May 31, 2013) was obtained in the merger with High Yield Fund. Utilization of these losses could be subject to limitations imposed by the Internal Revenue Code.
Under current tax rules, certain currency and capital losses realized after October 31 may be deferred and treated as occurring on the first day of the following fiscal year. As of May 31, 2010, post-October capital losses of $2,834,285 attributed to security transactions were deferred to June 1, 2010.
Management is required to determine whether a tax position of the Fund is more likely than not to be sustained upon examination by the applicable taxing authority, including resolution of any related appeals or litigation processes, based on the technical merits of the position. The tax benefit to be recognized by the Fund is measured as the largest amount of benefit that is greater than fifty percent likely of being realized upon ultimate settlement. Management is not aware of any tax positions for which it is reasonably possible that the total amounts of unrecognized tax benefits will significantly change in the next twelve months. However, management's conclusions may be subject to review and adjustment at a later date based on factors including, but not limited to, new tax laws, regulations, and administrative interpretations (including relevant court decisions). The Fund's federal tax returns for the prior three fiscal year s remain subject to examination by the Internal Revenue Service.
Note 4. Fees and Compensation Paid to Affiliates
Investment Advisory Fee
After the close of business on April 30, 2010, Ameriprise Financial, Inc. ("Ameriprise Financial") acquired a portion of the asset management business of Columbia Management Group, LLC (the "Transaction"), including the business of managing the Fund. In connection with the closing of the Transaction (the "Closing"), RiverSource Investments, LLC, a wholly owned subsidiary of Ameriprise Financial, became the investment advisor of the Fund and subsequently changed its name to Columbia Management Investment Advisers, LLC (the "New Advisor"). The New Advisor receives a monthly investment advisory fee based on the Fund's average daily net assets at the following annual rates:
| Average Daily Net Assets | | Annual Fee Rate | |
| First $500 million | | | 0.60 | % | |
| $500 million to $1 billion | | | 0.55 | % | |
| $1 billion to $1.5 billion | | | 0.52 | % | |
| Over $1.5 billion | | | 0.49 | % | |
Prior to the Closing, Columbia Management Advisors, LLC ("Columbia"), an indirect, wholly owned subsidiary of Bank of America Corporation ("BOA"), provided investment advisory services to the Fund under the same fee structure.
For the year ended May 31, 2010, the Fund's effective investment advisory fee rate was 0.60% of the Fund's average daily net assets.
Administration Fee
Effective upon the Closing, the New Advisor became the administrator of the Fund under a new Administrative Services Agreement (the "Administrative Agreement"). Under
34
Columbia High Yield Opportunity Fund, May 31, 2010
the Administrative Agreement, the New Advisor provides administrative and other services to the Fund, including services previously performed under the Pricing and Bookkeeping Oversight and Services Agreement discussed below. The New Advisor does not receive a fee for its services under the Administrative Agreement.
Pricing and Bookkeeping Fees
Prior to the Closing, the Fund entered into a Financial Reporting Services Agreement (the "Financial Reporting Services Agreement") with State Street Bank and Trust Company ("State Street") and Columbia pursuant to which State Street provides financial reporting services to the Fund. The Fund also entered into an Accounting Services Agreement (collectively with the Financial Reporting Services Agreement, the "State Street Agreements") with State Street and Columbia pursuant to which State Street provides accounting services to the Fund. Upon the Closing, Columbia assigned and delegated its rights and obligations under the State Street Agreements to the New Advisor. Under the State Street Agreements, the Fund pays State Street an annual fee of $38,000 paid monthly plus an additional monthly fee based on an annualized percentage rate of average daily net assets of the Fund for the month. The aggregate fee will not exceed $140,000 per year (exclusive of out-of-pocket expenses and charges). The Fund also reimburses State Street for certain out-of-pocket expenses and charges.
Also prior to the Closing, the Fund entered into a Pricing and Bookkeeping Oversight and Services Agreement (the "Services Agreement") with Columbia. Under the Services Agreement, Columbia provided services related to Fund expenses and the requirements of the Sarbanes-Oxley Act of 2002, and provided oversight of the accounting and financial reporting services provided by State Street. Under the Services Agreement, the Fund reimbursed Columbia for out-of-pocket expenses. The Services Agreement was terminated upon the Closing. These services are now provided under the Administrative Agreement discussed above.
Transfer Agent Fee
In connection with the Closing, RiverSource Service Corporation, a wholly owned subsidiary of Ameriprise Financial, became the transfer agent of the Fund and subsequently changed its name to Columbia Management Investment Services Corp. (the "New Transfer Agent"). The transfer agent fee rates paid by the Fund did not change as a result of the change in transfer agent.
Prior to the Closing, Columbia Management Services, Inc. (the "Former Transfer Agent"), an affiliate of Columbia and an indirect, wholly owned subsidiary of BOA, provided shareholder services to the Fund and contracted with Boston Financial Data Services ("BFDS") to serve as sub-transfer agent. The Former Transfer Agent was entitled to receive a fee for its services, paid monthly, at the annual rate of $22.36 per account plus reimbursement of certain sub-transfer agent fees paid by the Former Transfer Agent (exclusive of BFDS fees), calculated based on assets held in omnibus accounts and intended to recover the cost of payments to other parties (including affiliates of BOA) for services to those accounts. Prior to November 1, 2009, the annual rate was $17.34 per account. The Former Transfer Agent paid the fees of BFDS for services as sub-transfer agent and was not entitled to reimbursement for such fees from the Fund. The arrang ement with BFDS has been continued by the New Transfer Agent.
The Former Transfer Agent retained, as additional compensation for its services, fees for wire, telephone and redemption orders, Individual Retirement Account ("IRA") trustee agent fees and account transcript fees due to the Former Transfer Agent from shareholders of the Fund and credits (net of bank charges) earned with respect to balances in accounts the Former Transfer Agent maintained in connection with its services to the Fund. The Former Transfer Agent also received reimbursement for certain out-of-pocket expenses.
An annual minimum account balance fee of $20 may apply to certain accounts with a value below the Fund's initial minimum investment requirements to reduce the impact of small accounts on transfer agent fees. These minimum account balance fees are recorded as part of expense reductions on the Statement of Operations. For the year ended May 31, 2010, no minimum account balance fees were charged.
Underwriting Discounts, Service and Distribution Fees
In connection with the Closing, RiverSource Fund Distributors, Inc., an indirect wholly owned subsidiary of Ameriprise Financial, became the distributor of the Fund and subsequently changed its name to Columbia Management Investment Distributors, Inc. (the "New Distributor"). Prior to the Closing, Columbia Management Distributors, Inc. (the "Former Distributor"), an affiliate of Columbia and an indirect, wholly owned subsidiary of BOA, was the principal underwriter of the Fund's shares. There were no changes to
35
Columbia High Yield Opportunity Fund, May 31, 2010
the underwriting discount structure of the Fund or the service or distribution fee rates paid by the Fund as a result of the Transaction.
For the year ended May 31, 2010, the New Distributor and Former Distributor retained net underwriting discounts of $12,796 on sales of the Fund's Class A shares and received net CDSC fees of $157, $12,197 and $1,882 on Class A, Class B and Class C share redemptions, respectively.
The Fund has adopted distribution and shareholder servicing plans (the "Plans") pursuant to Rule 12b-1 under the 1940 Act for Class A, Class B and Class C shares, which require the payment of distribution and service fees. The fees are intended to compensate the New Distributor and/or eligible selling and/or servicing agents for selling shares of the Fund and providing services to investors.
Payments under the Plans, which are calculated daily and paid monthly, are based on the average daily net assets of the applicable class of the Fund at the following annual rates:
| Distribution Fee | | Service Fee | |
| Class B | | Class C | | Class A | | Class B | | Class C | |
| | 0.75 | % | | | 0.75 | % | | | 0.25 | % | | | 0.25 | % | | | 0.25 | % | |
The Former Distributor voluntarily waived a portion of the distribution fee for Class C shares so that the combined distribution and service fees did not exceed 0.85% annually of Class C shares average daily net assets. This arrangement has been continued by the New Distributor and may be modified or terminated by the New Distributor at any time.
Fee Waivers and Expense Reimbursements
In connection with the Closing, the New Advisor has voluntarily agreed to reimburse a portion of the Fund's expenses so that the Fund's ordinary operating expenses (excluding any distribution and service fees, brokerage commissions, interest, taxes and extraordinary expenses, but including custodian charges relating to overdrafts, if any), after giving effect to any balance credits from the Fund's custodian, do not exceed 0.80% of the Fund's average daily net assets on an annualized basis. For the period October 1, 2009 through the Closing, Columbia voluntarily reimbursed a portion of the Fund's expenses in the same manner.
Prior to October 1, 2009, Columbia contractually agreed to bear a portion of the Fund's expenses so that the Fund's ordinary operating expenses (excluding any distribution and service fees, brokerage commissions, interest, taxes and extraordinary expenses, but including custodian charges relating to overdrafts, if any), after giving effect to any balance credits from the Fund's custodian, did not exceed 0.87% annually of the Fund's average daily net assets.
Fees Paid to Officers and Trustees
As of May 1, 2010, officers of the Fund are employees of the New Advisor or its affiliates and, with the exception of the Fund's Chief Compliance Officer, receive no compensation from the Fund. The Board of Trustees has appointed a Chief Compliance Officer to the Fund in accordance with federal securities regulations. The Fund, along with other affiliated funds, pays its pro-rata share of the expenses associated with the Chief Compliance Officer. The Fund's expenses for the Chief Compliance Officer will not exceed $15,000 per year.
Trustees are compensated for their services to the Funds, as set forth on the Statements of Operations. The Trust's eligible Trustees may participate in a deferred compensation plan which may be terminated at any time. Obligations of the plan will be paid solely out of the Funds' assets.
Note 5. Custody Credits
The Fund has an agreement with its custodian bank under which custody fees may be reduced by balance credits. These credits are recorded as part of expense reductions on the Statement of Operations. The Fund could have invested a portion of the assets utilized in connection with the expense offset arrangement in an income-producing asset if it had not entered into such an agreement. For the year ended May 31, 2010, these custody credits reduced total expenses by $39 for the Fund.
Note 6. Objectives and Strategies for Investing in Derivative Instruments
The Fund uses derivatives instruments including forward foreign currency exchange contracts in order to meet its investment objectives. The Fund employs strategies in differing combinations to permit it to increase, decrease or change the level of exposure to market risk factors. The achievement of any strategy relating to derivatives depends on an analysis of various risk factors, and if the strategies for the use of derivatives do not work as intended, the Fund may not achieve its investment objectives.
36
Columbia High Yield Opportunity Fund, May 31, 2010
In pursuit of its investment objectives, the Fund is exposed to the following market risks:
Foreign exchange rate risk: Foreign exchange rate risk relates to the change in the U.S. dollar value of a security held that is denominated in a foreign currency. The U.S. dollar value of a foreign-currency-denominated security will decrease as the dollar appreciates against the currency, while the U.S. dollar value will increase as the dollar depreciates against the currency.
The following notes provide more detailed information about the derivative type held by the Fund:
The Fund entered into forward foreign currency exchange contracts for the purpose of shifting foreign currency exposure from one country to another.
Forward foreign currency exchange contracts are agreements to exchange one currency for another at a future date at a specified price. These contracts are used to minimize the exposure to foreign exchange rate fluctuations during the period between the trade and settlement dates of the contract. The Fund may utilize forward foreign currency exchange contracts in connection with the settlement of purchases and sales of securities. The Fund may also enter into these contracts to reduce the exposure to adverse price movements in certain other foreign-currency-denominated assets. Contracts to buy generally are used to acquire exposure to foreign currencies, while contracts to sell are generally used to reduce the exposure to foreign exchange rate fluctuations. Forward foreign currency exchange contracts are valued daily at the current exchange rate of the underlying currency, resulting in unrealized gains (losses) which become reali zed at the time the forward foreign currency exchange contracts are closed or mature. Realized and unrealized gains (losses) arising from such transactions are included in net realized and unrealized gains (losses) on foreign currency transactions. The use of forward foreign currency exchange contracts does not eliminate fluctuations in the prices of the Fund's portfolio securities. While the maximum potential loss from such contracts is the aggregate face value in U.S. dollars at the time the contract was opened, exposure is typically limited to the change in value of the contract (in U.S. dollars) over the period it remains open. The Fund could also be exposed to risk that counterparties of the contracts may be unable to fulfill the terms of the contracts.
During the year ended May 31, 2010, the Fund entered into 50 forward foreign currency exchange contracts.
The following table is a summary of the value of the Fund's derivative instruments as of May 31, 2010:
| | | Fair Value of Derivative Instruments | |
| | | Statement of Assets and Liabilities | |
| | | Asset | | Fair Value | | Liability | | Fair Value | |
| Forward foreign currency exchange contracts | | Unrealized
appreciation | | $ | 39,751 | | | Unrealized
depreciation | | $ | 11,778 | | |
The effect of derivative instruments on the Statement of Operations for the year ended May 31, 2010:
| | | Amount of Realized Gain or (Loss) and Change in
Unrealized Appreciation or (Depreciation)
on Derivatives Recognized in Income | |
| | | Risk Exposure | | Net Realized
Gain (Loss) | | Change in
Unrealized
Appreciation
(Depreciation) | |
| Forward foreign currency exchange contracts | | Foreign Exchange Rate | | $ | 87,298 | | | $ | 109,969 | | |
37
Columbia High Yield Opportunity Fund, May 31, 2010
Note 7. Portfolio Information
For the year ended May 31, 2010, the cost of purchases and proceeds from sales of securities, excluding short-term obligations, for the Fund were $196,647,914 and $227,711,203, respectively.
Note 8. Regulatory Settlements
During the year ended May 31, 2010, the Fund received payments totaling $133,454 relating to certain regulatory settlements with third parties that the Fund had participated in during the year. The payments have been included in "Increase from regulatory settlements" on the Statement of Changes in Net Assets.
Note 9. Line of Credit
The Fund and other affiliated funds participate in a $280,000,000 committed, unsecured revolving line of credit provided by State Street. The maximum amount that may be borrowed by any fund is limited to the lesser of $200,000,000 and the Fund's borrowing limit set forth in the Fund's registration statement. Borrowings are available for short-term liquidity or temporary or emergency purposes.
Effective October 15, 2009, interest is charged to each participating fund based on the fund's borrowings at a rate per annum equal to the greater of the Federal Funds Rate plus 1.25% or the overnight LIBOR Rate plus 1.25%. In addition, a commitment fee of 0.15% per annum is accrued and apportioned among the participating funds pro rata based on their relative net assets.
Prior to October 15, 2009, interest was charged to each participating fund based on the fund's borrowings at a rate per annum equal to the greater of the Federal Funds Rate plus 0.50% or the overnight LIBOR Rate plus 0.50%. In addition, an annual operations agency fee of $20,000, an amendment fee of 0.02% and a commitment fee of 0.12% per annum were accrued and apportioned among the participating funds pro rata based on their relative net assets.
For the year ended May 31, 2010, the average daily loan balance outstanding on days where borrowing existed was $5,266,667 at a weighted average interest rate of 1.42%.
Note 10. Shareholder Concentration
As of May 31, 2010, one shareholder account owned 27.4% of the outstanding shares of the Fund. Purchase and redemption activity of this account may have a significant effect on the operations of the Fund.
Note 11. Significant Risks and Contingencies
Sector Focus Risk
The Fund may focus its investments in certain sectors, subjecting it to greater risk than a fund that is less focused.
High-Yield Securities Risk
Investing in high-yield securities may involve greater credit risk and considerations not typically associated with investing in U.S. Government bonds and other higher quality fixed income securities. These securities are non-investment grade securities, often referred to as "junk" bonds. Economic downturns may disrupt the high yield market and impair the ability of issuers to repay principal and interest. Also, an increase in interest rates would likely have an adverse impact on the value of such obligations. Moreover, high-yield securities may be less liquid to the extent that there is no established secondary market.
Foreign Securities Risk
There are certain additional risks involved when investing in foreign securities. These risks may involve foreign currency exchange rate fluctuations, adverse political and economic developments and the possible prevention of currency exchange or other foreign governmental laws or restrictions. In addition, the liquidity of foreign securities may be more limited than that of domestic securities.
Information Regarding Pending and Settled Legal Proceedings
In June 2004, an action captioned John E. Gallus et al. v. American Express Financial Corp. and American Express Financial Advisors Inc. was filed in the United States District Court for the District of Arizona. The plaintiffs allege that they are investors in several American Express Company (now known as RiverSource) mutual funds and they purport to bring the action derivatively on behalf of those funds under the Investment Company Act of 1940. The plaintiffs allege that
38
Columbia High Yield Opportunity Fund, May 31, 2010
fees allegedly paid to the defendants by the funds for investment advisory and administrative services are excessive. The plaintiffs seek remedies including restitution and rescission of investment advisory and distribution agreements. The plaintiffs voluntarily agreed to transfer this case to the United States District Court for the District of Minnesota (the District Court). In response to defendants' motion to dismiss the complaint, the District Court dismissed one of plaintiffs' four claims and granted plaintiffs limited discovery. Defendants moved for summary judgment in April 2007. Summary judgment was granted in the defendants' favor on July 9, 2007. The plaintiffs filed a notice of appeal with the Eighth Circuit Court of Appeals (the Eighth Circuit) on August 8, 2007. On April 8, 2009, the Eighth Circuit reversed summary judgment and remanded to the District Court for further proceedings. On August 6, 2009, defendants fi led a writ of certiorari with the U.S. Supreme Court (the Supreme Court), asking the Supreme Court to stay the District Court proceedings while the Supreme Court considers and rules in a case captioned Jones v. Harris Associates, which involves issues of law similar to those presented in the Gallus case. On March 30, 2010, the Supreme Court issued its ruling in Jones v. Harris Associates, and on April 5, 2010, the Supreme Court vacated the Eighth Circuit's decision in the Gallus case and remanded the case to the Eighth Circuit for further consideration in light of the Supreme Court's decision in Jones v. Harris Associates. On June 4, 2010, the Eighth Circuit remanded the Gallus case to the District Court for further consideration in light of the Supreme Court's decision in Jones v. Harris Associates.
In December 2005, without admitting or denying the allegations, American Express Financial Corporation (AEFC, which is now known as Ameriprise Financial, Inc. (Ameriprise Financial)), entered into settlement agreements with the Securities and Exchange Commission (SEC) and Minnesota Department of Commerce (MDOC) related to market timing activities. As a result, AEFC was censured and ordered to cease and desist from committing or causing any violations of certain provisions of the Investment Advisers Act of 1940, the Investment Company Act of 1940, and various Minnesota laws. AEFC agreed to pay disgorgement of $10 million and civil money penalties of $7 million. AEFC also agreed to retain an independent distribution consultant to assist in developing a plan for distribution of all disgorgement and civil penalties ordered by the SEC in accordance with various undertakings detailed at http://www.sec.gov/litigation/admin/ia-2451.pdf. Ameriprise Financial and its affiliates have cooperated with the SEC and the MDOC in these legal proceedings, and have made regular reports to the RiverSource Funds' Boards of Directors/Trustees.
Ameriprise Financial and certain of its affiliates have historically been involved in a number of legal, arbitration and regulatory proceedings, including routine litigation, class actions, and governmental actions, concerning matters arising in connection with the conduct of their business activities. Ameriprise Financial believes that the Funds are not currently the subject of, and that neither Ameriprise Financial nor any of its affiliates are the subject of, any pending legal, arbitration or regulatory proceedings that are likely to have a material adverse effect on the Funds or the ability of Ameriprise Financial or its affiliates to perform under their contracts with the Funds. Ameriprise Financial is required to make 10-Q, 10-K and, as necessary, 8-K filings with the Securities and Exchange Commission on legal and regulatory matters that relate to Ameriprise Financial and its affiliates. Copies of these filings may be obt ained by accessing the SEC website at www.sec.gov.
There can be no assurance that these matters, or the adverse publicity associated with them, will not result in increased fund redemptions, reduced sale of fund shares or other adverse consequences to the Funds. Further, although we believe proceedings are not likely to have a material adverse effect on the Funds or the ability of Ameriprise Financial or its affiliates to perform under their contracts with the Funds, these proceedings are subject to uncertainties and, as such, we are unable to estimate the possible loss or range of loss that may result. An adverse outcome in one or more of these proceedings could result in adverse judgments, settlements, fines, penalties or other relief that could have a material adverse effect on the consolidated financial condition or results of operations of Ameriprise Financial.
39
Report of Independent Registered Public Accounting Firm
To the Trustees of Columbia Funds Series Trust I and the Shareholders of Columbia High Yield Opportunity Fund
In our opinion, the accompanying statement of assets and liabilities, including the investment portfolio, and the related statements of operations and of changes in net assets and the financial highlights present fairly, in all material respects, the financial position of Columbia High Yield Opportunity Fund (the "Fund")(a series of Columbia Funds Series Trust I) at May 31, 2010, the results of its operations for the year then ended, the changes in its net assets for each of the two years in the period then ended and the financial highlights for each of the five years in the period then ended, in conformity with accounting principles generally accepted in the United States of America. These financial statements and financial highlights (hereafter referred to as "financial statements") are the responsibility of the Fund's management. Our responsibility is to express an opinion on these financial statements based on our audits. We conducted our audits of these financial statements in accordance with the standards of the Public Company Accounting Oversight Board (United States). Those standards require that we plan and perform the audit to obtain reasonable assurance about whether the financial statements are free of material misstatement. An audit includes examining, on a test basis, evidence supporting the amounts and disclosures in the financial statements, assessing the accounting principles used and significant estimates made by management, and evaluating the overall financial statement presentation. We believe that our audits, which included confirmation of securities at May 31, 2010 by correspondence with the custodian and brokers, provide a reasonable basis for our opinion.
PricewaterhouseCoopers LLP
Boston, Massachusetts
July 22, 2010
40
Fund Governance
The Trustees serve terms of indefinite duration. The names, addresses and birth years of the Trustees and Officers of the Funds in the Columbia Funds Series Trust I, the year each was first elected or appointed to office, their principal business occupations during at least the last five years, the number of Funds overseen by each Trustee and other directorships they hold are shown below. Each officer listed below serves as an officer of each Fund in the Columbia Funds Complex.
Independent Trustees
Name, Address and Year of Birth,
Position with Funds, Year First
Elected or Appointed to Office | | Principal Occupation(s) During Past Five Years, Number of Funds in Columbia
Funds Complex Overseen by Trustee, Other Directorships Held
| |
| John D. Collins (Born 1938) | |
|
c/o Columbia Management
Investment Advisers, LLC
One Financial Center
Boston, MA 02111
Trustee (since 2005) | | Retired. Consultant, KPMG, LLP (accounting and tax firm) from July 1999 to June 2000; Partner, KPMG, LLP from March 1962 to June 1999. Oversees 64; Mrs. Fields Famous Brands LLC (consumer products); Suburban Propane Partners, L.P.; and Montpelier Re (insurance underwriting firm) | |
|
| Rodman L. Drake (Born 1943) | |
|
c/o Columbia Management
Investment Advisers, LLC
One Financial Center
Boston, MA 02111
Trustee (since 1994) and Chairman of the Board (since 2009) | | Co-Founder of Baringo Capital LLC (private equity) since 2002; CEO of Crystal River Capital, Inc. (real estate investment trust) since 2003; President, Continuation Investments Group, Inc. from 1997 to 2001. Oversees 64; Jackson Hewitt Tax Service Inc. (tax preparation services); Crystal Capital River Inc. (real estate investment trust); Student Loan Corporation (student loan provider); Celgene Corporation (global biotechnology company); and The Helios Funds (exchange-traded funds) | |
|
| Douglas A. Hacker (Born 1955) | |
|
c/o Columbia Management
Investment Advisers, LLC
One Financial Center
Boston, MA 02111
Trustee (since 1996) | | Independent business executive since May 2006; Executive Vice President—Strategy of United Airlines (airline) from December 2002 to May 2006; President of UAL Loyalty Services (airline marketing company) from September 2001 to December 2002; Executive Vice President and Chief Financial Officer of United Airlines from July 1999 to September 2001. Oversees 64; Nash Finch Company (food distributor); Aircastle Limited (aircraft leasing) | |
|
| Janet Langford Kelly (Born 1957) | |
|
c/o Columbia Management
Investment Advisers, LLC
One Financial Center
Boston, MA 02111
Trustee (since 1996) | | Senior Vice President, General Counsel and Corporate Secretary, ConocoPhillips (integrated energy company) since September 2007; Deputy General Counsel—Corporate Legal Services, ConocoPhillips from August 2006 to August 2007; Partner, Zelle, Hofmann, Voelbel, Mason & Gette LLP (law firm) from March 2005 to July 2006; Adjunct Professor of Law, Northwestern University, from September 2004 to June 2006; Director, UAL Corporation (airline) from February 2006 to July 2006; Oversees 64; None | |
|
| Charles R. Nelson (Born 1942) | |
|
c/o Columbia Management
Investment Advisers, LLC
One Financial Center
Boston, MA 02111
Trustee (since 1981) | | Professor of Economics, University of Washington, since January 1976; Ford and Louisa Van Voorhis Professor of Political Economy, University of Washington, since September 1993; Adjunct Professor of Statistics, University of Washington, since September 1980; Associate Editor, Journal of Money Credit and Banking, 1993-2008; Consultant on econometric and statistical matters. Oversees 64; None | |
|
41
Fund Governance (continued)
Independent Trustees (continued)
Name, Address and Year of Birth,
Position with Funds, Year First
Elected or Appointed to Office | | Principal Occupation(s) During Past Five Years, Number of Funds in Columbia
Funds Complex Overseen by Trustee, Other Directorships Held
| |
| John J. Neuhauser (Born 1943) | |
|
c/o Columbia Management
Investment Advisers, LLC
One Financial Center
Boston, MA 02111
Trustee (since 1984) | | President, Saint Michael's College, since August 2007; University Professor, Boston College from November 2005 to August 2007; Academic Vice President and Dean of Faculties, Boston College from August 1999 to October 2005. Oversees 64; Liberty All-Star Equity Fund and Liberty All-Star Growth Fund, Inc. (closed-end funds) | |
|
| Jonathan Piel (Born 1938) | |
|
c/o Columbia Management
Investment Advisers, LLC
One Financial Center
Boston, MA 02111
Trustee (since 1994) | | Cable television producer and website designer; The Editor, Scientific American from 1984 to 1994; Vice President, Scientific American, Inc., from 1984 to 1994; Member, Advisory Board, Stone Age Institute, Bloomington, Indiana (research institute that explores the effect of technology on human evolution); Member, Board of Directors of the National Institute of Social Sciences, New York City; Member, Board of Trustees of the William Alanson White Institute, New York City (institution for training psychoanalysts); and Member, Advisory Board, Mount Sinai Children's Environmental Health Center, New York. Oversees 64; None | |
|
| Patrick J. Simpson (Born 1944) | |
|
c/o Columbia Management
Investment Advisers, LLC
One Financial Center
Boston, MA 02111
Trustee (since 2000) | | Partner, Perkins Coie LLP (law firm). Oversees 64; None | |
|
| Anne-Lee Verville (Born 1945) | |
|
c/o Columbia Management
Investment Advisers, LLC
One Financial Center
Boston, MA 02111
Trustee (since 1998) | | Retired since 1997 (formerly General Manager–Global Education Industry (from 1994 to 1997), President–Application Systems Division (from 1991 to 1994), Chief Financial Officer–US Marketing & Services (from 1988 to 1991), and Chief Information Officer (from 1987 to 1988), IBM Corporation (computer and technology)). Oversees 64; None | |
|
42
Fund Governance (continued)
Interested Trustee
Name, Address and Year of Birth,
Position with Funds, Year First
Elected or Appointed to Office | | Principal Occupation(s) During Past Five Years, Number of Funds in Columbia
Funds Complex Overseen by Trustee, Other Directorships Held
| |
| William E. Mayer1 (Born 1940) | |
|
c/o Columbia Management
Investment Advisers, LLC
One Financial Center
Boston, MA 02111
Trustee (since 1994) | | Partner, Park Avenue Equity Partners (private equity) since February 1999; Dean and Professor, College of Business, University of Maryland from 1992 to 1997. Oversees 64; Lee Enterprises (print media); WR Hambrecht + Co. (financial service provider); BlackRock Kelso Capital Corporation (investment company) | |
|
1 Mr. Mayer may technically be an "interested person" (as defined in the Investment Company Act of 1940) by reason of his affiliation with WR Hambrecht + Co., a registered broker/dealer that may execute portfolio transactions for, engage in principal transactions with or distribute shares of a Fund or other funds or accounts advised/managed by the Advisor or any sub-advisor to a Fund.
The Statement of Additional Information includes additional information about the Trustees of the Funds and is available, without charge, upon request by calling 1-800-345-6611.
Officers
| Name, Year of Birth and Address | | Principal Occupation(s) During the Past Five Years | |
| J. Kevin Connaughton (Born 1964) | |
|
One Financial Center
Boston, MA 02111
President (since 2009) | | Senior Vice President and General Manager–Mutual Fund Products, Columbia Management Investment Advisers, LLC since May 2010; President, Columbia Funds, since 2009, and RiverSource Funds, since May 2010 (previously Senior Vice President and Chief Financial Officer, Columbia Funds, from June 2008 to January 2009, Treasurer, Columbia Funds, from October 2003 to May 2008, and senior officer of various other affiliated funds since 2000); Managing Director, Columbia Management Advisors, LLC from December 2004 to April 2010. | |
|
| Michael G. Clarke (Born 1969) | |
|
One Financial Center
Boston, MA 02111
Senior Vice President and Chief
Financial Officer (since 2009) | | Vice President, Columbia Management Investment Advisers, LLC since May 2010; Managing Director of Fund Administration, Columbia Management Advisors, LLC, from September 2004 to April 2010; senior officer of Columbia Funds and affiliated funds since 2002. | |
|
| Scott R. Plummer (Born 1959) | |
|
5228 Ameriprise Financial Center
Minneapolis, MN 55474
Senior Vice President, Secretary
and Chief Legal Officer (since 2010) | | Chief Legal Officer and Assistant Secretary, Columbia Management Investment Advisers, LLC since June 2005; Vice President and Lead Chief Counsel–Asset Management, Ameriprise Financial, Inc. since May 2010 (previously Vice President and Chief Counsel–Asset Management, from 2005 to April 2010, and Vice President–Asset Management Compliance from 2004 to 2005); Vice President, Chief Counsel and Assistant Secretary, Columbia Management Investment Distributors, Inc. since 2008; Vice President, General Counsel and Secretary, Ameriprise Certificate Company since 2005; Chief Counsel, RiverSource Distributors, Inc. since 2006; Vice President, General Counsel and Secretary, RiverSource Funds, since December 2006; Senior Vice President, Secretary and Chief Legal Officer, Columbia Funds, since May 2010. | |
|
43
Fund Governance (continued)
Officers (continued)
| Name, Year of Birth and Address | | Principal Occupation(s) During the Past Five Years | |
| Linda J. Wondrack (Born 1964) | |
|
One Financial Center
Boston, MA 02111
Senior Vice President and Chief
Compliance Officer (since 2007) | | Vice President and Chief Compliance Officer, Columbia Management Investment Advisers, LLC since May 2010; Chief Compliance Officer, Columbia Funds, since 2007, and RiverSource Funds, since May 2010; Director (Columbia Management Group, LLC and Investment Product Group Compliance), Bank of America, from June 2005 to April 2010; Director of Corporate Compliance and Conflicts Officer of MFS Investment Management (investment management) from August 2004 to May 2005. | |
|
| William F. Truscott (Born 1960) | |
|
53600 Ameriprise Financial Center
Minneapolis, MN 55474
Senior Vice President (since 2010) | | Chairman of the Board, Columbia Management Investment Advisers, LLC since May 2010 (previously President, Chairman of the Board and Chief Investment Officer, from 2001 to April 2010); Chief Executive Officer, U.S. Asset Management & President, Annuities, Ameriprise Financial, Inc. since May 2010 (previously President–U.S. Asset Management and Chief Investment Officer from 2005 to April 2010, and Senior Vice President—Chief Investment Officer, from 2001 to 2005); Director, President and Chief Executive Officer, Ameriprise Certificate Company since 2006; Director, Columbia Management Investment Distributors, Inc. since May 2010 (previously Chairman of the Board and Chief Executive Officer from 2008 to April 2010); Chairman of the Board and Chief Executive Officer, RiverSource Distributors, Inc. since 2006. | |
|
| Colin Moore (Born 1958) | |
|
One Financial Center
Boston, MA 02111
Senior Vice President (since 2010) | | Director and Chief Investment Officer, Columbia Management Investment Advisers, LLC since May 2010; Manager, Managing Director and Chief Investment Officer of Columbia Management Advisors, LLC from 2007 to April 2010; Head of Equities, Columbia Management Advisors, LLC from 2002 to 2007. | |
|
| Michael A. Jones (Born 1959) | |
|
100 Federal Street
Boston, MA 02110
Senior Vice President (since 2010) | | Director and President, Columbia Management Investment Advisers, LLC since May 2010; President and Director, Columbia Management Investment Distributors, Inc. since May 2010; Manager, Chairman, Chief Executive Officer and President, Columbia Management Advisors, LLC from 2007 to April 2010; Chief Executive Officer, President and Director, Columbia Management Distributors, Inc. from November 2006 to April 2010; previously, co-president and senior managing director at Robeco Investment Management. | |
|
| Amy Johnson (Born 1965) | |
|
5228 Ameriprise Financial Center
Minneapolis, MN 55474
Senior Vice President (since 2010) | | Senior Vice President and Chief Operating Officer, Columbia Management Investment Advisers, LLC since May 2010 (previously Chief Administrative Officer, from 2009 until April 2010, Vice President—Asset Management and Trust Company Services, from 2006 to 2009, and Vice President—Operations and Compliance from 2004 to 2006). | |
|
| Joseph F. DiMaria (Born 1968) | |
|
One Financial Center
Boston, MA 02111
Treasurer (since 2009) and
Chief Accounting Officer (since 2008) | | Vice President, Mutual Fund Administration, Columbia Management Investment Advisers, LLC, since May 2010; Director of Fund Administration, Columbia Management Advisors, LLC from January 2006 to April 2010; Head of Tax/Compliance and Assistant Treasurer, Columbia Management Advisors, LLC, from November 2004 to December 2005. | |
|
44
Fund Governance (continued)
Officers (continued)
| Name, Year of Birth and Address | | Principal Occupation(s) During the Past Five Years | |
| Marybeth Pilat (Born 1968) | |
|
One Financial Center
Boston, MA 02111
Deputy Treasurer (since 2010) | | Vice President, Mutual Fund Administration, Columbia Management Investment Advisers, LLC, since May 2010; Vice President, Investment Operations, Bank of America, from October 2008 to April 2010; Finance Manager, Boston Children's Hospital from August 2008 to October 2008; Director, Mutual Fund Administration, Columbia Management Advisors, LLC, from May 2007 to July 2008; Vice President, Mutual Fund Valuation, Columbia Management Advisors, LLC, from January 2006 to May 2007; Vice President, Mutual Fund Accounting Oversight, Columbia Management Advisors, LLC from January 2005 to January 2006. | |
|
| Julian Quero (Born 1967) | |
|
One Financial Center
Boston, MA 02111
Deputy Treasurer (since 2008) | | Vice President, Mutual Fund Administration, Columbia Management Investment Advisers, LLC since May 2010; Director of Fund Administration, Columbia Management Advisors, LLC, from August 2008 to April 2010; Senior Tax Manager, Columbia Management Advisors, LLC from August 2006 to July 2008; Senior Compliance Manager, Columbia Management Advisors, LLC from April 2002 to August 2006. | |
|
| Stephen T. Welsh (Born 1957) | |
|
One Financial Center
Boston, MA 02111
Vice President (since 2006) | | President and Director, Columbia Management Investment Services Corp. since May 2010; President and Director, Columbia Management Services, Inc. from July 2004 to April 2010; Managing Director, Columbia Management Distributors, Inc. from August 2007 to April 2010. | |
|
45
Board Consideration and Approval of Advisory Agreements
The Board unanimously approved the Advisory Agreements at a meeting held on December 17, 2009. These agreements were approved by shareholders on March 3, 2010, and took effect upon the closing of the acquisition of the long-term asset management business of Columbia by Ameriprise Financial, Inc. ("Ameriprise") (the "Transaction").
The Advisory Fees and Expenses Committee (the "Committee") of the Board met on multiple occasions to review the investment management services agreements (the "Advisory Agreements") for the funds for which the Trustees serve as trustees (each a "Fund," and collectively, the "Funds"). On December 14, 2009, the Committee recommended that the full Board approve the Advisory Agreements. On December 17, 2009, the full Board, including a majority of the Trustees who have no direct or indirect interest in the Advisory Agreements and who are not "interested persons" (as defined in the 1940 Act) of the Trust (the "Independent Trustees"), approved the Advisory Agreement with Columbia Management Investment Advisers, LLC (formerly, RiverSource Investments, LLC) ("CMIA") for each Fund. Prior to their approval of the Advisory Agreements, the Committee and the Independent Trustees requested and evaluated materials from, and were provided mater ials and information about the Transaction and matters related to the proposals by, BOA, Columbia, CMIA and Ameriprise. In connection with their most recent approval of the Funds' previous advisory agreements (the "Former Advisory Agreements") on October 28, 2009, the Committee and the Trustees requested and evaluated materials from Columbia, and discussed such materials with representatives of Columbia. The Committee, at meetings held on August 11, 2009, September 23, 2009, October 27, 2009, November 30, 2009, December 7, 2009 and December 14, 2009, and the Independent Trustees, at meetings held on August 12, 2009, August 20, 2009, October 28, 2009, December 8, 2009, December 14, 2009 and December 17, 2009, discussed the materials provided in connection with the October 28, 2009 approvals and the materials provided in connection with their consideration of the Advisory Agreements and other matters relating to the Transaction with representatives of BOA, Columbia, CMIA and Ameriprise. The Trustees consulted with experienced legal counsel, who advised on the legal standards for consideration by the Trustees. The Independent Trustees also discussed the proposed approvals with independent legal counsel in private sessions.
The Trustees reviewed each Advisory Agreement, as well as certain information obtained through CMIA's responses to initial and supplemental questionnaires prepared at the request of the Trustees by counsel to the Funds and independent legal counsel to the Independent Trustees. The Committee and the Trustees also met with, and reviewed and considered a report prepared and provided by, the independent fee consultant (the "Fee Consultant") appointed by the Independent Trustees pursuant to an assurance of discontinuance entered into by Columbia with the New York Attorney General ("NYAG") to settle a civil complaint filed by the NYAG relating to trading in mutual fund shares (the "NYAG Settlement"). Under the NYAG Settlement, the Fee Consultant's role is to manage the process by which management fees are negotiated so that they are negotiated in a manner that is at arms' length and reasonable.
The Trustees considered all materials that they, their legal counsel or CMIA believed reasonably necessary to evaluate and to determine whether to approve the Advisory Agreements. In their deliberations, the Trustees did not identify any particular information that was all-important or controlling, and individual Trustees may have attributed different weights to the various factors. The material factors that formed the basis for the Trustees' approvals included the factors set forth below:
(i) the reputation, financial strength, regulatory histories and resources of CMIA and its parent, Ameriprise;
(ii) the capabilities of CMIA with respect to compliance, including an assessment of CMIA's compliance system by the Funds' Chief Compliance Officer;
(iii) the qualifications of the personnel of CMIA that would be expected to provide advisory services to each Fund, including CMIA's representations that the Chief Investment Officer of Columbia would serve as the Chief Investment Officer of CMIA, and that the process for determining the portfolio management team for each Fund would be substantially the same process as has customarily been followed by Columbia, and reported to the Trustees, in evaluating the performance of Columbia's portfolio management teams;
(iv) the terms and conditions of the Advisory Agreements, including the differences between the Advisory Agreements and Former Advisory Agreements in
46
connection with CMIA's efforts to standardize such agreements across the Columbia Fund complex and the legacy RiverSource fund complex;
(v) the terms and conditions of other agreements and arrangements relating to the future operations of the Funds, including an administrative services agreement and the Master Services and Distribution Agreement;
(vi) the commitment of CMIA and Ameriprise that there would not be any diminution in the nature, quality and extent of services provided to each Fund or its shareholders following closing of the Transaction;
(vii) that the Trustees recently had completed a full annual review of the Former Advisory Agreements, as required by the 1940 Act, for each Fund and had determined that they were satisfied with the nature, extent and quality of services provided thereunder and that the management fee rate for each Fund were sufficient to warrant their approval;
(viii) that the advisory fee rates payable by each Fund would not change;
(ix) that CMIA and BOA, and not any Fund, would bear the costs of obtaining approvals of the Advisory Agreements;
(x) that Ameriprise and CMIA had agreed to exercise reasonable best efforts to assure that, for a period of two years after the Closing, there would not be imposed on any Fund any "unfair burden" (within the meaning of Section 15(f) of 1940 Act) with respect to the Transaction; and
(xi) that certain members of CMIA's management had a significant amount of experience integrating other fund families; that certain current Columbia personnel that would be integrated into CMIA and its affiliates as a result of the Transaction also had experience in integrating fund families; and that the senior management of CMIA following the Transaction would include certain senior executives of Columbia who were, at that time, responsible for oversight of services provided to the Funds.
Nature, Extent and Quality of Services to be Provided. The Trustees considered the expected nature, extent and quality of services to be provided to the Funds by CMIA and its affiliates and the resources to be dedicated to the Funds by CMIA and its affiliates. The Trustees considered, among other things, the expected effect of the Transaction on the operations of the Funds, the information provided by CMIA with respect to the nature, extent and quality of services to be provided by it, CMIA's compliance programs and compliance records, the ability of CMIA (including personnel and other resources, compensation programs for personnel involved in fund management, reputation and other attributes) to attract, motivate and retain highly qualified research, advisory and supervisory investment professionals, the trade execution services to be provided on beha lf of the Funds and the quality of CMIA's investment research capabilities and the other resources that it indicated it would devote to each Fund. As noted above, the Trustees also considered CMIA's representations that the Chief Investment Officer of Columbia would serve as the Chief Investment Officer of CMIA following the Transaction, and that the process for determining the portfolio management team for each Fund would be substantially the same process as has customarily been followed by Columbia, and reported to the Trustees, in evaluating the performance of Columbia's portfolio management teams.
The Trustees noted the professional experience and qualifications of the senior personnel of CMIA. The Trustees also considered the compliance programs of and the compliance-related resources proposed to be provided to the Funds by CMIA and its affiliates, including discussions with the Funds' Chief Compliance Officer regarding CMIA's compliance program. The Trustees also discussed CMIA's compliance program with the Chief Compliance Officer for the legacy RiverSource funds. The Trustees also considered CMIA's representation that the Funds' Chief Compliance Officer would serve as the Chief Compliance Officer of CMIA following the Transaction. The Trustees considered CMIA's ability to provide administrative services to the Funds, noting that while some Former Advisory Agreements contemplated the provision of certain administrative services, following the Transaction, all administrative services were anticipated to be provided purs uant to a new administrative services agreement. The Trustees also considered CMIA's ability to coordinate the activities of each Fund's other service providers. The Trustees considered performance information provided by CMIA with respect to other mutual funds advised
47
by CMIA, and discussed with senior executives of CMIA its process for identifying which portfolio management teams of the legacy Columbia and legacy CMIA organizations would be responsible for the management of the Funds following the Transaction. After reviewing these and related factors, the Trustees concluded, within the context of their overall conclusions, that the expected nature, extent and quality of the services to be provided to each Fund under the Advisory Agreements supported the approval of such agreements.
Investment Advisory Fee Rates and Other Expenses. The Trustees considered the fact that the advisory fee rates payable by each Fund to CMIA under the Advisory Agreements were the same as those that were paid by each Fund to Columbia under the Former Advisory Agreements. The Trustees noted that in connection with their October 28, 2009 approval of the Former Advisory Agreements, they had concluded, within the context of their overall conclusions regarding each such agreement, that the advisory fees charged to each Fund supported the continuation of the agreement(s) pertaining to that Fund.
The Trustees noted that in certain cases the effective advisory fee rate for a legacy RiverSource fund was lower than the proposed investment advisory fee rate for a Fund with generally similar investment objectives and strategies. The Trustees also noted that CMIA's investment advisory fee rates for equity and balanced funds generally are subject to adjustments based on investment performance, whereas the proposed investment advisory fee rates for the Funds, consistent with those in the Former Advisory Agreements, do not reflect performance adjustments. The Trustees considered existing advisory fee breakpoints and CMIA's undertaking not to change expense caps previously implemented by Columbia with respect to the Funds without further discussion with the Independent Trustees.
The Trustees received and considered information about the advisory fees charged by CMIA to institutional accounts. In considering the fees charged to those accounts, the Trustees took into account, among other things, CMIA's representations about the differences between managing mutual funds as compared to other types of accounts, including differences in the services provided, differences in the risk profile of such business for CMIA and the additional resources required to manage mutual funds effectively. In evaluating each Fund's advisory fees, the Trustees also took into account the demands, complexity and quality of the investment management of the Fund.
The Trustees also considered that for certain Funds, certain administrative services that were provided under the Former Advisory Agreements would not be provided under the Advisory Agreements, but under a separate administrative services agreement. The Trustees noted that, unlike fees under an advisory agreement, fees under the administrative services agreement could be changed without shareholder approval, although CMIA had not proposed any increase in such administrative fees and any such increase would require Board approval. The Trustees also noted Ameriprise's and CMIA's covenants regarding compliance with Section 15(f) of the 1940 Act.
After reviewing these and related factors, the Trustees concluded, within the context of their overall conclusions, that the expected advisory fee rates and expenses of each Fund supported the approval of the Advisory Agreements.
Costs of Services to be Provided and Profitability. The Trustees noted that in connection with their October 28, 2009 approval of the Former Advisory Agreements, they had concluded, within the context of their overall conclusions regarding each such agreement, that profitability to Columbia and its affiliates of their relationships with each Fund supported the continuation of the agreement(s) pertaining to that Fund. In connection with the integration of the legacy Columbia and legacy CMIA organizations, the Trustees considered, among other things, CMIA's projected annual net expense synergies (reductions in the cost of providing services to the Funds), the timetable over which such synergies are expected to be realized and the extent to which any such synergies are expected to be shared with the Funds. The Trustees also considered information provide d by CMIA regarding their respective financial conditions. The Trustees considered that CMIA proposed to continue voluntary expense caps currently in effect for the Funds and that CMIA had undertaken not to change these caps without further discussion with the Independent Trustees. After reviewing these and related factors, the Trustees concluded, within the context of their overall conclusions, that the expected profitability to CMIA and its affiliates from its relationship with each Fund supported the approval of the Advisory Agreements.
48
Economies of Scale. The Trustees considered the existence of any anticipated economies of scale in the provision by CMIA of services to each Fund, to groups of related Funds and to CMIA's investment advisory clients as a whole, and whether those economies of scale were expected to be shared with the Funds. The Trustees considered Ameriprise's anticipated net expense synergies resulting from the Transaction, and considered the possibility that the Funds might benefit from economies of scale over time as part of the larger, combined fund complex. The Trustees considered how expected synergies and potential economies of scale might benefit the Funds and their shareholders. The Trustees considered the potential impact of the Transaction on the distribution of the Funds, and noted that the proposed management fee schedules for the Funds generally contained breakpoints that would reduce the fee rate on assets above specified threshold levels. After reviewing these and related factors, the Trustees concluded, within the context of their overall conclusions, that the extent to which economies of scale were expected to be shared with the Funds supported the approval of the Advisory Agreements.
Other Benefits to CMIA. The Trustees received and considered information regarding any expected "fall-out" or ancillary benefits to be received by CMIA and its affiliates as a result of their relationships with the Funds, such as the engagement of CMIA to provide administrative services to the Funds and the engagement of CMIA's affiliates to provide distribution and transfer agency services to the Funds. The Trustees considered that the Funds' distributor, which would be an affiliate of CMIA, retains a portion of the distribution fees from the Funds and receives a portion of the sales charges on sales or redemptions of certain classes of shares of the Funds. The Trustees also considered the benefits of research made available to CMIA by reason of brokerage commissions generated by the Funds' securities transactions, and reviewed information about CMIA 's practices with respect to allocating portfolio brokerage for brokerage and research services. The Trustees considered the possible conflicts of interest associated with certain fall-out or other ancillary benefits and the reporting, disclosure and other processes that would be in place to disclose and to monitor such possible conflicts of interest. The Trustees recognized that CMIA's profitability would be somewhat lower without these benefits.
Conclusion. Based on their evaluation of all factors that they deemed to be material, including those factors described above, and assisted by the advice of independent legal counsel and the Fee Consultant, the Trustees, including the Independent Trustees, approved, and recommended that Fund shareholders approve, each Advisory Agreement.
49
Summary of Management Fee Evaluation by Independent Fee Consultant (RiverSource Investments, LLC)
EXCERPT FROM REPORT OF INDEPENDENT FEE CONSULTANT TO THE FUNDS SUPERVISED BY THE COLUMBIA ATLANTIC BOARD
Prepared Pursuant to the February 9, 2005
Assurance of Discontinuance among the
Office of Attorney General of New York State,
Columbia Management Advisors, LLC, and
Columbia Management Distributors, Inc.
December 21, 2009
I. Overview
On February 9, 2005, Columbia Management Advisors, LLC ("CMA") and Columbia Management Distributors, Inc.1 ("CMD") agreed to the New York Attorney General's Assurance of Discontinuance ("AOD"). Among other things, the AOD stipulates that CMA may manage or advise a Columbia Fund ("Columbia Fund" and, together with some or all of such funds, the "Columbia Funds") only if the Independent Members of the Columbia Fund's Board of Trustees appoint a Senior Officer or retain an Independent Fee Consultant ("IFC") who is to manage the process by which proposed management fees are negotiated. The AOD further stipulates that the Senior Officer or IFC is to prepare a written annual evaluation of the fee negotiation process.
With effect from January 1, 2007, the Independent Members of the Board of Trustees for certain Columbia Funds known collectively as the "Atlantic Funds" (together with the other members of that Board, the "Trustees") retained me as IFC for the Atlantic Funds.2 In this capacity, I have prepared this written evaluation of the fee negotiation process. As was the case with the last three annual reports, my immediate predecessor as IFC, John Rea, provided invaluable assistance in the preparation of this report.
On September 29, 2009, Ameriprise entered into an asset purchase agreement with Bank of America, N.A. and its parent, Bank of America Corporation (together, the "Bank") pursuant to which the Bank agreed to sell certain CMG assets relating to Columbia's long-term asset management business, including management of the Atlantic Funds (the "Transaction").3 The Transaction if completed would result in the termination of the existing Investment Management Agreements with CMA. Therefore, the Trustees have been requested to approve and recommend to the shareholders of each Atlantic Fund new Investment Management and Sub-Advisory Agreements (together, the "Management Agreements") with RiverSource Investments, LLC ("RI"),4 investment manager of the RiverSource Funds and a subsidiary of Ameriprise. This report is intended to fulfill the requiremen ts of the AOD with respect to the Trustees' consideration of the new Management Agreements.
A. Role of the Independent Fee Consultant
The AOD charges the IFC with "managing the process by which proposed management fees ... to be charged the Columbia Fund are negotiated so that they are negotiated in a manner which is at arms' length and reasonable and consistent with this Assurance of Discontinuance." The AOD also provides that CMA "may manage or advise a Columbia Fund only if the reasonableness of the proposed management fees is determined by the Board of Trustees ... using ... an annual independent written evaluation prepared by or under the direction of ... the Independent Fee Consultant." Therefore, the AOD makes clear that the IFC does not supplant the Trustees in negotiating management fees with CMA (or RI), nor does the IFC substitute his or her judgment for that of the Trustees with respect to the reasonableness of proposed fees or any other matter that is committed to the business judgment of the Trustees.
B. Elements Involved in Managing the Fee Negotiation Process
In preparing the report required by the AOD, the IFC must consider at least the following six factors set forth in the AOD:
1. The nature and quality of the adviser's services, including the Fund's performance;
1 CMA and CMD are subsidiaries of Columbia Management Group, LLC ("CMG"), and are the successors to the entities named in the AOD.
2 I have no material relationship with Bank of America, CMG or Ameriprise Financial, Inc. ("Ameriprise"), aside from serving as IFC, and I am aware of no material relationship with any of their affiliates. I retained John Rea, an independent economic consultant, to assist me with this report.
Unless otherwise stated or required by the context, this report covers only the Atlantic Funds.
3 Preliminary Response of Ameriprise to Information Request of Columbia Atlantic Board dated October 21, 2009 (hereafter, the "Preliminary Response"), p. 1. The one money market Atlantic Fund, Money Market Fund VS, was included in the Transaction because it was an integral part of CMG's array of Funds used as investment vehicles by variable annuity and similar insurance products.
4 Ameriprise intends to re-brand RI with the "Columbia" name (which is one of the assets being sold in the Transaction). Preliminary Response, pp. 4-5. In the case of new Sub-Advisory Agreements, the current sub-adviser would also be a party.
50
2. Management fees (including any components thereof) charged by other mutual fund companies for like services;
3. Possible economies of scale as the Fund grows larger;
4. Management fees (including any components thereof) charged to institutional and other clients of the adviser for like services;
5. Costs to the adviser and its affiliates of supplying services pursuant to the management fee agreements, excluding any intra-corporate profit; and
6. Profit margins of the adviser and its affiliates from supplying such services.
C. Data Presented to the Trustees
In considering the proposed new Management Agreements with RI, the Trustees relied in part on the data that had been prepared as part of their annual contract review process, which concluded in late October. This data remained relevant because the fees in the proposed Management Agreements were identical to the fees approved at that time. The annual review materials included a Lipper report on the performance of each Atlantic Fund compared to its peers and its benchmark, comparisons of the fees and expenses of each Atlantic Fund to similar CMG-sponsored Funds, comparable competitive funds chosen by Lipper, and institutional accounts advised by CMA, revenues, expenses, and profits of CMG from managing the Atlantic Funds, calculated both by Fund and collectively, and CMG's views on the existence and sharing of economies of scale.
In addition, the Trustees reviewed materials specific to the proposed new Management Agreements with RI in response to requests for information made on behalf of the Trustees, including the following:
• Performance data for the RiverSource Funds showing percentile and quartile rankings of each fund within its Lipper performance universe for periods up to five years and net returns of each fund relative to its benchmark returns. This data was arguably relevant due to the possibility that some RiverSource investment teams would be providing investment management services to certain Columbia Funds.5
• tables comparing the fee schedules and effective fee rates of funds managed by CMA and RI and institutional accounts advised by the two firms.
• extensive discussion of the process by which the various components of the two asset management businesses would be integrated including investment management, compliance, transfer agency, custody, fund accounting, and distribution.
• information about the financial condition of Ameriprise, including its most recent annual report on Form 10-K, RI's profit margins from managing the RiverSource Funds in 2007 and 2008, and pro forma income statements for the combined Columbia and RiverSource fund complex.
• disclosure that certain senior CMG executives, including President Michael Jones, Chief Investment Officer Colin Moore, Head of Mutual Funds J. Kevin Connaughton, and Chief Compliance Officer Linda Wondrack would continue in analogous capacities following the consummation of the Transaction, and
• a breakdown of the synergies RI expects to realize in the two years following the Transaction and the extent to which those potential synergies are expected to be shared with shareholders of funds advised by RI.
II. Findings
1. Based upon my examination of the information supplied by CMG and Ameriprise in the light of the six factors set forth in the AOD, I conclude that the Trustees have the relevant information necessary to evaluate the reasonableness of the proposed management fees for each Atlantic Fund.
2. In my view, the process by which the proposed management fees of the Atlantic Funds have been negotiated with RI thus far has been, to the extent practicable, at arms' length and reasonable and consistent with the AOD.
Respectfully submitted,
Steven E. Asher
5 On page 20 of its Supplemental Response to the Atlantic Trustees (undated but delivered November 24, 2009), Ameriprise said that "most personnel decisions, including with respect to the portfolio management teams for the Atlantic Funds . . . will be made primarily by [current CMA CIO] Colin Moore using the Columbia 5P process."
51
Shareholder Meeting Results
Columbia High Yield Opportunity Fund
On March 3, 2010, a special meeting of shareholders of Columbia Funds Series Trust I was held to consider the approval of several proposals listed in the proxy statement for the meeting. Proposal 1 and Proposal 2 were voted on at the March 3, 2010 meeting of shareholders and Proposal 3 was voted on at an adjourned meeting of shareholders held on March 31, 2010. The shareholder meeting results are as follows:
Proposal 1: A proposed Investment Management Services Agreement with Columbia Management Investment Advisers, LLC (formerly, RiverSource Investments, LLC) (CMIA) was approved as follows:
| Votes For | | Votes Against | | Abstentions | | Broker Non-Votes | |
| | 221,098,150 | | | | 6,730,620 | | | | 6,278,800 | | | | 55,918,284 | | |
Proposal 2: A proposal authorizing CMIA to enter into and materially amend subadvisory agreements for the Fund in the future, with the approval of the Trust's Board of Trustees, but without obtaining additional shareholder approval, was approved as follows:
| Votes For | | Votes Against | | Abstentions | | Broker Non-Votes | |
| | 215,250,723 | | | | 12,647,782 | | | | 6,209,031 | | | | 55,918,319 | | |
Proposal 3: Each of the nominees for trustees was elected to the Trust's Board of Trustees, as follows:
| Trustee | | Votes For | | Votes Withheld | | Abstentions | |
| John D. Collins | | | 30,977,072,412 | | | | 859,827,038 | | | | 0 | | |
| Rodman L. Drake | | | 30,951,179,004 | | | | 885,720,446 | | | | 0 | | |
| Douglas A. Hacker | | | 30,989,793,279 | | | | 847,106,171 | | | | 0 | | |
| Janet Langford Kelly | | | 30,999,020,814 | | | | 837,878,636 | | | | 0 | | |
| William E. Mayer | | | 16,291,139,483 | | | | 15,545,759,967 | | | | 0 | | |
| Charles R. Nelson | | | 30,997,700,700 | | | | 839,198,750 | | | | 0 | | |
| John J. Neuhauser | | | 30,988,095,661 | | | | 848,803,789 | | | | 0 | | |
| Jonathon Piel | | | 30,968,801,048 | | | | 868,098,402 | | | | 0 | | |
| Patrick J. Simpson | | | 30,999,065,030 | | | | 837,834,420 | | | | 0 | | |
| Anne-Lee Verville | | | 30,996,227,913 | | | | 840,671,537 | | | | 0 | | |
52
Important Information About This Report
The fund mails one shareholder report to each shareholder address. If you would like more than one report, please call shareholder services at 1-800-345-6611 and additional reports will be sent to you. This report has been prepared for shareholders of Columbia High Yield Opportunity Fund.
A description of the policies and procedures that the fund uses to determine how to vote proxies and a copy of the fund's voting records are available (i) at www.columbiamanagement.com, (ii) on the Securities and Exchange Commission's website at www.sec.gov, and (iii) without charge, upon request, by calling 1-800-368-0346. Information regarding how the fund voted proxies relating to portfolio securities during the 12-month period ended June 30 is available from the SEC's website. Information regarding how the fund voted proxies relating to portfolio securities is also available from the fund's website, www.columbiamanagement.com.
The fund files a complete schedule of portfolio holdings with the SEC for the first and third quarters of each fiscal year on Form N-Q. The fund's Form N-Q is available on the SEC's website at www.sec.gov and may be reviewed and copied at the SEC's Public Reference Room in Washington, D.C. Information on the operation of the Public Reference Room may be obtained by calling 1-800-SEC-0330.
Investors should consider the investment objectives, risks, charges and expenses of a mutual fund carefully before investing. For a free prospectus, which contains this and other important information about the funds, visit www.columbiamanagement.com. Read the prospectus carefully before investing.
On April 30, 2010, Ameriprise Financial, Inc., the parent company of RiverSource Investments, LLC, acquired the long-term asset management business of Columbia Management Group, LLC, including certain of its affiliates, which were, prior to this acquisition, part of Bank of America. In connection with the acquisition of the long-term assets, the Columbia Funds have a new investment adviser, RiverSource Investments, LLC, which is now known as Columbia Management Investment Advisers, LLC. For those clients that use the services of a subadviser, those arrangements are continuing unless notified otherwise. RiverSource Fund Distributors, Inc., now known as Columbia Management Investment Distributors, Inc., member FINRA, will act as the principal distributor of the Columbia Funds.
Transfer Agent*
Columbia Management Investment
Services Corp.
P.O. Box 8081
Boston, MA 02266-8081
1-800-345-6611
Distributor*
Columbia Management Investment
Distributors, Inc.
One Financial Center
Boston, MA 02111
Investment Advisor*
Columbia Management Investment Advisers, LLC
100 Federal Street
Boston, MA 02110
53

PRSRT STD
U.S. Postage
PAID
Holliston, MA
Permit NO. 20
Columbia High Yield Opportunity Fund
One Financial Center
Boston, MA 02111-2621
www.columbiafunds.com
This report must be accompanied or preceeded by the Fund's current prospectus. Columbia Management mutual funds are distributed by Columbia Management Investment Distributors, Inc.
©2010 Columbia Management Investment Advisers, LLC. All rights reserved.
C-1041 A (7/10)

Columbia High Yield Opportunity Fund
This report must be accompanied or preceeded by the Fund's current prospectus. Columbia Management mutual funds are distributed by Columbia Management Investment Distributors, Inc.
©2010 Columbia Management Investment Advisers, LLC. All rights reserved.
C-1041 A (7/10)

Columbia International Bond Fund
Annual Report for the Period Ended May 31, 2010
Table of Contents
The views expressed in this report reflect the current views of the respective parties. These views are not guarantees of future performance and involve certain risks, uncertainties and assumptions that are difficult to predict, so actual outcomes and results may differ significantly from the views expressed. These views are subject to change at any time based upon economic, market or other conditions and the respective parties disclaim any responsibility to update such views. These views may not be relied on as investment advice and, because investment decisions for a Columbia Fund are based on numerous factors, may not be relied on as an indication of trading intent on behalf of any particular Columbia Fund. References to specific securities should not be construed as a recommendation or investment advice.
President’s Message

Dear Shareholder:
On May 3, 2010, Ameriprise Financial, Inc. announced that it had completed the acquisition of the long-term asset management business of Columbia Management Group, LLC from Bank of America. This includes the business of managing its equity and fixed-income mutual funds. Ameriprise Financial has combined its current U.S. asset management business, RiverSource Investments, LLC, with Columbia Management. This transaction puts together two leading asset management firms to create one entity that ranks as one of the largest managers of long-term mutual fund assets in the United States. This combined business will operate under the well-regarded Columbia Management brand, where we will build on the strengths of our combined investment capabilities and talent, our broad and diversified product lineup and exceptional service.
Our combined business has a new breadth and depth of investment choices. William “Ted” Truscott, CEO, U.S. asset management and president of annuities for Ameriprise Financial, leads the combined U.S. asset management business. Michael Jones serves as president, U.S. asset management.1 Colin Moore continues to serve as chief investment officer.1 I am also continuing in my role as head of mutual funds, responsible for the delivery of mutual fund products and services to investors. The Columbia funds’ advisers, distributor and transfer agent are now subsidiaries of our parent company, Ameriprise Financial, but operate under the Columbia Management name. You will begin to see these names used in communications and statements going forward.
| | |
| | | Service provider name |
| Advisers | | Columbia Management Investment Advisers, LLC Columbia Wanger Asset Management, LLC |
| Distributor | | Columbia Management Investment Distributors, Inc. |
| Transfer Agent | | Columbia Management Investment Services Corp. |
As a valued investor in Columbia funds, please know that our goal is to ensure a smooth transition and provide the highest quality products and services. Transition teams across the organization continue their efforts to build on best practices from both legacy organizations with integration efforts including rebranding, vendor and system consolidations and client communications. Additionally, we want to assure you that the funds’ portfolio managers also continue to focus on providing uninterrupted service to all fund shareholders.
Although we have a lot of work ahead of us in 2010, Columbia Management and Ameriprise Financial are excited about the opportunities for our combined organization. I share this optimism and believe it positions us as a best-in-class asset management business with the ability to deliver more for our clients than ever before.
Sincerely,

J. Kevin Connaughton
President, Columbia Funds
| 1 | Associate joined Columbia Management Investment Advisers, LLC as part of its 2010 acquisition of the long-term asset management business of Columbia Management Group, LLC from Bank of America. |
Investors should consider the investment objectives, risks, charges and expenses of a mutual fund carefully before investing. For a free prospectus, which contains this and other important information about the funds, visit www.columbiamanagement.com. Read the prospectus carefully before investing.
Securities products offered through Columbia Management Investment Distributors, Inc. (formerly known as RiverSource Fund Distributors, Inc.), member FINRA. Advisory services provided by Columbia Management Investment Advisers, LLC (formerly known as RiverSource Investments, LLC).
© 2010 Columbia Management Investment Advisers, LLC. All rights reserved.
Fund Profile – Columbia International Bond Fund
Performance data quoted represents past performance and current performance may be lower or higher. Past performance is no guarantee of future results. The investment return and principal value will fluctuate so that shares, when redeemed, may be worth more or less than the original cost. Please visit www.columbiafunds.com for daily and most recent month-end performance updates.
Summary
1-year return as of 05/31/10
| | |
| |
 | | +1.07% Class A shares |
| | (without sales charge) |
| |
| | +0.05% Citigroup Non-U.S. World Government Bond Index – Unhedged |
Summary
| n | | For the 12-month period that ended May 31, 2010, the fund’s Class A shares returned 1.07% without sales charge. |
| n | | The fund outperformed its benchmark, the Citigroup Non-U.S. World Government Bond Index — Unhedged1, but lagged its peer group, the Lipper International Income Funds Classification.2 |
| n | | The fund gained ground against its benchmark by having less exposure to the euro and to government bonds issued by countries that were at the center of the European debt crisis. An underweight in emerging market debt and investment-grade corporate bonds hindered performance relative to the peer group. |
Portfolio Management
Laura A. Ostrander has managed the fund since 2008 and has been associated with the advisor since May 2010. Prior to joining the advisor, Ms. Ostrander was associated with the fund’s previous advisor or its predecessors since 1996.
Effective July 16, 2010, Nicholas Pifer, CFA replace Laura A. Ostrander as manager of the fund. Mr. Pifer has been associated with the advisor or its predecessors since 2000.
| 1 | The Citigroup Non-U.S. World Government Bond Index – Unhedged is calculated on a market-weighted basis and includes all fixed-rate bonds with a remaining maturity of one year or longer and with amounts outstanding of at least the equivalent of U.S. $25 million. The index excludes floating or variable rate bonds, securities aimed principally at non-institutional investors and private placement-type securities. Indices are not available for investment, are not professionally managed and do not reflect sales charges, fees, brokerage commissions, taxes or other expenses of investing. Securities in the fund may not match those in an index. |
| 2 | Lipper Inc., a widely respected data provider in the industry, calculates an average total return (assuming reinvestment of distributions) for mutual funds with investment objectives similar to those of the fund. Lipper makes no adjustments for the effect of sales loads. |
1
Economic Update – Columbia International Bond Fund
Summary
For the 12-month period that ended May 31, 2010
| | n | | Solid economic growth and relatively low interest rates boosted bond market returns. The Barclays Capital Aggregate Bond Index delivered solid results. High-yield bonds outperformed stocks, as measured by the Credit Suisse First Boston High Yield Index and the S&P 500 Index. | |
| | |
| Barclays Aggregate Index | | Credit Suisse Index |
| |

| |
|
8.42% | | 29.96% |
| | n | | The U.S. stock market, as measured by the S&P 500 Index, delivered solid returns, despite a correction in the final weeks of the period. Emerging market stocks, as measured by the MSCI Emerging Markets Index, outperformed U.S. stocks as well as stock markets in developed foreign markets. | |
| | |
| S&P Index | | MSCI Index |
| |
| |
|
20.99% | | 22.39% |
Although it has been nearly a year since U.S. economic growth turned positive, the economy continues to send mixed signals about the sustainability of this recovery. Consumer spending on items such as cars, clothing and other goods, for example, was solid throughout most of the year. But in May, spending fell 1.2%. By contrast, consumer confidence gained ground near the end of the period as consumers surveyed indicated they were increasingly optimistic about business conditions and job prospects.
The housing market showed some signs of stabilizing. However, a full recovery remained out of reach. Home sales moved generally higher, as mortgage rates remained low and new homebuyers took advantage of a federal tax credit, which was extended through June of 2010 — the second such extension in the past six months. Distressed properties continued to pressure prices and a huge backlog of foreclosed homes is likely to continue to keep a lid on prices for some time. Yet, housing prices were higher at the end of May than they were one year ago.
News on the job front was mostly positive. Approximately 290,000 new jobs were added to the economy in April — the second consecutive month of significant job gains in 2010. Yet, a good portion of those jobs are government sponsored and temporary.
Reports from the business side of the economy were generally positive. A key measure of the nation’s manufacturing situation — the Institute for Supply Management’s Index — rose for nine consecutive months before a slight downtick in May and industrial production moved higher. Perhaps the best news was about corporate profits. Of the S&P 500 companies announcing first-quarter results, 77% exceeded Wall Street earnings forecasts.
Bond returns ranged from solid to strong
As the economy strengthened, bonds delivered solid returns. The Barclays Capital Aggregate Bond Index1 returned 8.42%. Municipal bonds gained slightly more than taxable investment-grade bonds even without factoring in potential tax advantages to investors in higher income-tax brackets. The Barclays Capital Municipal Bond Index2 returned 8.52%. The high-yield bond market outpaced stocks during the period. For the 12 months covered by this report, the Credit Suisse First Boston (CSFB) High Yield Index3 returned 29.96%. Even the Treasury market was positive as the yield on the 10-year U.S. Treasury, a common bellwether for the bond market, fell from 3.5% to 3.3% during the 12-month period. Despite the pickup in economic activity, the Federal Reserve Board (the Fed) kept a key short-term interest rate — the federal funds rate — close to zero.
Stocks staged a solid comeback
Against a strengthening economic backdrop, a stock market rally that began in mid-March 2009 continued into April 2010, when a debt crisis brewing in Europe spilled over and undermined investor confidence in the United States. The S&P 500 Index4 lost on the order of 10% in the final six weeks of the period. Yet, the U.S. stock market returned 20.99% for the 12-month period, as measured by the S&P 500 Index. Outside the United States, stock market returns were also strong. The MSCI EAFE Index,5 a broad gauge of stock market performance in foreign developed markets,
2
Economic Update (continued) – Columbia International Bond Fund
returned 6.38% (net of dividends, in U.S. dollars) for the period, as concerns about the impact of a bailout for weak eurozone economies weighed on the markets. Emerging stock markets were more resilient. The MSCI Emerging Markets Index6 returned 22.39% (net of dividends, in U.S. dollars) for the 12-month period.
Past performance is no guarantee of future results.
| 1 | The Barclays Capital Aggregate Bond Index is a market value-weighted index that tracks the daily price, coupon, pay-downs and total return performance of fixed-rate, publicly placed, dollar-denominated and non-convertible investment grade debt issues with at least $250 million par amount outstanding and with at least one year to final maturity. |
| 2 | The Barclays Capital Municipal Bond Index is considered representative of the broad market for investment grade, tax-exempt bonds with a maturity of at least one year. |
| 3 | The Credit Suisse First Boston (CFSB) High Yield Index is a broad-based index that tracks the performance of high-yield bonds. |
| 4 | The Standard & Poor’s (S&P) 500 Index tracks the performance of 500 widely held, large-capitalization U.S. stocks. |
| 5 | The Morgan Stanley Capital International Europe, Australasia, Far East (MSCI EAFE) Index is a capitalization-weighted index that tracks the total return of common stocks in 21 developed-market countries within Europe, Australasia and the Far East. |
| 6 | The Morgan Stanley Capital International Emerging Markets Index (MSCI EMI) is a free float-adjusted market capitalization index that is designed to measure equity market performance in the global emerging markets. As of June 2009, the MSCI Emerging Markets Index consisted of the following 22 emerging market country indices: Brazil, Chile, China, Colombia, Czech Republic, Egypt, Hungary, India, Indonesia, Israel, Korea, Malaysia, Mexico, Morocco, Peru, Philippines, Poland, Russia, South Africa, Taiwan, Thailand and Turkey. |
Indices are not available for investment, are not professionally managed and do not reflect sales charges, fees, brokerage commissions, taxes or other expenses of investing. Securities in the fund may not match those in an index.
3
Performance Information – Columbia International Bond Fund
Performance data quoted represents past performance and current performance may be lower or higher. Past performance is no guarantee of future results. The investment return and principal value will fluctuate so that shares, when redeemed, may be worth more or less than the original cost. Please visit www.columbiafunds.com for daily and most recent month-end performance updates.
| | |
| Annual operating expense ratio (%)* |
| |
Class A | | 2.33 |
Class C | | 3.08 |
Class Z | | 2.08 |
| | |
Annual operating expense ratio
after contractual waivers (%)* |
| |
Class A | | 1.05 |
Class C | | 1.80 |
Class Z | | 0.80 |
| * | The annual operating expense ratio and annual operating expense ratio after contractual waivers are as stated in the fund’s prospectus that is current as of the date of this report. The contractual waivers expire 09/30/10. Differences in expense ratios disclosed elsewhere in this report may result from the inclusion of fee waivers and expense reimbursements as well as different time periods used in calculating the ratios. |
|
| Performance of a $10,000 investment 12/01/08 – 05/31/10 |
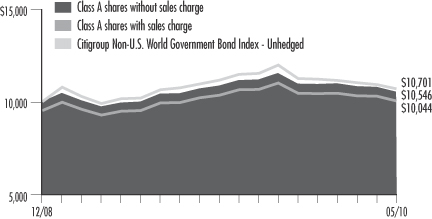
The chart above shows the change in value of a hypothetical $10,000 investment in the Class A shares of Columbia International Bond Fund during the stated time period, and does not reflect the deduction of taxes that a shareholder may pay on fund distributions or on the redemption of fund shares.
| | | | |
| Performance of a $10,000 investment 12/01/08 – 05/31/10 ($) |
| | |
| Sales charge | | without | | with |
Class A | | 10,546 | | 10,044 |
Class C | | 10,419 | | 10,419 |
Class Z | | 10,585 | | n/a |
| | | | | | | | | | |
| Average annual total return as of 05/31/10 (%) |
| | | |
| Share class | | A | | C | | Z |
| Inception | | 12/01/08 | | 12/01/08 | | 12/01/08 |
| Sales charge | | without | | with | | without | | with | | without |
1-year | | 1.07 | | –3.75 | | 0.21 | | –0.78 | | 1.31 |
Life | | 3.62 | | 0.29 | | 2.78 | | 2.78 | | 3.87 |
| | | | | | | | | | | |
| Average annual total return as of 06/30/10 (%) |
| | | |
| Share class | | A | | C | | Z |
| Sales charge | | without | | with | | without | | with | | without |
1-year | | 2.49 | | -2.39 | | 1.72 | | 0.72 | | 2.74 |
Life | | 4.46 | | 1.28 | | 3.69 | | 3.69 | | 4.72 |
The “with sales charge” returns include the maximum initial sales charge of 4.75% for Class A shares and the applicable contingent deferred sales charge of 1.00% for Class C shares for the first year only. The “without sales charge” returns do not include the effect of sales charges. If they had, returns would be lower.
Performance results reflect any fee waivers or reimbursements of fund expenses by the investment advisor and/or any of its affiliates. Absent these fee waivers or expense reimbursement arrangements, performance results would have been lower.
All results shown assume reinvestment of distributions. Class Z shares are sold at net asset value with no distribution and service (Rule 12b-1) fees. Class Z shares have limited eligibility and the investment minimum requirements may vary. Please see the fund’s prospectus for details. Performance for different share classes will vary based on differences in sales charges and fees associated with each class.
The tables do not reflect the deduction of taxes that a shareholder may pay on fund distributions or on the redemption of fund shares.
4
Understanding Your Expenses – Columbia International Bond Fund
Estimating your actual expenses
To estimate the expenses that you paid over the period, first you will need your account balance at the end of the period:
| | n | | For shareholders who receive their account statements from Columbia Management Investment Services Corp., your account balance is available online at www.columbiafunds.com or by calling Shareholder Services at 800.345.6611. | |
| | n | | For shareholders who receive their account statements from their financial intermediary, contact your financial intermediary to obtain your account balance. | |
| | 1. | Divide your ending account balance by $1,000. For example, if an account balance was $8,600 at the end of the period, the result would be 8.6. | |
| | 2. | In the section of the table below titled “Expenses paid during the period,” locate the amount for your share class. You will find this number in the column labeled “Actual.” Multiply this number by the result from step 1. Your answer is an estimate of the expenses you paid on your account during the period. | |
If the value of your account falls below the minimum initial investment requirement applicable to you, your account may be subject to a $20 annual fee. This fee is not included in the accompanying table. If you are subject to the fee, keep it in mind when you are estimating the ongoing expenses of investing in the fund and when comparing the expenses of this fund with other funds.
As a fund shareholder, you incur two types of costs. There are transaction costs, which generally include sales charges on purchases and may include redemption fees or exchange fees. There are also ongoing costs, which generally include investment advisory fees, distribution and service (Rule 12b-1) fees and other fund expenses. The information on this page is intended to help you understand the ongoing costs of investing in the fund and to compare these costs with the ongoing costs of investing in other mutual funds.
Analyzing your fund’s expenses by share class
To illustrate these ongoing costs, we have provided an example and calculated the expenses paid by investors in each share class during the period. The information in the following table is based on an initial investment of $1,000, which is invested at the beginning of the period and held for the entire period. Expense information is calculated two ways and each method provides you with different information. The amount listed in the “Actual” column is calculated using the fund’s actual operating expenses and total return for the period. The amount listed in the “Hypothetical” column for each share class assumes that the return each year is 5% before expenses and is calculated based on the fund’s actual operating expenses. You should not use the hypothetical account values and expenses to estimate either your actual account balance at the end of the period or the expenses you paid during this period.
Compare with other funds
Since all mutual funds are required to include the same hypothetical calculations about expenses in shareholder reports, you can use this information to compare the ongoing costs of investing in the fund with other funds. To do so, compare the 5% hypothetical example with the 5% hypothetical examples that appear in the shareholder reports of other funds. As you compare hypothetical examples of other funds, it is important to note that hypothetical examples are meant to highlight the ongoing costs of investing in a fund and do not reflect any transaction costs, such as sales charges, redemption fees or exchange fees.
| | | | | | | | | | | | | | |
| 12/01/09 – 05/31/10 | | |
| | | | |
| | | Account value at the
beginning of the period ($) | | Account value at the
end of the period ($) | | Expenses paid
during the period ($) | | Fund’s annualized
expense ratio (%) |
| | | Actual | | Hypothetical | | Actual | | Hypothetical | | Actual | | Hypothetical | | Actual |
Class A | | 1,000.00 | | 1,000.00 | | 913.10 | | 1,019.70 | | 5.01 | | 5.29 | | 1.05 |
Class C | | 1,000.00 | | 1,000.00 | | 908.80 | | 1,015.96 | | 8.57 | | 9.05 | | 1.80 |
Class Z | | 1,000.00 | | 1,000.00 | | 914.30 | | 1,020.94 | | 3.82 | | 4.03 | | 0.80 |
Expenses paid during the period are equal to the annualized expense ratio for the share class, multiplied by the average account value over the period, then multiplied by the number of days in the fund’s most recent fiscal half-year and divided by 365.
Had the investment advisor and/or any of its affiliates not waived fees or reimbursed a portion of expenses, account value at the end of the period would have been reduced.
It is important to note that the expense amounts shown in the table are meant to highlight only ongoing costs of investing in the fund and do not reflect any transaction costs, such as sales charges, redemption fees or exchange fees. Therefore, the hypothetical examples provided may not help you determine the relative total costs of owning shares of different funds. If these transaction costs were included, your costs would have been higher.
5
Portfolio Manager’s Report – Columbia International Bond Fund
Performance data quoted represents past performance and current performance may be lower or higher. Past performance is no guarantee of future results. The investment return and principal value will fluctuate so that shares, when redeemed, may be worth more or less than the original cost. Please visit www.columbiafunds.com for daily and most recent month-end performance updates.
| | |
| Net asset value per share |
|
as of 05/31/10 ($) |
Class A | | 10.28 |
Class C | | 10.27 |
Class Z | | 10.28 |
| | |
| Distributions declared per share |
|
06/01/09 – 05/31/10 ($) |
Class A | | 0.23 |
Class C | | 0.15 |
Class Z | | 0.26 |
| | |
| Portfolio structure |
| |
as of 05/31/10 (%) | | |
Foreign Government Obligations | | 91.5 |
Corporate Fixed-Income Bonds & Notes | | 3.7 |
Short-Term Obligation | | 3.3 |
U.S. Government Obligation | | 0.4 |
Other Assets & Liabilities, Net | | 1.1 |
The fund is actively managed and the composition of its portfolio will change over time. Portfolio structure is calculated as a percentage of net assets.
For the 12-month period that ended May 31, 2010, the fund’s Class A shares returned 1.07% without sales charge. The fund’s benchmark, the Citigroup Non-U.S. World Government Bond Index-Unhedged, returned 0.05% over the same period. The average return of the fund’s peer group, the Lipper International Income Funds Classification, was 5.63%. An underweight in the euro, as well as in weaker-performing European government bonds helped performance versus the index, as did an overweight in emerging market debt. The fund’s long-standing focus on high-quality developed market sovereign (or government) and quasi-sovereign debt hurt results relative to the peer group, as riskier assets outperformed.
Favorable positioning within developed markets
Over the past year, yields on most high-quality global government bonds declined, resulting in modestly positive total returns. However, gains on the best performing European bonds, including German bunds, turned negative when converted into U.S. dollars, as the euro weakened versus the U.S. dollar, Japanese yen and Swiss franc. The euro weakened as the Greek debt crisis unfolded, following elections last fall that highlighted problems with the country’s economy, including unsustainable fiscal deficits and weak tax collection policies. The crisis also called into question the economic competitiveness and debt policies of other European countries, including Portugal, Italy, Ireland and Spain, leading to concerns about a possible break-up in the European monetary union. As Europe’s debt crisis intensified over the last four months of the period, the euro declined sharply and investors backed away from riskier assets. Against this backdrop, the fund benefited from an underweight versus the index in the euro, as well as from limited exposure to bonds issued by the weakest European countries. An overweight in sovereign debt from the better-performing European countries of Germany and France also helped, as did overweights in the government bonds and currencies of Canada, Australia, New Zealand and Norway. On the downside, a smaller stake than the index in the Japanese yen, as well as yen-denominated bonds, detracted from performance, as the yen strengthened versus the U.S. dollar.
Strongest gains from higher-risk assets
Emerging market bonds, particularly those denominated in local currency, were strong performers, climbing over 15% for the year. The sector benefited as economies around the world stabilized, leading investors to take on more risk in exchange for potentially higher returns. Among the best performers were government bonds issued by higher-risk countries such as Argentina and Ukraine. The fund had roughly 10% of its assets invested in emerging market debt — a larger weight than emerging market debt in the index — and the overweight benefited performance. However, we believe that the fund lagged its Lipper peer group because its stake in emerging market debt, particularly in issues denominated in local currencies, was lower than the average competing fund. Exposure to foreign-issued investment grade corporate bonds, which modestly outpaced returns on emerging market debt, was also limited.
6
Portfolio Manager’s Report (continued) – Columbia International Bond Fund
| | |
| Quality breakdown |
| |
as of 05/31/10 (%) | | |
AAA | | 50.5 |
AA | | 23.2 |
A | | 9.4 |
BBB | | 5.1 |
BB | | 4.1 |
B | | 0.6 |
Not Rated | | 5.1 |
Other | | 2.0 |
| | |
| Maturity breakdown |
| |
as of 05/31/10 (%) | | |
0-1 year | | 1.9 |
1-3 years | | 10.8 |
3-5 years | | 21.8 |
5-7 years | | 28.3 |
7-10 years | | 17.2 |
10-15 years | | 5.8 |
15-20 years | | 6.1 |
20-30 years | | 2.8 |
Repurchase Agreement | | 3.3 |
Other | | 2.0 |
Quality and maturity breakdowns are calculated as a percentage of total net assets.
Ratings shown in the quality breakdown are assigned to individual bonds by taking the lower of the ratings available from one of the following nationally recognized rating agencies: Standard & Poor’s or Moody’s Investor Services. If a security is rated by only one of the two agencies, that rating is used. If a security is not rated by either of the two agencies, it is designated as Non-Rated. Ratings are relative and subjective and are not absolute standards of quality. The credit quality of the fund’s investments does not remove market risk.
| | |
30-day SEC yields |
|
as of 05/31/10 (%) |
Class A | | 1.32 |
Class C | | 0.65 |
Class Z | | 1.64 |
The 30-day SEC yields reflect the fund’s earning power net of expenses, expressed as an annualized percentage of the public offering price per share at the end of the period. Had the investment adviser not waived fees or reimbursed a portion of expenses, the 30-day SEC yields would have been reduced.
Positioned for gradual recovery
With time, we hope to see evidence that the current global economic recovery is sustainable, especially once central governments worldwide return to more normal fiscal and economic policies. Near-term, however, we believe that economic growth in major industrialized nations will be tepid, resulting in continued market volatility and keeping short-term interest rates on hold for some time. The United States, in particular, continues to struggle with weak consumer demand, high unemployment and an effective exit strategy for its fiscal stimulus measures. By contrast, emerging market economies, particularly in Asia, are likely to lead the global recovery and could be among the first to remove stimulus measures and raise key short-term interest rates. While owning riskier assets was the key to outperformance in 2009, we think security selection will be the big driver of results going forward. With these expectations in mind, we plan to position the fund to benefit from improving economic conditions.
Portfolio characteristics and holdings are subject to change periodically and may not be representative of current characteristics and holdings. The outlook for the fund may differ from that presented for other Columbia Funds.
Investing in fixed-income securities may involve certain risks, including the credit quality of individual issuers, possible prepayments, market or economic developments and yield and share price fluctuations due to changes in interest rates. When interest rates go up, bond prices typically drop, and vice versa.
Investments in high-yield bonds (sometimes referred to as “junk” bonds) offer the potential for high current income and attractive total return, but involve certain risks. Changes in economic conditions or other circumstances may adversely affect a high-yield bond issuer’s ability to make principal and interest payments.
International investing involves special risks, including foreign taxation, currency fluctuations, risks associated with possible differences in financial standards and other risks associated with future political and economic developments.
Investing in emerging markets may involve greater risks than investing in more developed countries. In addition, concentration of investments in a single region may result in greater volatility.
The fund is non-diversified, which generally means that it may invest a greater percentage of its total assets in the securities of fewer issuers than a “diversified” fund. This increases the risk that a change in the value of any one investment held by the fund could affect the overall value of the fund more than it would affect that of a diversified fund holding a greater number of investments. Accordingly, the fund’s value will likely be more volatile than the value of more diversified funds.
7
Investment Portfolio – Columbia International Bond Fund
May 31, 2010
Government & Agency Obligations – 91.9%
| | | | | | |
| | | | | Par (a) | | Value ($) |
| Foreign Government Obligations – 91.5% |
| Asian Development Bank |
2.350% 06/21/27 | | JPY | | 50,000,000 | | 577,789 |
|
| Canada Housing Trust No. 1 |
4.000% 06/15/12 | | CAD | | 75,000 | | 74,168 |
|
| Development Bank of Japan |
1.750% 03/17/17 | | JPY | | 10,000,000 | | 116,961 |
|
| Eksportfinans A/S |
1.600% 03/20/14 | | JPY | | 60,000,000 | | 680,082 |
1.800% 06/21/10 | | JPY | | 5,000,000 | | 55,029 |
|
| Eurofima |
4.375% 10/21/19 | | EUR | | 100,000 | | 133,568 |
|
| European Investment Bank |
1.250% 09/20/12 | | JPY | | 18,500,000 | | 207,868 |
1.400% 06/20/17 | | JPY | | 49,000,000 | | 554,722 |
|
| Federal Republic of Germany |
3.750% 01/04/19 | | EUR | | 190,000 | | 255,516 |
4.250% 07/04/14 | | EUR | | 325,000 | | 445,885 |
4.250% 07/04/17 | | EUR | | 555,000 | | 773,292 |
|
| Federative Republic of Brazil |
7.375% 02/03/15 | | EUR | | 30,000 | | 42,613 |
7.875% 03/07/15 | | | | 50,000 | | 58,925 |
8.250% 01/20/34 | | | | 70,000 | | 90,475 |
|
| Government of Belgium |
3.250% 09/28/16 | | EUR | | 185,000 | | 236,762 |
3.500% 03/28/15 | | EUR | | 75,000 | | 98,221 |
|
| Government of Canada |
3.750% 06/01/19 | | CAD | | 225,000 | | 222,952 |
4.250% 06/01/18 | | CAD | | 190,000 | | 194,533 |
|
| Government of Denmark |
5.000% 11/15/13 | | DKK | | 695,000 | | 129,324 |
|
| Government of Japan |
1.400% 12/20/18 | | JPY | | 52,200,000 | | 593,261 |
1.500% 09/20/14 | | JPY | | 67,250,000 | | 774,996 |
1.500% 09/20/18 | | JPY | | 5,900,000 | | 67,616 |
1.900% 09/20/23 | | JPY | | 29,000,000 | | 329,370 |
|
| Government of Malaysia |
7.500% 07/15/11 | | | | 60,000 | | 63,687 |
|
| Government of New Zealand |
6.000% 05/15/21 | | NZD | | 150,000 | | 105,113 |
6.500% 04/15/13 | | NZD | | 55,000 | | 39,430 |
|
| Instituto de Credito Oficial (Spain) |
1.500% 09/20/12 | | JPY | | 18,000,000 | | 198,033 |
| | | | | | |
| | | | | Par (a) | | Value ($) |
| International Bank for Reconstruction & Development |
4.250% 06/01/10 | | EUR | | 120,000 | | 147,258 |
|
| Kingdom of Netherlands |
4.000% 07/15/16 | | EUR | | 240,000 | | 325,950 |
|
| Kingdom of Norway |
4.250% 05/19/17 | | NOK | | 240,000 | | 40,508 |
5.000% 05/15/15 | | NOK | | 440,000 | | 76,095 |
|
| Kingdom of Spain |
3.800% 01/31/17 | | EUR | | 290,000 | | 355,657 |
|
| Kingdom of Sweden |
3.750% 08/12/17 | | SEK | | 680,000 | | 94,273 |
5.500% 10/08/12 | | SEK | | 275,000 | | 38,479 |
|
| Nordic Investment Bank |
1.700% 04/27/17 | | JPY | | 50,000,000 | | 577,853 |
|
| Pemex Project Funding Master Trust |
5.500% 02/24/25 | | EUR | | 20,000 | | 22,723 |
|
| Province of Quebec |
1.600% 05/09/13 | | JPY | | 9,000,000 | | 100,899 |
5.000% 04/29/19 | | EUR | | 50,000 | | 70,258 |
|
| Republic of Argentina |
8.280% 12/31/33 | | | | 50,756 | | 32,738 |
|
| Republic of Austria |
4.300% 09/15/17 (b) | | EUR | | 170,000 | | 232,429 |
|
| Republic of Bulgaria |
8.250% 01/15/15 | | | | 60,000 | | 66,975 |
|
| Republic of China |
4.750% 10/29/13 | | | | 50,000 | | 53,889 |
|
| Republic of Colombia |
8.125% 05/21/24 | | | | 50,000 | | 59,250 |
|
| Republic of Finland |
4.250% 07/04/15 | | EUR | | 145,000 | | 198,996 |
|
| Republic of France |
3.000% 10/25/15 | | EUR | | 280,000 | | 361,737 |
3.500% 07/12/11 | | EUR | | 140,000 | | 177,680 |
4.000% 04/25/13 | | EUR | | 240,000 | | 319,706 |
4.250% 04/25/19 | | EUR | | 228,000 | | 312,254 |
5.500% 04/25/29 | | EUR | | 120,000 | | 186,299 |
|
| Republic of Hungary |
3.500% 07/18/16 | | EUR | | 40,000 | | 45,765 |
|
| Republic of Indonesia |
7.250% 04/20/15 | | | | 38,000 | | 42,918 |
7.250% 04/20/15 (b) | | | | 80,000 | | 90,600 |
See Accompanying Notes to Financial Statements.
8
Columbia International Bond Fund
May 31, 2010
Government & Agency Obligations (continued)
| | | | | | |
| | | | | Par (a) | | Value ($) |
| Foreign Government Obligations (continued) |
| Republic of Ireland |
4.500% 10/18/18 | | EUR | | 90,000 | | 109,773 |
|
| Republic of Italy |
4.250% 08/01/13 | | EUR | | 210,000 | | 271,110 |
4.250% 09/01/19 | | EUR | | 270,000 | | 338,136 |
4.500% 08/01/18 | | EUR | | 95,000 | | 122,239 |
5.250% 08/01/17 | | EUR | | 230,000 | | 312,558 |
|
| Republic of Panama |
6.700% 01/26/36 | | | | 65,000 | | 71,662 |
|
| Republic of Peru |
6.550% 03/14/37 | | | | 45,000 | | 48,510 |
8.750% 11/21/33 | | | | 27,000 | | 35,707 |
|
| Republic of Philippines |
8.875% 03/17/15 | | | | 105,000 | | 128,625 |
|
| Republic of Poland |
5.000% 10/19/15 | | | | 50,000 | | 52,767 |
5.500% 10/25/19 | | PLN | | 375,000 | | 110,218 |
|
| Republic of South Africa |
5.250% 05/16/13 | | EUR | | 50,000 | | 65,192 |
|
| Republic of Turkey |
7.375% 02/05/25 | | | | 140,000 | | 156,100 |
|
Republic of Uruguay
PIK, |
7.875% 01/15/33 | | | | 40,000 | | 46,000 |
|
| Republic of Venezuela |
9.250% 09/15/27 | | | | 100,000 | | 65,500 |
|
| Russian Federation |
7.500% 03/31/30 | | | | 130,640 | | 145,990 |
|
| Switzerland Government Bond |
2.500% 03/12/16 | | CHF | | 80,000 | | 75,038 |
|
| Treasury Corp. of Victoria |
5.750% 11/15/16 | | AUD | | 95,000 | | 80,509 |
6.000% 06/15/20 | | AUD | | 120,000 | | 102,545 |
|
| United Kingdom Treasury |
4.000% 09/07/16 | | GBP | | 255,000 | | 395,109 |
5.000% 09/07/14 | | GBP | | 175,000 | | 283,152 |
5.000% 03/07/25 | | GBP | | 153,000 | | 243,642 |
|
| United Mexican States |
5.625% 01/15/17 | | | | 90,000 | | 96,525 |
6.050% 01/11/40 | | | | 40,000 | | 40,200 |
8.500% 12/13/18 | | MXN | | 205,000 | | 17,291 |
| | | | | | |
Foreign Government Obligations Total | | 14,565,478 |
| | | | | | |
| | | | | | |
| | | | | Par (a) | | Value ($) |
| U.S. Government Obligation – 0.4% |
| U.S. Treasury Note | | | | | | |
2.000% 11/30/13 | | | | 60,000 | | 60,905 |
| | | | | | |
U.S. Government Obligation Total | | 60,905 |
| | | | | | |
Total Government & Agency Obligations
(cost of $15,059,310) | | 14,626,383 |
|
Corporate Fixed-Income Bonds & Notes – 3.7% |
| | | | | | |
| Energy – 0.5% |
| Oil & Gas – 0.5% | | | | | | |
| Ecopetrol SA | | | | | | |
7.625% 07/23/19 | | | | 45,000 | | 50,062 |
| Gazprom International SA | | | | | | |
7.201% 02/01/20 | | | | 25,537 | | 26,063 |
| | | | | | |
Oil & Gas Total | | | | | | 76,125 |
| | | | | | |
Energy Total | | | | | | 76,125 |
| | | | | | |
| Financials – 3.2% |
| Banks – 1.3% | | | | | | |
| Bank Nederlandse Gemeenten | | | | |
1.850% 11/07/16 | | JPY | | 18,000,000 | | 206,231 |
| | | | | | |
Banks Total | | | | | | 206,231 |
| |
| Diversified Financial Services – 1.9% | | |
| General Electric Capital Corp. | | | | |
1.000% 03/21/12 | | JPY | | 20,000,000 | | 218,762 |
| |
| Network Rail Infrastructure Finance PLC | | |
4.375% 12/09/30 | | GBP | | 60,000 | | 84,572 |
| | | | | | |
Diversified Financial Services Total | | 303,334 |
| | | | | | |
Financials Total | | | | | | 509,565 |
| | | | | | |
Total Corporate Fixed-Income Bonds & Notes
(cost of $522,415) | | 585,690 |
| | |
Short-Term Obligation – 3.3% | | | | |
Repurchase agreement with State Street Bank and Trust Co., dated 05/28/10, due 06/01/10 at 0.080%, collateralized by a U.S. Treasury obligation maturing 04/30/17, market value $532,376 (repurchase proceeds $520,005) | | 520,000 | | 520,000 |
| | | | | | |
Total Short-Term Obligation
(cost of $520,000) | | 520,000 |
See Accompanying Notes to Financial Statements.
9
Columbia International Bond Fund
May 31, 2010
| | | | | | |
| | | | | | | Value ($) |
Total Investments – 98.9%
(cost of $16,101,725) (c) | | | | | | 15,732,073 |
| | | | | | |
Other Assets & Liabilities, Net – 1.1% | | 174,640 |
| | | | | | |
Net Assets – 100.0% | | | | | | 15,906,713 |
Notes to Investment Portfolio:
| (a) | Principal amount is stated in United States dollars unless otherwise noted. |
| (b) | Security exempt from registration pursuant to Rule 144A under the Securities Act of 1933. These securities may be resold in transactions exempt from registration, normally to qualified institutional buyers. At May 31, 2010, these securities, which are not illiquid, amounted to $323,029, which represents 2.0% of net assets. |
| (c) | Cost for federal income tax purposes is $16,171,129. |
The following table summarizes the inputs used, as of May 31, 2010, in valuing the Fund’s assets:
| | | | | | | | | | | | | | |
Description | | Quoted
Prices
(Level 1) | | Other
Significant
Observable
Inputs
(Level 2) | | | Significant
Unobservable
Inputs
(Level 3) | | Total | |
Government & Agency Obligations | | | | | | | | | | | | | | |
Foreign Government Obligations | | $ | — | | $ | 14,565,478 | | | $ | — | | $ | 14,565,478 | |
U.S. Government Obligation | | | 60,905 | | | — | | | | — | | | 60,905 | |
| | | | | | | | | | | | | | |
Total Government & Agency Obligations | | | 60,905 | | | 14,565,478 | | | | — | | | 14,626,383 | |
| | | | | | | | | | | | | | |
Total Corporate Fixed-Income Bonds & Notes | | | — | | | 585,690 | | | | — | | | 585,690 | |
| | | | | | | | | | | | | | |
Total Short-Term Obligation | | | — | | | 520,000 | | | | — | | | 520,000 | |
| | | | | | | | | | | | | | |
Total Investments | | | 60,905 | | | 15,671,168 | | | | — | | | 15,732,073 | |
| | | | | | | | | | | | | | |
Unrealized Appreciation on Forward Foreign Currency Exchange Contracts | | | — | | | 354 | | | | — | | | 354 | |
Unrealized Depreciation on Forward Foreign Currency Exchange Contracts | | | — | | | (3,101 | ) | | | — | | | (3,101 | ) |
| | | | | | | | | | | | | | |
Total | | $ | 60,905 | | $ | 15,668,421 | | | $ | — | | $ | 15,729,326 | |
| | | | | | | | | | | | | | |
The Fund’s assets assigned to the level 2 input category include certain foreign securities for which a third party statistical pricing service may be employed for purposes of fair market valuation.
For more information on valuation inputs, and their aggregation into the levels used in the table above, please refer to the Security Valuation section in the accompanying Notes to Financial Statements.
Forward foreign currency exchange contracts outstanding on May 31, 2010 are:
| | | | | | | | | | | | |
Foreign Exchange Rate Risk | | | | | |
Forward
Foreign
Currency
Exchange
Contracts
to Sell | | Value | | Aggregate
Face
Value | | Settlement
Date | | Unrealized
Appreciation
(Depreciation) | |
JPY | | $ | 77,007 | | $ | 75,326 | | 06/09/10 | | $ | (1,681 | ) |
JPY | | | 77,017 | | | 75,597 | | 06/17/10 | | | (1,420 | ) |
JPY | | | 76,474 | | | 76,828 | | 06/23/10 | | | 354 | |
| | | | | | | | | | | | |
| | | | | | | | | | $ | (2,747 | ) |
| | | | | | | | | | | | |
The Fund was invested in the following countries at May 31, 2010:
| | | | | |
Summary of Securities
by Country (Unaudited) | | Value | | % of Total Investments |
Japan | | $ | 1,882,204 | | 12.0 |
Germany | | | 1,474,693 | | 9.4 |
France | | | 1,357,677 | | 8.6 |
Italy | | | 1,044,043 | | 6.7 |
United Kingdom | | | 1,006,475 | | 6.4 |
United States* | | | 969,648 | | 6.2 |
Norway | | | 851,713 | | 5.4 |
Luxembourg | | | 788,653 | | 5.0 |
Finland | | | 776,848 | | 4.9 |
Philippines | | | 706,414 | | 4.5 |
Canada | | | 662,810 | | 4.2 |
Spain | | | 553,690 | | 3.5 |
Netherlands | | | 532,181 | | 3.4 |
Belgium | | | 334,983 | | 2.1 |
Austria | | | 232,429 | | 1.5 |
Switzerland | | | 208,606 | | 1.3 |
Brazil | | | 192,013 | | 1.2 |
Australia | | | 183,054 | | 1.2 |
Poland | | | 162,985 | | 1.0 |
Turkey | | | 156,100 | | 1.0 |
Mexico | | | 154,016 | | 1.0 |
Russian Federation | | | 145,990 | | 0.9 |
New Zealand | | | 144,543 | | 0.9 |
Indonesia | | | 133,518 | | 0.9 |
Sweden | | | 132,751 | | 0.9 |
Denmark | | | 129,324 | | 0.8 |
Ireland | | | 109,773 | | 0.7 |
Colombia | | | 109,312 | | 0.7 |
Peru | | | 84,218 | | 0.5 |
Panama | | | 71,663 | | 0.5 |
Bulgaria | | | 66,975 | | 0.4 |
Venezuela | | | 65,500 | | 0.4 |
South Africa | | | 65,192 | | 0.4 |
Malaysia | | | 63,687 | | 0.4 |
China | | | 53,889 | | 0.3 |
Uruguay | | | 46,000 | | 0.3 |
Hungary | | | 45,765 | | 0.3 |
Argentina | | | 32,738 | | 0.2 |
| | | | | |
| | $ | 15,732,073 | | 100.0 |
| | | | | |
* Includes short-term obligation.
Certain securities are listed by country of underlying exposure but may trade predominantly on another exchange.
| | |
Acronym | | Name |
| AUD | | Australian Dollar |
| CAD | | Canadian Dollar |
| CHF | | Swiss Franc |
| DKK | | Danish Krone |
| EUR | | Euro |
| GBP | | Pound Sterling |
| JPY | | Japanese Yen |
| MXN | | Mexican Peso |
| NOK | | Norwegian Krone |
| NZD | | New Zealand Dollar |
| PIK | | Payment-In-Kind |
| PLN | | Polish Zloty |
| SEK | | Swedish Krona |
See Accompanying Notes to Financial Statements.
10
Statement of Assets and Liabilities – Columbia International Bond Fund
May 31, 2010
| | | | | |
| | | | | ($) | |
| Assets | | Investments, at cost | | 16,101,725 | |
| | | | | |
| | Investments, at value | | 15,732,073 | |
| | Cash | | 556 | |
| | Unrealized appreciation on forward foreign currency exchange contracts | | 354 | |
| | Receivable for: | | | |
| | Investments sold | | 196,277 | |
| | Fund shares sold | | 1,824 | |
| | Interest | | 211,368 | |
| | Foreign tax reclaims | | 604 | |
| | Expense reimbursement due from investment advisor | | 25,814 | |
| | Trustees’ deferred compensation plan | | 2,284 | |
| | Prepaid expenses | | 424 | |
| | Other assets | | 217 | |
| | | | | |
| | Total Assets | | 16,171,795 | |
| | |
| Liabilities | | Unrealized depreciation on forward foreign currency exchange contracts | | 3,101 | |
| | Payable for: | | | |
| | Investments purchased | | 194,246 | |
| | Fund shares repurchased | | 3,053 | |
| | Investment advisory fee | | 7,546 | |
| | Administration fee | | 686 | |
| | Transfer agent fee | | 676 | |
| | Pricing and bookkeeping fees | | 5,352 | |
| | Trustees’ fees | | 1,829 | |
| | Audit fee | | 34,000 | |
| | Custody fee | | 2,200 | |
| | Distribution and service fees | | 466 | |
| | Chief compliance officer expenses | | 118 | |
| | Reports to shareholders | | 7,910 | |
| | Trustees’ deferred compensation plan | | 2,284 | |
| | Other liabilities | | 1,615 | |
| | | | | |
| | Total Liabilities | | 265,082 | |
| | |
| | | | | |
| | Net Assets | | 15,906,713 | |
| | |
| Net Assets Consist of | | Paid-in capital | | 16,218,886 | |
| | Undistributed net investment income | | 65,869 | |
| | Accumulated net realized gain | | 12,372 | |
| | Net unrealized appreciation (depreciation) on: | | | |
| | Investments | | (369,652 | ) |
| | Foreign currency translations | | (20,762 | ) |
| | | | | |
| | Net Assets | | 15,906,713 | |
See Accompanying Notes to Financial Statements.
11
Statement of Assets and Liabilities (continued) – Columbia International Bond Fund
May 31, 2010
| | | | | | |
| | | | | | |
| Class A | | Net assets | | $ | 989,908 | |
| | Shares outstanding | | | 96,340 | |
| | Net asset value per share | | $ | 10.28 | (a) |
| | Maximum sales charge | | | 4.75 | % |
| | Maximum offering price per share ($10.28/0.9525) | | $ | 10.79 | (b) |
| | |
| Class C | | Net assets | | $ | 354,732 | |
| | Shares outstanding | | | 34,525 | |
| | Net asset value and offering price per share | | $ | 10.27 | (a) |
| | |
| Class Z | | Net assets | | $ | 14,562,073 | |
| | Shares outstanding | | | 1,416,927 | |
| | Net asset value, offering and redemption price per share | | $ | 10.28 | |
| (a) | Redemption price per share is equal to net asset value less any applicable contingent deferred sales charge. |
| (b) | On sales of $50,000 or more the offering price is reduced. |
See Accompanying Notes to Financial Statements.
12
Statement of Operations – Columbia International Bond Fund
For the Year Ended May 31, 2010
| | | | | |
| | | | | ($) | |
| Investment Income | | Interest | | 389,795 | |
| | | | | |
| | |
| Expenses | | Investment advisory fee | | 77,060 | |
| | Administration fee | | 7,005 | |
| | Distribution fee – Class C | | 1,144 | |
| | Service fee: | | | |
| | Class A | | 1,735 | |
| | Class C | | 381 | |
| | Transfer agent fee | | 2,827 | |
| | Pricing and bookkeeping fees | | 46,735 | |
| | Trustees’ fees | | 16,644 | |
| | Custody fee | | 12,559 | |
| | Registration fees | | 29,854 | |
| | Audit fee | | 43,078 | |
| | Reports to shareholders | | 17,628 | |
| | Chief compliance officer expenses | | 647 | |
| | Other expenses | | 8,292 | |
| | | | | |
| | Total Expenses | | 265,589 | |
| | |
| | Fees waived or expenses reimbursed by investment advisor | | (150,254 | ) |
| | Expense reductions | | (3 | ) |
| | | | | |
| | Net Expenses | | 115,332 | |
| | |
| | | | | |
| | Net Investment Income | | 274,463 | |
| | |
| Net Realized and Unrealized Gain (Loss) on Investments, Foreign Currency and Forward Foreign Currency Exchange Contracts | | Net realized gain on: | | | |
| | Investments | | 139,026 | |
| | Foreign currency transactions and forward foreign currency
exchange contracts | | 281 | |
| | | | | |
| | Net realized gain | | 139,307 | |
| | |
| | Net change in unrealized appreciation (depreciation) on: | | | |
| | Investments | | (603,650 | ) |
| | Foreign currency translations and forward foreign currency
exchange contracts | | (26,859 | ) |
| | | | | |
| | Net change in unrealized appreciation (depreciation) | | (630,509 | ) |
| | | | | |
| | Net Loss | | (491,202 | ) |
| | |
| | | | | |
| | Net Decrease Resulting from Operations | | (216,739 | ) |
See Accompanying Notes to Financial Statements.
13
Statement of Changes in Net Assets – Columbia International Bond Fund
| | | | | | | | |
| Increase (Decrease) in Net Assets | | | | Year
Ended
May 31,
2010 ($) | | | Period
Ended
May 31,
2009 ($)(a) | |
| Operations | | Net investment income | | 274,463 | | | 55,934 | |
| | Net realized gain on investments, foreign currency transactions and forward foreign currency exchange contracts | | 139,307 | | | 2,946 | |
| | Net change in unrealized appreciation (depreciation) on investments, foreign currency translations and forward foreign currency exchange contracts | | (630,509 | ) | | 240,095 | |
| | | | | | | | |
| | Net increase (decrease) resulting from operations | | (216,739 | ) | | 298,975 | |
| | | |
| Distributions to Shareholders | | From net investment income: | | | | | | |
| | Class A | | (17,337 | ) | | (291 | ) |
| | Class C | | (2,076 | ) | | (15 | ) |
| | Class Z | | (325,033 | ) | | (42,256 | ) |
| | From net realized gains: | | | | | | |
| | Class A | | (441 | ) | | — | |
| | Class C | | (75 | ) | | — | |
| | Class Z | | (6,885 | ) | | — | |
| | | | | | | | |
| | Total distributions to shareholders | | (351,847 | ) | | (42,562 | ) |
| | | |
| | Net Capital Stock Transactions | | 7,521,442 | | | 8,695,709 | |
| | Redemption fees | | 1,011 | | | 724 | |
| | | | | | | | |
| | Total increase in net assets | | 6,953,867 | | | 8,952,846 | |
| | | |
| Net Assets | | Beginning of period | | 8,952,846 | | | — | |
| | End of period | | 15,906,713 | | | 8,952,846 | |
| | Undistributed net investment income at end of period | | 65,869 | | | 14,051 | |
| (a) | The Fund commenced operations on December 1, 2008. |
See Accompanying Notes to Financial Statements.
14
Statement of Changes in Net Assets (continued) – Columbia International Bond Fund
| | | | | | | | | | | | |
| | | Capital Stock Activity | |
| | | Year Ended
May 31, 2010 | | | Period Ended
May 31, 2009 (a) | |
| | | Shares | | | Dollars ($) | | | Shares | | | Dollars ($) | |
Class A | | | | | | | | | | | | |
Subscriptions | | 100,376 | | | 1,098,612 | | | 12,607 | | | 125,589 | |
Distributions reinvested | | 1,621 | | | 17,516 | | | 29 | | | 291 | |
Redemptions | | (18,289 | ) | | (194,447 | ) | | (4 | ) | | (44 | ) |
| | | | | | | | | | | | |
Net increase | | 83,708 | | | 921,681 | | | 12,632 | | | 125,836 | |
| | | | |
Class C | | | | | | | | | | | | |
Subscriptions | | 38,877 | | | 416,152 | | | 3,052 | | | 30,264 | |
Distributions reinvested | | 115 | | | 1,250 | | | 1 | | | 11 | |
Redemptions | | (7,520 | ) | | (79,856 | ) | | — | | | — | |
| | | | | | | | | | | | |
Net increase | | 31,472 | | | 337,546 | | | 3,053 | | | 30,275 | |
| | | | |
Class Z | | | | | | | | | | | | |
Subscriptions | | 720,985 | | | 7,850,434 | | | 856,503 | | | 8,646,596 | |
Distributions reinvested | | 12,579 | | | 135,913 | | | 2,765 | | | 28,076 | |
Redemptions | | (162,469 | ) | | (1,724,132 | ) | | (13,436 | ) | | (135,074 | ) |
| | | | | | | | | | | | |
Net increase | | 571,095 | | | 6,262,215 | | | 845,832 | | | 8,539,598 | |
| (a) | The Fund commenced operations on December 1, 2008. |
See Accompanying Notes to Financial Statements.
15
Financial Highlights – Columbia International Bond Fund
Selected data for a share outstanding throughout each period is as follows:
| | | | | | | | |
| Class A Shares | | Year Ended
May 31, 2010 | | | Period Ended
May 31, 2009 (a) | |
Net Asset Value, Beginning of Period | | $ | 10.39 | | | $ | 10.00 | |
| | |
Income from Investment Operations: | | | | | | | | |
Net investment income (b) | | | 0.19 | | | | 0.07 | |
Net realized and unrealized gain (loss) on investments and foreign currency | | | (0.07 | ) | | | 0.36 | |
| | | | | | | | |
Total from investment operations | | | 0.12 | | | | 0.43 | |
| | |
Less Distributions to Shareholders: | | | | | | | | |
From net investment income | | | (0.22 | ) | | | (0.04 | ) |
From net realized gains | | | (0.01 | ) | | | — | |
| | | | | | | | |
Total distributions to shareholders | | | (0.23 | ) | | | (0.04 | ) |
| | |
Redemption Fees: | | | | | | | | |
Redemption fees added to paid-in-capital (b)(c) | | | — | | | | — | |
| | |
Net Asset Value, End of Period | | $ | 10.28 | | | $ | 10.39 | |
Total return (d)(e) | | | 1.07 | % | | | 4.35 | %(f) |
| | |
Ratios to Average Net Assets/Supplemental Data: | | | | | | | | |
Net expenses (g) | | | 1.05 | % | | | 1.05 | %(h) |
Waiver/Reimbursement | | | 1.07 | % | | | 3.82 | %(h) |
Net investment income (g) | | | 1.78 | % | | | 1.41 | %(h) |
Portfolio turnover rate | | | 30 | % | | | 4 | %(f) |
Net assets, end of period (000s) | | $ | 990 | | | $ | 131 | |
| (a) | Class A shares commenced operations on December 1, 2008. Per share data and total return reflect activity from that date. |
| (b) | Per share data was calculated using the average shares outstanding during the period. |
| (c) | Rounds to less than $0.01 per share. |
| (d) | Total return at net asset value assuming all distributions reinvested and no initial sales charge or contingent deferred sales charge. |
| (e) | Had the investment advisor and/or any of its affiliates not waived fees or reimbursed a portion of expenses, total return would have been reduced. |
| (g) | The benefits derived from expense reductions had an impact of less than 0.01%. |
See Accompanying Notes to Financial Statements.
16
Financial Highlights – Columbia International Bond Fund
Selected data for a share outstanding throughout each period is as follows:
| | | | | | | | |
| Class C Shares | | Year Ended
May 31,
2010 | | | Period Ended
May 31,
2009 (a) | |
Net Asset Value, Beginning of Period | | $ | 10.39 | | | $ | 10.00 | |
| | |
Income from Investment Operations: | | | | | | | | |
Net investment income (b) | | | 0.11 | | | | 0.03 | |
Net realized and unrealized gain (loss) on investments and foreign currency | | | (0.08 | ) | | | 0.37 | |
| | | | | | | | |
Total from investment operations | | | 0.03 | | | | 0.40 | |
| | |
Less Distributions to Shareholders: | | | | | | | | |
From net investment income | | | (0.14 | ) | | | (0.01 | ) |
From net realized gains | | | (0.01 | ) | | | — | |
| | | | | | | | |
Total distributions to shareholders | | | (0.15 | ) | | | (0.01 | ) |
| | |
Redemption Fees: | | | | | | | | |
Redemption fees added to paid-in-capital (b)(c) | | | — | | | | — | |
| | |
Net Asset Value, End of Period | | $ | 10.27 | | | $ | 10.39 | |
Total return (d)(e) | | | 0.21 | % | | | 3.97 | %(f) |
| | |
Ratios to Average Net Assets/Supplemental Data: | | | | | | | | |
Net expenses (g) | | | 1.80 | % | | | 1.80 | %(h) |
Waiver/Reimbursement | | | 1.07 | % | | | 3.82 | %(h) |
Net investment income (g) | | | 1.06 | % | | | 0.59 | %(h) |
Portfolio turnover rate | | | 30 | % | | | 4 | %(f) |
Net assets, end of period (000s) | | $ | 355 | | | $ | 32 | |
| (a) | Class C shares commenced operations on December 1, 2008. Per share data and total return reflect activity from that date. |
| (b) | Per share data was calculated using the average shares outstanding during the period. |
| (c) | Rounds to less than $0.01 per share. |
| (d) | Total return at net asset value assuming all distributions reinvested and no contingent deferred sales charge. |
| (e) | Had the investment advisor and/or any of its affiliates not waived fees or reimbursed a portion of expenses, total return would have been reduced. |
| (g) | The benefits derived from expense reductions had an impact of less than 0.01%. |
See Accompanying Notes to Financial Statements.
17
Financial Highlights – Columbia International Bond Fund
Selected data for a share outstanding throughout each period is as follows:
| | | | | | | | |
| Class Z Shares | | Year Ended
May 31,
2010 | | | Period Ended
May 31,
2009 (a) | |
Net Asset Value, Beginning of Period | | $ | 10.39 | | | $ | 10.00 | |
| | |
Income from Investment Operations: | | | | | | | | |
Net investment income (b) | | | 0.21 | | | | 0.07 | |
Net realized and unrealized gain (loss) on investments and foreign currency | | | (0.06 | ) | | | 0.38 | |
| | | | | | | | |
Total from investment operations | | | 0.15 | | | | 0.45 | |
| | |
Less Distributions to Shareholders: | | | | | | | | |
From net investment income | | | (0.25 | ) | | | (0.06 | ) |
From net realized gains | | | (0.01 | ) | | | — | |
| | | | | | | | |
Total distributions to shareholders | | | (0.26 | ) | | | (0.06 | ) |
| | |
Redemption Fees: | | | | | | | | |
Redemption fees added to paid-in-capital (b)(c) | | | — | | | | — | |
| | |
Net Asset Value, End of Period | | $ | 10.28 | | | $ | 10.39 | |
Total return (d)(e) | | | 1.31 | % | | | 4.48 | %(f) |
| | |
Ratios to Average Net Assets/Supplemental Data: | | | | | | | | |
Net expenses (g) | | | 0.80 | % | | | 0.80 | %(h) |
Waiver/Reimbursement | | | 1.07 | % | | | 3.82 | %(h) |
Net investment income (g) | | | 1.98 | % | | | 1.50 | %(h) |
Portfolio turnover rate | | | 30 | % | | | 4 | %(f) |
Net assets, end of period (000s) | | $ | 14,562 | | | $ | 8,790 | |
| (a) | Class Z shares commenced operations on December 1, 2008. Per share data and total return reflect activity from that date. |
| (b) | Per share data was calculated using the average shares outstanding during the period. |
| (c) | Rounds to less than $0.01 per share. |
| (d) | Total return at net asset value assuming all distributions reinvested. |
| (e) | Had the investment advisor and/or any of its affiliates not waived fees or reimbursed a portion of expenses, total return would have been reduced. |
| (g) | The benefits derived from expense reductions had an impact of less than 0.01%. |
See Accompanying Notes to Financial Statements.
18
Notes to Financial Statements – Columbia International Bond Fund
May 31, 2010
Note 1. Organization
Columbia International Bond Fund (the “Fund”), a series of Columbia Funds Series Trust I (the “Trust”), is a non-diversified portfolio. The Trust is registered under the Investment Company Act of 1940, as amended (the “1940 Act”), as an open-end management investment company organized as a Massachusetts business trust.
Investment Objective
The Fund seeks total return, consisting of current income and capital appreciation.
Fund Shares
The Trust may issue an unlimited number of shares, and the Fund offers three classes of shares: Class A, Class C and Class Z. Each share class has its own expense structure and sales charges, as applicable. The Fund commenced operations on December 1, 2008.
Class A shares are subject to a maximum front-end sales charge of 4.75% based on the amount of initial investment. Class A shares purchased without an initial sales charge in accounts aggregating $1 million to $50 million at the time of purchase are subject to a 1.00% contingent deferred sales charge (“CDSC”) if the shares are sold within one year after purchase. Class C shares are subject to a 1.00% CDSC on shares sold within one year after purchase. Class Z shares are offered continuously at net asset value. There are certain restrictions on the purchase of Class Z shares, as described in the Fund’s prospectus.
Note 2. Significant Accounting Policies
The preparation of financial statements in accordance with accounting principles generally accepted in the United States of America (“GAAP”) requires management to make certain estimates and assumptions that affect the reported amounts of assets and liabilities, the disclosure of contingent assets and liabilities at the date of the financial statements and the reported amounts of revenue and expenses during the reporting period. Actual results could differ from those estimates.
Management has evaluated the events and transactions that have occurred through the date the financial statements were issued and noted no items requiring adjustment of the financial statements or additional disclosures.
The following is a summary of significant accounting policies consistently followed by the Fund in the preparation of its financial statements.
Security Valuation
Debt securities generally are valued by pricing services approved by the Trust’s Board of Trustees, based upon market transactions for normal, institutional-size trading units of similar securities. The services may use various pricing techniques which take into account appropriate factors such as yield, quality, coupon rate, maturity, type of issue, trading characteristics and other data, as well as broker quotes. Debt securities for which quotations are readily available are valued at an over-the-counter or exchange bid quotation.
Certain debt securities, which tend to be more thinly traded and of lesser quality, are priced based on fundamental analysis of the financial condition of the issuer and the estimated value of any collateral. Valuations developed through pricing techniques may vary from the actual amounts realized upon sale of the securities, and the potential variation may be greater for those securities valued using fundamental analysis.
Short-term investments maturing in 60 days or less are valued at amortized cost, which approximates market value.
Forward foreign currency exchange contracts are valued at the prevailing forward exchange rate of the underlying currencies.
Generally, trading in foreign securities is substantially completed each day at various times prior to the close of the New York Stock Exchange (“NYSE”). The values of such securities used in computing the net asset value of the Fund’s shares are determined as of such times. Foreign currency exchange rates are generally determined at 4:00 p.m. Eastern (U.S.) time. Occasionally, events affecting the values of such foreign securities may occur between the times at which they are determined and the close of the customary trading session of the NYSE, which would not be reflected in the computation of the Fund’s net asset value. If events materially affecting the values of such foreign securities occur and it is determined that market quotations are not reliable, then these foreign securities will be valued at their fair value using procedures approved by the Board of Trustees.
19
Columbia International Bond Fund
May 31, 2010
Investments for which market quotations are not readily available, or that have quotations which management believes are not reliable, are valued at fair value as determined in good faith under consistently applied procedures established by and under the general supervision of the Board of Trustees. If a security is valued at fair value, such value is likely to be different from the last quoted market price for the security. The determination of fair value often requires significant judgment. To determine fair value, management may use assumptions including but not limited to future cash flows and estimated risk premiums. Multiple inputs from various sources may be used to determine value.
GAAP establishes a hierarchy that prioritizes the inputs to valuation techniques used to measure fair value giving the highest priority to unadjusted quoted prices in active markets for identical securities (level 1 measurements) and the lowest priority to unobservable inputs (level 3 measurements) when market prices are not readily available or reliable. The three levels of the fair value hierarchy are described below:
| n | | Level 1 — quoted prices in active markets for identical securities |
| n | | Level 2 — prices determined using other significant observable inputs (including quoted prices for similar securities, interest rates, prepayment speeds, credit risk and others) |
| n | | Level 3 — prices determined using significant unobservable inputs. In situations where quoted prices or observable inputs are unavailable or less reliable, unobservable inputs may be used. Unobservable inputs may include management’s own assumptions about the factors market participants would use in pricing an investment. |
The inputs or methodology used for valuing securities are not necessarily an indication of the risk associated with investing in those securities.
On January 21, 2010, the Financial Accounting Standards Board issued an Accounting Standards Update (the “amendment”), Fair Value Measurements and Disclosures (Topic 820): Improving Disclosures about Fair Value Measurements, which provides guidance on how investment assets and liabilities are to be valued and disclosed. Specifically, the amendment requires reporting entities to disclose the input and valuation techniques used to measure fair value for both recurring and nonrecurring fair value measurements for Level 2 and Level 3 positions. The amendment also requires that transfers between all levels (including Level 1 and Level 2) be disclosed on a gross basis (i.e., transfers out must be disclosed separately from transfers in), and requires disclosure of the reason(s) for the transfer. Additionally, purchases, sales, issuances and settlements must be disclosed on a gross basis in the Level 3 rollforward. The effective date of the amendment is for interim and annual periods beginning after December 15, 2009; except for the requirement to provide the Level 3 activity for purchases, sales, issuances and settlements on a gross basis, which will be effective for interim and annual periods beginning after December 15, 2010. At this time, management is evaluating the implications of the amendment and the impact to the financial statements.
Security Transactions
Security transactions are accounted for on the trade date. Cost is determined and gains (losses) are based upon the specific identification method for both financial statement and federal income tax purposes.
Derivative Instruments
The Fund may invest in derivative instruments. For additional information on derivative instruments, please see Note 6.
Repurchase Agreements
The Fund may engage in repurchase agreement transactions with institutions that the Fund’s investment advisor has determined are creditworthy. The Fund, through its custodian, receives delivery of the underlying securities collateralizing a repurchase agreement. The investment advisor is responsible for determining that the collateral is at least equal, at all times, to the value of the repurchase obligation including interest. A repurchase agreement transaction involves certain risks in the event of default or insolvency of the counterparty. These risks include possible delays in or restrictions on the Fund’s ability to dispose of the underlying securities and a possible decline in the value of the underlying securities during the period while the Fund seeks to assert its rights.
Foreign Currency Transactions and Translations
The values of all assets and liabilities quoted in foreign currencies are translated into U.S. dollars at that day’s
20
Columbia International Bond Fund
May 31, 2010
exchange rates. Net realized and unrealized gains (losses) on foreign currency transactions and translations include gains (losses) arising from the fluctuation in exchange rates between trade and settlement dates on securities transactions, gains (losses) arising from the disposition of foreign currency and currency gains (losses) between the accrual and payment dates on dividends, interest income and foreign withholding taxes.
For financial statement purposes, the Fund does not distinguish that portion of gains (losses) on investments which is due to changes in foreign exchange rates from that which is due to changes in market prices of the investments. Such fluctuations are included with the net realized and unrealized gains (losses) on investments on the Statement of Operations.
Income Recognition
Interest income is recorded on the accrual basis. Premium and discount are amortized and accreted, respectively, on all debt securities, unless otherwise noted.
Expenses
General expenses of the Trust are allocated to the Fund and other series of the Trust based upon relative net assets or other expense allocation methodologies determined by the nature of the expense. Expenses directly attributable to the Fund are charged to the Fund.
Determination of Class Net Asset Value
All income, expenses (other than class-specific expenses, as shown on the Statement of Operations) and realized and unrealized gains (losses) are allocated to each class of the Fund on a daily basis, based on the relative net assets of each class, for purposes of determining the net asset value of each class.
Federal Income Tax Status
The Fund intends to qualify each year as a “regulated investment company” under Subchapter M of the Internal Revenue Code, as amended, and will distribute substantially all of its taxable income, if any, for its tax year, and as such will not be subject to federal income taxes. In addition, the Fund intends to distribute in each calendar year substantially all of its net investment income, capital gains and certain other amounts, if any, such that the Fund should not be subject to federal excise tax. Therefore, no provision is made for federal income or excise taxes.
Foreign Capital Gains Taxes
Realized gains in certain countries may be subject to foreign taxes at the fund level, at rates ranging from approximately 10% to 15%. The Fund accrues for such foreign taxes on net realized and unrealized gains at the appropriate rate for each jurisdiction.
Distributions to Shareholders
Distributions from net investment income are declared and paid monthly. Net realized capital gains, if any, are distributed at least annually. Income distributions and capital gain distributions are determined in accordance with federal income tax regulations which may differ from GAAP.
Indemnification
In the normal course of business, the Fund enters into contracts that contain a variety of representations and warranties and which provide general indemnities. The Fund’s maximum exposure under these arrangements is unknown because this would involve future claims against the Fund. Also, under the Trust’s organizational documents and by contract, the Trustees and officers of the Trust are indemnified against certain liabilities that may arise out of actions relating to their duties to the Trust. However, based on experience, the Fund expects the risk of loss due to these representations, warranties and indemnities to be minimal.
Note 3. Federal Tax Information
The timing and character of income and capital gain distributions are determined in accordance with income tax regulations, which may differ from GAAP. Reclassifications are made to the Fund’s capital accounts for permanent tax differences to reflect income and gains available for distribution (or available capital loss carryforwards) under income tax regulations.
For the year ended May 31, 2010, permanent book and tax basis differences resulting primarily from differing treatments for foreign currency transactions, distribution reclassifications, paydown reclassifications, market discount reclassifications and discount accretion/premium amortization on debt securities were
21
Columbia International Bond Fund
May 31, 2010
identified and reclassified among the components of the Fund’s net assets as follows:
| | | | |
| |
Undistributed Net Investment Income | | Accumulated Net Realized
Gain | | Paid-In Capital |
| $121,801 | | $(121,801) | | $— |
Net investment income and net realized gains (losses), as disclosed on the Statement of Operations, and net assets were not affected by this reclassification.
The tax character of distributions paid during the years ended May 31, 2010 and May 31, 2009 was as follows:
| | | | | | |
| | | 2010 | | 2009 |
Ordinary Income* | | $ | 351,847 | | $ | 42,562 |
Long-Term Capital Gains | | | — | | | — |
| * | For tax purposes short-term capital gains distributions, if any, are considered ordinary income distributions. |
As of May 31, 2010, the components of distributable earnings on a tax basis were as follows:
| | | | |
| |
Undistributed
Ordinary Income | | Undistributed Long-Term Capital Gains | | Net Unrealized Depreciation* |
| $134,432 | | $12,373 | | $(439,056) |
| * | The differences between book-basis and tax-basis net unrealized depreciation are primarily due to AICPA adjustments. |
Unrealized appreciation and depreciation at May 31, 2010, based on cost of investments for federal income tax purposes were:
| | | | |
| | |
Unrealized appreciation | | $ | 280,130 | |
Unrealized depreciation | | | (719,186 | ) |
Net unrealized depreciation | | $ | (439,056 | ) |
Management is required to determine whether a tax position of the Fund is more likely than not to be sustained upon examination by the applicable taxing authority, including resolution of any related appeals or litigation processes, based on the technical merits of the position. The tax benefit to be recognized by the Fund is measured as the largest amount of benefit that is greater than fifty percent likely of being realized upon ultimate settlement. Management is not aware of any tax positions for which it is reasonably possible that the total amounts of unrecognized tax benefits will significantly change in the next twelve months. However, management’s conclusions may be subject to review and adjustment at a later date based on factors including, but not limited to, new tax laws, regulations, and administrative interpretations (including relevant court decisions). The Fund’s federal tax returns for the prior three fiscal years remain subject to examination by the Internal Revenue Service.
Note 4. Fees and Compensation Paid to Affiliates
Investment Advisory Fee
After the close of business on April 30, 2010, Ameriprise Financial, Inc. (“Ameriprise Financial”) acquired a portion of the asset management business of Columbia Management Group, LLC (the “Transaction”), including the business of managing the Fund. In connection with the closing of the Transaction (the “Closing”), RiverSource Investments, LLC, a wholly owned subsidiary of Ameriprise Financial, became the investment advisor of the Fund and subsequently changed its name to Columbia Management Investment Advisers, LLC (the “New Advisor”). The New Advisor receives a monthly investment advisory fee based on the Fund’s average daily net assets at the following annual rates:
| | | |
| | |
| Average Daily Net Assets | | Annual Fee Rate | |
First $500 million | | 0.55 | % |
$500 million to $1 billion | | 0.50 | % |
$1 billion to $1.5 billion | | 0.47 | % |
Over $1.5 billion | | 0.44 | % |
For the year ended May 31, 2010, the Fund’s effective investment advisory fee rate was 0.55% of the Fund’s average daily net assets.
Prior to the Closing, Columbia Management Advisors, LLC (“Columbia”), an indirect, wholly owned subsidiary of Bank of America Corporation (“BOA”), provided investment advisory services to the Fund under the same fee structure.
Administration Fee
Effective upon the Closing, the New Advisor became the administrator of the Fund under a new Administrative Services Agreement (the “Administrative Agreement”).
22
Columbia International Bond Fund
May 31, 2010
Under the Administrative Agreement, the New Advisor provides administrative and other services to the Fund, including services previously performed under the Pricing and Bookkeeping Oversight and Services Agreement discussed below. The New Advisor receives a monthly administration fee at the annual rate of 0.05% of the Fund’s average daily net assets. Prior to the Closing, Columbia provided administrative services to the Fund under the same fee rate.
Pricing and Bookkeeping Fees
Prior to the Closing, the Fund entered into a Financial Reporting Services Agreement (the “Financial Reporting Services Agreement”) with State Street Bank and Trust Company (“State Street”) and Columbia pursuant to which State Street provides financial reporting services to the Fund. The Fund also entered into an Accounting Services Agreement (collectively with the Financial Reporting Services Agreement, the “State Street Agreements”) with State Street and Columbia pursuant to which State Street provides accounting services to the Fund. Upon the Closing, Columbia assigned and delegated its rights and obligations under the State Street Agreements to the New Advisor. Under the State Street Agreements, the Fund pays State Street an annual fee of $38,000 paid monthly plus an additional monthly fee based on an annualized percentage rate of average daily net assets of the Fund for the month. The aggregate fee will not exceed $140,000 per year (exclusive of out-of-pocket expenses and charges). The Fund also reimburses State Street for certain out-of-pocket expenses and charges.
Also prior to the Closing, the Fund entered into a Pricing and Bookkeeping Oversight and Services Agreement (the “Services Agreement”) with Columbia. Under the Services Agreement, Columbia provided services related to Fund expenses and the requirements of the Sarbanes-Oxley Act of 2002, and provided oversight of the accounting and financial reporting services provided by State Street. Under the Services Agreement, the Fund reimbursed Columbia for out-of-pocket expenses. The Services Agreement was terminated upon the Closing. These services are now provided under the Administrative Agreement discussed above.
Transfer Agent Fee
In connection with the Closing, RiverSource Service Corporation, a wholly owned subsidiary of Ameriprise Financial, became the transfer agent of the Fund and subsequently changed its name to Columbia Management Investment Services Corp. (the “New Transfer Agent”). The transfer agent fee rates paid by the Fund did not change as a result of the change in transfer agent.
Prior to the Closing, Columbia Management Services, Inc. (the “Former Transfer Agent”), an affiliate of Columbia and an indirect, wholly owned subsidiary of BOA, provided shareholder services to the Fund and contracted with Boston Financial Data Services (“BFDS”) to serve as sub-transfer agent. The Former Transfer Agent was entitled to receive a fee for its services, paid monthly, at the annual rate of $22.36 per account plus reimbursement of certain sub-transfer agent fees paid by the Former Transfer Agent (exclusive of BFDS fees), calculated based on assets held in omnibus accounts and intended to recover the cost of payments to other parties (including affiliates of BOA) for services to those accounts. Prior to November 1, 2009, the annual rate was $17.34 per account. The Former Transfer Agent paid the fees of BFDS for services as sub-transfer agent and was not entitled to reimbursement for such fees from the Fund. The arrangement with BFDS has been continued by the New Transfer Agent.
The Former Transfer Agent retained, as additional compensation for its services, fees for wire, telephone and redemption orders, Individual Retirement Account (“IRA”) trustee agent fees and account transcript fees due to the Former Transfer Agent from shareholders of the Fund and credits (net of bank charges) earned with respect to balances in accounts the Former Transfer Agent maintained in connection with its services to the Fund. The Former Transfer Agent also received reimbursement for certain out-of-pocket expenses.
An annual minimum account balance fee of $20 may apply to certain accounts with a value below the Fund’s initial minimum investment requirements to reduce the impact of small accounts on transfer agent fees. These minimum account balance fees are recorded as part of expense reductions on the Statement of Operations. For the year ended May 31, 2010, no minimum account balance fees were charged.
Underwriting Discounts, Service and Distribution Fees
In connection with the Closing, RiverSource Fund Distributors, Inc., an indirect wholly owned subsidiary of
23
Columbia International Bond Fund
May 31, 2010
Ameriprise Financial, became the distributor of the Fund and subsequently changed its name to Columbia Management Investment Distributors, Inc. (the “New Distributor”). Prior to the Closing, Columbia Management Distributors, Inc. (the “Former Distributor”), an affiliate of Columbia and an indirect, wholly owned subsidiary of BOA, was the principal underwriter of the Fund’s shares. There were no changes to the underwriting discount structure of the Fund or the service or distribution fee rates paid by the Fund as a result of the Transaction.
For the year ended May 31, 2010, the New Distributor and Former Distributor retained net underwriting discounts of $869 on sales of the Fund’s Class A shares and received net CDSC fees of $4 on Class C share redemptions, respectively.
The Fund has adopted distribution and shareholder servicing plans (the “Plans”) pursuant to Rule 12b-1 under the 1940 Act for Class A and Class C shares, which require the payment of distribution and service fees. The fees are intended to compensate the New Distributor and/or eligible selling and/or servicing agents for selling shares of the Fund and providing services to investors.
Payments under the Plans, which are calculated daily and paid monthly, are based on the average daily net assets of the applicable class of the Fund at the following annual rates:
| | | | | | |
| Distribution Fee | | Service Fee | |
| Class C | | Class A | | | Class C | |
| 0.75% | | 0.25 | % | | 0.25 | % |
Fee Waivers and Expense Reimbursements
In connection with the Closing, the New Advisor has contractually agreed to bear a portion of the Fund’s expenses through September 30, 2010, so that the Fund’s ordinary operating expenses (excluding any distribution and service fees, brokerage commissions, interest, taxes and extraordinary expenses, but including custodian charges relating to overdrafts, if any), after giving effect to any balance credits from the Fund’s custodian, do not exceed the annual rate of 0.80% of the Fund’s average daily net assets. There is no guarantee that this expense limitation will continue after September 30, 2010. Prior to the Closing, Columbia contractually agreed to reimburse a portion of the Fund’s expenses in the same manner.
Prior to the Closing, Columbia was entitled to recover from the Fund any fees waived or expenses reimbursed for a three year period following the date of such fee waiver or reimbursement under this arrangement if such recovery did not cause the Fund’s expenses to exceed the expense limitations in effect at the time of recovery. In connection with the Closing, the New Advisor is entitled to recover from the Fund any fees waived or expenses reimbursed for a three year period following the date of such fee waiver or reimbursement in the same manner. At May 31, 2010, the amounts potentially recoverable by the New Advisor pursuant to this arrangement are as follows:
| | | | | | | |
| | | | | | | |
Amount of Potential
Recovery Expiring May 31: | | Total
Potential | | Amount Recovered
During the Period Ended |
| 2013 | | 2012 | | Recovery | | 05/31/10 |
| $150,254 | | $142,545 | | $ | 292,799 | | $— |
Fees Paid to Officers and Trustees
As of May 1, 2010, all officers of the Fund are employees of the New Advisor or its affiliates and, with the exception of the Fund’s Chief Compliance Officer, receive no compensation from the Fund. The Board of Trustees has appointed a Chief Compliance Officer to the Fund in accordance with federal securities regulations. The Fund, along with other affiliated funds, pays its pro-rata share of the expenses associated with the Chief Compliance Officer. The Fund’s expenses for the Chief Compliance Officer will not exceed $15,000 per year.
Trustees are compensated for their services to the Fund, as set forth on the Statement of Operations. The Trust’s eligible Trustees may participate in a deferred compensation plan which may be terminated at any time. Obligations of the plan will be paid solely out of the Fund’s assets.
Note 5. Custody Credits
The Fund has an agreement with its custodian bank under which custody fees may be reduced by balance credits. These credits are recorded as part of expense reductions on the Statement of Operations. The Fund could have invested a portion of the assets utilized in connection with the expense offset arrangement in an income-producing asset if it had not entered into such an agreement. For the year ended May 31, 2010, these custody credits reduced total expenses by $3 for the Fund.
24
Columbia International Bond Fund
May 31, 2010
Note 6. Objectives and Strategies for Investing in Derivative Instruments
The Fund uses derivatives instruments including forward foreign currency exchange contracts in order to meet its investment objectives. The Fund employs strategies in differing combinations to permit it to increase, decrease or change the level of exposure to market risk factors. The achievement of any strategy relating to derivatives depends on an analysis of various risk factors, and if the strategies for the use of derivatives do not work as intended, the Fund may not achieve its investment objectives.
In pursuit of its investment objectives, the Fund is exposed to the following market risks:
Foreign Exchange Rate Risk: Foreign exchange rate risk relates to the change in the U.S. dollar value of a security held that is denominated in a foreign currency. The U.S. dollar value of a foreign-currency-denominated security will decrease as the dollar appreciates against the currency, while the U.S. dollar value will increase as the dollar depreciates against the currency.
The following notes provide more detailed information about the derivative type held by the Fund:
Forward Foreign Currency Exchange Contracts — The Fund entered into forward foreign currency exchange contracts for the purpose of shifting foreign currency exposure back to U.S. dollars.
Forward foreign currency exchange contracts are agreements to exchange one currency for another at a future date at a specified price. These contracts are used to minimize the exposure to foreign exchange rate fluctuations during the period between the trade and settlement dates of the contract. The Fund may utilize forward foreign currency exchange contracts in connection with the settlement of purchases and sales of securities. The Fund may also enter into these contracts to reduce the exposure to adverse price movements in certain other foreign-currency-denominated assets. Contracts to buy generally are used to acquire exposure to foreign currencies, while contracts to sell are generally used to reduce the exposure to foreign exchange rate fluctuations. Forward foreign currency exchange contracts are valued daily at the current exchange rate of the underlying currency, resulting in unrealized gains (losses) which become realized at the time the forward foreign currency exchange contracts are closed or mature. Realized and unrealized gains (losses) arising from such transactions are included in net realized and unrealized gains (losses) on foreign currency transactions. The use of forward foreign currency exchange contracts does not eliminate fluctuations in the prices of the Fund’s portfolio securities. While the maximum potential loss from such contracts is the aggregate face value in U.S. dollars at the time the contract was opened, exposure is typically limited to the change in value of the contract (in U.S. dollars) over the period it remains open. The Fund could also be exposed to risk that counterparties of the contracts may be unable to fulfill the terms of the contracts.
During the year ended May 31, 2010, the Fund entered into forty-six forward foreign currency exchange contracts.
The following table is a summary of the value of the Fund’s derivative instruments as of May 31, 2010.
| | | | | | |
| Fair Value of Derivative Instruments |
| Statement of Assets and Liabilities |
| Assets | | Fair Value | | Liabilities | | Fair Value |
Unrealized
Appreciation
on Forward
Foreign
Currency
Exchange
Contracts | | $354 | | Unrealized
Depreciation
on Forward
Foreign
Currency
Exchange
Contracts | | $3,101 |
The effect of derivative instruments on the Fund’s Statement of Operations for the year ended May 31, 2010:
| | | | | | | | | |
| | | | | | | | |
Amount of Realized Gain or (Loss) and
Change in Unrealized Appreciation or (Depreciation) on Derivatives Recognized in Income | |
| | | Risk
Exposure | | Net
Realized
Gain | | Change
in Unrealized
Appreciation
(Depreciation) | |
| Forward Foreign Currency Exchange Contracts | | Foreign
Exchange
Rate Risk | | $ | 8,669 | | $ | (1,233 | ) |
Note 7. Portfolio Information
For the year ended May 31, 2010, the cost of purchases and proceeds from sales of securities, excluding short-term obligations, for the Fund were $11,085,788 and $4,050,836, respectively, of which $20,115 and $153,815, respectively, were U.S. Government securities.
25
Columbia International Bond Fund
May 31, 2010
Note 8. Redemption Fees
Effective March 1, 2010, the Fund no longer assesses a 2.00% redemption fee on the proceeds from Fund shares that are redeemed within 60 days of purchase. The redemption fee was designed to offset brokerage commissions and other costs associated with short term trading of fund shares. The redemption fees, which were retained by the Fund, were accounted for as an addition to paid-in capital and were allocated to each class based on the relative net assets at the time of the redemption. For the year ended May 31, 2010, the Fund received redemption fees as follows:
| | | |
| | | |
| | | Redemption Fees |
| Class A Shares | | $ | 18 |
| Class C Shares | | | 4 |
| Class Z Shares | | | 989 |
Note 9. Line of Credit
The Fund and other affiliated funds participate in a $280,000,000 committed, unsecured revolving line of credit provided by State Street. The maximum amount that may be borrowed by any fund is limited to the lesser of $200,000,000 and the Fund’s borrowing limit set forth in the Fund’s registration statement. Borrowings are available for short-term liquidity or temporary or emergency purposes.
Effective October 15, 2009, interest is charged to each participating fund based on the fund’s borrowings at a rate per annum equal to the greater of the Federal Funds Rate plus 1.25% or the overnight LIBOR Rate plus 1.25%. In addition, a commitment fee of 0.15% per annum is accrued and apportioned among the participating funds pro rata based on their relative net assets.
Prior to October 15, 2009, interest was charged to each participating fund based on the fund’s borrowings at a rate per annum equal to the greater of the Federal Funds Rate plus 0.50% or the overnight LIBOR Rate plus 0.50%. In addition, an annual operations agency fee of $20,000, an amendment fee of 0.02% and a commitment fee of 0.12% per annum were accrued and apportioned among the participating funds pro rata based on their relative net assets.
For the year ended May 31, 2010, the Fund did not borrow under these arrangements.
Note 10. Shareholder Concentration
As of May 31, 2010, two shareholder accounts owned 89.8% of the outstanding shares of the Fund. Purchase and redemption activity of these accounts may have a significant effect on the operations of the Fund.
Note 11. Significant Risks and Contingencies
Non-Diversification Risk
As a non-diversified mutual fund, the Fund is permitted to invest a greater percentage of its total assets in the securities of fewer issuers than a diversified fund. The Fund may, therefore, have a greater risk of loss from a few issuers than a similar fund that invests more broadly.
Foreign Securities Risk
There are certain additional risks involved when investing in foreign securities. These risks may involve foreign currency exchange rate fluctuations, adverse political and economic developments and the possible prevention of currency exchange or other foreign governmental laws or restrictions. In addition, the liquidity of foreign securities may be more limited than that of domestic securities.
Investments in emerging market countries are subject to additional risk. The risk of foreign investments is typically increased in less developed countries. These countries are also more likely to experience high levels of inflation, deflation or currency devaluation which could hurt their economies and securities markets.
Information Regarding Pending and Settled Legal Proceedings
In June 2004, an action captioned John E. Gallus et al. v. American Express Financial Corp. and American Express Financial Advisors Inc. was filed in the United States District Court for the District of Arizona. The plaintiffs allege that they are investors in several American Express Company (now known as RiverSource) mutual funds and they purport to bring the action derivatively on behalf of those funds under the Investment Company Act of 1940. The plaintiffs allege that fees allegedly paid to the defendants by the funds for investment advisory and administrative services are excessive. The plaintiffs seek remedies including restitution and rescission of investment advisory and distribution agreements. The plaintiffs voluntarily agreed to transfer this
26
Columbia International Bond Fund
May 31, 2010
case to the United States District Court for the District of Minnesota (the District Court). In response to defendants’ motion to dismiss the complaint, the District Court dismissed one of plaintiffs’ four claims and granted plaintiffs limited discovery. Defendants moved for summary judgment in April 2007. Summary judgment was granted in the defendants’ favor on July 9, 2007. The plaintiffs filed a notice of appeal with the Eighth Circuit Court of Appeals (the Eighth Circuit) on August 8, 2007. On April 8, 2009, the Eighth Circuit reversed summary judgment and remanded to the District Court for further proceedings. On August 6, 2009, defendants filed a writ of certiorari with the U.S. Supreme Court (the Supreme Court), asking the Supreme Court to stay the District Court proceedings while the Supreme Court considers and rules in a case captioned Jones v. Harris Associates, which involves issues of law similar to those presented in the Gallus case. On March 30, 2010, the Supreme Court issued its ruling in Jones v. Harris Associates, and on April 5, 2010, the Supreme Court vacated the Eighth Circuit’s decision in the Gallus case and remanded the case to the
Eighth Circuit for further consideration in light of the Supreme Court’s decision in Jones v. Harris Associates. On June 4, 2010, the Eighth Circuit remanded the Gallus case to the District Court for further consideration in light of the Supreme Court’s decision in Jones v. Harris Associates.
In December 2005, without admitting or denying the allegations, American Express Financial Corporation (AEFC, which is now known as Ameriprise Financial, Inc. (Ameriprise Financial)), entered into settlement agreements with the Securities and Exchange Commission (SEC) and Minnesota Department of Commerce (MDOC) related to market timing activities. As a result, AEFC was censured and ordered to cease and desist from committing or causing any violations of certain provisions of the Investment Advisers Act of 1940, the Investment Company Act of 1940, and various Minnesota laws. AEFC agreed to pay disgorgement of $10 million and civil money penalties of $7 million. AEFC also agreed to retain an independent distribution consultant to assist in developing a plan for distribution of all disgorgement and civil penalties ordered by the SEC in accordance with various undertakings detailed at http://www.sec.gov/litigation/admin/ia-2451.pdf. Ameriprise Financial and its affiliates have cooperated with the SEC and the MDOC in these legal proceedings, and have made regular reports to the RiverSource Funds’ Boards of Directors/Trustees.
Ameriprise Financial and certain of its affiliates have historically been involved in a number of legal, arbitration and regulatory proceedings, including routine litigation, class actions, and governmental actions, concerning matters arising in connection with the conduct of their business activities. Ameriprise Financial believes that the Funds are not currently the subject of, and that neither Ameriprise Financial nor any of its affiliates are the subject of, any pending legal, arbitration or regulatory proceedings that are likely to have a material adverse effect on the Funds or the ability of Ameriprise Financial or its affiliates to perform under their contracts with the Funds. Ameriprise Financial is required to make 10-Q, 10-K and, as necessary, 8-K filings with the Securities and Exchange Commission on legal and regulatory matters that relate to Ameriprise Financial and its affiliates. Copies of these filings may be obtained by accessing the SEC website at www.sec.gov.
There can be no assurance that these matters, or the adverse publicity associated with them, will not result in increased fund redemptions, reduced sale of fund shares or other adverse consequences to the Funds. Further, although we believe proceedings are not likely to have a material adverse effect on the Funds or the ability of Ameriprise Financial or its affiliates to perform under their contracts with the Funds, these proceedings are subject to uncertainties and, as such, we are unable to estimate the possible loss or range of loss that may result. An adverse outcome in one or more of these proceedings could result in adverse judgments, settlements, fines, penalties or other relief that could have a material adverse effect on the consolidated financial condition or results of operations of Ameriprise Financial.
27
Report of Independent Registered Public Accounting Firm
To the Trustees of Columbia Funds Series Trust I and the Shareholders of Columbia International Bond Fund
In our opinion, the accompanying statement of assets and liabilities, including the investment portfolio, and the related statements of operations and of changes in net assets and the financial highlights present fairly, in all material respects, the financial position of Columbia International Bond Fund (the “Fund”) (a series of Columbia Funds Series Trust I) at May 31, 2010, the results of its operations for the year then ended, and the changes in its net assets and the financial highlights for the period December 1, 2008 (commencement of operations) through May 31, 2010, in conformity with accounting principles generally accepted in the United States of America. These financial statements and financial highlights (hereafter referred to as “financial statements”) are the responsibility of the Fund’s management. Our responsibility is to express an opinion on these financial statements based on our audits. We conducted our audits of these financial statements in accordance with the standards of the Public Company Accounting Oversight Board (United States). Those standards require that we plan and perform the audit to obtain reasonable assurance about whether the financial statements are free of material misstatement. An audit includes examining, on a test basis, evidence supporting the amounts and disclosures in the financial statements, assessing the accounting principles used and significant estimates made by management, and evaluating the overall financial statement presentation. We believe that our audits, which included confirmation of securities at May 31, 2010 by correspondence with the custodian and brokers, provide a reasonable basis for our opinion.
PricewaterhouseCoopers LLP
Boston, Massachusetts
July 22, 2010
28
Federal Income Tax Information (Unaudited) – Columbia International Bond Fund
The Fund hereby designates as a capital gain dividend with respect to the fiscal year ended May 31, 2010, $12,992, or, if subsequently determined to be different, the net capital gain of such year.
29
Fund Governance
The Trustees serve terms of indefinite duration. The names, addresses and birth years of the Trustees and Officers of the Funds of Columbia Funds Series Trust I, the year each was first elected or appointed to office, their principal business occupations during at least the last five years, the number of Funds overseen by each Trustee and other directorships they hold are shown below. Each officer listed below serves as an officer of each Fund in the Columbia Funds Complex.
Independent Trustees
| | |
Name, Address and Year of Birth,
Position with Funds, Year First
Elected or Appointed to Office | | Principal Occupation(s) During Past Five Years, Number of Funds in the
Columbia Funds Complex Overseen by Trustee, Other Directorships Held |
| |
| John D. Collins (Born 1938) | | |
c/o Columbia Management Investment Advisers, LLC One Financial Center Boston, MA 02111 Trustee (since 2005) | | Retired. Consultant, KPMG, LLP (accounting and tax firm) from July 1999 to June 2000; Partner, KPMG, LLP from March 1962 to June 1999. Oversees 64; Mrs. Fields Famous Brands LLC (consumer products); Suburban Propane Partners, L.P.; and Montpelier Re (insurance underwriting firm) |
| |
| Rodman L. Drake (Born 1943) | | |
c/o Columbia Management Investment Advisers, LLC One Financial Center Boston, MA 02111 Trustee (since 1994) and Chairman of the Board (since 2009) | | Co-Founder of Baringo Capital LLC (private equity) since 2002; CEO of Crystal River Capital, Inc. (real estate investment trust) since 2003; President, Continuation Investments Group, Inc. from 1997 to 2001. Oversees 64; Jackson Hewitt Tax Service Inc. (tax preparation services); Crystal Capital River Inc. (real estate investment trust); Student Loan Corporation (student loan provider); Celgene Corporation (global biotechnology company); and The Helios Funds (exchange-traded funds) |
| |
| Douglas A. Hacker (Born 1955) | | |
c/o Columbia Management Investment Advisers, LLC One Financial Center Boston, MA 02111 Trustee (since 1996) | | Independent business executive since May 2006; Executive Vice President–Strategy of United Airlines (airline) from December 2002 to May 2006; President of UAL Loyalty Services (airline marketing company) from September 2001 to December 2002; Executive Vice President and Chief Financial Officer of United Airlines from July 1999 to September 2001. Oversees 64; Nash Finch Company (food distributor); Aircastle Limited (aircraft leasing) |
|
| Janet Langford Kelly (Born 1957) |
c/o Columbia Management Investment Advisers, LLC One Financial Center Boston, MA 02111 Trustee (since 1996) | | Senior Vice President, General Counsel and Corporate Secretary, ConocoPhillips (integrated energy company) since September 2007; Deputy General Counsel–Corporate Legal Services, ConocoPhillips from August 2006 to August 2007; Partner, Zelle, Hofmann, Voelbel, Mason & Gette LLP (law firm) from March 2005 to July 2006; Adjunct Professor of Law, Northwestern University, from September 2004 to June 2006; Director, UAL Corporation (airline) from February 2006 to July 2006; Oversees 64; None |
| |
| Charles R. Nelson (Born 1942) | | |
c/o Columbia Management Investment Advisers, LLC One Financial Center Boston, MA 02111 Trustee (since 1981) | | Professor of Economics, University of Washington, since January 1976; Ford and Louisa Van Voorhis Professor of Political Economy, University of Washington, since September 1993; Adjunct Professor of Statistics, University of Washington, since September 1980; Associate Editor, Journal of Money Credit and Banking, 1993-2008 Consultant on econometric and statistical matters. Oversees 64; None |
30
Fund Governance (continued)
Independent Trustees (continued)
| | |
Name, Address and Year of Birth,
Position with Funds, Year First
Elected or Appointed to Office | | Principal Occupation(s) During Past Five Years, Number of Funds in the
Columbia Funds Complex Overseen by Trustee, Other Directorships Held |
| |
| John J. Neuhauser (Born 1943) | | |
c/o Columbia Management Investment Advisers, LLC One Financial Center Boston, MA 02111 Trustee (since 1984) | | President, Saint Michael’s College, since August 2007; University Professor, Boston College from November 2005 to August 2007; Academic Vice President and Dean of Faculties, Boston College from August 1999 to October 2005. Oversees 64; Liberty All-Star Equity Fund and Liberty All-Star Growth Fund, Inc. (closed-end funds) |
| |
| Jonathan Piel (Born 1938) | | |
c/o Columbia Management Investment Advisers, LLC One Financial Center Boston, MA 02111 Trustee (since 1994) | | Cable television producer and website designer; The Editor, Scientific American from 1984 to 1994; Vice President, Scientific American, Inc., from 1984 to 1994; Member, Advisory Board, Stone Age Institute, Bloomington, Indiana (research institute that explores the effect of technology on human evolution); Member, Board of Directors of the National Institute of Social Sciences, New York City; Member, Board of Trustees of the William Alanson White Institute, New York City (institution for training psychoanalysts); and Member, Advisory Board, Mount Sinai Children’s Environmental Health Center, New York. Oversees 64; None |
| |
| Patrick J. Simpson (Born 1944) | | |
c/o Columbia Management Investment Advisers, LLC One Financial Center Boston, MA 02111 Trustee (since 2000) | | Partner, Perkins Coie LLP (law firm). Oversees 64; None |
| |
| Anne-Lee Verville (Born 1945) | | |
c/o Columbia Management Investment Advisers, LLC One Financial Center Boston, MA 02111 Trustee (since 1998) | | Retired since 1997 (formerly General Manager–Global Education Industry (from 1994 to 1997), President–Application Systems Division (from 1991 to 1994), Chief Financial Officer–US Marketing & Services (from 1988 to 1991), and Chief Information Officer (from 1987 to 1988), IBM Corporation (computer and technology)). Oversees 64; None |
31
Fund Governance (continued)
Interested Trustee
| | |
Name, Address and Year of Birth,
Position with Funds, Year First
Elected or Appointed to Office | | Principal Occupation(s) During Past Five Years, Number of Funds in the
Columbia Funds Complex Overseen by Trustee, Other Directorships Held |
| |
| William E. Mayer1 (Born 1940) | | |
c/o Columbia Management Investment Advisers, LLC One Financial Center Boston, MA 02111 Trustee (since 1994) | | Partner, Park Avenue Equity Partners (private equity) since February 1999; Dean and Professor, College of Business, University of Maryland from 1992 to 1997. Oversees 64; Lee Enterprises (print media), WR Hambrecht + Co. (financial service provider); BlackRock Kelso Capital Corporation (investment company) |
| 1 | Mr. Mayer may technically be an “interested person” (as defined in the Investment Company Act of 1940) by reason of his affiliation with WR Hambrecht + Co., a registered broker/dealer that may execute portfolio transactions for, engage in principal transactions with or distribute shares of a Fund or other funds or accounts advised/managed by the Advisor or any sub-advisor to a Fund. |
The Statement of Additional Information includes additional information about the Trustees of the Funds and is available, without charge, upon request by calling 1-800-345-6611.
32
Fund Governance (continued)
Officers
| | |
| Name, Year of Birth and Address | | Principal Occupation(s) During the Past Five Years |
| |
| J. Kevin Connaughton (Born 1964) | | |
One Financial Center Boston, MA 02111 President (since 2009) | | Senior Vice President and General Manager–Mutual Fund Products, Columbia Management Investment Advisers, LLC since May 2010; President, Columbia Funds, since 2009, and RiverSource Funds, since May 2010 (previously Senior Vice President and Chief Financial Officer, Columbia Funds, from June 2008 to January 2009, Treasurer, Columbia Funds, from October 2003 to May 2008, and senior officer of various other affiliated funds since 2000); Managing Director, Columbia Management Advisors, LLC from December 2004 to April 2010. |
| |
| Michael G. Clarke (Born 1969) | | |
One Financial Center Boston, MA 02111 Senior Vice President and Chief Financial Officer (since 2009) | | Vice President, Columbia Management Investment Advisers, LLC since May 2010; Managing Director of Fund Administration, Columbia Management Advisors, LLC, from September 2004 to April 2010; senior officer of Columbia Funds and affiliated funds since 2002. |
| |
| Scott R. Plummer (Born 1959) | | |
5228 Ameriprise Financial Center Minneapolis, MN 55474 Senior Vice President, Secretary and Chief Legal Officer (since 2010) | | Chief Legal Officer and Assistant Secretary, Columbia Management Investment Advisers, LLC since June 2005; Vice President and Lead Chief Counsel–Asset Management, Ameriprise Financial, Inc. since May 2010 (previously Vice President and Chief Counsel–Asset Management, from 2005 to April 2010, and Vice President–Asset Management Compliance from 2004 to 2005); Vice President, Chief Counsel and Assistant Secretary, Columbia Management Investment Distributors, Inc. since 2008; Vice President, General Counsel and Secretary, Ameriprise Certificate Company since 2005; Chief Counsel, RiverSource Distributors, Inc. since 2006; Vice President, General Counsel and Secretary, RiverSource Funds, since December 2006; Senior Vice President, Secretary and Chief Legal Officer, Columbia Funds, since May 2010. |
| |
| Linda J. Wondrack (Born 1964) | | |
One Financial Center Boston, MA 02111 Senior Vice President and Chief Compliance Officer (since 2007) | | Vice President and Chief Compliance Officer, Columbia Management Investment Advisers, LLC since May 2010; Chief Compliance Officer, Columbia Funds, since 2007, and RiverSource Funds, since May 2010; Director (Columbia Management Group, LLC and Investment Product Group Compliance), Bank of America, from June 2005 to April 2010; Director of Corporate Compliance and Conflicts Officer of MFS Investment Management (investment management) from August 2004 to May 2005. |
| |
| William F. Truscott (Born 1960) | | |
53600 Ameriprise Financial Center Minneapolis, MN 55474 Senior Vice President (since 2010) | | Chairman of the Board, Columbia Management Investment Advisers, LLC since May 2010 (previously President, Chairman of the Board and Chief Investment Officer, from 2001 to April 2010); Chief Executive Officer, U.S. Asset Management & President, Annuities, Ameriprise Financial, Inc. since May 2010 (previously President–U.S. Asset Management and Chief Investment Officer from 2005 to April 2010, and Senior Vice President — Chief Investment Officer, from 2001 to 2005); Director, President and Chief Executive Officer, Ameriprise Certificate Company since 2006; Director, Columbia Management Investment Distributors, Inc. since May 2010 (previously Chairman of the Board and Chief Executive Officer from 2008 to April 2010); Chairman of the Board and Chief Executive Officer, RiverSource Distributors, Inc. since 2006. |
33
Fund Governance (continued)
Officers (continued)
| | |
| Name, Year of Birth and Address | | Principal Occupation(s) During the Past Five Years |
|
| Colin Moore (Born 1958) |
One Financial Center Boston, MA 02111 Senior Vice President (since 2010) | | Director and Chief Investment Officer, Columbia Management Investment Advisers, LLC since May 2010; Manager, Managing Director and Chief Investment Officer of Columbia Management Advisors, LLC from 2007 to April 2010; Head of Equities, Columbia Management Advisors, LLC from 2002 to 2007. |
| |
| Michael A. Jones (Born 1959) | | |
100 Federal Street Boston, MA 02110 Senior Vice President (since 2010) | | Director and President, Columbia Management Investment Advisers, LLC since May 2010; President and Director, Columbia Management Investment Distributors, Inc. since May 2010; Manager, Chairman, Chief Executive Officer and President, Columbia Management Advisors, LLC from 2007 to April 2010; Chief Executive Officer, President and Director, Columbia Management Distributors, Inc. from November 2006 to April 2010; previously, co-president and senior managing director at Robeco Investment Management. |
| |
| Amy Johnson (Born 1965) | | |
5228 Ameriprise Financial Center Minneapolis, MN 55474 Senior Vice President (since 2010) | | Senior Vice President and Chief Operating Officer, Columbia Management Investment Advisers, LLC since May 2010 (previously Chief Administrative Officer, from 2009 until April 2010, Vice President–Asset Management and Trust Company Services, from 2006 to 2009, and Vice President–Operations and Compliance from 2004 to 2006). |
| |
| Joseph F. DiMaria (Born 1968) | | |
One Financial Center Boston, MA 02111 Treasurer (since 2009) and Chief Accounting Officer (since 2008) | | Vice President, Mutual Fund Administration, Columbia Management Investment Advisers, LLC, since May 2010; Director of Fund Administration, Columbia Management Advisors, LLC from January 2006 to April 2010; Head of Tax/Compliance and Assistant Treasurer, Columbia Management Advisors, LLC, from November 2004 to December 2005. |
| |
| Marybeth Pilat (Born 1968) | | |
One Financial Center Boston, MA 02111 Deputy Treasurer (since 2010) | | Vice President, Mutual Fund Administration, Columbia Management Investment Advisers, LLC, since May 2010; Vice President, Investment Operations, Bank of America, from October 2008 to April 2010; Finance Manager, Boston Children’s Hospital from August 2008 to October 2008; Director, Mutual Fund Administration, Columbia Management Advisors, LLC, from May 2007 to July 2008; Vice President, Mutual Fund Valuation, Columbia Management Advisors, LLC, from January 2006 to May 2007; Vice President, Mutual Fund Accounting Oversight, Columbia Management Advisors, LLC from January 2005 to January 2006. |
| |
| Julian Quero (Born 1967) | | |
One Financial Center Boston, MA 02111 Deputy Treasurer (since 2008) | | Vice President, Mutual Fund Administration, Columbia Management Investment Advisers, LLC since May 2010; Director of Fund Administration, Columbia Management Advisors, LLC, from August 2008 to April 2010; Senior Tax Manager, Columbia Management Advisors, LLC from August 2006 to July 2008; Senior Compliance Manager, Columbia Management Advisors, LLC from April 2002 to August 2006. |
| |
| Stephen T. Welsh (Born 1957) | | |
One Financial Center Boston, MA 02111 Vice President (since 2006) | | President and Director, Columbia Management Investment Services Corp. since May 2010; President and Director, Columbia Management Services, Inc. from July 2004 to April 2010; Managing Director, Columbia Management Distributors, Inc. from August 2007 to April 2010. |
34
Board Consideration and Approval of Advisory Agreements
The Board unanimously approved the Advisory Agreements at a meeting held on December 17, 2009. These agreements were approved by shareholders on March 3, 2010, and took effect upon the closing of the acquisition of the long-term asset management business of Columbia by Ameriprise Financial, Inc. (“Ameriprise”) (the “Transaction”).
The Advisory Fees and Expenses Committee (the “Committee”) of the Board met on multiple occasions to review the investment management services agreements (the “Advisory Agreements”) for the funds for which the Trustees serve as trustees (each a “Fund,” and collectively, the “Funds”). On December 14, 2009, the Committee recommended that the full Board approve the Advisory Agreements. On December 17, 2009, the full Board, including a majority of the Trustees who have no direct or indirect interest in the Advisory Agreements and who are not “interested persons” (as defined in the 1940 Act) of the Trust (the “Independent Trustees”), approved the Advisory Agreement with Columbia Management Investment Advisers, LLC (formerly, RiverSource Investments, LLC) (“CMIA”) for each Fund. Prior to their approval of the Advisory Agreements, the Committee and the Independent Trustees requested and evaluated materials from, and were provided materials and information about the Transaction and matters related to the proposals by, BOA, Columbia, CMIA and Ameriprise. In connection with their most recent approval of the Funds’ previous advisory agreements (the “Former Advisory Agreements”) on October 28, 2009, the Committee and the Trustees requested and evaluated materials from Columbia, and discussed such materials with representatives of Columbia. The Committee, at meetings held on August 11, 2009, September 23, 2009, October 27, 2009, November 30, 2009, December 7, 2009 and December 14, 2009, and the Independent Trustees, at meetings held on August 12, 2009, August 20, 2009, October 28, 2009, December 8, 2009, December 14, 2009 and December 17, 2009, discussed the materials provided in connection with the October 28, 2009 approvals and the materials provided in connection with their consideration of the Advisory Agreements and other matters relating to the Transaction with representatives of BOA, Columbia, CMIA and Ameriprise. The Trustees consulted with experienced legal counsel, who advised on the legal standards for consideration by the Trustees. The Independent Trustees also discussed the proposed approvals with independent legal counsel in private sessions.
The Trustees reviewed each Advisory Agreement, as well as certain information obtained through CMIA’s responses to initial and supplemental questionnaires prepared at the request of the Trustees by counsel to the Funds and independent legal counsel to the Independent Trustees. The Committee and the Trustees also met with, and reviewed and considered a report prepared and provided by, the independent fee consultant (the “Fee Consultant”) appointed by the Independent Trustees pursuant to an assurance of discontinuance entered into by Columbia with the New York Attorney General (“NYAG”) to settle a civil complaint filed by the NYAG relating to trading in mutual fund shares (the “NYAG Settlement”). Under the NYAG Settlement, the Fee Consultant’s role is to manage the process by which management fees are negotiated so that they are negotiated in a manner that is at arms’ length and reasonable.
The Trustees considered all materials that they, their legal counsel or CMIA believed reasonably necessary to evaluate and to determine whether to approve the Advisory Agreements. In their deliberations, the Trustees did not identify any particular information that was all-important or controlling, and individual Trustees may have attributed different weights to the various factors. The material factors that formed the basis for the Trustees’ approvals included the factors set forth below:
| (i) | the reputation, financial strength, regulatory histories and resources of CMIA and its parent, Ameriprise; |
| (ii) | the capabilities of CMIA with respect to compliance, including an assessment of CMIA’s compliance system by the Funds’ Chief Compliance Officer; |
| (iii) | the qualifications of the personnel of CMIA that would be expected to provide advisory services to each Fund, including CMIA’s representations that the Chief Investment Officer of Columbia would serve as the Chief Investment Officer of CMIA, and that the process for determining the portfolio management team for each Fund would be substantially the same process as has customarily been followed by Columbia, and reported to the Trustees, in evaluating the performance of Columbia’s portfolio management teams; |
| (iv) | the terms and conditions of the Advisory Agreements, including the differences between the Advisory Agreements and Former Advisory Agreements in |
35
| | connection with CMIA’s efforts to standardize such agreements across the Columbia Fund complex and the legacy RiverSource fund complex; |
| (v) | the terms and conditions of other agreements and arrangements relating to the future operations of the Funds, including an administrative services agreement and the Master Services and Distribution Agreement; |
| (vi) | the commitment of CMIA and Ameriprise that there would not be any diminution in the nature, quality and extent of services provided to each Fund or its shareholders following closing of the Transaction; |
| (vii) | that the Trustees recently had completed a full annual review of the Former Advisory Agreements, as required by the 1940 Act, for each Fund and had determined that they were satisfied with the nature, extent and quality of services provided thereunder and that the management fee rate for each Fund were sufficient to warrant their approval; |
| (viii) | that the advisory fee rates payable by each Fund would not change; |
| (ix) | that CMIA and BOA, and not any Fund, would bear the costs of obtaining approvals of the Advisory Agreements; |
| (x) | that Ameriprise and CMIA had agreed to exercise reasonable best efforts to assure that, for a period of two years after the Closing, there would not be imposed on any Fund any “unfair burden” (within the meaning of Section 15(f) of 1940 Act) with respect to the Transaction; and |
| (xi) | that certain members of CMIA’s management had a significant amount of experience integrating other fund families; that certain current Columbia personnel that would be integrated into CMIA and its affiliates as a result of the Transaction also had experience in integrating fund families; and that the senior management of CMIA following the Transaction would include certain senior executives of Columbia who were, at that time, responsible for oversight of services provided to the Funds. |
Nature, Extent and Quality of Services to be Provided. The Trustees considered the expected nature, extent and quality of services to be provided to the Funds by CMIA and its affiliates and the resources to be dedicated to the Funds by CMIA and its affiliates. The Trustees considered, among other things, the expected effect of the Transaction on the operations of the Funds, the information provided by CMIA with respect to the nature, extent and quality of services to be provided by it, CMIA’s compliance programs and compliance records, the ability of CMIA (including personnel and other resources, compensation programs for personnel involved in fund management, reputation and other attributes) to attract, motivate and retain highly qualified research, advisory and supervisory investment professionals, the trade execution services to be provided on behalf of the Funds and the quality of CMIA’s investment research capabilities and the other resources that it indicated it would devote to each Fund. As noted above, the Trustees also considered CMIA’s representations that the Chief Investment Officer of Columbia would serve as the Chief Investment Officer of CMIA following the Transaction, and that the process for determining the portfolio management team for each Fund would be substantially the same process as has customarily been followed by Columbia, and reported to the Trustees, in evaluating the performance of Columbia’s portfolio management teams.
The Trustees noted the professional experience and qualifications of the senior personnel of CMIA. The Trustees also considered the compliance programs of and the compliance-related resources proposed to be provided to the Funds by CMIA and its affiliates, including discussions with the Funds’ Chief Compliance Officer regarding CMIA’s compliance program. The Trustees also discussed CMIA’s compliance program with the Chief Compliance Officer for the legacy RiverSource funds. The Trustees also considered CMIA’s representation that the Funds’ Chief Compliance Officer would serve as the Chief Compliance Officer of CMIA following the Transaction. The Trustees considered CMIA’s ability to provide administrative services to the Funds, noting that while some Former Advisory Agreements contemplated the provision of certain administrative services, following the Transaction, all administrative services were anticipated to be provided pursuant to a new administrative services agreement. The Trustees also considered CMIA’s ability to coordinate the activities of each Fund’s other service providers. The Trustees considered performance information provided by CMIA with respect to other mutual funds advised by CMIA, and discussed with senior executives of CMIA its
36
process for identifying which portfolio management teams of the legacy Columbia and legacy CMIA organizations would be responsible for the management of the Funds following the Transaction. After reviewing these and related factors, the Trustees concluded, within the context of their overall conclusions, that the expected nature, extent and quality of the services to be provided to each Fund under the Advisory Agreements supported the approval of such agreements.
Investment Advisory Fee Rates and Other Expenses. The Trustees considered the fact that the advisory fee rates payable by each Fund to CMIA under the Advisory Agreements were the same as those that were paid by each Fund to Columbia under the Former Advisory Agreements. The Trustees noted that in connection with their October 28, 2009 approval of the Former Advisory Agreements, they had concluded, within the context of their overall conclusions regarding each such agreement, that the advisory fees charged to each Fund supported the continuation of the agreement(s) pertaining to that Fund.
The Trustees noted that in certain cases the effective advisory fee rate for a legacy RiverSource fund was lower than the proposed investment advisory fee rate for a Fund with generally similar investment objectives and strategies. The Trustees also noted that CMIA’s investment advisory fee rates for equity and balanced funds generally are subject to adjustments based on investment performance, whereas the proposed investment advisory fee rates for the Funds, consistent with those in the Former Advisory Agreements, do not reflect performance adjustments. The Trustees considered existing advisory fee breakpoints and CMIA’s undertaking not to change expense caps previously implemented by Columbia with respect to the Funds without further discussion with the Independent Trustees.
The Trustees received and considered information about the advisory fees charged by CMIA to institutional accounts. In considering the fees charged to those accounts, the Trustees took into account, among other things, CMIA’s representations about the differences between managing mutual funds as compared to other types of accounts, including differences in the services provided, differences in the risk profile of such business for CMIA and the additional resources required to manage mutual funds effectively. In evaluating each Fund’s advisory fees, the Trustees also took into account the demands, complexity and quality of the investment management of the Fund.
The Trustees also considered that for certain Funds, certain administrative services that were provided under the Former Advisory Agreements would not be provided under the Advisory Agreements, but under a separate administrative services agreement. The Trustees noted that, unlike fees under an advisory agreement, fees under the administrative services agreement could be changed without shareholder approval, although CMIA had not proposed any increase in such administrative fees and any such increase would require Board approval. The Trustees also noted Ameriprise’s and CMIA’s covenants regarding compliance with Section 15(f) of the 1940 Act.
After reviewing these and related factors, the Trustees concluded, within the context of their overall conclusions, that the expected advisory fee rates and expenses of each Fund supported the approval of the Advisory Agreements.
Costs of Services to be Provided and Profitability. The Trustees noted that in connection with their October 28, 2009 approval of the Former Advisory Agreements, they had concluded, within the context of their overall conclusions regarding each such agreement, that profitability to Columbia and its affiliates of their relationships with each Fund supported the continuation of the agreement(s) pertaining to that Fund. In connection with the integration of the legacy Columbia and legacy CMIA organizations, the Trustees considered, among other things, CMIA’s projected annual net expense synergies (reductions in the cost of providing services to the Funds), the timetable over which such synergies are expected to be realized and the extent to which any such synergies are expected to be shared with the Funds. The Trustees also considered information provided by CMIA regarding their respective financial conditions. The Trustees considered that CMIA proposed to continue voluntary expense caps currently in effect for the Funds and that CMIA had undertaken not to change these caps without further discussion with the Independent Trustees. After reviewing these and related factors, the Trustees concluded, within the context of their overall conclusions, that the expected profitability to CMIA and its affiliates from its relationship with each Fund supported the approval of the Advisory Agreements.
Economies of Scale. The Trustees considered the existence of any anticipated economies of scale in the provision by CMIA of services to each Fund, to groups of related Funds
37
and to CMIA’s investment advisory clients as a whole, and whether those economies of scale were expected to be shared with the Funds. The Trustees considered Ameriprise’s anticipated net expense synergies resulting from the Transaction, and considered the possibility that the Funds might benefit from economies of scale over time as part of the larger, combined fund complex. The Trustees considered how expected synergies and potential economies of scale might benefit the Funds and their shareholders. The Trustees considered the potential impact of the Transaction on the distribution of the Funds, and noted that the proposed management fee schedules for the Funds generally contained breakpoints that would reduce the fee rate on assets above specified threshold levels. After reviewing these and related factors, the Trustees concluded, within the context of their overall conclusions, that the extent to which economies of scale were expected to be shared with the Funds supported the approval of the Advisory Agreements.
Other Benefits to CMIA. The Trustees received and considered information regarding any expected “fall-out” or ancillary benefits to be received by CMIA and its affiliates as a result of their relationships with the Funds, such as the engagement of CMIA to provide administrative services to the Funds and the engagement of CMIA’s affiliates to provide distribution and transfer agency services to the Funds. The Trustees considered that the Funds’ distributor, which would be an affiliate of CMIA, retains a portion of the distribution fees from the Funds and receives a portion of the sales charges on sales or redemptions of certain classes of shares of the Funds. The Trustees also considered the benefits of research made available to CMIA by reason of brokerage commissions generated by the Funds’ securities transactions, and reviewed information about CMIA’s practices with respect to allocating portfolio brokerage for brokerage and research services. The Trustees considered the possible conflicts of interest associated with certain fall-out or other ancillary benefits and the reporting, disclosure and other processes that would be in place to disclose and to monitor such possible conflicts of interest. The Trustees recognized that CMIA’s profitability would be somewhat lower without these benefits.
Conclusion. Based on their evaluation of all factors that they deemed to be material, including those factors described above, and assisted by the advice of independent legal counsel and the Fee Consultant, the Trustees, including the Independent Trustees, approved, and recommended that Fund shareholders approve, each Advisory Agreement.
38
Summary of Management Fee Evaluation by Independent Fee Consultant (RiverSource Investments, LLC)
EXCERPTS FROM REPORT OF INDEPENDENT FEE CONSULTANT TO THE FUNDS SUPERVISED BY THE COLUMBIA ATLANTIC BOARD
Prepared Pursuant to the February 9, 2005 Assurance of Discontinuance among the Office of Attorney General of New York State, Columbia Management Advisors, LLC, and Columbia Management Distributors, Inc. December 21, 2009
I. Overview
On February 9, 2005, Columbia Management Advisors, LLC (“CMA”) and Columbia Management Distributors, Inc.1 (“CMD”) agreed to the New York Attorney General’s Assurance of Discontinuance (“AOD”). Among other things, the AOD stipulates that CMA may manage or advise a Columbia Fund (“Columbia Fund” and, together with some or all of such funds, the “Columbia Funds”) only if the Independent Members of the Columbia Fund’s Board of Trustees appoint a Senior Officer or retain an Independent Fee Consultant (“IFC”) who is to manage the process by which proposed management fees are negotiated. The AOD further stipulates that the Senior Officer or IFC is to prepare a written annual evaluation of the fee negotiation process.
With effect from January 1, 2007, the Independent Members of the Board of Trustees for certain Columbia Funds known collectively as the “Atlantic Funds” (together with the other members of that Board, the “Trustees”) retained me as IFC for the Atlantic Funds.2 In this capacity, I have prepared this written evaluation of the fee negotiation process. As was the case with the last three annual reports, my immediate predecessor as IFC, John Rea, provided invaluable assistance in the preparation of this report.
On September 29, 2009, Ameriprise entered into an asset purchase agreement with Bank of America, N.A. and its parent, Bank of America Corporation (together, the “Bank”) pursuant to which the Bank agreed to sell certain CMG assets relating to Columbia’s long-term asset management business, including management of the Atlantic Funds (the “Transaction”).3 The Transaction if completed would result in the termination of the existing Investment Management Agreements with CMA. Therefore, the Trustees have been requested to approve and recommend to the shareholders of each Atlantic Fund new Investment Management and Sub-Advisory Agreements (together, the “Management Agreements”) with RiverSource Investments, LLC (“RI”),4 investment manager of the RiverSource Funds and a subsidiary of Ameriprise. This report is intended to fulfill the requirements of the AOD with respect to the Trustees’ consideration of the new Management Agreements.
A. Role of the Independent Fee Consultant
The AOD charges the IFC with “managing the process by which proposed management fees … to be charged the Columbia Fund are negotiated so that they are negotiated in a manner which is at arms’ length and reasonable and consistent with this Assurance of Discontinuance.” The AOD also provides that CMA “may manage or advise a Columbia Fund only if the reasonableness of the proposed management fees is determined by the Board of Trustees … using … an annual independent written evaluation prepared by or under the direction of … the Independent Fee Consultant.” Therefore, the AOD makes clear that the IFC does not supplant the Trustees in negotiating management fees with CMA (or RI), nor does the IFC substitute his or her judgment for that of the Trustees with respect to the reasonableness of proposed fees or any other matter that is committed to the business judgment of the Trustees.
| 1 | CMA and CMD are subsidiaries of Columbia Management Group, LLC (“CMG”), and are the successors to the entities named in the AOD. |
| 2 | I have no material relationship with Bank of America, CMG or Ameriprise Financial, Inc. (“Ameriprise”), aside from serving as IFC, and I am aware of no material relationship with any of their affiliates. I retained John Rea, an independent economic consultant, to assist me with this report. |
| | Unless otherwise stated or required by the context, this report covers only the Atlantic Funds. |
| 3 | Preliminary Response of Ameriprise to Information Request of Columbia Atlantic Board dated October 21, 2009 (hereafter, the “Preliminary Response”), p. 1. The one money market Atlantic Fund, Money Market Fund VS, was included in the Transaction because it was an integral part of CMG's array of Funds used as investment vehicles by variable annuity and similar insurance products. |
| 4 | Ameriprise intends to re-brand RI with the “Columbia” name (which is one of the assets being sold in the Transaction). Preliminary Response, pp. 4-5. In the case of new Sub-Advisory Agreements, the current sub-adviser would also be a party. |
39
B. Elements Involved in Managing the Fee Negotiation Process
In preparing the report required by the AOD, the IFC must consider at least the following six factors set forth in the AOD:
| 1. | The nature and quality of the adviser’s services, including the Fund’s performance; |
| 2. | Management fees (including any components thereof) charged by other mutual fund companies for like services; |
| 3. | Possible economies of scale as the Fund grows larger; |
| 4. | Management fees (including any components thereof) charged to institutional and other clients of the adviser for like services; |
| 5. | Costs to the adviser and its affiliates of supplying services pursuant to the management fee agreements, excluding any intra-corporate profit; and |
| 6. | Profit margins of the adviser and its affiliates from supplying such services. |
C. Data Presented to the Trustees
In considering the proposed new Management Agreements with RI, the Trustees relied in part on the data that had been prepared as part of their annual contract review process, which concluded in late October. This data remained relevant because the fees in the proposed Management Agreements were identical to the fees approved at that time. The annual review materials included a Lipper report on the performance of each Atlantic Fund compared to its peers and its benchmark, comparisons of the fees and expenses of each Atlantic Fund to similar CMG-sponsored Funds, comparable competitive funds chosen by Lipper, and institutional accounts advised by CMA, revenues, expenses, and profits of CMG from managing the Atlantic Funds, calculated both by Fund and collectively, and CMG’s views on the existence and sharing of economies of scale.
In addition, the Trustees reviewed materials specific to the proposed new Management Agreements with RI in response to requests for information made on behalf of the Trustees, including the following:
| n | | Performance data for the RiverSource Funds showing percentile and quartile rankings of each fund within its Lipper performance universe for periods up to five years and net returns of each fund relative to its benchmark returns. This data was arguably relevant due to the possibility that some RiverSource investment teams would be providing investment management services to certain Columbia Funds. 5 |
| n | | tables comparing the fee schedules and effective fee rates of funds managed by CMA and RI and institutional accounts advised by the two firms. |
| n | | extensive discussion of the process by which the various components of the two asset management businesses would be integrated including investment management, compliance, transfer agency, custody, fund accounting, and distribution. |
| n | | information about the financial condition of Ameriprise, including its most recent annual report on Form 10-K, RI’s profit margins from managing the RiverSource Funds in 2007 and 2008, and pro forma income statements for the combined Columbia and RiverSource fund complex. |
| n | | disclosure that certain senior CMG executives, including President Michael Jones, Chief Investment Officer Colin Moore, Head of Mutual Funds J. Kevin Connaughton, and Chief Compliance Officer Linda Wondrack would continue in analogous capacities following the consummation of the Transaction, and |
| n | | a breakdown of the synergies RI expects to realize in the two years following the Transaction and the extent to which those potential synergies are expected to be shared with shareholders of funds advised by RI. |
| 5 | On page 20 of its Supplemental Response to the Atlantic Trustees (undated but delivered November 24, 2009), Ameriprise said that “most personnel decisions, including with respect to the portfolio management teams for the Atlantic Funds . . . will be made primarily by [current CMA CIO] Colin Moore using the Columbia 5P process.” |
40
II. Findings
| 1. | Based upon my examination of the information supplied by CMG and Ameriprise in the light of the six factors set forth in the AOD, I conclude that the Trustees have the relevant information necessary to evaluate the reasonableness of the proposed management fees for each Atlantic Fund. |
| 2. | In my view, the process by which the proposed management fees of the Atlantic Funds have been negotiated with RI thus far has been, to the extent practicable, at arms’ length and reasonable and consistent with the AOD. |
Respectfully submitted,
Steven E. Asher
41
Shareholder Meeting Results
Columbia International Bond Fund
On March 3, 2010, a special meeting of shareholders of Columbia Funds Series Trust I was held to consider the approval of several proposals listed in the proxy statement for the meeting. Proposal 1 and Proposal 2 were voted on at the March 3, 2010 meeting of shareholders and Proposal 3 was voted on at an adjourned meeting of shareholders held on March 31, 2010. The shareholder meeting results are as follows:
Proposal 1: A proposed Investment Management Services Agreement with Columbia Management Investment Advisers, LLC (formerly, RiverSource Investments, LLC) (CMIA) was approved as follows:
| | | | | | |
| | | | | | | |
| Votes For | | Votes Against | | Abstentions | | Broker Non-Votes |
| 15,132,906 | | 0 | | 24,204 | | 418,952 |
Proposal 2: A proposal authorizing CMIA to enter into and materially amend subadvisory agreements for the Fund in the future, with the approval of the Trust’s Board of Trustees, but without obtaining additional shareholder approval, was approved as follows:
| | | | | | |
| | | | | | | |
| Votes For | | Votes Against | | Abstentions | | Broker Non-Votes |
| 15,125,884 | | 1,408 | | 29,818 | | 418,952 |
Proposal 3: Each of the nominees for trustees was elected to the Trust’s Board of Trustees, as follows:
| | | | | | |
| | | | | | | |
| Trustee | | Votes For | | Votes Withheld | | Abstentions |
| John D. Collins | | 30,977,072,412 | | 859,827,038 | | 0 |
Rodman L. Drake | | 30,951,179,004 | | 885,720,446 | | 0 |
| Douglas A. Hacker | | 30,989,793,279 | | 847,106,171 | | 0 |
Janet Langford Kelly | | 30,999,020,814 | | 837,878,636 | | 0 |
| William E. Mayer | | 16,291,139,483 | | 15,545,759,967 | | 0 |
Charles R. Nelson | | 30,997,700,700 | | 839,198,750 | | 0 |
| John J. Neuhauser | | 30,988,095,661 | | 848,803,789 | | 0 |
Jonathon Piel | | 30,968,801,048 | | 868,098,402 | | 0 |
| Patrick J. Simpson | | 30,999,065,030 | | 837,834,420 | | 0 |
Anne-Lee Verville | | 30,996,227,913 | | 840,671,537 | | 0 |
42
[THIS PAGE INTENTIONALLY LEFT BLANK]
43
[THIS PAGE INTENTIONALLY LEFT BLANK]
44
Important Information About This Report
The fund mails one shareholder report to each shareholder address. If you would like more than one report, please call shareholder services at 1-800-345-6611 and additional reports will be sent to you. This report has been prepared for shareholders of Columbia International Bond Fund.
A description of the policies and procedures that the fund uses to determine how to vote proxies and a copy of the fund’s voting records are available (i) at www.columbiamanagement.com, (ii) on the Securities and Exchange Commission’s website at www.sec.gov, and (iii) without charge, upon request, by calling 1-800-368-0346. Information regarding how the fund voted proxies relating to portfolio securities during the 12-month period ended June 30 is available from the SEC’s website. Information regarding how the fund voted proxies relating to portfolio securities is also available from the fund’s website, columbiamanagement.com.
The fund files a complete schedule of portfolio holdings with the SEC for the first and third quarters of each fiscal year on Form N-Q. The fund’s Form N-Q is available on the SEC’s website at www.sec.gov and may be reviewed and copied at the SEC’s Public Reference Room in Washington, D.C. Information on the operation of the Public Reference Room may be obtained by calling
1-800-SEC-0330.
Investors should consider the investment objectives, risks, charges and expenses of a mutual fund carefully before investing. For a free prospectus, which contains this and other important information about the funds, visit www.columbiamanagement.com. Read the prospectus carefully before investing.
On April 30, 2010, Ameriprise Financial, Inc., the parent company of RiverSource Investments, LLC, acquired the long-term asset management business of Columbia Management Group, LLC, including certain of its affiliates, which were, prior to this acquisition, part of Bank of America. In connection with the acquisition of the long-term assets, the Columbia Funds have a new investment adviser, RiverSource Investments, LLC, which is now known as Columbia Management Investment Advisers, LLC. For those clients that use the services of a subadviser, those arrangements are continuing unless notified otherwise. RiverSource Fund Distributors, Inc., now known as Columbia Management Investment Distributors, Inc., member FINRA, will act as the principal distributor of the Columbia Funds.
Transfer Agent*
Columbia Management Investment Services Corp.
P.O. Box 8081
Boston, MA 02266-8081
1-800-345-6611
Distributor*
Columbia Management Investment
Distributors, Inc.
One Financial Center
Boston, MA 02111
Investment Advisor*
Columbia Management Investment Advisers, LLC
100 Federal Street
Boston, MA 02110
* As of May 1, 2010.
45

Columbia International Bond Fund
One Financial Center
Boston, MA 02111-2621
www.columbiafunds.com
This report must be accompanied or preceeded by the Fund’s current prospectus. Columbia Management mutual funds are distributed by Columbia Management Investment Distributors, Inc.
©2010 Columbia Management Investment Advisers, LLC. All rights reserved.
C-1046 A (7/10)
Item 2. Code of Ethics.
(a) The registrant has adopted a code of ethics that applies to the registrant’s principal executive officer, principal financial officer, principal accounting officer or controller, or persons performing similar functions, regardless of whether these individuals are employed by the registrant or a third party.
(b) During the period covered by this report, there were not any amendments to a provision of the code of ethics adopted in 2(a) above.
(c) During the period covered by this report, there were no waivers, including any implicit waivers, from a provision of the code of ethics described in 2(a) above that relates to one or more of the items set forth in paragraph (b) of this item’s instructions.
Item 3. Audit Committee Financial Expert.
The registrant’s Board of Trustees has determined that John D. Collins, Douglas A. Hacker, Charles R. Nelson and Anne-Lee Verville, each of whom are members of the registrant’s Board of Trustees and Audit Committee, each qualify as an audit committee financial expert. Mr. Collins, Mr. Hacker, Mr. Nelson and Ms. Verville are each independent trustees, as defined in paragraph (a)(2) of this item’s instructions.
Item 4. Principal Accountant Fees and Services.
Fee information below is disclosed for the three series of the registrant whose report to stockholders is included in this annual filing.
(a) Audit Fees. Aggregate Audit Fees billed by the principal accountant for professional services rendered during the fiscal years ended May 31, 2010 and May 31, 2009 are approximately as follows:
2010 | | 2009 | |
$ | 138,900 | | $ | 146,400 | |
| | | | | |
Audit Fees include amounts related to the audit of the registrant’s annual financial statements or services that are normally provided by the accountant in connection with statutory and regulatory filings or engagements for those fiscal years. Audit fees for fiscal
year 2009 also includes fees for the review of and provision of consent in connection with filing Form N-1A for one new series. Fiscal year 2009 also includes Audit Fees for the review of and re-issuance of an audit opinion in conjunction with the filing of a Securities Registration Statement in Japan.
(b) Audit-Related Fees. Aggregate Audit-Related Fees billed to the registrant by the principal accountant for professional services rendered during the fiscal years ended May 31, 2010 and May 31, 2009 are approximately as follows:
Audit-Related Fees include amounts for assurance and related services by the principal accountant that are reasonably related to the performance of the audit of the registrant’s financial statements and are not reported in Audit Fees above. In both fiscal years 2010 and 2009, Audit-Related Fees consist of agreed-upon procedures performed for semi-annual shareholder reports.
During the fiscal years ended May 31, 2010 and May 31, 2009, there were no Audit-Related Fees billed by the registrant’s principal accountant to the registrant’s investment adviser (not including any sub-adviser whose role is primarily portfolio management and is subcontracted with or overseen by another investment adviser) and any entity controlling, controlled by, or under common control with the adviser that provides ongoing services to the registrant for an engagement that related directly to the operations and financial reporting of the registrant.
(c) Tax Fees. Aggregate Tax Fees billed by the principal accountant to the registrant for professional services rendered during the fiscal years ended May 31, 2010 and May 31, 2009 are approximately as follows:
2010 | | 2009 | |
$ | 15,300 | | $ | 10,500 | |
| | | | | |
Tax Fees include amounts for the review of annual tax returns, the review of required shareholder distribution calculations and typically include amounts for professional services by the principal accountant for tax compliance, tax advice and tax planning.
During the fiscal years ended May 31, 2010 and May 31, 2009, there were no Tax Fees billed by the registrant’s principal accountant to the registrant’s investment adviser (not including any sub-adviser whose role is primarily portfolio management and is subcontracted with or overseen by another investment adviser) and any entity controlling, controlled by, or under common control with the adviser that provides ongoing services to the registrant for an engagement that related directly to the operations and financial reporting of the registrant.
(d) All Other Fees. Aggregate All Other Fees billed by the principal accountant to the registrant for professional services rendered during the fiscal years ended May 31, 2010 and May 31, 2009 are approximately as follows:
All Other Fees include amounts for products and services provided by the principal accountant, other than the services reported in paragraphs (a) through (c) above.
Aggregate All Other Fees billed by the registrant’s principal accountant to the registrant’s investment adviser (not including any sub-adviser whose role is primarily portfolio management and is subcontracted with or overseen by another investment adviser) and any entity controlling, controlled by, or under common control with the adviser that provides ongoing services to the registrant for an engagement that related directly to the operations and financial reporting of the registrant during the fiscal years ended May 31, 2010 and May 31, 2009 are approximately as follows:
2010 | | 2009 | |
$ | 1,424,400 | | $ | 711,800 | |
| | | | | |
In both fiscal years 2010 and 2009, All Other Fees consist of fees billed for internal control examinations of the registrant’s transfer agent and investment advisor. Fiscal year 2010 also includes fees for agreed upon procedures related to the sale of the long-term asset management business and fees related to the review of revenue modeling schedules.
(e)(1) Audit Committee Pre-Approval Policies and Procedures
The registrant’s Audit Committee is required to pre-approve the engagement of the registrant’s independent accountants to provide audit and non-audit services to the registrant and non-audit services to its investment adviser (not including any sub-adviser whose role is primarily portfolio management and is subcontracted with or overseen by another investment adviser) or any entity controlling, controlled by or under common control with such investment adviser that provides ongoing services to the registrant (“Adviser Affiliates”), if the engagement relates directly to the operations and financial reporting of the registrant.
The Audit Committee has adopted a Policy for Engagement of Independent Accountants for Audit and Non-Audit Services (“Policy”). The Policy sets forth the understanding of the Audit Committee regarding the engagement of the registrant’s independent accountants to provide (i) audit and permissible audit-related, tax and other services to the registrant (collectively “Fund Services”); (ii) non-audit services to the registrant’s investment adviser (not including any sub-adviser whose role is primarily portfolio management and is subcontracted with or overseen by another investment
adviser) and Adviser Affiliates, if the engagement relates directly to the operations or financial reporting of a Fund (collectively “Fund-related Adviser Services”); and (iii) certain other audit and non-audit services to the registrant’s investment adviser (not including any sub-adviser whose role is primarily portfolio management and is subcontracted with or overseen by another investment adviser) and Adviser Affiliates. Unless a type of service receives general pre-approval under the Policy, it requires specific pre-approval by the Audit Committee if it is to be provided by the independent accountants. Pre-approval of non-audit services to the registrant, the registrant’s investment adviser (not including any sub-adviser whose role is primarily portfolio management and is subcontracted with or overseen by another investment adviser) and Adviser Affiliates may be waived provided that the “de minimis” requirements set forth under paragraph (c)(7)(i)(C) of Rule 2-01 of Regulation S-X are met.
Under the Policy, the Audit Committee may delegate pre-approval authority to any pre-designated member or members who are Independent Trustees/Directors. The member(s) to whom such authority is delegated must report, for informational purposes only, any pre-approval decisions to the Audit Committee at its next regular meeting. The Audit Committee’s responsibilities with respect to the pre-approval of services performed by the independent accountants may not be delegated to management.
The Policy requires the Fund Treasurer and/or Director of Board Administration to submit to the Audit Committee, on an annual basis, a schedule of the types of services that are subject to general pre-approval. The schedule(s) provide a description of each type of service that is subject to general pre-approval and, where possible, will provide estimated fee caps for each instance of providing each service. The Audit Committees will review and approve the types of services and review the projected fees for the next fiscal year and may add to, or subtract from, the list of general pre-approved services from time to time based on subsequent determinations. That approval acknowledges that the Audit Committee is in agreement with the specific types of services that the independent accountants will be permitted to perform.
The Fund Treasurer and/or Director of Board Administration shall report to the Audit Committee at each of its regular meetings regarding all Fund Services or Fund-related Adviser Services initiated since the last such report was rendered, including a general description of the services, actual billed and projected fees, and the means by which such Fund Services or Fund-related Adviser Services were pre-approved by the Audit Committee.
*****
(e)(2) The percentage of services described in paragraphs (b) through (d) of this Item approved pursuant to the “de minimis” exception under paragraph (c)(7)(i)(C) of Rule 2-01 of Regulation S-X during both fiscal years ended May 31, 2010 and May 31, 2009 was zero.
(f) Not applicable.
(g) The aggregate non-audit fees billed by the registrant’s accountant for services rendered to the registrant, and rendered to the registrant’s investment adviser (not including any sub-adviser whose role is primarily portfolio management and is subcontracted with or overseen by another investment adviser), and any entity controlling, controlled by, or under common control with the adviser that provides ongoing services to the registrant for the fiscal years ended May 31, 2010 and May 31, 2009 are approximately as follows:
2010 | | 2009 | |
$ | 1,453,500 | | $ | 731,500 | |
| | | | | |
(h) The registrant’s Audit Committee of the Board of Directors has considered whether the provision of non-audit services that were rendered to the registrant’s adviser (not including any sub-adviser whose role is primarily portfolio management and is subcontracted with or overseen by another investment adviser), and any entity controlling, controlled by, or under common control with the investment adviser that provides ongoing services to the registrant that were not pre-approved pursuant to paragraph (c)(7)(ii) of Rule 2-01 of Regulation S-X, is compatible with maintaining the principal accountant’s independence.
Item 5. Audit Committee of Listed Registrants.
Not applicable.
Item 6. Investments
(a) The registrant’s “Schedule I — Investments in securities of unaffiliated issuers” (as set forth in 17 CFR 210.12-12) is included in Item 1 of this Form N-CSR.
(b) Not applicable.
Item 7. Disclosure of Proxy Voting Policies and Procedures for Closed-End Management Investment Companies.
Not applicable.
Item 8. Portfolio Managers of Closed-End Management Investment Companies.
Not applicable.
Item 9. Purchases of Equity Securities by Closed-End Management Investment Company and Affiliated Purchasers.
Not applicable.
Item 10. Submission of Matters to a Vote of Security Holders.
There were no material changes to the procedures by which shareholders may recommend nominees to the registrant’s board of directors.
Item 11. Controls and Procedures.
(a) The registrant’s principal executive officer and principal financial officers, based on their evaluation of the registrant’s disclosure controls and procedures as of a date within 90 days of the filing of this report, have concluded that such controls and procedures are adequately designed to ensure that material information required to be disclosed by the registrant in Form N-CSR is accumulated and communicated to the registrant’s management, including the principal executive officer and principal financial officer, or persons performing similar functions, as appropriate to allow timely decisions regarding required disclosure.
(b) There was no change in the registrant’s internal control over financial reporting that occurred during the registrant’s second fiscal quarter of the period covered by this report that has materially affected, or is reasonably likely to materially affect, the registrant’s internal control over financial reporting.
Item 12. Exhibits.
(a)(1) Code of ethics required to be disclosed under Item 2 of Form N-CSR attached hereto as Exhibit 99.CODE ETH.
(a)(2) Certifications pursuant to Rule 30a-2(a) under the Investment Company Act of 1940 (17 CFR 270.30a-2(a)) attached hereto as Exhibit 99.CERT.
(a)(3) Not applicable.
(b) Certification pursuant to Rule 30a-2(b) under the Investment Company Act of 1940 (17 CFR 270.30a-2(b)) attached hereto as Exhibit 99.906CERT.
SIGNATURES
Pursuant to the requirements of the Securities Exchange Act of 1934 and the Investment Company Act of 1940, the registrant has duly caused this report to be signed on its behalf by the undersigned, thereunto duly authorized.
(registrant) | | Columbia Funds Series Trust I | |
| | |
| | |
By (Signature and Title) | | /s/ J. Kevin Connaughton | |
| | J. Kevin Connaughton, President | |
| | |
| | |
Date | | July 22, 2010 | |
| | | | | |
Pursuant to the requirements of the Securities Exchange Act of 1934 and the Investment Company Act of 1940, this report has been signed below by the following persons on behalf of the registrant and in the capacities and on the dates indicated.
By (Signature and Title) | | /s/ J. Kevin Connaughton | |
| | J. Kevin Connaughton, President | |
| | |
| | |
Date | | July 22, 2010 | |
| | |
| | |
By (Signature and Title) | | /s/ Michael G. Clarke | |
| | Michael G. Clarke, Chief Financial Officer | |
| | |
| | |
Date | | July 22, 2010 | |
| | | | |