UNITED STATES
SECURITIES AND EXCHANGE COMMISSION
Washington, D.C. 20549
FORM N-CSR
CERTIFIED SHAREHOLDER REPORT OF REGISTERED
MANAGEMENT INVESTMENT COMPANIES
Investment Company Act file number | 811-04367 |
|
Columbia Funds Series Trust I |
(Exact name of registrant as specified in charter) |
|
One Financial Center, Boston, Massachusetts | | 02111 |
(Address of principal executive offices) | | (Zip code) |
|
Scott R. Plummer
5228 Ameriprise Financial Center
Minneapolis, MN 55474 |
(Name and address of agent for service) |
|
Registrant’s telephone number, including area code: | 1-612-671-1947 | |
|
Date of fiscal year end: | August 31 | |
|
Date of reporting period: | August 31, 2010 | |
| | | | | | | | |
Form N-CSR is to be used by management investment companies to file reports with the Commission not later than 10 days after the transmission to stockholders of any report that is required to be transmitted to stockholders under Rule 30e-1 under the Investment Company Act of 1940 (17 CFR 270.30e-1). The Commission may use the information provided on Form N-CSR in its regulatory, disclosure review, inspection, and policymaking roles.
A registrant is required to disclose the information specified by Form N-CSR, and the Commission will make this information public. A registrant is not required to respond to the collection of information contained in Form N-CSR unless the Form displays a currently valid Office of Management and Budget (“OMB”) control number. Please direct comments concerning the accuracy of the information collection burden estimate and any suggestions for reducing the burden to Secretary, Securities and Exchange Commission, 450 Fifth Street, NW, Washington, DC 20549-0609. The OMB has reviewed this collection of information under the clearance requirements of 44 U.S.C. § 3507.
Item 1. Reports to Stockholders.

Columbia International Stock Fund
Annual Report for the Period Ended August 31, 2010
Not FDIC insured • No bank guarantee • May lose value
Table of Contents
| Fund Profile | | | 1 | | |
|
| Economic Update | | | 2 | | |
|
| Performance Information | | | 4 | | |
|
| Understanding Your Expenses | | | 5 | | |
|
| Portfolio Manager's Report | | | 6 | | |
|
| Investment Portfolio | | | 8 | | |
|
Statement of Assets and
Liabilities | | | 14 | | |
|
| Statement of Operations | | | 16 | | |
|
Statement of Changes in
Net Assets | | | 17 | | |
|
| Financial Highlights | | | 19 | | |
|
| Notes to Financial Statements | | | 24 | | |
|
Report of Independent Registered
Public Accounting Firm | | | 36 | | |
|
| Federal Income Tax Information | | | 37 | | |
|
| Fund Governance | | | 38 | | |
|
Summary of Management Fee
Evaluation by Independent Fee
Consultant (RiverSource
Investments, LLC) | | | 43 | | |
|
| Shareholder Meeting Results | | | 45 | | |
|
Important Information About
This Report | | | 49 | | |
|
The views expressed in this report reflect the current views of the respective parties. These views are not guarantees of future performance and involve certain risks, uncertainties and assumptions that are difficult to predict, so actual outcomes and results may differ significantly from the views expressed. These views are subject to change at any time based upon economic, market or other conditions and the respective parties disclaim any responsibility to update such views. These views may not be relied on as investment advice and, because investment decisions for a Columbia Fund are based on numerous factors, may not be relied on as an indication of trading intent on behalf of any particular Columbia Fund. References to specific securities should not be construed as a recommendation or investment advice.
President's Message

Dear Shareholder:
The Columbia Management story began over 100 years ago, and today, we are one of the nation's largest dedicated asset managers. The recent acquisition by Ameriprise Financial, Inc. brings together the talents, resources and capabilities of Columbia Management with those of RiverSource Investments, Threadneedle (acquired by Ameriprise in 2003) and Seligman Investments (acquired by Ameriprise in 2008) to build a best-in-class asset management business that we believe is truly greater than its parts.
RiverSource Investments traces its roots to 1894 when its then newly-founded predecessor, Investors Syndicate, offered a face-amount savings certificate that gave small investors the opportunity to build a safe and secure fund for retirement, education or other special needs. A mutual fund pioneer, Investors Syndicate launched Investors Mutual Fund in 1940. In the decades that followed, its mutual fund products and services lineup grew to include a full spectrum of styles and specialties. More than 110 years later, RiverSource continues to be a trusted financial products leader.
Threadneedle, a leader in global asset management and one of Europe's largest asset managers, offers sophisticated international experience from a dedicated U.K. management team. Headquartered in London, it is named for Threadneedle Street in the heart of the city's financial district, where British investors pioneered international and global investing. Threadneedle was acquired in 2003 and today operates as an affiliate of Columbia Management.
Seligman Investments' beginnings date back to the establishment of the investment firm J. & W. Seligman & Co. in 1864. In the years that followed, Seligman played a major role in the geographical expansion and industrial development of the United States. In 1874, President Ulysses S. Grant named Seligman as fiscal agent for the U.S. Navy—an appointment that would last through World War I. Seligman helped finance the westward path of the railroads and the building of the Panama Canal. The firm organized its first investment company in 1929 and began managing its first mutual fund in 1930. In 2008, J. & W. Seligman & Co. Incorporated was acquired and Seligman Investments became an offering brand of RiverSource Investments, LLC.
We are proud of the rich and distinctive history of these firms, the strength and breadth of products and services they offer, and the combined cultures of pioneering spirit and forward thinking. Together we are committed to providing more for our shareholders than ever before.
> A singular focus on our shareholders
Our business is asset management, so investors are our first priority. We dedicate our resources to identifying timely investment opportunities and provide a comprehensive choice of equity, fixed-income and alternative investments to help meet your individual needs.
> First-class research and thought leadership
We are dedicated to helping you take advantage of today's opportunities and anticipate tomorrow's. We stay abreast of the latest investment trends and ideas, using our collective insight to evaluate events and transform them into solutions you can use.
> A disciplined investment approach
We aren't distracted by passing fads. Our teams adhere to a rigorous investment process that helps ensure the integrity of our products and enables you and your financial advisor to match our solutions to your objectives with confidence.
When you choose Columbia Management, you can be confident that we will take the time to understand your needs and help you and your financial advisor identify the solutions that are right for you. Because at Columbia Management, we don't consider ourselves successful unless you are.
Sincerely,

J. Kevin Connaughton
President, Columbia Funds
Investors should consider the investment objectives, risks, charges and expenses of a mutual fund carefully before investing. For a free prospectus, which contains this and other important information about the funds, visit www.columbiamanagement.com. The prospectus should be read carefully before investing.
Columbia Funds are distributed by Columbia Management Investment Distributors, Inc., member FINRA, and managed by Columbia Management Investment Advisers, LLC.
© 2010 Columbia Management Investment Advisers, LLC. All rights reserved.
Fund Profile – Columbia International Stock Fund
Summary
g For the 12-month period that ended August 31, 2010, the fund's Class A shares returned negative 5.57% without sales charge.
g The fund underperformed its benchmarks, the MSCI EAFE Index (Net)1 and the MSCI All Country World ex U.S. Index (Net),2 and the average return of its peer group, the Lipper International Multi-Cap Core Funds Classification.3
g The fund had more exposure than its benchmarks to southern European countries, namely Greece, which detracted from the fund's performance. Stock selection in the consumer staples and consumer discretionary sectors also held back return.
Portfolio Management
Fred Copper has managed the fund since October 2005 and has been associated with the advisor since May 2010. Prior to joining the advisor, Mr. Copper was associated with the fund's previous advisor or its predecessors since 2005.
Effective May 1, 2010, RiverSource Investments, LLC, a subsidiary of Ameriprise Financial, Inc., became the investment advisor to the fund and changed its name to Columbia Management Investment Advisers, LLC. Please see the fund's prospectuses, as supplemented, for more information regarding the change in investment advisor and certain other changes.
1The Morgan Stanley Capital International Europe, Australasia, Far East (MSCI EAFE) Index (Net) is a free float-adjusted market capitalization Index that is designed to measure the equity market performance of developed markets, excluding the U.S. & Canada. As of May 27, 2010, the MSCI EAFE Index (Net) consisted of the following 22 developed market country indices: Australia, Austria, Belgium, Denmark, Finland, France, Germany, Greece, Hong Kong, Ireland, Israel, Italy, Japan, the Netherlands, New Zealand, Norway, Portugal, Singapore, Spain, Sweden, Switzerland, and the United Kingdom.
2The Morgan Stanley Capital International (MSCI) All Country (AC) World ex U.S. Index (Net) tracks global stock market performance that includes developed and emerging markets but excludes the U.S.
3Lipper Inc., a widely respected data provider in the industry, calculates an average total return (assuming reinvestment of distributions) for mutual funds with investment objectives similar to those of the fund. Lipper makes no adjustment for the effect of sales loads.
Indices are not available for investment, are not professionally managed and do not reflect sales charges, fees, brokerage commissions, taxes or other expenses of investing. Securities in the fund many not match those in an index.
Performance data quoted represents past performance and current performance may be lower or higher. Past performance is no guarantee of future results. The investment return and principal value will fluctuate so that shares, when redeemed, may be worth more or less than the original cost. Please visit www.columbiamanagement.com for daily and most recent month-end performance updates.
Summary
1-year return as of 08/31/2010
| | –5.57% | |
|
| |  | | | Class A shares
(without sales charge) | |
|
| | –2.34% | |
|
| |  | | | MSCI EAFE Index (Net) | |
|
| | +2.85% | |
|
| |  | | | MSCI All Country World
ex U.S. Index (Net) | |
|
Morningstar Style BoxTM
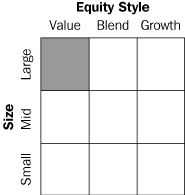
The Morningstar Style BoxTM is based on the Fund's portfolio holdings as of period end. For equity funds, the vertical axis shows the market capitalization of the stocks owned, and the horizontal axis shows investment style (value, blend, or growth). Information shown is based on the most recent data provided by Morningstar.
© 2010 Morningstar, Inc. All rights reserved. The information contained herein is proprietary to Morningstar and/or its content providers, may not be copied or distributed and is not warranted to be accurate, complete, or timely. Neither Morningstar nor its content providers are responsible for any damages or losses arising from any use of this information. Past performance is no guarantee of future results.
1
Economic Update – Columbia International Stock Fund
Summary
For the 12-month period that ended August 31, 2010
g The U.S. stock market, as measured by the S&P 500 Index, delivered positive returns, despite a correction in the last months of the period. Emerging market stocks, as measured by the MSCI Emerging Markets Index (Net), outperformed U.S. stocks as well as stock markets in developed foreign markets.
| S&P Index | | MSCI Index | |
|
 | |  | |
|
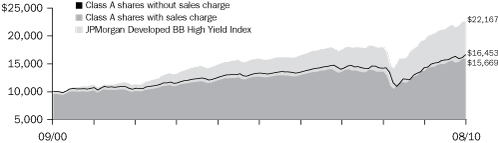
g Modest economic growth and relatively low interest rates boosted bond market returns. The Barclays Capital Aggregate Bond Index delivered solid results. High-yield bonds outperformed stocks, as measured by the JPMorgan Developed BB High Yield Index.
Barclays
Aggregate Index | | JPMorgan
Index | |
|
 | |  | |
|
Although it has been more than a year since U.S. economic growth turned positive, the economy continues to send mixed signals about the sustainability of this recovery. Economic growth, as measured by gross domestic product (GDP), was a solid 5.0% in the last quarter of 2009. However, it was 3.7% in the first quarter of 2010 and only 1.7% in the second quarter. Expectations are for continued lackluster growth through the end of the year, as government incentive programs have ended and stimulus spending winds down. Even so, it appears to be unlikely that the U.S. economy will sink back into recession as many key indicators remain positive.
Consumer spending on cars, clothing and other goods increased throughout the year, although the pace of increased spending was small. Personal income also moved higher. Consumer confidence, as measured by the Conference Board Consumer Confidence Index, gained ground in the first half of 2010. However, the index fell sharply in June and July before stabilizing in August. Consumers surveyed in the last three months of the reporting period indicated they were concerned about business conditions and job prospects and generally apprehensive about the future.
The housing market—another bellwether for the consumer sector—showed few positive signs. Both new and existing home sales fell in the final months of the period as a federal tax credit for new and repeat homebuyers expired. Distressed properties continued to pressure prices and a huge backlog of foreclosed homes is likely to continue to keep a lid on prices for some time. The national median price of existing homes rose slightly over the one-year period, while the national median price of new homes declined. Despite near-record low mortgage rates, the inventory of unsold homes rose to a 12.5 month supply, up sharply at the end of the period. The long-term average is on the order of six months.
News on the job front was mostly positive in 2010, but the number of new jobs added to the economy fell short of expectations. A good portion of the jobs added in March, April and May were temporary, government-sponsored census positions, which began to unwind in June, July and August. Private sector job growth was disappointing given the stage of economic recovery. Nevertheless, private sector payroll employment trended modestly higher in the summer and news of massive layoffs declined.
Reports from the business side of the economy were generally positive. A key measure of the nation's manufacturing situation—the Institute for Supply Management's Index—was generally positive, although the index trended slightly downward in the final months of the period. Industrial production moved higher, as did the amount of manufacturing capacity utilized—a key measure of the health of the manufacturing sector.
Stock rally interrupted
Against a strengthening economic backdrop, a stock market rally that began early in 2009 continued into the spring of 2010. However, a debt crisis brewing in Europe raised concerns among U.S. investors, as did mixed signals on the economy, and some of the stock market's earlier gains vanished during the early summer. The S&P 500 Index1
1The Standard & Poor's (S&P) 500 Index tracks the performance of 500 widely held, large-capitalization U.S. stocks.
2
Economic Update (continued) – Columbia International Stock Fund
returned 4.91% for the 12-month period. Outside the United States, stock market returns were mixed. The MSCI EAFE Index (Net),2 a broad gauge of stock market performance in foreign developed markets, returned negative 2.34% (net of dividends, in U.S. dollars) for the period, as concerns about the impact of a bailout for weak eurozone economies weighed on the markets. Emerging stock markets were more resilient. The MSCI Emerging Markets Index (Net)3 returned 18.02% (in U.S. dollars) for the 12-month period.
Bonds delivered solid returns
As the economy strengthened, bonds delivered solid returns. The Barclays Capital Aggregate Bond Index4 returned 9.18%. Municipal bonds gained almost as much as taxable investment-grade bonds, even without factoring in potential tax advantages to investors in higher income-tax brackets. The Barclays Capital 3-15 Year Blend Municipal Bond Index5 returned 8.95%. The high-yield bond market outpaced stocks during the period by a margin of more than three to one. For the 12 months covered by this report, the JPMorgan Developed BB High Yield Index6 returned 17.68% while the S&P 500 Index returned 4.91%. Even the Treasury market was positive as the yield on the 10-year U.S. Treasury, a common bellwether for the bond market, fell nearly one full percentage point, from 3.4% to 2.5% over the 12-month period. Despite the pickup in economic activity, the Federal Reserve Board (the Fed) kept a key short-te rm interest rate—the federal funds rate—close to zero.
Past performance is no guarantee of future results.
2The Morgan Stanley Capital International Europe, Australasia, Far East (MSCI EAFE) Index (Net) is a free float-adjusted market capitalization Index that is designed to measure the equity market performance of developed markets, excluding the U.S. & Canada. As of May 27, 2010, the MSCI EAFE Index (Net) consisted of the following 22 developed market country indices: Australia, Austria, Belgium, Denmark, Finland, France, Germany, Greece, Hong Kong, Ireland, Israel, Italy, Japan, the Netherlands, New Zealand, Norway, Portugal, Singapore, Spain, Sweden, Switzerland, and the United Kingdom.
3The Morgan Stanley Capital International Emerging Markets (MSCI EM) Index (Net) is a free float-adjusted market capitalization index that is designed to measure equity market performance of emerging markets. As of May 27, 2010, the MSCI Emerging Markets Index (Net) consisted of the following 21 emerging market country indices: Brazil, Chile, China, Colombia, Czech Republic, Egypt, Hungary, India, Indonesia, Korea, Malaysia, Mexico, Morocco, Peru, Philippines, Poland, Russia, South Africa, Taiwan, Thailand, and Turkey.
4The Barclays Capital Aggregate Bond Index is a market value-weighted index that tracks the daily price, coupon, pay-downs and total return performance of fixed-rate, publicly placed, dollar-denominated and non-convertible investment grade debt issues with at least $250 million par amount outstanding and with at least one year to final maturity.
5The Barclays Capital 3-15 Year Blend Municipal Bond Index tracks the performance of municipal bonds issued after December 31, 1990 with remaining maturities between 2 and 17 years and at least $7 million in principal amount outstanding.
6The JPMorgan Developed BB High Yield Index is an unmanaged index designed to mirror the investable universe of the U.S. dollar developed, BB-rated, high yield corporate debt market.
Indices are not available for investment, are not professionally managed and do not reflect sales charges, fees, brokerage commissions, taxes or other expenses of investing. Securities in the fund may not match those in an index.
3
Performance Information – Columbia International Stock Fund
Performance data quoted represents past performance and current performance may be lower or higher. Past performance is no guarantee of future results. The investment return and principal value will fluctuate so that shares, when redeemed, may be worth more or less than the original cost. Please visit www.columbiamanagement.com for daily and most recent month-end performance updates.
Annual operating expense ratio (%)*
| Class A | | | 1.48 | | |
| Class B | | | 2.23 | | |
| Class C | | | 2.23 | | |
| Class Y | | | 1.04 | | |
| Class Z | | | 1.23 | | |
* The annual operating expense ratio is as stated in the fund's prospectus that is current as of the date of this report and includes the expenses incurred by the investment companies in which the fund invests. Differences in expense ratios disclosed elsewhere in this report may result from expenses incurred by the investment companies, inclusion of fee waivers and expense reimbursements as well as the use of different time periods to calculate the ratios.
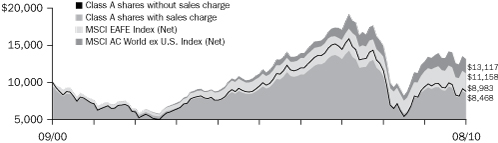
Performance of a $10,000 investment 09/01/00 – 08/31/10
The chart above shows the change in value of a hypothetical $10,000 investment in Class A shares of Columbia International Stock Fund during the stated time period, and does not reflect the deduction of taxes that a shareholder may pay on fund distributions or on the redemption of fund shares.
Performance of a $10,000 investment 09/01/00 – 08/31/10 ($)
| Sales charge | | without | | with | |
| Class A | | | 8,983 | | | | 8,468 | | |
| Class B | | | 8,448 | | | | 8,448 | | |
| Class C | | | 8,487 | | | | 8,487 | | |
| Class Y | | | 9,245 | | | | n/a | | |
| Class Z | | | 9,228 | | | | n/a | | |
Average annual total return as of 08/31/10 (%)
| Share class | | A | | B | | C | | Y | | Z | |
| Inception | | 11/01/02 | | 11/01/02 | | 10/13/03 | | 07/15/09 | | 10/01/92 | |
| Sales charge | | without | | with | | without | | with | | without | | with | | without | | without | |
| 1-year | | | –5.57 | | | | –11.00 | | | | –6.29 | | | | –10.87 | | | | –6.25 | | | | –7.17 | | | | –5.31 | | | | –5.48 | | |
| 5-year | | | –1.31 | | | | –2.47 | | | | –2.02 | | | | –2.30 | | | | –2.01 | | | | –2.01 | | | | –1.01 | | | | –1.05 | | |
| 10-year | | | –1.07 | | | | –1.65 | | | | –1.67 | | | | –1.67 | | | | –1.63 | | | | –1.63 | | | | –0.78 | | | | –0.80 | | |
Average annual total return as of 09/30/10 (%)
| Share class | | A | | B | | C | | Y | | Z | |
| Sales charge | | without | | with | | without | | with | | without | | with | | without | | without | |
| 1-year | | | 0.98 | | | | –4.83 | | | | 0.18 | | | | –4.72 | | | | 0.18 | | | | –0.80 | | | | 1.37 | | | | 1.18 | | |
| 5-year | | | –0.08 | | | | –1.26 | | | | –0.80 | | | | –1.08 | | | | –0.81 | | | | –0.81 | | | | 0.22 | | | | 0.19 | | |
| 10-year | | | 0.58 | | | | –0.01 | | | | –0.04 | | | | –0.04 | | | | 0.00 | | | | 0.00 | | | | 0.88 | | | | 0.86 | | |
The "with sales charge" returns include the maximum initial sales charge of 5.75% for Class A shares and the applicable contingent deferred sales charge of 5.00% in the first year, declining to 1.00% in the sixth year and eliminated thereafter for Class B shares and 1.00% for Class C shares in the first year only. The "without sales charge" returns do not include the effect of sales charges. If they had, returns would be lower.
Performance results reflect any fee waivers or reimbursements of fund expenses by the investment advisor and/or any of its affiliates. Absent these fee waivers or expense reimbursement arrangements, performance results would have been lower.
All results shown assume reinvestment of distributions. Class Y and Class Z shares are sold at net asset value with no distribution and service (Rule 12b-1) fees. Class Y and Class Z shares have limited eligibility and the investment minimum requirements may vary. Please see the fund's prospectuses for details. Performance for different share classes will vary based on differences in sales charges and fees associated with each class.
The tables do not reflect the deduction of taxes that a shareholder may pay on fund distributions or on the redemption of fund shares.
Class A, Class B, Class C and Class Y are newer classes of shares. Class A, Class B and Class Y shares performance information includes the performance of Class Z shares (the oldest existing share class) for periods prior to their inception. Class C shares performance information includes returns of Class B shares for the period from November 1, 2002 through October 12, 2003, and the returns of Class Z shares for periods prior thereto. These returns reflect differences in sales charges, but have not been restated to reflect any differences in expenses (such as distribution and service (Rule 12b-1) fees) between Class Z shares and the newer classes of shares. If differences in expenses had been reflected, the returns shown for periods prior to the inception of Class A, Class B, and Class C shares would have been lower, since these classes of shares are subject to distribution and service (Rule 12b-1) fees. Class A and Class B sha res were initially offered on November 1, 2002, Class C shares were initially offered on October 13, 2003, Class Y shares were initially offered on July 15, 2009 and Class Z shares were initially offered on October 1, 1992.
4
Understanding Your Expenses – Columbia International Stock Fund
As a fund shareholder, you incur two types of costs. There are transaction costs, which generally include sales charges on purchases and may include redemption fees or exchange fees. There are also ongoing costs, which generally include investment advisory fees, distribution and service (Rule 12b-1) fees and other fund expenses. The information on this page is intended to help you understand the ongoing costs of investing in the fund and to compare these costs with the ongoing costs of investing in other mutual funds.
Analyzing your fund's expenses by share class
To illustrate these ongoing costs, we have provided an example and calculated the expenses paid by investors in each share class during the period. The information in the following table is based on an initial investment of $1,000, which is invested at the beginning of the period and held for the entire period. Expense information is calculated two ways and each method provides you with different information. The amount listed in the "Actual" column is calculated using the fund's actual operating expenses and total return for the period. The amount listed in the "Hypothetical" column for each share class assumes that the return each year is 5% before expenses and is calculated based on the fund's actual operating expenses. You should not use the hypothetical account values and expenses to estimate either your actual account balance at the end of the period or the expenses you paid during this period.
Compare with other funds
Since all mutual funds are required to include the same hypothetical calculations about expenses in shareholder reports, you can use this information to compare the ongoing cost of investing in the fund with other funds. To do so, compare the 5% hypothetical example with the 5% hypothetical examples that appear in the shareholder reports of other funds. As you compare hypothetical examples of other funds, it is important to note that hypothetical examples are meant to highlight the ongoing costs of investing in a fund and do not reflect any transaction costs, such as sales charges, redemption fees or exchange fees.
Estimating your actual expenses
To estimate the expenses that you paid over the period, first you will need your account balance at the end of the period:
g For shareholders who receive their account statements from Columbia Management Investment Services Corp., your account balance is available online at www.columbiamanagement.com or by calling Shareholder Services at 800.345.6611.
g For shareholders who receive their account statements from their financial intermediary, contact your financial intermediary to obtain your account balance.
1. Divide your ending account balance by $1,000. For example, if an account balance was $8,600 at the end of the period, the result would be 8.6.
2. In the section of the table below titled "Expenses paid during the period," locate the amount for your share class. You will find this number in the column labeled "Actual." Multiply this number by the result from step 1. Your answer is an estimate of the expenses you paid on your account during the period.
If the value of your account falls below the minimum initial investment requirement applicable to you, your account may be subject to a $20 annual fee. This fee is not included in the accompanying table. If you are subject to the fee, keep it in mind when you are estimating the ongoing expenses of investing in the fund and when comparing the expenses of this fund with other funds.
03/01/10 – 08/31/10
| | | Account value at the
beginning of the period ($) | | Account value at the
end of the period ($) | | Expenses paid
during the period ($) | | Fund's annualized
expense ratio (%) | |
| | | Actual | | Hypothetical | | Actual | | Hypothetical | | Actual | | Hypothetical | | Actual | |
| Class A | | | 1,000.00 | | | | 1,000.00 | | | | 958.70 | | | | 1,018.15 | | | | 6.91 | | | | 7.12 | | | | 1.40 | | |
| Class B | | | 1,000.00 | | | | 1,000.00 | | | | 954.30 | | | | 1,014.37 | | | | 10.59 | | | | 10.92 | | | | 2.15 | | |
| Class C | | | 1,000.00 | | | | 1,000.00 | | | | 954.60 | | | | 1,014.37 | | | | 10.59 | | | | 10.92 | | | | 2.15 | | |
| Class Y | | | 1,000.00 | | | | 1,000.00 | | | | 959.10 | | | | 1,019.91 | | | | 5.18 | | | | 5.35 | | | | 1.05 | | |
| Class Z | | | 1,000.00 | | | | 1,000.00 | | | | 958.30 | | | | 1,019.41 | | | | 5.68 | | | | 5.85 | | | | 1.15 | | |
Expenses paid during the period are equal to the annualized expense ratio for the share class, multiplied by the average account value over the period, then multiplied by the number of days in the fund's most recent fiscal half-year and divided by 365.
Had the investment advisor and/or any of its affiliates not waived fees or reimbursed a portion of expenses for all share Classes except for Class Y, account value at the end of the period would have been reduced for these share Classes.
It is important to note that the expense amounts shown in the table are meant to highlight only ongoing costs of investing in the fund and do not reflect any transaction costs, such as sales charges, redemption fees or exchange fees. Therefore, the hypothetical examples provided may not help you determine the relative total costs of owning shares of different funds. If these transaction costs were included, your costs would have been higher.
5
Portfolio Manager's Report – Columbia International Stock Fund
Performance data quoted represents past performance and current performance may be lower or higher. Past performance is no guarantee of future results. The investment return and principal value will fluctuate so that shares, when redeemed, may be worth more or less than the original cost. Please visit www.columbiamanagement.com for daily and most recent month-end performance updates.
Net asset value per share
as of 08/31/10 ($)
| Class A | | | 10.21 | | |
| Class B | | | 9.82 | | |
| Class C | | | 9.88 | | |
| Class Y | | | 10.33 | | |
| Class Z | | | 10.33 | | |
Distributions declared per share
09/01/09 – 08/31/10 ($)
| Class A | | | 0.34 | | |
| Class B | | | 0.25 | | |
| Class C | | | 0.25 | | |
| Class Y | | | 0.40 | | |
| Class Z | | | 0.38 | | |
Top 5 countries
as of 08/31/10 (%)
| Japan | | | 20.0 | | |
| United Kingdom | | | 15.9 | | |
| Germany | | | 9.4 | | |
| Switzerland | | | 6.1 | | |
| France | | | 6.0 | | |
Top 10 holdings
as of 08/31/10 (%)
| Banco Santander | | | 1.9 | | |
| AstraZeneca | | | 1.7 | | |
| BHP Billiton | | | 1.7 | | |
| Roche Holdings | | | 1.6 | | |
| Sanofi-Aventis | | | 1.5 | | |
| BASF | | | 1.5 | | |
| Carlsberg | | | 1.4 | | |
Australia & New Zealand
Banking Group | | | 1.4 | | |
Sumitomo Mitsui Financial
Group | | | 1.4 | | |
| International Power | | | 1.3 | | |
This fund is actively managed and the composition of its portfolio will change over time. Information provided is calculated as a percentage of net assets.
For the 12-month period that ended August 31, 2010, the fund's Class A shares returned negative 5.57% without sales charge. In a challenging environment for international stock markets, the fund and the MSCI EAFE Index (Net) generated losses. The MSCI EAFE Index (Net) returned negative 2.34% and the MSCI All Country World ex U.S. Index (Net) returned positive 2.85%. The average return of funds in its peer group, the Lipper International Multi-Cap Core Funds Classification, was 1.94%. An overweight in southern European countries, namely Greece, detracted from the fund's performance as did stock selection in the consumer staples and consumer discretionary sectors.
Greece, consumer sectors detracted from performance in relatively flat market
Stock markets around the developed world were generally flat during the 12-month period, with Asia, emerging markets and northern European countries holding up better than southern Europe, which is struggling with a sovereign debt crisis. Against this backdrop, an overweight in Greece detracted from fund performance. We thought the country's austerity plan would be a solution for its debt problem. However, so far that has not been the case and we significantly trimmed exposure to Greece during the period.
In the consumer sectors, stock selection also hampered returns. Game Group (0.6% of net assets), a video game retailer in the UK, was a disappointment. Sales of video games are usually driven by new hardware platforms, but no new platforms were introduced during the period. The stock remains in the portfolio because its valuation and 8% dividend yield remain attractive. In addition, we believe that a new hardware cycle, based on hand held and 3D platforms, is about to begin. We believe that this has the potential to boost the stock's performance.
Positive stock selection aided returns
By contrast, relatively strong economic growth in Asia benefited Hongkong Land Holdings (0.9% of net assets), an office property developer. Turkish Air (Turk Hava Yollari) (0.5% of net assets) also aided performance. The Turkish market has been strong, and its location as a gateway between Europe and the Mideast has kept demand for air travel robust. U.K.-based International Power (1.3% of net assets), a global electricity generating company, made a positive contribution to the fund's return. The company's announced merger with France's GDF-Suez drove up the share price. During the period, we used derivatives, such as currency forwards to hedge the portfolio's currency weight, call options to protect against individual position losses and index futures to equitize cash. These positions provided some downside protection for currency exposures and certain portfolio holdings but had no material impact on performance.
A shift in country emphasis
In addition to reducing exposure to Greece, we also trimmed holdings in Japan. We had increased exposure to Japan on the belief that a new finance minister would be a force for stability and economic recovery. However, government upheaval has continued and there has been no sign of government action to implement tough reforms and weaken the yen. As a result, we reduced the fund's investments in Japan. We used the proceeds from reductions in Greece and Japan to build positions in the export-oriented northern
6
Portfolio Manager's Report (continued) – Columbia International Stock Fund
European markets of Germany, France, Sweden and Finland, because we believed they would continue to benefit from a structurally weak euro, which makes their products less expensive abroad, and from the export segments of their economies. An example is MTU Aero Engines Holdings (0.7% of net assets), a German aerospace company, which was buoyed by increased global demand for aerospace products. In addition, we had an out-of-index weight to the United States where we took profits on relatively strong performance.
Seeking dividends in a subdued market
With expectations of subdued economic growth and modest equity market returns, we have positioned the portfolio to emphasize dividend yield. Although we routinely consider a stock's dividend yield as part of our analysis, we will give dividends more consideration going forward because we believe dividends will become a much larger percentage of total return as investors seek opportunities to enhance return without undue risk. With this in mind, we have already added dividend-paying stocks from the telecommunications, integrated energy and utilities sectors.
Portfolio characteristics and holdings are subject to change and may not be representative of current characteristics and holdings. The outlook for this fund may differ from that presented for other Columbia Funds.
Equity securities are affected by stock market fluctuations that occur in response to economic and business developments.
International investing may involve certain risks, including currency fluctuations, risks associated with possible differences in financial accounting standards and other monetary and political risks. Significant levels of foreign taxes, including potentially confiscatory levels of taxation and withholding taxes, may also apply to some foreign investments.
Investing in emerging markets may involve greater risks than investing in more developed countries. In addition, concentration of investments in a single region may result in greater volatility.
7
Investment Portfolio – Columbia International Stock Fund
August 31, 2010
| Common Stocks – 98.2% | |
| | | Shares | | Value ($) | |
| Consumer Discretionary – 9.8% | |
| Automobiles – 1.6% | |
| Honda Motor Co., Ltd. | | | 51,500 | | | | 1,697,611 | | |
| Nissan Motor Co., Ltd. (a) | | | 635,000 | | | | 4,837,307 | | |
| Automobiles Total | | | 6,534,918 | | |
| Hotels, Restaurants & Leisure – 0.6% | |
| OPAP SA | | | 149,281 | | | | 2,257,832 | | |
| Hotels, Restaurants & Leisure Total | | | 2,257,832 | | |
| Household Durables – 2.3% | |
| Arnest One Corp. | | | 304,500 | | | | 3,084,586 | | |
| Foster Electric Co., Ltd. | | | 144,700 | | | | 3,100,349 | | |
| SEB SA | | | 43,403 | | | | 3,180,850 | | |
| Household Durables Total | | | 9,365,785 | | |
| Leisure Equipment & Products – 0.4% | |
| Altek Corp. | | | 1,177,000 | | | | 1,728,488 | | |
| Leisure Equipment & Products Total | | | 1,728,488 | | |
| Specialty Retail – 2.6% | |
| EDION Corp. | | | 236,000 | | | | 1,624,052 | | |
| Game Group PLC | | | 2,354,112 | | | | 2,387,147 | | |
| USS Co., Ltd. | | | 54,510 | | | | 4,031,286 | | |
| Yamada Denki Co., Ltd. | | | 38,040 | | | | 2,367,069 | | |
| Specialty Retail Total | | | 10,409,554 | | |
| Textiles, Apparel & Luxury Goods – 2.3% | |
| Adidas AG | | | 73,882 | | | | 3,749,871 | | |
| LG Fashion Corp. | | | 141,930 | | | | 3,528,192 | | |
| Youngone Corp. | | | 260,400 | | | | 2,083,619 | | |
| Textiles, Apparel & Luxury Goods Total | | | 9,361,682 | | |
| Consumer Discretionary Total | | | 39,658,259 | | |
| Consumer Staples – 9.1% | |
| Beverages – 2.4% | |
| Carlsberg A/S, Class B | | | 60,854 | | | | 5,717,236 | | |
| Cott Corp. (a)(b) | | | 580,228 | | | | 4,003,573 | | |
| Beverages Total | | | 9,720,809 | | |
| Food & Staples Retailing – 2.8% | |
| George Weston Ltd. | | | 31,000 | | | | 2,372,495 | | |
| Koninklijke Ahold NV | | | 355,385 | | | | 4,365,893 | | |
| Seven & I Holdings Co., Ltd. | | | 199,400 | | | | 4,548,440 | | |
| Food & Staples Retailing Total | | | 11,286,828 | | |
| Food Products – 3.5% | |
| Balrampur Chini Mills Ltd. | | | 1,154,276 | | | | 2,062,329 | | |
China Milk Products
Group Ltd. (a)(c) | | | 7,540,000 | | | | 389,377 | | |
| Marine Harvest ASA | | | 5,003,867 | | | | 3,800,307 | | |
| | | Shares | | Value ($) | |
| Nestle SA, Registered Shares | | | 89,674 | | | | 4,637,708 | | |
| Parmalat SpA | | | 1,511,854 | | | | 3,625,846 | | |
| Food Products Total | | | 14,515,567 | | |
| Household Products – 0.4% | |
| Mcbride PLC | | | 700,895 | | | | 1,496,927 | | |
| Household Products Total | | | 1,496,927 | | |
| Consumer Staples Total | | | 37,020,131 | | |
| Energy – 8.1% | |
| Energy Equipment & Services – 2.6% | |
| Core Laboratories NV | | | 27,182 | | | | 2,145,475 | | |
| Noble Corp. | | | 104,459 | | | | 3,250,764 | | |
| Shinko Plantech Co., Ltd. | | | 380,500 | | | | 2,992,703 | | |
| Tecnicas Reunidas SA | | | 39,782 | | | | 2,013,670 | | |
| Energy Equipment & Services Total | | | 10,402,612 | | |
| Oil, Gas & Consumable Fuels – 5.5% | |
| AWE Ltd. (a) | | | 2,200,185 | | | | 3,063,329 | | |
| BP PLC | | | 834,603 | | | | 4,847,641 | | |
| Japan Petroleum Exploration Co. | | | 50,100 | | | | 1,803,583 | | |
| Rosneft Oil Co., GDR | | | 313,135 | | | | 1,971,498 | | |
| Royal Dutch Shell PLC, Class B | | | 163,878 | | | | 4,176,723 | | |
| Total SA | | | 93,967 | | | | 4,375,537 | | |
Yanzhou Coal Mining Co., Ltd.,
Class H | | | 1,038,000 | | | | 2,134,208 | | |
| Oil, Gas & Consumable Fuels Total | | | 22,372,519 | | |
| Energy Total | | | 32,775,131 | | |
| Financials – 23.7% | |
| Capital Markets – 3.3% | |
Credit Suisse Group AG,
Registered Shares | | | 64,368 | | | | 2,812,356 | | |
Deutsche Bank AG,
Registered Shares | | | 48,661 | | | | 3,056,448 | | |
| ICAP PLC | | | 395,601 | | | | 2,487,481 | | |
| Intermediate Capital Group PLC | | | 742,168 | | | | 3,093,318 | | |
Tokai Tokyo Financial
Holdings, Inc. | | | 548,000 | | | | 1,812,506 | | |
| Capital Markets Total | | | 13,262,109 | | |
| Commercial Banks – 10.9% | |
Australia & New Zealand
Banking Group Ltd. | | | 280,958 | | | | 5,683,541 | | |
Banco Bilbao Vizcaya
Argentaria SA | | | 398,088 | | | | 4,798,262 | | |
| Banco Santander SA | | | 651,192 | | | | 7,610,801 | | |
See Accompanying Notes to Financial Statements.
8
Columbia International Stock Fund
August 31, 2010
| Common Stocks (continued) | |
| | | Shares | | Value ($) | |
| Bank of China Ltd., Class H | | | 4,973,000 | | | | 2,508,850 | | |
| BNP Paribas | | | 82,466 | | | | 5,129,635 | | |
Governor & Co. of the Bank
of Ireland (a) | | | 2,908,385 | | | | 2,822,038 | | |
| HSBC Holdings PLC | | | 482,721 | | | | 4,755,909 | | |
| National Bank of Greece SA (a) | | | 169,398 | | | | 2,149,019 | | |
Sumitomo Mitsui Financial
Group, Inc. | | | 184,500 | | | | 5,481,470 | | |
Svenska Handelsbanken AB,
Class A | | | 123,987 | | | | 3,226,890 | | |
| Commercial Banks Total | | | 44,166,415 | | |
| Diversified Financial Services – 0.9% | |
| ING Groep NV (a) | | | 432,849 | | | | 3,826,950 | | |
| Diversified Financial Services Total | | | 3,826,950 | | |
| Insurance – 5.0% | |
| Allianz SE, Registered Shares | | | 27,410 | | | | 2,810,829 | | |
| Axis Capital Holdings Ltd. | | | 103,556 | | | | 3,197,809 | | |
| Brit Insurance Holdings NV | | | 244,763 | | | | 3,605,214 | | |
| Sampo Oyj, Class A | | | 188,641 | | | | 4,537,612 | | |
| XL Group PLC | | | 102,884 | | | | 1,842,652 | | |
Zurich Financial Services AG,
Registered Shares | | | 19,495 | | | | 4,342,019 | | |
| Insurance Total | | | 20,336,135 | | |
| Real Estate Investment Trusts (REITs) – 1.1% | |
Japan Retail Fund
Investment Corp. | | | 3,166 | | | | 4,237,230 | | |
Real Estate Investment Trusts
(REITs) Total | | | 4,237,230 | | |
| Real Estate Management & Development – 2.5% | |
| Hongkong Land Holdings Ltd. | | | 702,000 | | | | 3,767,184 | | |
| Huaku Development Co., Ltd. | | | 1,603,466 | | | | 4,157,144 | | |
| Swire Pacific Ltd., Class A | | | 185,300 | | | | 2,239,615 | | |
Real Estate Management &
Development Total | | | 10,163,943 | | |
| Financials Total | | | 95,992,782 | | |
| Health Care – 9.0% | |
| Biotechnology – 0.6% | |
| Amgen, Inc. (a) | | | 49,496 | | | | 2,526,276 | | |
| Biotechnology Total | | | 2,526,276 | | |
| Health Care Providers & Services – 1.1% | |
| Miraca Holdings, Inc. | | | 129,200 | | | | 4,323,781 | | |
| Health Care Providers & Services Total | | | 4,323,781 | | |
| | | Shares | | Value ($) | |
| Pharmaceuticals – 7.3% | |
| AstraZeneca PLC, ADR | | | 141,659 | | | | 7,002,204 | | |
| GlaxoSmithKline PLC | | | 214,910 | | | | 4,026,868 | | |
| Novartis AG, Registered Shares | | | 51,920 | | | | 2,723,294 | | |
Roche Holding AG, Genusschein
Shares | | | 48,175 | | | | 6,544,052 | | |
| Sanofi-Aventis SA | | | 108,915 | | | | 6,226,626 | | |
| Santen Pharmaceutical Co., Ltd. | | | 87,900 | | | | 3,147,492 | | |
| Pharmaceuticals Total | | | 29,670,536 | | |
| Health Care Total | | | 36,520,593 | | |
| Industrials – 11.3% | |
| Aerospace & Defense – 1.7% | |
| BAE Systems PLC | | | 887,807 | | | | 4,015,145 | | |
| MTU Aero Engines Holding AG | | | 51,143 | | | | 2,839,658 | | |
| Aerospace & Defense Total | | | 6,854,803 | | |
| Airlines – 0.5% | |
| Turk Hava Yollari A.O. (a) | | | 685,702 | | | | 2,151,437 | | |
| Airlines Total | | | 2,151,437 | | |
| Commercial Services & Supplies – 0.8% | |
| Aeon Delight Co., Ltd. | | | 171,400 | | | | 3,208,830 | | |
| Commercial Services & Supplies Total | | | 3,208,830 | | |
| Construction & Engineering – 1.4% | |
| CTCI Corp. | | | 2,472,000 | | | | 2,710,642 | | |
| Maire Tecnimont SpA | | | 910,875 | | | | 3,039,005 | | |
| Construction & Engineering Total | | | 5,749,647 | | |
| Electrical Equipment – 1.8% | |
| Mitsubishi Electric Corp. | | | 473,000 | | | | 3,787,408 | | |
| Schneider Electric SA | | | 34,748 | | | | 3,669,099 | | |
| Electrical Equipment Total | | | 7,456,507 | | |
| Industrial Conglomerates – 1.9% | |
| DCC PLC | | | 123,935 | | | | 3,099,893 | | |
| Tyco International Ltd. | | | 122,128 | | | | 4,552,932 | | |
| Industrial Conglomerates Total | | | 7,652,825 | | |
| Machinery – 0.5% | |
| Demag Cranes AG (a) | | | 69,249 | | | | 2,112,946 | | |
| Machinery Total | | | 2,112,946 | | |
| Professional Services – 0.8% | |
| Atkins WS PLC | | | 293,734 | | | | 3,065,644 | | |
| Professional Services Total | | | 3,065,644 | | |
| Trading Companies & Distributors – 1.9% | |
| ITOCHU Corp. | | | 364,700 | | | | 2,969,241 | | |
| Kloeckner & Co., SE (a) | | | 95,092 | | | | 1,844,348 | | |
See Accompanying Notes to Financial Statements.
9
Columbia International Stock Fund
August 31, 2010
| Common Stocks (continued) | |
| | | Shares | | Value ($) | |
| Mitsui & Co., Ltd. | | | 229,400 | | | | 2,997,794 | | |
| Trading Companies & Distributors Total | | | 7,811,383 | | |
| Industrials Total | | | 46,064,022 | | |
| Information Technology – 5.3% | |
| Electronic Equipment, Instruments & Components – 2.2% | |
| FUJIFILM Holdings Corp. | | | 113,800 | | | | 3,444,580 | | |
| Halma PLC | | | 545,339 | | | | 2,288,010 | | |
| Murata Manufacturing Co., Ltd. | | | 67,500 | | | | 3,203,711 | | |
Electronic Equipment, Instruments &
Components Total | | | 8,936,301 | | |
| Semiconductors & Semiconductor Equipment – 1.5% | |
| Macronix International | | | 3,802,000 | | | | 2,026,891 | | |
| MediaTek, Inc. | | | 171,349 | | | | 2,327,113 | | |
| Samsung Electronics Co., Ltd. | | | 3,023 | | | | 1,911,405 | | |
Semiconductors & Semiconductor
Equipment Total | | | 6,265,409 | | |
| Software – 1.6% | |
| Autonomy Corp. PLC (a) | | | 132,827 | | | | 3,168,711 | | |
| Nintendo Co., Ltd. | | | 11,600 | | | | 3,218,985 | | |
| Software Total | | | 6,387,696 | | |
| Information Technology Total | | | 21,589,406 | | |
| Materials – 9.9% | |
| Chemicals – 3.0% | |
| BASF SE | | | 117,458 | | | | 6,148,834 | | |
Clariant AG, Registered
Shares (a) | | | 285,694 | | | | 3,661,042 | | |
| Hitachi Chemical Co., Ltd. | | | 139,400 | | | | 2,412,455 | | |
| Chemicals Total | | | 12,222,331 | | |
| Construction Materials – 0.4% | |
| Ciments Francais SA | | | 20,197 | | | | 1,520,313 | | |
| Construction Materials Total | | | 1,520,313 | | |
| Metals & Mining – 5.6% | |
| Aurubis AG | | | 70,998 | | | | 2,812,633 | | |
| BHP Billiton PLC | | | 248,210 | | | | 6,945,200 | | |
| Centerra Gold, Inc. | | | 163,530 | | | | 2,295,723 | | |
| Eastern Platinum Ltd. (a) | | | 1,822,200 | | | | 1,828,437 | | |
| First Quantum Minerals Ltd. | | | 25,875 | | | | 1,491,813 | | |
Freeport-McMoRan Copper &
Gold, Inc. (b) | | | 25,567 | | | | 1,840,313 | | |
| OneSteel Ltd. | | | 751,684 | | | | 1,933,285 | | |
| Teck Resources Ltd., Class B | | | 47,415 | | | | 1,582,713 | | |
| | | Shares | | Value ($) | |
Thompson Creek Metals
Co., Inc. (a)(b) | | | 242,200 | | | | 2,073,696 | | |
| Metals & Mining Total | | | 22,803,813 | | |
| Paper & Forest Products – 0.9% | |
| Svenska Cellulosa AB, Class B | | | 269,619 | | | | 3,574,973 | | |
| Paper & Forest Products Total | | | 3,574,973 | | |
| Materials Total | | | 40,121,430 | | |
| Telecommunication Services – 6.4% | |
| Diversified Telecommunication Services – 2.8% | |
Bezeq Israeli Telecommunication
Corp., Ltd. | | | 1,270,034 | | | | 2,807,095 | | |
| Tele2 AB, Class B | | | 227,400 | | | | 4,083,015 | | |
| Telefonica SA | | | 90,929 | | | | 2,005,885 | | |
| Telenor ASA | | | 174,154 | | | | 2,543,498 | | |
Diversified Telecommunication
Services Total | | | 11,439,493 | | |
| Wireless Telecommunication Services – 3.6% | |
| Freenet AG | | | 394,927 | | | | 3,975,480 | | |
| NTT DoCoMo, Inc. | | | 1,333 | | | | 2,250,134 | | |
| Softbank Corp. | | | 158,500 | | | | 4,539,284 | | |
| Vivo Participacoes SA, ADR | | | 78,074 | | | | 1,873,776 | | |
| Vodafone Group PLC | | | 750,971 | | | | 1,813,693 | | |
Wireless Telecommunication
Services Total | | | 14,452,367 | | |
| Telecommunication Services Total | | | 25,891,860 | | |
| Utilities – 5.6% | |
| Electric Utilities – 1.7% | |
| Enel SpA | | | 521,301 | | | | 2,473,420 | | |
| Fortum Oyj | | | 194,228 | | | | 4,461,732 | | |
| Electric Utilities Total | | | 6,935,152 | | |
| Gas Utilities – 0.6% | |
PT Perusahaan Gas
Negara Tbk | | | 5,433,000 | | | | 2,413,154 | | |
| Gas Utilities Total | | | 2,413,154 | | |
| Independent Power Producers & Energy Traders – 1.3% | |
| International Power PLC | | | 936,396 | | | | 5,319,614 | | |
Independent Power Producers &
Energy Traders Total | | | 5,319,614 | | |
See Accompanying Notes to Financial Statements.
10
Columbia International Stock Fund
August 31, 2010
| Common Stocks (continued) | |
| | | Shares | | Value ($) | |
| Multi-Utilities – 2.0% | |
| AGL Energy Ltd. | | | 261,871 | | | | 3,503,565 | | |
| RWE AG | | | 70,827 | | | | 4,613,056 | | |
| Multi-Utilities Total | | | 8,116,621 | | |
| Utilities Total | | | 22,784,541 | | |
Total Common Stocks
(cost of $400,641,280) | | | 398,418,155 | | |
| Investment Company – 0.3% | |
| iShares MSCI EAFE Index Fund | | | 27,732 | | | | 1,385,213 | | |
Total Investment Company
(cost of $1,487,708) | | | 1,385,213 | | |
| Preferred Stock – 1.0% | |
| Consumer Staples – 1.0% | |
| Household Products – 1.0% | |
| Henkel AG & Co., KGaA | | | 87,880 | | | | 4,111,176 | | |
| Household Products Total | | | 4,111,176 | | |
| Consumer Staples Total | | | 4,111,176 | | |
Total Preferred Stock
(cost of $4,355,674) | | | 4,111,176 | | |
| Short-Term Obligation – 0.2% | |
| | | Par ($) | | | |
Repurchase agreement with
Fixed Income Clearing Corp.,
dated 08/31/10, due 09/01/10
at 0.180%, collateralized by a
U.S. Treasury obligation
maturing 05/31/17, market
value $689,813 (repurchase
proceeds $675,003) | | | 675,000 | | | | 675,000 | | |
Total Short-Term Obligation
(cost of $675,000) | | | 675,000 | | |
Total Investments – 99.7%
(cost of $407,159,662)(d) | | | 404,589,544 | | |
| Other Assets & Liabilities, Net – 0.3% | | | 1,136,923 | | |
| Net Assets – 100.0% | | | 405,726,467 | | |
Notes to Investment Portfolio:
(a) Non-income producing security.
(b) All or a portion of this security is pledged as collateral for open written options contracts.
(c) Represents fair value as determined in good faith under procedures approved by the Board of Trustees. At August 31, 2010, the value of this security amounted to $389,377, which represents 0.1% of net assets.
(d) Cost for federal income tax purposes is $414,189,951.
The following table summarizes the inputs used, as of August 31, 2010, in valuing the Fund's assets:
| Description | | Quoted
Prices
(Level 1) | | Other
Significant
Observable
Inputs
(Level 2) | | Significant
Unobservable
Inputs
(Level 3) | | Total | |
| Common Stocks | |
Consumer
Discretionary | | $ | — | | | $ | 39,658,259 | | | $ | — | | | $ | 39,658,259 | | |
| Consumer Staples | | | 6,376,068 | | | | 30,254,686 | | | | 389,377 | | | | 37,020,131 | | |
| Energy | | | 7,367,737 | | | | 25,407,394 | | | | — | | | | 32,775,131 | | |
| Financials | | | 8,807,645 | | | | 87,185,137 | | | | — | | | | 95,992,782 | | |
| Health Care | | | 9,528,480 | | | | 26,992,113 | | | | — | | | | 36,520,593 | | |
| Industrials | | | 4,552,932 | | | | 41,511,090 | | | | — | | | | 46,064,022 | | |
Information
Technology | | | — | | | | 21,589,406 | | | | — | | | | 21,589,406 | | |
| Materials | | | 11,112,695 | | | | 29,008,735 | | | | — | | | | 40,121,430 | | |
Telecommunication
Services | | | 1,873,776 | | | | 24,018,084 | | | | — | | | | 25,891,860 | | |
| Utilities | | | — | | | | 22,784,541 | | | | — | | | | 22,784,541 | | |
| Total Common Stocks | | | 49,619,333 | | | | 348,409,455 | | | | 389,377 | | | | 398,418,155 | | |
| Total Preferred Stock | | | — | | | | 4,111,176 | | | | — | | | | 4,111,176 | | |
Total Investment
Company | | | 1,385,213 | | | | — | | | | — | | | | 1,385,213 | | |
Total Short-Term
Obligation | | | — | | | | 675,000 | | | | — | | | | 675,000 | | |
| Total Investments | | | 51,004,546 | | | | 353,195,621 | | | | 389,377 | | | | 404,589,544 | | |
Value of Written Call
Option Contracts | | | (118,995 | ) | | | — | | | | — | | | | (118,995 | ) | |
Unrealized Appreciation
on Forward Foreign
Currency Exchange
Contracts | | | — | | | | 1,037,257 | | | | — | | | | 1,037,257 | | |
Unrealized Depreciation
on Forward Foreign
Currency Exchange
Contracts | | | — | | | | (693,940 | ) | | | — | | | | (693,940 | ) | |
| Total | | $ | 50,885,551 | | | $ | 353,538,938 | | | $ | 389,377 | | | $ | 404,813,866 | | |
The Fund's assets assigned to the Level 2 input category include certain foreign securities for which a third party statistical pricing service may be employed for purpose of fair valuation.
Certain short-term obligations may be valued using amortized cost, an income approach which converts future cash flows to a present value based upon the premium or discount at purchase.
See Accompanying Notes to Financial Statements.
11
Columbia International Stock Fund
August 31, 2010
The following table reconciles asset balances for the twelve months ending August 31, 2010, in which significant unobservable inputs (Level 3) were used in determining value:
Investments in
Securities | | Balance
as of
August 31,
2009 | | Realized
Gain
(Loss) | | Change in
Unrealized
Appreciation
(Depreciation) | | Purchases | | (Sales) | | Transfers
into
Level 3 | | Transfers
(out of)
Level 3 | | Balance
as of
August 31,
2010 | |
Common Stocks
Consumer Staples | | $ | — | | | $ | (42,422 | ) | | $ | (2,578,841 | ) | | $ | — | | | $ | (233,199 | ) | | $ | 3,243,839 | | | $ | — | | | $ | 389,377 | | |
The information in the above reconciliation represents fiscal year to date activity for any securities identified as using Level 3 inputs at either the beginning or the end of the current fiscal period.
The change in unrealized depreciation attributable to securities owned at August 31, 2010, which were valued using significant unobservable inputs (Level 3) amounted to $2,578,841. This amount is included in net change in unrealized appreciation (depreciation) on the Statement of Changes in Net Assets.
Financial assets were transferred from level 2 to level 3 as certain common stocks classified as Level 3 securities are valued using the market approach. To determine fair value for these securities, management considered various factors which may have included, but were not limited to, the halt price of the security, the movement in observed market prices for other securities from the issuer, the movement in certain foreign or domestic market indices, models utilized by the third party statistical pricing service, and the position of the security within the respective company's capital structure.
The following table shows transfers between Level 2 and Level 3 of the fair value hierarchy during the year ended August 31, 2010.
| Transfers In | | Transfers Out | |
| Level 2 | | Level 3 | | Level 2 | | Level 3 | |
| $ | — | | | $ | 3,243,839 | | | $ | 3,243,839 | | | $ | — | | |
For more information on valuation inputs, and their aggregation in to the levels used in the tables above, please refer to the Security Valuation section in the accompanying Notes to Financial Statements.
Risk Exposure/Type
At August 31, 2010, the Fund held the following written call option contracts:
Equity Risk
Written Call Options
| Name of Issuer | | Strike
Price | | Number of
Contracts | | Expiration
Date | | Premium | | Value | |
| Cott Corp. | | $ | 7.5 | | | | 5,802 | | | 09/18/10 | | $ | 23,207 | | | $ | (116,040 | ) | |
Freeport-McMoRan
Copper &
Gold, Inc. | | | 85.0 | | | | 255 | | | 09/18/10 | | | 7,673 | | | | (2,805 | ) | |
Thompson Creek
Metals Co., Inc. | | | 10.0 | | | | 15 | | | 09/18/10 | | | 135 | | | | (150 | ) | |
| Total written call options: (proceeds $31,015) | | $ | (118,995 | ) | |
For the year ended August 31, 2010, transactions in written option contracts were as follows:
| | | Number of
contracts | | Premium
received | |
| Options outstanding at August 31, 2009 | | | 2,754 | | | $ | 75,067 | | |
| Options written | | | 25,230 | | | | 594,133 | | |
Options terminated in closing
purchase transactions | | | (6,467 | ) | | | (197,679 | ) | |
| Options exercised | | | (1,636 | ) | | | (59,395 | ) | |
| Options expired | | | (13,809 | ) | | | (381,111 | ) | |
| Options outstanding at August 31, 2010 | | | 6,072 | | | $ | 31,015 | | |
Forward foreign currency exchange contracts outstanding on August 31, 2010, are:
Foreign Exchange Rate Risk
Forward
Foreign
Currency
Exchange
Contracts
to Buy | | Value | | Aggregate
Face Value | | Settlement
Date | | Unrealized
Appreciation
(Depreciation) | |
| AUD | | | | $ | 19,834,526 | | | $ | 20,014,671 | | | 11/18/10 | | $ | (180,145 | ) | |
| CHF | | | | | 7,697,206 | | | | 7,589,880 | | | 11/18/10 | | | 107,326 | | |
| EUR | | | | | 2,053,982 | | | | 2,086,535 | | | 11/18/10 | | | (32,553 | ) | |
| GBP | | | | | 22,533,207 | | | | 22,992,270 | | | 11/18/10 | | | (459,063 | ) | |
| JPY | | | | | 5,935,412 | | | | 5,844,962 | | | 11/18/10 | | | 90,450 | | |
| JPY | | | | | 2,874,155 | | | | 2,859,102 | | | 11/18/10 | | | 15,053 | | |
| SGD | | | | | 5,814,096 | | | | 5,834,968 | | | 11/18/10 | | | (20,872 | ) | |
| | | $ | (479,804 | ) | |
Forward
Foreign
Currency
Exchange
Contracts
to Sell | | Value | | Aggregate
Face Value | | Settlement
Date | | Unrealized
Appreciation
(Depreciation) | |
| AUD | | | | $ | 1,616,878 | | | $ | 1,615,571 | | | 11/18/10 | | $ | (1,307 | ) | |
| CAD | | | | | 14,881,171 | | | | 15,375,088 | | | 11/18/10 | | | 493,917 | | |
| DKK | | | | | 1,233,273 | | | | 1,252,204 | | | 11/18/10 | | | 18,931 | | |
| DKK | | | | | 1,225,613 | | | | 1,229,172 | | | 11/18/10 | | | 3,559 | | |
| EUR | | | | | 1,624,432 | | | | 1,630,768 | | | 11/18/10 | | | 6,336 | | |
| KRW | | | | | 7,332,698 | | | | 7,489,253 | | | 11/18/10 | | | 156,555 | | |
| NOK | | | | | 3,257,539 | | | | 3,338,890 | | | 11/18/10 | | | 81,351 | | |
| SEK | | | | | 1,241,551 | | | | 1,248,845 | | | 11/18/10 | | | 7,294 | | |
| TWD | | | | | 12,836,301 | | | | 12,892,786 | | | 11/18/10 | | | 56,485 | | |
| | | $ | 823,121 | | |
See Accompanying Notes to Financial Statements.
12
Columbia International Stock Fund
August 31, 2010
The Fund was invested in the following countries at August 31, 2010:
Summary of Securities
by Country (Unaudited) | | Value | | % of Total
Investments | |
| Japan | | $ | 81,121,887 | | | | 20.0 | | |
| United Kingdom | | | 64,495,450 | | | | 15.9 | | |
| Germany | | | 38,075,278 | | | | 9.4 | | |
| Switzerland | | | 24,720,471 | | | | 6.1 | | |
| France | | | 24,102,061 | | | | 6.0 | | |
| United States* | | | 19,270,959 | | | | 4.7 | | |
| Spain | | | 16,428,618 | | | | 4.1 | | |
| Canada | | | 15,648,450 | | | | 3.9 | | |
| Australia | | | 14,183,720 | | | | 3.5 | | |
| Taiwan | | | 12,950,278 | | | | 3.2 | | |
| Sweden | | | 10,884,878 | | | | 2.7 | | |
| Netherlands | | | 10,338,318 | | | | 2.5 | | |
| Italy | | | 9,138,270 | | | | 2.3 | | |
| Finland | | | 8,999,344 | | | | 2.2 | | |
| Korea, Republic Of | | | 7,523,216 | | | | 1.9 | | |
| Norway | | | 6,343,806 | | | | 1.6 | | |
| Hong Kong | | | 6,006,799 | | | | 1.5 | | |
| Ireland | | | 5,921,931 | | | | 1.5 | | |
| Denmark | | | 5,717,236 | | | | 1.4 | | |
| China | | | 5,032,434 | | | | 1.2 | | |
| Greece | | | 4,406,851 | | | | 1.1 | | |
| Israel | | | 2,807,095 | | | | 0.7 | | |
| Indonesia | | | 2,413,154 | | | | 0.6 | | |
| Turkey | | | 2,151,437 | | | | 0.5 | | |
| India | | | 2,062,329 | | | | 0.5 | | |
| Russia | | | 1,971,498 | | | | 0.5 | | |
| Brazil | | | 1,873,776 | | | | 0.5 | | |
| | | $ | 404,589,544 | | | | 100.0 | | |
* Includes short-term obligation and investment company.
Certain securities are listed by country of underlying exposure but may trade predominantly on another exchange.
| Acronym | | Name | |
| ADR | | American Depositary Receipt | |
|
| AUD | | Australian Dollar | |
|
| CAD | | Canadian Dollar | |
|
| CHF | | Swiss Franc | |
|
| DKK | | Danish Krone | |
|
| EUR | | Euro | |
|
| GBP | | Pound Sterling | |
|
| GDR | | Global Depositary Receipt | |
|
| JPY | | Japanese Yen | |
|
| KRW | | South Korean Won | |
|
| NOK | | Norwegian Krone | |
|
| SEK | | Swedish Krona | |
|
| SGD | | Singapore Dollar | |
|
| TWD | | New Taiwan Dollar | |
|
See Accompanying Notes to Financial Statements.
13
Statement of Assets and Liabilities – Columbia International Stock Fund
August 31, 2010
| | | | | ($) | |
| Assets | | Investments, at identified cost | | | 407,159,662 | | |
| | | Investments, at value | | | 404,589,544 | | |
| | | Cash | | | 983 | | |
| | | Foreign currency (cost of $706,850) | | | 706,387 | | |
| | | Unrealized appreciation on forward foreign currency exchange contracts | | | 1,037,257 | | |
| | | Receivable for: | | | | | |
| | | Investments sold | | | 1,757,166 | | |
| | | Fund shares sold | | | 220,995 | | |
| | | Dividends | | | 1,003,418 | | |
| | | Interest | | | 3 | | |
| | | Foreign tax reclaims | | | 372,587 | | |
| | | Expense reimbursement due from investment advisor | | | 12,305 | | |
| | | Trustees' deferred compensation plan | | | 99,762 | | |
| | | Prepaid expenses | | | 11,581 | | |
| | | Total Assets | | | 409,811,988 | | |
| Liabilities | | Written options, at value (premium of $31,015) | | | 118,995 | | |
| | | Unrealized depreciation on forward foreign currency exchange contracts | | | 693,940 | | |
| | | Payable for: | | | | | |
| | | Investments purchased | | | 1,650,736 | | |
| | | Fund shares repurchased | | | 741,167 | | |
| | | Investment advisory fee | | | 313,627 | | |
| | | Pricing and bookkeeping fees | | | 10,609 | | |
| | | Transfer agent fee | | | 87,635 | | |
| | | Trustees' fees | | | 50 | | |
| | | Custody fee | | | 49,501 | | |
| | | Distribution and service fees | | | 38,957 | | |
| | | Chief compliance officer expenses | | | 205 | | |
| | | Trustees' deferred compensation plan | | | 99,762 | | |
| | | Other liabilities | | | 280,337 | | |
| | | Total Liabilities | | | 4,085,521 | | |
| | | Net Assets | | | 405,726,467 | | |
| Net Assets Consist of | | Paid-in capital | | | 638,922,892 | | |
| | | Overdistributed net investment income | | | (2,574,754 | ) | |
| | | Accumulated net realized loss | | | (228,306,052 | ) | |
| | | Net unrealized appreciation (depreciation) on: | | | | | |
| | | Investments | | | (2,570,118 | ) | |
| | | Foreign currency translations | | | 342,479 | | |
| | | Written options | | | (87,980 | ) | |
| | | Net Assets | | | 405,726,467 | | |
See Accompanying Notes to Financial Statements.
14
Statement of Assets and Liabilities (continued) – Columbia International Stock Fund
August 31, 2010
| Class A | | Net assets | | $ | 122,502,047 | | |
| | | Shares outstanding | | | 12,001,383 | | |
| | | Net asset value per share | | $ | 10.21 | (a) | |
| | | Maximum sales charge | | | 5.75 | % | |
| | | Maximum offering price per share ($10.21/0.9425) | | $ | 10.83 | (b) | |
| Class B | | Net assets | | $ | 3,817,565 | | |
| | | Shares outstanding | | | 388,740 | | |
| | | Net asset value and offering price per share | | $ | 9.82 | (a) | |
| Class C | | Net assets | | $ | 9,691,383 | | |
| | | Shares outstanding | | | 981,235 | | |
| | | Net asset value and offering price per share | | $ | 9.88 | (a) | |
| Class Y | | Net assets | | $ | 15,443,725 | | |
| | | Shares outstanding | | | 1,494,737 | | |
| | | Net asset value and offering price per share | | $ | 10.33 | | |
| Class Z | | Net assets | | $ | 254,271,747 | | |
| | | Shares outstanding | | | 24,607,020 | | |
| | | Net asset value and offering price per share | | $ | 10.33 | | |
(a) Redemption price per share is equal to net asset value less any applicable contingent deferred sales charge.
(b) On sales of $50,000 or more the offering price is reduced.
See Accompanying Notes to Financial Statements.
15
Statement of Operations – Columbia International Stock Fund
For the Year Ended August 31, 2010
| | | | | ($) | |
| Investment Income | | Dividends | | | 16,194,548 | | |
| | | Interest | | | 7,233 | | |
| | | Foreign taxes withheld | | | (1,714,333 | ) | |
| | | Total Investment Income | | | 14,487,448 | | |
| Expenses | | Investment advisory fee | | | 4,390,935 | | |
| | | Distribution fee: | | | | | |
| | | Class B | | | 39,345 | | |
| | | Class C | | | 85,602 | | |
| | | Service fee: | | | | | |
| | | Class A | | | 352,581 | | |
| | | Class B | | | 13,104 | | |
| | | Class C | | | 28,534 | | |
| | | Transfer agent fee: Class A, Class B, Class C, Class Z | | | 785,219 | | |
| | | Transfer agent fee: Class Y | | | 50 | | |
| | | Pricing and bookkeeping fees | | | 127,617 | | |
| | | Trustees' fees | | | 40,156 | | |
| | | Custody fee | | | 310,853 | | |
| | | Chief compliance officer expenses | | | 1,184 | | |
| | | Other expenses | | | 361,961 | | |
| | | Expenses before interest expense | | | 6,537,141 | | |
| | | Interest expense | | | 7,487 | | |
| | | Total Expenses | | | 6,544,628 | | |
| | | Fees waived or expenses reimbursed by investment advisor | | | (215,220 | ) | |
| | | Expense reductions | | | (3 | ) | |
| | | Net Expenses | | | 6,329,405 | | |
| | | Net Investment Income | | | 8,158,043 | | |
| Net Realized and Unrealized Gain (Loss) on Investments, Futures Contracts, Foreign Currency and Written Options | |
| | | Net realized gain (loss) on: | | | | | |
| | | Investments | | | 13,483,147 | | |
| | | Futures contracts | | | (153,907 | ) | |
| | | Foreign currency transactions and forward foreign currency
exchange contracts | | | (2,961,295 | ) | |
| | | Written options | | | 502,198 | | |
| | | Net realized gain | | | 10,870,143 | | |
| | | Net change in unrealized appreciation (depreciation) on: | | | | | |
| | | Investments | | | (39,940,355 | ) | |
| | | Foreign currency translations and forward foreign currency
exchange contracts | | | (1,206,708 | ) | |
| | | Written options | | | (121,737 | ) | |
| | | Net change in unrealized appreciation (depreciation) | | | (41,268,800 | ) | |
| | | Net Loss | | | (30,398,657 | ) | |
| | | Net Decrease Resulting from Operations | | | (22,240,614 | ) | |
See Accompanying Notes to Financial Statements.
16
Statement of Changes in Net Assets – Columbia International Stock Fund
| | | | | Year Ended August 31, | |
| Increase (Decrease) in Net Assets | | | | 2010 ($) | | 2009 ($)(a)(b) | |
| Operations | | Net investment income | | | 8,158,043 | | | | 12,573,567 | | |
| | | Net realized gain (loss) on investments, futures contracts,
foreign currency transactions, forward foreign currency
exchange contracts and written options | | | 10,870,143 | | | | (251,703,658 | ) | |
| | | Net change in unrealized appreciation (depreciation)
on investments, foreign currency translations and
written options | | | (41,268,800 | ) | | | 46,682,086 | | |
| | | Net decrease resulting from operations | | | (22,240,614 | ) | | | (192,448,005 | ) | |
| Distributions to Shareholders | | From net investment income: | | | | | | | | | |
| | | Class A | | | (4,501,763 | ) | | | — | | |
| | | Class B | | | (131,339 | ) | | | — | | |
| | | Class C | | | (269,778 | ) | | | — | | |
| | | Class Y | | | (1,059,827 | ) | | | — | | |
| | | Class Z | | | (11,584,228 | ) | | | — | | |
| | | From net realized gains: | | | | | | | | | |
| | | Class A | | | — | | | | (6,159,742 | ) | |
| | | Class B | | | — | | | | (334,111 | ) | |
| | | Class C | | | — | | | | (536,917 | ) | |
| | | Class Z | | | — | | | | (15,741,630 | ) | |
| | | Total distributions to shareholders | | | (17,546,935 | ) | | | (22,772,400 | ) | |
| | | Net Capital Stock Transactions | | | (124,829,289 | ) | | | (110,942,583 | ) | |
| | | Redemption fees | | | 6,287 | | | | 8,875 | | |
| | | Increase from regulatory settlements | | | 322,140 | | | | 7,166,056 | | |
| | | Total decrease in net assets | | | (164,288,411 | ) | | | (318,988,057 | ) | |
| Net Assets | | Beginning of period | | | 570,014,878 | | | | 889,002,935 | | |
| | | End of period | | | 405,726,467 | | | | 570,014,878 | | |
| | | Undistributed (overdistributed) net investment income
at end of period | | | (2,574,754 | ) | | | 8,468,703 | | |
(a) Class Y shares commenced operations on July 15, 2009.
(b) Class Y shares reflect activity for the period July 15, 2009 through August 31, 2009.
See Accompanying Notes to Financial Statements.
17
Statement of Changes in Net Assets (continued) – Columbia International
Stock Fund
| | | Capital Stock Activity | |
| | | Year Ended
August 31, 2010 | | Year Ended
August 31, 2009 (a)(b) | |
| | | Shares | | Dollars ($) | | Shares | | Dollars ($) | |
| Class A | |
| Subscriptions | | | 347,905 | | | | 3,851,300 | | | | 516,883 | | | | 4,695,613 | | |
| Distributions reinvested | | | 363,963 | | | | 4,014,516 | | | | 637,490 | | | | 5,520,581 | | |
| Redemptions | | | (2,228,143 | ) | | | (24,386,379 | ) | | | (3,223,832 | ) | | | (29,220,643 | ) | |
| Net decrease | | | (1,516,275 | ) | | | (16,520,563 | ) | | | (2,069,459 | ) | | | (19,004,449 | ) | |
| Class B | |
| Subscriptions | | | 30,573 | | | | 331,497 | | | | 53,826 | | | | 477,504 | | |
| Distributions reinvested | | | 10,460 | | | | 111,606 | | | | 34,698 | | | | 290,772 | | |
| Redemptions | | | (248,327 | ) | | | (2,639,874 | ) | | | (490,621 | ) | | | (4,372,977 | ) | |
| Net decrease | | | (207,294 | ) | | | (2,196,771 | ) | | | (402,097 | ) | | | (3,604,701 | ) | |
| Class C | |
| Subscriptions | | | 44,958 | | | | 491,010 | | | | 60,419 | | | | 547,251 | | |
| Distributions reinvested | | | 19,792 | | | | 212,370 | | | | 48,757 | | | | 410,531 | | |
| Redemptions | | | (253,394 | ) | | | (2,732,776 | ) | | | (397,869 | ) | | | (3,664,430 | ) | |
| Net decrease | | | (188,644 | ) | | | (2,029,396 | ) | | | (288,693 | ) | | | (2,706,648 | ) | |
| Class Y | |
| Subscriptions | | | 328,119 | | | | 3,677,237 | | | | 2,967,379 | | | | 31,160,000 | | |
| Distributions reinvested | | | 36 | | | | 397 | | | | — | | | | — | | |
| Redemptions | | | (1,561,104 | ) | | | (17,682,667 | ) | | | (239,693 | ) | | | (2,583,893 | ) | |
| Net increase (decrease) | | | (1,232,949 | ) | | | (14,005,033 | ) | | | 2,727,686 | | | | 28,576,107 | | |
| Class Z | |
| Subscriptions | | | 2,591,068 | | | | 28,737,156 | | | | 5,611,403 | | | | 52,602,683 | | |
| Distributions reinvested | | | 258,384 | | | | 2,880,935 | | | | 826,429 | | | | 7,239,240 | | |
| Redemptions | | | (10,951,066 | ) | | | (121,695,617 | ) | | | (18,754,823 | ) | | | (174,044,815 | ) | |
| Net decrease | | | (8,101,614 | ) | | | (90,077,526 | ) | | | (12,316,991 | ) | | | (114,202,892 | ) | |
(a) Class Y shares commenced operations on July 15, 2009.
(b) Class Y shares reflect activity for the period July 15, 2009 through August 31, 2009.
See Accompanying Notes to Financial Statements.
18
Financial Highlights – Columbia International Stock Fund
Selected data for a share outstanding throughout each period is as follows:
| | | Year Ended August 31, | |
| Class A Shares | | 2010 | | 2009 | | 2008 | | 2007 | | 2006 | |
| Net Asset Value, Beginning of Period | | $ | 11.15 | | | $ | 14.02 | | | $ | 19.93 | | | $ | 18.89 | | | $ | 15.76 | | |
| Income from Investment Operations: | |
| Net investment income (a) | | | 0.16 | | | | 0.22 | | | | 0.37 | (b) | | | 0.26 | | | | 0.26 | | |
Net realized and unrealized gain (loss) on investments,
futures contracts, foreign currency, foreign capital
gains tax and written options | | | (0.76 | ) | | | (2.81 | ) | | | (3.43 | ) | | | 3.04 | | | | 3.17 | | |
| Total from investment operations | | | (0.60 | ) | | | (2.59 | ) | | | (3.06 | ) | | | 3.30 | | | | 3.43 | | |
| Less Distributions to Shareholders: | |
| From net investment income | | | (0.34 | ) | | | — | | | | (0.64 | ) | | | (0.29 | ) | | | (0.13 | ) | |
| From net realized gains | | | — | | | | (0.42 | ) | | | (2.21 | ) | | | (1.97 | ) | | | (0.17 | ) | |
| Total distributions to shareholders | | | (0.34 | ) | | | (0.42 | ) | | | (2.85 | ) | | | (2.26 | ) | | | (0.30 | ) | |
| Redemption Fees: | |
| Redemption fees added to paid-in-capital (a)(c) | | | — | | | | — | | | | — | | | | — | | | | — | | |
| Increase from regulatory settlements | | | — | (c) | | | 0.14 | | | | — | | | | — | | | | — | | |
| Net Asset Value, End of Period | | $ | 10.21 | | | $ | 11.15 | | | $ | 14.02 | | | $ | 19.93 | | | $ | 18.89 | | |
| Total return (d)(e) | | | (5.57 | )% | | | (16.59 | )% | | | (17.74 | )% | | | 18.46 | %(f) | | | 21.98 | % | |
| Ratios to Average Net Assets/Supplemental Data: | |
| Net expenses before interest expense (g) | | | 1.40 | % | | | 1.41 | % | | | 1.23 | % | | | 1.24 | % | | | 1.19 | % | |
| Interest expense (h) | | | — | % | | | — | % | | | — | % | | | — | % | | | — | % | |
| Net expenses (g) | | | 1.40 | % | | | 1.41 | % | | | 1.23 | % | | | 1.24 | % | | | 1.19 | % | |
| Waiver/Reimbursement | | | 0.05 | % | | | 0.06 | % | | | 0.09 | % | | | 0.10 | % | | | 0.08 | % | |
| Net investment income (g) | | | 1.49 | % | | | 2.37 | % | | | 2.17 | % | | | 1.33 | % | | | 1.49 | % | |
| Portfolio turnover rate | | | 75 | % | | | 118 | % | | | 63 | % | | | 65 | % | | | 95 | % | |
| Net assets, end of period (000s) | | $ | 122,502 | | | $ | 150,743 | | | $ | 218,484 | | | $ | 297,149 | | | $ | 277,295 | | |
(a) Per share data was calculated using the average shares outstanding during the period.
(b) Net investment income per share reflects a special dividend. The effect of this dividend amounted to $0.04 per share.
(c) Rounds to less than $0.01 per share.
(d) Total return at net asset value assuming all distributions reinvested and no initial sales charge or contingent deferred sales charge.
(e) Had the investment advisor and/or any of its affiliates not waived fees or reimbursed a portion of expenses, total return would have been reduced.
(f) Total return includes a voluntary reimbursement by the investment advisor for a realized investment loss due to a trading error. This reimbursement increased total return and net asset value per share by less than 0.01% and less than $0.01, respectively.
(g) The benefits derived from expense reductions had an impact of less than 0.01%.
(h) Rounds to less than 0.01%.
See Accompanying Notes to Financial Statements.
19
Financial Highlights – Columbia International Stock Fund
Selected data for a share outstanding throughout each period is as follows:
| | | Year Ended August 31, | |
| Class B Shares | | 2010 | | 2009 | | 2008 | | 2007 | | 2006 | |
| Net Asset Value, Beginning of Period | | $ | 10.72 | | | $ | 13.61 | | | $ | 19.40 | | | $ | 18.44 | | | $ | 15.37 | | |
| Income from Investment Operations: | |
| Net investment income (a) | | | 0.07 | | | | 0.14 | | | | 0.20 | (b) | | | 0.09 | | | | 0.11 | | |
Net realized and unrealized gain (loss) on investments,
futures contracts, foreign currency, foreign capital
gains tax and written options | | | (0.72 | ) | | | (2.73 | ) | | | (3.29 | ) | | | 2.99 | | | | 3.14 | | |
| Total from investment operations | | | (0.65 | ) | | | (2.59 | ) | | | (3.09 | ) | | | 3.08 | | | | 3.25 | | |
| Less Distributions to Shareholders: | |
| From net investment income | | | (0.25 | ) | | | — | | | | (0.49 | ) | | | (0.15 | ) | | | (0.01 | ) | |
| From net realized gains | | | — | | | | (0.42 | ) | | | (2.21 | ) | | | (1.97 | ) | | | (0.17 | ) | |
| Total distributions to shareholders | | | (0.25 | ) | | | (0.42 | ) | | | (2.70 | ) | | | (2.12 | ) | | | (0.18 | ) | |
| Redemption Fees: | |
| Redemption fees added to paid-in-capital (a)(c) | | | — | | | | — | | | | — | | | | — | | | | — | | |
| Increase from regulatory settlements | | | — | (c) | | | 0.12 | | | | — | | | | — | | | | — | | |
| Net Asset Value, End of Period | | $ | 9.82 | | | $ | 10.72 | | | $ | 13.61 | | | $ | 19.40 | | | $ | 18.44 | | |
| Total return (d)(e) | | | (6.29 | )% | | | (17.26 | )% | | | (18.31 | )% | | | 17.54 | %(f) | | | 21.30 | % | |
| Ratios to Average Net Assets/Supplemental Data: | |
| Net expenses before interest expense (g) | | | 2.15 | % | | | 2.16 | % | | | 1.98 | % | | | 1.99 | % | | | 1.94 | % | |
| Interest expense (h) | | | — | % | | | — | % | | | — | % | | | — | % | | | — | % | |
| Net expenses (g) | | | 2.15 | % | | | 2.16 | % | | | 1.98 | % | | | 1.99 | % | | | 1.94 | % | |
| Waiver/Reimbursement | | | 0.05 | % | | | 0.06 | % | | | 0.09 | % | | | 0.10 | % | | | 0.08 | % | |
| Net investment income (g) | | | 0.66 | % | | | 1.57 | % | | | 1.18 | % | | | 0.49 | % | | | 0.62 | % | |
| Portfolio turnover rate | | | 75 | % | | | 118 | % | | | 63 | % | | | 65 | % | | | 95 | % | |
| Net assets, end of period (000s) | | $ | 3,818 | | | $ | 6,392 | | | $ | 13,580 | | | $ | 29,925 | | | $ | 42,585 | | |
(a) Per share data was calculated using the average shares outstanding during the period.
(b) Net investment income per share reflects a special dividend. The effect of this dividend amounted to $0.04 per share.
(c) Rounds to less than $0.01 per share.
(d) Total return at net asset value assuming all distributions reinvested and no contingent deferred sales charge.
(e) Had the investment advisor and/or any of its affiliates not waived fees or reimbursed a portion of expenses, total return would have been reduced.
(f) Total return includes a voluntary reimbursement by the investment advisor for a realized investment loss due to a trading error. This reimbursement increased total return and net asset value per share by less than 0.01% and less than $0.01, respectively.
(g) The benefits derived from expense reductions had an impact of less than 0.01%.
(h) Rounds to less than 0.01%.
See Accompanying Notes to Financial Statements.
20
Financial Highlights – Columbia International Stock Fund
Selected data for a share outstanding throughout each period is as follows:
| | | Year Ended August 31, | |
| Class C Shares | | 2010 | | 2009 | | 2008 | | 2007 | | 2006 | |
| Net Asset Value, Beginning of Period | | $ | 10.78 | | | $ | 13.68 | | | $ | 19.49 | | | $ | 18.51 | | | $ | 15.43 | | |
| Income from Investment Operations: | |
| Net investment income (a) | | | 0.08 | | | | 0.15 | | | | 0.23 | (b) | | | 0.11 | | | | 0.13 | | |
Net realized and unrealized gain (loss) on investments,
futures contracts, foreign currency, foreign capital
gains tax and written options | | | (0.73 | ) | | | (2.76 | ) | | | (3.34 | ) | | | 2.99 | | | | 3.13 | | |
| Total from investment operations | | | (0.65 | ) | | | (2.61 | ) | | | (3.11 | ) | | | 3.10 | | | | 3.26 | | |
| Less Distributions to Shareholders: | |
| From net investment income | | | (0.25 | ) | | | — | | | | (0.49 | ) | | | (0.15 | ) | | | (0.01 | ) | |
| From net realized gains | | | — | | | | (0.42 | ) | | | (2.21 | ) | | | (1.97 | ) | | | (0.17 | ) | |
| Total distributions to shareholders | | | (0.25 | ) | | | (0.42 | ) | | | (2.70 | ) | | | (2.12 | ) | | | (0.18 | ) | |
| Redemption Fees: | |
| Redemption fees added to paid-in-capital (a)(c) | | | — | | | | — | | | | — | | | | — | | | | — | | |
| Increase from regulatory settlements | | | — | (c) | | | 0.13 | | | | — | | | | — | | | | — | | |
| Net Asset Value, End of Period | | $ | 9.88 | | | $ | 10.78 | | | $ | 13.68 | | | $ | 19.49 | | | $ | 18.51 | | |
| Total return (d)(e) | | | (6.25 | )% | | | (17.24 | )% | | | (18.33 | )% | | | 17.59 | %(f) | | | 21.28 | % | |
| Ratios to Average Net Assets/Supplemental Data: | |
| Net expenses before interest expense (g) | | | 2.15 | % | | | 2.16 | % | | | 1.98 | % | | | 1.99 | % | | | 1.94 | % | |
| Interest expense (h) | | | — | % | | | — | % | | | — | % | | | — | % | | | — | % | |
| Net expenses (g) | | | 2.15 | % | | | 2.16 | % | | | 1.98 | % | | | 1.99 | % | | | 1.94 | % | |
| Waiver/Reimbursement | | | 0.05 | % | | | 0.06 | % | | | 0.09 | % | | | 0.10 | % | | | 0.08 | % | |
| Net investment income (g) | | | 0.72 | % | | | 1.63 | % | | | 1.38 | % | | | 0.57 | % | | | 0.75 | % | |
| Portfolio turnover rate | | | 75 | % | | | 118 | % | | | 63 | % | | | 65 | % | | | 95 | % | |
| Net assets, end of period (000s) | | $ | 9,691 | | | $ | 12,615 | | | $ | 19,946 | | | $ | 29,144 | | | $ | 27,806 | | |
(a) Per share data was calculated using the average shares outstanding during the period.
(b) Net investment income per share reflects a special dividend. The effect of this dividend amounted to $0.04 per share.
(c) Rounds to less than $0.01 per share.
(d) Total return at net asset value assuming all distributions reinvested and no contingent deferred sales charge.
(e) Had the investment advisor and/or any of its affiliates not waived fees or reimbursed a portion of expenses, total return would have been reduced.
(f) Total return includes a voluntary reimbursement by the investment advisor for a realized investment loss due to a trading error. This reimbursement increased total return and net asset value per share by less than 0.01% and less than $0.01, respectively.
(g) The benefits derived from expense reductions had an impact of less than 0.01%.
(h) Rounds to less than 0.01%.
See Accompanying Notes to Financial Statements.
21
Financial Highlights – Columbia International Stock Fund
Selected data for a share outstanding throughout each period is as follows:
| Class Y Shares | | Year Ended
August 31,
2010 | | Period Ended
August 31,
2009 (a) | |
| Net Asset Value, Beginning of Period | | $ | 11.30 | | | $ | 10.06 | | |
| Income from Investment Operations: | |
| Net investment income (b) | | | 0.18 | | | | 0.03 | | |
Net realized and unrealized gain (loss) on investments, futures contracts,
foreign currency and written options | | | (0.75 | ) | | | 1.21 | | |
| Total from investment operations | | | (0.57 | ) | | | 1.24 | | |
| Less Distributions to Shareholders: | |
| From net investment income | | | (0.40 | ) | | | — | | |
| Redemption Fees: | |
| Redemption fees added to paid-in-capital (b)(c) | | | — | | | | — | | |
| Increase from regulatory settlements | | | — | (c) | | | — | | |
| Net Asset Value, End of Period | | $ | 10.33 | | | $ | 11.30 | | |
| Total return (d) | | | (5.31 | )% | | | 12.33 | %(e) | |
| Ratios to Average Net Assets/Supplemental Data: | |
| Net expenses before interest expense (f) | | | 1.03 | % | | | 0.99 | %(g) | |
| Interest expense (h) | | | — | % | | | — | %(g) | |
| Net expenses (f) | | | 1.03 | % | | | 0.99 | %(g) | |
| Net investment income (f) | | | 1.59 | % | | | 2.05 | %(g) | |
| Portfolio turnover rate | | | 75 | % | | | 118 | %(e) | |
| Net assets, end of period (000s) | | $ | 15,444 | | | $ | 30,818 | | |
(a) Class Y shares commenced operations on July 15, 2009. Per share data and total return reflect activity from that date.
(b) Per share data was calculated using the average shares outstanding during the period.
(c) Rounds to less than $0.01 per share.
(d) Total return at net asset value assuming all distributions reinvested.
(e) Not annualized.
(f) The benefits derived from expense reductions had an impact of less than 0.01%.
(g) Annualized.
(h) Rounds to less than 0.01%.
See Accompanying Notes to Financial Statements.
22
Financial Highlights – Columbia International Stock Fund
Selected data for a share outstanding throughout each period is as follows:
| | | Year Ended August 31, | |
| Class Z Shares | | 2010 | | 2009 | | 2008 | | 2007 | | 2006 | |
| Net Asset Value, Beginning of Period | | $ | 11.30 | | | $ | 14.15 | | | $ | 20.09 | | | $ | 19.03 | | | $ | 15.85 | | |
| Income from Investment Operations: | |
| Net investment income (a) | | | 0.19 | | | | 0.24 | | | | 0.40 | (b) | | | 0.31 | | | | 0.29 | | |
Net realized and unrealized gain (loss) on investments,
futures contracts, written options, foreign capital gains
tax and foreign currency | | | (0.78 | ) | | | (2.80 | ) | | | (3.44 | ) | | | 3.06 | | | | 3.23 | | |
| Total from investment operations | | | (0.59 | ) | | | (2.56 | ) | | | (3.04 | ) | | | 3.37 | | | | 3.52 | | |
| Less Distributions to Shareholders: | |
| From net investment income | | | (0.38 | ) | | | — | | | | (0.69 | ) | | | (0.34 | ) | | | (0.17 | ) | |
| From net realized gains | | | — | | | | (0.42 | ) | | | (2.21 | ) | | | (1.97 | ) | | | (0.17 | ) | |
| Total distributions to shareholders | | | (0.38 | ) | | | (0.42 | ) | | | (2.90 | ) | | | (2.31 | ) | | | (0.34 | ) | |
| Redemption Fees: | |
| Redemption fees added to paid-in-capital (a)(c) | | | — | | | | — | | | | — | | | | — | | | | — | | |
| Increase from regulatory settlements | | | — | (c) | | | 0.13 | | | | — | | | | — | | | | — | | |
| Net Asset Value, End of Period | | $ | 10.33 | | | $ | 11.30 | | | $ | 14.15 | | | $ | 20.09 | | | $ | 19.03 | | |
| Total return (d)(e) | | | (5.48 | )% | | | (16.29 | )% | | | (17.52 | )% | | | 18.73 | %(f) | | | 22.45 | % | |
| Ratios to Average Net Assets/Supplemental Data: | |
| Net expenses before interest expense (g) | | | 1.15 | % | | | 1.16 | % | | | 0.98 | % | | | 0.99 | % | | | 0.94 | % | |
| Interest expense (h) | | | — | % | | | — | % | | | — | % | | | — | % | | | — | % | |
| Net expenses (g) | | | 1.15 | % | | | 1.16 | % | | | 0.98 | % | | | 0.99 | % | | | 0.94 | % | |
| Waiver/Reimbursement | | | 0.05 | % | | | 0.06 | % | | | 0.09 | % | | | 0.10 | % | | | 0.08 | % | |
| Net investment income (g) | | | 1.71 | % | | | 2.60 | % | | | 2.32 | % | | | 1.55 | % | | | 1.63 | % | |
| Portfolio turnover rate | | | 75 | % | | | 118 | % | | | 63 | % | | | 65 | % | | | 95 | % | |
| Net assets, end of period (000s) | | $ | 254,272 | | | $ | 369,448 | | | $ | 636,992 | | | $ | 1,011,212 | | | $ | 1,005,878 | | |
(a) Per share data was calculated using the average shares outstanding during the period.
(b) Net investment income per share reflects a special dividend. The effect of this dividend amounted to $0.04 per share.
(c) Rounds to less than $0.01 per share.
(d) Total return at net asset value assuming all distributions reinvested.
(e) Had the investment advisor and/or any of its affiliates not waived fees or reimbursed a portion of expenses, total return would have been reduced.
(f) Total return includes a voluntary reimbursement by the investment advisor for a realized investment loss due to a trading error. This reimbursement increased total return and net asset value per share by less than 0.01% and less than $0.01, respectively.
(g) The benefits derived from expense reductions had an impact of less than 0.01%.
(h) Rounds to less than 0.01%.
See Accompanying Notes to Financial Statements.
23
Notes to Financial Statements – Columbia International Stock Fund
August 31, 2010
Note 1. Organization
Columbia International Stock Fund (the "Fund"), a series of Columbia Funds Series Trust I (the "Trust"), is a diversified fund. The Trust is registered under the Investment Company Act of 1940, as amended (the "1940 Act"), as an open-end management investment company organized as a Massachusetts business trust.
Investment Objective
The Fund seeks long-term capital appreciation.
Fund Shares
The Trust may issue an unlimited number of shares, and the Fund offers five classes of shares: Class A, Class B, Class C, Class Y and Class Z. Each share class has its own expense structure and sales charges, as applicable. The Fund no longer accepts investments from new or existing investors in the Fund's Class B shares, except in connection with the reinvestment of any dividend and/or capital gain distributions in Class B shares of the Fund and exchanges by existing Class B shareholders of the other Columbia Funds.
Class A shares are subject to a maximum front-end sales charge of 5.75% based on the amount of initial investment. Class A shares purchased without an initial sales charge in accounts aggregating $1 million to $50 million at the time of purchase are subject to a 1.00% contingent deferred sales charge ("CDSC") if the shares are sold within one year after purchase. Class B shares are subject to a maximum CDSC of 5.00% based upon the holding period after purchase. Class B shares will convert to Class A shares eight years after purchase. Class C shares are subject to a 1.00% CDSC on shares sold within one year after purchase. Class Y and Class Z shares are offered continuously at net asset value. There are certain restrictions on the purchase of Class Y and Class Z shares, as described in the Fund's prospectus.
Note 2. Significant Accounting Policies
The preparation of financial statements in accordance with accounting principles generally accepted in the United States of America ("GAAP") requires management to make certain estimates and assumptions that affect the reported amounts of assets and liabilities, the disclosure of contingent assets and liabilities at the date of the financial statements and the reported amounts of revenue and expenses during the reporting period. Actual results could differ from those estimates.
Management has evaluated the events and transactions that have occurred through the date the financial statements were issued and noted no items requiring adjustment of the financial statements or additional disclosures.
The following is a summary of significant accounting policies consistently followed by the Fund in the preparation of its financial statements.
Security Valuation
Equity securities and securities of certain investment companies are valued at the last sale price on the principal exchange on which they trade, except for securities traded on the NASDAQ, which are valued at the NASDAQ official close price. Unlisted securities or listed securities for which there were no sales during the day are valued at the closing bid price on such exchanges or over-the-counter markets.
Short-term investments maturing in 60 days or less are valued at amortized cost, which approximates market value.
Futures contracts are valued at the settlement price established each day by the board of trade or exchange on which they are traded.
Written options are valued at the last reported sale price, or in the absence of a sale, at the last quoted ask price.
Forward foreign currency exchange contracts are valued at the prevailing forward exchange rate of the underlying currencies.
Foreign securities are generally valued at the last sale price on the foreign exchange or market on which they trade. If any foreign share prices are not readily available as a result of limited share activity, the securities are valued at the last sale price of the local shares in the principal market in which such securities are normally traded.
Generally, trading in foreign securities is substantially completed each day at various times prior to the close of the New York Stock Exchange ("NYSE"). The values of such securities used in computing the net asset value of the Fund's shares are determined as of such times. Foreign currency exchange rates are generally determined at 4:00 p.m. Eastern (U.S.) time. Occasionally, events affecting the values of such foreign securities may occur between the
24
Columbia International Stock Fund, August 31, 2010
times at which they are determined and the close of the customary trading session of the NYSE, which would not be reflected in the computation of the Fund's net asset value. If events materially affecting the values of such foreign securities occur and it is determined that market quotations are not reliable, then these foreign securities will be valued at their fair value using procedures approved by the Board of Trustees.
The Fund may use a systematic fair valuation model provided by an independent third party to value securities principally traded in foreign markets in order to adjust for possible stale pricing that may occur between the close of the foreign exchanges and the time for valuation.
Investments for which market quotations are not readily available, or that have quotations which management believes are not reliable, are valued at fair value as determined in good faith under consistently applied procedures established by and under the general supervision of the Board of Trustees. If a security is valued at fair value, such value is likely to be different from the last quoted market price for the security. The determination of fair value often requires significant judgment. To determine fair value, management may use assumptions including but not limited to future cash flows and estimated risk premiums. Multiple inputs from various sources may be used to determine value.
GAAP establishes a hierarchy that prioritizes the inputs to valuation techniques used to measure fair value giving the highest priority to unadjusted quoted prices in active markets for identical securities (level 1 measurements) and the lowest priority to unobservable inputs (level 3 measurements) when market prices are not readily available or reliable. The three levels of the fair value hierarchy are described below:
• Level 1 – quoted prices in active markets for identical securities
• Level 2 – prices determined using other significant observable inputs (including quoted prices for similar securities, interest rates, prepayment speeds, credit risk and others)
• Level 3 – prices determined using significant unobservable inputs. In situations where quoted prices or observable inputs are unavailable or less reliable, unobservable inputs may be used. Unobservable inputs may include management's own assumptions about the factors market participants would use in pricing an investment.
The inputs or methodology used for valuing securities are not necessarily an indication of the risk associated with investing in those securities.
On January 21, 2010, the Financial Accounting Standards Board issued an Accounting Standards Update (the "amendment"), Fair Value Measurements and Disclosures (Topic 820): Improving Disclosures about Fair Value Measurements, which provides guidance on how investment assets and liabilities are to be valued and disclosed. Specifically, the amendment requires reporting entities to disclose the inputs and valuation techniques used to measure fair value for both recurring and nonrecurring fair value measurements for Level 2 and Level 3 positions. The amendment also requires that transfers between all levels (including Level 1 and Level 2) be disclosed on a gross basis (i.e., transfers out must be disclosed separately from transfers in), and requires disclosure of the reason(s) for sign ificant transfers. Additionally, purchases, sales, issuances and settlements must be disclosed on a gross basis in the Level 3 roll forward. The effective date of the amendment is for interim and annual periods beginning after December 15, 2009; except for the requirement to provide the Level 3 activity for purchases, sales, issuances and settlements on a gross basis, which will be effective for interim and annual periods beginning after December 15, 2010. At this time, management is evaluating the implications of the amendment and the impact to the financial statements.
Security Transactions
Security transactions are accounted for on the trade date. Cost is determined and gains (losses) are based upon the specific identification method for both financial statement and federal income tax purposes.
Derivative Instruments
The Fund may invest in derivative instruments. For additional information on derivative instruments, please see Note 6.
Repurchase Agreements
The Fund may engage in repurchase agreement transactions with institutions that management has determined are creditworthy. The Fund, through its custodian, receives
25
Columbia International Stock Fund, August 31, 2010
delivery of the underlying securities collateralizing a repurchase agreement. Management is responsible for determining that the collateral is at least equal, at all times, to the value of the repurchase obligation including interest. A repurchase agreement transaction involves certain risks in the event of default or insolvency of the counterparty. These risks include possible delays in or restrictions on the Fund's ability to dispose of the underlying securities and a possible decline in the value of the underlying securities during the period while the Fund seeks to assert its rights.
Foreign Currency Transactions and Translations
The values of all assets and liabilities quoted in foreign currencies are translated into U.S. dollars at that day's exchange rates. Net realized and unrealized gains (losses) on foreign currency transactions and translations include gains (losses) arising from the fluctuation in exchange rates between trade and settlement dates on securities transactions, gains (losses) arising from the disposition of foreign currency and currency gains (losses) between the accrual and payment dates on dividends, interest income and foreign withholding taxes.
For financial statement purposes, the Fund does not distinguish that portion of gains (losses) on investments which is due to changes in foreign exchange rates from that which is due to changes in market prices of the investments. Such fluctuations are included with the net realized and unrealized gains (losses) on investments on the Statement of Operations.
Income Recognition
Interest income is recorded on the accrual basis.
Corporate actions and dividend income are recorded on the ex-date except for certain foreign securities which are recorded as soon after the ex-date as the Fund becomes aware of such, net of any non-reclaimable tax withholdings.
Distributions received from real estate investment trusts (REITs) in excess of their income are recorded as a reduction of the cost of the related investments. If the Fund no longer owns the applicable securities, any distributions received in excess of income are recorded as realized gains.
Expenses
General expenses of the Trust are allocated to the Fund and other series of the Trust based upon relative net assets or other expense allocation methodologies determined by the nature of the expense. Expenses directly attributable to a specific class of shares are charged to that share class. Expenses directly attributable to the Fund are charged to the Fund.
Determination of Class Net Asset Value
All income, expenses (other than class-specific expenses, as shown on the Statement of Operations) and realized and unrealized gains (losses) are allocated to each class of the Fund on a daily basis, based on the relative net assets of each class, for purposes of determining the net asset value of each class.
Federal Income Tax Status
The Fund intends to qualify each year as a "regulated investment company" under Subchapter M of the Internal Revenue Code, as amended, and will distribute substantially all of its taxable income, if any, for its tax year, and as such will not be subject to federal income taxes. In addition, the Fund intends to distribute in each calendar year substantially all of its net investment income, capital gains and certain other amounts, if any, such that the Fund should not be subject to federal excise tax. Therefore, no federal income or excise tax provision is recorded.
Foreign Tax
The Fund may be subject to foreign taxes on income, gains on investments or currency repatriation, a portion of which may be recoverable. The Fund will accrue such taxes and recoveries as applicable, based upon its current interpretation of tax rules and regulations that exist in the markets in which it invests.
Realized gains in certain countries may be subject to foreign taxes at the fund level, at rates ranging from approximately 10% to 15%. The Fund accrues for such foreign taxes on net realized and unrealized gains at the appropriate rate for each jurisdiction.
Distributions to Shareholders
Distributions from net investment income, if any, are declared and paid annually. Net realized capital gains, if any, are
26
Columbia International Stock Fund, August 31, 2010
distributed at least annually. Income distributions and capital gain distributions are determined in accordance with federal income tax regulations which may differ from GAAP.
Indemnification
In the normal course of business, the Fund enters into contracts that contain a variety of representations and warranties and which provide general indemnities. The Fund's maximum exposure under these arrangements is unknown because this would involve future claims against the Fund. Also, under the Trust's organizational documents and by contract, the Trustees and officers of the Trust are indemnified against certain liabilities that may arise out of actions relating to their duties to the Trust. However, based on experience, the Fund expects the risk of loss due to these representations, warranties and indemnities to be minimal.
Note 3. Federal Tax Information
The timing and character of income and capital gain distributions are determined in accordance with income tax regulations, which may differ from GAAP. Reclassifications are made to the Fund's capital accounts for permanent tax differences to reflect income and gains available for distribution (or available capital loss carryforwards) under income tax regulations.
For the year ended August 31, 2010, permanent book and tax basis differences resulting primarily from differing treatments for foreign currency transactions, expiring capital loss carryforwards, Passive Foreign Investment Company adjustments and proceeds from litigation settlements were identified and reclassified among the components of the Fund's net assets as follows:
Overdistributed
Net Investment
Income | | Accumulated
Net Realized
Loss | | Paid-In Capital | |
| $ | (1,654,565 | ) | | $ | 38,266,988 | | | $ | (36,612,423 | ) | |
Net investment income and net realized gains (losses), as disclosed on the Statement of Operations, and net assets were not affected by this reclassification.
The tax character of distributions paid during the years ended August 31, 2010 and August 31, 2009 was as follows:
| | | August 31, | |
| | | 2010 | | 2009 | |
| Ordinary Income* | | $ | 17,546,935 | | | $ | 39,369 | | |
| Long-Term Capital Gains | | | — | | | | 22,733,031 | | |
* For tax purposes short-term capital gain distributions, if any, are considered ordinary income distributions.
As of August 31, 2010, the components of distributable earnings on a tax basis were as follows:
Undistributed
Ordinary
Income | | Undistributed
Long-Term
Capital Gains | | Net
Unrealized
Depreciation* | |
| $ | 1,712,176 | | | $ | — | | | $ | (9,600,407 | ) | |
* The differences between book-basis and tax-basis net unrealized depreciation are primarily due to deferral of losses from wash sales.
Unrealized appreciation and depreciation at August 31, 2010, based on cost of investments for federal income tax purposes, and excluding any unrealized appreciation and depreciation from changes in the value of other assets and liabilities resulting from changes in exchange rates, were:
| Unrealized appreciation | | $ | 47,334,638 | | |
| Unrealized depreciation | | | (56,935,045 | ) | |
| Net unrealized depreciation | | $ | (9,600,407 | ) | |
The following capital loss carryforwards may be available to reduce taxable income arising from future net realized gains on investments, if any, to the extent permitted by the Internal Revenue Code:
| Year of Expiration | | Capital Loss
Carryforwards | |
| 2017 | | $ | 59,458,342 | | |
| 2018 | | | 165,754,669 | | |
| Total | | $ | 225,213,011 | | |
Capital loss carryforwards of $36,290,283 expired during the year ended August 31, 2010.
27
Columbia International Stock Fund, August 31, 2010
Management is required to determine whether a tax position of the Fund is more likely than not to be sustained upon examination by the applicable taxing authority, including resolution of any related appeals or litigation processes, based on the technical merits of the position. The tax benefit to be recognized by the Fund is measured as the largest amount of benefit that is greater than fifty percent likely of being realized upon ultimate settlement. Management is not aware of any tax positions for which it is reasonably possible that the total amounts of unrecognized tax benefits will significantly change in the next twelve months. However, management's conclusions may be subject to review and adjustment at a later date based on factors including, but not limited to, new tax laws, regulations, and administrative interpretations (including relevant court decisions). The Fund's federal tax returns for the prior three fiscal year s remain subject to examination by the Internal Revenue Service.
Note 4. Fees and Compensation Paid to Affiliates
Investment Advisory Fee
After the close of business on April 30, 2010, Ameriprise Financial, Inc. ("Ameriprise Financial") acquired a portion of the asset management business of Columbia Management Group, LLC (the "Transaction"), including the business of managing the Fund. In connection with the closing of the Transaction (the "Closing"), RiverSource Investments, LLC, a wholly owned subsidiary of Ameriprise Financial, became the investment advisor of the Fund and subsequently changed its name to Columbia Management Investment Advisers, LLC (the "New Advisor"). The New Advisor receives a monthly investment advisory fee based on the Fund's average daily net assets at the following annual rates:
| Average Daily Net Assets | | Annual Fee Rate | |
| First $500 million | | | 0.87 | % | |
| $500 million to $1 billion | | | 0.82 | % | |
| $1 billion to $1.5 billion | | | 0.77 | % | |
| $1.5 billion to $3 billion | | | 0.72 | % | |
| $3 billion to $6 billion | | | 0.70 | % | |
| Over $6 billion | | | 0.68 | % | |
Prior to the Closing, Columbia Management Advisors, LLC ("Columbia"), an indirect, wholly owned subsidiary of Bank of America Corporation ("BOA"), provided investment advisory, administrative and other services to the Fund under the same fee structure.
For the year ended August 31, 2010, the Fund's effective investment advisory fee rate was 0.87% of the Fund's average daily net assets.
Administration Fee
Effective upon the Closing, the New Advisor became the administrator of the Fund under a new Administrative Services Agreement (the "Administrative Agreement"). Under the Administrative Agreement, the New Advisor provides administrative and other services to the Fund, including services previously performed under the Pricing and Bookkeeping Oversight and Services Agreement discussed below. The New Advisor does not receive a fee for its services under the Administrative Agreement. Prior to the Closing, Columbia provided administrative services to the Fund as discussed in the Investment Advisory Fee note above.
Pricing and Bookkeeping Fees
Prior to the Closing, the Fund entered into a Financial Reporting Services Agreement (the "Financial Reporting Services Agreement") with State Street Bank and Trust Company ("State Street") and Columbia pursuant to which State Street provides financial reporting services to the Fund. The Fund also entered into an Accounting Services Agreement (collectively with the Financial Reporting Services Agreement, the "State Street Agreements") with State Street and Columbia pursuant to which State Street provides accounting services to the Fund. Upon the Closing, Columbia assigned and delegated its rights and obligations under the State Street Agreements to the New Advisor. Under the State Street Agreements, the Fund pays State Street an annual fee of $38,000 paid monthly plus an additional monthly fee based on an annualized percentage rate of average daily net assets of the Fund for the month. The aggregate fee will not exceed $140,000 per year (exclusive of out-of-pocket expenses and charges). The Fund also reimburses State Street for certain out-of-pocket expenses and charges.
Also prior to the Closing, the Fund entered into a Pricing and Bookkeeping Oversight and Services Agreement (the
28
Columbia International Stock Fund, August 31, 2010
"Services Agreement") with Columbia. Under the Services Agreement, Columbia provided services related to Fund expenses and the requirements of the Sarbanes-Oxley Act of 2002, and provided oversight of the accounting and financial reporting services provided by State Street. Under the Services Agreement, the Fund reimbursed Columbia for out-of-pocket expenses and charges, including fees payable to third parties, such as for pricing the Fund's portfolio securities, incurred by Columbia in the performance of services under the Services Agreement. The Services Agreement was terminated upon the Closing. These services are now provided under the Administrative Agreement discussed above.
Transfer Agent Fee
In connection with the Closing, RiverSource Service Corporation, a wholly owned subsidiary of Ameriprise Financial, became the transfer agent of the Fund and subsequently changed its name to Columbia Management Investment Services Corp. (the "New Transfer Agent"). The New Transfer Agent has contracted with Boston Financial Data Services ("BFDS") to serve as sub-transfer agent.
The New Transfer Agent receives a monthly fee for its services. All share classes, with the exception of Class Y shares (the "Other Share Classes") pay a monthly service fee (the "aggregate fee") based on the following:
(i) An annual rate of $22.36 is applied to the aggregate number of accounts for the Other Share Classes.
(ii) An allocated portion of fees for wire, telephone and redemption orders, Individual Retirement Account ("IRA") trustee agent fees and account transcript fees due to the New Transfer Agent from shareholders of the Fund and credits (net of bank charges) earned with respect to balances in accounts the New Transfer Agent maintains in connection with its services to the Fund. The New Transfer Agent also receives reimbursement for certain out-of-pocket expenses.
The aggregate fee is allocated to the Other Share Classes based on the relative average daily net assets of each share class.
Class Y shares of the Fund pay a monthly service fee based on the following:
(i) An annual rate of $22.36 is applied to the aggregate number of accounts for Class Y shares.
(ii) An allocated portion of fees for wire, telephone and redemption orders, IRA trustee agent fees and account transcript fees due to the New Transfer Agent from shareholders of the Fund and credits (net of bank charges) earned with respect to balances in accounts the New Transfer Agent maintains in connection with its services to the Fund. The New Transfer Agent also receives reimbursement for certain out-of-pocket expenses.
The New Transfer Agent also receives reimbursement of certain sub-transfer agent fees paid by the New Transfer Agent (exclusive of BFDS fees), calculated based on the combined assets held in the Other Share Classes in omnibus accounts and intended to recover the cost of payments to other parties (including affiliates of BOA) for services to those accounts. Such fees are allocated to the Other Share Classes based on the relative average daily net assets of each share class. The New Transfer Agent pays the fees of BFDS for services as sub-transfer agent and is not entitled to reimbursement for such fees from the Fund.
Prior to the Closing, Columbia Management Services, Inc. (the "Previous Transfer Agent"), an affiliate of Columbia and an indirect, wholly owned subsidiary of BOA, provided shareholder services to the Fund and contracted with BFDS to serve as sub-transfer agent, under the same fee structure. Prior to November 1, 2009, the annual rate was $17.34 per account.
An annual minimum account balance fee of $20 may apply to certain accounts with a value below the Fund's initial minimum investment requirements to reduce the impact of small accounts on transfer agent fees. These minimum account balance fees are recorded as part of expense reductions on the Statement of Operations. For the year ended August 31, 2010, no minimum account balance fees were charged by the Fund.
Underwriting Discounts, Service and Distribution Fees
In connection with the Closing, RiverSource Fund Distributors, Inc., an indirect wholly owned subsidiary of Ameriprise Financial, became the distributor of the Fund and subsequently changed its name to Columbia Management Investment Distributors, Inc. (the "New Distributor").
29
Columbia International Stock Fund, August 31, 2010
For the year ended August 31, 2010, initial sales charges paid by shareholders on the purchase of Class A shares amounted to $7,022 and net CDSC fees paid by shareholders on certain redemptions of Class A, Class B and Class C shares amounted to $404, $4,645 and $408, respectively.
The Fund has adopted shareholder servicing and distribution plans pursuant to Rule 12b-1 under the 1940 Act (the "Plans") which require the payment of a monthly service fee to the New Distributor at the maximum annual rate of 0.25% of the average daily net assets attributable to Class A, Class B and Class C shares of the Fund. The Plans also require the payment of a monthly distribution fee to the New Distributor at the maximum annual rate of 0.75% of the average daily net assets attributable to Class B and Class C shares only.
The CDSC and the distribution fees received from the Plans are used principally as repayment to the New Distributor for amounts paid by the New Distributor to dealers who sold such shares.
Prior to the Closing, Columbia Management Distributors, Inc., an affiliate of Columbia and an indirect, wholly owned subsidiary of BOA, was the principal underwriter of the Fund's shares. There were no changes to the underwriting discount structure of the Fund or the service or distribution fee rates paid by the Fund as a result of the Transaction.
Expense Limits and Fee Waivers
Effective May 1, 2010, the New Advisor has voluntarily agreed to reimburse a portion of the Fund's expenses so that the Fund's ordinary operating expenses (excluding any distribution and service fees, brokerage commissions, interest, taxes and extraordinary expenses, but including custodian charges relating to overdrafts, if any), after giving effect to any balance credits from the Fund's custodian, do not exceed 1.15% of the Fund's average daily net assets on an annualized basis. This arrangement may be modified or terminated by the New Advisor at any time. Prior to May 1, 2010, Columbia voluntarily reimbursed a portion of the Fund's expenses in the same manner.
Fees Paid to Officers and Trustees
In connection with the Closing, all officers of the Fund are employees of the New Advisor or its affiliates and, with the exception of the Fund's Chief Compliance Officer, receive no compensation from the Fund. The Board of Trustees has appointed a Chief Compliance Officer to the Fund in accordance with federal securities regulations. The Fund, along with other affiliated funds, pays its pro-rata share of the expenses associated with the Chief Compliance Officer. The Fund's expenses for the Chief Compliance Officer will not exceed $15,000 per year. Prior to the Closing, the Fund paid its pro-rata share of the expenses for the Chief Compliance Officer under the same fee structure.
Trustees are compensated for their services to the Fund, as set forth on the Statement of Operations. The Trust's eligible Trustees may participate in a deferred compensation plan which may be terminated at any time. Obligations of the plan will be paid solely out of the Fund's assets.
Other Related Party Transactions
Prior to the Closing, the Fund used one or more brokers that were affiliates of BOA in connection with the purchase and sale of its securities. Total brokerage commissions paid to affiliated brokers for the period prior to the Closing were $2,785.
Note 5. Custody Credits
The Fund has an agreement with its custodian bank under which custody fees may be reduced by balance credits. These credits are recorded as part of expense reductions on the Statement of Operations. The Fund could have invested a portion of the assets utilized in connection with the expense offset arrangement in an income-producing asset if it had not entered into such an agreement. For the year ended August 31, 2010, these custody credits reduced total expenses by $3 for the Fund.
Note 6. Objectives and Strategies for Investing in Derivative Instruments
The Fund uses derivatives instruments including futures contracts, options and forward contracts in order to meet its investment objectives. The Fund employs strategies in differing combinations to permit it to increase, decrease or change the level of exposure to market risk factors. The achievement of any strategy relating to derivatives depends on an analysis of various risk factors, and if the strategies for the use of derivatives do not work as intended, the Fund may not achieve its investment objectives.
30
Columbia International Stock Fund, August 31, 2010
In pursuit of its investment objectives, the Fund is exposed to the following market risks:
Equity Risk: Equity risk relates to change in value of equity securities such as common stocks due to general market conditions such as real or perceived adverse economic conditions, changes in the general outlook for corporate earnings, or adverse investor sentiment. Equity securities generally have greater price volatility than fixed income securities.
Foreign Exchange Rate Risk: Foreign exchange rate risk relates to the change in the U.S. dollar value of a security held that is denominated in a foreign currency. The U.S. dollar value of a foreign-currency-denominated security will decrease as the dollar appreciates against the currency, while the U.S. dollar value will increase as the dollar depreciates against the currency.
Interest Rate Risk: Interest rate risk relates to the fluctuation in value of fixed income securities because of the inverse relationship of price and yield. Fixed income securities generally will decline in value upon an increase in general interest rates and their value generally will increase upon a decline in general interest rates. Fixed income securities with longer durations tend to be more sensitive to changes in interest rates, usually making them more volatile than securities with shorter durations.
The following note provides more detailed information about each derivative type held by the Fund:
Forward Foreign Currency Exchange Contracts—The Fund entered into forward foreign currency exchange contracts to shift its investment exposure from one currency to another. The Fund used forward contracts in order to achieve a representative weighted mix of major currencies in its benchmarks and/or to recover an underweight country exposure in its portfolio.
Forward foreign currency exchange contracts are agreements to exchange one currency for another at a future date at a specified price. These contracts are used to minimize the exposure to foreign exchange rate fluctuations during the period between the trade and settlement dates of the contract. The Fund may utilize forward foreign currency exchange contracts in connection with the settlement of purchases and sales of securities. The Fund may also enter into these contracts to reduce the exposure to adverse price movements in certain other foreign-currency-denominated assets. Contracts to buy generally are used to acquire exposure to foreign currencies, while contracts to sell are generally used to reduce the exposure to foreign exchange rate fluctuations. Forward foreign currency exchange contracts are valued daily at the current exchange rate of the underlying currency, resulting in unrealized gains (losses) which become reali zed at the time the forward foreign currency exchange contracts are closed or mature. Realized and unrealized gains (losses) arising from such transactions are included in net realized and unrealized gains (losses) on foreign currency transactions. The use of forward foreign currency exchange contracts does not eliminate fluctuations in the prices of the Fund's portfolio securities. While the maximum potential loss from such contracts is the aggregate face value in U.S. dollars at the time the contract was opened, exposure is typically limited to the change in value of the contract (in U.S. dollars) over the period it remains open. The Fund could also be exposed to risk that counterparties of the contracts may be unable to fulfill the terms of the contracts.
During the year ended August 31, 2010, the Fund entered into 309 forward foreign currency exchange contracts.
Futures Contracts—The Fund entered into stock index futures and/or interest rate futures contracts to manage its exposure to the securities markets and/or to movements in interest rates.
The use of futures contracts involves certain risks, which include: (1) imperfect correlation between the price movement of the instruments and the underlying securities, (2) inability to close out positions due to differing trading hours, or the temporary absence of a liquid market, for either the instruments or the underlying securities, and (3) an inaccurate prediction of the future direction of interest rates by the Fund's investment advisor.
Upon entering into a futures contract, the Fund identifies within its portfolio of investments cash or securities in an amount sufficient to meet the initial margin requirement. Subsequent payments are made or received by the Fund equal to the daily change in the contract value and are recorded as variation margin receivable or payable and offset in unrealized gains or losses. The Fund recognizes a realized gain or loss when the contract is closed or expires.
31
Columbia International Stock Fund, August 31, 2010
Futures contracts involve, to varying degrees, risk of loss in excess of the variation margin disclosed on the Statement of Assets and Liabilities.
The Fund did not have any open futures contracts at the end of the year.
Options—The Fund wrote covered call options to decrease the Fund's exposure to equity risk and to increase return on instruments. Written covered call options become more valuable as the price of the underlying instruments depreciates relative to the strike price.
Writing put options tends to increase the Fund's exposure to the underlying instrument. When the Fund writes a call or put option, an amount equal to the premium received is recorded as a liability and subsequently marked-to-market to reflect the current value of the option written. Premiums received from writing options which expire are treated as realized gains. Premiums received from writing options which are exercised or closed are added to the proceeds or offset against the amounts paid on the underlying security transaction to determine the realized gain or loss. The Fund, as a writer of an option, has no control over whether the underlying security may be sold (call) or purchased (put) and as a result bears the market risk of an unfavorable change in the price of the security underlying the written option. There is the risk that the Fund may not be able to enter into a closing transaction because of an illiquid market. Th e Fund identifies within its portfolio of investments cash or liquid portfolio securities equal to the amount of the written options contract commitment.
The Fund may also purchase put and call options. Purchasing call options tends to increase the Fund's exposure to the underlying instrument. Purchasing put options tends to decrease the Fund's exposure to the underlying instrument. The Fund may pay a premium, which is included in the Fund's Statement of Assets and Liabilities as an investment and subsequently marked-to-market to reflect the current value of the option. The risk associated with purchasing put and call options is limited to the premium paid. Premiums paid for purchasing options which expire are treated as realized losses. Premiums paid for purchasing options which are exercised are added to the amounts paid (call) or offset against the proceeds (put) on the underlying security to determine the realized gain or loss. If the Fund enters into a closing transaction, the Fund will realize a gain or loss, depending on whether the proceeds from the closing transaction ar e greater or less than the cost of the option.
During the year ended August 31, 2010, the Fund entered into 25,230 written options contracts.
The following table is a summary of the value of the Fund's derivative instruments as of August 31, 2010:
| | | Fair Value of Derivative Instruments | | | |
| | | Statement of Assets and Liabilities | | | |
| Asset | | Fair Value | | Liabilities | | Fair Value | |
Unrealized Appreciation on Forward Foreign
Currency Exchange Contracts | | $ | 1,037,257 | | | Unrealized Depreciation on Forward Foreign
Currency Exchange Contracts | | $ | 693,940 | | |
| | | | | Written Options | | | 118,995 | | |
32
Columbia International Stock Fund, August 31, 2010
The effect of derivative instruments on the Fund's Statement of Operations for the year ended August 31, 2010:
| | | Amount of Realized Gain or (Loss)
and Change in Unrealized Appreciation
(Depreciation) on Derivatives Recognized in Income | |
| | | Risk Exposure | | Net Realized
Gain (Loss) | | Change in
Unrealized
Appreciation
(Depreciation) | |
| Forward Foreign Currency Exchange Contracts | | Foreign Exchange Rate Risk | | $ | (2,698,081 | ) | | $ | (1,162,153 | ) | |
| Written Options | | Equity Risk | | | 502,198 | | | | (121,737 | ) | |
| Futures Contracts | | Interest Rate Risk | | | (153,907 | ) | | | — | | |
Note 7. Portfolio Information
For the year ended August 31, 2010, the cost of purchases and proceeds from sales of securities, excluding short-term obligations, for the Fund were $374,181,668 and $509,801,503, respectively.
Note 8. Redemption Fees
Effective March 1, 2010, the Fund no longer assesses a 2.00% redemption fee on the proceeds from Fund shares that are redeemed within 60 days of purchase. The redemption fee was designed to offset brokerage commissions and other costs associated with short term trading of fund shares. The redemption fees, which were retained by the Fund, were accounted for as an addition to paid-in capital and were allocated to each class based on the relative net assets at the time of the redemption. For the year ended August 31, 2010, the Fund received redemption fees as follows:
| Redemption Fee | |
| Class A | | Class B | | Class C | | Class Y | | Class Z | |
| $ | 1,692 | | | $ | 68 | | | $ | 139 | | | $ | 351 | | | $ | 4,037 | | |
Note 9. Regulatory Settlements
During the years ended August 31, 2010 and August 31, 2009, the Fund received payments totaling $322,140 and $7,166,056, respectively, relating to certain regulatory settlements with third parties that the Fund had participated in during the respective periods. The payments have been included in "Increase from regulatory settlements" on the Statement of Changes in Net Assets.
Note 10. Line of Credit
The Fund and other affiliated funds participate in a $280,000,000 committed, unsecured revolving line of credit provided by State Street. The maximum amount that may be borrowed by any fund is limited to the lesser of $200,000,000 and the Fund's borrowing limit set forth in the Fund's registration statement. Borrowings are available for short-term liquidity or temporary or emergency purposes.
Effective October 15, 2009, interest is charged to each participating fund based on the fund's borrowings at a rate per annum equal to the greater of the Federal Funds Rate plus 1.25% or the overnight LIBOR Rate plus 1.25%. In addition, a commitment fee of 0.15% per annum is accrued and apportioned among the participating funds pro rata based on their relative net assets.
Prior to October 15, 2009, interest was charged to each participating fund based on the fund's borrowings at a rate per annum equal to the greater of the Federal Funds Rate plus 0.50% or the overnight LIBOR Rate plus 0.50%. In addition, an annual operations agency fee of $20,000, an amendment fee of 0.02% and a commitment fee of 0.12% per annum were accrued and apportioned among the participating funds pro rata based on their relative net assets.
For the year ended August 31, 2010, the average daily loan balance outstanding on days where borrowing existed was $4,048,649 at a weighted average interest rate of 1.49%.
Note 11. Shareholder Concentration
As of August 31, 2010, one shareholder account owned 49.7% of the outstanding shares of the Fund. Purchase and
33
Columbia International Stock Fund, August 31, 2010
redemption activity of this account may have a significant effect on the operations of the Fund.
Note 12. Significant Risks and Contingencies
Foreign Securities Risk
There are certain additional risks involved when investing in foreign securities. These risks may involve foreign currency exchange rate fluctuations, adverse political and economic developments and the possible prevention of currency exchange or other foreign governmental laws or restrictions. In addition, the liquidity of foreign securities may be more limited than that of domestic securities.
Investments in emerging market countries are subject to additional risk. The risk of foreign investments is typically increased in less developed countries. These countries are also more likely to experience high levels of inflation, deflation or currency devaluation which could hurt their economies and securities markets.
Information Regarding Pending and Settled Legal Proceedings
In June 2004, an action captioned John E. Gallus et al. v. American Express Financial Corp. and American Express Financial Advisors Inc. was filed in the United States District Court for the District of Arizona. The plaintiffs allege that they are investors in several American Express Company (now known as legacy RiverSource) mutual funds and they purport to bring the action derivatively on behalf of those funds under the Investment Company Act of 1940. The plaintiffs allege that fees allegedly paid to the defendants by the funds for investment advisory and administrative services are excessive. The plaintiffs seek remedies including restitution and rescission of investment advisory and distribution agreements. The plaintiffs voluntarily agreed to transfer this case to the United States District Court for the District of Minnesota (the District Court). In response to defendants' motion to dismiss the complaint, the District Court dismissed one of plaintiffs' four claims and granted plaintiffs limited discovery. Defendants moved for summary judgment in April 2007. Summary judgment was granted in the defendants' favor on July 9, 2007. The plaintiffs filed a notice of appeal with the Eighth Circuit Court of Appeals (the Eighth Circuit) on August 8, 2007. On April 8, 2009, the Eighth Circuit reversed summary judgment and remanded to the District Court for further proceedings. On August 6, 2009, defendants filed a writ of certiorari with the U.S. Supreme Court (the Supreme Court), asking the Supreme Court to stay the District Court proceedings while the Supreme Court considers and rules in a case captioned Jones v. Harris Associates, which involves issues of law similar to those presented in the Gallus case. On March 30, 2010, the Supreme Court issued its ruling in Jones v. Harris Associates, and on April 5, 2010, the Supreme Court vacated the Eighth Circuit's decision in the Gallus case and remanded the case to the Eighth Circuit for further consideration in light of the Supreme Court's decision in Jones v. Harris Associates. On June 4, 2010, the Eighth Circuit remanded the Gallus case to the District Court for further consideration in light of the Supreme Court's decision in Jones v. Harris Associates.
In December 2005, without admitting or denying the allegations, American Express Financial Corporation (AEFC, which is now known as Ameriprise Financial, Inc. (Ameriprise Financial)), entered into settlement agreements with the Securities and Exchange Commission (SEC) and Minnesota Department of Commerce (MDOC) related to market timing activities. As a result, AEFC was censured and ordered to cease and desist from committing or causing any violations of certain provisions of the Investment Advisers Act of 1940, the Investment Company Act of 1940, and various Minnesota laws. AEFC agreed to pay disgorgement of $10 million and civil money penalties of $7 million. AEFC also agreed to retain an independent distribution consultant to assist in developing a plan for distribution of all disgorgement and civil penalties ordered by the SEC in accordance with various undertakings detailed at http://www.sec.gov/litigation/admin/ia-2451.pdf. Ameriprise Financial and its affiliates have cooperated with the SEC and the MDOC in these legal proceedings, and have made regular reports to the funds' Boards of Directors/Trustees.
Ameriprise Financial and certain of its affiliates have historically been involved in a number of legal, arbitration and regulatory proceedings, including routine litigation, class actions, and governmental actions, concerning matters arising in connection with the conduct of their business activities. Ameriprise Financial believes that the Funds are not currently the subject of, and that neither Ameriprise Financial nor any of its affiliates are the subject of, any pending legal, arbitration or regulatory proceedings that are likely to have a
34
Columbia International Stock Fund, August 31, 2010
material adverse effect on the Funds or the ability of Ameriprise Financial or its affiliates to perform under their contracts with the Funds. Ameriprise Financial is required to make 10-Q, 10-K and, as necessary, 8-K filings with the Securities and Exchange Commission on legal and regulatory matters that relate to Ameriprise Financial and its affiliates. Copies of these filings may be obtained by accessing the SEC website at www.sec.gov.
There can be no assurance that these matters, or the adverse publicity associated with them, will not result in increased fund redemptions, reduced sale of fund shares or other adverse consequences to the Funds. Further, although we believe proceedings are not likely to have a material adverse effect on the Funds or the ability of Ameriprise Financial or its affiliates to perform under their contracts with the Funds, these proceedings are subject to uncertainties and, as such, we are unable to estimate the possible loss or range of loss that may result. An adverse outcome in one or more of these proceedings could result in adverse judgments, settlements, fines, penalties or other relief that could have a material adverse effect on the consolidated financial condition or results of operations of Ameriprise Financial.
Note 13. Subsequent Event
The Board of Trustees has approved in principle the proposed merger of the Fund into Columbia Multi-Advisor International Equity Fund. Shareholders will vote on the proposal at a Special Meeting of Shareholders scheduled to be held during the first half of 2011.
35
Report of Independent Registered Public Accounting Firm
To the Trustees of Columbia Funds Series Trust I and Shareholders of Columbia International Stock Fund
In our opinion, the accompanying statement of assets and liabilities, including the investment portfolios, and the related statements of operations and of changes in net assets and the financial highlights present fairly, in all material respects, the financial position of Columbia International Stock Fund (the "Fund") (a series of Columbia Funds Series Trust I) at August 31, 2010, the results of its operations for the year then ended, the changes in its net assets for each of the two years in the period then ended, and the financial highlights for each of the five years in the period then ended, in conformity with accounting principles generally accepted in the United States of America. These financial statements and financial highlights (hereafter referred to as "financial statements") are the responsibility of the Fund's management. Our responsibility is to express an opinion on these financial statements based on our audits. We conducted our audits of these financial statements in accordance with the standards of the Public Company Accounting Oversight Board (United States). Those standards require that we plan and perform the audit to obtain reasonable assurance about whether the financial statements are free of material misstatement. An audit includes examining, on a test basis, evidence supporting the amounts and disclosures in the financial statements, assessing the accounting principles used and significant estimates made by management, and evaluating the overall financial statement presentation. We believe that our audits, which included confirmation of securities at August 31, 2010 by correspondence with the custodian and brokers, provide a reasonable basis for our opinion.
PricewaterhouseCoopers LLP
Boston, Massachusetts
October 25, 2010
36
Federal Income Tax Information (Unaudited) – Columbia International Stock Fund
Foreign taxes paid during the fiscal year ended August 31, 2010 of $1,714,333 are being passed through to shareholders. This represents $0.04 per share. Eligible shareholders may claim this amount as a foreign tax credit.
Gross income derived from sources within foreign countries amounted to $14,423,951 ($0.37 per share) for the fiscal year ended August 31, 2010.
For non-corporate shareholders 18.56% or the maximum amount allowable under the Jobs and Growth Tax Relief Reconciliation Act of 2003, of the ordinary income distributed by the Fund for the fiscal year ended August 31, 2010 may represent qualified dividend income.
The Fund will notify shareholders in January 2011 of amounts for use in preparing 2010 income tax returns.
37
Fund Governance
The Trustees serve terms of indefinite duration. The names, addresses and birth years of the Trustees and Officers of the Funds in the Columbia Funds Series Trust I, the year each was first elected or appointed to office, their principal business occupations during at least the last five years, the number of Funds overseen by each Trustee and other directorships they hold are shown below. Each officer listed below serves as an officer of each Fund in the Columbia Funds Complex.
Independent Trustees
Name, Address and Year of Birth,
Position with Funds, Year First
Elected or Appointed to Office | | Principal Occupation(s) During Past Five Years, Number of Funds in Columbia
Funds Complex Overseen by Trustee, Other Directorships Held
| |
| John D. Collins (Born 1938) | |
|
c/o Columbia Management
Investment Advisers, LLC
One Financial Center
Boston, MA 02111
Trustee (since 2005) | | Retired. Consultant, KPMG, LLP (accounting and tax firm) from July 1999 to June 2000; Partner, KPMG, LLP from March 1962 to June 1999. Oversees 64; Mrs. Fields Original Cookies, Inc. (consumer products); Suburban Propane Partners, L.P.; and Montpelier Re (insurance underwriting firm) | |
|
| Rodman L. Drake (Born 1943) | |
|
c/o Columbia Management
Investment Advisers, LLC
One Financial Center
Boston, MA 02111
Trustee (since 1994) and Chairman of the Board (since 2009) | | Co-Founder of Baringo Capital LLC (private equity) since 2002; CEO of Crystal River Capital, Inc. (real estate investment trust) since 2003; President, Continuation Investments Group, Inc. from 1997 to 2001. Oversees 64; Jackson Hewitt Tax Service Inc. (tax preparation services); Crystal Capital River, Inc. (real estate investment trust); Student Loan Corporation (student loan provider); Celgene Corporation (global biotechnology company); The Helios Funds (exchange-traded funds); and Apex Silver Mines Ltd. from 2007 to 2009 | |
|
| Douglas A. Hacker (Born 1955) | |
|
c/o Columbia Management
Investment Advisers, LLC
One Financial Center
Boston, MA 02111
Trustee (since 1996) | | Independent business executive since May 2006; Executive Vice President—Strategy of United Airlines (airline) from December 2002 to May 2006; President of UAL Loyalty Services (airline marketing company) from September 2001 to December 2002; Executive Vice President and Chief Financial Officer of United Airlines from July 1999 to September 2001. Oversees 64; Nash Finch Company (food distributor); Aircastle Limited (aircraft leasing) | |
|
| Janet Langford Kelly (Born 1957) | |
|
c/o Columbia Management
Investment Advisers, LLC
One Financial Center
Boston, MA 02111
Trustee (since 1996) | | Senior Vice President, General Counsel and Corporate Secretary, ConocoPhillips (integrated energy company) since September 2007; Deputy General Counsel—Corporate Legal Services, ConocoPhillips from August 2006 to August 2007; Partner, Zelle, Hofmann, Voelbel, Mason & Gette LLP (law firm) from March 2005 to July 2006; Adjunct Professor of Law, Northwestern University, from September 2004 to June 2006; Director, UAL Corporation (airline) from February 2006 to July 2006; Oversees 64; None | |
|
| Charles R. Nelson (Born 1942) | |
|
c/o Columbia Management
Investment Advisers, LLC
One Financial Center
Boston, MA 02111
Trustee (since 1981) | | Professor of Economics, University of Washington, since January 1976; Ford and Louisa Van Voorhis Professor of Political Economy, University of Washington, since September 1993; Adjunct Professor of Statistics, University of Washington, since September 1980; Associate Editor, Journal of Money Credit and Banking, 1993-2008; Consultant on econometric and statistical matters. Oversees 64; None | |
|
38
Fund Governance (continued)
Independent Trustees (continued)
Name, Address and Year of Birth,
Position with Funds, Year First
Elected or Appointed to Office | | Principal Occupation(s) During Past Five Years, Number of Funds in Columbia
Funds Complex Overseen by Trustee, Other Directorships Held
| |
| John J. Neuhauser (Born 1943) | |
|
c/o Columbia Management
Investment Advisers, LLC
One Financial Center
Boston, MA 02111
Trustee (since 1984) | | President, Saint Michael's College, since August 2007; Director or Trustee of several non-profit organizations, including Fletcher Allen Health Care, Inc.; University Professor, Boston College from November 2005 to August 2007; Academic Vice President and Dean of Faculties, Boston College from August 1999 to October 2005. Oversees 64; Liberty All-Star Equity Fund and Liberty All-Star Growth Fund, Inc. (closed-end funds) | |
|
| Jonathan Piel (Born 1938) | |
|
c/o Columbia Management
Investment Advisers, LLC
One Financial Center
Boston, MA 02111
Trustee (since 1994) | | Cable television producer and website designer; The Editor, Scientific American from 1984 to 1994; Vice President, Scientific American, Inc., from 1984 to 1994; Member, Advisory Board, Stone Age Institute, Bloomington, Indiana (research institute that explores the effect of technology on human evolution); Member, Board of Directors of the National Institute of Social Sciences, New York City; Member, Board of Trustees of the William Alanson White Institute, New York City (institution for training psychoanalysts); and Member, Advisory Board, Mount Sinai Children's Environmental Health Center, New York. Oversees 64; None | |
|
| Patrick J. Simpson (Born 1944) | |
|
c/o Columbia Management
Investment Advisers, LLC
One Financial Center
Boston, MA 02111
Trustee (since 2000) | | Partner, Perkins Coie LLP (law firm). Oversees 64; None | |
|
| Anne-Lee Verville (Born 1945) | |
|
c/o Columbia Management
Investment Advisers, LLC
One Financial Center
Boston, MA 02111
Trustee (since 1998) | | Retired since 1997 (formerly General Manager–Global Education Industry from 1994 to 1997, President–Application Systems Division from 1991 to 1994, Chief Financial Officer–US Marketing & Services from 1988 to 1991, and Chief Information Officer from 1987 to 1988, IBM Corporation (computer and technology)). Oversees 64; Enesco Group, Inc. (producer of giftware and home and garden decor products) from 2001 to 2006 | |
|
39
Fund Governance (continued)
Interested Trustee
Name, Address and Year of Birth,
Position with Funds, Year First
Elected or Appointed to Office | | Principal Occupation(s) During Past Five Years, Number of Funds in Columbia
Funds Complex Overseen by Trustee, Other Directorships Held
| |
| William E. Mayer1 (Born 1940) | |
|
c/o Columbia Management
Investment Advisers, LLC
One Financial Center
Boston, MA 02111
Trustee (since 1994) | | Partner, Park Avenue Equity Partners (private equity) since February 1999; Dean and Professor, College of Business and Management, University of Maryland from 1992 to 1996. Oversees 64; DynaVox Inc. (software developer); Lee Enterprises (print media); WR Hambrecht + Co. (financial service provider); BlackRock Kelso Capital Corporation (investment company) | |
|
1 Mr. Mayer may technically be an "interested person" (as defined in the Investment Company Act of 1940) by reason of his affiliation with WR Hambrecht + Co., a registered broker/dealer that may execute portfolio transactions for, engage in principal transactions with or distribute shares of a Fund or other funds or accounts advised/managed by the Adviser or any sub-adviser to a Fund.
The Statement of Additional Information includes additional information about the Trustees of the Funds and is available, without charge, upon request by calling 1-800-345-6611.
Officers
| Name, Year of Birth and Address | | Principal Occupation(s) During the Past Five Years | |
| J. Kevin Connaughton (Born 1964) | |
|
One Financial Center
Boston, MA 02111
President (since 2009) | | Senior Vice President and General Manager–Mutual Fund Products, Columbia Management Investment Advisers, LLC since May 2010; President, Columbia Funds, since 2009, and RiverSource Funds, since May 2010 (previously Senior Vice President and Chief Financial Officer, Columbia Funds, from June 2008 to January 2009, Treasurer, Columbia Funds, from October 2003 to May 2008, and senior officer of various other affiliated funds since 2000); Managing Director, Columbia Management Advisors, LLC from December 2004 to April 2010. | |
|
| Michael G. Clarke (Born 1969) | |
|
One Financial Center
Boston, MA 02111
Senior Vice President and Chief
Financial Officer (since 2009) | | Vice President, Columbia Management Investment Advisers, LLC since May 2010; Managing Director of Fund Administration, Columbia Management Advisors, LLC, from September 2004 to April 2010; senior officer of Columbia Funds and affiliated funds since 2002. | |
|
| Scott R. Plummer (Born 1959) | |
|
5228 Ameriprise Financial Center
Minneapolis, MN 55474
Senior Vice President, Secretary
and Chief Legal Officer (since 2010) | | Chief Legal Officer and Assistant Secretary, Columbia Management Investment Advisers, LLC since June 2005; Vice President and Lead Chief Counsel–Asset Management, Ameriprise Financial, Inc. since May 2010 (previously Vice President and Chief Counsel–Asset Management, from 2005 to April 2010, and Vice President–Asset Management Compliance from 2004 to 2005); Vice President, Chief Counsel and Assistant Secretary, Columbia Management Investment Distributors, Inc. since 2008; Vice President, General Counsel and Secretary, Ameriprise Certificate Company since 2005; Chief Counsel, RiverSource Distributors, Inc. since 2006; Vice President, General Counsel and Secretary, RiverSource Funds, since December 2006; Senior Vice President, Secretary and Chief Legal Officer, Columbia Funds, since May 2010. | |
|
40
Fund Governance (continued)
Officers (continued)
| Name, Year of Birth and Address | | Principal Occupation(s) During the Past Five Years | |
| Linda J. Wondrack (Born 1964) | |
|
One Financial Center
Boston, MA 02111
Senior Vice President and Chief
Compliance Officer (since 2007) | | Vice President and Chief Compliance Officer, Columbia Management Investment Advisers, LLC since May 2010; Chief Compliance Officer, Columbia Funds, since 2007, and RiverSource Funds, since May 2010; Director (Columbia Management Group, LLC and Investment Product Group Compliance), Bank of America, from June 2005 to April 2010; Director of Corporate Compliance and Conflicts Officer of MFS Investment Management (investment management) from August 2004 to May 2005. | |
|
| William F. Truscott (Born 1960) | |
|
53600 Ameriprise Financial Center
Minneapolis, MN 55474
Senior Vice President (since 2010) | | Chairman of the Board, Columbia Management Investment Advisers, LLC since May 2010 (previously President, Chairman of the Board and Chief Investment Officer, from 2001 to April 2010); Chief Executive Officer, U.S. Asset Management & President, Annuities, Ameriprise Financial, Inc. since May 2010 (previously President–U.S. Asset Management and Chief Investment Officer from 2005 to April 2010, and Senior Vice President—Chief Investment Officer, from 2001 to 2005); Director, President and Chief Executive Officer, Ameriprise Certificate Company since 2006; Director, Columbia Management Investment Distributors, Inc. since May 2010 (previously Chairman of the Board and Chief Executive Officer from 2008 to April 2010); Chairman of the Board and Chief Executive Officer, RiverSource Distributors, Inc. since 2006. | |
|
| Colin Moore (Born 1958) | |
|
One Financial Center
Boston, MA 02111
Senior Vice President (since 2010) | | Director and Chief Investment Officer, Columbia Management Investment Advisers, LLC since May 2010; Manager, Managing Director and Chief Investment Officer of Columbia Management Advisors, LLC from 2007 to April 2010; Head of Equities, Columbia Management Advisors, LLC from 2002 to 2007. | |
|
| Michael A. Jones (Born 1959) | |
|
100 Federal Street
Boston, MA 02110
Senior Vice President (since 2010) | | Director and President, Columbia Management Investment Advisers, LLC since May 2010; President and Director, Columbia Management Investment Distributors, Inc. since May 2010; Manager, Chairman, Chief Executive Officer and President, Columbia Management Advisors, LLC from 2007 to April 2010; Chief Executive Officer, President and Director, Columbia Management Distributors, Inc. from November 2006 to April 2010; previously, co-president and senior managing director at Robeco Investment Management. | |
|
| Amy Johnson (Born 1965) | |
|
5228 Ameriprise Financial Center
Minneapolis, MN 55474
Senior Vice President (since 2010) | | Senior Vice President and Chief Operating Officer, Columbia Management Investment Advisers, LLC since May 2010 (previously Chief Administrative Officer, from 2009 until April 2010, Vice President—Asset Management and Trust Company Services, from 2006 to 2009, and Vice President—Operations and Compliance from 2004 to 2006). | |
|
| Joseph F. DiMaria (Born 1968) | |
|
One Financial Center
Boston, MA 02111
Treasurer (since 2009) and
Chief Accounting Officer (since 2008) | | Vice President, Mutual Fund Administration, Columbia Management Investment Advisers, LLC, since May 2010; Director of Fund Administration, Columbia Management Advisors, LLC from January 2006 to April 2010; Head of Tax/Compliance and Assistant Treasurer, Columbia Management Advisors, LLC, from November 2004 to December 2005. | |
|
41
Fund Governance (continued)
Officers (continued)
| Name, Year of Birth and Address | | Principal Occupation(s) During the Past Five Years | |
| Marybeth Pilat (Born 1968) | |
|
One Financial Center
Boston, MA 02111
Deputy Treasurer (since 2010) | | Vice President, Mutual Fund Administration, Columbia Management Investment Advisers, LLC, since May 2010; Vice President, Investment Operations, Bank of America, from October 2008 to April 2010; Finance Manager, Boston Children's Hospital from August 2008 to October 2008; Director, Mutual Fund Administration, Columbia Management Advisors, LLC, from May 2007 to July 2008; Vice President, Mutual Fund Valuation, Columbia Management Advisors, LLC, from January 2006 to May 2007; Vice President, Mutual Fund Accounting Oversight, Columbia Management Advisors, LLC from January 2005 to January 2006. | |
|
| Julian Quero (Born 1967) | |
|
One Financial Center
Boston, MA 02111
Deputy Treasurer (since 2008) | | Vice President, Mutual Fund Administration, Columbia Management Investment Advisers, LLC since May 2010; Director of Fund Administration, Columbia Management Advisors, LLC, from August 2008 to April 2010; Senior Tax Manager, Columbia Management Advisors, LLC from August 2006 to July 2008; Senior Compliance Manager, Columbia Management Advisors, LLC from April 2002 to August 2006. | |
|
| Stephen T. Welsh (Born 1957) | |
|
One Financial Center
Boston, MA 02111
Vice President (since 2006) | | President and Director, Columbia Management Investment Services Corp. since May 2010; President and Director, Columbia Management Services, Inc. from July 2004 to April 2010; Managing Director, Columbia Management Distributors, Inc. from August 2007 to April 2010. | |
|
42
Summary of Management Fee Evaluation by Independent Fee Consultant (RiverSource Investments, LLC)
EXCERPT FROM REPORT OF INDEPENDENT FEE CONSULTANT TO THE FUNDS SUPERVISED BY THE COLUMBIA ATLANTIC BOARD
Prepared Pursuant to the February 9, 2005
Assurance of Discontinuance among the
Office of Attorney General of New York State,
Columbia Management Advisors, LLC, and
Columbia Management Distributors, Inc.
December 21, 2009
I. Overview
On February 9, 2005, Columbia Management Advisors, LLC ("CMA") and Columbia Management Distributors, Inc.1 ("CMD") agreed to the New York Attorney General's Assurance of Discontinuance ("AOD"). Among other things, the AOD stipulates that CMA may manage or advise a Columbia Fund ("Columbia Fund" and, together with some or all of such funds, the "Columbia Funds") only if the Independent Members of the Columbia Fund's Board of Trustees appoint a Senior Officer or retain an Independent Fee Consultant ("IFC") who is to manage the process by which proposed management fees are negotiated. The AOD further stipulates that the Senior Officer or IFC is to prepare a written annual evaluation of the fee negotiation process.
With effect from January 1, 2007, the Independent Members of the Board of Trustees for certain Columbia Funds known collectively as the "Atlantic Funds" (together with the other members of that Board, the "Trustees") retained me as IFC for the Atlantic Funds.2 In this capacity, I have prepared this written evaluation of the fee negotiation process. As was the case with the last three annual reports, my immediate predecessor as IFC, John Rea, provided invaluable assistance in the preparation of this report.
On September 29, 2009, Ameriprise entered into an asset purchase agreement with Bank of America, N.A. and its parent, Bank of America Corporation (together, the "Bank") pursuant to which the Bank agreed to sell certain CMG assets relating to Columbia's long-term asset management business, including management of the Atlantic Funds (the "Transaction").3 The Transaction if completed would result in the termination of the existing Investment Management Agreements with CMA. Therefore, the Trustees have been requested to approve and recommend to the shareholders of each Atlantic Fund new Investment Management and Sub-Advisory Agreements (together, the "Management Agreements") with RiverSource Investments, LLC ("RI"),4 investment manager of the RiverSource Funds and a subsidiary of Ameriprise. This report is intended to fulfill the requirements of the AOD with respect to the Trustees' consideration of the new Man agement Agreements.
A. Role of the Independent Fee Consultant
The AOD charges the IFC with "managing the process by which proposed management fees ... to be charged the Columbia Fund are negotiated so that they are negotiated in a manner which is at arms' length and reasonable and consistent with this Assurance of Discontinuance." The AOD also provides that CMA "may manage or advise a Columbia Fund only if the reasonableness of the proposed management fees is determined by the Board of Trustees ... using ... an annual independent written evaluation prepared by or under the direction of ... the Independent Fee Consultant." Therefore, the AOD makes clear that the IFC does not supplant the Trustees in negotiating management fees with CMA (or RI), nor does the IFC substitute his or her judgment for that of the Trustees with respect to the reasonableness of proposed fees or any other matter that is committed to the business judgment of the Trustees.
B. Elements Involved in Managing the Fee Negotiation Process
In preparing the report required by the AOD, the IFC must consider at least the following six factors set forth in the AOD:
1. The nature and quality of the adviser's services, including the Fund's performance;
1 CMA and CMD are subsidiaries of Columbia Management Group, LLC ("CMG"), and are the successors to the entities named in the AOD.
2 I have no material relationship with Bank of America, CMG or Ameriprise Financial, Inc. ("Ameriprise"), aside from serving as IFC, and I am aware of no material relationship with any of their affiliates. I retained John Rea, an independent economic consultant, to assist me with this report.
Unless otherwise stated or required by the context, this report covers only the Atlantic Funds.
3 Preliminary Response of Ameriprise to Information Request of Columbia Atlantic Board dated October 21, 2009 (hereafter, the "Preliminary Response"), p. 1. The one money market Atlantic Fund, Money Market Fund VS, was included in the Transaction because it was an integral part of CMG's array of Funds used as investment vehicles by variable annuity and similar insurance products.
4 Ameriprise intends to re-brand RI with the "Columbia" name (which is one of the assets being sold in the Transaction). Preliminary Response, pp. 4-5. In the case of new Sub-Advisory Agreements, the current sub-adviser would also be a party.
43
2. Management fees (including any components thereof) charged by other mutual fund companies for like services;
3. Possible economies of scale as the Fund grows larger;
4. Management fees (including any components thereof) charged to institutional and other clients of the adviser for like services;
5. Costs to the adviser and its affiliates of supplying services pursuant to the management fee agreements, excluding any intra-corporate profit; and
6. Profit margins of the adviser and its affiliates from supplying such services.
C. Data Presented to the Trustees
In considering the proposed new Management Agreements with RI, the Trustees relied in part on the data that had been prepared as part of their annual contract review process, which concluded in late October. This data remained relevant because the fees in the proposed Management Agreements were identical to the fees approved at that time. The annual review materials included a Lipper report on the performance of each Atlantic Fund compared to its peers and its benchmark, comparisons of the fees and expenses of each Atlantic Fund to similar CMG-sponsored Funds, comparable competitive funds chosen by Lipper, and institutional accounts advised by CMA, revenues, expenses, and profits of CMG from managing the Atlantic Funds, calculated both by Fund and collectively, and CMG's views on the existence and sharing of economies of scale.
In addition, the Trustees reviewed materials specific to the proposed new Management Agreements with RI in response to requests for information made on behalf of the Trustees, including the following:
• Performance data for the RiverSource Funds showing percentile and quartile rankings of each fund within its Lipper performance universe for periods up to five years and net returns of each fund relative to its benchmark returns. This data was arguably relevant due to the possibility that some RiverSource investment teams would be providing investment management services to certain Columbia Funds.5
• tables comparing the fee schedules and effective fee rates of funds managed by CMA and RI and institutional accounts advised by the two firms.
• extensive discussion of the process by which the various components of the two asset management businesses would be integrated including investment management, compliance, transfer agency, custody, fund accounting, and distribution.
• information about the financial condition of Ameriprise, including its most recent annual report on Form 10-K, RI's profit margins from managing the RiverSource Funds in 2007 and 2008, and pro forma income statements for the combined Columbia and RiverSource fund complex.
• disclosure that certain senior CMG executives, including President Michael Jones, Chief Investment Officer Colin Moore, Head of Mutual Funds J. Kevin Connaughton, and Chief Compliance Officer Linda Wondrack would continue in analogous capacities following the consummation of the Transaction, and
• a breakdown of the synergies RI expects to realize in the two years following the Transaction and the extent to which those potential synergies are expected to be shared with shareholders of funds advised by RI.
II. Findings
1. Based upon my examination of the information supplied by CMG and Ameriprise in the light of the six factors set forth in the AOD, I conclude that the Trustees have the relevant information necessary to evaluate the reasonableness of the proposed management fees for each Atlantic Fund.
2. In my view, the process by which the proposed management fees of the Atlantic Funds have been negotiated with RI thus far has been, to the extent practicable, at arms' length and reasonable and consistent with the AOD.
Respectfully submitted,
Steven E. Asher
5 On page 20 of its Supplemental Response to the Atlantic Trustees (undated but delivered November 24, 2009), Ameriprise said that "most personnel decisions, including with respect to the portfolio management teams for the Atlantic Funds . . . will be made primarily by [current CMA CIO] Colin Moore using the Columbia 5P process."
44
Shareholder Meeting Results
On March 3, 2010, a special meeting of shareholders of Columbia Funds Series Trust I was held to consider the approval of several proposals listed in the proxy statement for the meeting. Proposal 1 and Proposal 2 were voted on at the March 3, 2010 meeting of shareholders and Proposal 3 was voted on at an adjourned meeting of shareholders held on March 31, 2010. The shareholder meeting results are as follows:
Proposal 1: A proposed Investment Management Services Agreement with Columbia Management Investment Advisers, LLC (formerly, RiverSource Investments, LLC) (CMIA) was approved as follows:
| Votes For | | Votes Against | | Abstentions | | Broker Non-Votes | |
| | 395,230,055 | | | | 5,843,489 | | | | 4,314,261 | | | | 56,207,166 | | |
Proposal 2: A proposal authorizing CMIA to enter into and materially amend subadvisory agreements for the Fund in the future, with the approval of the Trust's Board of Trustees, but without obtaining additional shareholder approval, was approved as follows:
| Votes For | | Votes Against | | Abstentions | | Broker Non-Votes | |
| | 391,713,558 | | | | 9,492,158 | | | | 4,181,991 | | | | 56,207,266 | | |
Proposal 3: Each of the nominees for trustees was elected to the Trust's Board of Trustees, as follows:
| Trustee | | Votes For | | Votes Withheld | | Abstentions | |
| John D. Collins | | | 30,977,072,412 | | | | 859,827,038 | | | | 0 | | |
| Rodman L. Drake | | | 30,951,179,004 | | | | 885,720,446 | | | | 0 | | |
| Douglas A. Hacker | | | 30,989,793,279 | | | | 847,106,171 | | | | 0 | | |
| Janet Langford Kelly | | | 30,999,020,814 | | | | 837,878,636 | | | | 0 | | |
| William E. Mayer | | | 16,291,139,483 | | | | 15,545,759,967 | | | | 0 | | |
| Charles R. Nelson | | | 30,997,700,700 | | | | 839,198,750 | | | | 0 | | |
| John J. Neuhauser | | | 30,988,095,661 | | | | 848,803,789 | | | | 0 | | |
| Jonathon Piel | | | 30,968,801,048 | | | | 868,098,402 | | | | 0 | | |
| Patrick J. Simpson | | | 30,999,065,030 | | | | 837,834,420 | | | | 0 | | |
| Anne-Lee Verville | | | 30,996,227,913 | | | | 840,671,537 | | | | 0 | | |
45
This page intentionally left blank.
This page intentionally left blank.
This page intentionally left blank.
Important Information About This Report
The fund mails one shareholder report to each shareholder address. If you would like more than one report, please call shareholder services at 1-800-345-6611 and additional reports will be sent to you. This report has been prepared for shareholders of Columbia International Stock Fund.
A description of the policies and procedures that the fund uses to determine how to vote proxies and a copy of the fund's voting records are available (i) at www.columbiamanagement.com, (ii) on the Securities and Exchange Commission's website at www.sec.gov, and (iii) without charge, upon request, by calling 1-800-368-0346. Information regarding how the fund voted proxies relating to portfolio securities during the 12-month period ended June 30 is available from the SEC's website. Information regarding how the fund voted proxies relating to portfolio securities is also available from the fund's website, www.columbiamanagement.com.
The fund files a complete schedule of portfolio holdings with the SEC for the first and third quarters of each fiscal year on Form N-Q. The fund's Form N-Q is available on the SEC's website at www.sec.gov and may be reviewed and copied at the SEC's Public Reference Room in Washington, D.C. Information on the operation of the Public Reference Room may be obtained by calling 1-800-SEC-0330.
Transfer Agent
Columbia Management Investment
Services Corp.
P.O. Box 8081
Boston, MA 02266-8081
1-800-345-6611
Distributor
Columbia Management Investment
Distributors, Inc.
One Financial Center
Boston, MA 02111
Investment Advisor
Columbia Management Investment Advisers, LLC
100 Federal Street
Boston, MA 02110
49

PRSRT STD
U.S. Postage
PAID
Holliston, MA
Permit NO. 20
Columbia International Stock Fund
P. O. Box 8081
Boston, MA 02266-8081
columbiamanagement.com
This information is for use with concurrent or prior delivery of a fund prospectus. Investors should consider the investment objectives, risks, charges and expenses of a mutual fund carefully before investing. For a free prospectus, which contains this and other important information about the funds, visit columbiamanagement.com. Read the prospectus carefully before investing. The Fund is distributed by Columbia Management Investment Distributors, Inc., member FINRA, and managed by Columbia Management Investment Advisers, LLC.
© 2010 Columbia Management Investment Advisers, LLC. All rights reserved.
C-1626 A (10/10)

Columbia Mid Cap Growth Fund
Annual Report for the Period Ended August 31, 2010
Not FDIC insured • No bank guarantee • May lose value
Table of Contents
| Fund Profile | | | 1 | | |
|
| Economic Update | | | 2 | | |
|
| Performance Information | | | 4 | | |
|
| Understanding Your Expenses | | | 5 | | |
|
| Portfolio Managers' Report | | | 6 | | |
|
| Investment Portfolio | | | 8 | | |
|
Statement of Assets and
Liabilities | | | 12 | | |
|
| Statement of Operations | | | 14 | | |
|
Statement of Changes in
Net Assets | | | 15 | | |
|
| Financial Highlights | | | 17 | | |
|
| Notes to Financial Statements | | | 24 | | |
|
Report of Independent Registered
Public Accounting Firm | | | 33 | | |
|
| Federal Income Tax Information | | | 34 | | |
|
| Fund Governance | | | 35 | | |
|
Summary of Management Fee
Evaluation by Independent Fee
Consultant (RiverSource
Investment, LLC) | | | 40 | | |
|
| Shareholder Meeting Results | | | 42 | | |
|
Important Information About
This Report | | | 45 | | |
|
The views expressed in this report reflect the current views of the respective parties. These views are not guarantees of future performance and involve certain risks, uncertainties and assumptions that are difficult to predict, so actual outcomes and results may differ significantly from the views expressed. These views are subject to change at any time based upon economic, market or other conditions and the respective parties disclaim any responsibility to update such views. These views may not be relied on as investment advice and, because investment decisions for a Columbia Fund are based on numerous factors, may not be relied on as an indication of trading intent on behalf of any particular Columbia Fund. References to specific securities should not be construed as a recommendation or investment advice.
President's Message

Dear Shareholder:
The Columbia Management story began over 100 years ago, and today, we are one of the nation's largest dedicated asset managers. The recent acquisition by Ameriprise Financial, Inc. brings together the talents, resources and capabilities of Columbia Management with those of RiverSource Investments, Threadneedle (acquired by Ameriprise in 2003) and Seligman Investments (acquired by Ameriprise in 2008) to build a best-in-class asset management business that we believe is truly greater than its parts.
RiverSource Investments traces its roots to 1894 when its then newly-founded predecessor, Investors Syndicate, offered a face-amount savings certificate that gave small investors the opportunity to build a safe and secure fund for retirement, education or other special needs. A mutual fund pioneer, Investors Syndicate launched Investors Mutual Fund in 1940. In the decades that followed, its mutual fund products and services lineup grew to include a full spectrum of styles and specialties. More than 110 years later, RiverSource continues to be a trusted financial products leader.
Threadneedle, a leader in global asset management and one of Europe's largest asset managers, offers sophisticated international experience from a dedicated U.K. management team. Headquartered in London, it is named for Threadneedle Street in the heart of the city's financial district, where British investors pioneered international and global investing. Threadneedle was acquired in 2003 and today operates as an affiliate of Columbia Management.
Seligman Investments' beginnings date back to the establishment of the investment firm J. & W. Seligman & Co. in 1864. In the years that followed, Seligman played a major role in the geographical expansion and industrial development of the United States. In 1874, President Ulysses S. Grant named Seligman as fiscal agent for the U.S. Navy—an appointment that would last through World War I. Seligman helped finance the westward path of the railroads and the building of the Panama Canal. The firm organized its first investment company in 1929 and began managing its first mutual fund in 1930. In 2008, J. & W. Seligman & Co. Incorporated was acquired and Seligman Investments became an offering brand of RiverSource Investments, LLC.
We are proud of the rich and distinctive history of these firms, the strength and breadth of products and services they offer, and the combined cultures of pioneering spirit and forward thinking. Together we are committed to providing more for our shareholders than ever before.
> A singular focus on our shareholders
Our business is asset management, so investors are our first priority. We dedicate our resources to identifying timely investment opportunities and provide a comprehensive choice of equity, fixed-income and alternative investments to help meet your individual needs.
> First-class research and thought leadership
We are dedicated to helping you take advantage of today's opportunities and anticipate tomorrow's. We stay abreast of the latest investment trends and ideas, using our collective insight to evaluate events and transform them into solutions you can use.
> A disciplined investment approach
We aren't distracted by passing fads. Our teams adhere to a rigorous investment process that helps ensure the integrity of our products and enables you and your financial advisor to match our solutions to your objectives with confidence.
When you choose Columbia Management, you can be confident that we will take the time to understand your needs and help you and your financial advisor identify the solutions that are right for you. Because at Columbia Management, we don't consider ourselves successful unless you are.
Sincerely,

J. Kevin Connaughton
President, Columbia Funds
Investors should consider the investment objectives, risks, charges and expenses of a mutual fund carefully before investing. For a free prospectus, which contains this and other important information about the funds, visit www.columbiamanagement.com. The prospectus should be read carefully before investing.
Columbia Funds are distributed by Columbia Management Investment Distributors, Inc., member FINRA, and managed by Columbia Management Investment Advisers, LLC.
© 2010 Columbia Management Investment Advisers, LLC. All rights reserved.
Fund Profile – Columbia Mid Cap Growth Fund
Summary
g For the 12-month period that ended August 31, 2010, the fund's Class A shares returned 15.02% without sales charge.
g The fund outperformed both its benchmarks, the Russell Midcap Growth Index and the Russell Midcap Index,1 while also exceeding the average return of its peer group, the Lipper Mid-Cap Growth Funds Classification.2
g Successful stock selection, notably in energy, information technology and industrials, helped propel the fund's solid return.
Portfolio Management
Wayne M. Collette has co-managed the fund since February 2006 and has been associated with the advisor since May 2010. Prior to joining the advisor, Mr. Collette was associated with the fund's previous advisor or its predecessors since 2001.
George J. Myers has co-managed the fund since February 2006 and has been associated with the advisor since May 2010. Prior to joining the advisor, Mr. Myers was associated with the fund's previous advisor or its predecessors since 2004.
Lawrence W. Lin has co-managed the fund since October 2007 and has been associated with the advisor since May 2010. Prior to joining the advisor, Mr. Lin was associated with the fund's previous advisor or its predecessors since 2006.
Brian D. Neigut has co-managed the fund since October 2007 and has been associated with the advisor since May 2010. Prior to joining the advisor, Mr. Neigut was associated with the fund's previous advisor or its predecessors since 2007.
Effective May 1, 2010, RiverSource Investments, LLC, a subsidiary of Ameriprise Financial, Inc., became the investment advisor to the fund and changed its name to Columbia Management Investment Advisers, LLC. Please see the fund's prospectuses, as supplemented, for more information regarding the change in investment advisor and certain other changes.
1The Russell Midcap Growth Index measures the performance of those Russell Midcap companies with higher price-to-book ratios and higher forecasted growth values. The stocks are also members of the Russell 1000 Growth Index. The Russell Midcap Index measures the performance of the 800 smallest companies in the Russell 1000 Index, which represents approximately 25% of the total market capitalization of the Russell 1000 Index.
2Lipper Inc., a widely respected data provider in the industry, calculates an average total return (assuming reinvestment of distributions) for mutual funds with investment objectives similar to those of the fund. Lipper makes no adjustment for the effect of sales loads.
Indices are not available for investment, are not professionally managed and do not reflect sales charges, fees, brokerage commissions, taxes or other expenses of investing. Securities in the fund may not match those in an index.
Performance data quoted represents past performance and current performance may be lower or higher. Past performance is no guarantee of future results. The investment return and principal value will fluctuate so that shares, when redeemed, may be worth more or less than the original cost. Please visit www.columbiamanagement.com for daily and most recent month-end performance updates.
Summary
1-year return as of 08/31/2010
| | +15.02% | |
|
| |  | | | Class A shares
(without sales charge) | |
|
| | +11.58% | |
|
| |  | | | Russell Midcap Growth Index | |
|
| | +12.32% | |
|
| |  | | | Russell Midcap Index | |
|
Morningstar Style BoxTM

The Morningstar Style BoxTM is based on the Fund's portfolio holdings as of period end. For equity funds, the vertical axis shows the market capitalization of the stocks owned, and the horizontal axis shows investment style (value, blend, or growth). Information shown is based on the most recent data provided by Morningstar.
© 2010 Morningstar, Inc. All rights reserved. The information contained herein is proprietary to Morningstar and/or its content providers, may not be copied or distributed and is not warranted to be accurate, complete, or timely. Neither Morningstar nor its content providers are responsible for any damages or losses arising from any use of this information. Past performance is no guarantee of future results.
1
Economic Update – Columbia Mid Cap Growth Fund
Summary
For the 12-month period that ended August 31, 2010
g The U.S. stock market, as measured by the S&P 500 Index, delivered positive returns, despite a correction in the last months of the period. Emerging market stocks, as measured by the MSCI Emerging Markets Index (Net), outperformed U.S. stocks as well as stock markets in developed foreign markets.
| S&P Index | | MSCI Index | |
|
 | |  | |
|
g Modest economic growth and relatively low interest rates boosted bond market returns. The Barclays Capital Aggregate Bond Index delivered solid results. High-yield bonds outperformed stocks, as measured by the JPMorgan Developed BB High Yield Index.
Barclays
Aggregate Index | | JPMorgan
Index | |
|
 | |  | |
|
Although it has been more than a year since U.S. economic growth turned positive, the economy continues to send mixed signals about the sustainability of this recovery. Economic growth, as measured by gross domestic product (GDP), was a solid 5.0% in the last quarter of 2009. However, it was 3.7% in the first quarter of 2010 and only 1.7% in the second quarter. Expectations are for continued lackluster growth through the end of the year, as government incentive programs have ended and stimulus spending winds down. Even so, it appears to be unlikely that the U.S. economy will sink back into recession as many key indicators remain positive.
Consumer spending on cars, clothing and other goods increased throughout the year, although the pace of increased spending was small. Personal income also moved higher. Consumer confidence, as measured by the Conference Board Consumer Confidence Index, gained ground in the first half of 2010. However, the index fell sharply in June and July before stabilizing in August. Consumers surveyed in the last three months of the reporting period indicated they were concerned about business conditions and job prospects and generally apprehensive about the future.
The housing market—another bellwether for the consumer sector—showed few positive signs. Both new and existing home sales fell in the final months of the period as a federal tax credit for new and repeat homebuyers expired. Distressed properties continued to pressure prices and a huge backlog of foreclosed homes is likely to continue to keep a lid on prices for some time. The national median price of existing homes rose slightly over the one-year period, while the national median price of new homes declined. Despite near-record low mortgage rates, the inventory of unsold homes rose to a 12.5 month supply, up sharply at the end of the period. The long-term average is on the order of six months.
News on the job front was mostly positive in 2010, but the number of new jobs added to the economy fell short of expectations. A good portion of the jobs added in March, April and May were temporary, government-sponsored census positions, which began to unwind in June, July and August. Private sector job growth was disappointing given the stage of economic recovery. Nevertheless, private sector payroll employment trended modestly higher in the summer and news of massive layoffs declined.
Reports from the business side of the economy were generally positive. A key measure of the nation's manufacturing situation—the Institute for Supply Management's Index—was generally positive, although the index trended slightly downward in the final months of the period. Industrial production moved higher, as did the amount of manufacturing capacity utilized—a key measure of the health of the manufacturing sector.
Stock rally interrupted
Against a strengthening economic backdrop, a stock market rally that began early in 2009 continued into the spring of 2010. However, a debt crisis brewing in Europe raised concerns among U.S. investors, as did mixed signals on the economy, and some of the stock market's earlier gains vanished during the early summer. The S&P 500 Index1 returned 4.91% for the 12-month period. Outside the United States, stock market returns
1The Standard & Poor's (S&P) 500 Index tracks the performance of 500 widely held, large-capitalization U.S. stocks.
2
Economic Update (continued) – Columbia Mid Cap Growth Fund
were mixed. The MSCI EAFE Index (Net),2 a broad gauge of stock market performance in foreign developed markets, returned negative 2.34% (net of dividends, in U.S. dollars) for the period, as concerns about the impact of a bailout for weak eurozone economies weighed on the markets. Emerging stock markets were more resilient. The MSCI Emerging Markets Index (Net)3 returned 18.02% (in U.S. dollars) for the 12-month period.
Bonds delivered solid returns
As the economy strengthened, bonds delivered solid returns. The Barclays Capital Aggregate Bond Index4 returned 9.18%. Municipal bonds gained almost as much as taxable investment-grade bonds, even without factoring in potential tax advantages to investors in higher income-tax brackets. The Barclays Capital 3-15 Year Blend Municipal Bond Index5 returned 8.95%. The high-yield bond market outpaced stocks during the period by a margin of more than three to one. For the 12 months covered by this report, the JPMorgan Developed BB High Yield Index6 returned 17.68% while the S&P 500 Index returned 4.91%. Even the Treasury market was positive as the yield on the 10-year U.S. Treasury, a common bellwether for the bond market, fell nearly one full percentage point, from 3.4% to 2.5% over the 12-month period. Despite the pickup in economic activity, the Federal Reserve Board (the Fed) kept a key short-te rm interest rate—the federal funds rate—close to zero.
Past performance is no guarantee of future results.
2The Morgan Stanley Capital International Europe, Australasia, Far East (MSCI EAFE) Index (Net) is a free float-adjusted market capitalization Index that is designed to measure the equity market performance of developed markets, excluding the U.S. & Canada. As of May 27, 2010, the MSCI EAFE Index (Net) consisted of the following 22 developed market country indices: Australia, Austria, Belgium, Denmark, Finland, France, Germany, Greece, Hong Kong, Ireland, Israel, Italy, Japan, the Netherlands, New Zealand, Norway, Portugal, Singapore, Spain, Sweden, Switzerland, and the United Kingdom.
3The Morgan Stanley Capital International Emerging Markets (MSCI EM) Index (Net) is a free float-adjusted market capitalization index that is designed to measure equity market performance of emerging markets. As of May 27, 2010, the MSCI Emerging Markets Index (Net) consisted of the following 21 emerging market country indices: Brazil, Chile, China, Colombia, Czech Republic, Egypt, Hungary, India, Indonesia, Korea, Malaysia, Mexico, Morocco, Peru, Philippines, Poland, Russia, South Africa, Taiwan, Thailand, and Turkey.
4The Barclays Capital Aggregate Bond Index is a market value-weighted index that tracks the daily price, coupon, pay-downs and total return performance of fixed-rate, publicly placed, dollar-denominated and non-convertible investment grade debt issues with at least $250 million par amount outstanding and with at least one year to final maturity.
5The Barclays Capital 3-15 Year Blend Municipal Bond Index tracks the performance of municipal bonds issued after December 31, 1990 with remaining maturities between 2 and 17 years and at least $7 million in principal amount outstanding.
6The JPMorgan Developed BB High Yield Index is an unmanaged index designed to mirror the investable universe of the U.S. dollar developed, BB-rated, high yield corporate debt market.
Indices are not available for investment, are not professionally managed and do not reflect sales charges, fees, brokerage commissions, taxes or other expenses of investing. Securities in the fund may not match those in an index.
3
Performance Information – Columbia Mid Cap Growth Fund
Performance data quoted represents past performance and current performance may be lower or higher. Past performance is no guarantee of future results. The investment return and principal value will fluctuate so that shares, when redeemed, may be worth more or less than the original cost. Please visit www.columbiamanagement.com for daily and most recent month-end performance updates.
Annual operating expense ratio (%)*
| Class A | | | 1.27 | | |
| Class B | | | 2.02 | | |
| Class C | | | 2.02 | | |
| Class R | | | 1.52 | | |
| Class T | | | 1.32 | | |
| Class Y | | | 0.87 | | |
| Class Z | | | 1.02 | | |
* The annual operating expense ratio is as stated in the fund's prospectus that is current as of the date of this report. Differences in expense ratios disclosed elsewhere in this report may result from the inclusion of fee waivers and expense reimbursements as well as the use of different time periods to calculate the ratios.
Performance of a $10,000 investment 09/01/00 – 08/31/10
The chart above shows the change in value of a hypothetical $10,000 investment in Class A shares of Columbia Mid Cap Growth Fund during the stated time period, and does not reflect the deduction of taxes that a shareholder may pay on fund distributions or on the redemption of fund shares.
Performance of a $10,000 investment 09/01/00 – 08/31/10 ($)
| Sales charge | | without | | with | |
| Class A | | | 8,857 | | | | 8,347 | | |
| Class B | | | 8,347 | | | | 8,347 | | |
| Class C | | | 8,369 | | | | 8,369 | | |
| Class R | | | 8,753 | | | | n/a | | |
| Class T | | | 8,849 | | | | 8,339 | | |
| Class Y | | | 9,079 | | | | n/a | | |
| Class Z | | | 9,068 | | | | n/a | | |
Average annual total return as of 08/31/10 (%)
| Share class | | A | | B | | C | | R | | T | | Y | | Z | |
| Inception | | 11/01/02 | | 11/01/02 | | 10/13/03 | | 01/23/06 | | 11/01/02 | | 07/15/09 | | 11/20/85 | |
| Sales charge | | without | | with | | without | | with | | without | | with | | without | | without | | with | | without | | without | |
| 1-year | | | 15.02 | | | | 8.42 | | | | 14.10 | | | | 9.10 | | | | 14.13 | | | | 13.13 | | | | 14.70 | | | | 14.96 | | | | 8.36 | | | | 15.43 | | | | 15.29 | | |
| 5-year | | | 3.05 | | | | 1.83 | | | | 2.28 | | | | 1.96 | | | | 2.27 | | | | 2.27 | | | | 2.80 | | | | 2.99 | | | | 1.78 | | | | 3.32 | | | | 3.30 | | |
| 10-year | | | –1.21 | | | | –1.79 | | | | –1.79 | | | | –1.79 | | | | –1.77 | | | | –1.77 | | | | –1.32 | | | | –1.22 | | | | –1.80 | | | | –0.96 | | | | –0.97 | | |
Average annual total return as of 09/30/10 (%)
| Share class | | A | | B | | C | | R | | T | | Y | | Z | |
| Sales charge | | without | | with | | without | | with | | without | | with | | without | | without | | with | | without | | without | |
| 1-year | | | 20.72 | | | | 13.77 | | | | 19.79 | | | | 14.79 | | | | 19.79 | | | | 18.79 | | | | 20.39 | | | | 20.62 | | | | 13.67 | | | | 21.25 | | | | 21.05 | | |
| 5-year | | | 4.92 | | | | 3.69 | | | | 4.14 | | | | 3.81 | | | | 4.14 | | | | 4.14 | | | | 4.67 | | | | 4.86 | | | | 3.62 | | | | 5.21 | | | | 5.18 | | |
| 10-year | | | 0.16 | | | | –0.43 | | | | –0.43 | | | | –0.43 | | | | –0.41 | | | | –0.41 | | | | 0.04 | | | | 0.15 | | | | –0.44 | | | | 0.42 | | | | 0.40 | | |
The "with sales charge" returns include the maximum initial sales charge of 5.75% for Class A and T shares, the applicable contingent deferred sales charge of 5.00% in the first year, declining to 1.00% in the sixth year and eliminated thereafter for Class B shares and 1.00% for Class C shares for the first year only. The "without sales charge" returns do not include the effect of sales charges. If they had, returns would be lower.
Performance results reflect any fee waivers or reimbursements of fund expenses by the investment advisor and/or any of its affiliates. Absent these fee waivers or expense reimbursement arrangements, performance results would have been lower.
All results shown assume reinvestment of distributions. Class Y and Class Z shares are sold at net asset value with no distribution and service (Rule 12b-1) fees. Class R shares are sold at net asset value with distribution (Rule 12b-1) fees. Class R, Class Y and Class Z shares have limited eligibility and the investment minimum requirements may vary. Please see the fund's prospectuses for details. Performance for different share classes will vary based on differences in sales charges and fees associated with each class.
The tables do not reflect the deduction of taxes that a shareholder may pay on fund distributions or on the redemption of fund shares.
Class A, Class B, Class C, Class R, Class T and Class Y are newer classes of shares. Class A, Class B, Class T and Class Y shares performance information includes the performance of Class Z shares (the oldest existing share class) for periods prior to their inception. Class C shares performance information includes returns of Class B shares for the period from November 1, 2002 through October 12, 2003, and the returns of Class Z shares for periods prior thereto. Class R share performance information includes returns of Class A shares for the period from November 1, 2002 through January 22, 2006, and the returns of Class Z share for periods prior thereto. These returns reflect differences in sales charges, but have not been restated to reflect any differences in expenses (such as distribution and service (Rule 12b-1) fees) between Class Z shares and the newer classes of shares. If differences in expenses had been reflected, the r eturns shown for Class A, Class B, Class C, Class R and Class T shares for periods during which Class Z share returns are included would have been lower, since the newer classes of shares are subject to distribution and service (Rule 12b-1) fees. Class A and Class B shares were initially offered on November 1, 2002, Class C shares were initially offered on October 13, 2003, Class R shares were initially offered on January 23, 2006, Class T shares were initially offered on November 1, 2002, Class Y shares were initially offered on July 15, 2009 and Class Z shares were initially offered on November 20, 1985.
4
Understanding Your Expenses – Columbia Mid Cap Growth Fund
As a fund shareholder, you incur two types of costs. There are transaction costs, which generally include sales charges on purchases and may include redemption fees or exchange fees. There are also ongoing costs, which generally include investment advisory fees, distribution and service (Rule 12b-1) fees and other fund expenses. The information on this page is intended to help you understand the ongoing costs of investing in the fund and to compare these costs with the ongoing costs of investing in other mutual funds.
Analyzing your fund's expenses by share class
To illustrate these ongoing costs, we have provided an example and calculated the expenses paid by investors in each share class during the period. The information in the following table is based on an initial investment of $1,000, which is invested at the beginning of the period and held for the entire period. Expense information is calculated two ways and each method provides you with different information. The amount listed in the "Actual" column is calculated using the fund's actual operating expenses and total return for the period. The amount listed in the "Hypothetical" column for each share class assumes that the return each year is 5% before expenses and is calculated based on the fund's actual operating expenses. You should not use the hypothetical account values and expenses to estimate either your actual account balance at the end of the period or the expenses you paid during this period.
Compare with other funds
Since all mutual funds are required to include the same hypothetical calculations about expenses in shareholder reports, you can use this information to compare the ongoing cost of investing in the fund with other funds. To do so, compare the 5% hypothetical example with the 5% hypothetical examples that appear in the shareholder reports of other funds. As you compare hypothetical examples of other funds, it is important to note that hypothetical examples are meant to highlight the ongoing costs of investing in a fund and do not reflect any transaction costs, such as sales charges, redemption fees or exchange fees.
Estimating your actual expenses
To estimate the expenses that you paid over the period, first you will need your account balance at the end of the period:
g For shareholders who receive their account statements from Columbia Management Investment Services Corp., your account balance is available online at www.columbiamanagement.com or by calling Shareholder Services at 800.345.6611.
g For shareholders who receive their account statements from their financial intermediary, contact your financial intermediary to obtain your account balance.
1. Divide your ending account balance by $1,000. For example, if an account balance was $8,600 at the end of the period, the result would be 8.6.
2. In the section of the table below titled "Expenses paid during the period," locate the amount for your share class. You will find this number in the column labeled "Actual." Multiply this number by the result from step 1. Your answer is an estimate of the expenses you paid on your account during the period.
If the value of your account falls below the minimum initial investment requirement applicable to you, your account may be subject to a $20 annual fee. This fee is not included in the accompanying table. If you are subject to the fee, keep it in mind when you are estimating the ongoing expenses of investing in the fund and when comparing the expenses of this fund with other funds.
03/01/10 – 08/31/10
| | | Account value at the
beginning of the period ($) | | Account value at the
end of the period ($) | | Expenses paid
during the period ($) | | Fund's annualized
expense ratio (%) | |
| | | Actual | | Hypothetical | | Actual | | Hypothetical | | Actual | | Hypothetical | | Actual | |
| Class A | | | 1,000.00 | | | | 1,000.00 | | | | 1,008.00 | | | | 1,019.00 | | | | 6.23 | | | | 6.26 | | | | 1.23 | | |
| Class B | | | 1,000.00 | | | | 1,000.00 | | | | 1,004.20 | | | | 1,015.22 | | | | 10.00 | | | | 10.06 | | | | 1.98 | | |
| Class C | | | 1,000.00 | | | | 1,000.00 | | | | 1,003.70 | | | | 1,015.22 | | | | 10.00 | | | | 10.06 | | | | 1.98 | | |
| Class R | | | 1,000.00 | | | | 1,000.00 | | | | 1,006.50 | | | | 1,017.74 | | | | 7.49 | | | | 7.53 | | | | 1.48 | | |
| Class T | | | 1,000.00 | | | | 1,000.00 | | | | 1,007.50 | | | | 1,018.75 | | | | 6.48 | | | | 6.51 | | | | 1.28 | | |
| Class Y | | | 1,000.00 | | | | 1,000.00 | | | | 1,009.70 | | | | 1,020.97 | | | | 4.26 | | | | 4.28 | | | | 0.84 | | |
| Class Z | | | 1,000.00 | | | | 1,000.00 | | | | 1,009.30 | | | | 1,020.27 | | | | 4.96 | | | | 4.99 | | | | 0.98 | | |
Expenses paid during the period are equal to the annualized expense ratio for the share class, multiplied by the average account value over the period, then multiplied by the number of days in the fund's most recent fiscal half-year and divided by 365.
It is important to note that the expense amounts shown in the table are meant to highlight only ongoing costs of investing in the fund and do not reflect any transaction costs, such as sales charges, redemption fees or exchange fees. Therefore, the hypothetical examples provided may not help you determine the relative total costs of owning shares of different funds. If these transaction costs were included, your costs would have been higher.
5
Portfolio Managers' Report – Columbia Mid Cap Growth Fund
Performance data quoted represents past performance and current performance may be lower or higher. Past performance is no guarantee of future results. The investment return and principal value will fluctuate so that shares, when redeemed, may be worth more or less than the original cost. Please visit www.columbiamanagement.com for daily and most recent month-end performance updates.
Net asset value per share
as of 08/31/10 ($)
| Class A | | | 20.22 | | |
| Class B | | | 18.93 | | |
| Class C | | | 18.98 | | |
| Class R | | | 19.98 | | |
| Class T | | | 20.21 | | |
| Class Y | | | 20.72 | | |
| Class Z | | | 20.72 | | |
Distributions declared per share
09/01/09 – 08/31/10 ($)
| Class Y | | | 0.03 | | |
| Class Z | | | 0.01 | | |
Top 5 sectors
as of 08/31/10 (%)
| Information Technology | | | 21.8 | | |
| Consumer Discretionary | | | 19.7 | | |
| Health Care | | | 13.7 | | |
| Industrials | | | 12.9 | | |
| Energy | | | 7.9 | | |
Top 10 holdings
as of 08/31/10 (%)
| TIBCO Software | | | 1.6 | | |
| Bucyrus International | | | 1.6 | | |
| Alliance Data System | | | 1.6 | | |
| Cummins | | | 1.5 | | |
| C.H. Robinson Worldwide | | | 1.5 | | |
| BorgWarner | | | 1.4 | | |
| Red Hat | | | 1.4 | | |
Laboratory Corp. of
America Holdings | | | 1.3 | | |
| Rovi | | | 1.3 | | |
| Concho Resources | | | 1.3 | | |
The fund is actively managed and the composition of its portfolio will change over time. Information provided is calculated as a percentage of net assets.
For the 12-month period that ended August 31, 2010, the fund's Class A shares returned 15.02% without sales charge. The fund outpaced its benchmarks, the Russell Midcap Growth Index, which returned 11.58%, and the Russell Midcap Index, which rose by 12.32%, for the same period. The fund's return also outdistanced the 11.36% average return of its peer group, the Lipper Mid-Cap Growth Funds Classification. Solid security selection helped drive the fund's strong relative performance. Investments in metals, mining, coal and oil companies did particularly well in late 2009 and early 2010, gaining from strong demand from emerging market nations.
Energy, technology and industrials selections helped drive outperformance
Selections in the energy, information technology and industrials sectors contributed substantially to the fund's outperformance. In energy, the leading contributors included Concho Resources and Core Laboratories (1.3% and 0.7% of net assets, respectively). An oil and gas exploration and production company, Concho generated impressive earnings results, driven by higher production volumes and lower costs. Core Laboratories, an oilfield service company, also produced healthy profits and had the continuing advantage of greater geographic diversification than many of its competitors. Among our technology holdings, Salesforce.com, Akamai Technologies and Cognizant Technology Solutions (1.1%, 0.9% and 1.2% of net assets, respectively) were three stand-out performers. In an environment in which corporations strived to improve workforce productivity, Salesforce.com enjoyed brisk demand for its software designed to improve the efficiency of sales associates. Akamai benefited from the growing demand for services to enhance the delivery of content, including video, that requires greater bandwidth to move over the Internet. Meanwhile Cognizant profited from increased corporate spending on information technology outsourcing. In the industrials group, leading performers included Bucyrus International and Cummins Inc. (1.6% and 1.5% of net assets, respectively). Bucyrus took advantage of increased demand for mining equipment in the emerging markets, while Cummins was boosted by a cyclical rebound for engines, fuel systems and emission systems. Other notable contributors included Cliffs Natural Resources (1.0% of net assets) in the materials sector and Priceline.com (0.9% of net assets) in the consumer discretionary group. Cliffs Natural Resources gained from strong domestic demand for steel and global demand for iron ore and metallurgical coal. Priceline.com provided an attractive airline reservations service for cost-conscious travelers.
Disappointments were generally stock specific
In the consumer discretionary group, increasing regulatory pressures took their toll on for-profit education company DeVry, which we sold. Investors worried that the pressures could lead to declining enrollments at schools operated by the company. In health care, Myriad Genetics and Brookdale Senior Living (0.5% of net assets) both held back results. Myriad, which we sold, suffered from weakening sales trends for its molecular diagnostic devices. The share price of Brookdale fell in the face of potentially greater regulation of fees for entering continuing-care retirement communities. In the financials sector, two disappointments were Janus Capital Group and Principal Financial Group, both of which we sold.
6
Portfolio Managers' Report (continued) – Columbia Mid Cap Growth Fund
A timely shift away from higher-volatility stocks
During the period, we reduced the fund's investments in companies that appear highly dependent on vigorous expansion of the domestic economy, where growth is vulnerable to the effects of persistently high unemployment, sluggish wage growth and a weak housing market. We are seeking solid companies with favorable product cycle trends that have the ability to do well regardless of the direction of the overall economy. We believe the market, in general, will start to favor companies whose earnings are less dependent on the direction of the general economy.
Portfolio characteristics and holdings are subject to change and may not be representative of current characteristics and holdings. The outlook for this fund may differ from that presented for other Columbia Funds.
Equity securities are affected by stock market fluctuations that occur in response to economic and business developments.
Risks include stock market fluctuations due to business and economic developments. Investments in small- and mid-cap companies may be subject to greater volatility and price fluctuations because they may be thinly traded and less liquid.
7
Investment Portfolio – Columbia Mid Cap Growth Fund
August 31, 2010
| Common Stocks – 97.2% | |
| | | Shares | | Value ($) | |
| Consumer Discretionary – 19.7% | |
| Auto Components – 2.5% | |
| BorgWarner, Inc. (a) | | | 350,980 | | | | 15,320,277 | | |
| Cooper Tire & Rubber Co. | | | 391,910 | | | | 6,345,023 | | |
| Lear Corp. (a) | | | 78,230 | | | | 5,762,422 | | |
| Auto Components Total | | | 27,427,722 | | |
| Diversified Consumer Services – 0.6% | |
Grand Canyon Education,
Inc. (a) | | | 396,849 | | | | 6,782,149 | | |
| Diversified Consumer Services Total | | | 6,782,149 | | |
| Hotels, Restaurants & Leisure – 4.3% | |
| Chipotle Mexican Grill, Inc. (a) | | | 65,970 | | | | 9,950,255 | | |
Ctrip.com International Ltd.,
ADR (a) | | | 245,290 | | | | 9,931,792 | | |
| Las Vegas Sands Corp. (a) | | | 235,320 | | | | 6,666,616 | | |
| Panera Bread Co., Class A (a) | | | 83,160 | | | | 6,647,810 | | |
Royal Caribbean Cruises
Ltd. (a) | | | 205,610 | | | | 5,049,782 | | |
| WMS Industries, Inc. (a) | | | 226,900 | | | | 8,018,646 | | |
| Hotels, Restaurants & Leisure Total | | | 46,264,901 | | |
| Household Durables – 1.7% | |
Tempur-Pedic International,
Inc. (a) | | | 445,490 | | | | 11,939,132 | | |
| Whirlpool Corp. | | | 86,130 | | | | 6,387,401 | | |
| Household Durables Total | | | 18,326,533 | | |
| Internet & Catalog Retail – 0.9% | |
| priceline.com, Inc. (a) | | | 33,190 | | | | 9,674,221 | | |
| Internet & Catalog Retail Total | | | 9,674,221 | | |
| Media – 1.7% | |
| CBS Corp., Class B | | | 468,190 | | | | 6,470,386 | | |
Lamar Advertising Co.,
Class A (a) | | | 214,140 | | | | 5,612,609 | | |
| McGraw-Hill Companies, Inc. | | | 246,250 | | | | 6,808,813 | | |
| Media Total | | | 18,891,808 | | |
| Multiline Retail – 1.9% | |
| Big Lots, Inc. (a) | | | 432,390 | | | | 13,516,511 | | |
| Nordstrom, Inc. | | | 249,760 | | | | 7,223,059 | | |
| Multiline Retail Total | | | 20,739,570 | | |
| Specialty Retail – 4.1% | |
| Advance Auto Parts, Inc. | | | 221,220 | | | | 12,049,853 | | |
| Dick's Sporting Goods, Inc. (a) | | | 260,310 | | | | 6,369,786 | | |
| Limited Brands, Inc. | | | 229,650 | | | | 5,419,740 | | |
| TJX Companies, Inc. | | | 280,840 | | | | 11,146,540 | | |
| Urban Outfitters, Inc. (a) | | | 329,310 | | | | 9,984,679 | | |
| Specialty Retail Total | | | 44,970,598 | | |
| | | Shares | | Value ($) | |
| Textiles, Apparel & Luxury Goods – 2.0% | |
| Coach, Inc. | | | 160,370 | | | | 5,747,661 | | |
| Hanesbrands, Inc. (a) | | | 217,890 | | | | 5,216,286 | | |
| Lululemon Athletica, Inc. (a) | | | 338,100 | | | | 11,164,062 | | |
| Textiles, Apparel & Luxury Goods Total | | | 22,128,009 | | |
| Consumer Discretionary Total | | | 215,205,511 | | |
| Consumer Staples – 5.5% | |
| Beverages – 0.6% | |
| Hansen Natural Corp. (a) | | | 135,430 | | | | 6,099,767 | | |
| Beverages Total | | | 6,099,767 | | |
| Food Products – 1.6% | |
Green Mountain Coffee
Roasters, Inc. (a) | | | 181,650 | | | | 5,598,453 | | |
| H.J. Heinz Co. | | | 255,890 | | | | 11,832,354 | | |
| Food Products Total | | | 17,430,807 | | |
| Household Products – 1.1% | |
| Clorox Co. | | | 194,700 | | | | 12,620,454 | | |
| Household Products Total | | | 12,620,454 | | |
| Personal Products – 2.2% | |
| Avon Products, Inc. | | | 409,180 | | | | 11,907,138 | | |
| Herbalife Ltd. | | | 217,740 | | | | 12,101,989 | | |
| Personal Products Total | | | 24,009,127 | | |
| Consumer Staples Total | | | 60,160,155 | | |
| Energy – 7.9% | |
| Energy Equipment & Services – 4.3% | |
Cameron International
Corp. (a) | | | 187,070 | | | | 6,880,435 | | |
| Core Laboratories N.V. | | | 101,240 | | | | 7,990,873 | | |
| FMC Technologies, Inc. (a) | | | 122,180 | | | | 7,556,833 | | |
McDermott International,
Inc. (a) | | | 442,360 | | | | 5,671,055 | | |
| Noble Corp. | | | 211,650 | | | | 6,586,548 | | |
| Seadrill Ltd. | | | 289,469 | | | | 6,709,891 | | |
Weatherford International
Ltd. (a) | | | 363,570 | | | | 5,420,829 | | |
| Energy Equipment & Services Total | | | 46,816,464 | | |
| Oil, Gas & Consumable Fuels – 3.6% | |
Alpha Natural Resources,
Inc. (a) | | | 193,530 | | | | 7,185,769 | | |
| Concho Resources, Inc. (a) | | | 239,339 | | | | 13,982,184 | | |
| Continental Resources, Inc. (a) | | | 152,670 | | | | 6,186,188 | | |
| Denbury Resources, Inc. (a) | | | 387,940 | | | | 5,718,236 | | |
See Accompanying Notes to Financial Statements.
8
Columbia Mid Cap Growth Fund
August 31, 2010
| Common Stocks (continued) | |
| | | Shares | | Value ($) | |
| Southwestern Energy Co. (a) | | | 200,120 | | | | 6,547,927 | | |
| Oil, Gas & Consumable Fuels Total | | | 39,620,304 | | |
| Energy Total | | | 86,436,768 | | |
| Financials – 6.3% | |
| Capital Markets – 2.3% | |
Affiliated Managers Group,
Inc. (a) | | | 200,190 | | | | 12,854,200 | | |
| T. Rowe Price Group, Inc. | | | 187,820 | | | | 8,222,759 | | |
TD Ameritrade Holding
Corp. (a) | | | 315,770 | | | | 4,613,400 | | |
| Capital Markets Total | | | 25,690,359 | | |
| Consumer Finance – 0.6% | |
| Discover Financial Services | | | 446,460 | | | | 6,478,134 | | |
| Consumer Finance Total | | | 6,478,134 | | |
| Diversified Financial Services – 1.4% | |
IntercontinentalExchange,
Inc. (a) | | | 87,550 | | | | 8,366,278 | | |
| MSCI, Inc., Class A (a) | | | 229,700 | | | | 6,868,030 | | |
| Diversified Financial Services Total | | | 15,234,308 | | |
| Real Estate Investment Trusts (REITs) – 2.0% | |
| Digital Realty Trust, Inc. | | | 146,400 | | | | 8,677,128 | | |
Nationwide Health
Properties, Inc. | | | 165,630 | | | | 6,371,786 | | |
| Plum Creek Timber Co., Inc. | | | 186,980 | | | | 6,445,201 | | |
| Real Estate Investment Trusts (REITs) Total | | | 21,494,115 | | |
| Financials Total | | | 68,896,916 | | |
| Health Care – 13.7% | |
| Biotechnology – 2.5% | |
Alexion Pharmaceuticals,
Inc. (a) | | | 185,950 | | | | 10,500,596 | | |
| Dendreon Corp. (a) | | | 169,470 | | | | 6,073,805 | | |
Human Genome Sciences,
Inc. (a) | | | 229,000 | | | | 6,661,610 | | |
| Onyx Pharmaceuticals, Inc. (a) | | | 191,822 | | | | 4,620,992 | | |
| Biotechnology Total | | | 27,857,003 | | |
| Health Care Equipment & Supplies – 2.4% | |
| Gen-Probe, Inc. (a) | | | 166,770 | | | | 7,509,653 | | |
| Intuitive Surgical, Inc. (a) | | | 28,680 | | | | 7,601,060 | | |
| NuVasive, Inc. (a) | | | 208,380 | | | | 6,115,953 | | |
| Thoratec Corp. (a) | | | 146,619 | | | | 4,721,132 | | |
| Health Care Equipment & Supplies Total | | | 25,947,798 | | |
| | | Shares | | Value ($) | |
| Health Care Providers & Services – 4.5% | |
| Brookdale Senior Living, Inc. (a) | | | 417,370 | | | | 5,592,758 | | |
| Express Scripts, Inc. (a) | | | 323,180 | | | | 13,767,468 | | |
Laboratory Corp. of America
Holdings (a) | | | 199,050 | | | | 14,455,011 | | |
| Mednax, Inc. (a) | | | 180,870 | | | | 8,381,516 | | |
| Patterson Companies, Inc. | | | 272,780 | | | | 6,898,606 | | |
| Health Care Providers & Services Total | | | 49,095,359 | | |
| Health Care Technology – 0.6% | |
| Cerner Corp. (a) | | | 89,900 | | | | 6,549,215 | | |
| Health Care Technology Total | | | 6,549,215 | | |
| Life Sciences Tools & Services – 2.9% | |
| ICON PLC, ADR (a) | | | 381,217 | | | | 8,386,774 | | |
| Illumina, Inc. (a) | | | 246,982 | | | | 10,593,058 | | |
| Life Technologies Corp. (a) | | | 298,540 | | | | 12,768,556 | | |
| Life Sciences Tools & Services Total | | | 31,748,388 | | |
| Pharmaceuticals – 0.8% | |
Watson Pharmaceuticals,
Inc. (a) | | | 205,030 | | | | 8,830,642 | | |
| Pharmaceuticals Total | | | 8,830,642 | | |
| Health Care Total | | | 150,028,405 | | |
| Industrials – 12.9% | |
| Aerospace & Defense – 1.9% | |
| BE Aerospace, Inc. (a) | | | 294,110 | | | | 7,926,265 | | |
| ITT Corp. | | | 115,630 | | | | 4,914,275 | | |
| Precision Castparts Corp. | | | 72,273 | | | | 8,179,858 | | |
| Aerospace & Defense Total | | | 21,020,398 | | |
| Air Freight & Logistics – 2.1% | |
Atlas Air Worldwide Holdings,
Inc. (a) | | | 153,390 | | | | 6,647,923 | | |
| C.H. Robinson Worldwide, Inc. | | | 245,170 | | | | 15,933,598 | | |
| Air Freight & Logistics Total | | | 22,581,521 | | |
| Airlines – 0.8% | |
| Delta Air Lines, Inc. (a) | | | 834,850 | | | | 8,732,531 | | |
| Airlines Total | | | 8,732,531 | | |
| Commercial Services & Supplies – 0.5% | |
| Stericycle, Inc. (a) | | | 88,320 | | | | 5,784,960 | | |
| Commercial Services & Supplies Total | | | 5,784,960 | | |
| Electrical Equipment – 0.9% | |
| AMETEK, Inc. | | | 236,950 | | | | 10,186,480 | | |
| Electrical Equipment Total | | | 10,186,480 | | |
See Accompanying Notes to Financial Statements.
9
Columbia Mid Cap Growth Fund
August 31, 2010
| Common Stocks (continued) | |
| | | Shares | | Value ($) | |
| Machinery – 3.7% | |
| Bucyrus International, Inc. | | | 302,510 | | | | 17,391,300 | | |
| Cummins, Inc. | | | 225,860 | | | | 16,806,243 | | |
| Pall Corp. | | | 179,470 | | | | 6,136,079 | | |
| Machinery Total | | | 40,333,622 | | |
| Professional Services – 0.6% | |
| IHS, Inc., Class A (a) | | | 108,130 | | | | 6,681,353 | | |
| Professional Services Total | | | 6,681,353 | | |
| Road & Rail – 1.8% | |
| Kansas City Southern (a) | | | 321,860 | | | | 10,804,840 | | |
Old Dominion Freight Line,
Inc. (a) | | | 354,465 | | | | 8,262,579 | | |
| Road & Rail Total | | | 19,067,419 | | |
| Trading Companies & Distributors – 0.6% | |
| Fastenal Co. | | | 149,240 | | | | 6,756,095 | | |
| Trading Companies & Distributors Total | | | 6,756,095 | | |
| Industrials Total | | | 141,144,379 | | |
| Information Technology – 21.8% | |
| Communications Equipment – 2.4% | |
| Blue Coat Systems, Inc. (a) | | | 373,370 | | | | 7,030,557 | | |
| CommScope, Inc. (a) | | | 328,960 | | | | 6,168,000 | | |
| F5 Networks, Inc. (a) | | | 144,760 | | | | 12,656,367 | | |
| Communications Equipment Total | | | 25,854,924 | | |
| Computers & Peripherals – 0.6% | |
| NetApp, Inc. (a) | | | 164,820 | | | | 6,665,321 | | |
| Computers & Peripherals Total | | | 6,665,321 | | |
| Internet Software & Services – 3.6% | |
| Akamai Technologies, Inc. (a) | | | 222,190 | | | | 10,236,293 | | |
| Baidu, Inc., ADR (a) | | | 130,130 | | | | 10,206,096 | | |
| MercadoLibre, Inc. (a) | | | 102,950 | | | | 6,788,523 | | |
| VeriSign, Inc. (a) | | | 191,770 | | | | 5,586,260 | | |
| VistaPrint NV (a) | | | 210,250 | | | | 6,450,470 | | |
| Internet Software & Services Total | | | 39,267,642 | | |
| IT Services – 3.6% | |
| Alliance Data Systems Corp. (a) | | | 301,710 | | | | 16,953,085 | | |
Cognizant Technology Solutions
Corp., Class A (a) | | | 229,550 | | | | 13,223,228 | | |
| Teradata Corp. (a) | | | 291,900 | | | | 9,556,806 | | |
| IT Services Total | | | 39,733,119 | | |
| Semiconductors & Semiconductor Equipment – 3.9% | |
| Analog Devices, Inc. | | | 330,759 | | | | 9,221,561 | | |
| Cree, Inc. (a) | | | 100,180 | | | | 5,363,637 | | |
| | | Shares | | Value ($) | |
Marvell Technology Group
Ltd. (a) | | | 343,310 | | | | 5,472,361 | | |
Omnivision Technologies,
Inc. (a) | | | 281,620 | | | | 5,773,210 | | |
| Silicon Laboratories, Inc. (a) | | | 124,540 | | | | 4,749,956 | | |
| Trina Solar Ltd., ADR (a) | | | 257,130 | | | | 6,628,811 | | |
| Xilinx, Inc. | | | 239,100 | | | | 5,774,265 | | |
Semiconductors & Semiconductor
Equipment Total | | | 42,983,801 | | |
| Software – 7.7% | |
| ANSYS, Inc. (a) | | | 151,530 | | | | 5,876,333 | | |
| Autodesk, Inc. (a) | | | 198,940 | | | | 5,520,585 | | |
| Citrix Systems, Inc. (a) | | | 127,500 | | | | 7,387,350 | | |
| Intuit, Inc. (a) | | | 128,990 | | | | 5,520,772 | | |
| Red Hat, Inc. (a) | | | 443,310 | | | | 15,316,361 | | |
| Rovi Corp. (a) | | | 326,104 | | | | 14,188,785 | | |
| Salesforce.com, Inc. (a) | | | 111,000 | | | | 12,196,680 | | |
| TIBCO Software, Inc. (a) | | | 1,226,010 | | | | 17,764,885 | | |
| Software Total | | | 83,771,751 | | |
| Information Technology Total | | | 238,276,558 | | |
| Materials – 5.6% | |
| Chemicals – 1.2% | |
| CF Industries Holdings, Inc. | | | 137,040 | | | | 12,676,200 | | |
| Chemicals Total | | | 12,676,200 | | |
| Construction Materials – 0.6% | |
| Martin Marietta Materials, Inc. | | | 87,860 | | | | 6,431,352 | | |
| Construction Materials Total | | | 6,431,352 | | |
| Containers & Packaging – 1.0% | |
| Crown Holdings, Inc. (a) | | | 407,780 | | | | 11,360,751 | | |
| Containers & Packaging Total | | | 11,360,751 | | |
| Metals & Mining – 2.8% | |
| Agnico-Eagle Mines Ltd. | | | 193,300 | | | | 12,558,701 | | |
| Cliffs Natural Resources, Inc. | | | 178,210 | | | | 10,904,670 | | |
| Steel Dynamics, Inc. | | | 482,410 | | | | 6,609,017 | | |
| Metals & Mining Total | | | 30,072,388 | | |
| Materials Total | | | 60,540,691 | | |
| Telecommunication Services – 3.1% | |
| Wireless Telecommunication Services – 3.1% | |
American Tower Corp.,
Class A (a) | | | 287,777 | | | | 13,485,230 | | |
| NII Holdings, Inc. (a) | | | 203,710 | | | | 7,384,488 | | |
See Accompanying Notes to Financial Statements.
10
Columbia Mid Cap Growth Fund
August 31, 2010
| Common Stocks (continued) | |
| | | Shares | | Value ($) | |
SBA Communications Corp.,
Class A (a) | | | 357,190 | | | | 12,787,402 | | |
| Wireless Telecommunication Services Total | | | 33,657,120 | | |
| Telecommunication Services Total | | | 33,657,120 | | |
| Utilities – 0.7% | |
| Multi-Utilities – 0.7% | |
| CenterPoint Energy, Inc. | | | 508,226 | | | | 7,516,663 | | |
| Multi-Utilities Total | | | 7,516,663 | | |
| Utilities Total | | | 7,516,663 | | |
Total Common Stocks
(cost of $908,233,903) | | | 1,061,863,166 | | |
| Short-Term Obligation – 2.9% | |
| | | Par ($) | | | |
Repurchase agreement with
Fixed Income Clearing Corp.,
dated 08/31/10, due 09/01/10
at 0.180%, collateralized by
a U.S. Treasury obligation
maturing 08/15/39, market
value $32,379,442 (repurchase
proceeds $31,744,159) | | | 31,744,000 | | | | 31,744,000 | | |
Total Short-Term Obligation
(cost of $31,744,000) | | | 31,744,000 | | |
Total Investments – 100.1%
(cost of $939,977,903) (b) | | | 1,093,607,166 | | |
| Other Assets & Liabilities, Net – (0.1)% | | | (747,138 | ) | |
| Net Assets – 100.0% | | | 1,092,860,028 | | |
Notes to Investment Portfolio:
(a) Non-income producing security.
(b) Cost for federal income tax purposes is $945,830,697.
The following table summarizes the inputs used, as of August 31, 2010, in valuing the Fund's assets:
| Description | | Quoted Prices
(Level 1) | | Other
Significant
Observable
Inputs
(Level 2) | | Significant
Unobservable
Inputs
(Level 3) | | Total | |
| Total Common Stocks | | $ | 1,061,863,166 | | | $ | — | | | $ | — | | | $ | 1,061,863,166 | | |
Total Short-Term
Obligation | | | — | | | | 31,744,000 | | | | — | | | | 31,744,000 | | |
| Total Investments | | $ | 1,061,863,166 | | | $ | 31,744,000 | | | $ | — | | | $ | 1,093,607,166 | | |
Certain short-term obligations may be valued using amortized cost, an income approach which converts future cash flows to a present value based upon the premium or discount at purchase.
For more information on valuation inputs, and their aggregation into the levels used in the table above, please refer to the Security Valuation section in the accompanying Notes to Financial Statements.
For the year ended August 31, 2010, transactions in written call option contracts were as follows:
| | | Number of
contracts | | Premium
received | |
| Options outstanding at August 31, 2009 | | | — | | | | — | | |
| Options written | | | 1,718 | | | $ | 339,183 | | |
Options terminated in closing
purchase transactions | | | — | | | | — | | |
| Options exercised | | | — | | | | — | | |
| Options expired | | | (1,718 | ) | | | (339,183 | ) | |
| Options outstanding at August 31, 2010 | | | — | | | $ | — | | |
At August 31, 2010, the Fund held investments in the following sectors:
| Sector (Unaudited) | | % of
Net Assets | |
| Information Technology | | | 21.8 | | |
| Consumer Discretionary | | | 19.7 | | |
| Health Care | | | 13.7 | | |
| Industrials | | | 12.9 | | |
| Energy | | | 7.9 | | |
| Financials | | | 6.3 | | |
| Materials | | | 5.6 | | |
| Consumer Staples | | | 5.5 | | |
| Telecommunication Services | | | 3.1 | | |
| Utilities | | | 0.7 | | |
| | | | 97.2 | | |
| Short-Term Obligation | | | 2.9 | | |
| Other Assets & Liabilities, Net | | | (0.1 | ) | |
| | | | 100.0 | | |
| Acronym | | Name | |
| ADR | | American Depositary Receipt | |
|
See Accompanying Notes to Financial Statements.
11
Statement of Assets and Liabilities – Columbia Mid Cap Growth Fund
August 31, 2010
| | | | | ($) | |
| Assets | | Investments, at identified cost | | | 939,977,903 | | |
| | | Investments, at value | | | 1,093,607,166 | | |
| | | Cash | | | 214 | | |
| | | Receivable for: | | | | | |
| | | Fund shares sold | | | 276,049 | | |
| | | Dividends | | | 854,037 | | |
| | | Interest | | | 159 | | |
| | | Trustees' deferred compensation plan | | | 72,417 | | |
| | | Prepaid expenses | | | 25,583 | | |
| | | Total Assets | | | 1,094,835,625 | | |
| Liabilities | | Payable for: | | | | | |
| | | Fund shares repurchased | | | 758,594 | | |
| | | Investment advisory fee | | | 745,958 | | |
| | | Pricing and bookkeeping fees | | | 12,486 | | |
| | | Transfer agent fee | | | 179,943 | | |
| | | Trustees' fees | | | 28,045 | | |
| | | Custody fee | | | 6,599 | | |
| | | Distribution and service fees | | | 35,284 | | |
| | | Chief compliance officer expenses | | | 336 | | |
| | | Trustees' deferred compensation plan | | | 72,417 | | |
| | | Other liabilities | | | 135,935 | | |
| | | Total Liabilities | | | 1,975,597 | | |
| | | Net Assets | | | 1,092,860,028 | | |
| Net Assets Consist of | | Paid-in capital | | | 1,089,309,949 | | |
| | | Overdistributed net investment income | | | (136,787 | ) | |
| | | Accumulated net realized loss | | | (149,942,397 | ) | |
| | | Net unrealized appreciation on investments | | | 153,629,263 | | |
| | | Net Assets | | | 1,092,860,028 | | |
See Accompanying Notes to Financial Statements.
12
Statement of Assets and Liabilities (continued) – Columbia Mid Cap Growth Fund
August 31, 2010
| Class A | | Net assets | | $ | 65,123,044 | | |
| | | Shares outstanding | | | 3,220,423 | | |
| | | Net asset value per share | | $ | 20.22 | (a) | |
| | | Maximum sales charge | | | 5.75 | % | |
| | | Maximum offering price per share ($20.22/0.9425) | | $ | 21.45 | (b) | |
| Class B | | Net assets | | $ | 5,581,662 | | |
| | | Shares outstanding | | | 294,859 | | |
| | | Net asset value and offering price per share | | $ | 18.93 | (a) | |
| Class C | | Net assets | | $ | 9,858,493 | | |
| | | Shares outstanding | | | 519,318 | | |
| | | Net asset value and offering price per share | | $ | 18.98 | (a) | |
| Class R | | Net assets | | $ | 5,112,378 | | |
| | | Shares outstanding | | | 255,838 | | |
| | | Net asset value and offering price per share | | $ | 19.98 | | |
| Class T | | Net assets | | $ | 19,581,597 | | |
| | | Shares outstanding | | | 968,882 | | |
| | | Net asset value per share | | $ | 20.21 | (a) | |
| | | Maximum sales charge | | | 5.75 | % | |
| | | Maximum offering price per share ($20.21/0.9425) | | $ | 21.44 | (b) | |
| Class Y | | Net assets | | $ | 1,013,072 | | |
| | | Shares outstanding | | | 48,889 | | |
| | | Net asset value and offering price per share | | $ | 20.72 | | |
| Class Z | | Net assets | | $ | 986,589,782 | | |
| | | Shares outstanding | | | 47,615,723 | | |
| | | Net asset value and offering price per share | | $ | 20.72 | | |
(a) Redemption price per share is equal to net asset value less any applicable contingent deferred sales charge.
(b) On sales of $50,000 or more the offering price is reduced.
See Accompanying Notes to Financial Statements.
13
Statement of Operations – Columbia Mid Cap Growth Fund
For the Year Ended August 31, 2010
| | | | | ($) | |
| Investment Income | | Dividends | | | 8,518,079 | | |
| | | Interest | | | 29,447 | | |
| | | Foreign taxes withheld | | | (21,226 | ) | |
| | | Total Investment Income | | | 8,526,300 | | |
| Expenses | | Investment advisory fee | | | 8,916,897 | | |
| | | Distribution fee: | | | | | |
| | | Class B | | | 56,414 | | |
| | | Class C | | | 76,973 | | |
| | | Class R | | | 22,154 | | |
| | | Service fee: | | | | | |
| | | Class A | | | 157,272 | | |
| | | Class B | | | 18,805 | | |
| | | Class C | | | 25,658 | | |
| | | Shareholder services fee—Class T | | | 61,959 | | |
| | | Pricing and bookkeeping fees | | | 145,095 | | |
| | | Transfer agent fee: | | | | | |
| | | Class A, Class B, Class C, Class R, Class T, Class Z | | | 1,586,875 | | |
| | | Transfer agent fee—Class Y | | | 46 | | |
| | | Trustees' fees | | | 65,579 | | |
| | | Custody fee | | | 56,685 | | |
| | | Reports to shareholders | | | 188,045 | | |
| | | Chief compliance officer expenses | | | 1,638 | | |
| | | Other expenses | | | 279,045 | | |
| | | Expenses before interest expense | | | 11,659,140 | | |
| | | Interest expense | | | 1,160 | | |
| | | Total Expenses | | | 11,660,300 | | |
| | | Expense reductions | | | (299 | ) | |
| | | Net Expenses | | | 11,660,001 | | |
| | | Net Investment Loss | | | (3,133,701 | ) | |
| Net Realized and Unrealized Gain (Loss) on Investments, Foreign Currency and Written Options | | Net realized gain (loss) on: | | | | | |
| | | Investments | | | 181,902,546 | | |
| | | Foreign currency transactions | | | (60,277 | ) | |
| | | Written options | | | 339,183 | | |
| | | Net realized gain | | | 182,181,452 | | |
| | | Net change in unrealized appreciation (depreciation) | | | (18,392,381 | ) | |
| | | Net Gain | | | 163,789,071 | | |
| | | Net Increase Resulting from Operations | | | 160,655,370 | | |
See Accompanying Notes to Financial Statements.
14
Statement of Changes in Net Assets – Columbia Mid Cap Growth Fund
| | | | | Year Ended August 31, | |
| Increase (Decrease) in Net Assets | | | | 2010 ($) | | 2009 ($) (a) | |
| Operations | | Net investment income (loss) | | | (3,133,701 | ) | | | 119,095 | | |
| | | Net realized gain (loss) on investments, foreign currency
transactions and written options | | | 182,181,452 | | | | (323,119,113 | ) | |
| | | Net change in unrealized appreciation (depreciation) | | | (18,392,381 | ) | | | (2,775,863 | ) | |
| | | Net increase (decrease) resulting from operations | | | 160,655,370 | | | | (325,775,881 | ) | |
| Distributions to Shareholders | | From net investment income: | | | | | | | | | |
| | | Class Y | | | (2,922 | ) | | | — | | |
| | | Class Z | | | (477,929 | ) | | | — | | |
| | | From net realized gains: | | | | | | | | | |
| | | Class A | | | — | | | | (1,358,266 | ) | |
| | | Class B | | | — | | | | (314,199 | ) | |
| | | Class C | | | — | | | | (263,576 | ) | |
| | | Class R | | | — | | | | (39,054 | ) | |
| | | Class T | | | — | | | | (545,428 | ) | |
| | | Class Z | | | — | | | | (25,919,329 | ) | |
| | | Total distributions to shareholders | | | (480,851 | ) | | | (28,439,852 | ) | |
| | | Net Capital Stock Transactions | | | (119,131,646 | ) | | | (2,385,092 | ) | |
| | | Increase from regulatory settlements | | | — | | | | 253,476 | | |
| | | Total increase (decrease) in net assets | | | 41,042,873 | | | | (356,347,349 | ) | |
| Net Assets | | Beginning of period | | | 1,051,817,155 | | | | 1,408,164,504 | | |
| | | End of period | | | 1,092,860,028 | | | | 1,051,817,155 | | |
| | | Undistributed (overdistributed) net investment
income, at end of period | | | (136,787 | ) | | | 347,574 | | |
(a) Class Y shares commenced operations on July 15, 2009.
See Accompanying Notes to Financial Statements.
15
Statement of Changes in Net Assets (continued) – Columbia Mid Cap Growth Fund
| | | Capital Stock Activity | |
| | | Year Ended
August 31, 2010 | | Year Ended
August 31, 2009 (a)(b) | |
| | | Shares | | Dollars ($) | | Shares | | Dollars ($) | |
| Class A | |
| Subscriptions | | | 921,409 | | | | 18,728,421 | | | | 1,325,611 | | | | 20,942,358 | | |
| Distributions reinvested | | | — | | | | — | | | | 92,517 | | | | 1,247,914 | | |
| Redemptions | | | (765,185 | ) | | | (15,343,264 | ) | | | (1,052,807 | ) | | | (15,739,486 | ) | |
| Net increase | | | 156,224 | | | | 3,385,157 | | | | 365,321 | | | | 6,450,786 | | |
| Class B | |
| Subscriptions | | | 52,543 | | | | 990,084 | | | | 110,528 | | | | 1,579,437 | | |
| Distributions reinvested | | | — | | | | — | | | | 22,692 | | | | 290,458 | | |
| Redemptions | | | (259,463 | ) | | | (4,972,238 | ) | | | (339,719 | ) | | | (4,808,540 | ) | |
| Net decrease | | | (206,920 | ) | | | (3,982,154 | ) | | | (206,499 | ) | | | (2,938,645 | ) | |
| Class C | |
| Subscriptions | | | 88,723 | | | | 1,682,301 | | | | 247,147 | | | | 3,434,668 | | |
| Distributions reinvested | | | — | | | | — | | | | 16,018 | | | | 205,511 | | |
| Redemptions | | | (116,905 | ) | | | (2,240,947 | ) | | | (319,840 | ) | | | (4,881,049 | ) | |
| Net decrease | | | (28,182 | ) | | | (558,646 | ) | | | (56,675 | ) | | | (1,240,870 | ) | |
| Class R | |
| Subscriptions | | | 134,520 | | | | 2,673,501 | | | | 210,812 | | | | 3,285,912 | | |
| Distributions reinvested | | | — | | | | — | | | | 2,133 | | | | 28,557 | | |
| Redemptions | | | (101,174 | ) | | | (1,964,246 | ) | | | (67,669 | ) | | | (1,075,077 | ) | |
| Net increase | | | 33,346 | | | | 709,255 | | | | 145,276 | | | | 2,239,392 | | |
| Class T | |
| Subscriptions | | | 6,928 | | | | 141,759 | | | | 14,049 | | | | 212,279 | | |
| Distributions reinvested | | | — | | | | — | | | | 39,726 | | | | 536,305 | | |
| Redemptions | | | (109,861 | ) | | | (2,227,593 | ) | | | (123,232 | ) | | | (1,878,375 | ) | |
| Net decrease | | | (102,933 | ) | | | (2,085,834 | ) | | | (69,457 | ) | | | (1,129,791 | ) | |
| Class Y | |
| Subscriptions | | | 61,701 | | | | 1,321,278 | | | | 266,736 | | | | 4,450,800 | | |
| Distributions reinvested | | | 1 | | | | 20 | | | | — | | | | — | | |
| Redemptions | | | (183,395 | ) | | | (3,698,530 | ) | | | (96,154 | ) | | | (1,696,154 | ) | |
| Net increase (decrease) | | | (121,693 | ) | | | (2,377,232 | ) | | | 170,582 | | | | 2,754,646 | | |
| Class Z | |
| Subscriptions | | | 4,308,947 | | | | 88,875,986 | | | | 9,977,319 | | | | 157,271,217 | | |
| Distributions reinvested | | | 13,416 | | | | 266,166 | | | | 1,250,287 | | | | 17,216,609 | | |
| Redemptions | | | (9,802,292 | ) | | | (203,364,344 | ) | | | (11,924,613 | ) | | | (183,008,436 | ) | |
| Net decrease | | | (5,479,929 | ) | | | (114,222,192 | ) | | | (697,007 | ) | | | (8,520,610 | ) | |
(a) Class Y shares commenced operations on July 15, 2009.
(b) Class Y shares reflect activity for the period July 15, 2009 through August 31, 2009.
See Accompanying Notes to Financial Statements.
16
Financial Highlights – Columbia Mid Cap Growth Fund
Selected data for a share outstanding throughout each period is as follows:
| | | Year Ended August 31, | |
| Class A Shares | | 2010 | | 2009 | | 2008 | | 2007 | | 2006 | |
| Net Asset Value, Beginning of Period | | $ | 17.58 | | | $ | 23.47 | | | $ | 27.51 | | | $ | 24.01 | | | $ | 22.16 | | |
| Income from Investment Operations: | |
| Net investment loss (a) | | | (0.10 | ) | | | (0.03 | ) | | | (0.12 | ) | | | (0.01 | )(b) | | | (0.10 | ) | |
Net realized and unrealized gain (loss) on investments,
foreign currency and written options | | | 2.74 | | | | (5.37 | ) | | | (0.06 | ) | | | 4.97 | | | | 2.26 | | |
| Total from investment operations | | | 2.64 | | | | (5.40 | ) | | | (0.18 | ) | | | 4.96 | | | | 2.16 | | |
| Less Distributions to Shareholders: | |
| From net realized gains | | | — | | | | (0.49 | ) | | | (3.86 | ) | | | (1.46 | ) | | | (0.31 | ) | |
| Increase from regulatory settlements | | | — | | | | — | (c) | | | — | | | | — | | | | — | | |
| Net Asset Value, End of Period | | $ | 20.22 | | | $ | 17.58 | | | $ | 23.47 | | | $ | 27.51 | | | $ | 24.01 | | |
| Total return (d) | | | 15.02 | % | | | (22.38 | )% | | | (2.21 | )% | | | 21.24 | % | | | 9.76 | %(e) | |
| Ratios to Average Net Assets/Supplemental Data: | |
| Net expenses before interest expense (f) | | | 1.23 | % | | | 1.26 | % | | | 1.18 | % | | | 1.17 | % | | | 1.21 | % | |
| Interest expense | | | — | %(g) | | | — | | | | — | %(g) | | | — | %(g) | | | — | | |
| Net expenses (f) | | | 1.23 | % | | | 1.26 | % | | | 1.18 | % | | | 1.17 | % | | | 1.21 | % | |
| Waiver/Reimbursement | | | — | | | | — | | | | — | | | | — | | | | 0.01 | % | |
| Net investment loss (f) | | | (0.49 | )% | | | (0.20 | )% | | | (0.48 | )% | | | (0.05 | )% | | | (0.43 | )% | |
| Portfolio turnover rate | | | 137 | % | | | 160 | % | | | 149 | % | | | 171 | % | | | 67 | % | |
| Net assets, end of period (000s) | | $ | 65,123 | | | $ | 53,881 | | | $ | 63,337 | | | $ | 49,614 | | | $ | 12,654 | | |
(a) Per share data was calculated using the average shares outstanding during the period.
(b) Net investment income per share reflects special dividends. The effect of these dividends amounted to $0.07 per share.
(c) Rounds to less than $0.01 per share.
(d) Total return at net asset value assuming all distributions reinvested and no initial sales charge or contingent deferred sales charge.
(e) Had the investment advisor and/or any of its affiliates not waived fees or reimbursed a portion of expenses, total return would have been reduced.
(f) The benefits derived from expense reductions had an impact of less than 0.01%.
(g) Rounds to less than 0.01%.
See Accompanying Notes to Financial Statements.
17
Financial Highlights – Columbia Mid Cap Growth Fund
Selected data for a share outstanding throughout each period is as follows:
| | | Year Ended August 31, | |
| Class B Shares | | 2010 | | 2009 | | 2008 | | 2007 | | 2006 | |
| Net Asset Value, Beginning of Period | | $ | 16.59 | | | $ | 22.35 | | | $ | 26.47 | | | $ | 23.32 | | | $ | 21.69 | | |
| Income from Investment Operations: | |
| Net investment loss (a) | | | (0.23 | ) | | | (0.14 | ) | | | (0.30 | ) | | | (0.20 | )(b) | | | (0.28 | ) | |
Net realized and unrealized gain (loss) on investments,
foreign currency and written options | | | 2.57 | | | | (5.13 | ) | | | (0.04 | ) | | | 4.81 | | | | 2.22 | | |
| Total from investment operations | | | 2.34 | | | | (5.27 | ) | | | (0.34 | ) | | | 4.61 | | | | 1.94 | | |
| Less Distributions to Shareholders: | |
| From net realized gains | | | — | | | | (0.49 | ) | | | (3.78 | ) | | | (1.46 | ) | | | (0.31 | ) | |
| Increase from regulatory settlements | | | — | | | | — | (c) | | | — | | | | — | | | | — | | |
| Net Asset Value, End of Period | | $ | 18.93 | | | $ | 16.59 | | | $ | 22.35 | | | $ | 26.47 | | | $ | 23.32 | | |
| Total return (d) | | | 14.10 | % | | | (22.93 | )% | | | (2.92 | )% | | | 20.33 | % | | | 8.95 | %(e) | |
| Ratios to Average Net Assets/Supplemental Data: | |
| Net expenses before interest expense (f) | | | 1.98 | % | | | 2.01 | % | | | 1.93 | % | | | 1.92 | % | | | 1.96 | % | |
| Interest expense | | | — | %(g) | | | — | | | | — | %(g) | | | — | %(g) | | | — | | |
| Net expenses (f) | | | 1.98 | % | | | 2.01 | % | | | 1.93 | % | | | 1.92 | % | | | 1.96 | % | |
| Waiver/Reimbursement | | | — | | | | — | | | | — | | | | — | | | | 0.01 | % | |
| Net investment loss (f) | | | (1.24 | )% | | | (0.95 | )% | | | (1.23 | )% | | | (0.79 | )% | | | (1.19 | )% | |
| Portfolio turnover rate | | | 137 | % | | | 160 | % | | | 149 | % | | | 171 | % | | | 67 | % | |
| Net assets, end of period (000s) | | $ | 5,582 | | | $ | 8,322 | | | $ | 15,829 | | | $ | 19,472 | | | $ | 7,452 | | |
(a) Per share data was calculated using the average shares outstanding during the period.
(b) Net investment income per share reflects special dividends. The effect of these dividends amounted to $0.07 per share.
(c) Rounds to less than $0.01 per share.
(d) Total return at net asset value assuming all distributions reinvested and no contingent deferred sales charge.
(e) Had the investment advisor and/or any of its affiliates not waived fees or reimbursed a portion of expenses, total return would have been reduced.
(f) The benefits derived from expense reductions had an impact of less than 0.01%.
(g) Rounds to less than 0.01%.
See Accompanying Notes to Financial Statements.
18
Financial Highlights – Columbia Mid Cap Growth Fund
Selected data for a share outstanding throughout each period is as follows:
| | | Year Ended August 31, | |
| Class C Shares | | 2010 | | 2009 | | 2008 | | 2007 | | 2006 | |
| Net Asset Value, Beginning of Period | | $ | 16.63 | | | $ | 22.41 | | | $ | 26.53 | | | $ | 23.37 | | | $ | 21.74 | | |
| Income from Investment Operations: | |
| Net investment loss (a) | | | (0.24 | ) | | | (0.14 | ) | | | (0.30 | ) | | | (0.21 | )(b) | | | (0.28 | ) | |
Net realized and unrealized gain (loss) on investments,
foreign currency and written options | | | 2.59 | | | | (5.15 | ) | | | (0.04 | ) | | | 4.83 | | | | 2.22 | | |
| Total from investment operations | | | 2.35 | | | | (5.29 | ) | | | (0.34 | ) | | | 4.62 | | | | 1.94 | | |
| Less Distributions to Shareholders: | |
| From net realized gains | | | — | | | | (0.49 | ) | | | (3.78 | ) | | | (1.46 | ) | | | (0.31 | ) | |
| Increase from regulatory settlements | | | — | | | | — | (c) | | | — | | | | — | | | | — | | |
| Net Asset Value, End of Period | | $ | 18.98 | | | $ | 16.63 | | | $ | 22.41 | | | $ | 26.53 | | | $ | 23.37 | | |
| Total return (d) | | | 14.13 | % | | | (22.96 | )% | | | (2.91 | )% | | | 20.33 | % | | | 8.93 | %(e) | |
| Ratios to Average Net Assets/Supplemental Data: | |
| Net expenses before interest expense (f) | | | 1.98 | % | | | 2.01 | % | | | 1.93 | % | | | 1.92 | % | | | 1.96 | % | |
| Interest expense | | | — | %(g) | | | — | | | | — | %(g) | | | — | %(g) | | | — | | |
| Net expenses (f) | | | 1.98 | % | | | 2.01 | % | | | 1.93 | % | | | 1.92 | % | | | 1.96 | % | |
| Waiver/Reimbursement | | | — | | | | — | | | | — | | | | — | | | | 0.01 | % | |
| Net investment loss (f) | | | (1.24 | )% | | | (0.95 | )% | | | (1.23 | )% | | | (0.81 | )% | | | (1.16 | )% | |
| Portfolio turnover rate | | | 137 | % | | | 160 | % | | | 149 | % | | | 171 | % | | | 67 | % | |
| Net assets, end of period (000s) | | $ | 9,858 | | | $ | 9,106 | | | $ | 13,540 | | | $ | 8,237 | | | $ | 2,454 | | |
(a) Per share data was calculated using the average shares outstanding during the period.
(b) Net investment income per share reflects special dividends. The effect of these dividends amounted to $0.07 per share.
(c) Rounds to less than $0.01 per share.
(d) Total return at net asset value assuming all distributions reinvested and no contingent deferred sales charge.
(e) Had the investment advisor and/or any of its affiliates not waived fees or reimbursed a portion of expenses, total return would have been reduced.
(f) The benefits derived from expense reductions had an impact of less than 0.01%.
(g) Rounds to less than 0.01%.
See Accompanying Notes to Financial Statements.
19
Financial Highlights – Columbia Mid Cap Growth Fund
Selected data for a share outstanding throughout each period is as follows:
| | | Year Ended August 31, | | Period Ended
August 31, | |
| Class R Shares | | 2010 | | 2009 | | 2008 | | 2007 | | 2006 (a) | |
| Net Asset Value, Beginning of Period | | $ | 17.42 | | | $ | 23.32 | | | $ | 27.39 | | | $ | 23.97 | | | $ | 24.44 | | |
| Income from Investment Operations: | |
| Net investment loss (b) | | | (0.15 | ) | | | (0.07 | ) | | | (0.18 | ) | | | (0.15 | )(c) | | | (0.10 | ) | |
Net realized and unrealized gain (loss) on investments,
foreign currency and written options | | | 2.71 | | | | (5.34 | ) | | | (0.06 | ) | | | 5.03 | | | | (0.37 | ) | |
| Total from investment operations | | | 2.56 | | | | (5.41 | ) | | | (0.24 | ) | | | 4.88 | | | | (0.47 | ) | |
| Less Distributions to Shareholders: | |
| From net realized gains | | | — | | | | (0.49 | ) | | | (3.83 | ) | | | (1.46 | ) | | | — | | |
| Increase from regulatory settlements | | | — | | | | — | (d) | | | — | | | | — | | | | — | | |
| Net Asset Value, End of Period | | $ | 19.98 | | | $ | 17.42 | | | $ | 23.32 | | | $ | 27.39 | | | $ | 23.97 | | |
| Total return (e) | | | 14.70 | % | | | (22.57 | )% | | | (2.44 | )% | | | 20.93 | % | | | (1.92 | )%(f) | |
| Ratios to Average Net Assets/Supplemental Data: | |
| Net expenses before interest expense (g) | | | 1.48 | % | | | 1.51 | % | | | 1.43 | % | | | 1.42 | % | | | 1.47 | %(h) | |
| Interest expense | | | — | %(i) | | | — | | | | — | %(i) | | | — | %(i) | | | — | | |
| Net expenses (g) | | | 1.48 | % | | | 1.51 | % | | | 1.43 | % | | | 1.42 | % | | | 1.47 | %(h) | |
| Net investment loss (g) | | | (0.73 | )% | | | (0.45 | )% | | | (0.74 | )% | | | (0.57 | )% | | | (0.66 | )%(h) | |
| Portfolio turnover rate | | | 137 | % | | | 160 | % | | | 149 | % | | | 171 | % | | | 67 | %(f) | |
| Net assets, end of period (000s) | | $ | 5,112 | | | $ | 3,876 | | | $ | 1,800 | | | $ | 908 | | | $ | 57 | | |
(a) Class R shares were initially offered on January 23, 2006. Total return reflects activity from that date.
(b) Per share data was calculated using the average shares outstanding during the period.
(c) Net investment income per share reflects special dividends. The effect of these dividends amounted to $0.07 per share.
(d) Rounds to less than $0.01 per share.
(e) Total return at net assets value assuming all distributions reinvested.
(f) Not annualized.
(g) The benefits derived from expense reductions had an impact of less than 0.01%.
(h) Annualized.
(i) Rounds to less than 0.01%.
See Accompanying Notes to Financial Statements.
20
Financial Highlights – Columbia Mid Cap Growth Fund
Selected data for a share outstanding throughout each period is as follows:
| | | Year Ended August 31, | |
| Class T Shares | | 2010 | | 2009 | | 2008 | | 2007 | | 2006 | |
| Net Asset Value, Beginning of Period | | $ | 17.58 | | | $ | 23.48 | | | $ | 27.53 | | | $ | 24.04 | | | $ | 22.20 | | |
| Income from Investment Operations: | |
| Net investment loss (a) | | | (0.11 | ) | | | (0.04 | ) | | | (0.14 | ) | | | (0.03 | )(b) | | | (0.12 | ) | |
Net realized and unrealized gain (loss) on investments,
foreign currency and written options | | | 2.74 | | | | (5.37 | ) | | | (0.06 | ) | | | 4.98 | | | | 2.27 | | |
| Total from investment operations | | | 2.63 | | | | (5.41 | ) | | | (0.20 | ) | | | 4.95 | | | | 2.15 | | |
| Less Distributions to Shareholders: | |
| From net realized gains | | | — | | | | (0.49 | ) | | | (3.85 | ) | | | (1.46 | ) | | | (0.31 | ) | |
| Increase from regulatory settlements | | | — | | | | — | (c) | | | — | | | | — | | | | — | | |
| Net Asset Value, End of Period | | $ | 20.21 | | | $ | 17.58 | | | $ | 23.48 | | | $ | 27.53 | | | $ | 24.04 | | |
| Total return (d) | | | 14.96 | % | | | (22.41 | )% | | | (2.27 | )% | | | 21.17 | % | | | 9.70 | %(e) | |
| Ratios to Average Net Assets/Supplemental Data: | |
| Net expenses before interest expense (f) | | | 1.28 | % | | | 1.31 | % | | | 1.23 | % | | | 1.22 | % | | | 1.26 | % | |
| Interest expense | | | — | %(g) | | | — | | | | — | %(g) | | | — | %(g) | | | — | | |
| Net expenses (f) | | | 1.28 | % | | | 1.31 | % | | | 1.23 | % | | | 1.22 | % | | | 1.26 | % | |
| Waiver/Reimbursement | | | — | | | | — | | | | — | | | | — | | | | 0.01 | % | |
| Net investment loss (f) | | | (0.54 | )% | | | (0.25 | )% | | | (0.53 | )% | | | (0.10 | )% | | | (0.50 | )% | |
| Portfolio turnover rate | | | 137 | % | | | 160 | % | | | 149 | % | | | 171 | % | | | 67 | % | |
| Net assets, end of period (000s) | | $ | 19,582 | | | $ | 18,847 | | | $ | 26,801 | | | $ | 29,282 | | | $ | 27,101 | | |
(a) Per share data was calculated using the average shares outstanding during the period.
(b) Net investment income per share reflects special dividends. The effect of these dividends amounted to $0.07 per share.
(c) Rounds to less than $0.01 per share.
(d) Total return at net asset value assuming all distributions reinvested and no initial sales charge or contingent deferred sales charge.
(e) Had the investment advisor and/or any of its affiliates not waived fees or reimbursed a portion of expenses, total return would have been reduced.
(f) The benefits derived from expense reductions had an impact of less than 0.01%.
(g) Rounds to less than 0.01%.
See Accompanying Notes to Financial Statements.
21
Financial Highlights – Columbia Mid Cap Growth Fund
Selected data for a share outstanding throughout each period is as follows:
| Class Y Shares | | Year Ended
August 31,
2010 | | Period Ended
August 31,
2009 (a) | |
| Net Asset Value, Beginning of Year | | $ | 17.98 | | | $ | 16.18 | | |
| Income from Investment Operations: | |
| Net investment income (loss) (b) | | | (0.03 | ) | | | 0.01 | | |
Net realized and unrealized gain on investments,
foreign currency and written options | | | 2.80 | | | | 1.79 | | |
| Total from investment operations | | | 2.77 | | | | 1.80 | | |
| Less Distributions Declared to Shareholders: | |
| From net investment income | | | (0.03 | ) | | | — | | |
| Net Asset Value, End of Period | | $ | 20.72 | | | $ | 17.98 | | |
| Total Return (c) | | | 15.43 | % | | | 11.12 | %(d) | |
| Ratios to Average Net Assets: | |
| Net expenses before interest expense (e) | | | 0.84 | % | | | 0.86 | %(f) | |
| Interest expense | | | — | %(g) | | | — | | |
| Net expenses (e) | | | 0.84 | % | | | 0.86 | %(f) | |
| Net investment income (loss) (e) | | | (0.13 | )% | | | 0.31 | %(f) | |
| Portfolio turnover rate | | | 137 | % | | | 160 | %(d) | |
| Net assets, end of period (000s) | | $ | 1,013 | | | $ | 3,067 | | |
(a) Class Y shares commenced operations on July 15, 2009. Per share data and total return reflect activity from that date.
(b) Per share data was calculated using the average shares outstanding during the period.
(c) Total return at net asset value assuming all distributions reinvested.
(d) Not annualized.
(e) The benefits derived from expense reductions had an impact of less than 0.01%.
(f) Annualized.
(g) Rounds to less than 0.01%.
See Accompanying Notes to Financial Statements.
22
Financial Highlights – Columbia Mid Cap Growth Fund
Selected data for a share outstanding throughout each period is as follows:
| | | Year Ended August 31, | |
| Class Z Shares | | 2010 | | 2009 | | 2008 | | 2007 | | 2006 | |
| Net Asset Value, Beginning of Period | | $ | 17.98 | | | $ | 23.92 | | | $ | 27.93 | | | $ | 24.35 | | | $ | 22.41 | | |
| Income from Investment Operations: | |
| Net investment income (loss) (a) | | | (0.05 | ) | | | 0.01 | | | | (0.06 | ) | | | 0.05 | (b) | | | (0.05 | ) | |
Net realized and unrealized gain (loss) on investments,
foreign currency and written options | | | 2.80 | | | | (5.46 | ) | | | (0.07 | ) | | | 5.04 | | | | 2.30 | | |
| Total from investment operations | | | 2.75 | | | | (5.45 | ) | | | (0.13 | ) | | | 5.09 | | | | 2.25 | | |
| Less Distributions to Shareholders: | |
| From net investment income | | | (0.01 | ) | | | — | | | | — | | | | (0.05 | ) | | | — | | |
| From net realized gains | | | — | | | | (0.49 | ) | | | (3.88 | ) | | | (1.46 | ) | | | (0.31 | ) | |
| Total distributions to shareholders | | | (0.01 | ) | | | (0.49 | ) | | | (3.88 | ) | | | (1.51 | ) | | | (0.31 | ) | |
| Increase from regulatory settlements | | | — | | | | — | (c) | | | — | | | | — | | | | — | | |
| Net Asset Value, End of Period | | $ | 20.72 | | | $ | 17.98 | | | $ | 23.92 | | | $ | 27.93 | | | $ | 24.35 | | |
| Total return (d) | | | 15.29 | % | | | (22.16 | )% | | | (1.97 | )% | | | 21.49 | % | | | 10.06 | %(e) | |
| Ratios to Average Net Assets/Supplemental Data: | |
| Net expenses before interest expense (f) | | | 0.98 | % | | | 1.01 | % | | | 0.93 | % | | | 0.92 | % | | | 0.96 | % | |
| Interest expense | | | — | %(g) | | | — | | | | — | %(g) | | | — | %(g) | | | — | | |
| Net expenses (f) | | | 0.98 | % | | | 1.01 | % | | | 0.93 | % | | | 0.92 | % | | | 0.96 | % | |
| Waiver/Reimbursement | | | — | | | | — | | | | — | | | | — | | | | 0.01 | % | |
| Net investment income (loss) (f) | | | (0.24 | )% | | | 0.05 | % | | | (0.23 | )% | | | 0.20 | % | | | (0.20 | )% | |
| Portfolio turnover rate | | | 137 | % | | | 160 | % | | | 149 | % | | | 171 | % | | | 67 | % | |
| Net assets, end of period (000s) | | $ | 986,590 | | | $ | 954,718 | | | $ | 1,286,857 | | | $ | 1,452,707 | | | $ | 807,089 | | |
(a) Per share data was calculated using the average shares outstanding during the period.
(b) Net investment income per share reflects a special dividend. The effect of this dividend amounted to $0.07 per share.
(c) Rounds to less than $0.01 per share.
(d) Total return at net asset value assuming all distributions reinvested.
(e) Had the investment advisor and/or any of its affiliates not waived fees or reimbursed a portion of expenses, total return would have been reduced.
(f) The benefits derived from expense reductions had an impact of less than 0.01%.
(g) Rounds to less than 0.01%.
See Accompanying Notes to Financial Statements.
23
Notes to Financial Statements – Columbia Mid Cap Growth Fund
August 31, 2010
Note 1. Organization
Columbia Mid Cap Growth Fund (the "Fund"), a series of Columbia Funds Series Trust I (the "Trust"), is a diversified fund. The Trust is registered under the Investment Company Act of 1940, as amended (the "1940 Act"), as an open-end management investment company organized as a Massachusetts business trust.
Investment Objective
The Fund seeks significant capital appreciation by investing, under normal market conditions, at least 80% of its total net assets (plus any borrowings for investment purposes) in stocks of companies with a market capitalization, at the time of initial purchase, equal to or less than the largest stock in the Russell Midcap Index.
Fund Shares
The Trust may issue an unlimited number of shares, and the Fund offers seven classes of shares: Class A, Class B, Class C, Class R, Class T, Class Y and Class Z. Each share class has its own expense structure and sales charges, as applicable. The Fund no longer accepts investments from new or existing investors in the Fund's Class B shares, except in connection with the reinvestment of any dividend and/or capital gain distributions in Class B shares of the Fund and exchanges by existing Class B shareholders of the other Columbia Funds.
Class A and Class T shares are subject to a maximum front-end sales charge of 5.75% based on the amount of initial investment. Class A and Class T shares purchased without an initial sales charge in accounts aggregating $1 million to $50 million at the time of purchase are subject to a 1.00% contingent deferred sales charge ("CDSC") if the shares are sold within one year after purchase. Class B shares are subject to a maximum CDSC of 5.00% based upon the holding period after purchase. Class B shares will generally convert to Class A shares eight years after purchase. Class C shares are subject to a 1.00% CDSC on shares sold within one year after purchase. Class R, Class Y and Class Z shares are offered continuously at net asset value. There are certain restrictions on the purchase of Class R, Class Y and Class Z shares, as described in the Fund's prospectus.
Note 2. Significant Accounting Policies
The preparation of financial statements in accordance with accounting principles generally accepted in the United States of America ("GAAP") requires management to make certain estimates and assumptions that affect the reported amounts of assets and liabilities, the disclosure of contingent assets and liabilities at the date of the financial statements and the reported amounts of revenue and expenses during the reporting period. Actual results could differ from those estimates.
Management has evaluated the events and transactions that have occurred through the date the financial statements were issued and noted no items requiring adjustment of the financial statements or additional disclosures.
The following is a summary of significant accounting policies consistently followed by the Fund in the preparation of its financial statements.
Security Valuation
Equity securities are valued at the last sale price on the principal exchange on which they trade, except for securities traded on the NASDAQ, which are valued at the NASDAQ official close price. Unlisted securities or listed securities for which there were no sales during the day are valued at the closing bid price on such exchanges or over-the-counter markets.
Written options are valued at the last reported sale price, or in the absence of a sale, at the last quoted ask price.
Short-term investments maturing in 60 days or less are valued at amortized cost, which approximates market value.
Investments for which market quotations are not readily available, or that have quotations which management believes are not reliable, are valued at fair value as determined in good faith under consistently applied procedures established by and under the general supervision of the Board of Trustees. If a security is valued at fair value, such value is likely to be different from the last quoted market price for the security. The determination of fair value often requires significant judgment. To determine fair value, management may use assumptions including but not limited to future cash flows and estimated risk premiums. Multiple inputs from various sources may be used to determine value.
24
Columbia Mid Cap Growth Fund, August 31, 2010
GAAP establishes a hierarchy that prioritizes the inputs to valuation techniques used to measure fair value giving the highest priority to unadjusted quoted prices in active markets for identical securities (level 1 measurements) and the lowest priority to unobservable inputs (level 3 measurements) when market prices are not readily available or reliable. The three levels of the fair value hierarchy are described below:
• Level 1 – quoted prices in active markets for identical securities
• Level 2 – prices determined using other significant observable inputs (including quoted prices for similar securities, interest rates, prepayment speeds, credit risk and others)
• Level 3 – prices determined using significant unobservable inputs. In situations where quoted prices or observable inputs are unavailable or less reliable, unobservable inputs may be used. Unobservable inputs may include management's own assumptions about the factors market participants would use in pricing an investment.
The inputs or methodology used for valuing securities are not necessarily an indication of the risk associated with investing in those securities.
On January 21, 2010, the Financial Accounting Standards Board issued an Accounting Standards Update (the "amendment"), Fair Value Measurements and Disclosures (Topic 820): Improving Disclosures about Fair Value Measurements, which provides guidance on how investment assets and liabilities are to be valued and disclosed. Specifically, the amendment requires reporting entities to disclose the inputs and valuation techniques used to measure fair value for both recurring and nonrecurring fair value measurements for Level 2 and Level 3 positions. The amendment also requires that transfers between all levels (including Level 1 and Level 2) be disclosed on a gross basis (i.e., transfers out must be disclosed separately from transfers in), and requires disclosure of the reason(s) for sign ificant transfers. Additionally, purchases, sales, issuances and settlements must be disclosed on a gross basis in the Level 3 roll forward. The effective date of the amendment is for interim and annual periods beginning after December 15, 2009; except for the requirement to provide the Level 3 activity for purchases, sales, issuances and settlements on a gross basis, which will be effective for interim and annual periods beginning after December 15, 2010. At this time, management is evaluating the implications of the amendment and the impact to the financial statements.
Security Transactions
Security transactions are accounted for on the trade date. Cost is determined and gains (losses) are based upon the specific identification method for both financial statement and federal income tax purposes.
Derivative Instruments
The Fund may invest in derivative instruments. For additional information on derivative instruments, please see Note 6.
Repurchase Agreements
The Fund may engage in repurchase agreement transactions with institutions that management has determined are creditworthy. The Fund, through its custodian, receives delivery of the underlying securities collateralizing a repurchase agreement. Management is responsible for determining that the collateral is at least equal, at all times, to the value of the repurchase obligation including interest. A repurchase agreement transaction involves certain risks in the event of default or insolvency of the counterparty. These risks include possible delays in or restrictions on the Fund's ability to dispose of the underlying securities and a possible decline in the value of the underlying securities during the period while the Fund seeks to assert its rights.
Income Recognition
Interest income is recorded on the accrual basis.
Corporate actions and dividend income are recorded on the ex-date.
Distributions received from real estate investment trusts (REITs) in excess of their income are recorded as a reduction of the cost of the related investments. If the Fund no longer owns the applicable securities, any distributions received in excess of income are recorded as realized gains.
Expenses
General expenses of the Trust are allocated to the Fund and other series of the Trust based upon relative net assets or other expense allocation methodologies determined by the nature of the expense. Expenses directly attributable to a specific class
25
Columbia Mid Cap Growth Fund, August 31, 2010
of shares are charged to that share class. Expenses directly attributable to the Fund are charged to the Fund.
Determination of Class Net Asset Value
All income, expenses (other than class-specific expenses, as shown on the Statement of Operations) and realized and unrealized gains (losses) are allocated to each class of the Fund on a daily basis, based on the relative net assets of each class, for purposes of determining the net asset value of each class.
Federal Income Tax Status
The Fund intends to qualify each year as a "regulated investment company" under Subchapter M of the Internal Revenue Code, as amended, and will distribute substantially all of its taxable income, if any, for its tax year, and as such will not be subject to federal income taxes. In addition, the Fund intends to distribute in each calendar year substantially all of its net investment income, capital gains and certain other amounts, if any, such that the Fund should not be subject to federal excise tax. Therefore, no federal income or excise tax provision is recorded.
Distributions to Shareholders
Distributions from net investment income, if any, are declared and paid annually. Net realized capital gains, if any, are distributed at least annually. Income distributions and capital gain distributions are determined in accordance with federal income tax regulations which may differ from GAAP.
Indemnification
In the normal course of business, the Fund enters into contracts that contain a variety of representations and warranties and which provide general indemnities. The Fund's maximum exposure under these arrangements is unknown because this would involve future claims against the Fund. Also, under the Trust's organizational documents and by contract, the Trustees and officers of the Trust are indemnified against certain liabilities that may arise out of actions relating to their duties to the Trust. However, based on experience, the Fund expects the risk of loss due to these representations, warranties and indemnities to be minimal.
Note 3. Federal Tax Information
The timing and character of income and capital gain distributions are determined in accordance with income tax regulations, which may differ from GAAP. Reclassifications are made to the Fund's capital accounts for permanent tax differences to reflect income and gains available for distribution (or available capital loss carryforwards) under income tax regulations.
For the year ended August 31, 2010, permanent book and tax basis differences resulting primarily from differing treatments for net operating losses and foreign currency transactions were identified and reclassified among the components of the Fund's net assets as follows:
Overdistributed
Net Investment
Income | | Accumulated
Net Realized
Loss | | Paid-In Capital | |
| $ | 3,130,191 | | | $ | 60,276 | | | $ | (3,190,467 | ) | |
Net investment income and net realized gains (losses), as disclosed on the Statement of Operations, and net assets were not affected by this reclassification.
The tax character of distributions paid during the years ended August 31, 2010 and August 31, 2009 was as follows:
| | | August 31, | |
| | | 2010 | | 2009 | |
| Ordinary Income* | | $ | 480,851 | | | $ | 250 | | |
| Long-Term Capital Gains | | | — | | | | 28,439,602 | | |
* For tax purposes short-term capital gain distributions, if any, are considered ordinary income distributions.
As of August 31, 2010, the components of distributable earnings on a tax basis were as follows:
Undistributed
Ordinary
Income | | Undistributed
Long-Term
Capital Gains | | Net Unrealized
Appreciation* | |
| $ | — | | | $ | — | | | $ | 147,776,469 | | |
* The differences between book-basis and tax-basis net unrealized appreciation are primarily due to deferral of losses from wash sales and identified straddle loss deferrals.
26
Columbia Mid Cap Growth Fund, August 31, 2010
Unrealized appreciation and depreciation at August 31, 2010, based on cost of investments for federal income tax purposes were:
| Unrealized appreciation | | $ | 189,173,672 | | |
| Unrealized depreciation | | | (41,397,203 | ) | |
| Net unrealized appreciation | | $ | 147,776,469 | | |
The following capital loss carryforwards may be available to reduce taxable income arising from future net realized gains on investments, if any, to the extent permitted by the Internal Revenue Code:
| Year of Expiration | | Capital Loss
Carryforwards | |
| 2017 | | $ | 106,558,441 | | |
| 2018 | | | 37,531,162 | | |
| Total | | $ | 144,089,603 | | |
Under current tax rules, certain currency and capital losses realized after October 31 may be deferred and treated as occurring on the first day of the following fiscal year. As of August 31, 2010, post-October currency losses of $60,378 attributed to security transactions were deferred to September 1, 2010.
Management is required to determine whether a tax position of the Fund is more likely than not to be sustained upon examination by the applicable taxing authority, including resolution of any related appeals or litigation processes, based on the technical merits of the position. The tax benefit to be recognized by the Fund is measured as the largest amount of benefit that is greater than fifty percent likely of being realized upon ultimate settlement. Management is not aware of any tax positions for which it is reasonably possible that the total amounts of unrecognized tax benefits will significantly change in the next twelve months. However, management's conclusions may be subject to review and adjustment at a later date based on factors including, but not limited to, new tax laws, regulations, and administrative interpretations (including relevant court decisions). The Fund's federal tax returns for the prior three fiscal year s remain subject to examination by the Internal Revenue Service.
Note 4. Fees and Compensation Paid to Affiliates
Investment Advisory Fee
After the close of business on April 30, 2010, Ameriprise Financial, Inc. ("Ameriprise Financial") acquired a portion of the asset management business of Columbia Management Group, LLC (the "Transaction"), including the business of managing the Fund. In connection with the closing of the Transaction (the "Closing"), RiverSource Investments, LLC, a wholly owned subsidiary of Ameriprise Financial, became the investment advisor of the Fund and subsequently changed its name to Columbia Management Investment Advisers, LLC (the "New Advisor"). The New Advisor receives a monthly investment advisory fee based on the Fund's average daily net assets at the following annual rates:
| Average Daily Net Assets | | Annual Fee Rate | |
| First $500 million | | | 0.82 | % | |
| $500 million to $1 billion | | | 0.75 | % | |
| $1 billion to $1.5 billion | | | 0.72 | % | |
| Over $1.5 billion | | | 0.67 | % | |
Prior to the Closing, Columbia Management Advisors, LLC ("Columbia"), an indirect, wholly owned subsidiary of Bank of America Corporation ("BOA"), provided investment advisory, administrative and other services to the Fund under the same fee structure.
For the year ended August 31, 2010, the Fund's effective investment advisory fee rate was 0.78% of the Fund's average daily net assets.
Administration Fee
Effective upon the Closing, the New Advisor became the administrator of the Fund under a new Administrative Services Agreement (the "Administrative Agreement"). Under the Administrative Agreement, the New Advisor provides administrative and other services to the Fund, including services previously performed under the Pricing and Bookkeeping Oversight and Services Agreement discussed below. The New Advisor does not receive a fee for its services under the Administrative Agreement. Prior to the Closing,
27
Columbia Mid Cap Growth Fund, August 31, 2010
Columbia provided administrative services to the Fund as discussed in the Investment Advisory Fee note above.
Pricing and Bookkeeping Fees
Prior to the Closing, the Fund entered into a Financial Reporting Services Agreement (the "Financial Reporting Services Agreement") with State Street Bank and Trust Company ("State Street") and Columbia pursuant to which State Street provides financial reporting services to the Fund. The Fund also entered into an Accounting Services Agreement (collectively with the Financial Reporting Services Agreement, the "State Street Agreements") with State Street and Columbia pursuant to which State Street provides accounting services to the Fund. Upon the Closing, Columbia assigned and delegated its rights and obligations under the State Street Agreements to the New Advisor. Under the State Street Agreements, the Fund pays State Street an annual fee of $38,000 paid monthly plus an additional monthly fee based on an annualized percentage rate of average daily net assets of the Fund for the month. The aggregate fee will not exceed $140,000 per year (exclusive of out-of-pocket expenses and charges). The Fund also reimburses State Street for certain out-of-pocket expenses and charges.
Also prior to the Closing, the Fund entered into a Pricing and Bookkeeping Oversight and Services Agreement (the "Services Agreement") with Columbia. Under the Services Agreement, Columbia provided services related to Fund expenses and the requirements of the Sarbanes-Oxley Act of 2002, and provided oversight of the accounting and financial reporting services provided by State Street. Under the Services Agreement, the Fund reimbursed Columbia for out-of-pocket expenses and charges, including fees payable to third parties, such as for pricing the Fund's portfolio securities, incurred by Columbia in the performance of services under the Services Agreement. The Services Agreement was terminated upon the Closing. These services are now provided under the Administrative Agreement discussed above.
Transfer Agent Fee
In connection with the Closing, RiverSource Service Corporation, a wholly owned subsidiary of Ameriprise Financial, became the transfer agent of the Fund and subsequently changed its name to Columbia Management Investment Services Corp. (the "New Transfer Agent"). The New Transfer Agent has contracted with Boston Financial Data Services ("BFDS") to serve as sub-transfer agent.
The New Transfer Agent receives a monthly fee for its services. All share classes, with the exception of Class Y shares (the "Other Share Classes") pay a monthly service fee (the "aggregate fee") based on the following:
(i) An annual rate of $22.36 is applied to the aggregate number of accounts for the Other Share Classes.
(ii) An allocated portion of fees for wire, telephone and redemption orders, Individual Retirement Account ("IRA") trustee agent fees and account transcript fees due to the New Transfer Agent from shareholders of the Fund and credits (net of bank charges) earned with respect to balances in accounts the New Transfer Agent maintains in connection with its services to the Fund. The New Transfer Agent also receives reimbursement for certain out-of-pocket expenses.
The aggregate fee is allocated to the Other Share Classes based on the relative average daily net assets of each share class.
Class Y shares of the Fund pay a monthly service fee based on the following:
(i) An annual rate of $22.36 is applied to the aggregate number of accounts for Class Y shares.
(ii) An allocated portion of fees for wire, telephone and redemption orders, IRA trustee agent fees and account transcript fees due to the New Transfer Agent from shareholders of the Fund and credits (net of bank charges) earned with respect to balances in accounts the New Transfer Agent maintains in connection with its services to the Fund. The New Transfer Agent also receives reimbursement for certain out-of-pocket expenses.
The New Transfer Agent also receives reimbursement of certain sub-transfer agent fees paid by the New Transfer Agent (exclusive of BFDS fees), calculated based on the combined assets held in the Other Share Classes in omnibus accounts and intended to recover the cost of payments to other parties (including affiliates of BOA) for services to those accounts. Such fees are allocated to the Other Share Classes based on the relative average daily net assets of each share class. The New Transfer Agent pays the fees of BFDS for services as sub-transfer agent and is not entitled to reimbursement for such fees from the Fund.
28
Columbia Mid Cap Growth Fund, August 31, 2010
Prior to the Closing, Columbia Management Services, Inc. (the "Previous Transfer Agent"), an affiliate of Columbia and an indirect, wholly owned subsidiary of BOA, provided shareholder services to the Fund and contracted with BFDS to serve as sub-transfer agent, under the same fee structure. Prior to November 1, 2009, the annual rate was $17.34 per account.
An annual minimum account balance fee of $20 may apply to certain accounts with a value below the Fund's initial minimum investment requirements to reduce the impact of small accounts on transfer agent fees. These minimum account balance fees are recorded as part of expense reductions on the Statement of Operations. For the year ended August 31, 2010, no minimum account balance fees were charged by the Fund.
Underwriting Discounts, Service and Distribution Fees
In connection with the Closing, RiverSource Fund Distributors, Inc., an indirect wholly owned subsidiary of Ameriprise Financial, became the distributor of the Fund and subsequently changed its name to Columbia Management Investment Distributors, Inc. (the "New Distributor").
For the year ended August 31, 2010, initial sales charges paid by shareholders on the purchase of Class A and Class T shares and net CDSC fees paid by shareholders on certain redemptions of Class A, Class B, Class C and Class T shares were as follows:
Front-End
Sales Charge | | Contingent Deferred
Sales Charge (CDSC) | |
| Class A | | Class T | | Class A | | Class B | | Class C | | Class T | |
| $ | 7,247 | | | $ | 61 | | | $ | 99 | | | $ | 4,870 | | | $ | 1,021 | | | $ | — | | |
The Fund has adopted shareholder servicing and distribution plans pursuant to Rule 12b-1 under the 1940 Act (the "Plans") which require the payment of a monthly service fee to the New Distributor at the maximum annual rate of 0.25% of the average daily net assets attributable to Class A, Class B and Class C shares of the Fund. The Plans also require the payment of a monthly distribution fee to the New Distributor at the maximum annual rates of 0.10%, 0.75%, 0.75% and 0.50% of the average daily net assets attributable to Class A, Class B, Class C and Class R shares, respectively.
The Fund may pay distribution and service fees up to a maximum annual rate of 0.35% of the Fund's average daily net assets attributable to Class A shares (comprised of up to 0.10% for distribution services and up to 0.25% for shareholder liaison services), but currently limit such fees to an aggregate fee of not more than 0.25% of the Fund's average daily net assets attributable to Class A shares.
The CDSC and the distribution fees received from the Plans are used principally as repayment to the New Distributor for amounts paid by the New Distributor to dealers who sold such shares.
Prior to the Closing, Columbia Management Distributors, Inc., an affiliate of Columbia and an indirect, wholly owned subsidiary of BOA, was the principal underwriter of the Fund's shares. There were no changes to the underwriting discount structure of the Fund or the service or distribution fee rates paid by the Fund as a result of the Transaction.
Shareholder Services Fees
The Fund has adopted shareholder services plans that permit the Fund to pay for certain services provided to Class T shareholders by its financial advisors. The Fund may pay shareholder service fees up to an aggregate annual rate of 0.50% of the Fund's average daily net assets attributable to Class T shares (comprised of an annual rate of up to 0.25% for shareholder liaison services and up to 0.25% for administrative support services), however, the Fund limits such fees to an aggregate annual rate of not more than 0.30% of the Fund's average daily net assets attributable to Class T shares for shareholder liaison services and administrative support services.
Expense Limits and Fee Waivers
Effective May 1, 2010, the New Advisor has voluntarily agreed to reimburse a portion of the Fund's expenses so that the Fund's ordinary operating expenses (excluding any distribution and service fees, brokerage commissions, interest, taxes and extraordinary expenses, but including custodian charges relating to overdrafts, if any), after giving effect to any balance credits from the Fund's custodian, do not exceed 1.05% of the Fund's average daily net assets on an annualized basis. This arrangement may be modified or terminated by the New Advisor at any time.
29
Columbia Mid Cap Growth Fund, August 31, 2010
Prior to May 1, 2010, Columbia voluntarily agreed to reimburse a portion of the Fund's expenses so that the Fund's ordinary operating expenses (excluding any distribution and service fees, brokerage commissions, interest, taxes and extraordinary expenses, but including custodian charges relating to overdrafts, if any) after giving effect to any balance credits from the Fund's custodian, did not exceed 1.05% of the Fund's average daily net assets on an annualized basis.
Fees Paid to Officers and Trustees
In connection with the Closing, all officers of the Fund are employees of the New Advisor or its affiliates and, with the exception of the Fund's Chief Compliance Officer, receive no compensation from the Fund. The Board of Trustees has appointed a Chief Compliance Officer to the Fund in accordance with federal securities regulations. The Fund, along with other affiliated funds, pays its pro-rata share of the expenses associated with the Chief Compliance Officer. The Fund's expenses for the Chief Compliance Officer will not exceed $15,000 per year. Prior to the Closing, the Fund paid its pro-rata share of the expenses for the Chief Compliance Officer under the same fee structure.
Trustees are compensated for their services to the Fund, as set forth on the Statement of Operations. The Trust's eligible Trustees may participate in a deferred compensation plan which may be terminated at any time. Obligations of the plan will be paid solely out of the Fund's assets.
Other Related Party Transactions
Prior to the Closing, the Fund used one or more brokers that were affiliates of BOA in connection with the purchase and sale of its securities. Total brokerage commissions paid to affiliated brokers for the period prior to the Closing were $2,931.
Note 5. Custody Credits
The Fund has an agreement with its custodian bank under which custody fees may be reduced by balance credits. These credits are recorded as part of expense reductions on the Statement of Operations. The Fund could have invested a portion of the assets utilized in connection with the expense offset arrangement in an income-producing asset if it had not entered into such an agreement. For the year ended August 31, 2010, these custody credits reduced total expenses by $299 for the Fund.
Note 6. Derivatives
The Fund uses derivatives instruments including options in order to meet its investment objectives. The Fund employs strategies in differing combinations to permit it to increase, decrease or change the level of exposure to market risk factors. The achievement of any strategy relating to derivatives depends on an analysis of various risk factors, and if the strategies for the use of derivatives do not work as intended, the Fund may not achieve its investment objectives.
In pursuit of its investment objectives, the Fund is exposed to the following market risks:
Equity Risk: Equity risk relates to change in value of equity securities such as common stocks due to general market conditions such as real or perceived adverse economic conditions, changes in the general outlook for corporate earnings, or adverse investor sentiment. Equity securities generally have greater price volatility than fixed income securities.
The following notes provide more detailed information about each derivative type held by the Fund:
The Fund wrote covered call options to decrease the Fund's exposure to equity risk on investments. Written covered call options become more valuable as the price of the underlying instruments depreciates relative to the strike price.
Writing put options tends to increase the Fund's exposure to the underlying instrument. When the Fund writes a call or put option, an amount equal to the premium received is recorded as a liability and subsequently marked-to-market to reflect the current value of the option written. Premiums received from writing options which expire are treated as realized gains. Premiums received from writing options which are exercised or closed are added to the proceeds or offset against the amounts paid on the underlying security transaction to determine the realized gain or loss. The Fund, as a writer of an option, has no control over whether the underlying security may be sold (call) or purchased (put) and as a result bears the market risk of an unfavorable change in the price of the security underlying the written option. There is the risk that the Fund may not be able to enter into a closing transaction because of an illiquid market. Th e Fund identifies within its portfolio of investments cash or liquid portfolio securities equal to the amount of the written options contract commitment.
30
Columbia Mid Cap Growth Fund, August 31, 2010
The Fund may also purchase put and call options. Purchasing call options tends to increase the Fund's exposure to the underlying instrument. Purchasing put options tends to decrease the Fund's exposure to the underlying instrument. The Fund may pay a premium, which is included in the Fund's Statement of Assets and Liabilities as an investment and subsequently marked-to-market to reflect the current value of the option. The risk associated with purchasing put and call options is limited to the premium paid. Premiums paid for purchasing options which expire are treated as realized losses. Premiums paid for purchasing options which are exercised are added to the amounts paid (call) or offset against the proceeds (put) on the underlying security to determine the realized gain or loss. If the Fund enters into a closing transaction, the Fund will realize a gain or loss, depending on whether the proceeds from the closing transaction ar e greater or less than the cost of the option.
During the year ended August 31, 2010, the Fund entered into 1,718 written options contracts.
The effect of derivative instruments on the Statement of Operations for the year ended August 31, 2010.
| | | Amount of Realized Gain or (Loss) and
Change in Unrealized Appreciation or
(Depreciation) on Derivatives
Recognized in Income | |
| | | Risk Exposure | | Net Realized
Gain (Loss) | | Change in
Unrealized
Appreciation
(Depreciation) | |
Written call
options | | Equity Risk | | | $339,183 | | | | — | | |
Note 7. Portfolio Information
For the year ended August 31, 2010, the cost of purchases and proceeds from sales of securities, excluding short-term obligations, for the Fund were $1,519,197,469 and $1,666,184,401, respectively.
Note 8. Regulatory Settlements
During the year ended August 31, 2009, the Fund received payments totaling $253,476 relating to certain regulatory settlements with third parties that the Fund had participated in during the year. The payments have been included in "Increase from regulatory settlements" on the Statement of Changes in Net Assets.
Note 9. Line of Credit
The Fund and other affiliated funds participate in a $280,000,000 committed, unsecured revolving line of credit provided by State Street. The maximum amount that may be borrowed by any fund is limited to the lesser of $200,000,000 and the Fund's borrowing limit set forth in the Fund's registration statement. Borrowings are available for short-term liquidity or temporary or emergency purposes.
Effective October 15, 2009, interest is charged to each participating fund based on the fund's borrowings at a rate per annum equal to the greater of the Federal Funds Rate plus 1.25% or the overnight LIBOR Rate plus 1.25%. In addition, a commitment fee of 0.15% per annum is accrued and apportioned among the participating funds pro rata based on their relative net assets.
Prior to October 15, 2009, interest was charged to each participating fund based on the fund's borrowings at a rate per annum equal to the greater of the Federal Funds Rate plus 0.50% or the overnight LIBOR Rate plus 0.50%. In addition, an annual operations agency fee of $20,000, an amendment fee of 0.02% and a commitment fee of 0.12% per annum were accrued and apportioned among the participating funds pro rata based on their relative net assets.
For the year ended August 31, 2010, the average daily loan balance outstanding on days where borrowing existed was $3,400,000 at a weighted average interest rate of 1.44%.
Note 10. Shareholder Concentration
As of August 31, 2010, one shareholder account owned 38.0% of the outstanding shares of the Fund. Purchase and redemption activity of this account may have a significant effect on the operations of the Fund.
Note 11. Significant Risks and Contingencies
Sector Focus Risk
The Fund may focus its investments in certain sectors, subjecting it to greater risk than a fund that is less focused.
31
Columbia Mid Cap Growth Fund, August 31, 2010
Information Regarding Pending and Settled Legal Proceedings
In June 2004, an action captioned John E. Gallus et al. v. American Express Financial Corp. and American Express Financial Advisors Inc. was filed in the United States District Court for the District of Arizona. The plaintiffs allege that they are investors in several American Express Company (now known as legacy RiverSource) mutual funds and they purport to bring the action derivatively on behalf of those funds under the Investment Company Act of 1940. The plaintiffs allege that fees allegedly paid to the defendants by the funds for investment advisory and administrative services are excessive. The plaintiffs seek remedies including restitution and rescission of investment advisory and distribution agreements. The plaintiffs voluntarily agreed to transfer this case to the United States District Court for the District of Minnesota (the District Court). In response to defendants' motion to dismiss the complaint, the District Court dismissed one of plaintiffs' four claims and granted plaintiffs limited discovery. Defendants moved for summary judgment in April 2007. Summary judgment was granted in the defendants' favor on July 9, 2007. The plaintiffs filed a notice of appeal with the Eighth Circuit Court of Appeals (the Eighth Circuit) on August 8, 2007. On April 8, 2009, the Eighth Circuit reversed summary judgment and remanded to the District Court for further proceedings. On August 6, 2009, defendants filed a writ of certiorari with the U.S. Supreme Court (the Supreme Court), asking the Supreme Court to stay the District Court proceedings while the Supreme Court considers and rules in a case captioned Jones v. Harris Associates, which involves issues of law similar to those presented in the Gallus case. On March 30, 2010, the Supreme Court issued its ruling in Jones v. Harris Associates, and on April 5, 2010, the Supreme Court vacated the Eighth Circuit's decision in the Gallus case and remanded the case to the Eighth Circuit for further consideration in light of the Supreme Court's decision in Jones v. Harris Associates. On June 4, 2010, the Eighth Circuit remanded the Gallus case to the District Court for further consideration in light of the Supreme Court's decision in Jones v. Harris Associates.
In December 2005, without admitting or denying the allegations, American Express Financial Corporation (AEFC, which is now known as Ameriprise Financial, Inc. (Ameriprise Financial)), entered into settlement agreements with the Securities and Exchange Commission (SEC) and Minnesota Department of Commerce (MDOC) related to market timing activities. As a result, AEFC was censured and ordered to cease and desist from committing or causing any violations of certain provisions of the Investment Advisers Act of 1940, the Investment Company Act of 1940, and various Minnesota laws. AEFC agreed to pay disgorgement of $10 million and civil money penalties of $7 million. AEFC also agreed to retain an independent distribution consultant to assist in developing a plan for distribution of all disgorgement and civil penalties ordered by the SEC in accordance with various undertakings detailed at http://www.sec.gov/litigation/admin/ia-2451.pdf. Ameriprise Financial and its affiliates have cooperated with the SEC and the MDOC in these legal proceedings, and have made regular reports to the funds' Boards of Directors/Trustees.
Ameriprise Financial and certain of its affiliates have historically been involved in a number of legal, arbitration and regulatory proceedings, including routine litigation, class actions, and governmental actions, concerning matters arising in connection with the conduct of their business activities. Ameriprise Financial believes that the Funds are not currently the subject of, and that neither Ameriprise Financial nor any of its affiliates are the subject of, any pending legal, arbitration or regulatory proceedings that are likely to have a material adverse effect on the Funds or the ability of Ameriprise Financial or its affiliates to perform under their contracts with the Funds. Ameriprise Financial is required to make 10-Q, 10-K and, as necessary, 8-K filings with the Securities and Exchange Commission on legal and regulatory matters that relate to Ameriprise Financial and its affiliates. Copies of these filings may be obt ained by accessing the SEC website at www.sec.gov.
There can be no assurance that these matters, or the adverse publicity associated with them, will not result in increased fund redemptions, reduced sale of fund shares or other adverse consequences to the Funds. Further, although we believe proceedings are not likely to have a material adverse effect on the Funds or the ability of Ameriprise Financial or its affiliates to perform under their contracts with the Funds, these proceedings are subject to uncertainties and, as such, we are unable to estimate the possible loss or range of loss that may result. An adverse outcome in one or more of these proceedings could result in adverse judgments, settlements, fines, penalties or other relief that could have a material adverse effect on the consolidated financial condition or results of operations of Ameriprise Financial.
32
Report of Independent Registered Public Accounting Firm
To the Trustees of Columbia Funds Series Trust I and Shareholders of Columbia Mid Cap Growth Fund
In our opinion, the accompanying statement of assets and liabilities, including the investment portfolios, and the related statements of operations and of changes in net assets and the financial highlights present fairly, in all material respects, the financial position of Columbia Mid Cap Growth Fund (the "Fund") (a series of Columbia Funds Series Trust I) at August 31, 2010, the results of its operations for the year then ended, the changes in its net assets for each of the two years in the period then ended, and the financial highlights for each of the five years in the period then ended, in conformity with accounting principles generally accepted in the United States of America. These financial statements and financial highlights (hereafter referred to as "financial statements") are the responsibility of the Fund's management. Our responsibility is to express an opinion on these financial statements based on our audits. We c onducted our audits of these financial statements in accordance with the standards of the Public Company Accounting Oversight Board (United States). Those standards require that we plan and perform the audit to obtain reasonable assurance about whether the financial statements are free of material misstatement. An audit includes examining, on a test basis, evidence supporting the amounts and disclosures in the financial statements, assessing the accounting principles used and significant estimates made by management, and evaluating the overall financial statement presentation. We believe that our audits, which included confirmation of securities at August 31, 2010 by correspondence with the custodian and brokers, provide a reasonable basis for our opinion.
PricewaterhouseCoopers LLP
Boston, Massachusetts
November 8, 2010
33
Federal Income Tax Information (Unaudited) – Columbia Mid Cap Growth Fund
For non-corporate shareholders 100.00% or the maximum amount allowable under the Jobs and Growth Tax Relief Reconciliation Act of 2003, of the ordinary income distributed by the Fund for the fiscal year ended August 31, 2010 may represent qualified dividend income.
100.00% of the ordinary income distributed by the Fund, for the fiscal year ended August 31, 2010 qualifies for the corporate dividends received deduction.
The Fund will notify shareholders in January 2011 of amounts for use in preparing 2010 income tax returns.
34
Fund Governance
The Trustees serve terms of indefinite duration. The names, addresses and birth years of the Trustees and Officers of the Funds in the Columbia Funds Series Trust I, the year each was first elected or appointed to office, their principal business occupations during at least the last five years, the number of Funds overseen by each Trustee and other directorships they hold are shown below. Each officer listed below serves as an officer of each Fund in the Columbia Funds Complex.
Independent Trustees
Name, Address and Year of Birth,
Position with Funds, Year First
Elected or Appointed to Office | | Principal Occupation(s) During Past Five Years, Number of Funds in Columbia
Funds Complex Overseen by Trustee, Other Directorships Held
| |
| John D. Collins (Born 1938) | |
|
c/o Columbia Management
Investment Advisers, LLC
One Financial Center
Boston, MA 02111
Trustee (since 2005) | | Retired. Consultant, KPMG, LLP (accounting and tax firm) from July 1999 to June 2000; Partner, KPMG, LLP from March 1962 to June 1999. Oversees 64; Mrs. Fields Original Cookies, Inc. (consumer products); Suburban Propane Partners, L.P.; and Montpelier Re (insurance underwriting firm) | |
|
| Rodman L. Drake (Born 1943) | |
|
c/o Columbia Management
Investment Advisers, LLC
One Financial Center
Boston, MA 02111
Trustee (since 1994) and Chairman of the Board (since 2009) | | Co-Founder of Baringo Capital LLC (private equity) since 2002; CEO of Crystal River Capital, Inc. (real estate investment trust) since 2003; President, Continuation Investments Group, Inc. from 1997 to 2001. Oversees 64; Jackson Hewitt Tax Service Inc. (tax preparation services); Crystal Capital River, Inc. (real estate investment trust); Student Loan Corporation (student loan provider); Celgene Corporation (global biotechnology company); The Helios Funds (exchange-traded funds); and Apex Silver Mines Ltd. from 2007 to 2009 | |
|
| Douglas A. Hacker (Born 1955) | |
|
c/o Columbia Management
Investment Advisers, LLC
One Financial Center
Boston, MA 02111
Trustee (since 1996) | | Independent business executive since May 2006; Executive Vice President—Strategy of United Airlines (airline) from December 2002 to May 2006; President of UAL Loyalty Services (airline marketing company) from September 2001 to December 2002; Executive Vice President and Chief Financial Officer of United Airlines from July 1999 to September 2001. Oversees 64; Nash Finch Company (food distributor); Aircastle Limited (aircraft leasing) | |
|
| Janet Langford Kelly (Born 1957) | |
|
c/o Columbia Management
Investment Advisers, LLC
One Financial Center
Boston, MA 02111
Trustee (since 1996) | | Senior Vice President, General Counsel and Corporate Secretary, ConocoPhillips (integrated energy company) since September 2007; Deputy General Counsel—Corporate Legal Services, ConocoPhillips from August 2006 to August 2007; Partner, Zelle, Hofmann, Voelbel, Mason & Gette LLP (law firm) from March 2005 to July 2006; Adjunct Professor of Law, Northwestern University, from September 2004 to June 2006; Director, UAL Corporation (airline) from February 2006 to July 2006; Oversees 64; None | |
|
| Charles R. Nelson (Born 1942) | |
|
c/o Columbia Management
Investment Advisers, LLC
One Financial Center
Boston, MA 02111
Trustee (since 1981) | | Professor of Economics, University of Washington, since January 1976; Ford and Louisa Van Voorhis Professor of Political Economy, University of Washington, since September 1993; Adjunct Professor of Statistics, University of Washington, since September 1980; Associate Editor, Journal of Money Credit and Banking, 1993-2008; Consultant on econometric and statistical matters. Oversees 64; None | |
|
35
Fund Governance (continued)
Independent Trustees (continued)
Name, Address and Year of Birth,
Position with Funds, Year First
Elected or Appointed to Office | | Principal Occupation(s) During Past Five Years, Number of Funds in Columbia
Funds Complex Overseen by Trustee, Other Directorships Held
| |
| John J. Neuhauser (Born 1943) | |
|
c/o Columbia Management
Investment Advisers, LLC
One Financial Center
Boston, MA 02111
Trustee (since 1984) | | President, Saint Michael's College, since August 2007; University Professor, Boston College from November 2005 to August 2007; Director or Trustee of several non-profit organizations, including Fletcher Allen Health Care, Inc.; Academic Vice President and Dean of Faculties, Boston College from August 1999 to October 2005. Oversees 64; Liberty All-Star Equity Fund and Liberty All-Star Growth Fund, Inc. (closed-end funds) | |
|
| Jonathan Piel (Born 1938) | |
|
c/o Columbia Management
Investment Advisers, LLC
One Financial Center
Boston, MA 02111
Trustee (since 1994) | | Cable television producer and website designer; The Editor, Scientific American from 1984 to 1994; Vice President, Scientific American, Inc., from 1984 to 1994; Member, Advisory Board, Stone Age Institute, Bloomington, Indiana (research institute that explores the effect of technology on human evolution); Member, Board of Directors of the National Institute of Social Sciences, New York City; Member, Board of Trustees of the William Alanson White Institute, New York City (institution for training psychoanalysts); and Member, Advisory Board, Mount Sinai Children's Environmental Health Center, New York. Oversees 64; None | |
|
| Patrick J. Simpson (Born 1944) | |
|
c/o Columbia Management
Investment Advisers, LLC
One Financial Center
Boston, MA 02111
Trustee (since 2000) | | Partner, Perkins Coie LLP (law firm). Oversees 64; None | |
|
| Anne-Lee Verville (Born 1945) | |
|
c/o Columbia Management
Investment Advisers, LLC
One Financial Center
Boston, MA 02111
Trustee (since 1998) | | Retired since 1997 (formerly General Manager–Global Education Industry from 1994 to 1997, President–Application Systems Division from 1991 to 1994, Chief Financial Officer–US Marketing & Services from 1988 to 1991, and Chief Information Officer from 1987 to 1988, IBM Corporation (computer and technology)). Oversees 64; Enesco Group, Inc. (producer of giftware and home and garden decor products) from 2001 to 2006 | |
|
36
Fund Governance (continued)
Interested Trustee
Name, Address and Year of Birth,
Position with Funds, Year First
Elected or Appointed to Office | | Principal Occupation(s) During Past Five Years, Number of Funds in Columbia
Funds Complex Overseen by Trustee, Other Directorships Held
| |
| William E. Mayer1 (Born 1940) | |
|
c/o Columbia Management
Investment Advisers, LLC
One Financial Center
Boston, MA 02111
Trustee (since 1994) | | Partner, Park Avenue Equity Partners (private equity) since February 1999; Dean and Professor, College of Business and Management, University of Maryland from 1992 to 1996. Oversees 64; DynaVox Inc. (software developer); Lee Enterprises (print media); WR Hambrecht + Co. (financial service provider); BlackRock Kelso Capital Corporation (investment company) | |
|
1 Mr. Mayer may technically be an "interested person" (as defined in the Investment Company Act of 1940) by reason of his affiliation with WR Hambrecht + Co., a registered broker/dealer that may execute portfolio transactions for, engage in principal transactions with or distribute shares of a Fund or other funds or accounts advised/managed by the Adviser or any sub-adviser to a Fund.
The Statement of Additional Information includes additional information about the Trustees of the Funds and is available, without charge, upon request by calling 1-800-345-6611.
Officers
| Name, Year of Birth and Address | | Principal Occupation(s) During the Past Five Years | |
| J. Kevin Connaughton (Born 1964) | |
|
One Financial Center
Boston, MA 02111
President (since 2009) | | Senior Vice President and General Manager–Mutual Fund Products, Columbia Management Investment Advisers, LLC since May 2010; President, Columbia Funds, since 2009, and RiverSource Funds, since May 2010 (previously Senior Vice President and Chief Financial Officer, Columbia Funds, from June 2008 to January 2009, Treasurer, Columbia Funds, from October 2003 to May 2008, and senior officer of various other affiliated funds since 2000); Managing Director, Columbia Management Advisors, LLC from December 2004 to April 2010. | |
|
| Michael G. Clarke (Born 1969) | |
|
One Financial Center
Boston, MA 02111
Senior Vice President and Chief
Financial Officer (since 2009) | | Vice President, Columbia Management Investment Advisers, LLC since May 2010; Managing Director of Fund Administration, Columbia Management Advisors, LLC, from September 2004 to April 2010; senior officer of Columbia Funds and affiliated funds since 2002. | |
|
| Scott R. Plummer (Born 1959) | |
|
5228 Ameriprise Financial Center
Minneapolis, MN 55474
Senior Vice President, Secretary
and Chief Legal Officer (since 2010) | | Chief Legal Officer and Assistant Secretary, Columbia Management Investment Advisers, LLC since June 2005; Vice President and Lead Chief Counsel–Asset Management, Ameriprise Financial, Inc. since May 2010 (previously Vice President and Chief Counsel–Asset Management, from 2005 to April 2010, and Vice President–Asset Management Compliance from 2004 to 2005); Vice President, Chief Counsel and Assistant Secretary, Columbia Management Investment Distributors, Inc. since 2008; Vice President, General Counsel and Secretary, Ameriprise Certificate Company since 2005; Chief Counsel, RiverSource Distributors, Inc. since 2006; Vice President, General Counsel and Secretary, RiverSource Funds, since December 2006; Senior Vice President, Secretary and Chief Legal Officer, Columbia Funds, since May 2010. | |
|
37
Fund Governance (continued)
Officers (continued)
| Name, Year of Birth and Address | | Principal Occupation(s) During the Past Five Years | |
| Linda J. Wondrack (Born 1964) | |
|
One Financial Center
Boston, MA 02111
Senior Vice President and Chief
Compliance Officer (since 2007) | | Vice President and Chief Compliance Officer, Columbia Management Investment Advisers, LLC since May 2010; Chief Compliance Officer, Columbia Funds, since 2007, and RiverSource Funds, since May 2010; Director (Columbia Management Group, LLC and Investment Product Group Compliance), Bank of America, from June 2005 to April 2010; Director of Corporate Compliance and Conflicts Officer of MFS Investment Management (investment management) from August 2004 to May 2005. | |
|
| William F. Truscott (Born 1960) | |
|
53600 Ameriprise Financial Center
Minneapolis, MN 55474
Senior Vice President (since 2010) | | Chairman of the Board, Columbia Management Investment Advisers, LLC since May 2010 (previously President, Chairman of the Board and Chief Investment Officer, from 2001 to April 2010); Chief Executive Officer, U.S. Asset Management & President, Annuities, Ameriprise Financial, Inc. since May 2010 (previously President–U.S. Asset Management and Chief Investment Officer from 2005 to April 2010, and Senior Vice President—Chief Investment Officer, from 2001 to 2005); Director, President and Chief Executive Officer, Ameriprise Certificate Company since 2006; Director, Columbia Management Investment Distributors, Inc. since May 2010 (previously Chairman of the Board and Chief Executive Officer from 2008 to April 2010); Chairman of the Board and Chief Executive Officer, RiverSource Distributors, Inc. since 2006. | |
|
| Colin Moore (Born 1958) | |
|
One Financial Center
Boston, MA 02111
Senior Vice President (since 2010) | | Director and Chief Investment Officer, Columbia Management Investment Advisers, LLC since May 2010; Manager, Managing Director and Chief Investment Officer of Columbia Management Advisors, LLC from 2007 to April 2010; Head of Equities, Columbia Management Advisors, LLC from 2002 to 2007. | |
|
| Michael A. Jones (Born 1959) | |
|
100 Federal Street
Boston, MA 02110
Senior Vice President (since 2010) | | Director and President, Columbia Management Investment Advisers, LLC since May 2010; President and Director, Columbia Management Investment Distributors, Inc. since May 2010; Manager, Chairman, Chief Executive Officer and President, Columbia Management Advisors, LLC from 2007 to April 2010; Chief Executive Officer, President and Director, Columbia Management Distributors, Inc. from November 2006 to April 2010; previously, co-president and senior managing director at Robeco Investment Management. | |
|
| Amy Johnson (Born 1965) | |
|
5228 Ameriprise Financial Center
Minneapolis, MN 55474
Senior Vice President (since 2010) | | Senior Vice President and Chief Operating Officer, Columbia Management Investment Advisers, LLC since May 2010 (previously Chief Administrative Officer, from 2009 until April 2010, Vice President—Asset Management and Trust Company Services, from 2006 to 2009, and Vice President—Operations and Compliance from 2004 to 2006). | |
|
| Joseph F. DiMaria (Born 1968) | |
|
One Financial Center
Boston, MA 02111
Treasurer (since 2009) and
Chief Accounting Officer (since 2008) | | Vice President, Mutual Fund Administration, Columbia Management Investment Advisers, LLC, since May 2010; Director of Fund Administration, Columbia Management Advisors, LLC from January 2006 to April 2010; Head of Tax/Compliance and Assistant Treasurer, Columbia Management Advisors, LLC, from November 2004 to December 2005. | |
|
38
Fund Governance (continued)
Officers (continued)
| Name, Year of Birth and Address | | Principal Occupation(s) During the Past Five Years | |
| Marybeth Pilat (Born 1968) | |
|
One Financial Center
Boston, MA 02111
Deputy Treasurer (since 2010) | | Vice President, Mutual Fund Administration, Columbia Management Investment Advisers, LLC, since May 2010; Vice President, Investment Operations, Bank of America, from October 2008 to April 2010; Finance Manager, Boston Children's Hospital from August 2008 to October 2008; Director, Mutual Fund Administration, Columbia Management Advisors, LLC, from May 2007 to July 2008; Vice President, Mutual Fund Valuation, Columbia Management Advisors, LLC, from January 2006 to May 2007; Vice President, Mutual Fund Accounting Oversight, Columbia Management Advisors, LLC from January 2005 to January 2006. | |
|
| Julian Quero (Born 1967) | |
|
One Financial Center
Boston, MA 02111
Deputy Treasurer (since 2008) | | Vice President, Mutual Fund Administration, Columbia Management Investment Advisers, LLC since May 2010; Director of Fund Administration, Columbia Management Advisors, LLC, from August 2008 to April 2010; Senior Tax Manager, Columbia Management Advisors, LLC from August 2006 to July 2008; Senior Compliance Manager, Columbia Management Advisors, LLC from April 2002 to August 2006. | |
|
| Stephen T. Welsh (Born 1957) | |
|
One Financial Center
Boston, MA 02111
Vice President (since 2006) | | President and Director, Columbia Management Investment Services Corp. since May 2010; President and Director, Columbia Management Services, Inc. from July 2004 to April 2010; Managing Director, Columbia Management Distributors, Inc. from August 2007 to April 2010. | |
|
39
Summary of Management Fee Evaluation by Independent Fee Consultant (RiverSource Investments, LLC)
EXCERPT FROM REPORT OF INDEPENDENT FEE CONSULTANT TO THE FUNDS SUPERVISED BY THE COLUMBIA ATLANTIC BOARD
Prepared Pursuant to the February 9, 2005
Assurance of Discontinuance among the
Office of Attorney General of New York State,
Columbia Management Advisors, LLC, and
Columbia Management Distributors, Inc.
December 21, 2009
I. Overview
On February 9, 2005, Columbia Management Advisors, LLC ("CMA") and Columbia Management Distributors, Inc.1 ("CMD") agreed to the New York Attorney General's Assurance of Discontinuance ("AOD"). Among other things, the AOD stipulates that CMA may manage or advise a Columbia Fund ("Columbia Fund" and, together with some or all of such funds, the "Columbia Funds") only if the Independent Members of the Columbia Fund's Board of Trustees appoint a Senior Officer or retain an Independent Fee Consultant ("IFC") who is to manage the process by which proposed management fees are negotiated. The AOD further stipulates that the Senior Officer or IFC is to prepare a written annual evaluation of the fee negotiation process.
With effect from January 1, 2007, the Independent Members of the Board of Trustees for certain Columbia Funds known collectively as the "Atlantic Funds" (together with the other members of that Board, the "Trustees") retained me as IFC for the Atlantic Funds.2 In this capacity, I have prepared this written evaluation of the fee negotiation process. As was the case with the last three annual reports, my immediate predecessor as IFC, John Rea, provided invaluable assistance in the preparation of this report.
On September 29, 2009, Ameriprise entered into an asset purchase agreement with Bank of America, N.A. and its parent, Bank of America Corporation (together, the "Bank") pursuant to which the Bank agreed to sell certain CMG assets relating to Columbia's long-term asset management business, including management of the Atlantic Funds (the "Transaction").3 The Transaction if completed would result in the termination of the existing Investment Management Agreements with CMA. Therefore, the Trustees have been requested to approve and recommend to the shareholders of each Atlantic Fund new Investment Management and Sub-Advisory Agreements (together, the "Management Agreements") with RiverSource Investments, LLC ("RI"),4 investment manager of the RiverSource Funds and a subsidiary of Ameriprise. This report is intended to fulfill the requirements of the AOD with respect to the Trustees' consideration of the new Man agement Agreements.
A. Role of the Independent Fee Consultant
The AOD charges the IFC with "managing the process by which proposed management fees ... to be charged the Columbia Fund are negotiated so that they are negotiated in a manner which is at arms' length and reasonable and consistent with this Assurance of Discontinuance." The AOD also provides that CMA "may manage or advise a Columbia Fund only if the reasonableness of the proposed management fees is determined by the Board of Trustees ... using ... an annual independent written evaluation prepared by or under the direction of ... the Independent Fee Consultant." Therefore, the AOD makes clear that the IFC does not supplant the Trustees in negotiating management fees with CMA (or RI), nor does the IFC substitute his or her judgment for that of the Trustees with respect to the reasonableness of proposed fees or any other matter that is committed to the business judgment of the Trustees.
B. Elements Involved in Managing the Fee Negotiation Process
In preparing the report required by the AOD, the IFC must consider at least the following six factors set forth in the AOD:
1. The nature and quality of the adviser's services, including the Fund's performance;
1 CMA and CMD are subsidiaries of Columbia Management Group, LLC ("CMG"), and are the successors to the entities named in the AOD.
2 I have no material relationship with Bank of America, CMG or Ameriprise Financial, Inc. ("Ameriprise"), aside from serving as IFC, and I am aware of no material relationship with any of their affiliates. I retained John Rea, an independent economic consultant, to assist me with this report.
Unless otherwise stated or required by the context, this report covers only the Atlantic Funds.
3 Preliminary Response of Ameriprise to Information Request of Columbia Atlantic Board dated October 21, 2009 (hereafter, the "Preliminary Response"), p. 1. The one money market Atlantic Fund, Money Market Fund VS, was included in the Transaction because it was an integral part of CMG's array of Funds used as investment vehicles by variable annuity and similar insurance products.
4 Ameriprise intends to re-brand RI with the "Columbia" name (which is one of the assets being sold in the Transaction). Preliminary Response, pp. 4-5. In the case of new Sub-Advisory Agreements, the current sub-adviser would also be a party.
40
2. Management fees (including any components thereof) charged by other mutual fund companies for like services;
3. Possible economies of scale as the Fund grows larger;
4. Management fees (including any components thereof) charged to institutional and other clients of the adviser for like services;
5. Costs to the adviser and its affiliates of supplying services pursuant to the management fee agreements, excluding any intra-corporate profit; and
6. Profit margins of the adviser and its affiliates from supplying such services.
C. Data Presented to the Trustees
In considering the proposed new Management Agreements with RI, the Trustees relied in part on the data that had been prepared as part of their annual contract review process, which concluded in late October. This data remained relevant because the fees in the proposed Management Agreements were identical to the fees approved at that time. The annual review materials included a Lipper report on the performance of each Atlantic Fund compared to its peers and its benchmark, comparisons of the fees and expenses of each Atlantic Fund to similar CMG-sponsored Funds, comparable competitive funds chosen by Lipper, and institutional accounts advised by CMA, revenues, expenses, and profits of CMG from managing the Atlantic Funds, calculated both by Fund and collectively, and CMG's views on the existence and sharing of economies of scale.
In addition, the Trustees reviewed materials specific to the proposed new Management Agreements with RI in response to requests for information made on behalf of the Trustees, including the following:
• Performance data for the RiverSource Funds showing percentile and quartile rankings of each fund within its Lipper performance universe for periods up to five years and net returns of each fund relative to its benchmark returns. This data was arguably relevant due to the possibility that some RiverSource investment teams would be providing investment management services to certain Columbia Funds.5
• tables comparing the fee schedules and effective fee rates of funds managed by CMA and RI and institutional accounts advised by the two firms.
• extensive discussion of the process by which the various components of the two asset management businesses would be integrated including investment management, compliance, transfer agency, custody, fund accounting, and distribution.
• information about the financial condition of Ameriprise, including its most recent annual report on Form 10-K, RI's profit margins from managing the RiverSource Funds in 2007 and 2008, and pro forma income statements for the combined Columbia and RiverSource fund complex.
• disclosure that certain senior CMG executives, including President Michael Jones, Chief Investment Officer Colin Moore, Head of Mutual Funds J. Kevin Connaughton, and Chief Compliance Officer Linda Wondrack would continue in analogous capacities following the consummation of the Transaction, and
• a breakdown of the synergies RI expects to realize in the two years following the Transaction and the extent to which those potential synergies are expected to be shared with shareholders of funds advised by RI.
II. Findings
1. Based upon my examination of the information supplied by CMG and Ameriprise in the light of the six factors set forth in the AOD, I conclude that the Trustees have the relevant information necessary to evaluate the reasonableness of the proposed management fees for each Atlantic Fund.
2. In my view, the process by which the proposed management fees of the Atlantic Funds have been negotiated with RI thus far has been, to the extent practicable, at arms' length and reasonable and consistent with the AOD.
Respectfully submitted,
Steven E. Asher
5 On page 20 of its Supplemental Response to the Atlantic Trustees (undated but delivered November 24, 2009), Ameriprise said that "most personnel decisions, including with respect to the portfolio management teams for the Atlantic Funds . . . will be made primarily by [current CMA CIO] Colin Moore using the Columbia 5P process."
41
Shareholder Meeting Results
On March 3, 2010, a special meeting of shareholders of Columbia Funds Series Trust I was held to consider the approval of several proposals listed in the proxy statement for the meeting. Proposal 1 and Proposal 2 were voted on at the March 3, 2010 meeting of shareholders and Proposal 3 was voted on at an adjourned meeting of shareholders held on March 31, 2010. The shareholder meeting results are as follows:
Proposal 1: A proposed Investment Management Services Agreement with Columbia Management Investment Advisers, LLC (formerly, RiverSource Investments, LLC) (CMIA) was approved as follows:
| Votes For | | Votes Against | | Abstentions | | Broker Non-Votes | |
| | 822,958,277 | | | | 20,857,684 | | | | 13,297,183 | | | | 54,614,719 | | |
Proposal 2: A proposal authorizing CMIA to enter into and materially amend subadvisory agreements for the Fund in the future, with the approval of the Trust's Board of Trustees, but without obtaining additional shareholder approval, was approved as follows:
| Votes For | | Votes Against | | Abstentions | | Broker Non-Votes | |
| | 773,221,440 | | | | 70,365,865 | | | | 13,525,597 | | | | 54,614,961 | | |
Proposal 3: Each of the nominees for trustees was elected to the Trust's Board of Trustees, as follows:
| Trustee | | Votes For | | Votes Withheld | | Abstentions | |
| John D. Collins | | | 30,977,072,412 | | | | 859,827,038 | | | | 0 | | |
| Rodman L. Drake | | | 30,951,179,004 | | | | 885,720,446 | | | | 0 | | |
| Douglas A. Hacker | | | 30,989,793,279 | | | | 847,106,171 | | | | 0 | | |
| Janet Langford Kelly | | | 30,999,020,814 | | | | 837,878,636 | | | | 0 | | |
| William E. Mayer | | | 16,291,139,483 | | | | 15,545,759,967 | | | | 0 | | |
| Charles R. Nelson | | | 30,997,700,700 | | | | 839,198,750 | | | | 0 | | |
| John J. Neuhauser | | | 30,988,095,661 | | | | 848,803,789 | | | | 0 | | |
| Jonathon Piel | | | 30,968,801,048 | | | | 868,098,402 | | | | 0 | | |
| Patrick J. Simpson | | | 30,999,065,030 | | | | 837,834,420 | | | | 0 | | |
| Anne-Lee Verville | | | 30,996,227,913 | | | | 840,671,537 | | | | 0 | | |
42
This page intentionally left blank.
This page intentionally left blank.
Important Information About This Report
The fund mails one shareholder report to each shareholder address. If you would like more than one report, please call shareholder services at 1-800-345-6611 and additional reports will be sent to you. This report has been prepared for shareholders of Columbia Mid Cap Growth Fund.
A description of the policies and procedures that the fund uses to determine how to vote proxies and a copy of the fund's voting records are available (i) at www.columbiamanagement.com, (ii) on the Securities and Exchange Commission's website at www.sec.gov, and (iii) without charge, upon request, by calling 1-800-368-0346. Information regarding how the fund voted proxies relating to portfolio securities during the 12-month period ended June 30 is available from the SEC's website. Information regarding how the fund voted proxies relating to portfolio securities is also available from the fund's website, www.columbiamanagement.com.
The fund files a complete schedule of portfolio holdings with the SEC for the first and third quarters of each fiscal year on Form N-Q. The fund's Form N-Q is available on the SEC's website at www.sec.gov and may be reviewed and copied at the SEC's Public Reference Room in Washington, D.C. Information on the operation of the Public Reference Room may be obtained by calling 1-800-SEC-0330.
Transfer Agent
Columbia Management Investment
Services Corp.
P.O. Box 8081
Boston, MA 02266-8081
1-800-345-6611
Distributor
Columbia Management Investment
Distributors, Inc.
One Financial Center
Boston, MA 02111
Investment Advisor
Columbia Management Investment Advisers, LLC
100 Federal Street
Boston, MA 02110
45

PRSRT STD
U.S. Postage
PAID
Holliston, MA
Permit NO. 20
Columbia Mid Cap Growth Fund
P. O. Box 8081
Boston, MA 02266-8081
columbiamanagement.com
This information is for use with concurrent or prior delivery of a fund prospectus. Investors should consider the investment objectives, risks, charges and expenses of a mutual fund carefully before investing. For a free prospectus, which contains this and other important information about the funds, visit columbiamanagement.com. Read the prospectus carefully before investing. The Fund is distributed by Columbia Management Investment Distributors, Inc., member FINRA, and managed by Columbia Management Investment Advisers, LLC.
© 2010 Columbia Management Investment Advisers, LLC. All rights reserved.
C-1631 A (10/10)

Columbia Small Cap Growth Fund I
Annual Report for the Period Ended August 31, 2010
Not FDIC insured • No bank guarantee • May lose value
Table of Contents
| Fund Profile | | | 1 | | |
|
| Economic Update | | | 2 | | |
|
| Performance Information | | | 4 | | |
|
| Understanding Your Expenses | | | 5 | | |
|
| Portfolio Managers' Report | | | 6 | | |
|
| Investment Portfolio | | | 8 | | |
|
Statement of Assets and
Liabilities | | | 12 | | |
|
| Statement of Operations | | | 14 | | |
|
Statement of Changes in
Net Assets | | | 15 | | |
|
| Financial Highlights | | | 17 | | |
|
| Notes to Financial Statements | | | 22 | | |
|
Report of Independent Registered
Public Accounting Firm | | | 32 | | |
|
| Fund Governance | | | 33 | | |
|
Summary of Management Fee
Evaluation by Independent Fee
Consultant (RiverSource
Investments, LLC) | | | 38 | | |
|
| Shareholder Meeting Results | | | 40 | | |
|
Important Information About
This Report | | | 41 | | |
|
The views expressed in this report reflect the current views of the respective parties. These views are not guarantees of future performance and involve certain risks, uncertainties and assumptions that are difficult to predict, so actual outcomes and results may differ significantly from the views expressed. These views are subject to change at any time based upon economic, market or other conditions and the respective parties disclaim any responsibility to update such views. These views may not be relied on as investment advice and, because investment decisions for a Columbia Fund are based on numerous factors, may not be relied on as an indication of trading intent on behalf of any particular Columbia Fund. References to specific securities should not be construed as a recommendation or investment advice.
President's Message

Dear Shareholder:
The Columbia Management story began over 100 years ago, and today, we are one of the nation's largest dedicated asset managers. The recent acquisition by Ameriprise Financial, Inc. brings together the talents, resources and capabilities of Columbia Management with those of RiverSource Investments, Threadneedle (acquired by Ameriprise in 2003) and Seligman Investments (acquired by Ameriprise in 2008) to build a best-in-class asset management business that we believe is truly greater than its parts.
RiverSource Investments traces its roots to 1894 when its then newly-founded predecessor, Investors Syndicate, offered a face-amount savings certificate that gave small investors the opportunity to build a safe and secure fund for retirement, education or other special needs. A mutual fund pioneer, Investors Syndicate launched Investors Mutual Fund in 1940. In the decades that followed, its mutual fund products and services lineup grew to include a full spectrum of styles and specialties. More than 110 years later, RiverSource continues to be a trusted financial products leader.
Threadneedle, a leader in global asset management and one of Europe's largest asset managers, offers sophisticated international experience from a dedicated U.K. management team. Headquartered in London, it is named for Threadneedle Street in the heart of the city's financial district, where British investors pioneered international and global investing. Threadneedle was acquired in 2003 and today operates as an affiliate of Columbia Management.
Seligman Investments' beginnings date back to the establishment of the investment firm J. & W. Seligman & Co. in 1864. In the years that followed, Seligman played a major role in the geographical expansion and industrial development of the United States. In 1874, President Ulysses S. Grant named Seligman as fiscal agent for the U.S. Navy—an appointment that would last through World War I. Seligman helped finance the westward path of the railroads and the building of the Panama Canal. The firm organized its first investment company in 1929 and began managing its first mutual fund in 1930. In 2008, J. & W. Seligman & Co. Incorporated was acquired and Seligman Investments became an offering brand of RiverSource Investments, LLC.
We are proud of the rich and distinctive history of these firms, the strength and breadth of products and services they offer, and the combined cultures of pioneering spirit and forward thinking. Together we are committed to providing more for our shareholders than ever before.
> A singular focus on our shareholders
Our business is asset management, so investors are our first priority. We dedicate our resources to identifying timely investment opportunities and provide a comprehensive choice of equity, fixed-income and alternative investments to help meet your individual needs.
> First-class research and thought leadership
We are dedicated to helping you take advantage of today's opportunities and anticipate tomorrow's. We stay abreast of the latest investment trends and ideas, using our collective insight to evaluate events and transform them into solutions you can use.
> A disciplined investment approach
We aren't distracted by passing fads. Our teams adhere to a rigorous investment process that helps ensure the integrity of our products and enables you and your financial advisor to match our solutions to your objectives with confidence.
When you choose Columbia Management, you can be confident that we will take the time to understand your needs and help you and your financial advisor identify the solutions that are right for you. Because at Columbia Management, we don't consider ourselves successful unless you are.
Sincerely,

J. Kevin Connaughton
President, Columbia Funds
Investors should consider the investment objectives, risks, charges and expenses of a mutual fund carefully before investing. For a free prospectus, which contains this and other important information about the funds, visit www.columbiamanagement.com. The prospectus should be read carefully before investing.
Columbia Funds are distributed by Columbia Management Investment Distributors, Inc., member FINRA, and managed by Columbia Management Investment Advisers, LLC.
© 2010 Columbia Management Investment Advisers, LLC. All rights reserved.
Fund Profile – Columbia Small Cap Growth Fund I
Summary
g For the 12-month period that ended August 31, 2010, the fund's Class A shares returned 13.11% without sales charge.
g The fund's return substantially outpaced the returns of both its benchmarks, the Russell 2000 Growth Index and the Russell 2000 Index1, as well as the average return of its peer group, the Lipper Small-Cap Growth Funds Classification.2
g Superior stock selection, particularly in the health care, information technology, industrials and consumer discretionary sectors, contributed to the fund's outperformance.
Portfolio Management
Wayne M. Collette has co-managed the fund since February 2006 and has been associated with the advisor since May 2010. Prior to joining the advisor, Mr. Collette was associated with the fund's previous advisor or its predecessors since 2001.
George J. Myers has co-managed the fund since February 2006 and has been associated with the advisor since May 2010. Prior to joining the advisor, Mr. Myers was associated with the fund's previous advisor or its predecessors since 2004.
Lawrence W. Lin has co-managed the fund since October 2007 and has been associated with the advisor since May 2010. Prior to joining the advisor, Mr. Lin was associated with the fund's previous advisor or its predecessors since 2006.
Brian D. Neigut has co-managed the fund since October 2007 and has been associated with the advisor since May 2010. Prior to joining the advisor, Mr. Neigut was associated with the fund's previous advisor or its predecessors since 2007.
Effective May 1, 2010, RiverSource Investments, LLC, a subsidiary of Ameriprise Financial, Inc., became the investment advisor to the fund and changed its name to Columbia Management Investment Advisers, LLC. Please see the fund's prospectuses, as supplemented, for more information regarding the change in investment advisor and certain other changes.
1The Russell 2000 Growth Index tracks the performance of those Russell 2000 companies with higher price-to-book ratios and higher forecasted growth values. The Russell 2000 Index tracks the performance of the 2,000 smallest companies in the Russell 3000 Index, which represents approximately 8% of the total market capitalization of the Russell 3000 Index.
2Lipper Inc., a widely respected data provider in the industry, calculates an average total return (assuming reinvestment of distributions) for mutual funds with investment objectives similar to those of the fund. Lipper makes no adjustment for the effect of sales loads.
Indices are not available for investment, are not professionally managed and do not reflect sales charges, fees, brokerage commissions, taxes or other expenses of investing. Securities in the fund may not match those in an index.
Performance data quoted represents past performance and current performance may be lower or higher. Past performance is no guarantee of future results. The investment return and principal value will fluctuate so that shares, when redeemed, may be worth more or less than the original cost. Please visit www.columbiamanagement.com for daily and most recent month-end performance updates.
Summary
1-year return as of 08/31/2010
| | +13.11% | |
|
| |  | | | Class A shares
(without sales charge) | |
|
| | +7.16% | |
|
| |  | | | Russell 2000 Growth Index | |
|
| | +6.60% | |
|
| |  | | | Russell 2000 Index | |
|
Morningstar Style BoxTM

The Morningstar Style BoxTM is based on the Fund's portfolio holdings as of period end. For equity funds, the vertical axis shows the market capitalization of the stocks owned, and the horizontal axis shows investment style (value, blend, or growth). Information shown is based on the most recent data provided by Morningstar.
© 2010 Morningstar, Inc. All rights reserved. The information contained herein is proprietary to Morningstar and/or its content providers, may not be copied or distributed and is not warranted to be accurate, complete, or timely. Neither Morningstar nor its content providers are responsible for any damages or losses arising from any use of this information. Past performance is no guarantee of future results.
1
Economic Update – Columbia Small Cap Growth Fund I
Summary
For the 12-month period that ended August 31, 2010
g The U.S. stock market, as measured by the S&P 500 Index, delivered positive returns, despite a correction in the last months of the period. Emerging market stocks, as measured by the MSCI Emerging Markets Index (Net), outperformed U.S. stocks as well as stock markets in developed foreign markets.
| S&P Index | | MSCI Index | |
|
 | |  | |
|
g Modest economic growth and relatively low interest rates boosted bond market returns. The Barclays Capital Aggregate Bond Index delivered solid results. High-yield bonds outperformed stocks, as measured by the JPMorgan Developed BB High Yield Index.
Barclays
Aggregate Index | | JPMorgan
Index | |
|
 | |  | |
|
Although it has been more than a year since U.S. economic growth turned positive, the economy continues to send mixed signals about the sustainability of this recovery. Economic growth, as measured by gross domestic product (GDP), was a solid 5.0% in the last quarter of 2009. However, it was 3.7% in the first quarter of 2010 and only 1.7% in the second quarter. Expectations are for continued lackluster growth through the end of the year, as government incentive programs have ended and stimulus spending winds down. Even so, it appears to be unlikely that the U.S. economy will sink back into recession as many key indicators remain positive.
Consumer spending on cars, clothing and other goods increased throughout the year, although the pace of increased spending was small. Personal income also moved higher. Consumer confidence, as measured by the Conference Board Consumer Confidence Index, gained ground in the first half of 2010. However, the index fell sharply in June and July before stabilizing in August. Consumers surveyed in the last three months of the reporting period indicated they were concerned about business conditions and job prospects and generally apprehensive about the future.
The housing market—another bellwether for the consumer sector—showed few positive signs. Both new and existing home sales fell in the final months of the period as a federal tax credit for new and repeat homebuyers expired. Distressed properties continued to pressure prices and a huge backlog of foreclosed homes is likely to continue to keep a lid on prices for some time. The national median price of existing homes rose slightly over the one-year period, while the national median price of new homes declined. Despite near-record low mortgage rates, the inventory of unsold homes rose to a 12.5 month supply, up sharply at the end of the period. The long-term average is on the order of six months.
News on the job front was mostly positive in 2010, but the number of new jobs added to the economy fell short of expectations. A good portion of the jobs added in March, April and May were temporary, government-sponsored census positions, which began to unwind in June, July and August. Private sector job growth was disappointing given the stage of economic recovery. Nevertheless, private sector payroll employment trended modestly higher in the summer and news of massive layoffs declined.
Reports from the business side of the economy were generally positive. A key measure of the nation's manufacturing situation—the Institute for Supply Management's Index—was generally positive, although the index trended slightly downward in the final months of the period. Industrial production moved higher, as did the amount of manufacturing capacity utilized—a key measure of the health of the manufacturing sector.
Stock rally interrupted
Against a strengthening economic backdrop, a stock market rally that began early in 2009 continued into the spring of 2010. However, a debt crisis brewing in Europe raised concerns among U.S. investors, as did mixed signals on the economy, and some of the stock market's earlier gains vanished during the early summer. The S&P 500 Index1 returned 4.91% for the 12-month period. Outside the United States, stock market
1The Standard & Poor's (S&P) 500 Index tracks the performance of 500 widely held, large-capitalization U.S. stocks.
2
Economic Update (continued) – Columbia Small Cap Growth Fund I
returns were mixed. The MSCI EAFE Index (Net),2 a broad gauge of stock market performance in foreign developed markets, returned negative 2.34% (net of dividends, in U.S. dollars) for the period, as concerns about the impact of a bailout for weak eurozone economies weighed on the markets. Emerging stock markets were more resilient. The MSCI Emerging Markets Index (Net)3 returned 18.02% (in U.S. dollars) for the 12-month period.
Bonds delivered solid returns
As the economy strengthened, bonds delivered solid returns. The Barclays Capital Aggregate Bond Index4 returned 9.18%. Municipal bonds gained almost as much as taxable investment-grade bonds, even without factoring in potential tax advantages to investors in higher income-tax brackets. The Barclays Capital 3-15 Year Blend Municipal Bond Index5 returned 8.95%. The high-yield bond market outpaced stocks during the period by a margin of more than three to one. For the 12 months covered by this report, the JPMorgan Developed BB High Yield Index6 returned 17.68% while the S&P 500 Index returned 4.91%. Even the Treasury market was positive as the yield on the 10-year U.S. Treasury, a common bellwether for the bond market, fell nearly one full percentage point, from 3.4% to 2.5% over the 12-month period. Despite the pickup in economic activity, the Federal Reserve Board (the Fed) kept a key short-te rm interest rate—the federal funds rate—close to zero.
Past performance is no guarantee of future results.
2The Morgan Stanley Capital International Europe, Australasia, Far East (MSCI EAFE) Index (Net) is a free float-adjusted market capitalization Index that is designed to measure the equity market performance of developed markets, excluding the U.S. & Canada. As of May 27, 2010, the MSCI EAFE Index (Net) consisted of the following 22 developed market country indices: Australia, Austria, Belgium, Denmark, Finland, France, Germany, Greece, Hong Kong, Ireland, Israel, Italy, Japan, the Netherlands, New Zealand, Norway, Portugal, Singapore, Spain, Sweden, Switzerland, and the United Kingdom.
3The Morgan Stanley Capital International Emerging Markets (MSCI EM) Index (Net) is a free float-adjusted market capitalization index that is designed to measure equity market performance of emerging markets. As of May 27, 2010, the MSCI Emerging Markets Index (Net) consisted of the following 21 emerging market country indices: Brazil, Chile, China, Colombia, Czech Republic, Egypt, Hungary, India, Indonesia, Korea, Malaysia, Mexico, Morocco, Peru, Philippines, Poland, Russia, South Africa, Taiwan, Thailand, and Turkey.
4The Barclays Capital Aggregate Bond Index is a market value-weighted index that tracks the daily price, coupon, pay-downs and total return performance of fixed-rate, publicly placed, dollar-denominated and non-convertible investment grade debt issues with at least $250 million par amount outstanding and with at least one year to final maturity.
5The Barclays Capital 3-15 Year Blend Municipal Bond Index tracks the performance of municipal bonds issued after December 31, 1990 with remaining maturities between 2 and 17 years and at least $7 million in principal amount outstanding.
6The JPMorgan Developed BB High Yield Index is an unmanaged index designed to mirror the investable universe of the U.S. dollar developed, BB-rated, high yield corporate debt market.
Indices are not available for investment, are not professionally managed and do not reflect sales charges, fees, brokerage commissions, taxes or other expenses of investing. Securities in the fund may not match those in an index.
3
Performance Information – Columbia Small Cap Growth Fund I
Performance data quoted represents past performance and current performance may be lower or higher. Past performance is no guarantee of future results. The investment return and principal value will fluctuate so that shares, when redeemed, may be worth more or less than the original cost. Please visit www.columbiamanagement.com for daily and most recent month-end performance updates.
Annual operating expense ratio (%)*
| Class A | | | 1.41 | | |
| Class B | | | 2.16 | | |
| Class C | | | 2.16 | | |
| Class Y | | | 1.00 | | |
| Class Z | | | 1.16 | | |
* The annual operating expense ratio is as stated in the fund's prospectus that is current as of the date of this report. Differences in expense ratios disclosed elsewhere in this report may result from the inclusion of fee waivers and expense reimbursements as well as the use of different time periods to calculate the ratios.
Performance of a $10,000 investment 09/01/00 – 08/31/10
The chart above shows the change in value of a hypothetical $10,000 investment in Class A shares of Columbia Small Cap Growth Fund I during the stated time period, and does not reflect the deduction of taxes that a shareholder may pay on fund distributions or on the redemption of fund shares.
Performance of a $10,000 investment 09/01/00 – 08/31/10 ($)
| Sales charge | | without | | with | |
| Class A | | | 10,696 | | | | 10,079 | | |
| Class B | | | 10,325 | | | | 10,325 | | |
| Class C | | | 10,325 | | | | 10,325 | | |
| Class Y | | | 10,842 | | | | n/a | | |
| Class Z | | | 10,824 | | | | n/a | | |
Average annual total return as of 08/31/10 (%)
| Share class | | A | | B | | C | | Y | | Z | |
| Inception | | 11/01/05 | | 11/01/05 | | 11/01/05 | | 07/15/09 | | 10/01/96 | |
| Sales charge | | without | | with | | without | | with | | without | | with | | without | | without | |
| 1-year | | | 13.11 | | | | 6.61 | | | | 12.24 | | | | 7.24 | | | | 12.24 | | | | 11.24 | | | | 13.57 | | | | 13.38 | | |
| 5-year | | | 2.75 | | | | 1.54 | | | | 2.03 | | | | 1.72 | | | | 2.03 | | | | 2.03 | | | | 3.03 | | | | 2.99 | | |
| 10-year | | | 0.67 | | | | 0.08 | | | | 0.32 | | | | 0.32 | | | | 0.32 | | | | 0.32 | | | | 0.81 | | | | 0.79 | | |
Average annual total return as of 09/30/10 (%)
| Share class | | A | | B | | C | | Y | | Z | |
| Sales charge | | without | | with | | without | | with | | without | | with | | without | | without | |
| 1-year | | | 19.72 | | | | 12.84 | | | | 18.82 | | | | 13.82 | | | | 18.87 | | | | 17.87 | | | | 20.17 | | | | 19.99 | | |
| 5-year | | | 5.02 | | | | 3.78 | | | | 4.27 | | | | 3.95 | | | | 4.27 | | | | 4.27 | | | | 5.30 | | | | 5.27 | | |
| 10-year | | | 2.38 | | | | 1.78 | | | | 2.02 | | | | 2.02 | | | | 2.02 | | | | 2.02 | | | | 2.52 | | | | 2.51 | | |
The "with sales charge" returns include the maximum initial sales charge of 5.75% for Class A shares and the applicable contingent deferred sales charge of 5.00% in the first year, declining to 1.00% in the sixth year and eliminated thereafter for Class B shares and 1.00% for Class C shares for the first year only. The "without sales charge" returns do not include the effect of sales charges. If they had, returns would be lower.
Performance results reflect any fee waivers or reimbursements of fund expenses by the investment advisor and/or any of its affiliates. Absent these fee waivers or expense reimbursement arrangements, performance results would have been lower.
All results shown assume reinvestment of distributions. Class Y and Class Z shares are sold at net asset value with no distribution and service (Rule 12b-1) fees. Class Y and Class Z shares have limited eligibility and the investment minimum requirements may vary. Please see the fund's prospectuses for details. Performance for different share classes will vary based on differences in sales charges and fees associated with each class.
The tables do not reflect the deduction of taxes that a shareholder may pay on fund distributions or on the redemption of fund shares.
Class A, Class B, Class C and Class Y are newer classes of shares. Class A, Class B, Class C and Class Y shares performance information includes the performance of Class Z shares (the oldest existing share class) for periods prior to their inception. These returns reflect differences in sales charges, but have not been restated to reflect any differences in expenses (such as distribution and service (Rule 12b-1) fees) between Class Z shares and the newer classes of shares. If differences in expenses had been reflected, the returns shown for periods prior to the inception of Class A, Class B, and Class C shares would have been lower, since these classes of shares are subject to distribution and service (Rule 12b-1) fees. Class A, Class B and Class C shares were initially offered on November 1, 2005, Class Y shares were initially offered on July 15, 2009 and Class Z shares were initially offered on October 1, 1996.
4
Understanding Your Expenses – Columbia Small Cap Growth Fund I
As a fund shareholder, you incur two types of costs. There are transaction costs, which generally include sales charges on purchases and may include redemption fees or exchange fees. There are also ongoing costs, which generally include investment advisory fees, distribution and service (Rule 12b-1) fees and other fund expenses. The information on this page is intended to help you understand the ongoing costs of investing in the fund and to compare these costs with the ongoing costs of investing in other mutual funds.
Analyzing your fund's expenses by share class
To illustrate these ongoing costs, we have provided an example and calculated the expenses paid by investors in each share class during the period. The information in the following table is based on an initial investment of $1,000, which is invested at the beginning of the period and held for the entire period. Expense information is calculated two ways and each method provides you with different information. The amount listed in the "Actual" column is calculated using the fund's actual operating expenses and total return for the period. The amount listed in the "Hypothetical" column for each share class assumes that the return each year is 5% before expenses and is calculated based on the fund's actual operating expenses. You should not use the hypothetical account values and expenses to estimate either your actual account balance at the end of the period or the expenses you paid during this period.
Compare with other funds
Since all mutual funds are required to include the same hypothetical calculations about expenses in shareholder reports, you can use this information to compare the ongoing cost of investing in the fund with other funds. To do so, compare the 5% hypothetical example with the 5% hypothetical examples that appear in the shareholder reports of other funds. As you compare hypothetical examples of other funds, it is important to note that hypothetical examples are meant to highlight the ongoing costs of investing in a fund and do not reflect any transaction costs, such as sales charges, redemption fees or exchange fees.
Estimating your actual expenses
To estimate the expenses that you paid over the period, first you will need your account balance at the end of the period:
g For shareholders who receive their account statements from Columbia Management Investment Services Corp., your account balance is available online at www.columbiamanagement.com or by calling Shareholder Services at 800.345.6611.
g For shareholders who receive their account statements from their financial intermediary, contact your financial intermediary to obtain your account balance.
1. Divide your ending account balance by $1,000. For example, if an account balance was $8,600 at the end of the period, the result would be 8.6.
2. In the section of the table below titled "Expenses paid during the period," locate the amount for your share class. You will find this number in the column labeled "Actual." Multiply this number by the result from step 1. Your answer is an estimate of the expenses you paid on your account during the period.
If the value of your account falls below the minimum initial investment requirement applicable to you, your account may be subject to a $20 annual fee. This fee is not included in the accompanying table. If you are subject to the fee, keep it in mind when you are estimating the ongoing expenses of investing in the fund and when comparing the expenses of this fund with other funds.
03/01/10 – 08/31/10
| | | Account value at the
beginning of the period ($) | | Account value at the
end of the period ($) | | Expenses paid
during the period ($) | | Fund's annualized
expense ratio (%) | |
| | | Actual | | Hypothetical | | Actual | | Hypothetical | | Actual | | Hypothetical | | Actual | |
| Class A | | | 1,000.00 | | | | 1,000.00 | | | | 981.30 | | | | 1,018.50 | | | | 6.64 | | | | 6.77 | | | | 1.33 | | |
| Class B | | | 1,000.00 | | | | 1,000.00 | | | | 977.70 | | | | 1,014.72 | | | | 10.37 | | | | 10.56 | | | | 2.08 | | |
| Class C | | | 1,000.00 | | | | 1,000.00 | | | | 977.70 | | | | 1,014.72 | | | | 10.37 | | | | 10.56 | | | | 2.08 | | |
| Class Y | | | 1,000.00 | | | | 1,000.00 | | | | 983.50 | | | | 1,020.57 | | | | 4.60 | | | | 4.69 | | | | 0.92 | | |
| Class Z | | | 1,000.00 | | | | 1,000.00 | | | | 982.70 | | | | 1,019.76 | | | | 5.40 | | | | 5.50 | | | | 1.08 | | |
Expenses paid during the period are equal to the annualized expense ratio for the share class, multiplied by the average account value over the period, then multiplied by the number of days in the fund's most recent fiscal half-year and divided by 365.
It is important to note that the expense amounts shown in the table are meant to highlight only ongoing costs of investing in the fund and do not reflect any transaction costs, such as sales charges, redemption fees or exchange fees. Therefore, the hypothetical examples provided may not help you determine the relative total costs of owning shares of different funds. If these transaction costs were included, your costs would have been higher.
5
Portfolio Managers' Report – Columbia Small Cap Growth Fund I
Performance data quoted represents past performance and current performance may be lower or higher. Past performance is no guarantee of future results. The investment return and principal value will fluctuate so that shares, when redeemed, may be worth more or less than the original cost. Please visit www.columbiamanagement.com for daily and most recent month-end performance updates.
Net asset value per share
as of 08/31/10 ($)
| Class A | | | 23.55 | | |
| Class B | | | 22.84 | | |
| Class C | | | 22.84 | | |
| Class Y | | | 23.85 | | |
| Class Z | | | 23.81 | | |
Top 5 sectors
as of 08/31/10 (%)
| Information Technology | | | 27.8 | | |
| Health Care | | | 22.3 | | |
| Consumer Discretionary | | | 17.4 | | |
| Industrials | | | 14.4 | | |
| Energy | | | 5.5 | | |
Top 10 holdings
as of 08/31/10 (%)
| Tempur-Pedic International | | | 2.4 | | |
| OpenTable | | | 1.7 | | |
| TIBCO Software | | | 1.6 | | |
| Baldor Electric | | | 1.3 | | |
| Aruba Networks | | | 1.3 | | |
| CROCS | | | 1.3 | | |
| VeriFone Systems | | | 1.2 | | |
| Lululemon Athletica | | | 1.2 | | |
| Signature Bank | | | 1.2 | | |
| SuccessFactors | | | 1.2 | | |
The fund is actively managed and the composition of its portfolio will change over time. Information provided is calculated as a percentage of net assets.
For the 12-month period that ended August 31, 2010, the fund's Class A shares returned 13.11% without sales charge. The fund significantly outdistanced its benchmarks, the Russell 2000 Growth Index, which returned 7.16%, and the Russell 2000 Index, which returned 6.60%, for the same period. The fund's return also exceeded the 8.54% average return of its peer group, the Lipper Small-Cap Growth Funds Classification. The fund's results were buoyed by successful stock selection, especially among metals, mining, coal and oil companies where we took advantage of strong emerging-market demand in late 2009 and early 2010.
Stock selection in a range of sectors helped drive results
Investments in health care were a major factor in the fund's strong relative performance, with positive contributions from companies such as Impax Laboratories and Illumina (0.9% and 0.6% of net assets, respectively). Impax rose on greater demand for inexpensive generic drugs. After struggling late in 2009, Illumina shares took off early in 2010. The company benefited from its genotyping technologies used in developing more personalized medical therapies to treat illnesses. Several technology investments performed particularly well, led by Aruba Networks and Veeco Instruments (1.3% and 0.6% of net assets, respectively). Aruba's share price appreciated as it took market share in the wireless networking industry, while Veeco benefited from rising demand for LED lighting equipment from both municipalities and the high definition television industry. In the industrials sector, notable contributors included rental firm Dollar Thrifty Automotive Group (0.6% of net assets) and mining equipment producer Bucyrus International, which we sold. Dollar Thrifty's share price rose on news of a takeover offer, while Bucyrus benefited from strong demand from mining operators, particularly in emerging market nations, including China. Among consumer discretionary holdings, top contributors included Tempur-Pedic International (2.4% of net assets), manufacturer of high-end mattresses, and Deckers Outdoor (0.5% of net assets), a manufacturer and marketer of casual footwear.
Materials, telecommunications services investments detracted
The fund's positioning in materials and telecommunications services detracted from the fund's return. In materials, Schweitzer-Maduit, a producer of self-extinguishing cigarette paper, declined after its largest customer announced it was exploring new technologies as alternatives. We liquidated the position. Another materials investment, Thompson Creek Metals (0.7% of net assets) fell as investors worried that a strong U.S. dollar could lead to slowing demand from China for the mineral molybdenum, produced by Thompson Creek. Among telecommunication services holdings, Neutral Tandem was a notable disappointment and was sold. Its share price declined in the face of slowing growth and eroding market share among competitors providing interconnection services for telecommunication carriers and service providers.
Looking ahead
The economic outlook in the United States continues to be uncertain, especially in light of persistently high unemployment, sluggish wage growth and a weak housing market. As we have moved to reduce risk, we have focused on seeking companies with the
6
Portfolio Managers' Report (continued) – Columbia Small Cap Growth Fund I
potential to prosper regardless of the direction of the economy or the markets. We also have placed emphasis on companies with favorable individual product cycle trends. We think these types of companies have the potential to become increasingly attractive to investors in an environment of uncertain economic trends.
Portfolio characteristics and holdings are subject to change and may not be representative of current characteristics and holdings. The outlook for this fund may differ from that presented for other Columbia Funds.
Equity securities are affected by stock market fluctuations that occur in response to economic and business developments.
Risks include stock market fluctuations due to business and economic developments. Investments in small-cap companies may be subject to greater volatility and price fluctuations because they may be thinly traded and less liquid
7
Investment Portfolio – Columbia Small Cap Growth Fund I
August 31, 2010
| Common Stocks – 97.4% | |
| | | Shares | | Value ($) | |
| Consumer Discretionary – 17.4% | |
| Auto Components – 1.1% | |
| Cooper Tire & Rubber Co. | | | 549,200 | | | | 8,891,548 | | |
| Auto Components Total | | | 8,891,548 | | |
| Diversified Consumer Services – 2.3% | |
| Capella Education Co. (a) | | | 91,131 | | | | 5,702,978 | | |
| Coinstar, Inc. (a) | | | 139,713 | | | | 6,077,516 | | |
| Grand Canyon Education, Inc. (a) | | | 357,879 | | | | 6,116,152 | | |
| Diversified Consumer Services Total | | | 17,896,646 | | |
| Hotels, Restaurants & Leisure – 2.9% | |
| Bally Technologies, Inc. (a) | | | 195,200 | | | | 6,139,040 | | |
| BJ's Restaurants, Inc. (a) | | | 280,900 | | | | 6,724,746 | | |
| California Pizza Kitchen, Inc. (a) | | | 269,900 | | | | 4,145,664 | | |
Home Inns & Hotels
Management, Inc., ADR (a) | | | 142,200 | | | | 5,966,712 | | |
| Hotels, Restaurants & Leisure Total | | | 22,976,162 | | |
| Household Durables – 2.4% | |
Tempur-Pedic
International, Inc. (a) | | | 714,500 | | | | 19,148,600 | | |
| Household Durables Total | | | 19,148,600 | | |
| Media – 1.1% | |
| Imax Corp. (a) | | | 372,100 | | | | 5,257,773 | | |
| Knology, Inc. (a) | | | 270,639 | | | | 3,174,595 | | |
| Media Total | | | 8,432,368 | | |
| Multiline Retail – 0.6% | |
| Gordmans Stores, Inc. (a) | | | 462,098 | | | | 4,939,828 | | |
| Multiline Retail Total | | | 4,939,828 | | |
| Specialty Retail – 2.7% | |
| Jo-Ann Stores, Inc. (a) | | | 147,800 | | | | 6,009,548 | | |
| Pier 1 Imports, Inc. (a) | | | 718,400 | | | | 4,382,240 | | |
Ulta Salon Cosmetics &
Fragrance, Inc. (a) | | | 279,587 | | | | 6,332,645 | | |
| Vitamin Shoppe, Inc. (a) | | | 195,500 | | | | 4,772,155 | | |
| Specialty Retail Total | | | 21,496,588 | | |
| Textiles, Apparel & Luxury Goods – 4.3% | |
| CROCS, Inc. (a) | | | 797,500 | | | | 9,968,750 | | |
| Deckers Outdoor Corp. (a) | | | 97,200 | | | | 4,225,284 | | |
| G-III Apparel Group Ltd. (a) | | | 194,100 | | | | 4,681,692 | | |
| Lululemon Athletica, Inc. (a) | | | 298,400 | | | | 9,853,168 | | |
| Warnaco Group, Inc. (a) | | | 128,500 | | | | 5,381,580 | | |
| Textiles, Apparel & Luxury Goods Total | | | 34,110,474 | | |
| Consumer Discretionary Total | | | 137,892,214 | | |
| | | Shares | | Value ($) | |
| Consumer Staples – 0.5% | |
| Personal Products – 0.5% | |
| Elizabeth Arden, Inc. (a) | | | 265,036 | | | | 4,338,639 | | |
| Personal Products Total | | | 4,338,639 | | |
| Consumer Staples Total | | | 4,338,639 | | |
| Energy – 5.5% | |
| Energy Equipment & Services – 2.2% | |
Complete Production
Services, Inc. (a) | | | 446,900 | | | | 7,883,316 | | |
| Core Laboratories N.V. | | | 62,000 | | | | 4,893,660 | | |
| Tetra Technologies, Inc. (a) | | | 562,400 | | | | 4,718,536 | | |
| Energy Equipment & Services Total | | | 17,495,512 | | |
| Oil, Gas & Consumable Fuels – 3.3% | |
| Comstock Resources, Inc. (a) | | | 178,500 | | | | 3,885,945 | | |
| Energy XXI Bermuda Ltd. (a) | | | 398,200 | | | | 7,960,018 | | |
| Oasis Petroleum, Inc. (a) | | | 234,400 | | | | 3,860,568 | | |
| Resolute Energy Corp. (a) | | | 414,300 | | | | 4,424,724 | | |
| World Fuel Services Corp. | | | 241,400 | | | | 6,165,356 | | |
| Oil, Gas & Consumable Fuels Total | | | 26,296,611 | | |
| Energy Total | | | 43,792,123 | | |
| Financials – 5.1% | |
| Capital Markets – 0.8% | |
| Stifel Financial Corp. (a) | | | 136,100 | | | | 5,890,408 | | |
| Capital Markets Total | | | 5,890,408 | | |
| Commercial Banks – 2.0% | |
| Center Financial Corp. (a) | | | 814,359 | | | | 3,770,482 | | |
| Pacific Continental Corp. | | | 260,099 | | | | 2,135,413 | | |
| Signature Bank (a) | | | 269,600 | | | | 9,851,184 | | |
| Commercial Banks Total | | | 15,757,079 | | |
| Consumer Finance – 0.6% | |
| EZCORP, Inc., Class A (a) | | | 270,100 | | | | 4,856,398 | | |
| Consumer Finance Total | | | 4,856,398 | | |
| Diversified Financial Services – 0.6% | |
Portfolio Recovery
Associates, Inc. (a) | | | 74,100 | | | | 4,720,170 | | |
| Diversified Financial Services Total | | | 4,720,170 | | |
| Real Estate Investment Trusts (REITs) – 1.1% | |
| FelCor Lodging Trust, Inc. (a) | | | 775,497 | | | | 3,086,478 | | |
| Tanger Factory Outlet Centers | | | 122,800 | | | | 5,675,816 | | |
| Real Estate Investment Trusts (REITs) Total | | | 8,762,294 | | |
| Financials Total | | | 39,986,349 | | |
See Accompanying Notes to Financial Statements.
8
Columbia Small Cap Growth Fund I
August 31, 2010
| Common Stocks (continued) | |
| | | Shares | | Value ($) | |
| Health Care – 22.2% | |
| Biotechnology – 5.1% | |
| Acorda Therapeutics, Inc. (a) | | | 135,900 | | | | 4,093,308 | | |
| Alexion Pharmaceuticals, Inc. (a) | | | 100,469 | | | | 5,673,484 | | |
| Cubist Pharmaceuticals, Inc. (a) | | | 204,500 | | | | 4,505,135 | | |
| Halozyme Therapeutics, Inc. (a) | | | 469,322 | | | | 3,585,620 | | |
| Human Genome Sciences, Inc. (a) | | | 165,864 | | | | 4,824,984 | | |
| Ironwood Pharmaceuticals, Inc. (a) | | | 337,500 | | | | 3,128,625 | | |
| Momenta Pharmaceuticals, Inc. (a) | | | 282,400 | | | | 4,080,680 | | |
| Onyx Pharmaceuticals, Inc. (a) | | | 254,983 | | | | 6,142,541 | | |
| Seattle Genetics, Inc. (a) | | | 369,480 | | | | 4,230,546 | | |
| Biotechnology Total | | | 40,264,923 | | |
| Health Care Equipment & Supplies – 5.2% | |
| Cutera, Inc. (a) | | | 284,600 | | | | 2,003,584 | | |
| DexCom, Inc. (a) | | | 464,900 | | | | 5,695,025 | | |
| ICU Medical, Inc. (a) | | | 129,100 | | | | 4,599,833 | | |
| Insulet Corp. (a) | | | 315,869 | | | | 4,175,788 | | |
| Masimo Corp. | | | 301,100 | | | | 6,853,036 | | |
| NuVasive, Inc. (a) | | | 306,000 | | | | 8,981,100 | | |
| Syneron Medical Ltd. (a) | | | 264,900 | | | | 2,124,498 | | |
| Thoratec Corp. (a) | | | 217,100 | | | | 6,990,620 | | |
| Health Care Equipment & Supplies Total | | | 41,423,484 | | |
| Health Care Providers & Services – 4.9% | |
| Brookdale Senior Living, Inc. (a) | | | 327,900 | | | | 4,393,860 | | |
| Catalyst Health Solutions, Inc. (a) | | | 141,455 | | | | 5,670,931 | | |
| HMS Holdings Corp. (a) | | | 119,100 | | | | 6,214,638 | | |
| IPC The Hospitalist Co., Inc. (a) | | | 339,200 | | | | 7,923,712 | | |
| LHC Group, Inc. (a) | | | 174,300 | | | | 3,487,743 | | |
| Mednax, Inc. (a) | | | 138,300 | | | | 6,408,822 | | |
| PSS World Medical, Inc. (a) | | | 246,241 | | | | 4,520,985 | | |
| Health Care Providers & Services Total | | | 38,620,691 | | |
| Health Care Technology – 2.3% | |
| Medidata Solutions, Inc. (a) | | | 347,800 | | | | 5,968,248 | | |
| Omnicell, Inc. (a) | | | 588,997 | | | | 6,570,261 | | |
| Quality Systems, Inc. | | | 94,000 | | | | 5,268,700 | | |
| Health Care Technology Total | | | 17,807,209 | | |
| Life Sciences Tools & Services – 1.4% | |
| ICON PLC, ADR (a) | | | 260,989 | | | | 5,741,758 | | |
| Illumina, Inc. (a) | | | 115,700 | | | | 4,962,373 | | |
| Life Sciences Tools & Services Total | | | 10,704,131 | | |
| Pharmaceuticals – 3.3% | |
| Ardea Biosciences, Inc. (a) | | | 197,201 | | | | 3,971,628 | | |
| Auxilium Pharmaceuticals, Inc. (a) | | | 172,000 | | | | 4,456,520 | | |
| Impax Laboratories, Inc. (a) | | | 440,900 | | | | 6,908,903 | | |
| MAP Pharmaceuticals, Inc. (a) | | | 220,400 | | | | 2,383,626 | | |
| Salix Pharmaceuticals Ltd. (a) | | | 231,000 | | | | 8,745,660 | | |
| Pharmaceuticals Total | | | 26,466,337 | | |
| Health Care Total | | | 175,286,775 | | |
| | | Shares | | Value ($) | |
| Industrials – 14.4% | |
| Aerospace & Defense – 1.1% | |
Global Defense Technology &
Systems, Inc. (a) | | | 243,432 | | | | 2,543,864 | | |
| LMI Aerospace, Inc. (a) | | | 402,900 | | | | 6,095,877 | | |
| Aerospace & Defense Total | | | 8,639,741 | | |
| Air Freight & Logistics – 1.8% | |
Atlas Air Worldwide
Holdings, Inc. (a) | | | 170,526 | | | | 7,390,597 | | |
| Forward Air Corp. | | | 277,000 | | | | 6,598,140 | | |
| Air Freight & Logistics Total | | | 13,988,737 | | |
| Airlines – 0.2% | |
| AirTran Holdings, Inc. (a) | | | 356,395 | | | | 1,607,341 | | |
| Airlines Total | | | 1,607,341 | | |
| Commercial Services & Supplies – 1.0% | |
| ACCO Brands Corp. (a) | | | 242,036 | | | | 1,406,229 | | |
| Tetra Tech, Inc. (a) | | | 365,700 | | | | 6,637,455 | | |
| Commercial Services & Supplies Total | | | 8,043,684 | | |
| Construction & Engineering – 1.1% | |
| Great Lakes Dredge & Dock Corp. | | | 820,100 | | | | 4,137,405 | | |
| Pike Electric Corp. (a) | | | 269,500 | | | | 2,182,950 | | |
| Sterling Construction Co., Inc. (a) | | | 249,862 | | | | 2,733,490 | | |
| Construction & Engineering Total | | | 9,053,845 | | |
| Electrical Equipment – 1.3% | |
| Baldor Electric Co. | | | 288,400 | | | | 10,117,072 | | |
| Electrical Equipment Total | | | 10,117,072 | | |
| Machinery – 3.5% | |
| ArvinMeritor, Inc. (a) | | | 567,700 | | | | 7,419,839 | | |
| Columbus McKinnon Corp. (a) | | | 355,800 | | | | 4,554,240 | | |
| Lindsay Corp. | | | 32,600 | | | | 1,201,962 | | |
| Nordson Corp. | | | 56,600 | | | | 3,632,022 | | |
| Robbins & Myers, Inc. | | | 243,600 | | | | 5,763,576 | | |
| Tennant Co. | | | 153,596 | | | | 4,798,339 | | |
| Machinery Total | | | 27,369,978 | | |
| Professional Services – 1.4% | |
| Advisory Board Co. (a) | | | 157,266 | | | | 6,375,564 | | |
| Korn/Ferry International (a) | | | 355,700 | | | | 4,631,214 | | |
| Professional Services Total | | | 11,006,778 | | |
| Road & Rail – 2.5% | |
Dollar Thrifty Automotive
Group, Inc. (a) | | | 107,483 | | | | 5,056,000 | | |
Genesee & Wyoming, Inc.,
Class A (a) | | | 129,800 | | | | 5,037,538 | | |
| Old Dominion Freight Line, Inc. (a) | | | 188,250 | | | | 4,388,108 | | |
See Accompanying Notes to Financial Statements.
9
Columbia Small Cap Growth Fund I
August 31, 2010
| Common Stocks (continued) | |
| | | Shares | | Value ($) | |
Roadrunner Transportation
Systems, Inc. (a) | | | 454,727 | | | | 5,333,948 | | |
| Road & Rail Total | | | 19,815,594 | | |
| Trading Companies & Distributors – 0.5% | |
| Beacon Roofing Supply, Inc. (a) | | | 281,500 | | | | 3,921,295 | | |
| Trading Companies & Distributors Total | | | 3,921,295 | | |
| Industrials Total | | | 113,564,065 | | |
| Information Technology – 27.8% | |
| Communications Equipment – 3.3% | |
| Aruba Networks, Inc. (a) | | | 550,000 | | | | 10,103,500 | | |
| Blue Coat Systems, Inc. (a) | | | 222,900 | | | | 4,197,207 | | |
| Infinera Corp. (a) | | | 559,800 | | | | 4,724,712 | | |
| Polycom, Inc. (a) | | | 243,700 | | | | 6,940,576 | | |
| Communications Equipment Total | | | 25,965,995 | | |
| Computers & Peripherals – 0.3% | |
| Super Micro Computer, Inc. (a) | | | 282,000 | | | | 2,547,870 | | |
| Computers & Peripherals Total | | | 2,547,870 | | |
| Electronic Equipment, Instruments & Components – 1.0% | |
| DTS, Inc. (a) | | | 228,900 | | | | 8,022,945 | | |
Electronic Equipment, Instruments &
Components Total | | | 8,022,945 | | |
| Internet Software & Services – 4.9% | |
| GSI Commerce, Inc. (a) | | | 193,000 | | | | 4,394,610 | | |
| LogMeIn, Inc. (a) | | | 166,100 | | | | 5,443,097 | | |
| MercadoLibre, Inc. (a) | | | 79,200 | | | | 5,222,448 | | |
| OpenTable, Inc. (a) | | | 251,900 | | | | 13,426,270 | | |
| VistaPrint NV (a) | | | 179,000 | | | | 5,491,720 | | |
| Vocus, Inc. (a) | | | 322,684 | | | | 4,782,177 | | |
| Internet Software & Services Total | | | 38,760,322 | | |
| IT Services – 3.6% | |
| ExlService Holdings, Inc. (a) | | | 292,024 | | | | 4,850,519 | | |
| Gartner, Inc. (a) | | | 288,300 | | | | 8,268,444 | | |
| VeriFone Systems, Inc. (a) | | | 407,800 | | | | 9,860,604 | | |
| Wright Express Corp. (a) | | | 157,273 | | | | 5,050,036 | | |
| IT Services Total | | | 28,029,603 | | |
| Semiconductors & Semiconductor Equipment – 4.2% | |
| Entropic Communications, Inc. (a) | | | 757,300 | | | | 5,763,053 | | |
| Omnivision Technologies, Inc. (a) | | | 261,700 | | | | 5,364,850 | | |
| Power Integrations, Inc. | | | 120,200 | | | | 3,292,278 | | |
| Silicon Laboratories, Inc. (a) | | | 92,300 | | | | 3,520,322 | | |
| SunPower Corp., Class A (a) | | | 451,700 | | | | 4,882,877 | | |
| Veeco Instruments, Inc. (a) | | | 150,182 | | | | 4,990,548 | | |
| Volterra Semiconductor Corp. (a) | | | 250,420 | | | | 5,020,921 | | |
Semiconductors & Semiconductor
Equipment Total | | | 32,834,849 | | |
| | | Shares | | Value ($) | |
| Software – 10.5% | |
| Advent Software, Inc. (a) | | | 153,769 | | | | 7,637,706 | | |
| AutoNavi Holdings Ltd., ADR (a) | | | 124,506 | | | | 1,942,293 | | |
| BroadSoft, Inc. (a) | | | 324,129 | | | | 2,648,134 | | |
| Concur Technologies, Inc. (a) | | | 181,343 | | | | 8,481,412 | | |
| Fortinet, Inc. (a) | | | 244,000 | | | | 4,975,160 | | |
| Informatica Corp. (a) | | | 190,000 | | | | 6,110,400 | | |
| Netscout Systems, Inc. (a) | | | 351,536 | | | | 5,564,815 | | |
| Pegasystems, Inc. | | | 193,600 | | | | 4,239,840 | | |
| RealPage, Inc. (a) | | | 104,874 | | | | 1,758,737 | | |
| Solera Holdings, Inc. | | | 117,898 | | | | 4,678,193 | | |
| Sourcefire, Inc. (a) | | | 233,200 | | | | 5,916,284 | | |
| SuccessFactors, Inc. (a) | | | 462,223 | | | | 9,752,905 | | |
| Taleo Corp., Class A (a) | | | 283,800 | | | | 7,273,794 | | |
| TIBCO Software, Inc. (a) | | | 846,600 | | | | 12,267,234 | | |
| Software Total | | | 83,246,907 | | |
| Information Technology Total | | | 219,408,491 | | |
| Materials – 3.9% | |
| Chemicals – 1.3% | |
| Solutia, Inc. (a) | | | 436,600 | | | | 5,911,564 | | |
| STR Holdings, Inc. (a) | | | 219,700 | | | | 4,541,199 | | |
| Chemicals Total | | | 10,452,763 | | |
| Containers & Packaging – 0.6% | |
| Silgan Holdings, Inc. | | | 161,700 | | | | 4,833,213 | | |
| Containers & Packaging Total | | | 4,833,213 | | |
| Metals & Mining – 2.0% | |
| Gammon Gold, Inc. (a) | | | 738,100 | | | | 5,284,796 | | |
| Stillwater Mining Co. (a) | | | 334,500 | | | | 4,582,650 | | |
Thompson Creek
Metals Co., Inc. (a) | | | 685,500 | | | | 5,881,590 | | |
| Metals & Mining Total | | | 15,749,036 | | |
| Materials Total | | | 31,035,012 | | |
| Telecommunication Services – 0.6% | |
| Wireless Telecommunication Services – 0.6% | |
SBA Communications Corp.,
Class A (a) | | | 128,407 | | | | 4,596,971 | | |
| Wireless Telecommunication Services Total | | | 4,596,971 | | |
| Telecommunication Services Total | | | 4,596,971 | | |
Total Common Stocks
(cost of $699,487,974) | | | 769,900,639 | | |
See Accompanying Notes to Financial Statements.
10
Columbia Small Cap Growth Fund I
August 31, 2010
| Purchased Put Options – 0.1% | |
| | | Contracts | | Value ($) | |
| Health Care – 0.1% | |
| Biotechnology – 0.1% | |
Momenta Pharmaceuticals, Inc.
Strike Price: $17.50
Expiration: 09/21/10 | | | 2,824 | | | | 931,920 | | |
Seattle Genetics, Inc.
Strike Price: $12.50
Expiration: 09/21/10 | | | 528 | | | | 81,840 | | |
| Biotechnology Total | | | 1,013,760 | | |
| Health Care Total | | | 1,013,760 | | |
Total Purchased Put Options
(cost of $731,368) | | | 1,013,760 | | |
| Short-Term Obligation – 2.8% | |
| | | Par ($) | | | |
Repurchase agreement with
Fixed Income Clearing Corp.,
dated 08/31/10, due 09/01/10
at 0.180%, collateralized by a
U.S. Treasury obligation
maturing 11/15/19, market
value $22,718,919 (repurchase
proceeds $22,270,111) | | | 22,270,000 | | | | 22,270,000 | | |
Total Short-Term Obligation
(cost of $22,270,000) | | | 22,270,000 | | |
Total Investments – 100.3%
(cost of $722,489,342)(b) | | | 793,184,399 | | |
| Other Assets & Liabilities, Net – (0.3)% | | | (2,741,012 | ) | |
| Net Assets – 100.0% | | | 790,443,387 | | |
Notes to Investment Portfolio:
(a) Non-income producing security.
(b) Cost for federal income tax purposes is $725,071,895.
The following table summarizes the inputs used, as of August 31, 2010, in valuing the Fund's assets:
| Description | | Quoted
Prices
(Level 1) | | Other
Significant
Observable
Inputs
(Level 2) | | Significant
Unobservable
Inputs
(Level 3) | | Total | |
| Total Common Stocks | | $ | 769,900,639 | | | $ | — | | | $ | — | | | $ | 769,900,639 | | |
Total Purchased
Put Options | | | 1,013,760 | | | | — | | | | — | | | | 1,013,760 | | |
Total Short-Term
Obligation | | | — | | | | 22,270,000 | | | | — | | | | 22,270,000 | | |
| Total Investments | | $ | 770,914,399 | | | $ | 22,270,000 | | | $ | — | | | $ | 793,184,399 | | |
Certain short-term obligations may be valued using amortized cost, an income approach which converts future cash flows to a present value based upon the premium or discount at purchase.
For more information on valuation inputs, and their aggregation into the levels used in the table above, please refer to the Security Valuation section in the accompanying Notes to Financial Statements.
For the year ended August 31, 2010, transactions in written call option contracts were as follows:
| | | Number of
contracts | | Premium
received | |
| Options outstanding at August 31, 2009 | | | — | | | | — | | |
| Options written | | | 810 | | | $ | 159,918 | | |
Options terminated in closing
purchase transactions | | | — | | | | — | | |
| Options exercised | | | — | | | | — | | |
| Options expired | | | (810 | ) | | | (159,918 | ) | |
| Options outstanding at August 31, 2010 | | | — | | | $ | — | | |
At August 31, 2010, the Fund held investments in the following sectors:
| Sector (Unaudited) | | % of
Net Assets | |
| Information Technology | | | 27.8 | | |
| Health Care | | | 22.3 | | |
| Consumer Discretionary | | | 17.4 | | |
| Industrials | | | 14.4 | | |
| Energy | | | 5.5 | | |
| Financials | | | 5.1 | | |
| Materials | | | 3.9 | | |
| Telecommunication Services | | | 0.6 | | |
| Consumer Staples | | | 0.5 | | |
| | | | 97.5 | | |
| Short-Term Obligation | | | 2.8 | | |
| Other Assets & Liabilities, Net | | | (0.3 | ) | |
| | | | 100.0 | | |
| Acronym | | Name | |
| ADR | | American Depositary Receipt | |
|
See Accompanying Notes to Financial Statements.
11
Statement of Assets and Liabilities – Columbia Small Cap Growth Fund I
August 31, 2010
| | | | | ($) | |
| Assets | | Investments, at identified cost | | | 722,489,342 | | |
| | | Investments, at value | | | 793,184,399 | | |
| | | Cash | | | 267,264 | | |
| | | Receivable for: | | | | | |
| | | Investments sold | | | 9,621,677 | | |
| | | Fund shares sold | | | 2,046,331 | | |
| | | Dividends | | | 132,371 | | |
| | | Interest | | | 111 | | |
| | | Trustees' deferred compensation plan | | | 28,029 | | |
| | | Prepaid expenses | | | 17,032 | | |
| | | Total Assets | | | 805,297,214 | | |
| Liabilities | | Payable for: | | | | | |
| | | Investments purchased | | | 13,020,641 | | |
| | | Fund shares repurchased | | | 885,888 | | |
| | | Investment advisory fee | | | 583,718 | | |
| | | Pricing and bookkeeping fees | | | 12,417 | | |
| | | Transfer agent fee | | | 189,786 | | |
| | | Trustees' fees | | | 711 | | |
| | | Custody fee | | | 5,963 | | |
| | | Distribution and service fees | | | 27,379 | | |
| | | Chief compliance officer expenses | | | 279 | | |
| | | Trustees' deferred compensation plan | | | 28,029 | | |
| | | Other liabilities | | | 99,016 | | |
| | | Total Liabilities | | | 14,853,827 | | |
| | | Net Assets | | | 790,443,387 | | |
| Net Assets Consist of | | Paid-in capital | | | 749,147,959 | | |
| | | Accumulated net investment loss | | | (82,402 | ) | |
| | | Accumulated net realized loss | | | (29,317,227 | ) | |
| | | Net unrealized appreciation on investments | | | 70,695,057 | | |
| | | Net Assets | | | 790,443,387 | | |
See Accompanying Notes to Financial Statements.
12
Statement of Assets and Liabilities (continued) – Columbia Small Cap Growth Fund I
August 31, 2010
| Class A | | Net assets | | $ | 62,261,175 | | |
| | | Shares outstanding | | | 2,643,332 | | |
| | | Net asset value per share | | $ | 23.55 | (a) | |
| | | Maximum sales charge | | | 5.75 | % | |
| | | Maximum offering price per share($23.55/0.9425) | | $ | 24.99 | (b) | |
| Class B | | Net assets | | $ | 2,155,229 | | |
| | | Shares outstanding | | | 94,351 | | |
| | | Net asset value and offering price per share | | $ | 22.84 | (a) | |
| Class C | | Net assets | | $ | 13,897,374 | | |
| | | Shares outstanding | | | 608,438 | | |
| | | Net asset value and offering price per share | | $ | 22.84 | (a) | |
| Class Y | | Net assets | | $ | 13,708,034 | | |
| | | Shares outstanding | | | 574,859 | | |
| | | Net asset value and offering price per share | | $ | 23.85 | | |
| Class Z | | Net assets | | $ | 698,421,575 | | |
| | | Shares outstanding | | | 29,331,634 | | |
| | | Net asset value and offering price per share | | $ | 23.81 | | |
(a) Redemption price per share is equal to net asset value less any applicable contingent deferred sales charge.
(b) On sales of $50,000 or more the offering price is reduced.
See Accompanying Notes to Financial Statements.
13
Statement of Operations – Columbia Small Cap Growth Fund I
For the Year Ended August 31, 2010
| | | | | ($) | |
| Investment Income | | Dividends | | | 1,674,757 | | |
| | | Interest | | | 24,793 | | |
| | | Foreign taxes withheld | | | (8,365 | ) | |
| | | Total Investment Income | | | 1,691,185 | | |
| Expenses | | Investment advisory fee | | | 6,529,203 | | |
| | | Distribution fee: | | | | | |
| | | Class B | | | 20,616 | | |
| | | Class C | | | 97,224 | | |
| | | Service fee: | | | | | |
| | | Class A | | | 156,543 | | |
| | | Class B | | | 6,872 | | |
| | | Class C | | | 32,408 | | |
| | | Transfer agent fee: | | | | | |
| | | Class A, Class B, Class C, Class Z | | | 1,075,822 | | |
| | | Transfer agent fee—Class Y | | | 51 | | |
| | | Pricing and bookkeeping fees | | | 145,808 | | |
| | | Trustees' fees | | | 43,145 | | |
| | | Custody fee | | | 38,574 | | |
| | | Chief compliance officer expenses | | | 1,394 | | |
| | | Other expenses | | | 329,471 | | |
| | | Expenses before interest expense | | | 8,477,131 | | |
| | | Interest expense | | | 1,096 | | |
| | | Total Expenses | | | 8,478,227 | | |
| | | Expense reductions | | | (128 | ) | |
| | | Net Expenses | | | 8,478,099 | | |
| | | Net Investment Loss | | | (6,786,914 | ) | |
Net Realized and Unrealized Gain
(Loss) on Investments, Foreign
Currency and Written Options | |
| | | Net realized gain (loss) on: | | | | | |
| | | Investments | | | 101,631,179 | | |
| | | Foreign currency transactions | | | (23,703 | ) | |
| | | Written options | | | 159,918 | | |
| | | Net realized gain | | | 101,767,394 | | |
| | | Net change in unrealized appreciation (depreciation) on investments | | | (18,161,392 | ) | |
| | | Net Gain | | | 83,606,002 | | |
| | | Net Increase Resulting from Operations | | | 76,819,088 | | |
See Accompanying Notes to Financial Statements.
14
Statement of Changes in Net Assets – Columbia Small Cap Growth Fund I
| | | | | Year Ended August 31, | |
| Increase (Decrease) in Net Assets | | | | 2010 ($) | | 2009 ($)(a) | |
| Operations | | Net investment loss | | | (6,786,914 | ) | | | (3,003,654 | ) | |
| | | Net realized gain (loss) on investments, foreign currency
transactions and written options | | | 101,767,394 | | | | (118,706,282 | ) | |
| | | Net change in unrealized appreciation (depreciation) on
investments | | | (18,161,392 | ) | | | 43,575,198 | | |
| | | Net increase (decrease) resulting from operations | | | 76,819,088 | | | | (78,134,738 | ) | |
| | | Net Capital Stock Transactions | | | 122,791,006 | | | | 259,444,727 | | |
| | | Total increase in net assets | | | 199,610,094 | | | | 181,309,989 | | |
| Net Assets | | Beginning of period | | | 590,833,293 | | | | 409,523,304 | | |
| | | End of period | | | 790,443,387 | | | | 590,833,293 | | |
| | | Accumulated net investment loss, at end of period | | | (82,402 | ) | | | (251,701 | ) | |
(a) Class Y shares commenced operations on July 15, 2009.
See Accompanying Notes to Financial Statements.
15
Statement of Changes in Net Assets (continued) – Columbia Small Cap Growth Fund I
| | | Capital Stock Activity | |
| | | Year Ended
August 31, 2010 | | Year Ended
August 31, 2009 (a)(b) | |
| | | Shares | | Dollars ($) | | Shares | | Dollars ($) | |
| Class A | |
| Subscriptions | | | 1,113,991 | | | | 27,211,950 | | | | 1,943,857 | | | | 34,901,719 | | |
| Redemptions | | | (1,082,435 | ) | | | (26,475,220 | ) | | | (920,396 | ) | | | (17,183,781 | ) | |
| Net increase | | | 31,556 | | | | 736,730 | | | | 1,023,461 | | | | 17,717,938 | | |
| Class B | |
| Subscriptions | | | 13,063 | | | | 300,178 | | | | 66,830 | | | | 1,233,954 | | |
| Redemptions | | | (47,461 | ) | | | (1,127,943 | ) | | | (40,755 | ) | | | (731,949 | ) | |
| Net increase (decrease) | | | (34,398 | ) | | | (827,765 | ) | | | 26,075 | | | | 502,005 | | |
| Class C | |
| Subscriptions | | | 219,503 | | | | 5,185,730 | | | | 404,657 | | | | 7,692,600 | | |
| Redemptions | | | (107,156 | ) | | | (2,548,963 | ) | | | (214,776 | ) | | | (3,870,815 | ) | |
| Net increase | | | 112,347 | | | | 2,636,767 | | | | 189,881 | | | | 3,821,785 | | |
| Class Y | |
| Subscriptions | | | — | | | | — | | | | 726,438 | | | | 14,786,726 | | |
| Redemptions | | | (102,318 | ) | | | (2,700,000 | ) | | | (49,261 | ) | | | (1,011,823 | ) | |
| Net increase (decrease) | | | (102,318 | ) | | | (2,700,000 | ) | | | 677,177 | | | | 13,774,903 | | |
| Class Z | |
| Subscriptions | | | 11,380,057 | | | | 276,508,206 | | | | 16,638,266 | | | | 317,334,603 | | |
| Redemptions | | | (6,309,766 | ) | | | (153,562,932 | ) | | | (5,031,679 | ) | | | (93,706,507 | ) | |
| Net increase | | | 5,070,291 | | | | 122,945,274 | | | | 11,606,587 | | | | 223,628,096 | | |
(a) Class Y shares commenced operations on July 15, 2009.
(b) Class Y shares reflect activity for the period July 15, 2009 through August 31, 2009.
See Accompanying Notes to Financial Statements.
16
Financial Highlights – Columbia Small Cap Growth Fund I
Selected data for a share outstanding throughout each period is as follows:
| | | Year Ended August 31, | | Period Ended
August 31, | |
| Class A Shares | | 2010 | | 2009 | | 2008 | | 2007 | | 2006 (a) | |
| Net Asset Value, Beginning of Period | | $ | 20.82 | | | $ | 27.82 | | | $ | 31.69 | | | $ | 30.29 | | | $ | 27.47 | | |
| Income from Investment Operations: | |
| Net investment loss (b) | | | (0.26 | ) | | | (0.19 | ) | | | (0.24 | ) | | | (0.25 | ) | | | (0.30 | ) | |
Net realized and unrealized gain (loss) on investments,
foreign currency and written options | | | 2.99 | | | | (6.81 | ) | | | 0.17 | | | | 6.38 | | | | 4.01 | | |
| Total from investment operations | | | 2.73 | | | | (7.00 | ) | | | (0.07 | ) | | | 6.13 | | | | 3.71 | | |
| Less Distributions to Shareholders: | |
| From net realized gains | | | — | | | | — | | | | (3.80 | ) | | | (4.73 | ) | | | (0.89 | ) | |
| Net Asset Value, End of Period | | $ | 23.55 | | | $ | 20.82 | | | $ | 27.82 | | | $ | 31.69 | | | $ | 30.29 | | |
| Total return (c) | | | 13.11 | % | | | (25.16 | )%(d) | | | (1.34 | )%(e) | | | 21.96 | % | | | 13.73 | %(f) | |
| Ratios to Average Net Assets/Supplemental Data: | |
| Net expenses before interest expense (g) | | | 1.32 | % | | | 1.37 | % | | | 1.37 | % | | | 1.40 | % | | | 1.46 | %(h) | |
| Interest expense | | | — | %(i) | | | — | | | | — | | | | — | %(i) | | | — | %(h)(i) | |
| Net expenses (g) | | | 1.32 | % | | | 1.37 | % | | | 1.37 | % | | | 1.40 | % | | | 1.46 | %(h) | |
| Waiver/Reimbursement | | | — | | | | 0.03 | % | | | — | | | | — | | | | — | | |
| Net investment loss (g) | | | (1.10 | )% | | | (1.01 | )% | | | (0.82 | )% | | | (0.82 | )% | | | (1.15 | )%(h) | |
| Portfolio turnover rate | | | 144 | % | | | 149 | % | | | 165 | % | | | 151 | % | | | 109 | %(f) | |
| Net assets, end of period (000s) | | $ | 62,261 | | | $ | 54,384 | | | $ | 44,184 | | | $ | 18,430 | | | $ | 2,836 | | |
(a) Class A shares were initially offered on November 1, 2005.
(b) Per share data was calculated using the average shares outstanding during the period.
(c) Total return at net asset value assuming all distributions reinvested and no initial sales charge or contingent deferred sales charge.
(d) Had the investment advisor and/or any of its affiliates not waived fees or reimbursed a portion of expenses, total return would have been reduced.
(e) Total return includes a voluntary reimbursement by the investment advisor for a realized investment loss due to a trading error. This reimbursement increased total return and net asset value per share by less than 0.01% and less than $0.01, respectively.
(f) Not annualized.
(g) The benefits derived from expense reductions had an impact of less than 0.01%.
(h) Annualized.
(i) Rounds to less than 0.01%.
See Accompanying Notes to Financial Statements.
17
Financial Highlights – Columbia Small Cap Growth Fund I
Selected data for a share outstanding throughout each period is as follows:
| | | Year Ended August 31, | | Period Ended
August 31, | |
| Class B Shares | | 2010 | | 2009 | | 2008 | | 2007 | | 2006 (a) | |
| Net Asset Value, Beginning of Period | | $ | 20.35 | | | $ | 27.39 | | | $ | 31.26 | | | $ | 30.14 | | | $ | 27.47 | | |
| Income from Investment Operations: | |
| Net investment loss (b) | | | (0.43 | ) | | | (0.32 | ) | | | (0.45 | ) | | | (0.48 | ) | | | (0.50 | ) | |
Net realized and unrealized gain (loss) on investments,
foreign currency and written options | | | 2.92 | | | | (6.72 | ) | | | 0.14 | | | | 6.33 | | | | 4.06 | | |
| Total from investment operations | | | 2.49 | | | | (7.04 | ) | | | (0.31 | ) | | | 5.85 | | | | 3.56 | | |
| Less Distributions to Shareholders: | |
| From net realized gains | | | — | | | | — | | | | (3.56 | ) | | | (4.73 | ) | | | (0.89 | ) | |
| Net Asset Value, End of Period | | $ | 22.84 | | | $ | 20.35 | | | $ | 27.39 | | | $ | 31.26 | | | $ | 30.14 | | |
| Total return (c) | | | 12.24 | % | | | (25.70 | )%(d) | | | (2.10 | )%(e) | | | 21.05 | % | | | 13.17 | %(f) | |
| Ratios to Average Net Assets/Supplemental Data: | |
| Net expenses before interest expense (g) | | | 2.07 | % | | | 2.12 | % | | | 2.12 | % | | | 2.15 | % | | | 2.21 | %(h) | |
| Interest expense | | | — | %(i) | | | — | | | | — | | | | — | %(i) | | | — | %(h)(i) | |
| Net expenses (g) | | | 2.07 | % | | | 2.12 | % | | | 2.12 | % | | | 2.15 | % | | | 2.21 | %(h) | |
| Waiver/Reimbursement | | | — | | | | 0.03 | % | | | — | | | | — | | | | — | | |
| Net investment loss (g) | | | (1.84 | )% | | | (1.75 | )% | | | (1.57 | )% | | | (1.57 | )% | | | (1.92 | )%(h) | |
| Portfolio turnover rate | | | 144 | % | | | 149 | % | | | 165 | % | | | 151 | % | | | 109 | %(f) | |
| Net assets, end of period (000s) | | $ | 2,155 | | | $ | 2,620 | | | $ | 2,812 | | | $ | 1,254 | | | $ | 521 | | |
(a) Class B shares were initially offered on November 1, 2005.
(b) Per share data was calculated using the average shares outstanding during the period.
(c) Total return at net asset value assuming all distributions reinvested and no contingent deferred sales charge.
(d) Had the investment advisor and/or any of its affiliates not waived fees or reimbursed a portion of expenses, total return would have been reduced.
(e) Total return includes a voluntary reimbursement by the investment advisor for a realized investment loss due to a trading error. This reimbursement increased total return and net asset value per share by less than 0.01% and less than $0.01, respectively.
(f) Not annualized.
(g) The benefits derived from expense reductions had an impact of less than 0.01%.
(h) Annualized.
(i) Rounds to less than 0.01%.
See Accompanying Notes to Financial Statements.
18
Financial Highlights – Columbia Small Cap Growth Fund I
Selected data for a share outstanding throughout each period is as follows:
| | | Year Ended August 31, | | Period Ended
August 31, | |
| Class C Shares | | 2010 | | 2009 | | 2008 | | 2007 | | 2006 (a) | |
| Net Asset Value, Beginning of Period | | $ | 20.35 | | | $ | 27.37 | | | $ | 31.25 | | | $ | 30.14 | | | $ | 27.47 | | |
| Income from Investment Operations: | |
| Net investment loss (b) | | | (0.44 | ) | | | (0.32 | ) | | | (0.44 | ) | | | (0.48 | ) | | | (0.49 | ) | |
Net realized and unrealized gain (loss) on investments,
foreign currency and written options | | | 2.93 | | | | (6.70 | ) | | | 0.12 | | | | 6.32 | | | | 4.05 | | |
| Total from investment operations | | | 2.49 | | | | (7.02 | ) | | | (0.32 | ) | | | 5.84 | | | | 3.56 | | |
| Less Distributions to Shareholders: | |
| From net realized gains | | | — | | | | — | | | | (3.56 | ) | | | (4.73 | ) | | | (0.89 | ) | |
| Net Asset Value, End of Period | | $ | 22.84 | | | $ | 20.35 | | | $ | 27.37 | | | $ | 31.25 | | | $ | 30.14 | | |
| Total return (c) | | | 12.24 | % | | | (25.65 | )%(d) | | | (2.14 | )%(e) | | | 21.02 | % | | | 13.17 | %(f) | |
| Ratios to Average Net Assets/Supplemental Data: | |
| Net expenses before interest expense (g) | | | 2.07 | % | | | 2.12 | % | | | 2.12 | % | | | 2.15 | % | | | 2.21 | %(h) | |
| Interest expense | | | — | %(i) | | | — | | | | — | | | | — | %(i) | | | — | %(h)(i) | |
| Net expenses (g) | | | 2.07 | % | | | 2.12 | % | | | 2.12 | % | | | 2.15 | % | | | 2.21 | %(h) | |
| Waiver/Reimbursement | | | — | | | | 0.03 | % | | | — | | | | — | | | | — | | |
| Net investment loss (g) | | | (1.85 | )% | | | (1.75 | )% | | | (1.57 | )% | | | (1.56 | )% | | | (1.92 | )%(h) | |
| Portfolio turnover rate | | | 144 | % | | | 149 | % | | | 165 | % | | | 151 | % | | | 109 | %(f) | |
| Net assets, end of period (000s) | | $ | 13,897 | | | $ | 10,093 | | | $ | 8,382 | | | $ | 2,303 | | | $ | 427 | | |
(a) Class C shares were initially offered on November 1, 2005.
(b) Per share data was calculated using the average shares outstanding during the period.
(c) Total return at net asset value assuming all distributions reinvested and no contingent deferred sales charge.
(d) Had the investment advisor and/or any of its affiliates not waived fees or reimbursed a portion of expenses, total return would have been reduced.
(e) Total return includes a voluntary reimbursement by the investment advisor for a realized investment loss due to a trading error. This reimbursement increased total return and net asset value per share by less than 0.01% and less than $0.01, respectively.
(f) Not annualized.
(g) The benefits derived from expense reductions had an impact of less than 0.01%.
(h) Annualized.
(i) Rounds to less than 0.01%.
See Accompanying Notes to Financial Statements.
19
Financial Highlights – Columbia Small Cap Growth Fund I
Selected data for a share outstanding throughout each period is as follows:
| Class Y Shares | | Year Ended
August 31,
2010 | | Period Ended
August 31,
2009 (a) | |
| Net Asset Value, Beginning of Period | | $ | 21.00 | | | $ | 19.21 | | |
| Income from Investment Operations: | |
| Net investment loss (b) | | | (0.17 | ) | | | (0.03 | ) | |
Net realized and unrealized gain (loss) on investments,
foreign currency and written options | | | 3.02 | | | | 1.82 | | |
| Total from investment operations | | | 2.85 | | | | 1.79 | | |
| Net Asset Value, End of Period | | $ | 23.85 | | | $ | 21.00 | | |
| Total return (c) | | | 13.57 | % | | | 9.32 | %(d) | |
| Ratios to Average Net Assets/Supplemental Data: | |
| Net expenses before interest expense (e) | | | 0.93 | % | | | 1.03 | %(f) | |
| Interest expense | | | — | %(g) | | | — | | |
| Net expenses (e) | | | 0.93 | % | | | 1.03 | %(f) | |
| Net investment loss (e) | | | (0.70 | )% | | | (0.96 | )%(f) | |
| Portfolio turnover rate | | | 144 | % | | | 149 | %(d) | |
| Net assets, end of period (000s) | | $ | 13,708 | | | $ | 14,222 | | |
(a) Class Y shares commenced operations on July 15, 2009. Per share data and total return reflect activity from that date.
(b) Per share data was calculated using the average shares outstanding during the period.
(c) Total return at net asset value.
(d) Not annualized.
(e) The benefits derived from expense reductions had an impact of less than 0.01%.
(f) Annualized.
(g) Rounds to less than 0.01%.
See Accompanying Notes to Financial Statements.
20
Financial Highlights – Columbia Small Cap Growth Fund I
Selected data for a share outstanding throughout each period is as follows:
| | | Year Ended August 31, | |
| Class Z Shares | | 2010 | | 2009 | | 2008 | | 2007 | | 2006 | |
| Net Asset Value, Beginning of Period | | $ | 21.00 | | | $ | 27.99 | | | $ | 31.86 | | | $ | 30.36 | | | $ | 27.80 | | |
| Income from Investment Operations: | |
| Net investment loss (a) | | | (0.21 | ) | | | (0.14 | ) | | | (0.17 | ) | | | (0.18 | ) | | | (0.29 | ) | |
Net realized and unrealized gain (loss) on investments,
foreign currency and written options | | | 3.02 | | | | (6.85 | ) | | | 0.18 | | | | 6.41 | | | | 3.74 | | |
| Total from investment operations | | | 2.81 | | | | (6.99 | ) | | | 0.01 | | | | 6.23 | | | | 3.45 | | |
| Less Distributions to Shareholders: | |
| From net investment income | | | — | | | | — | | | | — | | | | — | (b) | | | — | | |
| From net realized gains | | | — | | | | — | | | | (3.88 | ) | | | (4.73 | ) | | | (0.89 | ) | |
| Total distributions to shareholders | | | — | | | | — | | | | (3.88 | ) | | | (4.73 | ) | | | (0.89 | ) | |
| Net Asset Value, End of Period | | $ | 23.81 | | | $ | 21.00 | | | $ | 27.99 | | | $ | 31.86 | | | $ | 30.36 | | |
| Total return (c) | | | 13.38 | % | | | (24.97 | )%(d) | | | (1.09 | )%(e) | | | 22.28 | % | | | 12.64 | %(d) | |
| Ratios to Average Net Assets/Supplemental Data: | |
| Net expenses before interest expense (f) | | | 1.07 | % | | | 1.12 | % | | | 1.12 | % | | | 1.15 | % | | | 1.20 | % | |
| Interest expense | | | — | %(g) | | | — | | | | — | | | | — | %(g) | | | — | %(g) | |
| Net expenses (f) | | | 1.07 | % | | | 1.12 | % | | | 1.12 | % | | | 1.15 | % | | | 1.20 | % | |
| Waiver/Reimbursement | | | — | | | | 0.03 | % | | | — | | | | — | | | | — | %(g) | |
| Net investment loss (f) | | | (0.85 | )% | | | (0.76 | )% | | | (0.57 | )% | | | (0.59 | )% | | | (0.96 | )% | |
| Portfolio turnover rate | | | 144 | % | | | 149 | % | | | 165 | % | | | 151 | % | | | 109 | % | |
| Net assets, end of period (000s) | | $ | 698,422 | | | $ | 509,514 | | | $ | 354,145 | | | $ | 220,887 | | | $ | 193,493 | | |
(a) Per share data was calculated using the average shares outstanding during the period.
(b) Rounds to less than $0.01 per share.
(c) Total return at net asset value assuming all distributions reinvested.
(d) Had the investment advisor and/or any of its affiliates not waived fees or reimbursed a portion of expenses, total return would have been reduced.
(e) Total return includes a voluntary reimbursement by the investment advisor for a realized investment loss due to a trading error. This reimbursement increased total return and net asset value per share by less than 0.01% and less than $0.01, respectively.
(f) The benefits derived from expense reductions had an impact of less than 0.01%.
(g) Rounds to less than 0.01%.
See Accompanying Notes to Financial Statements.
21
Notes to Financial Statements – Columbia Small Cap Growth Fund I
August 31, 2010
Note 1. Organization
Columbia Small Cap Growth Fund I (the "Fund"), a series of Columbia Funds Series Trust I (the "Trust"), is a diversified fund. The Trust is registered under the Investment Company Act of 1940, as amended (the "1940 Act"), as an open-end management investment company organized as a Massachusetts business trust.
Investment Objective
The Fund seeks capital appreciation by investing, under normal market conditions, at least 80% of its net assets (plus any borrowings for investment purposes) in stocks of companies with a market capitalization, at the time of initial purchase, equal to or less than the largest stock in the Standard & Poor's SmallCap 600 Index.
Fund Shares
The Trust may issue an unlimited number of shares, and the Fund offers five classes of shares: Class A, Class B, Class C, Class Y and Class Z. Each share class has its own expense structure and sales charges, as applicable. The Fund no longer accepts investments from new or existing investors in the Fund's Class B shares, except in connection with the reinvestment of any dividend and/or capital gain distributions in Class B shares of the Fund and exchanges by existing Class B shareholders of the other Columbia Funds.
Class A shares are subject to a maximum front-end sales charge of 5.75% based on the amount of initial investment. Class A shares purchased without an initial sales charge in accounts aggregating $1 million to $50 million at the time of purchase are subject to a 1.00% contingent deferred sales charge ("CDSC") if the shares are sold within one year after purchase. Class B shares are subject to a maximum CDSC of 5.00% based upon the holding period after purchase. Class B shares will convert to Class A shares eight years after purchase. Class C shares are subject to a 1.00% CDSC on shares sold within one year after purchase. Class Y and Class Z shares are offered continuously at net asset value. There are certain restrictions on the purchase of Class Y and Class Z shares, as described in the Fund's prospectus.
Note 2. Significant Accounting Policies
The preparation of financial statements in accordance with accounting principles generally accepted in the United States of America ("GAAP") requires management to make certain estimates and assumptions that affect the reported amounts of assets and liabilities, the disclosure of contingent assets and liabilities at the date of the financial statements and the reported amounts of revenue and expenses during the reporting period. Actual results could differ from those estimates.
Management has evaluated the events and transactions that have occurred through the date the financial statements were issued and noted no items requiring adjustment of the financial statements or additional disclosures.
The following is a summary of significant accounting policies consistently followed by the Fund in the preparation of its financial statements.
Security Valuation
Equity securities are valued at the last sale price on the principal exchange on which they trade, except for securities traded on the NASDAQ, which are valued at the NASDAQ official close price. Unlisted securities or listed securities for which there were no sales during the day are valued at the closing bid price on such exchanges or over-the-counter markets.
Purchased options are valued at the last reported sale price, or in the absence of a sale, at the last quoted bid price.
Written options are valued at the last reported sale price, or in the absence of a sale, at the last quoted ask price.
Short-term investments maturing in 60 days or less are valued at amortized cost, which approximates market value.
Foreign securities are generally valued at the last sale price on the foreign exchange or market on which they trade. If any foreign share prices are not readily available as a result of limited share activity, the securities are valued at the last sale price of the local shares in the principal market in which such securities are normally traded.
Generally, trading in foreign securities is substantially completed each day at various times prior to the close of the New York Stock Exchange ("NYSE"). The values of such securities used in computing the net asset value of the Fund's shares are determined as of such times. Foreign currency exchange rates are generally determined at 4:00 p.m. Eastern (U.S.) time. Occasionally, events affecting the values of such
22
Columbia Small Cap Growth Fund I, August 31, 2010
foreign securities may occur between the times at which they are determined and the close of the customary trading session of the NYSE, which would not be reflected in the computation of the Fund's net asset value. If events materially affecting the values of such foreign securities occur and it is determined that market quotations are not reliable, then these foreign securities will be valued at their fair value using procedures approved by the Board of Trustees.
Investments for which market quotations are not readily available, or that have quotations which management believes are not reliable, are valued at fair value as determined in good faith under consistently applied procedures established by and under the general supervision of the Board of Trustees. If a security is valued at fair value, such value is likely to be different from the last quoted market price for the security. The determination of fair value often requires significant judgment. To determine fair value, management may use assumptions including but not limited to future cash flows and estimated risk premiums. Multiple inputs from various sources may be used to determine value.
GAAP establishes a hierarchy that prioritizes the inputs to valuation techniques used to measure fair value giving the highest priority to unadjusted quoted prices in active markets for identical securities (level 1 measurements) and the lowest priority to unobservable inputs (level 3 measurements) when market prices are not readily available or reliable. The three levels of the fair value hierarchy are described below:
• Level 1 – quoted prices in active markets for identical securities
• Level 2 – prices determined using other significant observable inputs (including quoted prices for similar securities, interest rates, prepayment speeds, credit risk and others)
• Level 3 – prices determined using significant unobservable inputs. In situations where quoted prices or observable inputs are unavailable or less reliable, unobservable inputs may be used. Unobservable inputs may include management's own assumptions about the factors market participants would use in pricing an investment.
The inputs or methodology used for valuing securities are not necessarily an indication of the risk associated with investing in those securities.
On January 21, 2010, the Financial Accounting Standards Board issued an Accounting Standards Update (the "amendment"), Fair Value Measurements and Disclosures (Topic 820): Improving Disclosures about Fair Value Measurements, which provides guidance on how investment assets and liabilities are to be valued and disclosed. Specifically, the amendment requires reporting entities to disclose the inputs and valuation techniques used to measure fair value for both recurring and nonrecurring fair value measurements for Level 2 and Level 3 positions. The amendment also requires that transfers between all levels (including Level 1 and Level 2) be disclosed on a gross basis (i.e., transfers out must be disclosed separately from transfers in), and requires disclosure of the reason(s) for sign ificant transfers. Additionally, purchases, sales, issuances and settlements must be disclosed on a gross basis in the Level 3 roll forward. The effective date of the amendment is for interim and annual periods beginning after December 15, 2009; except for the requirement to provide the Level 3 activity for purchases, sales, issuances and settlements on a gross basis, which will be effective for interim and annual periods beginning after December 15, 2010. At this time, management is evaluating the implications of the amendment and the impact to the financial statements.
Security Transactions
Security transactions are accounted for on the trade date. Cost is determined and gains (losses) are based upon the specific identification method for both financial statement and federal income tax purposes.
Foreign Currency Transactions and Translations
The values of all assets and liabilities quoted in foreign currencies are translated into U.S. dollars at that day's exchange rates. Net realized and unrealized gains (losses) on foreign currency transactions and translations include gains (losses) arising from the fluctuation in exchange rates between trade and settlement dates on securities transactions, gains (losses) arising from the disposition of foreign currency and currency gains (losses) between the accrual and payment dates on dividends, interest income and foreign withholding taxes.
For financial statement purposes, the Fund does not distinguish that portion of gains (losses) on investments which is due to changes in foreign exchange rates from that which is
23
Columbia Small Cap Growth Fund I, August 31, 2010
due to changes in market prices of the investments. Such fluctuations are included with the net realized and unrealized gains (losses) on investments on the Statement of Operations.
Derivative Instruments
The Fund may invest in derivative instruments. For additional information on derivative instruments, please see Note 6.
Repurchase Agreements
The Fund may engage in repurchase agreement transactions with institutions that management has determined are creditworthy. The Fund, through its custodian, receives delivery of the underlying securities collateralizing a repurchase agreement. Management is responsible for determining that the collateral is at least equal, at all times, to the value of the repurchase obligation including interest. A repurchase agreement transaction involves certain risks in the event of default or insolvency of the counterparty. These risks include possible delays in or restrictions on the Fund's ability to dispose of the underlying securities and a possible decline in the value of the underlying securities during the period while the Fund seeks to assert its rights.
Income Recognition
Interest income is recorded on the accrual basis.
Corporate actions and dividend income are recorded on the ex-date.
Distributions received from real estate investment trusts (REITs) in excess of their income are recorded as a reduction of the cost of the related investments. If the Fund no longer owns the applicable securities, any distributions received in excess of income are recorded as realized gains.
Expenses
General expenses of the Trust are allocated to the Fund and other series of the Trust based upon relative net assets or other expense allocation methodologies determined by the nature of the expense. Expenses directly attributable to a specific class of shares are charged to that share class. Expenses directly attributable to the Fund are charged to the Fund.
Determination of Class Net Asset Value
All income, expenses (other than class-specific expenses, as shown on the Statement of Operations) and realized and unrealized gains (losses) are allocated to each class of the Fund on a daily basis, based on the relative net assets of each class, for purposes of determining the net asset value of each class.
Federal Income Tax Status
The Fund intends to qualify each year as a "regulated investment company" under Subchapter M of the Internal Revenue Code, as amended, and will distribute substantially all of its taxable income, if any, for its tax year, and as such will not be subject to federal income taxes. In addition, the Fund intends to distribute in each calendar year substantially all of its net investment income, capital gains and certain other amounts, if any, such that the Fund should not be subject to federal excise tax. Therefore, no federal income or excise tax provision is recorded.
Foreign Tax
The Fund may be subject to foreign taxes on income, gains on investments or currency repatriation, a portion of which may be recoverable. The Fund will accrue such taxes and recoveries as applicable, based upon its current interpretation of tax rules and regulations that exist in the markets in which it invests.
Realized gains in certain countries may be subject to foreign taxes at the fund level, at rates ranging from approximately 10% to 15%. The Fund accrues for such foreign taxes on net realized and unrealized gains at the appropriate rate for each jurisdiction.
Distributions to Shareholders
Distributions from net investment income, if any, are declared and paid annually. Net realized capital gains, if any, are distributed at least annually. Income distributions and capital gain distributions are determined in accordance with federal income tax regulations which may differ from GAAP.
Indemnification
In the normal course of business, the Fund enters into contracts that contain a variety of representations and warranties and which provide general indemnities. The Fund's maximum exposure under these arrangements is unknown because this would involve future claims against the Fund. Also, under the Trust's organizational documents and by contract, the Trustees and officers of the Trust are indemnified against certain liabilities that may arise out of actions relating to their duties to the Trust. However, based on
24
Columbia Small Cap Growth Fund I, August 31, 2010
experience, the Fund expects the risk of loss due to these representations, warranties and indemnities to be minimal.
Note 3. Federal Tax Information
The timing and character of income and capital gain distributions are determined in accordance with income tax regulations, which may differ from GAAP. Reclassifications are made to the Fund's capital accounts for permanent tax differences to reflect income and gains available for distribution (or available capital loss carryforwards) under income tax regulations.
For the year ended August 31, 2010, permanent book and tax basis differences resulting primarily from differing treatments for net operating losses and foreign currency transactions were identified and reclassified among the components of the Fund's net assets as follows:
Accumulated
Net Investment
Loss | | Accumulated
Net Realized
Loss | | Paid-In Capital | |
| $ | 6,956,213 | | | $ | 23,702 | | | $ | (6,979,915 | ) | |
Net investment income and net realized gains (losses), as disclosed on the Statement of Operations, and net assets were not affected by this reclassification.
The tax character of distributions paid during the years ended August 31, 2010 and August 31, 2009 was as follows:
| | | August 31, | |
| | | 2010 | | 2009 | |
| Ordinary Income* | | $ | — | | | $ | — | | |
| Long-Term Capital Gains | | | — | | | | — | | |
* For tax purposes short-term capital gain distributions, if any, are considered ordinary income distributions.
As of August 31, 2010, the components of distributable earnings on a tax basis were as follows:
Undistributed
Ordinary
Income | | Undistributed
Long-Term
Capital Gains | | Net Unrealized
Appreciation* | |
| $ | — | | | $ | — | | | $ | 68,112,504 | | |
* The differences between book-basis and tax-basis net unrealized appreciation are primarily due to Passive Foreign Investment Company adjustments, deferral of losses from wash sales and identified straddle loss deferrals.
Unrealized appreciation and depreciation at August 31, 2010, based on cost of investments for federal income tax purposes were:
| Unrealized appreciation | | $ | 121,828,330 | | |
| Unrealized depreciation | | | (53,715,826 | ) | |
| Net unrealized appreciation | | $ | 68,112,504 | | |
The following capital loss carryforwards may be available to reduce taxable income arising from future net realized gains on investments, if any, to the extent permitted by the Internal Revenue Code:
| Year of Expiration | | Capital Loss
Carryforward | |
| 2017 | | $ | 26,761,735 | | |
Capital loss carryforwards of $23,882,810 were utilized during the year ended August 31, 2010.
Under current tax rules, certain currency and capital losses realized after October 31 may be deferred and treated as occurring on the first day of the following fiscal year. As of August 31, 2010, post-October currency losses of $23,702 attributed to security transactions were deferred to September 1, 2010.
Management is required to determine whether a tax position of the Fund is more likely than not to be sustained upon examination by the applicable taxing authority, including resolution of any related appeals or litigation processes, based on the technical merits of the position. The tax benefit to be recognized by the Fund is measured as the largest amount of benefit that is greater than fifty percent likely of being realized upon ultimate settlement. Management is not aware of any tax positions for which it is reasonably possible that the total amounts of unrecognized tax benefits will significantly change in the next twelve months. However, management's conclusions may be subject to review and adjustment at a later date based on factors including, but not limited to, new tax laws, regulations, and administrative interpretations (including relevant court decisions). The Fund's federal tax returns for the prior three fiscal year s remain subject to examination by the Internal Revenue Service.
25
Columbia Small Cap Growth Fund I, August 31, 2010
Note 4. Fees and Compensation Paid to Affiliates
Investment Advisory Fee
After the close of business on April 30, 2010, Ameriprise Financial, Inc. ("Ameriprise Financial") acquired a portion of the asset management business of Columbia Management Group, LLC (the "Transaction"), including the business of managing the Fund. In connection with the closing of the Transaction (the "Closing"), RiverSource Investments, LLC, a wholly owned subsidiary of Ameriprise Financial, became the investment advisor of the Fund and subsequently changed its name to Columbia Management Investment Advisers, LLC (the "New Advisor"). The New Advisor receives a monthly investment advisory fee based on the Fund's average daily net assets at the following annual rates:
| Average Daily Net Assets | | Annual Fee Rate | |
| First $500 million | | | 0.87 | % | |
| $500 million to $1 billion | | | 0.82 | % | |
| Over $1 billion | | | 0.77 | % | |
Prior to the Closing, Columbia Management Advisors, LLC ("Columbia"), an indirect, wholly owned subsidiary of Bank of America Corporation ("BOA"), provided investment advisory, administrative and other services to the Fund under the same fee structure.
For the year ended August 31, 2010, the Fund's effective investment advisory fee rate was 0.85% of the Fund's average daily net assets.
Administration Fee
Effective upon the Closing, the New Advisor became the administrator of the Fund under a new Administrative Services Agreement (the "Administrative Agreement"). Under the Administrative Agreement, the New Advisor provides administrative and other services to the Fund, including services previously performed under the Pricing and Bookkeeping Oversight and Services Agreement discussed below. The New Advisor does not receive a fee for its services under the Administrative Agreement. Prior to the Closing, Columbia provided administrative services to the Fund as discussed in the Investment Advisory Fee note above.
Pricing and Bookkeeping Fees
Prior to the Closing, the Fund entered into a Financial Reporting Services Agreement (the "Financial Reporting Services Agreement") with State Street Bank and Trust Company ("State Street") and Columbia pursuant to which State Street provides financial reporting services to the Fund. The Fund also entered into an Accounting Services Agreement (collectively with the Financial Reporting Services Agreement, the "State Street Agreements") with State Street and Columbia pursuant to which State Street provides accounting services to the Fund. Upon the Closing, Columbia assigned and delegated its rights and obligations under the State Street Agreements to the New Advisor. Under the State Street Agreements, the Fund pays State Street an annual fee of $38,000 paid monthly plus an additional monthly fee based on an annualized percentage rate of average daily net assets of the Fund for the month. The aggregate fee will not exceed $140,000 per year (exclusive of out-of-pocket expenses and charges). The Fund also reimburses State Street for certain out-of-pocket expenses and charges.
Also prior to the Closing, the Fund entered into a Pricing and Bookkeeping Oversight and Services Agreement (the "Services Agreement") with Columbia. Under the Services Agreement, Columbia provided services related to Fund expenses and the requirements of the Sarbanes-Oxley Act of 2002, and provided oversight of the accounting and financial reporting services provided by State Street. Under the Services Agreement, the Fund reimbursed Columbia for out-of-pocket expenses and charges, including fees payable to third parties, such as for pricing the Fund's portfolio securities, incurred by Columbia in the performance of services under the Services Agreement. The Services Agreement was terminated upon the Closing. These services are now provided under the Administrative Agreement discussed above.
Transfer Agent Fee
In connection with the Closing, RiverSource Service Corporation, a wholly owned subsidiary of Ameriprise Financial, became the transfer agent of the Fund and
26
Columbia Small Cap Growth Fund I, August 31, 2010
subsequently changed its name to Columbia Management Investment Services Corp. (the "New Transfer Agent"). The New Transfer Agent has contracted with Boston Financial Data Services ("BFDS") to serve as sub-transfer agent.
The New Transfer Agent receives a monthly fee for its services. All share classes, with the exception of Class Y shares (the "Other Share Classes") pay a monthly service fee (the "aggregate fee") based on the following:
(i) An annual rate of $22.36 is applied to the aggregate number of accounts for the Other Share Classes.
(ii) An allocated portion of fees for wire, telephone and redemption orders, Individual Retirement Account ("IRA") trustee agent fees and account transcript fees due to the New Transfer Agent from shareholders of the Fund and credits (net of bank charges) earned with respect to balances in accounts the New Transfer Agent maintains in connection with its services to the Fund. The New Transfer Agent also receives reimbursement for certain out-of-pocket expenses.
The aggregate fee is allocated to the Other Share Classes based on the relative average daily net assets of each share class.
Class Y shares of the Fund pay a monthly service fee based on the following:
(i) An annual rate of $22.36 is applied to the aggregate number of accounts for Class Y shares.
(ii) An allocated portion of fees for wire, telephone and redemption orders, IRA trustee agent fees and account transcript fees due to the New Transfer Agent from shareholders of the Fund and credits (net of bank charges) earned with respect to balances in accounts the New Transfer Agent maintains in connection with its services to the Fund. The New Transfer Agent also receives reimbursement for certain out-of-pocket expenses.
The New Transfer Agent also receives reimbursement of certain sub-transfer agent fees paid by the New Transfer Agent (exclusive of BFDS fees), calculated based on the combined assets held in the Other Share Classes in omnibus accounts and intended to recover the cost of payments to other parties (including affiliates of BOA) for services to those accounts. Such fees are allocated to the Other Share Classes based on the relative average daily net assets of each share class. The New Transfer Agent pays the fees of BFDS for services as sub-transfer agent and is not entitled to reimbursement for such fees from the Fund.
Prior to the Closing, Columbia Management Services, Inc. (the "Previous Transfer Agent"), an affiliate of Columbia and an indirect, wholly owned subsidiary of BOA, provided shareholder services to the Fund and contracted with BFDS to serve as sub-transfer agent, under the same fee structure. Prior to November 1, 2009, the annual rate was $17.34 per account.
An annual minimum account balance fee of $20 may apply to certain accounts with a value below the Fund's initial minimum investment requirements to reduce the impact of small accounts on transfer agent fees. These minimum account balance fees are recorded as part of expense reductions on the Statement of Operations. For the year ended August 31, 2010, no minimum account balance fees were charged by the Fund.
Underwriting Discounts, Service and Distribution Fees
In connection with the Closing, RiverSource Fund Distributors, Inc., an indirect wholly owned subsidiary of Ameriprise Financial became the distributor of the Fund and subsequently changed its name to Columbia Management Investment Distributors, Inc. (the "New Distributor").
For the year ended August 31, 2010, initial sales charges paid by shareholders on the purchase of Class A shares amounted to $11,768 and net CDSC fees paid by shareholders on certain redemptions of Class A, Class B and Class C shares amounted to $133, $5,690 and $2,854, respectively.
The Fund has adopted shareholder servicing and distribution plans pursuant to Rule 12b-1 under the 1940 Act (the "Plans") which require the payment of a monthly service fee to the New Distributor at the maximum annual rate of 0.25% of the average daily net assets attributable to Class A, Class B and Class C shares of the Fund. The Plans also require the payment of a monthly distribution fee to the New Distributor at the maximum annual rates of 0.10%, 0.75% and 0.75% of the average daily net assets attributable to Class A, Class B and Class C shares, respectively.
The Fund may pay distribution and service fees up to a maximum annual rate of 0.35% of the Fund's average daily net assets attributable to Class A shares (comprised of up to 0.10%
27
Columbia Small Cap Growth Fund I, August 31, 2010
for distribution services and up to 0.25% for shareholder liaison services), but currently limit such fees to an aggregate fee of not more than 0.25% of the Fund's average daily net assets attributable to Class A shares.
The CDSC and the distribution fees received from the Plans are used principally as repayment to the New Distributor for amounts paid by the New Distributor to dealers who sold such shares.
Prior to the Closing, Columbia Management Distributors, Inc., an affiliate of Columbia and an indirect, wholly owned subsidiary of BOA, was the principal underwriter of the Fund's shares. There were no changes to the underwriting discount structure of the Fund or the service or distribution fee rates paid by the Fund as a result of the Transaction.
Expense Limits and Fee Waivers
Effective May 1, 2010, the New Advisor has voluntarily agreed to reimburse a portion of the Fund's expenses so that the Fund's ordinary operating expenses (excluding any distribution and service fees, brokerage commissions, interest, taxes and extraordinary expenses, but including custodian charges relating to overdrafts, if any), after giving effect to any balance credits from the Fund's custodian, do not exceed 1.10% of the Fund's average daily net assets on an annualized basis. This arrangement may be modified or terminated by the New Advisor at any time.
Prior to May 1, 2010, Columbia voluntarily agreed to reimburse a portion of the Fund's expenses so that the Fund's ordinary operating expenses (excluding any distribution and service fees, brokerage commissions, interest, taxes and extraordinary expenses, but including custodian charges relating to overdrafts, if any) after giving effect to any balance credits from the Fund's custodian, did not exceed 1.10% of the Fund's average daily net assets on an annualized basis.
Fees Paid to Officers and Trustees
In connection with the Closing, all officers of the Fund are employees of the New Advisor or its affiliates and, with the exception of the Fund's Chief Compliance Officer, receive no compensation from the Fund. The Board of Trustees has appointed a Chief Compliance Officer to the Fund in accordance with federal securities regulations. The Fund, along with other affiliated funds, pays its pro-rata share of the expenses associated with the Chief Compliance Officer. The Fund's expenses for the Chief Compliance Officer will not exceed $15,000 per year. Prior to the Closing, the Fund paid its pro-rata share of the expenses for the Chief Compliance Officer under the same fee structure.
Trustees are compensated for their services to the Fund, as set forth on the Statement of Operations. The Trust's eligible Trustees may participate in a deferred compensation plan which may be terminated at any time. Obligations of the plan will be paid solely out of the Fund's assets.
Other Related Party Transactions
Prior to the Closing, the Fund used one or more brokers that were affiliates of BOA in connection with the purchase and sale of its securities. Total brokerage commissions paid to affiliated brokers for the period prior to the Closing were $10,882.
Note 5. Custody Credits
The Fund has an agreement with its custodian bank under which custody fees may be reduced by balance credits. These credits are recorded as part of expense reductions on the Statement of Operations. The Fund could have invested a portion of the assets utilized in connection with the expense offset arrangement in an income-producing asset if it had not entered into such an agreement. For the year ended August 31, 2010, these custody credits reduced total expenses by $128 for the Fund.
Note 6. Objectives and Strategies for Investing in Derivative Instruments
The Fund uses derivatives instruments including options in order to meet its investment objectives. The Fund employs strategies in differing combinations to permit it to increase, decrease or change the level of exposure to market risk factors. The achievement of any strategy relating to derivatives depends on an analysis of various risk factors, and if the strategies for the use of derivatives do not work as intended, the Fund may not achieve its investment objectives.
28
Columbia Small Cap Growth Fund I, August 31, 2010
In pursuit of its investment objectives, the Fund is exposed to the following market risks:
Equity Risk: Equity risk relates to change in value of equity securities such as common stocks due to general market conditions such as real or perceived adverse economic conditions, changes in the general outlook for corporate earnings, or adverse investor sentiment. Equity securities generally have greater price volatility than fixed income securities.
The following note provides more detailed information about each derivative type held by the Fund:
Options—The Fund wrote covered call options to decrease the Fund's exposure to equity risk on investments. Written covered call options become more valuable as the price of the underlying instruments depreciates relative to the strike price.
Writing put options tends to increase the Fund's exposure to the underlying instrument. When the Fund writes a call or put option, an amount equal to the premium received is recorded as a liability and subsequently marked-to-market to reflect the current value of the option written. Premiums received from writing options which expire are treated as realized gains. Premiums received from writing options which are exercised or closed are added to the proceeds or offset against the amounts paid on the underlying security transaction to determine the realized gain or loss. The Fund, as a writer of an option, has no control over whether the underlying security may be sold (call) or purchased (put) and as a result bears the market risk of an unfavorable change in the price of the security underlying the written option. There is the risk that the Fund may not be able to enter into a closing transaction because of an illiquid market. Th e Fund identifies within its portfolio of investments cash or liquid portfolio securities equal to the amount of the written options contract commitment.
The Fund may also purchase put and call options. Purchasing call options tends to increase the Fund's exposure to the underlying instrument. Purchasing put options tends to decrease the Fund's exposure to the underlying instrument. The Fund may pay a premium, which is included in the Fund's Statement of Assets and Liabilities as an investment and subsequently marked-to-market to reflect the current value of the option. The risk associated with purchasing put and call options is limited to the premium paid. Premiums paid for purchasing options which expire are treated as realized losses. Premiums paid for purchasing options which are exercised are added to the amounts paid (call) or offset against the proceeds (put) on the underlying security to determine the realized gain or loss. If the Fund enters into a closing transaction, the Fund will realize a gain or loss, depending on whether the proceeds from the closing transaction ar e greater or less than the cost of the option.
During the year ended August 31, 2010, the Fund entered into 810 written options contracts.
The following table is a summary of the value of the Fund's derivative instruments as of August 31, 2010:
| Fair Value of Derivative Instruments | |
| Assets | | Liabilities | |
Statement
of Assets and
Liabilities | | Fair Value* | | Statement
of Assets and
Liabilities | | Fair Value | |
Purchased
Put Options | | $ | 1,013,760 | | | Purchased
Put Options | | $— | |
*This amount is included in the Investments, at value on the Statement of Assets and Liabilities.
The effect of derivative instruments on the Statement of Operations for the year ended August 31, 2010.
| | | Amount of Realized Gain or (Loss) and
Change in Unrealized Appreciation or
(Depreciation) on Derivatives
Recognized in Income | |
| | |
Risk
Exposure | |
Net
Realized
Gain (Loss) | | Change in
Unrealized
Appreciation
(Depreciation) | |
| Written call options | | Equity Risk | | $ | 159,918 | | | | — | | |
| Purchased put options | | Equity Risk | | | — | | | $ | 282,392 | | |
29
Columbia Small Cap Growth Fund I, August 31, 2010
Note 7. Portfolio Information
For the year ended August 31, 2010, the cost of purchases and proceeds from sales of securities, excluding short-term obligations, for the Fund were $1,166,914,927 and $1,052,613,822, respectively.
Note 8. Line of Credit
The Fund and other affiliated funds participate in a $280,000,000 committed, unsecured revolving line of credit provided by State Street. The maximum amount that may be borrowed by any fund is limited to the lesser of $200,000,000 and the Fund's borrowing limit set forth in the Fund's registration statement. Borrowings are available for short-term liquidity or temporary or emergency purposes.
Effective October 15, 2009, interest is charged to each participating fund based on the fund's borrowings at a rate per annum equal to the greater of the Federal Funds Rate plus 1.25% or the overnight LIBOR Rate plus 1.25%. In addition, a commitment fee of 0.15% per annum is accrued and apportioned among the participating funds pro rata based on their relative net assets.
Prior to October 15, 2009, interest was charged to each participating fund based on the fund's borrowings at a rate per annum equal to the greater of the Federal Funds Rate plus 0.50% or the overnight LIBOR Rate plus 0.50%. In addition, an annual operations agency fee of $20,000, an amendment fee of 0.02% and a commitment fee of 0.12% per annum were accrued and apportioned among the participating funds pro rata based on their relative net assets.
For the year ended August 31, 2010, the average daily loan balance outstanding on days where borrowing existed was $2,800,000 at a weighted average interest rate of 1.43%
Note 9. Shareholder Concentration
As of August 31, 2010, one shareholder account owned 44.5% of the outstanding shares of the Fund. Purchase and redemption activity of this account may have a significant effect on the operations of the Fund.
Note 10. Significant Risks and Contingencies
Sector Focus Risk
The Fund may focus its investments in certain sectors, subjecting it to greater risk than a fund that is less focused.
Foreign Securities Risk
There are certain additional risks involved when investing in foreign securities. These risks may involve foreign currency exchange rate fluctuations, adverse political and economic developments and the possible prevention of currency exchange or other foreign governmental laws or restrictions. In addition, the liquidity of foreign securities may be more limited than that of domestic securities.
Information Regarding Pending and Settled Legal Proceedings
In June 2004, an action captioned John E. Gallus et al. v. American Express Financial Corp. and American Express Financial Advisors Inc. was filed in the United States District Court for the District of Arizona. The plaintiffs allege that they are investors in several American Express Company (now known as legacy RiverSource) mutual funds and they purport to bring the action derivatively on behalf of those funds under the Investment Company Act of 1940. The plaintiffs allege that fees allegedly paid to the defendants by the funds for investment advisory and administrative services are excessive. The plaintiffs seek remedies including restitution and rescission of investment advisory and distribution agreements. The plaintiffs voluntarily agreed to transfer this case to the United States District Court for the District of Minnesota (the District Court). In response to defendants' motion to dismiss the complaint, the District Court dismissed one of plaintiffs' four claims and granted plaintiffs limited discovery. Defendants moved for summary judgment in April 2007. Summary judgment was granted in the defendants' favor on July 9, 2007. The plaintiffs filed a notice of appeal with the Eighth Circuit Court of Appeals (the Eighth Circuit) on August 8, 2007. On April 8, 2009, the Eighth Circuit reversed summary judgment and remanded to the District Court for further proceedings. On August 6, 2009, defendants filed a writ of certiorari with the U.S. Supreme Court (the Supreme Court), asking the Supreme Court to stay the District Court proceedings while the Supreme Court considers and rules in a
30
Columbia Small Cap Growth Fund I, August 31, 2010
case captioned Jones v. Harris Associates, which involves issues of law similar to those presented in the Gallus case. On March 30, 2010, the Supreme Court issued its ruling in Jones v. Harris Associates, and on April 5, 2010, the Supreme Court vacated the Eighth Circuit's decision in the Gallus case and remanded the case to the Eighth Circuit for further consideration in light of the Supreme Court's decision in Jones v. Harris Associates. On June 4, 2010, the Eighth Circuit remanded the Gallus case to the District Court for further consideration in light of the Supreme Court's decision in Jones v. Harris Associates.
In December 2005, without admitting or denying the allegations, American Express Financial Corporation (AEFC, which is now known as Ameriprise Financial, Inc. (Ameriprise Financial)), entered into settlement agreements with the Securities and Exchange Commission (SEC) and Minnesota Department of Commerce (MDOC) related to market timing activities. As a result, AEFC was censured and ordered to cease and desist from committing or causing any violations of certain provisions of the Investment Advisers Act of 1940, the Investment Company Act of 1940, and various Minnesota laws. AEFC agreed to pay disgorgement of $10 million and civil money penalties of $7 million. AEFC also agreed to retain an independent distribution consultant to assist in developing a plan for distribution of all disgorgement and civil penalties ordered by the SEC in accordance with various undertakings detailed at http://www.sec.gov/litigation/admin/ia-2451.pdf. Ameriprise Financial and its affiliates have cooperated with the SEC and the MDOC in these legal proceedings, and have made regular reports to the funds' Boards of Directors/Trustees.
Ameriprise Financial and certain of its affiliates have historically been involved in a number of legal, arbitration and regulatory proceedings, including routine litigation, class actions, and governmental actions, concerning matters arising in connection with the conduct of their business activities. Ameriprise Financial believes that the Funds are not currently the subject of, and that neither Ameriprise Financial nor any of its affiliates are the subject of, any pending legal, arbitration or regulatory proceedings that are likely to have a material adverse effect on the Funds or the ability of Ameriprise Financial or its affiliates to perform under their contracts with the Funds. Ameriprise Financial is required to make 10-Q, 10-K and, as necessary, 8-K filings with the Securities and Exchange Commission on legal and regulatory matters that relate to Ameriprise Financial and its affiliates. Copies of these filings may be obt ained by accessing the SEC website at www.sec.gov.
There can be no assurance that these matters, or the adverse publicity associated with them, will not result in increased fund redemptions, reduced sale of fund shares or other adverse consequences to the Funds. Further, although we believe proceedings are not likely to have a material adverse effect on the Funds or the ability of Ameriprise Financial or its affiliates to perform under their contracts with the Funds, these proceedings are subject to uncertainties and, as such, we are unable to estimate the possible loss or range of loss that may result. An adverse outcome in one or more of these proceedings could result in adverse judgments, settlements, fines, penalties or other relief that could have a material adverse effect on the consolidated financial condition or results of operations of Ameriprise Financial.
31
Report of Independent Registered Public Accounting Firm
To the Trustees of Columbia Funds Series Trust I and Shareholders of Columbia Small Cap Growth Fund I
In our opinion, the accompanying statement of assets and liabilities, including the investment portfolios, and the related statements of operations and of changes in net assets and the financial highlights present fairly, in all material respects, the financial position of Columbia Small Cap Growth Fund I (the "Fund") (a series of Columbia Funds Series Trust I) at August 31, 2010, the results of its operations for the year then ended, the changes in its net assets for each of the two years in the period then ended, and the financial highlights for each of the five years in the period then ended, in conformity with accounting principles generally accepted in the United States of America. These financial statements and financial highlights (hereafter referred to as "financial statements") are the responsibility of the Fund's management. Our responsibility is to express an opinion on these financial statements based on our audits. We conducted our audits of these financial statements in accordance with the standards of the Public Company Accounting Oversight Board (United States). Those standards require that we plan and perform the audit to obtain reasonable assurance about whether the financial statements are free of material misstatement. An audit includes examining, on a test basis, evidence supporting the amounts and disclosures in the financial statements, assessing the accounting principles used and significant estimates made by management, and evaluating the overall financial statement presentation. We believe that our audits, which included confirmation of securities at August 31, 2010 by correspondence with the custodian and brokers, provide a reasonable basis for our opinion.
PricewaterhouseCoopers LLP
Boston, Massachusetts
October 25, 2010
32
Fund Governance
The Trustees serve terms of indefinite duration. The names, addresses and birth years of the Trustees and Officers of the Funds in the Columbia Funds Series Trust I, the year each was first elected or appointed to office, their principal business occupations during at least the last five years, the number of Funds overseen by each Trustee and other directorships they hold are shown below. Each officer listed below serves as an officer of each Fund in the Columbia Funds Complex.
Independent Trustees
Name, Address and Year of Birth,
Position with Funds, Year First
Elected or Appointed to Office | | Principal Occupation(s) During Past Five Years, Number of Funds in Columbia
Funds Complex Overseen by Trustee, Other Directorships Held
| |
| John D. Collins (Born 1938) | |
|
c/o Columbia Management
Investment Advisers, LLC
One Financial Center
Boston, MA 02111
Trustee (since 2005) | | Retired. Consultant, KPMG, LLP (accounting and tax firm) from July 1999 to June 2000; Partner, KPMG, LLP from March 1962 to June 1999. Oversees 64; Mrs. Fields Original Cookies, Inc. (consumer products); Suburban Propane Partners, L.P.; and Montpelier Re (insurance underwriting firm) | |
|
| Rodman L. Drake (Born 1943) | |
|
c/o Columbia Management
Investment Advisers, LLC
One Financial Center
Boston, MA 02111
Trustee (since 1994) and Chairman of the Board (since 2009) | | Co-Founder of Baringo Capital LLC (private equity) since 2002; CEO of Crystal River Capital, Inc. (real estate investment trust) since 2003; President, Continuation Investments Group, Inc. from 1997 to 2001. Oversees 64; Jackson Hewitt Tax Service Inc. (tax preparation services); Crystal Capital River, Inc. (real estate investment trust); Student Loan Corporation (student loan provider); Celgene Corporation (global biotechnology company); The Helios Funds (exchange-traded funds); and Apex Silver Mines Ltd. from 2007 to 2009 | |
|
| Douglas A. Hacker (Born 1955) | |
|
c/o Columbia Management
Investment Advisers, LLC
One Financial Center
Boston, MA 02111
Trustee (since 1996) | | Independent business executive since May 2006; Executive Vice President—Strategy of United Airlines (airline) from December 2002 to May 2006; President of UAL Loyalty Services (airline marketing company) from September 2001 to December 2002; Executive Vice President and Chief Financial Officer of United Airlines from July 1999 to September 2001. Oversees 64; Nash Finch Company (food distributor); Aircastle Limited (aircraft leasing) | |
|
| Janet Langford Kelly (Born 1957) | |
|
c/o Columbia Management
Investment Advisers, LLC
One Financial Center
Boston, MA 02111
Trustee (since 1996) | | Senior Vice President, General Counsel and Corporate Secretary, ConocoPhillips (integrated energy company) since September 2007; Deputy General Counsel—Corporate Legal Services, ConocoPhillips from August 2006 to August 2007; Partner, Zelle, Hofmann, Voelbel, Mason & Gette LLP (law firm) from March 2005 to July 2006; Adjunct Professor of Law, Northwestern University, from September 2004 to June 2006; Director, UAL Corporation (airline) from February 2006 to July 2006; Oversees 64; None | |
|
| Charles R. Nelson (Born 1942) | |
|
c/o Columbia Management
Investment Advisers, LLC
One Financial Center
Boston, MA 02111
Trustee (since 1981) | | Professor of Economics, University of Washington, since January 1976; Ford and Louisa Van Voorhis Professor of Political Economy, University of Washington, since September 1993; Adjunct Professor of Statistics, University of Washington, since September 1980; Associate Editor, Journal of Money Credit and Banking, 1993-2008; Consultant on econometric and statistical matters. Oversees 64; None | |
|
33
Fund Governance (continued)
Independent Trustees (continued)
Name, Address and Year of Birth,
Position with Funds, Year First
Elected or Appointed to Office | | Principal Occupation(s) During Past Five Years, Number of Funds in Columbia
Funds Complex Overseen by Trustee, Other Directorships Held
| |
| John J. Neuhauser (Born 1943) | |
|
c/o Columbia Management
Investment Advisers, LLC
One Financial Center
Boston, MA 02111
Trustee (since 1984) | | President, Saint Michael's College, since August 2007; Director or Trustee of several non-profit organizations, including Fletcher Allen Health Care, Inc.; University Professor, Boston College from November 2005 to August 2007; Academic Vice President and Dean of Faculties, Boston College from August 1999 to October 2005. Oversees 64; Liberty All-Star Equity Fund and Liberty All-Star Growth Fund, Inc. (closed-end funds) | |
|
| Jonathan Piel (Born 1938) | |
|
c/o Columbia Management
Investment Advisers, LLC
One Financial Center
Boston, MA 02111
Trustee (since 1994) | | Cable television producer and website designer; The Editor, Scientific American from 1984 to 1994; Vice President, Scientific American, Inc., from 1984 to 1994; Member, Advisory Board, Stone Age Institute, Bloomington, Indiana (research institute that explores the effect of technology on human evolution); Member, Board of Directors of the National Institute of Social Sciences, New York City; Member, Board of Trustees of the William Alanson White Institute, New York City (institution for training psychoanalysts); and Member, Advisory Board, Mount Sinai Children's Environmental Health Center, New York. Oversees 64; None | |
|
| Patrick J. Simpson (Born 1944) | |
|
c/o Columbia Management
Investment Advisers, LLC
One Financial Center
Boston, MA 02111
Trustee (since 2000) | | Partner, Perkins Coie LLP (law firm). Oversees 64; None | |
|
| Anne-Lee Verville (Born 1945) | |
|
c/o Columbia Management
Investment Advisers, LLC
One Financial Center
Boston, MA 02111
Trustee (since 1998) | | Retired since 1997 (formerly General Manager–Global Education Industry from 1994 to 1997, President–Application Systems Division from 1991 to 1994, Chief Financial Officer–US Marketing & Services from 1988 to 1991, and Chief Information Officer from 1987 to 1988, IBM Corporation (computer and technology)). Oversees 64; Enesco Group, Inc. (producer of giftware and home and garden decor products) from 2001 to 2006 | |
|
34
Fund Governance (continued)
Interested Trustee
Name, Address and Year of Birth,
Position with Funds, Year First
Elected or Appointed to Office | | Principal Occupation(s) During Past Five Years, Number of Funds in Columbia
Funds Complex Overseen by Trustee, Other Directorships Held
| |
| William E. Mayer1 (Born 1940) | |
|
c/o Columbia Management
Investment Advisers, LLC
One Financial Center
Boston, MA 02111
Trustee (since 1994) | | Partner, Park Avenue Equity Partners (private equity) since February 1999; Dean and Professor, College of Business and Management, University of Maryland from 1992 to 1996. Oversees 64; DynaVox Inc. (software developer); Lee Enterprises (print media); WR Hambrecht + Co. (financial service provider); BlackRock Kelso Capital Corporation (investment company) | |
|
1 Mr. Mayer may technically be an "interested person" (as defined in the Investment Company Act of 1940) by reason of his affiliation with WR Hambrecht + Co., a registered broker/dealer that may execute portfolio transactions for, engage in principal transactions with or distribute shares of a Fund or other funds or accounts advised/managed by the Adviser or any sub-adviser to a Fund.
The Statement of Additional Information includes additional information about the Trustees of the Funds and is available, without charge, upon request by calling 1-800-345-6611.
Officers
| Name, Year of Birth and Address | | Principal Occupation(s) During the Past Five Years | |
| J. Kevin Connaughton (Born 1964) | |
|
One Financial Center
Boston, MA 02111
President (since 2009) | | Senior Vice President and General Manager–Mutual Fund Products, Columbia Management Investment Advisers, LLC since May 2010; President, Columbia Funds, since 2009, and RiverSource Funds, since May 2010 (previously Senior Vice President and Chief Financial Officer, Columbia Funds, from June 2008 to January 2009, Treasurer, Columbia Funds, from October 2003 to May 2008, and senior officer of various other affiliated funds since 2000); Managing Director, Columbia Management Advisors, LLC from December 2004 to April 2010. | |
|
| Michael G. Clarke (Born 1969) | |
|
One Financial Center
Boston, MA 02111
Senior Vice President and Chief
Financial Officer (since 2009) | | Vice President, Columbia Management Investment Advisers, LLC since May 2010; Managing Director of Fund Administration, Columbia Management Advisors, LLC, from September 2004 to April 2010; senior officer of Columbia Funds and affiliated funds since 2002. | |
|
| Scott R. Plummer (Born 1959) | |
|
5228 Ameriprise Financial Center
Minneapolis, MN 55474
Senior Vice President, Secretary
and Chief Legal Officer (since 2010) | | Chief Legal Officer and Assistant Secretary, Columbia Management Investment Advisers, LLC since June 2005; Vice President and Lead Chief Counsel–Asset Management, Ameriprise Financial, Inc. since May 2010 (previously Vice President and Chief Counsel–Asset Management, from 2005 to April 2010, and Vice President–Asset Management Compliance from 2004 to 2005); Vice President, Chief Counsel and Assistant Secretary, Columbia Management Investment Distributors, Inc. since 2008; Vice President, General Counsel and Secretary, Ameriprise Certificate Company since 2005; Chief Counsel, RiverSource Distributors, Inc. since 2006; Vice President, General Counsel and Secretary, RiverSource Funds, since December 2006; Senior Vice President, Secretary and Chief Legal Officer, Columbia Funds, since May 2010. | |
|
35
Fund Governance (continued)
Officers (continued)
| Name, Year of Birth and Address | | Principal Occupation(s) During the Past Five Years | |
| Linda J. Wondrack (Born 1964) | |
|
One Financial Center
Boston, MA 02111
Senior Vice President and Chief
Compliance Officer (since 2007) | | Vice President and Chief Compliance Officer, Columbia Management Investment Advisers, LLC since May 2010; Chief Compliance Officer, Columbia Funds, since 2007, and RiverSource Funds, since May 2010; Director (Columbia Management Group, LLC and Investment Product Group Compliance), Bank of America, from June 2005 to April 2010; Director of Corporate Compliance and Conflicts Officer of MFS Investment Management (investment management) from August 2004 to May 2005. | |
|
| William F. Truscott (Born 1960) | |
|
53600 Ameriprise Financial Center
Minneapolis, MN 55474
Senior Vice President (since 2010) | | Chairman of the Board, Columbia Management Investment Advisers, LLC since May 2010 (previously President, Chairman of the Board and Chief Investment Officer, from 2001 to April 2010); Chief Executive Officer, U.S. Asset Management & President, Annuities, Ameriprise Financial, Inc. since May 2010 (previously President–U.S. Asset Management and Chief Investment Officer from 2005 to April 2010, and Senior Vice President—Chief Investment Officer, from 2001 to 2005); Director, President and Chief Executive Officer, Ameriprise Certificate Company since 2006; Director, Columbia Management Investment Distributors, Inc. since May 2010 (previously Chairman of the Board and Chief Executive Officer from 2008 to April 2010); Chairman of the Board and Chief Executive Officer, RiverSource Distributors, Inc. since 2006. | |
|
| Colin Moore (Born 1958) | |
|
One Financial Center
Boston, MA 02111
Senior Vice President (since 2010) | | Director and Chief Investment Officer, Columbia Management Investment Advisers, LLC since May 2010; Manager, Managing Director and Chief Investment Officer of Columbia Management Advisors, LLC from 2007 to April 2010; Head of Equities, Columbia Management Advisors, LLC from 2002 to 2007. | |
|
| Michael A. Jones (Born 1959) | |
|
100 Federal Street
Boston, MA 02110
Senior Vice President (since 2010) | | Director and President, Columbia Management Investment Advisers, LLC since May 2010; President and Director, Columbia Management Investment Distributors, Inc. since May 2010; Manager, Chairman, Chief Executive Officer and President, Columbia Management Advisors, LLC from 2007 to April 2010; Chief Executive Officer, President and Director, Columbia Management Distributors, Inc. from November 2006 to April 2010; previously, co-president and senior managing director at Robeco Investment Management. | |
|
| Amy Johnson (Born 1965) | |
|
5228 Ameriprise Financial Center
Minneapolis, MN 55474
Senior Vice President (since 2010) | | Senior Vice President and Chief Operating Officer, Columbia Management Investment Advisers, LLC since May 2010 (previously Chief Administrative Officer, from 2009 until April 2010, Vice President—Asset Management and Trust Company Services, from 2006 to 2009, and Vice President—Operations and Compliance from 2004 to 2006). | |
|
| Joseph F. DiMaria (Born 1968) | |
|
One Financial Center
Boston, MA 02111
Treasurer (since 2009) and
Chief Accounting Officer (since 2008) | | Vice President, Mutual Fund Administration, Columbia Management Investment Advisers, LLC, since May 2010; Director of Fund Administration, Columbia Management Advisors, LLC from January 2006 to April 2010; Head of Tax/Compliance and Assistant Treasurer, Columbia Management Advisors, LLC, from November 2004 to December 2005. | |
|
36
Fund Governance (continued)
Officers (continued)
| Name, Year of Birth and Address | | Principal Occupation(s) During the Past Five Years | |
| Marybeth Pilat (Born 1968) | |
|
One Financial Center
Boston, MA 02111
Deputy Treasurer (since 2010) | | Vice President, Mutual Fund Administration, Columbia Management Investment Advisers, LLC, since May 2010; Vice President, Investment Operations, Bank of America, from October 2008 to April 2010; Finance Manager, Boston Children's Hospital from August 2008 to October 2008; Director, Mutual Fund Administration, Columbia Management Advisors, LLC, from May 2007 to July 2008; Vice President, Mutual Fund Valuation, Columbia Management Advisors, LLC, from January 2006 to May 2007; Vice President, Mutual Fund Accounting Oversight, Columbia Management Advisors, LLC from January 2005 to January 2006. | |
|
| Julian Quero (Born 1967) | |
|
One Financial Center
Boston, MA 02111
Deputy Treasurer (since 2008) | | Vice President, Mutual Fund Administration, Columbia Management Investment Advisers, LLC since May 2010; Director of Fund Administration, Columbia Management Advisors, LLC, from August 2008 to April 2010; Senior Tax Manager, Columbia Management Advisors, LLC from August 2006 to July 2008; Senior Compliance Manager, Columbia Management Advisors, LLC from April 2002 to August 2006. | |
|
| Stephen T. Welsh (Born 1957) | |
|
One Financial Center
Boston, MA 02111
Vice President (since 2006) | | President and Director, Columbia Management Investment Services Corp. since May 2010; President and Director, Columbia Management Services, Inc. from July 2004 to April 2010; Managing Director, Columbia Management Distributors, Inc. from August 2007 to April 2010. | |
|
37
Summary of Management Fee Evaluation by Independent Fee Consultant (RiverSource Investments, LLC)
EXCERPT FROM REPORT OF INDEPENDENT FEE CONSULTANT TO THE FUNDS SUPERVISED BY THE COLUMBIA ATLANTIC BOARD
Prepared Pursuant to the February 9, 2005
Assurance of Discontinuance among the
Office of Attorney General of New York State,
Columbia Management Advisors, LLC, and
Columbia Management Distributors, Inc.
December 21, 2009
I. Overview
On February 9, 2005, Columbia Management Advisors, LLC ("CMA") and Columbia Management Distributors, Inc.1 ("CMD") agreed to the New York Attorney General's Assurance of Discontinuance ("AOD"). Among other things, the AOD stipulates that CMA may manage or advise a Columbia Fund ("Columbia Fund" and, together with some or all of such funds, the "Columbia Funds") only if the Independent Members of the Columbia Fund's Board of Trustees appoint a Senior Officer or retain an Independent Fee Consultant ("IFC") who is to manage the process by which proposed management fees are negotiated. The AOD further stipulates that the Senior Officer or IFC is to prepare a written annual evaluation of the fee negotiation process.
With effect from January 1, 2007, the Independent Members of the Board of Trustees for certain Columbia Funds known collectively as the "Atlantic Funds" (together with the other members of that Board, the "Trustees") retained me as IFC for the Atlantic Funds.2 In this capacity, I have prepared this written evaluation of the fee negotiation process. As was the case with the last three annual reports, my immediate predecessor as IFC, John Rea, provided invaluable assistance in the preparation of this report.
On September 29, 2009, Ameriprise entered into an asset purchase agreement with Bank of America, N.A. and its parent, Bank of America Corporation (together, the "Bank") pursuant to which the Bank agreed to sell certain CMG assets relating to Columbia's long-term asset management business, including management of the Atlantic Funds (the "Transaction").3 The Transaction if completed would result in the termination of the existing Investment Management Agreements with CMA. Therefore, the Trustees have been requested to approve and recommend to the shareholders of each Atlantic Fund new Investment Management and Sub-Advisory Agreements (together, the "Management Agreements") with RiverSource Investments, LLC ("RI"),4 investment manager of the RiverSource Funds and a subsidiary of Ameriprise. This report is intended to fulfill the requirements of the AOD with respect to the Trustees' consideration of the new Man agement Agreements.
A. Role of the Independent Fee Consultant
The AOD charges the IFC with "managing the process by which proposed management fees ... to be charged the Columbia Fund are negotiated so that they are negotiated in a manner which is at arms' length and reasonable and consistent with this Assurance of Discontinuance." The AOD also provides that CMA "may manage or advise a Columbia Fund only if the reasonableness of the proposed management fees is determined by the Board of Trustees ... using ... an annual independent written evaluation prepared by or under the direction of ... the Independent Fee Consultant." Therefore, the AOD makes clear that the IFC does not supplant the Trustees in negotiating management fees with CMA (or RI), nor does the IFC substitute his or her judgment for that of the Trustees with respect to the reasonableness of proposed fees or any other matter that is committed to the business judgment of the Trustees.
B. Elements Involved in Managing the Fee Negotiation Process
In preparing the report required by the AOD, the IFC must consider at least the following six factors set forth in the AOD:
1. The nature and quality of the adviser's services, including the Fund's performance;
1 CMA and CMD are subsidiaries of Columbia Management Group, LLC ("CMG"), and are the successors to the entities named in the AOD.
2 I have no material relationship with Bank of America, CMG or Ameriprise Financial, Inc. ("Ameriprise"), aside from serving as IFC, and I am aware of no material relationship with any of their affiliates. I retained John Rea, an independent economic consultant, to assist me with this report.
Unless otherwise stated or required by the context, this report covers only the Atlantic Funds.
3 Preliminary Response of Ameriprise to Information Request of Columbia Atlantic Board dated October 21, 2009 (hereafter, the "Preliminary Response"), p. 1. The one money market Atlantic Fund, Money Market Fund VS, was included in the Transaction because it was an integral part of CMG's array of Funds used as investment vehicles by variable annuity and similar insurance products.
4 Ameriprise intends to re-brand RI with the "Columbia" name (which is one of the assets being sold in the Transaction). Preliminary Response, pp. 4-5. In the case of new Sub-Advisory Agreements, the current sub-adviser would also be a party.
38
2. Management fees (including any components thereof) charged by other mutual fund companies for like services;
3. Possible economies of scale as the Fund grows larger;
4. Management fees (including any components thereof) charged to institutional and other clients of the adviser for like services;
5. Costs to the adviser and its affiliates of supplying services pursuant to the management fee agreements, excluding any intra-corporate profit; and
6. Profit margins of the adviser and its affiliates from supplying such services.
C. Data Presented to the Trustees
In considering the proposed new Management Agreements with RI, the Trustees relied in part on the data that had been prepared as part of their annual contract review process, which concluded in late October. This data remained relevant because the fees in the proposed Management Agreements were identical to the fees approved at that time. The annual review materials included a Lipper report on the performance of each Atlantic Fund compared to its peers and its benchmark, comparisons of the fees and expenses of each Atlantic Fund to similar CMG-sponsored Funds, comparable competitive funds chosen by Lipper, and institutional accounts advised by CMA, revenues, expenses, and profits of CMG from managing the Atlantic Funds, calculated both by Fund and collectively, and CMG's views on the existence and sharing of economies of scale.
In addition, the Trustees reviewed materials specific to the proposed new Management Agreements with RI in response to requests for information made on behalf of the Trustees, including the following:
• Performance data for the RiverSource Funds showing percentile and quartile rankings of each fund within its Lipper performance universe for periods up to five years and net returns of each fund relative to its benchmark returns. This data was arguably relevant due to the possibility that some RiverSource investment teams would be providing investment management services to certain Columbia Funds.5
• tables comparing the fee schedules and effective fee rates of funds managed by CMA and RI and institutional accounts advised by the two firms.
• extensive discussion of the process by which the various components of the two asset management businesses would be integrated including investment management, compliance, transfer agency, custody, fund accounting, and distribution.
• information about the financial condition of Ameriprise, including its most recent annual report on Form 10-K, RI's profit margins from managing the RiverSource Funds in 2007 and 2008, and pro forma income statements for the combined Columbia and RiverSource fund complex.
• disclosure that certain senior CMG executives, including President Michael Jones, Chief Investment Officer Colin Moore, Head of Mutual Funds J. Kevin Connaughton, and Chief Compliance Officer Linda Wondrack would continue in analogous capacities following the consummation of the Transaction, and
• a breakdown of the synergies RI expects to realize in the two years following the Transaction and the extent to which those potential synergies are expected to be shared with shareholders of funds advised by RI.
II. Findings
1. Based upon my examination of the information supplied by CMG and Ameriprise in the light of the six factors set forth in the AOD, I conclude that the Trustees have the relevant information necessary to evaluate the reasonableness of the proposed management fees for each Atlantic Fund.
2. In my view, the process by which the proposed management fees of the Atlantic Funds have been negotiated with RI thus far has been, to the extent practicable, at arms' length and reasonable and consistent with the AOD.
Respectfully submitted,
Steven E. Asher
5 On page 20 of its Supplemental Response to the Atlantic Trustees (undated but delivered November 24, 2009), Ameriprise said that "most personnel decisions, including with respect to the portfolio management teams for the Atlantic Funds . . . will be made primarily by [current CMA CIO] Colin Moore using the Columbia 5P process."
39
Shareholder Meeting Results
On March 3, 2010, a special meeting of shareholders of Columbia Funds Series Trust I was held to consider the approval of several proposals listed in the proxy statement for the meeting. Proposal 1 and Proposal 2 were voted on at the March 3, 2010 meeting of shareholders and Proposal 3 was voted on at an adjourned meeting of shareholders held on March 31, 2010. The shareholder meeting results are as follows:
Proposal 1: A proposed Investment Management Services Agreement with Columbia Management Investment Advisers, LLC (formerly, RiverSource Investments, LLC) (CMIA) was approved as follows:
| Votes For | | Votes Against | | Abstentions | | Broker Non-Votes | |
| | 487,572,444 | | | | 4,546,446 | | | | 5,257,215 | | | | 85,295,082 | | |
Proposal 2: A proposal authorizing CMIA to enter into and materially amend subadvisory agreements for the Fund in the future, with the approval of the Trust's Board of Trustees, but without obtaining additional shareholder approval, was approved as follows:
| Votes For | | Votes Against | | Abstentions | | Broker Non-Votes | |
| | 480,457,106 | | | | 11,812,912 | | | | 5,106,039 | | | | 85,295,129 | | |
Proposal 3: Each of the nominees for trustees was elected to the Trust's Board of Trustees, as follows:
| Trustee | | Votes For | | Votes Withheld | | Abstentions | |
| John D. Collins | | | 30,977,072,412 | | | | 859,827,038 | | | | 0 | | |
| Rodman L. Drake | | | 30,951,179,004 | | | | 885,720,446 | | | | 0 | | |
| Douglas A. Hacker | | | 30,989,793,279 | | | | 847,106,171 | | | | 0 | | |
| Janet Langford Kelly | | | 30,999,020,814 | | | | 837,878,636 | | | | 0 | | |
| William E. Mayer | | | 16,291,139,483 | | | | 15,545,759,967 | | | | 0 | | |
| Charles R. Nelson | | | 30,997,700,700 | | | | 839,198,750 | | | | 0 | | |
| John J. Neuhauser | | | 30,988,095,661 | | | | 848,803,789 | | | | 0 | | |
| Jonathon Piel | | | 30,968,801,048 | | | | 868,098,402 | | | | 0 | | |
| Patrick J. Simpson | | | 30,999,065,030 | | | | 837,834,420 | | | | 0 | | |
| Anne-Lee Verville | | | 30,996,227,913 | | | | 840,671,537 | | | | 0 | | |
40
Important Information About This Report
The fund mails one shareholder report to each shareholder address. If you would like more than one report, please call shareholder services at 1-800-345-6611 and additional reports will be sent to you. This report has been prepared for shareholders of Columbia Small Cap Growth Fund I.
A description of the policies and procedures that the fund uses to determine how to vote proxies and a copy of the fund's voting records are available (i) at www.columbiamanagement.com, (ii) on the Securities and Exchange Commission's website at www.sec.gov, and (iii) without charge, upon request, by calling 1-800-368-0346. Information regarding how the fund voted proxies relating to portfolio securities during the 12-month period ended June 30 is available from the SEC's website. Information regarding how the fund voted proxies relating to portfolio securities is also available from the fund's website, www.columbiamanagement.com.
The fund files a complete schedule of portfolio holdings with the SEC for the first and third quarters of each fiscal year on Form N-Q. The fund's Form N-Q is available on the SEC's website at www.sec.gov and may be reviewed and copied at the SEC's Public Reference Room in Washington, D.C. Information on the operation of the Public Reference Room may be obtained by calling 1-800-SEC-0330.
Transfer Agent
Columbia Management Investment
Services Corp.
P.O. Box 8081
Boston, MA 02266-8081
1-800-345-6611
Distributor
Columbia Management Investment
Distributors, Inc.
One Financial Center
Boston, MA 02111
Investment Advisor
Columbia Management Investment Advisers, LLC
100 Federal Street
Boston, MA 02110
41

PRSRT STD
U.S. Postage
PAID
Holliston, MA
Permit NO. 20
Columbia Small Cap Growth Fund I
P. O. Box 8081
Boston, MA 02266-8081
columbiamanagement.com
This information is for use with concurrent or prior delivery of a fund prospectus. Investors should consider the investment objectives, risks, charges and expenses of a mutual fund carefully before investing. For a free prospectus, which contains this and other important information about the funds, visit columbiamanagement.com. Read the prospectus carefully before investing. The Fund is distributed by Columbia Management Investment Distributors, Inc., member FINRA, and managed by Columbia Management Investment Advisers, LLC.
© 2010 Columbia Management Investment Advisers, LLC. All rights reserved.
C-1641 A (10/10)

Columbia Technology Fund
Annual Report for the Period Ended August 31, 2010
Not FDIC insured • No bank guarantee • May lose value
Table of Contents
| Fund Profile | | | 1 | | |
|
| Economic Update | | | 2 | | |
|
| Performance Information | | | 4 | | |
|
| Understanding Your Expenses | | | 5 | | |
|
| Portfolio Manager's Report | | | 6 | | |
|
| Investment Portfolio | | | 8 | | |
|
Statement of Assets and
Liabilities | | | 10 | | |
|
| Statement of Operations | | | 12 | | |
|
Statement of Changes in
Net Assets | | | 13 | | |
|
| Financial Highlights | | | 15 | | |
|
| Notes to Financial Statements | | | 19 | | |
|
Report of Independent Registered
Public Accounting Firm | | | 27 | | |
|
| Fund Governance | | | 28 | | |
|
Summary of Management Fee
Evaluation by Independent Fee
Consultant (Riversource
Investment, LLC) | | | 33 | | |
|
| Shareholder Meeting Results | | | 35 | | |
|
Important Information About
This Report | | | 37 | | |
|
The views expressed in this report reflect the current views of the respective parties. These views are not guarantees of future performance and involve certain risks, uncertainties and assumptions that are difficult to predict, so actual outcomes and results may differ significantly from the views expressed. These views are subject to change at any time based upon economic, market or other conditions and the respective parties disclaim any responsibility to update such views. These views may not be relied on as investment advice and, because investment decisions for a Columbia Fund are based on numerous factors, may not be relied on as an indication of trading intent on behalf of any particular Columbia Fund. References to specific securities should not be construed as a recommendation or investment advice.
President's Message

Dear Shareholder:
The Columbia Management story began over 100 years ago, and today, we are one of the nation's largest dedicated asset managers. The recent acquisition by Ameriprise Financial, Inc. brings together the talents, resources and capabilities of Columbia Management with those of RiverSource Investments, Threadneedle (acquired by Ameriprise in 2003) and Seligman Investments (acquired by Ameriprise in 2008) to build a best-in-class asset management business that we believe is truly greater than its parts.
RiverSource Investments traces its roots to 1894 when its then newly-founded predecessor, Investors Syndicate, offered a face-amount savings certificate that gave small investors the opportunity to build a safe and secure fund for retirement, education or other special needs. A mutual fund pioneer, Investors Syndicate launched Investors Mutual Fund in 1940. In the decades that followed, its mutual fund products and services lineup grew to include a full spectrum of styles and specialties. More than 110 years later, RiverSource continues to be a trusted financial products leader.
Threadneedle, a leader in global asset management and one of Europe's largest asset managers, offers sophisticated international experience from a dedicated U.K. management team. Headquartered in London, it is named for Threadneedle Street in the heart of the city's financial district, where British investors pioneered international and global investing. Threadneedle was acquired in 2003 and today operates as an affiliate of Columbia Management.
Seligman Investments' beginnings date back to the establishment of the investment firm J. & W. Seligman & Co. in 1864. In the years that followed, Seligman played a major role in the geographical expansion and industrial development of the United States. In 1874, President Ulysses S. Grant named Seligman as fiscal agent for the U.S. Navy—an appointment that would last through World War I. Seligman helped finance the westward path of the railroads and the building of the Panama Canal. The firm organized its first investment company in 1929 and began managing its first mutual fund in 1930. In 2008, J. & W. Seligman & Co. Incorporated was acquired and Seligman Investments became an offering brand of RiverSource Investments, LLC.
We are proud of the rich and distinctive history of these firms, the strength and breadth of products and services they offer, and the combined cultures of pioneering spirit and forward thinking. Together we are committed to providing more for our shareholders than ever before.
> A singular focus on our shareholders
Our business is asset management, so investors are our first priority. We dedicate our resources to identifying timely investment opportunities and provide a comprehensive choice of equity, fixed-income and alternative investments to help meet your individual needs.
> First-class research and thought leadership
We are dedicated to helping you take advantage of today's opportunities and anticipate tomorrow's. We stay abreast of the latest investment trends and ideas, using our collective insight to evaluate events and transform them into solutions you can use.
> A disciplined investment approach
We aren't distracted by passing fads. Our teams adhere to a rigorous investment process that helps ensure the integrity of our products and enables you and your financial advisor to match our solutions to your objectives with confidence.
When you choose Columbia Management, you can be confident that we will take the time to understand your needs and help you and your financial advisor identify the solutions that are right for you. Because at Columbia Management, we don't consider ourselves successful unless you are.
Sincerely,

J. Kevin Connaughton
President, Columbia Funds
Investors should consider the investment objectives, risks, charges and expenses of a mutual fund carefully before investing. For a free prospectus, which contains this and other important information about the funds, visit columbiamanagement.com. The prospectus should be read carefully before investing.
Columbia Funds are distributed by Columbia Management Investment Distributors, Inc., member FINRA, and managed by Columbia Management Investment Advisers, LLC.
© 2010 Columbia Management Investment Advisers, LLC. All rights reserved.
Fund Profile – Columbia Technology Fund
Summary
g For the 12-month period that ended August 31, 2010, the fund's Class A shares returned 15.44% without sales charge.
g The fund outperformed the Merrill Lynch 100 Technology Index,1 and the average return of the fund's peer group, the Lipper Science & Technology Funds Classification,2 which was 7.19%.
g Positive stock selection in the systems software and semiconductor equipment sectors boosted the fund's performance. Relative to the benchmark, underexposure to poor-performing semiconductor names also aided returns.
Portfolio Management
Wayne Collette has managed the fund since June 2002 and has been associated with the advisor since May 2010. Prior to joining the advisor, Mr. Collette was associated with the fund's previous advisor or its predecessors since 2001.
Effective May 1, 2010, RiverSource Investments, LLC, a subsidiary of Ameriprise Financial, Inc., became the investment advisor to the fund and changed its name to Columbia Management Investment Advisers, LLC. Please see the fund's prospectus, as supplemented, for more information regarding the change in investment advisor and certain other changes.
1The Merrill Lynch 100 Technology Index is an equally weighted index of 100 leading technology stocks. Indices are not available for investment, are not professionally managed and do not reflect sales charges, fees, brokerage commissions, taxes or other expenses of investing. Securities in the fund may not match those in an index.
2Lipper Inc., a widely respected data provider in the industry, calculates an average total return (assuming reinvestment of distributions) for mutual funds with investment objectives similar to those of the fund. Lipper makes no adjustment for the effect of sales loads.
Performance data quoted represents past performance and current performance may be lower or higher. Past performance is no guarantee of future results. The investment return and principal value will fluctuate so that shares, when redeemed, may be worth more or less than the original cost. Please visit www.columbiamanagement.com for daily and most recent month-end performance updates.
Summary
1-year return as of 08/31/2010
| | +15.44% | |
|
| |  | | | Class A shares
(without sales charge) | |
|
| | +8.26% | |
|
| |  | | | Merrill Lynch 100
Technology Index | |
|
1
Economic Update – Columbia Technology Fund
Summary
For the 12-month period that ended August 31, 2010
g The U.S. stock market, as measured by the S&P 500 Index, delivered positive returns, despite a correction in the last months of the period. Emerging market stocks, as measured by the MSCI Emerging Markets Index (Net), outperformed U.S. stocks as well as stock markets in developed foreign markets.
| S&P Index | | MSCI Index | |
|
 | |  | |
|
g Modest economic growth and relatively low interest rates boosted bond market returns. The Barclays Capital Aggregate Bond Index delivered solid results. High-yield bonds outperformed stocks, as measured by the JPMorgan Developed BB High Yield Index.
Barclays
Aggregate Index | | JPMorgan
Index | |
|
 | |  | |
|
Although it has been more than a year since U.S. economic growth turned positive, the economy continues to send mixed signals about the sustainability of this recovery. Economic growth, as measured by gross domestic product (GDP), was a solid 5.0% in the last quarter of 2009. However, it was 3.7% in the first quarter of 2010 and only 1.7% in the second quarter. Expectations are for continued lackluster growth through the end of the year, as government incentive programs have ended and stimulus spending winds down. Even so, it appears to be unlikely that the U.S. economy will sink back into recession as many key indicators remain positive.
Consumer spending on cars, clothing and other goods increased throughout the year, although the pace of increased spending was small. Personal income also moved higher. Consumer confidence, as measured by the Conference Board Consumer Confidence Index, gained ground in the first half of 2010. However, the index fell sharply in June and July before stabilizing in August. Consumers surveyed in the last three months of the reporting period indicated they were concerned about business conditions and job prospects and generally apprehensive about the future.
The housing market—another bellwether for the consumer sector—showed few positive signs. Both new and existing home sales fell in the final months of the period as a federal tax credit for new and repeat homebuyers expired. Distressed properties continued to pressure prices and a huge backlog of foreclosed homes is likely to continue to keep a lid on prices for some time. The national median price of existing homes rose slightly over the one-year period, while the national median price of new homes declined. Despite near-record low mortgage rates, the inventory of unsold homes rose to a 12.5 month supply, up sharply at the end of the period. The long-term average is on the order of six months.
News on the job front was mostly positive in 2010, but the number of new jobs added to the economy fell short of expectations. A good portion of the jobs added in March, April and May were temporary, government-sponsored census positions, which began to unwind in June, July and August. Private sector job growth was disappointing given the stage of economic recovery. Nevertheless, private sector payroll employment trended modestly higher in the summer and news of massive layoffs declined.
Reports from the business side of the economy were generally positive. A key measure of the nation's manufacturing situation—the Institute for Supply Management's Index—was generally positive, although the index trended slightly downward in the final months of the period. Industrial production moved higher, as did the amount of manufacturing capacity utilized—a key measure of the health of the manufacturing sector.
Stock rally interrupted
Against a strengthening economic backdrop, a stock market rally that began early in 2009 continued into the spring of 2010. However, a debt crisis brewing in Europe raised concerns among U.S. investors, as did mixed signals on the economy, and some of the stock market's earlier gains vanished during the early summer. The S&P 500 Index1 returned 4.91% for the 12-month period. Outside the United States, stock market
1The Standard & Poor's (S&P) 500 Index tracks the performance of 500 widely held, large-capitalization U.S. stocks.
2
Economic Update (continued) – Columbia Technology Fund
returns were mixed. The MSCI EAFE Index (Net),2 a broad gauge of stock market performance in foreign developed markets, returned negative 2.34% (net of dividends, in U.S. dollars) for the period, as concerns about the impact of a bailout for weak eurozone economies weighed on the markets. Emerging stock markets were more resilient. The MSCI Emerging Markets Index (Net)3 returned 18.02% (in U.S. dollars) for the 12-month period.
Bonds delivered solid returns
As the economy strengthened, bonds delivered solid returns. The Barclays Capital Aggregate Bond Index4 returned 9.18%. Municipal bonds gained almost as much as taxable investment-grade bonds, even without factoring in potential tax advantages to investors in higher income-tax brackets. The Barclays Capital 3-15 Year Blend Municipal Bond Index5 returned 8.95%. The high-yield bond market outpaced stocks during the period by a margin of more than three to one. For the 12 months covered by this report, the JPMorgan Developed BB High Yield Index6 returned 17.68% while the S&P 500 Index returned 4.91%. Even the Treasury market was positive as the yield on the 10-year U.S. Treasury, a common bellwether for the bond market, fell nearly one full percentage point, from 3.4% to 2.5% over the 12-month period. Despite the pickup in economic activity, the Federal Reserve Board (the Fed) kept a key short-te rm interest rate—the federal funds rate—close to zero.
Past performance is no guarantee of future results.
2The Morgan Stanley Capital International Europe, Australasia, Far East (MSCI EAFE) Index (Net) is a free float-adjusted market capitalization index that is designed to measure the equity market performance of developed markets, excluding the U.S. & Canada. As of May 27, 2010 the MSCI EAFE Index (Net) consisted of the following 22 developed market country indices: Australia, Austria, Belgium, Denmark, Finland, France, Germany, Greece, Hong Kong, Ireland, Israel, Italy, Japan, the Netherlands, New Zealand, Norway, Portugal, Singapore, Spain, Sweden, Switzerland, and the United Kingdom.
3The Morgan Stanley Capital International Emerging Markets (MSCI EM) Index (Net) is a free float-adjusted market capitalization index that is designed to measure equity market performance of emerging markets. As of May 27, 2010, the MSCI Emerging Markets Index consisted of the following 21 emerging market country indices: Brazil, Chile, China, Colombia, Czech Republic, Egypt, Hungary, India, Indonesia, Korea, Malaysia, Mexico, Morocco, Peru, Philippines, Poland, Russia, South Africa, Taiwan, Thailand, and Turkey.
4The Barclays Capital Aggregate Bond Index is a market value-weighted index that tracks the daily price, coupon, pay-downs and total return performance of fixed-rate, publicly placed, dollar-denominated and non-convertible investment grade debt issues with at least $250 million par amount outstanding and with at least one year to final maturity.
5The Barclays Capital 3-15 Year Blend Municipal Bond Index tracks the performance of municipal bonds issued after December 31, 1990 with remaining maturities between 2 and 17 years and at least $7 million in principal amount outstanding.
6The JPMorgan Developed BB High Yield Index is an unmanaged index designed to mirror the investable universe of the U.S. dollar developed, BB-rated, high yield corporate debt market.
Indices are not available for investment, are not professionally managed and do not reflect sales charges, fees, brokerage commissions, taxes or other expenses of investing. Securities in the fund may not match those in an index.
3
Performance Information – Columbia Technology Fund
Performance data quoted represents past performance and current performance may be lower or higher. Past performance is no guarantee of future results. The investment return and principal value will fluctuate so that shares, when redeemed, may be worth more or less than the original cost. Please visit www.columbiamanagement.com for daily and most recent month-end performance updates.
Annual operating expense ratio (%)*
| Class A | | | 1.55 | | |
| Class B | | | 2.30 | | |
| Class C | | | 2.30 | | |
| Class Z | | | 1.30 | | |
* The annual operating expense ratio is as stated in the fund's prospectus that is current as of the date of this report. Differences in expense ratios disclosed elsewhere in this report may result from the inclusion of fee waivers and expense reimbursements as well as the use of different time periods to calculate the ratios.
Performance of a $10,000 investment 11/09/00 – 08/31/10
The chart above shows the change in value of a hypothetical $10,000 investment in each share class of Columbia Technology Fund during the stated time period, and does not reflect the deduction of taxes that a shareholder may pay on fund distributions or on the redemption of fund shares.
Performance of a $10,000 investment 11/09/00 – 08/31/10 ($)
| Sales charge | | without | | with | |
| Class A | | | 9,734 | | | | 9,176 | | |
| Class B | | | 9,168 | | | | 9,168 | | |
| Class C | | | 9,188 | | | | 9,188 | | |
| Class Z | | | 9,955 | | | | n/a | | |
Average annual total return as of 08/31/10 (%)
| Share class | | A | | B | | C | | Z | |
| Inception | | 11/01/02 | | 11/01/02 | | 10/13/03 | | 11/09/00 | |
| Sales charge | | without | | with | | without | | with | | without | | with | | without | |
| 1-year | | | 15.44 | | | | 8.83 | | | | 14.74 | | | | 9.74 | | | | 14.86 | | | | 13.86 | | | | 15.84 | | |
| 5-year | | | 2.13 | | | | 0.91 | | | | 1.38 | | | | 1.01 | | | | 1.37 | | | | 1.37 | | | | 2.38 | | |
| Life | | | –0.27 | | | | –0.87 | | | | –0.88 | | | | –0.88 | | | | –0.86 | | | | –0.86 | | | | –0.05 | | |
Average annual total return as of 09/30/10 (%)
| Share class | | A | | B | | C | | Z | |
| Sales charge | | without | | with | | without | | with | | without | | with | | without | |
| 1-year | | | 23.24 | | | | 16.20 | | | | 22.32 | | | | 17.32 | | | | 22.42 | | | | 21.42 | | | | 23.60 | | |
| 5-year | | | 3.88 | | | | 2.65 | | | | 3.11 | | | | 2.76 | | | | 3.11 | | | | 3.11 | | | | 4.13 | | |
| Life | | | 1.05 | | | | 0.45 | | | | 0.43 | | | | 0.43 | | | | 0.45 | | | | 0.45 | | | | 1.28 | | |
The "with sales charge" returns include the maximum initial sales charge of 5.75% for Class A shares and the applicable contingent deferred sales charge of 5.00% in the first year, declining to 1.00% in the sixth year and eliminated thereafter for Class B shares and 1.00% for Class C shares for the first year only. The "without sales charge" returns do not include the effect of sales charges. If they had, returns would be lower.
Performance results reflect any fee waivers or reimbursements of fund expenses by the investment advisor and/or any of its affiliates. Absent these fee waivers or expense reimbursement arrangements, performance results would have been lower.
All results shown assume reinvestment of distributions. Class Z shares are sold at net asset value with no distribution and service (Rule 12b-1) fees. Class Z shares have limited eligibility and the investment minimum requirements may vary. Please see the fund's prospectus for details. Performance for different share classes will vary based on differences in sales charges and fees associated with each class.
The tables do not reflect the deduction of taxes that a shareholder may pay on fund distributions or on the redemption of fund shares.
Class A, Class B and Class C are newer classes of shares. Class A and Class B share performance information includes the performance of Class Z shares (the oldest existing share class) for periods prior to their inception. Class C share performance information includes returns of Class B shares for the period from November 1, 2002 through October 12, 2003, and the returns of Class Z shares for periods prior thereto. These returns reflect differences in sales charges, but have not been restated to reflect any differences in expenses (such as distribution and service (Rule 12b-1) fees) between Class Z shares and the newer classes of shares. If differences in expenses had been reflected, the returns shown for periods prior to the inception of the newer classes of shares would have been lower, since the newer classes of shares are subject to distribution and service (Rule 12b-1) fees. Class A and Class B shares were initially offere d on November 1, 2002, Class C shares were initially offered on October 13, 2003 and Class Z shares were initially offered on November 9, 2000.
4
Understanding Your Expenses – Columbia Technology Fund
As a fund shareholder, you incur two types of costs. There are transaction costs, which generally include sales charges on purchases and may include redemption fees or exchange fees. There are also ongoing costs, which generally include investment advisory fees, distribution and service (Rule 12b-1) fees and other fund expenses. The information on this page is intended to help you understand the ongoing costs of investing in the fund and to compare these costs with the ongoing costs of investing in other mutual funds.
Analyzing your fund's expenses by share class
To illustrate these ongoing costs, we have provided an example and calculated the expenses paid by investors in each share class during the period. The information in the following table is based on an initial investment of $1,000, which is invested at the beginning of the period and held for the entire period. Expense information is calculated two ways and each method provides you with different information. The amount listed in the "Actual" column is calculated using the fund's actual operating expenses and total return for the period. The amount listed in the "Hypothetical" column for each share class assumes that the return each year is 5% before expenses and is calculated based on the fund's actual operating expenses. You should not use the hypothetical account values and expenses to estimate either your actual account balance at the end of the period or the expenses you paid during this period.
Compare with other funds
Since all mutual funds are required to include the same hypothetical calculations about expenses in shareholder reports, you can use this information to compare the ongoing cost of investing in the fund with other funds. To do so, compare the 5% hypothetical example with the 5% hypothetical examples that appear in the shareholder reports of other funds. As you compare hypothetical examples of other funds, it is important to note that hypothetical examples are meant to highlight the ongoing costs of investing in a fund and do not reflect any transaction costs, such as sales charges, redemption fees or exchange fees.
Estimating your actual expenses
To estimate the expenses that you paid over the period, first you will need your account balance at the end of the period:
g For shareholders who receive their account statements from Columbia Management Investment Services Corp., your account balance is available online at www.columbiamanagement.com or by calling Shareholder Services at 800.345.6611.
g For shareholders who receive their account statements from their financial intermediary, contact your financial intermediary to obtain your account balance.
1. Divide your ending account balance by $1,000. For example, if an account balance was $8,600 at the end of the period, the result would be 8.6.
2. In the section of the table below titled "Expenses paid during the period," locate the amount for your share class. You will find this number in the column labeled "Actual." Multiply this number by the result from step 1. Your answer is an estimate of the expenses you paid on your account during the period.
If the value of your account falls below the minimum initial investment requirement applicable to you, your account may be subject to a $20 annual fee. This fee is not included in the accompanying table. If you are subject to the fee, keep it in mind when you are estimating the ongoing expenses of investing in the fund and when comparing the expenses of this fund with other funds.
03/01/10 – 08/31/10
| | | Account value at the
beginning of the period ($) | | Account value at the
end of the period ($) | | Expenses paid
during the period ($) | | Fund's annualized
expense ratio (%) | |
| | | Actual | | Hypothetical | | Actual | | Hypothetical | | Actual | | Hypothetical | | Actual | |
| Class A | | | 1,000.00 | | | | 1,000.00 | | | | 1,044.20 | | | | 1,017.85 | | | | 7.52 | | | | 7.43 | | | | 1.46 | | |
| Class B | | | 1,000.00 | | | | 1,000.00 | | | | 1,040.00 | | | | 1,014.06 | | | | 11.36 | | | | 11.22 | | | | 2.21 | | |
| Class C | | | 1,000.00 | | | | 1,000.00 | | | | 1,041.10 | | | | 1,014.06 | | | | 11.37 | | | | 11.22 | | | | 2.21 | | |
| Class Z | | | 1,000.00 | | | | 1,000.00 | | | | 1,045.70 | | | | 1,019.11 | | | | 6.24 | | | | 6.16 | | | | 1.21 | | |
Expenses paid during the period are equal to the annualized expense ratio for the share class, multiplied by the average account value over the period, then multiplied by the number of days in the fund's most recent fiscal half-year and divided by 365.
Had the investment advisor and/or any of its affiliates not waived fees or reimbursed a portion of expenses, account value at the end of the period would have been reduced.
It is important to note that the expense amounts shown in the table are meant to highlight only ongoing costs of investing in the fund and do not reflect any transaction costs, such as sales charges, redemption fees or exchange fees. Therefore, the hypothetical examples provided may not help you determine the relative total costs of owning shares of different funds. If these transaction costs were included, your costs would have been higher.
5
Portfolio Manager's Report – Columbia Technology Fund
Performance data quoted represents past performance and current performance may be lower or higher. Past performance is no guarantee of future results. The investment return and principal value will fluctuate so that shares, when redeemed, may be worth more or less than the original cost. Please visit www.columbiamanagement.com for daily and most recent month-end performance updates.
Net asset value per share
as of 08/31/10 ($)
| Class A | | | 8.75 | | |
| Class B | | | 8.33 | | |
| Class C | | | 8.35 | | |
| Class Z | | | 8.92 | | |
Top 5 sectors
as of 08/31/10 (%)
| Information Technology | | | 80.3 | | |
| Consumer Discretionary | | | 6.0 | | |
| Telecommunication Services | | | 2.7 | | |
| Health Care | | | 2.6 | | |
| Materials | | | 0.7 | | |
Top 10 holdings
as of 08/31/10 (%)
| Apple | | | 9.1 | | |
| QUALCOMM | | | 3.6 | | |
| Rovi | | | 3.3 | | |
| F5 Networks | | | 3.0 | | |
| Baidu | | | 2.8 | | |
| Red Hat | | | 2.7 | | |
| Salesforce.com | | | 2.7 | | |
| Akamai Technologies | | | 2.7 | | |
| Amazon.com | | | 2.5 | | |
Cognizant Technology
Solutions | | | 2.3 | | |
The fund is actively managed and the composition of its portfolio will change over time. Information provided is calculated as a percentage of net assets.
For the 12-month period that ended August 31, 2010, the fund's Class A shares returned 15.44% without sales charge. The fund outperformed its benchmark, the Merrill Lynch 100 Technology Index, which returned 8.26% for the same period. It also surpassed the average return of its peer group, the Lipper Science & Technology Funds Classification, which was 7.19%. Stock selection in the systems software and semiconductor equipment industries drove the fund's performance during the 12-month period. An underweight position in semiconductor stocks also helped boost relative returns as the industry underperformed because of continued economic uncertainty.
Stock selection in systems software and semiconductor equipment drove returns
While profits declined for much of the semiconductor industry as corporations and consumers held back on computer purchases, companies such as Analog Devices (2.1% of net assets) held up better than peers due to improved industrial demand for components. Another notable performer among semiconductor-related names was Trina Solar (1.8% of net assets), which posted strong earnings based on strong demand for its solar modules.
Several systems software names also helped the fund's returns. Top contributors included Sybase and VMware. Shares of Sybase rose after it was announced that the company would be acquired by SAP, and we sold the stock into strength. Strong revenue growth helped shares of server virtualization software maker VMware (2.0% of net assets), whose products are designed to help corporations reduce costs and improve workflow efficiency. Certain semiconductor equipment stocks also contributed positive performance, including Veeco Instruments (0.6% of net assets), which makes LED lighting components for energy efficient streetlights and high definition televisions. Another notable performer was NetFlix (0.6% of net assets), which benefited from increased market share and its low cost distribution model, including movies by mail and an increasingly popular streaming video offering.
Life sciences and entertainment names detracted from performance
Life sciences tools and services was an area of weakness for the fund during the period. Shares of genetic diagnostics maker Illumina declined late in 2009 as the company struggled with purchase postponements from customers and slowing revenues. We subsequently sold the stock. We also sold the fund's position in Dreamworks Animation as high expenses eroded box office revenues from several recent hit movies.
Focused on positive technology trends
While slowing economic growth has put broader enterprise technology spending on hold for many corporations, demand for technologies that help companies cut unnecessary costs and improve productivity is experiencing an upswing. As a result, we have moved to an underweight position in the semiconductor industry and have shifted the portfolio to benefit from positive spending trends in virtualization and cloud
6
Portfolio Manager's Report (continued) – Columbia Technology Fund
computing. Outside of traditional enterprise technology, we have also increased the fund's exposure to Chinese search engines and travel firms, which we believe are poised to grow as wages increase in China. We continue to emphasize companies with strong, forward-looking product cycles, which we believe can fare well regardless of the direction of the economy.
Portfolio characteristics and holdings are subject to change and may not be representative of current characteristics and holdings. The outlook for this fund may differ from that presented for other Columbia Funds.
Equity securities are affected by stock market fluctuations that occur in response to economic and business developments.
The share price of a fund that invests primarily in one sector will likely be subject to more volatility than a fund that invests across many sectors. Technology stocks may be more volatile than stocks in other sectors. The fund should be considered part of an overall investment program, and not a complete investment program.
International investing involves special risks, including foreign taxation, currency risks, risks associated with possible differences in financial standards and other risks associated with future political and economic developments.
7
Investment Portfolio – Columbia Technology Fund
August 31, 2010
| Common Stocks – 92.6% | |
| | | Shares | | Value ($) | |
| Consumer Discretionary – 6.0% | |
| Hotels, Restaurants & Leisure – 1.7% | |
Ctrip.com International Ltd.,
ADR (a) | | | 107,720 | | | | 4,361,583 | | |
| Hotels, Restaurants & Leisure Total | | | 4,361,583 | | |
| Internet & Catalog Retail – 3.2% | |
| Amazon.com, Inc. (a) | | | 50,990 | | | | 6,365,082 | | |
| NetFlix, Inc. (a) | | | 12,930 | | | | 1,622,973 | | |
| Internet & Catalog Retail Total | | | 7,988,055 | | |
| Media – 1.1% | |
| DIRECTV, Class A (a) | | | 70,680 | | | | 2,680,186 | | |
| Media Total | | | 2,680,186 | | |
| Consumer Discretionary Total | | | 15,029,824 | | |
| Health Care – 2.6% | |
| Health Care Equipment & Supplies – 0.5% | |
| NuVasive, Inc. (a) | | | 40,820 | | | | 1,198,067 | | |
| Health Care Equipment & Supplies Total | | | 1,198,067 | | |
| Health Care Providers & Services – 1.0% | |
| Express Scripts, Inc. (a) | | | 60,920 | | | | 2,595,192 | | |
| Health Care Providers & Services Total | | | 2,595,192 | | |
| Health Care Technology – 1.1% | |
| Cerner Corp. (a) | | | 23,600 | | | | 1,719,260 | | |
| Omnicell, Inc. (a) | | | 93,430 | | | | 1,042,212 | | |
| Health Care Technology Total | | | 2,761,472 | | |
| Health Care Total | | | 6,554,731 | | |
| Industrials – 0.3% | |
| Aerospace & Defense – 0.3% | |
Global Defense Technology &
Systems, Inc. (a) | | | 68,143 | | | | 712,094 | | |
| Aerospace & Defense Total | | | 712,094 | | |
| Industrials Total | | | 712,094 | | |
| Information Technology – 80.3% | |
| Communications Equipment – 11.5% | |
| Aruba Networks, Inc. (a) | | | 250,150 | | | | 4,595,256 | | |
| Blue Coat Systems, Inc. (a) | | | 90,380 | | | | 1,701,855 | | |
| CommScope, Inc. (a) | | | 68,600 | | | | 1,286,250 | | |
| F5 Networks, Inc. (a) | | | 86,050 | | | | 7,523,351 | | |
| Polycom, Inc. (a) | | | 95,660 | | | | 2,724,397 | | |
| QUALCOMM, Inc. | | | 234,770 | | | | 8,994,039 | | |
| | | Shares | | Value ($) | |
Telefonaktiebolaget LM
Ericsson, ADR | | | 227,660 | | | | 2,192,366 | | |
| Communications Equipment Total | | | 29,017,514 | | |
| Computers & Peripherals – 12.0% | |
| Apple, Inc. (a) | | | 94,094 | | | | 22,899,656 | | |
| EMC Corp. (a) | | | 311,720 | | | | 5,685,773 | | |
| NetApp, Inc. (a) | | | 37,820 | | | | 1,529,441 | | |
| Computers & Peripherals Total | | | 30,114,870 | | |
| Electronic Equipment, Instruments & Components – 1.3% | |
| Agilent Technologies, Inc. (a) | | | 41,800 | | | | 1,127,346 | | |
| Corning, Inc. | | | 73,730 | | | | 1,156,086 | | |
| LG Display Co., Ltd., ADR | | | 76,460 | | | | 1,076,557 | | |
Electronic Equipment, Instruments &
Components Total | | | 3,359,989 | | |
| Internet Software & Services – 10.4% | |
| Akamai Technologies, Inc. (a) | | | 146,280 | | | | 6,739,120 | | |
| Baidu, Inc., ADR (a) | | | 88,720 | | | | 6,958,310 | | |
| Google, Inc., Class A (a) | | | 10,760 | | | | 4,842,215 | | |
| OpenTable, Inc. (a) | | | 81,750 | | | | 4,357,275 | | |
| VeriSign, Inc. (a) | | | 110,100 | | | | 3,207,213 | | |
| Internet Software & Services Total | | | 26,104,133 | | |
| IT Services – 9.0% | |
| Accenture PLC, Class A | | | 66,850 | | | | 2,446,710 | | |
| Alliance Data Systems Corp. (a) | | | 33,850 | | | | 1,902,031 | | |
Cognizant Technology Solutions
Corp., Class A (a) | | | 99,540 | | | | 5,734,002 | | |
| Infosys Technologies Ltd., ADR | | | 49,810 | | | | 2,853,615 | | |
International Business
Machines Corp. | | | 19,820 | | | | 2,442,419 | | |
| Teradata Corp. (a) | | | 112,780 | | | | 3,692,417 | | |
| Visa, Inc., Class A | | | 49,930 | | | | 3,444,171 | | |
| IT Services Total | | | 22,515,365 | | |
| Office Electronics – 0.5% | |
| Canon, Inc., ADR | | | 32,010 | | | | 1,309,529 | | |
| Office Electronics Total | | | 1,309,529 | | |
| Semiconductors & Semiconductor Equipment – 11.9% | |
| Analog Devices, Inc. | | | 189,411 | | | | 5,280,779 | | |
ASML Holding N.V., N.Y.
Registered Shares | | | 68,200 | | | | 1,686,586 | | |
| Broadcom Corp., Class A | | | 73,940 | | | | 2,215,982 | | |
| Cree, Inc. (a) | | | 60,410 | | | | 3,234,352 | | |
| Intel Corp. | | | 127,810 | | | | 2,264,793 | | |
| KLA-Tencor Corp. | | | 86,840 | | | | 2,432,388 | | |
| Lam Research Corp. (a) | | | 31,530 | | | | 1,138,548 | | |
Marvell Technology Group
Ltd. (a) | | | 78,715 | | | | 1,254,717 | | |
| National Semiconductor Corp. | | | 184,720 | | | | 2,329,319 | | |
See Accompanying Notes to Financial Statements.
8
Columbia Technology Fund
August 31, 2010
| Common Stocks (continued) | |
| | | Shares | | Value ($) | |
| Silicon Laboratories, Inc. (a) | | | 48,640 | | | | 1,855,130 | | |
| Trina Solar Ltd., ADR (a) | | | 179,700 | | | | 4,632,666 | | |
| Veeco Instruments, Inc. (a) | | | 46,670 | | | | 1,550,844 | | |
Semiconductors & Semiconductor
Equipment Total | | | 29,876,104 | | |
| Software – 23.7% | |
| ANSYS, Inc. (a) | | | 83,330 | | | | 3,231,537 | | |
| Autodesk, Inc. (a) | | | 114,230 | | | | 3,169,883 | | |
| AutoNavi Holdings Ltd., ADR (a) | | | 51,910 | | | | 809,796 | | |
Check Point Software
Technologies Ltd. (a) | | | 123,690 | | | | 4,315,544 | | |
| Citrix Systems, Inc. (a) | | | 61,750 | | | | 3,577,795 | | |
| Concur Technologies, Inc. (a) | | | 66,760 | | | | 3,122,365 | | |
| Intuit, Inc. (a) | | | 68,950 | | | | 2,951,060 | | |
| Microsoft Corp. | | | 144,930 | | | | 3,402,956 | | |
| Nuance Communications, Inc. (a) | | | 124,730 | | | | 1,831,036 | | |
| Pegasystems, Inc. | | | 74,400 | | | | 1,629,360 | | |
| Red Hat, Inc. (a) | | | 197,710 | | | | 6,830,881 | | |
| Rovi Corp. (a) | | | 189,687 | | | | 8,253,281 | | |
| Salesforce.com, Inc. (a) | | | 61,780 | | | | 6,788,387 | | |
| SuccessFactors, Inc. (a) | | | 124,769 | | | | 2,632,626 | | |
| TIBCO Software, Inc. (a) | | | 136,212 | | | | 1,973,712 | | |
| VMware, Inc., Class A (a) | | | 63,630 | | | | 4,999,409 | | |
| Software Total | | | 59,519,628 | | |
| Information Technology Total | | | 201,817,132 | | |
| Materials – 0.7% | |
| Chemicals – 0.7% | |
| STR Holdings, Inc. (a) | | | 84,990 | | | | 1,756,743 | | |
| Chemicals Total | | | 1,756,743 | | |
| Materials Total | | | 1,756,743 | | |
| Telecommunication Services – 2.7% | |
| Wireless Telecommunication Services – 2.7% | |
American Tower Corp.,
Class A (a) | | | 27,710 | | | | 1,298,491 | | |
Crown Castle International
Corp. (a) | | | 32,480 | | | | 1,335,577 | | |
| NII Holdings, Inc. (a) | | | 35,760 | | | | 1,296,300 | | |
SBA Communications Corp.,
Class A (a) | | | 78,520 | | | | 2,811,016 | | |
Wireless Telecommunication
Services Total | | | 6,741,384 | | |
| Telecommunication Services Total | | | 6,741,384 | | |
Total Common Stocks
(cost of $188,932,123) | | | 232,611,908 | | |
| Short-Term Obligation – 7.0% | |
| | | Par ($) | | Value ($) | |
Repurchase agreement with
Fixed Income Clearing Corp.,
dated 08/31/10, due 09/01/10
at 0.180%, collateralized by a
U.S. Treasury obligation
maturing 11/15/19, market
value $18,004,594 (repurchase
proceeds $17,651,088) | | | 17,651,000 | | | | 17,651,000 | | |
Total Short-Term Obligation
(cost of $17,651,000) | | | 17,651,000 | | |
Total Investments – 99.6%
(cost of $206,583,123) (b) | | | 250,262,908 | | |
| Other Assets & Liabilities, Net – 0.4% | | | 1,070,242 | | |
| Net Assets – 100.0% | | | 251,333,150 | | |
Notes to Investment Portfolio:
(a) Non-income producing security.
(b) Cost for federal income tax purposes is $207,221,066.
The following table summarizes the inputs used, as of August 31, 2010, in valuing the Fund's assets:
| Description | | Quoted
Prices
(Level 1) | | Other
Significant
Observable
Inputs
(Level 2) | | Significant
Unobservable
Inputs
(Level 3) | | Total | |
| Total Common Stocks | | $ | 232,611,908 | | | $ | — | | | $ | — | | | $ | 232,611,908 | | |
Total Short-Term
Obligation | | | — | | | | 17,651,000 | | | | — | | | | 17,651,000 | | |
| Total Investments | | $ | 232,611,908 | | | $ | 17,651,000 | | | $ | — | | | $ | 250,262,908 | | |
Certain short-term obligations may be valued using amortized cost, an income approach which converts future cash flows to a present value based upon the premium or discount at purchase.
For more information on valuation inputs, and their aggregation into the levels used in the table above, please refer to the Security Valuation section in the accompanying Notes to Financial Statements.
At August 31, 2010, the Fund held investments in the following sectors:
| Sectors (Unaudited) | | % of
Net Assets | |
| Information Technology | | | 80.3 | | |
| Consumer Discretionary | | | 6.0 | | |
| Telecommunication Services | | | 2.7 | | |
| Health Care | | | 2.6 | | |
| Materials | | | 0.7 | | |
| Industrials | | | 0.3 | | |
| | | | 92.6 | | |
| Short-Term Obligation | | | 7.0 | | |
| Other Assets & Liabilities, Net | | | 0.4 | | |
| | | | 100.0 | | |
| Acronym | | Name | |
| ADR | | American Depositary Receipt | |
|
See Accompanying Notes to Financial Statements.
9
Statement of Assets and Liabilities – Columbia Technology Fund
August 31, 2010
| | | | | ($) | |
| Assets | | Investments, at identified cost | | | 206,583,123 | | |
| | | Investments, at value | | | 250,262,908 | | |
| | | Cash | | | 504 | | |
| | | Receivable for: | | | | | |
| | | Investments sold | | | 2,333,649 | | |
| | | Fund shares sold | | | 316,677 | | |
| | | Dividends | | | 175,684 | | |
| | | Interest | | | 88 | | |
| | | Foreign tax reclaims | | | 1,257 | | |
| | | Expense reimbursement due from investment advisor | | | 29,225 | | |
| | | Trustees' deferred compensation plan | | | 22,178 | | |
| | | Prepaid expenses | | | 5,996 | | |
| | | Total Assets | | | 253,148,166 | | |
| Liabilities | | Payable for: | | | | | |
| | | Investments purchased | | | 629,744 | | |
| | | Fund shares repurchased | | | 702,891 | | |
| | | Investment advisory fee | | | 190,315 | | |
| | | Pricing and bookkeeping fees | | | 7,533 | | |
| | | Transfer agent fee | | | 136,306 | | |
| | | Trustees' fees | | | 31 | | |
| | | Custody fee | | | 5,882 | | |
| | | Distribution and service fees | | | 39,339 | | |
| | | Chief compliance officer expenses | | | 166 | | |
| | | Trustees' deferred compensation plan | | | 22,178 | | |
| | | Other liabilities | | | 80,631 | | |
| | | Total Liabilities | | | 1,815,016 | | |
| | | Net Assets | | | 251,333,150 | | |
| Net Assets Consist of | | Paid-in capital | | | 327,420,933 | | |
| | | Accumulated net investment loss | | | (57,396 | ) | |
| | | Accumulated net realized loss | | | (119,710,172 | ) | |
| | | Net unrealized appreciation (depreciation) on investments | | | 43,679,785 | | |
| | | Net Assets | | | 251,333,150 | | |
See Accompanying Notes to Financial Statements.
10
Statement of Assets and Liabilities (continued) – Columbia Technology Fund
August 31, 2010
| Class A | | Net assets | | $ | 71,989,153 | | |
| | | Shares outstanding | | | 8,224,038 | | |
| | | Net asset value per share | | $ | 8.75 | (a) | |
| | | Maximum sales charge | | | 5.75 | % | |
| | | Maximum offering price per share ($8.75/0.9425) | | $ | 9.28 | (b) | |
| Class B | | Net assets | | $ | 6,478,175 | | |
| | | Shares outstanding | | | 777,594 | | |
| | | Net asset value and offering price per share | | $ | 8.33 | (a) | |
| Class C | | Net assets | | $ | 20,941,441 | | |
| | | Shares outstanding | | | 2,509,078 | | |
| | | Net asset value and offering price per share | | $ | 8.35 | (a) | |
| Class Z | | Net assets | | $ | 151,924,381 | | |
| | | Shares outstanding | | | 17,031,224 | | |
| | | Net asset value, offering and redemption price per share | | $ | 8.92 | | |
(a) Redemption price per share is equal to net asset value less any applicable contingent deferred sales charge.
(b) On sales of $50,000 or more the offering price is reduced.
See Accompanying Notes to Financial Statements.
11
Statement of Operations – Columbia Technology Fund
For the Year Ended August 31, 2010
| | | | | ($) | |
| Investment Income | | Dividends | | | 968,226 | | |
| | | Interest | | | 7,413 | | |
| | | Foreign taxes withheld | | | (14,260 | ) | |
| | | Total Investment Income | | | 961,379 | | |
| Expenses | | Investment advisory fee | | | 2,404,020 | | |
| | | Distribution fee: | | | | | |
| | | Class B | | | 51,826 | | |
| | | Class C | | | 178,510 | | |
| | | Service fee: | | | | | |
| | | Class A | | | 201,166 | | |
| | | Class B | | | 17,276 | | |
| | | Class C | | | 59,503 | | |
| | | Transfer agent fee | | | 564,733 | | |
| | | Pricing and bookkeeping fees | | | 84,839 | | |
| | | Trustees' fees | | | 26,826 | | |
| | | Custody fee | | | 26,340 | | |
| | | Chief compliance officer expenses | | | 1,034 | | |
| | | Other expenses | | | 252,472 | | |
| | | Expenses before interest expense | | | 3,868,545 | | |
| | | Interest expense | | | 2,254 | | |
| | | Total Expenses | | | 3,870,799 | | |
| | | Fees waived or expenses reimbursed by investment advisor | | | (45,469 | ) | |
| | | Expense reductions | | | (1 | ) | |
| | | Net Expenses | | | 3,825,329 | | |
| | | Net Investment Loss | | | (2,863,950 | ) | |
| Net Realized and Unrealized Gain (Loss) on Investments and Foreign Currency | | Net realized gain (loss) on: | | | | | |
| | | Investments | | | 47,054,190 | | |
| | | Foreign currency transactions | | | (33,684 | ) | |
| | | Net realized gain | | | 47,020,506 | | |
| | | Net change in unrealized appreciation (depreciation) on investments | | | (2,502,005 | ) | |
| | | Net Gain | | | 44,518,501 | | |
| | | Net Increase Resulting from Operations | | | 41,654,551 | | |
See Accompanying Notes to Financial Statements.
12
Statement of Changes in Net Assets – Columbia Technology Fund
| | | | | Year Ended August 31, | |
| Increase (Decrease) in Net Assets | | | | 2010 ($) | | 2009 ($) | |
| Operations | | Net investment loss | | | (2,863,950 | ) | | | (1,801,432 | ) | |
| | | Net realized gain (loss) on investments and foreign
currency transactions | | | 47,020,506 | | | | (120,368,694 | ) | |
| | | Net change in unrealized appreciation (depreciation) on
investments | | | (2,502,005 | ) | | | 24,801,146 | | |
| | | Net increase (decrease) resulting from operations | | | 41,654,551 | | | | (97,368,980 | ) | |
| | | Net Capital Stock Transactions | | | (57,946,529 | ) | | | (36,348,719 | ) | |
| | | Total decrease in net assets | | | (16,291,978 | ) | | | (133,717,699 | ) | |
| Net Assets | | Beginning of period | | | 267,625,128 | | | | 401,342,827 | | |
| | | End of period | | | 251,333,150 | | | | 267,625,128 | | |
| | | Accumulated net investment loss at end of period | | | (57,396 | ) | | | (22,060 | ) | |
See Accompanying Notes to Financial Statements.
13
Statement of Changes in Net Assets (continued) – Columbia Technology Fund
| | | Capital Stock Activity | |
| | | Year Ended
August 31, 2010 | | Year Ended
August 31, 2009 | |
| | | Shares | | Dollars ($) | | Shares | | Dollars ($) | |
| Class A | |
| Subscriptions | | | 3,128,923 | | | | 27,120,284 | | | | 4,349,034 | | | | 29,339,307 | | |
| Redemptions | | | (5,637,671 | ) | | | (48,352,597 | ) | | | (7,726,142 | ) | | | (49,825,236 | ) | |
| Net decrease | | | (2,508,748 | ) | | | (21,232,313 | ) | | | (3,377,108 | ) | | | (20,485,929 | ) | |
| Class B | |
| Subscriptions | | | 61,443 | | | | 509,325 | | | | 143,829 | | | | 927,078 | | |
| Redemptions | | | (187,574 | ) | | | (1,540,306 | ) | | | (392,198 | ) | | | (2,436,019 | ) | |
| Net decrease | | | (126,131 | ) | | | (1,030,981 | ) | | | (248,369 | ) | | | (1,508,941 | ) | |
| Class C | |
| Subscriptions | | | 239,855 | | | | 1,981,609 | | | | 522,506 | | | | 3,405,023 | | |
| Redemptions | | | (1,086,153 | ) | | | (8,871,786 | ) | | | (1,892,006 | ) | | | (12,137,396 | ) | |
| Net decrease | | | (846,298 | ) | | | (6,890,177 | ) | | | (1,369,500 | ) | | | (8,732,373 | ) | |
| Class Z | |
| Subscriptions | | | 6,141,161 | | | | 53,385,962 | | | | 9,291,739 | | | | 61,587,346 | | |
| Redemptions | | | (9,294,164 | ) | | | (82,179,020 | ) | | | (10,291,563 | ) | | | (67,208,822 | ) | |
| Net decrease | | | (3,153,003 | ) | | | (28,793,058 | ) | | | (999,824 | ) | | | (5,621,476 | ) | |
See Accompanying Notes to Financial Statements.
14
Financial Highlights – Columbia Technology Fund
Selected data for a share outstanding throughout each period is as follows:
| | | Year Ended August 31, | |
| Class A Shares | | 2010 | | 2009 | | 2008 | | 2007 | | 2006 | |
| Net Asset Value, Beginning of Period | | $ | 7.58 | | | $ | 9.72 | | | $ | 11.62 | | | $ | 9.33 | | | $ | 8.77 | | |
| Income from Investment Operations: | |
| Net investment loss (a) | | | (0.09 | ) | | | (0.05 | ) | | | (0.07 | ) | | | (0.10 | ) | | | (0.09 | ) | |
Net realized and unrealized gain (loss) on investments,
foreign currency, futures contracts and written options | | | 1.26 | | | | (2.09 | ) | | | (1.22 | ) | | | 2.39 | | | | 1.21 | | |
| Total from investment operations | | | 1.17 | | | | (2.14 | ) | | | (1.29 | ) | | | 2.29 | | | | 1.12 | | |
| Less Distributions to Shareholders: | |
| From net realized gains | | | — | | | | — | | | | (0.61 | ) | | | — | | | | (0.56 | ) | |
| Net Asset Value, End of Period | | $ | 8.75 | | | $ | 7.58 | | | $ | 9.72 | | | $ | 11.62 | | | $ | 9.33 | | |
| Total return (b) | | | 15.44 | %(c) | | | (22.02 | )%(c) | | | (12.13 | )% | | | 24.54 | % | | | 12.78 | %(c) | |
| Ratios to Average Net Assets/Supplemental Data: | |
| Net expenses before interest expense (d) | | | 1.45 | % | | | 1.46 | % | | | 1.36 | % | | | 1.46 | % | | | 1.45 | % | |
| Interest expense | | | — | %(e) | | | — | | | | — | | | | — | %(e) | | | — | %(e) | |
| Net expenses (d) | | | 1.45 | % | | | 1.46 | % | | | 1.36 | % | | | 1.46 | % | | | 1.45 | % | |
| Waiver/Reimbursement | | | 0.02 | % | | | 0.07 | % | | | — | | | | — | | | | — | %(e) | |
| Net investment loss (d) | | | (1.10 | )% | | | (0.80 | )% | | | (0.69 | )% | | | (0.96 | )% | | | (0.95 | )% | |
| Portfolio turnover rate | | | 189 | % | | | 284 | % | | | 263 | % | | | 210 | % | | | 350 | % | |
| Net assets, end of period (000s) | | $ | 71,989 | | | $ | 81,321 | | | $ | 137,181 | | | $ | 109,541 | | | $ | 75,996 | | |
(a) Per share data was calculated using the average shares outstanding during the period.
(b) Total return at net asset value assuming all distributions reinvested and no initial sales charge or contingent deferred sales charge.
(c) Had the investment advisor and/or any of its affiliates not waived fees or reimbursed a portion of expenses, total return would have been reduced.
(d) The benefits derived from expense reductions had an impact of less than 0.01%.
(e) Rounds to less than 0.01%.
See Accompanying Notes to Financial Statements.
15
Financial Highlights – Columbia Technology Fund
Selected data for a share outstanding throughout each period is as follows:
| | | Year Ended August 31, | |
| Class B Shares | | 2010 | | 2009 | | 2008 | | 2007 | | 2006 | |
| Net Asset Value, Beginning of Period | | $ | 7.26 | | | $ | 9.39 | | | $ | 11.25 | | | $ | 9.10 | | | $ | 8.57 | | |
| Income from Investment Operations: | |
| Net investment loss (a) | | | (0.15 | ) | | | (0.10 | ) | | | (0.15 | ) | | | (0.17 | ) | | | (0.16 | ) | |
Net realized and unrealized gain (loss) on investments,
foreign currency, futures contracts and written options | | | 1.22 | | | | (2.03 | ) | | | (1.19 | ) | | | 2.32 | | | | 1.19 | | |
| Total from investment operations | | | 1.07 | | | | (2.13 | ) | | | (1.34 | ) | | | 2.15 | | | | 1.03 | | |
| Less Distributions to Shareholders: | |
| From net realized gains | | | — | | | | — | | | | (0.52 | ) | | | — | | | | (0.50 | ) | |
| Net Asset Value, End of Period | | $ | 8.33 | | | $ | 7.26 | | | $ | 9.39 | | | $ | 11.25 | | | $ | 9.10 | | |
| Total return (b) | | | 14.74 | %(c) | | | (22.68 | )%(c) | | | (12.80 | )% | | | 23.63 | % | | | 11.98 | %(c) | |
| Ratios to Average Net Assets/Supplemental Data: | |
| Net expenses before interest expense (d) | | | 2.20 | % | | | 2.21 | % | | | 2.11 | % | | | 2.21 | % | | | 2.20 | % | |
| Interest expense | | | — | %(e) | | | — | | | | — | | | | — | %(e) | | | — | %(e) | |
| Net expenses (d) | | | 2.20 | % | | | 2.21 | % | | | 2.11 | % | | | 2.21 | % | | | 2.20 | % | |
| Waiver/Reimbursement | | | 0.02 | % | | | 0.07 | % | | | — | | | | — | | | | — | %(e) | |
| Net investment loss (d) | | | (1.85 | )% | | | (1.55 | )% | | | (1.43 | )% | | | (1.70 | )% | | | (1.70 | )% | |
| Portfolio turnover rate | | | 189 | % | | | 284 | % | | | 263 | % | | | 210 | % | | | 350 | % | |
| Net assets, end of period (000s) | | $ | 6,478 | | | $ | 6,562 | | | $ | 10,812 | | | $ | 10,580 | | | $ | 7,823 | | |
(a) Per share data was calculated using the average shares outstanding during the period.
(b) Total return at net asset value assuming all distributions reinvested and no contingent deferred sales charge.
(c) Had the investment advisor and/or any of its affiliates not waived fees or reimbursed a portion of expenses, total return would have been reduced.
(d) The benefits derived from expense reductions had an impact of less than 0.01%.
(e) Rounds to less than 0.01%.
See Accompanying Notes to Financial Statements.
16
Financial Highlights – Columbia Technology Fund
Selected data for a share outstanding throughout each period is as follows:
| | | Year Ended August 31, | |
| Class C Shares | | 2010 | | 2009 | | 2008 | | 2007 | | 2006 | |
| Net Asset Value, Beginning of Period | | $ | 7.27 | | | $ | 9.41 | | | $ | 11.27 | | | $ | 9.12 | | | $ | 8.59 | | |
| Income from Investment Operations: | |
| Net investment loss (a) | | | (0.15 | ) | | | (0.10 | ) | | | (0.15 | ) | | | (0.17 | ) | | | (0.16 | ) | |
Net realized and unrealized gain (loss) on investments,
foreign currency, futures contracts and written options | | | 1.23 | | | | (2.04 | ) | | | (1.19 | ) | | | 2.32 | | | | 1.19 | | |
| Total from investment operations | | | 1.08 | | | | (2.14 | ) | | | (1.34 | ) | | | 2.15 | | | | 1.03 | | |
| Less Distributions to Shareholders: | |
| From net realized gains | | | — | | | | — | | | | (0.52 | ) | | | — | | | | (0.50 | ) | |
| Net Asset Value, End of Period | | $ | 8.35 | | | $ | 7.27 | | | $ | 9.41 | | | $ | 11.27 | | | $ | 9.12 | | |
| Total return (b) | | | 14.86 | %(c) | | | (22.74 | )%(c) | | | (12.78 | )% | | | 23.57 | % | | | 11.95 | %(c) | |
| Ratios to Average Net Assets/Supplemental Data: | |
| Net expenses before interest expense (d) | | | 2.20 | % | | | 2.21 | % | | | 2.11 | % | | | 2.21 | % | | | 2.20 | % | |
| Interest expense | | | — | %(e) | | | — | | | | — | | | | — | %(e) | | | — | %(e) | |
| Net expenses (d) | | | 2.20 | % | | | 2.21 | % | | | 2.11 | % | | | 2.21 | % | | | 2.20 | % | |
| Waiver/Reimbursement | | | 0.02 | % | | | 0.07 | % | | | — | | | | — | | | | — | %(e) | |
| Net investment loss (d) | | | (1.85 | )% | | | (1.55 | )% | | | (1.45 | )% | | | (1.70 | )% | | | (1.70 | )% | |
| Portfolio turnover rate | | | 189 | % | | | 284 | % | | | 263 | % | | | 210 | % | | | 350 | % | |
| Net assets, end of period (000s) | | $ | 20,941 | | | $ | 24,410 | | | $ | 44,466 | | | $ | 36,325 | | | $ | 21,018 | | |
(a) Per share data was calculated using the average shares outstanding during the period.
(b) Total return at net asset value assuming all distributions reinvested and no contingent deferred sales charge.
(c) Had the investment advisor and/or any of its affiliates not waived fees or reimbursed a portion of expenses, total return would have been reduced.
(d) The benefits derived from expense reductions had an impact of less than 0.01%.
(e) Rounds to less than 0.01%.
See Accompanying Notes to Financial Statements.
17
Financial Highlights – Columbia Technology Fund
Selected data for a share outstanding throughout each period is as follows:
| | | Year Ended August 31, | |
| Class Z Shares | | 2010 | | 2009 | | 2008 | | 2007 | | 2006 | |
| Net Asset Value, Beginning of Period | | $ | 7.70 | | | $ | 9.86 | | | $ | 11.78 | | | $ | 9.43 | | | $ | 8.86 | | |
| Income from Investment Operations: | |
| Net investment loss (a) | | | (0.07 | ) | | | (0.04 | ) | | | (0.05 | ) | | | (0.08 | ) | | | (0.07 | ) | |
Net realized and unrealized gain (loss) on investments,
foreign currency, futures contracts and written options | | | 1.29 | | | | (2.12 | ) | | | (1.23 | ) | | | 2.43 | | | | 1.22 | | |
| Total from investment operations | | | 1.22 | | | | (2.16 | ) | | | (1.28 | ) | | | 2.35 | | | | 1.15 | | |
| Less Distributions to Shareholders: | |
| From net realized gains | | | — | | | | — | | | | (0.64 | ) | | | — | | | | (0.58 | ) | |
| Net Asset Value, End of Period | | $ | 8.92 | | | $ | 7.70 | | | $ | 9.86 | | | $ | 11.78 | | | $ | 9.43 | | |
| Total return (b) | | | 15.84 | %(c) | | | (21.91 | )%(c) | | | (11.93 | )% | | | 24.92 | % | | | 13.01 | %(c) | |
| Ratios to Average Net Assets/Supplemental Data: | |
| Net expenses before interest expense (d) | | | 1.20 | % | | | 1.21 | % | | | 1.11 | % | | | 1.21 | % | | | 1.20 | % | |
| Interest expense | | | — | %(e) | | | — | | | | — | | | | — | %(e) | | | — | %(e) | |
| Net expenses (d) | | | 1.20 | % | | | 1.21 | % | | | 1.11 | % | | | 1.21 | % | | | 1.20 | % | |
| Waiver/Reimbursement | | | 0.02 | % | | | 0.07 | % | | | — | | | | — | | | | — | %(e) | |
| Net investment loss (d) | | | (0.85 | )% | | | (0.54 | )% | | | (0.45 | )% | | | (0.70 | )% | | | (0.71 | )% | |
| Portfolio turnover rate | | | 189 | % | | | 284 | % | | | 263 | % | | | 210 | % | | | 350 | % | |
| Net assets, end of period (000s) | | $ | 151,924 | | | $ | 155,332 | | | $ | 208,883 | | | $ | 137,420 | | | $ | 70,767 | | |
(a) Per share data was calculated using the average shares outstanding during the period.
(b) Total return at net asset value assuming all distributions reinvested.
(c) Had the investment advisor and/or any of its affiliates not waived fees or reimbursed a portion of expenses, total return would have been reduced.
(d) The benefits derived from expense reductions had an impact of less than 0.01%.
(e) Rounds to less than 0.01%.
See Accompanying Notes to Financial Statements.
18
Notes to Financial Statements – Columbia Technology Fund
August 31, 2010
Note 1. Organization
Columbia Technology Fund (the "Fund"), a series of Columbia Funds Series Trust I (the "Trust"), is a diversified fund. The Trust is registered under the Investment Company Act of 1940, as amended (the "1940 Act"), as an open-end management investment company organized as a Massachusetts business trust.
Investment Objective
The Fund seeks capital appreciation by investing, under normal market conditions, at least 80% of its total net assets (plus any borrowings for investment purposes) in stocks of technology companies that may benefit from technological improvements, advancements or developments.
Fund Shares
The Trust may issue an unlimited number of shares, and the Fund offers four classes of shares: Class A, Class B, Class C and Class Z. Each share class has its own expense structure and sales charges, as applicable. The Fund no longer accepts investments from new or existing investors in the Fund's Class B shares, except in connection with the reinvestment of any dividend and/or capital gain distributions in Class B shares of the Fund and exchanges by existing Class B shareholders of the other Columbia Funds.
Class A shares are subject to a maximum front-end sales charge of 5.75% based on the amount of initial investment. Class A shares purchased without an initial sales charge in accounts aggregating $1 million to $50 million at the time of purchase are subject to a 1.00% contingent deferred sales charge ("CDSC") if the shares are sold within one year after purchase. Class B shares are subject to a maximum CDSC of 5.00% based upon the holding period after purchase. Class B shares will convert to Class A shares eight years after purchase. Class C shares are subject to a 1.00% CDSC on shares sold within one year after purchase. Class Z shares are offered continuously at net asset value. There are certain restrictions on the purchase of Class Z shares, as described in the Fund's prospectus.
Note 2. Significant Accounting Policies
The preparation of financial statements in accordance with accounting principles generally accepted in the United States of America ("GAAP") requires management to make certain estimates and assumptions that affect the reported amounts of assets and liabilities, the disclosure of contingent assets and liabilities at the date of the financial statements and the reported amounts of revenue and expenses during the reporting period. Actual results could differ from those estimates.
Management has evaluated the events and transactions that have occurred through the date the financial statements were issued and noted no items requiring adjustment of the financial statements or additional disclosures.
The following is a summary of significant accounting policies consistently followed by the Fund in the preparation of its financial statements.
Security Valuation
Equity securities are valued at the last sale price on the principal exchange on which they trade, except for securities traded on the NASDAQ, which are valued at the NASDAQ official close price. Unlisted securities or listed securities for which there were no sales during the day are valued at the closing bid price on such exchanges or over-the-counter markets.
Short-term investments maturing in 60 days or less are valued at amortized cost, which approximates market value.
Foreign securities are generally valued at the last sale price on the foreign exchange or market on which they trade. If any foreign share prices are not readily available as a result of limited share activity, the securities are valued at the last sale price of the local shares in the principal market in which such securities are normally traded.
Generally, trading in foreign securities is substantially completed each day at various times prior to the close of the New York Stock Exchange ("NYSE"). The values of such securities used in computing the net asset value of the Fund's shares are determined as of such times. Foreign currency exchange rates are generally determined at 4:00 p.m. Eastern (U.S.) time. Occasionally, events affecting the values of such foreign securities may occur between the times at which they are determined and the close of the customary trading session of the NYSE, which would not be reflected in the computation of the Fund's net asset value. If events materially affecting the values of such foreign securities occur and it is determined that market quotations are not reliable, then these foreign
19
Columbia Technology Fund, August 31, 2010
securities will be valued at their fair value using procedures approved by the Board of Trustees.
Investments for which market quotations are not readily available, or that have quotations which management believes are not reliable, are valued at fair value as determined in good faith under consistently applied procedures established by and under the general supervision of the Board of Trustees. If a security is valued at fair value, such value is likely to be different from the last quoted market price for the security. The determination of fair value often requires significant judgment. To determine fair value, management may use assumptions including but not limited to future cash flows and estimated risk premiums. Multiple inputs from various sources may be used to determine value.
GAAP establishes a hierarchy that prioritizes the inputs to valuation techniques used to measure fair value giving the highest priority to unadjusted quoted prices in active markets for identical securities (level 1 measurements) and the lowest priority to unobservable inputs (level 3 measurements) when market prices are not readily available or reliable. The three levels of the fair value hierarchy are described below:
• Level 1 – quoted prices in active markets for identical securities
• Level 2 – prices determined using other significant observable inputs (including quoted prices for similar securities, interest rates, prepayment speeds, credit risk and others)
• Level 3 – prices determined using significant unobservable inputs. In situations where quoted prices or observable inputs are unavailable or less reliable, unobservable inputs may be used. Unobservable inputs may include management's own assumptions about the factors market participants would use in pricing an investment.
The inputs or methodology used for valuing securities are not necessarily an indication of the risk associated with investing in those securities.
On January 21, 2010, the Financial Accounting Standards Board issued an Accounting Standards Update (the "amendment"), Fair Value Measurements and Disclosures (Topic 820): Improving Disclosures about Fair Value Measurements, which provides guidance on how investment assets and liabilities are to be valued and disclosed. Specifically, the amendment requires reporting entities to disclose the inputs and valuation techniques used to measure fair value for both recurring and nonrecurring fair value measurements for Level 2 and Level 3 positions. The amendment also requires that transfers between all levels (including Level 1 and Level 2) be disclosed on a gross basis (i.e., transfers out must be disclosed separately from transfers in), and requires disclosure of the reason(s) for sign ificant transfers. Additionally, purchases, sales, issuances and settlements must be disclosed on a gross basis in the Level 3 roll forward. The effective date of the amendment is for interim and annual periods beginning after December 15, 2009; except for the requirement to provide the Level 3 activity for purchases, sales, issuances and settlements on a gross basis, which will be effective for interim and annual periods beginning after December 15, 2010. At this time, management is evaluating the implications of the amendment and the impact to the financial statements.
Security Transactions
Security transactions are accounted for on the trade date. Cost is determined and gains (losses) are based upon the specific identification method for both financial statement and federal income tax purposes.
Repurchase Agreements
The Fund may engage in repurchase agreement transactions with institutions that management has determined are creditworthy. The Fund, through its custodian, receives delivery of the underlying securities collateralizing a repurchase agreement. Management is responsible for determining that the collateral is at least equal, at all times, to the value of the repurchase obligation including interest. A repurchase agreement transaction involves certain risks in the event of default or insolvency of the counterparty. These risks include possible delays in or restrictions on the Fund's ability to dispose of the underlying securities and a possible decline in the value of the underlying securities during the period while the Fund seeks to assert its rights.
Foreign Currency Transactions and Translations
The values of all assets and liabilities quoted in foreign currencies are translated into U.S. dollars at that day's exchange rates. Net realized and unrealized gains (losses) on foreign currency transactions and translations include gains (losses) arising from the fluctuation in exchange rates
20
Columbia Technology Fund, August 31, 2010
between trade and settlement dates on securities transactions, gains (losses) arising from the disposition of foreign currency and currency gains (losses) between the accrual and payment dates on dividends, interest income and foreign withholding taxes.
For financial statement purposes, the Fund does not distinguish that portion of gains (losses) on investments which is due to changes in foreign exchange rates from that which is due to changes in market prices of the investments. Such fluctuations are included with the net realized and unrealized gains (losses) on investments on the Statement of Operations.
Income Recognition
Interest income is recorded on the accrual basis.
Corporate actions and dividend income are recorded on the ex-date.
Expenses
General expenses of the Trust are allocated to the Fund and other series of the Trust based upon relative net assets or other expense allocation methodologies determined by the nature of the expense. Expenses directly attributable to a specific class of shares are charged to that specific class. Expenses directly attributable to the Fund are charged to the Fund.
Determination of Class Net Asset Value
All income, expenses (other than class-specific expenses, as shown on the Statement of Operations) and realized and unrealized gains (losses) are allocated to each class of the Fund on a daily basis, based on the relative net assets of each class, for purposes of determining the net asset value of each class.
Federal Income Tax Status
The Fund intends to qualify each year as a "regulated investment company" under Subchapter M of the Internal Revenue Code, as amended, and will distribute substantially all of its taxable income, if any, for its tax year, and as such will not be subject to federal income taxes. In addition, the Fund intends to distribute in each calendar year substantially all of its net investment income, capital gains and certain other amounts, if any, such that the Fund should not be subject to federal excise tax. Therefore, no provision is made for federal income or excise taxes.
Foreign Tax
The Fund may be subject to foreign taxes on income, gains on investments or currency repatriation, a portion of which may be recoverable. The Fund will accrue such taxes and recoveries as applicable, based upon its current interpretation of tax rules and regulations that exist in the markets in which it invests.
Realized gains in certain countries may be subject to foreign taxes at the fund level, at rates ranging from approximately 10% to 15%. The Fund accrues for such foreign taxes on net realized and unrealized gains at the appropriate rate for each jurisdiction.
Distributions to Shareholders
Distributions from net investment income, if any, are declared and paid annually. Net realized capital gains, if any, are distributed at least annually. Income distributions and capital gain distributions are determined in accordance with federal income tax regulations which may differ from GAAP.
Indemnification
In the normal course of business, the Fund enters into contracts that contain a variety of representations and warranties and which provide general indemnities. The Fund's maximum exposure under these arrangements is unknown because this would involve future claims against the Fund. Also, under the Trust's organizational documents and by contract, the Trustees and officers of the Trust are indemnified against certain liabilities that may arise out of actions relating to their duties to the Trust. However, based on experience, the Fund expects the risk of loss due to these representations, warranties and indemnities to be minimal.
Note 3. Federal Tax Information
The timing and character of income and capital gain distributions are determined in accordance with income tax regulations, which may differ from GAAP. Reclassifications are made to the Fund's capital accounts for permanent tax differences to reflect income and gains available for distribution (or available capital loss carryforwards) under income tax regulations.
For the year ended August 31, 2010, permanent book and tax basis differences resulting primarily from differing treatments
21
Columbia Technology Fund, August 31, 2010
for net operating losses, foreign currency transactions, Section 988 bond bifurcation, Section 1256 tax return of capital and expired capital loss carryforwards were identified and reclassified among the components of the Fund's net assets as follows:
Accumulated
Net Investment
Loss | | Accumulated
Net Realized
Loss | | Paid-In Capital | |
| $ | 2,828,614 | | | $ | 33,686 | | | $ | (2,862,300 | ) | |
Net investment income and net realized gains (losses), as disclosed on the Statement of Operations, and net assets were not affected by this reclassification.
As of August 31, 2010, the components of distributable earnings on a tax basis were as follows:
Undistributed
Ordinary
Income | | Undistributed
Long-Term
Capital Gains | | Net Unrealized
Appreciation* | |
| $ | — | | | $ | — | | | $ | 43,041,842 | | |
* The differences between book-basis and tax-basis net unrealized appreciation are primarily due to deferral of losses from wash sales.
Unrealized appreciation and depreciation at August 31, 2010, based on cost of investments for federal income tax purposes were:
| Unrealized appreciation | | $ | 50,924,588 | | |
| Unrealized depreciation | | | (7,882,746 | ) | |
| Net unrealized appreciation | | $ | 43,041,842 | | |
The following capital loss carryforwards may be available to reduce taxable income arising from future net realized gains on investments, if any, to the extent permitted by the Internal Revenue Code:
| Year of Expiration | | Capital Loss
Carryforwards | |
| 2017 | | $ | 89,694,106 | | |
| 2018 | | | 29,378,123 | | |
| Total | | $ | 119,072,229 | | |
Under current tax rules, certain currency losses realized after October 31 may be deferred and treated as occurring on the first day of the following fiscal year. As of August 31, 2010, post-October currency losses of $32,956 attributed to security transactions were deferred to September 1, 2010.
Management is required to determine whether a tax position of the Fund is more likely than not to be sustained upon examination by the applicable taxing authority, including resolution of any related appeals or litigation processes, based on the technical merits of the position. The tax benefit to be recognized by the Fund is measured as the largest amount of benefit that is greater than fifty percent likely of being realized upon ultimate settlement. Management is not aware of any tax positions for which it is reasonably possible that the total amounts of unrecognized tax benefits will significantly change in the next twelve months. However, management's conclusions may be subject to review and adjustment at a later date based on factors including, but not limited to, new tax laws, regulations, and administrative interpretations (including relevant court decisions). The Fund's federal tax returns for the prior three fiscal year s remain subject to examination by the Internal Revenue Service.
Note 4. Fees and Compensation Paid to Affiliates
Investment Advisory Fee
After the close of business on April 30, 2010, Ameriprise Financial, Inc. ("Ameriprise Financial") acquired a portion of the asset management business of Columbia Management Group, LLC (the "Transaction"), including the business of managing the Fund. In connection with the closing of the Transaction (the "Closing"), RiverSource Investments, LLC, a wholly owned subsidiary of Ameriprise Financial, became the investment advisor of the Fund and subsequently changed its name to Columbia Management Investment Advisers, LLC (the "New Advisor"). The New Advisor receives a monthly investment advisory fee based on the Fund's average daily net assets at the following annual rates:
| Average Daily Net Assets | | Annual Fee Rate | |
| First $500 million | | | 0.87 | % | |
| $500 million to $1 billion | | | 0.82 | % | |
| Over $1 billion | | | 0.77 | % | |
22
Columbia Technology Fund, August 31, 2010
Prior to the Closing, Columbia Management Advisors, LLC ("Columbia"), an indirect, wholly owned subsidiary of Bank of America Corporation ("BOA"), provided investment advisory, administrative and other services to the Fund under the same fee structure.
For the year ended August 31, 2010, the Fund's effective investment advisory fee rate was 0.87% of the Fund's average daily net assets.
Administration Fee
Effective upon the Closing, the New Advisor became the administrator of the Fund under a new Administrative Services Agreement (the "Administrative Agreement"). Under the Administrative Agreement, the New Advisor provides administrative and other services to the Fund, including services previously performed under the Pricing and Bookkeeping Oversight and Services Agreement discussed below. The New Advisor does not receive a fee for its services under the Administrative Agreement. Prior to the Closing, Columbia provided administrative services to the Fund as discussed in the Investment Advisory Fee note above.
Pricing and Bookkeeping Fees
Prior to the Closing, the Fund entered into a Financial Reporting Services Agreement (the "Financial Reporting Services Agreement") with State Street Bank and Trust Company ("State Street") and Columbia pursuant to which State Street provides financial reporting services to the Fund. The Fund also entered into an Accounting Services Agreement (collectively with the Financial Reporting Services Agreement, the "State Street Agreements") with State Street and Columbia pursuant to which State Street provides accounting services to the Fund. Upon the Closing, Columbia assigned and delegated its rights and obligations under the State Street Agreements to the New Advisor. Under the State Street Agreements, the Fund pays State Street an annual fee of $38,000 paid monthly plus an additional monthly fee based on an annualized percentage rate of average daily net assets of the Fund for the month. The aggregate fee will not exceed $140,000 per year (exclusive of out-of-pocket expenses and charges). The Fund also reimburses State Street for certain out-of-pocket expenses and charges.
Also prior to the Closing, the Fund entered into a Pricing and Bookkeeping Oversight and Services Agreement (the "Services Agreement") with Columbia. Under the Services Agreement, Columbia provided services related to Fund expenses and the requirements of the Sarbanes-Oxley Act of 2002, and provided oversight of the accounting and financial reporting services provided by State Street. Under the Services Agreement, the Fund reimbursed Columbia for out-of-pocket expenses. The Services Agreement was terminated upon the Closing. These services are now provided under the Administrative Agreement discussed above.
Transfer Agent Fee
In connection with the Closing, RiverSource Service Corporation, a wholly owned subsidiary of Ameriprise Financial, became the transfer agent of the Fund and subsequently changed its name to Columbia Management Investment Services Corp. (the "New Transfer Agent"). The New Transfer Agent has contracted with Boston Financial Data Services ("BFDS") to serve as sub-transfer agent. The New Transfer Agent receives a fee for its services, paid monthly, at the annual rate of $22.36 per account plus reimbursement of certain sub-transfer agent fees paid by the New Transfer Agent (exclusive of BFDS fees), calculated based on assets held in omnibus accounts and intended to recover the cost of payments to other parties (including affiliates of BOA) for services to those accounts. The New Transfer Agent pays the fees of BFDS for services as sub-transfer agent and is not entitled to reimbursement for such fees from the Fund.
The New Transfer Agent may also retain, as additional compensation for its services, fees for wire, telephone and redemption orders, Individual Retirement Account ("IRA") trustee agent fees and account transcript fees due to the New Transfer Agent from shareholders of the Fund and credits (net of bank charges) earned with respect to balances in accounts the New Transfer Agent maintains in connection with its services to the Fund. The New Transfer Agent also receives reimbursement for certain out-of-pocket expenses.
Prior to the Closing, Columbia Management Services, Inc. (the "Previous Transfer Agent"), an affiliate of Columbia and an indirect, wholly owned subsidiary of BOA, provided shareholder services to the Fund and contracted with BFDS to serve as sub-transfer agent, under the same fee structure. Prior to November 1, 2009, the annual rate was $17.34 per account.
An annual minimum account balance fee of $20 may apply to certain accounts with a value below the Fund's initial
23
Columbia Technology Fund, August 31, 2010
minimum investment requirements to reduce the impact of small accounts on transfer agent fees. These minimum account balance fees are recorded as part of expense reductions on the Statement of Operations. For the year ended August 31, 2010, no minimum account balance fees were charged by the Fund.
Underwriting Discounts, Service and Distribution Fees
In connection with the Closing, RiverSource Fund Distributors, Inc., an indirect wholly owned subsidiary of Ameriprise Financial, became the distributor of the Fund and subsequently changed its name to Columbia Management Investment Distributors, Inc. (the "New Distributor").
For the year ended August 31, 2010, initial sales charges paid by shareholders on the purchase of Class A shares amounted to $18,007 and net CDSC fees paid by shareholders on certain redemptions of Class A, Class B and Class C shares amounted to $-, $19,027 and $3,446, respectively.
The Fund has adopted shareholder servicing and distribution plans pursuant to Rule 12b-1 under the 1940 Act (the "Plans") which require the payment of a monthly service fee to the New Distributor at the maximum annual rate of 0.25% of the average daily net assets attributable to Class A, Class B and Class C shares of the Fund. The Plans also require the payment of a monthly distribution fee to the New Distributor at the maximum annual rates of 0.10%, 0.75% and 0.75% of the average daily net assets attributable to Class A, Class B and Class C shares, respectively.
The Fund may pay distribution and service fees up to a maximum annual rate of 0.35% of the Fund's average daily net assets attributable to Class A shares (comprised of up to 0.10% for distribution services and up to 0.25% for shareholder liaison services), but currently limit such fees to an aggregate fee of not more than 0.25% of the Fund's average daily net assets attributable to Class A shares.
The CDSC and the distribution fees received from the Plans are used principally as repayment to the New Distributor for amounts paid by the New Distributor to dealers who sold such shares.
Prior to the Closing, Columbia Management Distributors, Inc., an affiliate of Columbia and an indirect, wholly owned subsidiary of BOA, was the principal underwriter of the Fund's shares. There were no changes to the underwriting discount structure of the Fund or the service or distribution fee rates paid by the Fund as a result of the Transaction.
Expense Limits and Fee Waivers
Effective May 1, 2010, the New Advisor has voluntarily agreed to reimburse a portion of the Fund's expenses so that the Fund's ordinary operating expenses (excluding any distribution and service fees, brokerage commissions, interest, taxes and extraordinary expenses, but including custodian charges relating to overdrafts, if any), after giving effect to any balance credits from the Fund's custodian, do not exceed 1.20% of the Fund's average daily net assets on an annualized basis. This arrangement may be modified or terminated by the New Advisor at any time. Prior to May 1, 2010, Columbia voluntarily reimbursed a portion of the Fund's expenses in the same manner.
Fees Paid to Officers and Trustees
In connection with the Closing, all officers of the Fund are employees of the New Advisor or its affiliates and, with the exception of the Fund's Chief Compliance Officer, receive no compensation from the Fund. The Board of Trustees has appointed a Chief Compliance Officer to the Fund in accordance with federal securities regulations. The Fund, along with other affiliated funds, pays its pro-rata share of the expenses associated with the Chief Compliance Officer. The Fund's expenses for the Chief Compliance Officer will not exceed $15,000 per year. Prior to the Closing, the Fund paid its pro-rata share of the expenses for the Chief Compliance Officer under the same fee structure.
Trustees are compensated for their services to the Fund, as set forth on the Statement of Operations. The Trust's eligible Trustees may participate in a deferred compensation plan which may be terminated at any time. Obligations of the plan will be paid solely out of the Fund's assets.
Other Related Party Transactions
Prior to the Closing, the Fund used one or more brokers that were affiliates of BOA in connection with the purchase and sale of its securities. Total brokerage commissions paid to affiliated brokers for the period prior to the Closing were $614.
24
Columbia Technology Fund, August 31, 2010
Note 5. Custody Credits
The Fund has an agreement with its custodian bank under which custody fees may be reduced by balance credits. These credits are recorded as part of expense reductions on the Statement of Operations. The Fund could have invested a portion of the assets utilized in connection with the expense offset arrangement in an income-producing asset if it had not entered into such an agreement. For the year ended August 31, 2010, these custody credits reduced total expenses by $1 for the Fund.
Note 6. Portfolio Information
For the year ended August 31, 2010, the cost of purchases and proceeds from sales of securities, excluding short-term obligations, for the Fund were $495,271,231 and $574,943,423, respectively.
Note 7. Line of Credit
The Fund and other affiliated funds participate in a $280,000,000 committed, unsecured revolving line of credit provided by State Street. The maximum amount that may be borrowed by any fund is limited to the lesser of $200,000,000 and the Fund's borrowing limit set forth in the Fund's registration statement. Borrowings are available for short-term liquidity or temporary or emergency purposes.
Effective October 15, 2009, interest is charged to each participating fund based on the fund's borrowings at a rate per annum equal to the greater of the Federal Funds Rate plus 1.25% or the overnight LIBOR Rate plus 1.25%. In addition, a commitment fee of 0.15% per annum is accrued and apportioned among the participating funds pro rata based on their relative net assets.
Prior to October 15, 2009, interest was charged to each participating fund based on the fund's borrowings at a rate per annum equal to the greater of the Federal Funds Rate plus 0.50% or the overnight LIBOR Rate plus 0.50%. In addition, an annual operations agency fee of $20,000, an amendment fee of 0.02% and a commitment fee of 0.12% per annum were accrued and apportioned among the participating funds pro rata based on their relative net assets.
For the year ended August 31, 2010, the average daily loan balance outstanding on days where borrowing existed was $2,310,526 at a weighted average interest rate of 1.25%.
Note 8. Shareholder Concentration
As of August 31, 2010, one shareholder account owned 10.7% of the outstanding shares of the Fund. Purchase and redemption activity of this account may have a significant effect on the operations of the Fund.
Note 9. Significant Risks and Contingencies
Sector Focus Risk
The Fund may focus its investments in certain sectors, subjecting it to greater risk than a fund that is less focused.
Foreign Securities Risk
There are certain additional risks involved when investing in foreign securities. These risks may involve foreign currency exchange rate fluctuations, adverse political and economic developments and the possible prevention of currency exchange or other foreign governmental laws or restrictions. In addition, the liquidity of foreign securities may be more limited than that of domestic securities.
Information Regarding Pending and Settled Legal Proceedings
In June 2004, an action captioned John E. Gallus et al. v. American Express Financial Corp. and American Express Financial Advisors Inc. was filed in the United States District Court for the District of Arizona. The plaintiffs allege that they are investors in several American Express Company (now known as legacy RiverSource) mutual funds and they purport to bring the action derivatively on behalf of those funds under the Investment Company Act of 1940. The plaintiffs allege that fees allegedly paid to the defendants by the funds for investment advisory and administrative services are excessive. The plaintiffs seek remedies including restitution and rescission of investment advisory and distribution agreements. The plaintiffs voluntarily agreed to transfer this case to the United States District Court for the District of Minnesota (the District Court). In response to defendants' motion to dismiss the complaint, the District Court dismissed one of plaintiffs' four claims and granted plaintiffs limited discovery. Defendants moved for summary judgment in April 2007. Summary judgment was granted in the defendants' favor on July 9, 2007. The plaintiffs filed a notice of appeal with the Eighth Circuit Court of Appeals (the Eighth Circuit) on August 8, 2007. On April 8, 2009, the Eighth Circuit reversed summary judgment and remanded to the District Court for
25
Columbia Technology Fund, August 31, 2010
further proceedings. On August 6, 2009, defendants filed a writ of certiorari with the U.S. Supreme Court (the Supreme Court), asking the Supreme Court to stay the District Court proceedings while the Supreme Court considers and rules in a case captioned Jones v. Harris Associates, which involves issues of law similar to those presented in the Gallus case. On March 30, 2010, the Supreme Court issued its ruling in Jones v. Harris Associates, and on April 5, 2010, the Supreme Court vacated the Eighth Circuit's decision in the Gallus case and remanded the case to the Eighth Circuit for further consideration in light of the Supreme Cour t's decision in Jones v. Harris Associates. On June 4, 2010, the Eighth Circuit remanded the Gallus case to the District Court for further consideration in light of the Supreme Court's decision in Jones v. Harris Associates.
In December 2005, without admitting or denying the allegations, American Express Financial Corporation (AEFC, which is now known as Ameriprise Financial, Inc. (Ameriprise Financial)), entered into settlement agreements with the Securities and Exchange Commission (SEC) and Minnesota Department of Commerce (MDOC) related to market timing activities. As a result, AEFC was censured and ordered to cease and desist from committing or causing any violations of certain provisions of the Investment Advisers Act of 1940, the Investment Company Act of 1940, and various Minnesota laws. AEFC agreed to pay disgorgement of $10 million and civil money penalties of $7 million. AEFC also agreed to retain an independent distribution consultant to assist in developing a plan for distribution of all disgorgement and civil penalties ordered by the SEC in accordance with various undertakings detailed at http://www.sec.gov/litigation/admin/ia-2451.pdf. Ameriprise Financial and its affiliates have cooperated with the SEC and the MDOC in these legal proceedings, and have made regular reports to the funds' Boards of Directors/Trustees.
Ameriprise Financial and certain of its affiliates have historically been involved in a number of legal, arbitration and regulatory proceedings, including routine litigation, class actions, and governmental actions, concerning matters arising in connection with the conduct of their business activities. Ameriprise Financial believes that the Funds are not currently the subject of, and that neither Ameriprise Financial nor any of its affiliates are the subject of, any pending legal, arbitration or regulatory proceedings that are likely to have a material adverse effect on the Funds or the ability of Ameriprise Financial or its affiliates to perform under their contracts with the Funds. Ameriprise Financial is required to make 10-Q, 10-K and, as necessary, 8-K filings with the Securities and Exchange Commission on legal and regulatory matters that relate to Ameriprise Financial and its affiliates. Copies of these filings may be obt ained by accessing the SEC website at www.sec.gov.
There can be no assurance that these matters, or the adverse publicity associated with them, will not result in increased fund redemptions, reduced sale of fund shares or other adverse consequences to the Funds. Further, although we believe proceedings are not likely to have a material adverse effect on the Funds or the ability of Ameriprise Financial or its affiliates to perform under their contracts with the Funds, these proceedings are subject to uncertainties and, as such, we are unable to estimate the possible loss or range of loss that may result. An adverse outcome in one or more of these proceedings could result in adverse judgments, settlements, fines, penalties or other relief that could have a material adverse effect on the consolidated financial condition or results of operations of Ameriprise Financial.
Note 10. Subsequent Event
The Board of Trustees has approved in principle the proposed merger of the Fund into Columbia Seligman Global Technology Fund (formerly known as Seligman Global Technology Fund). Shareholders will vote on the proposal at a Special Meeting of Shareholders scheduled to be held during the first half of 2011.
26
Report of Independent Registered Public Accounting Firm
To the Trustees of Columbia Funds Series Trust I and Shareholders of Columbia Technology Fund
In our opinion, the accompanying statement of assets and liabilities, including the investment portfolio, and the related statement of operations and of changes in net assets and the financial highlights present fairly, in all material respects, the financial position of Columbia Technology Fund (the "Fund") (a series of Columbia Funds Series Trust I) at August 31, 2010, the results of its operations for the year then ended, the changes in its net assets for each of the two years in the period then ended, and the financial highlights for each of the five years in the period then ended, in conformity with accounting principles generally accepted in the United States of America. These financial statements and financial highlights (hereafter referred to as "financial statements") are the responsibility of the Fund's management. Our responsibility is to express an opinion on these financial statements based on our audits. We conduct ed our audits of these financial statements in accordance with the standards of the Public Company Accounting Oversight Board (United States). Those standards require that we plan and perform the audit to obtain reasonable assurance about whether the financial statements are free of material misstatement. An audit includes examining, on a test basis, evidence supporting the amounts and disclosures in the financial statements, assessing the accounting principles used and significant estimates made by management, and evaluating the overall financial statement presentation. We believe that our audits, which included confirmation of securities at August 31, 2010 by correspondence with the custodian and brokers, provide a reasonable basis for our opinion.
PricewaterhouseCoopers LLP
Boston, Massachusetts
October 25, 2010
27
Fund Governance
The Trustees serve terms of indefinite duration. The names, addresses and birth years of the Trustees and Officers of the Funds in the Columbia Funds Series Trust I, the year each was first elected or appointed to office, their principal business occupations during at least the last five years, the number of Funds overseen by each Trustee and other directorships they hold are shown below. Each officer listed below serves as an officer of each Fund in the Columbia Funds Complex.
Independent Trustees
Name, Address and Year of Birth,
Position with Funds, Year First
Elected or Appointed to Office | | Principal Occupation(s) During Past Five Years, Number of Funds in Columbia
Funds Complex Overseen by Trustee, Other Directorships Held
| |
| John D. Collins (Born 1938) | |
|
c/o Columbia Management
Investment Advisers, LLC
One Financial Center
Boston, MA 02111
Trustee (since 2005) | | Retired. Consultant, KPMG, LLP (accounting and tax firm) from July 1999 to June 2000; Partner, KPMG, LLP from March 1962 to June 1999. Oversees 64; Mrs. Fields Original Cookies, Inc. (consumer products); Suburban Propane Partners, L.P.; and Montpelier Re (insurance underwriting firm) | |
|
| Rodman L. Drake (Born 1943) | |
|
c/o Columbia Management
Investment Advisers, LLC
One Financial Center
Boston, MA 02111
Trustee (since 1994) and Chairman of the Board (since 2009) | | Co-Founder of Baringo Capital LLC (private equity) since 2002; CEO of Crystal River Capital, Inc. (real estate investment trust) since 2003; President, Continuation Investments Group, Inc. from 1997 to 2001. Oversees 64; Jackson Hewitt Tax Service Inc. (tax preparation services); Crystal Capital River, Inc. (real estate investment trust); Student Loan Corporation (student loan provider); Celgene Corporation (global biotechnology company); and The Helios Funds (exchange-traded funds); Apex Silver Mines Ltd. from 2007 to 2009 | |
|
| Douglas A. Hacker (Born 1955) | |
|
c/o Columbia Management
Investment Advisers, LLC
One Financial Center
Boston, MA 02111
Trustee (since 1996) | | Independent business executive since May 2006; Executive Vice President—Strategy of United Airlines (airline) from December 2002 to May 2006; President of UAL Loyalty Services (airline marketing company) from September 2001 to December 2002; Executive Vice President and Chief Financial Officer of United Airlines from July 1999 to September 2001. Oversees 64; Nash Finch Company (food distributor); Aircastle Limited (aircraft leasing) | |
|
| Janet Langford Kelly (Born 1957) | |
|
c/o Columbia Management
Investment Advisers, LLC
One Financial Center
Boston, MA 02111
Trustee (since 1996) | | Senior Vice President, General Counsel and Corporate Secretary, ConocoPhillips (integrated energy company) since September 2007; Deputy General Counsel—Corporate Legal Services, ConocoPhillips from August 2006 to August 2007; Partner, Zelle, Hofmann, Voelbel, Mason & Gette LLP (law firm) from March 2005 to July 2006; Adjunct Professor of Law, Northwestern University, from September 2004 to June 2006; Director, UAL Corporation (airline) from February 2006 to July 2006; Oversees 64; None | |
|
| Charles R. Nelson (Born 1942) | |
|
c/o Columbia Management
Investment Advisers, LLC
One Financial Center
Boston, MA 02111
Trustee (since 1981) | | Professor of Economics, University of Washington, since January 1976; Ford and Louisa Van Voorhis Professor of Political Economy, University of Washington, since September 1993; Adjunct Professor of Statistics, University of Washington, since September 1980; Associate Editor, Journal of Money Credit and Banking, 1993-2008; Consultant on econometric and statistical matters. Oversees 64; None | |
|
28
Fund Governance (continued)
Independent Trustees (continued)
Name, Address and Year of Birth,
Position with Funds, Year First
Elected or Appointed to Office | | Principal Occupation(s) During Past Five Years, Number of Funds in Columbia
Funds Complex Overseen by Trustee, Other Directorships Held
| |
| John J. Neuhauser (Born 1943) | |
|
c/o Columbia Management
Investment Advisers, LLC
One Financial Center
Boston, MA 02111
Trustee (since 1984) | | President, Saint Michael's College, since August 2007; Director or Trustee of several non-profit organizations, including Fletcher Allen Health Care, Inc.; University Professor, Boston College from November 2005 to August 2007; Academic Vice President and Dean of Faculties, Boston College from August 1999 to October 2005. Oversees 64; Liberty All-Star Equity Fund and Liberty All-Star Growth Fund, Inc. (closed-end funds) | |
|
| Jonathan Piel (Born 1938) | |
|
c/o Columbia Management
Investment Advisers, LLC
One Financial Center
Boston, MA 02111
Trustee (since 1994) | | Cable television producer and website designer; The Editor, Scientific American from 1984 to 1994; Vice President, Scientific American, Inc., from 1984 to 1994; Member, Advisory Board, Stone Age Institute, Bloomington, Indiana (research institute that explores the effect of technology on human evolution); Member, Board of Directors of the National Institute of Social Sciences, New York City; Member, Board of Trustees of the William Alanson White Institute, New York City (institution for training psychoanalysts); and Member, Advisory Board, Mount Sinai Children's Environmental Health Center, New York. Oversees 64; None | |
|
| Patrick J. Simpson (Born 1944) | |
|
c/o Columbia Management
Investment Advisers, LLC
One Financial Center
Boston, MA 02111
Trustee (since 2000) | | Partner, Perkins Coie LLP (law firm). Oversees 64; None | |
|
| Anne-Lee Verville (Born 1945) | |
|
c/o Columbia Management
Investment Advisers, LLC
One Financial Center
Boston, MA 02111
Trustee (since 1998) | | Retired since 1997 (formerly General Manager–Global Education Industry from 1994 to 1997, President–Application Systems Division from 1991 to 1994, Chief Financial Officer–US Marketing & Services from 1988 to 1991, and Chief Information Officer from 1987 to 1988, IBM Corporation (computer and technology)). Oversees 64; Enesco Group, Inc. (producer of giftware and home and garden decor products) from 2001 to 2006 | |
|
29
Fund Governance (continued)
Interested Trustee
Name, Address and Year of Birth,
Position with Funds, Year First
Elected or Appointed to Office | | Principal Occupation(s) During Past Five Years, Number of Funds in Columbia
Funds Complex Overseen by Trustee, Other Directorships Held
| |
| William E. Mayer1 (Born 1940) | |
|
c/o Columbia Management
Investment Advisers, LLC
One Financial Center
Boston, MA 02111
Trustee (since 1994) | | Partner, Park Avenue Equity Partners (private equity) since February 1999; Dean and Professor, College of Business and Management, University of Maryland from 1992 to 1996. Oversees 64; DynaVox Inc. (software developer); Lee Enterprises (print media); WR Hambrecht + Co. (financial service provider); BlackRock Kelso Capital Corporation (investment company) | |
|
1 Mr. Mayer may technically be an "interested person" (as defined in the Investment Company Act of 1940) by reason of his affiliation with WR Hambrecht + Co., a registered broker/dealer that may execute portfolio transactions for, engage in principal transactions with or distribute shares of a Fund or other funds or accounts advised/managed by the Adviser or any sub-adviser to a Fund.
The Statement of Additional Information includes additional information about the Trustees of the Funds and is available, without charge, upon request by calling 1-800-345-6611.
Officers
| Name, Year of Birth and Address | | Principal Occupation(s) During the Past Five Years | |
| J. Kevin Connaughton (Born 1964) | |
|
One Financial Center
Boston, MA 02111
President (since 2009) | | Senior Vice President and General Manager–Mutual Fund Products, Columbia Management Investment Advisers, LLC since May 2010; President, Columbia Funds, since 2009, and RiverSource Funds, since May 2010 (previously Senior Vice President and Chief Financial Officer, Columbia Funds, from June 2008 to January 2009, Treasurer, Columbia Funds, from October 2003 to May 2008, and senior officer of various other affiliated funds since 2000); Managing Director, Columbia Management Advisors, LLC from December 2004 to April 2010. | |
|
| Michael G. Clarke (Born 1969) | |
|
One Financial Center
Boston, MA 02111
Senior Vice President and Chief
Financial Officer (since 2009) | | Vice President, Columbia Management Investment Advisers, LLC since May 2010; Managing Director of Fund Administration, Columbia Management Advisors, LLC, from September 2004 to April 2010; senior officer of Columbia Funds and affiliated funds since 2002. | |
|
| Scott R. Plummer (Born 1959) | |
|
5228 Ameriprise Financial Center
Minneapolis, MN 55474
Senior Vice President, Secretary
and Chief Legal Officer (since 2010) | | Chief Legal Officer and Assistant Secretary, Columbia Management Investment Advisers, LLC since June 2005; Vice President and Lead Chief Counsel–Asset Management, Ameriprise Financial, Inc. since May 2010 (previously Vice President and Chief Counsel–Asset Management, from 2005 to April 2010, and Vice President–Asset Management Compliance from 2004 to 2005); Vice President, Chief Counsel and Assistant Secretary, Columbia Management Investment Distributors, Inc. since 2008; Vice President, General Counsel and Secretary, Ameriprise Certificate Company since 2005; Chief Counsel, RiverSource Distributors, Inc. since 2006; Vice President, General Counsel and Secretary, RiverSource Funds, since December 2006; Senior Vice President, Secretary and Chief Legal Officer, Columbia Funds, since May 2010. | |
|
30
Fund Governance (continued)
Officers (continued)
| Name, Year of Birth and Address | | Principal Occupation(s) During the Past Five Years | |
| Linda J. Wondrack (Born 1964) | |
|
One Financial Center
Boston, MA 02111
Senior Vice President and Chief
Compliance Officer (since 2007) | | Vice President and Chief Compliance Officer, Columbia Management Investment Advisers, LLC since May 2010; Chief Compliance Officer, Columbia Funds, since 2007, and RiverSource Funds, since May 2010; Director (Columbia Management Group, LLC and Investment Product Group Compliance), Bank of America, from June 2005 to April 2010; Director of Corporate Compliance and Conflicts Officer of MFS Investment Management (investment management) from August 2004 to May 2005. | |
|
| William F. Truscott (Born 1960) | |
|
53600 Ameriprise Financial Center
Minneapolis, MN 55474
Senior Vice President (since 2010) | | Chairman of the Board, Columbia Management Investment Advisers, LLC since May 2010 (previously President, Chairman of the Board and Chief Investment Officer, from 2001 to April 2010); Chief Executive Officer, U.S. Asset Management & President, Annuities, Ameriprise Financial, Inc. since May 2010 (previously President–U.S. Asset Management and Chief Investment Officer from 2005 to April 2010, and Senior Vice President—Chief Investment Officer, from 2001 to 2005); Director, President and Chief Executive Officer, Ameriprise Certificate Company since 2006; Director, Columbia Management Investment Distributors, Inc. since May 2010 (previously Chairman of the Board and Chief Executive Officer from 2008 to April 2010); Chairman of the Board and Chief Executive Officer, RiverSource Distributors, Inc. since 2006. | |
|
| Colin Moore (Born 1958) | |
|
One Financial Center
Boston, MA 02111
Senior Vice President (since 2010) | | Director and Chief Investment Officer, Columbia Management Investment Advisers, LLC since May 2010; Manager, Managing Director and Chief Investment Officer of Columbia Management Advisors, LLC from 2007 to April 2010; Head of Equities, Columbia Management Advisors, LLC from 2002 to 2007. | |
|
| Michael A. Jones (Born 1959) | |
|
100 Federal Street
Boston, MA 02110
Senior Vice President (since 2010) | | Director and President, Columbia Management Investment Advisers, LLC since May 2010; President and Director, Columbia Management Investment Distributors, Inc. since May 2010; Manager, Chairman, Chief Executive Officer and President, Columbia Management Advisors, LLC from 2007 to April 2010; Chief Executive Officer, President and Director, Columbia Management Distributors, Inc. from November 2006 to April 2010; previously, co-president and senior managing director at Robeco Investment Management. | |
|
| Amy Johnson (Born 1965) | |
|
5228 Ameriprise Financial Center
Minneapolis, MN 55474
Senior Vice President (since 2010) | | Senior Vice President and Chief Operating Officer, Columbia Management Investment Advisers, LLC since May 2010 (previously Chief Administrative Officer, from 2009 until April 2010, Vice President—Asset Management and Trust Company Services, from 2006 to 2009, and Vice President—Operations and Compliance from 2004 to 2006). | |
|
| Joseph F. DiMaria (Born 1968) | |
|
One Financial Center
Boston, MA 02111
Treasurer (since 2009) and
Chief Accounting Officer (since 2008) | | Vice President, Mutual Fund Administration, Columbia Management Investment Advisers, LLC, since May 2010; Director of Fund Administration, Columbia Management Advisors, LLC from January 2006 to April 2010; Head of Tax/Compliance and Assistant Treasurer, Columbia Management Advisors, LLC, from November 2004 to December 2005. | |
|
31
Fund Governance (continued)
Officers (continued)
| Name, Year of Birth and Address | | Principal Occupation(s) During the Past Five Years | |
| Marybeth Pilat (Born 1968) | |
|
One Financial Center
Boston, MA 02111
Deputy Treasurer (since 2010) | | Vice President, Mutual Fund Administration, Columbia Management Investment Advisers, LLC, since May 2010; Vice President, Investment Operations, Bank of America, from October 2008 to April 2010; Finance Manager, Boston Children's Hospital from August 2008 to October 2008; Director, Mutual Fund Administration, Columbia Management Advisors, LLC, from May 2007 to July 2008; Vice President, Mutual Fund Valuation, Columbia Management Advisors, LLC, from January 2006 to May 2007; Vice President, Mutual Fund Accounting Oversight, Columbia Management Advisors, LLC from January 2005 to January 2006. | |
|
| Julian Quero (Born 1967) | |
|
One Financial Center
Boston, MA 02111
Deputy Treasurer (since 2008) | | Vice President, Mutual Fund Administration, Columbia Management Investment Advisers, LLC since May 2010; Director of Fund Administration, Columbia Management Advisors, LLC, from August 2008 to April 2010; Senior Tax Manager, Columbia Management Advisors, LLC from August 2006 to July 2008; Senior Compliance Manager, Columbia Management Advisors, LLC from April 2002 to August 2006. | |
|
| Stephen T. Welsh (Born 1957) | |
|
One Financial Center
Boston, MA 02111
Vice President (since 2006) | | President and Director, Columbia Management Investment Services Corp. since May 2010; President and Director, Columbia Management Services, Inc. from July 2004 to April 2010; Managing Director, Columbia Management Distributors, Inc. from August 2007 to April 2010. | |
|
32
Summary of Management Fee Evaluation by Independent Fee Consultant (RiverSource Investments, LLC)
EXCERPT FROM REPORT OF INDEPENDENT FEE CONSULTANT TO THE FUNDS SUPERVISED BY THE COLUMBIA ATLANTIC BOARD
Prepared Pursuant to the February 9, 2005
Assurance of Discontinuance among the
Office of Attorney General of New York State,
Columbia Management Advisors, LLC, and
Columbia Management Distributors, Inc.
December 21, 2009
I. Overview
On February 9, 2005, Columbia Management Advisors, LLC ("CMA") and Columbia Management Distributors, Inc.1 ("CMD") agreed to the New York Attorney General's Assurance of Discontinuance ("AOD"). Among other things, the AOD stipulates that CMA may manage or advise a Columbia Fund ("Columbia Fund" and, together with some or all of such funds, the "Columbia Funds") only if the Independent Members of the Columbia Fund's Board of Trustees appoint a Senior Officer or retain an Independent Fee Consultant ("IFC") who is to manage the process by which proposed management fees are negotiated. The AOD further stipulates that the Senior Officer or IFC is to prepare a written annual evaluation of the fee negotiation process.
With effect from January 1, 2007, the Independent Members of the Board of Trustees for certain Columbia Funds known collectively as the "Atlantic Funds" (together with the other members of that Board, the "Trustees") retained me as IFC for the Atlantic Funds.2 In this capacity, I have prepared this written evaluation of the fee negotiation process. As was the case with the last three annual reports, my immediate predecessor as IFC, John Rea, provided invaluable assistance in the preparation of this report.
On September 29, 2009, Ameriprise entered into an asset purchase agreement with Bank of America, N.A. and its parent, Bank of America Corporation (together, the "Bank") pursuant to which the Bank agreed to sell certain CMG assets relating to Columbia's long-term asset management business, including management of the Atlantic Funds (the "Transaction").3 The Transaction if completed would result in the termination of the existing Investment Management Agreements with CMA. Therefore, the Trustees have been requested to approve and recommend to the shareholders of each Atlantic Fund new Investment Management and Sub-Advisory Agreements (together, the "Management Agreements") with RiverSource Investments, LLC ("RI"),4 investment manager of the RiverSource Funds and a subsidiary of Ameriprise. This report is intended to fulfill the requirements of the AOD with respect to the Trustees' consideration of the new Man agement Agreements.
A. Role of the Independent Fee Consultant
The AOD charges the IFC with "managing the process by which proposed management fees ... to be charged the Columbia Fund are negotiated so that they are negotiated in a manner which is at arms' length and reasonable and consistent with this Assurance of Discontinuance." The AOD also provides that CMA "may manage or advise a Columbia Fund only if the reasonableness of the proposed management fees is determined by the Board of Trustees ... using ... an annual independent written evaluation prepared by or under the direction of ... the Independent Fee Consultant." Therefore, the AOD makes clear that the IFC does not supplant the Trustees in negotiating management fees with CMA (or RI), nor does the IFC substitute his or her judgment for that of the Trustees with respect to the reasonableness of proposed fees or any other matter that is committed to the business judgment of the Trustees.
B. Elements Involved in Managing the Fee Negotiation Process
In preparing the report required by the AOD, the IFC must consider at least the following six factors set forth in the AOD:
1. The nature and quality of the adviser's services, including the Fund's performance;
1 CMA and CMD are subsidiaries of Columbia Management Group, LLC ("CMG"), and are the successors to the entities named in the AOD.
2 I have no material relationship with Bank of America, CMG or Ameriprise Financial, Inc. ("Ameriprise"), aside from serving as IFC, and I am aware of no material relationship with any of their affiliates. I retained John Rea, an independent economic consultant, to assist me with this report.
Unless otherwise stated or required by the context, this report covers only the Atlantic Funds.
3 Preliminary Response of Ameriprise to Information Request of Columbia Atlantic Board dated October 21, 2009 (hereafter, the "Preliminary Response"), p. 1. The one money market Atlantic Fund, Money Market Fund VS, was included in the Transaction because it was an integral part of CMG's array of Funds used as investment vehicles by variable annuity and similar insurance products.
4 Ameriprise intends to re-brand RI with the "Columbia" name (which is one of the assets being sold in the Transaction). Preliminary Response, pp. 4-5. In the case of new Sub-Advisory Agreements, the current sub-adviser would also be a party.
33
2. Management fees (including any components thereof) charged by other mutual fund companies for like services;
3. Possible economies of scale as the Fund grows larger;
4. Management fees (including any components thereof) charged to institutional and other clients of the adviser for like services;
5. Costs to the adviser and its affiliates of supplying services pursuant to the management fee agreements, excluding any intra-corporate profit; and
6. Profit margins of the adviser and its affiliates from supplying such services.
C. Data Presented to the Trustees
In considering the proposed new Management Agreements with RI, the Trustees relied in part on the data that had been prepared as part of their annual contract review process, which concluded in late October. This data remained relevant because the fees in the proposed Management Agreements were identical to the fees approved at that time. The annual review materials included a Lipper report on the performance of each Atlantic Fund compared to its peers and its benchmark, comparisons of the fees and expenses of each Atlantic Fund to similar CMG-sponsored Funds, comparable competitive funds chosen by Lipper, and institutional accounts advised by CMA, revenues, expenses, and profits of CMG from managing the Atlantic Funds, calculated both by Fund and collectively, and CMG's views on the existence and sharing of economies of scale.
In addition, the Trustees reviewed materials specific to the proposed new Management Agreements with RI in response to requests for information made on behalf of the Trustees, including the following:
• Performance data for the RiverSource Funds showing percentile and quartile rankings of each fund within its Lipper performance universe for periods up to five years and net returns of each fund relative to its benchmark returns. This data was arguably relevant due to the possibility that some RiverSource investment teams would be providing investment management services to certain Columbia Funds.5
• tables comparing the fee schedules and effective fee rates of funds managed by CMA and RI and institutional accounts advised by the two firms.
• extensive discussion of the process by which the various components of the two asset management businesses would be integrated including investment management, compliance, transfer agency, custody, fund accounting, and distribution.
• information about the financial condition of Ameriprise, including its most recent annual report on Form 10-K, RI's profit margins from managing the RiverSource Funds in 2007 and 2008, and pro forma income statements for the combined Columbia and RiverSource fund complex.
• disclosure that certain senior CMG executives, including President Michael Jones, Chief Investment Officer Colin Moore, Head of Mutual Funds J. Kevin Connaughton, and Chief Compliance Officer Linda Wondrack would continue in analogous capacities following the consummation of the Transaction, and
• a breakdown of the synergies RI expects to realize in the two years following the Transaction and the extent to which those potential synergies are expected to be shared with shareholders of funds advised by RI.
II. Findings
1. Based upon my examination of the information supplied by CMG and Ameriprise in the light of the six factors set forth in the AOD, I conclude that the Trustees have the relevant information necessary to evaluate the reasonableness of the proposed management fees for each Atlantic Fund.
2. In my view, the process by which the proposed management fees of the Atlantic Funds have been negotiated with RI thus far has been, to the extent practicable, at arms' length and reasonable and consistent with the AOD.
Respectfully submitted,
Steven E. Asher
5 On page 20 of its Supplemental Response to the Atlantic Trustees (undated but delivered November 24, 2009), Ameriprise said that "most personnel decisions, including with respect to the portfolio management teams for the Atlantic Funds . . . will be made primarily by [current CMA CIO] Colin Moore using the Columbia 5P process."
34
Shareholder Meeting Results
Columbia Technology Fund
On March 3, 2010, a special meeting of shareholders of Columbia Funds Series Trust I was held to consider the approval of several proposals listed in the proxy statement for the meeting. The proposals were voted on at an adjourned meeting of shareholders held on March 31, 2010. The shareholder meeting results are as follows:
Proposal 1: A proposed Investment Management Services Agreement with Columbia Management Investment Advisers, LLC (formerly, RiverSource Investments, LLC) (CMIA) was approved as follows:
| Votes For | | Votes Against | | Abstentions | | Broker Non-Votes | |
| | 114,432,045 | | | | 19,526,616 | | | | 3,477,738 | | | | 23,057,672 | | |
Proposal 2: A proposal authorizing CMIA to enter into and materially amend subadvisory agreements for the Fund in the future, with the approval of the Trust's Board of Trustees, but without obtaining additional shareholder approval, was approved as follows:
| Votes For | | Votes Against | | Abstentions | | Broker Non-Votes | |
| | 108,948,769 | | | | 25,313,870 | | | | 3,170,710 | | | | 23,057,722 | | |
Proposal 3: Each of the nominees for trustees was elected to the Trust's Board of Trustees, as follows:
| Trustee | | Votes For | | Votes Withheld | | Abstentions | |
| John D. Collins | | | 30,977,072,412 | | | | 859,827,038 | | | | 0 | | |
| Rodman L. Drake | | | 30,951,179,004 | | | | 885,720,446 | | | | 0 | | |
| Douglas A. Hacker | | | 30,989,793,279 | | | | 847,106,171 | | | | 0 | | |
| Janet Langford Kelly | | | 30,999,020,814 | | | | 837,878,636 | | | | 0 | | |
| William E. Mayer | | | 16,291,139,483 | | | | 15,545,759,967 | | | | 0 | | |
| Charles R. Nelson | | | 30,997,700,700 | | | | 839,198,750 | | | | 0 | | |
| John J. Neuhauser | | | 30,988,095,661 | | | | 848,803,789 | | | | 0 | | |
| Jonathon Piel | | | 30,968,801,048 | | | | 868,098,402 | | | | 0 | | |
| Patrick J. Simpson | | | 30,999,065,030 | | | | 837,834,420 | | | | 0 | | |
| Anne-Lee Verville | | | 30,996,227,913 | | | | 840,671,537 | | | | 0 | | |
35
This page intentionally left blank.
Important Information About This Report
The fund mails one shareholder report to each shareholder address. If you would like more than one report, please call shareholder services at 1-800-345-6611 and additional reports will be sent to you. This report has been prepared for shareholders of Columbia Technology Fund.
A description of the policies and procedures that the fund uses to determine how to vote proxies and a copy of the fund's voting records are available (i) at www.columbiamanagement.com, (ii) on the Securities and Exchange Commission's website at www.sec.gov, and (iii) without charge, upon request, by calling 1-800-368-0346. Information regarding how the fund voted proxies relating to portfolio securities during the 12-month period ended June 30 is available from the SEC's website. Information regarding how the fund voted proxies relating to portfolio securities is also available from the fund's website, www.columbiamanagement.com.
The fund files a complete schedule of portfolio holdings with the SEC for the first and third quarters of each fiscal year on Form N-Q. The fund's Form N-Q is available on the SEC's website at www.sec.gov and may be reviewed and copied at the SEC's Public Reference Room in Washington, D.C. Information on the operation of the Public Reference Room may be obtained by calling 1-800-SEC-0330.
Transfer Agent
Columbia Management Investment
Services Corp.
P.O. Box 8081
Boston, MA 02266-8081
1-800-345-6611
Distributor
Columbia Management Investment
Distributors, Inc.
One Financial Center
Boston, MA 02111
Investment Advisor
Columbia Management Investment Advisers, LLC
100 Federal Street
Boston, MA 02110
37

PRSRT STD
U.S. Postage
PAID
Holliston, MA
Permit NO. 20
Columbia Technology Fund
P. O. Box 8081
Boston, MA 02266-8081
columbiamanagement.com
This information is for use with concurrent or prior delivery of a fund prospectus. Investors should consider the investment objectives, risks, charges and expenses of a mutual fund carefully before investing. For a free prospectus, which contains this and other important information about the funds, visit columbiamanagement.com. Read the prospectus carefully before investing. The Fund is distributed by Columbia Management Investment Distributors, Inc., member FINRA, and managed by Columbia Management Investment Advisers, LLC.
© 2010 Columbia Management Investment Advisers, LLC. All rights reserved.
C-1646 A (10/10)

Columbia Balanced Fund
Annual Report for the Period Ended August 31, 2010
Not FDIC insured • No bank guarantee • May lose value
Table of Contents
| Fund Profile | | | 1 | | |
|
| Economic Update | | | 2 | | |
|
| Performance Information | | | 4 | | |
|
| Understanding Your Expenses | | | 5 | | |
|
| Portfolio Managers' Report | | | 6 | | |
|
| Investment Portfolio | | | 8 | | |
|
Statement of Assets and
Liabilities | | | 20 | | |
|
| Statement of Operations | | | 22 | | |
|
Statement of Changes in
Net Assets | | | 23 | | |
|
| Financial Highlights | | | 25 | | |
|
| Notes to Financial Statements | | | 29 | | |
|
Report of Independent Registered
Public Accounting Firm | | | 39 | | |
|
| Federal Income Tax Information | | | 40 | | |
|
| Fund Governance | | | 41 | | |
|
Summary of Management Fee
Evaluation by Independent Fee
Consultant (RiverSource
Investment, LLC) | | | 46 | | |
|
| Shareholder Meeting Results | | | 48 | | |
|
Important Information About
This Report | | | 49 | | |
|
The views expressed in this report reflect the current views of the respective parties. These views are not guarantees of future performance and involve certain risks, uncertainties and assumptions that are difficult to predict, so actual outcomes and results may differ significantly from the views expressed. These views are subject to change at any time based upon economic, market or other conditions and the respective parties disclaim any responsibility to update such views. These views may not be relied on as investment advice and, because investment decisions for a Columbia Fund are based on numerous factors, may not be relied on as an indication of trading intent on behalf of any particular Columbia Fund. References to specific securities should not be construed as a recommendation or investment advice.
President's Message

Dear Shareholder:
The Columbia Management story began over 100 years ago, and today, we are one of the nation's largest dedicated asset managers. The recent acquisition by Ameriprise Financial, Inc. brings together the talents, resources and capabilities of Columbia Management with those of RiverSource Investments, Threadneedle (acquired by Ameriprise in 2003) and Seligman Investments (acquired by Ameriprise in 2008) to build a best-in-class asset management business that we believe is truly greater than its parts.
RiverSource Investments traces its roots to 1894 when its then newly-founded predecessor, Investors Syndicate, offered a face-amount savings certificate that gave small investors the opportunity to build a safe and secure fund for retirement, education or other special needs. A mutual fund pioneer, Investors Syndicate launched Investors Mutual Fund in 1940. In the decades that followed, its mutual fund products and services lineup grew to include a full spectrum of styles and specialties. More than 110 years later, RiverSource continues to be a trusted financial products leader.
Threadneedle, a leader in global asset management and one of Europe's largest asset managers, offers sophisticated international experience from a dedicated U.K. management team. Headquartered in London, it is named for Threadneedle Street in the heart of the city's financial district, where British investors pioneered international and global investing. Threadneedle was acquired in 2003 and today operates as an affiliate of Columbia Management.
Seligman Investments' beginnings date back to the establishment of the investment firm J. & W. Seligman & Co. in 1864. In the years that followed, Seligman played a major role in the geographical expansion and industrial development of the United States. In 1874, President Ulysses S. Grant named Seligman as fiscal agent for the U.S. Navy—an appointment that would last through World War I. Seligman helped finance the westward path of the railroads and the building of the Panama Canal. The firm organized its first investment company in 1929 and began managing its first mutual fund in 1930. In 2008, J. & W. Seligman & Co. Incorporated was acquired and Seligman Investments became an offering brand of RiverSource Investments, LLC.
We are proud of the rich and distinctive history of these firms, the strength and breadth of products and services they offer, and the combined cultures of pioneering spirit and forward thinking. Together we are committed to providing more for our shareholders than ever before.
> A singular focus on our shareholders
Our business is asset management, so investors are our first priority. We dedicate our resources to identifying timely investment opportunities and provide a comprehensive choice of equity, fixed-income and alternative investments to help meet your individual needs.
> First-class research and thought leadership
We are dedicated to helping you take advantage of today's opportunities and anticipate tomorrow's. We stay abreast of the latest investment trends and ideas, using our collective insight to evaluate events and transform them into solutions you can use.
> A disciplined investment approach
We aren't distracted by passing fads. Our teams adhere to a rigorous investment process that helps ensure the integrity of our products and enables you and your financial advisor to match our solutions to your objectives with confidence.
When you choose Columbia Management, you can be confident that we will take the time to understand your needs and help you and your financial advisor identify the solutions that are right for you. Because at Columbia Management, we don't consider ourselves successful unless you are.
Sincerely,

J. Kevin Connaughton
President, Columbia Funds
Investors should consider the investment objectives, risks, charges and expenses of a mutual fund carefully before investing. For a free prospectus, which contains this and other important information about the funds, visit columbiamanagement.com. The prospectus should be read carefully before investing.
Columbia Funds are distributed by Columbia Management Investment Distributors, Inc., member FINRA, and managed by Columbia Management Investment Advisers, LLC.
© 2010 Columbia Management Investment Advisers, LLC. All rights reserved.
Fund Profile – Columbia Balanced Fund
Summary
g For the 12-month period that ended August 31, 2010, the fund's class A shares returned 5.33% without sales charge.
g Modest economic growth and falling interest rates helped bonds outperform stocks by several percentage points for the period.
g The fund's equity results were a modest disappointment for the period and resulted in slight underperformance versus the benchmark and peer group.
Portfolio Management
Guy W. Pope is responsible for selecting the securities within the equity portion of the fund. Leonard A. Aplet, Brian Lavin and Ronald B. Stahl are jointly responsible for determining the sector emphasis and securities within the fixed income allocation of the fund.
Guy W. Pope has co-managed the fund since 1997 and has been associated with the advisor since May 2010. Prior to joining the advisor, Mr. Pope was associated with the fund's previous advisor or its predecessors since 1993.
Leonard A. Aplet has co-managed the fund since October 1991 and has been associated with the advisor since May 2010. Prior to joining the advisor, Mr. Aplet was associated with the fund's previous advisor or its predecessors since 1987.
Brian Lavin has co-managed the fund since May 2010 and has been associated with the advisor since 1994.
Ronald B. Stahl has co-managed the fund since March 2005 and has been associated with the advisor since May 2010. Prior to joining the advisor, Mr. Stahl was associated with the fund's previous advisor or its predecessors since 1998.
Effective May 1, 2010, RiverSource Investments, LLC, a subsidiary of Ameriprise Financial, Inc., became the investment advisor to the fund and changed its name to Columbia Management Investment Advisers, LLC. Please see the fund's prospectus, as supplemented, for more information regarding the change in investment advisor and certain other changes.
1The Standard & Poor's (S&P) 500 Index tracks the performance of 500 widely held, large-capitalization U.S. stocks.
2The Barclays Capital Aggregate Bond Index is a market value-weighted index that tracks the daily price, coupon, pay-downs and total return performance of fixed-rate, publicly placed, dollar-denominated and non-convertible investment grade debt issues with at least $250 million par amount outstanding and with at least one year to final maturity.
Indices are not available for investment, are not professionally managed and do not reflect sales charges, fees, brokerage commissions, taxes or other expenses of investing. Securities in the fund may not match those in an index.
Performance data quoted represents past performance and current performance may be lower or higher. Past performance is no guarantee of future results. The investment return and principal value will fluctuate so that shares, when redeemed, may be worth more or less than the original cost. Please visit www.columbiamanagement.com for daily and most recent month-end performance updates.
Summary
1-year return as of 08/31/2010
| | +5.33% | |
|
| |  | | | Class A shares
(without sales charge) | |
|
| | +4.91% | |
|
| |  | | | S&P 500 Index1 | |
|
| | +9.18% | |
|
| |  | | | Barclays Capital
Aggregate Bond Index2 | |
|
1
Economic Update – Columbia Balanced Fund
Summary
For the 12-month period that ended August 31, 2010
g The U.S. stock market, as measured by the S&P 500 Index, delivered positive returns, despite a correction in the last months of the period. Emerging market stocks, as measured by the MSCI Emerging Markets Index (Net), outperformed U.S. stocks as well as stock markets in developed foreign markets.
| S&P Index | | MSCI Index | |
|
 | |  | |
|
g Modest economic growth and relatively low interest rates boosted bond market returns. The Barclays Capital Aggregate Bond Index delivered solid results. High-yield bonds outperformed stocks, as measured by the JPMorgan Developed BB High Yield Index.
Barclays
Aggregate Index | | JPMorgan
Index | |
|
 | |  | |
|
Although it has been more than a year since U.S. economic growth turned positive, the economy continues to send mixed signals about the sustainability of this recovery. Economic growth, as measured by gross domestic product (GDP), was a solid 5.0% in the last quarter of 2009. However, it was 3.7% in the first quarter of 2010 and only 1.7% in the second quarter. Expectations are for continued lackluster growth through the end of the year, as government incentive programs have ended and stimulus spending winds down. Even so, it appears to be unlikely that the U.S. economy will sink back into recession as many key indicators remain positive.
Consumer spending on cars, clothing and other goods increased throughout the year, although the pace of increased spending was small. Personal income also moved higher. Consumer confidence, as measured by the Conference Board Consumer Confidence Index, gained ground in the first half of 2010. However, the index fell sharply in June and July before stabilizing in August. Consumers surveyed in the last three months of the reporting period indicated they were concerned about business conditions and job prospects and generally apprehensive about the future.
The housing market—another bellwether for the consumer sector—showed few positive signs. Both new and existing home sales fell in the final months of the period as a federal tax credit for new and repeat homebuyers expired. Distressed properties continued to pressure prices and a huge backlog of foreclosed homes is likely to continue to keep a lid on prices for some time. The national median price of existing homes rose slightly over the one-year period, while the national median price of new homes declined. Despite near-record low mortgage rates, the inventory of unsold homes rose to a 12.5 month supply, up sharply at the end of the period. The long-term average is on the order of six months.
News on the job front was mostly positive in 2010, but the number of new jobs added to the economy fell short of expectations. A good portion of the jobs added in March, April and May were temporary, government-sponsored census positions, which began to unwind in June, July and August. Private sector job growth was disappointing given the stage of economic recovery. Nevertheless, private sector payroll employment trended modestly higher in the summer and news of massive layoffs declined.
Reports from the business side of the economy were generally positive. A key measure of the nation's manufacturing situation—the Institute for Supply Management's Index—was generally positive, although the index trended slightly downward in the final months of the period. Industrial production moved higher, as did the amount of manufacturing capacity utilized—a key measure of the health of the manufacturing sector.
Stock rally interrupted
Against a strengthening economic backdrop, a stock market rally that began early in 2009 continued into the spring of 2010. However, a debt crisis brewing in Europe raised concerns among U.S. investors, as did mixed signals on the economy, and some of the stock market's earlier gains vanished during the early summer. The S&P 500 Index returned 4.91% for the 12-month period. Outside the United States, stock market
2
Economic Update (continued) – Columbia Balanced Fund
returns were mixed. The MSCI EAFE Index (Net),1 a broad gauge of stock market performance in foreign developed markets, returned negative 2.34% (net of dividends, in U.S. dollars) for the period, as concerns about the impact of a bailout for weak eurozone economies weighed on the markets. Emerging stock markets were more resilient. The MSCI Emerging Markets Index (Net)2 returned 18.02% (in U.S. dollars) for the 12-month period.
Bonds delivered solid returns
As the economy strengthened, bonds delivered solid returns. The Barclays Capital Aggregate Bond Index returned 9.18%. Municipal bonds gained almost as much as taxable investment-grade bonds, even without factoring in potential tax advantages to investors in higher income-tax brackets. The Barclays Capital 3-15 Year Blend Municipal Bond Index3 returned 8.95%. The high-yield bond market outpaced stocks during the period by a margin of more than three to one. For the 12 months covered by this report, the JPMorgan Developed BB High Yield Index4 returned 17.68% while the S&P 500 Index returned 4.91%. Even the Treasury market was positive as the yield on the 10-year U.S. Treasury, a common bellwether for the bond market, fell nearly one full percentage point, from 3.4% to 2.5% over the 12-month period. Despite the pickup in economic activity, the Federal Reserve Board (the Fed) kept a key short-term interest rate—the federal funds rate—close to zero.
Past performance is no guarantee of future results.
1The Morgan Stanley Capital International Europe, Australasia, Far East (MSCI EAFE) Index (Net) is a free float-adjusted market capitalization index that is designed to measure the equity market performance of developed markets, excluding the U.S. & Canada. As of May 27, 2010 the MSCI EAFE Index (Net) consisted of the following 22 developed market country indices: Australia, Austria, Belgium, Denmark, Finland, France, Germany, Greece, Hong Kong, Ireland, Israel, Italy, Japan, the Netherlands, New Zealand, Norway, Portugal, Singapore, Spain, Sweden, Switzerland, and the United Kingdom.
2The Morgan Stanley Capital International Emerging Markets (MSCI EM) Index (Net) is a free float-adjusted market capitalization index that is designed to measure equity market performance of emerging markets. As of May 27, 2010, the MSCI Emerging Markets Index consisted of the following 21 emerging market country indices: Brazil, Chile, China, Colombia, Czech Republic, Egypt, Hungary, India, Indonesia, Korea, Malaysia, Mexico, Morocco, Peru, Philippines, Poland, Russia, South Africa, Taiwan, Thailand, and Turkey.
3The Barclays Capital 3-15 Year Blend Municipal Bond Index tracks the performance of municipal bonds issued after December 31, 1990 with remaining maturities between 2 and 17 years and at least $7 million in principal amount outstanding.
4The JPMorgan Developed BB High Yield Index is an unmanaged index designed to mirror the investable universe of the U.S. dollar developed, BB-rated, high yield corporate debt market.
Indices are not available for investment, are not professionally managed and do not reflect sales charges, fees, brokerage commissions, taxes or other expenses of investing. Securities in the fund may not match those in an index.
3
Performance Information – Columbia Balanced Fund
Performance data quoted represents past performance and current performance may be lower or higher. Past performance is no guarantee of future results. The investment return and principal value will fluctuate so that shares, when redeemed, may be worth more or less than the original cost. Please visit www.columbiamanagement.com for daily and most recent month-end performance updates.
Annual operating expense ratio (%)*
| Class A | | | 1.04 | | |
| Class B | | | 1.79 | | |
| Class C | | | 1.79 | | |
| Class Z | | | 0.82 | | |
* The annual operating expense ratio is as stated in the fund's prospectus that is current as of the date of this report. Differences in expense ratios disclosed elsewhere in this report may result from the inclusion of fee waivers and expense reimbursements as well as the use of different time periods to calculate the ratios.
Performance of a $10,000 investment 09/01/00 – 08/31/10
The chart above shows the change in value of a hypothetical $10,000 investment in Class A shares of Columbia Balanced Fund during the stated time period, and does not reflect the deduction of taxes that a shareholder may pay on fund distributions or on the redemption of fund shares.
Performance of a $10,000 investment 09/01/00 – 08/31/10 ($)
| Sales charge | | without | | with | |
| Class A | | | 11,446 | | | | 10,789 | | |
| Class B | | | 10,788 | | | | 10,788 | | |
| Class C | | | 10,788 | | | | 10,788 | | |
| Class Z | | | 11,703 | | | | n/a | | |
Average annual total return as of 08/31/10 (%)
| Share class | | A | | B | | C | | Z | |
| Inception | | 11/01/02 | | 11/01/02 | | 10/13/03 | | 10/01/91 | |
| Sales charge | | without | | with | | without | | with | | without | | with | | without | |
| 1-year | | | 5.33 | | | | –0.73 | | | | 4.56 | | | | –0.44 | | | | 4.51 | | | | 3.51 | | | | 5.64 | | |
| 5-year | | | 3.60 | | | | 2.38 | | | | 2.81 | | | | 2.45 | | | | 2.81 | | | | 2.81 | | | | 3.85 | | |
| 10-year | | | 1.36 | | | | 0.76 | | | | 0.76 | | | | 0.76 | | | | 0.76 | | | | 0.76 | | | | 1.59 | | |
Average annual total return as of 09/30/10 (%)
| Share class | | A | | B | | C | | Z | |
| Sales charge | | without | | with | | without | | with | | without | | with | | without | |
| 1-year | | | 8.01 | | | | 1.80 | | | | 7.22 | | | | 2.22 | | | | 7.22 | | | | 6.22 | | | | 8.34 | | |
| 5-year | | | 4.82 | | | | 3.59 | | | | 4.03 | | | | 3.68 | | | | 4.03 | | | | 4.03 | | | | 5.08 | | |
| 10-year | | | 2.40 | | | | 1.80 | | | | 1.79 | | | | 1.79 | | | | 1.79 | | | | 1.79 | | | | 2.63 | | |
The "with sales charge" returns include the maximum initial sales charge of 5.75% for Class A shares and the applicable contingent deferred sales charge of 5.00% in the first year, declining to 1.00% in the sixth year, and eliminated thereafter for Class B shares and 1.00% for Class C shares in the first year only. The "without sales charge" returns do not include the effect of sales charges. If they had, returns would be lower.
Performance results reflect any fee waivers or reimbursements of fund expenses by the investment advisor and/or any of its affiliates. Absent these fee waivers or expense reimbursement arrangements, performance results would have been lower.
All results shown assume reinvestment of distributions. Class Z shares are sold at net asset value with no distribution and service (Rule 12b-1) fees. Class Z shares have limited eligibility and the investment minimum requirements may vary. Please see the fund's prospectus for details. Performance for different share classes will vary based on differences in sales charges and fees associated with each class.
The tables do not reflect the deduction of taxes that a shareholder may pay on fund distributions or on the redemption of fund shares.
Class A, Class B and Class C are newer classes of shares. Class A and Class B share performance information includes the performance of Class Z shares (the oldest existing share class) for periods prior to their inception. Class C share performance information includes returns of Class B shares for the period from November 1, 2002 through October 12, 2003, and the returns of Class Z shares for periods prior thereto. These returns reflect differences in sales charges, but have not been restated to reflect any differences in expenses (such as distribution and service (Rule 12b-1) fees) between Class Z shares and the newer classes of shares. If differences in expenses had been reflected, the returns shown for periods prior to the inception of the newer classes of shares would have been lower, since the newer classes of shares are subject to distribution and service (Rule 12b-1) fees. Class A and Class B shares were initially offere d on November 1, 2002, Class C shares were initially offered on October 13, 2003 and Class Z shares were initially offered on October 1, 1991.
4
Understanding Your Expenses – Columbia Balanced Fund
As a fund shareholder, you incur two types of costs. There are transaction costs, which generally include sales charges on purchases and may include redemption fees or exchange fees. There are also ongoing costs, which generally include investment advisory fees, distribution and service (Rule 12b-1) fees and other fund expenses. The information on this page is intended to help you understand the ongoing costs of investing in the fund and to compare these costs with the ongoing costs of investing in other mutual funds.
Analyzing your fund's expenses by share class
To illustrate these ongoing costs, we have provided an example and calculated the expenses paid by investors in each share class during the period. The information in the following table is based on an initial investment of $1,000, which is invested at the beginning of the period and held for the entire period. Expense information is calculated two ways and each method provides you with different information. The amount listed in the "Actual" column is calculated using the fund's actual operating expenses and total return for the period. The amount listed in the "Hypothetical" column for each share class assumes that the return each year is 5% before expenses and is calculated based on the fund's actual operating expenses. You should not use the hypothetical account values and expenses to estimate either your actual account balance at the end of the period or the expenses you paid during this period.
Compare with other funds
Since all mutual funds are required to include the same hypothetical calculations about expenses in shareholder reports, you can use this information to compare the ongoing cost of investing in the fund with other funds. To do so, compare the 5% hypothetical example with the 5% hypothetical examples that appear in the shareholder reports of other funds. As you compare hypothetical examples of other funds, it is important to note that hypothetical examples are meant to highlight the ongoing costs of investing in a fund and do not reflect any transaction costs, such as sales charges, redemption fees or exchange fees.
Estimating your actual expenses
To estimate the expenses that you paid over the period, first you will need your account balance at the end of the period:
g For shareholders who receive their account statements from Columbia Management Investment Services Corp., your account balance is available online at www.columbiamanagement.com or by calling Shareholder Services at 800.345.6611.
g For shareholders who receive their account statements from their financial intermediary, contact your financial intermediary to obtain your account balance.
1. Divide your ending account balance by $1,000. For example, if an account balance was $8,600 at the end of the period, the result would be 8.6.
2. In the section of the table below titled "Expenses paid during the period," locate the amount for your share class. You will find this number in the column labeled "Actual." Multiply this number by the result from step 1. Your answer is an estimate of the expenses you paid on your account during the period.
If the value of your account falls below the minimum initial investment requirement applicable to you, your account may be subject to a $20 annual fee. This fee is not included in the accompanying table. If you are subject to the fee, keep it in mind when you are estimating the ongoing expenses of investing in the fund and when comparing the expenses of this fund with other funds.
03/01/10 – 08/31/10
| | | Account value at the
beginning of the period ($) | | Account value at the
end of the period ($) | | Expenses paid
during the period ($) | | Fund's annualized
expense ratio (%) | |
| | | Actual | | Hypothetical | | Actual | | Hypothetical | | Actual | | Hypothetical | | Actual | |
| Class A | | | 1,000.00 | | | | 1,000.00 | | | | 984.90 | | | | 1,019.91 | | | | 5.25 | | | | 5.35 | | | | 1.05 | | |
| Class B | | | 1,000.00 | | | | 1,000.00 | | | | 981.10 | | | | 1,016.13 | | | | 8.99 | | | | 9.15 | | | | 1.80 | | |
| Class C | | | 1,000.00 | | | | 1,000.00 | | | | 981.10 | | | | 1,016.13 | | | | 8.99 | | | | 9.15 | | | | 1.80 | | |
| Class Z | | | 1,000.00 | | | | 1,000.00 | | | | 986.50 | | | | 1,021.17 | | | | 4.01 | | | | 4.08 | | | | 0.80 | | |
Expenses paid during the period are equal to the annualized expense ratio for the share class, multiplied by the average account value over the period, then multiplied by the number of days in the fund's most recent fiscal half-year and divided by 365.
It is important to note that the expense amounts shown in the table are meant to highlight only ongoing costs of investing in the fund and do not reflect any transaction costs, such as sales charges, redemption fees or exchange fees. Therefore, the hypothetical examples provided may not help you determine the relative total costs of owning shares of different funds. If these transaction costs were included, your costs would have been higher.
5
Portfolio Managers' Report – Columbia Balanced Fund
Performance data quoted represents past performance and current performance may be lower or higher. Past performance is no guarantee of future results. The investment return and principal value will fluctuate so that shares, when redeemed, may be worth more or less than the original cost. Please visit www.columbiamanagement.com for daily and most recent month-end performance updates.
Net asset value per share
as of 08/31/10 ($)
| Class A | | | 23.29 | | |
| Class B | | | 23.24 | | |
| Class C | | | 23.24 | | |
| Class Z | | | 23.27 | | |
Distributions declared per share
09/01/09 – 08/31/10 ($)
| Class A | | | 0.37 | | |
| Class B | | | 0.19 | | |
| Class C | | | 0.19 | | |
| Class Z | | | 0.43 | | |
Top 10 equity holdings
as of 08/31/10 (%)
| Apple | | | 2.1 | | |
| Philip Morris International | | | 2.0 | | |
International Business
Machines | | | 1.7 | | |
| Abbott Laboratories | | | 1.6 | | |
| JPMorgan Chase | | | 1.6 | | |
| Chevron | | | 1.6 | | |
| Exxon Mobil | | | 1.5 | | |
| Goldman Sachs Group | | | 1.4 | | |
| PepsiCo | | | 1.4 | | |
| eBay | | | 1.3 | | |
The fund is actively managed and the composition of its portfolio will change over time. Information provided is calculated as a percentage of net assets.
For the 12-month period that ended August 31, 2010, the fund's Class A shares returned 5.33% without sales charge. The S&P 500 Index returned 4.91% and the Barclays Capital Aggregate Bond Index returned 9.18%. The fund underperformed the 6.18% average return of the Lipper Mixed-Asset Target Allocation Growth Funds Classification.1 Results for the period were hampered by a modest bias toward equities at a time when bonds outperformed stocks. In addition, the fund's stock holdings underperformed the broader equity averages.
A positive market environment
The equity markets produced positive but modest results during the period. The fund lagged the market primarily because of stock selection in the consumer discretionary, health care and financials sectors. GameStop (0.3% of net assets) suffered from competition from online gaming and cell phone applications. Baxter International (0.4% of net assets) was hurt by a more competitive market in its line of blood therapeutics. The uneven pace of economic recovery, as well as uncertainty surrounding financial reform and potential changes in the capital requirements for lending institutions, weighed on the financials sector. Fund holdings such as Wells Fargo, Goldman Sachs and JPMorgan Chase (0.7%, 1.4% and 1.6% of net assets, respectively) struggled against this backdrop.
By contrast, the information technology sector was a standout performer for the fund, notably Apple and semiconductor manufacturer Atmel (2.1% and 0.7% of net assets, respectively). The materials sector also made a positive contribution to returns, based on a global recovery in steel and an improvement in iron ore prices. Holdings such as Vale and Walter Energy (0.4% and 0.1% of net assets, respectively) prospered in this environment. Unfortunately, the fund's successes in these areas were not sufficient to offset the shortfall in other sectors, resulting in a slight lag in the fund's equity results versus the market.
A solid showing from the fund's fixed-income component
The fixed-income market outperformed equities for the period, buoyed by a favorable macroeconomic setting of moderate growth and falling interest rates. The fixed-income portion of the portfolio outperformed its benchmark on the strength of several specific asset allocation decisions. First, we increased the fund's exposure to corporate bonds. And we fared especially well with selections in the finance, insurance, and real estate investment trust (REIT) segments. Second, we increased exposure to BBB-rated and high-yield securities, which outperformed higher-rated securities as investors regained their appetite for risk during the period. Finally, we increased the fund's overweight in commercial mortgage-backed securities (CMBS), which rebounded from sharply depressed levels and remain attractively priced. The fund's CMBS purchases have been concentrated in the vintage segment of the market, because seasoned securities tend to ha ve been underwritten with tighter credit standards.
1Lipper Inc., a widely respected data provider in the industry, calculates an average total return (assuming reinvestment of distributions) for mutual funds with investment objectives similar to those of the fund. Lipper makes no adjustment for the effect of sales loads.
6
Portfolio Managers' Report (continued) – Columbia Balanced Fund
Looking ahead
Although we think that interest rates will move in a narrow trading range, we remain alert to the possibility that the Federal Reserve could shift from its current accommodative stance should inflation replace growth as the major policy concern. As a result, the fund's fixed-income portfolio maintains a maturity profile that is slightly shorter than its benchmark index. We are encouraged by the steadily improving health of the corporate bond market, which enjoys strong demand and a resurgence in the supply of new issues.
Portfolio characteristics and holdings are subject to change and may not be representative of current characteristics and holdings. The outlook for the fund may differ from that presented for other Columbia Funds.
Equity securities are subject to stock market fluctuations that occur in response to economic and business developments.
Investing in fixed-income securities may involve certain risks, including the credit quality of individual issuers, possible prepayments, market or economic developments and yield and share price fluctuations due to changes in interest rates. When interest rates go up, bond prices typically drop, and vice versa.
Investments in high-yield bonds (sometimes referred to as "junk" bonds) offer the potential for high current income and attractive total return, but involve certain risks. Changes in economic conditions or other circumstances may adversely affect a high-yield bond issuer's ability to make principal and interest payments.
Portfolio composition
as of 08/31/10 (%)
| Common Stocks | | | 61.2 | | |
Corporate Fixed-Income
Bonds & Notes | | | 12.3 | | |
| Mortgage-Backed Securities | | | 9.7 | | |
Government & Agency
Obligations | | | 7.4 | | |
Commercial Mortgage-Backed
Securities | | | 5.3 | | |
Collateralized Mortgage
Obligations | | | 1.6 | | |
| Asset-Backed Securities | | | 0.7 | | |
| Cash & Equivalents | | | 3.2 | | |
7
Investment Portfolio – Columbia Balanced Fund
August 31, 2010
| Common Stocks – 61.2% | |
| | | Shares | | Value ($) | |
| Consumer Discretionary – 4.5% | |
| Hotels, Restaurants & Leisure – 0.7% | |
| Carnival Corp. | | | 53,970 | | | | 1,682,784 | | |
| Las Vegas Sands Corp. (a) | | | 15,578 | | | | 441,325 | | |
| Hotels, Restaurants & Leisure Total | | | 2,124,109 | | |
| Media – 1.1% | |
| Comcast Corp., Class A | | | 195,835 | | | | 3,352,695 | | |
| Media Total | | | 3,352,695 | | |
| Multiline Retail – 2.0% | |
| Kohl's Corp. (a) | | | 49,275 | | | | 2,314,939 | | |
| Target Corp. | | | 75,948 | | | | 3,885,500 | | |
| Multiline Retail Total | | | 6,200,439 | | |
| Specialty Retail – 0.3% | |
| GameStop Corp., Class A (a) | | | 55,535 | | | | 995,743 | | |
| Specialty Retail Total | | | 995,743 | | |
| Textiles, Apparel & Luxury Goods – 0.4% | |
| NIKE, Inc., Class B | | | 15,926 | | | | 1,114,820 | | |
| Textiles, Apparel & Luxury Goods Total | | | 1,114,820 | | |
| Consumer Discretionary Total | | | 13,787,806 | | |
| Consumer Staples – 6.6% | |
| Beverages – 1.4% | |
| PepsiCo, Inc. | | | 66,471 | | | | 4,266,109 | | |
| Beverages Total | | | 4,266,109 | | |
| Food & Staples Retailing – 1.7% | |
| CVS Caremark Corp. | | | 105,276 | | | | 2,842,452 | | |
| Wal-Mart Stores, Inc. | | | 45,615 | | | | 2,287,136 | | |
| Food & Staples Retailing Total | | | 5,129,588 | | |
| Food Products – 1.1% | |
| Kraft Foods, Inc., Class A | | | 114,945 | | | | 3,442,603 | | |
| Food Products Total | | | 3,442,603 | | |
| Personal Products – 0.4% | |
| Herbalife Ltd. | | | 22,343 | | | | 1,241,824 | | |
| Personal Products Total | | | 1,241,824 | | |
| Tobacco – 2.0% | |
| Philip Morris International, Inc. | | | 117,617 | | | | 6,050,218 | | |
| Tobacco Total | | | 6,050,218 | | |
| Consumer Staples Total | | | 20,130,342 | | |
| | | Shares | | Value ($) | |
| Energy – 9.3% | |
| Energy Equipment & Services – 1.4% | |
| Halliburton Co. | | | 82,195 | | | | 2,318,721 | | |
| Schlumberger Ltd. | | | 33,705 | | | | 1,797,487 | | |
| Energy Equipment & Services Total | | | 4,116,208 | | |
| Oil, Gas & Consumable Fuels – 7.9% | |
Alpha Natural Resources,
Inc. (a) | | | 43,064 | | | | 1,598,966 | | |
| Apache Corp. | | | 35,509 | | | | 3,190,484 | | |
| Chevron Corp. | | | 64,921 | | | | 4,814,541 | | |
| ConocoPhillips | | | 75,462 | | | | 3,956,473 | | |
| Devon Energy Corp. | | | 37,429 | | | | 2,256,220 | | |
| Exxon Mobil Corp. | | | 79,445 | | | | 4,699,966 | | |
| Petroleo Brasileiro SA, ADR | | | 62,119 | | | | 1,836,238 | | |
| Suncor Energy, Inc. | | | 60,857 | | | | 1,841,533 | | |
| Oil, Gas & Consumable Fuels Total | | | 24,194,421 | | |
| Energy Total | | | 28,310,629 | | |
| Financials – 10.0% | |
| Capital Markets – 3.5% | |
| Bank of New York Mellon Corp. | | | 79,359 | | | | 1,926,043 | | |
| Goldman Sachs Group, Inc. | | | 31,975 | | | | 4,378,657 | | |
| Invesco Ltd. | | | 79,080 | | | | 1,431,348 | | |
| State Street Corp. | | | 80,905 | | | | 2,838,147 | | |
| Capital Markets Total | | | 10,574,195 | | |
| Commercial Banks – 1.0% | |
| Itau Unibanco Holding SA, ADR | | | 51,725 | | | | 1,115,708 | | |
| Wells Fargo & Co. | | | 85,254 | | | | 2,007,732 | | |
| Commercial Banks Total | | | 3,123,440 | | |
| Diversified Financial Services – 2.7% | |
| Citigroup, Inc. (a) | | | 859,315 | | | | 3,196,652 | | |
| JPMorgan Chase & Co. | | | 136,398 | | | | 4,959,431 | | |
| Diversified Financial Services Total | | | 8,156,083 | | |
| Insurance – 2.8% | |
| AON Corp. | | | 62,890 | | | | 2,279,134 | | |
Berkshire Hathaway, Inc.,
Class B (a) | | | 36,290 | | | | 2,858,926 | | |
| MetLife, Inc. | | | 88,885 | | | | 3,342,076 | | |
| Insurance Total | | | 8,480,136 | | |
| Financials Total | | | 30,333,854 | | |
See Accompanying Notes to Financial Statements.
8
Columbia Balanced Fund
August 31, 2010
| Common Stocks (continued) | |
| | | Shares | | Value ($) | |
| Health Care – 7.2% | |
| Biotechnology – 1.2% | |
| Amgen, Inc. (a) | | | 36,790 | | | | 1,877,762 | | |
| Celgene Corp. (a) | | | 37,650 | | | | 1,939,728 | | |
| Biotechnology Total | | | 3,817,490 | | |
| Health Care Equipment & Supplies – 0.4% | |
| Baxter International, Inc. | | | 28,414 | | | | 1,209,300 | | |
| Health Care Equipment & Supplies Total | | | 1,209,300 | | |
| Health Care Providers & Services – 1.7% | |
| Cardinal Health, Inc. | | | 64,749 | | | | 1,939,880 | | |
| Express Scripts, Inc. (a) | | | 30,980 | | | | 1,319,748 | | |
| Medco Health Solutions, Inc. (a) | | | 41,740 | | | | 1,814,855 | | |
| Health Care Providers & Services Total | | | 5,074,483 | | |
| Life Sciences Tools & Services – 1.0% | |
| Thermo Fisher Scientific, Inc. (a) | | | 70,103 | | | | 2,952,738 | | |
| Life Sciences Tools & Services Total | | | 2,952,738 | | |
| Pharmaceuticals – 2.9% | |
| Abbott Laboratories | | | 101,810 | | | | 5,023,306 | | |
| Pfizer, Inc. | | | 131,715 | | | | 2,098,220 | | |
Teva Pharmaceutical Industries
Ltd., ADR | | | 34,040 | | | | 1,721,743 | | |
| Pharmaceuticals Total | | | 8,843,269 | | |
| Health Care Total | | | 21,897,280 | | |
| Industrials – 6.9% | |
| Aerospace & Defense – 1.9% | |
| Honeywell International, Inc. | | | 63,354 | | | | 2,476,508 | | |
| United Technologies Corp. | | | 53,188 | | | | 3,468,389 | | |
| Aerospace & Defense Total | | | 5,944,897 | | |
| Air Freight & Logistics – 0.3% | |
| FedEx Corp. | | | 12,020 | | | | 938,161 | | |
| Air Freight & Logistics Total | | | 938,161 | | |
| Electrical Equipment – 0.5% | |
Sensata Technologies
Holding NV (a) | | | 81,675 | | | | 1,377,857 | | |
| Electrical Equipment Total | | | 1,377,857 | | |
| Industrial Conglomerates – 1.5% | |
| General Electric Co. | | | 131,912 | | | | 1,910,086 | | |
| Tyco International Ltd. | | | 67,540 | | | | 2,517,891 | | |
| Industrial Conglomerates Total | | | 4,427,977 | | |
| Machinery – 1.0% | |
| Illinois Tool Works, Inc. | | | 75,913 | | | | 3,132,171 | | |
| Machinery Total | | | 3,132,171 | | |
| | | Shares | | Value ($) | |
| Professional Services – 0.5% | |
| Equifax, Inc. | | | 53,560 | | | | 1,578,413 | | |
| Professional Services Total | | | 1,578,413 | | |
| Road & Rail – 1.2% | |
| Union Pacific Corp. | | | 48,163 | | | | 3,513,009 | | |
| Road & Rail Total | | | 3,513,009 | | |
| Industrials Total | | | 20,912,485 | | |
| Information Technology – 12.5% | |
| Communications Equipment – 1.8% | |
| Cisco Systems, Inc. (a) | | | 93,100 | | | | 1,866,655 | | |
| Motorola, Inc. (a) | | | 76,055 | | | | 572,694 | | |
| QUALCOMM, Inc. | | | 83,376 | | | | 3,194,135 | | |
| Communications Equipment Total | | | 5,633,484 | | |
| Computers & Peripherals – 2.9% | |
| Apple, Inc. (a) | | | 26,151 | | | | 6,364,369 | | |
| EMC Corp. (a) | | | 133,061 | | | | 2,427,032 | | |
| Computers & Peripherals Total | | | 8,791,401 | | |
| Electronic Equipment, Instruments & Components – 0.6% | |
| Corning, Inc. | | | 111,845 | | | | 1,753,730 | | |
Electronic Equipment, Instruments &
Components Total | | | 1,753,730 | | |
| Internet Software & Services – 2.5% | |
| eBay, Inc. (a) | | | 172,115 | | | | 3,999,952 | | |
| Google, Inc., Class A (a) | | | 8,082 | | | | 3,637,062 | | |
| Internet Software & Services Total | | | 7,637,014 | | |
| IT Services – 2.4% | |
International Business
Machines Corp. | | | 41,305 | | | | 5,090,015 | | |
| Visa, Inc., Class A | | | 33,170 | | | | 2,288,067 | | |
| IT Services Total | | | 7,378,082 | | |
| Semiconductors & Semiconductor Equipment – 0.7% | |
| Atmel Corp. (a) | | | 356,652 | | | | 2,068,582 | | |
Semiconductors & Semiconductor
Equipment Total | | | 2,068,582 | | |
| Software – 1.6% | |
| Adobe Systems, Inc. (a) | | | 58,830 | | | | 1,633,121 | | |
| McAfee, Inc. (a) | | | 12,950 | | | | 609,297 | | |
| Microsoft Corp. | | | 116,033 | | | | 2,724,455 | | |
| Software Total | | | 4,966,873 | | |
| Information Technology Total | | | 38,229,166 | | |
See Accompanying Notes to Financial Statements.
9
Columbia Balanced Fund
August 31, 2010
| Common Stocks (continued) | |
| | | Shares | | Value ($) | |
| Materials – 2.5% | |
| Chemicals – 1.4% | |
| Air Products & Chemicals, Inc. | | | 33,010 | | | | 2,443,730 | | |
| Syngenta AG, ADR | | | 39,960 | | | | 1,839,759 | | |
| Chemicals Total | | | 4,283,489 | | |
| Metals & Mining – 1.1% | |
Freeport-McMoRan Copper &
Gold, Inc. | | | 23,970 | | | | 1,725,361 | | |
| Vale SA, ADR | | | 45,524 | | | | 1,217,767 | | |
| Walter Energy, Inc. | | | 5,512 | | | | 397,084 | | |
| Metals & Mining Total | | | 3,340,212 | | |
| Materials Total | | | 7,623,701 | | |
| Telecommunication Services – 0.7% | |
| Wireless Telecommunication Services – 0.7% | |
MetroPCS Communications,
Inc. (a) | | | 139,855 | | | | 1,250,304 | | |
Millicom International
Cellular SA | | | 11,145 | | | | 1,026,231 | | |
| Wireless Telecommunication Services Total | | | 2,276,535 | | |
| Telecommunication Services Total | | | 2,276,535 | | |
| Utilities – 1.0% | |
| Independent Power Producers & Energy Traders – 0.6% | |
| AES Corp. (a) | | | 182,755 | | | | 1,871,411 | | |
Independent Power Producers &
Energy Traders Total | | | 1,871,411 | | |
| Multi-Utilities – 0.4% | |
| National Grid PLC, ADR | | | 26,895 | | | | 1,134,162 | | |
| Multi-Utilities Total | | | 1,134,162 | | |
| Utilities Total | | | 3,005,573 | | |
Total Common Stocks
(cost of $176,002,270) | | | 186,507,371 | | |
| Corporate Fixed-Income Bonds & Notes – 12.3% | |
| | | Par ($) | | | |
| Basic Materials – 0.4% | |
| Chemicals – 0.1% | |
| CF Industries, Inc. | |
| 6.875% 05/01/18 | | | 35,000 | | | | 36,838 | | |
| Hexion U.S. Finance Corp./Hexion Nova Scotia Finance ULC | |
| 8.875% 02/01/18 | | | 65,000 | | | | 60,125 | | |
| | | Par ($) | | Value ($) | |
| INEOS Finance PLC | |
| 9.000% 05/15/15 (b) | | | 60,000 | | | | 60,675 | | |
| Lyondell Chemical Co. | |
| 8.000% 11/01/17 (b) | | | 35,000 | | | | 37,581 | | |
| Chemicals Total | | | 195,219 | | |
| Forest Products & Paper – 0.1% | |
| Cascades, Inc. | |
| 7.750% 12/15/17 | | | 10,000 | | | | 10,300 | | |
| Georgia-Pacific LLC | |
| 8.000% 01/15/24 | | | 280,000 | | | | 308,000 | | |
| Forest Products & Paper Total | | | 318,300 | | |
| Iron/Steel – 0.1% | |
| ArcelorMittal USA, Inc. | |
| 6.500% 04/15/14 | | | 300,000 | | | | 330,313 | | |
| Iron/Steel Total | | | 330,313 | | |
| Metals & Mining – 0.1% | |
| Novelis, Inc. | |
| 7.250% 02/15/15 | | | 3,000 | | | | 3,008 | | |
| Vale Overseas Ltd. | |
| 6.250% 01/23/17 | | | 295,000 | | | | 330,686 | | |
| Metals & Mining Total | | | 333,694 | | |
| Basic Materials Total | | | 1,177,526 | | |
| Communications – 2.2% | |
| Advertising – 0.0% | |
| Interpublic Group of Companies, Inc. | |
| 10.000% 07/15/17 | | | 5,000 | | | | 5,750 | | |
| inVentiv Health, Inc. | |
| 10.000% 08/15/18 (b) | | | 30,000 | | | | 29,325 | | |
| Advertising Total | | | 35,075 | | |
| Media – 0.8% | |
| Belo Corp. | |
| 8.000% 11/15/16 | | | 15,000 | | | | 15,900 | | |
| Cablevision Systems Corp. | |
| 8.625% 09/15/17 (b) | | | 50,000 | | | | 54,500 | | |
| Clear Channel Worldwide Holdings, Inc. | |
| 9.250% 12/15/17 | | | 45,000 | | | | 47,194 | | |
| Comcast Corp. | |
| 7.050% 03/15/33 | | | 375,000 | | | | 452,582 | | |
| DIRECTV Holdings LLC | |
| 3.550% 03/15/15 | | | 280,000 | | | | 288,747 | | |
| DISH DBS Corp. | |
| 7.875% 09/01/19 | | | 85,000 | | | | 88,612 | | |
| Entravision Communications Corp. | |
| 8.750% 08/01/17 (b) | | | 45,000 | | | �� | 45,000 | | |
See Accompanying Notes to Financial Statements.
10
Columbia Balanced Fund
August 31, 2010
| Corporate Fixed-Income Bonds & Notes (continued) | |
| | | Par ($) | | Value ($) | |
| Gray Television, Inc. | |
| 10.500% 06/29/15 | | | 25,000 | | | | 24,063 | | |
| Insight Communications Co., Inc. | |
| 9.375% 07/15/18 (b) | | | 15,000 | | | | 15,750 | | |
| Mediacom LLC/Mediacom Capital Corp. | |
| 9.125% 08/15/19 | | | 45,000 | | | | 45,000 | | |
| News America, Inc. | |
| 6.550% 03/15/33 | | | 275,000 | | | | 313,221 | | |
| RR Donnelley & Sons Co. | |
| 6.125% 01/15/17 | | | 350,000 | | | | 360,847 | | |
| Salem Communications Corp. | |
| 9.625% 12/15/16 | | | 35,000 | | | | 36,444 | | |
| Sinclair Television Group, Inc. | |
| 9.250% 11/01/17 (b) | | | 50,000 | | | | 51,500 | | |
| Sirius XM Radio, Inc. | |
| 8.750% 04/01/15 (b) | | | 25,000 | | | | 25,750 | | |
| 9.750% 09/01/15 (b) | | | 10,000 | | | | 10,875 | | |
| Time Warner, Inc. | |
| 6.200% 03/15/40 | | | 360,000 | | | | 396,299 | | |
| Univision Communications, Inc. | |
| PIK, | |
9.750% 03/15/15
(03/15/12) (b)(c)(d) | | | 5,000 | | | | 4,275 | | |
| Viacom, Inc. | |
| 6.125% 10/05/17 | | | 195,000 | | | | 228,632 | | |
| Media Total | | | 2,505,191 | | |
| Telecommunication Services – 1.4% | |
| America Movil SAB de CV | |
| 5.625% 11/15/17 | | | 370,000 | | | | 418,657 | | |
| AT&T, Inc. | |
| 4.950% 01/15/13 | | | 400,000 | | | | 435,805 | | |
| British Telecommunications PLC | |
| 5.150% 01/15/13 | | | 275,000 | | | | 291,592 | | |
| Cellco Partnership/Verizon Wireless Capital LLC | |
| 5.550% 02/01/14 | | | 500,000 | | | | 565,818 | | |
| Cincinnati Bell, Inc. | |
| 8.250% 10/15/17 | | | 30,000 | | | | 29,400 | | |
| Clearwire Communications LLC/Clearwire Finance, Inc. | |
| 12.000% 12/01/15 (b) | | | 43,000 | | | | 43,000 | | |
| Intelsat Corp. | |
| 9.250% 06/15/16 | | | 185,000 | | | | 196,100 | | |
| ITC Deltacom, Inc. | |
| 10.500% 04/01/16 | | | 65,000 | | | | 64,025 | | |
| Level 3 Financing, Inc. | |
| 8.750% 02/15/17 | | | 45,000 | | | | 38,138 | | |
| 9.250% 11/01/14 | | | 5,000 | | | | 4,406 | | |
| New Cingular Wireless Services, Inc. | |
| 8.750% 03/01/31 | | | 200,000 | | | | 290,987 | | |
| Nextel Communications, Inc. | |
| 7.375% 08/01/15 | | | 185,000 | | | | 183,150 | | |
| | | Par ($) | | Value ($) | |
| PAETEC Holding Corp. | |
| 8.875% 06/30/17 | | | 40,000 | | | | 41,400 | | |
| Qwest Communications International, Inc. | |
| 7.500% 02/15/14 | | | 295,000 | | | | 300,531 | | |
| Telecom Italia Capital SA | |
| 4.950% 09/30/14 | | | 325,000 | | | | 341,596 | | |
| Telefonica Emisiones SAU | |
0.775% 02/04/13
(11/04/10) (c)(d) | | | 425,000 | | | | 413,180 | | |
| Vodafone Group PLC | |
| 5.750% 03/15/16 | | | 335,000 | | | | 381,260 | | |
| Wind Acquisition Finance SA | |
| 11.750% 07/15/17 (b) | | | 65,000 | | | | 71,500 | | |
| Windstream Corp. | |
| 7.875% 11/01/17 | | | 45,000 | | | | 45,675 | | |
| 8.125% 09/01/18 (b) | | | 25,000 | | | | 25,438 | | |
| Telecommunication Services Total | | | 4,181,658 | | |
| Communications Total | | | 6,721,924 | | |
| Consumer Cyclical – 0.3% | |
| Auto Manufacturers – 0.0% | |
| Oshkosh Corp. | |
| 8.500% 03/01/20 | | | 2,000 | | | | 2,125 | | |
| Auto Manufacturers Total | | | 2,125 | | |
| Auto Parts & Equipment – 0.0% | |
| Accuride Corp. | |
| 9.500% 08/01/18 (b) | | | 7,000 | | | | 7,175 | | |
| American Axle & Manufacturing Holdings, Inc. | |
| 9.250% 01/15/17 (b) | | | 45,000 | | | | 47,812 | | |
| Lear Corp. | |
| 7.875% 03/15/18 | | | 45,000 | | | | 46,575 | | |
| Tenneco, Inc. | |
| 7.750% 08/15/18 (b) | | | 4,000 | | | | 4,080 | | |
| Auto Parts & Equipment Total | | | 105,642 | | |
| Distribution/Wholesale – 0.0% | |
| McJunkin Red Man Corp. | |
| 9.500% 12/15/16 (b) | | | 26,000 | | | | 22,945 | | |
| Distribution/Wholesale Total | | | 22,945 | | |
| Entertainment – 0.0% | |
| Cedar Fair LP/Canada's Wonderland Co./Magnum Management Corp. | |
| 9.125% 08/01/18 (b) | | | 10,000 | | | | 10,175 | | |
| Pinnacle Entertainment, Inc. | |
| 8.750% 05/15/20 | | | 30,000 | | | | 28,950 | | |
| Shingle Springs Tribal Gaming Authority | |
| 9.375% 06/15/15 (b) | | | 65,000 | | | | 49,563 | | |
| Entertainment Total | | | 88,688 | | |
See Accompanying Notes to Financial Statements.
11
Columbia Balanced Fund
August 31, 2010
| Corporate Fixed-Income Bonds & Notes (continued) | |
| | | Par ($) | | Value ($) | |
| Home Builders – 0.0% | |
| K Hovnanian Enterprises, Inc. | |
| 10.625% 10/15/16 | | | 25,000 | | | | 24,250 | | |
| Home Builders Total | | | 24,250 | | |
| Home Furnishings – 0.0% | |
| Norcraft Companies LP/Norcraft Finance Corp. | |
| 10.500% 12/15/15 | | | 50,000 | | | | 51,625 | | |
| Home Furnishings Total | | | 51,625 | | |
| Lodging – 0.1% | |
| MGM Resorts International | |
| 9.000% 03/15/20 (b) | | | 45,000 | | | | 46,688 | | |
| 11.375% 03/01/18 (b) | | | 55,000 | | | | 49,775 | | |
| Starwood Hotels & Resorts Worldwide, Inc. | |
| 7.150% 12/01/19 | | | 30,000 | | | | 32,100 | | |
| Wyndham Worldwide Corp. | |
| 6.000% 12/01/16 | | | 75,000 | | | | 76,541 | | |
| Lodging Total | | | 205,104 | | |
| Retail – 0.2% | |
| CVS Pass-Through Trust | |
| 7.507% 01/10/32 (b) | | | 346,745 | | | | 408,809 | | |
| Michaels Stores, Inc. | |
| 11.375% 11/01/16 | | | 10,000 | | | | 10,725 | | |
| Neiman Marcus Group, Inc. | |
| PIK, | |
| 9.000% 10/15/15 | | | 23,000 | | | | 23,288 | | |
| QVC, Inc. | |
| 7.500% 10/01/19 (b) | | | 75,000 | | | | 76,500 | | |
| Rite Aid Corp. | |
| 8.000% 08/15/20 (b) | | | 10,000 | | | | 9,938 | | |
| 10.250% 10/15/19 | | | 25,000 | | | | 25,687 | | |
| Toys R Us - Delaware, Inc. | |
| 7.375% 09/01/16 (b)(e) | | | 25,000 | | | | 25,250 | | |
| Retail Total | | | 580,197 | | |
| Consumer Cyclical Total | | | 1,080,576 | | |
| Consumer Non-Cyclical – 1.4% | |
| Beverages – 0.4% | |
| Anheuser-Busch InBev Worldwide, Inc. | |
| 2.500% 03/26/13 (b) | | | 375,000 | | | | 381,164 | | |
| Bottling Group LLC | |
| 6.950% 03/15/14 | | | 425,000 | | | | 503,988 | | |
| Cott Beverages USA, Inc. | |
| 8.125% 09/01/18 (b) | | | 9,000 | | | | 9,259 | | |
| Cott Beverages, Inc. | |
| 8.375% 11/15/17 (b) | | | 20,000 | | | | 20,925 | | |
| Miller Brewing Co. | |
| 5.500% 08/15/13 (b) | | | 340,000 | | | | 374,054 | | |
| Beverages Total | | | 1,289,390 | | |
| | | Par ($) | | Value ($) | |
| Commercial Services – 0.1% | |
| Cardtronics, Inc. | |
| 8.250% 09/01/18 | | | 20,000 | | | | 20,450 | | |
| Garda World Security Corp. | |
| 9.750% 03/15/17 (b) | | | 10,000 | | | | 10,325 | | |
| Interactive Data Corp. | |
| 10.250% 08/01/18 (b) | | | 35,000 | | | | 36,312 | | |
| Trans Union LLC/TransUnion Financing Corp. | |
| 11.375% 06/15/18 (b) | | | 10,000 | | | | 10,875 | | |
| United Rentals North America, Inc. | |
| 9.250% 12/15/19 | | | 10,000 | | | | 10,625 | | |
| 10.875% 06/15/16 | | | 35,000 | | | | 38,850 | | |
| Commercial Services Total | | | 127,437 | | |
| Food – 0.3% | |
| ConAgra Foods, Inc. | |
| 5.875% 04/15/14 | | | 250,000 | | | | 286,743 | | |
| Kraft Foods, Inc. | |
| 5.375% 02/10/20 | | | 310,000 | | | | 344,508 | | |
| Kroger Co. | |
| 5.400% 07/15/40 | | | 300,000 | | | | 316,561 | | |
| Michael Foods, Inc. | |
| 9.750% 07/15/18 (b) | | | 20,000 | | | | 21,000 | | |
| Pinnacle Foods Finance LLC/Pinnacle Foods Finance Corp. | |
| 9.250% 04/01/15 | | | 15,000 | | | | 15,394 | | |
| Food Total | | | 984,206 | | |
| Healthcare Services – 0.3% | |
| Apria Healthcare Group, Inc. | |
| 11.250% 11/01/14 (b) | | | 45,000 | | | | 48,656 | | |
| Capella Healthcare, Inc. | |
| 9.250% 07/01/17 (b) | | | 5,000 | | | | 5,175 | | |
| CHS/Community Health Systems, Inc. | |
| 8.875% 07/15/15 | | | 55,000 | | | | 57,062 | | |
| HCA, Inc. | |
| 7.250% 09/15/20 | | | 45,000 | | | | 47,025 | | |
| 9.250% 11/15/16 | | | 25,000 | | | | 26,813 | | |
| PIK, | |
| 9.625% 11/15/16 | | | 78,000 | | | | 83,752 | | |
| Multiplan, Inc. | |
| 9.875% 09/01/18 (b) | | | 14,000 | | | | 14,070 | | |
| Radiation Therapy Services, Inc. | |
| 9.875% 04/15/17 (b) | | | 5,000 | | | | 4,888 | | |
| Roche Holdings, Inc. | |
| 6.000% 03/01/19 (b) | | | 350,000 | | | | 424,417 | | |
| Select Medical Corp. | |
| 7.625% 02/01/15 | | | 15,000 | | | | 14,138 | | |
| Tenet Healthcare Corp. | |
| 8.000% 08/01/20 (b) | | | 25,000 | | | | 24,250 | | |
See Accompanying Notes to Financial Statements.
12
Columbia Balanced Fund
August 31, 2010
| Corporate Fixed-Income Bonds & Notes (continued) | |
| | | Par ($) | | Value ($) | |
Vanguard Health Holding Co. II, LLC/Vanguard
Holding Co. II, Inc. | |
| 8.000% 02/01/18 | | | 40,000 | | | | 39,250 | | |
| Healthcare Services Total | | | 789,496 | | |
| Household Products/Wares – 0.0% | |
| Jarden Corp. | |
| 8.000% 05/01/16 | | | 45,000 | | | | 47,531 | | |
| Spectrum Brands Holdings, Inc. | |
| 9.500% 06/15/18 (b) | | | 25,000 | | | | 26,313 | | |
| Household Products/Wares Total | | | 73,844 | | |
| Pharmaceuticals – 0.3% | |
| Express Scripts, Inc. | |
| 6.250% 06/15/14 | | | 335,000 | | | | 386,175 | | |
| Omnicare, Inc. | |
| 6.875% 12/15/15 | | | 130,000 | | | | 128,700 | | |
| Warner Chilcott Co. LLC/Warner Chilcott Finance LLC | |
| 7.750% 09/15/18 (b) | | | 15,000 | | | | 15,225 | | |
| Wyeth | |
| 5.500% 02/01/14 | | | 345,000 | | | | 390,588 | | |
| Pharmaceuticals Total | | | 920,688 | | |
| Consumer Non-Cyclical Total | | | 4,185,061 | | |
| Energy – 1.2% | |
| Coal – 0.1% | |
| Arch Coal, Inc. | |
| 7.250% 10/01/20 | | | 2,000 | | | | 2,030 | | |
| 8.750% 08/01/16 | | | 110,000 | | | | 119,075 | | |
| Consol Energy, Inc. | |
| 8.000% 04/01/17 (b) | | | 15,000 | | | | 15,825 | | |
| 8.250% 04/01/20 (b) | | | 60,000 | | | | 63,675 | | |
| Coal Total | | | 200,605 | | |
| Oil & Gas – 0.7% | |
| Anadarko Petroleum Corp. | |
| 6.200% 03/15/40 | | | 325,000 | | | | 278,107 | | |
| Berry Petroleum Co. | |
| 8.250% 11/01/16 | | | 5,000 | | | | 5,050 | | |
| Canadian Natural Resources Ltd. | |
| 5.700% 05/15/17 | | | 300,000 | | | | 346,279 | | |
| Chesapeake Energy Corp. | |
| 6.625% 08/15/20 | | | 50,000 | | | | 50,187 | | |
| Comstock Resources, Inc. | |
| 8.375% 10/15/17 | | | 3,000 | | | | 3,068 | | |
| Concho Resources, Inc. | |
| 8.625% 10/01/17 | | | 45,000 | | | | 47,025 | | |
| El Paso Corp. | |
| 6.875% 06/15/14 | | | 220,000 | | | | 232,787 | | |
| 7.750% 01/15/32 | | | 40,000 | | | | 40,265 | | |
| | | Par ($) | | Value ($) | |
| Forest Oil Corp. | |
| 7.250% 06/15/19 | | | 45,000 | | | | 45,056 | | |
| Hilcorp Energy I LP/Hilcorp Finance Co. | |
| 7.750% 11/01/15 (b) | | | 45,000 | | | | 45,563 | | |
| Nexen, Inc. | |
| 5.875% 03/10/35 | | | 300,000 | | | | 312,768 | | |
| PetroHawk Energy Corp. | |
| 7.250% 08/15/18 (b) | | | 15,000 | | | | 14,888 | | |
| 7.875% 06/01/15 | | | 285,000 | | | | 295,687 | | |
| 10.500% 08/01/14 | | | 30,000 | | | | 33,525 | | |
| QEP Resources, Inc. | |
| 6.875% 03/01/21 | | | 20,000 | | | | 20,850 | | |
| Quicksilver Resources, Inc. | |
| 8.250% 08/01/15 | | | 10,000 | | | | 10,200 | | |
| 9.125% 08/15/19 | | | 45,000 | | | | 48,262 | | |
| Range Resources Corp. | |
| 6.750% 08/01/20 | | | 20,000 | | | | 20,150 | | |
| 7.500% 05/15/16 | | | 110,000 | | | | 114,400 | | |
| SandRidge Energy, Inc. | |
| PIK, | |
| 8.625% 04/01/15 | | | 17,000 | | | | 16,256 | | |
| Talisman Energy, Inc. | |
| 6.250% 02/01/38 | | | 235,000 | | | | 260,325 | | |
| Oil & Gas Total | | | 2,240,698 | | |
| Oil & Gas Services – 0.1% | |
| Expro Finance Luxembourg SCA | |
| 8.500% 12/15/16 (b) | | | 40,000 | | | | 37,400 | | |
| Weatherford International Ltd. | |
| 5.150% 03/15/13 | | | 225,000 | | | | 240,913 | | |
| Oil & Gas Services Total | | | 278,313 | | |
| Pipelines – 0.3% | |
| Enterprise Products Operating LLC | |
| 4.600% 08/01/12 | | | 200,000 | | | | 209,409 | | |
| Regency Energy Partners LP/Regency Energy Finance Corp. | |
| 9.375% 06/01/16 (b) | | | 95,000 | | | | 103,075 | | |
| TransCanada Pipelines Ltd. | |
6.350% 05/15/67
(05/15/17) (c)(d) | | | 245,000 | | | | 223,622 | | |
| Williams Partners LP/Williams Partners Finance Corp. | |
| 7.250% 02/01/17 | | | 270,000 | | | | 319,028 | | |
| Pipelines Total | | | 855,134 | | |
| Energy Total | | | 3,574,750 | | |
| Financials – 4.7% | |
| Banks – 2.8% | |
| Ally Financial, Inc. | |
| 7.500% 09/15/20 (b) | | | 20,000 | | | | 19,800 | | |
| 8.000% 03/15/20 (b) | | | 105,000 | | | | 107,625 | | |
See Accompanying Notes to Financial Statements.
13
Columbia Balanced Fund
August 31, 2010
| Corporate Fixed-Income Bonds & Notes (continued) | |
| | | Par ($) | | Value ($) | |
| ANZ National International Ltd. | |
| 6.200% 07/19/13 (b) | | | 500,000 | | | | 557,879 | | |
| Bank of New York Mellon Corp. | |
| 5.125% 08/27/13 | | | 300,000 | | | | 333,591 | | |
| Barclays Bank PLC | |
| 6.750% 05/22/19 | | | 475,000 | | | | 561,638 | | |
| Bear Stearns Cos. LLC | |
| 7.250% 02/01/18 | | | 650,000 | | | | 788,089 | | |
| Capital One Financial Corp. | |
| 5.500% 06/01/15 | | | 325,000 | | | | 354,914 | | |
| CIT Group, Inc. | |
| 7.000% 05/01/17 | | | 125,000 | | | | 117,539 | | |
| Citigroup Funding, Inc. | |
| 2.000% 03/30/12 (f) | | | 750,000 | | | | 765,905 | | |
| Citigroup, Inc. | |
| 6.125% 05/15/18 | | | 625,000 | | | | 674,476 | | |
| Commonwealth Bank of Australia | |
| 3.750% 10/15/14 (b) | | | 450,000 | | | | 476,553 | | |
| Credit Suisse/New York NY | |
| 6.000% 02/15/18 | | | 449,000 | | | | 489,544 | | |
| Deutsche Bank AG/London | |
| 4.875% 05/20/13 | | | 500,000 | | | | 539,763 | | |
| Goldman Sachs Group, Inc. | |
| 5.350% 01/15/16 | | | 300,000 | | | | 323,128 | | |
| Keycorp | |
| 6.500% 05/14/13 | | | 290,000 | | | | 317,589 | | |
| Merrill Lynch & Co., Inc. | |
| 6.875% 04/25/18 | | | 675,000 | | | | 742,844 | | |
| Morgan Stanley | |
| 6.625% 04/01/18 | | | 350,000 | | | | 384,621 | | |
| Royal Bank of Scotland PLC | |
2.759% 08/23/13
(11/23/10) (c)(d) | | | 425,000 | | | | 430,160 | | |
| Wachovia Corp. | |
| 4.875% 02/15/14 | | | 500,000 | | | | 531,749 | | |
| Banks Total | | | 8,517,407 | | |
| Diversified Financial Services – 0.8% | |
| American General Finance Corp. | |
| 6.900% 12/15/17 | | | 90,000 | | | | 69,750 | | |
| E*Trade Financial Corp. | |
| 7.375% 09/15/13 | | | 5,000 | | | | 4,750 | | |
| 7.875% 12/01/15 | | | 20,000 | | | | 18,900 | | |
| PIK, | |
| 12.500% 11/30/17 | | | 10,000 | | | | 11,150 | | |
| ERAC USA Finance LLC | |
| 6.375% 10/15/17 (b) | | | 300,000 | | | | 348,095 | | |
| Ford Motor Credit Co., LLC | |
| 6.625% 08/15/17 | | | 100,000 | | | | 101,637 | | |
| 8.000% 12/15/16 | | | 90,000 | | | | 97,734 | | |
| | | Par ($) | | Value ($) | |
| General Electric Capital Corp. | |
| 2.250% 03/12/12 (f) | | | 750,000 | | | | 769,735 | | |
| 5.500% 01/08/20 | | | 750,000 | | | | 820,792 | | |
| International Lease Finance Corp. | |
| 8.750% 03/15/17 (b) | | | 22,000 | | | | 22,193 | | |
| 8.875% 09/01/17 | | | 25,000 | | | | 25,188 | | |
| Lehman Brothers Holdings, Inc. | |
| 5.750% 07/18/11 (g) | | | 275,000 | | | | 57,750 | | |
| Diversified Financial Services Total | | | 2,347,674 | | |
| Insurance – 0.8% | |
| Chubb Corp. | |
| 5.750% 05/15/18 | | | 90,000 | | | | 103,821 | | |
| CNA Financial Corp. | |
| 7.350% 11/15/19 | | | 325,000 | | | | 362,338 | | |
| ING Groep NV | |
| 5.775% 12/29/49 (c) | | | 20,000 | | | | 16,450 | | |
| Lincoln National Corp. | |
| 8.750% 07/01/19 | | | 250,000 | | | | 319,212 | | |
| MetLife, Inc. | |
| 6.817% 08/15/18 | | | 360,000 | | | | 429,051 | | |
| Principal Life Income Funding Trusts | |
| 5.300% 04/24/13 | | | 320,000 | | | | 346,809 | | |
| Prudential Financial, Inc. | |
| 6.100% 06/15/17 | | | 325,000 | | | | 363,350 | | |
| Transatlantic Holdings, Inc. | |
| 8.000% 11/30/39 | | | 310,000 | | | | 325,500 | | |
| UnitedHealth Group, Inc. | |
| 5.250% 03/15/11 | | | 225,000 | | | | 230,022 | | |
| Insurance Total | | | 2,496,553 | | |
| Investment Companies – 0.0% | |
| Offshore Group Investments Ltd. | |
| 11.500% 08/01/15 (b) | | | 40,000 | | | | 39,900 | | |
| Investment Companies Total | | | 39,900 | | |
| Real Estate Investment Trusts (REITs) – 0.3% | |
| Duke Realty LP | |
| 8.250% 08/15/19 | | | 250,000 | | | | 293,733 | | |
| Kimco Realty Corp. | |
| 4.300% 02/01/18 (e) | | | 275,000 | | | | 273,346 | | |
| Simon Property Group LP | |
| 6.750% 02/01/40 | | | 255,000 | | | | 303,723 | | |
| Real Estate Investment Trusts (REITs) Total | | | 870,802 | | |
| Financials Total | | | 14,272,336 | | |
| Industrials – 0.5% | |
| Aerospace & Defense – 0.1% | |
| Kratos Defense & Security Solutions, Inc. | |
| 10.000% 06/01/17 | | | 10,000 | | | | 10,325 | | |
See Accompanying Notes to Financial Statements.
14
Columbia Balanced Fund
August 31, 2010
| Corporate Fixed-Income Bonds & Notes (continued) | |
| | | Par ($) | | Value ($) | |
| United Technologies Corp. | |
| 5.375% 12/15/17 | | | 315,000 | | | | 372,456 | | |
| Aerospace & Defense Total | | | 382,781 | | |
| Building Materials – 0.0% | |
| Gibraltar Industries, Inc. | |
| 8.000% 12/01/15 | | | 10,000 | | | | 9,575 | | |
| Nortek, Inc. | |
| 11.000% 12/01/13 | | | 10,000 | | | | 10,537 | | |
| Building Materials Total | | | 20,112 | | |
| Machinery-Construction & Mining – 0.0% | |
| Terex Corp. | |
| 10.875% 06/01/16 | | | 75,000 | | | | 82,875 | | |
| Machinery-Construction & Mining Total | | | 82,875 | | |
| Machinery-Diversified – 0.0% | |
| Case New Holland, Inc. | |
| 7.875% 12/01/17 (b) | | | 39,000 | | | | 41,047 | | |
| Machinery-Diversified Total | | | 41,047 | | |
| Miscellaneous Manufacturing – 0.2% | |
| Ingersoll-Rand Global Holding Co., Ltd. | |
| 9.500% 04/15/14 | | | 235,000 | | | | 291,261 | | |
| SPX Corp. | |
| 6.875% 09/01/17 (b) | | | 12,000 | | | | 12,360 | | |
| Tyco International Ltd./Tyco International Finance SA | |
| 7.000% 12/15/19 | | | 265,000 | | | | 334,853 | | |
| Miscellaneous Manufacturing Total | | | 638,474 | | |
| Packaging & Containers – 0.0% | |
| Graphic Packaging International, Inc. | |
| 9.500% 06/15/17 | | | 75,000 | | | | 79,875 | | |
| Packaging & Containers Total | | | 79,875 | | |
| Transportation – 0.2% | |
| Burlington Northern Santa Fe Corp. | |
| 6.200% 08/15/36 | | | 275,000 | | | | 323,115 | | |
| United Parcel Service, Inc. | |
| 4.500% 01/15/13 | | | 145,000 | | | | 157,186 | | |
| Transportation Total | | | 480,301 | | |
| Industrials Total | | | 1,725,465 | | |
| Information Technology – 0.0% | |
| IT Services – 0.0% | |
| First Data Corp. | |
| 8.875% 08/15/20 (b) | | | 25,000 | | | | 25,063 | | |
| 9.875% 09/24/15 | | | 15,000 | | | | 11,400 | | |
| IT Services Total | | | 36,463 | | |
| Information Technology Total | | | 36,463 | | |
| | | Par ($) | | Value ($) | |
| Technology – 0.3% | |
| Networking Products – 0.1% | |
| Cisco Systems, Inc. | |
| 4.950% 02/15/19 | | | 325,000 | | | | 371,468 | | |
| Networking Products Total | | | 371,468 | | |
| Semiconductors – 0.0% | |
| Freescale Semiconductor, Inc. | |
| 9.250% 04/15/18 (b) | | | 15,000 | | | | 15,038 | | |
| NXP BV/NXP Funding LLC | |
| 9.750% 08/01/18 (b) | | | 45,000 | | | | 46,350 | | |
| Semiconductors Total | | | 61,388 | | |
| Software – 0.2% | |
| Oracle Corp. | |
| 6.500% 04/15/38 | | | 300,000 | | | | 378,100 | | |
| Software Total | | | 378,100 | | |
| Technology Total | | | 810,956 | | |
| Utilities – 1.3% | |
| Electric – 1.1% | |
| Commonwealth Edison Co. | |
| 6.150% 09/15/17 | | | 300,000 | | | | 356,816 | | |
| Consolidated Edison Co. of New York | |
| 5.850% 03/15/36 | | | 325,000 | | | | 374,122 | | |
| Dominion Resources, Inc./VA | |
| 5.200% 08/15/19 | | | 335,000 | | | | 383,162 | | |
| Dynegy Holdings, Inc. | |
| 7.750% 06/01/19 | | | 29,000 | | | | 18,705 | | |
| Edison Mission Energy | |
| 7.000% 05/15/17 | | | 30,000 | | | | 20,475 | | |
| Energy Future Holdings Corp. | |
| 10.000% 01/15/20 (b) | | | 30,000 | | | | 28,890 | | |
| Indiana Michigan Power Co. | |
| 5.650% 12/01/15 | | | 275,000 | | | | 309,524 | | |
| Nevada Power Co. | |
| 6.500% 08/01/18 | | | 235,000 | | | | 282,820 | | |
| Nisource Finance Corp. | |
| 6.400% 03/15/18 | | | 285,000 | | | | 327,184 | | |
| NRG Energy, Inc. | |
| 7.375% 01/15/17 | | | 165,000 | | | | 166,237 | | |
| Pacific Gas & Electric Co. | |
| 5.800% 03/01/37 | | | 325,000 | | | | 374,243 | | |
| Progress Energy, Inc. | |
| 7.750% 03/01/31 | | | 250,000 | | | | 337,328 | | |
| Southern California Edison Co. | |
| 5.000% 01/15/14 | | | 200,000 | | | | 223,307 | | |
| Electric Total | | | 3,202,813 | | |
See Accompanying Notes to Financial Statements.
15
Columbia Balanced Fund
August 31, 2010
| Corporate Fixed-Income Bonds & Notes (continued) | |
| | | Par ($) | | Value ($) | |
| Gas – 0.2% | |
| Atmos Energy Corp. | |
| 6.350% 06/15/17 | | | 300,000 | | | | 342,859 | | |
| Sempra Energy | |
| 6.500% 06/01/16 | | | 305,000 | | | | 362,859 | | |
| Gas Total | | | 705,718 | | |
| Utilities Total | | | 3,908,531 | | |
Total Corporate Fixed-Income Bonds & Notes
(cost of $35,468,281) | | | 37,493,588 | | |
| Mortgage-Backed Securities – 9.7% | |
| Federal Home Loan Mortgage Corp. | |
| 4.500% 10/01/39 | | | 1,037,287 | | | | 1,089,367 | | |
| 4.500% 01/01/40 | | | 1,603,731 | | | | 1,684,252 | | |
| 4.500% 06/01/40 | | | 2,953,955 | | | | 3,102,268 | | |
| 4.500% 07/01/40 | | | 499,329 | | | | 524,399 | | |
| 5.000% 12/01/38 | | | 161,112 | | | | 171,206 | | |
| 5.000% 10/01/39 | | | 899,290 | | | | 955,542 | | |
| 5.000% 01/01/40 | | | 1,062,210 | | | | 1,128,653 | | |
| 5.000% 08/01/40 | | | 1,000,000 | | | | 1,062,552 | | |
| 5.500% 12/01/18 | | | 566,710 | | | | 611,714 | | |
| 5.500% 07/01/19 | | | 170,847 | | | | 184,521 | | |
| 5.500% 07/01/21 | | | 118,679 | | | | 127,714 | | |
| 5.500% 08/01/21 | | | 13,793 | | | | 14,843 | | |
| 5.500% 12/01/36 | | | 469,543 | | | | 502,825 | | |
| 5.500% 07/01/38 | | | 847,758 | | | | 905,813 | | |
| 6.000% 03/01/17 | | | 34,912 | | | | 37,815 | | |
| 6.000% 04/01/17 | | | 220,012 | | | | 238,302 | | |
| 6.000% 05/01/17 | | | 111,852 | | | | 121,150 | | |
| 6.000% 08/01/17 | | | 77,773 | | | | 84,239 | | |
| 6.500% 08/01/32 | | | 79,742 | | | | 88,374 | | |
| 6.500% 03/01/38 | | | 246,100 | | | | 267,727 | | |
| TBA: | |
| 5.000% 08/01/40 (e) | | | 1,000,000 | | | | 1,061,094 | | |
| 6.000% 08/01/40 (e) | | | 1,000,000 | | | | 1,074,688 | | |
| 5.500% 08/01/40 (e) | | | 1,000,000 | | | | 1,067,188 | | |
| Federal National Mortgage Association | |
| 4.000% 01/01/25 | | | 1,540,638 | | | | 1,622,145 | | |
| 4.500% 05/01/40 | | | 1,840,917 | | | | 1,935,647 | | |
| 5.000% 05/01/37 | | | 995,345 | | | | 1,058,539 | | |
| 5.000% 03/01/38 | | | 746,514 | | | | 793,868 | | |
| 5.000% 08/01/39 | | | 1,436,160 | | | | 1,527,117 | | |
| 5.000% 05/01/40 | | | 745,923 | | | | 793,164 | | |
| 5.500% 03/01/37 | | | 1,093,439 | | | | 1,172,480 | | |
| 5.500% 06/01/37 | | | 746,318 | | | | 798,943 | | |
| 5.500% 09/01/37 | | | 1,020,332 | | | | 1,092,278 | | |
5.606% 07/01/32
(09/01/10) (c)(d) | | | 229,306 | | | | 243,763 | | |
| 6.500% 03/01/37 | | | 170,013 | | | | 185,627 | | |
| 6.500% 08/01/37 | | | 126,246 | | | | 137,604 | | |
| | | Par ($) | | Value ($) | |
| Government National Mortgage Association | |
| 4.500% 02/15/39 | | | 127,277 | | | | 135,346 | | |
| 5.500% 07/15/39 | | | 1,154,709 | | | | 1,252,028 | | |
| 6.000% 12/15/37 | | | 382,755 | | | | 417,410 | | |
| 7.000% 10/15/31 | | | 48,407 | | | | 55,404 | | |
| 7.000% 04/15/32 | | | 36,574 | | | | 41,897 | | |
| 7.000% 05/15/32 | | | 70,903 | | | | 81,223 | | |
Total Mortgage-Backed Securities
(cost of $28,599,313) | | | 29,450,729 | | |
| Government & Agency Obligations – 7.4% | |
| Foreign Government Obligations – 0.7% | |
| Petroleos Mexicanos | |
| 5.500% 01/21/21 (b) | | | 335,000 | | | | 349,689 | | |
| Province of Ontario | |
| 5.450% 04/27/16 | | | 675,000 | | | | 791,679 | | |
| Province of Quebec | |
| 4.625% 05/14/18 | | | 475,000 | | | | 540,697 | | |
| Svensk Exportkredit AB | |
| 5.125% 03/01/17 | | | 375,000 | | | | 434,208 | | |
| Foreign Government Obligations Total | | | 2,116,273 | | |
| U.S. Government Agencies – 0.5% | |
| Federal Home Loan Bank | |
| 5.500% 08/13/14 | | | 1,225,000 | | | | 1,424,917 | | |
| Federal Home Loan Mortgage Corp. | |
| 3.125% 10/25/10 (h) | | | 100,000 | | | | 100,440 | | |
| 3.750% 03/27/19 | | | 60,000 | | | | 65,273 | | |
| U.S. Government Agencies Total | | | 1,590,630 | | |
| U.S. Government Obligations – 6.2% | |
| U.S. Treasury Bonds | |
| 5.375% 02/15/31 | | | 6,057,000 | | | | 7,945,082 | | |
| U.S. Treasury Inflation Indexed Notes | |
| 3.000% 07/15/12 | | | 1,551,744 | | | | 1,645,212 | | |
| U.S. Treasury Notes | |
| 0.875% 02/29/12 | | | 1,250,000 | | | | 1,258,937 | | |
| 1.375% 09/15/12 | | | 1,000,000 | | | | 1,017,656 | | |
| 1.875% 06/30/15 | | | 1,000,000 | | | | 1,027,500 | | |
| 2.375% 10/31/14 | | | 4,000,000 | | | | 4,206,876 | | |
| 2.375% 02/28/15 | | | 1,800,000 | | | | 1,892,808 | | |
| U.S. Government Obligations Total | | | 18,994,071 | | |
Total Government & Agency Obligations
(cost of $20,604,478) | | | 22,700,974 | | |
| Commercial Mortgage-Backed Securities – 5.3% | |
| Bear Stearns Commercial Mortgage Securities | |
5.281% 10/12/42
(09/01/10) (c)(d) | | | 1,000,000 | | | | 1,063,168 | | |
See Accompanying Notes to Financial Statements.
16
Columbia Balanced Fund
August 31, 2010
| Commercial Mortgage-Backed Securities (continued) | |
| | | Par ($) | | Value ($) | |
5.742% 09/11/42
(09/01/10) (c)(d) | | | 750,000 | | | | 823,109 | | |
| Credit Suisse Mortgage Capital Certificates | |
5.846% 03/15/39
(09/01/10) (c)(d) | | | 660,000 | | | | 697,472 | | |
| CS First Boston Mortgage Securities Corp. | |
| 4.429% 12/15/36 | | | 685,454 | | | | 702,967 | | |
5.065% 08/15/38
(09/01/10) (c)(d) | | | 426,758 | | | | 450,580 | | |
| GE Capital Commercial Mortgage Corp. | |
| 4.706% 05/10/43 | | | 524,034 | | | | 523,754 | | |
| 4.819% 01/10/38 | | | 550,000 | | | | 583,893 | | |
| Greenwich Capital Commercial Funding Corp. | |
| 5.117% 04/10/37 | | | 681,986 | | | | 690,217 | | |
5.190% 04/10/37
(09/01/10) (c)(d) | | | 375,000 | | | | 404,479 | | |
| JPMorgan Chase Commercial Mortgage Securities Corp. | |
| 4.134% 10/15/37 | | | 277,243 | | | | 287,508 | | |
| 4.659% 07/15/42 | | | 441,932 | | | | 465,759 | | |
4.824% 10/15/42
(09/01/10) (c)(d) | | | 382,572 | | | | 404,589 | | |
5.201% 08/12/37
(09/01/10) (c)(d) | | | 672,111 | | | | 711,058 | | |
| 5.440% 06/12/47 | | | 820,000 | | | | 858,456 | | |
| 5.447% 06/12/47 | | | 791,000 | | | | 843,992 | | |
| 5.857% 10/12/35 | | | 1,482,036 | | | | 1,536,163 | | |
| LB-UBS Commercial Mortgage Trust | |
| 5.279% 11/15/38 | | | 827,617 | | | | 842,707 | | |
| 5.403% 02/15/40 | | | 820,000 | | | | 878,253 | | |
| Morgan Stanley Capital I | |
| 4.500% 06/15/40 | | | 262,955 | | | | 265,127 | | |
| 5.325% 12/15/43 | | | 820,000 | | | | 897,993 | | |
| Morgan Stanley Dean Witter Capital I | |
| 4.390% 09/15/37 | | | 381,241 | | | | 386,435 | | |
| 6.390% 10/15/35 | | | 597,646 | | | | 625,697 | | |
| Nationslink Funding Corp. | |
| 7.104% 01/22/26 | | | 308,872 | | | | 339,541 | | |
| Wachovia Bank Commercial Mortgage Trust | |
| 4.390% 02/15/41 | | | 747,725 | | | | 755,603 | | |
Total Commercial Mortgage-Backed Securities
(cost of $15,317,206) | | | 16,038,520 | | |
| Collateralized Mortgage Obligations – 1.6% | |
| Agency – 1.4% | |
| Federal Home Loan Mortgage Corp. | |
| 4.000% 10/15/18 | | | 1,900,000 | | | | 2,066,169 | | |
| 5.000% 08/15/32 | | | 370,000 | | | | 399,976 | | |
| 5.000% 05/15/33 | | | 700,000 | | | | 763,556 | | |
| Federal National Mortgage Association | |
| 5.500% 01/25/33 | | | 539,886 | | | | 556,324 | | |
| | | Par ($) | | Value ($) | |
| Government National Mortgage Association | |
| 4.000% 05/16/39 | | | 253,808 | | | | 262,684 | | |
| Agency Total | | | 4,048,709 | | |
| Non-Agency – 0.2% | |
| SACO I, Inc. | |
(i) 09/25/24
(09/01/10) (c)(d)(j) | | | 6,184 | | | | 2,041 | | |
| Structured Asset Securities Corp. | |
| 5.500% 05/25/33 | | | 347,020 | | | | 356,389 | | |
| 5.500% 07/25/33 | | | 328,554 | | | | 334,676 | | |
| Non-Agency Total | | | 693,106 | | |
Total Collateralized Mortgage Obligations
(cost of $4,448,840) | | | 4,741,815 | | |
| Asset-Backed Securities – 0.7% | |
| Capital Auto Receivables Asset Trust | |
| 5.300% 05/15/14 | | | 500,000 | | | | 520,522 | | |
| Cityscape Home Equity Loan Trust | |
| 7.410% 05/25/28 | | | 64,225 | | | | 63,167 | | |
| First Alliance Mortgage Loan Trust | |
| 7.340% 06/20/27 | | | 46,226 | | | | 47,283 | | |
| Franklin Auto Trust | |
| 5.360% 05/20/16 | | | 761,000 | | | | 781,125 | | |
| IMC Home Equity Loan Trust | |
| 7.520% 08/20/28 | | | 524,667 | | | | 527,759 | | |
| MMCA Automobile Trust | |
| 3.930% 03/15/13 (b) | | | 300,000 | | | | 307,869 | | |
Total Asset-Backed Securities
(cost of $2,246,169) | | | 2,247,725 | | |
| Short-Term Obligation – 3.2% | |
Repurchase agreement with
Fixed Income Clearing Corp.,
dated 08/31/10, due 09/01/10
at 0.190%, collateralized by a
U.S. Government Agency
obligation maturing 01/13/12,
market value $9,952,425
(repurchase proceeds
$9,754,051) | | | 9,754,000 | | | | 9,754,000 | | |
Total Short-Term Obligation
(cost of $9,754,000) | | | 9,754,000 | | |
Total Investments – 101.4%
(cost of $292,440,557) (k) | | | 308,934,722 | | |
| Other Assets & Liabilities, Net – (1.4)% | | | (4,152,315 | ) | |
| Net Assets – 100.0% | | | 304,782,407 | | |
See Accompanying Notes to Financial Statements.
17
Columbia Balanced Fund
August 31, 2010
Notes to Investment Portfolio:
(a) Non-income producing security.
(b) Security exempt from registration pursuant to Rule 144A under the Securities Act of 1933. These securities may be resold in transactions exempt from registration, normally to qualified institutional buyers. At August 31, 2010, these securities, which are not illiquid except for the following, amounted to $5,339,564, which represents 1.8% of net assets.
| Security | | Acquisition
Date | | Par | | Cost | | Value | |
Regency Energy
Partners LP/Regency
Energy Finance Corp.
9.375% 06/01/16 | | | 05/26/10 | | | $ | 95,000 | | | $ | 99,038 | | | $ | 103,075 | | |
(c) The interest rate shown on floating rate or variable rate securities reflects the rate at August 31, 2010.
(d) Parenthetical date represents the effective maturity date for the security.
(e) Security purchased on a delayed delivery basis.
(f) Security is guaranteed by the Federal Deposit Insurance Corporation.
(g) The issuer has filed for bankruptcy protection under Chapter 11, and is in default of certain debt covenants. Income is not being accrued. At August 31, 2010, the value of this security amounted to $57,750, which represents less than 0.1% of net assets.
(h) All of this security with a market value of $100,440 is pledged as collateral for open futures contracts.
(i) Zero coupon bond.
(j) Represents fair value as determined in good faith under procedures approved by the Board of Trustees. At August 31, 2010, the value of this security amounted to $2,041, which represents less than 0.1% of net assets.
(k) Cost for federal income tax purposes is $293,624,965.
Investments in affiliate during the year ended August 31, 2010:
| Affiliate | | Value,
beginning
of period | | Purchases | | Sales
Proceeds | | Interest
Income | | Value,
end of
period | |
Merrill Lynch &
Co., Inc. 6.050%
08/15/12 | | $ | 260,505 | | | $ | — | | | $ | (267,443 | ) | | $ | 10,083 | | | $ | — | | |
As of May 1, 2010, this company was no longer an affiliate of the Fund. The above table reflects activity for the period from September 1, 2009 through April 30, 2010.
The following table summarizes the inputs used, as of August 31, 2010, in valuing the Fund's assets:
| Description | | Quoted Prices
(Level 1) | | Other
Significant
Observable
Inputs
(Level 2) | | Significant
Unobservable
Inputs
(Level 3) | | Total | |
| Total Common Stocks | | $ | 186,507,371 | | | $ | — | | | $ | — | | | $ | 186,507,371 | | |
Total Corporate
Fixed-Income
Bonds & Notes | | | — | | | | 37,493,588 | | | | — | | | | 37,493,588 | | |
Total Mortgage-Backed
Securities | | | 3,202,970 | | | | 26,247,759 | | | | — | | | | 29,450,729 | | |
Government &
Agency Obligations | | | | | | | | | | | | | | | | | |
Foreign Government
Obligations | | | — | | | | 2,116,273 | | | | — | | | | 2,116,273 | | |
U.S. Government
Agencies | | | — | | | | 1,590,630 | | | | — | | | | 1,590,630 | | |
U.S. Government
Obligations | | | 17,966,571 | | | | 1,027,500 | | | | — | | | | 18,994,071 | | |
Total Government &
Agency Obligations | | | 17,966,571 | | | | 4,734,403 | | | | — | | | | 22,700,974 | | |
Total Commercial
Mortgage-Backed
Securities | | | — | | | | 16,038,520 | | | | — | | | | 16,038,520 | | |
Collateralized
Mortgage
Obligations | | | | | | | | | | | | | | | | | |
| Agency | | | — | | | | 4,048,709 | | | | — | | | | 4,048,709 | | |
| Non-Agency | | | — | | | | 691,065 | | | | 2,041 | | | | 693,106 | | |
Total Collateralized
Mortgage
Obligations | | | — | | | | 4,739,774 | | | | 2,041 | | | | 4,741,815 | | |
Total Asset-Backed
Securities | | | — | | | | 2,247,725 | | | | — | | | | 2,247,725 | | |
Total Short-Term
Obligation | | | — | | | | 9,754,000 | | | | — | | | | 9,754,000 | | |
| Total Investments | | | 207,676,912 | | | | 101,255,769 | | | | 2,041 | | | | 308,934,722 | | |
Unrealized
Depreciation on
Futures Contracts | | | (35,228 | ) | | | — | | | | — | | | | (35,228 | ) | |
| Total | | $ | 207,641,684 | | | $ | 101,255,769 | | | $ | 2,041 | | | $ | 308,899,494 | | |
Certain short-term obligations may be valued using amortized cost, an income approach which converts future cash flows to a present value based upon the premium or discount at purchase.
The following table reconciles asset balances for the year ended August 31, 2010, in which significant unobservable inputs (Level 3) were used in determining value:
Investment in
Securities | | Balance
as of
August 31,
2009 | | Accrued
Discounts/
(Premiums) | | Realized
Gain
(Loss) | | Change in
Unrealized
Appreciation
(Depreciation) | | Purchases | | Sales | | Transfers
into
Level 3 | | Transfers
out of
Level 3 | | Balance
as of
August 31, 2010 | |
Collateralized Mortgage Obligations
Non-Agency | | $ | 2,100 | | | $ | 19 | | | $ | 9 | | | $ | 93 | | | $ | — | | | $ | (180 | ) | | $ | — | | | $ | — | | | $ | 2,041 | | |
The information in the above reconciliation represents fiscal year to date activity for any securities identified as using Level 3 inputs at either the beginning or the end of the current fiscal period.
The change in unrealized appreciation attributed to securities owned at August 31, 2010, which were valued using significant unobservable inputs (Level 3) amounted to $93. This amount is included in net change in unrealized appreciation (depreciation) on the Statement of Changes in Net Assets.
For more information on valuation inputs, and their aggregation into the levels used in the tables above, please refer to the Security Valuation section in the accompanying Notes to Financial Statements.
See Accompanying Notes to Financial Statements.
18
Columbia Balanced Fund
August 31, 2010
At August 31, 2010, the Fund held the following open short futures contracts:
Risk
Exposure/
Type | | Number of
Contracts | | Value | | Aggregate
Face Value | | Expiration
Date | | Unrealized
Depreciation | |
Interest
Rate Risk
5-Year U.S.
Treasury
Notes | | | (51 | ) | | $ | (6,136,336 | ) | | $ | (6,101,108 | ) | | Dec-2010 | | $ | (35,228 | ) | |
At August 31, 2010, the asset allocation of the Fund is as follows:
| Asset Allocation (Unaudited) | | % of
Net Assets | |
| Common Stocks | | | 61.2 | | |
| Corporate Fixed-Income Bonds & Notes | | | 12.3 | | |
| Mortgage-Backed Securities | | | 9.7 | | |
| Government & Agency Obligations | | | 7.4 | | |
| Commercial Mortgage-Backed Securities | | | 5.3 | | |
| Collateralized Mortgage Obligations | | | 1.6 | | |
| Asset-Backed Securities | | | 0.7 | | |
| | | | 98.2 | | |
| Short-Term Obligation | | | 3.2 | | |
| Other Assets & Liabilities, Net | | | (1.4 | ) | |
| | | | 100.0 | | |
| Acronym | | Name | |
| ADR | | American Depositary Receipt | |
|
| PIK | | Payment-In-Kind | |
|
| TBA | | To Be Announced | |
|
See Accompanying Notes to Financial Statements.
19
Statement of Assets and Liabilities – Columbia Balanced Fund
August 31, 2010
| | | | | ($) | |
| Assets | | Investments, at identified cost | | | 292,440,557 | | |
| | | Investments, at value | | | 308,934,722 | | |
| | | Cash | | | 30,886 | | |
| | | Receivable for: | | | | | |
| | | Investments sold | | | 3,376,203 | | |
| | | Fund shares sold | | | 607,813 | | |
| | | Dividends | | | 358,367 | | |
| | | Interest | | | 808,418 | | |
| | | Foreign tax reclaims | | | 2,143 | | |
| | | Trustees' deferred compensation plan | | | 25,848 | | |
| | | Prepaid expenses | | | 5,888 | | |
| | | Total Assets | | | 314,150,288 | | |
| Liabilities | | Payable for: | | | | | |
| | | Investments purchased | | | 4,192,962 | | |
| | | Investments purchased on a delayed delivery basis | | | 3,498,517 | | |
| | | Fund shares repurchased | | | 1,310,829 | | |
| | | Futures variation margin | | | 13,945 | | |
| | | Investment advisory fee | | | 132,168 | | |
| | | Pricing and bookkeeping fees | | | 9,437 | | |
| | | Transfer agent fee | | | 74,215 | | |
| | | Trustees' fees | | | 28 | | |
| | | Audit fee | | | 43,600 | | |
| | | Custody fee | | | 2,439 | | |
| | | Distribution and service fees | | | 41,507 | | |
| | | Chief compliance officer expenses | | | 159 | | |
| | | Trustees' deferred compensation plan | | | 25,848 | | |
| | | Other liabilities | | | 22,227 | | |
| | | Total Liabilities | | | 9,367,881 | | |
| | | Net Assets | | | 304,782,407 | | |
| Net Assets Consist of | | Paid-in capital | | | 295,685,565 | | |
| | | Undistributed net investment income | | | 949,744 | | |
| | | Accumulated net realized loss | | | (8,311,839 | ) | |
| | | Net unrealized appreciation (depreciation) on: | | | | | |
| | | Investments | | | 16,494,165 | | |
| | | Futures contracts | | | (35,228 | ) | |
| | | Net Assets | | | 304,782,407 | | |
See Accompanying Notes to Financial Statements.
20
Statement of Assets and Liabilities (continued) – Columbia Balanced Fund
August 31, 2010
| Class A | | Net assets | | $ | 65,112,116 | | |
| | | Shares outstanding | | | 2,795,619 | | |
| | | Net asset value per share | | $ | 23.29 | (a) | |
| | | Maximum sales charge | | | 5.75 | % | |
| | | Maximum offering price per share ($23.29/0.9425) | | $ | 24.71 | (b) | |
| Class B | | Net assets | | $ | 6,682,903 | | |
| | | Shares outstanding | | | 287,536 | | |
| | | Net asset value and offering price per share | | $ | 23.24 | (a) | |
| Class C | | Net assets | | $ | 25,461,595 | | |
| | | Shares outstanding | | | 1,095,447 | | |
| | | Net asset value and offering price per share | | $ | 23.24 | (a) | |
| Class Z | | Net assets | | $ | 207,525,793 | | |
| | | Shares outstanding | | | 8,919,701 | | |
| | | Net asset value, offering and redemption price per share | | $ | 23.27 | | |
(a) Redemption price per share is equal to net asset value less any applicable contingent deferred sales charge.
(b) On sales of $50,000 or more the offering price is reduced.
See Accompanying Notes to Financial Statements.
21
Statement of Operations – Columbia Balanced Fund
For the Year Ended August 31, 2010
| | | | | ($) | |
| Investment Income | | Dividends | | | 2,665,063 | | |
| | | Interest | | | 4,298,517 | | |
| | | Interest from affiliate | | | 10,083 | | |
| | | Foreign taxes withheld | | | (42,924 | ) | |
| | | Total Investment Income | | | 6,930,739 | | |
| Expenses | | Investment advisory fee | | | 1,392,483 | | |
| | | Distribution fee: | | | | | |
| | | Class B | | | 54,490 | | |
| | | Class C | | | 141,506 | | |
| | | Service fee: | | | | | |
| | | Class A | | | 97,486 | | |
| | | Class B | | | 18,163 | | |
| | | Class C | | | 47,285 | | |
| | | Transfer agent fee | | | 358,051 | | |
| | | Pricing and bookkeeping fees | | | 97,492 | | |
| | | Trustees' fees | | | 25,471 | | |
| | | Custody fee | | | 25,338 | | |
| | | Chief compliance officer expenses | | | 1,003 | | |
| | | Other expenses | | | 232,694 | | |
| | | Total Expenses | | | 2,491,462 | | |
| | | Expense reductions | | | (259 | ) | |
| | | Net Expenses | | | 2,491,203 | | |
| | | Net Investment Income | | | 4,439,536 | | |
Net Realized and Unrealized Gain (Loss) on Investments, Futures Contracts and
Foreign Currency | | Net realized gain (loss) on: | | | | | |
| | | Investments | | | 11,082,133 | | |
| | | Foreign currency transactions | | | 103 | | |
| | | Futures contracts | | | (327,500 | ) | |
| | | Net realized gain | | | 10,754,736 | | |
| | | Net change in unrealized appreciation (depreciation) on: | | | | | |
| | | Investments | | | (4,814,278 | ) | |
| | | Futures contracts | | | (43,908 | ) | |
| | | Net change in unrealized appreciation (depreciation) | | | (4,858,186 | ) | |
| | | Net Gain | | | 5,896,550 | | |
| | | Net Increase Resulting from Operations | | | 10,336,086 | | |
See Accompanying Notes to Financial Statements.
22
Statement of Changes in Net Assets – Columbia Balanced Fund
| | | | | Year Ended August 31, | |
| Increase (Decrease) in Net Assets | | | | 2010 ($) | | 2009 ($) | |
| Operations | | Net investment income | | | 4,439,536 | | | | 4,481,770 | | |
| | | Net realized gain (loss) on investments, futures contracts
and foreign currency transactions | | | 10,754,736 | | | | (17,663,134 | ) | |
| | | Net change in unrealized appreciation (depreciation) on
investments and futures contracts | | | (4,858,186 | ) | | | 6,363,009 | | |
| | | Net increase (decrease) resulting from operations | | | 10,336,086 | | | | (6,818,355 | ) | |
| Distributions to Shareholders | | From net investment income: | | | | | | | | | |
| | | Class A | | | (525,553 | ) | | | (280,981 | ) | |
| | | Class B | | | (59,886 | ) | | | (115,048 | ) | |
| | | Class C | | | (136,210 | ) | | | (98,834 | ) | |
| | | Class Z | | | (3,796,805 | ) | | | (4,322,287 | ) | |
| | | Total distributions to shareholders | | | (4,518,454 | ) | | | (4,817,150 | ) | |
| | | Net Capital Stock Transactions | | | 69,045,371 | | | | 43,969,754 | | |
| | | Increase from regulatory settlements | | | 119 | | | | — | | |
| | | Total increase in net assets | | | 74,863,122 | | | | 32,334,249 | | |
| Net Assets | | Beginning of period | | | 229,919,285 | | | | 197,585,036 | | |
| | | End of period | | | 304,782,407 | | | | 229,919,285 | | |
| | | Undistributed net investment income at end of period | | | 949,744 | | | | 713,516 | | |
See Accompanying Notes to Financial Statements.
23
Statement of Changes in Net Assets (continued) – Columbia Balanced Fund
| | | Capital Stock Activity | |
| | | Year Ended
August 31, 2010 | | Year Ended
August 31, 2009 | |
| | | Shares | | Dollars ($) | | Shares | | Dollars ($) | |
| Class A | |
| Subscriptions | | | 2,433,066 | | | �� | 58,521,147 | | | | 708,774 | | | | 14,496,979 | | |
| Distributions reinvested | | | 19,569 | | | | 463,355 | | | | 12,409 | | | | 243,487 | | |
| Redemptions | | | (509,844 | ) | | | (12,154,454 | ) | | | (314,065 | ) | | | (6,131,842 | ) | |
| Net increase | | | 1,942,791 | | | | 46,830,048 | | | | 407,118 | | | | 8,608,624 | | |
| Class B | |
| Subscriptions | | | 87,910 | | | | 2,093,131 | | | | 145,116 | | | | 2,867,407 | | |
| Distributions reinvested | | | 2,295 | | | | 54,129 | | | | 5,350 | | | | 104,942 | | |
| Redemptions | | | (112,053 | ) | | | (2,684,099 | ) | | | (155,841 | ) | | | (3,021,067 | ) | |
| Net decrease | | | (21,848 | ) | | | (536,839 | ) | | | (5,375 | ) | | | (48,718 | ) | |
| Class C | |
| Subscriptions | | | 725,311 | | | | 17,383,404 | | | | 449,324 | | | | 9,081,085 | | |
| Distributions reinvested | | | 4,642 | | | | 109,653 | | | | 4,417 | | | | 85,684 | | |
| Redemptions | | | (125,817 | ) | | | (3,002,620 | ) | | | (96,186 | ) | | | (1,823,294 | ) | |
| Net increase | | | 604,136 | | | | 14,490,437 | | | | 357,555 | | | | 7,343,475 | | |
| Class Z | |
| Subscriptions | | | 2,249,164 | | | | 54,009,281 | | | | 2,436,622 | | | | 51,173,961 | | |
| Distributions reinvested | | | 133,969 | | | | 3,167,162 | | | | 210,989 | | | | 4,140,192 | | |
| Redemptions | | | (2,058,405 | ) | | | (48,914,718 | ) | | | (1,385,254 | ) | | | (27,247,780 | ) | |
| Net increase | | | 324,728 | | | | 8,261,725 | | | | 1,262,357 | | | | 28,066,373 | | |
See Accompanying Notes to Financial Statements.
24
Financial Highlights – Columbia Balanced Fund
Selected data for a share outstanding throughout each period is as follows:
| | | Year Ended August 31, | |
| Class A Shares | | 2010 | | 2009 | | 2008 | | 2007 | | 2006 | |
| Net Asset Value, Beginning of Period | | $ | 22.46 | | | $ | 24.03 | | | $ | 24.77 | | | $ | 22.51 | | | $ | 21.75 | | |
| Income from Investment Operations: | |
| Net investment income (a) | | | 0.35 | | | | 0.47 | | | | 0.53 | | | | 0.48 | | | | 0.38 | | |
Net realized and unrealized gain (loss) on investments,
foreign currency and futures contracts | | | 0.85 | | | | (1.52 | ) | | | (0.56 | ) | | | 2.26 | | | | 0.78 | | |
| Total from investment operations | | | 1.20 | | | | (1.05 | ) | | | (0.03 | ) | | | 2.74 | | | | 1.16 | | |
| Less Distributions to Shareholders: | |
| From net investment income | | | (0.37 | ) | | | (0.52 | ) | | | (0.56 | ) | | | (0.48 | ) | | | (0.40 | ) | |
| From net realized gains | | | — | | | | — | | | | (0.15 | ) | | | — | | | | — | | |
| Total distributions to shareholders | | | (0.37 | ) | | | (0.52 | ) | | | (0.71 | ) | | | (0.48 | ) | | | (0.40 | ) | |
| Increase from regulatory settlements | | | — | (b) | | | — | | | | — | | | | — | | | | — | | |
| Net Asset Value, End of Period | | $ | 23.29 | | | $ | 22.46 | | | $ | 24.03 | | | $ | 24.77 | | | $ | 22.51 | | |
| Total return (c) | | | 5.33 | % | | | (4.03 | )% | | | (0.22 | )% | | | 12.26 | % | | | 5.40 | %(d) | |
| Ratios to Average Net Assets/Supplemental Data: | |
| Net expenses before interest expense (e) | | | 1.02 | % | | | 1.04 | % | | | 0.99 | % | | | 1.02 | % | | | 0.98 | % | |
| Interest expense | | | — | | | | — | | | | — | | | | — | | | | — | %(f) | |
| Net expenses (e) | | | 1.02 | % | | | 1.04 | % | | | 0.99 | % | | | 1.02 | % | | | 0.98 | % | |
| Waiver/Reimbursement | | | — | | | | — | | | | — | | | | — | | | | 0.01 | % | |
| Net investment income (e) | | | 1.47 | % | | | 2.33 | % | | | 2.14 | % | | | 1.98 | % | | | 1.71 | % | |
| Portfolio turnover rate | | | 89 | % | | | 102 | % | | | 94 | % | | | 78 | % | | | 59 | % | |
| Net assets, end of period (000s) | | $ | 65,112 | | | $ | 19,152 | | | $ | 10,712 | | | $ | 6,582 | | | $ | 4,137 | | |
(a) Per share data was calculated using the average shares outstanding during the period.
(b) Rounds to less than $0.01 per share.
(c) Total return at net asset value assuming all distributions reinvested and no initial sales charge or contingent deferred sales charge.
(d) Had the investment advisor and/or any of its affiliates not waived fees or reimbursed a portion of expenses, total return would have been reduced.
(e) The benefits derived from expense reductions had an impact of less than 0.01%.
(f) Rounds to less than 0.01%.
See Accompanying Notes to Financial Statements.
25
Financial Highlights – Columbia Balanced Fund
Selected data for a share outstanding throughout each period is as follows:
| | | Year Ended August 31, | |
| Class B Shares | | 2010 | | 2009 | | 2008 | | 2007 | | 2006 | |
| Net Asset Value, Beginning of Period | | $ | 22.41 | | | $ | 23.99 | | | $ | 24.73 | | | $ | 22.47 | | | $ | 21.72 | | |
| Income from Investment Operations: | |
| Net investment income (a) | | | 0.17 | | | | 0.32 | | | | 0.34 | | | | 0.29 | | | | 0.21 | | |
Net realized and unrealized gain (loss) on investments,
foreign currency and futures contracts | | | 0.85 | | | | (1.53 | ) | | | (0.56 | ) | | | 2.27 | | | | 0.78 | | |
| Total from investment operations | | | 1.02 | | | | (1.21 | ) | | | (0.22 | ) | | | 2.56 | | | | 0.99 | | |
| Less Distributions to Shareholders: | |
| From net investment income | | | (0.19 | ) | | | (0.37 | ) | | | (0.37 | ) | | | (0.30 | ) | | | (0.24 | ) | |
| From net realized gains | | | — | | | | — | | | | (0.15 | ) | | | — | | | | — | | |
| Total distributions to shareholders | | | (0.19 | ) | | | (0.37 | ) | | | (0.52 | ) | | | (0.30 | ) | | | (0.24 | ) | |
| Increase from regulatory settlements | | | — | (b) | | | — | | | | — | | | | — | | | | — | | |
| Net Asset Value, End of Period | | $ | 23.24 | | | $ | 22.41 | | | $ | 23.99 | | | $ | 24.73 | | | $ | 22.47 | | |
| Total return (c) | | | 4.56 | % | | | (4.82 | )% | | | (0.97 | )% | | | 11.45 | % | | | 4.57 | %(d) | |
| Ratios to Average Net Assets/Supplemental Data: | |
| Net expenses before interest expense (e) | | | 1.77 | % | | | 1.79 | % | | | 1.74 | % | | | 1.77 | % | | | 1.73 | % | |
| Interest expense | | | — | | | | — | | | | — | | | | — | | | | — | %(f) | |
| Net expenses (e) | | | 1.77 | % | | | 1.79 | % | | | 1.74 | % | | | 1.77 | % | | | 1.73 | % | |
| Waiver/Reimbursement | | | — | | | | — | | | | — | | | | — | | | | 0.01 | % | |
| Net investment income (e) | | | 0.73 | % | | | 1.63 | % | | | 1.37 | % | | | 1.20 | % | | | 0.95 | % | |
| Portfolio turnover rate | | | 89 | % | | | 102 | % | | | 94 | % | | | 78 | % | | | 59 | % | |
| Net assets, end of period (000s) | | $ | 6,683 | | | $ | 6,934 | | | $ | 7,551 | | | $ | 6,955 | | | $ | 7,213 | | |
(a) Per share data was calculated using the average shares outstanding during the period.
(b) Rounds to less than $0.01 per share.
(c) Total return at net asset value assuming all distributions reinvested and no contingent deferred sales charge.
(d) Had the investment advisor and/or any of its affiliates not waived fees or reimbursed a portion of expenses, total return would have been reduced.
(e) The benefits derived from expense reductions had an impact of less than 0.01%.
(f) Rounds to less than 0.01%.
See Accompanying Notes to Financial Statements.
26
Financial Highlights – Columbia Balanced Fund
Selected data for a share outstanding throughout each period is as follows:
| | | Year Ended August 31, | |
| Class C Shares | | 2010 | | 2009 | | 2008 | | 2007 | | 2006 | |
| Net Asset Value, Beginning of Period | | $ | 22.42 | | | $ | 23.99 | | | $ | 24.73 | | | $ | 22.48 | | | $ | 21.72 | | |
| Income from Investment Operations: | |
| Net investment income (a) | | | 0.17 | | | | 0.31 | | | | 0.34 | | | | 0.29 | | | | 0.21 | | |
Net realized and unrealized gain (loss) on investments,
foreign currency and futures contracts | | | 0.84 | | | | (1.51 | ) | | | (0.56 | ) | | | 2.26 | | | | 0.79 | | |
| Total from investment operations | | | 1.01 | | | | (1.20 | ) | | | (0.22 | ) | | | 2.55 | | | | 1.00 | | |
| Less Distributions to Shareholders: | |
| From net investment income | | | (0.19 | ) | | | (0.37 | ) | | | (0.37 | ) | | | (0.30 | ) | | | (0.24 | ) | |
| From net realized gains | | | — | | | | — | | | | (0.15 | ) | | | — | | | | — | | |
| Total distributions to shareholders | | | (0.19 | ) | | | (0.37 | ) | | | (0.52 | ) | | | (0.30 | ) | | | (0.24 | ) | |
| Increase from regulatory settlements | | | — | (b) | | | — | | | | — | | | | — | | | | — | | |
| Net Asset Value, End of Period | | $ | 23.24 | | | $ | 22.42 | | | $ | 23.99 | | | $ | 24.73 | | | $ | 22.48 | | |
| Total return (c) | | | 4.51 | % | | | (4.77 | )% | | | (0.97 | )% | | | 11.40 | % | | | 4.62 | %(d) | |
| Ratios to Average Net Assets/Supplemental Data: | |
| Net expenses before interest expense (e) | | | 1.77 | % | | | 1.79 | % | | | 1.74 | % | | | 1.77 | % | | | 1.73 | % | |
| Interest expense | | | — | | | | — | | | | — | | | | — | | | | — | %(f) | |
| Net expenses (e) | | | 1.77 | % | | | 1.79 | % | | | 1.74 | % | | | 1.77 | % | | | 1.73 | % | |
| Waiver/Reimbursement | | | — | | | | — | | | | — | | | | — | | | | 0.01 | % | |
| Net investment income (e) | | | 0.71 | % | | | 1.57 | % | | | 1.39 | % | | | 1.20 | % | | | 0.98 | % | |
| Portfolio turnover rate | | | 89 | % | | | 102 | % | | | 94 | % | | | 78 | % | | | 59 | % | |
| Net assets, end of period (000s) | | $ | 25,462 | | | $ | 11,014 | | | $ | 3,209 | | | $ | 1,887 | | | $ | 1,491 | | |
(a) Per share data was calculated using the average shares outstanding during the period.
(b) Rounds to less than $0.01 per share.
(c) Total return at net asset value assuming all distributions reinvested and no contingent deferred sales charge.
(d) Had the investment advisor and/or any of its affiliates not waived fees or reimbursed a portion of expenses, total return would have been reduced.
(e) The benefits derived from expense reductions had an impact of less than 0.01%.
(f) Rounds to less than 0.01%.
See Accompanying Notes to Financial Statements.
27
Financial Highlights – Columbia Balanced Fund
Selected data for a share outstanding throughout each period is as follows:
| | | Year Ended August 31, | |
| Class Z Shares | | 2010 | | 2009 | | 2008 | | 2007 | | 2006 | |
| Net Asset Value, Beginning of Period | | $ | 22.43 | | | $ | 24.02 | | | $ | 24.75 | | | $ | 22.50 | | | $ | 21.74 | | |
| Income from Investment Operations: | |
| Net investment income (a) | | | 0.41 | | | | 0.52 | | | | 0.58 | | | | 0.53 | | | | 0.43 | | |
Net realized and unrealized gain (loss) on investments,
foreign currency and futures contracts | | | 0.86 | | | | (1.54 | ) | | | (0.54 | ) | | | 2.26 | | | | 0.79 | | |
| Total from investment operations | | | 1.27 | | | | (1.02 | ) | | | 0.04 | | | | 2.79 | | | | 1.22 | | |
| Less Distributions to Shareholders: | |
| From net investment income | | | (0.43 | ) | | | (0.57 | ) | | | (0.62 | ) | | | (0.54 | ) | | | (0.46 | ) | |
| From net realized gains | | | — | | | | — | | | | (0.15 | ) | | | — | | | | — | | |
| Total distributions to shareholders | | | (0.43 | ) | | | (0.57 | ) | | | (0.77 | ) | | | (0.54 | ) | | | (0.46 | ) | |
| Increase from regulatory settlements | | | — | (b) | | | — | | | | — | | | | — | | | | — | | |
| Net Asset Value, End of Period | | $ | 23.27 | | | $ | 22.43 | | | $ | 24.02 | | | $ | 24.75 | | | $ | 22.50 | | |
| Total return (c) | | | 5.64 | % | | | (3.87 | )% | | | 0.07 | % | | | 12.49 | % | | | 5.66 | %(d) | |
| Ratios to Average Net Assets/Supplemental Data: | |
| Net expenses before interest expense (e) | | | 0.77 | % | | | 0.79 | % | | | 0.74 | % | | | 0.77 | % | | | 0.73 | % | |
| Interest expense | | | — | | | | — | | | | — | | | | — | | | | — | %(f) | |
| Net expenses (e) | | | 0.77 | % | | | 0.79 | % | | | 0.74 | % | | | 0.77 | % | | | 0.73 | % | |
| Waiver/Reimbursement | | | — | | | | — | | | | — | | | | — | | | | 0.01 | % | |
| Net investment income (e) | | | 1.73 | % | | | 2.62 | % | | | 2.35 | % | | | 2.19 | % | | | 1.94 | % | |
| Portfolio turnover rate | | | 89 | % | | | 102 | % | | | 94 | % | | | 78 | % | | | 59 | % | |
| Net assets, end of period (000s) | | $ | 207,526 | | | $ | 192,819 | | | $ | 176,113 | | | $ | 196,615 | | | $ | 226,694 | | |
(a) Per share data was calculated using the average shares outstanding during the period.
(b) Rounds to less than $0.01 per share.
(c) Total return at net asset value assuming all distributions reinvested.
(d) Had the investment advisor and/or any of its affiliates not waived fees or reimbursed a portion of expenses, total return would have been reduced.
(e) The benefits derived from expense reductions had an impact of less than 0.01%.
(f) Rounds to less than 0.01%.
See Accompanying Notes to Financial Statements.
28
Notes to Financial Statements – Columbia Balanced Fund
August 31, 2010
Note 1. Organization
Columbia Balanced Fund (the "Fund"), a series of Columbia Funds Series Trust I (the "Trust"), is a diversified fund. The Trust is registered under the Investment Company Act of 1940, as amended (the "1940 Act"), as an open-end management investment company organized as a Massachusetts business trust.
Investment Objective
The Fund seeks high total return by investing in common stocks and debt securities.
Fund Shares
The Trust may issue an unlimited number of shares, and the Fund offers four classes of shares: Class A, Class B, Class C and Class Z. Each share class has its own expense structure and sales charges, as applicable. The Fund no longer accepts investments from new or existing investors in the Fund's Class B shares, except in connection with the reinvestment of any dividend and/or capital gain distributions in Class B shares of the Fund and exchanges by existing Class B shareholders of the other Columbia Funds.
Class A shares are subject to a maximum front-end sales charge of 5.75% based on the amount of initial investment. Class A shares purchased without an initial sales charge in accounts aggregating $1 million to $50 million at the time of purchase are subject to a 1.00% contingent deferred sales charge ("CDSC") if the shares are sold within one year after purchase. Class B shares are subject to a maximum CDSC of 5.00% based upon the holding period after purchase. Class B shares will convert to Class A shares eight years after purchase. Class C shares are subject to a 1.00% CDSC on shares sold within one year after purchase. Class Z shares are offered continuously at net asset value. There are certain restrictions on the purchase of Class Z shares, as described in the Fund's prospectus.
Note 2. Significant Accounting Policies
The preparation of financial statements in accordance with accounting principles generally accepted in the United States of America ("GAAP") requires management to make certain estimates and assumptions that affect the reported amounts of assets and liabilities, the disclosure of contingent assets and liabilities at the date of the financial statements and the reported amounts of revenue and expenses during the reporting period. Actual results could differ from those estimates.
Management has evaluated the events and transactions that have occurred through the date the financial statements were issued and noted no items requiring adjustment of the financial statements or additional disclosures.
The following is a summary of significant accounting policies consistently followed by the Fund in the preparation of its financial statements.
Security Valuation
Debt securities generally are valued by pricing services approved by the Trust's Board of Trustees, based upon market transactions for normal, institutional-size trading units of similar securities. The services may use various pricing techniques which take into account appropriate factors such as yield, quality, coupon rate, maturity, type of issue, trading characteristics and other data, as well as broker quotes. Debt securities for which quotations are readily available may also be valued based upon an over-the-counter or exchange bid quotation.
Certain debt securities, which tend to be more thinly traded and of lesser quality, are priced based on fundamental analysis of the financial condition of the issuer and the estimated value of any collateral. Valuations developed through pricing techniques may vary from the actual amounts realized upon sale of the securities, and the potential variation may be greater for those securities valued using fundamental analysis.
Equity securities are valued at the last sale price on the principal exchange on which they trade, except for securities traded on the NASDAQ, which are valued at the NASDAQ official close price. Unlisted securities or listed securities for which there were no sales during the day are valued at the closing bid price on such exchanges or over-the-counter markets.
Short-term investments maturing in 60 days or less are valued at amortized cost, which approximates market value.
Investments in other open-end investment companies are valued at net asset value.
Futures contracts are valued at the settlement price established each day by the board of trade or exchange on which they are traded.
29
Columbia Balanced Fund, August 31, 2010
Foreign securities are generally valued at the last sale price on the foreign exchange or market on which they trade. If any foreign share prices are not readily available as a result of limited share activity, the securities are valued at the last sale price of the local shares in the principal market in which such securities are normally traded.
Generally, trading in foreign securities is substantially completed each day at various times prior to the close of the New York Stock Exchange ("NYSE"). The values of such securities used in computing the net asset value of the Fund's shares are determined as of such times. Foreign currency exchange rates are generally determined at 4:00 p.m. Eastern (U.S.) time. Occasionally, events affecting the values of such foreign securities may occur between the times at which they are determined and the close of the customary trading session of the NYSE, which would not be reflected in the computation of the Fund's net asset value. If events materially affecting the values of such foreign securities occur and it is determined that market quotations are not reliable, then these foreign securities will be valued at their fair value using procedures approved by the Board of Trustees.
Investments for which market quotations are not readily available, or that have quotations which management believes are not reliable, are valued at fair value as determined in good faith under consistently applied procedures established by and under the general supervision of the Board of Trustees. If a security is valued at fair value, such value is likely to be different from the last quoted market price for the security. The determination of fair value often requires significant judgment. To determine fair value, management may use assumptions including but not limited to future cash flows and estimated risk premiums. Multiple inputs from various sources may be used to determine value.
GAAP establishes a hierarchy that prioritizes the inputs to valuation techniques used to measure fair value giving the highest priority to unadjusted quoted prices in active markets for identical securities (level 1 measurements) and the lowest priority to unobservable inputs (level 3 measurements) when market prices are not readily available or reliable. The three levels of the fair value hierarchy are described below:
• Level 1 – quoted prices in active markets for identical securities
• Level 2 – prices determined using other significant observable inputs (including quoted prices for similar securities, interest rates, prepayment speeds, credit risk and others)
• Level 3 – prices determined using significant unobservable inputs. In situations where quoted prices or observable inputs are unavailable or less reliable, unobservable inputs may be used. Unobservable inputs may include management's own assumptions about the factors market participants would use in pricing an investment.
The inputs or methodology used for valuing securities are not necessarily an indication of the risk associated with investing in those securities.
On January 21, 2010, the Financial Accounting Standards Board issued an Accounting Standards Update (the "amendment"), Fair Value Measurements and Disclosures (Topic 820): Improving Disclosures about Fair Value Measurements, which provides guidance on how investment assets and liabilities are to be valued and disclosed. Specifically, the amendment requires reporting entities to disclose the inputs and valuation techniques used to measure fair value for both recurring and nonrecurring fair value measurements for Level 2 and Level 3 positions. The amendment also requires that transfers between all levels (including Level 1 and Level 2) be disclosed on a gross basis (i.e., transfers out must be disclosed separately from transfers in), and requires disclosure of the reason(s) for sign ificant transfers. Additionally, purchases, sales, issuances and settlements must be disclosed on a gross basis in the Level 3 roll forward. The effective date of the amendment is for interim and annual periods beginning after December 15, 2009; except for the requirement to provide the Level 3 activity for purchases, sales, issuances and settlements on a gross basis, which will be effective for interim and annual periods beginning after December 15, 2010. At this time, management is evaluating the implications of the amendment and the impact to the financial statements.
Security Transactions
Security transactions are accounted for on the trade date. Cost is determined and gains (losses) are based upon the specific identification method for both financial statement and federal income tax purposes.
30
Columbia Balanced Fund, August 31, 2010
Derivative Instruments
The Fund may invest in derivative instruments. For additional information on derivative instruments, please see Note 6.
Repurchase Agreements
The Fund may engage in repurchase agreement transactions with institutions that management has determined are creditworthy. The Fund, through its custodian, receives delivery of the underlying securities collateralizing a repurchase agreement. Management is responsible for determining that the collateral is at least equal, at all times, to the value of the repurchase obligation including interest. A repurchase agreement transaction involves certain risks in the event of default or insolvency of the counterparty. These risks include possible delays in or restrictions on the Fund's ability to dispose of the underlying securities and a possible decline in the value of the underlying securities during the period while the Fund seeks to assert its rights.
Delayed Delivery Securities
The Fund may trade securities on other than normal settlement terms, including securities purchased or sold on a "when-issued" basis. This may increase the risk if the other party to the transaction fails to deliver and causes the Fund to subsequently invest at less advantageous prices. The Fund identifies within its portfolio of investments cash or liquid securities in an amount equal to the delayed delivery commitment.
Treasury Inflation Protected Securities
The Fund may invest in treasury inflation protected securities ("TIPS"). The principal amount of TIPS is increased for inflation or decreased for deflation based on a monthly published index. Interest payments are based on the adjusted principal at the time the interest is paid. These adjustments are recorded as interest income on the Statement of Operations.
Foreign Currency Transactions and Translations
The values of all assets and liabilities quoted in foreign currencies are translated into U.S. dollars at that day's exchange rates. Net realized and unrealized gains (losses) on foreign currency transactions and translations include gains (losses) arising from the fluctuation in exchange rates between trade and settlement dates on securities transactions, gains (losses) arising from the disposition of foreign currency and currency gains (losses) between the accrual and payment dates on dividends, interest income and foreign withholding taxes.
For financial statement purposes, the Fund does not distinguish that portion of gains (losses) on investments which is due to changes in foreign exchange rates from that which is due to changes in market prices of the investments. Such fluctuations are included with the net realized and unrealized gains (losses) on investments on the Statement of Operations.
Income Recognition
Interest income is recorded on the accrual basis. Premium and discount are amortized and accreted, respectively, on all debt securities, unless otherwise noted.
Corporate actions and dividend income are recorded on the ex-date except for certain foreign securities which are recorded as soon after the ex-date as the Fund becomes aware of such, net of any non-reclaimable tax withholdings.
Distributions received from real estate investment trusts (REITs) in excess of their income are recorded as a reduction of the cost of the related investments. If the Fund no longer owns the applicable securities, any distributions received in excess of income are recorded as realized gains.
Expenses
General expenses of the Trust are allocated to the Fund and other series of the Trust based upon relative net assets or other expense allocation methodologies determined by the nature of the expense. Expenses directly attributable to a specific class of shares are charged to that specific class. Expenses directly attributable to the Fund are charged to the Fund.
Determination of Class Net Asset Value
All income, expenses (other than class-specific expenses, as shown on the Statement of Operations) and realized and unrealized gains (losses) are allocated to each class of the Fund on a daily basis, based on the relative net assets of each class, for purposes of determining the net asset value of each class.
31
Columbia Balanced Fund, August 31, 2010
Federal Income Tax Status
The Fund intends to qualify each year as a "regulated investment company" under Subchapter M of the Internal Revenue Code, as amended, and will distribute substantially all of its taxable income, if any, for its tax year, and as such will not be subject to federal income taxes. In addition, the Fund intends to distribute in each calendar year substantially all of its net investment income, capital gains and certain other amounts, if any, such that the Fund should not be subject to federal excise tax. Therefore, no provision is made for federal income or excise taxes.
Distributions to Shareholders
Distributions from net investment income are declared and paid quarterly. Net realized capital gains, if any, are distributed at least annually. Income distributions and capital gain distributions are determined in accordance with federal income tax regulations which may differ from GAAP.
Indemnification
In the normal course of business, the Fund enters into contracts that contain a variety of representations and warranties and which provide general indemnities. The Fund's maximum exposure under these arrangements is unknown because this would involve future claims against the Fund. Also, under the Trust's organizational documents and by contract, the Trustees and officers of the Trust are indemnified against certain liabilities that may arise out of actions relating to their duties to the Trust. However, based on experience, the Fund expects the risk of loss due to these representations, warranties and indemnities to be minimal.
Note 3. Federal Tax Information
The timing and character of income and capital gain distributions are determined in accordance with income tax regulations, which may differ from GAAP. Reclassifications are made to the Fund's capital accounts for permanent tax differences to reflect income and gains available for distribution (or available capital loss carryforwards) under income tax regulations.
For the year ended August 31, 2010, permanent book and tax basis differences resulting primarily from differing treatments for amortization/accretion adjustments, paydown reclassifications, proceeds from litigation settlements and foreign currency transactions were identified and reclassified among the components of the Fund's net assets as follows:
Undistributed
Net Investment
Income | | Accumulated
Net Realized
Loss | | Paid-In Capital | |
| $ | 315,146 | | | $ | (315,025 | ) | | $ | (121 | ) | |
Net investment income and net realized gains (losses), as disclosed on the Statement of Operations, and net assets were not affected by this reclassification.
The tax character of distributions paid during the years ended August 31, 2010 and August 31, 2009 was as follows:
| | | August 31, | |
| | | 2010 | | 2009 | |
| Ordinary Income* | | $ | 4,518,454 | | | $ | 4,817,150 | | |
* For tax purposes short-term capital gains distributions, if any, are considered ordinary income distributions.
As of August 31, 2010, the components of distributable earnings on a tax basis were as follows:
Undistributed
Ordinary
Income | | Undistributed
Long-Term
Capital Gains | | Net Unrealized
Appreciation* | |
| $ | 1,148,967 | | | $ | — | | | $ | 15,309,757 | | |
* The differences between book-basis and tax-basis net unrealized appreciation are primarily due to deferral of losses from wash sales.
Unrealized appreciation and depreciation at August 31, 2010, based on cost of investments for federal income tax purposes, and excluding any unrealized appreciation and depreciation from changes in the value of other assets and liabilities resulting from changes in exchange rates, were:
| Unrealized appreciation | | $ | 22,621,481 | | |
| Unrealized depreciation | | | (7,311,724 | ) | |
| Net unrealized appreciation | | $ | 15,309,757 | | |
The following capital loss carryforwards may be available to reduce taxable income arising from future net realized gains
32
Columbia Balanced Fund, August 31, 2010
on investments, if any, to the extent permitted by the Internal Revenue Code:
| Year of Expiration | | Capital Loss
Carryforwards | |
| 2017 | | $ | 5,778,904 | | |
| 2018 | | | 1,414,302 | | |
| Total | | $ | 7,193,206 | | |
Management is required to determine whether a tax position of the Fund is more likely than not to be sustained upon examination by the applicable taxing authority, including resolution of any related appeals or litigation processes, based on the technical merits of the position. The tax benefit to be recognized by the Fund is measured as the largest amount of benefit that is greater than fifty percent likely of being realized upon ultimate settlement. Management is not aware of any tax positions for which it is reasonably possible that the total amounts of unrecognized tax benefits will significantly change in the next twelve months. However, management's conclusions may be subject to review and adjustment at a later date based on factors including, but not limited to, new tax laws, regulations, and administrative interpretations (including relevant court decisions). The Fund's federal tax returns for the prior three fiscal year s remain subject to examination by the Internal Revenue Service.
Note 4. Fees and Compensation Paid to Affiliates
Investment Advisory Fee
After the close of business on April 30, 2010, Ameriprise Financial, Inc. ("Ameriprise Financial") acquired a portion of the asset management business of Columbia Management Group, LLC (the "Transaction"), including the business of managing the Fund. In connection with the closing of the Transaction (the "Closing"), RiverSource Investments, LLC, a wholly owned subsidiary of Ameriprise Financial, became the investment advisor of the Fund and subsequently changed its name to Columbia Management Investment Advisers, LLC (the "New Advisor"). The New Advisor receives a monthly investment advisory fee at the annual rate of 0.50% of the Fund's average daily net assets.
Prior to the Closing, Columbia Management Advisors, LLC ("Columbia"), an indirect, wholly owned subsidiary of Bank of America Corporation ("BOA"), provided investment advisory, administrative and other services to the Fund under the same fee structure.
Administration Fee
Effective upon the Closing, the New Advisor became the administrator of the Fund under a new Administrative Services Agreement (the "Administrative Agreement"). Under the Administrative Agreement, the New Advisor provides administrative and other services to the Fund, including services previously performed under the Pricing and Bookkeeping Oversight and Services Agreement discussed below. The New Advisor does not receive a fee for its services under the Administrative Agreement. Prior to the Closing, Columbia provided administrative services to the Fund as discussed in the Investment Advisory Fee note above.
Pricing and Bookkeeping Fees
Prior to the Closing, the Fund entered into a Financial Reporting Services Agreement (the "Financial Reporting Services Agreement") with State Street Bank and Trust Company ("State Street") and Columbia pursuant to which State Street provides financial reporting services to the Fund. The Fund also entered into an Accounting Services Agreement (collectively with the Financial Reporting Services Agreement, the "State Street Agreements") with State Street and Columbia pursuant to which State Street provides accounting services to the Fund. Upon the Closing, Columbia assigned and delegated its rights and obligations under the State Street Agreements to the New Advisor. Under the State Street Agreements, the Fund pays State Street an annual fee of $38,000 paid monthly plus an additional monthly fee based on an annualized percentage rate of average daily net assets of the Fund for the month. The aggregate fee will not exceed $140,000 per year (exclusive of out-of-pocket expenses and charges). The Fund also reimburses State Street for certain out-of-pocket expenses and charges.
Also prior to the Closing, the Fund entered into a Pricing and Bookkeeping Oversight and Services Agreement (the "Services Agreement") with Columbia. Under the Services Agreement, Columbia provided services related to Fund expenses and the requirements of the Sarbanes-Oxley Act of 2002, and provided oversight of the accounting and financial
33
Columbia Balanced Fund, August 31, 2010
reporting services provided by State Street. Under the Services Agreement, the Fund reimbursed Columbia for out-of-pocket expenses. The Services Agreement was terminated upon the Closing. These services are now provided under the Administrative Agreement discussed above.
Transfer Agent Fee
In connection with the Closing, RiverSource Service Corporation, a wholly owned subsidiary of Ameriprise Financial, became the transfer agent of the Fund and subsequently changed its name to Columbia Management Investment Services Corp. (the "New Transfer Agent"). The New Transfer Agent has contracted with Boston Financial Data Services ("BFDS") to serve as sub-transfer agent. The New Transfer Agent receives a fee for its services, paid monthly, at the annual rate of $22.36 per account plus reimbursement of certain sub-transfer agent fees paid by the New Transfer Agent (exclusive of BFDS fees), calculated based on assets held in omnibus accounts and intended to recover the cost of payments to other parties (including affiliates of BOA) for services to those accounts. The New Transfer Agent pays the fees of BFDS for services as sub-transfer agent and is not entitled to reimbursement for such fees from the Fund.
The New Transfer Agent may also retain, as additional compensation for its services, fees for wire, telephone and redemption orders, Individual Retirement Account ("IRA") trustee agent fees and account transcript fees due to the New Transfer Agent from shareholders of the Fund and credits (net of bank charges) earned with respect to balances in accounts the New Transfer Agent maintains in connection with its services to the Fund. The New Transfer Agent also receives reimbursement for certain out-of-pocket expenses.
Prior to the Closing, Columbia Management Services, Inc. (the "Previous Transfer Agent"), an affiliate of Columbia and an indirect, wholly owned subsidiary of BOA, provided shareholder services to the Fund and contracted with BFDS to serve as sub-transfer agent, under the same fee structure. Prior to November 1, 2009, the annual rate was $17.34 per account.
An annual minimum account balance fee of $20 may apply to certain accounts with a value below the Fund's initial minimum investment requirements to reduce the impact of small accounts on transfer agent fees. These minimum account balance fees are recorded as part of expense reductions on the Statement of Operations. For the year ended August 31, 2010, no minimum account balance fees were charged by the Fund.
Underwriting Discounts, Service and Distribution Fees
In connection with the Closing, RiverSource Fund Distributors, Inc., an indirect wholly owned subsidiary of Ameriprise Financial, became the distributor of the Fund and subsequently changed its name to Columbia Management Investment Distributors, Inc. (the "New Distributor").
For the year ended August 31, 2010, initial sales charges paid by shareholders on the purchase of Class A shares amounted to $78,831 and net CDSC fees paid by shareholders on certain redemptions of Class A, Class B and Class C shares amounted to $3,062, $10,629 and $7,621, respectively.
The Fund has adopted shareholder servicing and distribution plans pursuant to Rule 12b-1 under the 1940 Act (the "Plans") which require the payment of a monthly service fee to the New Distributor at the maximum annual rate of 0.25% of the average daily net assets attributable to Class A, Class B and Class C shares of the Fund. The Plans also require the payment of a monthly distribution fee to the New Distributor at the maximum annual rates of 0.10%, 0.75% and 0.75% of the average daily net assets attributable to Class A, Class B and Class C shares, respectively.
The Fund may pay distribution and service fees up to a maximum annual rate of 0.35% of the Fund's average daily net assets attributable to Class A shares (comprised of up to 0.10% for distribution services and up to 0.25% for shareholder liaison services), but currently limit such fees to an aggregate fee of not more than 0.25% of the Fund's average daily net assets attributable to Class A shares.
The CDSC and the distribution fees received from the Plans are used principally as repayment to the New Distributor for amounts paid by the New Distributor to dealers who sold such shares.
Prior to the Closing, Columbia Management Distributors, Inc., an affiliate of Columbia and an indirect, wholly owned subsidiary of BOA, was the principal underwriter of the Fund's shares. There were no changes to the underwriting discount structure of the Fund or the service or distribution fee rates paid by the Fund as a result of the Transaction.
34
Columbia Balanced Fund, August 31, 2010
Expense Limits and Fee Waivers
Effective May 1, 2010, the New Advisor has voluntarily agreed to reimburse a portion of the Fund's expenses so that the Fund's ordinary operating expenses (excluding any distribution and service fees, brokerage commissions, interest, taxes and extraordinary expenses, but including custodian charges relating to overdrafts, if any), after giving effect to any balance credits from the Fund's custodian, do not exceed 0.95% of the Fund's average daily net assets on an annualized basis. This arrangement may be modified or terminated by the New Advisor at any time.
Prior to May 1, 2010, Columbia voluntarily agreed to reimburse a portion of the Fund's expenses so that the Fund's ordinary operating expenses (excluding any distribution and service fees, brokerage commissions, interest, taxes and extraordinary expenses, but including custodian charges relating to overdrafts, if any) after giving effect to any balance credits from the Fund's custodian, did not exceed 0.95% of the Fund's average daily net assets on an annualized basis.
Fees Paid to Officers and Trustees
In connection with the Closing, all officers of the Fund are employees of the New Advisor or its affiliates and, with the exception of the Fund's Chief Compliance Officer, receive no compensation from the Fund. The Board of Trustees has appointed a Chief Compliance Officer to the Fund in accordance with federal securities regulations. The Fund, along with other affiliated funds, pays its pro-rata share of the expenses associated with the Chief Compliance Officer. The Fund's expenses for the Chief Compliance Officer will not exceed $15,000 per year. Prior to the Closing, the Fund paid its pro-rata share of the expenses for the Chief Compliance Officer under the same fee structure.
Trustees are compensated for their services to the Fund, as set forth on the Statement of Operations. The Trust's eligible Trustees may participate in a deferred compensation plan which may be terminated at any time. Obligations of the plan will be paid solely out of the Fund's assets.
Other Related Party Transactions
Prior to the Closing, the Fund used one or more brokers that were affiliates of BOA in connection with the purchase and sale of its securities. Total brokerage commissions paid to affiliated brokers for the period prior to the Closing were $1,882.
Note 5. Custody Credits
The Fund has an agreement with its custodian bank under which custody fees may be reduced by balance credits. These credits are recorded as part of expense reductions on the Statement of Operations. The Fund could have invested a portion of the assets utilized in connection with the expense offset arrangement in an income-producing asset if it had not entered into such an agreement. For the year ended August 31, 2010, these custody credits reduced total expenses by $259 for the Fund.
Note 6. Objectives and Strategies for Investing in Derivative Instruments
The Fund uses derivatives instruments including futures contracts in order to meet its investment objectives. The Fund employs strategies in differing combinations to permit it to increase, decrease or change the level of exposure to market risk factors. The achievement of any strategy relating to derivatives depends on an analysis of various risk factors, and if the strategies for the use of derivatives do not work as intended, the Fund may not achieve its investment objectives.
In pursuit of its investment objectives, the Fund is exposed to the following market risks:
Interest rate risk: Interest rate risk relates to the fluctuation in value of fixed income securities because of the inverse relationship of price and yield. Fixed income securities generally will decline in value upon an increase in general interest rates and their value generally will increase upon a decline in general interest rates. Fixed income securities with longer durations tend to be more sensitive to changes in interest rates, usually making them more volatile than securities with shorter durations.
The following note provides more detailed information about the derivative type held by the Fund:
Futures—The Fund entered into interest rate futures contracts to manage its exposure to the securities markets and/or to movements in interest rates.
The use of futures contracts involves certain risks, which include: (1) imperfect correlation between the price movement of the instruments and the underlying securities, (2) inability to close out positions due to differing trading hours, or the temporary absence of a liquid market, for either the instruments or the underlying securities, and (3) an inaccurate prediction of the future direction of interest rates by the Fund's investment advisor.
35
Columbia Balanced Fund, August 31, 2010
Upon entering into a futures contract, the Fund identifies within its portfolio of investments cash or securities in an amount sufficient to meet the initial margin requirement. Subsequent payments are made or received by the Fund equal to the daily change in the contract value and are recorded as variation margin receivable or payable and offset in unrealized gains or losses. The Fund recognizes a realized gain or loss when the contract is closed or expires.
Futures contracts involve, to varying degrees, risk of loss in excess of the variation margin disclosed on the Statement of Assets and Liabilities.
During the year ended August 31, 2010, the Fund entered into 51 futures contracts.
The following table is a summary of the value of the Fund's derivative instruments as of August 31, 2010.
| | | Fair Value of Derivative Instruments | | | |
| | | Statement of Assts and Liabilities | | | |
| Asset | | Fair Value | | Liability | | Fair Value | |
| Futures variation margin | | | — | | | Futures variation margin | | $ | 13,945 | * | |
* Includes only the current day's variation margin.
The effect of derivative instruments on the Statement of Operations for the year ended August 31, 2010.
| | | Amount of Realized Gain or (Loss)
and Change in Unrealized Appreciation or
(Depreciation) on Derivatives Recognized in Income | |
| | | Risk Exposure | | Net Realized
Loss | | Change in
Unrealized
Appreciation
(Depreciation) | |
| Futures Contracts | | Interest Rate | | $ | (327,500 | ) | | $ | (43,908 | ) | |
Note 7. Portfolio Information
For the year ended August 31, 2010, the cost of purchases and proceeds from sales of securities, excluding short-term obligations, for the Fund were $309,075,686 and $239,068,802, respectively, of which $52,875,469 and $33,604,827, respectively, were U.S. Government securities.
Note 8. Regulatory Settlements
During the year ended August 31, 2010, the Fund received payments totaling $119 relating to certain regulatory settlements with third parties that the Fund had participated in during the twelve month period. The payments have been included in "Increase from regulatory settlements" on the Statement of Changes in Net Assets.
Note 9. Line of Credit
The Fund and other affiliated funds participate in a $280,000,000 committed, unsecured revolving line of credit provided by State Street. The maximum amount that may be borrowed by any fund is limited to the lesser of $200,000,000 and the Fund's borrowing limit set forth in the Fund's registration statement. Borrowings are available for short-term liquidity or temporary or emergency purposes.
Effective October 15, 2009, interest is charged to each participating fund based on the fund's borrowings at a rate per annum equal to the greater of the Federal Funds Rate plus 1.25% or the overnight LIBOR Rate plus 1.25%. In addition, a commitment fee of 0.15% per annum is accrued and apportioned among the participating funds pro rata based on their relative net assets.
36
Columbia Balanced Fund, August 31, 2010
Prior to October 15, 2009, interest was charged to each participating fund based on the fund's borrowings at a rate per annum equal to the greater of the Federal Funds Rate plus 0.50% or the overnight LIBOR Rate plus 0.50%. In addition, an annual operations agency fee of $20,000, an amendment fee of 0.02% and a commitment fee of 0.12% per annum were accrued and apportioned among the participating funds pro rata based on their relative net assets.
For the year ended August 31, 2010, the Fund did not borrow under these arrangements.
Note 10. Shareholder Concentration
As of August 31, 2010, one shareholder account owned 12.2% of the outstanding shares of the Fund. Purchase and redemption activity of this account may have a significant effect on the operations of the Fund.
Note 11. Significant Risks and Contingencies
Information Regarding Pending and Settled Legal Proceedings
In June 2004, an action captioned John E. Gallus et al. v. American Express Financial Corp. and American Express Financial Advisors Inc. was filed in the United States District Court for the District of Arizona. The plaintiffs allege that they are investors in several American Express Company (now known as legacy RiverSource) mutual funds and they purport to bring the action derivatively on behalf of those funds under the Investment Company Act of 1940. The plaintiffs allege that fees allegedly paid to the defendants by the funds for investment advisory and administrative services are excessive. The plaintiffs seek remedies including restitution and rescission of investment advisory and distribution agreements. The plaintiffs voluntarily agreed to transfer this case to the United States District Court for the District of Minnesota (the District Court). In response to defendants' motion to dismiss the complaint, the District Court dismissed one of plaintiffs' four claims and granted plaintiffs limited discovery. Defendants moved for summary judgment in April 2007. Summary judgment was granted in the defendants' favor on July 9, 2007. The plaintiffs filed a notice of appeal with the Eighth Circuit Court of Appeals (the Eighth Circuit) on August 8, 2007. On April 8, 2009, the Eighth Circuit reversed summary judgment and remanded to the District Court for further proceedings. On August 6, 2009, defendants filed a writ of certiorari with the U.S. Supreme Court (the Supreme Court), asking the Supreme Court to stay the District Court proceedings while the Supreme Court considers and rules in a case captioned Jones v. Harris Associates, which involves issues of law similar to those presented in the Gallus case. On March 30, 2010, the Supreme Court issued its ruling in Jones v. Harris Associates, and on April 5, 2010, the Supreme Court vacated the Eighth Circuit's decision in the Gallus case and remanded the case to the Eighth Circuit for further consideration in light of the Supreme Court's decision in Jones v. Harris Associates. On June 4, 2010, the Eighth Circuit remanded the Gallus case to the District Court for further consideration in light of the Supreme Court's decision in Jones v. Harris Associates.
In December 2005, without admitting or denying the allegations, American Express Financial Corporation (AEFC, which is now known as Ameriprise Financial, Inc. (Ameriprise Financial)), entered into settlement agreements with the Securities and Exchange Commission (SEC) and Minnesota Department of Commerce (MDOC) related to market timing activities. As a result, AEFC was censured and ordered to cease and desist from committing or causing any violations of certain provisions of the Investment Advisers Act of 1940, the Investment Company Act of 1940, and various Minnesota laws. AEFC agreed to pay disgorgement of $10 million and civil money penalties of $7 million. AEFC also agreed to retain an independent distribution consultant to assist in developing a plan for distribution of all disgorgement and civil penalties ordered by the SEC in accordance with various undertakings detailed at http://www.sec.gov/litigation/admin/ia-2451.pdf. Ameriprise Financial and its affiliates have cooperated with the SEC and the MDOC in these legal proceedings, and have made regular reports to the funds' Boards of Directors/Trustees.
Ameriprise Financial and certain of its affiliates have historically been involved in a number of legal, arbitration and regulatory proceedings, including routine litigation, class actions, and governmental actions, concerning matters arising in connection with the conduct of their business activities. Ameriprise Financial believes that the Funds are not currently the subject of, and that neither Ameriprise Financial nor any of its affiliates are the subject of, any pending legal, arbitration or regulatory proceedings that are likely to have a material adverse effect on the Funds or the ability of Ameriprise Financial or its affiliates to perform under their
37
Columbia Balanced Fund, August 31, 2010
contracts with the Funds. Ameriprise Financial is required to make 10-Q, 10-K and, as necessary, 8-K filings with the Securities and Exchange Commission on legal and regulatory matters that relate to Ameriprise Financial and its affiliates. Copies of these filings may be obtained by accessing the SEC website at www.sec.gov.
There can be no assurance that these matters, or the adverse publicity associated with them, will not result in increased fund redemptions, reduced sale of fund shares or other adverse consequences to the Funds. Further, although we believe proceedings are not likely to have a material adverse effect on the Funds or the ability of Ameriprise Financial or its affiliates to perform under their contracts with the Funds, these proceedings are subject to uncertainties and, as such, we are unable to estimate the possible loss or range of loss that may result. An adverse outcome in one or more of these proceedings could result in adverse judgments, settlements, fines, penalties or other relief that could have a material adverse effect on the consolidated financial condition or results of operations of Ameriprise Financial.
38
Report of Independent Registered Public Accounting Firm
To the Trustees of Columbia Funds Series Trust I and Shareholders of Columbia Balanced Fund
In our opinion, the accompanying statement of assets and liabilities, including the investment portfolios, and the related statements of operations and of changes in net assets and the financial highlights present fairly, in all material respects, the financial position of Columbia Balanced Fund (the "Fund") (a series of Columbia Funds Series Trust I) at August 31, 2010, the results of its operations for the year then ended, the changes in its net assets for each of the two years in the period then ended, and the financial highlights for each of the five years in the period then ended, in conformity with accounting principles generally accepted in the United States of America. These financial statements and financial highlights (hereafter referred to as "financial statements") are the responsibility of the Fund's management. Our responsibility is to express an opinion on these financial statements based on our audits. We conduct ed our audits of these financial statements in accordance with the standards of the Public Company Accounting Oversight Board (United States). Those standards require that we plan and perform the audit to obtain reasonable assurance about whether the financial statements are free of material misstatement. An audit includes examining, on a test basis, evidence supporting the amounts and disclosures in the financial statements, assessing the accounting principles used and significant estimates made by management, and evaluating the overall financial statement presentation. We believe that our audits, which included confirmation of securities at August 31, 2010 by correspondence with the custodian and brokers, provide a reasonable basis for our opinion.
PricewaterhouseCoopers LLP
Boston, Massachusetts
October 25, 2010
39
Federal Income Tax Information (Unaudited) – Columbia Balanced Fund
45.16% of the ordinary income distributed by the Fund for the fiscal year ended August 31, 2010 qualifies for the corporate dividends received deduction.
For non-corporate shareholders, 49.44% or the maximum amount allowable under the Jobs and Growth Tax Relief Reconciliation Act of 2003, of the ordinary income distributed by the Fund for the fiscal year ended August 31, 2010 may represent qualified dividend income.
The Fund will notify shareholders in January 2011 of amounts for use in preparing 2010 income tax returns.
40
Fund Governance
The Trustees serve terms of indefinite duration. The names, addresses and birth years of the Trustees and Officers of the Funds in the Columbia Funds Series Trust I, the year each was first elected or appointed to office, their principal business occupations during at least the last five years, the number of Funds overseen by each Trustee and other directorships they hold are shown below. Each officer listed below serves as an officer of each Fund in the Columbia Funds Complex.
Independent Trustees
Name, Address and Year of Birth,
Position with Funds, Year First
Elected or Appointed to Office | | Principal Occupation(s) During Past Five Years, Number of Funds in Columbia
Funds Complex Overseen by Trustee, Other Directorships Held
| |
| John D. Collins (Born 1938) | |
|
c/o Columbia Management
Investment Advisers, LLC
One Financial Center
Boston, MA 02111
Trustee (since 2005) | | Retired. Consultant, KPMG, LLP (accounting and tax firm) from July 1999 to June 2000; Partner, KPMG, LLP from March 1962 to June 1999. Oversees 64; Mrs. Fields Original Cookies, Inc. (consumer products); Suburban Propane Partners, L.P.; and Montpelier Re (insurance underwriting firm) | |
|
| Rodman L. Drake (Born 1943) | |
|
c/o Columbia Management
Investment Advisers, LLC
One Financial Center
Boston, MA 02111
Trustee (since 1994) and Chairman of the Board (since 2009) | | Co-Founder of Baringo Capital LLC (private equity) since 2002; CEO of Crystal River Capital, Inc. (real estate investment trust) since 2003; President, Continuation Investments Group, Inc. from 1997 to 2001. Oversees 64; Jackson Hewitt Tax Service Inc. (tax preparation services); Crystal Capital River, Inc. (real estate investment trust); Student Loan Corporation (student loan provider); Celgene Corporation (global biotechnology company); and The Helios Funds (exchange-traded funds); Apex Silver Mines Ltd. from 2007 to 2009 | |
|
| Douglas A. Hacker (Born 1955) | |
|
c/o Columbia Management
Investment Advisers, LLC
One Financial Center
Boston, MA 02111
Trustee (since 1996) | | Independent business executive since May 2006; Executive Vice President—Strategy of United Airlines (airline) from December 2002 to May 2006; President of UAL Loyalty Services (airline marketing company) from September 2001 to December 2002; Executive Vice President and Chief Financial Officer of United Airlines from July 1999 to September 2001. Oversees 64; Nash Finch Company (food distributor); Aircastle Limited (aircraft leasing) | |
|
| Janet Langford Kelly (Born 1957) | |
|
c/o Columbia Management
Investment Advisers, LLC
One Financial Center
Boston, MA 02111
Trustee (since 1996) | | Senior Vice President, General Counsel and Corporate Secretary, ConocoPhillips (integrated energy company) since September 2007; Deputy General Counsel—Corporate Legal Services, ConocoPhillips from August 2006 to August 2007; Partner, Zelle, Hofmann, Voelbel, Mason & Gette LLP (law firm) from March 2005 to July 2006; Adjunct Professor of Law, Northwestern University, from September 2004 to June 2006; Director, UAL Corporation (airline) from February 2006 to July 2006; Oversees 64; None | |
|
| Charles R. Nelson (Born 1942) | |
|
c/o Columbia Management
Investment Advisers, LLC
One Financial Center
Boston, MA 02111
Trustee (since 1981) | | Professor of Economics, University of Washington, since January 1976; Ford and Louisa Van Voorhis Professor of Political Economy, University of Washington, since September 1993; Adjunct Professor of Statistics, University of Washington, since September 1980; Associate Editor, Journal of Money Credit and Banking, 1993-2008; Consultant on econometric and statistical matters. Oversees 64; None | |
|
41
Fund Governance (continued)
Independent Trustees (continued)
Name, Address and Year of Birth,
Position with Funds, Year First
Elected or Appointed to Office | | Principal Occupation(s) During Past Five Years, Number of Funds in Columbia
Funds Complex Overseen by Trustee, Other Directorships Held
| |
| John J. Neuhauser (Born 1943) | |
|
c/o Columbia Management
Investment Advisers, LLC
One Financial Center
Boston, MA 02111
Trustee (since 1984) | | President, Saint Michael's College, since August 2007; Director or Trustee of several non-profit organizations, including Fletcher Allen Health Care, Inc.; University Professor, Boston College from November 2005 to August 2007; Academic Vice President and Dean of Faculties, Boston College from August 1999 to October 2005. Oversees 64; Liberty All-Star Equity Fund and Liberty All-Star Growth Fund, Inc. (closed-end funds) | |
|
| Jonathan Piel (Born 1938) | |
|
c/o Columbia Management
Investment Advisers, LLC
One Financial Center
Boston, MA 02111
Trustee (since 1994) | | Cable television producer and website designer; The Editor, Scientific American from 1984 to 1994; Vice President, Scientific American, Inc., from 1984 to 1994; Member, Advisory Board, Stone Age Institute, Bloomington, Indiana (research institute that explores the effect of technology on human evolution); Member, Board of Directors of the National Institute of Social Sciences, New York City; Member, Board of Trustees of the William Alanson White Institute, New York City (institution for training psychoanalysts); and Member, Advisory Board, Mount Sinai Children's Environmental Health Center, New York. Oversees 64; None | |
|
| Patrick J. Simpson (Born 1944) | |
|
c/o Columbia Management
Investment Advisers, LLC
One Financial Center
Boston, MA 02111
Trustee (since 2000) | | Partner, Perkins Coie LLP (law firm). Oversees 64; None | |
|
| Anne-Lee Verville (Born 1945) | |
|
c/o Columbia Management
Investment Advisers, LLC
One Financial Center
Boston, MA 02111
Trustee (since 1998) | | Retired since 1997 (formerly General Manager–Global Education Industry from 1994 to 1997, President–Application Systems Division from 1991 to 1994, Chief Financial Officer–US Marketing & Services from 1988 to 1991, and Chief Information Officer from 1987 to 1988, IBM Corporation (computer and technology)). Oversees 64; Enesco Group, Inc. (producer of giftware and home and garden decor products) from 2001 to 2006 | |
|
42
Fund Governance (continued)
Interested Trustee
Name, Address and Year of Birth,
Position with Funds, Year First
Elected or Appointed to Office | | Principal Occupation(s) During Past Five Years, Number of Funds in Columbia
Funds Complex Overseen by Trustee, Other Directorships Held
| |
| William E. Mayer1 (Born 1940) | |
|
c/o Columbia Management
Investment Advisers, LLC
One Financial Center
Boston, MA 02111
Trustee (since 1994) | | Partner, Park Avenue Equity Partners (private equity) since February 1999; Dean and Professor, College of Business and Management, University of Maryland from 1992 to 1996. Oversees 64; DynaVox Inc. (software developer); Lee Enterprises (print media); WR Hambrecht + Co. (financial service provider); BlackRock Kelso Capital Corporation (investment company) | |
|
1 Mr. Mayer may technically be an "interested person" (as defined in the Investment Company Act of 1940) by reason of his affiliation with WR Hambrecht + Co., a registered broker/dealer that may execute portfolio transactions for, engage in principal transactions with or distribute shares of a Fund or other funds or accounts advised/managed by the Adviser or any sub-adviser to a Fund.
The Statement of Additional Information includes additional information about the Trustees of the Funds and is available, without charge, upon request by calling 1-800-345-6611.
Officers
| Name, Year of Birth and Address | | Principal Occupation(s) During the Past Five Years | |
| J. Kevin Connaughton (Born 1964) | |
|
One Financial Center
Boston, MA 02111
President (since 2009) | | Senior Vice President and General Manager–Mutual Fund Products, Columbia Management Investment Advisers, LLC since May 2010; President, Columbia Funds, since 2009, and RiverSource Funds, since May 2010 (previously Senior Vice President and Chief Financial Officer, Columbia Funds, from June 2008 to January 2009, Treasurer, Columbia Funds, from October 2003 to May 2008, and senior officer of various other affiliated funds since 2000); Managing Director, Columbia Management Advisors, LLC from December 2004 to April 2010. | |
|
| Michael G. Clarke (Born 1969) | |
|
One Financial Center
Boston, MA 02111
Senior Vice President and Chief
Financial Officer (since 2009) | | Vice President, Columbia Management Investment Advisers, LLC since May 2010; Managing Director of Fund Administration, Columbia Management Advisors, LLC, from September 2004 to April 2010; senior officer of Columbia Funds and affiliated funds since 2002. | |
|
| Scott R. Plummer (Born 1959) | |
|
5228 Ameriprise Financial Center
Minneapolis, MN 55474
Senior Vice President, Secretary
and Chief Legal Officer (since 2010) | | Chief Legal Officer and Assistant Secretary, Columbia Management Investment Advisers, LLC since June 2005; Vice President and Lead Chief Counsel–Asset Management, Ameriprise Financial, Inc. since May 2010 (previously Vice President and Chief Counsel–Asset Management, from 2005 to April 2010, and Vice President–Asset Management Compliance from 2004 to 2005); Vice President, Chief Counsel and Assistant Secretary, Columbia Management Investment Distributors, Inc. since 2008; Vice President, General Counsel and Secretary, Ameriprise Certificate Company since 2005; Chief Counsel, RiverSource Distributors, Inc. since 2006; Vice President, General Counsel and Secretary, RiverSource Funds, since December 2006; Senior Vice President, Secretary and Chief Legal Officer, Columbia Funds, since May 2010. | |
|
43
Fund Governance (continued)
Officers (continued)
| Name, Year of Birth and Address | | Principal Occupation(s) During the Past Five Years | |
| Linda J. Wondrack (Born 1964) | |
|
One Financial Center
Boston, MA 02111
Senior Vice President and Chief
Compliance Officer (since 2007) | | Vice President and Chief Compliance Officer, Columbia Management Investment Advisers, LLC since May 2010; Chief Compliance Officer, Columbia Funds, since 2007, and RiverSource Funds, since May 2010; Director (Columbia Management Group, LLC and Investment Product Group Compliance), Bank of America, from June 2005 to April 2010; Director of Corporate Compliance and Conflicts Officer of MFS Investment Management (investment management) from August 2004 to May 2005. | |
|
| William F. Truscott (Born 1960) | |
|
53600 Ameriprise Financial Center
Minneapolis, MN 55474
Senior Vice President (since 2010) | | Chairman of the Board, Columbia Management Investment Advisers, LLC since May 2010 (previously President, Chairman of the Board and Chief Investment Officer, from 2001 to April 2010); Chief Executive Officer, U.S. Asset Management & President, Annuities, Ameriprise Financial, Inc. since May 2010 (previously President–U.S. Asset Management and Chief Investment Officer from 2005 to April 2010, and Senior Vice President—Chief Investment Officer, from 2001 to 2005); Director, President and Chief Executive Officer, Ameriprise Certificate Company since 2006; Director, Columbia Management Investment Distributors, Inc. since May 2010 (previously Chairman of the Board and Chief Executive Officer from 2008 to April 2010); Chairman of the Board and Chief Executive Officer, RiverSource Distributors, Inc. since 2006. | |
|
| Colin Moore (Born 1958) | |
|
One Financial Center
Boston, MA 02111
Senior Vice President (since 2010) | | Director and Chief Investment Officer, Columbia Management Investment Advisers, LLC since May 2010; Manager, Managing Director and Chief Investment Officer of Columbia Management Advisors, LLC from 2007 to April 2010; Head of Equities, Columbia Management Advisors, LLC from 2002 to 2007. | |
|
| Michael A. Jones (Born 1959) | |
|
100 Federal Street
Boston, MA 02110
Senior Vice President (since 2010) | | Director and President, Columbia Management Investment Advisers, LLC since May 2010; President and Director, Columbia Management Investment Distributors, Inc. since May 2010; Manager, Chairman, Chief Executive Officer and President, Columbia Management Advisors, LLC from 2007 to April 2010; Chief Executive Officer, President and Director, Columbia Management Distributors, Inc. from November 2006 to April 2010; previously, co-president and senior managing director at Robeco Investment Management. | |
|
| Amy Johnson (Born 1965) | |
|
5228 Ameriprise Financial Center
Minneapolis, MN 55474
Senior Vice President (since 2010) | | Senior Vice President and Chief Operating Officer, Columbia Management Investment Advisers, LLC since May 2010 (previously Chief Administrative Officer, from 2009 until April 2010, Vice President—Asset Management and Trust Company Services, from 2006 to 2009, and Vice President—Operations and Compliance from 2004 to 2006). | |
|
| Joseph F. DiMaria (Born 1968) | |
|
One Financial Center
Boston, MA 02111
Treasurer (since 2009) and
Chief Accounting Officer (since 2008) | | Vice President, Mutual Fund Administration, Columbia Management Investment Advisers, LLC, since May 2010; Director of Fund Administration, Columbia Management Advisors, LLC from January 2006 to April 2010; Head of Tax/Compliance and Assistant Treasurer, Columbia Management Advisors, LLC, from November 2004 to December 2005. | |
|
44
Fund Governance (continued)
Officers (continued)
| Name, Year of Birth and Address | | Principal Occupation(s) During the Past Five Years | |
| Marybeth Pilat (Born 1968) | |
|
One Financial Center
Boston, MA 02111
Deputy Treasurer (since 2010) | | Vice President, Mutual Fund Administration, Columbia Management Investment Advisers, LLC, since May 2010; Vice President, Investment Operations, Bank of America, from October 2008 to April 2010; Finance Manager, Boston Children's Hospital from August 2008 to October 2008; Director, Mutual Fund Administration, Columbia Management Advisors, LLC, from May 2007 to July 2008; Vice President, Mutual Fund Valuation, Columbia Management Advisors, LLC, from January 2006 to May 2007; Vice President, Mutual Fund Accounting Oversight, Columbia Management Advisors, LLC from January 2005 to January 2006. | |
|
| Julian Quero (Born 1967) | |
|
One Financial Center
Boston, MA 02111
Deputy Treasurer (since 2008) | | Vice President, Mutual Fund Administration, Columbia Management Investment Advisers, LLC since May 2010; Director of Fund Administration, Columbia Management Advisors, LLC, from August 2008 to April 2010; Senior Tax Manager, Columbia Management Advisors, LLC from August 2006 to July 2008; Senior Compliance Manager, Columbia Management Advisors, LLC from April 2002 to August 2006. | |
|
| Stephen T. Welsh (Born 1957) | |
|
One Financial Center
Boston, MA 02111
Vice President (since 2006) | | President and Director, Columbia Management Investment Services Corp. since May 2010; President and Director, Columbia Management Services, Inc. from July 2004 to April 2010; Managing Director, Columbia Management Distributors, Inc. from August 2007 to April 2010. | |
|
45
Summary of Management Fee Evaluation by Independent Fee Consultant (RiverSource Investments, LLC)
EXCERPT FROM REPORT OF INDEPENDENT FEE CONSULTANT TO THE FUNDS SUPERVISED BY THE COLUMBIA ATLANTIC BOARD
Prepared Pursuant to the February 9, 2005
Assurance of Discontinuance among the
Office of Attorney General of New York State,
Columbia Management Advisors, LLC, and
Columbia Management Distributors, Inc.
December 21, 2009
I. Overview
On February 9, 2005, Columbia Management Advisors, LLC ("CMA") and Columbia Management Distributors, Inc.1 ("CMD") agreed to the New York Attorney General's Assurance of Discontinuance ("AOD"). Among other things, the AOD stipulates that CMA may manage or advise a Columbia Fund ("Columbia Fund" and, together with some or all of such funds, the "Columbia Funds") only if the Independent Members of the Columbia Fund's Board of Trustees appoint a Senior Officer or retain an Independent Fee Consultant ("IFC") who is to manage the process by which proposed management fees are negotiated. The AOD further stipulates that the Senior Officer or IFC is to prepare a written annual evaluation of the fee negotiation process.
With effect from January 1, 2007, the Independent Members of the Board of Trustees for certain Columbia Funds known collectively as the "Atlantic Funds" (together with the other members of that Board, the "Trustees") retained me as IFC for the Atlantic Funds.2 In this capacity, I have prepared this written evaluation of the fee negotiation process. As was the case with the last three annual reports, my immediate predecessor as IFC, John Rea, provided invaluable assistance in the preparation of this report.
On September 29, 2009, Ameriprise entered into an asset purchase agreement with Bank of America, N.A. and its parent, Bank of America Corporation (together, the "Bank") pursuant to which the Bank agreed to sell certain CMG assets relating to Columbia's long-term asset management business, including management of the Atlantic Funds (the "Transaction").3 The Transaction if completed would result in the termination of the existing Investment Management Agreements with CMA. Therefore, the Trustees have been requested to approve and recommend to the shareholders of each Atlantic Fund new Investment Management and Sub-Advisory Agreements (together, the "Management Agreements") with RiverSource Investments, LLC ("RI"),4 investment manager of the RiverSource Funds and a subsidiary of Ameriprise. This report is intended to fulfill the requirements of the AOD with respect to the Trustees' consideration of the new Man agement Agreements.
A. Role of the Independent Fee Consultant
The AOD charges the IFC with "managing the process by which proposed management fees ... to be charged the Columbia Fund are negotiated so that they are negotiated in a manner which is at arms' length and reasonable and consistent with this Assurance of Discontinuance." The AOD also provides that CMA "may manage or advise a Columbia Fund only if the reasonableness of the proposed management fees is determined by the Board of Trustees ... using ... an annual independent written evaluation prepared by or under the direction of ... the Independent Fee Consultant." Therefore, the AOD makes clear that the IFC does not supplant the Trustees in negotiating management fees with CMA (or RI), nor does the IFC substitute his or her judgment for that of the Trustees with respect to the reasonableness of proposed fees or any other matter that is committed to the business judgment of the Trustees.
B. Elements Involved in Managing the Fee Negotiation Process
In preparing the report required by the AOD, the IFC must consider at least the following six factors set forth in the AOD:
1. The nature and quality of the adviser's services, including the Fund's performance;
1 CMA and CMD are subsidiaries of Columbia Management Group, LLC ("CMG"), and are the successors to the entities named in the AOD.
2 I have no material relationship with Bank of America, CMG or Ameriprise Financial, Inc. ("Ameriprise"), aside from serving as IFC, and I am aware of no material relationship with any of their affiliates. I retained John Rea, an independent economic consultant, to assist me with this report.
Unless otherwise stated or required by the context, this report covers only the Atlantic Funds.
3 Preliminary Response of Ameriprise to Information Request of Columbia Atlantic Board dated October 21, 2009 (hereafter, the "Preliminary Response"), p. 1. The one money market Atlantic Fund, Money Market Fund VS, was included in the Transaction because it was an integral part of CMG's array of Funds used as investment vehicles by variable annuity and similar insurance products.
4 Ameriprise intends to re-brand RI with the "Columbia" name (which is one of the assets being sold in the Transaction). Preliminary Response, pp. 4-5. In the case of new Sub-Advisory Agreements, the current sub-adviser would also be a party.
46
2. Management fees (including any components thereof) charged by other mutual fund companies for like services;
3. Possible economies of scale as the Fund grows larger;
4. Management fees (including any components thereof) charged to institutional and other clients of the adviser for like services;
5. Costs to the adviser and its affiliates of supplying services pursuant to the management fee agreements, excluding any intra-corporate profit; and
6. Profit margins of the adviser and its affiliates from supplying such services.
C. Data Presented to the Trustees
In considering the proposed new Management Agreements with RI, the Trustees relied in part on the data that had been prepared as part of their annual contract review process, which concluded in late October. This data remained relevant because the fees in the proposed Management Agreements were identical to the fees approved at that time. The annual review materials included a Lipper report on the performance of each Atlantic Fund compared to its peers and its benchmark, comparisons of the fees and expenses of each Atlantic Fund to similar CMG-sponsored Funds, comparable competitive funds chosen by Lipper, and institutional accounts advised by CMA, revenues, expenses, and profits of CMG from managing the Atlantic Funds, calculated both by Fund and collectively, and CMG's views on the existence and sharing of economies of scale.
In addition, the Trustees reviewed materials specific to the proposed new Management Agreements with RI in response to requests for information made on behalf of the Trustees, including the following:
• Performance data for the RiverSource Funds showing percentile and quartile rankings of each fund within its Lipper performance universe for periods up to five years and net returns of each fund relative to its benchmark returns. This data was arguably relevant due to the possibility that some RiverSource investment teams would be providing investment management services to certain Columbia Funds.5
• tables comparing the fee schedules and effective fee rates of funds managed by CMA and RI and institutional accounts advised by the two firms.
• extensive discussion of the process by which the various components of the two asset management businesses would be integrated including investment management, compliance, transfer agency, custody, fund accounting, and distribution.
• information about the financial condition of Ameriprise, including its most recent annual report on Form 10-K, RI's profit margins from managing the RiverSource Funds in 2007 and 2008, and pro forma income statements for the combined Columbia and RiverSource fund complex.
• disclosure that certain senior CMG executives, including President Michael Jones, Chief Investment Officer Colin Moore, Head of Mutual Funds J. Kevin Connaughton, and Chief Compliance Officer Linda Wondrack would continue in analogous capacities following the consummation of the Transaction, and
• a breakdown of the synergies RI expects to realize in the two years following the Transaction and the extent to which those potential synergies are expected to be shared with shareholders of funds advised by RI.
II. Findings
1. Based upon my examination of the information supplied by CMG and Ameriprise in the light of the six factors set forth in the AOD, I conclude that the Trustees have the relevant information necessary to evaluate the reasonableness of the proposed management fees for each Atlantic Fund.
2. In my view, the process by which the proposed management fees of the Atlantic Funds have been negotiated with RI thus far has been, to the extent practicable, at arms' length and reasonable and consistent with the AOD.
Respectfully submitted,
Steven E. Asher
5 On page 20 of its Supplemental Response to the Atlantic Trustees (undated but delivered November 24, 2009), Ameriprise said that "most personnel decisions, including with respect to the portfolio management teams for the Atlantic Funds . . . will be made primarily by [current CMA CIO] Colin Moore using the Columbia 5P process."
47
Shareholder Meeting Results
On March 3, 2010, a special meeting of shareholders of Columbia Funds Series Trust I was held to consider the approval of several proposals listed in the proxy statement for the meeting. Proposal 1 and Proposal 2 were voted on at the March 3, 2010 meeting of shareholders and Proposal 3 was voted on at an adjourned meeting of shareholders held on March 31, 2010. The shareholder meeting results are as follows:
Proposal 1: A proposed Investment Management Services Agreement with Columbia Management Investment Advisers, LLC (formerly, RiverSource Investments, LLC) (CMIA) was approved as follows:
| Votes For | | Votes Against | | Abstentions | | Broker Non-Votes | |
| | 130,285,696 | | | | 5,510,557 | | | | 6,550,823 | | | | 18,486,101 | | |
Proposal 2: A proposal authorizing CMIA to enter into and materially amend subadvisory agreements for the Fund in the future, with the approval of the Trust's Board of Trustees, but without obtaining additional shareholder approval, was approved as follows:
| Votes For | | Votes Against | | Abstentions | | Broker Non-Votes | |
| | 126,680,765 | | | | 9,019,160 | | | | 6,646,887 | | | | 18,486,363 | | |
Proposal 3: Each of the nominees for trustees was elected to the Trust's Board of Trustees, as follows:
| Trustee | | Votes For | | Votes Withheld | | Abstentions | |
| John D. Collins | | | 30,977,072,412 | | | | 859,827,038 | | | | 0 | | |
| Rodman L. Drake | | | 30,951,179,004 | | | | 885,720,446 | | | | 0 | | |
| Douglas A. Hacker | | | 30,989,793,279 | | | | 847,106,171 | | | | 0 | | |
| Janet Langford Kelly | | | 30,999,020,814 | | | | 837,878,636 | | | | 0 | | |
| William E. Mayer | | | 16,291,139,483 | | | | 15,545,759,967 | | | | 0 | | |
| Charles R. Nelson | | | 30,997,700,700 | | | | 839,198,750 | | | | 0 | | |
| John J. Neuhauser | | | 30,988,095,661 | | | | 848,803,789 | | | | 0 | | |
| Jonathon Piel | | | 30,968,801,048 | | | | 868,098,402 | | | | 0 | | |
| Patrick J. Simpson | | | 30,999,065,030 | | | | 837,834,420 | | | | 0 | | |
| Anne-Lee Verville | | | 30,996,227,913 | | | | 840,671,537 | | | | 0 | | |
48
Important Information About This Report
The fund mails one shareholder report to each shareholder address. If you would like more than one report, please call shareholder services at 1-800-345-6611 and additional reports will be sent to you. This report has been prepared for shareholders of Columbia Balanced Fund.
A description of the policies and procedures that the fund uses to determine how to vote proxies and a copy of the fund's voting records are available (i) at www.columbiamanagement.com, (ii) on the Securities and Exchange Commission's website at www.sec.gov, and (iii) without charge, upon request, by calling 1-800-368-0346. Information regarding how the fund voted proxies relating to portfolio securities during the 12-month period ended June 30 is available from the SEC's website. Information regarding how the fund voted proxies relating to portfolio securities is also available from the fund's website, www.columbiamanagement.com.
The fund files a complete schedule of portfolio holdings with the SEC for the first and third quarters of each fiscal year on Form N-Q. The fund's Form N-Q is available on the SEC's website at www.sec.gov and may be reviewed and copied at the SEC's Public Reference Room in Washington, D.C. Information on the operation of the Public Reference Room may be obtained by calling 1-800-SEC-0330.
Transfer Agent
Columbia Management Investment
Services Corp.
P.O. Box 8081
Boston, MA 02266-8081
1-800-345-6611
Distributor
Columbia Management Investment
Distributors, Inc.
One Financial Center
Boston, MA 02111
Investment Advisor
Columbia Management Investment Advisers, LLC
100 Federal Street
Boston, MA 02110
49

PRSRT STD
U.S. Postage
PAID
Holliston, MA
Permit NO. 20
Columbia Balanced Fund
P. O. Box 8081
Boston, MA 02266-8081
columbiamanagement.com
This information is for use with concurrent or prior delivery of a fund prospectus. Investors should consider the investment objectives, risks, charges and expenses of a mutual fund carefully before investing. For a free prospectus, which contains this and other important information about the funds, visit columbiamanagement.com. Read the prospectus carefully before investing. The Fund is distributed by Columbia Management Investment Distributors, Inc., member FINRA, and managed by Columbia Management Investment Advisers, LLC.
© 2010 Columbia Management Investment Advisers, LLC. All rights reserved.
C-1386 A (10/10)

Columbia Oregon Intermediate Municipal Bond Fund
Annual Report for the Period Ended August 31, 2010
Not FDIC insured • No bank guarantee • May lose value
Table of Contents
| Fund Profile | | | 1 | | |
|
| Economic Update | | | 2 | | |
|
| Performance Information | | | 4 | | |
|
| Understanding Your Expenses | | | 5 | | |
|
| Portfolio Manager's Report | | | 6 | | |
|
| Investment Portfolio | | | 8 | | |
|
Statement of Assets and
Liabilities | | | 17 | | |
|
| Statement of Operations | | | 18 | | |
|
Statement of Changes in
Net Assets | | | 19 | | |
|
| Financial Highlights | | | 21 | | |
|
| Notes to Financial Statements | | | 25 | | |
|
Report of Independent Registered
Public Accounting Firm | | | 33 | | |
|
| Federal Income Tax Information | | | 34 | | |
|
| Fund Governance | | | 35 | | |
|
Summary of Management Fee
Evaluation by Independent Fee
Consultant (RiverSource
Investments, LLC) | | | 40 | | |
|
| Shareholder Meeting Results | | | 42 | | |
|
Important Information About
This Report | | | 45 | | |
|
The views expressed in this report reflect the current views of the respective parties. These views are not guarantees of future performance and involve certain risks, uncertainties and assumptions that are difficult to predict, so actual outcomes and results may differ significantly from the views expressed. These views are subject to change at any time based upon economic, market or other conditions and the respective parties disclaim any responsibility to update such views. These views may not be relied on as investment advice and, because investment decisions for a Columbia Fund are based on numerous factors, may not be relied on as an indication of trading intent on behalf of any particular Columbia Fund. References to specific securities should not be construed as a recommendation or investment advice.
President's Message

Dear Shareholder:
The Columbia Management story began over 100 years ago, and today, we are one of the nation's largest dedicated asset managers. The recent acquisition by Ameriprise Financial, Inc. brings together the talents, resources and capabilities of Columbia Management with those of RiverSource Investments, Threadneedle (acquired by Ameriprise in 2003) and Seligman Investments (acquired by Ameriprise in 2008) to build a best-in-class asset management business that we believe is truly greater than its parts.
RiverSource Investments traces its roots to 1894 when its then newly-founded predecessor, Investors Syndicate, offered a face-amount savings certificate that gave small investors the opportunity to build a safe and secure fund for retirement, education or other special needs. A mutual fund pioneer, Investors Syndicate launched Investors Mutual Fund in 1940. In the decades that followed, its mutual fund products and services lineup grew to include a full spectrum of styles and specialties. More than 110 years later, RiverSource continues to be a trusted financial products leader.
Threadneedle, a leader in global asset management and one of Europe's largest asset managers, offers sophisticated international experience from a dedicated U.K. management team. Headquartered in London, it is named for Threadneedle Street in the heart of the city's financial district, where British investors pioneered international and global investing. Threadneedle was acquired in 2003 and today operates as an affiliate of Columbia Management.
Seligman Investments' beginnings date back to the establishment of the investment firm J. & W. Seligman & Co. in 1864. In the years that followed, Seligman played a major role in the geographical expansion and industrial development of the United States. In 1874, President Ulysses S. Grant named Seligman as fiscal agent for the U.S. Navy—an appointment that would last through World War I. Seligman helped finance the westward path of the railroads and the building of the Panama Canal. The firm organized its first investment company in 1929 and began managing its first mutual fund in 1930. In 2008, J. & W. Seligman & Co. Incorporated was acquired and Seligman Investments became an offering brand of RiverSource Investments, LLC.
We are proud of the rich and distinctive history of these firms, the strength and breadth of products and services they offer, and the combined cultures of pioneering spirit and forward thinking. Together we are committed to providing more for our shareholders than ever before.
> A singular focus on our shareholders
Our business is asset management, so investors are our first priority. We dedicate our resources to identifying timely investment opportunities and provide a comprehensive choice of equity, fixed-income and alternative investments to help meet your individual needs.
> First-class research and thought leadership
We are dedicated to helping you take advantage of today's opportunities and anticipate tomorrow's. We stay abreast of the latest investment trends and ideas, using our collective insight to evaluate events and transform them into solutions you can use.
> A disciplined investment approach
We aren't distracted by passing fads. Our teams adhere to a rigorous investment process that helps ensure the integrity of our products and enables you and your financial advisor to match our solutions to your objectives with confidence.
When you choose Columbia Management, you can be confident that we will take the time to understand your needs and help you and your financial advisor identify the solutions that are right for you. Because at Columbia Management, we don't consider ourselves successful unless you are.
Sincerely,

J. Kevin Connaughton
President, Columbia Funds
Investors should consider the investment objectives, risks, charges and expenses of a mutual fund carefully before investing. For a free prospectus, which contains this and other important information about the funds, visit columbiamanagement.com. The prospectus should be read carefully before investing.
Columbia Funds are distributed by Columbia Management Investment Distributors, Inc., member FINRA, and managed by Columbia Management Investment Advisers, LLC.
© 2010 Columbia Management Investment Advisers, LLC. All rights reserved.
Fund Profile – Columbia Oregon Intermediate Municipal Bond Fund
Summary
g For the 12-month period that ended August 31, 2010, the fund's Class A shares returned 7.68% without sales charge.
g The fund's benchmark, the Barclays Capital 3-15 Year Blend Municipal Bond Index1, returned 8.95%. The average fund in its peer group, the Lipper Other States Intermediate Municipal Debt Funds Classification2, returned 7.54%
g The fund had more exposure than the index to shorter-maturity, high quality bonds during a period in which longer-maturity, lower-rated bonds outperformed. This positioning accounted for the fund's modest shortfall relative to the index.
Portfolio Management
Brian M. McGreevy has managed the fund since December 2003 and has been associated with the advisor since May 2010. Prior to joining the advisor, Mr. McGreevy was associated with the fund's previous advisor or its predecessors since 1994.
Effective May 1, 2010, RiverSource Investments, LLC, a subsidiary of Ameriprise Financial, Inc., became the investment advisor to the fund and changed its name to Columbia Management Investment Advisers, LLC. Please see the fund's prospectus, as supplemented, for more information regarding the change in investment advisor and certain other changes.
1The Barclays Capital 3-15 Year Blend Municipal Bond Index tracks the performance of municipal bonds issued after December 31, 1990 with remaining maturities between 2 and 17 years and at least $7 million in principal amount outstanding. Indices are not available for investment, are not professionally managed and do not reflect sales charges, fees, brokerage commissions, taxes or other expenses of investing. Securities in the fund may not match those in an index.
2Lipper Inc., a widely respected data provider in the industry, calculates an average total return (assuming reinvestment of distributions) for mutual funds with investment objectives similar to those of the fund. Lipper makes no adjustment for the effect of sales loads.
Performance data quoted represents past performance and current performance may be lower or higher. Past performance is no guarantee of future results. The investment return and principal value will fluctuate so that shares, when redeemed, may be worth more or less than the original cost. Please visit www.columbiamanagement.com for daily and most recent month-end performance updates.
Summary
1-year return as of 08/31/2010
| | +7.68% | |
|
| |  | | | Class A shares
(without sales charge) | |
|
| | +8.95% | |
|
| |  | | | Barclays Capital 3-15 Year
Blend Municipal Bond Index | |
|
1
Economic Update – Columbia Oregon Intermediate Municipal Bond Fund
Summary
For the 12-month period that ended August 31, 2010
g Modest economic growth and relatively low interest rates boosted bond market returns. The Barclays Capital Aggregate Bond Index delivered solid results. High-yield bonds outperformed stocks, as measured by the JPMorgan Developed BB High Yield Index.
Barclays
Aggregate Index | | JPMorgan
Index | |
|
 | |  | |
|
g The U.S. stock market, as measured by the S&P 500 Index, delivered positive returns, despite a correction in the last months of the period. Emerging market stocks, as measured by the MSCI Emerging Markets Index (Net), outperformed U.S. stocks as well as stock markets in developed foreign markets.
| S&P Index | | MSCI Index | |
|
 | |  | |
|
Although it has been more than a year since U.S. economic growth turned positive, the economy continues to send mixed signals about the sustainability of this recovery. Economic growth, as measured by gross domestic product (GDP), was a solid 5.0% in the last quarter of 2009. However, it was 3.7% in the first quarter of 2010 and only 1.7% in the second quarter. Expectations are for continued lackluster growth through the end of the year, as government incentive programs have ended and stimulus spending winds down. Even so, it appears to be unlikely that the U.S. economy will sink back into recession as many key indicators remain positive.
Consumer spending on cars, clothing and other goods increased throughout the year, although the pace of increased spending was small. Personal income also moved higher. Consumer confidence, as measured by the Conference Board Consumer Confidence Index, gained ground in the first half of 2010. However, the index fell sharply in June and July before stabilizing in August. Consumers surveyed in the last three months of the reporting period indicated they were concerned about business conditions and job prospects and generally apprehensive about the future.
The housing market—another bellwether for the consumer sector—showed few positive signs. Both new and existing home sales fell in the final months of the period as a federal tax credit for new and repeat homebuyers expired. Distressed properties continued to pressure prices and a huge backlog of foreclosed homes is likely to continue to keep a lid on prices for some time. The national median price of existing homes rose slightly over the one-year period, while the national median price of new homes declined. Despite near-record low mortgage rates, the inventory of unsold homes rose to a 12.5 month supply, up sharply at the end of the period. The long-term average is on the order of six months.
News on the job front was mostly positive in 2010, but the number of new jobs added to the economy fell short of expectations. A good portion of the jobs added in March, April and May were temporary, government-sponsored census positions, which began to unwind in June, July and August. Private sector job growth was disappointing given the stage of economic recovery. Nevertheless, private sector payroll employment trended modestly higher in the summer and news of massive layoffs declined.
Reports from the business side of the economy were generally positive. A key measure of the nation's manufacturing situation—the Institute for Supply Management's Index—was generally positive, although the index trended slightly downward in the final months of the period. Industrial production moved higher, as did the amount of manufacturing capacity utilized—a key measure of the health of the manufacturing sector.
Bonds delivered solid returns
As the economy strengthened, bonds delivered solid returns. The Barclays Capital Aggregate Bond Index1 returned 9.18%. Municipal bonds gained almost as much as taxable investment-grade bonds, even without factoring in potential tax advantages to investors in higher income-tax brackets. The Barclays Capital 3-15 Year Blend
1The Barclays Capital Aggregate Bond Index is a market value-weighted index that tracks the daily price, coupon, pay-downs and total return performance of fixed-rate, publicly placed, dollar-denominated and non-convertible investment grade debt issues with at least $250 million par amount outstanding and with at least one year to final maturity.
2
Economic Update (continued) – Columbia Oregon Intermediate Municipal Bond Fund
Municipal Bond Index returned 8.95%. The high-yield bond market outpaced stocks during the period by a margin of more than three to one. For the 12 months covered by this report, the JPMorgan Developed BB High Yield Index2 returned 17.68% while the S&P 500 Index3 returned 4.91%. Even the Treasury market was positive as the yield on the 10-year U.S. Treasury, a common bellwether for the bond market, fell nearly one full percentage point, from 3.4% to 2.5% over the 12-month period. Despite the pickup in economic activity, the Federal Reserve Board (the Fed) kept a key short-term interest rate—the federal funds rate—close to zero.
Stock rally interrupted
Against a strengthening economic backdrop, a stock market rally that began early in 2009 continued into the spring of 2010. However, a debt crisis brewing in Europe raised concerns among U.S. investors, as did mixed signals on the economy, and some of the stock market's earlier gains vanished during the early summer. The S&P 500 Index returned 4.91% for the 12-month period. Outside the United States, stock market returns were mixed. The MSCI EAFE Index (Net),4 a broad gauge of stock market performance in foreign developed markets, returned negative 2.34% (net of dividends, in U.S. dollars) for the period, as concerns about the impact of a bailout for weak eurozone economies weighed on the markets. Emerging stock markets were more resilient. The MSCI Emerging Markets Index (Net)5 returned 18.02% (in U.S. dollars) for the 12-month period.
Past performance is no guarantee of future results.
2The JPMorgan Developed BB High Yield Index is an unmanaged index designed to mirror the investable universe of the U.S. dollar developed, BB-rated, high yield corporate debt market.
3The Standard & Poor's (S&P) 500 Index tracks the performance of 500 widely held, large-capitalization U.S. stocks.
4The Morgan Stanley Capital International Europe, Australasia, Far East (MSCI EAFE) Index (Net) is a free float-adjusted market capitalization index that is designed to measure the equity market performance of developed markets, excluding the U.S. & Canada. As of May 27, 2010 the MSCI EAFE Index (Net) consisted of the following 22 developed market country indices: Australia, Austria, Belgium, Denmark, Finland, France, Germany, Greece, Hong Kong, Ireland, Israel, Italy, Japan, the Netherlands, New Zealand, Norway, Portugal, Singapore, Spain, Sweden, Switzerland, and the United Kingdom.
5The Morgan Stanley Capital International Emerging Markets (MSCI EM) Index (Net) is a free float-adjusted market capitalization index that is designed to measure equity market performance of emerging markets. As of May 27, 2010, the MSCI Emerging Markets Index consisted of the following 21 emerging market country indices: Brazil, Chile, China, Colombia, Czech Republic, Egypt, Hungary, India, Indonesia, Korea, Malaysia, Mexico, Morocco, Peru, Philippines, Poland, Russia, South Africa, Taiwan, Thailand, and Turkey.
Indices are not available for investment, are not professionally managed and do not reflect sales charges, fees, brokerage commissions, taxes or other expenses of investing. Securities in the fund may not match those in an index.
3
Performance Information – Columbia Oregon Intermediate Municipal Bond Fund
Performance data quoted represents past performance and current performance may be lower or higher. Past performance is no guarantee of future results. The investment return and principal value will fluctuate so that shares, when redeemed, may be worth more or less than the original cost. Please visit www.columbiamanagement.com for daily and most recent month-end performance updates.
Annual operating expense ratio (%)*
| Class A | | | 0.90 | | |
| Class B | | | 1.65 | | |
| Class C | | | 1.65 | | |
| Class Z | | | 0.65 | | |
* The annual operating expense ratio is as stated in the fund's prospectus that is current as of the date of this report and includes the expenses incurred by the investment companies in which the fund invests. Differences in expense ratios disclosed elsewhere in this report may result from expenses incurred by the investment companies, inclusion of fee waivers and expense reimbursements as well as the use of different time periods to calculate the ratios.
Performance of a $10,000 investment 09/01/00 – 08/31/10
The chart above shows the change in value of a hypothetical $10,000 investment in Class A shares of Columbia Oregon Intermediate Municipal Bond Fund during the stated time period, and does not reflect the deduction of taxes that a shareholder may pay on fund distributions or on the redemption of fund shares. The performance of $10,000 with sales charge for Class A is calculated with an initial sales charge of 4.75%.
Performance of a $10,000 investment 09/01/00 – 08/31/10 ($)
| Sales charge | | without | | with | |
| Class A | | | 16,118 | | | | 15,358 | | |
| Class B | | | 15,204 | | | | 15,204 | | |
| Class C | | | 15,571 | | | | 15,571 | | |
| Class Z | | | 16,471 | | | | n/a | | |
Average annual total return as of 08/31/10 (%)
| Share class | | A | | B | | C | | Z | |
| Inception | | 11/01/02 | | 11/01/02 | | 10/13/03 | | 07/02/84 | |
| Sales charge | | without | | with | | without | | with | | without | | with | | without | |
| 1-year | | | 7.68 | | | | 4.17 | | | | 6.88 | | | | 3.88 | | | | 7.25 | | | | 6.25 | | | | 7.95 | | |
| 5-year | | | 4.11 | | | | 3.42 | | | | 3.34 | | | | 3.34 | | | | 3.69 | | | | 3.69 | | | | 4.37 | | |
| 10-year | | | 4.89 | | | | 4.38 | | | | 4.28 | | | | 4.28 | | | | 4.53 | | | | 4.53 | | | | 5.12 | | |
Average annual total return as of 09/30/10 (%)
| Share class | | A | | B | | C | | Z | |
| Sales charge | | without | | with | | without | | with | | without | | with | | without | |
| 1-year | | | 4.65 | | | | 1.23 | | | | 3.87 | | | | 0.87 | | | | 4.24 | | | | 3.24 | | | | 4.91 | | |
| 5-year | | | 4.15 | | | | 3.48 | | | | 3.39 | | | | 3.39 | | | | 3.74 | | | | 3.74 | | | | 4.42 | | |
| 10-year | | | 4.91 | | | | 4.40 | | | | 4.29 | | | | 4.29 | | | | 4.54 | | | | 4.54 | | | | 5.14 | | |
The "with sales charge" returns include the maximum initial sales charge of 3.25% for Class A shares and the applicable contingent deferred sales charge of 3.00% in the first year, declining to 1.00% in the fourth year, and eliminated thereafter for Class B shares and 1.00% for Class C shares for the first year only. The "without sales charge" returns do not include the effect of sales charges. If they had, returns would be lower.
The 10-year Class A average annual returns with sales charge as of August 31, 2010 and September 30, 2010 include the previous sales charge of 4.75%. The 1-year and 5-year Class A average annual returns with sales charge as of August 31, 2010 and September 30, 2010 include the new sales charge of 3.25%. This change was effective beginning August 22, 2005.
Performance results reflect any fee waivers or reimbursements of fund expenses by the investment advisor and/or any of its affiliates. Absent these fee waivers or expense reimbursement arrangements, performance results would have been lower.
All results shown assume reinvestment of distributions. Class Z shares are sold at net asset value with no distribution and service (Rule 12b-1) fees. Class Z shares have limited eligibility and the investment minimum requirements may vary. Please see the fund's prospectus for details. Performance for different share classes will vary based on differences in sales charges and fees associated with each class.
The tables do not reflect the deduction of taxes that a shareholder may pay on fund distributions or on the redemption of fund shares.
Class A, Class B and Class C are newer classes of shares. Class A and Class B share performance information includes the performance of Class Z shares (the oldest existing share class) for periods prior to their inception. Class C share performance information includes returns of Class B shares for the period from November 1, 2002 through October 12, 2003, and the returns of Class Z shares for periods prior thereto. These returns reflect differences in sales charges, but have not been restated to reflect any differences in expenses (such as distribution and service (Rule 12b-1) fees) between Class Z shares and the newer classes of shares. If differences in expenses had been reflected, the returns shown for periods prior to the inception of the newer classes of shares would have been lower, since the newer classes of shares are subject to distribution and service (Rule 12b-1) fees. Class A and Class B shares were initially offere d on November 1, 2002, Class C shares were initially offered on October 13, 2003 and Class Z shares were initially offered on July 2, 1984.
4
Understanding Your Expenses – Columbia Oregon Intermediate Municipal Bond Fund
As a fund shareholder, you incur two types of costs. There are transaction costs, which generally include sales charges on purchases and may include redemption fees or exchange fees. There are also ongoing costs, which generally include investment advisory fees, distribution and service (Rule 12b-1) fees and other fund expenses. The information on this page is intended to help you understand the ongoing costs of investing in the fund and to compare these costs with the ongoing costs of investing in other mutual funds.
Analyzing your fund's expenses by share class
To illustrate these ongoing costs, we have provided an example and calculated the expenses paid by investors in each share class during the period. The information in the following table is based on an initial investment of $1,000, which is invested at the beginning of the period and held for the entire period. Expense information is calculated two ways and each method provides you with different information. The amount listed in the "Actual" column is calculated using the fund's actual operating expenses and total return for the period. The amount listed in the "Hypothetical" column for each share class assumes that the return each year is 5% before expenses and is calculated based on the fund's actual operating expenses. You should not use the hypothetical account values and expenses to estimate either your actual account balance at the end of the period or the expenses you paid during this period.
Compare with other funds
Since all mutual funds are required to include the same hypothetical calculations about expenses in shareholder reports, you can use this information to compare the ongoing cost of investing in the fund with other funds. To do so, compare the 5% hypothetical example with the 5% hypothetical examples that appear in the shareholder reports of other funds. As you compare hypothetical examples of other funds, it is important to note that hypothetical examples are meant to highlight the ongoing costs of investing in a fund and do not reflect any transaction costs, such as sales charges, redemption fees or exchange fees.
Estimating your actual expenses
To estimate the expenses that you paid over the period, first you will need your account balance at the end of the period:
g For shareholders who receive their account statements from Columbia Management Investment Services Corp., your account balance is available online at www.columbiamanagement.com or by calling Shareholder Services at 800.345.6611.
g For shareholders who receive their account statements from their financial intermediary, contact your financial intermediary to obtain your account balance.
1. Divide your ending account balance by $1,000. For example, if an account balance was $8,600 at the end of the period, the result would be 8.6.
2. In the section of the table below titled "Expenses paid during the period," locate the amount for your share class. You will find this number in the column labeled "Actual." Multiply this number by the result from step 1. Your answer is an estimate of the expenses you paid on your account during the period.
If the value of your account falls below the minimum initial investment requirement applicable to you, your account may be subject to a $20 annual fee. This fee is not included in the accompanying table. If you are subject to the fee, keep it in mind when you are estimating the ongoing expenses of investing in the fund and when comparing the expenses of this fund with other funds.
03/01/10 – 08/31/10
| | | Account value at the
beginning of the period ($) | | Account value at the
end of the period ($) | | Expenses paid
during the period ($) | | Fund's annualized
expense ratio (%) | |
| | | Actual | | Hypothetical | | Actual | | Hypothetical | | Actual | | Hypothetical | | Actual | |
| Class A | | | 1,000.00 | | | | 1,000.00 | | | | 1,043.80 | | | | 1,021.17 | | | | 4.12 | | | | 4.08 | | | | 0.80 | | |
| Class B | | | 1,000.00 | | | | 1,000.00 | | | | 1,039.90 | | | | 1,017.39 | | | | 7.97 | | | | 7.88 | | | | 1.55 | | |
| Class C | | | 1,000.00 | | | | 1,000.00 | | | | 1,041.70 | | | | 1,019.16 | | | | 6.18 | | | | 6.11 | | | | 1.20 | | |
| Class Z | | | 1,000.00 | | | | 1,000.00 | | | | 1,045.10 | | | | 1,022.43 | | | | 2.84 | | | | 2.80 | | | | 0.55 | | |
Expenses paid during the period are equal to the annualized expense ratio for the share class, multiplied by the average account value over the period, then multiplied by the number of days in the fund's most recent fiscal half-year and divided by 365.
Had the investment advisor and/or any of its affiliates not waived fees or reimbursed a portion of expenses, account value at the end of the period would have been reduced.
It is important to note that the expense amounts shown in the table are meant to highlight only ongoing costs of investing in the fund and do not reflect any transaction costs, such as sales charges, redemption fees or exchange fees. Therefore, the hypothetical examples provided may not help you determine the relative total costs of owning shares of different funds. If these transaction costs were included, your costs would have been higher.
5
Portfolio Manager's Report – Columbia Oregon Intermediate Municipal Bond Fund
Performance data quoted represents past performance and current performance may be lower or higher. Past performance is no guarantee of future results. The investment return and principal value will fluctuate so that shares, when redeemed, may be worth more or less than the original cost. Please visit www.columbiamanagement.com for daily and most recent month-end performance updates.
Net asset value per share
as of 08/31/10 ($)
| Class A | | | 12.67 | | |
| Class B | | | 12.67 | | |
| Class C | | | 12.67 | | |
| Class Z | | | 12.67 | | |
Distributions declared per share
09/01/09 – 08/31/10 ($)
| Class A | | | 0.42 | | |
| Class B | | | 0.32 | | |
| Class C | | | 0.37 | | |
| Class Z | | | 0.45 | | |
A portion of the fund's income may be subject to the alternative minimum tax. The fund may at times purchase tax-exempt securities at a discount. Some or all of this discount may be included in the fund's ordinary income, and is taxable when distributed.
Top 5 sectors
as of 08/31/10 (%)
| Tax-Backed | | | 48.1 | | |
| Refunded/Escrowed | | | 15.3 | | |
| Health Care | | | 9.6 | | |
| Utilities | | | 8.9 | | |
| Housing | | | 4.6 | | |
Maturity breakdown
as of 08/31/10 (%)
| 0–1 year | | | 8.9 | | |
| 1–3 years | | | 9.8 | | |
| 3–5 years | | | 6.5 | | |
| 5–7 years | | | 12.1 | | |
| 7–10 years | | | 14.8 | | |
| 10–15 years | | | 26.9 | | |
| 15–20 years | | | 13.2 | | |
| 20–25 years | | | 2.0 | | |
| 25+ years | | | 0.8 | | |
| Net Cash & Equivalents | | | 5.0 | | |
For the 12-month period that ended August 31, 2010, the fund's Class A shares returned 7.68% without sales charge. The fund's benchmark, the Barclays Capital 3-15 Year Blend Municipal Bond Index, returned 8.95%. The fund's return was slightly higher than the 7.54% average return of its peer group, the Lipper Other States Intermediate Municipal Debt Funds Category. The fund's modest shortfall relative to the index was the result of its positioning. The fund had more exposure than the index to shorter-maturity, high quality bonds during a period in which longer-maturity, lower-rated bonds outperformed.
A strong year for municipals market
Substantial inflows from individual investors into municipal bonds as well as a decrease in the overall supply of tax-exempt bonds drove solid returns for municipal bonds over the 12-month period.
New supply has dropped significantly with the heavy issuance of Build America Bonds (BABs), which are taxable. Although total issuance of municipal bonds in 2010 is close to 2009 levels, over $70 billion of taxable BABs have been issued, thus decreasing the available tax-exempt supply. With municipal money market rates close to zero, investors moved money into individual municipal bonds or municipal bond funds, which have enjoyed net positive flows of more than $30 billion through August 2010. This strong demand, coupled with decreased new issue supply, drove yields down, prices up and narrowed the yield difference between higher- and lower-quality credits.
Hospital, Housing and Education bonds, lower-quality bonds aided performance
Holdings in the hospital, housing and education sectors enjoyed strong returns for the period, while pre-refunded bonds and state general obligation bonds were less robust. Lower-quality bonds also performed well. Many of the fund's A- and BBB-rated holdings generated double-digit returns for the 12-month period. An overweight in non-rated bonds and an underweight in AAA bonds also aided performance.
Lack of new supply constrained portfolio activity
With relatively light new issue supply in Oregon, we were constrained in adding new issues to the fund. However, where we could, we added bonds in the 10- to 15-year maturity range, which we believed offered good value and we decreased the fund's exposure to shorter-maturity callable bonds.
Oregon economy shows signs of recovery
In July 2010, Moody's Investor Services affirmed the state's AA1 rating with a stable outlook. The rating agency cited sound financial controls and maintenance of a moderate rainy day fund balance as positive signs of the state's economic standing, while noting that its high reliance on personal income taxes was a credit challenge because of its volatility.
As major layoff announcements slowed and several of the state's larger employers have started hiring, economic activity picked up in Oregon over the past year. We expect that new hiring will be led by the technology manufacturing sector while real estate will
6
Portfolio Manager's Report (continued) – Columbia Oregon Intermediate Municipal Bond Fund
continue to be a drag on economic growth. Voters approved a tax increase on incomes over $125,000 and $250,000 retroactive to January 2009 and expiring in December 2011. The two new higher tax brackets are expected to add additional revenue to the state's budget. They also make the municipal market more attractive to households affected by the increase.
Looking ahead
We see value in issues with maturities between seven and 15 years, especially for bonds with A ratings. With the Fed expected to be on hold until employment growth picks up, we expect short-term interest rates to remain low for some time to come. The current "steep" yield curve and the "roll down" value (capturing the value and gain of a bond as its maturity shortens over time and is priced at lower yields) have the potential to enhance returns in the longer-intermediate portion of the curve. The municipal yield curve, a graphic depiction of yields, from short to long, is considered steep when the yield difference between two-year and 15-year AAA-rated munis is greater than 164 basis points (one hundredth of one percent), its five-year average. The current spread between two- and 15-year municipal bonds is 245 basis points.
Portfolio characteristics and holdings are subject to change and may not be representative of current characteristics and holdings. The outlook for this fund may differ from that presented for other Columbia Funds.
Tax-exempt investing offers current tax-exempt income, but it also involves special risks. The value of the fund will be affected by interest rate changes and the creditworthiness of issues held in the fund. When interest rates go up, bond prices generally drop and vice versa.
Interest income from certain tax-exempt bonds may be subject to certain state and local taxes and, if applicable, the alternative minimum tax. Any capital gains distributed are taxable to the investor.
Single-state municipal bond funds pose additional risks, due to limited geographical diversification.
Portfolio quality
as of 08/31/10 (%)
| AAA | | | 23.4 | | |
| AA | | | 48.7 | | |
| A | | | 18.9 | | |
| BBB | | | 2.5 | | |
| Non-Rated | | | 6.5 | | |
Ratings shown in the quality breakdown are assigned to individual bonds by taking the lower of the ratings available from one of the following nationally recognized rating agencies: Standard & Poor's or Moody's Investor Services. If a security is not rated by either of the two agencies, the bond is designated as Non-Rated. Ratings are relative and subjective and are not absolute standards of quality. The credit ratings typically range from AAA (highest) to D (lowest). The credit quality of the fund's investments does not remove market risk.
30-day SEC yields
as of 08/31/10 (%)
| Class A | | | 1.66 | | |
| Class B | | | 1.00 | | |
| Class C | | | 1.35 | | |
| Class Z | | | 1.99 | | |
The 30-day SEC yields reflect the fund's earning power, net of expenses, expressed as an annualized percentage of the public offering price per share at the end of the period. Had the investment advisor not waived fees or reimbursed a portion of expenses, the 30-day SEC yields would have been reduced.
Taxable-equivalent SEC yields
as of 08/31/10 (%)
| Class A | | | 2.86 | | |
| Class B | | | 1.73 | | |
| Class C | | | 2.33 | | |
| Class Z | | | 3.43 | | |
Taxable-equivalent SEC yields are based on the combined maximum effective 35.0% federal income tax rate and applicable state income tax rate. This tax rate doesn't reflect the phase out of exemptions of the reduction of otherwise allowable deductions that occur when adjusted gross income exceeds certain levels.
The fund is actively managed and the composition of its portfolio will change over time. Information provided is calculated as a percentage of net assets.
7
Investment Portfolio – Columbia Oregon Intermediate Municipal Bond Fund
August 31, 2010
| Municipal Bonds – 94.8% | |
| | | Par ($) | | Value ($) | |
| Education – 3.8% | |
| Education – 3.8% | |
OR Economic Development
Revenue | |
| Broadway Housing LLC, | |
Series 2008 A,
6.250% 04/01/23 | | | 3,250,000 | | | | 3,853,720 | | |
| OR Facilities Authority | |
| Linfield College, | |
Series 2005 A,
5.000% 10/01/20 | | | 1,825,000 | | | | 1,939,190 | | |
| OR Forest Grove | |
| Pacific University, | |
Series 2009,
6.000% 05/01/30 | | | 1,500,000 | | | | 1,577,235 | | |
| OR Health Sciences University | |
| Series 1996 A, | |
Insured: NPFGC:
(a) 07/01/12 | | | 1,315,000 | | | | 1,266,043 | | |
| (a) 07/01/14 | | | 2,550,000 | | | | 2,316,598 | | |
| (a) 07/01/21 | | | 12,515,000 | | | | 7,810,236 | | |
| Education Total | | | 18,763,022 | | |
| Education Total | | | 18,763,022 | | |
| Health Care – 9.6% | |
| Continuing Care Retirement – 0.6% | |
| OR Albany Hospital Facility Authority | |
| Mennonite Home Albany, | |
Series 2004 PJ-A:
4.750% 10/01/11 | | | 660,000 | | | | 656,033 | | |
| 5.000% 10/01/12 | | | 680,000 | | | | 675,023 | | |
OR Multnomah County Hospital Facilities
Authority | |
| Terwilliger Plaza, Inc., | |
Series 2006 A,
5.250% 12/01/26 | | | 1,400,000 | | | | 1,346,604 | | |
| Continuing Care Retirement Total | | | 2,677,660 | | |
| Hospitals – 9.0% | |
OR Clackamas County Hospital Facility
Authority | |
| Legacy Health System, | |
Series 2001:
5.250% 05/01/21 | | | 4,890,000 | | | | 5,004,573 | | |
| 5.750% 05/01/12 | | | 2,000,000 | | | | 2,081,900 | | |
| 5.750% 05/01/16 | | | 1,500,000 | | | | 1,549,875 | | |
| | | Par ($) | | Value ($) | |
OR Deschutes County Hospital
Facilities Authority | |
| Cascade Healthcare Community, | |
Series 2008,
7.375% 01/01/23 | | | 2,000,000 | | | | 2,475,800 | | |
| OR Facilities Authority | |
| Peacehealth, | |
Series 2009 A:
5.000% 11/01/17 | | | 4,450,000 | | | | 5,172,502 | | |
| 5.000% 11/01/19 | | | 3,695,000 | | | | 4,241,786 | | |
| OR Medford Hospital Facilities Authority | |
| Asante Health System, | |
Series 1998 A,
Insured: NPFGC
5.250% 08/15/11 | | | 260,000 | | | | 260,767 | | |
OR Multnomah County Hospital Facilities
Authority | |
| Adventist Health System, | |
Series 2009 A,
5.000% 09/01/21 | | | 3,685,000 | | | | 4,066,692 | | |
| Providence Health System, | |
Series 2004,
5.250% 10/01/16 | | | 2,970,000 | | | | 3,368,218 | | |
| OR Salem Hospital Facility Authority | |
| Series 2006 A, | |
| 5.000% 08/15/27 | | | 3,500,000 | | | | 3,631,180 | | |
| Series 2008 A: | |
| 5.250% 08/15/18 | | | 2,500,000 | | | | 2,842,375 | | |
| 5.750% 08/15/15 | | | 785,000 | | | | 903,723 | | |
| OR State Facilities Authority | |
| Series 2010 A: | |
| 5.000% 03/15/15 | | | 1,000,000 | | | | 1,110,990 | | |
| 5.000% 03/15/16 | | | 1,500,000 | | | | 1,662,690 | | |
| 5.000% 10/01/22 | | | 3,450,000 | | | | 3,780,372 | | |
| 5.000% 10/01/23 | | | 2,000,000 | | | | 2,178,080 | | |
OR Umatilla County Hospital Facility
Authority | |
| Catholic Health Initiatives, | |
Series 2000 A,
5.750% 12/01/20 | | | 285,000 | | | | 288,371 | | |
| Hospitals Total | | | 44,619,894 | | |
| Health Care Total | | | 47,297,554 | | |
See Accompanying Notes to Financial Statements.
8
Columbia Oregon Intermediate Municipal Bond Fund
August 31, 2010
| Municipal Bonds (continued) | |
| | | Par ($) | | Value ($) | |
| Housing – 4.6% | |
| Assisted Living/Senior – 0.4% | |
OR Clackamas County Hospital Facility
Authority | |
| Robison Jewish Home, | |
Series 2005:
5.000% 10/01/19 | | | 1,000,000 | | | | 919,550 | | |
| 5.125% 10/01/24 | | | 1,000,000 | | | | 887,900 | | |
| Assisted Living/Senior Total | | | 1,807,450 | | |
| Multi-Family – 2.3% | |
| OR Clackamas County Housing Authority | |
| Multi-Family Housing, | |
Easton Ridge,
Series 1996 A:
5.800% 12/01/16 | | | 1,715,000 | | | | 1,716,543 | | |
| 5.900% 12/01/26 | | | 1,750,000 | | | | 1,750,105 | | |
| OR Forest Grove Student Housing | |
| Oak Tree Foundation, | |
Series 2007,
5.500% 03/01/37 | | | 4,000,000 | | | | 3,748,840 | | |
| OR Portland Housing | |
| Series 2005 A, | |
| 5.000% 04/01/25 | | | 1,565,000 | | | | 1,686,241 | | |
PR Commonwealth of Puerto Rico
Housing Finance Authority | |
| Series 2008, | |
| 5.000% 12/01/13 | | | 2,455,000 | | | | 2,692,865 | | |
| Multi-Family Total | | | 11,594,594 | | |
| Single-Family – 1.9% | |
| OR Housing & Community Services | |
| Department Mortgage Single | |
Family Program:
Series 1991 D,
6.700% 07/01/13 | | | 45,000 | | | | 45,169 | | |
Series 1999 E,
5.375% 07/01/21 | | | 1,230,000 | | | | 1,237,515 | | |
Series 2000 E,
Insured: FHA:
5.700% 07/01/12 | | | 200,000 | | | | 205,104 | | |
| 5.800% 07/01/14 | | | 180,000 | | | | 184,758 | | |
| 6.000% 07/01/20 | | | 515,000 | | | | 515,850 | | |
Series 2001 J,
5.150% 07/01/24 | | | 1,095,000 | | | | 1,098,690 | | |
Series 2001 Q:
4.700% 07/01/15 | | | 385,000 | | | | 391,518 | | |
| 4.900% 07/01/17 | | | 380,000 | | | | 384,549 | | |
| | | Par ($) | | Value ($) | |
Series 2008 G,
5.200% 07/01/28 | | | 5,040,000 | | | | 5,302,987 | | |
| Single-Family Total | | | 9,366,140 | | |
| Housing Total | | | 22,768,184 | | |
| Other – 15.9% | |
| Other – 0.6% | |
OR Health, Housing, Educational &
Cultural Facilities Authority | |
| Goodwill Industries Lane County, | |
Series 1998 A,
6.650% 11/15/22 (b) | | | 3,095,000 | | | | 2,965,134 | | |
| Other Total | | | 2,965,134 | | |
| Refunded/Escrowed (c) – 15.3% | |
| OR Benton & Linn Counties | |
| School District No. 509J, Corvallis, | |
Series 2003,
Pre-refunded 06/01/13,
Insured: AGMC
5.000% 06/01/17 | | | 2,665,000 | | | | 2,987,971 | | |
| OR Board of Higher Education | |
| Lottery Education, | |
Series 1999 A,
Pre-refunded 04/01/11,
Insured: AGMC
5.000% 04/01/14 | | | 2,705,000 | | | | 2,780,334 | | |
| Series 2001 A, | |
Pre-refunded 08/01/11,
5.250% 08/01/14 | | | 1,225,000 | | | | 1,280,958 | | |
OR Clackamas Community College
District | |
| Series 2001, | |
Pre-refunded 06/15/11,
Insured: FGIC
5.250% 06/15/15 | | | 1,390,000 | | | | 1,445,072 | | |
| OR Clackamas County | |
| School District No. 108, | |
Series 2001,
Pre-refunded 06/15/11,
Insured: AGMC
5.375% 06/15/15 | | | 1,055,000 | | | | 1,097,844 | | |
| School District No. 7J, | |
Lake Oswego,
Series 2001,
Pre-refunded 06/01/11:
5.375% 06/01/16 | | | 1,295,000 | | | | 1,343,692 | | |
| 5.375% 06/01/17 | | | 2,535,000 | | | | 2,630,316 | | |
See Accompanying Notes to Financial Statements.
9
Columbia Oregon Intermediate Municipal Bond Fund
August 31, 2010
| Municipal Bonds (continued) | |
| | | Par ($) | | Value ($) | |
| OR Coos County | |
| School District No. 13, North Bend, | |
Series 2002,
Pre-refunded 06/15/12,
Insured: AGMC
5.500% 06/15/15 | | | 1,765,000 | | | | 1,927,751 | | |
| OR Department of Transportation | |
| Highway User Tax, | |
Series 2002 A,
Pre-refunded 11/15/12,
5.500% 11/15/16 | | | 2,500,000 | | | | 2,776,450 | | |
OR Deschutes County Hospital Facilities
Authority | |
| Cascade Health Services, Inc., | |
Series 2002,
Pre-refunded 01/01/12:
5.500% 01/01/22 | | | 2,000,000 | | | | 2,136,320 | | |
| 5.600% 01/01/27 | | | 5,550,000 | | | | 5,935,669 | | |
| 5.600% 01/01/32 | | | 2,000,000 | | | | 2,138,980 | | |
| OR Deschutes County | |
| School District No. 1, | |
Series 2001 A,
Pre-refunded 06/15/11,
Insured: AGMC
5.500% 06/15/18 | | | 1,000,000 | | | | 1,041,350 | | |
| OR Jackson County | |
| School District No. 4, | |
Phoenix-Talent,
Series 2001,
Pre-refunded 06/15/11,
Insured: AGMC
5.500% 06/15/16 | | | 1,000,000 | | | | 1,041,590 | | |
| School District No. 9, Eagle Point, | |
Series 2000,
Pre-refunded 06/15/11,
5.625% 06/15/15 | | | 1,920,000 | | | | 2,001,754 | | |
| OR Linn County Community | |
| School District No. 9, Lebanon, | |
Series 2001,
Pre-refunded 06/15/13,
Insured: FGIC:
5.550% 06/15/21 | | | 2,000,000 | | | | 2,280,800 | | |
| School District No. 9, | |
Series 2001,
Pre-refunded 06/15/13,
Insured: FGIC:
5.250% 06/15/15 | | | 405,000 | | | | 458,379 | | |
| | | Par ($) | | Value ($) | |
| OR Multnomah County | |
| School District No. 40, | |
Series 2001,
Pre-refunded 12/01/10,
Insured: AGMC:
5.000% 12/01/14 | | | 1,790,000 | | | | 1,811,408 | | |
| School District No. 7, Reynolds, | |
Series 2000,
Pre-refunded 06/15/11,
5.625% 06/15/17 | | | 1,000,000 | | | | 1,042,330 | | |
| OR Multnomah-Clackamas Counties | |
| Centennial School | |
District No. 28-302,
Series 2001,
Pre-refunded 06/15/11,
Insured: FGIC:
5.375% 06/15/16 | | | 2,055,000 | | | | 2,138,454 | | |
| 5.375% 06/15/17 | | | 2,280,000 | | | | 2,372,591 | | |
| 5.375% 06/15/18 | | | 2,490,000 | | | | 2,591,119 | | |
OR North Clackamas Parks &
Recreation District Facilities | |
| Series 1993, | |
Escrowed to Maturity,
5.700% 04/01/13 | | | 1,250,000 | | | | 1,342,587 | | |
| OR Portland Community College District | |
| Series 2001 A, | |
Pre-refunded 06/01/11:
5.375% 06/01/14 | | | 1,925,000 | | | | 1,999,324 | | |
| 5.375% 06/01/16 | | | 2,705,000 | | | | 2,809,440 | | |
| 5.375% 06/01/17 | | | 2,540,000 | | | | 2,638,069 | | |
| OR Washington & Clackamas Counties | |
| School District No. 23J, Tigard, | |
Series 2002,
Pre-refunded 06/15/12,
Insured: NPFGC
5.375% 06/15/17 | | | 1,500,000 | | | | 1,634,970 | | |
| OR Washington County | |
| School District No. 48J, Beaverton, | |
Series 2001,
Pre-refunded 01/01/11:
5.125% 01/01/14 | | | 2,000,000 | | | | 2,032,460 | | |
| 5.125% 01/01/17 | | | 1,820,000 | | | | 1,849,539 | | |
| 5.125% 01/01/18 | | | 2,260,000 | | | | 2,296,680 | | |
| Series 2001, | |
Pre-refunded 06/01/11,
5.500% 06/01/16 | | | 2,785,000 | | | | 2,895,119 | | |
See Accompanying Notes to Financial Statements.
10
Columbia Oregon Intermediate Municipal Bond Fund
August 31, 2010
| Municipal Bonds (continued) | |
| | | Par ($) | | Value ($) | |
| OR Yamhill County | |
| School District No. 029J, | |
Series 2002,
Pre-refunded 06/15/12,
Insured: NPFGC
5.250% 06/15/16 | | | 2,535,000 | | | | 2,757,446 | | |
PR Commonwealth of Puerto Rico
Public Finance Corp. | |
| Series 2002 E, | |
Escrowed to Maturity,
6.000% 08/01/26 | | | 5,000,000 | | | | 6,646,200 | | |
VI Virgin Islands Public Finance
Authority | |
| Series 1989 A, | |
Escrowed to Maturity,
7.300% 10/01/18 | | | 1,185,000 | | | | 1,468,713 | | |
| Refunded/Escrowed Total | | | 75,631,679 | | |
| Other Total | | | 78,596,813 | | |
| Other Revenue – 3.3% | |
| Recreation – 3.3% | |
| OR Board of Higher Education | |
| Lottery Education: | |
Series 2003 A,
Insured: AGMC
5.000% 04/01/14 | | | 1,830,000 | | | | 2,068,101 | | |
Series 2008,
5.000% 04/01/24 | | | 3,130,000 | | | | 3,589,422 | | |
Series 2009 A:
5.000% 04/01/21 | | | 5,000,000 | | | | 5,948,650 | | |
| 5.000% 04/01/27 | | | 4,000,000 | | | | 4,546,200 | | |
| Recreation Total | | | 16,152,373 | | |
| Other Revenue Total | | | 16,152,373 | | |
| Tax-Backed – 48.1% | |
| Local General Obligations – 32.6% | |
| OR Benton & Linn Counties | |
| School District No. 509J & 509A, | |
Series 2007
Insured: AGMC
5.000% 06/15/20 | | | 5,000,000 | | | | 6,080,700 | | |
OR Canyonville South Umpqua
Rural Fire District | |
| Series 2001, | |
| 5.400% 07/01/31 | | | 610,000 | | | | 533,951 | | |
| | | Par ($) | | Value ($) | |
OR Central Community College
District | |
| Series 2010, | |
| 4.750% 06/15/24 | | | 2,580,000 | | | | 2,958,305 | | |
| OR Clackamas & Washington Counties | |
| School District No. 3, | |
Series 2009,
5.000% 06/15/24 | | | 4,150,000 | | | | 4,843,050 | | |
| School District No. 3A, | |
Series 2003,
Insured: NPFGC
(a) 06/15/17 | | | 4,000,000 | | | | 3,341,080 | | |
OR Clackamas Community College
District | |
| Series 2001, | |
Insured: FGIC
5.250% 06/15/15 | | | 110,000 | | | | 113,738 | | |
| OR Clackamas County | |
| School District No. 108, Estacada, | |
Series 2005,
Insured: AGMC
5.500% 06/15/25 | | | 2,485,000 | | | | 3,219,044 | | |
| School District No. 115, | |
Series 2006 A,
Insured: NPFGC:
(a) 06/15/25 | | | 2,250,000 | | | | 1,208,588 | | |
| (a) 06/15/26 | | | 2,610,000 | | | | 1,328,751 | | |
| School District No. 12, | |
North Clackamas,
Series 2007 B,
Insured: AGMC
(a) 06/15/22 | | | 4,000,000 | | | | 4,350,680 | | |
| School District No. 46, | |
Series 2009:
5.000% 06/15/25 | | | 4,350,000 | | | | 4,985,013 | | |
| 5.000% 06/15/26 | | | 3,000,000 | | | | 3,408,270 | | |
| Series 2007, | |
Insured: NPFGC
4.125% 06/01/27 | | | 2,000,000 | | | | 2,089,180 | | |
| OR Columbia County | |
| School District No. 502, | |
Deferred Interest,
Series 1999,
Insured: FGIC:
(a) 06/01/13 | | | 1,685,000 | | | | 1,612,882 | | |
| (a) 06/01/14 | | | 1,025,000 | | | | 958,098 | | |
See Accompanying Notes to Financial Statements.
11
Columbia Oregon Intermediate Municipal Bond Fund
August 31, 2010
| Municipal Bonds (continued) | |
| | | Par ($) | | Value ($) | |
OR Columbia Multnomah & Washington
Counties | |
| School District No. 1J, | |
Series 2009:
5.000% 06/15/23 | | | 1,000,000 | | | | 1,163,620 | | |
| 5.000% 06/15/24 | | | 1,165,000 | | | | 1,341,940 | | |
| 5.000% 06/15/25 | | | 1,275,000 | | | | 1,456,904 | | |
| OR Deschutes & Jefferson County | |
| School District No. 02J, | |
Series 2004 B,
Insured: NPFGC
(a) 06/15/22 | | | 2,335,000 | | | | 1,562,115 | | |
| OR Deschutes County | |
| Administrative School | |
District No. 1,
Series 2007,
Insured: FGIC
4.500% 06/15/20 | | | 5,000,000 | | | | 5,689,300 | | |
| OR Jackson County | |
| School District No. 009, | |
Series 2005,
Insured: NPFGC:
5.500% 06/15/20 | | | 1,000,000 | | | | 1,254,580 | | |
| 5.500% 06/15/21 | | | 1,410,000 | | | | 1,780,040 | | |
| School District No. 549C, | |
Series 2008:
4.625% 06/15/27 | | | 1,500,000 | | | | 1,608,810 | | |
| 4.625% 06/15/28 | | | 1,660,000 | | | | 1,768,780 | | |
| 4.625% 06/15/30 | | | 2,000,000 | | | | 2,104,720 | | |
| OR Jefferson County | |
| School District No. 509J, | |
Madras School District,
Series 2002,
Insured: NPFGC
5.250% 06/15/18 | | | 1,075,000 | | | | 1,151,551 | | |
| OR Josephine County | |
| Unit School District, Three Rivers, | |
Series 2005,
Insured: FGIC:
5.000% 12/15/15 | | | 1,000,000 | | | | 1,187,940 | | |
| 5.000% 12/15/16 | | | 1,000,000 | | | | 1,204,420 | | |
| OR Lane Community College | |
| Series 2009: | |
| 4.250% 06/15/17 | | | 2,195,000 | | | | 2,533,689 | | |
| 4.250% 06/15/18 | | | 2,000,000 | | | | 2,315,520 | | |
| | | Par ($) | | Value ($) | |
| OR Lane County | |
| School District No. 19, Springfield: | |
Series 1997,
Insured: FGIC:
6.000% 10/15/12 | | | 1,740,000 | | | | 1,925,832 | | |
| 6.000% 10/15/14 | | | 1,310,000 | | | | 1,552,494 | | |
Series 2006,
Insured: AGMC
(a) 06/15/25 | | | 5,160,000 | | | | 2,759,568 | | |
| School District No. 4J, Eugene, | |
Series 2002:
5.000% 07/01/12 | | | 1,000,000 | | | | 1,084,320 | | |
| 5.250% 07/01/13 | | | 1,000,000 | | | | 1,133,160 | | |
| Series 2009 A: | |
| 5.000% 11/01/24 | | | 1,000,000 | | | | 1,141,810 | | |
| 5.000% 11/01/25 | | | 1,140,000 | | | | 1,294,299 | | |
| OR Linn Benton Community College | |
| Series 2001, | |
Insured: FGIC
(a) 06/15/13 | | | 1,000,000 | | | | 969,570 | | |
| Series 2002, | |
Insured: FGIC
(a) 06/15/14 | | | 1,000,000 | | | | 947,590 | | |
| OR Linn County | |
| Community School | |
District No. 9, Lebanon,
Series 2001,
Insured: FGIC
5.250% 06/15/15 | | | 305,000 | | | | 339,523 | | |
| OR Madras Aquatic Center District | |
| Series 2005, | |
| 5.000% 06/01/22 | | | 1,695,000 | | | | 1,826,685 | | |
| OR Multnomah-Clackamas Counties | |
| Centennial School | |
District No. 28JT,
Series 2006,
Insured: AMBAC
(a) 06/01/16 | | | 2,260,000 | | | | 1,793,852 | | |
OR Portland Community College
District | |
| Series 2005, | |
Insured: AGMC
5.000% 06/15/16 | | | 4,750,000 | | | | 5,538,785 | | |
See Accompanying Notes to Financial Statements.
12
Columbia Oregon Intermediate Municipal Bond Fund
August 31, 2010
| Municipal Bonds (continued) | |
| | | Par ($) | | Value ($) | |
| OR Portland Limited Tax | |
| Series 2001 B: | |
| (a) 06/01/13 | | | 1,500,000 | | | | 1,457,145 | | |
| (a) 06/01/16 | | | 3,500,000 | | | | 3,122,455 | | |
| (a) 06/01/18 | | | 4,000,000 | | | | 3,284,280 | | |
| (a) 06/01/19 | | | 4,000,000 | | | | 3,149,440 | | |
| (a) 06/01/20 | | | 4,000,000 | | | | 3,009,080 | | |
| OR Portland | |
| Series 2005, | |
| 5.000% 06/01/16 | | | 3,075,000 | | | | 3,582,713 | | |
| OR Salem-Keizer | |
| School District No. 24J, | |
Series 2009 A:
4.000% 06/15/15 | | | 3,850,000 | | | | 4,348,460 | | |
| 5.000% 06/15/16 | | | 2,500,000 | | | | 2,975,275 | | |
| OR Salem | |
| Series 2009: | |
| 5.000% 06/01/19 | | | 2,025,000 | | | | 2,461,408 | | |
| 5.000% 06/01/20 | | | 880,000 | | | | 1,052,286 | | |
| 5.000% 06/01/26 | | | 3,315,000 | | | | 3,750,889 | | |
OR Tri-County Metropolitan Transportation
District | |
| Series 2003 A, | |
| 5.000% 09/01/15 | | | 1,000,000 | | | | 1,092,590 | | |
| Series 2005 A, | |
Insured: AGMC
5.000% 09/01/17 | | | 4,250,000 | | | | 5,004,333 | | |
| Series 2009 A: | |
| 4.000% 09/01/18 | | | 1,000,000 | | | | 1,154,610 | | |
| 4.250% 09/01/21 | | | 1,815,000 | | | | 2,079,010 | | |
OR Tualatin Hills Park & Recreation
District | |
| Series 1998, | |
Insured: NPFGC
5.750% 03/01/14 | | | 990,000 | | | | 1,160,834 | | |
| OR Umatilla County | |
| School District No. 8R Hermiston, | |
Series 2010,
4.500% 06/15/29 | | | 2,360,000 | | | | 2,558,146 | | |
| OR Washington & Clackamas Counties | |
| School District No. 23J, Tigard: | |
Series 2000,
(a) 06/15/18 | | | 2,700,000 | | | | 2,137,158 | | |
Series 2005,
Insured: NPFGC:
5.000% 06/15/19 | | | 850,000 | | | | 1,040,060 | | |
| 5.000% 06/15/21 | | | 6,575,000 | | | | 8,096,915 | | |
| | | Par ($) | | Value ($) | |
OR Washington Clackamas & Yamhill
Counties | |
| School District No. 88J, | |
Series 2007 B,
Insured: NPFGC
4.500% 06/15/23 | | | 8,125,000 | | | | 8,947,412 | | |
OR Washington Multnomah & Yamhill
Counties | |
| School District No. 1J: | |
Series 1998,
5.000% 11/01/13 | | | 1,100,000 | | | | 1,250,095 | | |
Series 2006,
Insured: NPFGC
(a) 06/15/25 | | | 4,065,000 | | | | 2,172,011 | | |
| OR Yamhill County | |
| School District No. 029J, | |
Series 2005,
Insured: FGIC
5.500% 06/15/21 | | | 1,000,000 | | | | 1,259,020 | | |
| Local General Obligations Total | | | 161,608,372 | | |
| Special Non-Property Tax – 4.7% | |
| OR Department of Transportation | |
| Series 2006 A, | |
| 4.625% 11/15/26 | | | 5,040,000 | | | | 5,441,083 | | |
| Series 2007 A, | |
| 5.000% 11/15/16 | | | 6,305,000 | | | | 7,597,462 | | |
PR Commonwealth of Puerto Rico
Highway & Transportation Authority | |
| Series 2003, | |
Insured: AGMC
4.950% 07/01/26 | | | 5,000,000 | | | | 5,410,250 | | |
| VI Virgin Islands Public Finance Authority | |
| Series 2010 A, | |
| 5.000% 10/01/25 | | | 4,410,000 | | | | 4,641,834 | | |
| Special Non-Property Tax Total | | | 23,090,629 | | |
| Special Property Tax – 5.1% | |
| OR Hood River Urban Renewal Agency | |
| Series 1996, | |
| 6.250% 12/15/11 | | | 365,000 | | | | 365,139 | | |
| OR Keizer | |
| Series 2008, | |
| 5.200% 06/01/31 | | | 4,085,000 | | | | 4,226,831 | | |
| OR Lebanon Urban Renewal Agency | |
| Series 2000: | |
| 5.750% 06/01/15 | | | 1,120,000 | | | | 1,120,314 | | |
| 6.000% 06/01/20 | | | 1,580,000 | | | | 1,578,673 | | |
See Accompanying Notes to Financial Statements.
13
Columbia Oregon Intermediate Municipal Bond Fund
August 31, 2010
| Municipal Bonds (continued) | |
| | | Par ($) | | Value ($) | |
| OR Medford Urban Renewal | |
| Series 1996, | |
| 5.875% 09/01/10 | | | 175,000 | | | | 175,000 | | |
OR Portland Airport Way Urban
Renewal & Redevelopment | |
| Convention Center, | |
Series 2000 A,
Insured: AMBAC:
5.750% 06/15/17 | | | 1,500,000 | | | | 1,520,010 | | |
| 5.750% 06/15/18 | | | 2,050,000 | | | | 2,077,162 | | |
| Series 2010 B: | |
| 5.000% 06/15/25 | | | 1,550,000 | | | | 1,686,230 | | |
| 5.000% 06/15/26 | | | 1,440,000 | | | | 1,549,570 | | |
OR Portland River District Urban
Renewal & Redevelopment | |
| Series 2003 A, | |
Insured: AMBAC:
5.000% 06/15/17 | | | 1,500,000 | | | | 1,656,465 | | |
| 5.000% 06/15/18 | | | 3,070,000 | | | | 3,289,566 | | |
| 5.000% 06/15/20 | | | 2,000,000 | | | | 2,167,860 | | |
| OR Redmond Urban Renewal Agency | |
| Downtown Area B, | |
Series 1999:
5.650% 06/01/13 | | | 555,000 | | | | 555,627 | | |
| 5.850% 06/01/19 | | | 785,000 | | | | 785,777 | | |
| OR Seaside Urban Renewal Agency | |
| Greater Seaside Urban Renewal, | |
Series 2001,
5.250% 06/01/15 | | | 1,000,000 | | | | 1,000,270 | | |
| OR Veneta Urban Renewal Agency | |
| Series 2001: | |
| 5.375% 02/15/16 | | | 700,000 | | | | 701,547 | | |
| 5.625% 02/15/21 | | | 1,100,000 | | | | 1,101,210 | | |
| Special Property Tax Total | | | 25,557,251 | | |
| State Appropriated – 3.6% | |
| OR Department of Administrative Services | |
| Certificates of Participation: | |
Series 2002 C,
Insured: NPFGC:
5.250% 11/01/15 | | | 1,000,000 | | | | 1,065,760 | | |
| 5.250% 11/01/17 | | | 5,000,000 | | | | 5,320,200 | | |
Series 2002 E,
Insured: AGMC
5.000% 11/01/13 | | | 1,470,000 | | | | 1,599,110 | | |
| Series 2007 A, | |
Insured FGIC:
5.000% 05/01/24 | | | 2,630,000 | | | | 2,909,253 | | |
| 5.000% 05/01/25 | | | 2,780,000 | | | | 3,055,387 | | |
| 5.000% 05/01/26 | | | 2,800,000 | | | | 3,056,368 | | |
| | | Par ($) | | Value ($) | |
PR Commonwealth of Puerto Rico
Public Finance Corp. | |
| Series 2004 A, | |
LOC: Government Development
Bank for Puerto Rico
5.750% 08/01/27
(02/01/12) (d)(e) | | | 750,000 | | | | 779,828 | | |
| State Appropriated Total | | | 17,785,906 | | |
| State General Obligations – 2.1% | |
| OR Board of Higher Education | |
| Deferred Interest, | |
Series 2001 A,
(a) 08/01/17 | | | 1,050,000 | | | | 873,054 | | |
| Series 1996 A, | |
| (a) 08/01/14 | | | 490,000 | | | | 466,259 | | |
| Series 2001 A: | |
| 5.250% 08/01/14 | | | 255,000 | | | | 265,789 | | |
| 5.250% 08/01/16 | | | 780,000 | | | | 811,528 | | |
| Series 2004 D, | |
| 5.000% 08/01/24 | | | 3,620,000 | | | | 3,915,935 | | |
| OR Elderly & Disabled Housing | |
| Series 2001 B, | |
| 4.950% 08/01/20 | | | 985,000 | | | | 990,280 | | |
| OR State | |
| Series 2002 A, | |
| 5.250% 10/15/15 | | | 1,735,000 | | | | 1,893,631 | | |
| OR Veterans Welfare | |
| Series 2000 80A, | |
| 5.700% 10/01/32 | | | 1,035,000 | | | | 1,045,867 | | |
| State General Obligations Total | | | 10,262,343 | | |
| Tax-Backed Total | | | 238,304,501 | | |
| Transportation – 0.6% | |
| Airports – 0.2% | |
OR Port of Portland
International Airport | |
| Series 1998 12B, | |
Insured: FGIC
5.250% 07/01/12 | | | 1,000,000 | | | | 1,003,920 | | |
| Airports Total | | | 1,003,920 | | |
| Ports – 0.4% | |
| OR Port of Morrow | |
| Series 2007: | |
| 4.875% 06/01/20 | | | 750,000 | | | | 664,950 | | |
| 5.000% 06/01/25 | | | 1,000,000 | | | | 809,370 | | |
See Accompanying Notes to Financial Statements.
14
Columbia Oregon Intermediate Municipal Bond Fund
August 31, 2010
| Municipal Bonds (continued) | |
| | | Par ($) | | Value ($) | |
| OR Port of St. Helens | |
| Series 1999: | |
| 5.600% 08/01/14 | | | 260,000 | | | | 259,896 | | |
| 5.750% 08/01/19 | | | 425,000 | | | | 416,003 | | |
| Ports Total | | | 2,150,219 | | |
| Transportation Total | | | 3,154,139 | | |
| Utilities – 8.9% | |
| Independent Power Producers – 0.8% | |
| OR Western Generation Agency | |
| Series 2006 A, | |
| 5.000% 01/01/21 | | | 3,000,000 | | | | 2,901,120 | | |
| Wauna Cogeneration, | |
Series 2006 A,
5.000% 01/01/20 | | | 1,000,000 | | | | 974,480 | | |
| Independent Power Producers Total | | | 3,875,600 | | |
| Investor Owned – 0.8% | |
| OR Port of Morrow | |
| Portland General Electrical Co, | |
Series 1998
5.000% 05/01/33
(03/11/20) (d)(e) | | | 3,750,000 | | | | 3,983,100 | | |
| Investor Owned Total | | | 3,983,100 | | |
| Municipal Electric – 3.4% | |
| OR Emerald Peoples Utility District | |
| Series 1996, | |
Insured: FGIC:
7.350% 11/01/10 | | | 2,160,000 | | | | 2,182,723 | | |
| 7.350% 11/01/11 | | | 2,000,000 | | | | 2,145,080 | | |
| 7.350% 11/01/12 | | | 2,490,000 | | | | 2,818,954 | | |
| 7.350% 11/01/13 | | | 2,675,000 | | | | 3,174,770 | | |
| Series 2003 A, | |
Insured: AGMC
5.250% 11/01/20 | | | 605,000 | | | | 674,418 | | |
| OR Eugene Electric Utilities System | |
| Series 2001 B, | |
Insured: AGMC
5.250% 08/01/13 | | | 1,040,000 | | | | 1,083,545 | | |
PR Commonwealth of Puerto Rico
Electric Power Authority | |
| Series 2010, | |
| 5.250% 07/01/24 | | | 4,600,000 | | | | 5,110,876 | | |
| Municipal Electric Total | | | 17,190,366 | | |
| | | Par ($) | | Value ($) | |
| Water & Sewer – 3.9% | |
| OR Myrtle Point Water | |
| Series 2000, | |
| 6.000% 12/01/20 | | | 510,000 | | | | 513,682 | | |
| OR Portland Water Systems Revenue | |
| Series 2004 B, | |
| 5.000% 10/01/13 | | | 730,000 | | | | 829,419 | | |
| Series 2006 B, | |
| 5.000% 10/01/16 | | | 5,330,000 | | | | 6,403,782 | | |
| Series 2010 A, | |
| 4.000% 03/01/22 | | | 5,000,000 | | | | 5,562,300 | | |
| OR Portland | |
| Series 2008 A, | |
| 5.000% 06/15/17 | | | 1,500,000 | | | | 1,807,215 | | |
| OR Sheridan Water | |
| Series 1998, | |
| 5.350% 04/01/18 | | | 300,000 | | | | 300,057 | | |
| Series 2000: | |
| 6.200% 05/01/15 | | | 625,000 | | | | 625,731 | | |
| 6.450% 05/01/20 | | | 520,000 | | | | 520,468 | | |
| OR Washington County Housing Authority | |
| Clean Water Services Sewer, | |
Series 2004 Lien,
Insured: NPFGC
5.000% 10/01/13 | | | 2,310,000 | | | | 2,623,836 | | |
| Water & Sewer Total | | | 19,186,490 | | |
| Utilities Total | | | 44,235,556 | | |
Total Municipal Bonds
(cost of $438,044,166) | | | 469,272,142 | | |
| Investment Companies – 4.3% | |
| | | Shares | | | |
| BofA Tax-Exempt Reserves, | |
Capital Class
(7 day yield of 0.150%) (f)(g) | | | 12,427,158 | | | | 12,427,158 | | |
| Dreyfus Tax-Exempt Cash | |
Management Fund
(7 day yield of 0.130%) | | | 9,004,196 | | | | 9,004,196 | | |
Total Investment Companies
(cost of $21,431,354) | | | 21,431,354 | | |
Total Investments – 99.1%
(cost of $459,475,520) (h) | | | 490,703,496 | | |
| Other Assets & Liabilities, Net – 0.9% | | | 4,505,380 | | |
| Net Assets – 100.0% | | | 495,208,876 | | |
See Accompanying Notes to Financial Statements.
15
Columbia Oregon Intermediate Municipal Bond Fund
August 31, 2010
Notes to Investment Portfolio:
(a) Zero coupon bond.
(b) Denotes a restricted security, which is subject to restrictions on resale under federal securities laws or in transactions exempt from registration. At August 31, 2010, the value of this security amounted to $2,965,134, which represents 0.6% of net assets.
| Security | | Acquisition
Date | | Acquisition
Cost | |
OR Health, Housing, Educational &
Cultural Facilities Authority, Goodwill
Industries Lane County, Series 1998 A,
6.650% 11/15/22 | | | 06/17/98 | | | $ | 3,245,000 | | |
(c) The Fund has been informed that each issuer has placed direct obligations of the U.S. Government in an irrevocable trust, solely for the payment of principal and interest.
(d) The interest rate shown on floating rate or variable rate securities reflects the rate at August 31, 2010.
(e) Parenthetical date represents the next interest rate reset date for the security.
(f) Investments in affiliates for the year ended August 31, 2010:
| Affiliate | | Value,
beginning
of period | | Purchases | | Sales
Proceeds | | Dividend
Income | | Value,
end of
period | |
BofA Tax-Exempt
Reserves,
Capital Class
(7 day yield
of 0.150%)* | | $ | 8,970,586 | | | $ | 57,204,007 | | | $ | 58,211,731 | | | $ | 6,814 | | | $ | — | | |
* As of May 1, 2010, this company was no longer an affiliate of this fund. The above table reflects activity for the period from September 1, 2009 through April 30, 2010.
(g) Mutual fund registered under the Investment Company Act of 1940, as amended, and advised by BofA Global Capital Management Group, LLC or one of its affiliates.
(h) Cost for federal income tax purposes is $459,358,007.
The following table summarizes the inputs used, as of August 31, 2010, in valuing the Fund's assets:
| Description | | Quoted
Prices
(Level 1) | | Other
Significant
Observable
Inputs
(Level 2) | | Significant
Unobservable
Inputs
(Level 3) | |
Total | |
| Total Municipal Bonds | | $ | — | | | $ | 469,272,142 | | | $ | — | | | $ | 469,272,142 | | |
Total Investment
Companies | | | 21,431,354 | | | | — | | | | — | | | | 21,431,354 | | |
| Total Investments | | $ | 21,431,354 | | | $ | 469,272,142 | | | $ | — | | | $ | 490,703,496 | | |
The Fund's assets assigned to the Level 2 input category are generally valued using the market approach, in which a security's value is determined through reference to prices and information from market transactions for similar or identical assets.
For more information on valuation inputs, and their aggregation into the levels used in the table above, please refer to the Security Valuation section in the accompanying Notes to Financial Statements.
At August 31, 2010, the composition of the Fund by revenue source is as follows:
| Holdings By Revenue Source (Unaudited) | | % of
Net Assets | |
| Tax-Backed | | | 48.1 | | |
| Refunded/Escrowed | | | 15.3 | | |
| Health Care | | | 9.6 | | |
| Utilities | | | 8.9 | | |
| Housing | | | 4.6 | | |
| Education | | | 3.8 | | |
| Other Revenue | | | 3.3 | | |
| Transportation | | | 0.6 | | |
| Other | | | 0.6 | | |
| | | | 94.8 | | |
| Investment Companies | | | 4.3 | | |
| Other Assets & Liabilities, Net | | | 0.9 | | |
| | | | 100.0 | | |
| Acronym | | Name | |
| AGMC | | Assured Guaranty Municipal Corp. | |
|
| AMBAC | | Ambac Assurance Corp. | |
|
| FGIC | | Financial Guaranty Insurance Co. | |
|
| FHA | | Federal Housing Administration | |
|
| LOC | | Letter of Credit | |
|
| NPFGC | | National Public Finance Guarantee Corp. | |
|
See Accompanying Notes to Financial Statements.
16
Statement of Assets and Liabilities – Columbia Oregon Intermediate Municipal Bond Fund
August 31, 2010
| | | | | ($) | |
| Assets | | Investments, at cost | | | 459,475,520 | | |
| | | Investments, at value | | | 490,703,496 | | |
| | | Cash | | | 639 | | |
| | | Receivable for: | | | | | |
| | | Fund shares sold | | | 184,583 | | |
| | | Interest | | | 5,255,267 | | |
| | | Expense reimbursement due from investment advisor | | | 63,610 | | |
| | | Trustees' deferred compensation plan | | | 33,093 | | |
| | | Prepaid expenses | | | 9,832 | | |
| | | Total Assets | | | 496,250,520 | | |
| Liabilities | | Payable for: | | | | | |
| | | Fund shares repurchased | | | 223,173 | | |
| | | Distributions | | | 405,282 | | |
| | | Investment advisory fee | | | 206,302 | | |
| | | Pricing and bookkeeping fees | | | 15,447 | | |
| | | Transfer agent fee | | | 71,424 | | |
| | | Trustees' fees | | | 22 | | |
| | | Audit fee | | | 41,700 | | |
| | | Custody fee | | | 3,610 | | |
| | | Distribution and service fees | | | 14,690 | | |
| | | Chief compliance officer expenses | | | 92 | | |
| | | Trustees' deferred compensation plan | | | 33,093 | | |
| | | Other liabilities | | | 26,809 | | |
| | | Total Liabilities | | | 1,041,644 | | |
| | | Net Assets | | | 495,208,876 | | |
| Net Assets Consist of | | Paid-in capital | | | 462,740,860 | | |
| | | Undistributed net investment income | | | 464,202 | | |
| | | Accumulated net realized gain | | | 775,838 | | |
| | | Net unrealized appreciation on investments | | | 31,227,976 | | |
| | | Net Assets | | | 495,208,876 | | |
| Class A | | Net assets | | $ | 27,661,027 | | |
| | | Shares outstanding | | | 2,183,343 | | |
| | | Net asset value per share | | $ | 12.67 | (a) | |
| | | Maximum sales charge | | | 3.25 | % | |
| | | Maximum offering price per share ($12.67/0.9675) | | $ | 13.10 | (b) | |
| Class B | | Net assets | | $ | 403,079 | | |
| | | Shares outstanding | | | 31,816 | | |
| | | Net asset value and offering price per share | | $ | 12.67 | (a) | |
| Class C | | Net assets | | $ | 16,722,486 | | |
| | | Shares outstanding | | | 1,319,959 | | |
| | | Net asset value and offering price per share | | $ | 12.67 | (a) | |
| Class Z | | Net assets | | $ | 450,422,284 | | |
| | | Shares outstanding | | | 35,552,977 | | |
| | | Net asset value, offering and redemption price per share | | $ | 12.67 | | |
(a) Redemption price per share is equal to net asset value less any applicable contingent deferred sales charge.
(b) On sales of $50,000 or more the offering price is reduced.
See Accompanying Notes to Financial Statements.
17
Statement of Operations – Columbia Oregon Intermediate Municipal Bond Fund
For the Year Ended August 31, 2010
| | | | | ($) | |
| Investment Income | | Dividends | | | 13,365 | | |
| | | Dividends from affiliates | | | 6,814 | | |
| | | Interest | | | 19,269,940 | | |
| | | Total Investment Income | | | 19,290,119 | | |
| Expenses | | Investment advisory fee | | | 2,315,707 | | |
| | | Distribution fee: | | | | | |
| | | Class B | | | 3,593 | | |
| | | Class C | | | 106,004 | | |
| | | Service fee: | | | | | |
| | | Class A | | | 52,212 | | |
| | | Class B | | | 1,198 | | |
| | | Class C | | | 35,335 | | |
| | | Transfer agent fee | | | 243,653 | | |
| | | Pricing and bookkeeping fees | | | 146,534 | | |
| | | Trustees' fees | | | 36,883 | | |
| | | Custody fee | | | 19,028 | | |
| | | Chief compliance officer expenses | | | 1,041 | | |
| | | Other expenses | | | 218,939 | | |
| | | Total Expenses | | | 3,180,127 | | |
| | | Fees waived or expenses reimbursed by investment advisor | | | (512,036 | ) | |
| | | Fees waived by distributor—Class C | | | (49,469 | ) | |
| | | Expense reductions | | | (2 | ) | |
| | | Net Expenses | | | 2,618,620 | | |
| | | Net Investment Income | | | 16,671,499 | | |
| Net Realized and Unrealized Gain (Loss) on Investments | | | |
| | | Net realized gain on investments | | | 997,849 | | |
| | | Net change in unrealized appreciation (depreciation) on investments | | | 18,044,173 | | |
| | | Net Gain | | | 19,042,022 | | |
| | | Net Increase Resulting from Operations | | | 35,713,521 | | |
See Accompanying Notes to Financial Statements.
18
Statement of Changes in Net Assets – Columbia Oregon Intermediate Municipal Bond Fund
| | | | | Year Ended August 31, | |
| Increase (Decrease) in Net Assets | | | | 2010 ($) | | 2009 ($) | |
| Operations | | Net investment income | | | 16,671,499 | | | | 16,323,054 | | |
| | | Net realized gain (loss) on investments | | | 997,849 | | | | (68,972 | ) | |
| | | Net change in unrealized appreciation (depreciation)
on investments | | | 18,044,173 | | | | 3,804,182 | | |
| | | Net increase resulting from operations | | | 35,713,521 | | | | 20,058,264 | | |
| Distributions to Shareholders | | From net investment income: | | | | | | | | | |
| | | Class A | | | (701,103 | ) | | | (455,891 | ) | |
| | | Class B | | | (12,721 | ) | | | (17,932 | ) | |
| | | Class C | | | (419,059 | ) | | | (299,764 | ) | |
| | | Class Z | | | (15,520,849 | ) | | | (15,530,146 | ) | |
| | | Total distributions to shareholders | | | (16,653,732 | ) | | | (16,303,733 | ) | |
| | | Net Capital Stock Transactions | | | 32,393,745 | | | | 40,028,648 | | |
| | | Increase from regulatory settlements | | | — | | | | 182,996 | | |
| | | Total increase in net assets | | | 51,453,534 | | | | 43,966,175 | | |
| Net Assets | | Beginning of period | | | 443,755,342 | | | | 399,789,167 | | |
| | | End of period | | | 495,208,876 | | | | 443,755,342 | | |
| | | Undistributed net investment income at end of period | | | 464,202 | | | | 458,365 | | |
See Accompanying Notes to Financial Statements.
19
Statement of Changes in Net Assets (continued) – Columbia Oregon Intermediate Municipal Bond Fund
| | | Capital Stock Activity | |
| | | Year Ended
August 31, 2010 | | Year Ended
August 31, 2009 | |
| | | Shares | | Dollars ($) | | Shares | | Dollars ($) | |
| Class A | |
| Subscriptions | | | 1,365,372 | | | | 16,826,691 | | | | 645,220 | | | | 7,740,369 | | |
| Distributions reinvested | | | 35,415 | | | | 437,050 | | | | 27,514 | | | | 328,090 | | |
| Redemptions | | | (491,768 | ) | | | (6,052,905 | ) | | | (244,240 | ) | | | (2,938,693 | ) | |
| Net increase | | | 909,019 | | | | 11,210,836 | | | | 428,494 | | | | 5,129,766 | | |
| Class B | |
| Subscriptions | | | 1,765 | | | | 21,655 | | | | 12,812 | | | | 151,232 | | |
| Distributions reinvested | | | 632 | | | | 7,786 | | | | 1,103 | | | | 13,131 | | |
| Redemptions | | | (23,259 | ) | | | (285,419 | ) | | | (8,431 | ) | | | (100,630 | ) | |
| Net increase (decrease) | | | (20,862 | ) | | | (255,978 | ) | | | 5,484 | | | | 63,733 | | |
| Class C | |
| Subscriptions | | | 432,297 | | | | 5,330,213 | | | | 344,664 | | | | 4,130,110 | | |
| Distributions reinvested | | | 17,321 | | | | 213,880 | | | | 10,716 | | | | 127,847 | | |
| Redemptions | | | (60,819 | ) | | | (750,119 | ) | | | (74,243 | ) | | | (878,119 | ) | |
| Net increase | | | 388,799 | | | | 4,793,974 | | | | 281,137 | | | | 3,379,838 | | |
| Class Z | |
| Subscriptions | | | 4,601,517 | | | | 56,748,918 | | | | 4,984,227 | | | | 59,336,743 | | |
| Distributions reinvested | | | 919,244 | | | | 11,343,381 | | | | 969,877 | | | | 11,543,269 | | |
| Redemptions | | | (4,174,921 | ) | | | (51,447,386 | ) | | | (3,322,767 | ) | | | (39,424,701 | ) | |
| Net increase | | | 1,345,840 | | | | 16,644,913 | | | | 2,631,337 | | | | 31,455,311 | | |
See Accompanying Notes to Financial Statements.
20
Financial Highlights – Columbia Oregon Intermediate Municipal Bond Fund
Selected data for a share outstanding throughout each period is as follows:
| | | Year Ended August 31, | |
| Class A Shares | | 2010 | | 2009 | | 2008 | | 2007 | | 2006 | |
| Net Asset Value, Beginning of Period | | $ | 12.17 | | | $ | 12.07 | | | $ | 12.02 | | | $ | 12.24 | | | $ | 12.45 | | |
| Income from Investment Operations: | |
| Net investment income (a) | | | 0.41 | | | | 0.45 | | | | 0.46 | | | | 0.46 | | | | 0.45 | | |
Net realized and unrealized gain (loss) on investments
and futures contracts | | | 0.51 | | | | 0.09 | | | | 0.05 | | | | (0.23 | ) | | | (0.20 | ) | |
| Total from investment operations | | | 0.92 | | | | 0.54 | | | | 0.51 | | | | 0.23 | | | | 0.25 | | |
| Less Distributions to Shareholders: | |
| From net investment income | | | (0.42 | ) | | | (0.45 | ) | | | (0.46 | ) | | | (0.45 | ) | | | (0.46 | ) | |
| Increase from regulatory settlements | | | — | | | | 0.01 | | | | — | | | | — | | | | — | | |
| Net Asset Value, End of Period | | $ | 12.67 | | | $ | 12.17 | | | $ | 12.07 | | | $ | 12.02 | | | $ | 12.24 | | |
| Total return (b) | | | 7.68 | %(c) | | | 4.70 | %(c) | | | 4.31 | %(c) | | | 1.92 | % | | | 2.05 | %(c) | |
| Ratios to Average Net Assets/Supplemental Data: | |
| Net expenses (d) | | | 0.78 | % | | | 0.75 | % | | | 0.77 | % | | | 0.88 | % | | | 0.89 | % | |
| Waiver/Reimbursement | | | 0.11 | % | | | 0.14 | % | | | 0.10 | % | | | — | | | | — | %(e) | |
| Net investment income (d) | | | 3.35 | % | | | 3.74 | % | | | 3.78 | % | | | 3.73 | % | | | 3.72 | % | |
| Portfolio turnover rate | | | 12 | % | | | 8 | % | | | 5 | % | | | 16 | % | | | 2 | % | |
| Net assets, end of period (000s) | | $ | 27,661 | | | $ | 15,507 | | | $ | 10,210 | | | $ | 5,519 | | | $ | 6,507 | | |
(a) Per share data was calculated using the average shares outstanding during the period.
(b) Total return at net asset value assuming all distributions reinvested and no initial sales charge or contingent deferred sales charge.
(c) Had the investment advisor and/or any of its affiliates not waived fees or reimbursed a portion of expenses, total return would have been reduced.
(d) The benefits derived from expense reductions had an impact of less than 0.01%.
(e) Rounds to less than 0.01%.
See Accompanying Notes to Financial Statements.
21
Financial Highlights – Columbia Oregon Intermediate Municipal Bond Fund
Selected data for a share outstanding throughout each period is as follows:
| | | Year Ended August 31, | |
| Class B Shares | | 2010 | | 2009 | | 2008 | | 2007 | | 2006 | |
| Net Asset Value, Beginning of Period | | $ | 12.17 | | | $ | 12.07 | | | $ | 12.02 | | | $ | 12.24 | | | $ | 12.45 | | |
| Income from Investment Operations: | |
| Net investment income (a) | | | 0.33 | | | | 0.36 | | | | 0.37 | | | | 0.36 | | | | 0.37 | | |
Net realized and unrealized gain (loss) on investments
and futures contracts | | | 0.49 | | | | 0.09 | | | | 0.05 | | | | (0.22 | ) | | | (0.22 | ) | |
| Total from investment operations | | | 0.82 | | | | 0.45 | | | | 0.42 | | | | 0.14 | | | | 0.15 | | |
| Less Distributions to Shareholders: | |
| From net investment income | | | (0.32 | ) | | | (0.36 | ) | | | (0.37 | ) | | | (0.36 | ) | | | (0.36 | ) | |
| Increase from regulatory settlements | | | — | | | | 0.01 | | | | — | | | | — | | | | — | | |
| Net Asset Value, End of Period | | $ | 12.67 | | | $ | 12.17 | | | $ | 12.07 | | | $ | 12.02 | | | $ | 12.24 | | |
| Total return (b) | | | 6.88 | %(c) | | | 3.92 | %(c) | | | 3.56 | %(c) | | | 1.16 | % | | | 1.29 | %(c) | |
| Ratios to Average Net Assets/Supplemental Data: | |
| Net expenses (d) | | | 1.53 | % | | | 1.50 | % | | | 1.52 | % | | | 1.63 | % | | | 1.64 | % | |
| Waiver/Reimbursement | | | 0.11 | % | | | 0.14 | % | | | 0.10 | % | | | — | | | | — | %(e) | |
| Net investment income (d) | | | 2.66 | % | | | 3.02 | % | | | 3.08 | % | | | 2.98 | % | | | 3.00 | % | |
| Portfolio turnover rate | | | 12 | % | | | 8 | % | | | 5 | % | | | 16 | % | | | 2 | % | |
| Net assets, end of period (000s) | | $ | 403 | | | $ | 641 | | | $ | 570 | | | $ | 842 | | | $ | 913 | | |
(a) Per share data was calculated using the average shares outstanding during the period.
(b) Total return at net asset value assuming all distributions reinvested and no contingent deferred sales charge.
(c) Had the investment advisor and/or any of its affiliates not waived fees or reimbursed a portion of expenses, total return would have been reduced.
(d) The benefits derived from expense reductions had an impact of less than 0.01%.
(e) Rounds to less than 0.01%.
See Accompanying Notes to Financial Statements.
22
Financial Highlights – Columbia Oregon Intermediate Municipal Bond Fund
Selected data for a share outstanding throughout each period is as follows:
| | | Year Ended August 31, | |
| Class C Shares | | 2010 | | 2009 | | 2008 | | 2007 | | 2006 | |
| Net Asset Value, Beginning of Period | | $ | 12.17 | | | $ | 12.07 | | | $ | 12.02 | | | $ | 12.24 | | | $ | 12.45 | | |
| Income from Investment Operations: | |
| Net investment income (a) | | | 0.37 | | | | 0.40 | | | | 0.41 | | | | 0.40 | | | | 0.41 | | |
Net realized and unrealized gain (loss) on investments
and futures contracts | | | 0.50 | | | | 0.09 | | | | 0.05 | | | | (0.21 | ) | | | (0.21 | ) | |
| Total from investment operations | | | 0.87 | | | | 0.49 | | | | 0.46 | | | | 0.19 | | | | 0.20 | | |
| Less Distributions to Shareholders: | |
| From net investment income | | | (0.37 | ) | | | (0.40 | ) | | | (0.41 | ) | | | (0.41 | ) | | | (0.41 | ) | |
| Increase from regulatory settlements | | | — | | | | 0.01 | | | | — | | | | — | | | | — | | |
| Net Asset Value, End of Period | | $ | 12.67 | | | $ | 12.17 | | | $ | 12.07 | | | $ | 12.02 | | | $ | 12.24 | | |
| Total return (b)(c) | | | 7.25 | % | | | 4.28 | % | | | 3.88 | % | | | 1.52 | % | | | 1.64 | % | |
| Ratios to Average Net Assets/Supplemental Data: | |
| Net expenses (d) | | | 1.18 | % | | | 1.15 | % | | | 1.17 | % | | | 1.28 | % | | | 1.29 | % | |
| Waiver/Reimbursement | | | 0.46 | % | | | 0.49 | % | | | 0.45 | % | | | 0.35 | % | | | 0.35 | % | |
| Net investment income (d) | | | 2.96 | % | | | 3.34 | % | | | 3.36 | % | | | 3.33 | % | | | 3.33 | % | |
| Portfolio turnover rate | | | 12 | % | | | 8 | % | | | 5 | % | | | 16 | % | | | 2 | % | |
| Net assets, end of period (000s) | | $ | 16,722 | | | $ | 11,332 | | | $ | 7,847 | | | $ | 1,097 | | | $ | 616 | | |
(a) Per share data was calculated using the average shares outstanding during the period.
(b) Total return at net asset value assuming all distributions reinvested and no contingent deferred sales charge.
(c) Had the investment advisor and/or any of its affiliates not waived fees or reimbursed a portion of expenses, total return would have been reduced.
(d) The benefits derived from expense reductions had an impact of less than 0.01%.
See Accompanying Notes to Financial Statements.
23
Financial Highlights – Columbia Oregon Intermediate Municipal Bond Fund
Selected data for a share outstanding throughout each period is as follows:
| | | Year Ended August 31, | |
| Class Z Shares | | 2010 | | 2009 | | 2008 | | 2007 | | 2006 | |
| Net Asset Value, Beginning of Period | | $ | 12.17 | | | $ | 12.07 | | | $ | 12.02 | | | $ | 12.24 | | | $ | 12.45 | | |
| Income from Investment Operations: | |
| Net investment income (a) | | | 0.45 | | | | 0.48 | | | | 0.49 | | | | 0.49 | | | | 0.49 | | |
Net realized and unrealized gain (loss) on investments
and futures contracts | | | 0.50 | | | | 0.09 | | | | 0.05 | | | | (0.23 | ) | | | (0.21 | ) | |
| Total from investment operations | | | 0.95 | | | | 0.57 | | | | 0.54 | | | | 0.26 | | | | 0.28 | | |
| Less Distributions to Shareholders: | |
| From net investment income | | | (0.45 | ) | | | (0.48 | ) | | | (0.49 | ) | | | (0.48 | ) | | | (0.49 | ) | |
| Increase from regulatory settlements | | | — | | | | 0.01 | | | | — | | | | — | | | | — | | |
| Net Asset Value, End of Period | | $ | 12.67 | | | $ | 12.17 | | | $ | 12.07 | | | $ | 12.02 | | | $ | 12.24 | | |
| Total return (b) | | | 7.95 | %(c) | | | 4.96 | %(c) | | | 4.59 | %(c) | | | 2.18 | % | | | 2.31 | %(c) | |
| Ratios to Average Net Assets/Supplemental Data: | |
| Net expenses (d) | | | 0.53 | % | | | 0.50 | % | | | 0.52 | % | | | 0.63 | % | | | 0.64 | % | |
| Waiver/Reimbursement | | | 0.11 | % | | | 0.14 | % | | | 0.10 | % | | | — | | | | — | %(e) | |
| Net investment income (d) | | | 3.63 | % | | | 4.02 | % | | | 4.07 | % | | | 3.98 | % | | | 3.99 | % | |
| Portfolio turnover rate | | | 12 | % | | | 8 | % | | | 5 | % | | | 16 | % | | | 2 | % | |
| Net assets, end of period (000s) | | $ | 450,422 | | | $ | 416,275 | | | $ | 381,162 | | | $ | 368,292 | | | $ | 380,653 | | |
(a) Per share data was calculated using the average shares outstanding during the period.
(b) Total return at net asset value assuming all distributions reinvested.
(c) Had the investment advisor and/or any of its affiliates not waived fees or reimbursed a portion of expenses, total return would have been reduced.
(d) The benefits derived from expense reductions had an impact of less than 0.01%.
(e) Rounds to less than 0.01%.
See Accompanying Notes to Financial Statements.
24
Notes to Financial Statements – Columbia Oregon Intermediate Municipal Bond Fund
August 31, 2010
Note 1. Organization
Columbia Oregon Intermediate Municipal Bond Fund (the "Fund"), a series of Columbia Funds Series Trust I (the "Trust"), is a diversified fund. The Trust is registered under the Investment Company Act of 1940, as amended (the "1940 Act"), as an open-end management investment company organized as a Massachusetts business trust.
Investment Objective
The Fund seeks a high level of income exempt from federal and Oregon income tax by investing at least 80% of its net assets (plus any borrowings for investment purposes) in municipal securities issued by the State of Oregon (and its political subdivisions, agencies, authorities and instrumentalities).
Fund Shares
The Trust may issue an unlimited number of shares, and the Fund offers four classes of shares: Class A, Class B, Class C and Class Z. Each share class has its own expense structure and sales charges, as applicable. The Fund no longer accepts investments from new or existing investors in the Fund's Class B shares, except in connection with the reinvestment of any dividend and/or capital gain distributions in Class B shares of the Fund and exchanges by existing Class B shareholders of the other Columbia Funds.
Class A shares are subject to a maximum front-end sales charge of 3.25% based on the amount of initial investment. Class A shares purchased without an initial sales charge in accounts aggregating $1 million to $50 million at the time of purchase are subject to a 1.00% contingent deferred sales charge ("CDSC") if the shares are sold within one year after purchase. Class B shares are subject to a maximum CDSC of 3.00% based upon the holding period after purchase. Class B shares will convert to Class A shares eight years after purchase. Class C shares are subject to a 1.00% CDSC on shares sold within one year after purchase. Class Z shares are offered continuously at net asset value. There are certain restrictions on the purchase of Class Z shares, as described in the Fund's prospectus.
Note 2. Significant Accounting Policies
The preparation of financial statements in accordance with accounting principles generally accepted in the United States of America ("GAAP") requires management to make certain estimates and assumptions that affect the reported amounts of assets and liabilities, the disclosure of contingent assets and liabilities at the date of the financial statements and the reported amounts of revenue and expenses during the reporting period. Actual results could differ from those estimates.
Management has evaluated the events and transactions that have occurred through the date the financial statements were issued and noted no items requiring adjustment of the financial statements or additional disclosures.
The following is a summary of significant accounting policies consistently followed by the Fund in the preparation of its financial statements.
Security Valuation
Debt securities generally are valued by pricing services approved by the Trust's Board of Trustees, based upon market transactions for normal, institutional-size trading units of similar securities. The services may use various pricing techniques which take into account appropriate factors such as yield, quality, coupon rate, maturity, type of issue, trading characteristics and other data, as well as broker quotes. Debt securities for which quotations are readily available may also be valued based upon an over-the-counter or exchange bid quotation.
Investments in other open-end investment companies are valued at net asset value.
Investments for which market quotations are not readily available, or that have quotations which management believes are not reliable, are valued at fair value as determined in good faith under consistently applied procedures established by and under the general supervision of the Board of Trustees. If a security is valued at fair value, such value is likely to be different from the last quoted market price for the security. The determination of fair value often requires significant judgment. To determine fair value, management may use assumptions including but not limited to future cash flows and estimated risk premiums. Multiple inputs from various sources may be used to determine value.
GAAP establishes a hierarchy that prioritizes the inputs to valuation techniques used to measure fair value giving the highest priority to unadjusted quoted prices in active markets for identical securities (level 1 measurements) and the lowest
25
Columbia Oregon Intermediate Municipal Bond Fund, August 31, 2010
priority to unobservable inputs (level 3 measurements) when market prices are not readily available or reliable. The three levels of the fair value hierarchy are described below:
• Level 1 – quoted prices in active markets for identical securities
• Level 2 – prices determined using other significant observable inputs (including quoted prices for similar securities, interest rates, prepayment speeds, credit risk and others)
• Level 3 – prices determined using significant unobservable inputs. In situations where quoted prices or observable inputs are unavailable or less reliable, unobservable inputs may be used. Unobservable inputs may include management's own assumptions about the factors market participants would use in pricing an investment.
The inputs or methodology used for valuing securities are not necessarily an indication of the risk associated with investing in those securities.
On January 21, 2010, the Financial Accounting Standards Board issued an Accounting Standards Update (the "amendment"), Fair Value Measurements and Disclosures (Topic 820): Improving Disclosures about Fair Value Measurements, which provides guidance on how investment assets and liabilities are to be valued and disclosed. Specifically, the amendment requires reporting entities to disclose the inputs and valuation techniques used to measure fair value for both recurring and nonrecurring fair value measurements for Level 2 and Level 3 positions. The amendment also requires that transfers between all levels (including Level 1 and Level 2) be disclosed on a gross basis (i.e., transfers out must be disclosed separately from transfers in), and requires disclosure of the reason(s) for sign ificant transfers. Additionally, purchases, sales, issuances and settlements must be disclosed on a gross basis in the Level 3 roll forward. The effective date of the amendment is for interim and annual periods beginning after December 15, 2009; except for the requirement to provide the Level 3 activity for purchases, sales, issuances and settlements on a gross basis, which will be effective for interim and annual periods beginning after December 15, 2010. At this time, management is evaluating the implications of the amendment and the impact to the financial statements.
Security Transactions
Security transactions are accounted for on the trade date. Cost is determined and gains (losses) are based upon the specific identification method for both financial statement and federal income tax purposes.
Delayed Delivery Securities
The Fund may trade securities on other than normal settlement terms, including securities purchased or sold on a "when-issued" basis. This may increase the risk if the other party to the transaction fails to deliver and causes the Fund to subsequently invest at less advantageous prices. The Fund identifies within its portfolio of investments cash or liquid securities in an amount equal to the delayed delivery commitment.
Income Recognition
Interest income is recorded on the accrual basis. Premium and discount are amortized and accreted, respectively, on all debt securities, unless otherwise noted.
Original issue discount is accreted to interest income over the life of the security with a corresponding increase in the cost basis.
Expenses
General expenses of the Trust are allocated to the Fund and other series of the Trust based upon relative net assets or other expense allocation methodologies determined by the nature of the expense. Expenses directly attributable to a specific class of shares are charged to that specific class. Expenses directly attributable to the Fund are charged to the Fund.
Determination of Class Net Asset Value
All income, expenses (other than class-specific expenses, as shown on the Statement of Operations) and realized and unrealized gains (losses) are allocated to each class of the Fund on a daily basis for purposes of determining the net asset value of each class. Income and expenses are allocated to each class based on the settled shares method, while realized and unrealized gains (losses) are allocated based on the relative net assets of each class.
26
Columbia Oregon Intermediate Municipal Bond Fund, August 31, 2010
Federal Income Tax Status
The Fund intends to qualify each year as a "regulated investment company" under Subchapter M of the Internal Revenue Code, as amended, and will distribute substantially all of its tax exempt or taxable income, if any, for its tax year, and as such will not be subject to federal income taxes. In addition, the Fund intends to distribute in each calendar year substantially all of its net investment income, capital gains and certain other amounts, if any, such that the Fund should not be subject to federal excise tax. Therefore, no federal income or excise tax provision is recorded.
Distributions to Shareholders
Distributions from net investment income are declared daily and paid monthly. Net realized capital gains, if any, are distributed at least annually. Income distributions and capital gain distributions are determined in accordance with federal income tax regulations which may differ from GAAP.
Indemnification
In the normal course of business, the Fund enters into contracts that contain a variety of representations and warranties and which provide general indemnities. The Fund's maximum exposure under these arrangements is unknown because this would involve future claims against the Fund. Also, under the Trust's organizational documents and by contract, the Trustees and officers of the Trust are indemnified against certain liabilities that may arise out of actions relating to their duties to the Trust. However, based on experience, the Fund expects the risk of loss due to these representations, warranties and indemnities to be minimal.
Note 3. Federal Tax Information
The timing and character of income and capital gain distributions are determined in accordance with income tax regulations, which may differ from GAAP. Reclassifications are made to the Fund's capital accounts for permanent tax differences to reflect income and gains available for distribution (or available capital loss carryforwards) under income tax regulations.
For the year ended August 31, 2010, permanent book and tax basis differences resulting primarily from differing treatments for discount accretion/premium amortization on debt securities and market discount adjustments were identified and reclassified among the components of the Fund's net assets as follows:
Undistributed
Net Investment
Income | | Accumulated
Net Realized
Gain | | Paid-In Capital | |
| $ | (11,930 | ) | | $ | 11,930 | | | $ | — | | |
Net investment income and net realized gains (losses), as disclosed on the Statement of Operations, and net assets were not affected by this reclassification.
The tax character of distributions paid during the years ended August 31, 2010 and August 31, 2009 was as follows:
| | | August 31, | |
| Distributions paid from | | 2010 | | 2009 | |
| Tax-Exempt Income | | $ | 16,606,638 | | | $ | 16,013,698 | | |
| Ordinary Income* | | | 47,094 | | | | 290,035 | | |
* For tax purposes short-term capital gains distributions, if any, are considered ordinary income distributions.
As of August 31, 2010, the components of distributable earnings on a tax basis were as follows:
Undistributed
Tax-Exempt
Income | | Undistributed
Long-Term
Capital Gains | | Net Unrealized
Appreciation* | |
| $ | 781,164 | | | $ | 784,781 | | | $ | 31,345,489 | | |
* The differences between book-basis and tax-basis net unrealized depreciation are primarily due to deferral of losses from wash sales.
Unrealized appreciation and depreciation at August 31, 2010, based on cost of investments for federal income tax purposes were:
| Unrealized appreciation | | $ | 32,486,923 | | |
| Unrealized depreciation | | | (1,141,434 | ) | |
| Net unrealized appreciation | | $ | 31,345,489 | | |
27
Columbia Oregon Intermediate Municipal Bond Fund, August 31, 2010
Capital loss carryforwards of $88,245 were utilized during the year ended August 31, 2010. Any capital loss carryforwards acquired as part of a merger that are permanently lost due to provisions under the Internal Revenue Code are included as being expired. Expired capital loss carryforwards are recorded as a reduction of paid-in capital.
Management is required to determine whether a tax position of the Fund is more likely than not to be sustained upon examination by the applicable taxing authority, including resolution of any related appeals or litigation processes, based on the technical merits of the position. The tax benefit to be recognized by the Fund is measured as the largest amount of benefit that is greater than fifty percent likely of being realized upon ultimate settlement. Management is not aware of any tax positions for which it is reasonably possible that the total amounts of unrecognized tax benefits will significantly change in the next twelve months. However, management's conclusions may be subject to review and adjustment at a later date based on factors including, but not limited to, new tax laws, regulations, and administrative interpretations (including relevant court decisions). The Fund's federal tax returns for the prior three fiscal year s remain subject to examination by the Internal Revenue Service.
Note 4. Fees and Compensation Paid to Affiliates
Investment Advisory Fee
After the close of business on April 30, 2010, Ameriprise Financial, Inc. ("Ameriprise Financial") acquired a portion of the asset management business of Columbia Management Group, LLC (the "Transaction"), including the business of managing the Fund. In connection with the closing of the Transaction (the "Closing"), RiverSource Investments, LLC, a wholly owned subsidiary of Ameriprise Financial, became the investment advisor of the Fund and subsequently changed its name to Columbia Management Investment Advisers, LLC (the "New Advisor"). The New Advisor receives a monthly investment advisory fee at the annual rate of 0.50% of the Fund's average daily net assets.
Prior to the Closing, Columbia Management Advisors, LLC ("Columbia"), an indirect, wholly owned subsidiary of Bank of America Corporation ("BOA"), provided investment advisory, administrative and other services to the Fund under the same fee structure.
Administration Fee
Effective upon the Closing, the New Advisor became the administrator of the Fund under a new Administrative Services Agreement (the "Administrative Agreement"). Under the Administrative Agreement, the New Advisor provides administrative and other services to the Fund, including services previously performed under the Pricing and Bookkeeping Oversight and Services Agreement discussed below. The New Advisor does not receive a fee for its services under the Administrative Agreement. Prior to the Closing, Columbia provided administrative services to the Fund as discussed in the Investment Advisory Fee note above.
Pricing and Bookkeeping Fees
Prior to the Closing, the Fund entered into a Financial Reporting Services Agreement (the "Financial Reporting Services Agreement") with State Street Bank and Trust Company ("State Street") and Columbia pursuant to which State Street provides financial reporting services to the Fund. The Fund also entered into an Accounting Services Agreement (collectively with the Financial Reporting Services Agreement, the "State Street Agreements") with State Street and Columbia pursuant to which State Street provides accounting services to the Fund. Upon the Closing, Columbia assigned and delegated its rights and obligations under the State Street Agreements to the New Advisor. Under the State Street Agreements, the Fund pays State Street an annual fee of $38,000 paid monthly plus an additional monthly fee based on an annualized percentage rate of average daily net assets of the Fund for the month. The aggregate fee will not exceed $140,000 per year (exclusive of out-of-pocket expenses and charges). The Fund also reimburses State Street for certain out-of-pocket expenses and charges.
Also prior to the Closing, the Fund entered into a Pricing and Bookkeeping Oversight and Services Agreement (the "Services Agreement") with Columbia. Under the Services Agreement, Columbia provided services related to Fund expenses and the requirements of the Sarbanes-Oxley Act of 2002, and provided oversight of the accounting and financial reporting services provided by State Street. Under the Services Agreement, the Fund reimbursed Columbia for out-of-pocket expenses. The
28
Columbia Oregon Intermediate Municipal Bond Fund, August 31, 2010
Services Agreement was terminated upon the Closing. These services are now provided under the Administrative Agreement discussed above.
Transfer Agent Fee
In connection with the Closing, RiverSource Service Corporation, a wholly owned subsidiary of Ameriprise Financial, became the transfer agent of the Fund and subsequently changed its name to Columbia Management Investment Services Corp. (the "New Transfer Agent"). The New Transfer Agent has contracted with Boston Financial Data Services ("BFDS") to serve as sub-transfer agent. The New Transfer Agent receives a fee for its services, paid monthly, at the annual rate of $22.36 per account plus reimbursement of certain sub-transfer agent fees paid by the New Transfer Agent (exclusive of BFDS fees), calculated based on assets held in omnibus accounts and intended to recover the cost of payments to other parties (including affiliates of BOA) for services to those accounts. The New Transfer Agent pays the fees of BFDS for services as sub-transfer agent and is not entitled to reimbursement for such fees from the Fund.
The New Transfer Agent may also retain, as additional compensation for its services, fees for wire, telephone and redemption orders, Individual Retirement Account ("IRA") trustee agent fees and account transcript fees due to the New Transfer Agent from shareholders of the Fund and credits (net of bank charges) earned with respect to balances in accounts the New Transfer Agent maintains in connection with its services to the Fund. The New Transfer Agent also receives reimbursement for certain out-of-pocket expenses.
Prior to the Closing, Columbia Management Services, Inc. (the "Previous Transfer Agent"), an affiliate of Columbia and an indirect, wholly owned subsidiary of BOA, provided shareholder services to the Fund and contracted with BFDS to serve as sub-transfer agent, under the same fee structure. Prior to November 1, 2009, the annual rate was $17.34 per account.
An annual minimum account balance fee of $20 may apply to certain accounts with a value below the Fund's initial minimum investment requirements to reduce the impact of small accounts on transfer agent fees. These minimum account balance fees are recorded as part of expense reductions on the Statement of Operations. For the year ended August 31, 2010, no minimum account balance fees were charged by the Fund.
Underwriting Discounts, Service and Distribution Fees
In connection with the Closing, RiverSource Fund Distributors, Inc., an indirect wholly owned subsidiary of Ameriprise Financial, became the distributor of the Fund and subsequently changed its name to Columbia Management Investment Distributors, Inc. (the "New Distributor").
For the year ended August 31, 2010, initial sales charges paid by shareholders on the purchase of Class A shares amounted to $6,342 and net CDSC fees paid by shareholders on certain redemptions of Class B and Class C shares amounted to $99 and $2,134, respectively.
The Fund has adopted shareholder servicing and distribution plans pursuant to Rule 12b-1 under the 1940 Act (the "Plans") which require the payment of a monthly service fee to the New Distributor at the maximum annual rate of 0.25% of the average daily net assets attributable to Class A, Class B and Class C shares of the Fund. The Plans also require the payment of a monthly distribution fee to the New Distributor at the maximum annual rates of 0.10%, 0.75% and 0.75% of the average daily net assets attributable to Class A, Class B and Class C shares, respectively.
The Fund may pay distribution and service fees up to a maximum annual rate of 0.35% of the Fund's average daily net assets attributable to Class A shares (comprised of up to 0.10% for distribution services and up to 0.25% for shareholder liaison services), but currently limit such fees to an aggregate fee of not more than 0.25% of the Fund's average daily net assets attributable to Class A shares.
The New Distributor has voluntarily agreed to waive a portion of the distribution fee for Class C shares so that the combined distribution and service fees do not exceed the annual rate of 0.65% of the average daily net assets of the Class C shares of the Fund. This arrangement may be modified or terminated by the New Distributor at any time.
The CDSC and the distribution fees received from the Plans are used principally as repayment to the New Distributor for amounts paid by the New Distributor to dealers who sold such shares.
Prior to the Closing, Columbia Management Distributors, Inc., an affiliate of Columbia and an indirect, wholly owned subsidiary of BOA, was the principal underwriter of the Fund's
29
Columbia Oregon Intermediate Municipal Bond Fund, August 31, 2010
shares. There were no changes to the underwriting discount structure of the Fund or the service or distribution fee rates paid by the Fund as a result of the Transaction.
Expense Limits and Fee Waivers
Effective May 1, 2010, the New Advisor has voluntarily agreed to reimburse a portion of the Fund's expenses so that the Fund's ordinary operating expenses (excluding any distribution and service fees, brokerage commissions, interest, taxes and extraordinary expenses, but including custodian charges relating to overdrafts, if any), after giving effect to any balance credits from the Fund's custodian, do not exceed 0.55% of the Fund's average daily net assets on an annualized basis. This arrangement may be modified or terminated by the New Advisor at any time. For the period January 1, 2010 to May 1, 2010, Columbia voluntarily reimbursed a portion of the Fund's expenses in the same manner. Prior to January 1, 2010, Columbia contractually agreed to bear a portion of the Fund's expenses so that the Fund's ordinary operating expenses (excluding any distribution and service fees, brokerage commissions, interest, taxes and extraordinar y expenses, but including custodian charges relating to overdrafts, if any), after giving effect to any balance credits from the Fund's custodian, did not exceed the annual rate of 0.50% of the Fund's average daily net assets.
Fees Paid to Officers and Trustees
In connection with the Closing, all officers of the Fund are employees of the New Advisor or its affiliates and, with the exception of the Fund's Chief Compliance Officer, receive no compensation from the Fund. The Board of Trustees has appointed a Chief Compliance Officer to the Fund in accordance with federal securities regulations. The Fund, along with other affiliated funds, pays its pro-rata share of the expenses associated with the Chief Compliance Officer. The Fund's expenses for the Chief Compliance Officer will not exceed $15,000 per year. Prior to the Closing, the Fund paid its pro-rata share of the expenses for the Chief Compliance Officer under the same fee structure.
Trustees are compensated for their services to the Fund, as set forth on the Statement of Operations. The Trust's eligible Trustees may participate in a deferred compensation plan which may be terminated at any time. Obligations of the plan will be paid solely out of the Fund's assets.
Other
Prior to the Closing, the Fund made daily investments of cash balances in BofA (formerly Columbia) Tax-Exempt Reserves, formerly an affiliated open-ended investment company of Columbia, pursuant to an exemptive order received from the Securities and Exchange Commission. As an investing Fund, the Fund was indirectly allocated its proportionate share of the expenses of BofA Tax-Exempt Reserves.
Note 5. Custody Credits
The Fund has an agreement with its custodian bank under which custody fees may be reduced by balance credits. These credits are recorded as part of expense reductions on the Statement of Operations. The Fund could have invested a portion of the assets utilized in connection with the expense offset arrangement in an income-producing asset if it had not entered into such an agreement. For the year ended August 31, 2010, these custody credits reduced total expenses by $2 for the Fund.
Note 6. Portfolio Information
For the year ended August 31, 2010, the cost of purchases and proceeds from sales of securities, excluding short-term obligations, for the Fund were $84,641,721 and $54,274,384, respectively.
Note 7. Regulatory Settlements
During the year ended August 31, 2009, the Fund received payments totaling $182,996 relating to certain regulatory settlements with third parties that the Fund had participated in during the twelve month period. The payments have been included in "Increase from regulatory settlements" on the Statement of Changes in Net Assets.
Note 8. Line of Credit
The Fund and other affiliated funds participate in a $280,000,000 committed, unsecured revolving line of credit provided by State Street. The maximum amount that may be borrowed by any fund is limited to the lesser of $200,000,000 and the Fund's borrowing limit set forth in the Fund's registration statement. Borrowings are available for short-term liquidity or temporary or emergency purposes.
Effective October 15, 2009, interest is charged to each participating fund based on the fund's borrowings at a rate
30
Columbia Oregon Intermediate Municipal Bond Fund, August 31, 2010
per annum equal to the greater of the Federal Funds Rate plus 1.25% or the overnight LIBOR Rate plus 1.25%. In addition, a commitment fee of 0.15% per annum is accrued and apportioned among the participating funds pro rata based on their relative net assets.
Prior to October 15, 2009, interest was charged to each participating fund based on the fund's borrowings at a rate per annum equal to the greater of the Federal Funds Rate plus 0.50% or the overnight LIBOR Rate plus 0.50%. In addition, an annual operations agency fee of $20,000, an amendment fee of 0.02% and a commitment fee of 0.12% per annum were accrued and apportioned among the participating funds pro rata based on their relative net assets.
For the year ended August 31, 2010, the Fund did not borrow under these arrangements.
Note 9. Shareholder Concentration
As of August 31, 2010, one shareholder account owned 14.5% of the outstanding shares of the Fund. Purchase and redemption activity of this account may have a significant effect on the operations of the Fund.
Note 10. Significant Risks and Contingencies
Geographic Concentration Risk
The Fund had greater than 5% of its total net assets at August 31, 2010, invested in debt obligations issued by Oregon and its political subdivisions, agencies and public authorities. The Fund is more susceptible to economic and political factors adversely affecting issuers of this state's municipal securities than are municipal bond funds that are not concentrated to the same extent in these issuers.
Tax Development Risk
The Fund purchases municipal securities whose interest, in the opinion of bond counsel, is free from federal income tax. There is no assurance that the Internal Revenue Service (IRS) will agree with this opinion. In the event the IRS determines that an issuer does not comply with relevant tax requirements, interest payments from a security could become federally taxable, possibly retroactively to the date the security was issued. As a shareholder of the Fund, you may be required to file an amended tax return as a result.
Information Regarding Pending and Settled Legal Proceedings
In June 2004, an action captioned John E. Gallus et al. v. American Express Financial Corp. and American Express Financial Advisors Inc. was filed in the United States District Court for the District of Arizona. The plaintiffs allege that they are investors in several American Express Company (now known as legacy RiverSource) mutual funds and they purport to bring the action derivatively on behalf of those funds under the Investment Company Act of 1940. The plaintiffs allege that fees allegedly paid to the defendants by the funds for investment advisory and administrative services are excessive. The plaintiffs seek remedies including restitution and rescission of investment advisory and distribution agreements. The plaintiffs voluntarily agreed to transfer this case to the United States District Court for the District of Minnesota (the District Court). In response to defendants' motion to dismiss the complaint, the District Court dismissed one of plaintiffs' four claims and granted plaintiffs limited discovery. Defendants moved for summary judgment in April 2007. Summary judgment was granted in the defendants' favor on July 9, 2007. The plaintiffs filed a notice of appeal with the Eighth Circuit Court of Appeals (the Eighth Circuit) on August 8, 2007. On April 8, 2009, the Eighth Circuit reversed summary judgment and remanded to the District Court for further proceedings. On August 6, 2009, defendants filed a writ of certiorari with the U.S. Supreme Court (the Supreme Court), asking the Supreme Court to stay the District Court proceedings while the Supreme Court considers and rules in a case captioned Jones v. Harris Associates, which involves issues of law similar to those presented in the Gallus case. On March 30, 2010, the Supreme Court issued its ruling in Jones v. Harris Associates, and on April 5, 2010, the Supreme Court vacated the Eighth Circuit's decision in the Gallus case and remanded the case to the Eighth Circuit for further consideration in light of the Supreme Court's decision in Jones v. Harris Associates. On June 4, 2010, the Eighth Circuit remanded the Gallus case to the District Court for further consideration in light of the Supreme Court's decision in Jones v. Harris Associates.
In December 2005, without admitting or denying the allegations, American Express Financial Corporation (AEFC, which is now known as Ameriprise Financial, Inc. (Ameriprise Financial)), entered into settlement agreements with the Securities and Exchange Commission (SEC) and Minnesota Department of
31
Columbia Oregon Intermediate Municipal Bond Fund, August 31, 2010
Commerce (MDOC) related to market timing activities. As a result, AEFC was censured and ordered to cease and desist from committing or causing any violations of certain provisions of the Investment Advisers Act of 1940, the Investment Company Act of 1940, and various Minnesota laws. AEFC agreed to pay disgorgement of $10 million and civil money penalties of $7 million. AEFC also agreed to retain an independent distribution consultant to assist in developing a plan for distribution of all disgorgement and civil penalties ordered by the SEC in accordance with various undertakings detailed at http://www.sec.gov/litigation/admin/ia-2451.pdf. Ameriprise Financial and its affiliates have cooperated with the SEC and the MDOC in these legal proceedings, and have made regular reports to the funds' Boards of Directors/Trustees.
Ameriprise Financial and certain of its affiliates have historically been involved in a number of legal, arbitration and regulatory proceedings, including routine litigation, class actions, and governmental actions, concerning matters arising in connection with the conduct of their business activities. Ameriprise Financial believes that the Funds are not currently the subject of, and that neither Ameriprise Financial nor any of its affiliates are the subject of, any pending legal, arbitration or regulatory proceedings that are likely to have a material adverse effect on the Funds or the ability of Ameriprise Financial or its affiliates to perform under their contracts with the Funds. Ameriprise Financial is required to make 10-Q, 10-K and, as necessary, 8-K filings with the Securities and Exchange Commission on legal and regulatory matters that relate to Ameriprise Financial and its affiliates. Copies of these filings may be obt ained by accessing the SEC website at www.sec.gov.
There can be no assurance that these matters, or the adverse publicity associated with them, will not result in increased fund redemptions, reduced sale of fund shares or other adverse consequences to the Funds. Further, although we believe proceedings are not likely to have a material adverse effect on the Funds or the ability of Ameriprise Financial or its affiliates to perform under their contracts with the Funds, these proceedings are subject to uncertainties and, as such, we are unable to estimate the possible loss or range of loss that may result. An adverse outcome in one or more of these proceedings could result in adverse judgments, settlements, fines, penalties or other relief that could have a material adverse effect on the consolidated financial condition or results of operations of Ameriprise Financial.
32
Report of Independent Registered Public Accounting Firm
To the Trustees of Columbia Funds Series Trust I and Shareholders of Columbia Oregon Intermediate Municipal Bond Fund
In our opinion, the accompanying statement of assets and liabilities, including the investment portfolios, and the related statements of operations and of changes in net assets and the financial highlights present fairly, in all material respects, the financial position of Columbia Oregon Intermediate Municipal Bond Fund (the "Fund") (a series of Columbia Funds Series Trust I) at August 31, 2010, the results of its operations for the year then ended, the changes in its net assets for each of the two years in the period then ended, and the financial highlights for each of the five years in the period then ended, in conformity with accounting principles generally accepted in the United States of America. These financial statements and financial highlights (hereafter referred to as "financial statements") are the responsibility of the Fund's management. Our responsibility is to express an opinion on these financial statements based on our audits. We conducted our audits of these financial statements in accordance with the standards of the Public Company Accounting Oversight Board (United States). Those standards require that we plan and perform the audit to obtain reasonable assurance about whether the financial statements are free of material misstatement. An audit includes examining, on a test basis, evidence supporting the amounts and disclosures in the financial statements, assessing the accounting principles used and significant estimates made by management, and evaluating the overall financial statement presentation. We believe that our audits, which included confirmation of securities at August 31, 2010 by correspondence with the custodian and brokers, provide a reasonable basis for our opinion.
PricewaterhouseCoopers LLP
Boston, Massachusetts
October 25, 2010
33
Federal Income Tax Information (Unaudited) – Columbia Oregon Intermediate
Municipal Bond Fund
The Fund hereby designates as a capital gain dividend with respect to the fiscal year ended August 31, 2010, $824,020, or, if subsequently determined to be different, the net capital gain of such year.
99.72% of the distributions from net investment income will be treated as exempt income for federal income tax purposes.
The Fund will notify shareholders in January 2011 of amounts for use in preparing 2010 income tax returns.
34
Fund Governance
The Trustees serve terms of indefinite duration. The names, addresses and birth years of the Trustees and Officers of the Funds in the Columbia Funds Series Trust I, the year each was first elected or appointed to office, their principal business occupations during at least the last five years, the number of Funds overseen by each Trustee and other directorships they hold are shown below. Each officer listed below serves as an officer of each Fund in the Columbia Funds Complex.
Independent Trustees
Name, Address and Year of Birth,
Position with Funds, Year First
Elected or Appointed to Office | | Principal Occupation(s) During Past Five Years, Number of Funds in Columbia
Funds Complex Overseen by Trustee, Other Directorships Held
| |
| John D. Collins (Born 1938) | |
|
c/o Columbia Management
Investment Advisers, LLC
One Financial Center
Boston, MA 02111
Trustee (since 2005) | | Retired. Consultant, KPMG, LLP (accounting and tax firm) from July 1999 to June 2000; Partner, KPMG, LLP from March 1962 to June 1999. Oversees 64; Mrs. Fields Original Cookies, Inc. (consumer products); Suburban Propane Partners, L.P.; and Montpelier Re (insurance underwriting firm) | |
|
| Rodman L. Drake (Born 1943) | |
|
c/o Columbia Management
Investment Advisers, LLC
One Financial Center
Boston, MA 02111
Trustee (since 1994) and Chairman of the Board (since 2009) | | Co-Founder of Baringo Capital LLC (private equity) since 2002; CEO of Crystal River Capital, Inc. (real estate investment trust) since 2003; President, Continuation Investments Group, Inc. from 1997 to 2001. Oversees 64; Jackson Hewitt Tax Service Inc. (tax preparation services); Crystal Capital River, Inc. (real estate investment trust); Student Loan Corporation (student loan provider); Celgene Corporation (global biotechnology company); and The Helios Funds (exchange-traded funds); Apex Silver Mines Ltd. from 2007 to 2009 | |
|
| Douglas A. Hacker (Born 1955) | |
|
c/o Columbia Management
Investment Advisers, LLC
One Financial Center
Boston, MA 02111
Trustee (since 1996) | | Independent business executive since May 2006; Executive Vice President—Strategy of United Airlines (airline) from December 2002 to May 2006; President of UAL Loyalty Services (airline marketing company) from September 2001 to December 2002; Executive Vice President and Chief Financial Officer of United Airlines from July 1999 to September 2001. Oversees 64; Nash Finch Company (food distributor); Aircastle Limited (aircraft leasing) | |
|
| Janet Langford Kelly (Born 1957) | |
|
c/o Columbia Management
Investment Advisers, LLC
One Financial Center
Boston, MA 02111
Trustee (since 1996) | | Senior Vice President, General Counsel and Corporate Secretary, ConocoPhillips (integrated energy company) since September 2007; Deputy General Counsel—Corporate Legal Services, ConocoPhillips from August 2006 to August 2007; Partner, Zelle, Hofmann, Voelbel, Mason & Gette LLP (law firm) from March 2005 to July 2006; Adjunct Professor of Law, Northwestern University, from September 2004 to June 2006; Director, UAL Corporation (airline) from February 2006 to July 2006; Oversees 64; None | |
|
| Charles R. Nelson (Born 1942) | |
|
c/o Columbia Management
Investment Advisers, LLC
One Financial Center
Boston, MA 02111
Trustee (since 1981) | | Professor of Economics, University of Washington, since January 1976; Ford and Louisa Van Voorhis Professor of Political Economy, University of Washington, since September 1993; Adjunct Professor of Statistics, University of Washington, since September 1980; Associate Editor, Journal of Money Credit and Banking, 1993-2008; Consultant on econometric and statistical matters. Oversees 64; None | |
|
35
Fund Governance (continued)
Independent Trustees (continued)
Name, Address and Year of Birth,
Position with Funds, Year First
Elected or Appointed to Office | | Principal Occupation(s) During Past Five Years, Number of Funds in Columbia
Funds Complex Overseen by Trustee, Other Directorships Held
| |
| John J. Neuhauser (Born 1943) | |
|
c/o Columbia Management
Investment Advisers, LLC
One Financial Center
Boston, MA 02111
Trustee (since 1984) | | President, Saint Michael's College, since August 2007; Director or Trustee of several non-profit organizations, including Fletcher Allen Health Care, Inc.; University Professor, Boston College from November 2005 to August 2007; Academic Vice President and Dean of Faculties, Boston College from August 1999 to October 2005. Oversees 64; Liberty All-Star Equity Fund and Liberty All-Star Growth Fund, Inc. (closed-end funds) | |
|
| Jonathan Piel (Born 1938) | |
|
c/o Columbia Management
Investment Advisers, LLC
One Financial Center
Boston, MA 02111
Trustee (since 1994) | | Cable television producer and website designer; The Editor, Scientific American from 1984 to 1994; Vice President, Scientific American, Inc., from 1984 to 1994; Member, Advisory Board, Stone Age Institute, Bloomington, Indiana (research institute that explores the effect of technology on human evolution); Member, Board of Directors of the National Institute of Social Sciences, New York City; Member, Board of Trustees of the William Alanson White Institute, New York City (institution for training psychoanalysts); and Member, Advisory Board, Mount Sinai Children's Environmental Health Center, New York. Oversees 64; None | |
|
| Patrick J. Simpson (Born 1944) | |
|
c/o Columbia Management
Investment Advisers, LLC
One Financial Center
Boston, MA 02111
Trustee (since 2000) | | Partner, Perkins Coie LLP (law firm). Oversees 64; None | |
|
| Anne-Lee Verville (Born 1945) | |
|
c/o Columbia Management
Investment Advisers, LLC
One Financial Center
Boston, MA 02111
Trustee (since 1998) | | Retired since 1997 (formerly General Manager–Global Education Industry from 1994 to 1997, President–Application Systems Division from 1991 to 1994, Chief Financial Officer–US Marketing & Services from 1988 to 1991, and Chief Information Officer from 1987 to 1988, IBM Corporation (computer and technology)). Oversees 64; Enesco Group, Inc. (producer of giftware and home and garden decor products) from 2001 to 2006 | |
|
36
Fund Governance (continued)
Interested Trustee
Name, Address and Year of Birth,
Position with Funds, Year First
Elected or Appointed to Office | | Principal Occupation(s) During Past Five Years, Number of Funds in Columbia
Funds Complex Overseen by Trustee, Other Directorships Held
| |
| William E. Mayer1 (Born 1940) | |
|
c/o Columbia Management
Investment Advisers, LLC
One Financial Center
Boston, MA 02111
Trustee (since 1994) | | Partner, Park Avenue Equity Partners (private equity) since February 1999; Dean and Professor, College of Business and Management, University of Maryland from 1992 to 1996. Oversees 64; DynaVox Inc. (software developer); Lee Enterprises (print media); WR Hambrecht + Co. (financial service provider); BlackRock Kelso Capital Corporation (investment company) | |
|
1 Mr. Mayer may technically be an "interested person" (as defined in the Investment Company Act of 1940) by reason of his affiliation with WR Hambrecht + Co., a registered broker/dealer that may execute portfolio transactions for, engage in principal transactions with or distribute shares of a Fund or other funds or accounts advised/managed by the Adviser or any sub-adviser to a Fund.
The Statement of Additional Information includes additional information about the Trustees of the Funds and is available, without charge, upon request by calling 1-800-345-6611.
Officers
| Name, Year of Birth and Address | | Principal Occupation(s) During the Past Five Years | |
| J. Kevin Connaughton (Born 1964) | |
|
One Financial Center
Boston, MA 02111
President (since 2009) | | Senior Vice President and General Manager–Mutual Fund Products, Columbia Management Investment Advisers, LLC since May 2010; President, Columbia Funds, since 2009, and RiverSource Funds, since May 2010 (previously Senior Vice President and Chief Financial Officer, Columbia Funds, from June 2008 to January 2009, Treasurer, Columbia Funds, from October 2003 to May 2008, and senior officer of various other affiliated funds since 2000); Managing Director, Columbia Management Advisors, LLC from December 2004 to April 2010. | |
|
| Michael G. Clarke (Born 1969) | |
|
One Financial Center
Boston, MA 02111
Senior Vice President and Chief
Financial Officer (since 2009) | | Vice President, Columbia Management Investment Advisers, LLC since May 2010; Managing Director of Fund Administration, Columbia Management Advisors, LLC, from September 2004 to April 2010; senior officer of Columbia Funds and affiliated funds since 2002. | |
|
| Scott R. Plummer (Born 1959) | |
|
5228 Ameriprise Financial Center
Minneapolis, MN 55474
Senior Vice President, Secretary
and Chief Legal Officer (since 2010) | | Chief Legal Officer and Assistant Secretary, Columbia Management Investment Advisers, LLC since June 2005; Vice President and Lead Chief Counsel–Asset Management, Ameriprise Financial, Inc. since May 2010 (previously Vice President and Chief Counsel–Asset Management, from 2005 to April 2010, and Vice President–Asset Management Compliance from 2004 to 2005); Vice President, Chief Counsel and Assistant Secretary, Columbia Management Investment Distributors, Inc. since 2008; Vice President, General Counsel and Secretary, Ameriprise Certificate Company since 2005; Chief Counsel, RiverSource Distributors, Inc. since 2006; Vice President, General Counsel and Secretary, RiverSource Funds, since December 2006; Senior Vice President, Secretary and Chief Legal Officer, Columbia Funds, since May 2010. | |
|
37
Fund Governance (continued)
Officers (continued)
| Name, Year of Birth and Address | | Principal Occupation(s) During the Past Five Years | |
| Linda J. Wondrack (Born 1964) | |
|
One Financial Center
Boston, MA 02111
Senior Vice President and Chief
Compliance Officer (since 2007) | | Vice President and Chief Compliance Officer, Columbia Management Investment Advisers, LLC since May 2010; Chief Compliance Officer, Columbia Funds, since 2007, and RiverSource Funds, since May 2010; Director (Columbia Management Group, LLC and Investment Product Group Compliance), Bank of America, from June 2005 to April 2010; Director of Corporate Compliance and Conflicts Officer of MFS Investment Management (investment management) from August 2004 to May 2005. | |
|
| William F. Truscott (Born 1960) | |
|
53600 Ameriprise Financial Center
Minneapolis, MN 55474
Senior Vice President (since 2010) | | Chairman of the Board, Columbia Management Investment Advisers, LLC since May 2010 (previously President, Chairman of the Board and Chief Investment Officer, from 2001 to April 2010); Chief Executive Officer, U.S. Asset Management & President, Annuities, Ameriprise Financial, Inc. since May 2010 (previously President–U.S. Asset Management and Chief Investment Officer from 2005 to April 2010, and Senior Vice President—Chief Investment Officer, from 2001 to 2005); Director, President and Chief Executive Officer, Ameriprise Certificate Company since 2006; Director, Columbia Management Investment Distributors, Inc. since May 2010 (previously Chairman of the Board and Chief Executive Officer from 2008 to April 2010); Chairman of the Board and Chief Executive Officer, RiverSource Distributors, Inc. since 2006. | |
|
| Colin Moore (Born 1958) | |
|
One Financial Center
Boston, MA 02111
Senior Vice President (since 2010) | | Director and Chief Investment Officer, Columbia Management Investment Advisers, LLC since May 2010; Manager, Managing Director and Chief Investment Officer of Columbia Management Advisors, LLC from 2007 to April 2010; Head of Equities, Columbia Management Advisors, LLC from 2002 to 2007. | |
|
| Michael A. Jones (Born 1959) | |
|
100 Federal Street
Boston, MA 02110
Senior Vice President (since 2010) | | Director and President, Columbia Management Investment Advisers, LLC since May 2010; President and Director, Columbia Management Investment Distributors, Inc. since May 2010; Manager, Chairman, Chief Executive Officer and President, Columbia Management Advisors, LLC from 2007 to April 2010; Chief Executive Officer, President and Director, Columbia Management Distributors, Inc. from November 2006 to April 2010; previously, co-president and senior managing director at Robeco Investment Management. | |
|
| Amy Johnson (Born 1965) | |
|
5228 Ameriprise Financial Center
Minneapolis, MN 55474
Senior Vice President (since 2010) | | Senior Vice President and Chief Operating Officer, Columbia Management Investment Advisers, LLC since May 2010 (previously Chief Administrative Officer, from 2009 until April 2010, Vice President—Asset Management and Trust Company Services, from 2006 to 2009, and Vice President—Operations and Compliance from 2004 to 2006). | |
|
| Joseph F. DiMaria (Born 1968) | |
|
One Financial Center
Boston, MA 02111
Treasurer (since 2009) and
Chief Accounting Officer (since 2008) | | Vice President, Mutual Fund Administration, Columbia Management Investment Advisers, LLC, since May 2010; Director of Fund Administration, Columbia Management Advisors, LLC from January 2006 to April 2010; Head of Tax/Compliance and Assistant Treasurer, Columbia Management Advisors, LLC, from November 2004 to December 2005. | |
|
38
Fund Governance (continued)
Officers (continued)
| Name, Year of Birth and Address | | Principal Occupation(s) During the Past Five Years | |
| Marybeth Pilat (Born 1968) | |
|
One Financial Center
Boston, MA 02111
Deputy Treasurer (since 2010) | | Vice President, Mutual Fund Administration, Columbia Management Investment Advisers, LLC, since May 2010; Vice President, Investment Operations, Bank of America, from October 2008 to April 2010; Finance Manager, Boston Children's Hospital from August 2008 to October 2008; Director, Mutual Fund Administration, Columbia Management Advisors, LLC, from May 2007 to July 2008; Vice President, Mutual Fund Valuation, Columbia Management Advisors, LLC, from January 2006 to May 2007; Vice President, Mutual Fund Accounting Oversight, Columbia Management Advisors, LLC from January 2005 to January 2006. | |
|
| Julian Quero (Born 1967) | |
|
One Financial Center
Boston, MA 02111
Deputy Treasurer (since 2008) | | Vice President, Mutual Fund Administration, Columbia Management Investment Advisers, LLC since May 2010; Director of Fund Administration, Columbia Management Advisors, LLC, from August 2008 to April 2010; Senior Tax Manager, Columbia Management Advisors, LLC from August 2006 to July 2008; Senior Compliance Manager, Columbia Management Advisors, LLC from April 2002 to August 2006. | |
|
| Stephen T. Welsh (Born 1957) | |
|
One Financial Center
Boston, MA 02111
Vice President (since 2006) | | President and Director, Columbia Management Investment Services Corp. since May 2010; President and Director, Columbia Management Services, Inc. from July 2004 to April 2010; Managing Director, Columbia Management Distributors, Inc. from August 2007 to April 2010. | |
|
39
Summary of Management Fee Evaluation by Independent Fee Consultant (RiverSource Investments, LLC)
EXCERPT FROM REPORT OF INDEPENDENT FEE CONSULTANT TO THE FUNDS SUPERVISED BY THE COLUMBIA ATLANTIC BOARD
Prepared Pursuant to the February 9, 2005
Assurance of Discontinuance among the
Office of Attorney General of New York State,
Columbia Management Advisors, LLC, and
Columbia Management Distributors, Inc.
December 21, 2009
I. Overview
On February 9, 2005, Columbia Management Advisors, LLC ("CMA") and Columbia Management Distributors, Inc.1 ("CMD") agreed to the New York Attorney General's Assurance of Discontinuance ("AOD"). Among other things, the AOD stipulates that CMA may manage or advise a Columbia Fund ("Columbia Fund" and, together with some or all of such funds, the "Columbia Funds") only if the Independent Members of the Columbia Fund's Board of Trustees appoint a Senior Officer or retain an Independent Fee Consultant ("IFC") who is to manage the process by which proposed management fees are negotiated. The AOD further stipulates that the Senior Officer or IFC is to prepare a written annual evaluation of the fee negotiation process.
With effect from January 1, 2007, the Independent Members of the Board of Trustees for certain Columbia Funds known collectively as the "Atlantic Funds" (together with the other members of that Board, the "Trustees") retained me as IFC for the Atlantic Funds.2 In this capacity, I have prepared this written evaluation of the fee negotiation process. As was the case with the last three annual reports, my immediate predecessor as IFC, John Rea, provided invaluable assistance in the preparation of this report.
On September 29, 2009, Ameriprise entered into an asset purchase agreement with Bank of America, N.A. and its parent, Bank of America Corporation (together, the "Bank") pursuant to which the Bank agreed to sell certain CMG assets relating to Columbia's long-term asset management business, including management of the Atlantic Funds (the "Transaction").3 The Transaction if completed would result in the termination of the existing Investment Management Agreements with CMA. Therefore, the Trustees have been requested to approve and recommend to the shareholders of each Atlantic Fund new Investment Management and Sub-Advisory Agreements (together, the "Management Agreements") with RiverSource Investments, LLC ("RI"),4 investment manager of the RiverSource Funds and a subsidiary of Ameriprise. This report is intended to fulfill the requirements of the AOD with respect to the Trustees' consideration of the new Man agement Agreements.
A. Role of the Independent Fee Consultant
The AOD charges the IFC with "managing the process by which proposed management fees ... to be charged the Columbia Fund are negotiated so that they are negotiated in a manner which is at arms' length and reasonable and consistent with this Assurance of Discontinuance." The AOD also provides that CMA "may manage or advise a Columbia Fund only if the reasonableness of the proposed management fees is determined by the Board of Trustees ... using ... an annual independent written evaluation prepared by or under the direction of ... the Independent Fee Consultant." Therefore, the AOD makes clear that the IFC does not supplant the Trustees in negotiating management fees with CMA (or RI), nor does the IFC substitute his or her judgment for that of the Trustees with respect to the reasonableness of proposed fees or any other matter that is committed to the business judgment of the Trustees.
B. Elements Involved in Managing the Fee Negotiation Process
In preparing the report required by the AOD, the IFC must consider at least the following six factors set forth in the AOD:
1. The nature and quality of the adviser's services, including the Fund's performance;
1 CMA and CMD are subsidiaries of Columbia Management Group, LLC ("CMG"), and are the successors to the entities named in the AOD.
2 I have no material relationship with Bank of America, CMG or Ameriprise Financial, Inc. ("Ameriprise"), aside from serving as IFC, and I am aware of no material relationship with any of their affiliates. I retained John Rea, an independent economic consultant, to assist me with this report.
Unless otherwise stated or required by the context, this report covers only the Atlantic Funds.
3 Preliminary Response of Ameriprise to Information Request of Columbia Atlantic Board dated October 21, 2009 (hereafter, the "Preliminary Response"), p. 1. The one money market Atlantic Fund, Money Market Fund VS, was included in the Transaction because it was an integral part of CMG's array of Funds used as investment vehicles by variable annuity and similar insurance products.
4 Ameriprise intends to re-brand RI with the "Columbia" name (which is one of the assets being sold in the Transaction). Preliminary Response, pp. 4-5. In the case of new Sub-Advisory Agreements, the current sub-adviser would also be a party.
40
2. Management fees (including any components thereof) charged by other mutual fund companies for like services;
3. Possible economies of scale as the Fund grows larger;
4. Management fees (including any components thereof) charged to institutional and other clients of the adviser for like services;
5. Costs to the adviser and its affiliates of supplying services pursuant to the management fee agreements, excluding any intra-corporate profit; and
6. Profit margins of the adviser and its affiliates from supplying such services.
C. Data Presented to the Trustees
In considering the proposed new Management Agreements with RI, the Trustees relied in part on the data that had been prepared as part of their annual contract review process, which concluded in late October. This data remained relevant because the fees in the proposed Management Agreements were identical to the fees approved at that time. The annual review materials included a Lipper report on the performance of each Atlantic Fund compared to its peers and its benchmark, comparisons of the fees and expenses of each Atlantic Fund to similar CMG-sponsored Funds, comparable competitive funds chosen by Lipper, and institutional accounts advised by CMA, revenues, expenses, and profits of CMG from managing the Atlantic Funds, calculated both by Fund and collectively, and CMG's views on the existence and sharing of economies of scale.
In addition, the Trustees reviewed materials specific to the proposed new Management Agreements with RI in response to requests for information made on behalf of the Trustees, including the following:
• Performance data for the RiverSource Funds showing percentile and quartile rankings of each fund within its Lipper performance universe for periods up to five years and net returns of each fund relative to its benchmark returns. This data was arguably relevant due to the possibility that some RiverSource investment teams would be providing investment management services to certain Columbia Funds.5
• tables comparing the fee schedules and effective fee rates of funds managed by CMA and RI and institutional accounts advised by the two firms.
• extensive discussion of the process by which the various components of the two asset management businesses would be integrated including investment management, compliance, transfer agency, custody, fund accounting, and distribution.
• information about the financial condition of Ameriprise, including its most recent annual report on Form 10-K, RI's profit margins from managing the RiverSource Funds in 2007 and 2008, and pro forma income statements for the combined Columbia and RiverSource fund complex.
• disclosure that certain senior CMG executives, including President Michael Jones, Chief Investment Officer Colin Moore, Head of Mutual Funds J. Kevin Connaughton, and Chief Compliance Officer Linda Wondrack would continue in analogous capacities following the consummation of the Transaction, and
• a breakdown of the synergies RI expects to realize in the two years following the Transaction and the extent to which those potential synergies are expected to be shared with shareholders of funds advised by RI.
II. Findings
1. Based upon my examination of the information supplied by CMG and Ameriprise in the light of the six factors set forth in the AOD, I conclude that the Trustees have the relevant information necessary to evaluate the reasonableness of the proposed management fees for each Atlantic Fund.
2. In my view, the process by which the proposed management fees of the Atlantic Funds have been negotiated with RI thus far has been, to the extent practicable, at arms' length and reasonable and consistent with the AOD.
Respectfully submitted,
Steven E. Asher
5 On page 20 of its Supplemental Response to the Atlantic Trustees (undated but delivered November 24, 2009), Ameriprise said that "most personnel decisions, including with respect to the portfolio management teams for the Atlantic Funds . . . will be made primarily by [current CMA CIO] Colin Moore using the Columbia 5P process."
41
Shareholder Meeting Results
On March 3, 2010, a special meeting of shareholders of Columbia Funds Series Trust I was held to consider the approval of several proposals listed in the proxy statement for the meeting. Proposal 1 and Proposal 2 were voted on at the March 3, 2010 meeting of shareholders and Proposal 3 was voted on at an adjourned meeting of shareholders held on March 31, 2010. The shareholder meeting results are as follows:
Proposal 1: A proposed Investment Management Services Agreement with Columbia Management Investment Advisers, LLC (formerly, RiverSource Investments, LLC) (CMIA) was approved as follows:
| Votes For | | Votes Against | | Abstentions | | Broker Non-Votes | |
| | 276,247,987 | | | | 25,270,610 | | | | 13,658,490 | | | | 27,909,644 | | |
Proposal 2: A proposal authorizing CMIA to enter into and materially amend subadvisory agreements for the Fund in the future, with the approval of the Trust's Board of Trustees, but without obtaining additional shareholder approval, was approved as follows:
| Votes For | | Votes Against | | Abstentions | | Broker Non-Votes | |
| | 263,609,745 | | | | 36,179,487 | | | | 15,387,917 | | | | 27,909,582 | | |
Proposal 3: Each of the nominees for trustees was elected to the Trust's Board of Trustees, as follows:
| Trustee | | Votes For | | Votes Withheld | | Abstentions | |
| John D. Collins | | | 30,977,072,412 | | | | 859,827,038 | | | | 0 | | |
| Rodman L. Drake | | | 30,951,179,004 | | | | 885,720,446 | | | | 0 | | |
| Douglas A. Hacker | | | 30,989,793,279 | | | | 847,106,171 | | | | 0 | | |
| Janet Langford Kelly | | | 30,999,020,814 | | | | 837,878,636 | | | | 0 | | |
| William E. Mayer | | | 16,291,139,483 | | | | 15,545,759,967 | | | | 0 | | |
| Charles R. Nelson | | | 30,997,700,700 | | | | 839,198,750 | | | | 0 | | |
| John J. Neuhauser | | | 30,988,095,661 | | | | 848,803,789 | | | | 0 | | |
| Jonathon Piel | | | 30,968,801,048 | | | | 868,098,402 | | | | 0 | | |
| Patrick J. Simpson | | | 30,999,065,030 | | | | 837,834,420 | | | | 0 | | |
| Anne-Lee Verville | | | 30,996,227,913 | | | | 840,671,537 | | | | 0 | | |
42
This page intentionally left blank.
This page intentionally left blank.
Important Information About This Report
The fund mails one shareholder report to each shareholder address. If you would like more than one report, please call shareholder services at 1-800-345-6611 and additional reports will be sent to you. This report has been prepared for shareholders of Columbia Oregon Intermediate Municipal Bond Fund.
A description of the policies and procedures that the fund uses to determine how to vote proxies and a copy of the fund's voting records are available (i) at www.columbiamanagement.com, (ii) on the Securities and Exchange Commission's website at www.sec.gov, and (iii) without charge, upon request, by calling 1-800-368-0346. Information regarding how the fund voted proxies relating to portfolio securities during the 12-month period ended June 30 is available from the SEC's website. Information regarding how the fund voted proxies relating to portfolio securities is also available from the fund's website, www.columbiamanagement.com.
The fund files a complete schedule of portfolio holdings with the SEC for the first and third quarters of each fiscal year on Form N-Q. The fund's Form N-Q is available on the SEC's website at www.sec.gov and may be reviewed and copied at the SEC's Public Reference Room in Washington, D.C. Information on the operation of the Public Reference Room may be obtained by calling 1-800-SEC-0330.
Transfer Agent
Columbia Management Investment
Services Corp.
P.O. Box 8081
Boston, MA 02266-8081
1-800-345-6611
Distributor
Columbia Management Investment
Distributors, Inc.
One Financial Center
Boston, MA 02111
Investment Advisor
Columbia Management Investment Advisers, LLC
100 Federal Street
Boston, MA 02110
45

PRSRT STD
U.S. Postage
PAID
Holliston, MA
Permit NO. 20
Columbia Oregon Intermediate Municipal Bond Fund
P. O. Box 8081
Boston, MA 02266-8081
columbiamanagement.com
This information is for use with concurrent or prior delivery of a fund prospectus. Investors should consider the investment objectives, risks, charges and expenses of a mutual fund carefully before investing. For a free prospectus, which contains this and other important information about the funds, visit columbiamanagement.com. Read the prospectus carefully before investing. The Fund is distributed by Columbia Management Investment Distributors, Inc., member FINRA, and managed by Columbia Management Investment Advisers, LLC.
©2010 Columbia Management Investment Advisers, LLC. All rights reserved.
C-1636 A (10/10)

Columbia Conservative High Yield Fund
Annual Report for the Period Ended August 31, 2010
Not FDIC insured • No bank guarantee • May lose value
Table of Contents
| Fund Profile | | | 1 | | |
|
| Economic Update | | | 2 | | |
|
| Performance Information | | | 4 | | |
|
| Understanding Your Expenses | | | 5 | | |
|
| Portfolio Managers' Report | | | 6 | | |
|
| Investment Portfolio | | | 8 | | |
|
Statement of Assets and
Liabilities | | | 17 | | |
|
| Statement of Operations | | | 19 | | |
|
Statement of Changes in
Net Assets | | | 20 | | |
|
| Financial Highlights | | | 22 | | |
|
| Notes to Financial Statements | | | 27 | | |
|
Report of Independent Registered
Public Accounting Firm | | | 37 | | |
|
| Fund Governance | | | 38 | | |
|
Summary of Management Fee
Evaluation by Independent Fee
Consultant (RiverSource
Investments, LLC) | | | 43 | | |
|
| Shareholder Meeting Results | | | 45 | | |
|
Important Information About
This Report | | | 49 | | |
|
The views expressed in this report reflect the current views of the respective parties. These views are not guarantees of future performance and involve certain risks, uncertainties and assumptions that are difficult to predict, so actual outcomes and results may differ significantly from the views expressed. These views are subject to change at any time based upon economic, market or other conditions and the respective parties disclaim any responsibility to update such views. These views may not be relied on as investment advice and, because investment decisions for a Columbia Fund are based on numerous factors, may not be relied on as an indication of trading intent on behalf of any particular Columbia Fund. References to specific securities should not be construed as a recommendation or investment advice.
President's Message

Dear Shareholder:
The Columbia Management story began over 100 years ago, and today, we are one of the nation's largest dedicated asset managers. The recent acquisition by Ameriprise Financial, Inc. brings together the talents, resources and capabilities of Columbia Management with those of RiverSource Investments, Threadneedle (acquired by Ameriprise in 2003) and Seligman Investments (acquired by Ameriprise in 2008) to build a best-in-class asset management business that we believe is truly greater than its parts.
RiverSource Investments traces its roots to 1894 when its then newly-founded predecessor, Investors Syndicate, offered a face-amount savings certificate that gave small investors the opportunity to build a safe and secure fund for retirement, education or other special needs. A mutual fund pioneer, Investors Syndicate launched Investors Mutual Fund in 1940. In the decades that followed, its mutual fund products and services lineup grew to include a full spectrum of styles and specialties. More than 110 years later, RiverSource continues to be a trusted financial products leader.
Threadneedle, a leader in global asset management and one of Europe's largest asset managers, offers sophisticated international experience from a dedicated U.K. management team. Headquartered in London, it is named for Threadneedle Street in the heart of the city's financial district, where British investors pioneered international and global investing. Threadneedle was acquired in 2003 and today operates as an affiliate of Columbia Management.
Seligman Investments' beginnings date back to the establishment of the investment firm J. & W. Seligman & Co. in 1864. In the years that followed, Seligman played a major role in the geographical expansion and industrial development of the United States. In 1874, President Ulysses S. Grant named Seligman as fiscal agent for the U.S. Navy—an appointment that would last through World War I. Seligman helped finance the westward path of the railroads and the building of the Panama Canal. The firm organized its first investment company in 1929 and began managing its first mutual fund in 1930. In 2008, J. & W. Seligman & Co. Incorporated was acquired and Seligman Investments became an offering brand of RiverSource Investments, LLC.
We are proud of the rich and distinctive history of these firms, the strength and breadth of products and services they offer, and the combined cultures of pioneering spirit and forward thinking. Together we are committed to providing more for our shareholders than ever before.
> A singular focus on our shareholders
Our business is asset management, so investors are our first priority. We dedicate our resources to identifying timely investment opportunities and provide a comprehensive choice of equity, fixed-income and alternative investments to help meet your individual needs.
> First-class research and thought leadership
We are dedicated to helping you take advantage of today's opportunities and anticipate tomorrow's. We stay abreast of the latest investment trends and ideas, using our collective insight to evaluate events and transform them into solutions you can use.
> A disciplined investment approach
We aren't distracted by passing fads. Our teams adhere to a rigorous investment process that helps ensure the integrity of our products and enables you and your financial advisor to match our solutions to your objectives with confidence.
When you choose Columbia Management, you can be confident that we will take the time to understand your needs and help you and your financial advisor identify the solutions that are right for you. Because at Columbia Management, we don't consider ourselves successful unless you are.
Sincerely,

J. Kevin Connaughton
President, Columbia Funds
Investors should consider the investment objectives, risks, charges and expenses of a mutual fund carefully before investing. For a free prospectus, which contains this and other important information about the funds, visit columbiamanagement.com. The prospectus should be read carefully before investing.
Columbia Funds are distributed by Columbia Management Investment Distributors, Inc., member FINRA, and managed by Columbia Management Investment Advisers, LLC.
© 2010 Columbia Management Investment Advisers, LLC. All rights reserved.
Fund Profile – Columbia Conservative High Yield Fund
Summary
g For the 12-month period that ended August 31, 2010, the fund's Class A shares returned 15.88% without sales charge.
g The fund underperformed its benchmark, the JPMorgan Developed BB High Yield Index1, and underperformed the average return of the funds in its peer group, the Lipper High Current Yield Funds Classification.2
g Lower-quality credits were the best performers during the period, placing conservatively run funds at a competitive disadvantage.
Portfolio Management
Brian Lavin has managed the fund since May 2010 and has been associated with the advisor since 1994.
On May 1, 2010, the fund's management team changed, and Brian Lavin took over as portfolio manager.
Effective May 1, 2010, RiverSource Investments, LLC, a subsidiary of Ameriprise Financial, Inc., became the investment advisor to the fund and changed its name to Columbia Management Investment Advisers, LLC. Please see the fund's prospectus, as supplemented, for more information regarding the change in investment advisor and certain other changes.
1The JPMorgan Developed BB High Yield Index is an unmanaged index designed to mirror the investable universe of the U.S. dollar developed, BB-rated, high yield corporate debt market. Indices are not available for investment, are not professionally managed and do not reflect sales charges, fees, brokerage commissions, taxes or other expenses of investing. Securities in the fund may not match those in an index.
2Lipper Inc., a widely respected data provider in the industry, calculates an average total return (assuming reinvestment of distributions) for mutual funds with investment objectives similar to those of the fund. Lipper makes no adjustment for the effect of sales loads.
Performance data quoted represents past performance and current performance may be lower or higher. Past performance is no guarantee of future results. The investment return and principal value will fluctuate so that shares, when redeemed, may be worth more or less than the original cost. Please visit www.columbiamanagement.com for daily and most recent month-end performance updates.
Summary
1-year return as of 08/31/2010
| | +15.88% | |
|
| |  | | | Class A shares
(without sale charge) | |
|
| | | | | +17.68% | |
|
| |  | | | JPMorgan Developed
BB High Yield Index | |
|
1
Economic Update – Columbia Conservative High Yield Fund
Summary
For the 12-month period that ended August 31, 2010
g Modest economic growth and relatively low interest rates boosted bond market returns. The Barclays Capital Aggregate Bond Index delivered solid results. High-yield bonds outperformed stocks, as measured by the JPMorgan Developed BB High Yield Index.
Barclays
Aggregate Index | | JPMorgan
Index | |
|
 | |  | |
|
g The U.S. stock market, as measured by the S&P 500 Index, delivered positive returns, despite a correction in the last months of the period. Emerging market stocks, as measured by the MSCI Emerging Markets Index (Net), outperformed U.S. stocks as well as stock markets in developed foreign markets.
| S&P Index | | MSCI Index | |
|
 | |  | |
|
Although it has been more than a year since U.S. economic growth turned positive, the economy continues to send mixed signals about the sustainability of this recovery. Economic growth, as measured by gross domestic product (GDP), was a solid 5.0% in the last quarter of 2009. However, it was 3.7% in the first quarter of 2010 and only 1.7% in the second quarter. Expectations are for continued lackluster growth through the end of the year, as government incentive programs have ended and stimulus spending winds down. Even so, it appears to be unlikely that the U.S. economy will sink back into recession as many key indicators remain positive.
Consumer spending on cars, clothing and other goods increased throughout the year, although the pace of increased spending was small. Personal income also moved higher. Consumer confidence, as measured by the Conference Board Consumer Confidence Index, gained ground in the first half of 2010. However, the index fell sharply in June and July before stabilizing in August. Consumers surveyed in the last three months of the reporting period indicated they were concerned about business conditions and job prospects and generally apprehensive about the future.
The housing market—another bellwether for the consumer sector—showed few positive signs. Both new and existing home sales fell in the final months of the period as a federal tax credit for new and repeat homebuyers expired. Distressed properties continued to pressure prices and a huge backlog of foreclosed homes is likely to continue to keep a lid on prices for some time. The national median price of existing homes rose slightly over the one-year period, while the national median price of new homes declined. Despite near-record low mortgage rates, the inventory of unsold homes rose to a 12.5 month supply, up sharply at the end of the period. The long-term average is on the order of six months.
News on the job front was mostly positive for the period, but the number of new jobs added to the economy fell short of expectations. A good portion of the jobs added in March, April and May were temporary, government-sponsored census positions, which began to unwind in June, July and August. Private sector job growth was disappointing given the stage of economic recovery. Nevertheless, private sector payroll employment trended modestly higher in the summer and news of massive layoffs declined.
Reports from the business side of the economy were generally positive. A key measure of the nation's manufacturing situation—the Institute for Supply Management's Index—was generally positive, although the index trended slightly downward in the final months of the period. Industrial production moved higher, as did the amount of manufacturing capacity utilized—a key measure of the health of the manufacturing sector.
Bonds delivered solid returns
As the economy strengthened, bonds delivered solid returns. The Barclays Capital Aggregate Bond Index1 returned 9.18%. Municipal bonds gained almost as much as taxable investment-grade bonds, even without factoring in potential tax advantages to investors in higher income-tax brackets. The Barclays Capital 3-15 Year Blend
1The Barclays Capital Aggregate Bond Index is a market value-weighted index that tracks the daily price, coupon, pay-downs and total return performance of fixed-rate, publicly placed, dollar-denominated and non-convertible investment-grade debt issues with at least $250 million par amount outstanding and with at least one year to final maturity.
2
Economic Update (continued) – Columbia Conservative High Yield Fund
Municipal Bond Index2 returned 8.95%. The high-yield bond market outpaced stocks during the period by a margin of more than three to one. For the 12 months covered by this report, the JPMorgan Developed BB High Yield Index3 returned 17.68% while the S&P 500 Index returned 4.91%. Even the Treasury market was positive as the yield on the 10-year U.S. Treasury, a common bellwether for the bond market, fell nearly one full percentage point, from 3.4% to 2.5% over the 12-month period. Despite the pickup in economic activity, the Federal Reserve Board kept a key short-term interest rate—the federal funds rate—close to zero.
Stock rally interrupted
Against a strengthening economic backdrop, a stock market rally that began early in 2009 continued into the spring of 2010. However, a debt crisis brewing in Europe raised concerns among U.S. investors, as did mixed signals on the economy, and some of the stock market's earlier gains vanished during the early summer. The S&P 500 Index returned 4.91% for the 12-month period.4 Outside the United States, stock market returns were mixed. The MSCI EAFE Index (Net),5 a broad gauge of stock market performance in foreign developed markets, returned negative 2.34% (net of dividends, in U.S. dollars) for the period, as concerns about the impact of a bailout for weak eurozone economies weighed on the markets. Emerging stock markets were more resilient. The MSCI Emerging Markets Index (Net)6 returned 18.02% (net of dividends, in U.S. dollars) for the 12-month period.
Past performance is no guarantee of future results.
2The Barclays Capital 3-15 Year Blend Municipal Bond Index tracks the performance of municipal bonds issued after December 31, 1990 with remaining maturities between 2 and 17 years and at least $7 million in principal amount outstanding.
3The JPMorgan Developed BB High Yield Index is an unmanaged index designed to mirror the investable universe of the U.S. dollar developed, BB-rated, high yield corporate debt market.
4The Standard & Poor's (S&P) 500 Index tracks the performance of 500 widely held, large-capitalization U.S. stocks.
5The Morgan Stanley Capital International Europe, Australasia, Far East (MSCI EAFE) Index (Net) is a free float-adjusted market capitalization Index that is designed to measure equity market performance of developed markets, excluding the U.S. & Canada. As of May 27, 2010, the MSCI EAFE Index (Net) consisted of the following 22 developed market country indices: Australia, Austria, Belgium, Denmark, Finland, France, Germany, Greece, Hong Kong, Ireland, Israel, Italy, Japan, the Netherlands, New Zealand, Norway, Portugal, Singapore, Spain, Sweden, Switzerland and the United Kingdom.
6The Morgan Stanley Capital International Emerging Markets (MSCI EM) Index (Net) is a free float-adjusted market capitalization index that is designed to measure equity market performance of emerging markets. As of May 27, 2010, the MSCI Emerging Markets Index (Net) consisted of the following 21 emerging market country indices: Brazil, Chile, China, Colombia, Czech Republic, Egypt, Hungary, India, Indonesia, Korea, Malaysia, Mexico, Morocco, Peru, Philippines, Poland, Russia, South Africa, Taiwan, Thailand, and Turkey.
Indices are not available for investment, are not professionally managed and do not reflect sales charges, fees, brokerage commissions, taxes or other expenses of investing. Securities in the fund may not match those in an index.
3
Performance Information – Columbia Conservative High Yield Fund
Performance data quoted represents past performance and current performance may be lower or higher. Past performance is no guarantee of future results. The investment return and principal value will fluctuate so that shares, when redeemed, may be worth more or less than the original cost. Please visit www.columbiamanagement.com for daily and most recent month-end performance updates.
Annual operating expense ratio (%)*
| Class A | | | 1.05 | | |
| Class B | | | 1.80 | | |
| Class C | | | 1.80 | | |
| Class Y | | | 0.68 | | |
| Class Z | | | 0.80 | | |
* The annual operating expense ratio is as stated in the fund's prospectus that is current as of the date of this report. Differences in expense ratios disclosed elsewhere in this report may result from the inclusion of fee waivers and expense reimbursements as well as the use of different time periods to calculate the ratios.
Performance of a $10,000 investment 09/01/00 – 08/31/10
The chart above shows the change in value of a hypothetical $10,000 investment in Class A shares of Columbia Conservative High Yield Fund during the stated time period, and does not reflect the deduction of taxes that a shareholder may pay on fund distributions or on the redemption of fund shares
Performance of a $10,000 investment 09/01/00 – 08/31/10 ($)
| Sales charge | | without | | with | |
| Class A | | | 16,453 | | | | 15,669 | | |
| Class B | | | 15,502 | | | | 15,502 | | |
| Class C | | | 15,650 | | | | 15,650 | | |
| Class Y | | | 16,809 | | | | n/a | | |
| Class Z | | | 16,785 | | | | n/a | | |
Average annual total return as of 08/31/10 (%)
| Share class | | A | | B | | C | | Y | | Z | |
| Inception | | 11/01/02 | | 11/01/02 | | 10/13/03 | | 07/15/09 | | 10/01/93 | |
| Sales charge | | without | | with | | without | | with | | without | | with | | without | | without | |
| 1-year | | | 15.88 | | | | 10.43 | | | | 15.02 | | | | 10.02 | | | | 15.19 | | | | 14.19 | | | | 16.30 | | | | 16.16 | | |
| 5-year | | | 4.60 | | | | 3.59 | | | | 3.83 | | | | 3.52 | | | | 3.98 | | | | 3.98 | | | | 4.89 | | | | 4.86 | | |
| 10-year | | | 5.11 | | | | 4.59 | | | | 4.48 | | | | 4.48 | | | | 4.58 | | | | 4.58 | | | | 5.33 | | | | 5.32 | | |
Average annual total return as of 09/30/10 (%)
| Share class | | A | | B | | C | | Y | | Z | |
| Sales charge | | without | | with | | without | | with | | without | | with | | without | | without | |
| 1-year | | | 15.01 | | | | 9.48 | | | | 14.17 | | | | 9.17 | | | | 14.33 | | | | 13.33 | | | | 15.42 | | | | 15.29 | | |
| 5-year | | | 5.34 | | | | 4.33 | | | | 4.56 | | | | 4.25 | | | | 4.71 | | | | 4.71 | | | | 5.63 | | | | 5.60 | | |
| 10-year | | | 5.41 | | | | 4.89 | | | | 4.78 | | | | 4.78 | | | | 4.88 | | | | 4.88 | | | | 5.64 | | | | 5.62 | | |
The "with sales charge" returns include the maximum initial sales charge of 4.75% for Class A shares, the applicable contingent deferred sales charge of 5.00% in the first year, declining to 1.00% in the sixth year, and eliminated thereafter for Class B shares and 1.00% for Class C shares for the first year only. The "without sales charge" returns do not include the effect of sales charges. If they had, returns would have been lower.
Performance results reflect any fee waivers or expense reimbursements of fund expenses by the investment advisor and/or any of its affiliates. Absent these fee waivers or expense reimbursement arrangements, performance results would have been lower.
All results shown assume reinvestment of distributions. Class Y and Class Z shares are sold at net asset value with no distribution and service (Rule 12b-1) fees. Class Y and Class Z shares have limited eligibility and the investment minimum requirements may vary. Please see the fund's prospectus for details. Performance for different share classes will vary based on differences in sales charges and fees associated with each class.
The tables do not reflect the deduction of taxes that a shareholder may pay on fund distributions or on the redemption of fund shares.
Class A, Class B, Class C and Class Y are newer classes of shares. Class A, Class B and Class Y share performance information includes the performance of Class Z shares (the oldest existing share class) for periods prior to their inception. Class C share performance information includes returns of Class B shares for the period from November 1, 2002 through October 12, 2003, and the returns of Class Z shares for periods prior thereto. These returns reflect differences in sales charges, but have not been restated to reflect any differences in expenses (such as distribution and service (Rule 12b-1) fees) between Class Z shares and the newer classes of shares. If differences in expenses had been reflected, the returns shown for Class A, Class B, and Class C for periods during which Class Z share returns are included would have been lower, since these classes of shares are subject to distribution and service (Rule 12b-1) fees. Class A and Class B shares were initially offered on November 1, 2002, Class C shares were initially offered on October 13, 2003, Class Y shares were initially offered on July 15, 2009 and Class Z shares were initially offered on October 1, 1993.
4
Understanding Your Expenses – Columbia Conservative High Yield Fund
As a fund shareholder, you incur two types of costs. There are transaction costs, which generally include sales charges on purchases and may include redemption fees or exchange fees. There are also ongoing costs, which generally include investment advisory fees, distribution and service (Rule 12b-1) fees and other fund expenses. The information on this page is intended to help you understand the ongoing costs of investing in the fund and to compare these costs with the ongoing costs of investing in other mutual funds.
Analyzing your fund's expenses by share class
To illustrate these ongoing costs, we have provided an example and calculated the expenses paid by investors in each share class during the period. The information in the following table is based on an initial investment of $1,000, which is invested at the beginning of the period and held for the entire period. Expense information is calculated two ways and each method provides you with different information. The amount listed in the "Actual" column is calculated using the fund's actual operating expenses and total return for the period. The amount listed in the "Hypothetical" column for each share class assumes that the return each year is 5% before expenses and is calculated based on the fund's actual operating expenses. You should not use the hypothetical account values and expenses to estimate either your actual account balance at the end of the period or the expenses you paid during this period.
Compare with other funds
Since all mutual funds are required to include the same hypothetical calculations about expenses in shareholder reports, you can use this information to compare the ongoing cost of investing in the fund with other funds. To do so, compare the 5% hypothetical example with the 5% hypothetical examples that appear in the shareholder reports of other funds. As you compare hypothetical examples of other funds, it is important to note that hypothetical examples are meant to highlight the ongoing costs of investing in a fund and do not reflect any transaction costs, such as sales charges, redemption fees or exchange fees.
Estimating your actual expenses
To estimate the expenses that you paid over the period, first you will need your account balance at the end of the period:
g For shareholders who receive their account statements from Columbia Management Investment Services Corp., your account balance is available online at www.columbiamanagement.com or by calling Shareholder Services at 800.345.6611.
g For shareholders who receive their account statements from their financial intermediary, contact your financial intermediary to obtain your account balance.
1. Divide your ending account balance by $1,000. For example, if an account balance was $8,600 at the end of the period, the result would be 8.6.
2. In the section of the table below titled "Expenses paid during the period," locate the amount for your share class. You will find this number in the column labeled "Actual." Multiply this number by the result from step 1. Your answer is an estimate of the expenses you paid on your account during the period.
If the value of your account falls below the minimum initial investment requirement applicable to you, your account may be subject to a $20 annual fee. This fee is not included in the accompanying table. If you are subject to the fee, keep it in mind when you are estimating the ongoing expenses of investing in the fund and when comparing the expenses of this fund with other funds.
03/01/10 – 08/31/10
| | | Account value at the
beginning of the period ($) | | Account value at the
end of the period ($) | | Expenses paid
during the period ($) | | Fund's annualized
expense ratio (%) | |
| | | Actual | | Hypothetical | | Actual | | Hypothetical | | Actual | | Hypothetical | | Actual | |
| Class A | | | 1,000.00 | | | | 1,000.00 | | | | 1,062.20 | | | | 1,019.91 | | | | 5.46 | | | | 5.35 | | | | 1.05 | | |
| Class B | | | 1,000.00 | | | | 1,000.00 | | | | 1,058.30 | | | | 1,016.13 | | | | 9.34 | | | | 9.15 | | | | 1.80 | | |
| Class C | | | 1,000.00 | | | | 1,000.00 | | | | 1,059.00 | | | | 1,016.89 | | | | 8.56 | | | | 8.39 | | | | 1.65 | | |
| Class Y | | | 1,000.00 | | | | 1,000.00 | | | | 1,064.10 | | | | 1,021.76 | | | | 3.55 | | | | 3.48 | | | | 0.68 | | |
| Class Z | | | 1,000.00 | | | | 1,000.00 | | | | 1,063.50 | | | | 1,021.17 | | | | 4.16 | | | | 4.08 | | | | 0.80 | | |
Expenses paid during the period are equal to the annualized expense ratio for the share class, multiplied by the average account value over the period, then multiplied by the number of days in the fund's most recent fiscal half-year and divided by 365.
Had the investment advisor and/or any of its affiliates not waived fees or reimbursed a portion of expenses for Class C shares, account value at the end of the period for Class C shares would have been reduced.
It is important to note that the expense amounts shown in the table are meant to highlight only ongoing costs of investing in the fund and do not reflect any transaction costs, such as sales charges, redemption fees or exchange fees. Therefore, the hypothetical examples provided may not help you determine the relative total costs of owning shares of different funds. If these transaction costs were included, your costs would have been higher.
5
Portfolio Manager's Report – Columbia Conservative High Yield Fund
Performance data quoted represents past performance and current performance may be lower or higher. Past performance is no guarantee of future results. The investment return and principal value will fluctuate so that shares, when redeemed, may be worth more or less than the original cost. Please visit www.columbiamanagement.com for daily and most recent month-end performance updates.
Net asset value per share
as of 08/31/10 ($)
| Class A | | | 7.64 | | |
| Class B | | | 7.64 | | |
| Class C | | | 7.64 | | |
| Class Y | | | 7.64 | | |
| Class Z | | | 7.64 | | |
Distributions declared per share
09/01/09 – 08/31/10 ($)
| Class A | | | 0.56 | | |
| Class B | | | 0.50 | | |
| Class C | | | 0.51 | | |
| Class Y | | | 0.58 | | |
| Class Z | | | 0.57 | | |
Portfolio quality
as of 08/31/10 (%)
| AAA | | | 5.1 | | |
| BBB | | | 8.9 | | |
| BB | | | 44.0 | | |
| B | | | 38.3 | | |
| CCC | | | 3.7 | | |
Ratings shown in the quality breakdown represent the rating assigned to a particular bond by one of the following nationally-recognized rating agencies: Standard and Poor's, Moody's Investors Service, Inc. or Fitch Ratings Ltd. Ratings are relative and subjective and are not absolute standards of quality. The credit quality of the fund's investments does not remove market risk.
Maturity breakdown
as of 08/31/10 (%)
| 1–3 years | | | 0.6 | | |
| 3–5 years | | | 16.5 | | |
| 5–7 years | | | 42.5 | | |
| 7–10 years | | | 30.0 | | |
| 10–15 years | | | 5.8 | | |
| 15–20 years | | | 2.8 | | |
| 20–30 years | | | 1.8 | | |
Your fund is actively managed and the composition of its portfolio will change over time. Information provided is calculated as a percentage of net assets.
For the 12-month period that ended August 31, 2010, the fund's Class A shares returned 15.88% without sales charge. The fund's double-digit return reflected a positive environment for high-yield bonds throughout the period. The fund's benchmark, the JPMorgan Developed BB High Yield Index, returned 17.68%. The average return of the funds in its peer group, the Lipper High Current Yield Funds Classification, was 18.99%. Lower-quality credits tended to outperform higher-quality issues during the period, so the fund's conservative investment profile detracted somewhat from its performance relative to comparative measures.
A favorable environment for high-yield
The past 12 months were characterized by an improving economy, lower long-term interest rates and lower corporate default rates—altogether a favorable combination for the high-yield fixed-income market. Securities with CCC ratings performed especially well within this environment. However, their outperformance created an opportunity cost for the fund, whose prospectus limits investments of such low quality. An underweight in the technology and financial sectors also detracted from return, as both sectors outperformed the overall corporate market for the reporting period. We added to the fund's financial exposure as the period wore on, while simultaneously reducing a commitment to underperforming defensive sectors, such as cable and utilities. This move aided performance in the later months of the period.
Occasional concerns over foreign market debt
The most significant challenges to the fixed-income markets during the period came from overseas. Concerns about European sovereign debt led to a significant market contraction in the spring, while Chinese consumer consumption became a closely-watched statistic because of its potential impact on global growth. At home, debates raged about the impact of financial regulation, creating episodes of confusion and uncertainty in the otherwise healthy marketplace. Yet, these occasional macroeconomic challenges did not impair the fundamental health of the high-yield market. In particular, high-yield issuers enjoyed an access to capital that had all but vanished during the financial crisis of 2008 and 2009, the most significant result being a sharp reduction in the corporate default rate, a key statistic for high-yield valuations.
Looking ahead
We remain constructive in our outlook for the high-yield asset class. Our optimism is based on the expectation of moderate economic growth, a gradual improvement in the employment and housing markets and adequate levels of liquidity for corporate issuers. In addition, high-yield issuers have been able to refinance or extend their maturity schedules over the next several years, which makes us optimistic that the recent downward trend in default rates will continue or even accelerate. Finally, valuations remain attractive on a historical basis. The market strength of the past 12 months
6
Portfolio Manager's Report (continued) – Columbia Conservative High Yield Fund
notwithstanding, high-yield investments continue to enjoy a meaningful yield advantage versus other fixed-income asset classes.
Portfolio characteristics and holdings are subject to change and may not be representative of current characteristics and holdings. The outlook for this fund may differ from that presented for other Columbia Funds.
Investing in fixed-income securities may involve certain risks, including greater price volatility and higher credit risk due to lower-quality debt securities, as well as prepayments, the credit quality of individual issuers and prepayments and changes in interest rates. When interest rates go up, bond prices typically go down and vice versa. International investing involves special risks, including foreign taxation, currency risks, risks associated with possible differences in financial standards, and other monetary and political risks.
The term "conservative" in the Columbia Conservative High Yield Fund's name, and as used in the discussion above, is intended to describe the fund's credit approach relative to other high-yield funds; the fund invests primarily in bonds rated Ba or B by Moody's Investors Service, Inc. or BB or B by Standard & Poor's. These lower rated bonds, commonly referred to as "junk" bonds, are subject to greater credit risk, and are generally less liquid, than higher-rated, lower yielding bonds. Also, changes in economic conditions or other circumstances may adversely affect a junk bond issuer's ability to make principal and interest payments. Rising interest rates tend to lower the value of all bonds.
7
Investment Portfolio – Columbia Conservative High Yield Fund
August 31, 2010
| Corporate Fixed-Income Bonds & Notes – 95.1% | |
| | | Par ($) | | Value ($) | |
| Basic Materials – 10.5% | |
| Chemicals – 3.3% | |
| Agricultural Chemicals – 0.6% | |
| CF Industries, Inc. | |
| 6.875% 05/01/18 | | | 3,295,000 | | | | 3,467,987 | | |
| | | | 3,467,987 | | |
| Chemicals-Diversified – 2.0% | |
| INEOS Finance PLC | |
| 9.000% 05/15/15 (a) | | | 1,025,000 | | | | 1,036,531 | | |
| INVISTA | |
| 9.250% 05/01/12 (a) | | | 2,289,000 | | | | 2,314,752 | | |
| Koppers, Inc. | |
| 7.875% 12/01/19 | | | 895,000 | | | | 916,256 | | |
| Lyondell Chemical Co. | |
| 8.000% 11/01/17 (a) | | | 2,740,000 | | | | 2,942,075 | | |
| NOVA Chemicals Corp. | |
| 8.375% 11/01/16 | | | 860,000 | | | | 879,350 | | |
| 8.625% 11/01/19 | | | 960,000 | | | | 988,800 | | |
| Solutia, Inc. | |
| 8.750% 11/01/17 | | | 2,345,000 | | | | 2,509,150 | | |
| | | | 11,586,914 | | |
| Chemicals-Plastics – 0.7% | |
| Hexion U.S. Finance Corp./Hexion Nova Scotia Finance ULC | |
| 8.875% 02/01/18 | | | 4,475,000 | | | | 4,139,375 | | |
| | | | 4,139,375 | | |
| Chemicals Total | | | 19,194,276 | | |
| Forest Products & Paper – 3.6% | |
| Paper & Related Products – 3.6% | |
| Cascades, Inc. | |
| 7.750% 12/15/17 | | | 2,830,000 | | | | 2,914,900 | | |
| Clearwater Paper Corp. | |
| 10.625% 06/15/16 | | | 865,000 | | | | 973,125 | | |
| Domtar Corp. | |
| 10.750% 06/01/17 | | | 3,105,000 | | | | 3,826,913 | | |
| Georgia-Pacific LLC | |
| 8.000% 01/15/24 | | | 6,685,000 | | | | 7,353,500 | | |
| PE Paper Escrow GmbH | |
| 12.000% 08/01/14 (a) | | | 2,530,000 | | | | 2,855,738 | | |
| Westvaco Corp. | |
| 8.200% 01/15/30 | | | 2,305,000 | | | | 2,564,764 | | |
| | | | 20,488,940 | | |
| Forest Products & Paper Total | | | 20,488,940 | | |
| Iron/Steel – 0.9% | |
| Steel-Producers – 0.9% | |
| Russel Metals, Inc. | |
| 6.375% 03/01/14 | | | 3,390,000 | | | | 3,339,150 | | |
| | | Par ($) | | Value ($) | |
| United States Steel Corp. | |
| 7.000% 02/01/18 | | | 2,100,000 | | | | 2,110,500 | | |
| | | | 5,449,650 | | |
| Iron/Steel Total | | | 5,449,650 | | |
| Metals & Mining – 2.7% | |
| Diversified Minerals – 1.8% | |
| Teck Resources Ltd. | |
| 10.750% 05/15/19 | | | 8,160,000 | | | | 10,138,800 | | |
| | | | 10,138,800 | | |
| Metal-Aluminum – 0.1% | |
| Novelis, Inc. | |
| 7.250% 02/15/15 | | | 442,000 | | | | 443,105 | | |
| | | | 443,105 | | |
| Metal-Copper – 0.4% | |
| Freeport-McMoRan Copper & Gold, Inc. | |
| 8.375% 04/01/17 | | | 2,150,000 | | | | 2,386,500 | | |
| | | | 2,386,500 | | |
| Metal-Diversified – 0.4% | |
| Vedanta Resources PLC | |
| 9.500% 07/18/18 (a) | | | 2,330,000 | | | | 2,446,500 | | |
| | | | 2,446,500 | | |
| Metals & Mining Total | | | 15,414,905 | | |
| Basic Materials Total | | | 60,547,771 | | |
| Communications – 21.9% | |
| Advertising – 0.6% | |
| Advertising Agencies – 0.2% | |
| Interpublic Group of Companies, Inc. | |
| 6.250% 11/15/14 | | | 960,000 | | | | 998,400 | | |
| 10.000% 07/15/17 | | | 465,000 | | | | 534,750 | | |
| | | | 1,533,150 | | |
| Advertising Services – 0.4% | |
| inVentiv Health, Inc. | |
| 10.000% 08/15/18 (a) | | | 2,300,000 | | | | 2,248,250 | | |
| | | | 2,248,250 | | |
| Advertising Total | | | 3,781,400 | | |
| Media – 5.4% | |
| Broadcast Services/Programs – 0.7% | |
| Liberty Media LLC | |
| 8.250% 02/01/30 | | | 4,240,000 | | | | 4,028,000 | | |
| | | | 4,028,000 | | |
See Accompanying Notes to Financial Statements.
8
Columbia Conservative High Yield Fund
August 31, 2010
| Corporate Fixed-Income Bonds & Notes (continued) | |
| | | Par ($) | | Value ($) | |
| Cable TV – 2.4% | |
| CSC Holdings LLC | |
| 8.500% 04/15/14 | | | 1,445,000 | | | | 1,578,663 | | |
| 8.500% 06/15/15 | | | 3,200,000 | | | | 3,472,000 | | |
| DISH DBS Corp. | |
| 7.875% 09/01/19 | | | 6,115,000 | | | | 6,374,887 | | |
| Insight Communications Co., Inc. | |
| 9.375% 07/15/18 (a) | | | 1,240,000 | | | | 1,302,000 | | |
| Mediacom LLC/Mediacom Capital Corp. | |
| 9.125% 08/15/19 | | | 1,205,000 | | | | 1,205,000 | | |
| | | | 13,932,550 | | |
| Multimedia – 0.6% | |
| Entravision Communications Corp. | |
| 8.750% 08/01/17 (a) | | | 3,310,000 | | | | 3,310,000 | | |
| | | | 3,310,000 | | |
| Radio – 1.4% | |
| Salem Communications Corp. | |
| 9.625% 12/15/16 | | | 2,825,000 | | | | 2,941,531 | | |
| Sirius XM Radio, Inc. | |
| 8.750% 04/01/15 (a) | | | 1,710,000 | | | | 1,761,300 | | |
| 9.750% 09/01/15 (a) | | | 3,090,000 | | | | 3,360,375 | | |
| | | | 8,063,206 | | |
| Television – 0.3% | |
| Belo Corp. | |
| 8.000% 11/15/16 | | | 1,460,000 | | | | 1,547,600 | | |
| Sinclair Television Group, Inc. | |
| 9.250% 11/01/17 (a) | | | 130,000 | | | | 133,900 | | |
| | | | 1,681,500 | | |
| Media Total | | | 31,015,256 | | |
| Telecommunication Services – 15.9% | |
| Cellular Telecommunications – 5.4% | |
| Cricket Communications, Inc. | |
| 7.750% 05/15/16 | | | 4,905,000 | | | | 5,064,412 | | |
| Digicel Group Ltd. | |
| 8.250% 09/01/17 (a) | | | 4,370,000 | | | | 4,539,338 | | |
| Nextel Communications, Inc. | |
| 7.375% 08/01/15 | | | 11,645,000 | | | | 11,528,550 | | |
| NII Capital Corp. | |
| 10.000% 08/15/16 | | | 2,890,000 | | | | 3,240,413 | | |
| Wind Acquisition Finance SA | |
| 11.750% 07/15/17 (a) | | | 5,474,000 | | | | 6,021,400 | | |
| 12.000% 12/01/15 (a) | | | 360,000 | | | | 379,800 | | |
| | | | 30,773,913 | | |
| Media – 0.9% | |
| Quebecor Media, Inc. | |
| 7.750% 03/15/16 | | | 4,905,000 | | | | 5,003,100 | | |
| | | | 5,003,100 | | |
| | | Par ($) | | Value ($) | |
| Satellite Telecommunications – 0.9% | |
| Intelsat Corp. | |
| 9.250% 06/15/16 | | | 4,745,000 | | | | 5,029,700 | | |
| | | | 5,029,700 | | |
| Telecommunication Services – 1.7% | |
| Clearwire Communications LLC/Clearwire Finance, Inc. | |
| 12.000% 12/01/15 (a) | | | 1,495,000 | | | | 1,495,000 | | |
| ITC Deltacom, Inc. | |
| 10.500% 04/01/16 | | | 3,635,000 | | | | 3,580,475 | | |
| PAETEC Holding Corp. | |
| 8.875% 06/30/17 | | | 1,140,000 | | | | 1,179,900 | | |
| SBA Telecommunications, Inc. | |
| 8.250% 08/15/19 | | | 3,420,000 | | | | 3,710,700 | | |
| | | | 9,966,075 | | |
| Telephone-Integrated – 6.4% | |
| Cincinnati Bell, Inc. | |
| 8.250% 10/15/17 | | | 2,925,000 | | | | 2,866,500 | | |
| Frontier Communications Corp. | |
| 7.875% 01/15/27 | | | 7,935,000 | | | | 7,617,600 | | |
| Level 3 Financing, Inc. | |
| 8.750% 02/15/17 | | | 3,165,000 | | | | 2,682,338 | | |
| 9.250% 11/01/14 | | | 880,000 | | | | 775,500 | | |
| Qwest Communications International, Inc. | |
| 7.500% 02/15/14 | | | 3,035,000 | | | | 3,091,906 | | |
| Qwest Corp. | |
| 7.500% 10/01/14 | | | 5,155,000 | | | | 5,741,381 | | |
| 7.500% 06/15/23 | | | 4,035,000 | | | | 4,115,700 | | |
| Sprint Capital Corp. | |
| 6.875% 11/15/28 | | | 1,165,000 | | | | 972,775 | | |
| Windstream Corp. | |
| 8.625% 08/01/16 | | | 8,820,000 | | | | 9,106,650 | | |
| | | | 36,970,350 | | |
| Wireless Equipment – 0.6% | |
| Crown Castle International Corp. | |
| 9.000% 01/15/15 | | | 3,305,000 | | | | 3,585,925 | | |
| | | | 3,585,925 | | |
| Telecommunication Services Total | | | 91,329,063 | | |
| Communications Total | | | 126,125,719 | | |
| Consumer Cyclical – 12.5% | |
| Auto Manufacturers – 0.0% | |
| Auto-Medium & Heavy Duty Trucks – 0.0% | |
| Oshkosh Corp. | |
| 8.500% 03/01/20 | | | 143,000 | | | | 151,938 | | |
| | | | 151,938 | | |
| Auto Manufacturers Total | | | 151,938 | | |
See Accompanying Notes to Financial Statements.
9
Columbia Conservative High Yield Fund
August 31, 2010
| Corporate Fixed-Income Bonds & Notes (continued) | |
| | | Par ($) | | Value ($) | |
| Auto Parts & Equipment – 0.7% | |
| Auto/Truck Parts & Equipment-Original – 0.7% | |
| Accuride Corp. | |
| 9.500% 08/01/18 (a) | | | 545,000 | | | | 558,625 | | |
| American Axle & Manufacturing Holdings, Inc. | |
| 9.250% 01/15/17 (a) | | | 935,000 | | | | 993,438 | | |
| Lear Corp. | |
| 7.875% 03/15/18 | | | 1,730,000 | | | | 1,790,550 | | |
| 8.125% 03/15/20 | | | 370,000 | | | | 383,875 | | |
| Tenneco, Inc. | |
| 7.750% 08/15/18 (a) | | | 356,000 | | | | 363,120 | | |
| | | | 4,089,608 | | |
| Auto Parts & Equipment Total | | | 4,089,608 | | |
| Distribution/Wholesale – 0.4% | |
| Distribution/Wholesale – 0.4% | |
| McJunkin Red Man Corp. | |
| 9.500% 12/15/16 (a) | | | 2,283,000 | | | | 2,014,748 | | |
| | | | 2,014,748 | | |
| Distribution/Wholesale Total | | | 2,014,748 | | |
| Entertainment – 1.1% | |
| Casino Services – 0.1% | |
| Tunica-Biloxi Gaming Authority | |
| 9.000% 11/15/15 (a) | | | 1,100,000 | | | | 983,125 | | |
| | | | 983,125 | | |
| Gambling (Non-Hotel) – 1.0% | |
| Boyd Gaming Corp. | |
| 7.125% 02/01/16 | | | 1,145,000 | | | | 961,800 | | |
| Pinnacle Entertainment, Inc. | |
| 8.625% 08/01/17 | | | 2,515,000 | | | | 2,634,462 | | |
| Shingle Springs Tribal Gaming Authority | |
| 9.375% 06/15/15 (a) | | | 2,650,000 | | | | 2,020,625 | | |
| | | | 5,616,887 | | |
| Entertainment Total | | | 6,600,012 | | |
| Home Builders – 2.3% | |
| Building-Residential/Commercial – 2.3% | |
| D.R. Horton, Inc. | |
| 5.625% 09/15/14 | | | 2,865,000 | | | | 2,814,862 | | |
| 5.625% 01/15/16 | | | 2,180,000 | | | | 2,098,250 | | |
| K Hovnanian Enterprises, Inc. | |
| 10.625% 10/15/16 | | | 2,340,000 | | | | 2,269,800 | | |
| KB Home | |
| 5.875% 01/15/15 | | | 5,110,000 | | | | 4,688,425 | | |
| Ryland Group, Inc. | |
| 8.400% 05/15/17 | | | 1,270,000 | | | | 1,352,550 | | |
| | | | 13,223,887 | | |
| Home Builders Total | | | 13,223,887 | | |
| | | Par ($) | | Value ($) | |
| Home Furnishings – 0.2% | |
| Home Furnishings – 0.2% | |
| Norcraft Companies LP/Norcraft Finance Corp. | |
| 10.500% 12/15/15 | | | 1,110,000 | | | | 1,146,075 | | |
| | | | 1,146,075 | | |
| Home Furnishings Total | | | 1,146,075 | | |
| Lodging – 4.7% | |
| Casino Hotels – 2.0% | |
| MGM Resorts International | |
| 13.000% 11/15/13 | | | 1,600,000 | | | | 1,848,000 | | |
| Penn National Gaming, Inc. | |
| 8.750% 08/15/19 | | | 3,215,000 | | | | 3,359,675 | | |
| Pokagon Gaming Authority | |
| 10.375% 06/15/14 (a) | | | 1,885,000 | | | | 1,955,687 | | |
| Wynn Las Vegas LLC/Wynn Las Vegas Capital Corp. | |
| 7.875% 05/01/20 | | | 3,760,000 | | | | 3,797,600 | | |
| | | | 10,960,962 | | |
| Gambling (Non-Hotel) – 0.7% | |
| Seminole Indian Tribe of Florida | |
| 6.535% 10/01/20 (a) | | | 540,000 | | | | 475,999 | | |
| 7.804% 10/01/20 (a) | | | 3,895,000 | | | | 3,655,458 | | |
| | | | 4,131,457 | | |
| Hotels & Motels – 2.0% | |
| Host Hotels & Resorts LP | |
| 6.750% 06/01/16 | | | 4,875,000 | | | | 4,948,125 | | |
| Starwood Hotels & Resorts Worldwide, Inc. | |
| 6.750% 05/15/18 | | | 4,835,000 | | | | 5,113,013 | | |
| Wyndham Worldwide Corp. | |
| 6.000% 12/01/16 | | | 1,475,000 | | | | 1,505,311 | | |
| | | | 11,566,449 | | |
| Lodging Total | | | 26,658,868 | | |
| Retail – 2.6% | |
| Retail-Apparel/Shoe – 0.8% | |
| Limited Brands, Inc. | |
| 8.500% 06/15/19 | | | 3,990,000 | | | | 4,508,700 | | |
| | | | 4,508,700 | | |
| Retail-Drug Stores – 0.7% | |
| Rite Aid Corp. | |
| 8.000% 08/15/20 (a) | | | 1,550,000 | | | | 1,540,312 | | |
| 9.750% 06/12/16 | | | 2,380,000 | | | | 2,528,750 | | |
| | | | 4,069,062 | | |
| Retail-Mail Order – 0.6% | |
| QVC, Inc. | |
| 7.375% 10/15/20 (a) | | | 885,000 | | | | 898,275 | | |
| 7.500% 10/01/19 (a) | | | 2,435,000 | | | | 2,483,700 | | |
| | | | 3,381,975 | | |
See Accompanying Notes to Financial Statements.
10
Columbia Conservative High Yield Fund
August 31, 2010
| Corporate Fixed-Income Bonds & Notes (continued) | |
| | | Par ($) | | Value ($) | |
| Retail-Major Department Stores – 0.2% | |
| Neiman Marcus Group, Inc. | |
PIK,
9.000% 10/15/15 | | | 1,074,000 | | | | 1,087,425 | | |
| | | | 1,087,425 | | |
| Retail-Toy Store – 0.3% | |
| Toys R Us - Delaware, Inc. | |
| 7.375% 09/01/16 (a)(b) | | | 1,051,000 | | | | 1,061,510 | | |
| Toys R Us Property Co., LLC | |
| 8.500% 12/01/17 (a) | | | 1,000,000 | | | | 1,040,000 | | |
| | | | 2,101,510 | | |
| Retail Total | | | 15,148,672 | | |
| Storage/Warehousing – 0.5% | |
| Storage/Warehousing – 0.5% | |
| Niska Gas Storage U.S. LLC/Niska Gas Storage Canada ULC | |
| 8.875% 03/15/18 (a) | | | 2,640,000 | | | | 2,778,600 | | |
| | | | 2,778,600 | | |
| Storage/Warehousing Total | | | 2,778,600 | | |
| Consumer Cyclical Total | | | 71,812,408 | | |
| Consumer Non-Cyclical – 10.5% | |
| Beverages – 0.3% | |
| Beverages-Non-Alcoholic – 0.3% | |
| Cott Beverages USA, Inc. | |
| 8.125% 09/01/18 (a) | | | 775,000 | | | | 797,281 | | |
| Cott Beverages, Inc. | |
| 8.375% 11/15/17 (a) | | | 895,000 | | | | 936,394 | | |
| | | | 1,733,675 | | |
| Beverages Total | | | 1,733,675 | | |
| Commercial Services – 3.2% | |
| Commercial Services-Finance – 1.0% | |
| Cardtronics, Inc. | |
| 8.250% 09/01/18 | | | 1,730,000 | | | | 1,768,925 | | |
| Interactive Data Corp. | |
| 10.250% 08/01/18 (a) | | | 2,615,000 | | | | 2,713,062 | | |
| Trans Union LLC/TransUnion Financing Corp. | |
| 11.375% 06/15/18 (a) | | | 800,000 | | | | 870,000 | | |
| | | | 5,351,987 | | |
| Private Corrections – 0.6% | |
| Corrections Corp. of America | |
| 6.250% 03/15/13 | | | 280,000 | | | | 282,800 | | |
| 7.750% 06/01/17 | | | 3,000,000 | | | | 3,187,500 | | |
| | | | 3,470,300 | | |
| | | Par ($) | | Value ($) | |
| Rental Auto/Equipment – 1.5% | |
| Hertz Corp. | |
| 8.875% 01/01/14 | | | 1,500,000 | | | | 1,541,250 | | |
| RSC Equipment Rental, Inc. | |
| 10.000% 07/15/17 (a) | | | 2,225,000 | | | | 2,425,250 | | |
| United Rentals North America, Inc. | |
| 9.250% 12/15/19 | | | 2,100,000 | | | | 2,231,250 | | |
| 10.875% 06/15/16 | | | 2,220,000 | | | | 2,464,200 | | |
| | | | 8,661,950 | | |
| Security Services – 0.1% | |
| Garda World Security Corp. | |
| 9.750% 03/15/17 (a) | | | 715,000 | | | | 738,238 | | |
| | | | 738,238 | | |
| Commercial Services Total | | | 18,222,475 | | |
| Food – 0.2% | |
| Food-Miscellaneous/Diversified – 0.2% | |
| Michael Foods, Inc. | |
| 9.750% 07/15/18 (a) | | | 1,240,000 | | | | 1,302,000 | | |
| | | | 1,302,000 | | |
| Food Total | | | 1,302,000 | | |
| Healthcare Products – 0.3% | |
| Medical Products – 0.3% | |
| Biomet, Inc. | |
PIK,
10.375% 10/15/17 | | | 1,605,000 | | | | 1,745,438 | | |
| | | | 1,745,438 | | |
| Healthcare Products Total | | | 1,745,438 | | |
| Healthcare Services – 4.6% | |
| Medical-Hospitals – 4.2% | |
| Capella Healthcare, Inc. | |
| 9.250% 07/01/17 (a) | | | 285,000 | | | | 294,975 | | |
| Community Health Systems, Inc. | |
| 8.875% 07/15/15 | | | 1,790,000 | | | | 1,857,125 | | |
| HCA, Inc. | |
| 9.250% 11/15/16 | | | 3,850,000 | | | | 4,129,125 | | |
| PIK, | |
| 9.625% 11/15/16 | | | 13,022,000 | | | | 13,982,372 | | |
| Select Medical Corp. | |
| 7.625% 02/01/15 | | | 1,435,000 | | | | 1,352,488 | | |
Vanguard Health Holding Co. II, LLC/Vanguard
Holding Co. II, Inc. | | | |
| 8.000% 02/01/18 | | | 1,000,000 | | | | 981,250 | | |
| 8.000% 02/01/18 (a) | | | 1,200,000 | | | | 1,168,500 | | |
| | | | 23,765,835 | | |
See Accompanying Notes to Financial Statements.
11
Columbia Conservative High Yield Fund
August 31, 2010
| Corporate Fixed-Income Bonds & Notes (continued) | |
| | | Par ($) | | Value ($) | |
| Physical Therapy/Rehab Centers – 0.4% | |
| Healthsouth Corp. | |
| 8.125% 02/15/20 | | | 2,440,000 | | | | 2,467,450 | | |
| | | | 2,467,450 | | |
| Healthcare Services Total | | | 26,233,285 | | |
| Household Products/Wares – 0.7% | |
| Consumer Products-Miscellaneous – 0.7% | |
| American Greetings Corp. | |
| 7.375% 06/01/16 | | | 1,820,000 | | | | 1,842,750 | | |
| Spectrum Brands Holdings, Inc. | |
| 9.500% 06/15/18 (a) | | | 2,095,000 | | | | 2,204,987 | | |
| | | | 4,047,737 | | |
| Household Products/Wares Total | | | 4,047,737 | | |
| Pharmaceuticals – 1.2% | |
| Medical-Drugs – 0.3% | |
| Patheon, Inc. | |
| 8.625% 04/15/17 (a) | | | 1,440,000 | | | | 1,434,600 | | |
| | | | 1,434,600 | | |
| Medical-Generic Drugs – 0.2% | |
| Mylan, Inc. | |
| 7.875% 07/15/20 (a) | | | 1,075,000 | | | | 1,120,687 | | |
| | | | 1,120,687 | | |
| Pharmacy Services – 0.5% | |
| Omnicare, Inc. | |
| 7.750% 06/01/20 | | | 3,095,000 | | | | 3,095,000 | | |
| | | | 3,095,000 | | |
| Therapeutics – 0.2% | |
| Warner Chilcott Co. LLC/Warner Chilcott Finance LLC | |
| 7.750% 09/15/18 (a) | | | 1,165,000 | | | | 1,182,475 | | |
| | | | 1,182,475 | | |
| Pharmaceuticals Total | | | 6,832,762 | | |
| Consumer Non-Cyclical Total | | | 60,117,372 | | |
| Diversified – 0.9% | |
| Diversified Holding Companies – 0.9% | |
| Diversified Operations – 0.9% | |
| Leucadia National Corp. | |
| 7.125% 03/15/17 | | | 2,325,000 | | | | 2,330,813 | | |
| Reynolds Group Issuer, Inc./Reynolds Group Issuer LLC | |
| 7.750% 10/15/16 (a) | | | 2,965,000 | | | | 2,987,237 | | |
| | | | 5,318,050 | | |
| Diversified Holding Companies Total | | | 5,318,050 | | |
| Diversified Total | | | 5,318,050 | | |
| | | Par ($) | | Value ($) | |
| Energy – 13.0% | |
| Coal – 1.5% | |
| Coal – 1.5% | |
| Arch Coal, Inc. | |
| 7.250% 10/01/20 | | | 188,000 | | | | 190,820 | | |
| Arch Western Finance LLC | |
| 6.750% 07/01/13 | | | 3,179,000 | | | | 3,194,895 | | |
| Consol Energy, Inc. | |
| 8.000% 04/01/17 (a) | | | 1,605,000 | | | | 1,693,275 | | |
| 8.250% 04/01/20 (a) | | | 3,125,000 | | | | 3,316,406 | | |
| | | | 8,395,396 | | |
| Coal Total | | | 8,395,396 | | |
| Oil & Gas – 8.5% | |
| Oil Companies-Exploration & Production – 8.5% | |
| Anadarko Petroleum Corp. | |
| 6.375% 09/15/17 | | | 3,320,000 | | | | 3,285,137 | | |
| 7.625% 03/15/14 | | | 5,645,000 | | | | 6,068,996 | | |
| Berry Petroleum Co. | |
| 8.250% 11/01/16 | | | 235,000 | | | | 237,350 | | |
| 10.250% 06/01/14 | | | 395,000 | | | | 435,488 | | |
| Chesapeake Energy Corp. | |
| 6.625% 08/15/20 | | | 4,270,000 | | | | 4,286,012 | | |
| Cimarex Energy Co. | |
| 7.125% 05/01/17 | | | 3,610,000 | | | | 3,736,350 | | |
| Comstock Resources, Inc. | |
| 8.375% 10/15/17 | | | 1,310,000 | | | | 1,339,475 | | |
| Concho Resources, Inc. | |
| 8.625% 10/01/17 | | | 1,500,000 | | | | 1,567,500 | | |
| Forest Oil Corp. | |
| 8.500% 02/15/14 | | | 6,465,000 | | | | 6,869,062 | | |
| Hilcorp Energy I LP/Hilcorp Finance Co. | |
| 7.750% 11/01/15 (a) | | | 2,555,000 | | | | 2,586,937 | | |
| Newfield Exploration Co. | |
| 6.875% 02/01/20 | | | 1,660,000 | | | | 1,730,550 | | |
| PetroHawk Energy Corp. | |
| 7.250% 08/15/18 (a) | | | 1,325,000 | | | | 1,315,063 | | |
| 7.875% 06/01/15 | | | 2,390,000 | | | | 2,479,625 | | |
| Pioneer Natural Resources Co. | |
| 7.500% 01/15/20 | | | 230,000 | | | | 247,107 | | |
| QEP Resources, Inc. | |
| 6.875% 03/01/21 | | | 1,970,000 | | | | 2,053,725 | | |
| Quicksilver Resources, Inc. | |
| 7.125% 04/01/16 | | | 1,528,000 | | | | 1,466,880 | | |
| 8.250% 08/01/15 | | | 850,000 | | | | 867,000 | | |
| Range Resources Corp. | |
| 6.750% 08/01/20 | | | 1,665,000 | | | | 1,677,488 | | |
| 7.500% 05/15/16 | | | 1,765,000 | | | | 1,835,600 | | |
| 8.000% 05/15/19 | | | 835,000 | | | | 893,450 | | |
See Accompanying Notes to Financial Statements.
12
Columbia Conservative High Yield Fund
August 31, 2010
| Corporate Fixed-Income Bonds & Notes (continued) | |
| | | Par ($) | | Value ($) | |
| SandRidge Energy, Inc. | |
PIK,
8.625% 04/01/15 | | | 1,609,000 | | | | 1,538,606 | | |
| Southwestern Energy Co. | |
| 7.500% 02/01/18 | | | 2,310,000 | | | | 2,604,525 | | |
| | | | 49,121,926 | | |
| Oil & Gas Total | | | 49,121,926 | | |
| Oil & Gas Services – 0.7% | |
| Oil-Field Services – 0.7% | |
| American Petroleum Tankers LLC/AP Tankers Co. | |
| 10.250% 05/01/15 (a) | | | 855,000 | | | | 865,688 | | |
| Expro Finance Luxembourg SCA | |
| 8.500% 12/15/16 (a) | | | 3,320,000 | | | | 3,104,200 | | |
| | | | 3,969,888 | | |
| Oil & Gas Services Total | | | 3,969,888 | | |
| Pipelines – 2.3% | |
| Pipelines – 2.3% | |
| El Paso Corp. | |
| 6.875% 06/15/14 | | | 750,000 | | | | 793,592 | | |
| 7.250% 06/01/18 | | | 3,420,000 | | | | 3,664,010 | | |
| 7.750% 01/15/32 | | | 1,865,000 | | | | 1,877,359 | | |
| Kinder Morgan Finance Co. ULC | |
| 5.700% 01/05/16 | | | 4,400,000 | | | | 4,433,000 | | |
| Regency Energy Partners LP/Regency Energy Finance Corp. | |
| 8.375% 12/15/13 | | | 280,000 | | | | 292,600 | | |
| 9.375% 06/01/16 (a) | | | 845,000 | | | | 916,825 | | |
| Southern Star Central Corp. | |
| 6.750% 03/01/16 | | | 545,000 | | | | 549,088 | | |
| Williams Companies, Inc. | |
| 7.875% 09/01/21 | | | 685,000 | | | | 831,897 | | |
| | | | 13,358,371 | | |
| Pipelines Total | | | 13,358,371 | | |
| Energy Total | | | 74,845,581 | | |
| Financials – 10.8% | |
| Banks – 2.9% | |
| Commercial Banks-Eastern U.S. – 2.0% | |
| CIT Group, Inc. | |
| 7.000% 05/01/17 | | | 12,045,000 | | | | 11,326,058 | | |
| | | | 11,326,058 | | |
| Diversified Financial Services – 0.9% | |
| Capital One Capital IV | |
6.745% 02/17/37
(02/17/32) (b)(c) | | | 2,185,000 | | | | 2,081,213 | | |
| | | Par ($) | | Value ($) | |
| Capital One Capital V | |
| 10.250% 08/15/39 | | | 3,160,000 | | | | 3,412,800 | | |
| | | | 5,494,013 | | |
| Banks Total | | | 16,820,071 | | |
| Diversified Financial Services – 6.0% | |
| Finance-Auto Loans – 3.4% | |
| Ally Financial, Inc. | |
| 7.500% 09/15/20 (a) | | | 1,690,000 | | | | 1,673,100 | | |
| 8.000% 03/15/20 (a) | | | 6,335,000 | | | | 6,493,375 | | |
| 8.000% 11/01/31 | | | 2,305,000 | | | | 2,270,425 | | |
| Ford Motor Credit Co., LLC | |
| 6.625% 08/15/17 | | | 3,150,000 | | | | 3,201,572 | | |
| 8.000% 12/15/16 | | | 5,635,000 | | | | 6,119,243 | | |
| | | | 19,757,715 | | |
| Finance-Consumer Loans – 0.9% | |
| American General Finance Corp. | |
| 4.875% 07/15/12 | | | 340,000 | | | | 309,825 | | |
| 6.900% 12/15/17 | | | 5,900,000 | | | | 4,572,500 | | |
| | | | 4,882,325 | | |
| Finance-Investment Banker/Broker – 0.5% | |
| E*Trade Financial Corp. | |
| 7.375% 09/15/13 | | | 555,000 | | | | 527,250 | | |
| 7.875% 12/01/15 | | | 2,705,000 | | | | 2,556,225 | | |
| | | | 3,083,475 | | |
| Finance-Leasing Company – 0.7% | |
| International Lease Finance Corp. | |
| 8.750% 03/15/17 (a) | | | 1,800,000 | | | | 1,815,750 | | |
| 8.875% 09/01/17 | | | 2,250,000 | | | | 2,266,875 | | |
| | | | 4,082,625 | | |
| Finance-Other Services – 0.5% | |
| Pinnacle Foods Finance LLC/Pinnacle Foods Finance Corp. | |
| 8.250% 09/01/17 (a) | | | 2,820,000 | | | | 2,795,325 | | |
| | | | 2,795,325 | | |
| Diversified Financial Services Total | | | 34,601,465 | | |
| Insurance – 1.3% | |
| Life/Health Insurance – 0.3% | |
| Provident Companies, Inc. | |
| 7.000% 07/15/18 | | | 1,435,000 | | | | 1,558,532 | | |
| | | | 1,558,532 | | |
| Multi-Line Insurance – 0.5% | |
| ING Groep NV | |
5.775% 12/29/49
(12/08/15) (b)(c) | | | 3,610,000 | | | | 2,969,225 | | |
| | | | 2,969,225 | | |
See Accompanying Notes to Financial Statements.
13
Columbia Conservative High Yield Fund
August 31, 2010
| Corporate Fixed-Income Bonds & Notes (continued) | |
| | | Par ($) | | Value ($) | |
| Property/Casualty Insurance – 0.5% | |
| Crum & Forster Holdings Corp. | |
| 7.750% 05/01/17 | | | 2,935,000 | | | | 3,034,056 | | |
| | | | 3,034,056 | | |
| Insurance Total | | | 7,561,813 | | |
| Investment Companies – 0.6% | |
| Investment Companies – 0.6% | |
| Offshore Group Investments Ltd. | |
| 11.500% 08/01/15 (a) | | | 3,420,000 | | | | 3,411,450 | | |
| | | | 3,411,450 | | |
| Investment Companies Total | | | 3,411,450 | | |
| Financials Total | | | 62,394,799 | | |
| Industrials – 8.6% | |
| Aerospace & Defense – 1.1% | |
| Aerospace/Defense – 0.4% | |
| Esterline Technologies Corp. | |
| 7.000% 08/01/20 (a) | | | 145,000 | | | | 147,537 | | |
| Kratos Defense & Security Solutions, Inc. | |
| 10.000% 06/01/17 | | | 1,900,000 | | | | 1,961,750 | | |
| | | | 2,109,287 | | |
| Electronics-Military – 0.7% | |
| L-3 Communications Corp. | |
| 6.375% 10/15/15 | | | 3,845,000 | | | | 3,936,319 | | |
| | | | 3,936,319 | | |
| Aerospace & Defense Total | | | 6,045,606 | | |
| Building Materials – 0.7% | |
| Building & Construction Products-Miscellaneous – 0.7% | |
| Gibraltar Industries, Inc. | |
| 8.000% 12/01/15 | | | 1,090,000 | | | | 1,043,675 | | |
| Owens Corning | |
| 6.500% 12/01/16 | | | 2,920,000 | | | | 3,127,379 | | |
| | | | 4,171,054 | | |
| Building Materials Total | | | 4,171,054 | | |
| Electrical Components & Equipment – 0.9% | |
| Wire & Cable Products – 0.9% | |
| Belden, Inc. | |
| 7.000% 03/15/17 | | | 4,245,000 | | | | 4,266,225 | | |
| WireCo WorldGroup | |
| 9.500% 05/15/17 (a) | | | 1,140,000 | | | | 1,148,550 | | |
| | | | 5,414,775 | | |
| Electrical Components & Equipment Total | | | 5,414,775 | | |
| | | Par ($) | | Value ($) | |
| Electronics – 0.4% | |
| Electronic Components-Miscellaneous – 0.4% | |
| Flextronics International Ltd. | |
| 6.250% 11/15/14 | | | 2,189,000 | | | | 2,221,835 | | |
| | | | 2,221,835 | | |
| Electronics Total | | | 2,221,835 | | |
| Environmental Control – 0.5% | |
| Hazardous Waste Disposal – 0.5% | |
| Clean Harbors, Inc. | |
| 7.625% 08/15/16 | | | 2,945,000 | | | | 3,018,625 | | |
| | | | 3,018,625 | | |
| Environmental Control Total | | | 3,018,625 | | |
| Machinery-Construction & Mining – 0.6% | |
| Machinery-Construction & Mining – 0.6% | |
| Terex Corp. | |
| 8.000% 11/15/17 | | | 3,285,000 | | | | 3,137,175 | | |
| | | | 3,137,175 | | |
| Machinery-Construction & Mining Total | | | 3,137,175 | | |
| Machinery-Diversified – 1.3% | |
| Machinery-Farm – 0.6% | |
| Case New Holland, Inc. | |
| 7.875% 12/01/17 (a) | | | 3,372,000 | | | | 3,549,030 | | |
| | | | 3,549,030 | | |
| Machinery-General Industry – 0.7% | |
| CPM Holdings, Inc. | |
| 10.625% 09/01/14 (a) | | | 1,065,000 | | | | 1,150,200 | | |
| Manitowoc Co., Inc. | |
| 7.125% 11/01/13 | | | 2,530,000 | | | | 2,530,000 | | |
| | | | 3,680,200 | | |
| Machinery-Diversified Total | | | 7,229,230 | | |
| Miscellaneous Manufacturing – 0.3% | |
| Diversified Manufacturing Operators – 0.3% | |
| SPX Corp. | |
| 6.875% 09/01/17 (a) | | | 1,798,000 | | | | 1,851,940 | | |
| | | | 1,851,940 | | |
| Miscellaneous Manufacturing Total | | | 1,851,940 | | |
| Packaging & Containers – 1.4% | |
| Containers-Metal/Glass – 1.0% | |
| Crown Americas LLC & Crown Americas Capital Corp. | |
| 7.750% 11/15/15 | | | 3,100,000 | | | | 3,216,250 | | |
| Crown Americas LLC & Crown Americas Capital Corp. II | |
| 7.625% 05/15/17 (a) | | | 2,210,000 | | | | 2,359,175 | | |
| | | | 5,575,425 | | |
See Accompanying Notes to Financial Statements.
14
Columbia Conservative High Yield Fund
August 31, 2010
| Corporate Fixed-Income Bonds & Notes (continued) | |
| | | Par ($) | | Value ($) | |
| Containers-Paper/Plastic – 0.4% | |
| Graphic Packaging International, Inc. | |
| 9.500% 06/15/17 | | | 2,407,000 | | | | 2,563,455 | | |
| | | | 2,563,455 | | |
| Packaging & Containers Total | | | 8,138,880 | | |
| Transportation – 1.4% | |
| Transportation-Railroad – 0.8% | |
| Kansas City Southern de Mexico SA de CV | |
| 7.375% 06/01/14 | | | 2,500,000 | | | | 2,568,750 | | |
| RailAmerica, Inc. | |
| 9.250% 07/01/17 | | | 1,724,000 | | | | 1,870,540 | | |
| | | | 4,439,290 | | |
| Transportation-Services – 0.6% | |
| Bristow Group, Inc. | |
| 7.500% 09/15/17 | | | 3,635,000 | | | | 3,635,000 | | |
| | | | 3,635,000 | | |
| Transportation Total | | | 8,074,290 | | |
| Industrials Total | | | 49,303,410 | | |
| Technology – 0.8% | |
| Semiconductors – 0.4% | |
| Electronic Components-Semiconductors – 0.4% | |
| Amkor Technology, Inc. | |
| 9.250% 06/01/16 | | | 1,100,000 | | | | 1,163,250 | | |
| Freescale Semiconductor, Inc. | |
| 9.250% 04/15/18 (a) | | | 1,215,000 | | | | 1,218,037 | | |
| | | | 2,381,287 | | |
| Semiconductors Total | | | 2,381,287 | | |
| Software – 0.4% | |
| Data Processing/Management – 0.4% | |
| First Data Corp. | |
| 8.875% 08/15/20 (a) | | | 2,250,000 | | | | 2,255,625 | | |
| | | | 2,255,625 | | |
| Software Total | | | 2,255,625 | | |
| Technology Total | | | 4,636,912 | | |
| Utilities – 5.6% | |
| Electric – 5.0% | |
| Electric-Generation – 1.3% | |
| Edison Mission Energy | |
| 7.000% 05/15/17 | | | 1,405,000 | | | | 958,913 | | |
| Intergen NV | |
| 9.000% 06/30/17 (a) | | | 6,255,000 | | | | 6,427,012 | | |
| | | | 7,385,925 | | |
| | | Par ($) | | Value ($) | |
| Electric-Integrated – 1.9% | |
| Calpine Construction Finance Co. LP | |
| 8.000% 06/01/16 (a) | | | 3,205,000 | | | | 3,365,250 | | |
| CMS Energy Corp. | |
| 6.875% 12/15/15 | | | 2,380,000 | | | | 2,632,242 | | |
| Energy Future Holdings Corp. | |
| 10.000% 01/15/20 (a) | | | 2,075,000 | | | | 1,998,231 | | |
| Ipalco Enterprises, Inc. | |
| 7.250% 04/01/16 (a) | | | 2,405,000 | | | | 2,513,225 | | |
| | | | 10,508,948 | | |
| Independent Power Producer – 1.8% | |
| Dynegy Holdings, Inc. | |
| 7.750% 06/01/19 | | | 2,570,000 | | | | 1,657,650 | | |
| NRG Energy, Inc. | |
| 7.375% 02/01/16 | | | 8,755,000 | | | | 8,820,663 | | |
| | | | 10,478,313 | | |
| Electric Total | | | 28,373,186 | | |
| Gas – 0.6% | |
| Gas-Distribution – 0.6% | |
| Centerpoint Energy, Inc. | |
| 5.950% 02/01/17 | | | 3,185,000 | | | | 3,575,312 | | |
| | | | 3,575,312 | | |
| Gas Total | | | 3,575,312 | | |
| Utilities Total | | | 31,948,498 | | |
Total Corporate Fixed-Income Bonds & Notes
(cost of $513,812,533) | | | 547,050,520 | | |
| Short-Term Obligation – 0.5% | |
Repurchase agreement with
Fixed Income Clearing Corp.,
dated 08/31/10, due 09/01/10
at 0.190%, collateralized by a
U.S. Government Agency
obligation maturing 07/14/14,
market value $2,695,063
(repurchase proceeds
$2,639,014) | | | 2,639,000 | | | | 2,639,000 | | |
Total Short-Term Obligation
(cost of $2,639,000) | | | 2,639,000 | | |
Total Investments – 95.6%
(cost of $516,451,533)(d) | | | 549,689,520 | | |
| Other Assets & Liabilities, Net – 4.4% | | | 25,411,237 | | |
| Net Assets – 100.0% | | | 575,100,757 | | |
See Accompanying Notes to Financial Statements.
15
Columbia Conservative High Yield Fund
August 31, 2010
Notes to Investment Portfolio:
(a) Security exempt from registration pursuant to Rule 144A under the Securities Act of 1933. These securities may be resold in transactions exempt from registration, normally to qualified institutional buyers. At August 31, 2010, these securities, which are not illiquid, amounted to $137,117,073, which represents 23.8% of net assets.
(b) The interest rate shown on floating rate or variable rate securities reflects the rate at August 31, 2010.
(c) Parenthetical date represents the next interest rate reset date for the security.
(d) Cost for federal income tax purposes is $517,114,871.
Significant observable inputs (level 2 measurements), including quoted prices for similar securities, interest rates, prepayment speeds and others, were used in determining value for all securities in the Fund's portfolio as of August 31, 2010.
Certain Short-Term Obligations may be valued using amortized cost, an income approach which converts future cash flows to a present value based upon the premium or discount at purchase.
The following table reconciles asset balances for the twelve months ending August 31, 2010, in which significant unobservable inputs (Level 3) were used in determining value:
Investments in
Securities | | Balance
as of
August 31,
2009 | | Accrued
Discounts
(Premiums) | | Realized
Gain
(Loss) | | Change in
Unrealized
Appreciation
(Depreciation) | | Purchases | | (Sales) | | Transfers
into
Level 3 | | Transfers
(out of)
Level 3 | | Balance
as of
August 31,
2010 | |
Corporate Fixed-Income
Bonds & Notes | | | | | | | | | | | | | | | | | | | | | | | | | | | | | | | | | | | | | |
| Consumer Cyclical | | $ | — | | | $ | — | | | $ | 108,221 | | | $ | — | | | $ | 2,860,050 | | | $ | (2,968,271 | ) | | $ | — | | | $ | — | | | $ | — | | |
The information in the above reconciliation represents fiscal year to date activity for any securities identified as using Level 3 inputs at either the beginning or the end of the current fiscal period.
The change in unrealized appreciation (depreciation) attributable to securities owned at August 31, 2010, which were valued using significant unobservable inputs (Level 3) amounted to $0. This amount is included in net change in unrealized appreciation on the Statement of Changes in Net Assets.
For more information on valuation inputs, and their aggregation into the levels used in the tables above, please refer to the Security Valuation section in the accompanying Notes to Financial Statements.
At August 31, 2010, the asset allocation of the fund is as follows:
| Asset Allocation (Unaudited) | | % of
Net Assets | |
| Communications | | | 21.9 | | |
| Energy | | | 13.0 | | |
| Consumer Cyclical | | | 12.5 | | |
| Financials | | | 10.8 | | |
| Basic Materials | | | 10.5 | | |
| Consumer Non-Cyclical | | | 10.5 | | |
| Industrials | | | 8.6 | | |
| Utilities | | | 5.6 | | |
| Diversified | | | 0.9 | | |
| Technology | | | 0.8 | | |
| | | | 95.1 | | |
| Short-Term Obligation | | | 0.5 | | |
| Other Assets & Liabilities, Net | | | 4.4 | | |
| | | | 100.0 | | |
| Acronym | | Name | |
| PIK | | Payment-In-Kind | |
|
See Accompanying Notes to Financial Statements.
16
Statement of Assets and Liabilities – Columbia Conservative High Yield Fund
August 31, 2010
| | | | | ($) | |
| Assets | | Total investments, at identified cost | | | 516,451,533 | | |
| | | Total investments, at value | | | 549,689,520 | | |
| | | Cash | | | 1,051,903 | | |
| | | Receivable for: | | | | | |
| | | Investments sold | | | 17,808,424 | | |
| | | Fund shares sold | | | 663,525 | | |
| | | Interest | | | 10,067,300 | | |
| | | Foreign tax reclaims | | | 6,138 | | |
| | | Expense reimbursement due from investment advisor | | | 260 | | |
| | | Trustees' deferred compensation plan | | | 64,181 | | |
| | | Prepaid expenses | | | 11,736 | | |
| | | Total Assets | | | 579,362,987 | | |
| Liabilities | | Payable for: | | | | | |
| | | Investments purchased on a delayed delivery basis | | | 1,051,000 | | |
| | | Fund shares repurchased | | | 1,019,855 | | |
| | | Distributions | | | 1,682,132 | | |
| | | Investment advisory fee | | | 293,143 | | |
| | | Pricing and bookkeeping fees | | | 13,082 | | |
| | | Transfer agent fee | | | 6,725 | | |
| | | Trustees' fees | | | 42 | | |
| | | Custody fee | | | 1,915 | | |
| | | Distribution and service fees | | | 66,746 | | |
| | | Chief compliance officer expenses | | | 203 | | |
| | | Trustees' deferred compensation plan | | | 64,181 | | |
| | | Other liabilities | | | 63,206 | | |
| | | Total Liabilities | | | 4,262,230 | | |
| | | Net Assets | | | 575,100,757 | | |
| Net Assets Consist of | | Paid-in capital | | | 664,999,789 | | |
| | | Accumulated net investment loss | | | (681,204 | ) | |
| | | Accumulated net realized loss | | | (122,455,815 | ) | |
| | | Net unrealized appreciation (depreciation) on investments | | | 33,237,987 | | |
| | | Net Assets | | | 575,100,757 | | |
See Accompanying Notes to Financial Statements.
17
Statement of Assets and Liabilities (continued) – Columbia Conservative High Yield Fund
August 31, 2010
| Class A | | Net assets | | $ | 76,440,445 | | |
| | | Shares outstanding | | | 10,004,762 | | |
| | | Net asset value per share | | $ | 7.64 | (a)(b) | |
| | | Maximum sales charge | | | 4.75 | % | |
| | | Maximum offering price per share ($7.64/0.9525) | | $ | 8.02 | (c) | |
| Class B | | Net assets | | $ | 23,869,591 | | |
| | | Shares outstanding | | | 3,124,073 | | |
| | | Net asset value and offering price per share | | $ | 7.64 | (a)(b) | |
| Class C | | Net assets | | $ | 30,462,811 | | |
| | | Shares outstanding | | | 3,987,140 | | |
| | | Net asset value and offering price per share | | $ | 7.64 | (a)(b) | |
| Class Y | | Net assets | | $ | 13,782,708 | | |
| | | Shares outstanding | | | 1,803,945 | | |
| | | Net asset value and offering price per share | | $ | 7.64 | (b) | |
| Class Z | | Net assets | | $ | 430,545,202 | | |
| | | Shares outstanding | | | 56,352,030 | | |
| | | Net asset value and offering price per share | | $ | 7.64 | (b) | |
(a) Redemption price per share is equal to net asset value less any applicable contingent deferred sales charge.
(b) Redemption price per share is equal to net asset value less any applicable redemption fees.
(c) On sales of $50,000 or more the offering price is reduced.
See Accompanying Notes to Financial Statements.
18
Statement of Operations – Columbia Conservative High Yield Fund
For the Year Ended August 31, 2010
| | | | | ($) | |
| Investment Income | | Interest | | | 48,974,280 | | |
| Expenses | | Investment advisory fee | | | 3,490,532 | | |
| | | Distribution fee: | | | | | |
| | | Class B | | | 201,880 | | |
| | | Class C | | | 228,387 | | |
| | | Service fee: | | | | | |
| | | Class A | | | 196,986 | | |
| | | Class B | | | 67,293 | | |
| | | Class C | | | 76,129 | | |
| | | Transfer agent fee: | | | | | |
| | | Class A, Class B, Class C and Class Z | | | 678,232 | | |
| | | Class Y | | | 106 | | |
| | | Pricing and bookkeeping fees | | | 145,227 | | |
| | | Trustees' fees | | | 40,057 | | |
| | | Custody fee | | | 20,825 | | |
| | | Chief compliance officer expenses | | | 1,226 | | |
| | | Other expenses | | | 321,863 | | |
| | | Total Expenses | | | 5,468,743 | | |
| | | Fees waived by distributor—Class C | | | (45,677 | ) | |
| | | Expense reductions | | | (186 | ) | |
| | | Net Expenses | | | 5,422,880 | | |
| | | Net Investment Income | | | 43,551,400 | | |
| Net Realized and Unrealized Gain (Loss) on Investments and Foreign Currency | |
| | | Net realized gain on: | | | | | |
| | | Investments | | | 17,588,478 | | |
| | | Foreign currency transactions and forward foreign
currency exchange contracts | | | 319,879 | | |
| | Net realized gain | | | 17,908,357 | | |
| | | Net change in unrealized appreciation (depreciation) on: | | | | | |
| | | Investments | | | 26,235,932 | | |
| | | Foreign currency translations and forward foreign
currency exchange contracts | | | 38,335 | | |
| | | Net change in unrealized appreciation (depreciation) | | | 26,274,267 | | |
| | | Net Gain | | | 44,182,624 | | |
| | | Net Increase Resulting from Operations | | | 87,734,024 | | |
See Accompanying Notes to Financial Statements.
19
Statement of Changes in Net Assets – Columbia Conservative High Yield Fund
| | | | | Year Ended August 31, | |
| Increase (Decrease) in Net Assets | | | | 2010 ($) | | 2009 ($)(a)(b) | |
| Operations | | Net investment income | | | 43,551,400 | | | | 38,137,345 | | |
| | | Net realized gain (loss) on investments, foreign currency
transactions, forward foreign currency exchange contracts
and credit default swap contracts | | | 17,908,357 | | | | (76,021,590 | ) | |
| | | Net change in unrealized appreciation (depreciation) on
investments, foreign currency translations, forward
foreign currency exchange contracts and credit
default swap contracts | | | 26,274,267 | | | | 43,385,562 | | |
| | | Net increase resulting from operations | | | 87,734,024 | | | | 5,501,317 | | |
| Distributions to Shareholders | | From net investment income: | | | | | | | | | |
| | | Class A | | | (5,880,290 | ) | | | (4,836,008 | ) | |
| | | Class B | | | (1,808,226 | ) | | | (2,089,701 | ) | |
| | | Class C | | | (2,086,523 | ) | | | (1,576,170 | ) | |
| | | Class Y | | | (1,279,329 | ) | | | (140,707 | ) | |
| | | Class Z | | | (33,650,377 | ) | | | (30,149,732 | ) | |
| | | Total distributions to shareholders | | | (44,704,745 | ) | | | (38,792,318 | ) | |
| | | Net Capital Stock Transactions | | | (56,950,067 | ) | | | 49,489,148 | | |
| | | Increase from regulatory settlements | | | 8,989 | | | | 97,269 | | |
| | | Total increase (decrease) in net assets | | | (13,911,799 | ) | | | 16,295,416 | | |
| Net Assets | | Beginning of period | | | 589,012,556 | | | | 572,717,140 | | |
| | | End of period | | | 575,100,757 | | | | 589,012,556 | | |
| | | Accumulated net investment loss, at end of period | | | (681,204 | ) | | | (519,212 | ) | |
(a) Class Y shares commenced operations on July 15, 2009.
(b) Class Y shares reflect activity for the period July 15, 2009 through August 31, 2009.
See Accompanying Notes to Financial Statements.
20
Statement of Changes in Net Assets (continued) – Columbia Conservative High Yield Fund
| | | Capital Stock Activity | |
| | | Year Ended
August 31, 2010 | | Year Ended
August 31, 2009 (a)(b) | |
| | | Shares | | Dollars ($) | | Shares | | Dollars ($) | |
| Class A | |
| Subscriptions | | | 3,860,465 | | | | 28,813,552 | | | | 7,347,134 | | | | 47,177,159 | | |
| Distributions reinvested | | | 600,682 | | | | 4,494,058 | | | | 629,430 | | | | 4,106,780 | | |
| Redemptions | | | (5,423,122 | ) | | | (40,369,210 | ) | | | (6,015,382 | ) | | | (39,077,085 | ) | |
| Net increase (decrease) | | | (961,975 | ) | | | (7,061,600 | ) | | | 1,961,182 | | | | 12,206,854 | | |
| Class B | |
| Subscriptions | | | 102,860 | | | | 764,206 | | | | 308,521 | | | | 1,950,860 | | |
| Distributions reinvested | | | 168,353 | | | | 1,259,538 | | | | 224,041 | | | | 1,452,365 | | |
| Redemptions | | | (1,307,919 | ) | | | (9,763,847 | ) | | | (1,390,908 | ) | | | (9,027,660 | ) | |
| Net decrease | | | (1,036,706 | ) | | | (7,740,103 | ) | | | (858,346 | ) | | | (5,624,435 | ) | |
| Class C | |
| Subscriptions | | | 759,283 | | | | 5,664,873 | | | | 1,788,700 | | | | 11,592,043 | | |
| Distributions reinvested | | | 185,894 | | | | 1,391,470 | | | | 167,490 | | | | 1,094,947 | | |
| Redemptions | | | (1,098,381 | ) | | | (8,227,442 | ) | | | (840,135 | ) | | | (5,421,856 | ) | |
| Net increase (decrease) | | | (153,204 | ) | | | (1,171,099 | ) | | | 1,116,055 | | | | 7,265,134 | | |
| Class Y | |
| Subscriptions | | | 461,580 | | | | 3,470,000 | | | | 2,586,030 | | | | 18,015,831 | | |
| Distributions reinvested | | | 42,328 | | | | 317,398 | | | | 3,202 | | | | 22,730 | | |
| Redemptions | | | (1,289,195 | ) | | | (9,746,923 | ) | | | — | | | | — | | |
| Net increase (decrease) | | | (785,287 | ) | | | (5,959,525 | ) | | | 2,589,232 | | | | 18,038,561 | | |
| Class Z | |
| Subscriptions | | | 15,746,735 | | | | 117,876,079 | | | | 24,712,911 | | | | 158,824,736 | | |
| Distributions reinvested | | | 2,079,829 | | | | 15,575,029 | | | | 1,849,969 | | | | 12,099,935 | | |
| Redemptions | | | (22,624,203 | ) | | | (168,468,848 | ) | | | (23,662,625 | ) | | | (153,321,637 | ) | |
| Net increase (decrease) | | | (4,797,639 | ) | | | (35,017,740 | ) | | | 2,900,255 | | | | 17,603,034 | | |
(a) Class Y shares commenced operations on July 15, 2009.
(b) Class Y shares reflect activity for the period July 15, 2009 through August 31, 2009.
See Accompanying Notes to Financial Statements.
21
Financial Highlights – Columbia Conservative High Yield Fund
Selected data for a share outstanding throughout each period is as follows:
| | | Year Ended August 31, | |
| Class A Shares | | 2010 | | 2009 | | 2008 | | 2007 | | 2006 | |
| Net Asset Value, Beginning of Period | | $ | 7.10 | | | $ | 7.61 | | | $ | 8.12 | | | $ | 8.27 | | | $ | 8.62 | | |
| Income from Investment Operations: | |
| Net investment income (a) | | | 0.54 | | | | 0.50 | | | | 0.51 | | | | 0.52 | | | | 0.50 | | |
Net realized and unrealized gain (loss) on investments,
foreign currency and credit default swap contracts | | | 0.56 | | | | (0.50 | ) | | | (0.50 | ) | | | (0.13 | ) | | | (0.32 | ) | |
| Total from investment operations | | | 1.10 | | | | — | | | | 0.01 | | | | 0.39 | | | | 0.18 | | |
| Less Distributions to Shareholders: | |
| From net investment income | | | (0.56 | ) | | | (0.51 | ) | | | (0.52 | ) | | | (0.54 | ) | | | (0.53 | ) | |
| Increase from regulatory settlements | | | — | (b) | | | — | (b) | | | — | | | | — | | | | — | | |
| Net Asset Value, End of Period | | $ | 7.64 | | | $ | 7.10 | | | $ | 7.61 | | | $ | 8.12 | | | $ | 8.27 | | |
| Total return (c) | | | 15.88 | % | | | 0.91 | % | | | 0.07 | % | | | 4.75 | % | | | 2.16 | %(d) | |
| Ratios to Average Net Assets/Supplemental Data: | |
| Net expenses before interest expense (e) | | | 1.05 | % | | | 1.07 | % | | | 1.07 | % | | | 1.03 | % | | | 0.97 | % | |
| Interest expense | | | — | | | | — | %(f) | | | — | | | | — | %(f) | | | — | | |
| Net expenses (e) | | | 1.05 | % | | | 1.07 | % | | | 1.07 | % | | | 1.03 | % | | | 0.97 | % | |
| Waiver/Reimbursement | | | — | | | | — | | | | — | | | | — | | | | — | %(f) | |
| Net investment income (e) | | | 7.27 | % | | | 7.68 | % | | | 6.46 | % | | | 6.25 | % | | | 5.97 | % | |
| Portfolio turnover rate | | | 65 | % | | | 67 | % | | | 29 | % | | | 42 | % | | | 31 | % | |
| Net assets, end of period (000s) | | $ | 76,440 | | | $ | 77,820 | | | $ | 68,496 | | | $ | 103,769 | | | $ | 170,575 | | |
(a) Per share data was calculated using the average shares outstanding during the period.
(b) Rounds to less than $0.01 per share.
(c) Total return at net asset value assuming all distributions reinvested and no initial sales charge or contingent deferred sales charge.
(d) Had the investment advisor and/or any of its affiliates not waived fees or reimbursed a portion of expenses, total return would have been reduced.
(e) The benefits derived from expense reductions had an impact of less than 0.01%.
(f) Rounds to less than 0.01%.
See Accompanying Notes to Financial Statements.
22
Financial Highlights – Columbia Conservative High Yield Fund
Selected data for a share outstanding throughout each period is as follows:
| | | Year Ended August 31, | |
| Class B Shares | | 2010 | | 2009 | | 2008 | | 2007 | | 2006 | |
| Net Asset Value, Beginning of Period | | $ | 7.10 | | | $ | 7.61 | | | $ | 8.12 | | | $ | 8.27 | | | $ | 8.62 | | |
| Income from Investment Operations: | |
| Net investment income (a) | | | 0.49 | | | | 0.45 | | | | 0.45 | | | | 0.46 | | | | 0.44 | | |
Net realized and unrealized gain (loss) on investments,
foreign currency and credit default swap contracts | | | 0.55 | | | | (0.50 | ) | | | (0.50 | ) | | | (0.13 | ) | | | (0.32 | ) | |
| Total from investment operations | | | 1.04 | | | | (0.05 | ) | | | (0.05 | ) | | | 0.33 | | | | 0.12 | | |
| Less Distributions to Shareholders: | |
| From net investment income | | | (0.50 | ) | | | (0.46 | ) | | | (0.46 | ) | | | (0.48 | ) | | | (0.47 | ) | |
| Increase from regulatory settlements | | | — | (b) | | | — | (b) | | | — | | | | — | | | | — | | |
| Net Asset Value, End of Period | | $ | 7.64 | | | $ | 7.10 | | | $ | 7.61 | | | $ | 8.12 | | | $ | 8.27 | | |
| Total return (c) | | | 15.02 | % | | | 0.17 | % | | | (0.67 | )% | | | 3.97 | % | | | 1.40 | %(d) | |
| Ratios to Average Net Assets/Supplemental Data: | |
| Net expenses before interest expense (e) | | | 1.80 | % | | | 1.82 | % | | | 1.82 | % | | | 1.78 | % | | | 1.72 | % | |
| Interest expense | | | — | | | | — | %(f) | | | — | | | | — | %(f) | | | — | | |
| Net expenses (e) | | | 1.80 | % | | | 1.82 | % | | | 1.82 | % | | | 1.78 | % | | | 1.72 | % | |
| Waiver/Reimbursement | | | — | | | | — | | | | — | | | | — | | | | — | %(f) | |
| Net investment income (e) | | | 6.53 | % | | | 6.96 | % | | | 5.71 | % | | | 5.50 | % | | | 5.21 | % | |
| Portfolio turnover rate | | | 65 | % | | | 67 | % | | | 29 | % | | | 42 | % | | | 31 | % | |
| Net assets, end of period (000s) | | $ | 23,870 | | | $ | 29,525 | | | $ | 38,175 | | | $ | 50,577 | | | $ | 66,886 | | |
(a) Per share data was calculated using the average shares outstanding during the period.
(b) Rounds to less than $0.01 per share.
(c) Total return at net asset value assuming all distributions reinvested and no contingent deferred sales charge.
(d) Had the investment advisor and/or any of its affiliates not waived fees or reimbursed a portion of expenses, total return would have been reduced.
(e) The benefits derived from expense reductions had an impact of less than 0.01%.
(f) Rounds to less than 0.01%.
See Accompanying Notes to Financial Statements.
23
Financial Highlights – Columbia Conservative High Yield Fund
Selected data for a share outstanding throughout each period is as follows:
| | | Year Ended August 31, | |
| Class C Shares | | 2010 | | 2009 | | 2008 | | 2007 | | 2006 | |
| Net Asset Value, Beginning of Period | | $ | 7.10 | | | $ | 7.61 | | | $ | 8.12 | | | $ | 8.27 | | | $ | 8.62 | | |
| Income from Investment Operations: | |
| Net investment income (a) | | | 0.50 | | | | 0.46 | | | | 0.47 | | | | 0.47 | | | | 0.45 | | |
Net realized and unrealized gain (loss) on investments,
foreign currency and credit default swap contracts | | | 0.55 | | | | (0.50 | ) | | | (0.51 | ) | | | (0.13 | ) | | | (0.32 | ) | |
| Total from investment operations | | | 1.05 | | | | (0.04 | ) | | | (0.04 | ) | | | 0.34 | | | | 0.13 | | |
| Less Distributions to Shareholders: | |
| From net investment income | | | (0.51 | ) | | | (0.47 | ) | | | (0.47 | ) | | | (0.49 | ) | | | (0.48 | ) | |
| Increase from regulatory settlements | | | — | (b) | | | — | (b) | | | — | | | | — | | | | — | | |
| Net Asset Value, End of Period | | $ | 7.64 | | | $ | 7.10 | | | $ | 7.61 | | | $ | 8.12 | | | $ | 8.27 | | |
| Total return (c)(d) | | | 15.19 | % | | | 0.31 | % | | | (0.52 | )% | | | 4.13 | % | | | 1.55 | % | |
| Ratios to Average Net Assets/Supplemental Data: | |
| Net expenses before interest expense (e) | | | 1.65 | % | | | 1.67 | % | | | 1.67 | % | | | 1.63 | % | | | 1.57 | % | |
| Interest expense | | | — | | | | — | %(f) | | | — | | | | — | %(f) | | | — | | |
| Net expenses (e) | | | 1.65 | % | | | 1.67 | % | | | 1.67 | % | | | 1.63 | % | | | 1.57 | % | |
| Waiver/Reimbursement | | | 0.15 | % | | | 0.15 | % | | | 0.15 | % | | | 0.15 | % | | | 0.15 | % | |
| Net investment income (e) | | | 6.66 | % | | | 7.08 | % | | | 5.88 | % | | | 5.69 | % | | | 5.37 | % | |
| Portfolio turnover rate | | | 65 | % | | | 67 | % | | | 29 | % | | | 42 | % | | | 31 | % | |
| Net assets, end of period (000s) | | $ | 30,463 | | | $ | 29,380 | | | $ | 23,003 | | | $ | 33,673 | | | $ | 11,653 | | |
(a) Per share data was calculated using the average shares outstanding during the period.
(b) Rounds to less than $0.01 per share.
(c) Total return at net asset value assuming all distributions reinvested and no contingent deferred sales charge.
(d) Had the investment advisor and/or any of its affiliates not waived fees or reimbursed a portion of expenses, total return would have been reduced.
(e) The benefits derived from expense reductions had an impact of less than 0.01%.
(f) Rounds to less than 0.01%.
See Accompanying Notes to Financial Statements.
24
Financial Highlights – Columbia Conservative High Yield Fund
Selected data for a share outstanding throughout each period is as follows:
| Class Y Shares | | Year Ended
August 31,
2010 | | Period Ended
August 31,
2009 (a) | |
| Net Asset Value, Beginning of Period | | $ | 7.10 | | | $ | 6.81 | | |
| Income from Investment Operations: | |
| Net investment income (b) | | | 0.57 | | | | 0.06 | | |
Net realized and unrealized gain (loss) on investments,
foreign currency and credit default swap contracts | | | 0.55 | | | | 0.30 | | |
| Total from investment operations | | | 1.12 | | | | 0.36 | | |
| Less Distributions to Shareholders: | |
| From net investment income | | | (0.58 | ) | | | (0.07 | ) | |
| Increase from regulatory settlements | | | — | (c) | | | — | | |
| Net Asset Value, End of Period | | $ | 7.64 | | | $ | 7.10 | | |
| Total return (d) | | | 16.30 | % | | | 5.28 | %(e) | |
| Ratios to Average Net Assets/Supplemental Data: | |
| Net expenses before interest expense (f) | | | 0.68 | % | | | 0.65 | %(g) | |
| Interest expense | | | — | | | | — | %(g)(h) | |
| Net expenses (f) | | | 0.68 | % | | | 0.65 | %(g) | |
| Net investment income (f) | | | 7.65 | % | | | 6.92 | %(g) | |
| Portfolio turnover rate | | | 65 | % | | | 67 | %(e) | |
| Net assets, end of period (000s) | | $ | 13,783 | | | $ | 18,373 | | |
(a) Class Y shares commenced operations on July 15, 2009. Per share data and total return reflect activity from that date.
(b) Per share data was calculated using the average shares outstanding during the period.
(c) Rounds to less than $0.01 per share.
(d) Total return at net asset value assuming all distributions reinvested.
(e) Not annualized.
(f) The benefits derived from expense reductions had an impact of less than 0.01%.
(g) Annualized.
(h) Rounds to less than 0.01%.
See Accompanying Notes to Financial Statements.
25
Financial Highlights – Columbia Conservative High Yield Fund
Selected data for a share outstanding throughout each period is as follows:
| | | Year Ended August 31, | |
| Class Z Shares | | 2010 | | 2009 | | 2008 | | 2007 | | 2006 | |
| Net Asset Value, Beginning of Period | | $ | 7.10 | | | $ | 7.61 | | | $ | 8.12 | | | $ | 8.27 | | | $ | 8.62 | | |
| Income from Investment Operations: | |
| Net investment income (a) | | | 0.56 | | | | 0.52 | | | | 0.53 | | | | 0.54 | | | | 0.52 | | |
Net realized and unrealized gain (loss) on investments,
foreign currency and credit default swap contracts | | | 0.55 | | | | (0.50 | ) | | | (0.50 | ) | | | (0.13 | ) | | | (0.32 | ) | |
| Total from investment operations | | | 1.11 | | | | 0.02 | | | | 0.03 | | | | 0.41 | | | | 0.20 | | |
| Less Distributions to Shareholders: | |
| From net investment income | | | (0.57 | ) | | | (0.53 | ) | | | (0.54 | ) | | | (0.56 | ) | | | (0.55 | ) | |
| Increase from regulatory settlements | | | — | (b) | | | — | (b) | | | — | | | | — | | | | — | | |
| Net Asset Value, End of Period | | $ | 7.64 | | | $ | 7.10 | | | $ | 7.61 | | | $ | 8.12 | | | $ | 8.27 | | |
| Total return (c) | | | 16.16 | % | | | 1.17 | % | | | 0.32 | % | | | 5.01 | % | | | 2.42 | %(d) | |
| Ratios to Average Net Assets/Supplemental Data: | |
| Net expenses before interest expense (e) | | | 0.80 | % | | | 0.82 | % | | | 0.82 | % | | | 0.78 | % | | | 0.72 | % | |
| Interest expense | | | — | | | | — | %(f) | | | — | | | | — | %(f) | | | — | | |
| Net expenses (e) | | | 0.80 | % | | | 0.82 | % | | | 0.82 | % | | | 0.78 | % | | | 0.72 | % | |
| Waiver/Reimbursement | | | — | | | | — | | | | — | | | | — | | | | — | %(f) | |
| Net investment income (e) | | | 7.50 | % | | | 7.94 | % | | | 6.71 | % | | | 6.49 | % | | | 6.20 | % | |
| Portfolio turnover rate | | | 65 | % | | | 67 | % | | | 29 | % | | | 42 | % | | | 31 | % | |
| Net assets, end of period (000s) | | $ | 430,545 | | | $ | 433,915 | | | $ | 443,043 | | | $ | 614,168 | | | $ | 801,811 | | |
(a) Per share data was calculated using the average shares outstanding during the period.
(b) Rounds to less than $0.01 per share.
(c) Total return at net asset value assuming all distributions reinvested.
(d) Had the investment advisor and/or any of its affiliates not waived fees or reimbursed a portion of expenses, total return would have been reduced.
(e) The benefits derived from expense reductions had an impact of less than 0.01%.
(f) Rounds to less than 0.01%.
See Accompanying Notes to Financial Statements.
26
Notes to Financial Statements – Columbia Conservative High Yield Fund
August 31, 2010
Note 1. Organization
Columbia Conservative High Yield Fund (the "Fund"), a series of Columbia Funds Series Trust I (the "Trust"), is a diversified fund. The Trust is registered under the Investment Company Act of 1940, as amended (the "1940 Act"), as an open-end management investment company organized as a Massachusetts business trust.
Investment Objective
The Fund seeks a high level of income, with capital appreciation as a secondary goal, by investing in non-investment-grade, corporate debt securities, commonly referred to as "junk" or "high-yield" bonds.
Fund Shares
The Trust may issue an unlimited number of shares and the Fund offers five classes of shares: Class A, Class B, Class C, Class Y and Class Z. Each share class has its own expense structure and sales charges, as applicable. The Fund no longer accepts investments from new or existing investors in the Fund's Class B shares, except in connection with the reinvestment of any dividend and/or capital gain distributions in Class B shares of the Fund and exchanges by existing Class B shareholders of the other Columbia Funds.
Class A shares are subject to a maximum front-end sales charge of 4.75% based on the amount of initial investment. Class A shares purchased without an initial sales charge in accounts aggregating $1 million to $50 million at the time of purchase are subject to a 1.00% contingent deferred sales charge ("CDSC") if the shares are sold within one year after purchase. Class B shares are subject to a maximum CDSC of 5.00% based upon the holding period after purchase. Class B shares will generally convert to Class A shares eight years after purchase. Class C shares are subject to a 1.00% CDSC on shares sold within one year after purchase. Class Y and Class Z shares are offered continuously at net asset value. There are certain restrictions on the purchase of Class Y and Class Z shares, as described in the Fund's prospectus.
Note 2. Significant Accounting Policies
The preparation of financial statements in accordance with accounting principles generally accepted in the United States of America ("GAAP") requires management to make certain estimates and assumptions that affect the reported amounts of assets and liabilities, the disclosure of contingent assets and liabilities at the date of the financial statements and the reported amounts of revenue and expenses during the reporting period. Actual results could differ from those estimates.
Management has evaluated the events and transactions that have occurred through the date the financial statements were issued and noted no items requiring adjustment of the financial statements or additional disclosures.
The following is a summary of significant accounting policies consistently followed by the Fund in the preparation of its financial statements.
Security Valuation
Debt securities generally are valued by pricing services approved by the Trust's Board of Trustees, based upon market transactions for normal, institutional-size trading units of similar securities. The services may use various pricing techniques which take into account appropriate factors such as yield, quality, coupon rate, maturity, type of issue, trading characteristics and other data, as well as broker quotes. Debt securities for which quotations are readily available may also be valued based upon an over-the-counter or exchange bid quotation.
Certain debt securities, which tend to be more thinly traded and of lesser quality, are priced based on fundamental analysis of the financial condition of the issuer and the estimated value of any collateral. Valuations developed through pricing techniques may vary from the actual amounts realized upon sale of the securities, and the potential variation may be greater for those securities valued using fundamental analysis.
Short-term investments maturing in 60 days or less are valued at amortized cost, which approximates market value.
Forward foreign currency exchange contracts are valued at the prevailing forward exchange rate of the underlying currencies.
Investments for which market quotations are not readily available, or that have quotations which management believes are not reliable, are valued at fair value as determined in good faith under consistently applied procedures established by and under the general supervision of the Board of Trustees. If a security is valued at fair value, such value is likely to be
27
Columbia Conservative High Yield Fund, August 31, 2010
different from the last quoted market price for the security. The determination of fair value often requires significant judgment. To determine fair value, management may use assumptions including but not limited to future cash flows and estimated risk premiums. Multiple inputs from various sources may be used to determine value.
GAAP establishes a hierarchy that prioritizes the inputs to valuation techniques used to measure fair value giving the highest priority to unadjusted quoted prices in active markets for identical securities (level 1 measurements) and the lowest priority to unobservable inputs (level 3 measurements) when market prices are not readily available or reliable. The three levels of the fair value hierarchy are described below:
• Level 1 – quoted prices in active markets for identical securities
• Level 2 – prices determined using other significant observable inputs (including quoted prices for similar securities, interest rates, prepayment speeds, credit risk and others)
• Level 3 – prices determined using significant unobservable inputs. In situations where quoted prices or observable inputs are unavailable or less reliable, unobservable inputs may be used. Unobservable inputs may include management's own assumptions about the factors market participants would use in pricing an investment.
The inputs or methodology used for valuing securities are not necessarily an indication of the risk associated with investing in those securities.
On January 21, 2010, the Financial Accounting Standards Board issued an Accounting Standards Update (the "amendment"), Fair Value Measurements and Disclosures (Topic 820): Improving Disclosures about Fair Value Measurements, which provides guidance on how investment assets and liabilities are to be valued and disclosed. Specifically, the amendment requires reporting entities to disclose the inputs and valuation techniques used to measure fair value for both recurring and nonrecurring fair value measurements for Level 2 and Level 3 positions. The amendment also requires that transfers between all levels (including Level 1 and Level 2) be disclosed on a gross basis (i.e., transfers out must be disclosed separately from transfers in), and requires disclosure of the reason(s) for sign ificant transfers. Additionally, purchases, sales, issuances and settlements must be disclosed on a gross basis in the Level 3 roll forward. The effective date of the amendment is for interim and annual periods beginning after December 15, 2009; except for the requirement to provide the Level 3 activity for purchases, sales, issuances and settlements on a gross basis, which will be effective for interim and annual periods beginning after December 15, 2010. At this time, management is evaluating the implications of the amendment and the impact to the financial statements.
Security Transactions
Security transactions are accounted for on the trade date. Cost is determined and gains (losses) are based upon the specific identification method for both financial statement and federal income tax purposes.
Derivative Instruments
The Fund may invest in derivative instruments. For additional information on derivative instruments, please see Note 6.
Repurchase Agreements
The Fund may engage in repurchase agreement transactions with institutions that management has determined are creditworthy. The Fund, through its custodian, receives delivery of the underlying securities collateralizing a repurchase agreement. Management is responsible for determining that the collateral is at least equal, at all times, to the value of the repurchase obligation including interest. A repurchase agreement transaction involves certain risks in the event of default or insolvency of the counterparty. These risks include possible delays in or restrictions on the Fund's ability to dispose of the underlying securities and a possible decline in the value of the underlying securities during the period while the Fund seeks to assert its rights.
Loan Participations and Commitments
The Fund may invest in loan participations. When the Fund purchases a loan participation, the Fund typically enters into a contractual relationship with the lender or third party selling such participation ("Selling Participant"), but not the borrower. However, the Fund assumes the credit risk of the borrower, Selling Participant and any other persons interpositioned between the Fund and the borrower. The Fund may not directly benefit from the collateral supporting the
28
Columbia Conservative High Yield Fund, August 31, 2010
senior loan which it has purchased from the Selling Participant.
Delayed Delivery Securities
The Fund may trade securities on other than normal settlement terms, including securities purchased or sold on a "when-issued" basis. This may increase the risk if the other party to the transaction fails to deliver and causes the Fund to subsequently invest at less advantageous prices. The Fund identifies within its portfolio of investments cash or liquid securities in an amount equal to the delayed delivery commitment.
Foreign Currency Transactions and Translations
The values of all assets and liabilities quoted in foreign currencies are translated into U.S. dollars at that day's exchange rates. Net realized and unrealized gains (losses) on foreign currency transactions and translations include gains (losses) arising from the fluctuation in exchange rates between trade and settlement dates on securities transactions, gains (losses) arising from the disposition of foreign currency and currency gains (losses) between the accrual and payment dates on dividends, interest income and foreign withholding taxes.
For financial statement purposes, the Fund does not distinguish that portion of gains (losses) on investments which is due to changes in foreign exchange rates from that which is due to changes in market prices of the investments. Such fluctuations are included with the net realized and unrealized gains (losses) on investments on the Statement of Operations.
Income Recognition
Interest income is recorded on the accrual basis. Premium and discount are amortized and accreted, respectively, on all debt securities, unless otherwise noted.
The value of additional securities received as an income payment is recorded as income and an increase to the cost basis of such securities.
Expenses
General expenses of the Trust are allocated to the Fund and other series of the Trust based upon relative net assets or other expense allocation methodologies determined by the nature of the expense. Expenses directly attributable to a specific class of shares are charged to that share class. Expenses directly attributable to the Fund are charged to the Fund.
Determination of Class Net Asset Value
All income, expenses (other than class-specific expenses, as shown on the Statement of Operations) and realized and unrealized gains (losses) are allocated to each class of the Fund on a daily basis for purposes of determining the net asset value of each class. Income and expenses are allocated to each class based on the settled shares method, while realized and unrealized gains (losses) are allocated based on the relative net assets of each class.
Federal Income Tax Status
The Fund intends to qualify each year as a "regulated investment company" under Subchapter M of the Internal Revenue Code, as amended, and will distribute substantially all of its taxable income, if any, for its tax year, and as such will not be subject to federal income taxes. In addition, the Fund intends to distribute in each calendar year substantially all of its net investment income, capital gains and certain other amounts, if any, such that the Fund should not be subject to federal excise tax. Therefore, no provision is made for federal income or excise taxes.
Distributions to Shareholders
Distributions from net investment income are declared daily and paid monthly. Net realized capital gains, if any, are distributed at least annually. Income distributions and capital gain distributions are determined in accordance with federal income tax regulations which may differ from GAAP.
Indemnification
In the normal course of business, the Fund enters into contracts that contain a variety of representations and warranties and which provide general indemnities. The Fund's maximum exposure under these arrangements is unknown because this would involve future claims against the Fund.
29
Columbia Conservative High Yield Fund, August 31, 2010
Also, under the Trust's organizational documents and by contract, the Trustees and officers of the Trust are indemnified against certain liabilities that may arise out of actions relating to their duties to the Trust. However, based on experience, the Fund expects the risk of loss due to these representations, warranties and indemnities to be minimal.
Note 3. Federal Tax Information
The timing and character of income and capital gain distributions are determined in accordance with income tax regulations, which may differ from GAAP. Reclassifications are made to the Fund's capital accounts for permanent tax differences to reflect income and gains available for distribution (or available capital loss carryforwards) under income tax regulations.
For the year ended August 31, 2010, permanent book and tax basis differences resulting primarily from 988 transactions, proceeds from litigation settlements, expiring capital loss carryforwards, paydown reclassifications, and discount accretion/premium amortization on debt securities were identified and reclassified among the components of the Fund's net assets as follows:
Accumulated
Net Investment
Loss | | Accumulated
Net Realized
Loss | | Paid-In Capital | |
| $ | 991,353 | | | $ | 8,552,745 | | | $ | (9,544,098 | ) | |
Net investment income and net realized gains (losses), as disclosed on the Statement of Operations, and net assets were not affected by this reclassification.
The tax character of distributions paid during the years ended August 31, 2010 and August 31, 2009 was as follows:
| | | August 31, | |
| | | 2010 | | 2009 | |
| Ordinary Income* | | $ | 44,704,745 | | | $ | 38,792,318 | | |
| Long-Term Capital Gains | | | — | | | | — | | |
* For tax purposes short-term capital gain distributions, if any, are considered ordinary income distributions.
As of August 31, 2010, the components of distributable earnings on a tax basis were as follows:
Undistributed
Ordinary
Income | | Undistributed
Long-Term
Capital Gains | | Net Unrealized
Appreciation* | |
| $ | 1,560,824 | | | $ | — | | | $ | 32,574,649 | | |
* The differences between book-basis and tax-basis net unrealized appreciation are primarily due to deferral of losses from wash sales.
Unrealized appreciation and depreciation at August 31, 2010, based on cost of investments for federal income tax purposes were:
| Unrealized appreciation | | $ | 35,745,937 | | |
| Unrealized depreciation | | | (3,171,288 | ) | |
| Net unrealized appreciation | | $ | 32,574,649 | | |
The following capital loss carryforwards may be available to reduce taxable income arising from future net realized gains on investments, if any, to the extent permitted by the Internal Revenue Code:
| Year of Expiration | | Capital Loss
Carryforwards | |
| 2014 | | $ | 975,147 | | |
| 2015 | | | 22,859,341 | | |
| 2016 | | | 5,603,050 | | |
| 2017 | | | 40,533,191 | | |
| 2018 | | | 52,301,824 | | |
| Total | | $ | 122,272,553 | | |
Capital loss carryforwards of $9,535,110 expired during the year ended August 31, 2010.
Management is required to determine whether a tax position of the Fund is more likely than not to be sustained upon examination by the applicable taxing authority, including resolution of any related appeals or litigation processes, based on the technical merits of the position. The tax benefit to be recognized by the Fund is measured as the largest amount of benefit that is greater than fifty percent likely of being realized upon ultimate settlement. Management is not aware of any tax
30
Columbia Conservative High Yield Fund, August 31, 2010
positions for which it is reasonably possible that the total amounts of unrecognized tax benefits will significantly change in the next twelve months. However, management's conclusions may be subject to review and adjustment at a later date based on factors including, but not limited to, new tax laws, regulations, and administrative interpretations (including relevant court decisions). The Fund's federal tax returns for the prior three fiscal years remain subject to examination by the Internal Revenue Service.
Note 4. Fees and Compensation Paid to Affiliates
Investment Advisory Fee
After the close of business on April 30, 2010, Ameriprise Financial, Inc. ("Ameriprise Financial") acquired a portion of the asset management business of Columbia Management Group, LLC (the "Transaction"), including the business of managing the Fund. In connection with the closing of the Transaction (the "Closing"), RiverSource Investments, LLC, a wholly owned subsidiary of Ameriprise Financial, became the investment advisor of the Fund and subsequently changed its name to Columbia Management Investment Advisers, LLC (the "New Advisor"). The New Advisor receives a monthly investment advisory fee based on the Fund's average daily net assets at the following annual rates:
| Average Daily Net Assets | | Annual Fee Rate | |
| First $500 million | | | 0.60 | % | |
| $500 million to $1 billion | | | 0.55 | % | |
| $1 billion to $1.5 billion | | | 0.52 | % | |
| Over $1.5 billion | | | 0.49 | % | |
Prior to the Closing, Columbia Management Advisors, LLC ("Columbia"), an indirect, wholly owned subsidiary of Bank of America Corporation ("BOA"), provided investment advisory, administrative and other services to the Fund under the same fee structure.
For the year ended August 31, 2010, the Fund's effective investment advisory fee rate was 0.59% of the Fund's average daily net assets.
Administration Fee
Effective upon the Closing, the New Advisor became the administrator of the Fund under a new Administrative Services Agreement (the "Administrative Agreement"). Under the Administrative Agreement, the New Advisor provides administrative and other services to the Fund, including services previously performed under the Pricing and Bookkeeping Oversight and Services Agreement discussed below. The New Advisor does not receive a fee for its services under the Administrative Agreement. Prior to the Closing, Columbia provided administrative services to the Fund as discussed in the Investment Advisory Fee note above.
Pricing and Bookkeeping Fees
Prior to the Closing, the Fund entered into a Financial Reporting Services Agreement (the "Financial Reporting Services Agreement") with State Street Bank and Trust Company ("State Street") and Columbia pursuant to which State Street provides financial reporting services to the Fund. The Fund also entered into an Accounting Services Agreement (collectively with the Financial Reporting Services Agreement, the "State Street Agreements") with State Street and Columbia pursuant to which State Street provides accounting services to the Fund. Upon the Closing, Columbia assigned and delegated its rights and obligations under the State Street Agreements to the New Advisor. Under the State Street Agreements, the Fund pays State Street an annual fee of $38,000 paid monthly plus an additional monthly fee based on an annualized percentage rate of average daily net assets of the Fund for the month. The aggregate fee will not exceed $140,000 per year (exclusive of out-of-pocket expenses and charges). The Fund also reimburses State Street for certain out-of-pocket expenses and charges.
Also, prior to the Closing, the Fund entered into a Pricing and Bookkeeping Oversight and Services Agreement (the "Services Agreement") with Columbia. Under the Services Agreement, Columbia provided services related to Fund expenses and the requirements of the Sarbanes-Oxley Act of 2002, and provided oversight of the accounting and financial reporting services provided by State Street. Under the Services Agreement, the Fund reimbursed Columbia for out-of-pocket expenses. The Services Agreement was terminated upon the Closing. These services are now provided under the Administrative Agreement discussed above.
31
Columbia Conservative High Yield Fund, August 31, 2010
Transfer Agent Fee
In connection with the Closing, RiverSource Service Corporation, a wholly owned subsidiary of Ameriprise Financial, became the transfer agent of the Fund and subsequently changed its name to Columbia Management Investment Services Corp. (the "New Transfer Agent"). The New Transfer Agent has contracted with Boston Financial Data Services ("BFDS") to serve as sub-transfer agent.
The New Transfer Agent receives a monthly fee for its services. All share classes, with the exception of Class Y shares (the "Other Share Classes") pay a monthly service fee (the "aggregate fee") based on the following:
(i) An annual rate of $22.36 is applied to the aggregate number of accounts for the Other Share Classes.
(ii) An allocated portion of fees for wire, telephone and redemption orders, Individual Retirement Account ("IRA") trustee agent fees and account transcript fees due to the New Transfer Agent from shareholders of the Fund and credits (net of bank charges) earned with respect to balances in accounts the New Transfer Agent maintains in connection with its services to the Fund. The New Transfer Agent also receives reimbursement for certain out-of-pocket expenses.
The aggregate fee is allocated to the Other Share Classes based on the relative average daily net assets of each share class.
Class Y shares of the Fund pay a monthly service fee based on the following:
(i) An annual rate of $22.36 is applied to the aggregate number of accounts for Class Y shares.
(ii) An allocated portion of fees for wire, telephone and redemption orders, IRA trustee agent fees and account transcript fees due to the New Transfer Agent from shareholders of the Fund and credits (net of bank charges) earned with respect to balances in accounts the New Transfer Agent maintains in connection with its services to the Fund. The New Transfer Agent also receives reimbursement for certain out-of-pocket expenses.
The New Transfer Agent also receives reimbursement of certain sub-transfer agent fees paid by the New Transfer Agent (exclusive of BFDS fees), calculated based on the combined assets held in the Other Share Classes in omnibus accounts and intended to recover the cost of payments to other parties (including affiliates of BOA) for services to those accounts. Such fees are allocated to the Other Share Classes based on the relative average daily net assets of each share class. The New Transfer Agent pays the fees of BFDS for services as sub-transfer agent and is not entitled to reimbursement for such fees from the Fund.
Prior to the Closing, Columbia Management Services, Inc. (the "Previous Transfer Agent"), an affiliate of Columbia and an indirect, wholly owned subsidiary of BOA, provided shareholder services to the Fund and contracted with BFDS to serve as sub-transfer agent, under the same fee structure. Prior to November 1, 2009, the annual rate was $17.34 per account.
An annual minimum account balance fee of $20 may apply to certain accounts with a value below the Fund's initial minimum investment requirements to reduce the impact of small accounts on transfer agent fees. These minimum account balance fees are recorded as part of expense reductions on the Statement of Operations. For the year ended August 31, 2010, no minimum account balance fees were charged by the Fund.
Underwriting Discounts, Service and Distribution Fees
In connection with the Closing, RiverSource Fund Distributors, Inc., an indirect wholly owned subsidiary of Ameriprise Financial, became the distributor of the Fund and subsequently changed its name to Columbia Management Investment Distributors, Inc. (the "New Distributor").
For the year ended August 31, 2010, initial sales charges paid by shareholders on the purchase of Class A shares amounted to $10,688 and net CDSC fees paid by shareholders on certain redemptions of Class A, Class B and Class C shares amounted to $-, $11,673 and $6,984, respectively.
The Fund has adopted shareholder servicing and distribution plans pursuant to Rule 12b-1 under the 1940 Act (the "Plans") which require the payment of a monthly service fee to the New Distributor at the maximum annual rate of 0.25% of the average daily net assets attributable to Class A, Class B and Class C shares of the Fund. The Plans also require the payment of a monthly distribution fee to the New Distributor at the maximum annual rates of 0.10%, 0.75% and 0.75% of the average daily net assets attributable to Class A, Class B and Class C shares, respectively.
32
Columbia Conservative High Yield Fund, August 31, 2010
The Fund may pay distribution and service fees up to a maximum annual rate of 0.35% of the Fund's average daily net assets attributable to Class A shares (comprised of up to 0.10% for distribution services and up to 0.25% for shareholder liaison services), but currently limit such fees to an aggregate fee of not more than 0.25% of the Fund's average daily net assets attributable to Class A shares.
The New Distributor has voluntarily agreed to waive a portion of the distribution and service fees for Class C shares so that the combined distribution and service fees do not exceed the annual rate of 0.85% of the average daily net assets of the Class C shares of the Fund. This arrangement may be modified or terminated by the New Distributor at any time.
The CDSC and the distribution fees received from the Plans are used principally as repayment to the New Distributor for amounts paid by the New Distributor to dealers who sold such shares.
Prior to the Closing, Columbia Management Distributors, Inc., an affiliate of Columbia and an indirect, wholly owned subsidiary of BOA, was the principal underwriter of the Fund's shares. There were no changes to the underwriting discount structure of the Fund or the service or distribution fee rates paid by the Fund as a result of the Transaction.
Expense Limits and Fee Waivers
Effective May 1, 2010, the New Advisor has voluntarily agreed to reimburse a portion of the Fund's expenses so that the Fund's ordinary operating expenses (excluding any distribution and service fees, brokerage commissions, interest, taxes and extraordinary expenses, but including custodian charges relating to overdrafts, if any), after giving effect to any balance credits from the Fund's custodian, do not exceed 0.80% of the Fund's average daily net assets on an annualized basis. This arrangement may be modified or terminated by the New Advisor at any time.
Prior to May 1, 2010, Columbia voluntarily agreed to reimburse a portion of the Fund's expenses so that the Fund's ordinary operating expenses (excluding any distribution and service fees, brokerage commissions, interest, taxes and extraordinary expenses, but including custodian charges relating to overdrafts, if any) after giving effect to any balance credits from the Fund's custodian, did not exceed 0.80% of the Fund's average daily net assets on an annualized basis.
Fees Paid to Officers and Trustees
In connection with the Closing, all officers of the Fund are employees of the New Advisor or its affiliates and, with the exception of the Fund's Chief Compliance Officer, receive no compensation from the Fund. The Board of Trustees has appointed a Chief Compliance Officer to the Fund in accordance with federal securities regulations. The Fund, along with other affiliated funds, pays its pro-rata share of the expenses associated with the Chief Compliance Officer. The Fund's expenses for the Chief Compliance Officer will not exceed $15,000 per year. Prior to the Closing, the Fund paid its pro-rata share of the expenses for the Chief Compliance Officer under the same fee structure.
Trustees are compensated for their services to the Fund, as set forth on the Statement of Operations. The Trust's eligible Trustees may participate in a deferred compensation plan which may be terminated at any time. Obligations of the plan will be paid solely out of the Fund's assets.
Note 5. Custody Credits
The Fund has an agreement with its custodian bank under which custody fees may be reduced by balance credits. These credits are recorded as part of expense reductions on the Statement of Operations. The Fund could have invested a portion of the assets utilized in connection with the expense offset arrangement in an income-producing asset if it had not entered into such an agreement. For the year ended August 31, 2010, these custody credits reduced total expenses by $186 for the Fund.
Note 6. Objectives and Strategies for Investing in Derivative Instruments
The Fund uses derivatives instruments including forward contracts in order to meet its investment objectives. The Fund employs strategies in differing combinations to permit it to increase, decrease or change the level of exposure to market risk factors. The achievement of any strategy relating to derivatives depends on an analysis of various risk factors, and if the strategies for the use of derivatives do not work as intended, the Fund may not achieve its investment objectives.
In pursuit of its investment objectives, the Fund is exposed to the following market risks:
Foreign exchange rate risk: Foreign exchange rate risk relates to the change in the U.S. dollar value of a security held
33
Columbia Conservative High Yield Fund, August 31, 2010
that is denominated in a foreign currency. The U.S. dollar value of a foreign-currency-denominated security will decrease as the dollar appreciates against the currency, while the U.S. dollar value will increase as the dollar depreciates against the currency.
The following notes provide more detailed information about the derivative type held by the Fund:
Forward Foreign Currency Exchange Contracts—The Fund entered into forward foreign currency exchange contracts to shift its investment exposure from one currency to another. Forward foreign currency exchange contracts are agreements to exchange one currency for another at a future date at a specified price. These contracts are used to minimize the exposure to foreign exchange rate fluctuations during the period between the trade and settlement dates of the contract. The Fund may utilize forward foreign currency exchange contracts in connection with the settlement of purchases and sales of securities. The Fund may also enter into these contracts to reduce the exposure to adverse price movements in certain other foreign-currency-denominated assets. Contracts to buy generally are used to acquire exposure to foreign currencies, while contracts to sell are generally used to reduce the exposure to foreign exchange rate fluctuations. Forward foreign currency exchange contracts are valued daily at the current exchange rate of the underlying currency, resulting in unrealized gains (losses) which become realized at the time the forward foreign currency exchange contracts are closed or mature. Realized and unrealized gains (losses) arising from such transactions are included in net realized and unrealized gains (losses) on foreign currency transactions. The use of forward foreign currency exchange contracts does not eliminate fluctuations in the prices of the Fund's portfolio securities. While the maximum potential loss from such contracts is the aggregate face value in U.S. dollars at the time the contract was opened, exposure is typically limited to the change in value of the contract (in U.S. dollars) over the period it remains open. The Fund could also be exposed to risk that counterparties of the contracts may be unable to fulfill the terms of the contract s.
During the year ended August 31, 2010, the Fund entered into 41 forward foreign currency exchange contracts.
The effect of derivative instruments on the Statement of Operations for the year ended August 31, 2010:
| | | Amount of Realized Gain or (Loss)
and Change in Unrealized Appreciation or
(Depreciation) on Derivatives Recognized in Income | |
| | | Risk Exposure | | Net Realized
Gain (Loss) | | Change in
Unrealized
Appreciation
(Depreciation) | |
| Forward foreign currency exchange contracts | | Foreign Exchange Rate | | $ | 350,865 | | | $ | (39,255 | ) | |
Note 7. Portfolio Information
For the year ended August 31, 2010, the cost of purchases and proceeds from sales of securities, excluding short-term obligations, for the Fund were $371,218,802 and $438,367,703, respectively.
Note 8. Regulatory Settlements
During the years ended August 31, 2010 and August 31, 2009, the Fund received payments totaling $8,989 and $97,269, respectively, relating to certain regulatory settlements with third parties that the Fund had participated in during the respective periods. The payments have been included in "Increase from regulatory settlements" on the Statement of Changes in Net Assets.
Note 9. Line of Credit
The Fund and other affiliated funds participate in a $280,000,000 committed, unsecured revolving line of credit provided by State Street. The maximum amount that may be borrowed by any fund is limited to the lesser of $200,000,000 and the Columbia Conservative High Yield Fund's borrowing limit set forth in the Fund's registration statement. Borrowings are available for short-term liquidity or temporary or emergency purposes.
34
Columbia Conservative High Yield Fund, August 31, 2010
Effective October 15, 2009, interest is charged to each participating fund based on the fund's borrowings at a rate per annum equal to the greater of the Federal Funds Rate plus 1.25% or the overnight LIBOR Rate plus 1.25%. In addition, a commitment fee of 0.15% per annum is accrued and apportioned among the participating funds pro rata based on their relative net assets.
Prior to October 15, 2009, interest was charged to each participating fund based on the fund's borrowings at a rate per annum equal to the greater of the Federal Funds Rate plus 0.50% or the overnight LIBOR Rate plus 0.50%. In addition, an annual operations agency fee of $20,000, an amendment fee of 0.02% and a commitment fee of 0.12% per annum were accrued and apportioned among the participating funds pro rata based on their relative net assets.
For the year ended August 31, 2010, the Fund did not borrow under these arrangements.
Note 10. Shareholder Concentration
As of August 31, 2010, one shareholder account owned 35.0% of the outstanding shares of the Fund. Purchase and redemption activity of this account may have a significant effect on the operations of the Fund.
Note 11. Significant Risks and Contingencies
High-Yield Securities Risk
Investing in high-yield securities may involve greater credit risk and considerations not typically associated with investing in U.S. Government bonds and other higher quality fixed income securities. These securities are non-investment-grade securities, often referred to as "junk" bonds. Economic downturns may disrupt the high-yield market and impair the ability of issuers to repay principal and interest. Also, an increase in interest rates would likely have an adverse impact on the value of such obligations. Moreover, high-yield securities may be less liquid to the extent that there is no established secondary market.
Information Regarding Pending and Settled Legal Proceedings
In June 2004, an action captioned John E. Gallus et al. v. American Express Financial Corp. and American Express Financial Advisors Inc. was filed in the United States District Court for the District of Arizona. The plaintiffs allege that they are investors in several American Express Company (now known as legacy RiverSource) mutual funds and they purport to bring the action derivatively on behalf of those funds under the Investment Company Act of 1940. The plaintiffs allege that fees allegedly paid to the defendants by the funds for investment advisory and administrative services are excessive. The plaintiffs seek remedies including restitution and rescission of investment advisory and distribution agreements. The plaintiffs voluntarily agreed to transfer this case to the United States District Court for the District of Minnesota (the District Court). In response to defendants' motion to dismiss the complaint, the District Court dismissed one of plaintiffs' four claims and granted plaintiffs limited discovery. Defendants moved for summary judgment in April 2007. Summary judgment was granted in the defendants' favor on July 9, 2007. The plaintiffs filed a notice of appeal with the Eighth Circuit Court of Appeals (the Eighth Circuit) on August 8, 2007. On April 8, 2009, the Eighth Circuit reversed summary judgment and remanded to the District Court for further proceedings. On August 6, 2009, defendants filed a writ of certiorari with the U.S. Supreme Court (the Supreme Court), asking the Supreme Court to stay the District Court proceedings while the Supreme Court considers and rules in a case captioned Jones v. Harris Associates, which involves issues of law similar to those presented in the Gallus case. On March 30, 2010, the Supreme Court issued its ruling in Jones v. Harris Associates, and on April 5, 2010, the Supreme Court vacated the Eighth Circuit's decision in the Gallus case and remanded the case to the Eighth Circuit for further consideration in light of the Supreme Court's decision in Jones v. Harris Associates. On June 4, 2010, the Eighth Circuit remanded the Gallus case to the District Court for further consideration in light of the Supreme Court's decision in Jones v. Harris Associates.
In December 2005, without admitting or denying the allegations, American Express Financial Corporation (AEFC, which is now known as Ameriprise Financial, Inc. (Ameriprise Financial)), entered into settlement agreements with the Securities and Exchange Commission (SEC) and Minnesota Department of Commerce (MDOC) related to market timing activities. As a result, AEFC was censured and ordered to cease and desist from committing or causing any violations of certain provisions of the Investment Advisers Act of 1940, the Investment Company Act of 1940, and various Minnesota laws. AEFC agreed to pay disgorgement of $10 million and civil
35
Columbia Conservative High Yield Fund, August 31, 2010
money penalties of $7 million. AEFC also agreed to retain an independent distribution consultant to assist in developing a plan for distribution of all disgorgement and civil penalties ordered by the SEC in accordance with various undertakings detailed at http://www.sec.gov/litigation/admin/ia-2451.pdf. Ameriprise Financial and its affiliates have cooperated with the SEC and the MDOC in these legal proceedings, and have made regular reports to the funds' Boards of Directors/Trustees.
Ameriprise Financial and certain of its affiliates have historically been involved in a number of legal, arbitration and regulatory proceedings, including routine litigation, class actions, and governmental actions, concerning matters arising in connection with the conduct of their business activities. Ameriprise Financial believes that the Funds are not currently the subject of, and that neither Ameriprise Financial nor any of its affiliates are the subject of, any pending legal, arbitration or regulatory proceedings that are likely to have a material adverse effect on the Funds or the ability of Ameriprise Financial or its affiliates to perform under their contracts with the Funds. Ameriprise Financial is required to make 10-Q, 10-K and, as necessary, 8-K filings with the Securities and Exchange Commission on legal and regulatory matters that relate to Ameriprise Financial and its affiliates. Copies of these filings may be obt ained by accessing the SEC website at www.sec.gov.
There can be no assurance that these matters, or the adverse publicity associated with them, will not result in increased fund redemptions, reduced sale of fund shares or other adverse consequences to the Funds. Further, although we believe proceedings are not likely to have a material adverse effect on the Funds or the ability of Ameriprise Financial or its affiliates to perform under their contracts with the Funds, these proceedings are subject to uncertainties and, as such, we are unable to estimate the possible loss or range of loss that may result. An adverse outcome in one or more of these proceedings could result in adverse judgments, settlements, fines, penalties or other relief that could have a material adverse effect on the consolidated financial condition or results of operations of Ameriprise Financial.
Note 12. Subsequent Event
The Board of Trustees has approved in principle the proposed merger of the Fund into Columbia Income Opportunities Fund (formerly known as RiverSource Income Opportunities Fund). Shareholders will vote on the proposal at a Special Meeting of Shareholders scheduled to be held during the first half of 2011.
36
Report of Independent Registered Public Accounting Firm
To the Trustees of Columbia Funds Series Trust I and Shareholders of Columbia Conservative High Yield Fund
In our opinion, the accompanying statement of assets and liabilities, including the investment portfolio, and the related statements of operations and of changes in net assets and the financial highlights present fairly, in all material respects, the financial position of Columbia Conservative High Yield Fund (the "Fund") (a series of Columbia Funds Series Trust I) at August 31, 2010, the results of its operations for the year then ended, the changes in its net assets for each of the two years in the period then ended, and the financial highlights for each of the five years in the period then ended, in conformity with accounting principles generally accepted in the United States of America. These financial statements and financial highlights (hereafter referred to as "financial statements") are the responsibility of the Fund's management. Our responsibility is to express an opinion on these financial statements based on our audi ts. We conducted our audits of these financial statements in accordance with the standards of the Public Company Accounting Oversight Board (United States). Those standards require that we plan and perform the audit to obtain reasonable assurance about whether the financial statements are free of material misstatement. An audit includes examining, on a test basis, evidence supporting the amounts and disclosures in the financial statements, assessing the accounting principles used and significant estimates made by management, and evaluating the overall financial statement presentation. We believe that our audits, which included confirmation of securities at August 31, 2010 by correspondence with the custodian and brokers, provide a reasonable basis for our opinion.
PricewaterhouseCoopers LLP
Boston, Massachusetts
October 25, 2010
37
Fund Governance
The Trustees serve terms of indefinite duration. The names, addresses and birth years of the Trustees and Officers of the Funds in the Columbia Funds Series Trust I, the year each was first elected or appointed to office, their principal business occupations during at least the last five years, the number of Funds overseen by each Trustee and other directorships they hold are shown below. Each officer listed below serves as an officer of each Fund in the Columbia Funds Complex.
Independent Trustees
Name, Address and Year of Birth,
Position with Funds, Year First
Elected or Appointed to Office | | Principal Occupation(s) During Past Five Years, Number of Funds in Columbia
Funds Complex Overseen by Trustee, Other Directorships Held
| |
| John D. Collins (Born 1938) | |
|
c/o Columbia Management
Investment Advisers, LLC
One Financial Center
Boston, MA 02111
Trustee (since 2005) | | Retired. Consultant, KPMG, LLP (accounting and tax firm) from July 1999 to June 2000; Partner, KPMG, LLP from March 1962 to June 1999. Oversees 64; Mrs. Fields Original Cookies, Inc. (consumer products); Suburban Propane Partners, L.P.; and Montpelier Re (insurance underwriting firm) | |
|
| Rodman L. Drake (Born 1943) | |
|
c/o Columbia Management
Investment Advisers, LLC
One Financial Center
Boston, MA 02111
Trustee (since 1994) and Chairman of the Board (since 2009) | | Co-Founder of Baringo Capital LLC (private equity) since 2002; CEO of Crystal River Capital, Inc. (real estate investment trust) since 2003; President, Continuation Investments Group, Inc. from 1997 to 2001. Oversees 64; Jackson Hewitt Tax Service Inc. (tax preparation services); Crystal Capital River, Inc. (real estate investment trust); Student Loan Corporation (student loan provider); Celgene Corporation (global biotechnology company); The Helios Funds (exchange-traded funds); and Apex Silver Mines Ltd. from 2007 to 2009 | |
|
| Douglas A. Hacker (Born 1955) | |
|
c/o Columbia Management
Investment Advisers, LLC
One Financial Center
Boston, MA 02111
Trustee (since 1996) | | Independent business executive since May 2006; Executive Vice President—Strategy of United Airlines (airline) from December 2002 to May 2006; President of UAL Loyalty Services (airline marketing company) from September 2001 to December 2002; Executive Vice President and Chief Financial Officer of United Airlines from July 1999 to September 2001. Oversees 64; Nash Finch Company (food distributor); Aircastle Limited (aircraft leasing) | |
|
| Janet Langford Kelly (Born 1957) | |
|
c/o Columbia Management
Investment Advisers, LLC
One Financial Center
Boston, MA 02111
Trustee (since 1996) | | Senior Vice President, General Counsel and Corporate Secretary, ConocoPhillips (integrated energy company) since September 2007; Deputy General Counsel—Corporate Legal Services, ConocoPhillips from August 2006 to August 2007; Partner, Zelle, Hofmann, Voelbel, Mason & Gette LLP (law firm) from March 2005 to July 2006; Adjunct Professor of Law, Northwestern University, from September 2004 to June 2006; Director, UAL Corporation (airline) from February 2006 to July 2006; Oversees 64; None | |
|
| Charles R. Nelson (Born 1942) | |
|
c/o Columbia Management
Investment Advisers, LLC
One Financial Center
Boston, MA 02111
Trustee (since 1981) | | Professor of Economics, University of Washington, since January 1976; Ford and Louisa Van Voorhis Professor of Political Economy, University of Washington, since September 1993; Adjunct Professor of Statistics, University of Washington, since September 1980; Associate Editor, Journal of Money Credit and Banking, 1993-2008; Consultant on econometric and statistical matters. Oversees 64; None | |
|
38
Fund Governance (continued)
Independent Trustees (continued)
Name, Address and Year of Birth,
Position with Funds, Year First
Elected or Appointed to Office | | Principal Occupation(s) During Past Five Years, Number of Funds in Columbia
Funds Complex Overseen by Trustee, Other Directorships Held
| |
| John J. Neuhauser (Born 1943) | |
|
c/o Columbia Management
Investment Advisers, LLC
One Financial Center
Boston, MA 02111
Trustee (since 1984) | | President, Saint Michael's College, since August 2007; Director or Trustee of several non-profit organizations, including Fletcher Allen Health Care, Inc.; University Professor, Boston College from November 2005 to August 2007; Academic Vice President and Dean of Faculties, Boston College from August 1999 to October 2005. Oversees 64; Liberty All-Star Equity Fund and Liberty All-Star Growth Fund, Inc. (closed-end funds) | |
|
| Jonathan Piel (Born 1938) | |
|
c/o Columbia Management
Investment Advisers, LLC
One Financial Center
Boston, MA 02111
Trustee (since 1994) | | Cable television producer and website designer; The Editor, Scientific American from 1984 to 1994; Vice President, Scientific American, Inc., from 1984 to 1994; Member, Advisory Board, Stone Age Institute, Bloomington, Indiana (research institute that explores the effect of technology on human evolution); Member, Board of Directors of the National Institute of Social Sciences, New York City; Member, Board of Trustees of the William Alanson White Institute, New York City (institution for training psychoanalysts); and Member, Advisory Board, Mount Sinai Children's Environmental Health Center, New York. Oversees 64; None | |
|
| Patrick J. Simpson (Born 1944) | |
|
c/o Columbia Management
Investment Advisers, LLC
One Financial Center
Boston, MA 02111
Trustee (since 2000) | | Partner, Perkins Coie LLP (law firm). Oversees 64; None | |
|
| Anne-Lee Verville (Born 1945) | |
|
c/o Columbia Management
Investment Advisers, LLC
One Financial Center
Boston, MA 02111
Trustee (since 1998) | | Retired since 1997 (formerly General Manager–Global Education Industry from 1994 to 1997, President–Application Systems Division from 1991 to 1994, Chief Financial Officer–US Marketing & Services from 1988 to 1991, and Chief Information Officer from 1987 to 1988, IBM Corporation (computer and technology)). Oversees 64; Enesco Group, Inc. (producer of giftware and home and garden decor products) from 2001 to 2006 | |
|
39
Fund Governance (continued)
Interested Trustee
Name, Address and Year of Birth,
Position with Funds, Year First
Elected or Appointed to Office | | Principal Occupation(s) During Past Five Years, Number of Funds in Columbia
Funds Complex Overseen by Trustee, Other Directorships Held
| |
| William E. Mayer1 (Born 1940) | |
|
c/o Columbia Management
Investment Advisers, LLC
One Financial Center
Boston, MA 02111
Trustee (since 1994) | | Partner, Park Avenue Equity Partners (private equity) since February 1999; Dean and Professor, College of Business and Management, University of Maryland from 1992 to 1996. Oversees 64; DynaVox Inc. (software developer); Lee Enterprises (print media); WR Hambrecht + Co. (financial service provider); BlackRock Kelso Capital Corporation (investment company) | |
|
1 Mr. Mayer may technically be an "interested person" (as defined in the Investment Company Act of 1940) by reason of his affiliation with WR Hambrecht + Co., a registered broker/dealer that may execute portfolio transactions for, engage in principal transactions with or distribute shares of a Fund or other funds or accounts advised/managed by the Adviser or any sub-adviser to a Fund.
The Statement of Additional Information includes additional information about the Trustees of the Funds and is available, without charge, upon request by calling 1-800-345-6611.
Officers
| Name, Year of Birth and Address | | Principal Occupation(s) During the Past Five Years | |
| J. Kevin Connaughton (Born 1964) | |
|
One Financial Center
Boston, MA 02111
President (since 2009) | | Senior Vice President and General Manager–Mutual Fund Products, Columbia Management Investment Advisers, LLC since May 2010; President, Columbia Funds, since 2009, and RiverSource Funds, since May 2010 (previously Senior Vice President and Chief Financial Officer, Columbia Funds, from June 2008 to January 2009, Treasurer, Columbia Funds, from October 2003 to May 2008, and senior officer of various other affiliated funds since 2000); Managing Director, Columbia Management Advisors, LLC from December 2004 to April 2010. | |
|
| Michael G. Clarke (Born 1969) | |
|
One Financial Center
Boston, MA 02111
Senior Vice President and Chief
Financial Officer (since 2009) | | Vice President, Columbia Management Investment Advisers, LLC since May 2010; Managing Director of Fund Administration, Columbia Management Advisors, LLC, from September 2004 to April 2010; senior officer of Columbia Funds and affiliated funds since 2002. | |
|
| Scott R. Plummer (Born 1959) | |
|
5228 Ameriprise Financial Center
Minneapolis, MN 55474
Senior Vice President, Secretary
and Chief Legal Officer (since 2010) | | Chief Legal Officer and Assistant Secretary, Columbia Management Investment Advisers, LLC since June 2005; Vice President and Lead Chief Counsel–Asset Management, Ameriprise Financial, Inc. since May 2010 (previously Vice President and Chief Counsel–Asset Management, from 2005 to April 2010, and Vice President–Asset Management Compliance from 2004 to 2005); Vice President, Chief Counsel and Assistant Secretary, Columbia Management Investment Distributors, Inc. since 2008; Vice President, General Counsel and Secretary, Ameriprise Certificate Company since 2005; Chief Counsel, RiverSource Distributors, Inc. since 2006; Vice President, General Counsel and Secretary, RiverSource Funds, since December 2006; Senior Vice President, Secretary and Chief Legal Officer, Columbia Funds, since May 2010. | |
|
40
Fund Governance (continued)
Officers (continued)
| Name, Year of Birth and Address | | Principal Occupation(s) During the Past Five Years | |
| Linda J. Wondrack (Born 1964) | |
|
One Financial Center
Boston, MA 02111
Senior Vice President and Chief
Compliance Officer (since 2007) | | Vice President and Chief Compliance Officer, Columbia Management Investment Advisers, LLC since May 2010; Chief Compliance Officer, Columbia Funds, since 2007, and RiverSource Funds, since May 2010; Director (Columbia Management Group, LLC and Investment Product Group Compliance), Bank of America, from June 2005 to April 2010; Director of Corporate Compliance and Conflicts Officer of MFS Investment Management (investment management) from August 2004 to May 2005. | |
|
| William F. Truscott (Born 1960) | |
|
53600 Ameriprise Financial Center
Minneapolis, MN 55474
Senior Vice President (since 2010) | | Chairman of the Board, Columbia Management Investment Advisers, LLC since May 2010 (previously President, Chairman of the Board and Chief Investment Officer, from 2001 to April 2010); Chief Executive Officer, U.S. Asset Management & President, Annuities, Ameriprise Financial, Inc. since May 2010 (previously President–U.S. Asset Management and Chief Investment Officer from 2005 to April 2010, and Senior Vice President—Chief Investment Officer, from 2001 to 2005); Director, President and Chief Executive Officer, Ameriprise Certificate Company since 2006; Director, Columbia Management Investment Distributors, Inc. since May 2010 (previously Chairman of the Board and Chief Executive Officer from 2008 to April 2010); Chairman of the Board and Chief Executive Officer, RiverSource Distributors, Inc. since 2006. | |
|
| Colin Moore (Born 1958) | |
|
One Financial Center
Boston, MA 02111
Senior Vice President (since 2010) | | Director and Chief Investment Officer, Columbia Management Investment Advisers, LLC since May 2010; Manager, Managing Director and Chief Investment Officer of Columbia Management Advisors, LLC from 2007 to April 2010; Head of Equities, Columbia Management Advisors, LLC from 2002 to 2007. | |
|
| Michael A. Jones (Born 1959) | |
|
100 Federal Street
Boston, MA 02110
Senior Vice President (since 2010) | | Director and President, Columbia Management Investment Advisers, LLC since May 2010; President and Director, Columbia Management Investment Distributors, Inc. since May 2010; Manager, Chairman, Chief Executive Officer and President, Columbia Management Advisors, LLC from 2007 to April 2010; Chief Executive Officer, President and Director, Columbia Management Distributors, Inc. from November 2006 to April 2010; previously, co-president and senior managing director at Robeco Investment Management. | |
|
| Amy Johnson (Born 1965) | |
|
5228 Ameriprise Financial Center
Minneapolis, MN 55474
Senior Vice President (since 2010) | | Senior Vice President and Chief Operating Officer, Columbia Management Investment Advisers, LLC since May 2010 (previously Chief Administrative Officer, from 2009 until April 2010, Vice President—Asset Management and Trust Company Services, from 2006 to 2009, and Vice President—Operations and Compliance from 2004 to 2006). | |
|
| Joseph F. DiMaria (Born 1968) | |
|
One Financial Center
Boston, MA 02111
Treasurer (since 2009) and
Chief Accounting Officer (since 2008) | | Vice President, Mutual Fund Administration, Columbia Management Investment Advisers, LLC, since May 2010; Director of Fund Administration, Columbia Management Advisors, LLC from January 2006 to April 2010; Head of Tax/Compliance and Assistant Treasurer, Columbia Management Advisors, LLC, from November 2004 to December 2005. | |
|
41
Fund Governance (continued)
Officers (continued)
| Name, Year of Birth and Address | | Principal Occupation(s) During the Past Five Years | |
| Marybeth Pilat (Born 1968) | |
|
One Financial Center
Boston, MA 02111
Deputy Treasurer (since 2010) | | Vice President, Mutual Fund Administration, Columbia Management Investment Advisers, LLC, since May 2010; Vice President, Investment Operations, Bank of America, from October 2008 to April 2010; Finance Manager, Boston Children's Hospital from August 2008 to October 2008; Director, Mutual Fund Administration, Columbia Management Advisors, LLC, from May 2007 to July 2008; Vice President, Mutual Fund Valuation, Columbia Management Advisors, LLC, from January 2006 to May 2007; Vice President, Mutual Fund Accounting Oversight, Columbia Management Advisors, LLC from January 2005 to January 2006. | |
|
| Julian Quero (Born 1967) | |
|
One Financial Center
Boston, MA 02111
Deputy Treasurer (since 2008) | | Vice President, Mutual Fund Administration, Columbia Management Investment Advisers, LLC since May 2010; Director of Fund Administration, Columbia Management Advisors, LLC, from August 2008 to April 2010; Senior Tax Manager, Columbia Management Advisors, LLC from August 2006 to July 2008; Senior Compliance Manager, Columbia Management Advisors, LLC from April 2002 to August 2006. | |
|
| Stephen T. Welsh (Born 1957) | |
|
One Financial Center
Boston, MA 02111
Vice President (since 2006) | | President and Director, Columbia Management Investment Services Corp. since May 2010; President and Director, Columbia Management Services, Inc. from July 2004 to April 2010; Managing Director, Columbia Management Distributors, Inc. from August 2007 to April 2010. | |
|
42
Summary of Management Fee Evaluation by Independent Fee Consultant (RiverSource Investments, LLC)
EXCERPT FROM REPORT OF INDEPENDENT FEE CONSULTANT TO THE FUNDS SUPERVISED BY THE COLUMBIA ATLANTIC BOARD
Prepared Pursuant to the February 9, 2005
Assurance of Discontinuance among the
Office of Attorney General of New York State,
Columbia Management Advisors, LLC, and
Columbia Management Distributors, Inc.
December 21, 2009
I. Overview
On February 9, 2005, Columbia Management Advisors, LLC ("CMA") and Columbia Management Distributors, Inc.1 ("CMD") agreed to the New York Attorney General's Assurance of Discontinuance ("AOD"). Among other things, the AOD stipulates that CMA may manage or advise a Columbia Fund ("Columbia Fund" and, together with some or all of such funds, the "Columbia Funds") only if the Independent Members of the Columbia Fund's Board of Trustees appoint a Senior Officer or retain an Independent Fee Consultant ("IFC") who is to manage the process by which proposed management fees are negotiated. The AOD further stipulates that the Senior Officer or IFC is to prepare a written annual evaluation of the fee negotiation process.
With effect from January 1, 2007, the Independent Members of the Board of Trustees for certain Columbia Funds known collectively as the "Atlantic Funds" (together with the other members of that Board, the "Trustees") retained me as IFC for the Atlantic Funds.2 In this capacity, I have prepared this written evaluation of the fee negotiation process. As was the case with the last three annual reports, my immediate predecessor as IFC, John Rea, provided invaluable assistance in the preparation of this report.
On September 29, 2009, Ameriprise entered into an asset purchase agreement with Bank of America, N.A. and its parent, Bank of America Corporation (together, the "Bank") pursuant to which the Bank agreed to sell certain CMG assets relating to Columbia's long-term asset management business, including management of the Atlantic Funds (the "Transaction").3 The Transaction if completed would result in the termination of the existing Investment Management Agreements with CMA. Therefore, the Trustees have been requested to approve and recommend to the shareholders of each Atlantic Fund new Investment Management and Sub-Advisory Agreements (together, the "Management Agreements") with RiverSource Investments, LLC ("RI"),4 investment manager of the RiverSource Funds and a subsidiary of Ameriprise. This report is intended to fulfill the requirements of the AOD with respect to the Trustees' consideration of the new Man agement Agreements.
A. Role of the Independent Fee Consultant
The AOD charges the IFC with "managing the process by which proposed management fees ... to be charged the Columbia Fund are negotiated so that they are negotiated in a manner which is at arms' length and reasonable and consistent with this Assurance of Discontinuance." The AOD also provides that CMA "may manage or advise a Columbia Fund only if the reasonableness of the proposed management fees is determined by the Board of Trustees ... using ... an annual independent written evaluation prepared by or under the direction of ... the Independent Fee Consultant." Therefore, the AOD makes clear that the IFC does not supplant the Trustees in negotiating management fees with CMA (or RI), nor does the IFC substitute his or her judgment for that of the Trustees with respect to the reasonableness of proposed fees or any other matter that is committed to the business judgment of the Trustees.
B. Elements Involved in Managing the Fee Negotiation Process
In preparing the report required by the AOD, the IFC must consider at least the following six factors set forth in the AOD:
1. The nature and quality of the adviser's services, including the Fund's performance;
1 CMA and CMD are subsidiaries of Columbia Management Group, LLC ("CMG"), and are the successors to the entities named in the AOD.
2 I have no material relationship with Bank of America, CMG or Ameriprise Financial, Inc. ("Ameriprise"), aside from serving as IFC, and I am aware of no material relationship with any of their affiliates. I retained John Rea, an independent economic consultant, to assist me with this report.
Unless otherwise stated or required by the context, this report covers only the Atlantic Funds.
3 Preliminary Response of Ameriprise to Information Request of Columbia Atlantic Board dated October 21, 2009 (hereafter, the "Preliminary Response"), p. 1. The one money market Atlantic Fund, Money Market Fund VS, was included in the Transaction because it was an integral part of CMG's array of Funds used as investment vehicles by variable annuity and similar insurance products.
4 Ameriprise intends to re-brand RI with the "Columbia" name (which is one of the assets being sold in the Transaction). Preliminary Response, pp. 4-5. In the case of new Sub-Advisory Agreements, the current sub-adviser would also be a party.
43
2. Management fees (including any components thereof) charged by other mutual fund companies for like services;
3. Possible economies of scale as the Fund grows larger;
4. Management fees (including any components thereof) charged to institutional and other clients of the adviser for like services;
5. Costs to the adviser and its affiliates of supplying services pursuant to the management fee agreements, excluding any intra-corporate profit; and
6. Profit margins of the adviser and its affiliates from supplying such services.
C. Data Presented to the Trustees
In considering the proposed new Management Agreements with RI, the Trustees relied in part on the data that had been prepared as part of their annual contract review process, which concluded in late October. This data remained relevant because the fees in the proposed Management Agreements were identical to the fees approved at that time. The annual review materials included a Lipper report on the performance of each Atlantic Fund compared to its peers and its benchmark, comparisons of the fees and expenses of each Atlantic Fund to similar CMG-sponsored Funds, comparable competitive funds chosen by Lipper, and institutional accounts advised by CMA, revenues, expenses, and profits of CMG from managing the Atlantic Funds, calculated both by Fund and collectively, and CMG's views on the existence and sharing of economies of scale.
In addition, the Trustees reviewed materials specific to the proposed new Management Agreements with RI in response to requests for information made on behalf of the Trustees, including the following:
• Performance data for the RiverSource Funds showing percentile and quartile rankings of each fund within its Lipper performance universe for periods up to five years and net returns of each fund relative to its benchmark returns. This data was arguably relevant due to the possibility that some RiverSource investment teams would be providing investment management services to certain Columbia Funds.5
• tables comparing the fee schedules and effective fee rates of funds managed by CMA and RI and institutional accounts advised by the two firms.
• extensive discussion of the process by which the various components of the two asset management businesses would be integrated including investment management, compliance, transfer agency, custody, fund accounting, and distribution.
• information about the financial condition of Ameriprise, including its most recent annual report on Form 10-K, RI's profit margins from managing the RiverSource Funds in 2007 and 2008, and pro forma income statements for the combined Columbia and RiverSource fund complex.
• disclosure that certain senior CMG executives, including President Michael Jones, Chief Investment Officer Colin Moore, Head of Mutual Funds J. Kevin Connaughton, and Chief Compliance Officer Linda Wondrack would continue in analogous capacities following the consummation of the Transaction, and
• a breakdown of the synergies RI expects to realize in the two years following the Transaction and the extent to which those potential synergies are expected to be shared with shareholders of funds advised by RI.
II. Findings
1. Based upon my examination of the information supplied by CMG and Ameriprise in the light of the six factors set forth in the AOD, I conclude that the Trustees have the relevant information necessary to evaluate the reasonableness of the proposed management fees for each Atlantic Fund.
2. In my view, the process by which the proposed management fees of the Atlantic Funds have been negotiated with RI thus far has been, to the extent practicable, at arms' length and reasonable and consistent with the AOD.
Respectfully submitted,
Steven E. Asher
5 On page 20 of its Supplemental Response to the Atlantic Trustees (undated but delivered November 24, 2009), Ameriprise said that "most personnel decisions, including with respect to the portfolio management teams for the Atlantic Funds . . . will be made primarily by [current CMA CIO] Colin Moore using the Columbia 5P process."
44
Shareholder Meeting Results
Columbia Conservative High Yield Fund
On March 3, 2010, a special meeting of shareholders of Columbia Funds Series Trust I was held to consider the approval of several proposals listed in the proxy statement for the meeting. Proposal 1 and Proposal 2 were voted on at the March 3, 2010 meeting of shareholders and Proposal 3 was voted on at an adjourned meeting of shareholders held on March 31, 2010. The shareholder meeting results are as follows:
Proposal 1: A proposed Investment Management Services Agreement with Columbia Management Investment Advisers, LLC (formerly, RiverSource Investments, LLC) (CMIA) was approved as follows:
| Votes For | | Votes Against | | Abstentions | | Broker Non-Votes | |
| | 446,764,717 | | | | 5,661,067 | | | | 7,250,990 | | | | 92,909,660 | | |
Proposal 2: A proposal authorizing CMIA to enter into and materially amend subadvisory agreements for the Fund in the future, with the approval of the Trust's Board of Trustees, but without obtaining additional shareholder approval, was approved as follows:
| Votes For | | Votes Against | | Abstentions | | Broker Non-Votes | |
| | 403,030,568 | | | | 49,938,253 | | | | 6,707,879 | | | | 92,909,734 | | |
Proposal 3: Each of the nominees for trustees was elected to the Trust's Board of Trustees, as follows:
| Trustee | | Votes For | | Votes Withheld | | Abstentions | |
| John D. Collins | | | 30,977,072,412 | | | | 859,827,038 | | | | 0 | | |
| Rodman L. Drake | | | 30,951,179,004 | | | | 885,720,446 | | | | 0 | | |
| Douglas A. Hacker | | | 30,989,793,279 | | | | 847,106,171 | | | | 0 | | |
| Janet Langford Kelly | | | 30,999,020,814 | | | | 837,878,636 | | | | 0 | | |
| William E. Mayer | | | 16,291,139,483 | | | | 15,545,759,967 | | | | 0 | | |
| Charles R. Nelson | | | 30,997,700,700 | | | | 839,198,750 | | | | 0 | | |
| John J. Neuhauser | | | 30,988,095,661 | | | | 848,803,789 | | | | 0 | | |
| Jonathon Piel | | | 30,968,801,048 | | | | 868,098,402 | | | | 0 | | |
| Patrick J. Simpson | | | 30,999,065,030 | | | | 837,834,420 | | | | 0 | | |
| Anne-Lee Verville | | | 30,996,227,913 | | | | 840,671,537 | | | | 0 | | |
45
This page intentionally left blank.
This page intentionally left blank.
This page intentionally left blank.
Important Information About This Report
The fund mails one shareholder report to each shareholder address. If you would like more than one report, please call shareholder services at 1-800-345-6611 and additional reports will be sent to you. This report has been prepared for shareholders of Columbia Conservative High Yield Fund.
A description of the policies and procedures that the fund uses to determine how to vote proxies and a copy of the fund's voting records are available (i) at www.columbiamanagement.com, (ii) on the Securities and Exchange Commission's website at www.sec.gov, and (iii) without charge, upon request, by calling 1-800-368-0346. Information regarding how the fund voted proxies relating to portfolio securities during the 12-month period ended June 30 is available from the SEC's website. Information regarding how the fund voted proxies relating to portfolio securities is also available from the fund's website, www.columbiamanagement.com.
The fund files a complete schedule of portfolio holdings with the SEC for the first and third quarters of each fiscal year on Form N-Q. The fund's Form N-Q is available on the SEC's website at www.sec.gov and may be reviewed and copied at the SEC's Public Reference Room in Washington, D.C. Information on the operation of the Public Reference Room may be obtained by calling 1-800-SEC-0330.
Transfer Agent
Columbia Management Investment
Services Corp.
P.O. Box 8081
Boston, MA 02266-8081
1-800-345-6611
Distributor
Columbia Management Investment
Distributors, Inc.
One Financial Center
Boston, MA 02111
Investment Advisor
Columbia Management Investment Advisers, LLC
100 Federal Street
Boston, MA 02110
49

PRSRT STD
U.S. Postage
PAID
Holliston, MA
Permit NO. 20
Columbia Conservative High Yield Fund
P. O. Box 8081
Boston, MA 02266-8081
columbiamanagement.com
This information is for use with concurrent or prior delivery of a fund prospectus. Investors should consider the investment objectives, risks, charges and expenses of a mutual fund carefully before investing. For a free prospectus, which contains this and other important information about the funds, visit columbiamanagement.com. Read the prospectus carefully before investing. The Fund is distributed by Columbia Management Investment Distributors, Inc., member FINRA, and managed by Columbia Management Investment Advisers, LLC.
© 2010 Columbia Management Investment Advisers, LLC. All rights reserved.
C-1621 A (10/10)

Columbia Strategic Investor Fund
Annual Report for the Period Ended August 31, 2010
Table of contents
The views expressed in this report reflect the current views of the respective parties. These views are not guarantees of future performance and involve certain risks, uncertainties and assumptions that are difficult to predict, so actual outcomes and results may differ significantly from the views expressed. These views are subject to change at any time based upon economic, market or other conditions and the respective parties disclaim any responsibility to update such views. These views may not be relied on as investment advice and, because investment decisions for a Columbia Fund are based on numerous factors, may not be relied on as an indication of trading intent on behalf of any particular Columbia Fund. References to specific securities should not be construed as a recommendation or investment advice.
President’s Message

Dear Shareholder:
The Columbia Management story began over 100 years ago, and today, we are one of the nation’s largest dedicated asset managers. The recent acquisition by Ameriprise Financial, Inc. brings together the talents, resources and capabilities of Columbia Management with those of RiverSource Investments, Threadneedle (acquired by Ameriprise in 2003) and Seligman Investments (acquired by Ameriprise in 2008) to build a best-in-class asset management business that we believe is truly greater than its parts.
RiverSource Investments traces its roots to 1894 when its then newly-founded predecessor, Investors Syndicate, offered a face-amount savings certificate that gave small investors the opportunity to build a safe and secure fund for retirement, education or other special needs. A mutual fund pioneer, Investors Syndicate launched Investors Mutual Fund in 1940. In the decades that followed, its mutual fund products and services lineup grew to include a full spectrum of styles and specialties. More than 110 years later, RiverSource continues to be a trusted financial products leader.
Threadneedle, a leader in global asset management and one of Europe’s largest asset managers, offers sophisticated international experience from a dedicated U.K. management team. Headquartered in London, it is named for Threadneedle Street in the heart of the city’s financial district, where British investors pioneered international and global investing. Threadneedle was acquired in 2003 and today operates as an affiliate of Columbia Management.
Seligman Investments’ beginnings date back to the establishment of the investment firm J. & W. Seligman & Co. in 1864. In the years that followed, Seligman played a major role in the geographical expansion and industrial development of the United States. In 1874, President Ulysses S. Grant named Seligman as fiscal agent for the U.S. Navy — an appointment that would last through World War I. Seligman helped finance the westward path of the railroads and the building of the Panama Canal. The firm organized its first investment company in 1929 and began managing its first mutual fund in 1930. In 2008, J. & W. Seligman & Co. Incorporated was acquired and Seligman Investments became an offering brand of RiverSource Investments, LLC.
We are proud of the rich and distinctive history of these firms, the strength and breadth of products and services they offer, and the combined cultures of pioneering spirit and forward thinking. Together we are committed to providing more for our shareholders than ever before.
| n | | A singular focus on our shareholders. Our business is asset management, so investors are our first priority. We dedicate our resources to identifying timely investment opportunities and provide a comprehensive choice of equity, fixed-income and alternative investments to help meet your individual needs. |
| n | | First-class research and thought leadership. We are dedicated to helping you take advantage of today’s opportunities and anticipate tomorrow’s. We stay abreast of the latest investment trends and ideas, using our collective insight to evaluate events and transform them into solutions you can use. |
| n | | A disciplined investment approach. We aren’t distracted by passing fads. Our teams adhere to a rigorous investment process that helps ensure the integrity of our products and enables you and your financial advisor to match our solutions to your objectives with confidence. |
When you choose Columbia Management, you can be confident that we will take the time to understand your needs and help you and your financial advisor identify the solutions that are right for you. Because at Columbia Management, we don’t consider ourselves successful unless you are.
Sincerely,

J. Kevin Connaughton
President, Columbia Funds
Investors should consider the investment objectives, risks, charges and expenses of a mutual fund carefully before investing. For a free prospectus, which contains this and other important information about the funds, visit columbiamanagement.com. The prospectus should be read carefully before investing.
Columbia Funds are distributed by Columbia Management Investment Distributors, Inc., member FINRA, and managed by Columbia Management Investment Advisers, LLC.
© 2010 Columbia Management Investment Advisers, LLC. All rights reserved.
Fund Profile – Columbia Strategic Investor Fund
Performance data quoted represents past performance and current performance may be lower or higher. Past performance is no guarantee of future results. The investment return and principal value will fluctuate so that shares, when redeemed, may be worth more or less than the original cost. Please visit www.columbiamanagement.com for daily and most recent month-end performance updates.
Summary
1-year return as of 08/31/10
| | |
| |
 | | +5.00% Class A shares
(without sales charge) |
| |
| | +5.55% Russell 1000 Index |
|
Morningstar Style BoxTM |
|
Equity Style |

|
The Morningstar Style Box™ is based on the Fund’s portfolio holdings as of period end. For equity funds, the vertical axis shows the market capitalization of the stocks owned, and the horizontal axis shows investment style (value, blend, or growth). Information shown is based on the most recent data provided by Morningstar.
© 2010 Morningstar, Inc. All rights reserved. The information contained herein is proprietary to Morningstar and/or its content providers, may not be copied or distributed and is not warranted to be accurate, complete, or timely. Neither Morningstar nor its content providers are responsible for any damages or losses arising from any use of this information. Past performance is no guarantee of future results.
Summary
| n | | For the 12-month period that ended August 31, 2010, the fund’s Class A shares returned 5.00% without sales charge. |
| n | | The fund’s return was slightly lower than the return of its benchmark, the Russell 1000 Index,1 and the average return of the funds in its peer group, the Lipper Multi-Cap Core Funds Classification.2 |
Portfolio Management
Emil A. Gjester, lead manager of the fund, has managed or co-managed the fund since May 2002 and has been associated with the advisor since May 2010. Prior to joining the advisor, Mr. Gjester was associated with the fund’s previous advisor or its predecessors since 1996.
Jonas Patrikson has co-managed the fund since February 2006 and has been associated with the advisor since May 2010. Prior to joining the advisor, Mr. Patrikson was associated with the fund’s previous advisor or its predecessors since 2004.
Michael T. Welter has co-managed the fund since July 2006 and has been associated with the advisor since May 2010. Prior to joining the advisor, Mr. Welter was associated with the fund’s previous advisor or its predecessors since 2006.
Mary-Ann Ward has co-managed the fund since April 2008 and has been associated with the advisor since May 2010. Prior to joining the advisor, Ms. Ward was associated with the fund’s previous advisor or its predecessors since 1997.
Effective May 1, 2010, RiverSource Investments, LLC, a subsidiary of Ameriprise Financial, Inc., became the investment advisor to the fund and changed its name to Columbia Management Investment Advisers, LLC. Please see the fund’s prospectus, as supplemented, for more information regarding the change in investment advisor and certain other changes.
| 1 | The Russell 1000 Index measures the performance of 1,000 of the largest U.S. companies, based on market capitalization. Indices are not available for investment, are not professionally managed and do not reflect sales charges, fees, brokerage commissions, taxes or other expenses of investing. Securities in the fund may not match those in an index. |
| 2 | Lipper Inc., a widely respected data provider in the industry, calculates an average total return (assuming reinvestment of distributions) for mutual funds with investment objectives similar to those of the fund. Lipper makes no adjustment for the effect of sales loads. |
1
Economic Update – Columbia Strategic Investor Fund
Summary
For the 12-month period that ended August 31, 2010
| | n | | The U.S. stock market, as measured by the S&P 500 Index, delivered positive returns, despite a correction in the last months of the period. Emerging market stocks, as measured by the MSCI Emerging Markets Index (Net), outperformed U.S. stocks as well as stock markets in developed foreign markets. | |
| | |
| S&P Index | | MSCI Index |
| |

| |
|
4.91% | | 18.02% |
| | n | | Modest economic growth and relatively low interest rates boosted bond market returns. The Barclays Capital Aggregate Bond Index delivered solid results. High-yield bonds outperformed stocks, as measured by the JPMorgan Developed BB High Yield Index. | |
| | |
| Barclays Aggregate Index | | JPMorgan
Index |
| |
| |
|
9.18% | | 17.68% |
Although it has been more than a year since U.S. economic growth turned positive, the economy continues to send mixed signals about the sustainability of this recovery. Economic growth, as measured by gross domestic product (GDP), was a solid 5.0% in the last quarter of 2009. However, it was 3.7% in the first quarter of 2010 and only 1.7% in the second quarter. Expectations are for continued lackluster growth through the end of the year, as government incentive programs have ended and stimulus spending winds down. Even so, it appears to be unlikely that the U.S. economy will sink back into recession as many key indicators remain positive.
Consumer spending on cars, clothing and other goods increased throughout the year, although the pace of increased spending was small. Personal income also moved higher. Consumer confidence, as measured by the Conference Board Consumer Confidence Index, gained ground in the first half of 2010. However, the index fell sharply in June and July before stabilizing in August. Consumers surveyed in the last three months of the reporting period indicated they were concerned about business conditions and job prospects and generally apprehensive about the future.
The housing market — another bellwether for the consumer sector — showed few positive signs. Both new and existing home sales fell in the final months of the period as a federal tax credit for new and repeat homebuyers expired. Distressed properties continued to pressure prices and a huge backlog of foreclosed homes is likely to continue to keep a lid on prices for some time. The national median price of existing homes rose slightly over the one-year period, while the national median price of new homes declined. Despite near-record low mortgage rates, the inventory of unsold homes rose to a 12.5 month supply, up sharply at the end of the period. The long-term average is on the order of six months.
News on the job front was mostly positive for the period, but the number of new jobs added to the economy fell short of expectations. A good portion of the jobs added in March, April and May were temporary, government-sponsored census positions, which began to unwind in June, July and August. Private sector job growth was disappointing given the stage of economic recovery. Nevertheless, private sector payroll employment trended modestly higher in the summer and news of massive layoffs declined.
Reports from the business side of the economy were generally positive. A key measure of the nation’s manufacturing situation — the Institute for Supply Management’s Index — was generally positive, although the index trended slightly downward in the final months of the period. Industrial production moved higher, as did the amount of manufacturing capacity utilized — a key measure of the health of the manufacturing sector.
Stock rally interrupted
Against a strengthening economic backdrop, a stock market rally that began early in 2009 continued into the spring of 2010. However, a debt crisis brewing in Europe raised concerns among U.S. investors, as did mixed signals on the economy, and some of the stock market’s earlier gains vanished during the early summer. The S&P 500 Index1 returned 4.91% for the 12-month period. Outside the United States, stock
2
Economic Update (continued) – Columbia Strategic Investor Fund
market returns were mixed. The MSCI EAFE Index (Net),2 a broad gauge of stock market performance in foreign developed markets, returned negative 2.34% (net of dividends, in U.S. dollars) for the period, as concerns about the impact of a bailout for weak eurozone economies weighed on the markets. Emerging stock markets were more resilient. The MSCI Emerging Markets Index (Net)3 returned 18.02% (net of dividends, in U.S. dollars) for the 12-month period.
Bonds delivered solid returns
As the economy strengthened, bonds delivered solid returns. The Barclays Capital Aggregate Bond Index4 returned 9.18%. Municipal bonds gained almost as much as taxable investment-grade bonds, even without factoring in potential tax advantages to investors in higher income-tax brackets. The Barclays Capital 3-15 Year Blend Municipal Bond Index5 returned 8.95%. The high-yield bond market outpaced stocks during the period by a margin of more than three to one. For the 12 months covered by this report, the JPMorgan Developed BB High Yield Index6 returned 17.68% while the S&P 500 Index returned 4.91%. Even the Treasury market was positive as the yield on the 10-year U.S. Treasury, a common bellwether for the bond market, fell nearly one full percentage point, from 3.4% to 2.5% over the 12-month period. Despite the pickup in economic activity, the Federal Reserve Board kept a key short-term interest rate — the federal funds rate — close to zero.
Past performance is no guarantee of future results.
| 1 | The Standard & Poor’s (S&P) 500 Index tracks the performance of 500 widely held, large-capitalization U.S. stocks. |
| 2 | The Morgan Stanley Capital International Europe, Australasia, Far East (MSCI EAFE) Index (Net) is a free float-adjusted market capitalization Index that is designed to measure equity market performance of developed markets, excluding the U.S. & Canada. As of May 27, 2010, the MSCI EAFE Index (Net) consisted of the following 22 developed market country indices: Australia, Austria, Belgium, Denmark, Finland, France, Germany, Greece, Hong Kong, Ireland, Israel, Italy, Japan, the Netherlands, New Zealand, Norway, Portugal, Singapore, Spain, Sweden, Switzerland and the United Kingdom. |
| 3 | The Morgan Stanley Capital International Emerging Markets (MSCI EM) Index (Net) is a free float-adjusted market capitalization index that is designed to measure equity market performance of emerging markets. As of May 27, 2010, the MSCI Emerging Markets Index (Net) consisted of the following 21 emerging market country indices: Brazil, Chile, China, Colombia, Czech Republic, Egypt, Hungary, India, Indonesia, Korea, Malaysia, Mexico, Morocco, Peru, Philippines, Poland, Russia, South Africa, Taiwan, Thailand, and Turkey. |
| 4 | The Barclays Capital Aggregate Bond Index is a market value-weighted index that tracks the daily price, coupon, pay-downs and total return performance of fixed-rate, publicly placed, dollar-denominated and non-convertible investment grade debt issues with at least $250 million par amount outstanding and with at least one year to final maturity. |
| 5 | The Barclays Capital 3-15 Year Blend Municipal Bond Index tracks the performance of municipal bonds issued after December 31, 1990 with remaining maturities between 2 and 17 years and at least $7 million in principal amount outstanding. |
| 6 | The JPMorgan Developed BB High Yield Index is an unmanaged index designed to mirror the investable universe of the U.S. dollar developed, BB-rated, high yield corporate debt market. |
Indices are not available for investment, are not professionally managed and do not reflect sales charges, fees, brokerage commissions, taxes or other expenses of investing. Securities in the fund may not match those in an index.
3
Performance Information – Columbia Strategic Investor Fund
Performance data quoted represents past performance and current performance may be lower or higher. Past performance is no guarantee of future results. The investment return and principal value will fluctuate so that shares, when redeemed, may be worth more or less than the original cost. Please visit www.columbiamanagement.com for daily and most recent month-end performance updates.
| | | | |
| Annual operating expense ratio (%)* | |
| |
Class A | | | 1.39 | |
Class B | | | 2.14 | |
Class C | | | 2.14 | |
Class Y | | | 0.87 | |
Class Z | | | 1.31 | |
| * | The annual operating expense ratio is as stated in the fund’s prospectus that is current as of the date of this report. Differences in expense ratios disclosed elsewhere in this report may result from the inclusion of fee waivers and expense reimbursements as well as the use of different time periods to calculate the ratios. |
| | | | |
| Net asset value per share | |
| |
as of 08/31/10 ($) | | | | |
Class A | | | 15.28 | |
Class B | | | 14.71 | |
Class C | | | 14.71 | |
Class Y | | | 15.32 | |
Class Z | | | 15.32 | |
| | | | |
| Distributions declared per share | |
| |
09/01/09 – 08/31/10 ($) | | | | |
Class A | | | 0.07 | |
Class B | | | 0.01 | |
Class C | | | 0.01 | |
Class Y | | | 0.13 | |
Class Z | | | 0.10 | |
|
| Performance of a $10,000 investment 11/09/00 – 08/31/10 |
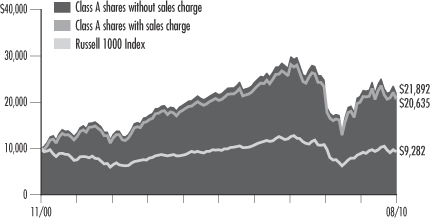
The chart above shows the change in value of a hypothetical $10,000 investment in Class A shares of Columbia Strategic Investor Fund during the stated time period, and does not reflect the deduction of taxes that a shareholder may pay on fund distributions or on the redemption of fund shares.
| | | | | | | | |
| Performance of a $10,000 investment 11/09/00 – 08/31/10 ($) | |
| Sales charge | | without | | | with | |
Class A | | | 21,892 | | | | 20,635 | |
Class B | | | 20,621 | | | | 20,621 | |
Class C | | | 20,621 | | | | 20,621 | |
Class Y | | | 22,373 | | | | n/a | |
Class Z | | | 22,330 | | | | n/a | |
| | | | | | | | | | | | | | | | | | | | | | | | | | | | | | | | |
| Average annual total return as of 08/31/10 (%) | | | | | | | |
| Share class | | A | | | B | | | C | | | Y | | | Z | |
| Inception | | 11/01/02 | | | 11/01/02 | | | 10/13/03 | | | 07/15/09 | | | 11/09/00 | |
| Sales charge | | without | | | with | | | without | | | with | | | without | | | with | | | without | | | without | |
1-year | | | 5.00 | | | | –1.03 | | | | 4.26 | | | | –0.74 | | | | 4.18 | | | | 3.18 | | | | 5.51 | | | | 5.31 | |
5-year | | | 0.04 | | | | –1.14 | | | | –0.70 | | | | –0.99 | | | | –0.71 | | | | –0.71 | | | | 0.33 | | | | 0.29 | |
Life | | | 8.32 | | | | 7.67 | | | | 7.66 | | | | 7.66 | | | | 7.66 | | | | 7.66 | | | | 8.56 | | | | 8.54 | |
| | | | | | | | | | | | | | | | | | | | | | | | | | | | | | | | |
| Average annual total return as of 09/30/10 (%) | |
| Share class | | A | | | B | | | C | | | Y | | | Z | |
| Sales charge | | without | | | with | | | without | | | with | | | without | | | with | | | without | | | without | |
1-year | | | 10.61 | | | | 4.26 | | | | 9.80 | | | | 4.80 | | | | 9.73 | | | | 8.73 | | | | 11.04 | | | | 10.90 | |
5-year | | | 1.95 | | | | 0.75 | | | | 1.20 | | | | 0.90 | | | | 1.19 | | | | 1.19 | | | | 2.24 | | | | 2.20 | |
Life | | | 9.42 | | | | 8.77 | | | | 8.76 | | | | 8.76 | | | | 8.76 | | | | 8.76 | | | | 9.67 | | | | 9.65 | |
The “with sales charge” returns include the maximum initial sales charge of 5.75% for Class A shares and the applicable contingent deferred sales charge of 5.00% in the first year, declining to 1.00% in the sixth year and eliminated thereafter for Class B shares and 1.00% for Class C shares for the first year only. The “without sales charge” returns do not include the effect of sales charges. If they had, returns would be lower.
Performance results reflect any fee waivers or reimbursements of fund expenses by the investment advisor and/or any of its affiliates. Absent these fee waivers or expense reimbursement arrangements, performance results would have been lower.
All results shown assume reinvestment of distributions. Class Y and Class Z shares are sold at net asset value with no distribution and service (Rule 12b-1) fees. Class Y and Class Z shares have limited eligibility and the investment minimum requirements may vary. Please see the fund’s prospectus for details. Performance for different share classes will vary based on differences in sales charges and fees associated with each class.
The tables do not reflect the deduction of taxes that a shareholder may pay on fund distributions or on the redemption of fund shares.
Class A, Class B, Class C and Class Y are newer classes of shares. Class A and Class B share performance information includes the performance of Class Z shares (the oldest existing share class) for periods prior to their inception. Class C share performance information includes returns of Class B shares for the period from November 1, 2002 through October 12, 2003, and the returns of Class Z shares for periods prior thereto. Class Y share performance information includes the performance of Class Z shares for periods prior to its inception. These returns reflect differences in sales charges, but have not been restated to reflect any differences in expenses such as distribution and service (Rule 12b-1) fees between Class Z shares and the newer classes of shares. If differences in expenses had been reflected, the returns shown for periods prior to the inception of Class A, Class B and Class C shares would have been lower, since these classes of shares are subject to distribution and service (Rule 12b-1) fees.
4
Understanding Your Expenses – Columbia Strategic Investor Fund
Estimating your actual expenses
To estimate the expenses that you paid over the period, first you will need your account balance at the end of the period:
| | n | | For shareholders who receive their account statements from Columbia Management Investment Services Corp., your account balance is available online at www.columbiamanagement.com or by calling Shareholder Services at 800.345.6611. | |
| | n | | For shareholders who receive their account statements from their financial intermediary, contact your financial intermediary to obtain your account balance. | |
| | 1. | Divide your ending account balance by $1,000. For example, if an account balance was $8,600 at the end of the period, the result would be 8.6. | |
| | 2. | In the section of the table below titled “Expenses paid during the period,” locate the amount for your share class. You will find this number in the column labeled “Actual.” Multiply this number by the result from step 1. Your answer is an estimate of the expenses you paid on your account during the period. | |
If the value of your account falls below the minimum initial investment requirement applicable to you, your account may be subject to a $20 annual fee. This fee is not included in the accompanying table. If you are subject to the fee, keep it in mind when you are estimating the ongoing expenses of investing in the fund and when comparing the expenses of this fund with other funds.
As a fund shareholder, you incur two types of costs. There are transaction costs, which generally include sales charges on purchases and may include redemption fees or exchange fees. There are also ongoing costs, which generally include investment advisory fees, distribution and service (Rule 12b-1) fees and other fund expenses. The information on this page is intended to help you understand the ongoing costs of investing in the fund and to compare these costs with the ongoing costs of investing in other mutual funds.
Analyzing your fund’s expenses by share class
To illustrate these ongoing costs, we have provided an example and calculated the expenses paid by investors in each share class during the period. The information in the following table is based on an initial investment of $1,000, which is invested at the beginning of the period and held for the entire period. Expense information is calculated two ways and each method provides you with different information. The amount listed in the “Actual” column is calculated using the fund’s actual operating expenses and total return for the period. The amount listed in the “Hypothetical” column for each share class assumes that the return each year is 5% before expenses and is calculated based on the fund’s actual operating expenses. You should not use the hypothetical account values and expenses to estimate either your actual account balance at the end of the period or the expenses you paid during this period.
Compare with other funds
Since all mutual funds are required to include the same hypothetical calculations about expenses in shareholder reports, you can use this information to compare the ongoing costs of investing in the fund with other funds. To do so, compare the 5% hypothetical example with the 5% hypothetical examples that appear in the shareholder reports of other funds. As you compare hypothetical examples of other funds, it is important to note that hypothetical examples are meant to highlight the ongoing costs of investing in a fund and do not reflect any transaction costs, such as sales charges, redemption fees or exchange fees.
| | | | | | | | | | | | | | | | | | | | | | | | | | | | |
| 03/01/10 – 08/31/10 | |
| | | | |
| | | Account value at the
beginning of the period ($) | | | Account value at the
end of the period ($) | | | Expenses paid
during the period ($) | | | Fund’s annualized
expense ratio (%) | |
| | | Actual | | | Hypothetical | | | Actual | | | Hypothetical | | | Actual | | | Hypothetical | | | Actual | |
Class A | | | 1,000.00 | | | | 1,000.00 | | | | 950.80 | | | | 1,018.90 | | | | 6.15 | | | | 6.36 | | | | 1.25 | |
Class B | | | 1,000.00 | | | | 1,000.00 | | | | 947.80 | | | | 1,015.12 | | | | 9.82 | | | | 10.16 | | | | 2.00 | |
Class C | | | 1,000.00 | | | | 1,000.00 | | | | 947.20 | | | | 1,015.12 | | | | 9.82 | | | | 10.16 | | | | 2.00 | |
Class Y | | | 1,000.00 | | | | 1,000.00 | | | | 953.30 | | | | 1,021.07 | | | | 4.04 | | | | 4.18 | | | | 0.82 | |
Class Z | | | 1,000.00 | | | | 1,000.00 | | | | 952.70 | | | | 1,020.16 | | | | 4.92 | | | | 5.09 | | | | 1.00 | |
Expenses paid during the period are equal to the annualized expense ratio for the share class, multiplied by the average account value over the period, then multiplied by the number of days in the fund’s most recent fiscal half-year and divided by 365.
Had the investment advisor and/or any of its affiliates not waived fees or reimbursed a portion of expenses, account value at the end of the period would have been reduced.
It is important to note that the expense amounts shown in the table are meant to highlight only ongoing costs of investing in the fund and do not reflect any transaction costs, such as sales charges, redemption fees or exchange fees. Therefore, the hypothetical examples provided may not help you determine the relative total costs of owning shares of different funds. If these transaction costs were included, your costs would have been higher.
5
Portfolio Managers’ Report – Columbia Strategic Investor Fund
Performance data quoted represents past performance and current performance may be lower or higher. Past performance is no guarantee of future results. The investment return and principal value will fluctuate so that shares, when redeemed, may be worth more or less than the original cost. Please visit www.columbiamanagement.com for daily and most recent month-end performance updates.
| | | | |
| Top 5 equity sectors | | | |
| |
as of 08/31/10 ($) | | | | |
Information Technology | | | 18.8 | |
Financials | | | 15.5 | |
Energy | | | 13.4 | |
Industrials | | | 12.1 | |
Consumer Discretionary | | | 11.9 | |
| | | | |
| Top 10 holdings | | | |
| |
as of 08/31/10 ($) | | | | |
JPMorgan | | | 2.1 | |
Apple | | | 2.1 | |
International Business Machines | | | 2.0 | |
Bank of America | | | 1.8 | |
Wells Fargo | | | 1.8 | |
Microsoft | | | 1.7 | |
Exxon Mobil | | | 1.6 | |
Hewlett Packard | | | 1.6 | |
Merck | | | 1.4 | |
Philip Morris | | | 1.4 | |
The fund is actively managed and the composition of its portfolio will change over time. Information provided is calculated as a percentage of net assets.
For the 12-month period that ended August 31, 2010, the fund’s Class A shares returned 5.00% without sales charge. The fund’s benchmark, the Russell 1000 Index, returned 5.55%, and the average return of the funds in its peer group, the Lipper Multi-Cap Core Funds Classification, was 5.20%. Stock selection was the primary driver of fund returns over the period.
Stock selection drove performance
For the period, the fund’s relative performance was primarily the result of stock selection. In the industrials, health care and financials sectors, stock selection detracted from relative performance. Within industrials, Barnes Group, Huron Consulting (0.4% and 0.4% of net assets, respectively) and Orion Marine Group were among the period’s disappointments. We sold Orion Marine Group before the end of the period. In health care, Auxilium Pharmaceutical, Baxter International and NuVasive (0.3% of net assets) were among the negative performers. We sold Auxilium and Baxter. Financial stocks came under pressure during the period, and we lost ground relative to the index with a number of positions, including MB Financial (0.4% of net assets), Charles Schwab and TD Ameritrade. Both Schwab and Ameritrade were sold. In addition, stock selection in materials and utilities weighed on relative performance.
On the positive side, the energy sector delivered solid performance relative to the benchmark during the period. Standouts within energy were Carbo Ceramics (sold during the period), Cimarex (0.7% of net assets) and Smith International, which was acquired by Schlumberger (1.2% of net assets) during the period. The technology sector also delivered favorable relative performance. Among the names that benefited the fund were Advanced Energy, which was sold during the period, as well as Tibco Software and VanceInfo Technologies (0.5% and 0.4% of net assets, respectively). In the consumer discretionary and consumer staples sectors, relative performance benefited from holdings such as Las Vegas Sands, Jo-Ann Stores, and Hypermarcas (0.9%, 0.9%, and 0.9% of net assets, respectively).
Looking ahead
We believe that the U.S. economy will continue to advance at a modest pace, as a deleveraging consumer, joblessness and a still-fragile housing market dampen the rate of growth relative to past recoveries. Nonetheless, we do not expect the economy to slide back into recession. Against this backdrop, we believe that we have the potential to continue to find attractive investment opportunities, although selectivity is key. We expect emerging markets to benefit from an expanding middle class. As a result, we maintain our long-held belief in the attractive growth potential for these parts of the world, and we continue to seek investments that directly or indirectly benefit from this trend.
Portfolio characteristics and holdings are subject to change and may not be representative of current characteristics and holdings. The outlook for this fund may differ from that presented for other Columbia Funds.
Equity securities are subject to stock market fluctuations that occur in response to economic and business developments.
Stocks of small- and mid-cap companies may pose special risks, including possible illiquidity and greater price volatility than stocks of larger, more established companies.
Value stocks are stocks of companies that may have experienced adverse business or industry developments or may be subject to special risks that have caused the stocks to be out of favor. If the manager’s assessment of a company’s prospects is wrong, the price of its stock may not approach the value the manager has placed on it.
6
Investment Portfolio – Columbia Strategic Investor Fund
August 31, 2010
Common Stocks – 99.3%
| | | | | | | | |
| | | Shares | | | Value ($) | |
| Consumer Discretionary – 11.9% | | | | | | | | |
| Auto Components – 0.6% | | | | | | | | |
Nokian Renkaat Oyj | | | 154,272 | | | | 4,408,003 | |
| | | | | | | | |
Auto Components Total | | | | | | | 4,408,003 | |
| | |
| Automobiles – 0.6% | | | | | | | | |
Nissan Motor Co., Ltd. (a) | | | 561,100 | | | | 4,274,351 | |
| | | | | | | | |
Automobiles Total | | | | | | | 4,274,351 | |
|
| Hotels, Restaurants & Leisure – 2.5% | |
Bally Technologies, Inc. (a) | | | 90,440 | | | | 2,844,338 | |
Carnival Corp. | | | 116,057 | | | | 3,618,657 | |
Ctrip.com International Ltd., ADR (a) | | | 133,139 | | | | 5,390,798 | |
Las Vegas Sands Corp. (a) | | | 223,186 | | | | 6,322,860 | |
| | | | | | | | |
Hotels, Restaurants & Leisure Total | | | | 18,176,653 | |
| | |
| Household Durables – 0.3% | | | | | | | | |
MRV Engenharia e Participacoes SA | | | 268,700 | | | | 2,241,398 | |
| | | | | | | | |
Household Durables Total | | | | | | | 2,241,398 | |
|
| Internet & Catalog Retail – 0.5% | |
Amazon.com, Inc. (a) | | | 28,391 | | | | 3,544,048 | |
| | | | | | | | |
Internet & Catalog Retail Total | | | | | | | 3,544,048 | |
| | |
| Media – 1.4% | | | | | | | | |
Comcast Corp., Class A | | | 325,459 | | | | 5,571,858 | |
News Corp., Class A | | | 327,608 | | | | 4,118,033 | |
| | | | | | | | |
Media Total | | | | | | | 9,689,891 | |
| | |
| Multiline Retail – 2.1% | | | | | | | | |
Big Lots, Inc. (a) | | | 233,043 | | | | 7,284,924 | |
Target Corp. | | | 149,041 | | | | 7,624,938 | |
| | | | | | | | |
Multiline Retail Total | | | | | | | 14,909,862 | |
| | |
| Specialty Retail – 3.0% | | | | | | | | |
Belle International Holdings Ltd. | | | 3,232,000 | | | | 5,656,281 | |
Collective Brands, Inc. (a) | | | 290,812 | | | | 3,760,199 | |
GameStop Corp., Class A (a) | | | 278,418 | | | | 4,992,035 | |
Jo-Ann Stores, Inc. (a) | | | 163,428 | | | | 6,644,982 | |
| | | | | | | | |
Specialty Retail Total | | | | | | | 21,053,497 | |
|
| Textiles, Apparel & Luxury Goods – 0.9% | |
Hanesbrands, Inc. (a) | | | 172,518 | | | | 4,130,081 | |
Ports Design Ltd. | | | 849,000 | | | | 2,083,768 | |
| | | | | | | | |
Textiles, Apparel & Luxury Goods Total | | | | 6,213,849 | |
| | | | | | | | |
Consumer Discretionary Total | | | | 84,511,552 | |
| | | | | |
| Consumer Staples – 10.1% | | | | | | | | |
| Beverages – 3.3% | | | | | | | | |
Carlsberg A/S, Class B | | | 34,248 | | | | 3,217,601 | |
| | | | | | | | |
| | | Shares | | | Value ($) | |
Constellation Brands, Inc., Class A (a) | | | 221,635 | | | | 3,692,439 | |
Hansen Natural Corp. (a) | | | 96,359 | | | | 4,340,009 | |
PepsiCo, Inc. | | | 144,930 | | | | 9,301,608 | |
United Spirits Ltd. | | | 101,236 | | | | 3,083,074 | |
| | | | | | | | |
Beverages Total | | | | | | | 23,634,731 | |
|
| Food & Staples Retailing – 1.8% | |
BJ’s Wholesale Club, Inc. (a) | | | 98,934 | | | | 4,151,270 | |
Casey’s General Stores, Inc. | | | 125,919 | | | | 4,737,073 | |
CVS Caremark Corp. | | | 144,482 | | | | 3,901,014 | |
| | | | | | | | |
Food & Staples Retailing Total | | | | | | | 12,789,357 | |
| | |
| Food Products – 1.7% | | | | | | | | |
Archer-Daniels-Midland Co. | | | 151,422 | | | | 4,660,769 | |
Kraft Foods, Inc., Class A | | | 245,512 | | | | 7,353,085 | |
| | | | | | | | |
Food Products Total | | | | | | | 12,013,854 | |
| | |
| Personal Products – 1.7% | | | | | | | | |
Avon Products, Inc. | | | 197,257 | | | | 5,740,179 | |
Hypermarcas SA (a) | | | 488,500 | | | | 6,433,597 | |
| | | | | | | | |
Personal Products Total | | | | | | | 12,173,776 | |
| | |
| Tobacco – 1.6% | | | | | | | | |
Philip Morris International, Inc. | | | 186,541 | | | | 9,595,669 | |
PT Gudang Garam Tbk | | | 380,000 | | | | 1,658,891 | |
| | | | | | | | |
Tobacco Total | | | | | | | 11,254,560 | |
| | | | | | | | |
Consumer Staples Total | | | | | | | 71,866,278 | |
| | | | | | | | |
| Energy – 13.4% | | | | | | | | |
| Energy Equipment & Services – 4.8% | |
Cameron International Corp. (a) | | | 110,917 | | | | 4,079,527 | |
National-Oilwell Varco, Inc. | | | 106,983 | | | | 4,021,491 | |
Noble Corp. | | | 105,952 | | | | 3,297,226 | |
Pioneer Drilling Co. (a) | | | 215,857 | | | | 1,174,262 | |
Schlumberger Ltd. | | | 154,444 | | | | 8,236,499 | |
Seadrill Ltd. | | | 94,779 | | | | 2,196,977 | |
Tenaris SA, ADR | | | 95,757 | | | | 3,222,223 | |
Weatherford International Ltd. (a) | | | 328,349 | | | | 4,895,684 | |
Wellstream Holdings PLC | | | 400,910 | | | | 3,355,776 | |
| | | | | | | | |
Energy Equipment & Services Total | | | | | | | 34,479,665 | |
|
| Oil, Gas & Consumable Fuels – 8.6% | |
Apache Corp. | | | 75,583 | | | | 6,791,132 | |
Cimarex Energy Co. | | | 71,831 | | | | 4,699,184 | |
Continental Resources, Inc. (a) | | | 69,738 | | | | 2,825,784 | |
Denbury Resources, Inc. (a) | | | 430,335 | | | | 6,343,138 | |
EOG Resources, Inc. | | | 64,861 | | | | 5,634,475 | |
Exxon Mobil Corp. | | | 197,986 | | | | 11,712,852 | |
Hess Corp. | | | 77,850 | | | | 3,911,962 | |
LUKOIL OAO, ADR | | | 97,226 | | | | 5,138,394 | |
See Accompanying Notes to Financial Statements.
7
Columbia Strategic Investor Fund
August 31, 2010
Common Stocks (continued)
| | | | | | | | |
| | | Shares | | | Value ($) | |
| Energy (continued) | | | | | | | | |
| Oil, Gas & Consumable Fuels (continued) | |
Occidental Petroleum Corp. | | | 99,211 | | | | 7,250,340 | |
Peabody Energy Corp. | | | 100,071 | | | | 4,283,039 | |
Petroleo Brasileiro SA, ADR | | | 76,145 | | | | 2,539,436 | |
| | | | | | | | |
Oil, Gas & Consumable Fuels Total | | | | 61,129,736 | |
| | | | | | | | |
Energy Total | | | | | | | 95,609,401 | |
| | | | | | | | |
| Financials – 15.5% | | | | | | | | |
| Capital Markets – 4.5% | | | | | | | | |
Greenhill & Co., Inc. | | | 60,750 | | | | 4,278,623 | |
Invesco Ltd. | | | 275,555 | | | | 4,987,545 | |
Morgan Stanley | | | 323,180 | | | | 7,979,314 | |
Northern Trust Corp. | | | 85,319 | | | | 3,936,619 | |
SEI Investments Co. | | | 215,615 | | | | 3,816,386 | |
T. Rowe Price Group, Inc. | | | 85,578 | | | | 3,746,605 | |
Waddell & Reed Financial, Inc., Class A | | | 152,737 | | | | 3,514,478 | |
| | | | | | | | |
Capital Markets Total | | | | | | | 32,259,570 | |
| | |
| Commercial Banks – 4.5% | | | | | | | | |
Fifth Third Bancorp. | | | 166,676 | | | | 1,841,770 | |
HDFC Bank Ltd., ADR | | | 23,415 | | | | 3,741,717 | |
Itau Unibanco Holding SA, ADR | | | 232,672 | | | | 5,018,735 | |
MB Financial, Inc. | | | 173,494 | | | | 2,598,940 | |
PT Bank Central Asia Tbk | | | 6,460,500 | | | | 4,159,622 | |
Wells Fargo & Co. | | | 534,325 | | | | 12,583,354 | |
Wilmington Trust Corp. | | | 266,164 | | | | 2,342,243 | |
| | | | | | | | |
Commercial Banks Total | | | | | | | 32,286,381 | |
| | |
| Consumer Finance – 0.9% | | | | | | | | |
Discover Financial Services | | | 426,333 | | | | 6,186,092 | |
| | | | | | | | |
Consumer Finance Total | | | | | | | 6,186,092 | |
|
| Diversified Financial Services – 4.3% | |
Bank of America Corp. | | | 1,031,570 | | | | 12,843,046 | |
Hong Kong Exchanges & Clearing Ltd. | | | 184,200 | | | | 2,901,672 | |
JPMorgan Chase & Co. | | | 405,191 | | | | 14,732,745 | |
| | | | | | | | |
Diversified Financial Services Total | | | | 30,477,463 | |
| | |
| Insurance – 1.3% | | | | | | | | |
Primerica, Inc. | | | 159,204 | | | | 3,348,060 | |
Principal Financial Group, Inc. | | | 238,406 | | | | 5,495,259 | |
| | | | | | | | |
Insurance Total | | | | | | | 8,843,319 | |
| | | | | | | | |
Financials Total | | | | | | | 110,052,825 | |
| | | | | | | | |
| Health Care – 8.8% | | | | | | | | |
| Biotechnology – 1.5% | | | | | | | | |
Alexion Pharmaceuticals, Inc. (a) | | | 61,352 | | | | 3,464,548 | |
| | | | | | | | |
| | | Shares | | | Value ($) | |
Celgene Corp. (a) | | | 54,883 | | | | 2,827,572 | |
Dendreon Corp. (a) | | | 38,225 | | | | 1,369,984 | |
Gilead Sciences, Inc. (a) | | | 104,219 | | | | 3,320,417 | |
| | | | | | | | |
Biotechnology Total | | | | | | | 10,982,521 | |
|
| Health Care Equipment & Supplies – 1.2% | |
Hospira, Inc. (a) | | | 87,476 | | | | 4,492,767 | |
Insulet Corp. (a) | | | 108,546 | | | | 1,434,978 | |
NuVasive, Inc. (a) | | | 79,771 | | | | 2,341,279 | |
| | | | | | | | |
Health Care Equipment & Supplies Total | | | | 8,269,024 | |
|
| Health Care Providers & Services – 2.8% | |
CIGNA Corp. | | | 110,369 | | | | 3,556,089 | |
Express Scripts, Inc. (a) | | | 158,385 | | | | 6,747,201 | |
Fleury SA | | | 201,100 | | | | 2,473,316 | |
Odontoprev SA | | | 33,100 | | | | 352,250 | |
UnitedHealth Group, Inc. | | | 225,457 | | | | 7,151,496 | |
| | | | | | | | |
Health Care Providers & Services Total | | | | 20,280,352 | |
|
| Life Sciences Tools & Services – 0.4% | |
QIAGEN N.V. (a) | | | 141,218 | | | | 2,516,505 | |
| | | | | | | | |
Life Sciences Tools & Services Total | | | | 2,516,505 | |
| | |
| Pharmaceuticals – 2.9% | | | | | | | | |
Allergan, Inc. | | | 64,699 | | | | 3,973,813 | |
Merck & Co., Inc. | | | 273,363 | | | | 9,611,443 | |
Teva Pharmaceutical Industries Ltd., ADR | | | 78,642 | | | | 3,977,712 | |
Watson Pharmaceuticals, Inc. (a) | | | 79,831 | | | | 3,438,321 | |
| | | | | | | | |
Pharmaceuticals Total | | | | | | | 21,001,289 | |
| | | | | | | | |
Health Care Total | | | | | | | 63,049,691 | |
| | | | | | | | |
| Industrials – 12.1% | | | | | | | | |
| Aerospace & Defense – 2.0% | | | | | | | | |
BE Aerospace, Inc. (a) | | | 112,879 | | | | 3,042,089 | |
Boeing Co. | | | 45,053 | | | | 2,754,090 | |
Spirit Aerosystems Holdings, Inc., Class A (a) | | | 93,100 | | | | 1,800,554 | |
United Technologies Corp. | | | 107,028 | | | | 6,979,296 | |
| | | | | | | | |
Aerospace & Defense Total | | | | | | | 14,576,029 | |
|
| Air Freight & Logistics – 0.4% | |
Atlas Air Worldwide Holdings, Inc. (a) | | | 58,998 | | | | 2,556,973 | |
| | | | | | | | |
Air Freight & Logistics Total | | | | | | | 2,556,973 | |
|
| Construction & Engineering – 1.2% | |
EMCOR Group, Inc. (a) | | | 71,617 | | | | 1,628,571 | |
Insituform Technologies, Inc., Class A (a) | | | 166,089 | | | | 3,381,572 | |
Quanta Services, Inc. (a) | | | 207,950 | | | | 3,730,623 | |
| | | | | | | | |
Construction & Engineering Total | | | | 8,740,766 | |
See Accompanying Notes to Financial Statements.
8
Columbia Strategic Investor Fund
August 31, 2010
Common Stocks (continued)
| | | | | | | | |
| | | Shares | | | Value ($) | |
| Industrials (continued) | | | | | | | | |
| Industrial Conglomerates – 1.5% | |
General Electric Co. | | | 360,993 | | | | 5,227,178 | |
Siemens AG, ADR | | | 58,896 | | | | 5,331,855 | |
| | | | | | | | |
Industrial Conglomerates Total | | | | 10,559,033 | |
| | |
| Machinery – 4.4% | | | | | | | | |
Barnes Group, Inc. | | | 190,868 | | | | 2,903,102 | |
Caterpillar, Inc. | | | 97,093 | | | | 6,326,580 | |
Cummins, Inc. | | | 38,814 | | | | 2,888,150 | |
Dover Corp. | | | 85,036 | | | | 3,806,211 | |
Joy Global, Inc. | | | 66,636 | | | | 3,780,927 | |
Kubota Corp. | | | 498,000 | | | | 3,980,123 | |
Parker Hannifin Corp. | | | 94,334 | | | | 5,580,799 | |
WABCO Holdings, Inc. (a) | | | 60,031 | | | | 2,116,693 | |
| | | | | | | | |
Machinery Total | | | | | | | 31,382,585 | |
| | |
| Marine – 1.0% | | | | | | | | |
A.P. Moller – Maersk A/S, Class B | | | 934 | | | | 7,011,371 | |
| | | | | | | | |
Marine Total | | | | | | | 7,011,371 | |
| | |
| Professional Services – 0.8% | | | | | | | | |
Huron Consulting Group, Inc. (a) | | | 143,195 | | | | 2,641,948 | |
Manpower, Inc. | | | 65,774 | | | | 2,795,395 | |
| | | | | | | | |
Professional Services Total | | | | | | | 5,437,343 | |
| | |
| Road & Rail – 0.8% | | | | | | | | |
J.B. Hunt Transport Services, Inc. | | | 66,010 | | | | 2,161,168 | |
Union Pacific Corp. | | | 49,812 | | | | 3,633,287 | |
| | | | | | | | |
Road & Rail Total | | | | | | | 5,794,455 | |
| | | | | | | | |
Industrials Total | | | | | | | 86,058,555 | |
| | | | | | | | |
| Information Technology – 18.8% | | | | | | | | |
| Communications Equipment – 1.1% | |
QUALCOMM, Inc. | | | 198,986 | | | | 7,623,153 | |
| | | | | | | | |
Communications Equipment Total | | | | 7,623,153 | |
| | |
| Computers & Peripherals – 3.7% | | | | | | | | |
Apple, Inc. (a) | | | 60,489 | | | | 14,721,208 | |
Hewlett-Packard Co. | | | 302,077 | | | | 11,623,923 | |
| | | | | | | | |
Computers & Peripherals Total | | | | | | | 26,345,131 | |
|
| Electronic Equipment, Instruments & Components – 0.8% | |
Hollysys Automation Technologies Ltd. (a) | | | 252,845 | | | | 2,536,035 | |
Tyco Electronics Ltd. | | | 136,771 | | | | 3,353,625 | |
| | | | | | | | |
Electronic Equipment, Instruments & Components Total | | | | 5,889,660 | |
| |
| Internet Software & Services – 3.0% | | | | | |
eBay, Inc. (a) | | | 324,413 | | | | 7,539,358 | |
Google, Inc., Class A (a) | | | 19,612 | | | | 8,825,792 | |
| | | | | | | | |
| | | Shares | | | Value ($) | |
GSI Commerce, Inc. (a) | | | 104,020 | | | | 2,368,536 | |
Opera Software ASA | | | 188,915 | | | | 680,609 | |
Tencent Holdings Ltd. | | | 102,500 | | | | 1,884,854 | |
| | | | | | | | |
Internet Software & Services Total | | | | 21,299,149 | |
| | |
| IT Services – 3.6% | | | | | | | | |
Alliance Data Systems Corp. (a) | | | 69,338 | | | | 3,896,102 | |
International Business Machines Corp. | | | 113,260 | | | | 13,957,030 | |
MasterCard, Inc., Class A | | | 23,038 | | | | 4,569,818 | |
Redecard SA | | | 237,400 | | | | 3,244,185 | |
| | | | | | | | |
IT Services Total | | | | | | | 25,667,135 | |
|
| Semiconductors & Semiconductor Equipment – 2.4% | |
Cavium Networks, Inc. (a) | | | 51,088 | | | | 1,233,264 | |
Disco Corp. | | | 34,200 | | | | 1,702,757 | |
Intel Corp. | | | 253,409 | | | | 4,490,408 | |
Silicon Laboratories, Inc. (a) | | | 44,333 | | | | 1,690,861 | |
Trina Solar Ltd., ADR (a) | | | 173,221 | | | | 4,465,637 | |
Varian Semiconductor Equipment Associates, Inc. (a) | | | 146,755 | | | | 3,642,459 | |
| | | | | | | | |
Semiconductors & Semiconductor Equipment Total | | | | 17,225,386 | |
| | |
| Software – 4.2% | | | | | | | | |
Electronic Arts, Inc. (a) | | | 186,627 | | | | 2,844,196 | |
Microsoft Corp. | | | 502,071 | | | | 11,788,627 | |
Oracle Corp. | | | 401,366 | | | | 8,781,888 | |
TIBCO Software, Inc. (a) | | | 263,402 | | | | 3,816,695 | |
VanceInfo Technologies, Inc., ADR (a) | | | 90,562 | | | | 2,639,882 | |
| | | | | | | | |
Software Total | | | | | | | 29,871,288 | |
| | | | | | | | |
Information Technology Total | | | | 133,920,902 | |
| | | | | |
| Materials – 4.8% | | | | | | | | |
| Chemicals – 1.6% | | | | | | | | |
Ferro Corp. (a) | | | 534,034 | | | | 5,714,164 | |
Potash Corp. of Saskatchewan, Inc. | | | 20,976 | | | | 3,088,716 | |
STR Holdings, Inc. (a) | | | 127,785 | | | | 2,641,316 | |
| | | | | | | | |
Chemicals Total | | | | | | | 11,444,196 | |
| | |
| Metals & Mining – 3.2% | | | | | | | | |
ArcelorMittal, NY Registered Shares | | | 125,745 | | | | 3,637,803 | |
Eurasian Natural Resources Corp. PLC | | | 352,096 | | | | 4,560,900 | |
Freeport-McMoRan Copper & Gold, Inc. | | | 99,263 | | | | 7,144,951 | |
Petropavlovsk PLC | | | 110,151 | | | | 1,790,694 | |
Thompson Creek Metals Co., Inc. (a) | | | 383,477 | | | | 3,290,233 | |
See Accompanying Notes to Financial Statements.
9
Columbia Strategic Investor Fund
August 31, 2010
Common Stocks (continued)
| | | | | | | | |
| | | Shares | | | Value ($) | |
| Materials (continued) | | | | | | | | |
| Metals & Mining (continued) | | | | | | | | |
Vale SA, ADR | | | 77,971 | | | | 2,085,724 | |
| | | | | | | | |
Metals & Mining Total | | | | | | | 22,510,305 | |
| | | | | | | | |
Materials Total | | | | | | | 33,954,501 | |
| | | | | | | | |
| Telecommunication Services – 1.7% | |
| Wireless Telecommunication Services – 1.7% | |
American Tower Corp., Class A (a) | | | 87,746 | | | | 4,111,777 | |
Millicom International Cellular SA | | | 29,737 | | | | 2,738,183 | |
Mobile TeleSystems OJSC, ADR | | | 246,315 | | | | 5,138,131 | |
| | | | | | | | |
Wireless Telecommunication Services Total | | | | 11,988,091 | |
| | | | | | | | |
Telecommunication Services Total | | | | 11,988,091 | |
| | | | | |
| Utilities – 2.2% | | | | | | | | |
| Electric Utilities – 0.6% | | | | | | | | |
NV Energy, Inc. | | | 356,773 | | | | 4,566,694 | |
| | | | | | | | |
Electric Utilities Total | | | | | | | 4,566,694 | |
| | |
| Gas Utilities – 0.7% | | | | | | | | |
PT Perusahaan Gas Negara | | | 11,323,500 | | | | 5,029,514 | |
| | | | | | | | |
Gas Utilities Total | | | | | | | 5,029,514 | |
|
| Independent Power Producers & Energy Traders – 0.9% | |
AES Corp. (a) | | | 586,795 | | | | 6,008,781 | |
| | | | | | | | |
Independent Power Producers & Energy Traders Total | | | | 6,008,781 | |
| | | | | | | | |
Utilities Total | | | | | | | 15,604,989 | |
| | | | | | | | |
Total Common Stocks
(cost of $635,235,094) | | | | 706,616,785 | |
| | |
Short-Term Obligation – 0.5% | | | | | | | | |
| | | Par ($) | | | | |
Repurchase agreement with Fixed Income Clearing Corp., dated 08/31/10, due 09/01/10 at 0.180%, collateralized by a U.S. Treasury obligation maturing 11/15/19, market value $3,872,481 (repurchase proceeds $3,794,019) | | | 3,794,000 | | | | 3,794,000 | |
| | | | | | | | |
Total Short-Term Obligation (cost of $3,794,000) | | | | | | | 3,794,000 | |
| | | | | | | | |
Total Investments – 99.8% (cost of $639,029,094)(b) | | | | | | | 710,410,785 | |
| | | | | | | | |
Other Assets & Liabilities, Net – 0.2% | | | | 1,558,614 | |
| | | | | | | | |
Net Assets – 100.0% | | | | | | | 711,969,399 | |
Notes to Investment Portfolio:
| (a) | Non-income producing security. |
| (b) | Cost for federal income tax purposes is $640,214,485. |
The following table summarizes the inputs used, as of August 31, 2010, in valuing the Fund’s assets:
| | | | | | | | | | | | | | | | |
Description | | Quoted Prices
(Level 1) | | | Other
Significant
Observable
Inputs
(Level 2) | | | Significant
Unobservable
Inputs
(Level 3) | | | Total | |
Common Stocks | | | | | | | | | | | | | | | | |
Consumer Discretionary | | $ | 68,089,149 | | | $ | 16,422,403 | | | $ | — | | | $ | 84,511,552 | |
Consumer Staples | | | 63,906,712 | | | | 7,959,566 | | | | — | | | | 71,866,278 | |
Energy | | | 92,253,625 | | | | 3,355,776 | | | | — | | | | 95,609,401 | |
Financials | | | 102,991,531 | | | | 7,061,294 | | | | — | | | | 110,052,825 | |
Health Care | | | 63,049,691 | | | | — | | | | — | | | | 63,049,691 | |
Industrials | | | 75,067,061 | | | | 10,991,494 | | | | — | | | | 86,058,555 | |
Information Technology | | | 130,333,291 | | | | 3,587,611 | | | | — | | | | 133,920,902 | |
Materials | | | 27,602,907 | | | | 6,351,594 | | | | — | | | | 33,954,501 | |
Teleccommunication Services | | | 11,988,091 | | | | — | | | | — | | | | 11,988,091 | |
Utilities | | | 10,575,475 | | | | 5,029,514 | | | | — | | | | 15,604,989 | |
| | | | | | | | | | | | | | | | |
Total Common Stocks | | | 645,857,533 | | | | 60,759,252 | | | | — | | | | 706,616,785 | |
| | | | | | | | | | | | | | | | |
Total Short-Term Obligation | | | — | | | | 3,794,000 | | | | — | | | | 3,794,000 | |
| | | | | | | | | | | | | | | | |
Total Investments | | $ | 645,857,533 | | | $ | 64,553,252 | | | $ | — | | | $ | 710,410,785 | |
| | | | | | | | | | | | | | | | |
The Fund’s assets assigned to the Level 2 input category include certain foreign securities for which a third party statistical pricing service may be employed for purposes of fair market valuation.
Certain short-term obligations may be valued using amortized cost, an income approach which converts future cash flows to a present value based upon the premium or discount at purchase.
For more information on valuation inputs, and their aggregation into the levels used in the table above, please refer to the Security Valuation section in the accompanying Notes to Financial Statements.
At August 31, 2010, the Fund held investments in the following sectors:
| | | | |
Sector (Unaudited) | | % of
Net Assets | |
Information Technology | | | 18.8 | |
Financials | | | 15.5 | |
Energy | | | 13.4 | |
Industrials | | | 12.1 | |
Consumer Discretionary | | | 11.9 | |
Consumer Staples | | | 10.1 | |
Health Care | | | 8.8 | |
Materials | | | 4.8 | |
Utilities | | | 2.2 | |
Telecommunication Services | | | 1.7 | |
| | | | |
| | | 99.3 | |
Short-Term Obligation | | | 0.5 | |
Other Assets & Liabilities, Net | | | 0.2 | |
| | | | |
| | | 100.0 | |
| | | | |
See Accompanying Notes to Financial Statements.
10
Columbia Strategic Investor Fund
August 31, 2010
The Fund was invested in the following countries at August 31, 2010:
| | | | | | | | |
Summary of Securities
by Country (Unaudited) | | Value | | | % of Total Investments | |
United States* | | | 558,717,958 | | | | 78.7 | |
Brazil | | | 24,388,640 | | | | 3.4 | |
China | | | 16,464,940 | | | | 2.3 | |
Switzerland | | | 11,546,535 | | | | 1.6 | |
Indonesia | | | 10,848,027 | | | | 1.5 | |
Russia | | | 10,276,525 | | | | 1.5 | |
Denmark | | | 10,228,972 | | | | 1.4 | |
Japan | | | 9,957,231 | | | | 1.4 | |
United Kingdom | | | 9,707,371 | | | | 1.4 | |
Luxembourg | | | 9,598,209 | | | | 1.3 | |
Hong Kong | | | 8,557,953 | | | | 1.2 | |
India | | | 6,824,791 | | | | 1.0 | |
Canada | | | 6,378,949 | | | | 0.9 | |
Germany | | | 5,331,855 | | | | 0.8 | |
Finland | | | 4,408,003 | | | | 0.6 | |
Israel | | | 3,977,712 | | | | 0.6 | |
Netherlands | | | 2,516,505 | | | | 0.3 | |
Norway | | | 680,609 | | | | 0.1 | |
| | | | | | | | |
| | | 710,410,785 | | | | 100.0 | |
| | | | | | | | |
* Includes short-term obligation.
Certain securities are listed by country of underlying exposure but may trade predominantly on other exchanges.
| | |
Acronym | | Name |
| ADR | | American Depositary Receipt |
See Accompanying Notes to Financial Statements.
11
Statement of Assets and Liabilities – Columbia Strategic Investor Fund
August 31, 2010
| | | | | | |
| | | | | ($) | |
| Assets | | Investments, at cost | | | 639,029,094 | |
| | | | | | |
| | Investments, at value | | | 710,410,785 | |
| | Cash | | | 25,954 | |
| | Foreign currency (cost of $41,844) | | | 41,821 | |
| | Receivable for: | | | | |
| | Investments sold | | | 6,871,110 | |
| | Fund shares sold | | | 62,679 | |
| | Dividends | | | 862,874 | |
| | Interest | | | 19 | |
| | Foreign tax reclaims | | | 45,005 | |
| | Expense reimbursement due from investment advisor | | | 67,793 | |
| | Trustees’ deferred compensation plan | | | 87,636 | |
| | Prepaid expenses | | | 17,905 | |
| | | | | | |
| | Total Assets | | | 718,493,581 | |
| | |
| Liabilities | | Payable for: | | | | |
| | Investments purchased | | | 4,774,534 | |
| | Fund shares repurchased | | | 660,377 | |
| | Investment advisory fee | | | 368,210 | |
| | Administration fee | | | 94,630 | |
| | Transfer agent fee | | | 271,997 | |
| | Pricing and bookkeeping fees | | | 13,788 | |
| | Trustees’ fees | | | 279 | |
| | Custody fee | | | 17,687 | |
| | Distribution and service fees | | | 63,334 | |
| | Chief compliance officer expenses | | | 259 | |
| | Reports to shareholders | | | 104,998 | |
| | Trustees’ deferred compensation plan | | | 87,636 | |
| | Other liabilities | | | 66,453 | |
| | | | | | |
| | Total Liabilities | | | 6,524,182 | |
| | |
| | | | | | |
| | Net Assets | | | 711,969,399 | |
| | |
| Net Assets Consist of | | Paid-in capital | | | 795,475,896 | |
| | Undistributed net investment income | | | 442,606 | |
| | Accumulated net realized loss | | | (155,332,420 | ) |
| | Net unrealized appreciation (depreciation) on: | | | | |
| | Investments | | | 71,381,691 | |
| | Foreign currency translations | | | 1,626 | |
| | | | | | |
| | Net Assets | | | 711,969,399 | |
See Accompanying Notes to Financial Statements.
12
Statement of Assets and Liabilities (continued) – Columbia Strategic Investor Fund
August 31, 2010
| | | | | | |
| | | | | | |
| Class A | | Net assets | | $ | 141,137,302 | |
| | Shares outstanding | | | 9,236,006 | |
| | Net asset value per share | | $ | 15.28 | (a) |
| | Maximum sales charge | | | 5.75 | % |
| | Maximum offering price per share ($15.28/0.9425) | | $ | 16.21 | (b) |
| | |
| Class B | | Net assets | | $ | 19,861,496 | |
| | Shares outstanding | | | 1,350,290 | |
| | Net asset value and offering price per share | | $ | 14.71 | (a) |
| | |
| Class C | | Net assets | | $ | 15,994,279 | |
| | Shares outstanding | | | 1,087,017 | |
| | Net asset value and offering price per share | | $ | 14.71 | (a) |
| | |
| Class Y | | Net assets | | $ | 9,826,204 | |
| | Shares outstanding | | | 641,569 | |
| | Net asset value, offering and redemption price per share | | $ | 15.32 | |
| | |
| Class Z | | Net assets | | $ | 525,150,118 | |
| | Shares outstanding | | | 34,284,662 | |
| | Net asset value, offering and redemption price per share | | $ | 15.32 | |
| (a) | Redemption price per share is equal to net asset value less any applicable contingent deferred sales charge. |
| (b) | On sales of $50,000 or more the offering price is reduced. |
See Accompanying Notes to Financial Statements.
13
Statement of Operations – Columbia Strategic Investor Fund
For the Year Ended August 31, 2010
| | | | | | |
| | | | | ($) | |
| Investment Income | | Dividends | | | 9,955,619 | |
| | Interest | | | 294,816 | |
| | Foreign taxes withheld | | | (213,915 | ) |
| | | | | | |
| | Total Investment Income | | | 10,036,520 | |
| | |
| Expenses | | Investment advisory fee | | | 4,623,342 | |
| | Administration fee | | | 1,192,730 | |
| | Distribution fee: | | | | |
| | Class B | | | 182,876 | |
| | Class C | | | 143,552 | |
| | Service fee: | | | | |
| | Class A | | | 405,057 | |
| | Class B | | | 60,959 | |
| | Class C | | | 47,851 | |
| | Transfer agent fee: | | | | |
| | Class A, Class B, Class C and Class Z | | | 2,711,688 | |
| | Class Y | | | 45 | |
| | Pricing and bookkeeping fees | | | 147,864 | |
| | Trustees’ fees | | | 51,364 | |
| | Custody fee | | | 98,204 | |
| | Reports to shareholders | | | 289,962 | |
| | Chief compliance officer expenses | | | 1,379 | |
| | Other expenses | | | 217,440 | |
| | | | | | |
| | Total Expenses | | | 10,174,313 | |
| | |
| | Fees waived or expenses reimbursed by investment advisor | | | (1,397,152 | ) |
| | Expense reductions | | | (33 | ) |
| | | | | | |
| | Net Expenses | | | 8,777,128 | |
| | |
| | | | | | |
| | Net Investment Income | | | 1,259,392 | |
| | |
| Net Realized and Unrealized Gain (Loss) on Investments and Foreign Currency | | Net realized gain (loss) on: | | | | |
| | Investments | | | 77,257,244 | |
| | Foreign currency transactions | | | (169,521 | ) |
| | | | | | |
| | Net realized gain | | | 77,087,723 | |
| | |
| | Net change in unrealized appreciation (depreciation) on: | | | | |
| | Investments | | | (33,350,389 | ) |
| | Foreign currency translations | | | 2,571 | |
| | | | | | |
| | Net change in unrealized appreciation (depreciation) | | | (33,347,818 | ) |
| | | | | | |
| | Net Gain | | | 43,739,905 | |
| | |
| | | | | | |
| | Net Increase Resulting from Operations | | | 44,999,297 | |
See Accompanying Notes to Financial Statements.
14
Statement of Changes in Net Assets – Columbia Strategic Investor Fund
| | | | | | | | | | |
| | | | | Year Ended August 31, | |
| Increase (Decrease) in Net Assets | | | | 2010 ($) | | | 2009 ($)(a) | |
| Operations | | Net investment income | | | 1,259,392 | | | | 5,854,287 | |
| | Net realized gain (loss) on investments and foreign currency transactions | | | 77,087,723 | | | | (157,757,707 | ) |
| | Net change in unrealized appreciation (depreciation) on investments and foreign currency translations | | | (33,347,818 | ) | | | (54,357,809 | ) |
| | | | | | | | | | |
| | Net increase (decrease) resulting from operations | | | 44,999,297 | | | | (206,261,229 | ) |
| | | |
| Distributions to Shareholders | | From net investment income: | | | | | | | | |
| | Class A | | | (768,250 | ) | | | (665,483 | ) |
| | Class B | | | (19,538 | ) | | | — | |
| | Class C | | | (14,955 | ) | | | — | |
| | Class Y | | | (85,917 | ) | | | — | |
| | Class Z | | | (3,668,702 | ) | | | (4,034,658 | ) |
| | | | | | | | | | |
| | Total distributions to shareholders | | | (4,557,362 | ) | | | (4,700,141 | ) |
| | | |
| | Net Capital Stock Transactions | | | (112,707,741 | ) | | | (62,182,505 | ) |
| | Increase from regulatory settlements | | | — | | | | 176,191 | |
| | | | | | | | | | |
| | Total decrease in net assets | | | (72,265,806 | ) | | | (272,967,684 | ) |
| | | |
| Net Assets | | Beginning of period | | | 784,235,205 | | | | 1,057,202,889 | |
| | End of period | | | 711,969,399 | | | | 784,235,205 | |
| | Undistributed net investment income at end of period | | | 442,606 | | | | 3,910,097 | |
| (a) | Class Y Shares commenced operations on July 15, 2009. |
See Accompanying Notes to Financial Statements.
15
Statement of Changes in Net Assets (continued) – Columbia Strategic Investor Fund
| | | | | | | | | | | | | | | | |
| | | Capital Stock Activity | |
| | | Year Ended
August 31, 2010 | | | Year Ended
August 31, 2009 | |
| | | Shares | | | Dollars ($) | | | Shares | | | Dollars ($) | |
Class A | | | | | | | | | | | | | | | | |
Subscriptions | | | 554,806 | | | | 8,963,147 | | | | 1,198,938 | | | | 15,494,350 | |
Distributions reinvested | | | 45,698 | | | | 728,424 | | | | 53,211 | | | | 631,609 | |
Redemptions | | | (2,216,849 | ) | | | (35,695,825 | ) | | | (2,913,464 | ) | | | (36,422,408 | ) |
| | | | | | | | | | | | | | | | |
Net decrease | | | (1,616,345 | ) | | | (26,004,254 | ) | | | (1,661,315 | ) | | | (20,296,449 | ) |
| | | | |
Class B | | | | | | | | | | | | | | | | |
Subscriptions | | | 19,131 | | | | 302,196 | | | | 90,795 | | | | 1,125,543 | |
Distributions reinvested | | | 1,172 | | | | 18,085 | | | | — | | | | — | |
Redemptions | | | (435,858 | ) | | | (6,792,331 | ) | | | (744,915 | ) | | | (9,113,095 | ) |
| | | | | | | | | | | | | | | | |
Net decrease | | | (415,555 | ) | | | (6,472,050 | ) | | | (654,120 | ) | | | (7,987,552 | ) |
| | | | |
Class C | | | | | | | | | | | | | | | | |
Subscriptions | | | 126,097 | | | | 1,975,759 | | | | 155,332 | | | | 1,885,688 | |
Distributions reinvested | | | 825 | | | | 12,730 | | | | — | | | | — | |
Redemptions | | | (446,858 | ) | | | (6,928,254 | ) | | | (707,882 | ) | | | (8,714,088 | ) |
| | | | | | | | | | | | | | | | |
Net decrease | | | (319,936 | ) | | | (4,939,765 | ) | | | (552,550 | ) | | | (6,828,400 | ) |
| | | | |
Class Y (a) | | | | | | | | | | | | | | | | |
Subscriptions | | | — | | | | — | | | | 657,726 | | | | 9,266,434 | |
Distributions reinvested | | | 5,371 | | | | 85,916 | | | | — | | | | — | |
Redemptions | | | (21,528 | ) | | | (345,100 | ) | | | — | | | | — | |
| | | | | | | | | | | | | | | | |
Net increase (decrease) | | | (16,157 | ) | | | (259,184 | ) | | | 657,726 | | | | 9,266,434 | |
| | | | |
Class Z | | | | | | | | | | | | | | | | |
Subscriptions | | | 1,669,306 | | | | 27,075,217 | | | | 2,698,045 | | | | 33,794,489 | |
Distributions reinvested | | | 223,986 | | | | 3,582,323 | | | | 334,033 | | | | 3,961,625 | |
Redemptions | | | (6,625,959 | ) | | | (105,690,028 | ) | | | (5,835,211 | ) | | | (74,092,652 | ) |
| | | | | | | | | | | | | | | | |
Net decrease | | | (4,732,667 | ) | | | (75,032,488 | ) | | | (2,803,133 | ) | | | (36,336,538 | ) |
| (a) | Class Y Shares commenced operations on July 15, 2009. |
See Accompanying Notes to Financial Statements.
16
Financial Highlights – Columbia Strategic Investor Fund
Selected data for a share outstanding throughout each period is as follows:
| | | | | | | | | | | | | | | | | | | | |
| | | Year Ended August 31, | |
| Class A Shares | | 2010 | | | 2009 | | | 2008 | | | 2007 | | | 2006 | |
Net Asset Value, Beginning of Period | | $ | 14.62 | | | $ | 18.01 | | | $ | 21.48 | | | $ | 21.22 | | | $ | 21.21 | |
| | | | | |
Income from Investment Operations: | | | | | | | | | | | | | | | | | | | | |
Net investment income (a) | | | — | (b) | | | 0.09 | | | | 0.06 | | | | 0.07 | | | | 0.13 | |
Net realized and unrealized gain (loss) on investments and foreign currency | | | 0.73 | | | | (3.42 | ) | | | (1.25 | ) | | | 2.97 | | | | 1.54 | |
| | | | | | | | | | | | | | | | | | | | |
Total from investment operations | | | 0.73 | | | | (3.33 | ) | | | (1.19 | ) | | | 3.04 | | | | 1.67 | |
| | | | | |
Less Distributions to Shareholders: | | | | | | | | | | | | | | | | | | | | |
From net investment income | | | (0.07 | ) | | | (0.06 | ) | | | (0.07 | ) | | | (0.10 | ) | | | (0.14 | ) |
From net realized gains | | | — | | | | — | | | | (2.21 | ) | | | (2.68 | ) | | | (1.52 | ) |
| | | | | | | | | | | | | | | | | | | | |
Total distributions to shareholders | | | (0.07 | ) | | | (0.06 | ) | | | (2.28 | ) | | | (2.78 | ) | | | (1.66 | ) |
| | | | | |
Increase from regulatory settlements | | | — | | | | — | (b) | | | — | | | | — | | | | — | |
| | | | | |
Net Asset Value, End of Period | | $ | 15.28 | | | $ | 14.62 | | | $ | 18.01 | | | $ | 21.48 | | | $ | 21.22 | |
Total return (c)(d) | | | 5.00 | % | | | (18.44 | )% | | | (7.09 | )% | | | 16.33 | % | | | 8.26 | % |
| | | | | |
Ratios to Average Net Assets/Supplemental Data: | | | | | | | | | | | | | | | | | | | | |
Net expenses | | | 1.25 | %(e) | | | 1.24 | %(e) | | | 1.22 | %(f) | | | 1.23 | %(g) | | | 1.24 | %(e) |
Waiver/Reimbursement | | | 0.18 | % | | | 0.23 | % | | | 0.03 | % | | | 0.02 | % | | | 0.01 | % |
Net investment income | | | 0.01 | %(e) | | | 0.70 | %(e) | | | 0.30 | %(f) | | | 0.36 | %(g) | | | 0.65 | %(e) |
Portfolio turnover rate | | | 67 | % | | | 117 | % | | | 88 | % | | | 139 | % | | | 82 | % |
Net assets, end of period (000s) | | $ | 141,137 | | | $ | 158,624 | | | $ | 225,418 | | | $ | 255,743 | | | $ | 170,201 | |
| (a) | Per share data was calculated using the average shares outstanding during the period. |
| (b) | Rounds to less than $0.01 per share. |
| (c) | Total return at net asset value assuming all distributions reinvested and no initial sales charge or contingent deferred sales charge. |
| (d) | Had the investment advisor and/or any of its affiliates not waived fees or reimbursed a portion of expenses, total return would have been reduced. |
| (e) | The benefits derived from expense reductions had an impact of less than 0.01%. |
| (f) | The benefits derived from expense reductions had an impact of 0.04%. |
| (g) | The benefits derived from expense reductions had an impact of 0.06%. |
See Accompanying Notes to Financial Statements.
17
Financial Highlights – Columbia Strategic Investor Fund
Selected data for a share outstanding throughout each period is as follows:
| | | | | | | | | | | | | | | | | | | | |
| | | Year Ended August 31, | |
| Class B Shares | | 2010 | | | 2009 | | | 2008 | | | 2007 | | | 2006 | |
Net Asset Value, Beginning of Period | | $ | 14.12 | | | $ | 17.45 | | | $ | 20.96 | | | $ | 20.81 | | | $ | 20.84 | |
| | | | | |
Income from Investment Operations: | | | | | | | | | | | | | | | | | | | | |
Net investment loss (a) | | | (0.11 | ) | | | (0.01 | ) | | | (0.09 | ) | | | (0.08 | ) | | | (0.02 | ) |
Net realized and unrealized gain (loss) on investments and foreign currency | | | 0.71 | | | | (3.32 | ) | | | (1.21 | ) | | | 2.91 | | | | 1.51 | |
| | | | | | | | | | | | | | | | | | | | |
Total from investment operations | | | 0.60 | | | | (3.33 | ) | | | (1.30 | ) | | | 2.83 | | | | 1.49 | |
| | | | | |
Less Distributions to Shareholders: | | | | | | | | | | | | | | | | | | | | |
From net investment income | | | (0.01 | ) | | | — | | | | — | | | | — | | | | — | |
From net realized gains | | | — | | | | — | | | | (2.21 | ) | | | (2.68 | ) | | | (1.52 | ) |
| | | | | | | | | | | | | | | | | | | | |
Total distributions to shareholders | | | (0.01 | ) | | | — | | | | (2.21 | ) | | | (2.68 | ) | | | (1.52 | ) |
| | | | | |
Increase from regulatory settlements | | | — | | | | — | (b) | | | — | | | | — | | | | — | |
| | | | | |
Net Asset Value, End of Period | | $ | 14.71 | | | $ | 14.12 | | | $ | 17.45 | | | $ | 20.96 | | | $ | 20.81 | |
Total return (c)(d) | | | 4.26 | % | | | (19.08 | )% | | | (7.77 | )% | | | 15.50 | % | | | 7.47 | % |
| | | | | |
Ratios to Average Net Assets/Supplemental Data: | | | | | | | | | | | | | | | | | | | | |
Net expenses | | | 2.00 | %(e) | | | 1.99 | %(e) | | | 1.97 | %(f) | | | 1.98 | %(g) | | | 1.99 | %(e) |
Waiver/Reimbursement | | | 0.18 | % | | | 0.23 | % | | | 0.03 | % | | | 0.02 | % | | | 0.01 | % |
Net investment loss | | | (0.74 | )%(e) | | | (0.05 | )%(e) | | | (0.46 | )%(f) | | | (0.39 | )%(g) | | | (0.10 | )%(e) |
Portfolio turnover rate | | | 67 | % | | | 117 | % | | | 88 | % | | | 139 | % | | | 82 | % |
Net assets, end of period (000s) | | $ | 19,861 | | | $ | 24,933 | | | $ | 42,229 | | | $ | 53,965 | | | $ | 51,446 | |
| (a) | Per share data was calculated using the average shares outstanding during the period. |
| (b) | Rounds to less than $0.01 per share. |
| (c) | Total return at net asset value assuming all distributions reinvested and no contingent deferred sales charge. |
| (d) | Had the investment advisor and/or any of its affiliates not waived fees or reimbursed a portion of expenses, total return would have been reduced. |
| (e) | The benefits derived from expense reductions had an impact of less than 0.01%. |
| (f) | The benefits derived from expense reductions had an impact of 0.04%. |
| (g) | The benefits derived from expense reductions had an impact of 0.06%. |
See Accompanying Notes to Financial Statements.
18
Financial Highlights – Columbia Strategic Investor Fund
Selected data for a share outstanding throughout each period is as follows:
| | | | | | | | | | | | | | | | | | | | |
| | | Year Ended August 31, | |
| Class C Shares | | 2010 | | | 2009 | | | 2008 | | | 2007 | | | 2006 | |
Net Asset Value, Beginning of Period | | $ | 14.13 | | | $ | 17.46 | | | $ | 20.96 | | | $ | 20.82 | | | $ | 20.85 | |
| | | | | |
Income from Investment Operations: | | | | | | | | | | | | | | | | | | | | |
Net investment loss (a) | | | (0.11 | ) | | | (0.01 | ) | | | (0.09 | ) | | | (0.08 | ) | | | (0.02 | ) |
Net realized and unrealized gain (loss) on investments and foreign currency | | | 0.70 | | | | (3.32 | ) | | | (1.20 | ) | | | 2.90 | | | | 1.51 | |
| | | | | | | | | | | | | | | | | | | | |
Total from investment operations | | | 0.59 | | | | (3.33 | ) | | | (1.29 | ) | | | 2.82 | | | | 1.49 | |
| | | | | |
Less Distributions to Shareholders: | | | | | | | | | | | | | | | | | | | | |
From net investment income | | | (0.01 | ) | | | — | | | | — | | | | — | | | | — | |
From net realized gains | | | — | | | | — | | | | (2.21 | ) | | | (2.68 | ) | | | (1.52 | ) |
| | | | | | | | | | | | | | | | | | | | |
Total distributions to shareholders | | | (0.01 | ) | | | — | | | | (2.21 | ) | | | (2.68 | ) | | | (1.52 | ) |
| | | | | |
Increase from regulatory settlements | | | — | | | | — | (b) | | | — | | | | — | | | | — | |
| | | | | |
Net Asset Value, End of Period | | $ | 14.71 | | | $ | 14.13 | | | $ | 17.46 | | | $ | 20.96 | | | $ | 20.82 | |
Total return (c)(d) | | | 4.18 | % | | | (19.07 | )% | | | (7.72 | )% | | | 15.43 | % | | | 7.46 | % |
| | | | | |
Ratios to Average Net Assets/Supplemental Data: | | | | | | | | | | | | | | | | | | | | |
Net expenses | | | 2.00 | %(e) | | | 1.99 | %(e) | | | 1.97 | %(f) | | | 1.98 | %(g) | | | 1.99 | %(e) |
Waiver/Reimbursement | | | 0.18 | % | | | 0.23 | % | | | 0.03 | % | | | 0.02 | % | | | 0.01 | % |
Net investment loss | | | (0.74 | )%(e) | | | (0.05 | )%(e) | | | (0.46 | )%(f) | | | (0.40 | )%(g) | | | (0.10 | )%(e) |
Portfolio turnover rate | | | 67 | % | | | 117 | % | | | 88 | % | | | 139 | % | | | 82 | % |
Net assets, end of period (000s) | | $ | 15,994 | | | $ | 19,874 | | | $ | 34,208 | | | $ | 44,682 | | | $ | 43,881 | |
| (a) | Per share data was calculated using the average shares outstanding during the period. |
| (b) | Rounds to less than $0.01 per share. |
| (c) | Total return at net asset value assuming all distributions reinvested and no contingent deferred sales charge. |
| (d) | Had the investment advisor and/or any of its affiliates not waived fees or reimbursed a portion of expenses, total return would have been reduced. |
| (e) | The benefits derived from expense reductions had an impact of less than 0.01%. |
| (f) | The benefits derived from expense reductions had an impact of 0.04%. |
| (g) | The benefits derived from expense reductions had an impact of 0.06%. |
See Accompanying Notes to Financial Statements.
19
Financial Highlights – Columbia Strategic Investor Fund
Selected data for a share outstanding throughout each period is as follows:
| | | | | | | | |
| Class Y Shares | | Year Ended
August 31,
2010 | | | Period Ended
August 31,
2009 (a) | |
Net Asset Value, Beginning of Period | | $ | 14.64 | | | $ | 13.32 | |
| | |
Income from Investment Operations: | | | | | | | | |
Net investment income (b) | | | 0.07 | | | | 0.02 | |
Net realized and unrealized gain on investments and foreign currency | | | 0.74 | | | | 1.30 | |
| | | | | | | | |
Total from investment operations | | | 0.81 | | | | 1.32 | |
| | |
Less Distributions to Shareholders: | | | | | | | | |
From net investment income | | | (0.13 | ) | | | — | |
| | |
Net Asset Value, End of Period | | $ | 15.32 | | | $ | 14.64 | |
Total return (c)(d) | | | 5.51 | % | | | 9.91 | %(e) |
| | |
Ratios to Average Net Assets/Supplemental Data: | | | | | | | | |
Net expenses (f) | | | 0.83 | % | | | 0.72 | %(g) |
Net investment income (f) | | | 0.43 | % | | | 0.99 | %(g) |
Portfolio turnover rate | | | 67 | % | | | 117 | %(e) |
Net assets, end of period (000s) | | $ | 9,826 | | | $ | 9,630 | |
| (a) | Class Y shares commenced operations on July 15, 2009. Per share data and total return reflect activity from that date. |
| (b) | Per share data was calculated using the average shares outstanding during the period. |
| (c) | Total return at net asset value assuming all distributions reinvested. |
| (d) | Had the investment advisor and/or any of its affiliates not waived fees or reimbursed a portion of expenses, total return would have been reduced. |
| (f) | The benefits derived from expense reductions had an impact of less than 0.01%. |
See Accompanying Notes to Financial Statements.
20
Financial Highlights – Columbia Strategic Investor Fund
Selected data for a share outstanding throughout each period is as follows:
| | | | | | | | | | | | | | | | | | | | |
| | | Year Ended August 31, | |
| Class Z Shares | | 2010 | | | 2009 | | | 2008 | | | 2007 | | | 2006 | |
Net Asset Value, Beginning of Period | | $ | 14.64 | | | $ | 18.06 | | | $ | 21.53 | | | $ | 21.28 | | | $ | 21.27 | |
| | | | | |
Income from Investment Operations: | | | | | | | | | | | | | | | | | | | | |
Net investment income (a) | | | 0.04 | | | | 0.12 | | | | 0.11 | | | | 0.13 | | | | 0.18 | |
Net realized and unrealized gain (loss) on investments and foreign currency | | | 0.74 | | | | (3.44 | ) | | | (1.25 | ) | | | 2.96 | | | | 1.54 | |
| | | | | | | | | | | | | | | | | | | | |
Total from investment operations | | | 0.78 | | | | (3.32 | ) | | | (1.14 | ) | | | 3.09 | | | | 1.72 | |
| | | | | |
Less Distributions to Shareholders: | | | | | | | | | | | | | | | | | | | | |
From net investment income | | | (0.10 | ) | | | (0.10 | ) | | | (0.12 | ) | | | (0.16 | ) | | | (0.19 | ) |
From net realized gains | | | — | | | | — | | | | (2.21 | ) | | | (2.68 | ) | | | (1.52 | ) |
| | | | | | | | | | | | | | | | | | | | |
Total distributions to shareholders | | | (0.10 | ) | | | (0.10 | ) | | | (2.33 | ) | | | (2.84 | ) | | | (1.71 | ) |
| | | | | |
Increase from regulatory settlements | | | — | | | | — | (b) | | | — | | | | — | | | | — | |
| | | | | |
Net Asset Value, End of Period | | $ | 15.32 | | | $ | 14.64 | | | $ | 18.06 | | | $ | 21.53 | | | $ | 21.28 | |
Total return (c)(d) | | | 5.31 | % | | | (18.26 | )% | | | (6.85 | )% | | | 16.62 | % | | | 8.50 | % |
| | | | | |
Ratios to Average Net Assets/Supplemental Data: | | | | | | | | | | | | | | | | | | | | |
Net expenses | | | 1.00 | %(e) | | | 0.99 | %(e) | | | 0.97 | %(f) | | | 0.98 | %(g) | | | 0.99 | %(e) |
Waiver/Reimbursement | | | 0.18 | % | | | 0.23 | % | | | 0.03 | % | | | 0.02 | % | | | 0.01 | % |
Net investment income | | | 0.26 | %(e) | | | 0.94 | %(e) | | | 0.55 | %(f) | | | 0.63 | %(g) | | | 0.89 | %(e) |
Portfolio turnover rate | | | 67 | % | | | 117 | % | | | 88 | % | | | 139 | % | | | 82 | % |
Net assets, end of period (000s) | | $ | 525,150 | | | $ | 571,175 | | | $ | 755,348 | | | $ | 859,142 | | | $ | 179,027 | |
| (a) | Per share data was calculated using the average shares outstanding during the period. |
| (b) | Rounds to less than $0.01 per share. |
| (c) | Total return at net asset value assuming all distributions reinvested. |
| (d) | Had the investment advisor and/or any of its affiliates not waived fees or reimbursed a portion of expenses, total return would have been reduced. |
| (e) | The benefits derived from expense reductions had an impact of less than 0.01%. |
| (f) | The benefits derived from expense reductions had an impact of 0.04%. |
| (g) | The benefits derived from expense reductions had an impact of 0.06%. |
See Accompanying Notes to Financial Statements.
21
Notes to Financial Statements – Columbia Strategic Investor Fund
August 31, 2010
Note 1. Organization
Columbia Strategic Investor Fund (the “Fund”), a series of Columbia Funds Series Trust I (the “Trust”), is a diversified fund. The Trust is registered under the Investment Company Act of 1940, as amended (the “1940 Act”), as an open-end management investment company organized as a Massachusetts business trust.
Investment Objective
The Fund seeks long-term growth of capital by using a “value” approach to investing primarily in common stocks.
Fund Shares
The Trust may issue an unlimited number of shares, and the Fund offers five classes of shares: Class A, Class B, Class C, Class Y and Class Z. Each share class has its own expense structure and sales charges, as applicable. The Fund no longer accepts investments from new or existing investors in the Fund’s Class B shares, except in connection with the reinvestment of any dividend and/or capital gain distributions in Class B shares of the Fund and exchanges by existing Class B shareholders of the other Columbia Funds.
Class A shares are subject to a maximum front-end sales charge of 5.75% based on the amount of initial investment. Class A shares purchased without an initial sales charge in accounts aggregating $1 million to $50 million at the time of purchase are subject to a 1.00% contingent deferred sales charge (“CDSC”) if the shares are sold within one year after purchase. Class B shares are subject to a maximum CDSC of 5.00% based upon the holding period after purchase. Class B shares will convert to Class A shares eight years after purchase. Class C shares are subject to a 1.00% CDSC on shares sold within one year after purchase. Class Y and Class Z shares are offered continuously at net asset value. There are certain restrictions on the purchase of Class Y and Class Z shares, as described in the Fund’s prospectus.
Note 2. Significant Accounting Policies
The preparation of financial statements in accordance with accounting principles generally accepted in the United States of America (“GAAP”) requires management to make certain estimates and assumptions that affect the reported amounts of assets and liabilities, the disclosure of contingent assets and liabilities at the date of the financial statements and the reported amounts of revenue and expenses during the reporting period. Actual results could differ from those estimates.
Management has evaluated the events and transactions that have occurred through the date the financial statements were issued and noted no items requiring adjustment of the financial statements or additional disclosures.
The following is a summary of significant accounting policies consistently followed by the Fund in the preparation of its financial statements.
Security Valuation
Equity securities are valued at the last sale price on the principal exchange on which they trade, except for securities traded on the NASDAQ, which are valued at the NASDAQ official close price. Unlisted securities or listed securities for which there were no sales during the day are valued at the closing bid price on such exchanges or over-the-counter markets.
Short-term investments maturing in 60 days or less are valued at amortized cost, which approximates market value.
Foreign securities are generally valued at the last sale price on the foreign exchange or market on which they trade. If any foreign share prices are not readily available as a result of limited share activity, the securities are valued at the last sale price of the local shares in the principal market in which such securities are normally traded.
Generally, trading in foreign securities is substantially completed each day at various times prior to the close of the New York Stock Exchange (“NYSE”). The values of such securities used in computing the net asset value of the Fund’s shares are determined as of such times. Foreign currency exchange rates are generally determined at 4:00 p.m. Eastern (U.S.) time. Occasionally, events affecting the values of such foreign securities and such exchange rates may occur between the times at which they are determined and the close of the customary trading session of the NYSE, which would not be reflected in the computation of the Fund’s net asset value. If events materially affecting the values of such foreign securities occur and it is determined that market quotations are not reliable, then these foreign securities will be valued at their fair value using procedures approved by the Board of Trustees.
22
Columbia Strategic Investor Fund
August 31, 2010
Investments for which market quotations are not readily available, or that have quotations which management believes are not reliable, are valued at fair value as determined in good faith under consistently applied procedures established by and under the general supervision of the Board of Trustees. If a security is valued at fair value, such value is likely to be different from the last quoted market price for the security. The determination of fair value often requires significant judgment. To determine fair value, management may use assumptions including but not limited to future cash flows and estimated risk premiums. Multiple inputs from various sources may be used to determine value.
GAAP establishes a hierarchy that prioritizes the inputs to valuation techniques used to measure fair value giving the highest priority to unadjusted quoted prices in active markets for identical securities (level 1 measurements) and the lowest priority to unobservable inputs (level 3 measurements) when market prices are not readily available or reliable. The three levels of the fair value hierarchy are described below:
| n | | Level 1 — quoted prices in active markets for identical securities |
| n | | Level 2 — prices determined using other significant observable inputs (including quoted prices for similar securities, interest rates, prepayment speeds, credit risk and others) |
| n | | Level 3 — prices determined using significant unobservable inputs. In situations where quoted prices or observable inputs are unavailable or less reliable, unobservable inputs may be used. Unobservable inputs may include management’s own assumptions about the factors market participants would use in pricing an investment. |
The inputs or methodology used for valuing securities are not necessarily an indication of the risk associated with investing in those securities.
On January 21, 2010, the Financial Accounting Standards Board issued an Accounting Standards Update (the “amendment”), Fair Value Measurements and Disclosures (Topic 820): Improving Disclosures about Fair Value Measurements, which provides guidance on how investment assets and liabilities are to be valued and disclosed. Specifically, the amendment requires reporting entities to disclose the inputs and valuation techniques used to measure fair value for both recurring and nonrecurring fair value measurements for Level 2 and Level 3 positions. The amendment also requires that transfers between all levels (including Level 1 and Level 2) be disclosed on a gross basis (i.e., transfers out must be disclosed separately from transfers in), and requires disclosure of the reason(s) for significant transfers. Additionally, purchases, sales, issuances and settlements must be disclosed on a gross basis in the Level 3 roll forward. The effective date of the amendment is for interim and annual periods beginning after December 15, 2009; except for the requirement to provide the Level 3 activity for purchases, sales, issuances and settlements on a gross basis, which will be effective for interim and annual periods beginning after December 15, 2010. At this time, management is evaluating the implications of the amendment and the impact to the financial statements.
Security Transactions
Security transactions are accounted for on the trade date. Cost is determined and gains (losses) are based upon the specific identification method for both financial statement and federal income tax purposes.
Repurchase Agreements
The Fund may engage in repurchase agreement transactions with institutions that management has determined are creditworthy. The Fund, through its custodian, receives delivery of the underlying securities collateralizing a repurchase agreement. Management is responsible for determining that the collateral is at least equal, at all times, to the value of the repurchase obligation including interest. A repurchase agreement transaction involves certain risks in the event of default or insolvency of the counterparty. These risks include possible delays in or restrictions on the Fund’s ability to dispose of the underlying securities and a possible decline in the value of the underlying securities during the period while the Fund seeks to assert its rights.
Foreign Currency Transactions and Translations
The values of all assets and liabilities quoted in foreign currencies are translated into U.S. dollars at that day’s exchange rates. Net realized and unrealized gains (losses) on foreign currency transactions and translations include gains (losses) arising from the fluctuation in exchange rates between trade and settlement dates on securities
23
Columbia Strategic Investor Fund
August 31, 2010
transactions, gains (losses) arising from the disposition of foreign currency and currency gains (losses) between the accrual and payment dates on dividends, interest income and foreign withholding taxes.
For financial statement purposes, the Fund does not distinguish that portion of gains (losses) on investments which is due to changes in foreign exchange rates from that which is due to changes in market prices of the investments. Such fluctuations are included with the net realized and unrealized gains (losses) on investments on the Statement of Operations.
Income Recognition
Interest income is recorded on the accrual basis.
Corporate actions and dividend income are recorded on the ex-date except for certain foreign securities which are recorded as soon after the ex-date as the Fund becomes aware of such, net of any non-reclaimable tax withholdings.
Expenses
General expenses of the Trust are allocated to the Fund and other series of the Trust based upon relative net assets or other expense allocation methodologies determined by the nature of the expense. Expenses directly attributable to a specific class of shares are charged to that share class. Expenses directly attributable to the Fund are charged to the Fund.
Determination of Class Net Asset Value
All income, expenses (other than class-specific expenses, as shown on the Statement of Operations) and realized and unrealized gains (losses) are allocated to each class of the Fund on a daily basis, based on the relative net assets of each class, for purposes of determining the net asset value of each class.
Federal Income Tax Status
The Fund intends to qualify each year as a “regulated investment company” under Subchapter M of the Internal Revenue Code, as amended, and will distribute substantially all of its taxable income, if any, for its tax year, and as such will not be subject to federal income taxes. In addition, the Fund intends to distribute in each calendar year substantially all of its net investment income, capital gains and certain other amounts, if any, such that the Fund should not be subject to federal excise tax. Therefore, no provision is made for federal income or excise taxes.
Foreign Tax
The Fund may be subject to foreign taxes on incomes, gains on investments or currency repatriation, a portion of which may be recoverable. The Fund will accrue such taxes and recoveries as applicable, based upon its current interpretation of tax rules and regulations that exist in the markets in which it invests.
Realized gains in certain countries may be subject to foreign taxes at the fund level, at rates ranging from approximately 10% to 15%. The Fund accrues for such foreign taxes on net realized and unrealized gains at the appropriate rate for each jurisdiction.
Distributions to Shareholders
Distributions from net investment income, if any, are declared and paid annually. Net realized capital gains, if any, are distributed at least annually. Income distributions and capital gain distributions are determined in accordance with federal income tax regulations which may differ from GAAP.
Indemnification
In the normal course of business, the Fund enters into contracts that contain a variety of representations and warranties and which provide general indemnities. The Fund’s maximum exposure under these arrangements is unknown because this would involve future claims against the Fund. Also, under the Trust’s organizational documents and by contract, the Trustees and officers of the Trust are indemnified against certain liabilities that may arise out of actions relating to their duties to the Trust. However, based on experience, the Fund expects the risk of loss due to these representations, warranties and indemnities to be minimal.
Note 3. Federal Tax Information
The timing and character of income and capital gain distributions are determined in accordance with income tax regulations, which may differ from GAAP. Reclassifications are made to the Fund’s capital accounts for permanent tax differences to reflect income and gains available for distribution (or available capital loss carryforwards) under income tax regulations.
24
Columbia Strategic Investor Fund
August 31, 2010
For the year ended August 31, 2010, permanent book and tax basis differences resulting primarily from differing treatments for foreign currency transactions were identified and reclassified among the components of the Fund’s net assets as follows:
| | | | |
| | | | | |
Undistributed Net Investment
Income | | Accumulated Net Realized
Loss | | Paid-In Capital |
| $(169,521) | | $169,521 | | $— |
Net investment income and net realized gains (losses), as disclosed on the Statement of Operations, and net assets were not affected by this reclassification.
The tax character of distributions paid during the years ended August 31, 2010 and August 31, 2009 was as follows:
| | | | | | | | |
| | | | | | | |
| | | August 31, 2010 | | | August 31, 2009 | |
Ordinary Income* | | $ | 4,557,362 | | | $ | 4,700,141 | |
Long-Term Capital Gains | | | — | | | | — | |
| * | For tax purposes short-term capital gains distributions, if any, are considered ordinary income distributions. |
As of August 31, 2010, the components of distributable earnings on a tax basis were as follows:
| | | | |
| | | | | |
Undistributed
Ordinary Income | | Undistributed Long-Term Capital Gains | | Net Unrealized Appreciation* |
| $538,081 | | $— | | $70,196,300 |
| * | The differences between book-basis and tax-basis net unrealized appreciation are primarily due to deferral of losses from wash sales. |
Unrealized appreciation and depreciation at August 31, 2010, based on cost of investments for federal income tax purposes were:
| | | | |
| | | | |
Unrealized appreciation | | $ | 111,916,292 | |
Unrealized depreciation | | | (41,719,992 | ) |
| | | | |
Net unrealized appreciation | | $ | 70,196,300 | |
The following capital loss carryforwards may be available to reduce taxable income arising from future net realized gains on investments, if any, to the extent permitted by the Internal Revenue Code:
| | | | |
| | | | |
| Year of Expiration | | Capital Loss Carryforwards | |
| 2011 | | $ | 15,870,696 | |
| 2017 | | | 122,751,575 | |
| 2018 | | | 15,524,758 | |
| | | | |
| Total | | $ | 154,147,029 | |
Of the remaining capital loss carryforwards attributable to the Fund, $15,870,696 expiring August 31, 2011 remains from the Fund’s merger with Columbia Young Investor Fund. Utilization of capital losses from Columbia Young Investor Fund could be subject to limitations imposed by the Internal Revenue Code.
Any capital loss carryforwards acquired as part of a merger that are permanently lost due to provisions under the Internal Revenue Code are included as being expired. Expired capital loss carryforwards are recorded as a reduction of paid-in capital.
Management is required to determine whether a tax position of the Fund is more likely than not to be sustained upon examination by the applicable taxing authority, including resolution of any related appeals or litigation processes, based on the technical merits of the position. The tax benefit to be recognized by the Fund is measured as the largest amount of benefit that is greater than fifty percent likely of being realized upon ultimate settlement. Management is not aware of any tax positions for which it is reasonably possible that the total amounts of unrecognized tax benefits will significantly change in the next twelve months. However, management’s conclusions may be subject to review and adjustment at a later date based on factors including, but not limited to, new tax laws, regulations, and administrative interpretations (including relevant court decisions). The Fund’s federal tax returns for the prior three fiscal years remain subject to examination by the Internal Revenue Service.
25
Columbia Strategic Investor Fund
August 31, 2010
Note 4. Fees and Compensation Paid to Affiliates
Investment Advisory Fee
After the close of business on April 30, 2010, Ameriprise Financial, Inc. (“Ameriprise Financial”) acquired a portion of the asset management business of Columbia Management Group, LLC (the “Transaction”), including the business of managing the Fund. In connection with the closing of the Transaction (the “Closing”), RiverSource Investments, LLC, a wholly owned subsidiary of Ameriprise Financial, became the investment advisor of the Fund and subsequently changed its name to Columbia Management Investment Advisers, LLC (the “New Advisor”). The New Advisor receives a monthly investment advisory fee based on the Fund’s average daily net assets at the following annual rates:
| | | | |
| | | | |
| Average Daily Net Assets | | Annual Fee Rate | |
First $500 million | | | 0.60 | % |
$500 million to $1 billion | | | 0.55 | % |
Over $1 billion | | | 0.50 | % |
Prior to the Closing, Columbia Management Advisors, LLC (“Columbia”), an indirect, wholly owned subsidiary of Bank of America Corporation (“BOA”), provided investment advisory services to the Fund under the same fee structure.
For the year ended August 31, 2010, the Fund’s effective investment advisory fee rate was 0.58% of the Fund’s average daily net assets.
Administration Fee
Effective upon the Closing, the New Advisor became the administrator of the Fund under a new Administrative Services Agreement (the “Administrative Agreement”). Under the Administrative Agreement, the New Advisor provides administrative and other services to the Fund, including services previously performed under the Pricing and Bookkeeping Oversight and Services Agreement discussed below. The New Advisor receives a monthly administration fee based on the Fund’s average daily net assets at the following annual rates:
| | | | |
| | | | |
| Average Daily Net Assets | | Annual Fee Rates | |
First $1 billion | | | 0.150 | % |
Over $1 billion | | | 0.125 | % |
Prior to the Closing, Columbia provided administrative services to the Fund at the same fee rates. For the year ended August 31, 2010, the annualized effective administration fee rate was 0.15% of the Fund’s average daily net assets.
Pricing and Bookkeeping Fees
Prior to the Closing, the Fund entered into a Financial Reporting Services Agreement (the “Financial Reporting Services Agreement”) with State Street Bank and Trust Company (“State Street”) and Columbia pursuant to which State Street provides financial reporting services to the Fund. The Fund also entered into an Accounting Services Agreement (collectively with the Financial Reporting Services Agreement, the “State Street Agreements”) with State Street and Columbia pursuant to which State Street provides accounting services to the Fund. Upon the Closing, Columbia assigned and delegated its rights and obligations under the State Street Agreements to the New Advisor. Under the State Street Agreements, the Fund pays State Street an annual fee of $38,000 paid monthly plus an additional monthly fee based on an annualized percentage rate of average daily net assets of the Fund for the month. The aggregate fee will not exceed $140,000 per year (exclusive of out-of-pocket expenses and charges). The Fund also reimburses State Street for certain out-of-pocket expenses and charges.
Also prior to the Closing, the Fund entered into a Pricing and Bookkeeping Oversight and Services Agreement (the “Services Agreement”) with Columbia. Under the Services Agreement, Columbia provided services related to Fund expenses and the requirements of the Sarbanes-Oxley Act of 2002, and provided oversight of the accounting and financial reporting services provided by State Street. Under the Services Agreement, the Fund reimbursed Columbia for out-of-pocket expenses. The Services Agreement was terminated upon the Closing. These services are now provided under the Administrative Agreement discussed above.
Transfer Agent Fee
In connection with the Closing, RiverSource Service Corporation, a wholly owned subsidiary of Ameriprise Financial, became the transfer agent of the Fund and subsequently changed its name to Columbia Management Investment Services Corp. (the “New Transfer Agent”). The New Transfer Agent has contracted with Boston Financial Data Services (“BFDS”) to serve as sub-transfer agent.
26
Columbia Strategic Investor Fund
August 31, 2010
The New Transfer Agent receives a monthly fee for its services. All share classes, with the exception of Class Y shares (the “Other Share Classes”) pay a monthly service fee (the “aggregate fee”) based on the following:
| (i) | An annual rate of $22.36 is applied to the aggregate number of accounts for the Other Share Classes. |
| (ii) | An allocated portion of fees for wire, telephone and redemption orders, Individual Retirement Account (“IRA”) trustee agent fees and account transcript fees due to the New Transfer Agent from shareholders of the Fund and credits (net of bank charges) earned with respect to balances in accounts the New Transfer Agent maintains in connection with its services to the Fund. The New Transfer Agent also receives reimbursement for certain out-of-pocket expenses. |
The aggregate fee is allocated to the Other Share Classes based on the relative average daily net assets of each share class.
Class Y shares of the Fund pay a monthly service fee based on the following:
| (i) | An annual rate of $22.36 is applied to the aggregate number of accounts for Class Y shares. |
| (ii) | An allocated portion of fees for wire, telephone and redemption orders, IRA trustee agent fees and account transcript fees due to the New Transfer Agent from shareholders of the Fund and credits (net of bank charges) earned with respect to balances in accounts the New Transfer Agent maintains in connection with its services to the Fund. The New Transfer Agent also receives reimbursement for certain out-of-pocket expenses. |
The New Transfer Agent also receives reimbursement of certain sub-transfer agent fees paid by the New Transfer Agent (exclusive of BFDS fees), calculated based on the combined assets held in the Other Share Classes in omnibus accounts and intended to recover the cost of payments to other parties (including affiliates of BOA) for services to those accounts. Such fees are allocated to the Other Share Classes based on the relative average daily net assets of each share class. The New Transfer Agent pays the fees of BFDS for services as sub-transfer agent and is not entitled to reimbursement for such fees from the Fund.
Prior to the Closing, Columbia Management Services, Inc. (the “Previous Transfer Agent”), an affiliate of Columbia and an indirect, wholly owned subsidiary of BOA, provided shareholder services to the Fund and contracted with BFDS to serve as sub-transfer agent, under the same fee structure. Prior to November 1, 2009, the annual rate was $17.34 per account.
An annual minimum account balance fee of $20 may apply to certain accounts with a value below the Fund’s initial minimum investment requirements to reduce the impact of small accounts on transfer agent fees. These minimum account balance fees are recorded as part of expense reductions on the Statement of Operations. For the year ended August 31, 2010, no minimum account balance fees were charged by the Fund.
Underwriting Discounts, Service and Distribution Fees
In connection with the Closing, RiverSource Fund Distributors, Inc., an indirect wholly owned subsidiary of Ameriprise Financial, became the distributor of the Fund and subsequently changed its name to Columbia Management Investment Distributors, Inc. (the “New Distributor”).
For the year ended August 31, 2010, initial sales charges paid by shareholders on the purchase of Class A shares amounted to $8,185 and net CDSC fees paid by shareholders on certain redemptions of Class A, Class B and Class C shares amounted to $515, $29,424 and $2,257, respectively.
The Fund has adopted shareholder servicing and distribution plans pursuant to Rule 12b-1 under the 1940 Act (the “Plans”) which require the payment of a monthly service fee to the New Distributor at the maximum annual rate of 0.25% of the average daily net assets attributable to Class A, Class B and Class C shares of the Fund. The Plans also require the payment of a monthly distribution fee to the New Distributor at the maximum annual rate of 0.75% of the average daily net assets attributable to Class B and Class C shares only.
The CDSC and the distribution fees received from the Plans are used principally as repayment to the New Distributor for amounts paid by the New Distributor to dealers who sold such shares.
Prior to the Closing, Columbia Management Distributors, Inc, an affiliate of Columbia and an indirect, wholly owned subsidiary of BOA, was the principal underwriter of the Fund’s shares. There were no changes to the underwriting discount structure of the Fund or the service or distribution fee rates paid by the Fund as a result of the Transaction.
27
Columbia Strategic Investor Fund
August 31, 2010
Expense Limits and Fee Waivers
Effective May 1, 2010, the New Advisor has voluntarily agreed to reimburse a portion of the Fund’s expenses so that the Fund’s ordinary operating expenses (excluding any distribution and service fees, brokerage commissions, interest, taxes and extraordinary expenses, but including custodian charges relating to overdrafts, if any), after giving effect to any balance credits from the Fund’s custodian, do not exceed 1.00% annually of the Fund’s average daily net assets. This arrangement may be modified or terminated by the New Advisor at any time. Prior to May 1, 2010, Columbia voluntarily reimbursed a portion of the Fund’s expenses in the same manner.
Fees Paid to Officers and Trustees
In connection with the Closing, all officers of the Fund are employees of the New Advisor or its affiliates and, with the exception of the Fund’s Chief Compliance Officer, receive no compensation from the Fund. The Board of Trustees has appointed a Chief Compliance Officer to the Fund in accordance with federal securities regulations. The Fund, along with other affiliated funds, pays its pro-rata share of the expenses associated with the Chief Compliance Officer. The Fund’s expenses for the Chief Compliance Officer will not exceed $15,000 per year. Prior to the Closing, the Fund paid its pro-rata share of the expenses for the Chief Compliance Officer under the same fee structure.
Trustees are compensated for their services to the Fund, as set forth on the Statement of Operations. The Trust’s eligible Trustees may participate in a deferred compensation plan which may be terminated at any time. Obligations of the plan will be paid solely out of the Fund’s assets.
Other Related Party Transactions
Prior to the Closing, the Fund used one or more brokers that were affiliates of BOA in connection with the purchase and sale of its securities. Total brokerage commissions paid to affiliated brokers for the period prior to the Closing were $12,629.
Note 5. Custody Credits
The Fund has an agreement with its custodian bank under which custody fees may be reduced by balance credits. These credits are recorded as part of expense reductions on the Statement of Operations. The Fund could have invested a portion of the assets utilized in connection with the expense offset arrangement in an income-producing asset if it had not entered into such an agreement. For the year ended August 31, 2010, these custody credits reduced total expenses by $33 for the Fund.
Note 6. Portfolio Information
For the year ended August 31, 2010, the cost of purchases and proceeds from sales of securities, excluding short-term obligations, for the Fund were $514,919,373 and $617,315,252, respectively.
Note 7. Regulatory Settlements
During the year ended August 31, 2009, the Fund received payments totaling $176,191 relating to certain regulatory settlements with third parties that the Fund had participated in during the twelve month period. The payments have been included in “Increase from regulatory settlements” on the Statement of Changes in Net Assets.
Note 8. Line of Credit
The Fund and other affiliated funds participate in a $280,000,000 committed, unsecured revolving line of credit provided by State Street. The maximum amount that may be borrowed by any fund is limited to the lesser of $200,000,000 and the Fund’s borrowing limit set forth in the Fund’s registration statement. Borrowings are available for short-term liquidity or temporary or emergency purposes.
Effective October 15, 2009, interest is charged to each participating fund based on the fund’s borrowings at a rate per annum equal to the greater of the Federal Funds Rate plus 1.25% or the overnight LIBOR Rate plus 1.25%. In addition, a commitment fee of 0.15% per annum is accrued and apportioned among the participating funds pro rata based on their relative net assets.
Prior to October 15, 2009, interest was charged to each participating fund based on the fund’s borrowings at a rate per annum equal to the greater of the Federal Funds Rate plus 0.50% or the overnight LIBOR Rate plus 0.50%. In addition, an annual operations agency fee of $20,000, an amendment fee of 0.02% and a commitment fee of 0.12% per annum were accrued and apportioned among the participating funds pro rata based on their relative net assets.
28
Columbia Strategic Investor Fund
August 31, 2010
For the year ended August 31, 2010, the Fund did not borrow under these arrangements.
Note 9. Significant Risks and Contingencies
Foreign Securities Risk
There are certain additional risks involved when investing in foreign securities. These risks may involve foreign currency exchange rate fluctuations, adverse political and economic developments and the possible prevention of currency exchange or other foreign governmental laws or restrictions. In addition, the liquidity of foreign securities may be more limited than that of domestic securities.
Information Regarding Pending and Settled Legal Proceedings
In June 2004, an action captioned John E. Gallus et al. v. American Express Financial Corp. and American Express Financial Advisors Inc. was filed in the United States District Court for the District of Arizona. The plaintiffs allege that they are investors in several American Express Company (now known as legacy RiverSource) mutual funds and they purport to bring the action derivatively on behalf of those funds under the Investment Company Act of 1940. The plaintiffs allege that fees allegedly paid to the defendants by the funds for investment advisory and administrative services are excessive. The plaintiffs seek remedies including restitution and rescission of investment advisory and distribution agreements. The plaintiffs voluntarily agreed to transfer this case to the United States District Court for the District of Minnesota (the District Court). In response to defendants’ motion to dismiss the complaint, the District Court dismissed one of plaintiffs’ four claims and granted plaintiffs limited discovery. Defendants moved for summary judgment in April 2007. Summary judgment was granted in the defendants’ favor on July 9, 2007. The plaintiffs filed a notice of appeal with the Eighth Circuit Court of Appeals (the Eighth Circuit) on August 8, 2007. On April 8, 2009, the Eighth Circuit reversed summary judgment and remanded to the District Court for further proceedings. On August 6, 2009, defendants filed a writ of certiorari with the U.S. Supreme Court (the Supreme Court), asking the Supreme Court to stay the District Court proceedings while the Supreme Court considers and rules in a case captioned Jones v. Harris Associates, which involves issues of law similar to those presented in the Gallus case. On March 30, 2010, the Supreme Court issued its ruling in Jones v. Harris Associates, and on April 5, 2010, the Supreme Court vacated the Eighth Circuit’s decision in the Gallus case and remanded the case to the Eighth Circuit for further consideration in light of the Supreme Court’s decision in Jones v. Harris Associates. On June 4, 2010, the Eighth Circuit remanded the Gallus case to the District Court for further consideration in light of the Supreme Court’s decision in Jones v. Harris Associates.
In December 2005, without admitting or denying the allegations, American Express Financial Corporation (AEFC, which is now known as Ameriprise Financial, Inc. (Ameriprise Financial)), entered into settlement agreements with the Securities and Exchange Commission (SEC) and Minnesota Department of Commerce (MDOC) related to market timing activities. As a result, AEFC was censured and ordered to cease and desist from committing or causing any violations of certain provisions of the Investment Advisers Act of 1940, the Investment Company Act of 1940, and various Minnesota laws. AEFC agreed to pay disgorgement of $10 million and civil money penalties of $7 million. AEFC also agreed to retain an independent distribution consultant to assist in developing a plan for distribution of all disgorgement and civil penalties ordered by the SEC in accordance with various undertakings detailed at http://www.sec.gov/litigation/ admin/ia-2451.pdf. Ameriprise Financial and its affiliates have cooperated with the SEC and the MDOC in these legal proceedings, and have made regular reports to the funds’ Boards of Directors/Trustees.
Ameriprise Financial and certain of its affiliates have historically been involved in a number of legal, arbitration and regulatory proceedings, including routine litigation, class actions, and governmental actions, concerning matters arising in connection with the conduct of their business activities. Ameriprise Financial believes that the Funds are not currently the subject of, and that neither Ameriprise Financial nor any of its affiliates are the subject of, any pending legal, arbitration or regulatory proceedings that are likely to have a material adverse effect on the Funds or the ability of Ameriprise Financial or its affiliates to perform under their contracts with the Funds. Ameriprise Financial is required to make 10-Q, 10-K and, as necessary, 8-K filings with the Securities and Exchange Commission on legal and regulatory matters that relate to Ameriprise Financial and its affiliates. Copies of these filings may be obtained by accessing the SEC website at www.sec.gov.
29
Columbia Strategic Investor Fund
August 31, 2010
There can be no assurance that these matters, or the adverse publicity associated with them, will not result in increased fund redemptions, reduced sale of fund shares or other adverse consequences to the Funds. Further, although we believe proceedings are not likely to have a material adverse effect on the Funds or the ability of Ameriprise Financial or its affiliates to perform under their contracts with the Funds, these proceedings are subject to uncertainties and, as such, we are unable to estimate the possible loss or range of loss that may result. An adverse outcome in one or more of these proceedings could result in adverse judgments, settlements, fines, penalties or other relief that could have a material adverse effect on the consolidated financial condition or results of operations of Ameriprise Financial.
30
Report of Independent Registered Public Accounting Firm
To the Trustees of Columbia Funds Series Trust I and Shareholders of Columbia Strategic Investor Fund
In our opinion, the accompanying statement of assets and liabilities, including the investment portfolio, and the related statements of operations and of changes in net assets and the financial highlights present fairly, in all material respects, the financial position of Columbia Strategic Investor Fund (the “Fund”) (a series of Columbia Funds Series Trust I) at August 31, 2010, the results of its operations for the year then ended, the changes in its net assets for each of the two years in the period then ended, and the financial highlights for each of the five years in the period then ended, in conformity with accounting principles generally accepted in the United States of America. These financial statements and financial highlights (hereafter referred to as “financial statements”) are the responsibility of the Fund’s management. Our responsibility is to express an opinion on these financial statements based on our audits. We conducted our audits of these financial statements in accordance with the standards of the Public Company Accounting Oversight Board (United States). Those standards require that we plan and perform the audit to obtain reasonable assurance about whether the financial statements are free of material misstatement. An audit includes examining, on a test basis, evidence supporting the amounts and disclosures in the financial statements, assessing the accounting principles used and significant estimates made by management, and evaluating the overall financial statement presentation. We believe that our audits, which included confirmation of securities at August 31, 2010 by correspondence with the custodian and brokers, provide a reasonable basis for our opinion.
PricewaterhouseCoopers LLP
Boston, Massachusetts
October 25, 2010
31
Federal Income Tax Information (Unaudited) – Columbia Strategic Investor Fund
For non-corporate shareholders 100.0% or the maximum amount allowable under the Jobs and Growth Tax Relief Reconciliation Act of 2003, of the ordinary income distributed by the Fund for the fiscal year ended August 31, 2010 may represent qualified dividend income.
100.0% of the ordinary income distributed by the Fund, for the year ended August 31, 2010, qualifies for the corporate dividends received deduction.
The Fund will notify shareholders on January 2011 of amounts for use in preparing 2010 income tax returns.
32
Fund Governance
The Trustees serve terms of indefinite duration. The names, addresses and birth years of the Trustees and Officers of the Funds in the Columbia Funds Series Trust I, the year each was first elected or appointed to office, their principal business occupations during at least the last five years, the number of Funds overseen by each Trustee and other directorships they hold are shown below. Each officer listed below serves as an officer of each Fund in the Columbia Funds Complex.
Independent Trustees
| | |
Name, Address and Year of Birth,
Position with Funds, Year First
Elected or Appointed to Office | | Principal Occupation(s) During Past Five Years, Number of Funds in Columbia Funds
Complex Overseen by Trustee, Other Directorships Held |
| |
| John D. Collins (Born 1938) | | |
c/o Columbia Management Investment Advisers, LLC One Financial Center Boston, MA 02111 Trustee (since 2005) | | Retired. Consultant, KPMG, LLP (accounting and tax firm) from July 1999 to June 2000; Partner, KPMG, LLP from March 1962 to June 1999. Oversees 64; Mrs. Fields Original Cookies, Inc. (consumer products); Suburban Propane Partners, L.P.; and Montpelier Re (insurance underwriting firm) |
| |
| Rodman L. Drake (Born 1943) | | |
c/o Columbia Management Investment Advisers, LLC One Financial Center Boston, MA 02111 Trustee (since 1994) and Chairman of the Board (since 2009) | | Co-Founder of Baringo Capital LLC (private equity) since 2002; CEO of Crystal River Capital, Inc. (real estate investment trust) since 2003; President, Continuation Investments Group, Inc. from 1997 to 2001. Oversees 64; Jackson Hewitt Tax Service Inc. (tax preparation services); Crystal Capital River Inc. (real estate investment trust); Student Loan Corporation (student loan provider); Celgene Corporation (global biotechnology company); The Helios Funds (exchange-traded funds); and Apex Silver Mines Ltd. from 2007 to 2009 |
| |
| Douglas A. Hacker (Born 1955) | | |
c/o Columbia Management Investment Advisers, LLC One Financial Center Boston, MA 02111 Trustee (since 1996) | | Independent business executive since May 2006; Executive Vice President–Strategy of United Airlines (airline) from December 2002 to May 2006; President of UAL Loyalty Services (airline marketing company) from September 2001 to December 2002; Executive Vice President and Chief Financial Officer of United Airlines from July 1999 to September 2001. Oversees 64; Nash Finch Company (food distributor); Aircastle Limited (aircraft leasing) |
|
| Janet Langford Kelly (Born 1957) |
c/o Columbia Management Investment Advisers, LLC One Financial Center Boston, MA 02111 Trustee (since 1996) | | Senior Vice President, General Counsel and Corporate Secretary, ConocoPhillips (integrated energy company) since September 2007; Deputy General Counsel–Corporate Legal Services, ConocoPhillips from August 2006 to August 2007; Partner, Zelle, Hofmann, Voelbel, Mason & Gette LLP (law firm) from March 2005 to July 2006; Adjunct Professor of Law, Northwestern University, from September 2004 to June 2006; Director, UAL Corporation (airline) from February 2006 to July 2006; Oversees 64; None |
| |
| Charles R. Nelson (Born 1942) | | |
c/o Columbia Management Investment Advisers, LLC One Financial Center Boston, MA 02111 Trustee (since 1981) | | Professor of Economics, University of Washington, since January 1976; Ford and Louisa Van Voorhis Professor of Political Economy, University of Washington, since September 1993; Adjunct Professor of Statistics, University of Washington, since September 1980; Associate Editor, Journal of Money Credit and Banking, 1993-2008 Consultant on econometric and statistical matters. Oversees 64; None |
33
Fund Governance (continued)
Independent Trustees (continued)
| | |
Name, Address and Year of Birth,
Position with Funds, Year First
Elected or Appointed to Office | | Principal Occupation(s) During Past Five Years, Number of Funds in Columbia Funds
Complex Overseen by Trustee, Other Directorships Held |
| |
| John J. Neuhauser (Born 1943) | | |
c/o Columbia Management Investment Advisers, LLC One Financial Center Boston, MA 02111 Trustee (since 1984) | | President, Saint Michael’s College, since August 2007; Director or Trustee of several non-profit organization, including Fletcher Allen Health Care, Inc.; University Professor, Boston College from November 2005 to August 2007; Academic Vice President and Dean of Faculties, Boston College from August 1999 to October 2005. Oversees 64; Liberty All-Star Equity Fund and Liberty All-Star Growth Fund, Inc. (closed-end funds) |
| |
| Jonathan Piel (Born 1938) | | |
c/o Columbia Management Investment Advisers, LLC One Financial Center Boston, MA 02111 Trustee (since 1994) | | Cable television producer and website designer; The Editor, Scientific American from 1984 to 1994; Vice President, Scientific American, Inc., from 1984 to 1994; Member, Advisory Board, Stone Age Institute, Bloomington, Indiana (research institute that explores the effect of technology on human evolution); Member, Board of Directors of the National Institute of Social Sciences, New York City; Member, Board of Trustees of the William Alanson White Institute, New York City (institution for training psychoanalysts); and Member, Advisory Board, Mount Sinai Children’s Environmental Health Center, New York. Oversees 64; None |
| |
| Patrick J. Simpson (Born 1944) | | |
c/o Columbia Management Investment Advisers, LLC One Financial Center Boston, MA 02111 Trustee (since 2000) | | Partner, Perkins Coie LLP (law firm). Oversees 64; None |
| |
| Anne-Lee Verville (Born 1945) | | |
c/o Columbia Management Investment Advisers, LLC One Financial Center Boston, MA 02111 Trustee (since 1998) | | Retired since 1997 (formerly General Manager–Global Education Industry (from 1994 to 1997), President–Application Systems Division (from 1991 to 1994), Chief Financial Officer–US Marketing & Services (from 1988 to 1991), and Chief Information Officer (from 1987 to 1988), IBM Corporation (computer and technology)). Oversees 64; Enesco Group, Inc. (producer of giftware and home and garden decor products) from 2001 to 2006 |
34
Fund Governance (continued)
Interested Trustee
| | |
Name, Address and Year of Birth,
Position with Funds, Year First
Elected or Appointed to Office | | Principal Occupation(s) During Past Five Years, Number of Funds in Columbia Funds
Complex Overseen by Trustee, Other Directorships Held |
| |
| William E. Mayer1 (Born 1940) | | |
c/o Columbia Management Investment Advisers, LLC One Financial Center Boston, MA 02111 Trustee (since 1994) | | Partner, Park Avenue Equity Partners (private equity) since February 1999; Dean and Professor, College of Business and Management, University of Maryland from 1992 to 1996. Oversees 64; DynaVox Inc. (software developer); Lee Enterprises (print media), WR Hambrecht + Co. (financial service provider); BlackRock Kelso Capital Corporation (investment company) |
| 1 | Mr. Mayer may technically be an “interested person” (as defined in the Investment Company Act of 1940) by reason of his affiliation with WR Hambrecht + Co., a registered broker/dealer that may execute portfolio transactions for, engage in principal transactions with or distribute shares of a Fund or other funds or accounts advised/managed by the Advisor or any sub-advisor to a Fund. |
The Statement of Additional Information includes additional information about the Trustees of the Funds and is available, without charge, upon request by calling 1-800-345-6611.
35
Fund Governance (continued)
Officers
| | |
| Name, Year of Birth and Address | | Principal Occupation(s) During the Past Five Years |
| |
| J. Kevin Connaughton (Born 1964) | | |
One Financial Center Boston, MA 02111 President (since 2009) | | Senior Vice President and General Manager–Mutual Fund Products, Columbia Management Investment Advisers, LLC since May 2010; President, Columbia Funds, since 2009, and RiverSource Funds, since May 2010 (previously Senior Vice President and Chief Financial Officer, Columbia Funds, from June 2008 to January 2009, Treasurer, Columbia Funds, from October 2003 to May 2008, and senior officer of various other affiliated funds since 2000); Managing Director, Columbia Management Advisors, LLC from December 2004 to April 2010. |
| |
| Michael G. Clarke (Born 1969) | | |
One Financial Center Boston, MA 02111 Senior Vice President and Chief Financial Officer (since 2009) | | Vice President, Columbia Management Investment Advisers, LLC since May 2010; Managing Director of Fund Administration, Columbia Management Advisors, LLC, from September 2004 to April 2010; senior officer of Columbia Funds and affiliated funds since 2002. |
| |
| Scott R. Plummer (Born 1959) | | |
5228 Ameriprise Financial Center Minneapolis, MN 55474 Senior Vice President, Secretary and Chief Legal Officer (since 2010) | | Chief Legal Officer and Assistant Secretary, Columbia Management Investment Advisers, LLC since June 2005; Vice President and Lead Chief Counsel–Asset Management, Ameriprise Financial, Inc. since May 2010 (previously Vice President and Chief Counsel–Asset Management, from 2005 to April 2010, and Vice President–Asset Management Compliance from 2004 to 2005); Vice President, Chief Counsel and Assistant Secretary, Columbia Management Investment Distributors, Inc. since 2008; Vice President, General Counsel and Secretary, Ameriprise Certificate Company since 2005; Chief Counsel, RiverSource Distributors, Inc. since 2006; Vice President, General Counsel and Secretary, RiverSource Funds, since December 2006; Senior Vice President, Secretary and Chief Legal Officer, Columbia Funds, since May 2010. |
| |
| Linda J. Wondrack (Born 1964) | | |
One Financial Center Boston, MA 02111 Senior Vice President and Chief Compliance Officer (since 2007) | | Vice President and Chief Compliance Officer, Columbia Management Investment Advisers, LLC since May 2010; Chief Compliance Officer, Columbia Funds, since 2007, and RiverSource Funds, since May 2010; Director (Columbia Management Group, LLC and Investment Product Group Compliance), Bank of America, from June 2005 to April 2010; Director of Corporate Compliance and Conflicts Officer of MFS Investment Management (investment management) from August 2004 to May 2005. |
| |
| William F. Truscott (Born 1960) | | |
53600 Ameriprise Financial Center Minneapolis, MN 55474 Senior Vice President (since 2010) | | Chairman of the Board, Columbia Management Investment Advisers, LLC since May 2010 (previously President, Chairman of the Board and Chief Investment Officer, from 2001 to April 2010); Chief Executive Officer, U.S. Asset Management & President, Annuities, Ameriprise Financial, Inc. since May 2010 (previously President–U.S. Asset Management and Chief Investment Officer from 2005 to April 2010, and Senior Vice President — Chief Investment Officer, from 2001 to 2005); Director, President and Chief Executive Officer, Ameriprise Certificate Company since 2006; Director, Columbia Management Investment Distributors, Inc. since May 2010 (previously Chairman of the Board and Chief Executive Officer from 2008 to April 2010); Chairman of the Board and Chief Executive Officer, RiverSource Distributors, Inc. since 2006. |
36
Fund Governance (continued)
Officers (continued)
| | |
| Name, Year of Birth and Address | | Principal Occupation(s) During the Past Five Years |
|
| Colin Moore (Born 1958) |
One Financial Center Boston, MA 02111 Senior Vice President (since 2010) | | Director and Chief Investment Officer, Columbia Management Investment Advisers, LLC since May 2010; Manager, Managing Director and Chief Investment Officer of Columbia Management Advisors, LLC from 2007 to April 2010; Head of Equities, Columbia Management Advisors, LLC from 2002 to 2007. |
| |
| Michael A. Jones (Born 1959) | | |
100 Federal Street Boston, MA 02110 Senior Vice President (since 2010) | | Director and President, Columbia Management Investment Advisers, LLC since May 2010; President and Director, Columbia Management Investment Distributors, Inc. since May 2010; Manager, Chairman, Chief Executive Officer and President, Columbia Management Advisors, LLC from 2007 to April 2010; Chief Executive Officer, President and Director, Columbia Management Distributors, Inc. from November 2006 to April 2010; previously, co-president and senior managing director at Robeco Investment Management. |
| |
| Amy Johnson (Born 1965) | | |
5228 Ameriprise Financial Center Minneapolis, MN 55474 Senior Vice President (since 2010) | | Senior Vice President and Chief Operating Officer, Columbia Management Investment Advisers, LLC since May 2010 (previously Chief Administrative Officer, from 2009 until April 2010, Vice President–Asset Management and Trust Company Services, from 2006 to 2009, and Vice President–Operations and Compliance from 2004 to 2006). |
| |
| Joseph F. DiMaria (Born 1968) | | |
One Financial Center Boston, MA 02111 Treasurer (since 2009) and Chief Accounting Officer (since 2008) | | Vice President, Mutual Fund Administration, Columbia Management Investment Advisers, LLC, since May 2010; Director of Fund Administration, Columbia Management Advisors, LLC from January 2006 to April 2010; Head of Tax/Compliance and Assistant Treasurer, Columbia Management Advisors, LLC, from November 2004 to December 2005. |
| |
| Marybeth Pilat (Born 1968) | | |
One Financial Center Boston, MA 02111 Deputy Treasurer (since 2010) | | Vice President, Mutual Fund Administration, Columbia Management Investment Advisers, LLC, since May 2010; Vice President, Investment Operations, Bank of America, from October 2008 to April 2010; Finance Manager, Boston Children’s Hospital from August 2008 to October 2008; Director, Mutual Fund Administration, Columbia Management Advisors, LLC, from May 2007 to July 2008; Vice President, Mutual Fund Valuation, Columbia Management Advisors, LLC, from January 2006 to May 2007; Vice President, Mutual Fund Accounting Oversight, Columbia Management Advisors, LLC from January 2005 to January 2006. |
| |
| Julian Quero (Born 1967) | | |
One Financial Center Boston, MA 02111 Deputy Treasurer (since 2008) | | Vice President, Mutual Fund Administration, Columbia Management Investment Advisers, LLC since May 2010; Director of Fund Administration, Columbia Management Advisors, LLC, from August 2008 to April 2010; Senior Tax Manager, Columbia Management Advisors, LLC from August 2006 to July 2008; Senior Compliance Manager, Columbia Management Advisors, LLC from April 2002 to August 2006. |
| |
| Stephen T. Welsh (Born 1957) | | |
One Financial Center Boston, MA 02111 Vice President (since 2006) | | President and Director, Columbia Management Investment Services Corp. since May 2010; President and Director, Columbia Management Services, Inc. from July 2004 to April 2010; Managing Director, Columbia Management Distributors, Inc. from August 2007 to April 2010. |
37
Summary of Management Fee Evaluation by Independent Fee Consultant (RiverSource Investments, LLC)
EXCERPTS FROM REPORT OF INDEPENDENT FEE CONSULTANT TO THE FUNDS SUPERVISED BY THE COLUMBIA ATLANTIC BOARD
Prepared Pursuant to the February 9, 2005 Assurance of Discontinuance among the Office of Attorney General of New York State, Columbia Management Advisors, LLC, and Columbia Management Distributors, Inc. December 21, 2009
I. Overview
On February 9, 2005, Columbia Management Advisors, LLC (“CMA”) and Columbia Management Distributors, Inc.1 (“CMD”) agreed to the New York Attorney General’s Assurance of Discontinuance (“AOD”). Among other things, the AOD stipulates that CMA may manage or advise a Columbia Fund (“Columbia Fund” and, together with some or all of such funds, the “Columbia Funds”) only if the Independent Members of the Columbia Fund’s Board of Trustees appoint a Senior Officer or retain an Independent Fee Consultant (“IFC”) who is to manage the process by which proposed management fees are negotiated. The AOD further stipulates that the Senior Officer or IFC is to prepare a written annual evaluation of the fee negotiation process.
With effect from January 1, 2007, the Independent Members of the Board of Trustees for certain Columbia Funds known collectively as the “Atlantic Funds” (together with the other members of that Board, the “Trustees”) retained me as IFC for the Atlantic Funds.2 In this capacity, I have prepared this written evaluation of the fee negotiation process. As was the case with the last three annual reports, my immediate predecessor as IFC, John Rea, provided invaluable assistance in the preparation of this report.
On September 29, 2009, Ameriprise entered into an asset purchase agreement with Bank of America, N.A. and its parent, Bank of America Corporation (together, the “Bank”) pursuant to which the Bank agreed to sell certain CMG assets relating to Columbia’s long-term asset management business, including management of the Atlantic Funds (the “Transaction”).3 The Transaction if completed would result in the termination of the existing Investment Management Agreements with CMA. Therefore, the Trustees have been requested to approve and recommend to the shareholders of each Atlantic Fund new Investment Management and Sub-Advisory Agreements (together, the “Management Agreements”) with RiverSource Investments, LLC (“RI”),4 investment manager of the RiverSource Funds and a subsidiary of Ameriprise. This report is intended to fulfill the requirements of the AOD with respect to the Trustees’ consideration of the new Management Agreements.
A. Role of the Independent Fee Consultant
The AOD charges the IFC with “managing the process by which proposed management fees … to be charged the Columbia Fund are negotiated so that they are negotiated in a manner which is at arms’ length and reasonable and consistent with this Assurance of Discontinuance.” The AOD also provides that CMA “may manage or advise a Columbia Fund only if the reasonableness of the proposed management fees is determined by the Board of Trustees … using … an annual independent written evaluation prepared by or under the direction of … the Independent Fee Consultant.” Therefore, the AOD makes clear that the IFC does not supplant the Trustees in negotiating management fees with CMA (or RI), nor does the IFC substitute his or her judgment for that of the Trustees with respect to the reasonableness of proposed fees or any other matter that is committed to the business judgment of the Trustees.
| 1 | CMA and CMD are subsidiaries of Columbia Management Group, LLC (“CMG”), and are the successors to the entities named in the AOD. |
| 2 | I have no material relationship with Bank of America, CMG or Ameriprise Financial, Inc. (“Ameriprise”), aside from serving as IFC, and I am aware of no material relationship with any of their affiliates. I retained John Rea, an independent economic consultant, to assist me with this report. |
| | Unless otherwise stated or required by the context, this report covers only the Atlantic Funds. |
| 3 | Preliminary Response of Ameriprise to Information Request of Columbia Atlantic Board dated October 21, 2009 (hereafter, the “Preliminary Response”), p. 1. The one money market Atlantic Fund, Money Market Fund VS, was included in the Transaction because it was an integral part of CMG's array of Funds used as investment vehicles by variable annuity and similar insurance products. |
| 4 | Ameriprise intends to re-brand RI with the “Columbia” name (which is one of the assets being sold in the Transaction). Preliminary Response, pp. 4-5. In the case of new Sub-Advisory Agreements, the current sub-adviser would also be a party. |
38
B. Elements Involved in Managing the Fee Negotiation Process
In preparing the report required by the AOD, the IFC must consider at least the following six factors set forth in the AOD:
| 1. | The nature and quality of the adviser’s services, including the Fund’s performance; |
| 2. | Management fees (including any components thereof) charged by other mutual fund companies for like services; |
| 3. | Possible economies of scale as the Fund grows larger; |
| 4. | Management fees (including any components thereof) charged to institutional and other clients of the adviser for like services; |
| 5. | Costs to the adviser and its affiliates of supplying services pursuant to the management fee agreements, excluding any intra-corporate profit; and |
| 6. | Profit margins of the adviser and its affiliates from supplying such services. |
C. Data Presented to the Trustees
In considering the proposed new Management Agreements with RI, the Trustees relied in part on the data that had been prepared as part of their annual contract review process, which concluded in late October. This data remained relevant because the fees in the proposed Management Agreements were identical to the fees approved at that time. The annual review materials included a Lipper report on the performance of each Atlantic Fund compared to its peers and its benchmark, comparisons of the fees and expenses of each Atlantic Fund to similar CMG-sponsored Funds, comparable competitive funds chosen by Lipper, and institutional accounts advised by CMA, revenues, expenses, and profits of CMG from managing the Atlantic Funds, calculated both by Fund and collectively, and CMG’s views on the existence and sharing of economies of scale.
In addition, the Trustees reviewed materials specific to the proposed new Management Agreements with RI in response to requests for information made on behalf of the Trustees, including the following:
| n | | Performance data for the RiverSource Funds showing percentile and quartile rankings of each fund within its Lipper performance universe for periods up to five years and net returns of each fund relative to its benchmark returns. This data was arguably relevant due to the possibility that some RiverSource investment teams would be providing investment management services to certain Columbia Funds.5 |
| n | | tables comparing the fee schedules and effective fee rates of funds managed by CMA and RI and institutional accounts advised by the two firms. |
| n | | extensive discussion of the process by which the various components of the two asset management businesses would be integrated including investment management, compliance, transfer agency, custody, fund accounting, and distribution. |
| n | | information about the financial condition of Ameriprise, including its most recent annual report on Form 10-K, RI’s profit margins from managing the RiverSource Funds in 2007 and 2008, and pro forma income statements for the combined Columbia and RiverSource fund complex. |
| n | | disclosure that certain senior CMG executives, including President Michael Jones, Chief Investment Officer Colin Moore, Head of Mutual Funds J. Kevin Connaughton, and Chief Compliance Officer Linda Wondrack would continue in analogous capacities following the consummation of the Transaction, and |
| n | | a breakdown of the synergies RI expects to realize in the two years following the Transaction and the extent to which those potential synergies are expected to be shared with shareholders of funds advised by RI. |
| 5 | On page 20 of its Supplemental Response to the Atlantic Trustees (undated but delivered November 24, 2009), Ameriprise said that “most personnel decisions, including with respect to the portfolio management teams for the Atlantic Funds . . . will be made primarily by [current CMA CIO] Colin Moore using the Columbia 5P process.” |
39
II. Findings
| 1. | Based upon my examination of the information supplied by CMG and Ameriprise in the light of the six factors set forth in the AOD, I conclude that the Trustees have the relevant information necessary to evaluate the reasonableness of the proposed management fees for each Atlantic Fund. |
| 2. | In my view, the process by which the proposed management fees of the Atlantic Funds have been negotiated with RI thus far has been, to the extent practicable, at arms’ length and reasonable and consistent with the AOD. |
Respectfully submitted,
Steven E. Asher
40
Shareholder Meeting Results
Columbia Strategic Investor Fund
On March 3, 2010, a special meeting of shareholders of Columbia Funds Series Trust I was held to consider the approval of several proposals listed in the proxy statement for the meeting. Proposal 1 and Proposal 2 were voted on at the March 3, 2010 meeting of shareholders and Proposal 3 was voted on at an adjourned meeting of shareholders held on March 31, 2010. The shareholder meeting results are as follows:
Proposal 1: A proposed Investment Management Services Agreement with Columbia Management Investment Advisers, LLC (formerly, RiverSource Investments, LLC) (CMIA) was approved as follows:
| | | | | | |
| | | | | | | |
| Votes For | | Votes Against | | Abstentions | | Broker Non-Votes |
| 381,035,626 | | 21,973,786 | | 15,767,912 | | 49,616,691 |
Proposal 2: A proposal authorizing CMIA to enter into and materially amend subadvisory agreements for the Fund in the future, with the approval of the Trust’s Board of Trustees, but without obtaining additional shareholder approval, was approved as follows:
| | | | | | |
| | | | | | | |
| Votes For | | Votes Against | | Abstentions | | Broker Non-Votes |
| 367,023,918 | | 36,233,132 | | 15,520,226 | | 49,616,739 |
Proposal 3: Each of the nominees for trustees was elected to the Trust’s Board of Trustees, as follows:
| | | | | | |
| | | | | | | |
| Trustee | | Votes For | | Votes Withheld | | Abstentions |
| John D. Collins | | 30,977,072,412 | | 859,827,038 | | 0 |
| Rodman L. Drake | | 30,951,179,004 | | 885,720,446 | | 0 |
| Douglas A. Hacker | | 30,989,793,279 | | 847,106,171 | | 0 |
| Janet Langford Kelly | | 30,999,020,814 | | 837,878,636 | | 0 |
| William E. Mayer | | 16,291,139,483 | | 15,545,759,967 | | 0 |
| Charles R. Nelson | | 30,997,700,700 | | 839,198,750 | | 0 |
| John J. Neuhauser | | 30,988,095,661 | | 848,803,789 | | 0 |
| Jonathon Piel | | 30,968,801,048 | | 868,098,402 | | 0 |
| Patrick J. Simpson | | 30,999,065,030 | | 837,834,420 | | 0 |
| Anne-Lee Verville | | 30,996,227,913 | | 840,671,537 | | 0 |
41
[THIS PAGE INTENTIONALLY LEFT BLANK]
42
[THIS PAGE INTENTIONALLY LEFT BLANK]
43
[THIS PAGE INTENTIONALLY LEFT BLANK]
44
Important Information About This Report
The fund mails one shareholder report to each shareholder address. If you would like more than one report, please call shareholder services at 1-800-345-6611 and additional reports will be sent to you. This report has been prepared for shareholders of Columbia Strategic Investor Fund.
A description of the policies and procedures that the fund uses to determine how to vote proxies and a copy of the fund’s voting records are available (i) at www.columbiamanagement.com, (ii) on the Securities and Exchange Commission’s website at www.sec.gov, and (iii) without charge, upon request, by calling 1-800-368-0346. Information regarding how the fund voted proxies relating to portfolio securities during the 12-month period ended June 30 is available from the SEC’s website. Information regarding how the fund voted proxies relating to portfolio securities is also available from the fund’s website, www.columbiamanagement.com.
The fund files a complete schedule of portfolio holdings with the SEC for the first and third quarters of each fiscal year on Form N-Q. The fund’s Form N-Q is available on the SEC’s website at www.sec.gov and may be reviewed and copied at the SEC’s Public Reference Room in Washington, D.C. Information on the operation of the Public Reference Room may be obtained by calling
1-800-SEC-0330.
Transfer Agent
Columbia Management Investment Services Corp.
P.O. Box 8081
Boston, MA 02266-8081
1-800-345-6611
Distributor
Columbia Management Investment
Distributors, Inc.
One Financial Center
Boston, MA 02111
Investment Advisor
Columbia Management Investment Advisers, LLC
100 Federal Street
Boston, MA 02110
45

Columbia Strategic Investor Fund
P.O. Box 8081
Boston, MA 02266-8081
columbiamanagement.com
This information is for use with concurrent or prior delivery of a fund prospectus. Investors should consider the investment objectives, risks, charges and expenses of a mutual fund carefully before investing. For a free prospectus, which contains this and other important information about the funds, visit columbiamanagement.com. Read the prospectus carefully before investing. The Fund is distributed by Columbia Management Investment Distributors, Inc., member FINRA, and managed by Columbia Management Investment Advisers, LLC.
©2010 Columbia Management Investment Advisers, LLC. All rights reserved.
C-1381 A (10/10)

Columbia Federal Securities Fund
Annual Report for the Period Ended August 31, 2010
Table of contents
The views expressed in this report reflect the current views of the respective parties. These views are not guarantees of future performance and involve certain risks, uncertainties and assumptions that are difficult to predict, so actual outcomes and results may differ significantly from the views expressed. These views are subject to change at any time based upon economic, market or other conditions and the respective parties disclaim any responsibility to update such views. These views may not be relied on as investment advice and, because investment decisions for a Columbia Fund are based on numerous factors, may not be relied on as an indication of trading intent on behalf of any particular Columbia Fund. References to specific company securities should not be construed as a recommendation or investment advice.
President’s Message

Dear Shareholder:
The Columbia Management story began over 100 years ago, and today, we are one of the nation’s largest dedicated asset managers. The recent acquisition by Ameriprise Financial, Inc. brings together the talents, resources and capabilities of Columbia Management with those of RiverSource Investments, Threadneedle (acquired by Ameriprise in 2003) and Seligman Investments (acquired by Ameriprise in 2008) to build a best-in-class asset management business that we believe is truly greater than its parts.
RiverSource Investments traces its roots to 1894 when its then newly-founded predecessor, Investors Syndicate, offered a face-amount savings certificate that gave small investors the opportunity to build a safe and secure fund for retirement, education or other special needs. A mutual fund pioneer, Investors Syndicate launched Investors Mutual Fund in 1940. In the decades that followed, its mutual fund products and services lineup grew to include a full spectrum of styles and specialties. More than 110 years later, RiverSource continues to be a trusted financial products leader.
Threadneedle, a leader in global asset management and one of Europe’s largest asset managers, offers sophisticated international experience from a dedicated U.K. management team. Headquartered in London, it is named for Threadneedle Street in the heart of the city’s financial district, where British investors pioneered international and global investing. Threadneedle was acquired in 2003 and today operates as an affiliate of Columbia Management.
Seligman Investments’ beginnings date back to the establishment of the investment firm J. & W. Seligman & Co. in 1864. In the years that followed, Seligman played a major role in the geographical expansion and industrial development of the United States. In 1874, President Ulysses S. Grant named Seligman as fiscal agent for the U.S. Navy — an appointment that would last through World War I. Seligman helped finance the westward path of the railroads and the building of the Panama Canal. The firm organized its first investment company in 1929 and began managing its first mutual fund in 1930. In 2008, J. & W. Seligman & Co. Incorporated was acquired and Seligman Investments became an offering brand of RiverSource Investments, LLC.
We are proud of the rich and distinctive history of these firms, the strength and breadth of products and services they offer, and the combined cultures of pioneering spirit and forward thinking. Together we are committed to providing more for our shareholders than ever before.
| n | | A singular focus on our shareholders. Our business is asset management, so investors are our first priority. We dedicate our resources to identifying timely investment opportunities and provide a comprehensive choice of equity, fixed-income and alternative investments to help meet your individual needs. |
| n | | First-class research and thought leadership. We are dedicated to helping you take advantage of today’s opportunities and anticipate tomorrow’s. We stay abreast of the latest investment trends and ideas, using our collective insight to evaluate events and transform them into solutions you can use. |
| n | | A disciplined investment approach. We aren’t distracted by passing fads. Our teams adhere to a rigorous investment process that helps ensure the integrity of our products and enables you and your financial advisor to match our solutions to your objectives with confidence. |
When you choose Columbia Management, you can be confident that we will take the time to understand your needs and help you and your financial advisor identify the solutions that are right for you. Because at Columbia Management, we don’t consider ourselves successful unless you are.
Sincerely,

J. Kevin Connaughton
President, Columbia Funds
Investors should consider the investment objectives, risks, charges and expenses of a mutual fund carefully before investing. For a free prospectus, which contains this and other important information about the funds, visit columbiamanagement.com. The prospectus should be read carefully before investing.
Columbia Funds are distributed by Columbia Management Investment Distributors, Inc., member FINRA, and managed by Columbia Management Investment Advisers, LLC.
© 2010 Columbia Management Investment Advisers, LLC. All rights reserved.
Fund Profile – Columbia Federal Securities Fund
Summary
| n | | For the 12-month period that ended August 31, 2010, the fund’s Class A shares returned 6.34% without sales charge. |
| n | | The fund’s return was lower than the return of its benchmark, the Citigroup Government/Mortgage Index1, and the average return of the funds in its peer group, the Lipper General U.S. Government Funds Classification.2 |
| n | | The fund fell short during a strong Treasury rally in the spring. Since then, new managers have taken steps to bolster the fund’s yield in an environment of low interest rates. |
Portfolio Management
Jason Callan has managed the fund since May 2010 and has been associated with the advisor since 2007.
Tom Heuer has managed the fund since May 2010 and has been associated with the advisor since 2002.
Colin Lundgren has managed the fund since May 2010 and has been associated with the advisor since 1989.
On May 1, 2010, the fund’s management team changed, and Jason J. Callan, Tom Heuer and Colin J. Lundgren took over as portfolio managers.
Effective May 1, 2010, RiverSource Investments, LLC, a subsidiary of Ameriprise Financial, Inc., became the investment advisor to the fund and changed its name to Columbia Management Investment Advisers, LLC. Please see the fund’s prospectus, as supplemented, for more information regarding the change in investment advisor and certain other changes.
| 1 | The Citigroup Government/Mortgage Index is a combination of the Citigroup U.S. Government Index and the Citigroup Mortgage Index. The Citigroup U.S. Government Index tracks the performance of the Treasury and government-sponsored indices within the U.S. Broad Investment Grade (BIG) Bond Index. The Citigroup Mortgage Index tracks the performance of the mortgage component of the U.S. BIG Bond Index, comprising 30- and 15-year Government National Mortgage Association (GNMA), Federal National Mortgage Association (FNMA) and Federal Home Loan Mortgage Corporation (FHLMC) pass-throughs and FNMA and FHLMC balloon mortgages. Indices are not available for investment, are not professionally managed and do not reflect sales charges, fees, brokerage commissions, taxes or other expenses of investing. Securities in the fund may not match those in an index. |
| 2 | Lipper Inc., a widely respected data provider in the industry, calculates an average total return (assuming reinvestment of distributions) for mutual funds with investment objectives similar to those of the fund. Lipper makes no adjustment for the effect of sales loads. |
Performance data quoted represents past performance and current performance may be lower or higher. Past performance is no guarantee of future results. The investment return and principal value will fluctuate so that shares, when redeemed, may be worth more or less than the original cost. Please visit www.columbiamanagement.com for daily and most recent month-end performance updates.
Summary
1-year return as of 08/31/10
| | |
| |
 | | +6.34% Class A shares
(without sales charge) |
| |
| | +7.65% Citigroup Government/Mortgage Index |
1
Economic Update – Columbia Federal Securities Fund
Although it has been more than a year since U.S. economic growth turned positive, the economy continues to send mixed signals about the sustainability of this recovery. Economic growth, as measured by gross domestic product (GDP), was a solid 5.0% in the last quarter of 2009. However, it was 3.7% in the first quarter of 2010 and only 1.7% in the second quarter. Expectations are for continued lackluster growth through the end of the year, as government incentive programs have ended and stimulus spending winds down. Even so, it appears to be unlikely that the U.S. economy will sink back into recession as many key indicators remain positive.
Consumer spending on cars, clothing and other goods increased throughout the year, although the pace of increased spending was small. Personal income also moved higher. Consumer confidence, as measured by the Conference Board Consumer Confidence Index, gained ground in the first half of 2010. However, the index fell sharply in June and July before stabilizing in August. Consumers surveyed in the last three months of the reporting period indicated they were concerned about business conditions and job prospects and generally apprehensive about the future.
The housing market — another bellwether for the consumer sector — showed few positive signs. Both new and existing home sales fell in the final months of the period as a federal tax credit for new and repeat homebuyers expired. Distressed properties continued to pressure prices and a huge backlog of foreclosed homes is likely to continue to keep a lid on prices for some time. The national median price of existing homes rose slightly over the one-year period, while the national median price of new homes declined. Despite near-record low mortgage rates, the inventory of unsold homes rose to a 12.5 month supply, up sharply at the end of the period. The long-term average is on the order of six months.
News on the job front was mostly positive for the period, but the number of new jobs added to the economy fell short of expectations. A good portion of the jobs added in March, April and May were temporary, government-sponsored census positions, which began to unwind in June, July and August. Private sector job growth was disappointing given the stage of economic recovery. Nevertheless, private sector payroll employment trended modestly higher in the summer and news of massive layoffs declined.
Reports from the business side of the economy were generally positive. A key measure of the nation’s manufacturing situation — the Institute for Supply Management’s Index — was generally positive, although the index trended slightly downward in the final months of the period. Industrial production moved higher, as did the amount of manufacturing capacity utilized — a key measure of the health of the manufacturing sector.
Summary
For the 12-month period that ended August 31, 2010
| | n | | Modest economic growth and relatively low interest rates boosted bond market returns. The Barclays Capital Aggregate Bond Index delivered solid results. High-yield bonds outperformed stocks, as measured by the JPMorgan Developed BB High Yield Index. | |
| | |
| Barclays Aggregate Index | | JPMorgan
Index |
| |

| |
|
9.18% | | 17.68% |
| | n | | The U.S. stock market, as measured by the S&P 500 Index, delivered positive returns, despite a correction in the last months of the period. Emerging market stocks, as measured by the MSCI Emerging Markets Index (Net), outperformed U.S. stocks as well as stock markets in developed foreign markets. | |
| | |
| S&P Index | | MSCI Index |
| |
| |
|
4.91% | | 18.02% |
2
Economic Update (continued) – Columbia Federal Securities Fund
Bonds delivered solid returns
As the economy strengthened, bonds delivered solid returns. The Barclays Capital Aggregate Bond Index1 returned 9.18%. Municipal bonds gained almost as much as taxable investment-grade bonds, even without factoring in potential tax advantages to investors in higher income-tax brackets. The Barclays Capital 3-15 Year Blend Municipal Bond Index2 returned 8.95%. The high-yield bond market outpaced stocks during the period by a margin of more than three to one. For the 12 months covered by this report, the JPMorgan Developed BB High Yield Index3 returned 17.68% while the S&P 500 Index returned 4.91%. Even the Treasury market was positive as the yield on the 10-year U.S. Treasury, a common bellwether for the bond market, fell nearly one full percentage point, from 3.4% to 2.5% over the 12-month period. Despite the pickup in economic activity, the Federal Reserve Board kept a key short-term interest rate — the federal funds rate — close to zero.
Stock rally interrupted
Against a strengthening economic backdrop, a stock market rally that began early in 2009 continued into the spring of 2010. However, a debt crisis brewing in Europe raised concerns among U.S. investors, as did mixed signals on the economy, and some of the stock market’s earlier gains vanished during the early summer. The S&P 500 Index returned 4.91% for the 12-month period.4 Outside the United States, stock market returns were mixed. The MSCI EAFE Index (Net),5 a broad gauge of stock market performance in foreign developed markets, returned negative 2.34% (net of dividends, in U.S. dollars) for the period, as concerns about the impact of a bailout for weak eurozone economies weighed on the markets. Emerging stock markets were more resilient. The MSCI Emerging Markets Index (Net)6 returned 18.02% (net of dividends, in U.S. dollars) for the 12-month period.
Past performance is no guarantee of future results.
| 1 | The Barclays Capital Aggregate Bond Index is a market value-weighted index that tracks the daily price, coupon, pay-downs and total return performance of fixed-rate, publicly placed, dollar-denominated and non-convertible investment grade debt issues with at least $250 million par amount outstanding and with at least one year to final maturity. |
| 2 | The Barclays Capital 3-15 Year Blend Municipal Bond Index tracks the performance of municipal bonds issued after December 31, 1990 with remaining maturities between 2 and 17 years and at least $7 million in principal amount outstanding. |
| 3 | The JPMorgan Developed BB High Yield Index is an unmanaged index designed to mirror the investable universe of the U.S. dollar developed, BB-rated, high yield corporate debt market. |
| 4 | The Standard & Poor’s (S&P) 500 Index tracks the performance of 500 widely held, large-capitalization U.S. stocks. |
| 5 | The Morgan Stanley Capital International Europe, Australasia, Far East (MSCI EAFE) Index (Net) is a free float-adjusted market capitalization Index that is designed to measure equity market performance of developed markets, excluding the U.S. & Canada. As of May 27, 2010, the MSCI EAFE Index (Net) consisted of the following 22 developed market country indices: Australia, Austria, Belgium, Denmark, Finland, France, Germany, Greece, Hong Kong, Ireland, Israel, Italy, Japan, the Netherlands, New Zealand, Norway, Portugal, Singapore, Spain, Sweden, Switzerland and the United Kingdom. |
| 6 | The Morgan Stanley Capital International Emerging Markets (MSCI EM) Index (Net) is a free float-adjusted market capitalization index that is designed to measure equity market performance of emerging markets. As of May 27, 2010, the MSCI Emerging Markets Index (Net) consisted of the following 21 emerging market country indices: Brazil, Chile, China, Colombia, Czech Republic, Egypt, Hungary, India, Indonesia, Korea, Malaysia, Mexico, Morocco, Peru, Philippines, Poland, Russia, South Africa, Taiwan, Thailand, and Turkey. |
Indices are not available for investment, are not professionally managed and do not reflect sales charges, fees, brokerage commissions, taxes or other expenses of investing. Securities in the fund may not match those in an index.
3
Performance Information – Columbia Federal Securities Fund
Performance data quoted represents past performance and current performance may be lower or higher. Past performance is no guarantee of future results. The investment return and principal value will fluctuate so that shares, when redeemed, may be worth more or less than the original cost. Please visit www.columbiamanagement.com for daily and most recent month-end performance updates.
| | | | |
| Annual operating expense ratio (%)* | |
| |
Class A | | | 1.00 | |
Class B | | | 1.75 | |
Class C | | | 1.75 | |
Class Z | | | 0.75 | |
| * | The annual operating expense ratio is as stated in the fund’s prospectus that is current as of the date of this report. Differences in expense ratios disclosed elsewhere in this report may result from the inclusion of fee waivers and expense reimbursements as well as the use of different time periods to calculate the ratios. |
| | | | |
| Net asset value per share | |
| |
as of 08/31/10 ($) | | | | |
Class A | | | 11.12 | |
Class B | | | 11.12 | |
Class C | | | 11.12 | |
Class Z | | | 11.12 | |
| Distributions declared per share | |
| |
09/01/09 – 08/31/10 ($) | | | | |
Class A | | | 0.27 | |
Class B | | | 0.19 | |
Class C | | | 0.21 | |
Class Z | | | 0.30 | |
|
| Performance of a $10,000 investment 09/01/00 – 08/31/10 |
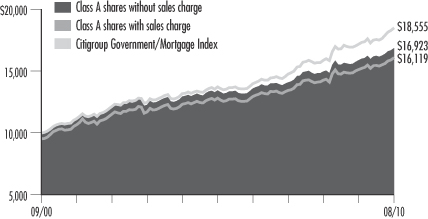
The chart above shows the change in value of a hypothetical $10,000 investment in Class A shares of Columbia Federal Securities Fund during the stated time period, and does not reflect the deduction of taxes that a shareholder may pay on fund distributions or on the redemption of fund shares.
| | | | | | | | |
| Performance of a $10,000 investment 09/01/00 – 08/31/10 ($) | |
| | |
| Sales charge | | without | | | with | |
Class A | | | 16,923 | | | | 16,119 | |
Class B | | | 15,711 | | | | 15,711 | |
Class C | | | 15,944 | | | | 15,944 | |
Class Z | | | 17,347 | | | | n/a | |
| | | | | | | | | | | | | | | | | | | | | | | | | | | | |
| Average annual total return as of 08/31/10 (%) | | | | | | | |
| | | | |
| Share class | | A | | | B | | | C | | | Z | |
| Inception | | 03/30/84 | | | 06/08/92 | | | 08/01/97 | | | 01/11/99 | |
| Sales charge | | without | | | with | | | without | | | with | | | without | | | with | | | without | |
1-year | | | 6.34 | | | | 1.29 | | | | 5.56 | | | | 0.56 | | | | 5.71 | | | | 4.71 | | | | 6.61 | |
5-year | | | 4.65 | | | | 3.64 | | | | 3.88 | | | | 3.53 | | | | 4.03 | | | | 4.03 | | | | 4.91 | |
10-year | | | 5.40 | | | | 4.89 | | | | 4.62 | | | | 4.62 | | | | 4.78 | | | | 4.78 | | | | 5.66 | |
| | | | | | | | | | | | | | | | | | | | | | | | | | | | |
| Average annual total return as of 09/30/10 (%) | | | | | | | |
| | | | |
| Share class | | A | | | B | | | C | | | Z | |
| Sales charge | | without | | | with | | | without | | | with | | | without | | | with | | | without | |
1-year | | | 5.50 | | | | 0.48 | | | | 4.72 | | | | –0.28 | | | | 4.87 | | | | 3.87 | | | | 5.76 | |
5-year | | | 4.88 | | | | 3.86 | | | | 4.10 | | | | 3.76 | | | | 4.25 | | | | 4.25 | | | | 5.14 | |
10-year | | | 5.35 | | | | 4.84 | | | | 4.57 | | | | 4.57 | | | | 4.73 | | | | 4.73 | | | | 5.62 | |
The “with sales charge” returns include the maximum initial sales charge of 4.75% for Class A shares and the applicable contingent deferred sales charge of 5.00% in the first year, declining to 1.00% in the sixth year, and eliminated thereafter for Class B shares and 1.00% for Class C shares for the first year only. The “without sales charge” returns do not include the effect of sales charges. If they had, returns would be lower.
Performance results reflect any fee waivers or expense reimbursements of fund expenses by the investment advisor and/or any of its affiliates. Absent these fee waivers or reimbursement arrangements, performance results would have been lower.
All results shown assume reinvestment of distributions. Class Z shares are sold at net asset value with no distribution and service (Rule 12b-1) fees. Class Z shares have limited eligibility and the investment minimum requirements may vary. Please see the fund’s prospectus for details. Performance for different share classes will vary based on differences in sales charges and fees associated with each class.
The tables do not reflect the deduction of taxes a shareholder may pay on fund distributions or on the redemption of fund shares.
4
Understanding Your Expenses – Columbia Federal Securities Fund
Estimating your actual expenses
To estimate the expenses that you paid over the period, first you will need your account balance at the end of the period:
| | n | | For shareholders who receive their account statements from Columbia Management Investment Services Corp., your account balance is available online at www.columbiamanagement.com or by calling Shareholder Services at 800.345.6611. | |
| | n | | For shareholders who receive their account statements from their financial intermediary, contact your financial intermediary firm to obtain your account balance. | |
| | 1. | Divide your ending account balance by $1,000. For example, if an account balance was $8,600 at the end of the period, the result would be 8.6. | |
| | 2. | In the section of the table below titled “Expenses paid during the period,” locate the amount for your share class. You will find this number in the column labeled “Actual.” Multiply this number by the result from step 1. Your answer is an estimate of the expenses you paid on your account during the period. | |
If the value of your account falls below the minimum initial investment requirement applicable to you, your account may be subject to a $20 annual fee. This fee is not included in the accompanying table. If you are subject to the fee, keep it in mind when you are estimating the ongoing expenses of investing in the fund and when comparing the expenses of this fund with other funds.
As a fund shareholder, you incur two types of costs. There are transaction costs, which generally include sales charges on purchases and may include redemption fees or exchange fees. There are also ongoing costs, which generally include investment advisory fees, distribution and service (Rule 12b-1) fees and other fund expenses. The information on this page is intended to help you understand the ongoing costs of investing in the fund and to compare these costs with the ongoing costs of investing in other mutual funds.
Analyzing your fund’s expenses by share class
To illustrate these ongoing costs, we have provided an example and calculated the expenses paid by investors in each share class during the period. The information in the following table is based on an initial investment of $1,000, which is invested at the beginning of the period and held for the entire period. Expense information is calculated two ways and each method provides you with different information. The amount listed in the “Actual” column is calculated using the fund’s actual operating expenses and total return for the period. The amount listed in the “Hypothetical” column for each share class assumes that the return each year is 5% before expenses and is calculated based on the fund’s actual operating expenses. You should not use the hypothetical account values and expenses to estimate either your actual account balance at the end of the period or the expenses you paid during this period.
Compare with other funds
Since all mutual funds are required to include the same hypothetical calculations about expenses in shareholder reports, you can use this information to compare the ongoing costs of investing in the fund with other funds. To do so, compare the 5% hypothetical example with the 5% hypothetical examples that appear in the shareholder reports of other funds. As you compare hypothetical examples of other funds, it is important to note that hypothetical examples are meant to highlight the ongoing costs of investing in a fund and do not reflect any transaction costs, such as sales charges, redemption fees or exchange fees.
| | | | | | | | | | | | | | |
| 03/01/10 – 08/31/10 |
| | | | |
| | | Account value at the
beginning of the period ($) | | Account value at the
end of the period ($) | | Expenses paid
during the period ($) | | Fund’s annualized
expense ratio (%) |
| | | Actual | | Hypothetical | | Actual | | Hypothetical | | Actual | | Hypothetical | | Actual |
Class A | | 1,000.00 | | 1,000.00 | | 1,039.00 | | 1,020.42 | | 4.88 | | 4.84 | | 0.95 |
Class B | | 1,000.00 | | 1,000.00 | | 1,035.10 | | 1,016.64 | | 8.72 | | 8.64 | | 1.70 |
Class C | | 1,000.00 | | 1,000.00 | | 1,035.90 | | 1,017.39 | | 7.95 | | 7.88 | | 1.55 |
Class Z | | 1,000.00 | | 1,000.00 | | 1,040.30 | | 1,021.68 | | 3.60 | | 3.57 | | 0.70 |
Expenses paid during the period are equal to the annualized expense ratio for the share class, multiplied by the average account value over the period, then multiplied by the number of days in the fund’s most recent fiscal half-year and divided by 365.
Had the investment advisor and/or any of its affiliates not waived fees or reimbursed a portion of expenses, account value at the end of the period would have been reduced.
It is important to note that the expense amounts shown in the table are meant to highlight only ongoing costs of investing in the fund and do not reflect any transaction costs, such as sales charges, redemption fees or exchange fees. Therefore, the hypothetical examples provided may not help you determine the relative total costs of owning shares of different funds. If these transaction costs were included, your costs would have been higher.
5
Portfolio Managers’ Report – Columbia Federal Securities Fund
For the 12-month period that ended August 31, 2010, the fund’s Class A shares returned 6.34% without sales charge. The fund underperformed its benchmark, the Citigroup Government/Mortgage Index, which returned 7.65%. The average return of the funds in its peer group, the Lipper General U.S. Government Funds Classification, was 9.16%. The fund lost ground against these comparative measures because its maturity profile was shorter than the index and, we believe, its peer group during the spring of 2010, when long-term Treasury securities staged a significant rally.
A favorable environment for fixed-income securities
Over the 12 months covered by this report, the environment was favorable for fixed-income securities, as the U.S. economy staged a modest recovery and interest rates declined across the entire maturity spectrum. One of the most important developments of the period actually took place overseas in the spring of 2010 when excessive deficits in what had been an overheated Greek economy led to default rumors and eventual intervention by the European Union. The sovereign debt of many European countries came under heavy selling pressure and fixed-income investors around the world flocked to the safety of the U.S. Treasury market. Long-term Treasury yields, which had hovered near 4.0% earlier in the year, began a steady decline, and by the end of the period had fallen below 2.5%. The fund was underweight in long Treasuries when this rally began, which detracted from relative performance.
An increase in mortgage exposure bolstered fund’s yield
During the last three months of the period, the fund’s management bolstered the portfolio’s current yield by a coordinated effort to diversify into sectors of the market that had favorable risk/reward characteristics. In that regard, we increased the fund’s holdings in seasoned non-agency mortgage-backed securities (MBS), which had been significantly depressed following the financial crisis of 2008 and 2009. We believe that seasoned non-agency MBS represent attractive value in light of the strong credit profile of the underlying collateral. In addition, we made a significant increase in the fund’s position in seasoned agency MBS because we see muted prepayment risk in the current interest-rate environment. In order to make these purchases, we reduced the fund’s positions in investment-grade corporate debt and shorter-term Treasury securities. The net effect of these changes was an increase in the portfolio’s current yield. Early in 2010, the fund’s yield was half a percentage point below the benchmark’s yield, and now it exceeds the benchmark by almost three-quarters of a percentage point.
Performance data quoted represents past performance and current performance may be lower or higher. Past performance is no guarantee of future results. The investment return and principal value will fluctuate so that shares, when redeemed, may be worth more or less than the original cost. Please visit www.columbiamanagement.com for daily and most recent month-end performance updates.
| | | | |
| 30-day SEC yields | |
| |
as of 08/31/10 (%) | | | | |
Class A | | | 2.35 | |
Class B | | | 1.78 | |
Class C | | | 1.89 | |
Class Z | | | 2.71 | |
The 30-day SEC yields reflect the fund’s earning power net of expenses, expressed as an annualized percentage of the public offering price at the end of the period. Had the investment advisor not waived fees or reimbursed a portion of expenses, the 30-day SEC yields would have been reduced.
| | | | |
| Average life breakdown | |
| |
as of 08/31/10 (%) | | | | |
0-1 year | | | 2.6 | |
1-5 years | | | 2.4 | |
5-10 years | | | 18.2 | |
10-20 years | | | 18.4 | |
20+ years | | | 58.4 | |
Average life breakdown is calculated as a percentage of total investments.
| | | | |
| Top 5 Sectors | |
| |
as of 08/31/10 (%) | | | | |
Mortgage-Backed Securities | | | 57.3 | |
Government & Agency Obligations | | | 46.9 | |
Collateralized Mortgage Obligations | | | 11.3 | |
Commercial Mortgage-Backed Securities | | | 4.1 | |
Asset-Backed Securities | | | 2.1 | |
Top 5 Sectors are calculated as a percentage of net assets.
6
Portfolio Managers’ Report (continued) – Columbia Federal Securities Fund
Looking ahead
Looking ahead, we anticipate a continued, albeit moderate, economic expansion, and we would not be surprised to see interest rates remain in a fairly narrow range. We expect credit standards to remain tight, which should help keep prepayment risk muted for the mortgage universe, creating attractive valuations within agency mortgages and high quality non-agency mortgages.
Portfolio characteristics and holdings are subject to change periodically and may not be representative of current characteristics and holdings. The outlook for the fund may differ from those presented for other Columbia Funds.
Investing in fixed-income securities may involve certain risks, including bond market fluctuations due to credit quality of individual issuers and prepayments and changes in interest rates. When interest rates go up, bond prices typically go down and vice versa.
7
Investment Portfolio – Columbia Federal Securities Fund
August 31, 2010
Mortgage-Backed Securities – 57.3%
| | | | |
| | | Par ($) | | Value ($) |
| Federal Home Loan Mortgage Corp. | | |
1.886% 07/01/19 (09/01/10) (a)(b) | | 26,471 | | 27,194 |
2.172% 05/01/18 (09/01/10) (a)(b) | | 12,837 | | 13,226 |
3.106% 02/01/18 (09/01/10) (a)(b) | | 14,532 | | 15,136 |
5.580% 08/01/37 (09/01/10) (a)(b) | | 2,836,247 | | 3,006,865 |
5.624% 06/01/37 (09/01/10) (a)(b) | | 2,372,826 | | 2,522,668 |
5.722% 06/01/36 (09/01/10) (a)(b) | | 3,414,599 | | 3,633,963 |
I.O.,
| | | | |
5.824% 02/15/35 (09/15/10) (a)(b)(c) | | 7,210,051 | | 822,941 |
6.000% 03/01/38 | | 28,044,313 | | 30,194,908 |
7.000% 08/01/29 | | 7 | | 8 |
10.500% 01/01/20 | | 21,718 | | 24,661 |
| | |
TBA: | | | | |
4.500% 12/01/40 (d) | | 27,300,000 | | 28,630,875 |
5.500% 12/01/40 (d) | | 8,000,000 | | 8,537,504 |
| |
| Federal National Mortgage Association | | |
1.932% 06/01/20 (09/01/10) (a)(b) | | 14,046 | | 14,437 |
1.957% 07/01/20 (09/01/10) (a)(b) | | 4,990 | | 5,009 |
2.216% 03/01/18 (09/01/10) (a)(b) | | 68,899 | | 69,040 |
2.250% 11/01/19 (09/01/10) (a)(b) | | 2,359 | | 2,370 |
2.369% 12/01/17 (09/01/10) (a)(b) | | 10,599 | | 10,669 |
2.500% 05/15/14 (e) | | 8,225,000 | | 8,614,544 |
2.500% 08/01/19 (09/01/10) (a)(b) | | 19,110 | | 19,556 |
2.520% 06/25/20 | | 2,486,340 | | 2,546,317 |
2.625% 06/01/19 (09/01/10) (a)(b) | | 11,169 | | 11,332 |
3.132% 07/01/27 (09/01/10) (a)(b) | | 14,267 | | 14,468 |
3.199% 08/01/36 (09/01/10) (a)(b) | | 12,492 | | 12,905 |
3.380% 10/01/14 | | 2,477,129 | | 2,621,017 |
4.420% 10/01/19 | | 4,369,551 | | 4,730,528 |
4.430% 10/01/19 | | 4,950,741 | | 5,362,329 |
4.500% 06/01/25 | | 14,395,090 | | 15,248,476 |
4.570% 01/01/20 | | 1,116,672 | | 1,219,563 |
4.600% 01/01/20 | | 1,834,808 | | 2,007,612 |
5.000% 11/01/17 | | 13,585,075 | | 14,541,774 |
5.000% 04/01/35 | | 5,951,419 | | 6,372,978 |
5.000% 06/01/35 | | 12,374,773 | | 13,251,319 |
5.030% 05/01/24 | | 3,545,000 | | 3,914,197 |
5.197% 12/01/31 (09/01/10) (a)(b) | | 32,506 | | 34,440 |
5.500% 02/01/33 (f) | | 10,053,907 | | 10,865,503 |
5.500% 09/01/35 | | 12,442,240 | | 13,419,416 |
5.500% 07/01/36 | | 6,068,029 | | 6,544,594 |
5.515% 10/01/37 (09/01/10) (a)(b) | | 955,494 | | 1,014,123 |
I.O.,
| | | | |
5.986% 11/25/39 (09/25/10) (a)(b)(c) | | 2,335,702 | | 288,034 |
6.000% 01/01/24 | | 78,573 | | 84,829 |
6.000% 02/01/24 | | 93,797 | | 101,612 |
6.000% 03/01/24 | | 466,568 | | 505,435 |
6.000% 04/01/24 | | 333,668 | | 361,201 |
| | | | |
| | | Par ($) | | Value ($) |
6.000% 05/01/24 | | 165,572 | | 179,365 |
6.000% 08/01/24 | | 61,304 | | 66,411 |
6.000% 01/01/26 | | 1,078 | | 1,169 |
6.000% 03/01/26 | | 32,172 | | 34,928 |
6.000% 04/01/26 | | 1,340 | | 1,455 |
6.000% 05/01/26 | | 4,478 | | 4,861 |
6.000% 09/01/36 | | 7,626,154 | | 8,237,186 |
I.O.,
| | | | |
6.436% 07/25/35 (09/25/10) (a)(b)(c) | | 5,018,686 | | 737,018 |
6.500% 12/01/10 | | 20 | | 20 |
6.500% 04/01/11 | | 955 | | 999 |
6.500% 09/01/25 | | 21,539 | | 23,750 |
6.500% 11/01/25 | | 89,858 | | 99,080 |
6.500% 05/01/26 | | 159,295 | | 175,643 |
6.500% 09/01/28 | | 8,211 | | 9,115 |
6.500% 12/01/28 | | 12,248 | | 13,597 |
6.500% 01/01/29 | | 86,275 | | 95,776 |
6.500% 06/01/29 | | 74,411 | | 82,605 |
6.500% 10/01/37 | | 5,350,612 | | 5,842,022 |
6.565% 07/01/16 | | 4,379,009 | | 4,897,093 |
I.O.,
| | | | |
6.886% 07/25/36 (09/25/10) (a)(b)(c) | | 5,671,733 | | 866,808 |
7.000% 10/01/10 | | 14 | | 14 |
7.000% 10/01/12 | | 3,816 | | 4,009 |
7.000% 08/01/23 | | 83,789 | | 94,236 |
7.000% 10/01/23 | | 22,105 | | 24,860 |
7.000% 11/01/23 | | 30,205 | | 33,971 |
7.000% 02/01/27 | | 4,484 | | 5,064 |
I.O.,
| | | | |
7.336% 01/25/33 (09/25/10) (a)(b)(c) | | 6,679,768 | | 847,529 |
7.500% 11/01/11 | | 100 | | 104 |
7.500% 01/01/17 | | 23,592 | | 26,233 |
7.500% 02/01/18 | | 8,908 | | 9,969 |
8.000% 03/01/13 | | 653 | | 698 |
8.000% 11/01/15 | | 694 | | 700 |
| | |
TBA: | | | | |
3.500% 12/01/25 (d) | | 20,400,000 | | 21,149,068 |
4.000% 12/01/40 (d) | | 24,000,000 | | 24,851,256 |
4.500% 12/01/25 (d) | | 2,000,000 | | 2,115,624 |
4.500% 12/01/40 (d) | | 16,200,000 | | 17,010,000 |
5.000% 12/01/25 (d) | | 750,000 | | 797,578 |
5.000% 12/01/40 (d) | | 32,800,000 | | 34,829,500 |
5.500% 12/01/40 (d) | | 5,500,000 | | 5,880,704 |
6.500% 12/01/40 (d) | | 6,000,000 | | 6,531,564 |
|
| Government National Mortgage Association |
3.375% 05/20/22 (09/01/10) (a)(b) | | 20,319 | | 20,913 |
See Accompanying Notes to Financial Statements.
8
Columbia Federal Securities Fund
August 31, 2010
Mortgage-Backed Securities (continued)
| | | | |
| | | Par ($) | | Value ($) |
3.375% 06/20/23 (09/01/10) (a)(b) | | 13,639 | | 14,038 |
3.625% 08/20/22 (09/01/10) (a)(b) | | 3,478 | | 3,595 |
6.000% 12/15/10 | | 761 | | 768 |
I.O.,
| | | | |
6.324% 01/16/34 (09/16/10) (a)(b)(c) | | 2,997,376 | | 414,466 |
I.O.,
| | | | |
6.334% 08/20/32 (09/20/10) (a)(b)(c) | | 4,411,039 | | 402,835 |
I.O.,
| | | | |
7.374% 12/16/25 (09/16/10) (a)(b)(c) | | 5,555,312 | | 1,021,953 |
8.000% 11/15/14 | | 5,745 | | 6,193 |
| | | | |
Total Mortgage-Backed Securities
(cost of $324,528,230) | | 328,705,919 |
|
Government & Agency Obligations – 46.9% |
| | | | |
| U.S. Government Agencies – 3.5% | | |
| Federal Home Loan Bank | | |
5.375% 03/11/16 | | 8,130,000 | | 9,597,481 |
5.375% 06/10/16 | | 8,830,000 | | 10,438,181 |
| | |
| Small Business Administration | | | | |
8.200% 10/01/11 | | 15,814 | | 16,113 |
8.250% 11/01/11 | | 54,406 | | 55,683 |
9.150% 07/01/11 | | 2,547 | | 2,612 |
| | | | |
U.S. Government Agencies Total | | 20,110,070 |
| | | | |
| U.S. Government Obligations – 43.4% | | |
| U.S. Treasury Bonds | | | | |
3.500% 05/15/20 (e) | | 7,000,000 | | 7,627,270 |
4.500% 02/15/36 (e) | | 12,045,000 | | 14,213,100 |
| | |
| U.S. Treasury Notes | | | | |
0.875% 03/31/11 | | 76,443,000 | | 76,726,680 |
0.875% 05/31/11 | | 34,848,000 | | 35,011,367 |
1.375% 03/15/12 | | 50,306,000 | | 51,066,476 |
1.750% 07/31/15 (e) | | 480,000 | | 490,051 |
2.125% 05/31/15 (e) | | 18,000,000 | | 18,715,860 |
2.625% 04/30/16 | | 6,747,000 | | 7,130,209 |
2.625% 08/15/20 (e) | | 12,160,000 | | 12,315,794 |
2.750% 02/15/19 | | 9,928,000 | | 10,318,141 |
3.125% 09/30/13 | | 7,775,000 | | 8,343,547 |
| | |
| U.S. Treasury Stripped | | | | |
P.O.,
11/15/21 (e)(g) | | 10,000,000 | | 7,187,460 |
| | | | |
U.S. Government Obligations Total | | 249,145,955 |
| | | | |
Total Government & Agency Obligations
(cost of $261,531,324) | | 269,256,025 |
Collateralized Mortgage Obligations – 11.3%
| | | | |
| | | Par ($) | | Value ($) |
| Agency – 1.4% | | | | |
| Federal Home Loan Mortgage Corp. | | |
I.O.:
| | | | |
6.444% 05/15/35 (09/15/10) (a)(b)(c) | | 7,433,541 | | 1,253,157 |
7.053% 12/15/32 (09/15/10) (a)(b)(c) | | 22,302,580 | | 4,284,328 |
| |
| Federal National Mortgage Association | | |
I.O.:
| | | | |
5.736% 06/25/33 (09/25/10) (a)(b)(c) | | 9,876,421 | | 1,006,762 |
5.736% 05/25/34 (09/25/10) (a)(b)(c) | | 10,131,058 | | 1,210,469 |
| |
| Vendee Mortgage Trust | | |
I.O.:
| | | | |
0.301% 03/15/29 (09/01/10) (a)(b)(c) | | 5,242,702 | | 38,464 |
0.428% 03/15/28 (09/01/10) (a)(b)(c) | | 4,179,339 | | 48,159 |
| | | | |
Agency Total | | | | 7,841,339 |
| | | | |
| Non-Agency – 9.9% | | | | |
| American Home Mortgage Assets | | |
1.000% 08/25/37 (09/27/10) (a)(b)(d) | | 2,742,423 | | 2,742,004 |
| | |
| ASG Resecuritization Trust | | | | |
3.500% 07/28/37 (h) | | 5,061,397 | | 5,074,051 |
| | |
| BCAP LLC Trust | | | | |
4.000% 07/26/37 (09/01/10) (a)(b)(h) | | 5,541,373 | | 5,557,997 |
5.250% 04/26/37 (09/01/10) (a)(b)(h) | | 2,217,638 | | 2,247,317 |
| |
| Citigroup Mortgage Loan Trust, Inc. | | |
0.344% 01/25/37 (09/27/10) (a)(b)(h) | | 8,231,164 | | 7,984,229 |
4.750% 05/25/35 (h) | | 4,523,862 | | 4,501,242 |
| |
| Credit Suisse Mortgage Capital Certificates | | |
5.000% 02/27/37 (09/01/10) (a)(b)(h) | | 3,651,620 | | 3,634,067 |
5.000% 04/27/37 (09/01/10) (a)(b)(h) | | 2,098,390 | | 2,092,833 |
5.250% 10/27/36 (09/01/10) (h) | | 1,381,144 | | 1,380,506 |
| |
| GSR Mortgage Loan Trust | | |
4.701% 05/25/34
(09/01/10) (a)(b) | | 4,184,636 | | 4,147,903 |
| |
| Morgan Stanley Reremic Trust | | |
5.921% 03/26/36 (09/01/10) (a)(b)(h) | | 3,368,962 | | 3,402,652 |
See Accompanying Notes to Financial Statements.
9
Columbia Federal Securities Fund
August 31, 2010
Collateralized Mortgage Obligations (continued)
| | | | | | | | |
| | | Par ($) | | | Value ($) | |
| RBSSP Resecuritization Trust | | | | | |
0.519% 02/26/46 (09/25/10) (a)(b)(h) | | | 3,133,124 | | | | 2,905,973 | |
| |
| Tryon Mortgage Funding, Inc. | | | | | |
7.500% 02/20/27 | | | 17,138 | | | | 15,183 | |
| |
| Washington Mutual Mortgage Loan Trust | | | | | |
1.564% 01/25/40 (09/27/10) (a)(b) | | | 178,620 | | | | 171,018 | |
| |
| Wells Fargo Mortgage Backed Securities Trust | | | | | |
4.742% 06/25/34 (09/01/10) (a)(b) | | | 4,452,941 | | | | 4,535,845 | |
4.756% 07/25/34 (09/01/10) (a)(b) | | | 3,715,000 | | | | 3,766,475 | |
4.863% 09/25/34 (09/01/10) (a)(b) | | | 2,922,072 | | | | 2,982,377 | |
| | | | | | | | |
Non-Agency Total | | | | | | | 57,141,672 | |
| | | | | | | | |
Total Collateralized Mortgage
Obligations (cost of $64,053,183) | | | | 64,983,011 | |
|
Commercial Mortgage-Backed Securities – 4.1% | |
| Bear Stearns Commercial Mortgage Securities | | | | | |
4.933% 02/13/42 (09/01/10) (a)(b) | | | 1,260,000 | | | | 1,357,380 | |
| |
| Citigroup Commercial Mortgage Trust | | | | | |
4.733% 10/15/41 | | | 765,000 | | | | 811,993 | |
| |
| GE Capital Commercial Mortgage Corp. | | | | | |
4.819% 01/10/38 | | | 3,535,000 | | | | 3,752,840 | |
|
| GMAC Commercial Mortgage Securities, Inc. | |
5.659% 05/10/40 (09/01/10) (a)(b) | | | 815,000 | | | | 890,896 | |
| |
| LB-UBS Commercial Mortgage Trust | | | | | |
4.853% 09/15/31 | | | 885,000 | | | | 936,240 | |
5.124% 11/15/32 (09/11/10) (a)(b) | | | 715,000 | | | | 776,523 | |
| |
| Merrill Lynch Mortgage Investors, Inc. | | | | | |
I.O.,
0.575% 12/15/30 (09/01/10) (a)(b)(c) | | | 2,466,754 | | | | 47,734 | |
| |
| Morgan Stanley Capital I | | | | | |
4.970% 12/15/41 | | | 2,660,000 | | | | 2,862,648 | |
5.150% 06/13/41 | | | 2,500,000 | | | | 2,690,761 | |
| | | | | | | | |
| | | Par ($) | | | Value ($) | |
| |
| Morgan Stanley Dean Witter Capital I | | | | | |
4.740% 11/13/36 | | | 1,060,000 | | | | 1,119,128 | |
4.920% 03/12/35 | | | 2,646,000 | | | | 2,818,157 | |
5.080% 09/15/37 | | | 2,995,000 | | | | 3,173,716 | |
5.980% 01/15/39 | | | 1,430,000 | | | | 1,510,875 | |
| |
| Wachovia Bank Commercial Mortgage Trust | | | | | |
5.380% 10/15/44 (09/01/10) (a)(b) | | | 265,000 | | | | 291,560 | |
5.726% 06/15/45 | | | 181,877 | | | | 181,967 | |
| | | | | | | | |
Total Commercial Mortgage-Backed Securities
(cost of $21,110,508) | | | | 23,222,418 | |
| | |
Asset-Backed Securities – 2.1% | | | | | | | | |
| Entergy Gulf States Reconstruction Funding LLC | | | | | | | | |
5.510% 10/01/13 | | | 264,921 | | | | 278,771 | |
| | |
| Ford Credit Auto Owner Trust | | | | | | | | |
1.320% 06/15/14 | | | 1,400,000 | | | | 1,413,749 | |
5.150% 11/15/11 | | | 36,771 | | | | 37,097 | |
| | |
| GSAMP Trust | | | | | | | | |
0.374% 06/25/36 (09/27/10) (a)(b) | | | 181,083 | | | | 180,454 | |
| |
| Massachusetts RRB Special Purpose Trust WMECO-1 | | | | | |
6.530% 06/01/15 | | | 55,903 | | | | 60,489 | |
| |
| Morgan Stanley ABS Capital I | | | | | |
0.754% 07/25/35 (09/27/10) (a)(b) | | | 2,844,664 | | | | 2,815,566 | |
| |
| Novastar Home Equity Loan | | | | | |
0.374% 06/25/36 (09/27/10) (a)(b) | | | 2,344,221 | | | | 2,330,036 | |
| |
| Sierra Receivables Funding Co. | | | | | |
3.840% 11/20/25 (h) | | | 2,240,954 | | | | 2,253,129 | |
| |
| Small Business Administration | | | | | |
7.600% 01/01/12 | | | 24,174 | | | | 24,777 | |
8.650% 11/01/14 | | | 148,753 | | | | 153,077 | |
8.850% 08/01/11 | | | 2,125 | | | | 2,198 | |
| |
| Triad Auto Receivables Owner Trust | | | | | |
5.310% 05/13/13 | | | 2,411,240 | | | | 2,464,799 | |
| | | | | | | | |
Total Asset-Backed Securities (cost of $11,940,418) | | | | | | | 12,014,142 | |
| | | | | | | | |
See Accompanying Notes to Financial Statements.
10
Columbia Federal Securities Fund
August 31, 2010
Corporate Fixed-Income Bonds & Notes – 0.4%
| | | | | | | | |
| | | Par ($) | | | Value ($) | |
| Consumer Cyclical – 0.2% | | | | | | | | |
| Retail – 0.2% | | | | | | | | |
| CVS Pass-Through Trust | | | | | | | | |
8.353% 07/10/31 (h) | | | 1,075,091 | | | | 1,342,058 | |
| | | | | | | | |
Retail Total | | | | | | | 1,342,058 | |
| | | | | | | | |
Consumer Cyclical Total | | | | | | | 1,342,058 | |
| | | | | | | | |
| Financials – 0.2% | |
| Banks – 0.1% | | | | | | | | |
| USB Capital IX | | | | | | | | |
6.189% 10/29/49 (04/15/42) (a)(b) | | | 560,000 | | | | 436,800 | |
| | | | | | | | |
Banks Total | | | | | | | 436,800 | |
| |
Diversified Financial Services – 0.1% | | | | | |
| International Lease Finance Corp. | | | | | |
4.875% 09/01/10 | | | 785,000 | | | | 785,000 | |
| | | | | | | | |
Diversified Financial Services Total | | | | 785,000 | |
| | | | | | | | |
Financials Total | | | | | | | 1,221,800 | |
| | | | | | | | |
Total Corporate Fixed-Income Bonds & Notes
(cost of $2,310,898) | | | | 2,563,858 | |
| |
Securities Lending Collateral – 8.2% | | | | | |
| | | Shares | | | | |
State Street Navigator Securities Lending Prime Portfolio (7 day yield of 0.351%) (i) | | | 47,219,235 | | | | 47,219,235 | |
| | | | | | | | |
Total Securities Lending Collateral (cost of $47,219,235) | | | | 47,219,235 | |
| |
Short-Term Obligation – 4.2% | | | | | |
| | | Par ($) | | | | |
Repurchase agreement with Fixed Income Clearing Corp., dated 08/31/10, due 09/01/10 at 0.190%, collateralized by a U.S. Government Agency obligation maturing 01/12/15, market value $24,371,375 (repurchase proceeds $23,890,126) | | | 23,890,000 | | | | 23,890,000 | |
| | | | | | | | |
Total Short-Term Obligation (cost of $23,890,000) | | | | 23,890,000 | |
| | | | | | | | |
| | | | | | | | |
| | | Par ($) | | | Value ($) | |
Total Investments – 134.5%
(cost of $756,583,796) (j) | | | | 771,854,608 | |
| | | | | | | | |
Obligation to Return Collateral for Securities Loaned – (8.2)% | | | | (47,219,235 | ) |
| | | | | | | | |
Other Assets & Liabilities,
Net – (26.3)% | | | | (150,795,314 | ) |
| | | | | | | | |
Net Assets – 100.0% | | | | 573,840,059 | |
| | |
Securities Sold Short – (1.3)% | | | | | | | | |
| | | | | | | | |
| Government & Agency Obligations – (1.3)% | |
| Federal National Mortgage Association | | | | | |
TBA: | | | | | | | | |
5.000% 12/01/25 | | | (2,250,000 | ) | | | (2,392,736 | ) |
6.000% 12/01/40 | | | (4,500,000 | ) | | | (4,844,529 | ) |
| | | | | | | | |
Government & Agency Obligations Total | | | | (7,237,265 | ) |
| | | | | | | | |
Total Securities Sold Short (proceeds of $7,213,008) | | | | (7,237,265 | ) |
Notes to Investment Portfolio:
| (a) | The interest rate shown on floating rate or variable rate securities reflects the rate at August 31, 2010. |
| (b) | Parenthetical date represents the effective maturity date for the security. |
| (c) | Accrued interest accumulates in the value of this security and is payable at redemption. |
| (d) | Security purchased on a delayed delivery basis. |
| (e) | All or a portion of this security was on loan at August 31, 2010. The total market value of securities on loan at August 31, 2010 is $46,602,544. |
| (f) | A portion of this security with a market value of $698,992 is pledged as collateral for open futures contracts and written put options on futures contracts. |
| (h) | Security exempt from registration pursuant to Rule 144A under the Securities Act of 1933. These securities may be resold in transactions exempt from registration, normally to qualified institutional buyers. At August 31, 2010, these securities, which are not illiquid, amounted to $42,376,054, which represents 7.4% of net assets. |
| (i) | Investment made with cash collateral received from securities lending activity. |
| (j) | Cost for federal income tax purposes is $756,583,796. |
See Accompanying Notes to Financial Statements.
11
Columbia Federal Securities Fund
August 31, 2010
The following table summarizes the inputs used, as of August 31, 2010, in valuing the Fund’s assets:
| | | | | | | | | | | | | | | |
Description | | Quoted Prices
(Level 1) | | | Other Significant
Observable Inputs (Level 2) | | | Significant
Unobservable
Inputs (Level 3) | | Total | |
Total Mortgage-Backed Securities | | $ | 72,789,272 | | | $ | 255,916,647 | | | $ | — | | $ | 328,705,919 | |
| | | | | | | | | | | | | | | |
Government & Agency Obligations | | | | | | | | | | | | | | | |
U.S. Government Agencies | | | — | | | | 20,110,070 | | | | — | | | 20,110,070 | |
U.S. Government Obligations | | | 241,958,495 | | | | 7,187,460 | | | | — | | | 249,145,955 | |
| | | | | | | | | | | | | | | |
Total Government & Agency Obligations | | | 241,958,495 | | | | 27,297,530 | | | | — | | | 269,256,025 | |
| | | | | | | | | | | | | | | |
Total Collateralized Mortgage Obligations | | | — | | | | 64,983,011 | | | | — | | | 64,983,011 | |
| | | | | | | | | | | | | | | |
Total Commercial Mortgage-Backed Securities | | | — | | | | 23,222,418 | | | | — | | | 23,222,418 | |
| | | | | | | | | | | | | | | |
Total Asset-Backed Securities | | | — | | | | 12,014,142 | | | | — | | | 12,014,142 | |
| | | | | | | | | | | | | | | |
Total Corporate Fixed-Income Bonds & Notes | | | — | | | | 2,563,858 | | | | — | | | 2,563,858 | |
| | | | | | | | | | | | | | | |
Total Securities Lending Collateral | | | 47,219,235 | | | | — | | | | — | | | 47,219,235 | |
| | | | | | | | | | | | | | | |
Total Short-Term Obligation | | | — | | | | 23,890,000 | | | | — | | | 23,890,000 | |
| | | | | | | | | | | | | | | |
Total Investments | | | 361,967,002 | | | | 409,887,606 | | | | — | | | 771,854,608 | |
| | | | | | | | | | | | | | | |
Total Securities Sold Short | | | — | | | | (7,237,265 | ) | | | — | | | (7,237,265 | ) |
Unrealized Appreciation on Futures Contracts | | | 198,009 | | | | — | | | | — | | | 198,009 | |
Value of Written Put Option Contracts | | | (46,875 | ) | | | — | | | | — | | | (46,875 | ) |
| | | | | | | | | | | | | | | |
Total | | $ | 362,118,136 | | | $ | 402,650,341 | | | $ | — | | $ | 764,768,477 | |
| | | | | | | | | | | | | | | |
The Fund’s assets assigned to the Level 2 input category include certain foreign securities for which a third party statistical pricing service may be employed for purposes of fair market valuation.
Certain Short-Term Obligations may be valued using amortized cost, an income approach which converts future cash flows to a present value based upon the premium or discount at purchase.
For more information on valuation inputs, and their aggregation into the levels used in the table above, please refer to the Security Valuation section in the accompanying Notes to Financial Statements.
At August 31, 2010, the Fund held the following open long futures contracts:
| | | | | | | | | | | | | |
Risk
Exposure/
Type | | Number of
Contracts | | Value | | Aggregate
Face Value | | Expiration
Date | | Unrealized
Appreciation |
Interest Rate Risk | | | | | | | | | | | |
5-Year U.S. Treasury Notes | | 250 | | $ | 30,080,078 | | $ | 30,000,600 | | Dec-2010 | | $ | 79,478 |
10-Year U.S. Treasury Notes | | 91 | | | 11,431,875 | | | 11,392,992 | | Dec-2010 | | | 38,883 |
30-Year U.S. Treasury Bond | | 41 | | | 5,536,282 | | | 5,456,634 | | Dec-2010 | | | 79,648 |
| | | | | | | | | | | | | |
| | | | | | | | | | | | $ | 198,009 |
At August 31, 2010, the Fund held the following written put option contracts:
| | | | | | | | | | | | | | |
Written Put
Option Contracts Name of Issuer | | Strike
Price | | Number of
Contracts | | Expiration
Date | | Premium | | Value | |
10-Year U.S. Treasury Notes | | $ | 124 | | 120 | | 09/24/10 | | $ | 51,275 | | $ | (46,875 | ) |
For the year ended August 31, 2010 transactions in written put options on futures contracts were as follows:
| | | | | |
| | | Number of
contracts | | Premium
received |
Options outstanding at August 31, 2009 | | — | | $ | — |
Options written | | 120 | | | 51,275 |
Options terminated in closing purchase transactions | | — | | | — |
Options exercised | | — | | | — |
Options expired | | — | | | — |
| | | | | |
Options outstanding at August 31, 2010 | | 120 | | $ | 51,275 |
| | | | | |
At August 31, 2010, the asset allocation of the Fund is as follows:
| | | |
Asset Allocation (Unaudited) | | % of Net Assets | |
Mortgage-Backed Securities | | 57.3 | |
Government & Agency Obligations | | 46.9 | |
Collateralized Mortgage Obligations | | 11.3 | |
Commercial Mortgage-Backed Securities | | 4.1 | |
Asset-Backed Securities | | 2.1 | |
Corporate Fixed-Income Bonds & Notes | | 0.4 | |
| | | |
| | 122.1 | |
Securities Lending Collateral | | 8.2 | |
Short-Term Obligation | | 4.2 | |
Obligation to Return Collateral for Securities Loaned | | (8.2 | ) |
Other Assets & Liabilities, Net | | (26.3 | ) |
| | | |
| | 100.0 | |
| | | |
| | |
Acronym | | Name |
| I.O. | | Interest Only |
| P.O. | | Principal Only |
| STRIPS | | Separate Trading of Registered Interest and Principal of Securities |
| TBA | | To Be Announced |
See Accompanying Notes to Financial Statements.
12
Statement of Assets and Liabilities – Columbia Federal Securities Fund
August 31, 2010
| | | | | | |
| | | | | ($) | |
| Assets | | Investments, at cost | | | 756,583,796 | |
| | | | | | |
| | Investments at value (including securities on loan of $46,602,544) | | | 771,854,608 | |
| | Cash | | | 351,331 | |
| | Receivable for: | | | | |
| | Investments sold | | | 15,816,305 | |
| | Fund shares sold | | | 108,032 | |
| | Interest | | | 2,935,945 | |
| | Securities lending income | | | 3,444 | |
| | Futures variation margin | | | 138,078 | |
| | Trustees’ deferred compensation plan | | | 91,070 | |
| | Prepaid expenses | | | 11,729 | |
| | | |
| | Total Assets | | | 791,310,542 | |
| | |
| Liabilities | | Collateral on securities loaned | | | 47,219,235 | |
| | Written put option contracts, at value (premium of $51,275) | | | 46,875 | |
| | Securities sold short, at value (proceeds $7,213,008) | | | 7,237,265 | |
| | Expense reimbursement due to investment advisor | | | 7,560 | |
| | Payable for: | | | | |
| | Interest | | | 230 | |
| | Investments purchased on delayed delivery basis | | | 161,282,421 | |
| | Fund shares repurchased | | | 570,271 | |
| | Distributions | | | 378,792 | |
| | Investment advisory fee | | | 254,538 | |
| | Pricing and bookkeeping fees | | | 12,996 | |
| | Transfer agent fee | | | 95,218 | |
| | Trustees’ fees | | | 27,119 | |
| | Custody fee | | | 8,859 | |
| | Distribution and service fees | | | 121,922 | |
| | Chief compliance officer expenses | | | 231 | |
| | Trustees’ deferred compensation plan | | | 91,070 | |
| | Interest payable for short sales | | | 15,688 | |
| | Other liabilities | | | 100,193 | |
| | | |
| | Total Liabilities | | | 217,470,483 | |
| |
| | | |
| | Net Assets | | | 573,840,059 | |
| | |
| Net Assets Consist of | | Paid-in capital | | | 565,145,620 | |
| | Overdistributed net investment income | | | (498,053 | ) |
| | Accumulated net realized loss | | | (6,256,472 | ) |
| | Net unrealized appreciation (depreciation) on: | | | | |
| | Investments | | | 15,270,812 | |
| | Futures contracts | | | 198,009 | |
| | Short sales | | | (24,257 | ) |
| | Written put option contracts | | | 4,400 | |
| | | |
| | Net Assets | | | 573,840,059 | |
See Accompanying Notes to Financial Statements.
13
Statement of Assets and Liabilities (continued) – Columbia Federal Securities Fund
August 31, 2010
| | | | | | |
| | | | | | |
| Class A | | Net assets | | $ | 485,782,049 | |
| | Shares outstanding | | | 43,668,131 | |
| | Net asset value per share | | $ | 11.12 | (a) |
| | Maximum sales charge | | | 4.75 | % |
| | Maximum offering price per share ($11.12/0.9525) | | $ | 11.67 | (b) |
| | |
| Class B | | Net assets | | $ | 12,437,403 | |
| | Shares outstanding | | | 1,118,022 | |
| | Net asset value and offering price per share | | $ | 11.12 | (a) |
| | |
| Class C | | Net assets | | $ | 11,497,765 | |
| | Shares outstanding | | | 1,033,558 | |
| | Net asset value and offering price per share | | $ | 11.12 | (a) |
| | |
| Class Z | | Net assets | | $ | 64,122,842 | |
| | Shares outstanding | | | 5,764,121 | |
| | Net asset value, offering and redemption price per share | | $ | 11.12 | |
| (a) | Redemption price per share is equal to net asset value less any applicable contingent deferred sales charge. |
| (b) | On sales of $50,000 or more the offering price is reduced. |
See Accompanying Notes to Financial Statements.
14
Statement of Operations – Columbia Federal Securities Fund
For the Year Ended August 31, 2010
| | | | | | |
| | | | | ($) | |
| Investment Income | | Interest | | | 18,604,663 | |
| | Securities lending income | | | 136,277 | |
| | Dollar roll fee income | | | 27,759 | |
| | | |
| | Total Investment Income | | | 18,768,699 | |
| | |
| Expenses | | Investment advisory fee | | | 3,118,714 | |
| | Distribution fee: | | | | |
| | Class B | | | 140,668 | |
| | Class C | | | 92,398 | |
| | Service fee: | | | | |
| | Class A | | | 1,241,870 | |
| | Class B | | | 46,884 | |
| | Class C | | | 30,800 | |
| | Pricing and bookkeeping fees | | | 183,254 | |
| | Transfer agent fee | | | 739,772 | |
| | Trustees’ fees | | | 47,367 | |
| | Custody fee | | | 100,520 | |
| | Chief compliance officer expenses | | | 1,242 | |
| | Other expenses | | | 324,654 | |
| | | | | | |
| | Expenses before interest expense | | | 6,068,143 | |
| | Interest expense | | | 502 | |
| | | |
| | Total Expenses | | | 6,068,645 | |
| | |
| | Fees waived or expenses reimbursed by investment advisor | | | (331,138 | ) |
| | Fees waived by distributor – Class C | | | (18,572 | ) |
| | Expense reductions | | | (283 | ) |
| | | |
| | Net Expenses | | | 5,718,652 | |
| |
| | | |
| | Net Investment Income | | | 13,050,047 | |
| | |
| Net Realized and Unrealized Gain (Loss) on Investments, Futures Contracts, Written Put Option Contracts and Short Sales | | Net realized gain on: | | | | |
| | Investments | | | 17,054,092 | |
| | Futures contracts | | | 680,272 | |
| | | |
| | Net realized gain | | | 17,734,364 | |
| | |
| | Net change in unrealized appreciation (depreciation) on: | | | | |
| | Investments | | | 5,756,748 | |
| | Futures contracts | | | 198,009 | |
| | Written put option contracts | | | 4,400 | |
| | Short sales | | | (24,257 | ) |
| | | |
| | Net change in unrealized appreciation (depreciation) | | | 5,934,900 | |
| | | |
| | Net Gain | | | 23,669,264 | |
| |
| | | |
| | Net Increase Resulting from Operations | | | 36,719,311 | |
See Accompanying Notes to Financial Statements.
15
Statement of Changes in Net Assets – Columbia Federal Securities Fund
| | | | | | | | | | |
| | | | | Year Ended August 31, | |
| Increase (Decrease) in Net Assets | | | | 2010 ($) | | | 2009 ($) | |
| Operations | | Net investment income | | | 13,050,047 | | | | 22,454,971 | |
| | Net realized gain on investments and futures contracts | | | 17,734,364 | | | | 14,561,611 | |
| | Net change in unrealized appreciation (depreciation) on investments, futures contracts, written put option contracts and short sales | | | 5,934,900 | | | | 1,716,151 | |
| | | |
| | Net increase resulting from operations | | | 36,719,311 | | | | 38,732,733 | |
| | | |
| Distributions to Shareholders | | From net investment income: | | | | | | | | |
| | Class A | | | (12,445,957 | ) | | | (18,982,480 | ) |
| | Class B | | | (342,382 | ) | | | (918,131 | ) |
| | Class C | | | (237,818 | ) | | | (460,568 | ) |
| | Class Z | | | (1,928,869 | ) | | | (2,887,362 | ) |
| | | |
| | Total distributions to shareholders | | | (14,955,026 | ) | | | (23,248,541 | ) |
| | | |
| | Net Capital Stock Transactions | | | (77,136,938 | ) | | | (49,705,001 | ) |
| | Increase from regulatory settlements | | | 86,467 | | | | 69,270 | |
| | | | | | | | | | |
| | Total decrease in net assets | | | (55,286,186 | ) | | | (34,151,539 | ) |
| | | |
| Net Assets | | Beginning of period | | | 629,126,245 | | | | 663,277,784 | |
| | End of period | | | 573,840,059 | | | | 629,126,245 | |
| | Overdistributed net investment income at end of period | | | (498,053 | ) | | | (685,288 | ) |
See Accompanying Notes to Financial Statements.
16
Statement of Changes in Net Assets (continued) – Columbia Federal Securities Fund
| | | | | | | | | | | | |
| | | Capital Stock Activity | |
| | | Year Ended
August 31, 2010 | | | Year Ended
August 31, 2009 | |
| | | Shares | | | Dollars ($) | | | Shares | | | Dollars ($) | |
Class A | | | | | | | | | | | | |
Subscriptions | | 1,711,781 | | | 18,563,421 | | | 3,556,008 | | | 37,812,023 | |
Distributions reinvested | | 828,086 | | | 8,984,503 | | | 1,277,998 | | | 13,595,455 | |
Redemptions | | (7,018,040 | ) | | (76,000,707 | ) | | (9,159,108 | ) | | (97,530,319 | ) |
| | | | | | | | | | | | |
Net decrease | | (4,478,173 | ) | | (48,452,783 | ) | | (4,325,102 | ) | | (46,122,841 | ) |
Class B | | | | | | | | | | | | |
Subscriptions | | 85,796 | | | 930,941 | | | 924,207 | | | 9,820,780 | |
Distributions reinvested | | 22,602 | | | 244,732 | | | 66,978 | | | 712,144 | |
Redemptions | | (1,429,173 | ) | | (15,466,578 | ) | | (1,869,251 | ) | | (19,910,268 | ) |
| | | | | | | | | | | | |
Net decrease | | (1,320,775 | ) | | (14,290,905 | ) | | (878,066 | ) | | (9,377,344 | ) |
Class C | | | | | | | | | | | | |
Subscriptions | | 204,657 | | | 2,226,897 | | | 1,309,558 | | | 13,904,546 | |
Distributions reinvested | | 11,709 | | | 126,967 | | | 21,008 | | | 223,615 | |
Redemptions | | (508,449 | ) | | (5,497,597 | ) | | (851,908 | ) | | (9,049,658 | ) |
| | | | | | | | | | | | |
Net increase (decrease) | | (292,083 | ) | | (3,143,733 | ) | | 478,658 | | | 5,078,503 | |
Class Z | | | | | | | | | | | | |
Subscriptions | | 1,067,627 | | | 11,553,097 | | | 2,295,644 | | | 24,441,990 | |
Distributions reinvested | | 35,229 | | | 382,416 | | | 42,909 | | | 456,821 | |
Redemptions | | (2,137,976 | ) | | (23,185,030 | ) | | (2,274,304 | ) | | (24,182,130 | ) |
| | | | | | | | | | | | |
Net increase (decrease) | | (1,035,120 | ) | | (11,249,517 | ) | | 64,249 | | | 716,681 | |
See Accompanying Notes to Financial Statements.
17
Financial Highlights – Columbia Federal Securities Fund
Selected data for a share outstanding throughout each period is as follows:
| | | | | | | | | | | | | | | | | | | | |
| | | Year Ended August 31, | |
| Class A Shares | | 2010 | | | 2009 | | | 2008 | | | 2007 | | | 2006 | |
Net Asset Value, Beginning of Period | | $ | 10.72 | | | $ | 10.47 | | | $ | 10.30 | | | $ | 10.38 | | | $ | 10.73 | |
| | | | | |
Income from Investment Operations: | | | | | | | | | | | | | | | | | | | | |
Net investment income (a) | | | 0.24 | | | | 0.36 | | | | 0.46 | | | | 0.46 | | | | 0.44 | |
Net realized and unrealized gain (loss) on investments, futures contracts, written options and short sales | | | 0.43 | | | | 0.26 | | | | 0.17 | | | | (0.08 | ) | | | (0.32 | ) |
| | | | | | | | | | | | | | | | | | | | |
Total from investment operations | | | 0.67 | | | | 0.62 | | | | 0.63 | | | | 0.38 | | | | 0.12 | |
| | | | | |
Less Distributions to Shareholders: | | | | | | | | | | | | | | | | | | | | |
From net investment income | | | (0.27 | ) | | | (0.37 | ) | | | (0.46 | ) | | | (0.46 | ) | | | (0.46 | ) |
From return of capital | | | — | | | | — | | | | — | | | | — | (b) | | | (0.01 | ) |
| | | | | | | | | | | | | | | | | | | | |
Total distributions to shareholders | | | (0.27 | ) | | | (0.37 | ) | | | (0.46 | ) | | | (0.46 | ) | | | (0.47 | ) |
| | | | | |
Increase from regulatory settlements | | | — | (b) | | | — | (b) | | | — | | | | — | | | | — | |
| | | | | |
Net Asset Value, End of Period | | $ | 11.12 | | | $ | 10.72 | | | $ | 10.47 | | | $ | 10.30 | | | $ | 10.38 | |
Total return (c) | | | 6.34 | %(d) | | | 6.04 | %(d) | | | 6.18 | % | | | 3.73 | %(d) | | | 1.07 | %(d) |
| | | | | |
Ratios to Average Net Assets/Supplemental Data: | | | | | | | | | | | | | | | | | | | | |
Net expenses before interest expense (e) | | | 0.95 | % | | | 0.96 | % | | | 0.98 | % | | | 0.95 | % | | | 0.97 | % |
Interest expense | | | — | %(f) | | | — | %(f) | | | — | | | | — | | | | — | |
Net expenses (e) | | | 0.95 | % | | | 0.96 | % | | | 0.98 | % | | | 0.95 | % | | | 0.97 | % |
Waiver/Reimbursement | | | 0.06 | % | | | 0.02 | % | | | — | | | | 0.02 | % | | | 0.01 | % |
Net investment income (e) | | | 2.19 | % | | | 3.39 | % | | | 4.33 | % | | | 4.43 | % | | | 4.24 | % |
Portfolio turnover rate(g) | | | 194 | % | | | 253 | % | | | 135 | % | | | 121 | % | | | 92 | % |
Net assets, end of period (000s) | | $ | 485,782 | | | $ | 515,928 | | | $ | 549,203 | | | $ | 589,124 | | | $ | 665,283 | |
| (a) | Per share data was calculated using the average shares outstanding during the period. |
| (b) | Rounds to less than $0.01 per share. |
| (c) | Total return at net asset value assuming all distributions reinvested and no initial sales charge or contingent deferred sales charge. |
| (d) | Had the investment advisor and/or any of its affiliates not waived fees or reimbursed a portion of expenses, total return would have been reduced. |
| (e) | The benefits derived from expense reductions had an impact of less than 0.01% except for August 31,2007 which had a 0.01% impact. |
| (f) | Rounds to less than 0.01%. |
| (g) | Portfolio turnover excludes dollar roll transactions. |
See Accompanying Notes to Financial Statements.
18
Financial Highlights – Columbia Federal Securities Fund
Selected data for a share outstanding throughout each period is as follows:
| | | | | | | | | | | | | | | | | | | | |
| | | Year Ended August 31, | |
| Class B Shares | | 2010 | | | 2009 | | | 2008 | | | 2007 | | | 2006 | |
Net Asset Value, Beginning of Period | | $ | 10.72 | | | $ | 10.47 | | | $ | 10.30 | | | $ | 10.38 | | | $ | 10.73 | |
| | | | | |
Income from Investment Operations: | | | | | | | | | | | | | | | | | | | | |
Net investment income (a) | | | 0.16 | | | | 0.28 | | | | 0.38 | | | | 0.38 | | | | 0.36 | |
Net realized and unrealized gain (loss) on investments, futures��contracts, written options and short sales | | | 0.43 | | | | 0.26 | | | | 0.17 | | | | (0.08 | ) | | | (0.32 | ) |
| | | | | | | | | | | | | | | | | | | | |
Total from investment operations | | | 0.59 | | | | 0.54 | | | | 0.55 | | | | 0.30 | | | | 0.04 | |
| | | | | |
Less Distributions to Shareholders: | | | | | | | | | | | | | | | | | | | | |
From net investment income | | | (0.19 | ) | | | (0.29 | ) | | | (0.38 | ) | | | (0.38 | ) | | | (0.38 | ) |
From return of capital | | | — | | | | — | | | | — | | | | — | (b) | | | (0.01 | ) |
| | | | | | | | | | | | | | | | | | | | |
Total distributions to shareholders | | | (0.19 | ) | | | (0.29 | ) | | | (0.38 | ) | | | (0.38 | ) | | | (0.39 | ) |
| | | | | |
Increase from regulatory settlements | | | — | (b) | | | — | (b) | | | — | | | | — | | | | — | |
| | | | | |
Net Asset Value, End of Period | | $ | 11.12 | | | $ | 10.72 | | | $ | 10.47 | | | $ | 10.30 | | | $ | 10.38 | |
Total return (c) | | | 5.56 | %(d) | | | 5.25 | %(d) | | | 5.39 | % | | | 2.96 | %(d) | | | 0.32 | %(d) |
| | | | | |
Ratios to Average Net Assets/Supplemental Data: | | | | | | | | | | | | | | | | | | | | |
Net expenses before interest expense (e) | | | 1.70 | % | | | 1.71 | % | | | 1.73 | % | | | 1.70 | % | | | 1.72 | % |
Interest expense | | | — | %(f) | | | — | %(f) | | | — | | | | — | | | | — | |
Net expenses (e) | | | 1.70 | % | | | 1.71 | % | | | 1.73 | % | | | 1.70 | % | | | 1.72 | % |
Waiver/Reimbursement | | | 0.06 | % | | | 0.02 | % | | | — | | | | 0.02 | % | | | 0.01 | % |
Net investment income (e) | | | 1.51 | % | | | 2.67 | % | | | 3.59 | % | | | 3.68 | % | | | 3.49 | % |
Portfolio turnover rate (g) | | | 194 | % | | | 253 | % | | | 135 | % | | | 121 | % | | | 92 | % |
Net assets, end of period (000s) | | $ | 12,437 | | | $ | 26,134 | | | $ | 34,716 | | | $ | 44,345 | | | $ | 65,896 | |
| (a) | Per share data was calculated using the average shares outstanding during the period. |
| (b) | Rounds to less than $0.01 per share. |
| (c) | Total return at net asset value assuming all distributions reinvested and no contingent deferred sales charge. |
| (d) | Had the investment advisor and/or any of its affiliates not waived fees or reimbursed a portion of expenses, total return would have been reduced. |
| (e) | The benefits derived from expense reductions had an impact of less than 0.01% except for August 31,2007 which had a 0.01% impact. |
| (f) | Rounds to less than 0.01%. |
| (g) | Portfolio turnover excludes dollar roll transactions. |
See Accompanying Notes to Financial Statements.
19
Financial Highlights – Columbia Federal Securities Fund
Selected data for a share outstanding throughout each period is as follows:
| | | | | | | | | | | | | | | | | | | | |
| | | Year Ended August 31, | |
| Class C Shares | | 2010 | | | 2009 | | | 2008 | | | 2007 | | | 2006 | |
Net Asset Value, Beginning of Period | | $ | 10.72 | | | $ | 10.47 | | | $ | 10.30 | | | $ | 10.38 | | | $ | 10.73 | |
| | | | | |
Income from Investment Operations: | | | | | | | | | | | | | | | | | | | | |
Net investment income (a) | | | 0.17 | | | | 0.29 | | | | 0.39 | | | | 0.40 | | | | 0.38 | |
Net realized and unrealized gain (loss) on investments,
futures contracts, written options and short sales | | | 0.44 | | | | 0.27 | | | | 0.18 | | | | (0.08 | ) | | | (0.33 | ) |
| | | | | | | | | | | | | | | | | | | | |
Total from investment operations | | | 0.61 | | | | 0.56 | | | | 0.57 | | | | 0.32 | | | | 0.05 | |
| | | | | |
Less Distributions to Shareholders: | | | | | | | | | | | | | | | | | | | | |
From net investment income | | | (0.21 | ) | | | (0.31 | ) | | | (0.40 | ) | | | (0.40 | ) | | | (0.39 | ) |
From return of capital | | | — | | | | — | | | | — | | | | — | (b) | | | (0.01 | ) |
| | | | | | | | | | | | | | | | | | | | |
Total distributions to shareholders | | | (0.21 | ) | | | (0.31 | ) | | | (0.40 | ) | | | (0.40 | ) | | | (0.40 | ) |
| | | | | |
Increase from regulatory settlements | | | — | (b) | | | — | (b) | | | — | | | | — | | | | — | |
| | | | | |
Net Asset Value, End of Period | | $ | 11.12 | | | $ | 10.72 | | | $ | 10.47 | | | $ | 10.30 | | | $ | 10.38 | |
Total return (c)(d) | | | 5.71 | % | | | 5.40 | % | | | 5.54 | % | | | 3.11 | % | | | 0.47 | % |
| | | | | |
Ratios to Average Net Assets/Supplemental Data: | | | | | | | | | | | | | | | | | | | | |
Net expenses before interest expense (e) | | | 1.55 | % | | | 1.56 | % | | | 1.58 | % | | | 1.55 | % | | | 1.57 | % |
Interest expense | | | — | %(f) | | | — | %(f) | | | — | | | | — | | | | — | |
Net expenses (e) | | | 1.55 | % | | | 1.56 | % | | | 1.58 | % | | | 1.55 | % | | | 1.57 | % |
Waiver/Reimbursement | | | 0.21 | % | | | 0.17 | % | | | 0.15 | % | | | 0.17 | % | | | 0.16 | % |
Net investment income (e) | | | 1.61 | % | | | 2.76 | % | | | 3.73 | % | | | 3.83 | % | | | 3.65 | % |
Portfolio turnover rate (g) | | | 194 | % | | | 253 | % | | | 135 | % | | | 121 | % | | | 92 | % |
Net assets, end of period (000s) | | $ | 11,498 | | | $ | 14,205 | | | $ | 8,865 | | | $ | 7,051 | | | $ | 8,231 | |
| (a) | Per share data was calculated using the average shares outstanding during the period. |
| (b) | Rounds to less than $0.01 per share. |
| (c) | Total return at net asset value assuming all distributions reinvested and no contingent deferred sales charge. |
| (d) | Had the investment advisor and/or any of its affiliates not waived fees or reimbursed a portion of expenses, total return would have been reduced. |
| (e) | The benefits derived from expense reductions had an impact of less than 0.01% except for August 31, 2007 which had an impact of 0.01%. |
| (f) | Rounds to less than 0.01%. |
| (g) | Portfolio turnover excludes dollar roll transactions. |
See Accompanying Notes to Financial Statements.
20
Financial Highlights – Columbia Federal Securities Fund
Selected data for a share outstanding throughout each period is as follows:
| | | | | | | | | | | | | | | | | | | | |
| | | Year Ended August 31, | |
| Class Z Shares | | 2010 | | | 2009 | | | 2008 | | | 2007 | | | 2006 | |
Net Asset Value, Beginning of Period | | $ | 10.72 | | | $ | 10.47 | | | $ | 10.30 | | | $ | 10.38 | | | $ | 10.73 | |
| | | | | |
Income from Investment Operations: | | | | | | | | | | | | | | | | | | | | |
Net investment income (a) | | | 0.26 | | | | 0.39 | | | | 0.48 | | | | 0.48 | | | | 0.46 | |
Net realized and unrealized gain (loss) on investments, futures contracts, written options and short sales | | | 0.44 | | | | 0.26 | | | | 0.18 | | | | (0.07 | ) | | | (0.32 | ) |
| | | | | | | | | | | | | | | | | | | | |
Total from investment operations | | | 0.70 | | | | 0.65 | | | | 0.66 | | | | 0.41 | | | | 0.14 | |
| | | | | |
Less Distributions to Shareholders: | | | | | | | | | | | | | | | | | | | | |
From net investment income | | | (0.30 | ) | | | (0.40 | ) | | | (0.49 | ) | | | (0.49 | ) | | | (0.48 | ) |
From return of capital | | | — | | | | — | | | | — | | | | — | (b) | | | (0.01 | ) |
| | | | | | | | | | | | | | | | | | | | |
Total distributions to shareholders | | | (0.30 | ) | | | (0.40 | ) | | | (0.49 | ) | | | (0.49 | ) | | | (0.49 | ) |
| | | | | |
Increase from regulatory settlements | | | — | (b) | | | — | (b) | | | — | | | | — | | | | — | |
| | | | | |
Net Asset Value, End of Period | | $ | 11.12 | | | $ | 10.72 | | | $ | 10.47 | | | $ | 10.30 | | | $ | 10.38 | |
Total return (c) | | | 6.61 | %(d) | | | 6.31 | %(d) | | | 6.45 | % | | | 3.99 | %(d) | | | 1.33 | %(d) |
| | | | | |
Ratios to Average Net Assets/Supplemental Data: | | | | | | | | | | | | | | | | | | | | |
Net expenses before interest expense (e) | | | 0.70 | % | | | 0.71 | % | | | 0.73 | % | | | 0.70 | % | | | 0.72 | % |
Interest expense | | | — | %(f) | | | — | %(f) | | | — | | | | — | | | | — | |
Net expenses (e) | | | 0.70 | % | | | 0.71 | % | | | 0.73 | % | | | 0.70 | % | | | 0.72 | % |
Waiver/Reimbursement | | | 0.06 | % | | | 0.02 | % | | | — | | | | 0.02 | % | | | 0.01 | % |
Net investment income (e) | | | 2.44 | % | | | 3.63 | % | | | 4.58 | % | | | 4.68 | % | | | 4.51 | % |
Portfolio turnover rate (g) | | | 194 | % | | | 253 | % | | | 135 | % | | | 121 | % | | | 92 | % |
Net assets, end of period (000s) | | $ | 64,123 | | | $ | 72,860 | | | $ | 70,493 | | | $ | 104,504 | | | $ | 109,187 | |
| (a) | Per share data was calculated using the average shares outstanding during the period. |
| (b) | Rounds to less than $0.01 per share. |
| (c) | Total return at net asset value assuming all distributions reinvested. |
| (d) | Had the investment advisor and/or any of its affiliates not waived fees or reimbursed a portion of expenses, total return would have been reduced. |
| (e) | The benefits derived from expense reductions had an impact of less than 0.01% except for August 31. 2007 which had an impact of 0.01%. |
| (f) | Rounds to less than 0.01%. |
| (g) | Portfolio turnover excludes dollar roll transactions. |
See Accompanying Notes to Financial Statements.
21
Notes to Financial Statements – Columbia Federal Securities Fund
August 31, 2010
Note 1. Organization
Columbia Federal Securities Fund (the “Fund”), a series of Columbia Funds Series Trust I (the “Trust”), is a diversified fund. The Trust is registered under the Investment Company Act of 1940, as amended (the “1940 Act”), as an open-end management investment company organized as a Massachusetts business trust.
Investment Objective
The Fund seeks total return, consisting of current income and capital appreciation.
Fund Shares
The Trust may issue an unlimited number of shares, and the Fund offers four classes of shares: Class A, Class B, Class C and Class Z. Each share class has its own expense structure and sales charges, as applicable. The Fund no longer accepts investments from new or existing investors in the Fund’s Class B shares, except in connection with the reinvestment of any dividend and/or capital gain distributions in Class B shares of the Fund and exchanges by existing Class B shareholders of the other Columbia Funds.
Class A shares are subject to a maximum front-end sales charge of 4.75% based on the amount of initial investment. Class A shares purchased without an initial sales charge in accounts aggregating $1 million to $50 million at the time of purchase are subject to a 1.00% contingent deferred sales charge (“CDSC”) if the shares are sold within one year after purchase. Class B shares are subject to a maximum CDSC of 5.00% based upon the holding period after purchase. Class B shares will convert to Class A shares eight years after purchase. Class C shares are subject to a 1.00% CDSC on shares sold within one year after purchase. Class Z shares are offered continuously at net asset value. There are certain restrictions on the purchase of Class Z shares, as described in the Fund’s prospectus.
Note 2. Significant Accounting Policies
The preparation of financial statements in accordance with accounting principles generally accepted in the United States of America (“GAAP”) requires management to make certain estimates and assumptions that affect the reported amounts of assets and liabilities, the disclosure of contingent assets and liabilities at the date of the financial statements and the reported amounts of revenue and expenses during the reporting period. Actual results could differ from those estimates.
Management has evaluated the events and transactions that have occurred through the date the financial statements were issued and noted no items requiring adjustment of the financial statements or additional disclosures.
The following is a summary of significant accounting policies consistently followed by the Fund in the preparation of its financial statements.
Security Valuation
Debt securities generally are valued by pricing services approved by the Trust’s Board of Trustees, based upon market transactions for normal, institutional-size trading units of similar securities. The services may use various pricing techniques which take into account appropriate factors such as yield, quality, coupon rate, maturity, type of issue, trading characteristics and other data, as well as broker quotes. Debt securities for which quotations are readily available may also be valued based upon an over-the-counter or exchange bid quotation.
Asset-backed and mortgage-backed securities are generally valued by pricing services, which utilize pricing models that incorporate the securities’ cash flow and loan performance data. These models also take into account available market data, including trades, market quotations, and benchmark yield curves for identical or similar securities. Factors used to identify similar securities may include, but are not limited to, issuer, collateral type, vintage, prepayment speeds, collateral performance, credit ratings, credit enhancement and expected life. Asset-backed and mortgage-backed securities for which quotations are readily available may also be valued based upon an over-the-counter or exchange bid quotation.
Certain debt securities, which tend to be more thinly traded and of lesser quality, are priced based on fundamental analysis of the financial condition of the issuer and the estimated value of any collateral. Valuations developed through pricing techniques may vary from the actual amounts realized upon sale of the securities, and the potential variation may be greater for those securities valued using fundamental analysis.
22
Columbia Federal Securities Fund
August 31, 2010
Futures contracts are valued at the settlement price established each day by the board of trade or exchange on which they are traded.
Written options are valued at the last reported sale price, or in the absence of a sale, at the last quoted ask price.
Short-term investments maturing in 60 days or less are valued at amortized cost, which approximates market value.
Investments for which market quotations are not readily available, or that have quotations which management believes are not reliable, are valued at fair value as determined in good faith under consistently applied procedures established by and under the general supervision of the Board of Trustees. If a security is valued at fair value, such value is likely to be different from the last quoted market price for the security. The determination of fair value often requires significant judgment. To determine fair value, management may use assumptions including but not limited to future cash flows and estimated risk premiums. Multiple inputs from various sources may be used to determine value.
GAAP establishes a hierarchy that prioritizes the inputs to valuation techniques used to measure fair value giving the highest priority to unadjusted quoted prices in active markets for identical securities (level 1 measurements) and the lowest priority to unobservable inputs (level 3 measurements) when market prices are not readily available or reliable. The three levels of the fair value hierarchy are described below:
| n | | Level 1 — quoted prices in active markets for identical securities |
| n | | Level 2 — prices determined using other significant observable inputs (including quoted prices for similar securities, interest rates, prepayment speeds, credit risk and others) |
| n | | Level 3 — prices determined using significant unobservable inputs. In situations where quoted prices or observable inputs are unavailable or less reliable, unobservable inputs may be used. Unobservable inputs may include management’s own assumptions about the factors market participants would use in pricing an investment. |
The inputs or methodology used for valuing securities are not necessarily an indication of the risk associated with investing in those securities.
On January 21, 2010, the Financial Accounting Standards Board issued an Accounting Standards Update (the “amendment”), Fair Value Measurements and Disclosures (Topic 820): Improving Disclosures about Fair Value Measurements, which provides guidance on how investment assets and liabilities are to be valued and disclosed. Specifically, the amendment requires reporting entities to disclose the inputs and valuation techniques used to measure fair value for both recurring and nonrecurring fair value measurements for Level 2 and Level 3 positions. The amendment also requires that transfers between all levels (including Level 1 and Level 2) be disclosed on a gross basis (i.e., transfers out must be disclosed separately from transfers in), and requires disclosure of the reason(s) for significant transfers. Additionally, purchases, sales, issuances and settlements must be disclosed on a gross basis in the Level 3 roll forward. The effective date of the amendment is for interim and annual periods beginning after December 15, 2009; except for the requirement to provide the Level 3 activity for purchases, sales, issuances and settlements on a gross basis, which will be effective for interim and annual periods beginning after December 15, 2010. At this time, management is evaluating the implications of the amendment and the impact to the financial statements.
Security Transactions
Security transactions are accounted for on the trade date. Cost is determined and gains (losses) are based upon the specific identification method for both financial statement and federal income tax purposes.
Derivative Instruments
The Fund may invest in derivative instruments. For additional information on derivative instruments, please see Note 6.
Repurchase Agreements
The Fund may engage in repurchase agreement transactions with institutions that management has determined are creditworthy. The Fund, through its custodian, receives delivery of the underlying securities collateralizing a repurchase agreement. Management is responsible for determining that the collateral is at least equal, at all times, to the value of the repurchase obligation including interest. A repurchase agreement transaction involves certain risks in
23
Columbia Federal Securities Fund
August 31, 2010
the event of default or insolvency of the counterparty. These risks include possible delays in or restrictions on the Fund’s ability to dispose of the underlying securities and a possible decline in the value of the underlying securities during the period while the Fund seeks to assert its rights.
Mortgage Dollar Roll Transactions
The Fund may enter into mortgage “dollar rolls” in which the Fund sells securities for delivery in the current month and simultaneously contracts with the same counterparty to repurchase similar (same type, coupon and maturity) but not identical securities on a specified future date not exceeding 120 days. During the roll period, the Fund loses the right to receive principal and interest paid on the securities sold. However, the Fund would benefit to the extent of any difference between the price received for the securities sold and the lower forward price for the future purchase (often referred to as the “drop”) or fee income plus the interest earned on the cash proceeds of the securities sold until the settlement date of the forward purchase. Unless such benefits exceed the income, capital appreciation and gain or loss due to mortgage prepayments that would have been realized on the securities sold as part of the mortgage dollar roll, the use of this technique will diminish the investment performance of the Fund compared to what the performance would have been without the use of mortgage dollar rolls. All cash proceeds will be invested in instruments that are permissible investments for the Fund. The Fund identifies within its portfolio of investments cash or liquid securities in an amount equal to the forward purchase price.
For financial reporting and tax purposes, the Fund treats “to be announced” mortgage dollar rolls as two separate transactions, one involving the purchase of a security and a separate transaction involving a sale. The Fund does not currently enter into mortgage dollar rolls that are accounted for as financing transactions.
Mortgage dollar rolls involve certain risks. If the broker-dealer to whom the Fund sells the securities becomes insolvent, the Fund’s right to purchase or repurchase the mortgage-related securities may be restricted and the instruments which the Fund is required to repurchase may be worth less than instruments which the Fund originally held. Successful use of mortgage dollar rolls may depend upon the investment advisor’s ability to predict interest rates and mortgage prepayments. For these reasons, there is no assurance that mortgage dollar rolls can be successfully employed.
Delayed Delivery Securities
The Fund may trade securities on other than normal settlement terms, including securities purchased or sold on a “when-issued” basis. This may increase the risk if the other party to the transaction fails to deliver and causes the Fund to subsequently invest at less advantageous prices. The Fund identifies within its portfolio of investments cash or liquid securities in an amount equal to the delayed delivery commitment.
Short Sales
The Fund may sell a security it does not own in anticipation of a decline in the fair value of the security. The Fund can purchase the same security at the current market price and deliver it to the broker to close out the short sale. A short position is reported at value in the Statement of Asset and Liabilities. The Fund will realize a gain if the security declines in value, and will realize a loss if the security appreciates in value. Such gain, limited to the price at which the Fund sold the security short, or such loss, potentially unlimited in size because the short position loses value as the market price of the security sold short increases, will be recognized upon the termination of a short sale. There is also the risk that the broker may fail to honor its contract terms, causing a loss to the Fund.
Stripped Securities
The Fund may invest in Interest only (“IO”) and Principal Only (“PO”) stripped mortgage-backed securities. These securities are derivative multi-class mortgage securities structured so that one class receives most, if not all, of the principal from the underlying mortgage assets, while the other class receives most, if not all, of the interest and the remainder of the principal, if any. If the underlying mortgage assets experience greater than anticipated prepayments of principal, the Fund may fail to fully recoup its initial investment in an IO security; therefore, the daily interest accrual factor is adjusted each month to reflect the paydown of principal. The market value of these securities can be extremely volatile in response to changes in interest rates. Credit risk reflects the risk that the Fund may not receive all
24
Columbia Federal Securities Fund
August 31, 2010
or part of its principal because the issuer or credit enhancer has defaulted on its obligation.
Income Recognition
Interest income is recorded on the accrual basis and includes accretion of discounts, amortization of premiums and paydown gains and losses. Fee income attributable to mortgage dollar roll transactions is recorded on the accrual basis over the term of the transaction. The value of additional securities received as an income payment is recorded as income and as the cost basis of such securities.
Expenses
General expenses of the Trust are allocated to the Fund and other series of the Trust based upon relative net assets or other expense allocation methodologies determined by the nature of the expense. Expenses directly attributable to the Fund are charged to the Fund.
Determination of Class Net Asset Value
All income, expenses (other than class-specific expenses, as shown on the Statement of Operations) and realized and unrealized gains (losses) are allocated to each class of the Fund on a daily basis for purposes of determining the net asset value of each class. Income and expenses are allocated to each class based on the settled shares method, while realized and unrealized gains (losses) are allocated based on the relative net assets of each class.
Federal Income Tax Status
The Fund intends to qualify each year as a “regulated investment company” under Subchapter M of the Internal Revenue Code, as amended, and will distribute substantially all of its tax exempt or taxable income, if any, for its tax year, and as such will not be subject to federal income taxes. In addition, the Fund intends to distribute in each calendar year substantially all of its net investment income, capital gains and certain other amounts, if any, such that the Fund should not be subject to federal excise tax. Therefore, no federal income or excise tax provision is recorded.
Distributions to Shareholders
Distributions from net investment income are declared daily and paid monthly. Net realized capital gains, if any, are distributed at least annually. Income distributions and capital gain distributions are determined in accordance with federal income tax regulations which may differ from GAAP.
Indemnification
In the normal course of business, the Fund enters into contracts that contain a variety of representations and warranties and which provide general indemnities. The Fund’s maximum exposure under these arrangements is unknown because this would involve future claims against the Fund. Also, under the Trust’s organizational documents and by contract, the Trustees and officers of the Trust are indemnified against certain liabilities that may arise out of actions relating to their duties to the Trust. However, based on experience, the Fund expects the risk of loss due to these representations, warranties and indemnities to be minimal.
Note 3. Federal Tax Information
The timing and character of income and capital gain distributions are determined in accordance with income tax regulations, which may differ from GAAP. Reclassifications are made to the Fund’s capital accounts for permanent tax differences to reflect income and gains available for distribution (or available capital loss carryforwards) under income tax regulations.
For the year ended August 31, 2010, permanent book and tax basis differences resulting primarily from differing treatments for amortization/accretion adjustments, paydown reclassifications, proceeds from litigation settlements and utilized capital loss carryforwards were identified and reclassified among the components of the Fund’s net assets as follows:
| | | | |
| | | | | |
Overdistributed Net Investment
Income | | Accumulated Net Realized
Loss | | Paid-In Capital |
| $2,092,214 | | $— | | $(2,092,214) |
Net investment income and net realized gains (losses), as disclosed on the Statement of Operations, and net assets were not affected by this reclassification.
25
Columbia Federal Securities Fund
August 31, 2010
The tax character of distributions paid during the years ended August 31, 2010 and August 31, 2009 was as follows:
| | | | | | | | |
| | | | | | | |
| | | August 31, 2010 | | | August 31, 2009 | |
Ordinary Income* | | $ | 14,955,026 | | | $ | 23,248,541 | |
Long-Term Capital Gains | | | — | | | | — | |
| * | For tax purposes short-term capital gains distributions, if any, are considered ordinary income distributions. |
As of August 31, 2010, the components of distributable earnings on a tax basis were as follows:
| | | | |
| | | | | |
Undistributed
Ordinary Income | | Undistributed Long-Term Capital Gains | | Net
Unrealized Appreciation |
| $— | | $— | | $15,270,812 |
Unrealized appreciation and depreciation at August 31, 2010, based on cost of investments for federal income tax purposes were:
| | | | |
| | | | |
Unrealized appreciation | | $ | 16,145,277 | |
Unrealized depreciation | | | (874,465 | ) |
| | | | |
Net unrealized appreciation | | $ | 15,270,812 | |
The following capital loss carryforwards may be available to reduce taxable income arising from future net realized gains on investments, if any, to the extent permitted by the Internal Revenue Code:
| | | | |
| | | | |
| Year of Expiration | | Capital Loss Carryforwards | |
| 2015 | | $ | 5,900,089 | |
Capital loss carryforwards of $12,020,150 were utilized during the year ended August 31, 2010. Any capital loss carryforwards acquired as part of a merger that are permanently lost due to provisions under the Internal Revenue Code are included as being expired. Expired capital loss carryforwards are recorded as a reduction of paid-in capital.
Management is required to determine whether a tax position of the Fund is more likely than not to be sustained upon examination by the applicable taxing authority, including resolution of any related appeals or litigation processes, based on the technical merits of the position. The tax benefit to be recognized by the Fund is measured as the largest amount of benefit that is greater than fifty percent likely of being realized upon ultimate settlement. Management is not aware of any tax positions for which it is reasonably possible that the total amounts of unrecognized tax benefits will significantly change in the next twelve months. However, management’s conclusions may be subject to review and adjustment at a later date based on factors including, but not limited to, new tax laws, regulations, and administrative interpretations (including relevant court decisions). The Fund’s federal tax returns for the prior three fiscal years remain subject to examination by the Internal Revenue Service.
Note 4. Fees and Compensation Paid to Affiliates
Investment Advisory Fee
After the close of business on April 30, 2010, Ameriprise Financial, Inc. (“Ameriprise Financial”) acquired a portion of the asset management business of Columbia Management Group, LLC (the “Transaction”), including the business of managing the Fund. In connection with the closing of the Transaction (the “Closing”), RiverSource Investments, LLC, a wholly owned subsidiary of Ameriprise Financial, became the investment advisor of the Fund and subsequently changed its name to Columbia Management Investment Advisers, LLC (the “New Advisor”). The New Advisor receives a monthly investment advisory fee based on the Fund’s average daily net assets at the following annual rates:
| | | | |
| | | | |
| Average Daily Net Assets | | Annual Fee Rate | |
First $500 million | | | 0.53 | % |
$500 million to $1 billion | | | 0.48 | % |
$1 billion to $1.5 billion | | | 0.45 | % |
$1.5 billion to $3 billion | | | 0.42 | % |
$3 billion to $6 billion | | | 0.41 | % |
Over $6 billion | | | 0.40 | % |
Prior to the Closing, Columbia Management Advisors, LLC (“Columbia”), an indirect, wholly owned subsidiary of Bank of America Corporation (“BOA”), provided investment advisory services to the Fund under the same fee structure.
For the year ended August 31, 2010, the Fund’s effective investment advisory fee rate was 0.52% of the Fund’s average daily net assets.
26
Columbia Federal Securities Fund
August 31, 2010
Administration Fee
Effective upon the Closing, the New Advisor became the administrator of the Fund under a new Administrative Services Agreement (the “Administrative Agreement”). Under the Administrative Agreement, the New Advisor provides administrative and other services to the Fund, including services previously performed under the Pricing and Bookkeeping Oversight and Services Agreement discussed below. The New Advisor does not receive a fee for its services under the Administrative Agreement. Prior to the Closing, Columbia provided administrative services to the Fund as discussed in the Investment Advisory Fee note above.
Pricing and Bookkeeping Fees
Prior to the Closing, the Fund entered into a Financial Reporting Services Agreement (the “Financial Reporting Services Agreement”) with State Street Bank and Trust Company (“State Street”) and Columbia pursuant to which State Street provides financial reporting services to the Fund. The Fund also entered into an Accounting Services Agreement (collectively with the Financial Reporting Services Agreement, the “State Street Agreements”) with State Street and Columbia pursuant to which State Street provides accounting services to the Fund. Upon the Closing, Columbia assigned and delegated its rights and obligations under the State Street Agreements to the New Advisor. Under the State Street Agreements, the Fund pays State Street an annual fee of $38,000 paid monthly plus an additional monthly fee based on an annualized percentage rate of average daily net assets of the Fund for the month. The aggregate fee will not exceed $140,000 per year (exclusive of out-of-pocket expenses and charges). The Fund also reimburses State Street for certain out-of-pocket expenses and charges.
Also prior to the Closing, the Fund entered into a Pricing and Bookkeeping Oversight and Services Agreement (the “Services Agreement”) with Columbia. Under the Services Agreement, Columbia provided services related to Fund expenses and the requirements of the Sarbanes-Oxley Act of 2002, and provided oversight of the accounting and financial reporting services provided by State Street. Under the Services Agreement, the Fund reimbursed Columbia for out-of-pocket expenses. The Services Agreement was terminated upon the Closing. These services are now provided under the Administrative Agreement discussed above.
Transfer Agent Fee
In connection with the Closing, RiverSource Service Corporation, a wholly owned subsidiary of Ameriprise Financial, became the transfer agent of the Fund and subsequently changed its name to Columbia Management Investment Services Corp. (the “New Transfer Agent”). The New Transfer Agent has contracted with Boston Financial Data Services (“BFDS”) to serve as sub-transfer agent. The New Transfer Agent receives a fee for its services, paid monthly, at the annual rate of $22.36 per account plus reimbursement of certain sub-transfer agent fees paid by the New Transfer Agent (exclusive of BFDS fees), calculated based on assets held in omnibus accounts and intended to recover the cost of payments to other parties (including affiliates of BOA) for services to those accounts. The New Transfer Agent pays the fees of BFDS for services as sub-transfer agent and is not entitled to reimbursement for such fees from the Fund.
The New Transfer Agent may also retain, as additional compensation for its services, fees for wire, telephone and redemption orders, Individual Retirement Account (“IRA”) trustee agent fees and account transcript fees due to the New Transfer Agent from shareholders of the Fund and credits (net of bank charges) earned with respect to balances in accounts the New Transfer Agent maintains in connection with its services to the Fund. The New Transfer Agent also receives reimbursement for certain out-of-pocket expenses.
Prior to the Closing, Columbia Management Services, Inc. (the “Previous Transfer Agent”), an affiliate of Columbia and an indirect, wholly owned subsidiary of BOA, provided shareholder services to the Fund and contracted with BFDS to serve as sub-transfer agent, under the same fee structure. Prior to November 1, 2009, the annual rate was $17.34 per open account.
An annual minimum account balance fee of $20 may apply to certain accounts with a value below the Fund’s initial minimum investment requirements to reduce the impact of small accounts on transfer agent fees. These minimum account balance fees are recorded as part of expense reductions on the Statement of Operations. For the year ended August 31, 2010, no minimum account balance fees were charged by the Fund.
27
Columbia Federal Securities Fund
August 31, 2010
Underwriting Discounts, Service and Distribution Fees
In connection with the Closing, RiverSource Fund Distributors, Inc., an indirect wholly owned subsidiary of Ameriprise Financial, became the distributor of the Fund and subsequently changed its name to Columbia Management Investment Distributors, Inc. (the “New Distributor”).
For the year ended August 31, 2010, initial sales charges paid by shareholders on the purchase of Class A shares amounted to $9,893 and net CDSC fees paid by shareholders on certain redemptions of Class A, Class B and Class C shares amounted to $715, $19,222 and $1,362, respectively.
The Fund has adopted shareholder servicing and distribution plans pursuant to Rule 12b-1 under the 1940 Act (the “Plans”) which require the payment of a monthly service fee to the New Distributor at the maximum annual rate of 0.25% of the average daily net assets attributable to Class A, Class B and Class C shares of the Fund. The Plans also require the payment of a monthly distribution fee to the New Distributor at the maximum annual rate of 0.75% of the average daily net assets attributable to Class B and Class C shares. The New Distributor has voluntarily agreed to waive a portion of the distribution fee for Class C shares so that the combined distribution and service fee will not exceed 0.85% annually of the average daily net assets attributable to the Class C shares. This agreement may be modified or terminated by the New Distributor at any time.
The CDSC and the distribution fees received from the Plans are used principally as repayment to the New Distributor for amounts paid by the New Distributor to dealers who sold such shares.
Prior to the Closing, Columbia Management Distributors, Inc, an affiliate of Columbia and an indirect, wholly owned subsidiary of BOA, was the principal underwriter of the Fund’s shares. There were no changes to the underwriting discount structure of the Fund or the service or distribution fee rates paid by the Fund as a result of the Transaction.
Expense Limits and Fee Waivers
Effective May 1, 2010, the New Advisor has voluntarily agreed to reimburse a portion of the Fund’s expenses so that the Fund’s ordinary operating expenses (excluding any distribution and service fees, brokerage commissions, interest, taxes and extraordinary expenses, but including custodian charges relating to overdrafts, if any), after giving effect to any balance credits from the Fund’s custodian, do not exceed 0.70% annually of the Fund’s average daily net assets. This arrangement may be modified or terminated by the New Advisor at any time. Prior to May 1, 2010, Columbia voluntarily reimbursed a portion of the Fund’s expenses in the same manner.
Fees Paid to Officers and Trustees
In connection with the Closing, all officers of the Fund are employees of the New Advisor or its affiliates and, with the exception of the Fund’s Chief Compliance Officer, receive no compensation from the Fund. The Board of Trustees has appointed a Chief Compliance Officer to the Fund in accordance with federal securities regulations. The Fund, along with other affiliated funds, pays its pro-rata share of the expenses associated with the Chief Compliance Officer. The Fund’s expenses for the Chief Compliance Officer will not exceed $15,000 per year. Prior to the Closing, the Fund paid its pro-rata share of the expenses for the Chief Compliance Officer under the same fee structure.
Trustees are compensated for their services to the Fund, as set forth on the Statement of Operations. The Trust’s eligible Trustees may participate in a deferred compensation plan which may be terminated at any time. Obligations of the plan will be paid solely out of the Fund’s assets.
As a result of a fund merger, the Fund assumed the liabilities of the deferred compensation plan of the acquired fund, which are included in “Trustees’ fees” on the Statement of Assets and Liabilities. The deferred compensation plan may be terminated at any time. Any payments to plan participants are paid solely out of the Fund’s assets.
Note 5. Custody Credits
The Fund has an agreement with its custodian bank under which custody fees may be reduced by balance credits. These credits are recorded as part of expense reductions on the Statement of Operations. The Fund could have invested a portion of the assets utilized in connection with the expense offset arrangement in an income-producing asset if it had not entered into such an agreement. For the year ended August 31, 2010, these custody credits reduced total expenses by $283 for the Fund.
28
Columbia Federal Securities Fund
August 31, 2010
Note 6. Objectives and Strategies for Investing in Derivative Instruments
The Fund uses derivatives instruments including futures contracts and options in order to meet its investment objectives. The Fund employs strategies in differing combinations to permit it to increase, decrease or change the level of exposure to market risk factors. The achievement of any strategy relating to derivatives depends on an analysis of various risk factors, and if the strategies for the use of derivatives do not work as intended, the Fund may not achieve its investment objectives.
In pursuit of its investment objectives, the Fund is exposed to the following market risks:
Interest rate risk: Interest rate risk relates to the fluctuation in value of fixed income securities because of the inverse relationship of price and yield. Fixed income securities generally will decline in value upon an increase in general interest rates and their value generally will increase upon a decline in general interest rates. Fixed income securities with longer durations tend to be more sensitive to changes in interest rates, usually making them more volatile than securities with shorter durations.
The following notes provide more detailed information about each derivative type held by the Fund:
Futures — The Fund entered into interest rate futures contracts to manage the duration and yield curve exposure of the Fund versus the benchmark.
The use of futures contracts involves certain risks, which include: (1) imperfect correlation between the price movement of the instruments and the underlying securities, (2) inability to close out positions due to differing trading hours, or the temporary absence of a liquid market, for either the instruments or the underlying securities, and (3) an inaccurate prediction of the future direction of interest rates by the Fund’s investment advisor.
Upon entering into a futures contract, the Fund identifies within its portfolio of investments cash or securities in an amount sufficient to meet the initial margin requirement. Subsequent payments are made or received by the Fund equal to the daily change in the contract value and are recorded as variation margin receivable or payable and offset in unrealized gains or losses. The Fund recognizes a realized gain or loss when the contract is closed or expires.
Futures contracts involve, to varying degrees, risk of loss in excess of the variation margin disclosed on the Statement of Assets and Liabilities.
During the year ended August 31, 2010, the Fund entered into 382 futures contracts.
Options — The Fund had written put options on futures contracts to increase the Fund’s exposure to its underlying instruments. Written put options become more valuable as the price of the underlying instrument appreciates relative to the strike price.
Writing put options tends to increase the Fund’s exposure to the underlying instrument. When the Fund writes a call or put option, an amount equal to the premium received is recorded as a liability and subsequently marked-to-market to reflect the current value of the option written. Premiums received from writing options which expire are treated as realized gains. Premiums received from writing options which are exercised or closed are added to the proceeds or offset against the amounts paid on the underlying security transaction to determine the realized gain or loss. When the Fund writes a call or put option, an amount equal to the premium received is recorded as a liability and subsequently marked-to-market to reflect the current value of the option written. Premiums received from writing options which expire are treated as realized gains. Premiums received from writing options which are exercised or closed are added to the proceeds or offset against the amounts paid on the underlying security transaction to determine the realized gain or loss. The Fund, as a writer of an option, has no control over whether the underlying security may be sold (call) or purchased (put) and as a result bears the market risk of an unfavorable change in the price of the security underlying the written option. There is the risk that the Fund may not be able to enter into a closing transaction because of an illiquid market. The Fund identifies within its portfolio of investments cash or liquid portfolio securities equal to the amount of the written options contract commitment.
The Fund may also purchase put and call options. Purchasing call options tends to increase the Fund’s exposure to the underlying instrument. Purchasing put options tends to decrease the Fund’s exposure to the underlying instrument. The Fund may pay a premium, which is included in the Fund’s Statement of Assets and Liabilities as an investment and subsequently marked-to-market to reflect the current value of the option. The risk associated with purchasing put and call
29
Columbia Federal Securities Fund
August 31, 2010
options is limited to the premium paid. Premiums paid for purchasing options which expire are treated as realized losses. Premiums paid for purchasing options which are exercised are added to the amounts paid (call) or offset against the proceeds (put) on the underlying security to determine the realized gain or loss. If the Fund enters into a closing transaction, the Fund will realize a gain or loss, depending on whether the proceeds from the closing transaction are greater or less than the cost of the option.
During the year ended August 31, 2010, the Fund entered into 120 written options contracts.
The following table is a summary of the value of the Fund’s derivative instruments as of August 31, 2010:
| | | | | | | | |
| Fair Value of Derivative Instruments | |
| Statement of Assets and Liabilities | |
| Asset | | Fair Value | | Liability | | Fair Value | |
Futures
Variation
Margin | | $138,078* | | Written
options | | $ | 46,875 | |
| * | Includes only the current day’s variation margin. |
The effect of derivative instruments on the Statement of Operations for the year ended August 31, 2010:
| | | | | | | | | | |
| | | | | | | | | |
| | | Amount of Realized Gain or (Loss) and
Change in Unrealized Appreciation or
(Depreciation) on Derivatives
Recognized in Income | |
| | | Risk
Exposure | | Net
Realized Gain
(Loss) | | | Change in Unrealized Appreciation (Depreciation) | |
| Futures Contracts | | Interest
Rate | | $ | 680,272 | | | $ | 198,009 | |
| Written Options | | Interest
Rate | | | — | | | | 4,400 | |
Note 7. Portfolio Information
For the year ended August 31, 2010, the cost of purchases and proceeds from sales of securities, excluding securities sold short and short-term obligations, for the Fund were $1,228,242,691 and $1,130,729,031, respectively, of which $890,334,399 and $1,072,905,232, respectively, were U.S. Government securities.
Note 8. Regulatory Settlements
During the years ended August 31, 2010 and August 31, 2009, the Fund received payments totaling $86,467 and $69,270, respectively, relating to certain regulatory settlements with third parties that the Fund had participated in during the respective periods. The payments have been included in “Increase from regulatory settlements” on the Statement of Changes in Net Assets.
Note 9. Line of Credit
The Fund and other affiliated funds participate in a $280,000,000 committed, unsecured revolving line of credit provided by State Street. The maximum amount that may be borrowed by any fund is limited to the lesser of $200,000,000 and the Fund’s borrowing limit set forth in the Fund’s registration statement. Borrowings are available for short-term liquidity or temporary or emergency purposes.
Effective October 15, 2009, interest is charged to each participating fund based on the fund’s borrowings at a rate per annum equal to the greater of the Federal Funds Rate plus 1.25% or the overnight LIBOR Rate plus 1.25%. In addition, a commitment fee of 0.15% per annum is accrued and apportioned among the participating funds pro rata based on their relative net assets.
Prior to October 15, 2009, interest was charged to each participating fund based on the fund’s borrowings at a rate per annum equal to the greater of the Federal Funds Rate plus 0.50% or the overnight LIBOR Rate plus 0.50%. In addition, an annual operations agency fee of $20,000, an amendment fee of 0.02% and a commitment fee of 0.12% per annum were accrued and apportioned among the participating funds pro rata based on their relative net assets.
For the year ended August 31, 2010, the average daily loan balance outstanding on days where borrowing existed was $3,125,000 at a weighted average interest rate of 1.44%
Note 10. Securities Lending
The Fund may lend its securities to certain approved brokers, dealers and other financial institutions. Each loan is collateralized by cash, in an amount at least equal to the market value of the securities loaned plus accrued income from the investment of collateral. The market value of the loaned securities is determined at the close of business of the
30
Columbia Federal Securities Fund
August 31, 2010
Fund and any additional required collateral is delivered to the Fund on the next business day. The collateral received is invested and the income generated by the investment of the collateral, net of any fees remitted to State Street as the lending agent and borrower rebates, is paid to the Fund. Generally, in the event of borrower default, the Fund has the right to use the collateral to offset any losses incurred. In the event the Fund is delayed or prevented from exercising its right to dispose of the collateral, there may be a potential loss to the Fund. The Fund bears the risk of loss with respect to the investment of collateral.
Note 11. Significant Risks and Contingencies
Asset-Backed Securities Risk
The value of asset-backed securities may be affected by, among other factors, changes in interest rates, the market’s assessment of the quality of underlying assets, the creditworthiness of the servicer for the underlying assets, factors concerning the interests in and structure of the issuer or the originator of the underlying assets, or the creditworthiness or rating of the entities that provide any supporting letters of credit, surety bonds, derivative instruments, or other credit enhancement. The value of asset-backed securities also will be affected by the exhaustion, termination or expiration of any credit enhancement. Most asset-backed securities are subject to prepayment risk, which is the possibility that the underlying debt may be refinanced or prepaid prior to maturity during periods of declining or low interest rates, causing the Fund to have to reinvest the money received in securities that have lower yields. In addition, the impact of prepayments on the value of asset-backed securities may be difficult to predict and may result in greater volatility.
Mortgage-Backed Securities Risk
The value of mortgage-backed securities may be affected by, among other things, changes in interest rates, factors concerning the interests in and structure of the issuer or the originator of the mortgages, the creditworthiness of the entities that provide any supporting letters of credit, surety bonds or other credit enhancements or the quality of underlying assets or the market’s assessment thereof. Mortgage-backed securities are subject to prepayment risk, which is the possibility that the underlying mortgage may be refinanced or prepaid prior to maturity during periods of declining or low interest rates, causing the Fund to have to reinvest the money received in securities that have lower yields. In addition, the impact of prepayments on the value of mortgage-backed securities may be difficult to predict and may result in greater volatility.
Information Regarding Pending and Settled Legal Proceedings
In June 2004, an action captioned John E. Gallus et al. v. American Express Financial Corp. and American Express Financial Advisors Inc. was filed in the United States District Court for the District of Arizona. The plaintiffs allege that they are investors in several American Express Company (now known as legacy RiverSource) mutual funds and they purport to bring the action derivatively on behalf of those funds under the Investment Company Act of 1940. The plaintiffs allege that fees allegedly paid to the defendants by the funds for investment advisory and administrative services are excessive. The plaintiffs seek remedies including restitution and rescission of investment advisory and distribution agreements. The plaintiffs voluntarily agreed to transfer this case to the United States District Court for the District of Minnesota (the District Court). In response to defendants’ motion to dismiss the complaint, the District Court dismissed one of plaintiffs’ four claims and granted plaintiffs limited discovery. Defendants moved for summary judgment in April 2007. Summary judgment was granted in the defendants’ favor on July 9, 2007. The plaintiffs filed a notice of appeal with the Eighth Circuit Court of Appeals (the Eighth Circuit) on August 8, 2007. On April 8, 2009, the Eighth Circuit reversed summary judgment and remanded to the District Court for further proceedings. On August 6, 2009, defendants filed a writ of certiorari with the U.S. Supreme Court (the Supreme Court), asking the Supreme Court to stay the District Court proceedings while the Supreme Court considers and rules in a case captioned Jones v. Harris Associates, which involves issues of law similar to those presented in the Gallus case. On March 30, 2010, the Supreme Court issued its ruling in Jones v. Harris Associates, and on April 5, 2010, the Supreme Court vacated the Eighth Circuit’s decision in the Gallus case and remanded the case to the Eighth Circuit for further consideration in light of the Supreme Court’s decision in Jones v. Harris Associates. On June 4, 2010, the Eighth Circuit remanded the Gallus case to the District Court for further consideration in light of the Supreme Court’s decision in Jones v. Harris Associates.
31
Columbia Federal Securities Fund
August 31, 2010
In December 2005, without admitting or denying the allegations, American Express Financial Corporation (AEFC, which is now known as Ameriprise Financial, Inc. (Ameriprise Financial)), entered into settlement agreements with the Securities and Exchange Commission (SEC) and Minnesota Department of Commerce (MDOC) related to market timing activities. As a result, AEFC was censured and ordered to cease and desist from committing or causing any violations of certain provisions of the Investment Advisers Act of 1940, the Investment Company Act of 1940, and various Minnesota laws. AEFC agreed to pay disgorgement of $10 million and civil money penalties of $7 million. AEFC also agreed to retain an independent distribution consultant to assist in developing a plan for distribution of all disgorgement and civil penalties ordered by the SEC in accordance with various undertakings detailed at http://www.sec.gov/litigation/admin/ia-2451.pdf. Ameriprise Financial and its affiliates have cooperated with the SEC and the MDOC in these legal proceedings, and have made regular reports to the funds’ Boards of Directors/Trustees.
Ameriprise Financial and certain of its affiliates have historically been involved in a number of legal, arbitration and regulatory proceedings, including routine litigation, class actions, and governmental actions, concerning matters arising in connection with the conduct of their business activities. Ameriprise Financial believes that the Funds are not currently the subject of, and that neither Ameriprise Financial nor any of its affiliates are the subject of, any pending legal, arbitration or regulatory proceedings that are likely to have a material adverse effect on the Funds or the ability of Ameriprise Financial or its affiliates to perform under their contracts with the Funds. Ameriprise Financial is required to make 10-Q, 10-K and, as necessary, 8-K filings with the Securities and Exchange Commission on legal and regulatory matters that relate to Ameriprise Financial and its affiliates. Copies of these filings may be obtained by accessing the SEC website at www.sec.gov.
There can be no assurance that these matters, or the adverse publicity associated with them, will not result in increased fund redemptions, reduced sale of fund shares or other adverse consequences to the Funds. Further, although we believe proceedings are not likely to have a material adverse effect on the Funds or the ability of Ameriprise Financial or its affiliates to perform under their contracts with the Funds, these proceedings are subject to uncertainties and, as such, we are unable to estimate the possible loss or range of loss that may result. An adverse outcome in one or more of these proceedings could result in adverse judgments, settlements, fines, penalties or other relief that could have a material adverse effect on the consolidated financial condition or results of operations of Ameriprise Financial.
Note 12. Subsequent Event
The Board of Trustees has approved in principle the proposed merger of the Fund into Columbia U.S. Government Mortgage Fund (formerly known as RiverSource U.S. Government Mortgage Fund). Shareholders will vote on the proposal at a Special Meeting of Shareholders scheduled to be held during the first half of 2011.
32
Report of Independent Registered Public Accounting Firm
To the Trustees of Columbia Funds Series Trust I and the Shareholders of Columbia Federal Securities Fund
In our opinion, the accompanying statement of assets and liabilities, including the investment portfolio, and the related statements of operations and of changes in net assets and the financial highlights present fairly, in all material respects, the financial position of Columbia Federal Securities Fund (the “Fund”) (a series of Columbia Funds Series Trust I) at August 31, 2010, the results of its operations for the year then ended, the changes in its net assets for each of the two years in the period then ended, and the financial highlights for each of the five years in the period then ended, in conformity with accounting principles generally accepted in the United States of America. These financial statements and financial highlights (hereafter referred to as “financial statements”) are the responsibility of the Fund’s management. Our responsibility is to express an opinion on these financial statements based on our audits. We conducted our audits of these financial statements in accordance with the standards of the Public Company Accounting Oversight Board (United States). Those standards require that we plan and perform the audit to obtain reasonable assurance about whether the financial statements are free of material misstatement. An audit includes examining, on a test basis, evidence supporting the amounts and disclosures in the financial statements, assessing the accounting principles used and significant estimates made by management, and evaluating the overall financial statement presentation. We believe that our audits, which included confirmation of securities at August 31, 2010 by correspondence with the custodian and brokers, provide a reasonable basis for our opinion.
PricewaterhouseCoopers LLP
Boston, Massachusetts
October 25, 2010
33
Fund Governance
The Trustees serve terms of indefinite duration. The names, addresses and birth years of the Trustees and Officers of the Funds in the Columbia Funds Series Trust I, the year each was first elected or appointed to office, their principal business occupations during at least the last five years, the number of Funds overseen by each Trustee and other directorships they hold are shown below. Each officer listed below serves as an officer of each Fund in the Columbia Funds Complex.
Independent Trustees
| | |
Name, Address and Year of Birth,
Position with Funds, Year First
Elected or Appointed to Office | | Principal Occupation(s) During Past Five Years, Number of Funds in Columbia Funds
Complex Overseen by Trustee, Other Directorships Held |
| |
| John D. Collins (Born 1938) | | |
c/o Columbia Management Investment Advisers, LLC One Financial Center Boston, MA 02111 Trustee (since 2005) | | Retired. Consultant, KPMG, LLP (accounting and tax firm) from July 1999 to June 2000; Partner, KPMG, LLP from March 1962 to June 1999. Oversees 64; Mrs. Fields Original Cookies, Inc. (consumer products); Suburban Propane Partners, L.P.; and Montpelier Re (insurance underwriting firm) |
| |
| Rodman L. Drake (Born 1943) | | |
c/o Columbia Management Investment Advisers, LLC One Financial Center Boston, MA 02111 Trustee (since 1994) and Chairman of the Board (since 2009) | | Co-Founder of Baringo Capital LLC (private equity) since 2002; CEO of Crystal River Capital, Inc. (real estate investment trust) since 2003; President, Continuation Investments Group, Inc. from 1997 to 2001. Oversees 64; Jackson Hewitt Tax Service Inc. (tax preparation services); Crystal Capital River Inc. (real estate investment trust); Student Loan Corporation (student loan provider); Celgene Corporation (global biotechnology company); The Helios Funds (exchange-traded funds); and Apex Silver Mines Ltd. from 2007 to 2009 |
| |
| Douglas A. Hacker (Born 1955) | | |
c/o Columbia Management Investment Advisers, LLC One Financial Center Boston, MA 02111 Trustee (since 1996) | | Independent business executive since May 2006; Executive Vice President–Strategy of United Airlines (airline) from December 2002 to May 2006; President of UAL Loyalty Services (airline marketing company) from September 2001 to December 2002; Executive Vice President and Chief Financial Officer of United Airlines from July 1999 to September 2001. Oversees 64; Nash Finch Company (food distributor); Aircastle Limited (aircraft leasing) |
|
| Janet Langford Kelly (Born 1957) |
c/o Columbia Management Investment Advisers, LLC One Financial Center Boston, MA 02111 Trustee (since 1996) | | Senior Vice President, General Counsel and Corporate Secretary, ConocoPhillips (integrated energy company) since September 2007; Deputy General Counsel–Corporate Legal Services, ConocoPhillips from August 2006 to August 2007; Partner, Zelle, Hofmann, Voelbel, Mason & Gette LLP (law firm) from March 2005 to July 2006; Adjunct Professor of Law, Northwestern University, from September 2004 to June 2006; Director, UAL Corporation (airline) from February 2006 to July 2006; Oversees 64; None |
| |
| Charles R. Nelson (Born 1942) | | |
c/o Columbia Management Investment Advisers, LLC One Financial Center Boston, MA 02111 Trustee (since 1981) | | Professor of Economics, University of Washington, since January 1976; Ford and Louisa Van Voorhis Professor of Political Economy, University of Washington, since September 1993; Adjunct Professor of Statistics, University of Washington, since September 1980; Associate Editor, Journal of Money Credit and Banking, 1993-2008 Consultant on econometric and statistical matters. Oversees 64; None |
34
Fund Governance (continued)
Independent Trustees (continued)
| | |
Name, Address and Year of Birth,
Position with Funds, Year First
Elected or Appointed to Office | | Principal Occupation(s) During Past Five Years, Number of Funds in Columbia Funds
Complex Overseen by Trustee, Other Directorships Held |
| |
| John J. Neuhauser (Born 1943) | | |
c/o Columbia Management Investment Advisers, LLC One Financial Center Boston, MA 02111 Trustee (since 1984) | | President, Saint Michael’s College, since August 2007; Director or Trustee of several non-profit organizations, including Fletcher Allen Health Care Inc. University Professor, Boston College from November 2005 to August 2007; Academic Vice President and Dean of Faculties, Boston College from August 1999 to October 2005. Oversees 64; Liberty All-Star Equity Fund and Liberty All-Star Growth Fund, Inc. (closed-end funds) |
| |
| Jonathan Piel (Born 1938) | | |
c/o Columbia Management Investment Advisers, LLC One Financial Center Boston, MA 02111 Trustee (since 1994) | | Cable television producer and website designer; The Editor, Scientific American from 1984 to 1994; Vice President, Scientific American, Inc., from 1984 to 1994; Member, Advisory Board, Stone Age Institute, Bloomington, Indiana (research institute that explores the effect of technology on human evolution); Member, Board of Directors of the National Institute of Social Sciences, New York City; Member, Board of Trustees of the William Alanson White Institute, New York City (institution for training psychoanalysts); and Member, Advisory Board, Mount Sinai Children’s Environmental Health Center, New York. Oversees 64; None |
| |
| Patrick J. Simpson (Born 1944) | | |
c/o Columbia Management Investment Advisers, LLC One Financial Center Boston, MA 02111 Trustee (since 2000) | | Partner, Perkins Coie LLP (law firm). Oversees 64; None |
| |
| Anne-Lee Verville (Born 1945) | | |
c/o Columbia Management Investment Advisers, LLC One Financial Center Boston, MA 02111 Trustee (since 1998) | | Retired since 1997 (formerly General Manager–Global Education Industry (from 1994 to 1997), President–Application Systems Division (from 1991 to 1994), Chief Financial Officer–US Marketing & Services (from 1988 to 1991), and Chief Information Officer (from 1987 to 1988), IBM Corporation (computer and technology)). Oversees 64; Enesco Group, Inc. (producer of giftware and home and garden decor products) from 2001 to 2006 |
35
Fund Governance (continued)
Interested Trustee
| | |
Name, Address and Year of Birth,
Position with Funds, Year First
Elected or Appointed to Office | | Principal Occupation(s) During Past Five Years, Number of Funds in Columbia Funds
Complex Overseen by Trustee, Other Directorships Held |
| |
| William E. Mayer1 (Born 1940) | | |
c/o Columbia Management Investment Advisers, LLC One Financial Center Boston, MA 02111 Trustee (since 1994) | | Partner, Park Avenue Equity Partners (private equity) since February 1999; Dean and Professor, College of Business and Management, University of Maryland from 1992 to 1996. Oversees 64; DynaVox Inc. (software developer); Lee Enterprises (print media), WR Hambrecht + Co. (financial service provider); BlackRock Kelso Capital Corporation (investment company) |
| 1 | Mr. Mayer may technically be an “interested person” (as defined in the Investment Company Act of 1940) by reason of his affiliation with WR Hambrecht + Co., a registered broker/dealer that may execute portfolio transactions for, engage in principal transactions with or distribute shares of a Fund or other funds or accounts advised/managed by the Advisor or any sub-advisor to a Fund. |
The Statement of Additional Information includes additional information about the Trustees of the Funds and is available, without charge, upon request by calling 1-800-345-6611.
36
Fund Governance (continued)
Officers
| | |
| Name, Year of Birth and Address | | Principal Occupation(s) During the Past Five Years |
| |
| J. Kevin Connaughton (Born 1964) | | |
One Financial Center Boston, MA 02111 President (since 2009) | | Senior Vice President and General Manager–Mutual Fund Products, Columbia Management Investment Advisers, LLC since May 2010; President, Columbia Funds, since 2009, and RiverSource Funds, since May 2010 (previously Senior Vice President and Chief Financial Officer, Columbia Funds, from June 2008 to January 2009, Treasurer, Columbia Funds, from October 2003 to May 2008, and senior officer of various other affiliated funds since 2000); Managing Director, Columbia Management Advisors, LLC from December 2004 to April 2010. |
| |
| Michael G. Clarke (Born 1969) | | |
One Financial Center Boston, MA 02111 Senior Vice President and Chief Financial Officer (since 2009) | | Vice President, Columbia Management Investment Advisers, LLC since May 2010; Managing Director of Fund Administration, Columbia Management Advisors, LLC, from September 2004 to April 2010; senior officer of Columbia Funds and affiliated funds since 2002. |
| |
| Scott R. Plummer (Born 1959) | | |
5228 Ameriprise Financial Center Minneapolis, MN 55474 Senior Vice President, Secretary and Chief Legal Officer (since 2010) | | Chief Legal Officer and Assistant Secretary, Columbia Management Investment Advisers, LLC since June 2005; Vice President and Lead Chief Counsel–Asset Management, Ameriprise Financial, Inc. since May 2010 (previously Vice President and Chief Counsel–Asset Management, from 2005 to April 2010, and Vice President–Asset Management Compliance from 2004 to 2005); Vice President, Chief Counsel and Assistant Secretary, Columbia Management Investment Distributors, Inc. since 2008; Vice President, General Counsel and Secretary, Ameriprise Certificate Company since 2005; Chief Counsel, RiverSource Distributors, Inc. since 2006; Vice President, General Counsel and Secretary, RiverSource Funds, since December 2006; Senior Vice President, Secretary and Chief Legal Officer, Columbia Funds, since May 2010. |
| |
| Linda J. Wondrack (Born 1964) | | |
One Financial Center Boston, MA 02111 Senior Vice President and Chief Compliance Officer (since 2007) | | Vice President and Chief Compliance Officer, Columbia Management Investment Advisers, LLC since May 2010; Chief Compliance Officer, Columbia Funds, since 2007, and RiverSource Funds, since May 2010; Director (Columbia Management Group, LLC and Investment Product Group Compliance), Bank of America, from June 2005 to April 2010; Director of Corporate Compliance and Conflicts Officer of MFS Investment Management (investment management) from August 2004 to May 2005. |
| |
| William F. Truscott (Born 1960) | | |
53600 Ameriprise Financial Center Minneapolis, MN 55474 Senior Vice President (since 2010) | | Chairman of the Board, Columbia Management Investment Advisers, LLC since May 2010 (previously President, Chairman of the Board and Chief Investment Officer, from 2001 to April 2010); Chief Executive Officer, U.S. Asset Management & President, Annuities, Ameriprise Financial, Inc. since May 2010 (previously President–U.S. Asset Management and Chief Investment Officer from 2005 to April 2010, and Senior Vice President — Chief Investment Officer, from 2001 to 2005); Director, President and Chief Executive Officer, Ameriprise Certificate Company since 2006; Director, Columbia Management Investment Distributors, Inc. since May 2010 (previously Chairman of the Board and Chief Executive Officer from 2008 to April 2010); Chairman of the Board and Chief Executive Officer, RiverSource Distributors, Inc. since 2006. |
37
Fund Governance (continued)
Officers (continued)
| | |
| Name, Year of Birth and Address | | Principal Occupation(s) During the Past Five Years |
|
| Colin Moore (Born 1958) |
One Financial Center Boston, MA 02111 Senior Vice President (since 2010) | | Director and Chief Investment Officer, Columbia Management Investment Advisers, LLC since May 2010; Manager, Managing Director and Chief Investment Officer of Columbia Management Advisors, LLC from 2007 to April 2010; Head of Equities, Columbia Management Advisors, LLC from 2002 to 2007. |
| |
| Michael A. Jones (Born 1959) | | |
100 Federal Street Boston, MA 02110 Senior Vice President (since 2010) | | Director and President, Columbia Management Investment Advisers, LLC since May 2010; President and Director, Columbia Management Investment Distributors, Inc. since May 2010; Manager, Chairman, Chief Executive Officer and President, Columbia Management Advisors, LLC from 2007 to April 2010; Chief Executive Officer, President and Director, Columbia Management Distributors, Inc. from November 2006 to April 2010; previously, co-president and senior managing director at Robeco Investment Management. |
| |
| Amy Johnson (Born 1965) | | |
5228 Ameriprise Financial Center Minneapolis, MN 55474 Senior Vice President (since 2010) | | Senior Vice President and Chief Operating Officer, Columbia Management Investment Advisers, LLC since May 2010 (previously Chief Administrative Officer, from 2009 until April 2010, Vice President–Asset Management and Trust Company Services, from 2006 to 2009, and Vice President–Operations and Compliance from 2004 to 2006). |
| |
| Joseph F. DiMaria (Born 1968) | | |
One Financial Center Boston, MA 02111 Treasurer (since 2009) and Chief Accounting Officer (since 2008) | | Vice President, Mutual Fund Administration, Columbia Management Investment Advisers, LLC, since May 2010; Director of Fund Administration, Columbia Management Advisors, LLC from January 2006 to April 2010; Head of Tax/Compliance and Assistant Treasurer, Columbia Management Advisors, LLC, from November 2004 to December 2005. |
| |
| Marybeth Pilat (Born 1968) | | |
One Financial Center Boston, MA 02111 Deputy Treasurer (since 2010) | | Vice President, Mutual Fund Administration, Columbia Management Investment Advisers, LLC, since May 2010; Vice President, Investment Operations, Bank of America, from October 2008 to April 2010; Finance Manager, Boston Children’s Hospital from August 2008 to October 2008; Director, Mutual Fund Administration, Columbia Management Advisors, LLC, from May 2007 to July 2008; Vice President, Mutual Fund Valuation, Columbia Management Advisors, LLC, from January 2006 to May 2007; Vice President, Mutual Fund Accounting Oversight, Columbia Management Advisors, LLC from January 2005 to January 2006. |
| |
| Julian Quero (Born 1967) | | |
One Financial Center Boston, MA 02111 Deputy Treasurer (since 2008) | | Vice President, Mutual Fund Administration, Columbia Management Investment Advisers, LLC since May 2010; Director of Fund Administration, Columbia Management Advisors, LLC, from August 2008 to April 2010; Senior Tax Manager, Columbia Management Advisors, LLC from August 2006 to July 2008; Senior Compliance Manager, Columbia Management Advisors, LLC from April 2002 to August 2006. |
| |
| Stephen T. Welsh (Born 1957) | | |
One Financial Center Boston, MA 02111 Vice President (since 2006) | | President and Director, Columbia Management Investment Services Corp. since May 2010; President and Director, Columbia Management Services, Inc. from July 2004 to April 2010; Managing Director, Columbia Management Distributors, Inc. from August 2007 to April 2010. |
38
Summary of Management Fee Evaluation by Independent Fee Consultant (RiverSource Investments, LLC)
EXCERPTS FROM REPORT OF INDEPENDENT FEE CONSULTANT TO THE FUNDS SUPERVISED BY THE COLUMBIA ATLANTIC BOARD
Prepared Pursuant to the February 9, 2005 Assurance of Discontinuance among the Office of Attorney General of New York State, Columbia Management Advisors, LLC, and Columbia Management Distributors, Inc. December 21, 2009
I. Overview
On February 9, 2005, Columbia Management Advisors, LLC (“CMA”) and Columbia Management Distributors, Inc.1 (“CMD”) agreed to the New York Attorney General’s Assurance of Discontinuance (“AOD”). Among other things, the AOD stipulates that CMA may manage or advise a Columbia Fund (“Columbia Fund” and, together with some or all of such funds, the “Columbia Funds”) only if the Independent Members of the Columbia Fund’s Board of Trustees appoint a Senior Officer or retain an Independent Fee Consultant (“IFC”) who is to manage the process by which proposed management fees are negotiated. The AOD further stipulates that the Senior Officer or IFC is to prepare a written annual evaluation of the fee negotiation process.
With effect from January 1, 2007, the Independent Members of the Board of Trustees for certain Columbia Funds known collectively as the “Atlantic Funds” (together with the other members of that Board, the “Trustees”) retained me as IFC for the Atlantic Funds.2 In this capacity, I have prepared this written evaluation of the fee negotiation process. As was the case with the last three annual reports, my immediate predecessor as IFC, John Rea, provided invaluable assistance in the preparation of this report.
On September 29, 2009, Ameriprise entered into an asset purchase agreement with Bank of America, N.A. and its parent, Bank of America Corporation (together, the “Bank”) pursuant to which the Bank agreed to sell certain CMG assets relating to Columbia’s long-term asset management business, including management of the Atlantic Funds (the “Transaction”).3 The Transaction if completed would result in the termination of the existing Investment Management Agreements with CMA. Therefore, the Trustees have been requested to approve and recommend to the shareholders of each Atlantic Fund new Investment Management and Sub-Advisory Agreements (together, the “Management Agreements”) with RiverSource Investments, LLC (“RI”),4 investment manager of the RiverSource Funds and a subsidiary of Ameriprise. This report is intended to fulfill the requirements of the AOD with respect to the Trustees’ consideration of the new Management Agreements.
A. Role of the Independent Fee Consultant
The AOD charges the IFC with “managing the process by which proposed management fees … to be charged the Columbia Fund are negotiated so that they are negotiated in a manner which is at arms’ length and reasonable and consistent with this Assurance of Discontinuance.” The AOD also provides that CMA “may manage or advise a Columbia Fund only if the reasonableness of the proposed management fees is determined by the Board of Trustees … using … an annual independent written evaluation prepared by or under the direction of … the Independent Fee Consultant.” Therefore, the AOD makes clear that the IFC does not supplant the Trustees in negotiating management fees with CMA (or RI), nor does the IFC substitute his or her judgment for that of the Trustees with respect to the reasonableness of proposed fees or any other matter that is committed to the business judgment of the Trustees.
| 1 | CMA and CMD are subsidiaries of Columbia Management Group, LLC (“CMG”), and are the successors to the entities named in the AOD. |
| 2 | I have no material relationship with Bank of America, CMG or Ameriprise Financial, Inc. (“Ameriprise”), aside from serving as IFC, and I am aware of no material relationship with any of their affiliates. I retained John Rea, an independent economic consultant, to assist me with this report. |
| | Unless otherwise stated or required by the context, this report covers only the Atlantic Funds. |
| 3 | Preliminary Response of Ameriprise to Information Request of Columbia Atlantic Board dated October 21, 2009 (hereafter, the “Preliminary Response”), p. 1. The one money market Atlantic Fund, Money Market Fund VS, was included in the Transaction because it was an integral part of CMG's array of Funds used as investment vehicles by variable annuity and similar insurance products. |
| 4 | Ameriprise intends to re-brand RI with the “Columbia” name (which is one of the assets being sold in the Transaction). Preliminary Response, pp. 4-5. In the case of new Sub-Advisory Agreements, the current sub-adviser would also be a party. |
39
B. Elements Involved in Managing the Fee Negotiation Process
In preparing the report required by the AOD, the IFC must consider at least the following six factors set forth in the AOD:
| 1. | The nature and quality of the adviser’s services, including the Fund’s performance; |
| 2. | Management fees (including any components thereof) charged by other mutual fund companies for like services; |
| 3. | Possible economies of scale as the Fund grows larger; |
| 4. | Management fees (including any components thereof) charged to institutional and other clients of the adviser for like services; |
| 5. | Costs to the adviser and its affiliates of supplying services pursuant to the management fee agreements, excluding any intra-corporate profit; and |
| 6. | Profit margins of the adviser and its affiliates from supplying such services. |
C. Data Presented to the Trustees
In considering the proposed new Management Agreements with RI, the Trustees relied in part on the data that had been prepared as part of their annual contract review process, which concluded in late October. This data remained relevant because the fees in the proposed Management Agreements were identical to the fees approved at that time. The annual review materials included a Lipper report on the performance of each Atlantic Fund compared to its peers and its benchmark, comparisons of the fees and expenses of each Atlantic Fund to similar CMG-sponsored Funds, comparable competitive funds chosen by Lipper, and institutional accounts advised by CMA, revenues, expenses, and profits of CMG from managing the Atlantic Funds, calculated both by Fund and collectively, and CMG’s views on the existence and sharing of economies of scale.
In addition, the Trustees reviewed materials specific to the proposed new Management Agreements with RI in response to requests for information made on behalf of the Trustees, including the following:
| n | | Performance data for the RiverSource Funds showing percentile and quartile rankings of each fund within its Lipper performance universe for periods up to five years and net returns of each fund relative to its benchmark returns. This data was arguably relevant due to the possibility that some RiverSource investment teams would be providing investment management services to certain Columbia Funds.5 |
| n | | tables comparing the fee schedules and effective fee rates of funds managed by CMA and RI and institutional accounts advised by the two firms. |
| n | | extensive discussion of the process by which the various components of the two asset management businesses would be integrated including investment management, compliance, transfer agency, custody, fund accounting, and distribution. |
| n | | information about the financial condition of Ameriprise, including its most recent annual report on Form 10-K, RI’s profit margins from managing the RiverSource Funds in 2007 and 2008, and pro forma income statements for the combined Columbia and RiverSource fund complex. |
| n | | disclosure that certain senior CMG executives, including President Michael Jones, Chief Investment Officer Colin Moore, Head of Mutual Funds J. Kevin Connaughton, and Chief Compliance Officer Linda Wondrack would continue in analogous capacities following the consummation of the Transaction, and |
| n | | a breakdown of the synergies RI expects to realize in the two years following the Transaction and the extent to which those potential synergies are expected to be shared with shareholders of funds advised by RI. |
| 5 | On page 20 of its Supplemental Response to the Atlantic Trustees (undated but delivered November 24, 2009), Ameriprise said that “most personnel decisions, including with respect to the portfolio management teams for the Atlantic Funds . . . will be made primarily by [current CMA CIO] Colin Moore using the Columbia 5P process.” |
40
II. Findings
| 1. | Based upon my examination of the information supplied by CMG and Ameriprise in the light of the six factors set forth in the AOD, I conclude that the Trustees have the relevant information necessary to evaluate the reasonableness of the proposed management fees for each Atlantic Fund. |
| 2. | In my view, the process by which the proposed management fees of the Atlantic Funds have been negotiated with RI thus far has been, to the extent practicable, at arms’ length and reasonable and consistent with the AOD. |
Respectfully submitted,
Steven E. Asher
41
Shareholder Meeting Results
Columbia Federal Securities Fund
On March 3, 2010, a special meeting of shareholders of Columbia Funds Series Trust I was held to consider the approval of several proposals listed in the proxy statement for the meeting. Proposal 1 and Proposal 2 were voted on at the March 3, 2010 meeting of shareholders and Proposal 3 was voted on at an adjourned meeting of shareholders held on March 31, 2010. The shareholder meeting results are as follows:
Proposal 1: A proposed Investment Management Services Agreement with Columbia Management Investment Advisers, LLC (formerly, RiverSource Investments, LLC) (CMIA) was approved as follows:
| | | | | | |
| | | | | | | |
| Votes For | | Votes Against | | Abstentions | | Broker Non-Votes |
| 328,879,250 | | 11,413,698 | | 13,206,489 | | 99,709,185 |
Proposal 2: A proposal authorizing CMIA to enter into and materially amend subadvisory agreements for the Fund in the future, with the approval of the Trust’s Board of Trustees, but without obtaining additional shareholder approval, was approved as follows:
| | | | | | |
| | | | | | | |
| Votes For | | Votes Against | | Abstentions | | Broker Non-Votes |
| 320,244,257 | | 20,222,697 | | 13,032,397 | | 99,709,271 |
Proposal 3: Each of the nominees for trustees was elected to the Trust’s Board of Trustees, as follows:
| | | | | | |
| | | | | | | |
| Trustee | | Votes For | | Votes Withheld | | Abstentions |
| John D. Collins | | 30,977,072,412 | | 859,827,038 | | 0 |
| Rodman L. Drake | | 30,951,179,004 | | 885,720,446 | | 0 |
| Douglas A. Hacker | | 30,989,793,279 | | 847,106,171 | | 0 |
| Janet Langford Kelly | | 30,999,020,814 | | 837,878,636 | | 0 |
| William E. Mayer | | 16,291,139,483 | | 15,545,759,967 | | 0 |
| Charles R. Nelson | | 30,997,700,700 | | 839,198,750 | | 0 |
| John J. Neuhauser | | 30,988,095,661 | | 848,803,789 | | 0 |
| Jonathon Piel | | 30,968,801,048 | | 868,098,402 | | 0 |
| Patrick J. Simpson | | 30,999,065,030 | | 837,834,420 | | 0 |
| Anne-Lee Verville | | 30,996,227,913 | | 840,671,537 | | 0 |
42
[THIS PAGE INTENTIONALLY LEFT BLANK]
43
[THIS PAGE INTENTIONALLY LEFT BLANK]
44
Important Information About This Report
The fund mails one shareholder report to each shareholder address. If you would like more than one report, please call shareholder services at 1-800-345-6611 and additional reports will be sent to you. This report has been prepared for shareholders of Columbia Federal Securities Fund.
A description of the policies and procedures that the fund uses to determine how to vote proxies and a copy of the fund’s voting records are available (i) at www.columbiamanagement.com, (ii) on the Securities and Exchange Commission’s website at www.sec.gov, and (iii) without charge, upon request, by calling 1-800-368-0346. Information regarding how the fund voted proxies relating to portfolio securities during the 12-month period ended June 30 is available from the SEC’s website. Information regarding how the fund voted proxies relating to portfolio securities is also available from the fund’s website, www.columbiamanagement.com.
The fund files a complete schedule of portfolio holdings with the SEC for the first and third quarters of each fiscal year on Form N-Q. The fund’s Form N-Q is available on the SEC’s website at www.sec.gov and may be reviewed and copied at the SEC’s Public Reference Room in Washington, D.C. Information on the operation of the Public Reference Room may be obtained by calling
1-800-SEC-0330.
Transfer Agent
Columbia Management Investment Services Corp.
P.O. Box 8081
Boston, MA 02266-8081
1-800-345-6611
Distributor
Columbia Management Investment
Distributors, Inc.
One Financial Center
Boston, MA 02111
Investment Advisor
Columbia Management Investment Advisers, LLC
100 Federal Street
Boston, MA 02110
45

Columbia Federal Securities Fund
P.O. Box 8081
Boston, MA 02266-8081
columbiamanagement.com
This information is for use with concurrent or prior delivery of a fund prospectus. Investors should consider the investment objectives, risks, charges and expenses of a mutual fund carefully before investing. For a free prospectus, which contains this and other important information about the funds, visit columbiamanagement.com. Read the prospectus carefully before investing. The Fund is distributed by Columbia Management Investment Distributors, Inc., member FINRA, and managed by Columbia Management Investment Advisers, LLC.
©2010 Columbia Management Investment Advisers, LLC. All rights reserved.
C-1376 A (10/10)

Columbia Greater China Fund
Annual Report for the Period Ended August 31, 2010
Table of Contents
The views expressed in this report reflect the current views of the respective parties. These views are not guarantees of future performance and involve certain risks, uncertainties and assumptions that are difficult to predict, so actual outcomes and results may differ significantly from the views expressed. These views are subject to change at any time based upon economic, market or other conditions and the respective parties disclaim any responsibility to update such views. These views may not be relied on as investment advice and, because investment decisions for a Columbia Fund are based on numerous factors, may not be relied on as an indication of trading intent on behalf of any particular Columbia Fund. References to specific company securities should not be construed as a recommendation or investment advice.
President’s Message

Dear Shareholder:
The Columbia Management story began over 100 years ago, and today, we are one of the nation’s largest dedicated asset managers. The recent acquisition by Ameriprise Financial, Inc. brings together the talents, resources and capabilities of Columbia Management with those of RiverSource Investments, Threadneedle (acquired by Ameriprise in 2003) and Seligman Investments (acquired by Ameriprise in 2008) to build a best-in-class asset management business that we believe is truly greater than its parts.
RiverSource Investments traces its roots to 1894 when its then newly-founded predecessor, Investors Syndicate, offered a face-amount savings certificate that gave small investors the opportunity to build a safe and secure fund for retirement, education or other special needs. A mutual fund pioneer, Investors Syndicate launched Investors Mutual Fund in 1940. In the decades that followed, its mutual fund products and services lineup grew to include a full spectrum of styles and specialties. More than 110 years later, RiverSource continues to be a trusted financial products leader.
Threadneedle, a leader in global asset management and one of Europe’s largest asset managers, offers sophisticated international experience from a dedicated U.K. management team. Headquartered in London, it is named for Threadneedle Street in the heart of the city’s financial district, where British investors pioneered international and global investing. Threadneedle was acquired in 2003 and today operates as an affiliate of Columbia Management.
Seligman Investments’ beginnings date back to the establishment of the investment firm J. & W. Seligman & Co. in 1864. In the years that followed, Seligman played a major role in the geographical expansion and industrial development of the United States. In 1874, President Ulysses S. Grant named Seligman as fiscal agent for the U.S. Navy — an appointment that would last through World War I. Seligman helped finance the westward path of the railroads and the building of the Panama Canal. The firm organized its first investment company in 1929 and began managing its first mutual fund in 1930. In 2008, J. & W. Seligman & Co. Incorporated was acquired and Seligman Investments became an offering brand of RiverSource Investments, LLC.
We are proud of the rich and distinctive history of these firms, the strength and breadth of products and services they offer, and the combined cultures of pioneering spirit and forward thinking. Together we are committed to providing more for our shareholders than ever before.
| n | | A singular focus on our shareholders. Our business is asset management, so investors are our first priority. We dedicate our resources to identifying timely investment opportunities and provide a comprehensive choice of equity, fixed-income and alternative investments to help meet your individual needs. |
| n | | First-class research and thought leadership. We are dedicated to helping you take advantage of today’s opportunities and anticipate tomorrow’s. We stay abreast of the latest investment trends and ideas, using our collective insight to evaluate events and transform them into solutions you can use. |
| n | | A disciplined investment approach. We aren’t distracted by passing fads. Our teams adhere to a rigorous investment process that helps ensure the integrity of our products and enables you and your financial advisor to match our solutions to your objectives with confidence. |
When you choose Columbia Management, you can be confident that we will take the time to understand your needs and help you and your financial advisor identify the solutions that are right for you. Because at Columbia Management, we don’t consider ourselves successful unless you are.
Sincerely,

J. Kevin Connaughton
President, Columbia Funds
Investors should consider the investment objectives, risks, charges and expenses of a mutual fund carefully before investing. For a free prospectus, which contains this and other important information about the funds, visit www.columbiamanagement.com. The prospectus should be read carefully before investing.
Columbia Funds are distributed by Columbia Management Investment Distributors, Inc., member FINRA, and managed by Columbia Management Investment Advisers, LLC.
© 2010 Columbia Management Investment Advisers, LLC. All rights reserved.
Fund Profile – Columbia Greater China Fund
Summary
| n | | For the 12-month period that ended August 31, 2010, the fund’s Class A shares returned 16.42% without sales charge. |
| n | | The fund outperformed its benchmarks, the MSCI China Index (Net)1 and the Hang Seng Stock Index.2 It also outperformed the average fund in its peer group, the Lipper China Region Funds Classification.3 |
| n | | Stock selection, particularly in the consumer discretionary and information technology sectors, was the main driver of performance. |
Portfolio Management
Jasmine (Weili) Huang has managed the fund since May 2005 and has been associated with the advisor since May 2010. Prior to joining the advisor, Ms. Huang was associated with the fund’s previous advisor or its predecessors since 2003.
Effective May 1, 2010, RiverSource Investments, LLC, a subsidiary of Ameriprise Financial, Inc., became the investment advisor to the fund and changed its name to Columbia Management Investment Advisers, LLC. Please see the fund’s prospectuses, as supplemented, for more information regarding the change in investment advisor and certain other changes.
| 1 | The Morgan Stanley Capital International (MSCI) China Index (Net) is designed to broadly and fairly represent the full diversity of business activities in China. This index aims to capture 85% of the free float adjusted market capitalization in each industry group. |
| 2 | The Hang Seng Stock Index tracks the performance of approximately 70% of the total market capitalization of the Stock Exchange of Hong Kong. |
| 3 | Lipper Inc., a widely respected data provider in the industry, calculates an average total return (assuming reinvestment of distributions) for mutual funds with investment objectives similar to those of the fund. Lipper makes no adjustment for the effect of sales loads. |
Indices are not available for investment, are not professionally managed and do not reflect sales charges, fees, brokerage commissions, taxes or other expenses of investing. Securities in the fund may not match those in an index.
Performance data quoted represents past performance and current performance may be lower or higher. Past performance is no guarantee of future results. The investment return and principal value will fluctuate so that shares, when redeemed, may be worth more or less than the original cost. Please visit www.columbiamanagement.com for daily and most recent month-end performance updates.
Summary
1-year return as of 08/31/10
| | |
 | | +16.42% Class A shares |
| | (without sales charge) |
| |
| | +9.23% MSCI China Index (Net) |
| |
 | | –1.02% Hang Seng Stock Index |
|
Morningstar Style Box™ |
|
Equity Style |
|
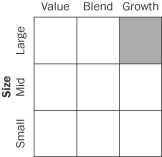
|
The Morningstar Style Box™ is based on the Fund’s portfolio holdings as of period end. For equity funds, the vertical axis shows the market capitalization of the stocks owned, and the horizontal axis shows investment style (value, blend, or growth). Information shown is based on the most recent data provided by Morningstar.
© 2010 Morningstar, Inc. All rights reserved. The information contained herein is proprietary to Morningstar and/or its content providers, may not be copied or distributed and is not warranted to be accurate, complete, or timely. Neither Morningstar nor its content providers are responsible for any damages or losses arising from any use of this information. Past performance is no guarantee of future results.
1
Economic Update – Columbia Greater China Fund
Summary
For the 12-month period that ended August 31, 2010
| | n | | China’s stock markets delivered mixed returns. | |
| | |
MSCI China Index | | Hang Seng Stock Index |
| |
 | |  |
9.23% | | –1.02% |
As the pace of global economic growth picked up, the World Bank estimated that global gross domestic product (GDP) will expand by 3.3% in 2010. However, in the eurozone, which is dealing with a debt crisis in certain regions, growth is not expected to reach 1%. By contrast, the forecast for developing economies calls for 6.2% growth, with 8.7% expansion in East Asia and the Pacific region, led by Singapore and China. China’s economy is on track to post a year of high single-digit growth in 2010. In the second quarter of 2010, China surpassed Japan as the world’s second largest economy.
Stimulus spending aided recovery
China’s massive stimulus package has been a major factor in the region’s resilience. A combination of infrastructure spending, increases in transfers, consumer subsidies and tax cuts boosted overall GDP in 2009 and jumpstarted even higher growth in 2010. In fact, the economic rebound was so strong by the end of 2009 that the government took action to restrain the pace of growth in 2010, controlling lending, tightening lending standards and implementing an austerity program as well. China’s goal was to bring economic growth down from double digits to approximately 8%. Although that has not yet been achieved, the trend toward high single-digit growth appears to be on track. Measures to cool China’s real estate sector have proven effective. Nevertheless, construction is expected to continue to be a key driver of China’s economic growth going forward as money flows into affordable housing projects, roads and railways.
A new five-year plan
Every five years China formulates a plan for the next five-year period. The current plan ends in 2010, and the next plan is expected to reflect some substantial changes in government thinking in terms of where the economy should grow, how fast it should grow and what should be the key drivers of growth. In order to free itself from heavy dependence on exports and reduce its vulnerability to the economic cycles of developed countries, China is expected to target domestic consumption for expansion from 40%, its current level, to 60% to 70%, more in line with the developed world. The Chinese government hopes to accomplish this goal through policy changes designed to narrow the income gap between rich and poor and stimulate consumption while reducing the household savings rate. In an effort to promote safety and environmentally friendly growth, China has also shut down some steel mills, cement producers and small coal mines. In addition, we’re starting to see a move away from low-end manufacturing to technology and research and development, in order to help the country’s manufacturing sector climb the value chain toward higher-end exports, such as machinery. These major changes are likely to continue well beyond the new five-year plan to help shape the decade for China.
China’s stock market returns: mixed compared to region
While returns were modest to negative in developed markets over the 12-month period ended August 31, 2010, China’s stock market delivered mixed returns. The MSCI China Index (Net)1 returned 9.23%. The Hang Seng Stock Index2, which tracks stock market performance in Hong Kong, returned negative 1.02%. By comparison, returns from India, Indonesia, Malaysia, the Philippines and Thailand ranged between 22% and 47%, as measured by their respective MSCI indices.
| Past | performance is no guarantee of future results. |
| 1 | The Morgan Stanley Capital International (MSCI) China Index (Net) is designed to broadly and fairly represent the full diversity of business activities in China. This index aims to capture 85% of the free float adjusted market capitalization in each industry group. |
| 2 | The Hang Seng Stock Index tracks the performance of approximately 70% of the total market capitalization of the Stock Exchange of Hong Kong. |
Indices are not available for investment, are not professionally managed and do not reflect sales charges, fees, brokerage commissions, taxes or other expenses of investing. Securities in the fund may not match those in an index.
2
Performance Information – Columbia Greater China Fund
|
| Performance of a $10,000 investment 09/01/00 – 08/31/10 |
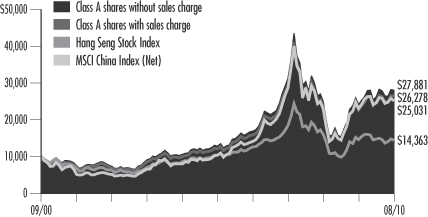
The chart above shows the change in value of a hypothetical $10,000 investment in Class A shares of Columbia Greater China Fund during the stated time, and does not reflect the deduction of taxes that a shareholder may pay on fund distributions or on the redemption of fund shares.
| | | | | | | | |
| Performance of a $10,000 investment 09/01/00 – 08/31/10 ($) | |
| | |
| Sales charge: | | without | | | with | |
Class A | | | 27,881 | | | | 26,278 | |
Class B | | | 25,882 | | | | 25,882 | |
Class C | | | 25,860 | | | | 25,860 | |
Class Z | | | 29,341 | | | | n/a | |
| | | | | | | | | | | | | | | | | | | | | | | | | | | | |
| Average annual total return as of 08/31/10 (%) | |
| | | | |
| Share class | | A | | | B | | | C | | | Z | |
| Inception | | 05/16/97 | | | 05/16/97 | | | 05/16/97 | | | 05/16/97 | |
| Sales charge | | without | | | with | | | without | | | with | | | without | | | with | | | without | |
1-year | | | 16.42 | | | | 9.73 | | | | 15.55 | | | | 10.55 | | | | 15.54 | | | | 14.54 | | | | 16.71 | |
5-year | | | 16.97 | | | | 15.60 | | | | 16.10 | | | | 15.88 | | | | 16.10 | | | | 16.10 | | | | 17.27 | |
10-year | | | 10.80 | | | | 10.14 | | | | 9.98 | | | | 9.98 | | | | 9.97 | | | | 9.97 | | | | 11.36 | |
| | | | | | | | | | | | | | | | | | | | | | | | | | | | |
| Average annual total return as of 09/30/10 (%) | |
| Share class | | A | | | B | | | C | | | Z | |
| Sales charge | | without | | | with | | | without | | | with | | | without | | | with | | | without | |
1-year | | | 22.20 | | | | 15.17 | | | | 21.29 | | | | 16.29 | | | | 21.29 | | | | 20.29 | | | | 22.53 | |
5-year | | | 18.00 | | | | 16.61 | | | | 17.12 | | | | 16.90 | | | | 17.13 | | | | 17.13 | | | | 18.30 | |
10-year | | | 12.67 | | | | 12.00 | | | | 11.83 | | | | 11.83 | | | | 11.82 | | | | 11.82 | | | | 13.25 | |
Performance data quoted represents past performance and current performance may be lower or higher. Past performance is no guarantee of future results. The investment return and principal value will fluctuate so that shares, when redeemed, may be worth more or less than the original cost. Please visit www.columbiamanagement.com for daily and most recent month-end performance updates.
| | | | |
| Annual operating expense ratio (%)* | |
| |
Class A | | | 1.72 | |
Class B | | | 2.47 | |
Class C | | | 2.47 | |
Class Z | | | 1.47 | |
| * | The annual operating expense ratio is as stated in the fund’s prospectus that is current as of the date of this report. Differences in expense ratios disclosed elsewhere in this report may result from inclusion of fee waivers and expense reimbursements as well as the use of different time periods to calculate the ratios. |
| | | | |
Net asset value per share | |
| |
as of 08/31/10 ($) | | | | |
Class A | | | 51.35 | |
Class B | | | 49.42 | |
Class C | | | 50.10 | |
Class Z | | | 53.60 | |
| | | | |
| Distributions declared per share | |
09/01/09 – 08/31/10 ($) | | | | |
Class A | | | 0.22 | |
Class Z | | | 0.31 | |
The “with sales charge” returns include the maximum initial sales charge of 5.75% for Class A shares and the applicable contingent deferred sales charge of 5.00% in the first year, declining to 1.00% in the sixth year and eliminated thereafter for Class B shares and 1.00% for Class C shares for the first year only. The “without sales charge” returns do not include the effect of sales charges. If they had, returns would be lower.
Performance results reflect any fee waivers or reimbursements of fund expenses by the investment advisor and/or any of its affiliates. Absent these fee waivers or expense reimbursement arrangements, performance results would have been lower.
All results shown assume reinvestment of distributions. Class Z shares are sold at net asset value with no distribution and service (Rule 12b-1) fees. Class Z shares have limited eligibility and the investment minimum requirements may vary. Please see the fund’s prospectuses for details. Performance for different share classes will vary based on differences in sales charges and fees associated with each class.
The tables do not reflect the deduction of taxes that a shareholder may pay on fund distributions or on the redemption of fund shares.
3
Understanding Your Expenses – Columbia Greater China Fund
Estimating your actual expenses
To estimate the expenses that you paid over the period, first you will need your account balance at the end of the period:
| | n | | For shareholders who receive their account statements from Columbia Management Investment Services Corp., your account balance is available online at www.columbiamanagement.com or by calling Shareholder Services at 800.345.6611. | |
| | n | | For shareholders who receive their account statements from their financial intermediary, contact your financial intermediary to obtain your account balance. | |
| | 1. | Divide your ending account balance by $1,000. For example, if an account balance was $8,600 at the end of the period, the result would be 8.6. | |
| | 2. | In the section of the table below titled “Expenses paid during the period,” locate the amount for your share class. You will find this number in the column labeled “Actual.” Multiply this number by the result from step 1. Your answer is an estimate of the expenses you paid on your account during the period. | |
If the value of your account falls below the minimum initial investment requirement applicable to you, your account may be subject to a $20 annual fee. This fee is not included in the accompanying table. If you are subject to the fee, keep it in mind when you are estimating the ongoing expenses of investing in the fund and when comparing the expenses of this fund with other funds.
As a fund shareholder, you incur two types of costs. There are transaction costs, which generally include sales charges on purchases and may include redemption fees or exchange fees. There are also ongoing costs, which generally include investment advisory fees, distribution and service (Rule 12b-1) fees and other fund expenses. The information on this page is intended to help you understand the ongoing costs of investing in the fund and to compare these costs with the ongoing costs of investing in other mutual funds.
Analyzing your fund’s expenses by share class
To illustrate these ongoing costs, we have provided an example and calculated the expenses paid by investors in each share class during the period. The information in the following table is based on an initial investment of $1,000, which is invested at the beginning of the period and held for the entire period. Expense information is calculated two ways and each method provides you with different information. The amount listed in the “Actual” column is calculated using the fund’s actual operating expenses and total return for the period. The amount listed in the “Hypothetical” column for each share class assumes that the return each year is 5% before expenses and is calculated based on the fund’s actual operating expenses. You should not use the hypothetical account values and expenses to estimate either your actual account balance at the end of the period or the expenses you paid during this period.
Compare with other funds
Since all mutual funds are required to include the same hypothetical calculations about expenses in shareholder reports, you can use this information to compare the ongoing costs of investing in the fund with other funds. To do so, compare the 5% hypothetical example with the 5% hypothetical examples that appear in the shareholder reports of other funds. As you compare hypothetical examples of other funds, it is important to note that hypothetical examples are meant to highlight the ongoing costs of investing in a fund and do not reflect any transaction costs, such as sales charges, redemption fees or exchange fees.
| | | | | | | | | | | | | | | | | | | | | | | | | | | | |
| 03/01/10 – 08/31/10 | | | | | | | | | | |
| | | | |
| | | Account value at the
beginning of the period ($) | | | Account value at the
end of the period ($) | | | Expenses paid
during the period ($) | | | Fund’s annualized
expense ratio (%) | |
| | | Actual | | | Hypothetical | | | Actual | | | Hypothetical | | | Actual | | | Hypothetical | | | Actual | |
Class A | | | 1,000.00 | | | | 1,000.00 | | | | 1,065.60 | | | | 1,016.84 | | | | 8.64 | | | | 8.44 | | | | 1.66 | |
Class B | | | 1,000.00 | | | | 1,000.00 | | | | 1,061.70 | | | | 1,013.06 | | | | 12.52 | | | | 12.23 | | | | 2.41 | |
Class C | | | 1,000.00 | | | | 1,000.00 | | | | 1,061.70 | | | | 1,013.06 | | | | 12.52 | | | | 12.23 | | | | 2.41 | |
Class Z | | | 1,000.00 | | | | 1,000.00 | | | | 1,066.90 | | | | 1,018.10 | | | | 7.35 | | | | 7.17 | | | | 1.41 | |
Expenses paid during the period are equal to the annualized expense ratio for the share class, multiplied by the average account value over the period, then multiplied by the number of days in the fund’s most recent fiscal half-year and divided by 365.
It is important to note that the expense amounts shown in the table are meant to highlight only ongoing costs of investing in the fund and do not reflect any transaction costs, such as sales charges, redemption fees or exchange fees. Therefore, the hypothetical examples provided may not help you determine the relative total costs of owning shares of different funds. If these transaction costs were included, your costs would have been higher.
4
Portfolio Manager’s Report – Columbia Greater China Fund
Performance data quoted represents past performance and current performance may be lower or higher. Past performance is no guarantee of future results. The investment return and principal value will fluctuate so that shares, when redeemed, may be worth more or less than the original cost. Please visit www.columbiamanagement.com for daily and most recent month-end performance updates.
| | | | |
| Top 10 holdings | |
| |
as of 08/31/10 (%) | | | | |
CNOOC | | | 7.6 | |
Industrial & Commercial Bank of China | | | 7.0 | |
China Life Insurance Co. | | | 7.0 | |
Bank of China | | | 6.0 | |
China Mobile | | | 4.6 | |
PetroChina | | | 4.2 | |
China Merchants Bank | | | 4.0 | |
Tencent Holdings | | | 3.8 | |
China Construction Bank | | | 3.1 | |
Xinao Gas Holdings | | | 2.9 | |
The fund is actively managed and the composition of its portfolio will change over time. Information provided is calculated as a percentage of net assets.
For the 12-month period that ended August 31, 2010, Columbia Greater China Fund Class A shares returned 16.42% without sales charge. This was more than the 9.23% return of the MSCI China Index (Net) for the same period and the Hang Seng Stock Index, which returned negative 1.02%. The fund outperformed the average fund in its peer group, the Lipper China Region Funds Classification, which returned 13.80%. Stock selection, particularly in the consumer discretionary and information technology sectors, was the main driver of performance.
Taking advantage of China’s new economic plan
After engineering a strong economic recovery through a large stimulus program in 2009, in 2010 the Chinese government began focusing on boosting domestic consumption and developing a services sector. To raise consumption levels, the government is expected to increase wage growth. It is also developing a social safety net, including health care services and pensions, so that their citizens can spend more of their wages and reduce the amount they save for emergencies. As a result, we emphasized stocks with the potential to benefit from increased consumer spending, which were relatively strong performers for the period. One example is Great Wall Motor (1.4% of net assets), an auto manufacturer that benefited from robust auto growth, especially in SUVs and pickup trucks, which are favored by people in rural areas. Golden Eagle Retail Group (2.3% of net assets), a department store chain, was also a noteworthy performer. Building a services sector includes everything from supporting new information technology, research and development and health care companies to developing a tourism industry. In the past, China used capital and labor to increase production. In the future, it plans to turn to technology to enhance productivity. To capitalize on this trend, we invested in Kingdee International Software Group (1.2% of net assets), which contributed significantly to performance. In health care, we had a position in China Shineway Pharmaceutical Group (0.6% of net assets), a provider of traditional medicines, which helped drive return. The company is positioned to take advantage of the expansion of government-sponsored health care services. Tourism was also a theme in the portfolio, and Ctrip.com International (1.3% of net assets), an online travel agency, produced a strong result. The Chinese government’s new five-year plan also focuses on promoting environmentally friendly growth. Much of China’s energy is supplied by coal, but a new focus on cleaner energy was helpful to Xinao Gas Holdings (2.9% of net assets), a natural gas distributor.
Some disappointments
We participated in an initial public offering of China Nuokang Bio-Pharmaceutical (0.3% of net assets). The stock did poorly because the execution of the company’s business plan fell short of our expectations. We trimmed our holdings. Because many investors were risk-averse as the global economy strained toward recovery, they favored defensive stocks, such as consumer staples, which we believed had been bid up to unsustainable levels. As a result, we had less exposure to the sector than the benchmarks. This positioning detracted from the fund’s return because the sector was a strong performer.
5
Portfolio Manager’s Report (continued) – Columbia Greater China Fund
Looking ahead
We remain interested in trends that favor consumer spending, information technology and tourism, as well as areas that the Chinese government has targeted for expansion, such as high technology industrials. As a result, the portfolio is overweight in consumer discretionary and information technology stocks. The government has also placed a new emphasis on reducing low-end manufacturing and becoming a producer of relatively high-end products for export, such as machinery. In this regard, we have already increased the fund’s exposure to the industrials sector. The fund remains underweight in materials, telecommunications and financials.
Portfolio characteristics and holdings are subject to change periodically and may not be representative of current characteristics and holdings. The outlook for the fund may differ from those presented for other Columbia Funds.
Equity securities are affected by stock market fluctuations that occur in response to economic and business developments.
International investing may involve certain risks, including currency fluctuations, risks associated with possible differences in financial accounting standards and other monetary and political risks. Significant levels of foreign taxes, including potentially confiscatory levels of taxation and withholding taxes, may also apply to some foreign investments.
Investing in emerging markets may involve greater risks than investing in more developed countries. In addition, concentration of investments in a single region may result in greater volatility.
6
Investment Portfolio – Columbia Greater China Fund
August 31, 2010
Common Stocks – 99.7%
| | | | | | | | |
| | | Shares | | | Value ($) | |
| Consumer Discretionary – 12.5% | | | | | | | | |
| Automobiles – 1.4% | | | | | | | | |
Great Wall Motor Co., Ltd., Class H | | | 1,497,000 | | | | 3,224,638 | |
| |
Automobiles Total | | | | | | | 3,224,638 | |
| | |
| Distributors – 1.4% | | | | | | | | |
Li & Fung Ltd. | | | 607,600 | | | | 3,060,825 | |
| |
Distributors Total | | | | | | | 3,060,825 | |
| |
| Diversified Consumer Services – 0.7% | | | | | |
New Oriental Education & Technology Group, ADR (a) | | | 15,047 | | | | 1,483,484 | |
| |
Diversified Consumer Services Total | | | | 1,483,484 | |
| |
| Hotels, Restaurants & Leisure – 1.7% | | | | | |
7 Days Group Holdings Ltd., ADR (a) | | | 70,881 | | | | 1,008,637 | |
Ctrip.com International Ltd., ADR (a) | | | 71,199 | | | | 2,882,847 | |
| |
Hotels, Restaurants & Leisure Total | | | | 3,891,484 | |
| | |
| Multiline Retail – 2.9% | | | | | | | | |
Golden Eagle Retail Group Ltd. | | | 1,974,000 | | | | 5,240,933 | |
Intime Department Store Group Co., Ltd. | | | 977,000 | | | | 1,204,985 | |
| |
Multiline Retail Total | | | | | | | 6,445,918 | |
| | |
| Specialty Retail – 2.3% | | | | | | | | |
Belle International Holdings Ltd. | | | 2,625,000 | | | | 4,593,978 | |
SA SA International Holdings Ltd. | | | 876,000 | | | | 601,421 | |
| |
Specialty Retail Total | | | | | | | 5,195,399 | |
| |
| Textiles, Apparel & Luxury Goods – 2.1% | | | | | |
China Lilang Ltd. | | | 1,590,444 | | | | 2,098,006 | |
Trinity Ltd. | | | 3,394,598 | | | | 2,708,955 | |
| |
Textiles, Apparel & Luxury Goods Total | | | | 4,806,961 | |
| |
Consumer Discretionary Total | | | | | | | 28,108,709 | |
| | | | | | | | |
| Consumer Staples – 4.7% | | | | | | | | |
| Beverages – 1.4% | | | | | | | | |
Tsingtao Brewery Co., Ltd., Class H | | | 574,000 | | | | 3,035,515 | |
| |
Beverages Total | | | | | | | 3,035,515 | |
| | |
| Food Products – 3.3% | | | | | | | | |
Shenguan Holdings Group Ltd. | | | 1,870,000 | | | | 1,961,087 | |
Tingyi Cayman Islands Holding Corp. | | | 844,000 | | | | 2,132,608 | |
| | | | | | | | |
| | | Shares | | | Value ($) | |
Want Want China Holdings Ltd. | | | 4,219,000 | | | | 3,417,198 | |
| |
Food Products Total | | | | | | | 7,510,893 | |
| |
Consumer Staples Total | | | | | | | 10,546,408 | |
| | | | | | | | |
| Energy – 17.1% | | | | | | | | |
| Oil, Gas & Consumable Fuels – 17.1% | | | | | |
China Shenhua Energy Co., Ltd., Class H | | | 1,711,500 | | | | 6,242,425 | |
CNOOC Ltd. | | | 10,141,500 | | | | 17,192,709 | |
PetroChina Co., Ltd., Class H | | | 8,734,000 | | | | 9,490,147 | |
Yanzhou Coal Mining Co., Ltd., Class H | | | 2,752,000 | | | | 5,658,323 | |
| |
Oil, Gas & Consumable Fuels Total | | | | 38,583,604 | |
| |
Energy Total | | | | | | | 38,583,604 | |
| | | | | | | | |
| Financials – 35.4% | | | | | | | | |
| Commercial Banks – 20.1% | | | | | | | | |
Bank of China Ltd., Class H | | | 26,544,000 | | | | 13,391,293 | |
China Construction Bank Corp., Class H | | | 8,439,000 | | | | 7,001,111 | |
China Merchants Bank Co., Ltd., Class H | | | 3,502,090 | | | | 9,039,159 | |
Industrial & Commercial Bank of China, Class H | | | 21,704,000 | | | | 15,842,451 | |
| |
Commercial Banks Total | | | | | | | 45,274,014 | |
| | |
| Insurance – 10.4% | | | | | | | | |
China Life Insurance Co., Ltd., Class H | | | 4,090,000 | | | | 15,684,356 | |
China Pacific Insurance Group Co., Ltd., Class H | | | 780,864 | | | | 2,814,780 | |
Ping An Insurance Group Co. of China, Ltd., Class H (b) | | | 601,500 | | | | 4,918,710 | |
| |
Insurance Total | | | | | | | 23,417,846 | |
|
| Real Estate Management & Development – 4.9% | |
China Overseas Land & Investment Ltd. | | | 968,320 | | | | 2,075,464 | |
China Vanke Co., Ltd., Class B | | | 4,437,110 | | | | 5,426,294 | |
Guangzhou R&F Properties Co., Ltd., Class H | | | 2,336,000 | | | | 3,419,622 | |
| |
Real Estate Management & Development Total | | | | | | | 10,921,380 | |
| |
Financials Total | | | | | | | 79,613,240 | |
| | | | | | | | |
| Health Care – 1.6% | | | | | | | | |
| Biotechnology – 0.3% | | | | | | | | |
China Nuokang Bio-Pharmaceutical, Inc., ADR (a) | | | 149,052 | | | | 745,260 | |
| |
Biotechnology Total | | | | | | | 745,260 | |
See Accompanying Notes to Financial Statements.
7
Columbia Greater China Fund
August 31, 2010
Common Stocks (continued)
| | | | | | | | |
| | | Shares | | | Value ($) | |
| Health Care (continued) | | | | | | | | |
| Health Care Providers & Services – 0.7% | | | | | |
Sinopharm Group Co., Class H | | | 430,830 | | | | 1,646,870 | |
| |
Health Care Providers & Services Total | | | | 1,646,870 | |
| | |
| Pharmaceuticals – 0.6% | | | | | | | | |
China Shineway Pharmaceutical Group Ltd. | | | 472,000 | | | | 1,237,975 | |
| |
Pharmaceuticals Total | | | | | | | 1,237,975 | |
| |
Health Care Total | | | | | | | 3,630,105 | |
| | | | | | | | |
| Industrials – 7.4% | | | | | | | | |
| Electrical Equipment – 2.1% | | | | | | | | |
Harbin Electric, Inc. (a) | | | 96,903 | | | | 1,636,692 | |
Zhuzhou CSR Times Electric Co., Ltd., Class H | | | 1,201,000 | | | | 3,118,987 | |
| |
Electrical Equipment Total | | | | | | | 4,755,679 | |
| | |
| Industrial Conglomerates – 1.0% | | | | | | | | |
Beijing Enterprises Holdings Ltd. | | | 190,500 | | | | 1,347,076 | |
Chongqing Machinery & Electric Co., Ltd., Class H | | | 3,858,964 | | | | 984,111 | |
| |
Industrial Conglomerates Total | | | | | | | 2,331,187 | |
| | |
| Machinery – 1.6% | | | | | | | | |
CSR Corp., Ltd., Class H | | | 4,104,707 | | | | 3,472,412 | |
| |
Machinery Total | | | | | | | 3,472,412 | |
| |
| Transportation Infrastructure – 2.7% | | | | | |
China Merchants Holdings International Co., Ltd. | | | 722,000 | | | | 2,443,313 | |
Sichuan Expressway Co., Ltd., Class H | | | 5,458,000 | | | | 3,669,920 | |
| |
Transportation Infrastructure Total | | | | 6,113,233 | |
| |
Industrials Total | | | | | | | 16,672,511 | |
| | | | | | | | |
| Information Technology – 12.2% | | | | | | | | |
| Communications Equipment – 2.5% | |
O-Net Communications Group Ltd. (a) | | | 9,354,000 | | | | 5,734,932 | |
| |
Communications Equipment Total | | | | 5,734,932 | |
|
| Electronic Equipment, Instruments & Components – 0.8% | |
Digital China Holdings Ltd. | | | 1,111,000 | | | | 1,728,426 | |
| |
Electronic Equipment, Instruments & Components Total | | | | 1,728,426 | |
| |
| Internet Software & Services – 5.9% | | | | | |
Baidu, Inc., ADR (a) | | | 44,000 | | | | 3,450,920 | |
Sina Corp. (a) | | | 25,659 | | | | 1,098,718 | |
Tencent Holdings Ltd. | | | 470,400 | | | | 8,650,102 | |
| |
Internet Software & Services Total | | | | 13,199,740 | |
| | | | | | | | |
| | | Shares | | | Value ($) | |
| Software – 3.0% | | | | | | | | |
AutoNavi Holdings Ltd., ADR (a) | | | 77,643 | | | | 1,211,231 | |
Kingdee International Software Group Co., Ltd. | | | 6,794,000 | | | | 2,576,962 | |
VanceInfo Technologies, Inc., ADR (a) | | | 100,181 | | | | 2,920,276 | |
| |
Software Total | | | | | | | 6,708,469 | |
| |
Information Technology Total | | | | | | | 27,371,567 | |
| | | | | | | | |
| Materials – 1.4% | | | | | | | | |
| Chemicals – 1.4% | | | | | | | | |
Huabao International Holdings Ltd. | | | 2,164,000 | | | | 3,126,528 | |
| |
Chemicals Total | | | | | | | 3,126,528 | |
| |
Materials Total | | | | | | | 3,126,528 | |
| | | | | | | | |
| Telecommunication Services – 4.5% | |
| Wireless Telecommunication Services – 4.5% | |
China Mobile Ltd. | | | 1,000,500 | | | | 10,235,118 | |
| |
Wireless Telecommunication Services Total | | | | 10,235,118 | |
| |
Telecommunication Services Total | | | | 10,235,118 | |
| | | | | | | | |
| Utilities – 2.9% | | | | | | | | |
| Gas Utilities – 2.9% | | | | | | | | |
Xinao Gas Holdings Ltd. | | | 2,384,000 | | | | 6,433,057 | |
| |
Gas Utilities Total | | | | | | | 6,433,057 | |
| |
Utilities Total | | | | | | | 6,433,057 | |
| |
Total Common Stocks
(cost of $129,690,073) | | | | | | | 224,320,847 | |
| | |
Short-Term Obligation – 0.3% | | | | | | | | |
| | | Par ($) | | | | |
Repurchase agreement with Fixed Income Clearing Corp., dated 08/31/10, due 09/01/10 at 0.180%, collateralized by a U.S. Treasury obligation maturing 08/15/39, market value $762,486 (repurchase proceeds $745,004) | | | 745,000 | | | | 745,000 | |
| |
Total Short-Term Obligation
(cost of $745,000) | | | | | | | 745,000 | |
| |
Total Investments – 100.0%
(cost of $130,435,073)(c) | | | | | | | 225,065,847 | |
| |
Other Assets & Liabilities, Net – (0.0)% | | | | (85,814 | ) |
| |
Net Assets – 100.0% | | | | | | | 224,980,033 | |
See Accompanying Notes to Financial Statements.
8
Columbia Greater China Fund
August 31, 2010
Notes to Investment Portfolio:
| (a) | Non-income producing security. |
| (b) | Represents fair value as determined in good faith under procedures approved by the Board of Trustees. At August 31, 2010, the value of this security amounted to $4,918,710 which represents 2.2% of net assets. |
| (c) | Cost for federal income tax purposes is $130,435,073. |
The following table summarizes the inputs used, as of August 31, 2010, in valuing the Fund’s assets:
| | | | | | | | | | | | | | | | |
Description | | Quoted Prices
(Level 1) | | | Other
Significant
Observable
Inputs
(Level 2) | | | Significant
Unobservable
Inputs
(Level 3) | | | Total | |
Common Stocks | | | | | | | | | | | | | | | | |
Consumer Discretionary | | $ | 5,374,968 | | | $ | 22,733,741 | | | $ | — | | | $ | 28,108,709 | |
Consumer Staples | | | — | | | | 10,546,408 | | | | — | | | | 10,546,408 | |
Energy | | | — | | | | 38,583,604 | | | | — | | | | 38,583,604 | |
Financials | | | — | | | | 74,694,530 | | | | 4,918,710 | | | | 79,613,240 | |
Health Care | | | 745,260 | | | | 2,884,845 | | | | — | | | | 3,630,105 | |
Industrials | | | 1,636,692 | | | | 15,035,819 | | | | — | | | | 16,672,511 | |
Information Technology | | | 8,681,145 | | | | 18,690,422 | | | | — | | | | 27,371,567 | |
Materials | | | — | | | | 3,126,528 | | | | — | | | | 3,126,528 | |
Telecommunication Services | | | — | | | | 10,235,118 | | | | — | | | | 10,235,118 | |
Utilities | | | — | | | | 6,433,057 | | | | — | | | | 6,433,057 | |
| | | | | | | | | | | | | | | | |
Total Common Stocks | | | 16,438,065 | | | | 202,964,072 | | | | 4,918,710 | | | | 224,320,847 | |
| | | | | | | | | | | | | | | | |
Total Short-Term Obligation | | | — | | | | 745,000 | | | | — | | | | 745,000 | |
| | | | | | | | | | | | | | | | |
Total Investments | | $ | 16,438,065 | | | $ | 203,709,072 | | | $ | 4,918,710 | | | $ | 225,065,847 | |
| | | | | | | | | | | | | | | | |
The Fund’s assets assigned to the Level 2 input category include certain foreign securities for which a third party statistical pricing service may be employed for purposes of fair valuation.
Certain short-term obligations may be valued using amortized cost, an income approach which converts future cash flows to a present value based upon the premium or discount at purchase.
The following table reconciles asset balances for the year ended August 31, 2010, in which significant unobservable inputs (Level 3) were used in determining value:
| | | | | | | | | | | | | | | | | | | | | | | | | | | | | | | | |
Investments in Securities | | Balance as
of August 31, 2009 | | | Realized Gain/
(Loss) | | | Change in
Unrealized
Appreciation
(Depreciation) | | | Purchases | | | (Sales) | | | Transfers
into Level 3 | | | Transfers
out of
Level 3 | | | Balance as
of August 31,
2010 | |
Common Stocks | | | | | | | | | | | | | | | | | | | | | | | | | | | | | | | | |
Financials | | $ | — | | | $ | 723,703 | | | $ | (45,688 | ) | | $ | — | | | $ | (2,210,027 | ) | | $ | 6,450,722 | | | $ | — | | | $ | 4,918,710 | |
The information in the above reconciliation represents fiscal year to date activity for any securities identified as using Level 3 inputs at either the beginning or the end of the current fiscal period.
The change in unrealized depreciation attributable to securities owned at August 31, 2010, which were valued using significant unobservable inputs (Level 3) amounted to $45,688. This amount is included in net change in unrealized appreciation (depreciation) on the Statement of Changes in Net Assets.
Financial assets were transferred from level 2 to level 3 as certain common stocks classified as Level 3 securities are valued using the market approach. To determine fair value for these securities, management considered various factors which may have included, but were not limited to, the halt price of the security, the movement in observed market prices for other securities from the issuer, the movement in certain foreign or domestic market indices, models utilized by the third party statistical pricing service, and the position of the security within the respective company’s capital structure.
The following table shows transfers between Level 2 and Level 3 of the fair value hierarchy during the year ended August 31, 2010:
| | | | | | |
Transfers In | | Transfers Out |
Level 2 | | Level 3 | | Level 2 | | Level 3 |
$— | | $6,450,722 | | $6,450,722 | | $— |
For more information on valuation inputs, and their aggregation into the levels used in the tables above, please refer to the Security Valuation section in the accompanying Notes to Financial Statements.
See Accompanying Notes to Financial Statements.
9
Columbia Greater China Fund
August 31, 2010
At August 31, 2010, the Fund held investments in the following sectors:
| | | | |
Sector (Unaudited) | | % of Net Assets | |
Financials | | | 35.4 | |
Energy | | | 17.1 | |
Consumer Discretionary | | | 12.5 | |
Information Technology | | | 12.2 | |
Industrials | | | 7.4 | |
Consumer Staples | | | 4.7 | |
Telecommunication Services | | | 4.5 | |
Utilities | | | 2.9 | |
Health Care | | | 1.6 | |
Materials | | | 1.4 | |
| | | | |
| | | 99.7 | |
Short-Term Obligation | | | 0.3 | |
Other Assets & Liabilities, Net | | | (0.0 | )* |
| | | | |
| | | 100.0 | |
| | | | |
* Round to less than 0.1%.
The Fund was invested in the following countries at August 31, 2010:
| | | | | | | | |
Summary of Securities
by Country (Unaudited) | | Value | | | % of Total
Investments | |
China | | $ | 217,949,646 | | | | 96.9 | |
Hong Kong | | | 6,371,201 | | | | 2.8 | |
United States* | | | 745,000 | | | | 0.3 | |
| | | | | | | | |
| | $ | 225,065,847 | | | | 100.0 | |
| | | | | | | | |
* Includes short-term obligation.
Certain securities are listed by country of underlying exposure but may trade predominantly on other exchanges.
| | |
Acronym | | Name |
| ADR | | American Depositary Receipt |
See Accompanying Notes to Financial Statements.
10
Statement of Assets and Liabilities – Columbia Greater China Fund
August 31, 2010
| | | | | | |
| | | | | ($) | |
| Assets | | Investments, at cost | | | 130,435,073 | |
| | | | | | |
| | Investments, at value | | | 225,065,847 | |
| | Cash | | | 669 | |
| | Foreign currency (cost of $161,057) | | | 161,061 | |
| | Receivable for: | | | | |
| | Investments sold | | | 331,646 | |
| | Fund shares sold | | | 151,474 | |
| | Dividends | | | 63,844 | |
| | Interest | | | 4 | |
| | Trustees’ deferred compensation plan | | | 23,650 | |
| | Prepaid expenses | | | 5,018 | |
| | | |
| | Total Assets | | | 225,803,213 | |
| | |
| Liabilities | | Payable for: | | | | |
| | Fund shares repurchased | | | 368,956 | |
| | Investment advisory fee | | | 184,292 | |
| | Pricing and bookkeeping fees | | | 7,866 | |
| | Transfer agent fee | | | 71,431 | |
| | Trustees’ fees | | | 1,931 | |
| | Custody fee | | | 35,980 | |
| | Distribution and service fees | | | 71,226 | |
| | Chief compliance officer expenses | | | 166 | |
| | Trustees’ deferred compensation plan | | | 23,650 | |
| | Other liabilities | | | 57,682 | |
| | | |
| | Total Liabilities | | | 823,180 | |
| |
| | | |
| | Net Assets | | | 224,980,033 | |
| | |
| Net Assets Consist of | | Paid-in capital | | | 127,330,061 | |
| | Undistributed net investment income | | | 607,328 | |
| | Accumulated net realized gain | | | 2,411,928 | |
| | Net unrealized appreciation (depreciation) on: | | | | |
| | Investments | | | 94,630,774 | |
| | Foreign currency translations | | | (58 | ) |
| | | |
| | Net Assets | | | 224,980,033 | |
See Accompanying Notes to Financial Statements.
11
Statement of Assets and Liabilities (continued) – Columbia Greater China Fund
August 31, 2010
| | | | | | |
| | | | | | |
| Class A | | Net assets | | $ | 116,870,172 | |
| | Shares outstanding | | | 2,276,174 | |
| | Net asset value per share | | $ | 51.35 | (a) |
| | Maximum sales charge | | | 5.75 | % |
| | Maximum offering price per share ($51.35 / 0.9425) | | $ | 54.48 | (b) |
| | |
| Class B | | Net assets | | $ | 16,717,538 | |
| | Shares outstanding | | | 338,303 | |
| | Net asset value and offering price per share | | $ | 49.42 | (a) |
| | |
| Class C | | Net assets | | $ | 36,371,007 | |
| | Shares outstanding | | | 726,032 | |
| | Net asset value and offering price per share | | $ | 50.10 | (a) |
| | |
| Class Z | | Net assets | | $ | 55,021,316 | |
| | Shares outstanding | | | 1,026,581 | |
| | Net asset value and offering price per share | | $ | 53.60 | (a) |
| (a) | Redemption price per share is equal to net asset value less any applicable contingent deferred sales charge. |
| (b) | On sales of $50,000 or more the offering price is reduced. |
See Accompanying Notes to Financial Statements.
12
Statement of Operations – Columbia Greater China Fund
For the Year Ended August 31, 2010
| | | | | | |
| | | | | ($) | |
| Investment Income | | Dividends | | | 5,108,725 | |
| | Interest | | | 911 | |
| | Foreign taxes withheld | | | (428,439 | ) |
| | | | | | |
| | Total Investment Income | | | 4,681,197 | |
| | |
| Expenses | | Investment advisory fee | | | 2,279,560 | |
| | Distribution fee: | | | | |
| | Class B | | | 137,841 | |
| | Class C | | | 295,281 | |
| | Service fee: | | | | |
| | Class A | | | 323,893 | |
| | Class B | | | 45,947 | |
| | Class C | | | 98,417 | |
| | Transfer agent fee | | | 469,187 | |
| | Pricing and bookkeeping fees | | | 86,509 | |
| | Trustees’ fees | | | 27,364 | |
| | Custody fee | | | 221,372 | |
| | Chief compliance officer expenses | | | 1,014 | |
| | Other expenses | | | 205,704 | |
| | | | | | |
| | Expenses before interest expense | | | 4,192,089 | |
| | Interest expense | | | 717 | |
| | | | | | |
| | Total Expenses | | | 4,192,806 | |
| | |
| | Expense reductions | | | — | (a) |
| | | | | | |
| | Net Investment Income | | | 488,391 | |
| | |
| Net Realized and Unrealized Gain (Loss) on Investments and Foreign Currency | | Net realized gain on: | | | | |
| | Investments | | | 17,960,003 | |
| | Foreign currency transactions | | | 18,074 | |
| | | | | | |
| | Net realized gain | | | 17,978,077 | |
| | |
| | Net change in unrealized appreciation (depreciation) on: | | | | |
| | Investments | | | 15,712,714 | |
| | Foreign currency translations | | | (7 | ) |
| | | | | | |
| | Net change in unrealized appreciation (depreciation) | | | 15,712,707 | |
| | | | | | |
| | Net Gain | | | 33,690,784 | |
| | |
| | | | | | |
| | Net Increase Resulting from Operations | | | 34,179,175 | |
| (a) | Rounds to less than $1. |
See Accompanying Notes to Financial Statements.
13
Statement of Changes in Net Assets – Columbia Greater China Fund
| | | | | | | | | | |
| | | | | Year Ended August 31, | |
| Increase (Decrease) in Net Assets | | | | 2010 ($) | | | 2009 ($) | |
| Operations | | Net investment income | | | 488,391 | | | | 1,450,928 | |
| | Net realized gain (loss) on investments and foreign currency transactions | | | 17,978,077 | | | | (15,111,316 | ) |
| | Net change in unrealized appreciation (depreciation) on investments and foreign currency translations | | | 15,712,707 | | | | (6,774,353 | ) |
| | | |
| | Net increase (decrease) resulting from operations | | | 34,179,175 | | | | (20,434,741 | ) |
| | | |
| Distributions to Shareholders | | From net investment income: | | | | | | | | |
| | Class A | | | (609,676 | ) | | | — | |
| | Class Z | | | (320,778 | ) | | | — | |
| | From net realized gains: | | | | | | | | |
| | Class A | | | — | | | | (1,483,663 | ) |
| | Class B | | | — | | | | (223,819 | ) |
| | Class C | | | — | | | | (392,226 | ) |
| | Class Z | | | — | | | | (436,493 | ) |
| | | |
| | Total distributions to shareholders | | | (930,454 | ) | | | (2,536,201 | ) |
| | | |
| | Net Capital Stock Transactions | | | (32,242,287 | ) | | | (12,519,342 | ) |
| | Increase from regulatory settlements | | | 148,533 | | | | 103,255 | |
| | Redemption fees | | | 36,720 | | | | 93,566 | |
| | | | | | | | | | |
| | Total increase (decrease) in net assets | | | 1,191,687 | | | | (35,293,463 | ) |
| | | |
| Net Assets | | Beginning of period | | | 223,788,346 | | | | 259,081,809 | |
| | End of period | | | 224,980,033 | | | | 223,788,346 | |
| | Undistributed net investment income at end of period | | | 607,328 | | | | 882,784 | |
See Accompanying Notes to Financial Statements.
14
Statement of Changes in Net Assets (continued) – Columbia Greater China Fund
| | | | | | | | | | | | | | | | |
| | | Capital Stock Activity | |
| | | Year Ended
August 31, 2010 | | | Year Ended
August 31, 2009 | |
| | | Shares | | | Dollars ($) | | | Shares | | | Dollars ($) | |
Class A | | | | | | | | | | | | | | | | |
Subscriptions | | | 533,966 | | | | 26,896,211 | | | | 640,144 | | | | 24,692,423 | |
Distributions reinvested | | | 10,370 | | | | 519,513 | | | | 38,179 | | | | 1,286,612 | |
Redemptions | | | (1,029,040 | ) | | | (50,967,024 | ) | | | (1,235,383 | ) | | | (43,562,423 | ) |
| | | | | | | | | | | | | | | | |
Net decrease | | | (484,704 | ) | | | (23,551,300 | ) | | | (557,060 | ) | | | (17,583,388 | ) |
| | | | |
Class B | | | | | | | | | | | | | | | | |
Subscriptions | | | 17,982 | | | | 856,074 | | | | 61,424 | | | | 2,316,583 | |
Distributions reinvested | | | — | | | | — | | | | 5,032 | | | | 164,581 | |
Redemptions | | | (96,183 | ) | | | (4,609,765 | ) | | | (133,056 | ) | | | (4,376,447 | ) |
| | | | | | | | | | | | | | | | |
Net decrease | | | (78,201 | ) | | | (3,753,691 | ) | | | (66,600 | ) | | | (1,895,283 | ) |
| | | | |
Class C | | | | | | | | | | | | | | | | |
Subscriptions | | | 133,863 | | | | 6,585,620 | | | | 295,539 | | | | 11,096,474 | |
Distributions reinvested | | | — | | | | — | | | | 8,529 | | | | 282,747 | |
Redemptions | | | (247,265 | ) | | | (11,964,448 | ) | | | (328,054 | ) | | | (11,076,276 | ) |
| | | | | | | | | | | | | | | | |
Net increase (decrease) | | | (113,402 | ) | | | (5,378,828 | ) | | | (23,986 | ) | | | 302,945 | |
| | | | |
Class Z | | | | | | | | | | | | | | | | |
Subscriptions | | | 335,054 | | | | 17,582,788 | | | | 515,855 | | | | 20,827,817 | |
Distributions reinvested | | | 3,627 | | | | 189,365 | | | | 9,309 | | | | 326,574 | |
Redemptions | | | (335,284 | ) | | | (17,330,621 | ) | | | (394,270 | ) | | | (14,498,007 | ) |
| | | | | | | | | | | | | | | | |
Net increase | | | 3,397 | | | | 441,532 | | | | 130,894 | | | | 6,656,384 | |
See Accompanying Notes to Financial Statements.
15
Financial Highlights – Columbia Greater China Fund
Selected data for a share outstanding throughout each period is as follows:
| | | | | | | | | | | | | | | | | | | | |
| | | Year Ended August 31, | |
| Class A Shares | | 2010 | | | 2009 | | | 2008 | | | 2007 | | | 2006 | |
Net Asset Value, Beginning of Period | | $ | 44.30 | | | $ | 46.54 | | | $ | 58.78 | | | $ | 31.90 | | | $ | 24.68 | |
| | | | | |
Income from Investment Operations: | | | | | | | | | | | | | | | | | | | | |
Net investment income (a) | | | 0.17 | | | | 0.34 | | | | 0.22 | | | | 0.26 | | | | 0.26 | |
Net realized and unrealized gain (loss) on investments and foreign currency | | | 7.06 | | | | (2.08 | ) | | | (12.02 | ) | | | 26.86 | | | | 7.41 | |
| | | | | | | | | | | | | | | | | | | | |
Total from investment operations | | | 7.23 | | | | (1.74 | ) | | | (11.80 | ) | | | 27.12 | | | | 7.67 | |
| | | | | |
Less Distributions to Shareholders: | | | | | | | | | | | | | | | | | | | | |
From net investment income | | | (0.22 | ) | | | — | | | | (0.46 | ) | | | (0.24 | ) | | | (0.45 | ) |
From net realized gains | | | — | | | | (0.54 | ) | | | (0.03 | ) | | | — | | | | — | |
| | | | | | | | | | | | | | | | | | | | |
Total distributions to shareholders | | | (0.22 | ) | | | (0.54 | ) | | | (0.49 | ) | | | (0.24 | ) | | | (0.45 | ) |
| | | | | |
Increase from Regulatory Settlements | | | 0.03 | | | | 0.02 | | | | — | | | | — | | | | — | |
| | | | | |
Redemption Fees: | | | | | | | | | | | | | | | | | | | | |
Redemption fees added to paid-in-capital (a) | | | 0.01 | | | | 0.02 | | | | 0.05 | | | | — | (b) | | | — | (b) |
| | | | | |
Net Asset Value, End of Period | | $ | 51.35 | | | $ | 44.30 | | | $ | 46.54 | | | $ | 58.78 | | | $ | 31.90 | |
Total return (c) | | | 16.42 | % | | | (3.30 | )% | | | (20.24 | )% | | | 85.39 | % | | | 31.55 | %(d)(e) |
| | | | | |
Ratios to Average Net Assets/Supplemental Data: | | | | | | | | | | | | | | | | | | | | |
Net expenses before interest expense (f) | | | 1.62 | % | | | 1.69 | % | | | 1.55 | % | | | 1.59 | % | | | 1.73 | % |
Interest expense | | | — | %(g) | | | — | %(g) | | | — | %(g) | | | — | %(g) | | | — | |
Net expenses (f) | | | 1.62 | % | | | 1.69 | % | | | 1.55 | % | | | 1.59 | % | | | 1.73 | % |
Waiver/Reimbursement | | | — | | | | — | | | | — | | | | — | | | | 0.01 | % |
Net investment income (f) | | | 0.33 | % | | | 0.96 | % | | | 0.37 | % | | | 0.61 | % | | | 0.93 | % |
Portfolio turnover rate | | | 23 | % | | | 39 | % | | | 16 | % | | | 36 | % | | | 32 | % |
Net assets, end of period (000s) | | $ | 116,870 | | | $ | 122,314 | | | $ | 154,413 | | | $ | 179,902 | | | $ | 84,492 | |
| (a) | Per share data was calculated using the average shares outstanding during the period. |
| (b) | Rounds to less than $0.01 per share. |
| (c) | Total return at net asset value assuming all distributions reinvested and no initial sales charge or contingent deferred sales charge. |
| (d) | Had the investment advisor and/or any of its affiliates not waived fees or reimbursed a portion of expenses, total return would have been reduced. |
| (e) | Includes a voluntary reimbursement by the investment advisor for a realized investment loss due to a trading error. This reimbursement increased total return and net asset value per share by 0.03% and $0.01, respectively. |
| (f) | The benefits derived from expense reductions had an impact of less than 0.01%. |
| (g) | Rounds to less than 0.01%. |
See Accompanying Notes to Financial Statements.
16
Financial Highlights – Columbia Greater China Fund
Selected data for a share outstanding throughout each period is as follows:
| | | | | | | | | | | | | | | | | | | | |
| | | Year Ended August 31, | |
| Class B Shares | | 2010 | | | 2009 | | | 2008 | | | 2007 | | | 2006 | |
Net Asset Value, Beginning of Period | | $ | 42.77 | | | $ | 45.29 | | | $ | 57.29 | | | $ | 31.14 | | | $ | 24.11 | |
| | | | | |
Income from Investment Operations: | | | | | | | | | | | | | | | | | | | | |
Net investment income (loss) (a) | | | (0.20 | ) | | | 0.07 | | | | (0.23 | ) | | | (0.06 | ) | | | 0.05 | |
Net realized and unrealized gain (loss) on investments and foreign currency | | | 6.81 | | | | (2.09 | ) | | | (11.73 | ) | | | 26.22 | | | | 7.25 | |
| | | | | | | | | | | | | | | | | | | | |
Total from investment operations | | | 6.61 | | | | (2.02 | ) | | | (11.96 | ) | | | 26.16 | | | | 7.30 | |
| | | | | |
Less Distributions to Shareholders: | | | | | | | | | | | | | | | | | | | | |
From net investment income | | | — | | | | — | | | | (0.06 | ) | | | (0.01 | ) | | | (0.27 | ) |
From net realized gains | | | — | | | | (0.54 | ) | | | (0.03 | ) | | | — | | | | — | |
| | | | | | | | | | | | | | | | | | | | |
Total distributions to shareholders | | | — | | | | (0.54 | ) | | | (0.09 | ) | | | (0.01 | ) | | | (0.27 | ) |
| | | | | |
Increase from Regulatory Settlements | | | 0.03 | | | | 0.02 | | | | — | | | | — | | | | — | |
| | | | | |
Redemption Fees: | | | | | | | | | | | | | | | | | | | | |
Redemption fees added to paid-in-capital (a) | | | 0.01 | | | | 0.02 | | | | 0.05 | | | | — | (b) | | | — | (b) |
| | | | | |
Net Asset Value, End of Period | | $ | 49.42 | | | $ | 42.77 | | | $ | 45.29 | | | $ | 57.29 | | | $ | 31.14 | |
Total return (c) | | | 15.55 | % | | | (4.02 | )% | | | (20.83 | )% | | | 84.01 | % | | | 30.57 | %(d)(e) |
| | | | | |
Ratios to Average Net Assets/Supplemental Data: | | | | | | | | | | | | | | | | | | | | |
Net expenses before interest expense (f) | | | 2.37 | % | | | 2.44 | % | | | 2.30 | % | | | 2.34 | % | | | 2.48 | % |
Interest expense | | | — | %(g) | | | — | %(g) | | | — | %(g) | | | — | %(g) | | | — | |
Net expenses (f) | | | 2.37 | % | | | 2.44 | % | | | 2.30 | % | | | 2.34 | % | | | 2.48 | % |
Waiver/Reimbursement | | | — | | | | — | | | | — | | | | — | | | | 0.01 | % |
Net investment income (loss) (f) | | | (0.42 | )% | | | 0.21 | % | | | (0.40 | )% | | | (0.14 | )% | | | 0.19 | % |
Portfolio turnover rate | | | 23 | % | | | 39 | % | | | 16 | % | | | 36 | % | | | 32 | % |
Net assets, end of period (000s) | | $ | 16,718 | | | $ | 17,813 | | | $ | 21,880 | | | $ | 33,502 | | | $ | 17,176 | |
| (a) | Per share data was calculated using the average shares outstanding during the period. |
| (b) | Rounds to less than $0.01 per share. |
| (c) | Total return at net asset value assuming all distributions reinvested and no contingent deferred sales charge. |
| (d) | Had the investment advisor and/or any of its affiliates not waived fees or reimbursed a portion of expenses, total return would have been reduced. |
| (e) | Includes a voluntary reimbursement by the investment advisor for a realized investment loss due to a trading error. This reimbursement increased total return and net asset value per share by 0.03% and $0.01, respectively. |
| (f) | The benefits derived from expense reductions had an impact of less than 0.01%. |
| (g) | Rounds to less than 0.01%. |
See Accompanying Notes to Financial Statements.
17
Financial Highlights – Columbia Greater China Fund
Selected data for a share outstanding throughout each period is as follows:
| | | | | | | | | | | | | | | | | | | | |
| | | Year Ended August 31, | |
| Class C Shares | | 2010 | | | 2009 | | | 2008 | | | 2007 | | | 2006 | |
Net Asset Value, Beginning of Period | | $ | 43.36 | | | $ | 45.89 | | | $ | 58.05 | | | $ | 31.56 | | | $ | 24.43 | |
| | | | | |
Income from Investment Operations: | | | | | | | | | | | | | | | | | | | | |
Net investment income (loss) (a) | | | (0.21 | ) | | | 0.09 | | | | (0.22 | ) | | | (0.07 | ) | | | 0.05 | |
Net realized and unrealized gain (loss) on investments and foreign currency | | | 6.91 | | | | (2.12 | ) | | | (11.90 | ) | | | 26.57 | | | | 7.35 | |
| | | | | | | | | | | | | | | | | | | | |
Total from investment operations | | | 6.70 | | | | (2.03 | ) | | | (12.12 | ) | | | 26.50 | | | | 7.40 | |
| | | | | |
Less Distributions to Shareholders: | | | | | | | | | | | | | | | | | | | | |
From net investment income | | | — | | | | — | | | | (0.06 | ) | | | (0.01 | ) | | | (0.27 | ) |
From net realized gains | | | — | | | | (0.54 | ) | | | (0.03 | ) | | | — | | | | — | |
| | | | | | | | | | | | | | | | | | | | |
Total distributions to shareholders | | | — | | | | (0.54 | ) | | | (0.09 | ) | | | (0.01 | ) | | | (0.27 | ) |
| | | | | |
Increase from Regulatory Settlements | | | 0.03 | | | | 0.02 | | | | — | | | | — | | | | — | |
| | | | | |
Redemption Fees: | | | | | | | | | | | | | | | | | | | | |
Redemption fees added to paid-in-capital (a) | | | 0.01 | | | | 0.02 | | | | 0.05 | | | | — | (b) | | | — | (b) |
| | | | | |
Net Asset Value, End of Period | | $ | 50.10 | | | $ | 43.36 | | | $ | 45.89 | | | $ | 58.05 | | | $ | 31.56 | |
Total return (c) | | | 15.54 | % | | | (3.99 | )% | | | (20.84 | )% | | | 83.97 | % | | | 30.58 | %(d)(e) |
| | | | | |
Ratios to Average Net Assets/Supplemental Data: | | | | | | | | | | | | | | | | | | | | |
Net expenses before interest expense (f) | | | 2.37 | % | | | 2.44 | % | | | 2.30 | % | | | 2.34 | % | | | 2.48 | % |
Interest expense | | | — | %(g) | | | — | %(g) | | | — | %(g) | | | — | %(g) | | | — | |
Net expenses (f) | | | 2.37 | % | | | 2.44 | % | | | 2.30 | % | | | 2.34 | % | | | 2.48 | % |
Waiver/Reimbursement | | | — | | | | — | | | | — | | | | — | | | | 0.01 | % |
Net investment income (loss) (f) | | | (0.43 | )% | | | 0.24 | % | | | (0.38 | )% | | | (0.17 | )% | | | 0.20 | % |
Portfolio turnover rate | | | 23 | % | | | 39 | % | | | 16 | % | | | 36 | % | | | 32 | % |
Net assets, end of period (000s) | | $ | 36,371 | | | $ | 36,395 | | | $ | 39,620 | | | $ | 51,938 | | | $ | 22,229 | |
| (a) | Per share data was calculated using the average shares outstanding during the period. |
| (b) | Rounds to less than $0.01 per share. |
| (c) | Total return at net asset value assuming all distributions reinvested and no contingent deferred sales charge. |
| (d) | Had the investment advisor and/or any of its affiliates not waived fees or reimbursed a portion of expenses, total return would have been reduced. |
| (e) | Includes a voluntary reimbursement by the investment advisor for a realized investment loss due to a trading error. This reimbursement increased total return and net asset value per share by 0.03% and $0.01, respectively. |
| (f) | The benefits derived from expense reductions had an impact of less than 0.01%. |
| (g) | Rounds to less than 0.01%. |
See Accompanying Notes to Financial Statements.
18
Financial Highlights – Columbia Greater China Fund
Selected data for a share outstanding throughout each period is as follows:
| | | | | | | | | | | | | | | | | | | | |
| | | Year Ended August 31, | |
| Class Z Shares | | 2010 | | | 2009 | | | 2008 | | | 2007 | | | 2006 | |
Net Asset Value, Beginning of Period | | $ | 46.20 | | | $ | 48.38 | | | $ | 61.05 | | | $ | 33.10 | | | $ | 25.59 | |
| | | | | |
Income from Investment Operations: | | | | | | | | | | | | | | | | | | | | |
Net investment income (a) | | | 0.30 | | | | 0.44 | | | | 0.38 | | | | 0.37 | | | | 0.37 | |
Net realized and unrealized gain (loss) on investments and foreign currency | | | 7.37 | | | | (2.12 | ) | | | (12.47 | ) | | | 27.90 | | | | 7.65 | |
| | | | | | | | | | | | | | | | | | | | |
Total from investment operations | | | 7.67 | | | | (1.68 | ) | | | (12.09 | ) | | | 28.27 | | | | 8.02 | |
| | | | | |
Less Distributions to Shareholders: | | | | | | | | | | | | | | | | | | | | |
From net investment income | | | (0.31 | ) | | | — | | | | (0.60 | ) | | | (0.32 | ) | | | (0.51 | ) |
From net realized gains | | | — | | | | (0.54 | ) | | | (0.03 | ) | | | — | | | | — | |
| | | | | | | | | | | | | | | | | | | | |
Total distributions to shareholders | | | (0.31 | ) | | | (0.54 | ) | | | (0.63 | ) | | | (0.32 | ) | | | (0.51 | ) |
| | | | | |
Increase from Regulatory Settlements | | | 0.03 | | | | 0.02 | | | | — | | | | — | | | | — | |
| | | | | |
Redemption Fees: | | | | | | | | | | | | | | | | | | | | |
Redemption fees added to paid-in-capital (a) | | | 0.01 | | | | 0.02 | | | | 0.05 | | | | — | (b) | | | — | (b) |
| | | | | |
Net Asset Value, End of Period | | $ | 53.60 | | | $ | 46.20 | | | $ | 48.38 | | | $ | 61.05 | | | $ | 33.10 | |
Total return (c) | | | 16.71 | % | | | (3.05 | )% | | | (20.04 | )% | | | 85.88 | % | | | 31.86 | %(d)(e) |
| | | | | |
Ratios to Average Net Assets/Supplemental Data: | | | | | | | | | | | | | | | | | | | | |
Net expenses before interest expense (f) | | | 1.37 | % | | | 1.44 | % | | | 1.30 | % | | | 1.34 | % | | | 1.48 | % |
Interest expense | | | — | %(g) | | | — | %(g) | | | — | %(g) | | | — | %(g) | | | — | |
Net expenses (f) | | | 1.37 | % | | | 1.44 | % | | | 1.30 | % | | | 1.34 | % | | | 1.48 | % |
Waiver/Reimbursement | | | — | | | | — | | | | — | | | | — | | | | 0.01 | % |
Net investment income (f) | | | 0.58 | % | | | 1.17 | % | | | 0.62 | % | | | 0.82 | % | | | 1.25 | % |
Portfolio turnover rate | | | 23 | % | | | 39 | % | | | 16 | % | | | 36 | % | | | 32 | % |
Net assets, end of period (000s) | | $ | 55,021 | | | $ | 47,266 | | | $ | 43,170 | | | $ | 52,903 | | | $ | 19,821 | |
| (a) | Per share data was calculated using the average shares outstanding during the period. |
| (b) | Rounds to less than $0.01 per share. |
| (c) | Total return at net asset value assuming all distributions reinvested. |
| (d) | Had the investment advisor and/or any of its affiliates not waived fees or reimbursed a portion of expenses, total return would have been reduced. |
| (e) | Includes a voluntary reimbursement by the investment advisor for a realized investment loss due to a trading error. This reimbursement increased total return and net asset value per share by 0.03% and $0.01, respectively. |
| (f) | The benefits derived from expense reductions had an impact of less than 0.01%. |
| (g) | Rounds to less than 0.01%. |
See Accompanying Notes to Financial Statements.
19
Notes to Financial Statements – Columbia Greater China Fund
August 31, 2010
Note 1. Organization
Columbia Greater China Fund (the “Fund”), a series of Columbia Funds Series Trust I (the “Trust”), is a non-diversified fund. The Trust is registered under the Investment Company Act of 1940, as amended (the “1940 Act”), as an open-end management investment company organized as a Massachusetts business trust.
Investment Objective
The Fund seeks long-term capital appreciation.
Fund Shares
The Trust may issue an unlimited number of shares, and the Fund offers four classes of shares: Class A, Class B, Class C and Class Z. Each share class has its own expense structure and sales charges, as applicable. The Fund no longer accepts investments from new or existing investors in the Fund’s Class B shares, except in connection with the reinvestment of any dividend and/or capital gain distributions in Class B shares of the Fund and exchanges by existing Class B shareholders of the other Columbia Funds.
Class A shares are subject to a maximum front-end sales charge of 5.75% based on the amount of initial investment. Class A shares purchased without an initial sales charge in accounts aggregating $1 million to $50 million at the time of purchase are subject to a 1.00% contingent deferred sales charge (“CDSC”) if the shares are sold within one year after purchase. Class B shares are subject to a maximum CDSC of 5.00% based upon the holding period after purchase. Class B shares will convert to Class A shares eight years after purchase. Class C shares are subject to a 1.00% CDSC on shares sold within one year after purchase. Class Z shares are offered continuously at net asset value. There are certain restrictions on the purchase of Class Z shares, as described in the Fund’s prospectus.
Note 2. Significant Accounting Policies
The preparation of financial statements in accordance with accounting principles generally accepted in the United States of America (“GAAP”) requires management to make certain estimates and assumptions that affect the reported amounts of assets and liabilities, the disclosure of contingent assets and liabilities at the date of the financial statements and the reported amounts of revenue and expenses during the reporting period. Actual results could differ from those estimates.
Management has evaluated the events and transactions that have occurred through the date the financial statements were issued and noted no items requiring adjustment of the financial statements or additional disclosures.
The following is a summary of significant accounting policies consistently followed by the Fund in the preparation of its financial statements.
Security Valuation
Equity securities are valued at the last sale price on the principal exchange on which they trade, except for securities traded on the NASDAQ, which are valued at the NASDAQ official close price. Unlisted securities or listed securities for which there were no sales during the day are valued at the closing bid price on such exchanges or over-the-counter markets.
Short-term investments maturing in 60 days or less are valued at amortized cost, which approximates market value.
Foreign securities are generally valued at the last sale price on the foreign exchange or market on which they trade. If any foreign share prices are not readily available as a result of limited share activity, the securities are valued at the last sale price of the local shares in the principal market in which such securities are normally traded.
Generally, trading in foreign securities is substantially completed each day at various times prior to the close of the New York Stock Exchange (“NYSE”). The values of such securities used in computing the net asset value of the Fund’s shares are determined as of such times. Foreign currency exchange rates are generally determined at 4:00 p.m. Eastern (U.S.) time. Occasionally, events affecting the values of such foreign securities may occur between the times at which they are determined and the close of the customary trading session of the NYSE, which would not be reflected in the computation of the Fund’s net asset value. If events materially affecting the values of such foreign securities occur and it is determined that market quotations are not reliable, then these foreign securities will be valued at their fair value using procedures approved by the Board of Trustees.
The Fund may use a systematic fair valuation model provided by an independent third party to value securities principally traded in foreign markets in order to adjust for possible stale pricing that may occur between the close of the foreign exchanges and the time for valuation.
20
Columbia Greater China Fund, August 31, 2010
Investments for which market quotations are not readily available, or that have quotations which management believes are not reliable, are valued at fair value as determined in good faith under consistently applied procedures established by and under the general supervision of the Board of Trustees. If a security is valued at fair value, such value is likely to be different from the last quoted market price for the security. The determination of fair value often requires significant judgment. To determine fair value, management may use assumptions including but not limited to future cash flows and estimated risk premiums. Multiple inputs from various sources may be used to determine value.
GAAP establishes a hierarchy that prioritizes the inputs to valuation techniques used to measure fair value giving the highest priority to unadjusted quoted prices in active markets for identical securities (level 1 measurements) and the lowest priority to unobservable inputs (level 3 measurements) when market prices are not readily available or reliable. The three levels of the fair value hierarchy are described below:
| n | | Level 1 — quoted prices in active markets for identical securities |
| n | | Level 2 — prices determined using other significant observable inputs (including quoted prices for similar securities, interest rates, prepayment speeds, credit risk and others) |
| n | | Level 3 — prices determined using significant unobservable inputs. In situations where quoted prices or observable inputs are unavailable or less reliable, unobservable inputs may be used. Unobservable inputs may include management’s own assumptions about the factors market participants would use in pricing an investment. |
The inputs or methodology used for valuing securities are not necessarily an indication of the risk associated with investing in those securities.
On January 21, 2010, the Financial Accounting Standards Board issued an Accounting Standards Update (the “amendment”), Fair Value Measurements and Disclosures (Topic 820): Improving Disclosures about Fair Value Measurements, which provides guidance on how investment assets and liabilities are to be valued and disclosed. Specifically, the amendment requires reporting entities to disclose the inputs and valuation techniques used to measure fair value for both recurring and nonrecurring fair value measurements for Level 2 and Level 3 positions. The amendment also requires that transfers between all levels (including Level 1 and Level 2) be disclosed on a gross basis (i.e., transfers out must be disclosed separately from transfers in), and requires disclosure of the reason(s) for significant transfers. Additionally, purchases, sales, issuances and settlements must be disclosed on a gross basis in the Level 3 roll forward. The effective date of the amendment is for interim and annual periods beginning after December 15, 2009; except for the requirement to provide the Level 3 activity for purchases, sales, issuances and settlements on a gross basis, which will be effective for interim and annual periods beginning after December 15, 2010. At this time, management is evaluating the implications of the amendment and the impact to the financial statements.
Security Transactions
Security transactions are accounted for on the trade date. Cost is determined and gains (losses) are based upon the specific identification method for both financial statement and federal income tax purposes.
Repurchase Agreements
The Fund may engage in repurchase agreement transactions with institutions that management has determined are creditworthy. The Fund, through its custodian, receives delivery of the underlying securities collateralizing a repurchase agreement. Management is responsible for determining that the collateral is at least equal, at all times, to the value of the repurchase obligation including interest. A repurchase agreement transaction involves certain risks in the event of default or insolvency of the counterparty. These risks include possible delays in or restrictions on the Fund’s ability to dispose of the underlying securities and a possible decline in the value of the underlying securities during the period while the Fund seeks to assert its rights.
Foreign Currency Transactions and Translations
The values of all assets and liabilities quoted in foreign currencies are translated into U.S. dollars at that day’s exchange rates. Net realized and unrealized gains (losses) on foreign currency transactions and translations include gains (losses) arising from the fluctuation in exchange rates between trade and settlement dates on securities transactions, gains
21
Columbia Greater China Fund, August 31, 2010
(losses) arising from the disposition of foreign currency and currency gains (losses) between the accrual and payment dates on dividends, interest income and foreign withholding taxes.
For financial statement purposes, the Fund does not distinguish that portion of gains (losses) on investments which is due to changes in foreign exchange rates from that which is due to changes in market prices of the investments. Such fluctuations are included with the net realized and unrealized gains (losses) on investments on the Statement of Operations.
Income Recognition
Interest income is recorded on the accrual basis.
Corporate actions and dividend income are recorded on the ex-date except for certain foreign securities which are recorded as soon after the ex-date as the Fund becomes aware of such, net of any non-reclaimable tax withholdings.
Expenses
General expenses of the Trust are allocated to the Fund and other series of the Trust based upon relative net assets or other expense allocation methodologies determined by the nature of the expense. Expenses directly attributable to the Fund are charged to the Fund.
Determination of Class Net Asset Value
All income, expenses (other than class-specific expenses, as shown on the Statement of Operations) and realized and unrealized gains (losses) are allocated to each class of the Fund on a daily basis, based on the relative net assets of each class, for purposes of determining the net asset value of each class.
Federal Income Tax Status
The Fund intends to qualify each year as a “regulated investment company” under Subchapter M of the Internal Revenue Code, as amended, and will distribute substantially all of its tax exempt or taxable income, if any, for its tax year, and as such will not be subject to federal income taxes. In addition, the Fund intends to distribute in each calendar year substantially all of its net investment income, capital gains and certain other amounts, if any, such that the Fund should not be subject to federal excise tax. Therefore, no federal income or excise tax provision is recorded.
Foreign Tax
The Fund may be subject to foreign taxes on income, gains on investments or currency repatriation, a portion of which may be recoverable. The Fund will accrue such taxes and recoveries as applicable, based upon its current interpretation of tax rules and regulations that exist in the markets in which it invests.
Realized gains in certain countries may be subject to foreign taxes at the fund level, at rates ranging from approximately 10% to 15%. The Fund accrues for such foreign taxes on net realized and unrealized gains at the appropriate rate for each jurisdiction.
Distributions to Shareholders
Distributions from net investment income, if any, are declared and paid annually. Net realized capital gains, if any, are distributed at least annually. Income distributions and capital gain distributions are determined in accordance with federal income tax regulations which may differ from GAAP.
Indemnification
In the normal course of business, the Fund enters into contracts that contain a variety of representations and warranties and which provide general indemnities. The Fund’s maximum exposure under these arrangements is unknown because this would involve future claims against the Fund. Also, under the Trust’s organizational documents and by contract, the Trustees and officers of the Trust are indemnified against certain liabilities that may arise out of actions relating to their duties to the Trust. However, based on experience, the Fund expects the risk of loss due to these representations, warranties and indemnities to be minimal.
Note 3. Federal Tax Information
The timing and character of income and capital gain distributions are determined in accordance with income tax regulations, which may differ from GAAP. Reclassifications are made to the Fund’s capital accounts for permanent tax differences to reflect income and gains available for distribution (or available capital loss carryforwards) under income tax regulations.
For the year ended August 31, 2010, permanent book and tax basis differences resulting primarily from differing treatments for foreign currency transactions and proceeds
22
Columbia Greater China Fund, August 31, 2010
received from litigation settlements were identified and reclassified among the components of the Fund’s net assets as follows:
| | | | |
| | | |
Undistributed Net Investment
Income | | Accumulated Net Realized
Gain | | Paid-In Capital |
| $166,607 | | $(18,075) | | $(148,532) |
Net investment income and net realized gains (losses), as disclosed on the Statement of Operations, and net assets were not affected by this reclassification.
The tax character of distributions paid during the years ended August 31, 2010 and August 31, 2009 was as follows:
| | | | | | | | |
| | | | | | | |
| | | August 31, 2010 | | | August 31, 2009 | |
Ordinary Income* | | $ | 930,454 | | | $ | 16,410 | |
Long-Term Capital Gains | | | — | | | | 2,519,791 | |
| * | For tax purposes short-term capital gain distributions, if any, are considered ordinary income distributions. |
As of August 31, 2010, the components of distributable earnings on a tax basis were as follows:
| | | | |
| | | | | |
Undistributed
Ordinary Income | | Undistributed Long-Term Capital Gains | | Net Unrealized Appreciation |
| $635,263 | | $2,411,928 | | $94,630,774 |
Unrealized appreciation and depreciation at August 31, 2010, based on cost of investments for federal income tax purposes and excluding any unrealized appreciation and depreciation from changes in the value of other assets and liabilities resulting from changes in exchange rates, were:
| | | | |
| | |
Unrealized appreciation | | $ | 96,383,912 | |
Unrealized depreciation | | | (1,753,138 | ) |
| | | | |
Net unrealized appreciation | | $ | 94,630,774 | |
Capital loss carryforwards of $11,181,842 were utilized during the year ended August 31, 2010.
Management is required to determine whether a tax position of the Fund is more likely than not to be sustained upon examination by the applicable taxing authority, including resolution of any related appeals or litigation processes, based on the technical merits of the position. The tax benefit to be recognized by the Fund is measured as the largest amount of benefit that is greater than fifty percent likely of being realized upon ultimate settlement. Management is not aware of any tax positions for which it is reasonably possible that the total amounts of unrecognized tax benefits will significantly change in the next twelve months. However, management’s conclusions may be subject to review and adjustment at a later date based on factors including, but not limited to, new tax laws, regulations, and administrative interpretations (including relevant court decisions). The Fund’s federal tax returns for the prior three fiscal years remain subject to examination by the Internal Revenue Service.
Note 4. Fees and Compensation Paid to Affiliates
Investment Advisory Fee
After the close of business on April 30, 2010, Ameriprise Financial, Inc. (“Ameriprise Financial”) acquired a portion of the asset management business of Columbia Management Group, LLC (the “Transaction”), including the business of managing the Fund. In connection with the closing of the Transaction (the “Closing”), RiverSource Investments, LLC, a wholly owned subsidiary of Ameriprise Financial, became the investment advisor of the Fund and subsequently changed its name to Columbia Management Investment Advisers, LLC (the “New Advisor”). The New Advisor receives a monthly investment advisory fee based on the Fund’s average daily net assets at the following annual rates:
| | | | |
| | |
| Average Daily Net Assets | | Annual Fee Rate | |
First $1 billion | | | 0.95 | % |
$1 billion to $1.5 billion | | | 0.87 | % |
$1.5 billion to $3 billion | | | 0.82 | % |
$3 billion to $6 billion | | | 0.77 | % |
Over $6 billion | | | 0.72 | % |
Prior to the Closing, Columbia Management Advisors, LLC (“Columbia”), an indirect, wholly owned subsidiary of Bank of America Corporation (“BOA”), provided investment advisory, administrative and other services to the Fund under the same fee structure.
For the year ended August 31, 2010, the Fund’s effective investment advisory fee rate was 0.95% of the Fund’s average daily net assets.
23
Columbia Greater China Fund, August 31, 2010
Administration Fee
Effective upon the Closing, the New Advisor became the administrator of the Fund under a new Administrative Services Agreement (the “Administrative Agreement”). Under the Administrative Agreement, the New Advisor provides administrative and other services to the Fund, including services previously performed under the Pricing and Bookkeeping Oversight and Services Agreement discussed below. The New Advisor does not receive a fee for its services under the Administrative Agreement. Prior to the Closing, Columbia provided administrative services to the Fund as discussed in the Investment Advisory Fee note above.
Pricing and Bookkeeping Fees
Prior to the Closing, the Fund entered into a Financial Reporting Services Agreement (the “Financial Reporting Services Agreement”) with State Street Bank and Trust Company (“State Street”) and Columbia pursuant to which State Street provides financial reporting services to the Fund. The Fund also entered into an Accounting Services Agreement (collectively with the Financial Reporting Services Agreement, the “State Street Agreements”) with State Street and Columbia pursuant to which State Street provides accounting services to the Fund. Upon the Closing, Columbia assigned and delegated its rights and obligations under the State Street Agreements to the New Advisor. Under the State Street Agreements, the Fund pays State Street an annual fee of $38,000 paid monthly plus an additional monthly fee based on an annualized percentage rate of average daily net assets of the Fund for the month. The aggregate fee will not exceed $140,000 per year (exclusive of out-of-pocket expenses and charges). The Fund also reimburses State Street for certain out-of-pocket expenses and charges.
Also prior to the Closing, the Fund entered into a Pricing and Bookkeeping Oversight and Services Agreement (the “Services Agreement”) with Columbia. Under the Services Agreement, Columbia provided services related to Fund expenses and the requirements of the Sarbanes-Oxley Act of 2002, and provided oversight of the accounting and financial reporting services provided by State Street. Under the Services Agreement, the Fund reimbursed Columbia for out-of-pocket expenses and charges, including fees payable to third parties, such as for pricing the Fund’s portfolio securities, incurred by Columbia in the performance of services under the Services Agreement. The Services Agreement was terminated upon the Closing. These services are now provided under the Administrative Agreement discussed above.
Transfer Agent Fee
In connection with the Closing, RiverSource Service Corporation, a wholly owned subsidiary of Ameriprise Financial, became the transfer agent of the Fund and subsequently changed its name to Columbia Management Investment Services Corp. (the “New Transfer Agent”). The New Transfer Agent has contracted with Boston Financial Data Services (“BFDS”) to serve as sub-transfer agent. The New Transfer Agent receives a fee for its services, paid monthly, at the annual rate of $22.36 per account plus reimbursement of certain sub-transfer agent fees paid by the New Transfer Agent (exclusive of BFDS fees), calculated based on assets held in omnibus accounts and intended to recover the cost of payments to other parties (including affiliates of BOA) for services to those accounts. The New Transfer Agent pays the fees of BFDS for services as sub-transfer agent and is not entitled to reimbursement for such fees from the Fund.
The New Transfer Agent may also retain, as additional compensation for its services, fees for wire, telephone and redemption orders, Individual Retirement Account (“IRA”) trustee agent fees and account transcript fees due to the New Transfer Agent from shareholders of the Fund and credits (net of bank charges) earned with respect to balances in accounts the New Transfer Agent maintains in connection with its services to the Fund. The New Transfer Agent also receives reimbursement for certain out-of-pocket expenses.
Prior to the Closing, Columbia Management Services, Inc. (the “Previous Transfer Agent”), an affiliate of Columbia and an indirect, wholly owned subsidiary of BOA, provided shareholder services to the Fund and contracted with BFDS to serve as sub-transfer agent, under the same fee structure. Prior to November 1, 2009, the annual rate was $17.34 per open account.
An annual minimum account balance fee of $20 may apply to certain accounts with a value below the Fund’s initial minimum investment requirements to reduce the impact of small accounts on transfer agent fees. These minimum account balance fees are recorded as part of expense reductions on the Statement of Operations. For the year
24
Columbia Greater China Fund, August 31, 2010
ended August 31, 2010, no minimum account balance fees were charged by the Fund.
Underwriting Discounts, Service and Distribution Fees
In connection with the Closing, RiverSource Fund Distributors, Inc., an indirect wholly owned subsidiary of Ameriprise Financial, became the distributor of the Fund and subsequently changed its name to Columbia Management Investment Distributors, Inc. (the “New Distributor”).
For the year ended August 31, 2010, initial sales charges paid by shareholders on the purchase of Class A shares amounted to $43,450 and net CDSC fees paid by shareholders on certain redemptions of Class A, Class B and Class C shares amounted to $104, $33,525 and $15,024, respectively.
The Fund has adopted shareholder servicing and distribution plans pursuant to Rule 12b-1 under the 1940 Act (the “Plans”) which require the payment of a monthly service fee to the New Distributor at the maximum annual rate of 0.25% of the average daily net assets attributable to Class A, Class B and Class C shares of the Fund. The Plans also require the payment of a monthly distribution fee to the New Distributor at the maximum annual rate of 0.75% of the average daily net assets attributable to Class B and Class C shares only.
The CDSC and the distribution fees received from the Plans are used principally as repayment to the New Distributor for amounts paid by the New Distributor to dealers who sold such shares.
Prior to the Closing, Columbia Management Distributors, Inc., an affiliate of Columbia and an indirect, wholly owned subsidiary of BOA, was the principal underwriter of the Fund’s shares. There were no changes to the underwriting discount structure of the Fund or the service or distribution fee rates paid by the Fund as a result of the Transaction.
Expense Limits and Fee Waivers
Effective May 1, 2010, the New Advisor has voluntarily agreed to reimburse a portion of the Fund’s expenses so that the Fund’s ordinary operating expenses (excluding any distribution and service fees, brokerage commissions, interest, taxes and extraordinary expenses, but including custodian charges relating to overdrafts, if any), after giving effect to any balance credits from the Fund’s custodian, do not exceed 1.40% of the Fund’s average daily net assets on an annualized basis. This arrangement may be modified or terminated by the New Advisor at any time.
Prior to May 1, 2010, Columbia voluntarily agreed to reimburse a portion of the Fund’s expenses so that the Fund’s ordinary operating expenses (excluding any distribution and service fees, brokerage commissions, interest, taxes and extraordinary expenses, but including custodian charges relating to overdrafts, if any) after giving effect to any balance credits from the Fund’s custodian, did not exceed 1.40% of the Fund’s average daily net assets on an annualized basis.
Fees Paid to Officers and Trustees
In connection with the Closing, all officers of the Fund are employees of the New Advisor or its affiliates and, with the exception of the Fund’s Chief Compliance Officer, receive no compensation from the Fund. The Board of Trustees has appointed a Chief Compliance Officer to the Fund in accordance with federal securities regulations. The Fund, along with other affiliated funds, pays its pro-rata share of the expenses associated with the Chief Compliance Officer. The Fund’s expenses for the Chief Compliance Officer will not exceed $15,000 per year. Prior to the Closing, the Fund paid its pro-rata share of the expenses for the Chief Compliance Officer under the same fee structure.
Trustees are compensated for their services to the Fund, as set forth on the Statement of Operations. The Trust’s eligible Trustees may participate in a deferred compensation plan which may be terminated at any time. Obligations of the plan will be paid solely out of the Fund’s assets.
Note 5. Custody Credits
The Fund has an agreement with its custodian bank under which custody fees may be reduced by balance credits. These credits are recorded as part of expense reductions on the Statement of Operations. The Fund could have invested a portion of the assets utilized in connection with the expense offset arrangement in an income-producing asset if it had not entered into such an agreement. For the year ended August 31, 2010, these custody credits reduced total expenses by less than $1 for the Fund.
Note 6. Portfolio Information
For the year ended August 31, 2010, the cost of purchases and proceeds from sales of securities, excluding short-term obligations, for the Fund were $53,496,516 and $86,221,420, respectively.
25
Columbia Greater China Fund, August 31, 2010
Note 7. Redemption Fees
Effective March 1, 2010, the Fund no longer assesses a 2.00% redemption fee on the proceeds from Fund shares that are redeemed within 60 days of purchase. The redemption fee was designed to offset brokerage commissions and other costs associated with short term trading of fund shares. The redemption fees, which were retained by the Fund, were accounted for as an addition to paid-in capital and were allocated to each class based on the relative net assets at the time of the redemption. For the year ended August 31, 2010, the redemption fees for Class A, Class B, Class C and Class Z of the Fund amounted to $20,024, $2,840, $6,045 and $7,811, respectively.
Note 8. Regulatory Settlements
During the years ended August 31, 2010 and August 31, 2009, the Fund received payments totaling $148,533 and $103,255, respectively, relating to certain regulatory settlements with third parties that the Fund had participated in during the respective periods. The payments have been included in “Increase from regulatory settlements” on the Statement of Changes in Net Assets.
Note 9. Line of Credit
The Fund and other affiliated funds participate in a $280,000,000 committed, unsecured revolving line of credit provided by State Street. The maximum amount that may be borrowed by any fund is limited to the lesser of $200,000,000 and the Fund’s borrowing limit set forth in the Fund’s registration statement. Borrowings are available for short-term liquidity or temporary or emergency purposes.
Effective October 15, 2009, interest is charged to each participating fund based on the fund’s borrowings at a rate per annum equal to the greater of the Federal Funds Rate plus 1.25% or the overnight LIBOR Rate plus 1.25%. In addition, a commitment fee of 0.15% per annum is accrued and apportioned among the participating funds pro rata based on their relative net assets.
Prior to October 15, 2009, interest was charged to each participating fund based on the fund’s borrowings at a rate per annum equal to the greater of the Federal Funds Rate plus 0.50% or the overnight LIBOR Rate plus 0.50%. In addition, an annual operations agency fee of $20,000, an amendment fee of 0.02% and a commitment fee of 0.12% per annum were accrued and apportioned among the participating funds pro rata based on their relative net assets.
For the year ended August 31, 2010, the average daily loan balance outstanding on days where borrowing existed was $1,346,154 at a weighted average interest rate of 1.47%
Note 10. Shareholder Concentration
As of August 31, 2010, one shareholder account owned 12.3% of the outstanding shares of the Fund. Purchase and redemption activity of this account may have a significant effect on the operations of the Fund.
Note 11. Significant Risks and Contingencies
Sector Focus Risk
The Fund may focus its investments in certain sectors, subjecting it to greater risk than a fund that is less focused.
Non-Diversification Risk
As a non-diversified mutual fund, the Fund is permitted to invest a greater percentage of its total assets in the securities of fewer issuers than a diversified fund. The Fund may, therefore, have a greater risk of loss from a few issuers than a similar fund that invests more broadly.
Foreign Securities Risk
There are certain additional risks involved when investing in foreign securities. These risks may involve foreign currency exchange rate fluctuations, adverse political and economic developments and the possible prevention of currency exchange or other foreign governmental laws or restrictions. In addition, the liquidity of foreign securities may be more limited than that of domestic securities.
Investments in emerging market countries are subject to additional risk. The risk of foreign investments is typically increased in less developed countries. These countries are also more likely to experience high levels of inflation, deflation or currency devaluation which could hurt their economies and securities markets.
Geographic Concentration Risk
Because the Fund’s investments are concentrated in the Greater China region, events within the region will have a greater effect on the Fund than if the Fund were more geographically diversified. In addition, events in any one country within the region may impact the other countries or the region as a whole. Markets in the region can experience significant volatility due to social, regulatory and political uncertainties.
26
Columbia Greater China Fund, August 31, 2010
Information Regarding Pending and Settled Legal Proceedings
In June 2004, an action captioned John E. Gallus et al. v. American Express Financial Corp. and American Express Financial Advisors Inc. was filed in the United States District Court for the District of Arizona. The plaintiffs allege that they are investors in several American Express Company (now known as legacy RiverSource) mutual funds and they purport to bring the action derivatively on behalf of those funds under the Investment Company Act of 1940. The plaintiffs allege that fees allegedly paid to the defendants by the funds for investment advisory and administrative services are excessive. The plaintiffs seek remedies including restitution and rescission of investment advisory and distribution agreements. The plaintiffs voluntarily agreed to transfer this case to the United States District Court for the District of Minnesota (the District Court). In response to defendants’ motion to dismiss the complaint, the District Court dismissed one of plaintiffs’ four claims and granted plaintiffs limited discovery. Defendants moved for summary judgment in April 2007. Summary judgment was granted in the defendants’ favor on July 9, 2007. The plaintiffs filed a notice of appeal with the Eighth Circuit Court of Appeals (the Eighth Circuit) on August 8, 2007. On April 8, 2009, the Eighth Circuit reversed summary judgment and remanded to the District Court for further proceedings. On August 6, 2009, defendants filed a writ of certiorari with the U.S. Supreme Court (the Supreme Court), asking the Supreme Court to stay the District Court proceedings while the Supreme Court considers and rules in a case captioned Jones v. Harris Associates, which involves issues of law similar to those presented in the Gallus case. On March 30, 2010, the Supreme Court issued its ruling in Jones v. Harris Associates, and on April 5, 2010, the Supreme Court vacated the Eighth Circuit’s decision in the Gallus case and remanded the case to the Eighth Circuit for further consideration in light of the Supreme Court’s decision in Jones v. Harris Associates. On June 4, 2010, the Eighth Circuit remanded the Gallus case to the District Court for further consideration in light of the Supreme Court’s decision in Jones v. Harris Associates.
In December 2005, without admitting or denying the allegations, American Express Financial Corporation (AEFC, which is now known as Ameriprise Financial, Inc. (Ameriprise Financial)), entered into settlement agreements with the Securities and Exchange Commission (SEC) and Minnesota Department of Commerce (MDOC) related to market timing activities. As a result, AEFC was censured and ordered to cease and desist from committing or causing any violations of certain provisions of the Investment Advisers Act of 1940, the Investment Company Act of 1940, and various Minnesota laws. AEFC agreed to pay disgorgement of $10 million and civil money penalties of $7 million. AEFC also agreed to retain an independent distribution consultant to assist in developing a plan for distribution of all disgorgement and civil penalties ordered by the SEC in accordance with various undertakings detailed at http://www.sec.gov/litigation/admin/ia-2451.pdf. Ameriprise Financial and its affiliates have cooperated with the SEC and the MDOC in these legal proceedings, and have made regular reports to the funds’ Boards of Directors/Trustees.
Ameriprise Financial and certain of its affiliates have historically been involved in a number of legal, arbitration and regulatory proceedings, including routine litigation, class actions, and governmental actions, concerning matters arising in connection with the conduct of their business activities. Ameriprise Financial believes that the Funds are not currently the subject of, and that neither Ameriprise Financial nor any of its affiliates are the subject of, any pending legal, arbitration or regulatory proceedings that are likely to have a material adverse effect on the Funds or the ability of Ameriprise Financial or its affiliates to perform under their contracts with the Funds. Ameriprise Financial is required to make 10-Q, 10-K and, as necessary, 8-K filings with the Securities and Exchange Commission on legal and regulatory matters that relate to Ameriprise Financial and its affiliates. Copies of these filings may be obtained by accessing the SEC website at www.sec.gov.
There can be no assurance that these matters, or the adverse publicity associated with them, will not result in increased fund redemptions, reduced sale of fund shares or other adverse consequences to the Funds. Further, although we believe proceedings are not likely to have a material adverse effect on the Funds or the ability of Ameriprise Financial or its affiliates to perform under their contracts with the Funds, these proceedings are subject to uncertainties and, as such, we are unable to estimate the possible loss or range of loss that may result. An adverse outcome in one or more of these proceedings could result in adverse judgments, settlements, fines, penalties or other relief that could have a material adverse effect on the consolidated financial condition or results of operations of Ameriprise Financial.
27
Report of Independent Registered Public Accounting Firm
To the Trustees of the Columbia Funds Series Trust I and the Shareholders of Columbia Greater China Fund
In our opinion, the accompanying statement of assets and liabilities, including the investment portfolio and the related statements of operations and of changes in net assets and the financial highlights present fairly, in all material respects, the financial position of Columbia Greater China Fund (the “Fund”) (a series of Columbia Funds Series Trust I), at August 31, 2010, the results of its operations for the year then ended, the changes in its net assets for each of the two years in the period then ended and the financial highlights for each of the five years in the period then ended, in conformity with accounting principles generally accepted in the United States of America. These financial statements and financial highlights (hereafter referred to as “financial statements”) are the responsibility of the Fund’s management; our responsibility is to express an opinion on these financial statements based on our audits. We conducted our audits of these financial statements in accordance with the standards of the Public Company Accounting Oversight Board (United States). Those standards require that we plan and perform the audits to obtain reasonable assurance about whether the financial statements are free of material misstatement. An audit includes examining, on a test basis, evidence supporting the amounts and disclosures in the financial statements, assessing the accounting principles used and significant estimates made by management, and evaluating the overall financial statement presentation. We believe that our audits, which included confirmation of securities at August 31, 2010 by correspondence with the custodian and brokers, provide a reasonable basis for our opinion.
PricewaterhouseCoopers LLP
Boston, Massachusetts
October 25, 2010
28
Federal Income Tax Information (Unaudited) – Columbia Greater China Fund
The Fund hereby designates as a capital gains dividend with respect to the fiscal year ended August 31, 2010, $2,532,524, or, if subsequently determined to be different, the net capital gain of such year.
Foreign taxes paid during the fiscal year ended August 31, 2010 of $428,439 are being passed through to shareholders. This represents $0.10 per share. Eligible shareholders may claim this amount as a foreign tax credit.
Gross income derived from sources within foreign countries was $5,108,725 ($1.17 per share) for the fiscal year ended August 31, 2010.
For non-corporate shareholders 2.32%, or the maximum amount allowable under the Jobs and Growth Tax Relief Reconciliation Act of 2003, of ordinary income distributed by the Fund for the fiscal year ended August 31, 2010 may represent qualified dividend income.
The Fund will notify shareholders in January 2011 of amounts for use in preparing 2010 income tax returns.
29
Fund Governance
The Trustees serve terms of indefinite duration. The names, addresses and birth years of the Trustees and Officers of the Funds in the Columbia Funds Series Trust I, the year each was first elected or appointed to office, their principal business occupations during at least the last five years, the number of Funds overseen by each Trustee and other directorships they hold are shown below. Each officer listed below serves as an officer of each Fund in the Columbia Funds Complex.
Independent Trustees
| | |
Name, Address and Year of Birth,
Position with Funds, Year First
Elected or Appointed to Office | | Principal Occupation(s) During Past Five Years, Number of Funds in Columbia Funds
Complex Overseen by Trustee, Other Directorships Held |
| |
| John D. Collins (Born 1938) | | |
c/o Columbia Management Investment Advisers, LLC One Financial Center Boston, MA 02111 Trustee (since 2005) | | Retired. Consultant, KPMG, LLP (accounting and tax firm) from July 1999 to June 2000; Partner, KPMG, LLP from March 1962 to June 1999. Oversees 64; Mrs. Fields Original Cookies, Inc. (consumer products); Suburban Propane Partners, L.P.; and Montpelier Re (insurance underwriting firm) |
| |
| Rodman L. Drake (Born 1943) | | |
c/o Columbia Management Investment Advisers, LLC One Financial Center Boston, MA 02111 Trustee (since 1994) and Chairman of the Board (since 2009) | | Co-Founder of Baringo Capital LLC (private equity) since 2002; CEO of Crystal River Capital, Inc. (real estate investment trust) since 2003; President, Continuation Investments Group, Inc. from 1997 to 2001. Oversees 64; Jackson Hewitt Tax Service Inc. (tax preparation services); Crystal Capital River Inc. (real estate investment trust); Student Loan Corporation (student loan provider); Celgene Corporation (global biotechnology company); The Helios Funds (exchange-traded funds); and Apex Silver Mines Ltd. from 2007 to 2009 |
| |
| Douglas A. Hacker (Born 1955) | | |
c/o Columbia Management Investment Advisers, LLC One Financial Center Boston, MA 02111 Trustee (since 1996) | | Independent business executive since May 2006; Executive Vice President–Strategy of United Airlines (airline) from December 2002 to May 2006; President of UAL Loyalty Services (airline marketing company) from September 2001 to December 2002; Executive Vice President and Chief Financial Officer of United Airlines from July 1999 to September 2001. Oversees 64; Nash Finch Company (food distributor); Aircastle Limited (aircraft leasing) |
|
| Janet Langford Kelly (Born 1957) |
c/o Columbia Management Investment Advisers, LLC One Financial Center Boston, MA 02111 Trustee (since 1996) | | Senior Vice President, General Counsel and Corporate Secretary, ConocoPhillips (integrated energy company) since September 2007; Deputy General Counsel–Corporate Legal Services, ConocoPhillips from August 2006 to August 2007; Partner, Zelle, Hofmann, Voelbel, Mason & Gette LLP (law firm) from March 2005 to July 2006; Adjunct Professor of Law, Northwestern University, from September 2004 to June 2006; Director, UAL Corporation (airline) from February 2006 to July 2006; Oversees 64; None |
| |
| Charles R. Nelson (Born 1942) | | |
c/o Columbia Management Investment Advisers, LLC One Financial Center Boston, MA 02111 Trustee (since 1981) | | Professor of Economics, University of Washington, since January 1976; Ford and Louisa Van Voorhis Professor of Political Economy, University of Washington, since September 1993; Adjunct Professor of Statistics, University of Washington, since September 1980; Associate Editor, Journal of Money Credit and Banking, 1993-2008 Consultant on econometric and statistical matters. Oversees 64; None |
30
Fund Governance (continued)
Independent Trustees (continued)
| | |
Name, Address and Year of Birth,
Position with Funds, Year First
Elected or Appointed to Office | | Principal Occupation(s) During Past Five Years, Number of Funds in Columbia Funds
Complex Overseen by Trustee, Other Directorships Held |
| |
| John J. Neuhauser (Born 1943) | | |
c/o Columbia Management Investment Advisers, LLC One Financial Center Boston, MA 02111 Trustee (since 1984) | | President, Saint Michael’s College, since August 2007; Director or Trustee of several non-profit organizations, including Fletcher Allen Health Care, Inc.; University Professor, Boston College from November 2005 to August 2007; Academic Vice President and Dean of Faculties, Boston College from August 1999 to October 2005. Oversees 64; Liberty All-Star Equity Fund and Liberty All-Star Growth Fund, Inc. (closed-end funds) |
| |
| Jonathan Piel (Born 1938) | | |
c/o Columbia Management Investment Advisers, LLC One Financial Center Boston, MA 02111 Trustee (since 1994) | | Cable television producer and website designer; The Editor, Scientific American from 1984 to 1994; Vice President, Scientific American, Inc., from 1984 to 1994; Member, Advisory Board, Stone Age Institute, Bloomington, Indiana (research institute that explores the effect of technology on human evolution); Member, Board of Directors of the National Institute of Social Sciences, New York City; Member, Board of Trustees of the William Alanson White Institute, New York City (institution for training psychoanalysts); and Member, Advisory Board, Mount Sinai Children’s Environmental Health Center, New York. Oversees 64; None |
| |
| Patrick J. Simpson (Born 1944) | | |
c/o Columbia Management Investment Advisers, LLC One Financial Center Boston, MA 02111 Trustee (since 2000) | | Partner, Perkins Coie LLP (law firm). Oversees 64; None |
| |
| Anne-Lee Verville (Born 1945) | | |
c/o Columbia Management Investment Advisers, LLC One Financial Center Boston, MA 02111 Trustee (since 1998) | | Retired since 1997 (formerly General Manager–Global Education Industry (from 1994 to 1997), President–Application Systems Division (from 1991 to 1994), Chief Financial Officer–US Marketing & Services (from 1988 to 1991), and Chief Information Officer (from 1987 to 1988), IBM Corporation (computer and technology)). Oversees 64; Enesco Group, Inc. (producer of giftware and home and garden decor products) from 2001 to 2006 |
31
Fund Governance (continued)
Interested Trustee
| | |
Name, Address and Year of Birth,
Position with Funds, Year First
Elected or Appointed to Office | | Principal Occupation(s) During Past Five Years, Number of Funds in Columbia Funds
Complex Overseen by Trustee, Other Directorships Held |
| |
| William E. Mayer1 (Born 1940) | | |
c/o Columbia Management Investment Advisers, LLC One Financial Center Boston, MA 02111 Trustee (since 1994) | | Partner, Park Avenue Equity Partners (private equity) since February 1999; Dean and Professor, College of Business and Management, University of Maryland from 1992 to 1996. Oversees 64; DynaVox Inc. (software application); Lee Enterprises (print media), WR Hambrecht + Co. (financial service provider); BlackRock Kelso Capital Corporation (investment company) |
| 1 | Mr. Mayer may technically be an “interested person” (as defined in the Investment Company Act of 1940) by reason of his affiliation with WR Hambrecht + Co., a registered broker/dealer that may execute portfolio transactions for, engage in principal transactions with or distribute shares of a Fund or other funds or accounts advised/managed by the Advisor or any sub-advisor to a Fund. |
The Statement of Additional Information includes additional information about the Trustees of the Funds and is available, without charge, upon request by calling 1-800-345-6611.
32
Fund Governance (continued)
Officers
| | |
| Name, Year of Birth and Address | | Principal Occupation(s) During the Past Five Years |
| |
| J. Kevin Connaughton (Born 1964) | | |
One Financial Center Boston, MA 02111 President (since 2009) | | Senior Vice President and General Manager–Mutual Fund Products, Columbia Management Investment Advisers, LLC since May 2010; President, Columbia Funds, since 2009, and RiverSource Funds, since May 2010 (previously Senior Vice President and Chief Financial Officer, Columbia Funds, from June 2008 to January 2009, Treasurer, Columbia Funds, from October 2003 to May 2008, and senior officer of various other affiliated funds since 2000); Managing Director, Columbia Management Advisors, LLC from December 2004 to April 2010. |
| |
| Michael G. Clarke (Born 1969) | | |
One Financial Center Boston, MA 02111 Senior Vice President and Chief Financial Officer (since 2009) | | Vice President, Columbia Management Investment Advisers, LLC since May 2010; Managing Director of Fund Administration, Columbia Management Advisors, LLC, from September 2004 to April 2010; senior officer of Columbia Funds and affiliated funds since 2002. |
| |
| Scott R. Plummer (Born 1959) | | |
5228 Ameriprise Financial Center Minneapolis, MN 55474 Senior Vice President, Secretary and Chief Legal Officer (since 2010) | | Chief Legal Officer and Assistant Secretary, Columbia Management Investment Advisers, LLC since June 2005; Vice President and Lead Chief Counsel–Asset Management, Ameriprise Financial, Inc. since May 2010 (previously Vice President and Chief Counsel–Asset Management, from 2005 to April 2010, and Vice President–Asset Management Compliance from 2004 to 2005); Vice President, Chief Counsel and Assistant Secretary, Columbia Management Investment Distributors, Inc. since 2008; Vice President, General Counsel and Secretary, Ameriprise Certificate Company since 2005; Chief Counsel, RiverSource Distributors, Inc. since 2006; Vice President, General Counsel and Secretary, RiverSource Funds, since December 2006; Senior Vice President, Secretary and Chief Legal Officer, Columbia Funds, since May 2010. |
| |
| Linda J. Wondrack (Born 1964) | | |
One Financial Center Boston, MA 02111 Senior Vice President and Chief Compliance Officer (since 2007) | | Vice President and Chief Compliance Officer, Columbia Management Investment Advisers, LLC since May 2010; Chief Compliance Officer, Columbia Funds, since 2007, and RiverSource Funds, since May 2010; Director (Columbia Management Group, LLC and Investment Product Group Compliance), Bank of America, from June 2005 to April 2010; Director of Corporate Compliance and Conflicts Officer of MFS Investment Management (investment management) from August 2004 to May 2005. |
| |
| William F. Truscott (Born 1960) | | |
53600 Ameriprise Financial Center Minneapolis, MN 55474 Senior Vice President (since 2010) | | Chairman of the Board, Columbia Management Investment Advisers, LLC since May 2010 (previously President, Chairman of the Board and Chief Investment Officer, from 2001 to April 2010); Chief Executive Officer, U.S. Asset Management & President, Annuities, Ameriprise Financial, Inc. since May 2010 (previously President–U.S. Asset Management and Chief Investment Officer from 2005 to April 2010, and Senior Vice President — Chief Investment Officer, from 2001 to 2005); Director, President and Chief Executive Officer, Ameriprise Certificate Company since 2006; Director, Columbia Management Investment Distributors, Inc. since May 2010 (previously Chairman of the Board and Chief Executive Officer from 2008 to April 2010); Chairman of the Board and Chief Executive Officer, RiverSource Distributors, Inc. since 2006. |
33
Fund Governance (continued)
Officers (continued)
| | |
| Name, Year of Birth and Address | | Principal Occupation(s) During the Past Five Years |
|
| Colin Moore (Born 1958) |
One Financial Center Boston, MA 02111 Senior Vice President (since 2010) | | Director and Chief Investment Officer, Columbia Management Investment Advisers, LLC since May 2010; Manager, Managing Director and Chief Investment Officer of Columbia Management Advisors, LLC from 2007 to April 2010; Head of Equities, Columbia Management Advisors, LLC from 2002 to 2007. |
| |
| Michael A. Jones (Born 1959) | | |
100 Federal Street Boston, MA 02110 Senior Vice President (since 2010) | | Director and President, Columbia Management Investment Advisers, LLC since May 2010; President and Director, Columbia Management Investment Distributors, Inc. since May 2010; Manager, Chairman, Chief Executive Officer and President, Columbia Management Advisors, LLC from 2007 to April 2010; Chief Executive Officer, President and Director, Columbia Management Distributors, Inc. from November 2006 to April 2010; previously, co-president and senior managing director at Robeco Investment Management. |
| |
| Amy Johnson (Born 1965) | | |
5228 Ameriprise Financial Center Minneapolis, MN 55474 Senior Vice President (since 2010) | | Senior Vice President and Chief Operating Officer, Columbia Management Investment Advisers, LLC since May 2010 (previously Chief Administrative Officer, from 2009 until April 2010, Vice President–Asset Management and Trust Company Services, from 2006 to 2009, and Vice President–Operations and Compliance from 2004 to 2006). |
| |
| Joseph F. DiMaria (Born 1968) | | |
One Financial Center Boston, MA 02111 Treasurer (since 2009) and Chief Accounting Officer (since 2008) | | Vice President, Mutual Fund Administration, Columbia Management Investment Advisers, LLC, since May 2010; Director of Fund Administration, Columbia Management Advisors, LLC from January 2006 to April 2010; Head of Tax/Compliance and Assistant Treasurer, Columbia Management Advisors, LLC, from November 2004 to December 2005. |
| |
| Marybeth Pilat (Born 1968) | | |
One Financial Center Boston, MA 02111 Deputy Treasurer (since 2010) | | Vice President, Mutual Fund Administration, Columbia Management Investment Advisers, LLC, since May 2010; Vice President, Investment Operations, Bank of America, from October 2008 to April 2010; Finance Manager, Boston Children’s Hospital from August 2008 to October 2008; Director, Mutual Fund Administration, Columbia Management Advisors, LLC, from May 2007 to July 2008; Vice President, Mutual Fund Valuation, Columbia Management Advisors, LLC, from January 2006 to May 2007; Vice President, Mutual Fund Accounting Oversight, Columbia Management Advisors, LLC from January 2005 to January 2006. |
| |
| Julian Quero (Born 1967) | | |
One Financial Center Boston, MA 02111 Deputy Treasurer (since 2008) | | Vice President, Mutual Fund Administration, Columbia Management Investment Advisers, LLC since May 2010; Director of Fund Administration, Columbia Management Advisors, LLC, from August 2008 to April 2010; Senior Tax Manager, Columbia Management Advisors, LLC from August 2006 to July 2008; Senior Compliance Manager, Columbia Management Advisors, LLC from April 2002 to August 2006. |
| |
| Stephen T. Welsh (Born 1957) | | |
One Financial Center Boston, MA 02111 Vice President (since 2006) | | President and Director, Columbia Management Investment Services Corp. since May 2010; President and Director, Columbia Management Services, Inc. from July 2004 to April 2010; Managing Director, Columbia Management Distributors, Inc. from August 2007 to April 2010. |
34
Summary of Management Fee Evaluation by Independent Fee Consultant (RiverSource Investments, LLC)
EXCERPTS FROM REPORT OF INDEPENDENT FEE CONSULTANT TO THE FUNDS SUPERVISED BY THE COLUMBIA ATLANTIC BOARD
Prepared Pursuant to the February 9, 2005 Assurance of Discontinuance among the Office of Attorney General of New York State, Columbia Management Advisors, LLC, and Columbia Management Distributors, Inc. December 21, 2009
I. Overview
On February 9, 2005, Columbia Management Advisors, LLC (“CMA”) and Columbia Management Distributors, Inc.1 (“CMD”) agreed to the New York Attorney General’s Assurance of Discontinuance (“AOD”). Among other things, the AOD stipulates that CMA may manage or advise a Columbia Fund (“Columbia Fund” and, together with some or all of such funds, the “Columbia Funds”) only if the Independent Members of the Columbia Fund’s Board of Trustees appoint a Senior Officer or retain an Independent Fee Consultant (“IFC”) who is to manage the process by which proposed management fees are negotiated. The AOD further stipulates that the Senior Officer or IFC is to prepare a written annual evaluation of the fee negotiation process.
With effect from January 1, 2007, the Independent Members of the Board of Trustees for certain Columbia Funds known collectively as the “Atlantic Funds” (together with the other members of that Board, the “Trustees”) retained me as IFC for the Atlantic Funds.2 In this capacity, I have prepared this written evaluation of the fee negotiation process. As was the case with the last three annual reports, my immediate predecessor as IFC, John Rea, provided invaluable assistance in the preparation of this report.
On September 29, 2009, Ameriprise entered into an asset purchase agreement with Bank of America, N.A. and its parent, Bank of America Corporation (together, the “Bank”) pursuant to which the Bank agreed to sell certain CMG assets relating to Columbia’s long-term asset management business, including management of the Atlantic Funds (the “Transaction”).3 The Transaction if completed would result in the termination of the existing Investment Management Agreements with CMA. Therefore, the Trustees have been requested to approve and recommend to the shareholders of each Atlantic Fund new Investment Management and Sub-Advisory Agreements (together, the “Management Agreements”) with RiverSource Investments, LLC (“RI”),4 investment manager of the RiverSource Funds and a subsidiary of Ameriprise. This report is intended to fulfill the requirements of the AOD with respect to the Trustees’ consideration of the new Management Agreements.
A. Role of the Independent Fee Consultant
The AOD charges the IFC with “managing the process by which proposed management fees … to be charged the Columbia Fund are negotiated so that they are negotiated in a manner which is at arms’ length and reasonable and consistent with this Assurance of Discontinuance.” The AOD also provides that CMA “may manage or advise a Columbia Fund only if the reasonableness of the proposed management fees is determined by the Board of Trustees … using … an annual independent written evaluation prepared by or under the direction of … the Independent Fee Consultant.” Therefore, the AOD makes clear that the IFC does not supplant the Trustees in negotiating management fees with CMA (or RI), nor does the IFC substitute his or her judgment for that of the Trustees with respect to the reasonableness of proposed fees or any other matter that is committed to the business judgment of the Trustees.
| 1 | CMA and CMD are subsidiaries of Columbia Management Group, LLC (“CMG”), and are the successors to the entities named in the AOD. |
| 2 | I have no material relationship with Bank of America, CMG or Ameriprise Financial, Inc. (“Ameriprise”), aside from serving as IFC, and I am aware of no material relationship with any of their affiliates. I retained John Rea, an independent economic consultant, to assist me with this report. |
| | Unless otherwise stated or required by the context, this report covers only the Atlantic Funds. |
| 3 | Preliminary Response of Ameriprise to Information Request of Columbia Atlantic Board dated October 21, 2009 (hereafter, the “Preliminary Response”), p. 1. The one money market Atlantic Fund, Money Market Fund VS, was included in the Transaction because it was an integral part of CMG's array of Funds used as investment vehicles by variable annuity and similar insurance products. |
| 4 | Ameriprise intends to re-brand RI with the “Columbia” name (which is one of the assets being sold in the Transaction). Preliminary Response, pp. 4-5. In the case of new Sub-Advisory Agreements, the current sub-adviser would also be a party. |
35
B. Elements Involved in Managing the Fee Negotiation Process
In preparing the report required by the AOD, the IFC must consider at least the following six factors set forth in the AOD:
| 1. | The nature and quality of the adviser’s services, including the Fund’s performance; |
| 2. | Management fees (including any components thereof) charged by other mutual fund companies for like services; |
| 3. | Possible economies of scale as the Fund grows larger; |
| 4. | Management fees (including any components thereof) charged to institutional and other clients of the adviser for like services; |
| 5. | Costs to the adviser and its affiliates of supplying services pursuant to the management fee agreements, excluding any intra-corporate profit; and |
| 6. | Profit margins of the adviser and its affiliates from supplying such services. |
C. Data Presented to the Trustees
In considering the proposed new Management Agreements with RI, the Trustees relied in part on the data that had been prepared as part of their annual contract review process, which concluded in late October. This data remained relevant because the fees in the proposed Management Agreements were identical to the fees approved at that time. The annual review materials included a Lipper report on the performance of each Atlantic Fund compared to its peers and its benchmark, comparisons of the fees and expenses of each Atlantic Fund to similar CMG-sponsored Funds, comparable competitive funds chosen by Lipper, and institutional accounts advised by CMA, revenues, expenses, and profits of CMG from managing the Atlantic Funds, calculated both by Fund and collectively, and CMG’s views on the existence and sharing of economies of scale.
In addition, the Trustees reviewed materials specific to the proposed new Management Agreements with RI in response to requests for information made on behalf of the Trustees, including the following:
| n | | Performance data for the RiverSource Funds showing percentile and quartile rankings of each fund within its Lipper performance universe for periods up to five years and net returns of each fund relative to its benchmark returns. This data was arguably relevant due to the possibility that some RiverSource investment teams would be providing investment management services to certain Columbia Funds.5 |
| n | | tables comparing the fee schedules and effective fee rates of funds managed by CMA and RI and institutional accounts advised by the two firms. |
| n | | extensive discussion of the process by which the various components of the two asset management businesses would be integrated including investment management, compliance, transfer agency, custody, fund accounting, and distribution. |
| n | | information about the financial condition of Ameriprise, including its most recent annual report on Form 10-K, RI’s profit margins from managing the RiverSource Funds in 2007 and 2008, and pro forma income statements for the combined Columbia and RiverSource fund complex. |
| n | | disclosure that certain senior CMG executives, including President Michael Jones, Chief Investment Officer Colin Moore, Head of Mutual Funds J. Kevin Connaughton, and Chief Compliance Officer Linda Wondrack would continue in analogous capacities following the consummation of the Transaction, and |
| n | | a breakdown of the synergies RI expects to realize in the two years following the Transaction and the extent to which those potential synergies are expected to be shared with shareholders of funds advised by RI. |
| 5 | On page 20 of its Supplemental Response to the Atlantic Trustees (undated but delivered November 24, 2009), Ameriprise said that “most personnel decisions, including with respect to the portfolio management teams for the Atlantic Funds . . . will be made primarily by [current CMA CIO] Colin Moore using the Columbia 5P process.” |
36
II. Findings
| 1. | Based upon my examination of the information supplied by CMG and Ameriprise in the light of the six factors set forth in the AOD, I conclude that the Trustees have the relevant information necessary to evaluate the reasonableness of the proposed management fees for each Atlantic Fund. |
| 2. | In my view, the process by which the proposed management fees of the Atlantic Funds have been negotiated with RI thus far has been, to the extent practicable, at arms’ length and reasonable and consistent with the AOD. |
Respectfully submitted,
Steven E. Asher
37
Shareholder Meeting Results
On March 3, 2010, a special meeting of shareholders of Columbia Funds Series Trust I was held to consider the approval of several proposals listed in the proxy statement for the meeting. The proposals were voted on at an adjourned meeting of shareholders held on March 31, 2010. The shareholder meeting results are as follows:
Proposal 1: A proposed Investment Management Services Agreement with Columbia Management Investment Advisers, LLC (formerly, RiverSource Investments, LLC) (CMIA) was approved as follows:
| | | | | | |
| | | | | | | |
| Votes For | | Votes Against | | Abstentions | | Broker Non-Votes |
| 128,906,115 | | 5,919,332 | | 4,538,940 | | 42,544,412 |
Proposal 2: A proposal authorizing CMIA to enter into and materially amend subadvisory agreements for the Fund in the future, with the approval of the Trust’s Board of Trustees, but without obtaining additional shareholder approval, was approved as follows:
| | | | | | |
| | | | | | | |
| Votes For | | Votes Against | | Abstentions | | Broker Non-Votes |
| 123,120,565 | | 11,503,202 | | 4,740,627 | | 42,544,405 |
Proposal 3: Each of the nominees for trustees was elected to the Trust’s Board of Trustees, as follows:
| | | | | | |
| | | | | | | |
| Trustee | | Votes For | | Votes Withheld | | Abstentions |
| John D. Collins | | 30,977,072,412 | | 859,827,038 | | 0 |
| Rodman L. Drake | | 30,951,179,004 | | 885,720,446 | | 0 |
| Douglas A. Hacker | | 30,989,793,279 | | 847,106,171 | | 0 |
| Janet Langford Kelly | | 30,999,020,814 | | 837,878,636 | | 0 |
| William E. Mayer | | 16,291,139,483 | | 15,545,759,967 | | 0 |
| Charles R. Nelson | | 30,997,700,700 | | 839,198,750 | | 0 |
| John J. Neuhauser | | 30,988,095,661 | | 848,803,789 | | 0 |
| Jonathon Piel | | 30,968,801,048 | | 868,098,402 | | 0 |
| Patrick J. Simpson | | 30,999,065,030 | | 837,834,420 | | 0 |
| Anne-Lee Verville | | 30,996,227,913 | | 840,671,537 | | 0 |
38
[THIS PAGE INTENTIONALLY LEFT BLANK]
39
[THIS PAGE INTENTIONALLY LEFT BLANK]
40
Important Information About This Report
The fund mails one shareholder report to each shareholder address. If you would like more than one report, please call shareholder services at 1-800-345-6611 and additional reports will be sent to you. This report has been prepared for shareholders of Columbia Greater China Fund.
A description of the policies and procedures that the fund uses to determine how to vote proxies and a copy of the fund’s voting records are available (i) at www.columbiamanagement.com, (ii) on the Securities and Exchange Commission’s website at www.sec.gov, and (iii) without charge, upon request, by calling 1-800-368-0346. Information regarding how the fund voted proxies relating to portfolio securities during the 12-month period ended June 30 is available from the SEC’s website. Information regarding how the fund voted proxies relating to portfolio securities is also available from the fund’s website, www.columbiamanagement.com.
The fund files a complete schedule of portfolio holdings with the SEC for the first and third quarters of each fiscal year on Form N-Q. The fund’s Form N-Q is available on the SEC’s website at www.sec.gov and may be reviewed and copied at the SEC’s Public Reference Room in Washington, D.C. Information on the operation of the Public Reference Room may be obtained by calling
1-800-SEC-0330.
Transfer Agent
Columbia Management Investment Services Corp.
P.O. Box 8081
Boston, MA 02266-8081
1-800-345-6611
Distributor
Columbia Management Investment
Distributors, Inc.
One Financial Center
Boston, MA 02111
Investment Advisor
Columbia Management Investment Advisers, LLC
100 Federal Street
Boston, MA 02110
41

Columbia Greater China Fund
P.O. Box 8081
Boston, MA 02266-8081
columbiamanagement.com
This information is for use with concurrent or prior delivery of a fund prospectus. Investors should consider the investment objectives, risks, charges and expenses of a mutual fund carefully before investing. For a free prospectus, which contains this and other important information about the funds, visit columbiamanagement.com. Read the prospectus carefully before investing. The Fund is distributed by Columbia Management Investment Distributors, Inc., member FINRA, and managed by Columbia Management Investment Advisers, LLC.
©2010 Columbia Management Investment Advisers, LLC. All rights reserved.
C-1371 A (10/10)
Item 2. Code of Ethics.
(a) The registrant has adopted a code of ethics that applies to the registrant’s principal executive officer, principal financial officer, principal accounting officer or controller, or persons performing similar functions, regardless of whether these individuals are employed by the registrant or a third party.
(b) During the period covered by this report, there were not any amendments to a provision of the code of ethics adopted in 2(a) above.
(c) During the period covered by this report, there were no waivers, including any implicit waivers, from a provision of the code of ethics described in 2(a) above that relates to one or more of the items set forth in paragraph (b) of this item’s instructions.
Item 3. Audit Committee Financial Expert.
The registrant’s Board of Trustees has determined that John D. Collins, Douglas A. Hacker, Charles R. Nelson and Anne-Lee Verville, each of whom are members of the registrant’s Board of Trustees and Audit Committee, each qualify as an audit committee financial expert. Mr. Collins, Mr. Hacker, Mr. Nelson and Ms. Verville are each independent trustees, as defined in paragraph (a)(2) of this item’s instructions.
Item 4. Principal Accountant Fees and Services.
Fee information below is disclosed for the ten series of the registrant whose reports to stockholders is included in this annual filing. Fee information for fiscal year ended August 31, 2009 also includes fees for one series that changed its fiscal year end to December 31 during the period.
(a) Audit Fees. Aggregate Audit Fees billed by the principal accountant for professional services rendered during the fiscal years ended August 31, 2010 and August 31, 2009 are approximately as follows:
2010 | | 2009 | |
$ | 377,300 | | $ | 423,300 | |
| | | | | |
Audit Fees include amounts related to the audit of the registrant’s annual financial statements or services that are normally provided by the accountant in connection with statutory and regulatory filings or engagements for those fiscal years. Audit fees in fiscal year 2009 also include fees for the review of and provision of consent in connection with filing Form N-1A for a new share class.
(b) Audit-Related Fees. Aggregate Audit-Related Fees billed to the registrant by the principal accountant for professional services rendered during the fiscal years ended August 31, 2010 and August 31, 2009 are approximately as follows:
2010 | | 2009 | |
$ | 46,000 | | $ | 50,600 | |
| | | | | |
Audit-Related Fees include amounts for assurance and related services by the principal accountant that are reasonably related to the performance of the audit of the registrant’s financial statements and are not reported in Audit Fees above. In both fiscal years 2010 and 2009, Audit-Related Fees consist of agreed-upon procedures performed for semi-annual shareholder reports.
During the fiscal years ended August 31, 2010 and August 31, 2009, there were no Audit-Related Fees billed by the registrant’s principal accountant to the registrant’s investment adviser (not including any sub-adviser whose role is primarily portfolio management and is subcontracted with or overseen by another investment adviser) and any entity controlling, controlled by, or under common control with the adviser that provides ongoing services to the registrant for an engagement that related directly to the operations and financial reporting of the registrant.
(c) Tax Fees. Aggregate Tax Fees billed by the principal accountant to the registrant for professional services rendered during the fiscal years ended August 31, 2010 and August 31, 2009 are approximately as follows:
2010 | | 2009 | |
$ | 50,800 | | $ | 52,700 | |
| | | | | |
Tax Fees include amounts for the review of annual tax returns, the review of required shareholder distribution calculations and typically include amounts for professional services by the principal accountant for tax compliance, tax advice and tax planning. Fiscal year 2010 also includes tax fees for assistance with foreign tax filings.
During the fiscal years ended August 31, 2010 and August 31, 2009, there were no Tax Fees billed by the registrant’s principal accountant to the registrant’s investment adviser (not including any sub-adviser whose role is primarily portfolio management and is subcontracted with or overseen by another investment adviser) and any entity controlling, controlled by, or under common control with the adviser that provides ongoing services to the registrant for an engagement that related directly to the operations and financial reporting of the registrant.
(d) All Other Fees. Aggregate All Other Fees billed by the principal accountant to the registrant for professional services rendered during the fiscal years ended August 31, 2010 and August 31, 2009 are approximately as follows:
All Other Fees include amounts for products and services provided by the principal accountant, other than the services reported in paragraphs (a) through (c) above.
Aggregate All Other Fees billed by the registrant’s principal accountant to the registrant’s investment adviser (not including any sub-adviser whose role is primarily portfolio management and is subcontracted with or overseen by another investment adviser) and any entity controlling, controlled by, or under common control with the adviser that provides ongoing services to the registrant for an engagement that related directly to the operations and financial reporting of the registrant during the fiscal years ended August 31, 2010 and August 31, 2009 are approximately as follows:
2010 | | 2009 | |
$ | 1,156,500 | | $ | 829,700 | |
| | | | | |
In both fiscal years 2010 and 2009, All Other Fees consist of fees billed for internal control examinations of the registrant’s transfer agent and investment advisor. Fiscal year 2010 also includes fees for agreed upon procedures related to the sale of the long-term asset management business and fees related to the review of revenue modeling schedules.
(e)(1) Audit Committee Pre-Approval Policies and Procedures
The registrant’s Audit Committee is required to pre-approve the engagement of the registrant’s independent accountants to provide audit and non-audit services to the registrant and non-audit services to its investment adviser (not including any sub-adviser whose role is primarily portfolio management and is subcontracted with or overseen by another investment adviser) or any entity controlling, controlled by or under common control with such investment adviser that provides ongoing services to the registrant (“Adviser Affiliates”), if the engagement relates directly to the operations and financial reporting of the registrant.
The Audit Committee has adopted a Policy for Engagement of Independent Accountants for Audit and Non-Audit Services (“Policy”). The Policy sets forth the understanding of the Audit Committee regarding the engagement of the registrant’s independent accountants to provide (i) audit and permissible audit-related, tax and other services to the registrant (collectively “Fund Services”); (ii) non-audit services to the registrant’s investment adviser (not including any sub-adviser whose role is primarily portfolio management and is subcontracted with or overseen by another investment
adviser) and Adviser Affiliates, if the engagement relates directly to the operations or financial reporting of a Fund (collectively “Fund-related Adviser Services”); and (iii) certain other audit and non-audit services to the registrant’s investment adviser (not including any sub-adviser whose role is primarily portfolio management and is subcontracted with or overseen by another investment adviser) and Adviser Affiliates. Unless a type of service receives general pre-approval under the Policy, it requires specific pre-approval by the Audit Committee if it is to be provided by the independent accountants. Pre-approval of non-audit services to the registrant, the registrant’s investment adviser (not including any sub-adviser whose role is primarily portfolio management and is subcontracted with or overseen by another investment adviser) and Adviser Affiliates may be waived provided that the “de minimis” requirements set forth under paragraph (c)(7)(i)(C) of Rule 2-01 of Regulation S-X are met.
Under the Policy, the Audit Committee may delegate pre-approval authority to any pre-designated member or members who are Independent Trustees/Directors. The member(s) to whom such authority is delegated must report, for informational purposes only, any pre-approval decisions to the Audit Committee at its next regular meeting. The Audit Committee’s responsibilities with respect to the pre-approval of services performed by the independent accountants may not be delegated to management.
The Policy requires the Fund Treasurer and/or Director of Board Administration to submit to the Audit Committee, on an annual basis, a schedule of the types of services that are subject to general pre-approval. The schedule(s) provide a description of each type of service that is subject to general pre-approval and, where possible, will provide estimated fee caps for each instance of providing each service. The Audit Committees will review and approve the types of services and review the projected fees for the next fiscal year and may add to, or subtract from, the list of general pre-approved services from time to time based on subsequent determinations. That approval acknowledges that the Audit Committee is in agreement with the specific types of services that the independent accountants will be permitted to perform.
The Fund Treasurer and/or Director of Board Administration shall report to the Audit Committee at each of its regular meetings regarding all Fund Services or Fund-related Adviser Services initiated since the last such report was rendered, including a general description of the services, actual billed and projected fees, and the means by which such Fund Services or Fund-related Adviser Services were pre-approved by the Audit Committee.
*****
(e)(2) The percentage of services described in paragraphs (b) through (d) of this Item approved pursuant to the “de minimis” exception under paragraph (c)(7)(i)(C) of Rule 2-01 of Regulation S-X during both fiscal years ended August 31, 2010 and August 31, 2009 was zero.
(f) Not applicable.
(g) The aggregate non-audit fees billed by the registrant’s accountant for services rendered to the registrant, and rendered to the registrant’s investment adviser (not including any sub-adviser whose role is primarily portfolio management and is subcontracted with or overseen by another investment adviser), and any entity controlling, controlled by, or under common control with the adviser that provides ongoing services to the registrant for the fiscal years ended August 31, 2010 and August 31, 2009 are approximately as follows:
2010 | | 2009 | |
$ | 1,253,300 | | $ | 933,000 | |
| | | | | |
(h) The registrant’s Audit Committee of the Board of Directors has considered whether the provision of non-audit services that were rendered to the registrant’s adviser (not including any sub-adviser whose role is primarily portfolio management and is subcontracted with or overseen by another investment adviser), and any entity controlling, controlled by, or under common control with the investment adviser that provides ongoing services to the registrant that were not pre-approved pursuant to paragraph (c)(7)(ii) of Rule 2-01 of Regulation S-X, is compatible with maintaining the principal accountant’s independence.
Item 5. Audit Committee of Listed Registrants.
Not applicable.
Item 6. Investments
(a) The registrant’s “Schedule I — Investments in securities of unaffiliated issuers” (as set forth in 17 CFR 210.12-12) is included in Item 1 of this Form N-CSR.
(b) Not applicable.
Item 7. Disclosure of Proxy Voting Policies and Procedures for Closed-End Management Investment Companies.
Not applicable.
Item 8. Portfolio Managers of Closed-End Management Investment Companies.
Not applicable.
Item 9. Purchases of Equity Securities by Closed-End Management Investment Company and Affiliated Purchasers.
Not applicable.
Item 10. Submission of Matters to a Vote of Security Holders.
There were no material changes to the procedures by which shareholders may recommend nominees to the registrant’s board of directors.
Item 11. Controls and Procedures.
(a) The registrant’s principal executive officer and principal financial officers, based on their evaluation of the registrant’s disclosure controls and procedures as of a date within 90 days of the filing of this report, have concluded that such controls and procedures are adequately designed to ensure that material information required to be disclosed by the registrant in Form N-CSR is accumulated and communicated to the registrant’s management, including the principal executive officer and principal financial officer, or persons performing similar functions, as appropriate to allow timely decisions regarding required disclosure.
(b) There was no change in the registrant’s internal control over financial reporting that occurred during the registrant’s second fiscal quarter of the period covered by this report that has materially affected, or is reasonably likely to materially affect, the registrant’s internal control over financial reporting.
Item 12. Exhibits.
(a)(1) Code of ethics required to be disclosed under Item 2 of Form N-CSR attached hereto as Exhibit 99.CODE ETH.
(a)(2) Certifications pursuant to Rule 30a-2(a) under the Investment Company Act of 1940 (17 CFR 270.30a-2(a)) attached hereto as Exhibit 99.CERT.
(a)(3) Not applicable.
(b) Certification pursuant to Rule 30a-2(b) under the Investment Company Act of 1940 (17 CFR 270.30a-2(b)) attached hereto as Exhibit 99.906CERT.
SIGNATURES
Pursuant to the requirements of the Securities Exchange Act of 1934 and the Investment Company Act of 1940, the registrant has duly caused this report to be signed on its behalf by the undersigned, thereunto duly authorized.
(registrant) | | Columbia Funds Series Trust I | |
| | | |
| |
By (Signature and Title) | | /s/J. Kevin Connaughton | |
| | J. Kevin Connaughton, President | |
| | |
| | |
Date | | November 8, 2010 | |
| | | | | | |
Pursuant to the requirements of the Securities Exchange Act of 1934 and the Investment Company Act of 1940, this report has been signed below by the following persons on behalf of the registrant and in the capacities and on the dates indicated.
By (Signature and Title) | | /s/J. Kevin Connaughton | |
| | J. Kevin Connaughton, President | |
| | |
| | |
Date | | November 8, 2010 | |
| | |
| | |
By (Signature and Title) | | /s/Michael G. Clarke | |
| | Michael G. Clarke, Chief Financial Officer | |
| | |
| | |
Date | | November 8, 2010 | |
| | | | |