UNITED STATES
SECURITIES AND EXCHANGE COMMISSION
Washington, D.C. 20549
FORM N-CSR
CERTIFIED SHAREHOLDER REPORT OF REGISTERED
MANAGEMENT INVESTMENT COMPANIES
Investment Company Act file number | 811-04367 |
|
Columbia Funds Series Trust I |
(Exact name of registrant as specified in charter) |
|
One Financial Center, Boston, Massachusetts | | 02111 |
(Address of principal executive offices) | | (Zip code) |
|
Scott R. Plummer 5228 Ameriprise Financial Center Minneapolis, MN 55474 |
(Name and address of agent for service) |
|
Registrant’s telephone number, including area code: | 1-612-671-1947 | |
|
Date of fiscal year end: | November 30 | |
|
Date of reporting period: | November 30, 2010 | |
| | | | | | | | |
Form N-CSR is to be used by management investment companies to file reports with the Commission not later than 10 days after the transmission to stockholders of any report that is required to be transmitted to stockholders under Rule 30e-1 under the Investment Company Act of 1940 (17 CFR 270.30e-1). The Commission may use the information provided on Form N-CSR in its regulatory, disclosure review, inspection, and policymaking roles.
A registrant is required to disclose the information specified by Form N-CSR, and the Commission will make this information public. A registrant is not required to respond to the collection of information contained in Form N-CSR unless the Form displays a currently valid Office of Management and Budget (“OMB”) control number. Please direct comments concerning the accuracy of the information collection burden estimate and any suggestions for reducing the burden to Secretary, Securities and Exchange Commission, 450 Fifth Street, NW, Washington, DC 20549-0609. The OMB has reviewed this collection of information under the clearance requirements of 44 U.S.C. § 3507.
Item 1. Reports to Stockholders.

Columbia Tax-Exempt Fund
Annual Report for the Period Ended November 30, 2010
Not FDIC insured • No bank guarantee • May lose value
Table of Contents
| Fund Profile | | | 1 | | |
|
| Economic Update | | | 2 | | |
|
| Performance Information | | | 4 | | |
|
| Understanding Your Expenses | | | 5 | | |
|
| Portfolio Manager's Report | | | 6 | | |
|
| Investment Portfolio | | | 8 | | |
|
Statement of Assets and
Liabilities | | | 28 | | |
|
| Statement of Operations | | | 30 | | |
|
Statement of Changes in
Net Assets | | | 31 | | |
|
| Financial Highlights | | | 33 | | |
|
| Notes to Financial Statements | | | 37 | | |
|
Report of Independent Registered
Public Accounting Firm | | | 46 | | |
|
| Federal Income Tax Information | | | 47 | | |
|
| Fund Governance | | | 48 | | |
|
Board Consideration and
Approval of Advisory
Agreements | | | 53 | | |
|
Summary of Management Fee
Evaluation by Independent Fee
Consultant | | | 57 | | |
|
Important Information About
This Report | | | 61 | | |
|
The views expressed in this report reflect the current views of the respective parties. These views are not guarantees of future performance and involve certain risks, uncertainties and assumptions that are difficult to predict, so actual outcomes and results may differ significantly from the views expressed. These views are subject to change at any time based upon economic, market or other conditions and the respective parties disclaim any responsibility to update such views. These views may not be relied on as investment advice and, because investment decisions for a Columbia Fund are based on numerous factors, may not be relied on as an indication of trading intent on behalf of any particular Columbia Fund. References to specific securities should not be construed as a recommendation or investment advice.
President's Message

Dear Shareholder:
The Columbia Management story began over 100 years ago, and today, we are one of the nation's largest dedicated asset managers. The recent acquisition by Ameriprise Financial, Inc. brings together the talents, resources and capabilities of Columbia Management with those of RiverSource Investments, Threadneedle (acquired by Ameriprise in 2003) and Seligman Investments (acquired by Ameriprise in 2008) to build a best-in-class asset management business that we believe is truly greater than its parts.
RiverSource Investments traces its roots to 1894 when its then newly-founded predecessor, Investors Syndicate, offered a face-amount savings certificate that gave small investors the opportunity to build a safe and secure fund for retirement, education or other special needs. A mutual fund pioneer, Investors Syndicate launched Investors Mutual Fund in 1940. In the decades that followed, its mutual fund products and services lineup grew to include a full spectrum of styles and specialties. More than 110 years later, RiverSource continues to be a trusted financial products leader.
Threadneedle, a leader in global asset management and one of Europe's largest asset managers, offers sophisticated international experience from a dedicated U.K. management team. Headquartered in London, it is named for Threadneedle Street in the heart of the city's financial district, where British investors pioneered international and global investing. Threadneedle was acquired in 2003 and today operates as an affiliate of Columbia Management.
Seligman Investments' beginnings date back to the establishment of the investment firm J. & W. Seligman & Co. in 1864. In the years that followed, Seligman played a major role in the geographical expansion and industrial development of the United States. In 1874, President Ulysses S. Grant named Seligman as fiscal agent for the U.S. Navy—an appointment that would last through World War I. Seligman helped finance the westward path of the railroads and the building of the Panama Canal. The firm organized its first investment company in 1929 and began managing its first mutual fund in 1930. In 2008, J. & W. Seligman & Co. Incorporated was acquired and Seligman Investments became an offering brand of RiverSource Investments, LLC.
We are proud of the rich and distinctive history of these firms, the strength and breadth of products and services they offer, and the combined cultures of pioneering spirit and forward thinking. Together we are committed to providing more for our shareholders than ever before.
> A singular focus on our shareholders
Our business is asset management, so investors are our first priority. We dedicate our resources to identifying timely investment opportunities and provide a comprehensive choice of equity, fixed-income and alternative investments to help meet your individual needs.
> First-class research and thought leadership
We are dedicated to helping you take advantage of today's opportunities and anticipate tomorrow's. We stay abreast of the latest investment trends and ideas, using our collective insight to evaluate events and transform them into solutions you can use.
> A disciplined investment approach
We aren't distracted by passing fads. Our teams adhere to a rigorous investment process that helps ensure the integrity of our products and enables you and your financial advisor to match our solutions to your objectives with confidence.
When you choose Columbia Management, you can be confident that we will take the time to understand your needs and help you and your financial advisor identify the solutions that are right for you. Because at Columbia Management, we don't consider ourselves successful unless you are.
Sincerely,

J. Kevin Connaughton
President, Columbia Funds
Investors should consider the investment objectives, risks, charges and expenses of a mutual fund carefully before investing. For a free prospectus, which contains this and other important information about the funds, visit www.columbiamanagement.com. The prospectus should be read carefully before investing.
Columbia Funds are distributed by Columbia Management Investment Distributors, Inc., member FINRA, and managed by Columbia Management Investment Advisers, LLC.
© 2011 Columbia Management Investment Advisers, LLC. All rights reserved.
Fund Profile – Columbia Tax-Exempt Fund
Summary
g For the 12-month period that ended November 30, 2010, the fund's Class A shares returned 5.12% without sales charge.
g The fund outperformed the average return of the funds in its peer group, the Lipper General Municipal Debt Funds Classification,1 and its benchmark, the Barclays Capital Municipal Bond Index.2
g Credit quality and maturity allocations helped the fund outperform these measures.
Portfolio Management
Kimberly Campbell has managed the fund since 2002. From 1995 until joining Columbia Management Advisers, LLC in May 2010, Ms. Campbell was associated with the fund's previous adviser or its predecessors as an investment professional.
1Lipper Inc., a widely respected data provider in the industry, calculates an average total return (assuming reinvestment of distributions) for mutual funds with investment objectives similar to those of the fund. Lipper makes no adjustment for the effect of sales loads.
2The Barclays Capital Municipal Bond Index is considered representative of the broad market for investment-grade, tax-exempt bonds with a maturity of at least one year.
Indices are not available for investment, are not professionally managed and do not reflect sales charges, fees, brokerage commissions, taxes or other expenses of investing. Securities in the fund may not match those in an index.
Performance data quoted represents past performance and current performance may be lower or higher. Past performance is no guarantee of future results. The investment return and principal value will fluctuate so that shares, when redeemed, may be worth more or less than the original cost. Please visit www.columbiamanagement.com for daily and most recent month-end performance updates.
Summary
1-year return as of 11/30/10
| | | | +5.12% | |
|
|  | | | Class A shares
(without sales charge) | |
|
| | | | +4.76% | |
|
|  | | | Barclays Capital
Municipal Bond Index | |
|
1
Economic Update – Columbia Tax-Exempt Fund
Summary
For the 12-month period that ended November 30, 2010
g Modest economic growth and relatively low interest rates boosted bond market returns until the final months of the period. The Barclays Capital Aggregate Bond Index delivered solid results. High-yield bonds kept pace with stocks, as measured by the JPMorgan Developed BB High Yield Index.
Barclays
Aggregate Index | | JPMorgan
Index | |
|
 | |  | |
|
g The U.S. stock market, as measured by the S&P 500 Index, delivered solid returns, despite a summer correction. Emerging market stocks, as measured by the MSCI Emerging Markets Index (Net), outperformed U.S. stocks as well as stock markets in developed foreign markets, as measured by the MSCI EAFE Index (Net).
S&P Index | | MSCI Emerging
Markets Index | |
|
 | |  | |
|
MSCI EAFE
Index | | | |
|
 | | | |
|
The U.S. economy expanded at a modest pace in 2010, as measured by gross domestic product (GDP). Yet, growth was strong enough to allay fears of a relapse into recession. GDP expanded by 3.7% in the first quarter of 2010, 1.7% in the second quarter and 2.6% in the third quarter. With the Federal Reserve Board providing additional monetary stimulus to shore up economic growth and the extension of key tax cuts beyond the end of the year, economists are revising 2011 expectations upward. In addition, there is evidence that consumers are starting to feel more confident despite a 9.8% unemployment rate.
Consumer spending on cars, clothing and other goods generally trended higher throughout the year. Holiday spending is up in all retail categories compared with the same period in 2009, according to MasterCard Advisors' SpendingPulse, which tracks spending on all transactions including cash. Analysts say that an increase in personal savings and a decline in consumer debt have given consumers confidence to spend a little more this year. The personal savings rate edged higher, ending November at 5.7% and personal income also increased modestly during the year.
News on the job front was mostly positive in 2010, even though the number of new jobs added to the economy fell short of expectations. A good portion of the jobs added in March, April and May were temporary, government-sponsored census positions, which began to unwind in June, July and August. However, private sector payroll employment trended modestly higher, massive layoffs declined and job growth, in general, turned positive in the final months of the period, with the addition of 172,000 new jobs in October and 39,000 in November.
Despite some glimmers of improvement early in the year, the housing market remained troublesome. Both new and existing home sales fell after a federal tax credit for new and repeat homebuyers expired. Distressed properties pressured prices. And foreclosures continued—another drag on prices. The inventory of unsold new homes rose from 7.2 months to 10.5 months over the one-year period, according to the National Association of Realtors, raising concerns that a meaningful turnaround in housing could remain elusive for months to come.
Reports from the business side of the economy were generally positive. A key measure of the nation's manufacturing situation—the Institute for Supply Management's Index—took a somewhat surprising turn higher in the final months of the period. Industrial production was disappointingly flat at year end, while the amount of manufacturing capacity utilized—a key measure of the health of the manufacturing sector—inched higher.
Bonds delivered solid returns
As the economy strengthened, bonds delivered solid returns. The Barclays Capital Aggregate Bond Index1 returned 6.02%. The high-yield bond market kept pace with the stock market during the period. For the 12 months covered by this report, the
1The Barclays Capital Aggregate Bond Index is a market value-weighted index that tracks the daily price, coupon, pay-downs and total return performance of fixed-rate, publicly placed, dollar-denominated and non-convertible investment grade debt issues with at least $250 million par amount outstanding and with at least one year to final maturity.
2
Economic Update (continued) – Columbia Tax Exempt Fund
JPMorgan Developed BB High Yield Index2 returned 14.22%. The Treasury market was also positive. As the yield on the 10-year U.S. Treasury, a common bellwether for the bond market, fell throughout most of the period (bond prices and yields move in opposite directions), the Barclays Capital U.S. Treasury Index3 returned 4.99%. However, municipal bonds struggled in the final months of the period, as interest rates inched higher and issue supply surged ahead of the expected expiration of the Buy America Bonds program. Nevertheless, the Barclays Capital Municipal Bond Index4 gained 4.76% for the period. Rising rates in the final months of the period also curtailed returns from other sectors. Despite positive economic activity, the Federal Reserve Board (the Fed) kept a key short-term interest rate—the federal funds rate—close to zero.
Stock rally regained its footing
Against a strengthening economic backdrop, a stock market rally that began early in 2009 continued into 2010 despite a summer setback linked to a debt crisis brewing in Europe, which raised concerns among U.S. investors. These fears were short-lived and stocks regained their footing in September, moving higher through the end of the year. The S&P 500 Index5 returned 9.94% for the 12-month period. Outside the United States, stock market returns were mixed. The MSCI EAFE Index (Net),6 a broad gauge of stock market performance in foreign developed markets, returned 1.11% (in U.S. dollars) for the period, as concerns about the impact of a bailout for weak eurozone economies weighed on the markets. Emerging stock markets were more resilient. The MSCI Emerging Markets Index (Net)7 returned 15.34% (in U.S. dollars) for the 12-month period.
Past performance is no guarantee of future results.
2The JPMorgan Developed BB High Yield Index is an unmanaged index designed to mirror the investable universe of the U.S. dollar developed, BB-rated, high yield corporate debt market.
3The Barclays Capital U.S. Treasury Index includes public obligations of the U.S. Treasury. Treasury bills are excluded by the maturity constraint. In addition, certain special issues, such as state and local government series bonds (SLGs), as well as U.S. Treasury TIPS, are excluded. STRIPS are excluded from the index because their inclusion would result in double-counting.
4The Barclays Capital Municipal Bond Index is considered representative of the broad market for investment-grade, tax-exempt bonds with a maturity of at least one year.
5The Standard & Poor's (S&P) 500 Index tracks the performance of 500 widely held, large-capitalization U.S. stocks.
6The Morgan Stanley Capital International Europe, Australasia, Far East (MSCI EAFE) Index (Net) is a free float- adjusted market capitalization index that is designed to measure the equity market performance of developed markets, excluding the U.S. & Canada. As of May 27, 2010, the MSCI EAFE Index (Net) consisted of the following 22 developed market country indices: Australia, Austria, Belgium, Denmark, Finland, France, Germany, Greece, Hong Kong, Ireland, Israel, Italy, Japan, the Netherlands, New Zealand, Norway, Portugal, Singapore, Spain, Sweden, Switzerland and the United Kingdom.
7The Morgan Stanley Capital International Emerging Markets (MSCI EM) Index (Net) is a free float-adjusted market capitalization index that is designed to measure equity market performance of emerging markets. As of May 27, 2010, the MSCI EM Index (Net) consisted of the following 21 emerging market country indices: Brazil, Chile, China, Colombia, Czech Republic, Egypt, Hungary, India, Indonesia, Korea, Malaysia, Mexico, Morocco, Peru, Philippines, Poland, Russia, South Africa, Taiwan, Thailand and Turkey.
Indices are not available for investment, are not professionally managed and do not reflect sales charges, fees, brokerage commissions, taxes or other expenses of investing. Securities in the fund may not match those in an index.
3
Performance Information – Columbia Tax-Exempt Fund
Performance data quoted represents past performance and current performance may be lower or higher. Past performance is no guarantee of future results. The investment return and principal value will fluctuate so that shares, when redeemed, may be worth more or less than the original cost. Please visit www.columbiamanagement.com for daily and most recent month-end performance updates.
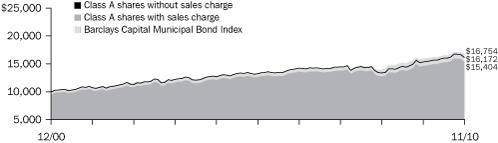
Performance of a $10,000 investment 12/01/00 – 11/30/10
The chart above shows the change in value of a hypothetical $10,000 investment in Class A shares of Columbia Tax-Exempt Fund during the stated time period, and does not reflect the deduction of taxes that a shareholder may pay on fund distributions or on the redemption of fund shares.
Performance of a $10,000 investment 12/01/00 – 11/30/10 ($)
| Sales charge | | without | | with | |
| Class A | | | 16,172 | | | | 15,404 | | |
| Class B | | | 15,013 | | | | 15,013 | | |
| Class C | | | 15,235 | | | | 15,235 | | |
| Class Z | | | 16,341 | | | | n/a | | |
Average annual total return as of 11/30/10 (%)
| Share class | | A | | B | | C | | Z | |
| Inception | | 11/21/78 | | 05/05/92 | | 08/01/97 | | 09/16/05 | |
| Sales charge | | without | | with | | without | | with | | without | | with | | without | |
| 1-year | | | 5.12 | | | | 0.13 | | | | 4.34 | | | | –0.66 | | | | 4.49 | | | | 3.49 | | | | 5.33 | | |
| 5-year | | | 4.01 | | | | 3.00 | | | | 3.24 | | | | 2.89 | | | | 3.39 | | | | 3.39 | | | | 4.22 | | |
| 10-year | | | 4.92 | | | | 4.41 | | | | 4.15 | | | | 4.15 | | | | 4.30 | | | | 4.30 | | | | 5.03 | | |
The "with sales charge" returns include the maximum initial sales charge of 4.75% for Class A shares, the applicable contingent deferred sales charge of 5.00% in the first year, declining to 1.00% in the sixth year and eliminated thereafter for Class B shares and 1.00% for Class C shares for the first year only. The "without sales charge" returns do not include the effect of sales charges. If they had, returns would be lower.
Performance results reflect any fee waivers or reimbursements of fund expenses by the investment adviser and/or any of its affiliates. Absent these fee waivers or expense reimbursement arrangements, performance results would have been lower.
All results shown assume reinvestment of distributions. Class Z shares are sold at net asset value with no distribution and service (Rule 12b-1) fees. Class Z shares have limited eligibility and the investment minimum requirements may vary. Please see the fund's prospectus for details. Performance for different share classes will vary based on differences in sales charges and fees associated with each class.
The tables do not reflect the deduction of taxes a shareholder may pay on fund distributions or on the redemption of fund shares.
The returns shown for the fund's Class Z shares include the returns of the fund's Class A shares for periods prior to September 16, 2005, the date on which the fund's Class Z shares were first offered. The returns shown have been adjusted to reflect the fact that Class Z shares are sold without a sales charge. The returns shown have not been adjusted to reflect any differences in expenses, such as distribution and service (Rule 12b-1) fees between Class Z and Class A shares of the fund.
4
Understanding Your Expenses – Columbia Tax-Exempt Fund
As a fund shareholder, you incur two types of costs. There are transaction costs, which generally include sales charges on purchases and may include redemption fees or exchange fees. There are also ongoing costs, which generally include investment advisory fees, distribution and service (Rule 12b-1) fees and other fund expenses. The information on this page is intended to help you understand the ongoing costs of investing in the fund and to compare these costs with the ongoing costs of investing in other mutual funds.
Analyzing your fund's expenses by share class
To illustrate these ongoing costs, we have provided an example and calculated the expenses paid by investors in each share class during the period. The information in the following table is based on an initial investment of $1,000, which is invested at the beginning of the period and held for the entire period. Expense information is calculated two ways and each method provides you with different information. The amount listed in the "Actual" column is calculated using the fund's actual operating expenses and total return for the period. The amount listed in the "Hypothetical" column for each share class assumes that the return each year is 5% before expenses and is calculated based on the fund's actual operating expenses. You should not use the hypothetical account values and expenses to estimate either your actual account balance at the end of the period or the expenses you paid during this period.
Compare with other funds
Since all mutual funds are required to include the same hypothetical calculations about expenses in shareholder reports, you can use this information to compare the ongoing cost of investing in the fund with other funds. To do so, compare the 5% hypothetical example with the 5% hypothetical examples that appear in the shareholder reports of other funds. As you compare hypothetical examples of other funds, it is important to note that hypothetical examples are meant to highlight the ongoing costs of investing in a fund and do not reflect any transaction costs, such as sales charges, redemption fees or exchange fees.
Estimating your actual expenses
To estimate the expenses that you paid over the period, first you will need your account balance at the end of the period:
g For shareholders who receive their account statements from Columbia Management Investment Services Corp., your account balance is available online at www.columbiamanagement.com or by calling Shareholder Services at 800.345.6611.
g For shareholders who receive their account statements from their financial intermediary, contact your financial intermediary to obtain your account balance.
1. Divide your ending account balance by $1,000. For example, if an account balance was $8,600 at the end of the period, the result would be 8.6.
2. In the section of the table below titled "Expenses paid during the period," locate the amount for your share class. You will find this number in the column labeled "Actual." Multiply this number by the result from step 1. Your answer is an estimate of the expenses you paid on your account during the period.
If the value of your account falls below the minimum initial investment requirement applicable to you, your account may be subject to a $20 annual fee. This fee is not included in the accompanying table. If you are subject to the fee, keep it in mind when you are estimating the ongoing expenses of investing in the fund and when comparing the expenses of this fund with other funds.
06/01/10 – 11/30/10
| | | Account value at the
beginning of the period ($) | | Account value at the
end of the period ($) | | Expenses paid
during the period ($) | | Fund's annualized
expense ratio (%) | |
| | | Actual | | Hypothetical | | Actual | | Hypothetical | | Actual | | Hypothetical | | Actual | |
| Class A | | | 1,000.00 | | | | 1,000.00 | | | | 1,005.90 | | | | 1,021.06 | | | | 4.02 | | | | 4.05 | | | | 0.80 | | |
| Class B | | | 1,000.00 | | | | 1,000.00 | | | | 1,002.10 | | | | 1,017.30 | | | | 7.78 | | | | 7.84 | | | | 1.55 | | |
| Class C | | | 1,000.00 | | | | 1,000.00 | | | | 1,002.80 | | | | 1,018.05 | | | | 7.03 | | | | 7.08 | | | | 1.40 | | |
| Class Z | | | 1,000.00 | | | | 1,000.00 | | | | 1,006.90 | | | | 1,022.06 | | | | 3.02 | | | | 3.04 | | | | 0.60 | | |
Expenses paid during the period are equal to the annualized expense ratio for the share class, multiplied by the average account value over the period, then multiplied by the number of days in the fund's most recent fiscal half-year and divided by 365.
Had the investment adviser and/or any of its affiliates not waived fees or reimbursed a portion of expenses for Class C shares, account value at the end of the period for Class C shares would have been reduced.
It is important to note that the expense amounts shown in the table are meant to highlight only ongoing costs of investing in the fund and do not reflect any transaction costs, such as sales charges, redemption fees or exchange fees. Therefore, the hypothetical examples provided may not help you determine the relative total costs of owning shares of different funds. If these transaction costs were included, your costs would have been higher.
5
Portfolio Manager's Report – Columbia Tax-Exempt Fund
Performance data quoted represents past performance and current performance may be lower or higher. Past performance is no guarantee of future results. The investment return and principal value will fluctuate so that shares, when redeemed, may be worth more or less than the original cost. Please visit www.columbiamanagement.com for daily and most recent month-end performance updates.
Net asset value per share
as of 11/30/10 ($)
| Class A | | | 13.13 | | |
| Class B | | | 13.13 | | |
| Class C | | | 13.13 | | |
| Class Z | | | 13.13 | | |
Distributions declared per share
12/01/09 – 11/30/10 ($)
| Class A | | | 0.59 | | |
| Class B | | | 0.49 | | |
| Class C | | | 0.51 | | |
| Class Z | | | 0.61 | | |
A portion of the fund's income may be subject to the alternative minimum tax. The fund may at times purchase tax-exempt securities at a discount. Some, or all, of this discount may be included in the fund's ordinary income and is taxable when distributed.
30-day SEC yields
as of 11/30/10 (%)
| Class A | | | 3.76 | | |
| Class B | | | 3.18 | | |
| Class C | | | 3.34 | | |
| Class Z | | | 4.15 | | |
The 30-day SEC yields reflect the fund's earning power, net of expenses, expressed as an annualized percentage of the public offering price per share at the end of the period. Had the investment adviser and/or any of its affiliates not waived fees or reimbursed a portion of expenses for Class C shares, the 30-day SEC yield for Class C shares would have been reduced.
Taxable Equivalent SEC yields
as of 11/30/10 (%)
| Class A | | | 5.78 | | |
| Class B | | | 4.90 | | |
| Class C | | | 5.14 | | |
| Class Z | | | 6.38 | | |
Taxable-equivalent SEC yields are calculated assuming a 35.0% federal income tax rate. This tax rate does not reflect the phase out of exemptions or the reduction of the otherwise allowable deductions that occur when adjusted gross income exceeds certain levels. Your taxable-equivalent yield may be different depending on your tax bracket.
For the 12-month period that ended November 30, 2010, the fund's Class A shares returned 5.12% without sales charge. The fund's benchmark, the Barclays Capital Municipal Bond Index, returned 4.76%. The average return of the fund's peer group, the Lipper General Municipal Debt Funds Classification, was 4.58%. The fund benefited from favorable credit quality and maturity allocations.
Strong gains for municipal bonds
Municipal bonds rallied strongly, especially from April through August, as declining interest rates helped boost bond prices. In addition, the sector benefited from a combination of strong demand, fueled by anticipation of higher tax rates and the possible expiration of the Bush-era tax cuts, and reduced supply—especially for longer-term bonds with maturities of 20 years or more. Tax-exempt municipal supply tightened as Build America Bonds (BABs) became more popular. BABs give issuers a federal subsidy for issuing taxable debt. Many issuers also benefited from credit upgrades, as Moody's Investor Services applied its global ratings scale to the municipal market. Late in the period, however, bond prices retreated as municipal yields rose to levels not seen since the summer of 2009, amid mounting worries over tax policy, the ballooning federal budget deficit and fiscal distress facing many state and local govern ments. In addition, demand for tax-exempt bonds slowed as the supply of new issuance increased.
Strong gains from lower quality issues
Throughout the year, interest rates stayed near historical lows, pushing investors to look for opportunities to add yield. Among the year's strongest performers were lower quality (BBB1 and below) muni bonds, which offered a yield advantage over higher quality issues. The fund benefited from having an overweight and good issue selection in the BBB sector, as well as exposure to below investment-grade issues, which are not in the index. Strong issue selection in higher quality (AA and AAA) bonds, where the fund had underweights, further aided results.
Bias toward longer-maturity issues
The fund also was well positioned for declining interest rates. During the period we added to issues with maturities of 20 years and longer which made the fund more sensitive than its benchmark to interest rate changes. Performance benefited from the fund's holdings in the 20- to 30-year maturity range, where issue selection also was strong. An above-average stake in 15- to 25-year non-callable bonds, which are bonds that cannot be redeemed before maturity, was particularly helpful. An overweight in the 10- to 15-year maturity range along with an underweight in weaker performing zero- to four-year issues also aided results, as did strong security selection in the five- to 10-year range.
1The credit quality ratings represent the lower of one of the following nationally recognized rating agencies: Standard & Poor's or Moody's Investor Services. If a security is rated by only one of the two agencies, that rating is used. If a security is not rated by either of the two agencies, it is designated as Non-Rated. Ratings are relative and subjective and are not absolute standards of quality. The credit quality of the fund's investments does not remove market risk.
6
Portfolio Manager's Report (continued) – Columbia Tax-Exempt Fund
Sector winners and losers
Among the sectors that gave the biggest boost to performance were hospitals, housing, industrial development bonds (IDB) and electric revenue bonds, where issue selection was strong. An IDB is issued by a government agency on behalf of a corporation for the purposes of promoting economic development or compliance with environmental regulations. Local general obligation (GO) bonds and pre-refunded bonds, however, were weaker performers. Local GOs were hurt by the budget problems facing many issuers. In addition, some of the fund's local GOs were zero coupon bonds, which hampered yield. Zero coupon bonds are sold at a deep discount and pay no interest. Pre-refunded bonds lagged other sectors because of their higher quality and generally shorter maturity. Pre-refunding occurs when a bond issuer sells a new bond and then invests the proceeds in shorter term government securities so it can pay off the old bond. An under weight in airline bonds, which were strong performers, and weak issue selection in the education sector detracted from relative performance.
Favorable but cautious outlook
We believe municipal bonds have the potential to offer solid returns in the coming year. However, there are many uncertainties that could affect returns, including tax changes, the possible expiration of the BABs program, new tax-exempt issuance and the pace of economic recovery. In addition, we remain concerned about budgetary shortfalls facing most states and municipalities. Going forward, we think issue selection will be critical, especially as we try to take advantage of selective buying opportunities created by stresses in the marketplace. We plan to continue to maintain our emphasis on lower quality investment-grade securities as well as bonds in the 10- to 25-year maturity range. However, we may reduce the fund's sensitivity to interest rate changes, especially if we see signs of more robust economic growth.
Portfolio characteristics and holdings are subject to change and may not be representative of current characteristics and holdings. The outlook for the fund may differ from that presented for other Columbia Funds.
Tax-exempt investing offers current tax-exempt income, but it also involves certain risks. The value of the fund will be affected by interest rate changes and the creditworthiness of issues held in the fund. When interest rates go up, bond prices generally drop and vice versa.
Interest income from certain tax-exempt bonds may be subject to certain state and local taxes and, if applicable, the alternative minimum tax. Capital gains are not exempt from income taxes.
Investments in high-yield bonds (sometimes referred to as "junk" bonds) offer the potential for high current income and attractive total return but involve certain risks. Changes in economic conditions or other circumstances may adversely affect a high-yield bond issuer's ability to make principal and interest payments.
Top 5 sectors
as of 11/30/10 (%)
| Refunded/Escrowed | | | 10.6 | | |
| Special Non-Property Tax | | | 9.2 | | |
| State General Obligations | | | 8.9 | | |
| Local General Obligations | | | 8.0 | | |
| State Appropriated | | | 6.1 | | |
Quality breakdown
as of 11/30/10 (%)
| AAA | | | 17.6 | | |
| AA | | | 33.7 | | |
| A | | | 27.0 | | |
| BBB | | | 11.4 | | |
| BB | | | 0.7 | | |
| B | | | 0.6 | | |
| CCC | | | 0.6 | | |
| CC | | | 0.1 | | |
| Non-Rated | | | 8.3 | | |
Maturity breakdown
as of 11/30/10 (%)
| 1-3 years | | | 1.0 | | |
| 3-5 years | | | 3.3 | | |
| 5-7 years | | | 8.5 | | |
| 7-10 years | | | 15.5 | | |
| 10-15 years | | | 21.8 | | |
| 15-20 years | | | 15.6 | | |
| 20-25 years | | | 16.5 | | |
| 25 years and over | | | 16.3 | | |
| Net Cash & Equivalents | | | 1.5 | | |
Ratings shown in the quality breakdown are assigned to individual bonds by taking the lower of the ratings available from one of the following nationally recognized rating agencies: Standard & Poor's or Moody's Investor Services. If a security is rated by only one of the two agencies, that rating is used. If a security is not rated by either of the two agencies, it is designated as Non-Rated. Ratings are relative and subjective and are not absolute standards of quality. The credit quality of the fund's investments does not remove market risk.
The fund is actively managed and the composition of its portfolio will change over time. Information provided is calcualted as a percentage of net assets.
7
Investment Portfolio – Columbia Tax-Exempt Fund
November 30, 2010
| Municipal Bonds – 97.3% | |
| | | Par ($) | | Value ($) | |
| Education – 6.9% | |
| Education – 5.9% | |
| AZ Glendale Industrial Development Authority | |
| Midwestern University, | |
Series 2010,
5.000% 05/15/35 | | | 3,000,000 | | | | 2,913,360 | | |
| CA Educational Facilities Authority | |
| Loyola Marymount University, | |
Series 2001,
Insured: NPFGC:
(a) 10/01/17 | | | 2,525,000 | | | | 1,900,845 | | |
| (a) 10/01/20 | | | 2,000,000 | | | | 1,220,120 | | |
| IN Purdue University | |
| Certificates of Participation, | |
Series 2006,
5.250% 07/01/22 | | | 2,000,000 | | | | 2,274,720 | | |
| MA College Building Authority | |
| Series 1994 A, | |
| 7.500% 05/01/14 | | | 3,500,000 | | | | 3,941,595 | | |
| MA Development Finance Agency | |
| College of the Holy Cross, | |
Series 2002,
Insured: AMBAC
5.250% 09/01/32 | | | 8,500,000 | | | | 9,266,190 | | |
| MA Health & Educational Facilities Authority | |
| Boston College, | |
Series 2008,
5.500% 06/01/35 | | | 19,500,000 | | | | 21,939,645 | | |
| Harvard University, | |
Series 1991 N,
6.250% 04/01/20 | | | 2,000,000 | | | | 2,575,700 | | |
| Massachusetts Institute of Technology, | |
Series 2002 K,
5.500% 07/01/22 | | | 8,000,000 | | | | 9,834,800 | | |
| NH Health & Education Facilities Authority | |
| Series 2009, | |
| 5.250% 06/01/39 | | | 4,000,000 | | | | 4,212,920 | | |
| NY Dormitory Authority | |
| Educational Housing Services, | |
Series 2005,
Insured: AMBAC
5.250% 07/01/30 | | | 3,000,000 | | | | 2,903,610 | | |
| Mt. Sinai School of Medicine, | |
Series 2009,
5.125% 07/01/39 | | | 15,000,000 | | | | 14,810,850 | | |
| | | Par ($) | | Value ($) | |
| New York University: | |
Series 2001 1,
Insured: AMBAC
5.500% 07/01/40 | | | 12,250,000 | | | | 13,494,723 | | |
| Series 2008 A: | |
| 5.000% 07/01/29 | | | 3,845,000 | | | | 4,007,413 | | |
| 5.000% 07/01/38 | | | 5,800,000 | | | | 5,894,888 | | |
| Upstate Community Colleges, | |
Series 2005 B,
Insured: NPFGC
5.500% 07/01/23 | | | 2,000,000 | | | | 2,292,200 | | |
| UT Weber State University Revenue | |
| Series 2005, | |
Insured: NPFGC
4.250% 04/01/29 | | | 5,100,000 | | | | 4,861,983 | | |
| VA College Building Authority | |
| Washington & Lee University, | |
Series 2001,
5.375% 01/01/21 | | | 5,000,000 | | | | 5,848,400 | | |
| WV University of West Virginia | |
| Series 1998 A, | |
Insured: NPFGC
5.250% 04/01/28 | | | 5,000,000 | | | | 5,354,050 | | |
| Series 2000 A, | |
Insured: AMBAC:
(a) 04/01/16 | | | 3,300,000 | | | | 2,810,445 | | |
| (a) 04/01/18 | | | 3,800,000 | | | | 2,899,286 | | |
| Education Total | | | 125,257,743 | | |
| Prep School – 0.5% | |
| CA Municipal Finance Authority | |
| Escondido Charter, | |
Series 2006 A,
5.250% 06/01/36 | | | 1,750,000 | | | | 1,427,195 | | |
| CA Statewide Communities Development Authority | |
| College for Certain LLC, | |
Series 2010,
GTY AGMT: PCSD Guaranty Pool LLC
6.000% 07/01/30 | | | 5,000,000 | | | | 4,746,100 | | |
| TX La Vernia Higher Education Finance Corp. | |
| Kipp, Inc., | |
Series 2009 A,
6.375% 08/15/44 | | | 5,000,000 | | | | 5,001,050 | | |
| Prep School Total | | | 11,174,345 | | |
See Accompanying Notes to Financial Statements.
8
Columbia Tax-Exempt Fund
November 30, 2010
| Municipal Bonds (continued) | |
| | | Par ($) | | Value ($) | |
| Student Loan – 0.5% | |
| MA Educational Financing Authority | |
| Series 2008 H, AMT, | |
Insured: AGC
6.350% 01/01/30 | | | 10,090,000 | | | | 10,497,131 | | |
| Student Loan Total | | | 10,497,131 | | |
| Education Total | | | 146,929,219 | | |
| Health Care – 8.4% | |
| Continuing Care Retirement – 1.4% | |
| MA Development Finance Agency | |
| Series 2009, | |
| 7.750% 06/01/39 | | | 2,250,000 | | | | 2,333,385 | | |
| MD Baltimore County | |
| Oak Crest Village, Inc., | |
Series 2007 A,
GTY AGMT: Oak Campus Partners LLC
5.000% 01/01/37 | | | 5,000,000 | | | | 4,502,450 | | |
| MO Health & Educational Facilities Authority | |
| Series 2010, | |
| 5.500% 02/01/42 | | | 2,000,000 | | | | 1,878,260 | | |
| MO St. Louis Industrial Development Authority | |
| St. Andrew's Resources for Seniors, | |
Series 2007 A,
6.375% 12/01/41 | | | 7,000,000 | | | | 6,295,380 | | |
| NC Medical Care Commission | |
| First Givens Estates, Inc., | |
Series 2007,
5.000% 07/01/33 | | | 5,000,000 | | | | 4,488,100 | | |
| Glenaire, Inc., | |
Series 2006,
5.500% 10/01/31 | | | 2,500,000 | | | | 2,269,525 | | |
| PA Montgomery County Industrial Development Authority | |
| Whitemarsh Continuing Care Retirement Community, | |
Series 2005,
6.125% 02/01/28 | | | 2,000,000 | | | | 1,780,840 | | |
| TX Bexar County Health Facilities Development Corp. | |
| Series 2010, | |
| 6.200% 07/01/45 | | | 2,300,000 | | | | 2,303,128 | | |
TX Tarrant County Cultural Education Facilities
Finance Corp. | |
| CC Young Memorial Home, | |
Series 2009,
8.000% 02/15/38 | | | 4,000,000 | | | | 3,938,280 | | |
| Continuing Care Retirement Total | | | 29,789,348 | | |
| | | Par ($) | | Value ($) | |
| Health Services – 0.5% | |
| MA Development Finance Agency | |
| Boston Biomedical Research Institute, | |
Series 1999,
5.650% 02/01/19 | | | 1,210,000 | | | | 1,171,934 | | |
MN Minneapolis & St. Paul Housing &
Redevelopment Authority | |
| Group Health Plan, Inc., | |
Series 2003,
6.000% 12/01/17 | | | 1,650,000 | | | | 1,758,372 | | |
| WI Health & Educational Facilities Authority | |
| Marshfield Clinic, | |
Series 1999,
Insured: RAD
6.250% 02/15/29 | | | 7,200,000 | | | | 7,201,296 | | |
| Health Services Total | | | 10,131,602 | | |
| Hospitals – 5.2% | |
| AL Montgomery Medical Clinic Board | |
| Jackson Hospital & Clinic, | |
Series 2006,
4.750% 03/01/36 | | | 1,000,000 | | | | 826,010 | | |
| CA ABAG Finance Authority for Nonprofit Corps. | |
| San Diego Hospital Association, | |
Series 2003 C,
5.375% 03/01/20 | | | 1,320,000 | | | | 1,344,486 | | |
| CA Kaweah Delta Health Care District | |
| Series 2006, | |
| 4.500% 06/01/34 | | | 9,500,000 | | | | 7,645,505 | | |
| FL Hillsborough County Industrial Development Authority | |
| Tampa General Hospital, | |
Series 2003 A:
5.000% 10/01/18 | | | 825,000 | | | | 839,116 | | |
| 5.250% 10/01/24 | | | 4,000,000 | | | | 3,972,520 | | |
| FL Orange County Health Facilities Authority | |
| Orlando Health, Inc., | |
Series 2009,
5.125% 10/01/26 | | | 4,350,000 | | | | 4,274,701 | | |
| FL South Lake Hospital District | |
| South Lake Hospital, Inc., | |
Series 2010,
6.250% 04/01/39 | | | 1,335,000 | | | | 1,352,836 | | |
| FL West Orange Health Care District | |
| Series 2001 A, | |
| 5.650% 02/01/22 | | | 3,650,000 | | | | 3,682,047 | | |
See Accompanying Notes to Financial Statements.
9
Columbia Tax-Exempt Fund
November 30, 2010
| Municipal Bonds (continued) | |
| | | Par ($) | | Value ($) | |
| GA Chatham County Hospital Authority | |
| Memorial Health University Medical Center, | |
Series 2004 A,
5.500% 01/01/34 | | | 2,500,000 | | | | 2,070,400 | | |
| LA Public Facilities Authority | |
| Touro Infirmary, | |
Series 1999 A,
5.625% 08/15/29 | | | 10,940,000 | | | | 8,979,333 | | |
| MA Health & Educational Facilities Authority | |
| Care Group, Inc., | |
Series 2008,
5.125% 07/01/33 | | | 2,000,000 | | | | 1,893,680 | | |
| Partners Healthcare System, | |
Series 2010,
5.000% 07/01/34 | | | 9,900,000 | | | | 9,845,253 | | |
| Series 1998 B-2, | |
Insured: NPFGC
5.375% 02/01/28 | | | 1,380,000 | | | | 1,393,276 | | |
| MD Health & Higher Educational Facilities Authority | |
| University of Maryland Medical Systems, | |
Series 2005,
Insured: AMBAC
5.250% 07/01/28 | | | 3,000,000 | | | | 3,102,210 | | |
| MI Hospital Finance Authority Revenue | |
| Henry Ford Health Systems, | |
Series 2006 A,
5.250% 11/15/32 | | | 2,000,000 | | | | 1,869,040 | | |
| MS Medical Center Building Corp. | |
| University of Mississippi Medical Center, | |
Series 1998,
Insured: AMBAC
5.500% 12/01/23 | | | 5,300,000 | | | | 5,842,667 | | |
| NC Medical Care Commission | |
| Wilson Memorial Hospital, | |
Series 1997,
Insured: AMBAC
(a) 11/01/14 | | | 1,380,000 | | | | 1,209,322 | | |
| NJ Health Care Facilities Financing Authority | |
| St. Joseph's Hospital & Medical Center, | |
Series 2008,
6.625% 07/01/38 | | | 4,000,000 | | | | 4,089,200 | | |
| NY Albany Industrial Development Agency | |
| St. Peter's Hospital, | |
Series 2008 A,
5.250% 11/15/27 | | | 3,830,000 | | | | 3,712,879 | | |
| | | Par ($) | | Value ($) | |
| NY Dormitory Authority | |
| Long Island Jewish Medical, | |
Series 2009,
5.500% 05/01/37 | | | 4,250,000 | | | | 4,318,467 | | |
| SC Greenville Hospital System Board | |
| GHS Partners in Health, | |
Series 2001,
GTY AGMT: Endowment Fund Greenville,
Insured: AMBAC
5.500% 05/01/26 | | | 5,000,000 | | | | 5,097,250 | | |
| TN Knox County Health, Educational & Housing Facilities Authority | |
| Fort Sanders Alliance, | |
Series 1993,
Insured: NPFGC
5.250% 01/01/15 | | | 5,000,000 | | | | 5,433,500 | | |
| TN Sullivan County Health, Educational & Housing Facilities Board | |
| Wellmont Health System, | |
Series 2006 C,
5.250% 09/01/36 | | | 6,865,000 | | | | 6,022,733 | | |
| VA Fairfax County Industrial Development Authority | |
| Inova Alexandria Health Service, | |
Series 2009,
5.500% 05/15/35 | | | 4,000,000 | | | | 4,209,720 | | |
| Inova Health System, | |
Series 1993,
5.000% 08/15/23 | | | 10,000,000 | | | | 10,770,400 | | |
| WI Health & Educational Facilities Authority | |
| Aurora Health Care, Inc.: | |
Series 1999 A,
5.600% 02/15/29 | | | 4,000,000 | | | | 4,000,240 | | |
| Series 2003, | |
| 6.400% 04/15/33 | | | 4,250,000 | | | | 4,324,290 | | |
| Hospitals Total | | | 112,121,081 | | |
| Intermediate Care Facilities – 0.5% | |
| IL Development Finance Authority | |
| Hoosier Care, Inc., | |
Series 1999 A,
7.125% 06/01/34 | | | 2,195,000 | | | | 1,980,131 | | |
| IN Health Facilities Financing Authority | |
| Hoosier Care, Inc., | |
Series 1999 A,
7.125% 06/01/34 | | | 11,335,000 | | | | 10,225,417 | | |
| Intermediate Care Facilities Total | | | 12,205,548 | | |
See Accompanying Notes to Financial Statements.
10
Columbia Tax-Exempt Fund
November 30, 2010
| Municipal Bonds (continued) | |
| | | Par ($) | | Value ($) | |
| Nursing Homes – 0.8% | |
| IA Finance Authority | |
| Care Initiatives, | |
Series 1998 B,
5.750% 07/01/28 | | | 4,500,000 | | | | 3,834,900 | | |
| IA Marion Health Care Facilities | |
| AHF/Kentucky-Iowa, Inc., | |
Series 2003,
8.000% 01/01/29 | | | 189,000 | | | | 188,089 | | |
| MA Industrial Finance Agency | |
| Quaside, Inc., | |
Series 1994,
8.300% 07/01/23 | | | 9,385,000 | | | | 4,759,227 | | |
| PA Chester County Industrial Development Authority | |
| Pennsylvania Nursing Home, | |
Series 2002,
8.500% 05/01/32 | | | 6,050,000 | | | | 5,409,063 | | |
| PA Washington County Industrial Development Authority | |
| AHF Project, | |
Series 2003,
8.500% 01/01/29 | | | 2,175,000 | | | | 2,166,800 | | |
| TN Metropolitan Government Nashville & Davidson County Health & Education Board | |
| AHF Project, | |
Series 2003,
8.500% 01/01/29 | | | 499,000 | | | | 497,119 | | |
| Nursing Homes Total | | | 16,855,198 | | |
| Health Care Total | | | 181,102,777 | | |
| Housing – 3.9% | |
| Assisted Living/Senior – 0.2% | |
| MN Roseville | |
| Care Institute, Inc., | |
Series 1993,
7.750% 11/01/23 | | | 3,275,000 | | | | 2,551,585 | | |
| NY Suffolk County Industrial Development Agency | |
| Gurwin Jewish-Phase II, | |
Series 2004,
6.700% 05/01/39 | | | 880,000 | | | | 861,344 | | |
| Assisted Living/Senior Total | | | 3,412,929 | | |
| | | Par ($) | | Value ($) | |
| Multi-Family – 3.2% | |
| CO Educational & Cultural Facilities Authority | |
| Campus Village Apartments LLC, | |
Series 2008 CA:
5.500% 06/01/33 | | | 2,000,000 | | | | 2,003,560 | | |
| 5.500% 06/01/38 | | | 6,000,000 | | | | 5,932,920 | | |
| FL Broward County Housing Finance Authority | |
| Chaves Lake Apartments Ltd., | |
Series 2000 A, AMT,
7.500% 07/01/40 | | | 7,925,000 | | | | 7,603,403 | | |
| Cross Keys Apartments, | |
Series 1998 A, AMT,
5.750% 10/01/28 | | | 985,000 | | | | 953,973 | | |
| FL Capital Trust Agency | |
| Atlantic Housing Foundation, | |
Series 2008 B,
4.989% 07/15/32 (e) | | | 1,895,000 | | | | 937,589 | | |
| FL Clay County Housing Finance Authority | |
| Breckenridge Commons Ltd., | |
Series 2000 A, AMT,
7.450% 07/01/40 | | | 3,872,425 | | | | 3,615,490 | | |
| MA Housing Finance Agency | |
| Series 2004 A, AMT, | |
Insured: AGMC
5.250% 07/01/25 | | | 10,000,000 | | | | 10,064,300 | | |
| MD Economic Development Corp. | |
| Collegiate Housing Foundation, | |
Series 1999 A,
6.000% 06/01/30 | | | 3,000,000 | | | | 2,912,850 | | |
| MO St. Louis Area Housing Finance Corp. | |
| Wellington Arms III, | |
Series 1979,
7.375% 01/01/21 | | | 1,302,969 | | | | 1,306,695 | | |
| NC Durham Housing Authority | |
| Magnolia Pointe Apartments, | |
Series 2005, AMT,
5.650% 02/01/38 | | | 3,234,088 | | | | 2,421,847 | | |
| NC Medical Care Commission | |
| ARC Project, | |
Series 2004 A,
5.800% 10/01/34 | | | 1,400,000 | | | | 1,406,300 | | |
| NJ Economic Development Authority | |
| Provident Group-Montclair, | |
Series 2010,
5.875% 06/01/42 | | | 13,000,000 | | | | 12,916,930 | | |
See Accompanying Notes to Financial Statements.
11
Columbia Tax-Exempt Fund
November 30, 2010
| Municipal Bonds (continued) | |
| | | Par ($) | | Value ($) | |
| NY New York City Housing Development Corp. | |
| Series 2005 F-1, | |
| 4.650% 11/01/25 | | | 5,000,000 | | | | 5,072,250 | | |
| OK County Finance Authority | |
| Sail Associates LLC, | |
Series 2007, AMT,
LOC: Bank of the West
5.250% 12/01/41 (c) | | | 1,475,000 | | | | 1,489,366 | | |
| PA Higher Educational Facilities Authority | |
| Edinboro University Foundation: | |
Series 2008,
5.750% 07/01/28 | | | 3,000,000 | | | | 2,973,630 | | |
Series 2010,
6.000% 07/01/43 | | | 1,450,000 | | | | 1,415,476 | | |
| Resolution Trust Corp. | |
| Pass-Through Certificates, | |
Series 1993 A,
8.500% 12/01/16 (f) | | | 6,615,223 | | | | 6,296,104 | | |
| Multi-Family Total | | | 69,322,683 | | |
| Single-Family – 0.5% | |
| CA Department of Veterans Affairs | |
| Series 2007, AMT, | |
| 4.850% 12/01/22 | | | 1,700,000 | | | | 1,667,581 | | |
| CO El Paso County School District No. 11 | |
| Series 1988 A, AMT, | |
Guarantor: GNMA
8.375% 03/25/19 | | | 60,159 | | | | 61,297 | | |
| FL Brevard County | |
| Series 1985, | |
Insured: FGIC
(a) 04/01/17 | | | 375,000 | | | | 203,588 | | |
| MD Community Development Administration Department of Housing & Community Development | |
| Series 2006 B, AMT, | |
| 4.900% 09/01/37 | | | 4,765,000 | | | | 4,606,087 | | |
| ME Housing Authority | |
| Series 2006 D, AMT, | |
| 4.950% 11/15/31 | | | 2,010,000 | | | | 1,984,151 | | |
| WA Housing Finance Commission | |
| Series 2006 3-A, AMT, | |
Guarantor: GNMA
5.000% 12/01/37 | | | 2,905,000 | | | | 2,837,691 | | |
| Single-Family Total | | | 11,360,395 | | |
| Housing Total | | | 84,096,007 | | |
| | | Par ($) | | Value ($) | |
| Industrials – 3.1% | |
| Chemicals – 0.1% | |
| LA Local Government Environmental Facilities & Community Development Authority | |
| Series 2010 A2, | |
| 6.500% 11/01/35 (g) | | | 2,800,000 | | | | 2,850,792 | | |
| Chemicals Total | | | 2,850,792 | | |
| Food Products – 0.4% | |
| MI Strategic Fund | |
| Imperial Sugar Co.: | |
Series 1998 A,
6.250% 11/01/15 | | | 2,250,000 | | | | 2,139,547 | | |
Series 1998 B,
6.450% 11/01/25 | | | 3,500,000 | | | | 3,062,395 | | |
Series 1998 C, AMT,
GTY AGMT: Imperial Sugar Co.
6.550% 11/01/25 | | | 4,250,000 | | | | 3,591,165 | | |
| Food Products Total | | | 8,793,107 | | |
| Forest Products & Paper – 0.4% | |
| FL Escambia County Environmental Improvement Revenue | |
| International Paper Co., | |
Series 2003 A, AMT,
5.750% 11/01/27 | | | 2,750,000 | | | | 2,753,492 | | |
| GA Rockdale County Development Authority | |
| Visy Paper, Inc., | |
Series 2007 A, AMT,
GTY AGMT: Pratt USA
6.125% 01/01/34 | | | 2,000,000 | | | | 1,888,100 | | |
| MS Lowndes County | |
| Weyerhaeuser Co., | |
Series 1992 A,
6.800% 04/01/22 | | | 2,470,000 | | | | 2,709,368 | | |
| SC Richland County | |
| International Paper Co., | |
Series 2003, AMT,
6.100% 04/01/23 | | | 1,000,000 | | | | 1,012,510 | | |
| Forest Products & Paper Total | | | 8,363,470 | | |
| Manufacturing – 0.6% | |
| IL Will-Kankakee Regional Development Authority | |
| Flanders Corp., | |
Series 1997, AMT,
6.500% 12/15/17 | | | 1,660,000 | | | | 1,627,946 | | |
| KS Wichita Airport Authority | |
| Cessna Citation Service Center, | |
Series 2002 A, AMT,
GTY AGMT: Textron, Inc.
6.250% 06/15/32 | | | 5,000,000 | | | | 4,478,300 | | |
See Accompanying Notes to Financial Statements.
12
Columbia Tax-Exempt Fund
November 30, 2010
| Municipal Bonds (continued) | |
| | | Par ($) | | Value ($) | |
| MO Development Finance Board | |
| Procter & Gamble Co., | |
Series 1999, AMT,
5.200% 03/15/29 | | | 4,385,000 | | | | 4,415,607 | | |
| MO St. Louis Industrial Development Authority | |
| Anheuser-Busch Companies, Inc., | |
Series 1991,
6.650% 05/01/16 | | | 1,400,000 | | | | 1,649,200 | | |
| Manufacturing Total | | | 12,171,053 | | |
| Oil & Gas – 1.1% | |
| AZ Salt Verde Financial Corp. Senior Gas Revenue | |
| Series 2007, | |
| 5.000% 12/01/32 | | | 5,400,000 | | | | 4,873,068 | | |
| LA St. John Baptist Parish | |
| Marathon Oil Corp., | |
Series 2007 A,
5.125% 06/01/37 | | | 12,750,000 | | | | 11,835,825 | | |
| TN Energy Acquisition Corp. | |
| Series 2006, | |
| 5.250% 09/01/26 | | | 1,250,000 | | | | 1,212,138 | | |
| TX Texas City Industrial Development Corp. | |
| BP Pipelines N.A., Inc., | |
Series 1990,
GTY AGMT: Atlantic Richfield Co.
7.375% 10/01/20 | | | 2,000,000 | | | | 2,361,920 | | |
| VI Virgin Islands Public Finance Authority | |
| Hovensa LLC, | |
Series 2003, AMT,
6.125% 07/01/22 | | | 2,975,000 | | | | 2,979,343 | | |
| Oil & Gas Total | | | 23,262,294 | | |
| Other Industrial Development Bonds – 0.5% | |
| MI Strategic Fund | |
| NSF International, | |
Series 2004,
5.250% 08/01/26 | | | 600,000 | | | | 580,056 | | |
| NJ Economic Development Authority | |
| GMT Realty LLC, | |
Series 2006 B, AMT,
6.875% 01/01/37 | | | 7,000,000 | | | | 6,162,940 | | |
| PA Dauphin County Industrial Development Authority | |
| General Waterworks Corp., | |
Series 1992 A, AMT,
6.900% 06/01/24 | | | 3,400,000 | | | | 3,963,346 | | |
| Other Industrial Development Bonds Total | | | 10,706,342 | | |
| Industrials Total | | | 66,147,058 | | |
| | | Par ($) | | Value ($) | |
| Other – 13.3% | |
| Other – 0.8% | |
| LA New Orleans Aviation Board | |
| Series 2009 A, | |
| 6.250% 01/01/30 | | | 5,250,000 | | | | 5,383,455 | | |
TX Capital Area Cultural Education Facilities
Finance Corp. | |
| Series 2005 B, | |
| 6.125% 04/01/45 | | | 11,000,000 | | | | 10,790,230 | | |
| Other Total | | | 16,173,685 | | |
| Pool/Bond Bank – 1.5% | |
| FL Municipal Loan Council | |
| Series 2000 A, | |
Insured: NPFGC
(a) 04/01/21 | | | 1,000,000 | | | | 588,250 | | |
IL Metropolitan Water Reclamation District
Greater Chicago | |
| Series 2007 C, | |
| 5.250% 12/01/33 | | | 13,210,000 | | | | 14,824,130 | | |
| MA Water Pollution Abatement Trust | |
| Series 1999 A, | |
| 6.000% 08/01/17 | | | 10,000,000 | | | | 12,403,800 | | |
| Series 2006, | |
| 5.250% 08/01/24 | | | 4,000,000 | | | | 4,690,360 | | |
| Pool/Bond Bank Total | | | 32,506,540 | | |
| Refunded/Escrowed (h) – 10.6% | |
| AZ Pima County Industrial Development Authority | |
| Series 1989, AMT, | |
Escrowed to Maturity,
8.200% 09/01/21 | | | 11,845,000 | | | | 15,910,322 | | |
| CA Foothill Eastern Transportation Corridor Agency | |
| Series 1995 A, | |
Escrowed to Maturity,
(a) 01/01/18 | | | 10,000,000 | | | | 8,350,600 | | |
| CA Morgan Hill Unified School District | |
| Series 2002, | |
Escrowed to Maturity,
Insured: FGIC
(a) 08/01/22 | | | 3,345,000 | | | | 2,226,399 | | |
| CA Palmdale Community Redevelopment Agency | |
| Series 1986 D, AMT, | |
Escrowed to Maturity,
Insured: FHA
8.000% 04/01/16 | | | 7,000,000 | | | | 8,937,880 | | |
See Accompanying Notes to Financial Statements.
13
Columbia Tax-Exempt Fund
November 30, 2010
| Municipal Bonds (continued) | |
| | | Par ($) | | Value ($) | |
| CA Perris Community Facilities District | |
| Series 1991 2-90, | |
Escrowed to Maturity,
8.750% 10/01/21 | | | 6,165,000 | | | | 9,353,415 | | |
| CA Pomona | |
| Series 1990 A, | |
Escrowed to Maturity,
Guarantor: GNMA
7.600% 05/01/23 | | | 8,315,000 | | | | 10,929,569 | | |
| CO Health Facilities Authority | |
| American Housing Foundation I, Inc., | |
Series 2003 A,
Pre-refunded 12/01/11,
8.500% 12/01/31 | | | 885,000 | | | | 948,764 | | |
| FL Jacksonville Transportation Authority | |
| Series 1985, | |
Escrowed to Maturity,
9.200% 01/01/15 | | | 2,000,000 | | | | 2,328,120 | | |
| FL Melbourne | |
| Series 2000 A, | |
Escrowed to Maturity,
Insured: FGIC
(a) 10/01/19 | | | 600,000 | | | | 454,818 | | |
| FL Mid-Bay Bridge Authority | |
| Series 1991 A, | |
Escrowed to Maturity,
6.875% 10/01/22 | | | 2,000,000 | | | | 2,605,080 | | |
| FL Orange County Health Facilities Authority | |
| Orlando Regional Health Care System, | |
Series 1996 A,
Escrowed to Maturity,
Insured: NPFGC
6.250% 10/01/16 | | | 2,120,000 | | | | 2,547,519 | | |
| FL Seminole County | |
| Series 1992, | |
Escrowed to Maturity,
Insured: NPFGC
6.000% 10/01/19 | | | 1,030,000 | | | | 1,230,675 | | |
| GA Fulton County Water & Sewer | |
| Series 1992, | |
Escrowed to Maturity,
Insured: FGIC
6.375% 01/01/14 | | | 12,000,000 | | | | 13,012,440 | | |
| | | Par ($) | | Value ($) | |
| GA Municipal Electric Authority | |
| Series 1991: | |
Escrowed to Maturity,
Insured: NPFGC
6.600% 01/01/18 | | | 3,600,000 | | | | 4,341,636 | | |
| Pre-refunded to Various Dates, | |
Insured: NPFGC
6.600% 01/01/18 | | | 420,000 | | | | 487,511 | | |
| ID Health Facilities Authority | |
| IHC Hospitals, Inc., | |
Series 1992,
Escrowed to Maturity,
6.650% 02/15/21 | | | 6,000,000 | | | | 7,872,300 | | |
| IL Glendale Heights | |
| Series 1985 B, | |
Escrowed to Maturity,
7.100% 12/01/15 | | | 1,045,000 | | | | 1,201,332 | | |
| MA College Building Authority | |
| Series 1999 A, | |
Escrowed to Maturity,
Insured: NPFGC:
(a) 05/01/19 | | | 7,710,000 | | | | 5,970,547 | | |
| (a) 05/01/20 | | | 7,750,000 | | | | 5,704,388 | | |
| MA Turnpike Authority | |
| Series 1993 A, | |
Escrowed to Maturity,
Insured: FGIC
5.125% 01/01/23 | | | 3,600,000 | | | | 4,188,276 | | |
| MA Water Resources Authority | |
| Series 1992 A, | |
Escrowed to Maturity,
Insured: FGIC
6.500% 07/15/19 | | | 5,000,000 | | | | 6,124,300 | | |
| MI State | |
| 525 Redevco, Inc., | | | | | |
Series 2000,
Escrowed to Maturity,
Insured: AMBAC
(a) 06/01/21 | | | 6,000,000 | | | | 4,153,440 | | |
| MN University of Minnesota | |
| Series 1996 A, | |
Escrowed to Maturity,
5.500% 07/01/21 | | | 1,000,000 | | | | 1,167,910 | | |
See Accompanying Notes to Financial Statements.
14
Columbia Tax-Exempt Fund
November 30, 2010
| Municipal Bonds (continued) | |
| | | Par ($) | | Value ($) | |
| MN Western Minnesota Municipal Power Agency | |
| Series 1983 A, | |
Escrowed to Maturity,
Insured: NPFGC
9.750% 01/01/16 | | | 1,000,000 | | | | 1,334,890 | | |
| NC Eastern Municipal Power Agency | |
| Series 1987 A, | |
Pre-refunded 01/01/22,
4.500% 01/01/24 | | | 1,750,000 | | | | 1,967,840 | | |
| Series 1991 A, | |
Escrowed to Maturity,
5.000% 01/01/21 | | | 8,735,000 | | | | 10,105,521 | | |
| NE Omaha Public Power District | |
| Series 1992 B, | |
Escrowed to Maturity,
6.200% 02/01/17 | | | 1,600,000 | | | | 1,859,088 | | |
| NJ Turnpike Authority | |
| Series 1991 C, | |
Escrowed to Maturity,
Insured: NPFGC
6.500% 01/01/16 | | | 11,000,000 | | | | 12,520,860 | | |
| NY Triborough Bridge & Tunnel Authority | |
| Series 1992 Y, | |
Escrowed to Maturity,
6.125% 01/01/21 | | | 11,000,000 | | | | 13,939,310 | | |
| Series 1992, | |
Escrowed to Maturity,
Insured: CAP
6.125% 01/01/21 | | | 7,000,000 | | | | 8,870,470 | | |
| PA Cambria County Industrial Development Authority | |
| Beverly Enterprises, | |
Series 1987,
Escrowed to Maturity,
10.000% 06/18/12 | | | 400,000 | | | | 434,740 | | |
| PA Convention Center Authority | |
| Series 1989 A, | |
Escrowed to Maturity,
Insured: FGIC
6.000% 09/01/19 | | | 14,010,000 | | | | 16,990,487 | | |
| PR Commonwealth of Puerto Rico Public Finance Corp. | |
| Series 1998 A, | |
Economically Defeased to Maturity,
Insured: AMBAC
5.125% 06/01/24 | | | 3,000,000 | | | | 3,364,320 | | |
| Series 2002 E, | |
Escrowed to Maturity,
6.000% 08/01/26 | | | 2,470,000 | | | | 3,151,053 | | |
| | | Par ($) | | Value ($) | |
| SC Piedmont Municipal Power Agency | |
| Series 1993, | |
Escrowed to Maturity,
Insured: NPFGC
5.375% 01/01/25 | | | 3,960,000 | | | | 4,637,041 | | |
| TX Houston Water & Sewer System | |
| Series 1998 A, | |
Escrowed to Maturity,
Insured: AGMC:
(a) 12/01/19 | | | 26,955,000 | | | | 20,236,197 | | |
| (a) 12/01/23 | | | 2,515,000 | | | | 1,530,201 | | |
| UT Provo | |
| Series 1980, | |
Escrowed to Maturity,
10.125% 04/01/15 | | | 975,000 | | | | 1,174,017 | | |
| VA Tobacco Settlement Financing Corp. | |
| Series 2005, | |
Refunded to Various Dates,
5.500% 06/01/26 | | | 5,000,000 | | | | 5,590,350 | | |
| Refunded/Escrowed Total | | | 227,753,626 | | |
| Tobacco – 0.4% | |
| CA Golden State Tobacco Securitization Corp. | |
| Series 2007 A-1, | |
| 5.000% 06/01/33 | | | 2,500,000 | | | | 1,847,225 | | |
| NJ Tobacco Settlement Financing Corp. | |
| Series 2007 1-A, | |
| 4.625% 06/01/26 | | | 5,055,000 | | | | 4,073,976 | | |
| OH Buckeye Tobacco Settlement Financing Authority | |
| Series 2007 A-2, | |
| 5.125% 06/01/24 | | | 3,750,000 | | | | 3,082,275 | | |
| Tobacco Total | | | 9,003,476 | | |
| Other Total | | | 285,437,327 | | |
| Other Revenue – 1.5% | |
| Hotels – 0.1% | |
| MA Boston Industrial Development Financing Authority | |
| Crosstown Center Hotel LLC, | |
Series 2002, AMT,
6.500% 09/01/35 | | | 2,845,000 | | | | 1,645,662 | | |
| NJ Middlesex County Improvement Authority | |
| Heldrich Associates LLC: | |
Series 2005 B,
6.250% 01/01/37 (i) | | | 4,000,000 | | | | 600,000 | | |
See Accompanying Notes to Financial Statements.
15
Columbia Tax-Exempt Fund
November 30, 2010
| Municipal Bonds (continued) | |
| | | Par ($) | | Value ($) | |
| Series 2005 C, | |
| 8.750% 01/01/37 (i) | | | 1,500,000 | | | | 150,000 | | |
| Hotels Total | | | 2,395,662 | | |
| Recreation – 1.4% | |
| CA Agua Caliente Band Cahuilla Indians | |
| Series 2003, | |
| 6.000% 07/01/18 (f) | | | 1,750,000 | | | | 1,807,557 | | |
| CA Cabazon Band Mission Indians | |
| Series 2004: | |
| 4.840% 10/01/15 (e)(f) | | | 1,740,000 | | | | 1,168,758 | | |
| 5.050% 10/01/19 (e)(f) | | | 8,670,000 | | | | 5,715,958 | | |
| 7.358% 10/01/11 (e) | | | 400,000 | | | | 304,752 | | |
| Series 2010, | |
| 8.375% 10/01/20 | | | 1,415,000 | | | | 1,399,407 | | |
| CT Mashantucket Western Pequot Tribe | |
| Series 2007 A, | |
| 5.750% 09/01/34 (f)(i) | | | 4,000,000 | | | | 1,853,480 | | |
| FL Seminole Indian Tribe | |
| Series 2007 A, | |
| 5.250% 10/01/27 (f) | | | 6,750,000 | | | | 6,039,832 | | |
| NY Industrial Development Agency | |
| Yankee Stadium, | |
Series 2006,
Insured: FGIC
5.000% 03/01/46 | | | 2,000,000 | | | | 1,898,120 | | |
| OK Chickasaw Nation | |
| Series 2007, | |
| 6.000% 12/01/25 (f) | | | 6,030,000 | | | | 6,282,476 | | |
| OR Cow Creek Band Umpqua Tribe of Indians | |
| Series 2006 C, | |
| 5.625% 10/01/26 (f) | | | 3,500,000 | | | | 2,806,195 | | |
| Recreation Total | | | 29,276,535 | | |
| Other Revenue Total | | | 31,672,197 | | |
| Resource Recovery – 0.4% | |
| Disposal – 0.1% | |
| NV Department of Business & Industry | |
| Republic Services, Inc., | |
Series 2003, AMT,
5.625% 12/01/26
(06/01/18) (c)(d) | | | 2,000,000 | | | | 2,101,160 | | |
| Disposal Total | | | 2,101,160 | | |
| | | Par ($) | | Value ($) | |
| Resource Recovery – 0.3% | |
| PA Economic Development Financing Authority | |
| Philidelphia Project Finance, | |
Series 2009 B,
6.250% 01/01/32 | | | 5,325,000 | | | | 5,484,484 | | |
| Resource Recovery Total | | | 5,484,484 | | |
| Resource Recovery Total | | | 7,585,644 | | |
| Tax-Backed – 36.1% | |
| Local Appropriated – 2.5% | |
| CA Los Angeles County Schools | |
| Series 1999 A, | |
Insured: AMBAC
(a) 08/01/22 | | | 2,180,000 | | | | 1,027,826 | | |
| IL Chicago Board of Education | |
| Series 1992 A, | |
Insured: NPFGC:
6.000% 01/01/16 | | | 5,000,000 | | | | 5,797,150 | | |
| 6.000% 01/01/20 | | | 8,000,000 | | | | 9,266,560 | | |
| 6.250% 01/01/15 | | | 12,900,000 | | | | 14,129,370 | | |
| IN Crown Point School Building Corp. | |
| Series 2000, | |
Insured: NPFGC
(a) 01/15/19 | | | 8,165,000 | | | | 5,794,864 | | |
| IN Noblesville Redevelopment Authority | |
| Series 2006 A, | |
| 5.250% 08/01/25 | | | 2,000,000 | | | | 2,113,120 | | |
| MN Hibbing Economic Development Authority | |
| Series 1997, | |
| 6.400% 02/01/12 | | | 270,000 | | | | 270,300 | | |
| MO St. Louis Industrial Development Authority | |
| St. Louis Convention Center, | |
Series 2000,
Insured: AMBAC
(a) 07/15/18 | | | 2,000,000 | | | | 1,262,640 | | |
| SC Scago Educational Facilities Corp. for Spartanburg School District No. 5 | |
| Series 2005, | |
Insured: AGMC
4.600% 04/01/22 | | | 8,885,000 | | | | 9,149,951 | | |
| TX Houston Independent School District | |
| Series 1998 A, | |
Insured: AMBAC:
(a) 09/15/18 | | | 3,885,000 | | | | 2,996,190 | | |
| (a) 09/15/20 | | | 3,885,000 | | | | 2,688,847 | | |
| Local Appropriated Total | | | 54,496,818 | | |
See Accompanying Notes to Financial Statements.
16
Columbia Tax-Exempt Fund
November 30, 2010
| Municipal Bonds (continued) | |
| | | Par ($) | | Value ($) | |
| Local General Obligations – 8.0% | |
| AZ Tucson | |
| Series 1994 G, | |
Insured: NPFGC
7.625% 07/01/14 | | | 3,140,000 | | | | 3,811,426 | | |
| CA Alvord Unified School District | |
| Series 2002 A, | |
Insured: NPFGC
5.900% 02/01/19 | | | 1,975,000 | | | | 2,287,406 | | |
| CA Benicia Unified School District | |
| Series 1997 A, | |
Insured: NPFGC
(a) 08/01/21 | | | 5,955,000 | | | | 3,304,429 | | |
| CA Clovis Unified School District | |
| Series 2004 A, | |
Insured: NPFGC
(a) 08/01/20 | | | 7,000,000 | | | | 4,474,120 | | |
| CA Norwalk LA Mirada Unified School District | |
| Series 2005 B, | |
Insured: NPFGC
(a) 08/01/23 | | | 9,790,000 | | | | 4,757,940 | | |
| CA Poway Unified School District | |
| Series 2009 A, | |
| (a) 08/01/24 | | | 1,750,000 | | | | 807,380 | | |
| CA San Diego Unified School District | |
| Series 2009 A, | |
| (a) 07/01/30 | | | 22,500,000 | | | | 6,702,075 | | |
| CA San Juan Unified School District | |
| Series 2001, | |
Insured: AGMC
(a) 08/01/18 | | | 1,785,000 | | | | 1,306,959 | | |
| CA San Ysidro School District | |
| Series 2005 D, | |
Insured: NPFGC
(a) 08/01/23 | | | 2,330,000 | | | | 1,076,693 | | |
| CA Vallejo City Unified School District | |
| Series 2002 A, | |
Insured: NPFGC
5.900% 02/01/20 | | | 1,000,000 | | | | 1,051,650 | | |
| CA West Contra Costa Unified School District | |
| Series 2001 B, | |
Insured: NPFGC
6.000% 08/01/24 | | | 2,320,000 | | | | 2,523,534 | | |
| | | Par ($) | | Value ($) | |
| CA Yuba City Unified School District | |
| Series 2000, | |
Insured: NPFGC
(a) 09/01/18 | | | 1,160,000 | | | | 796,584 | | |
| IL Champaign County | |
| Series 1999, | |
Insured: NPFGC:
8.250% 01/01/20 | | | 1,015,000 | | | | 1,368,565 | | |
| 8.250% 01/01/23 | | | 1,420,000 | | | | 1,952,457 | | |
| IL Chicago Board of Education | |
| Series 1998 B-1, | |
Insured: NPFGC:
(a) 12/01/21 | | | 8,000,000 | | | | 4,639,840 | | |
| (a) 12/01/22 | | | 25,200,000 | | | | 13,726,692 | | |
| Series 2005 A, | |
Insured: AMBAC
5.500% 12/01/22 | | | 4,750,000 | | | | 5,235,070 | | |
| IL Chicago | |
| Series 1999, | |
Insured: NPFGC
5.500% 01/01/23 | | | 9,750,000 | | | | 10,976,550 | | |
| IL Cook County School District No. 102 | |
| Series 2001, | |
Insured: NPFGC
(a) 12/01/20 | | | 3,065,000 | | | | 2,011,927 | | |
IL Cook County School District
No. 209-Provisional Township | |
| Series 2004, | |
Insured: AGMC
5.000% 12/01/15 | | | 1,750,000 | | | | 2,017,225 | | |
IL De Kalb County Community Unified School
District No. 424 | |
| Series 2001, | |
Insured: AMBAC:
(a) 01/01/20 | | | 2,575,000 | | | | 1,720,126 | | |
| (a) 01/01/21 | | | 2,675,000 | | | | 1,684,207 | | |
IL Du Page County Community High School
District No. 99 | |
| Series 1993, | |
| 5.600% 01/01/21 | | | 2,565,000 | | | | 2,979,248 | | |
| IL Kane & De Kalb Counties Community Unit School District No. 302 | |
| Series 2004, | |
Insured: NPFGC
(a) 02/01/21 | | | 3,165,000 | | | | 1,944,734 | | |
See Accompanying Notes to Financial Statements.
17
Columbia Tax-Exempt Fund
November 30, 2010
| Municipal Bonds (continued) | |
| | | Par ($) | | Value ($) | |
| IL Lake County School District No. 56 | |
| Series 1997, | |
Insured: NPFGC
9.000% 01/01/17 | | | 10,440,000 | | | | 14,038,564 | | |
| IL Will County School District No. 114 | |
| Series 2005 C, | |
Insured: NPFGC
(a) 12/01/23 | | | 2,130,000 | | | | 1,097,291 | | |
| IL Will County School District No. 365-UVY | |
| Series 1999 B, | |
Insured: AGMC
(a) 11/01/18 | | | 3,370,000 | | | | 2,421,210 | | |
| LA New Orleans | |
| Series 1991, | |
Insured: AMBAC
(a) 09/01/12 | | | 6,250,000 | | | | 5,855,687 | | |
| MI Detroit City School District | |
| Series 2005 A, | |
| 5.000% 05/01/17 | | | 2,500,000 | | | | 2,663,625 | | |
| Series 2005 A, | |
Insured: AGMC
5.250% 05/01/30 | | | 10,000,000 | | | | 9,987,500 | | |
| MI Paw Paw Public School District | |
| Series 1998, | |
Insured: NPFGC
5.000% 05/01/25 | | | 1,020,000 | | | | 1,135,658 | | |
| MI St. John's Public School | |
| Series 1998, | |
Insured: NPFGC
5.100% 05/01/25 | | | 1,790,000 | | | | 1,993,702 | | |
NJ Washington Township Board of Education
Mercer County | |
| Series 2005, | |
Insured: AGMC
5.250% 01/01/27 | | | 1,410,000 | | | | 1,617,552 | | |
| NY State | |
| Series 2007 M, | |
| 5.000% 04/01/22 | | | 2,000,000 | | | | 2,128,160 | | |
| OH Adams County Ohio Valley Local School District | |
| Series 1995, | |
Insured: NPFGC
7.000% 12/01/15 | | | 3,000,000 | | | | 3,363,930 | | |
| OH Cincinnati City School District | |
| Series 2006, | |
Insured: NPFGC
5.250% 12/01/30 | | | 4,000,000 | | | | 4,437,840 | | |
| | | Par ($) | | Value ($) | |
| OH Kings Local School District | |
| Series 1995, | |
Insured: NPFGC
7.500% 12/01/16 | | | 2,110,000 | | | | 2,545,335 | | |
| OR Linn County Community School District No. 9 | |
| Series 2005, | |
Insured: NPFGC
5.500% 06/15/30 | | | 1,435,000 | | | | 1,648,657 | | |
| PA Cornwall-Lebanon School District | |
| Series 2001, | |
Insured: AGMC
(a) 03/15/18 | | | 3,020,000 | | | | 2,384,622 | | |
| TX Dallas County Flood Control District | |
| Series 2002, | |
| 7.250% 04/01/32 | | | 7,500,000 | | | | 7,772,400 | | |
| TX Deaf Smith County Hospital District | |
| Series 2010 A, | |
| 6.500% 03/01/40 | | | 4,000,000 | | | | 3,983,920 | | |
| TX Galveston County | |
| Series 2001, | |
Insured: NPFGC
(a) 02/01/20 | | | 1,510,000 | | | | 1,059,839 | | |
| TX North East Independent School District | |
| Series 2007, | |
Insured: PSFG
5.250% 02/01/31 | | | 10,000,000 | | | | 11,330,200 | | |
| WA Clark County School District No. 37 Vancouver | |
| Series 2001 C, | |
Insured: NPFGC:
(a) 12/01/16 | | | 3,000,000 | | | | 2,591,400 | | |
| (a) 12/01/20 | | | 6,150,000 | | | | 4,260,720 | | |
| Local General Obligations Total | | | 171,474,649 | | |
| Special Non-Property Tax – 9.2% | |
| AL Jefferson County | |
| Series 2004 A, | |
| 5.250% 01/01/19 | | | 2,790,000 | | | | 2,566,744 | | |
| FL Tampa Sports Authority | |
| Series 1995, | |
Insured: NPFGC
5.750% 10/01/25 | | | 2,500,000 | | | | 2,505,350 | | |
| GA Metropolitan Atlanta Rapid Transit Authority | |
| Series 1992 P, | |
Insured: AMBAC
6.250% 07/01/20 | | | 6,000,000 | | | | 7,157,640 | | |
See Accompanying Notes to Financial Statements.
18
Columbia Tax-Exempt Fund
November 30, 2010
| Municipal Bonds (continued) | |
| | | Par ($) | | Value ($) | |
| GU Territory of Guam | |
| Series 2009 A, | |
| 5.750% 12/01/34 | | | 2,000,000 | | | | 2,023,800 | | |
| IL Metropolitan Pier & Exposition Authority | |
| Series 1993 A, | |
Insured: NPFGC
(a) 06/15/16 | | | 3,750,000 | | | | 3,066,187 | | |
| Series 2010 B2, | |
| 5.000% 06/15/50 | | | 2,875,000 | | | | 2,719,175 | | |
| IL Regional Transportation Authority | |
| Series 1994 C, | |
Insured: NPFGC
7.750% 06/01/20 | | | 5,000,000 | | | | 6,383,400 | | |
| Series 2002 A, | |
Insured: NPFGC
6.000% 07/01/31 | | | 5,400,000 | | | | 6,303,636 | | |
| IL Sales Tax Revenue | |
| Series 2002, | |
Insured: NPFGC
6.000% 06/15/23 | | | 4,000,000 | | | | 4,601,720 | | |
| KS Wyandotte County – Kansas City Unified Government | |
| Series 2010, | |
| (a) 06/01/21 | | | 18,550,000 | | | | 10,193,039 | | |
| KY Economic Development Finance Authority | |
| Louisville Arena Project, | |
Series 2008 A1,
Insured: AGC
6.000% 12/01/38 | | | 2,850,000 | | | | 2,997,374 | | |
| MA Bay Transportation Authority | |
| Series 2005 A, | |
| 5.000% 07/01/25 | | | 3,000,000 | | | | 3,367,920 | | |
| Series 2005 B, | |
Insured: NPFGC:
5.500% 07/01/26 | | | 1,500,000 | | | | 1,759,020 | | |
| 5.500% 07/01/29 | | | 2,000,000 | | | | 2,296,580 | | |
| Series 2006 A: | |
| 5.250% 07/01/29 | | | 3,185,000 | | | | 3,556,371 | | |
| 5.250% 07/01/34 | | | 22,000,000 | | | | 24,178,660 | | |
| MO Manchester | |
| Series 2010, | |
| 6.875% 11/01/39 | | | 1,500,000 | | | | 1,495,200 | | |
| NV Sparks Tourism Improvement District No. 1 | |
| Series 2008 A, | |
| 6.750% 06/15/28 (f) | | | 2,000,000 | | | | 1,875,240 | | |
| | | Par ($) | | Value ($) | |
| NY Dormitory Authority | |
| Series 2005 B, | |
Insured: AMBAC:
5.500% 03/15/24 | | | 10,170,000 | | | | 11,976,802 | | |
| 5.500% 03/15/27 | | | 11,240,000 | | | | 13,213,632 | | |
| 5.500% 03/15/29 | | | 2,030,000 | | | | 2,361,580 | | |
| 5.500% 03/15/30 | | | 6,040,000 | | | | 6,966,053 | | |
| Series 2008 B, | |
| 5.250% 03/15/38 | | | 5,000,000 | | | | 5,200,600 | | |
| NY Local Government Assistance Corp. | |
| Series 1993 E: | |
Insured: AMBAC
5.250% 04/01/16 | | | 10,000,000 | | | | 11,466,400 | | |
Insured: NPFGC
5.000% 04/01/21 | | | 3,655,000 | | | | 4,205,626 | | |
| NY Metropolitan Transportation Authority | |
| Series 2009 B, | |
| 5.000% 11/15/34 | | | 3,000,000 | | | | 3,082,800 | | |
| NY Sales Tax Asset Receivables Corp. | |
| Series 2004 A, | |
Insured: AMBAC
5.000% 10/15/32 | | | 3,950,000 | | | | 4,050,646 | | |
| OH Hamilton County Sales Tax Revenue | |
| Series 2000 B, | |
Insured: AMBAC
(a) 12/01/20 | | | 2,000,000 | | | | 1,271,120 | | |
| PR Commonwealth of Puerto Rico Highway & Transportation Authority | |
| Series 1996 Z, | |
Insured: AGMC
6.000% 07/01/18 | | | 10,000,000 | | | | 11,512,400 | | |
PR Commonwealth of Puerto Rico Sales Tax
Financing Corp. | |
| Series 2010 C, | |
| 5.250% 08/01/41 | | | 10,000,000 | | | | 9,849,300 | | |
| TX Harris County Houston Sports Authority | |
| Series 2001 A, | |
Insured: NPFGC:
(a) 11/15/14 | | | 3,905,000 | | | | 2,995,721 | | |
| (a) 11/15/15 | | | 3,975,000 | | | | 2,838,269 | | |
| (a) 11/15/16 | | | 4,040,000 | | | | 2,668,945 | | |
| TX Houston Hotel Occupancy | |
| Series 2001 B, | |
Insured: AMBAC
(a) 09/01/17 | | | 2,000,000 | | | | 1,444,880 | | |
See Accompanying Notes to Financial Statements.
19
Columbia Tax-Exempt Fund
November 30, 2010
| Municipal Bonds (continued) | |
| | | Par ($) | | Value ($) | |
| UT Transit Authority Sales Tax Revenue | |
| Series 2006 C, | |
Insured: AGMC
5.250% 06/15/29 | | | 10,000,000 | | | | 11,357,000 | | |
VA Peninsula Town Center Community
Development Authority | |
| Series 2007, | |
| 6.250% 09/01/24 | | | 2,375,000 | | | | 2,344,600 | | |
| Special Non-Property Tax Total | | | 197,853,430 | | |
| Special Property Tax – 1.4% | |
| CA Huntington Beach Community Facilities District | |
| Grand Coast Resort, | |
Series 2001-1,
6.450% 09/01/31 | | | 1,850,000 | | | | 1,849,759 | | |
| CT Harbor Point Infrastructure Improvement District | |
| Series 2010 A, | |
| 7.875% 04/01/39 | | | 8,000,000 | | | | 8,322,480 | | |
| FL Double Branch Community Development District | |
| Series 2002 A, | |
| 6.700% 05/01/34 | | | 1,295,000 | | | | 1,321,768 | | |
| FL Tolomato Community Development District | |
| Series 2007: | |
| 6.375% 05/01/17 | | | 1,000,000 | | | | 743,910 | | |
| 6.550% 05/01/27 | | | 3,500,000 | | | | 2,548,175 | | |
| FL Village Center Community Development District | |
| Series 1998 A, | |
Insured: NPFGC
5.500% 11/01/12 | | | 750,000 | | | | 784,267 | | |
| FL Waterset North Community Development District | |
| Series 2007 A, | |
| 6.600% 05/01/39 | | | 3,000,000 | | | | 1,777,500 | | |
| FL Westchester Community Development District No. 1 | |
| Series 2003, | |
| 6.000% 05/01/23 | | | 2,095,000 | | | | 1,944,265 | | |
| IL Sports Facilities Authority | |
| Series 2001, | |
Insured: AMBAC
(a) 06/15/18 | | | 4,000,000 | | | | 2,887,360 | | |
| IN Portage | |
| Series 2006, | |
| 5.000% 01/15/27 | | | 410,000 | | | | 386,569 | | |
| OH Hickory Chase Community Authority | |
| Series 2008, | |
| 6.750% 12/01/27 | | | 6,165,000 | | | | 4,165,506 | | |
| | | Par ($) | | Value ($) | |
| OH Toledo-Lucas County Port Authority | |
| Series 2007, | |
| 5.400% 11/01/36 | | | 2,630,000 | | | | 2,098,161 | | |
| Special Property Tax Total | | | 28,829,720 | | |
| State Appropriated – 6.1% | |
| CA Public Works Board | |
| Series 2009, | |
| 6.125% 11/01/29 | | | 6,000,000 | | | | 6,274,140 | | |
| IN Office Building Commission | |
| Series 1995 B, | |
Insured: AMBAC
6.250% 07/01/16 | | | 8,000,000 | | | | 9,154,800 | | |
| NJ Economic Development Authority | |
| Series 2005 N-1: | |
| Insured: AGMC | |
| 5.500% 09/01/25 | | | 23,990,000 | | | | 26,664,165 | | |
Insured: NPFGC
5.500% 09/01/27 | | | 5,000,000 | | | | 5,453,750 | | |
| NJ Transportation Trust Fund Authority | |
| Series 1999 A: | |
| 5.750% 06/15/18 | | | 5,000,000 | | | | 5,818,400 | | |
| 5.750% 06/15/20 | | | 4,150,000 | | | | 4,766,067 | | |
| Series 2006 A, | |
| 5.500% 12/15/23 | | | 3,000,000 | | | | 3,322,260 | | |
| NY Dormitory Authority | |
| Series 1993 A: | |
Insured: CGIC
6.000% 07/01/20 | | | 6,140,000 | | | | 7,134,312 | | |
Insured: NPFGC
5.875% 05/15/17 | | | 28,240,000 | | | | 32,675,657 | | |
| Series 1993, | |
| 6.000% 07/01/20 | | | 13,350,000 | | | | 15,567,702 | | |
| UT Building Ownership Authority | |
| Series 1998 C, | |
| Insured: AGMC | |
| 5.500% 05/15/19 | | | 3,450,000 | | | | 4,029,669 | | |
| WI State | |
| Series 2009 A, | |
| 5.750% 05/01/33 | | | 5,700,000 | | | | 6,124,251 | | |
| WV Building Commission | |
| Series 1998 A, | |
Insured: AMBAC
5.375% 07/01/21 | | | 3,215,000 | | | | 3,545,181 | | |
| State Appropriated Total | | | 130,530,354 | | |
See Accompanying Notes to Financial Statements.
20
Columbia Tax-Exempt Fund
November 30, 2010
| Municipal Bonds (continued) | |
| | | Par ($) | | Value ($) | |
| State General Obligations – 8.9% | |
| CA State | |
| Series 2002, | |
Insured: AMBAC
6.000% 04/01/17 | | | 2,500,000 | | | | 2,915,775 | | |
| Series 2006, | |
| 4.500% 10/01/36 | | | 4,015,000 | | | | 3,429,974 | | |
| Series 2007: | |
| 4.500% 08/01/30 | | | 45,000,000 | | | | 40,378,500 | | |
| 5.000% 12/01/37 | | | 8,500,000 | | | | 8,008,190 | | |
| Series 2008, | |
| 5.250% 03/01/38 | | | 8,250,000 | | | | 8,050,762 | | |
| Series 2009: | |
| 5.500% 11/01/39 | | | 15,520,000 | | | | 15,562,680 | | |
| 6.000% 04/01/35 | | | 15,000,000 | | | | 15,719,400 | | |
| Series 2010, | |
| 5.500% 03/01/40 | | | 11,200,000 | | | | 11,215,008 | | |
| FL Board of Education | |
| Series 1985, | |
| 9.125% 06/01/14 | | | 1,025,000 | | | | 1,135,167 | | |
| IL State | |
| Series 2001, | |
Insured: NPFGC
6.000% 11/01/26 | | | 3,000,000 | | | | 3,434,940 | | |
| Series 2004 A, | |
| 5.000% 03/01/34 | | | 3,000,000 | | | | 2,845,710 | | |
| Series 2006, | |
| 5.500% 01/01/31 | | | 7,985,000 | | | | 8,321,648 | | |
| MA Bay Transportation Authority | |
| Series 1994 A, | |
Insured: AGMC
7.000% 03/01/19 | | | 2,500,000 | | | | 3,076,625 | | |
| MA State | |
| Series 2006 B, | |
Insured: AGMC
5.250% 09/01/25 | | | 5,000,000 | | | | 5,800,400 | | |
| PR Commonwealth of Puerto Rico Public Buildings Authority | |
| Series 2002 F, | |
| 5.250% 07/01/20 | | | 2,000,000 | | | | 2,063,760 | | |
| Series 2007, | |
| 6.250% 07/01/31 | | | 27,000,000 | | | | 30,225,690 | | |
| PR Commonwealth of Puerto Rico | |
| Series 1996 B, | |
Insured: AMBAC
6.500% 07/01/15 | | | 2,650,000 | | | | 2,982,973 | | |
| | | Par ($) | | Value ($) | |
| WA State | |
| Series 2000 S-5, | |
Insured: NPFGC
(a) 01/01/19 | | | 1,500,000 | | | | 1,154,865 | | |
| Series 2007 D, | |
Insured: AMBAC
4.500% 01/01/30 | | | 24,470,000 | | | | 24,494,959 | | |
| State General Obligations Total | | | 190,817,026 | | |
| Tax-Backed Total | | | 774,001,997 | | |
| Transportation – 9.0% | |
| Air Transportation – 0.6% | |
| CO Denver City & County Special Facility Authority | |
| United Airlines, Inc., | |
Series 2007, AMT,
5.250% 10/01/32 (j) | | | 5,000,000 | | | | 4,056,550 | | |
| IN Indianapolis Airport Authority | |
| United Airlines, Inc., | |
Series 1995 A, AMT,
6.500% 11/15/31 (k) | | | 1,348,945 | | | | 6,745 | | |
| NJ Economic Development Authority | |
| Continental Airlines, Inc., | |
Series 1999, AMT:
6.250% 09/15/19 | | | 1,300,000 | | | | 1,263,977 | | |
| 6.250% 09/15/29 | | | 2,000,000 | | | | 1,876,000 | | |
| 6.400% 09/15/23 | | | 4,000,000 | | | | 3,884,160 | | |
| NY New York City Industrial Development Agency | |
| American Airlines, Inc., | |
Series 2005, AMT,
GTY AGMT: AMR Corp.
7.625% 08/01/25 (c) | | | 1,000,000 | | | | 1,047,820 | | |
| Air Transportation Total | | | 12,135,252 | | |
| Airports – 0.8% | |
| FL Miami-Dade | |
| Series 2010 A1, | |
| 5.375% 10/01/35 | | | 6,000,000 | | | | 6,047,400 | | |
| TX Houston | |
| Series 2009 A, | |
| 5.500% 07/01/34 | | | 10,500,000 | | | | 11,009,880 | | |
| Airports Total | | | 17,057,280 | | |
| Toll Facilities – 6.0% | |
| CA San Joaquin Hills Transportation Corridor Agency | |
| Series 1997 A, | |
Insured: NPFGC:
(a) 01/15/12 | | | 2,500,000 | | | | 2,360,200 | | |
| (a) 01/15/14 | | | 14,450,000 | | | | 12,102,453 | | |
See Accompanying Notes to Financial Statements.
21
Columbia Tax-Exempt Fund
November 30, 2010
| Municipal Bonds (continued) | | | |
| | | Par ($) | | Value ($) | |
| CO E-470 Public Highway Authority | | | |
| Series 1997 B, | |
Insured: NPFGC
(a) 09/01/22 | | | 6,515,000 | | | | 3,181,340 | | |
| Series 2000, | |
Insured: NPFGC
(a) 09/01/18 | | | 18,600,000 | | | | 12,243,636 | | |
| FL Orlando-Orange County Expressway Authority | | | |
| Series 2010 C, | |
| 5.000% 07/01/40 | | | 10,000,000 | | | | 9,743,400 | | |
| MA Turnpike Authority | | | |
| Series 1997 A, | |
Insured: NPFGC
(a) 01/01/24 | | | 7,000,000 | | | | 3,552,850 | | |
| Series 1997 C, | |
| Insured: NPFGC: | |
| (a) 01/01/18 | | | 4,700,000 | | | | 3,483,969 | | |
| (a) 01/01/20 | | | 17,000,000 | | | | 11,096,920 | | |
| NJ Turnpike Authority | | | |
| Series 1991 C, | |
Insured: AGMC
6.500% 01/01/16 | | | 1,415,000 | | | | 1,727,573 | | |
| Series 2004 C-2, | |
Insured: AMBAC
5.500% 01/01/25 | | | 2,500,000 | | | | 2,814,400 | | |
| Series 2005, | |
Insured: AGMC
5.250% 01/01/30 | | | 2,000,000 | | | | 2,177,240 | | |
| Series 2009 E, | |
| 5.250% 01/01/40 | | | 4,425,000 | | | | 4,565,936 | | |
| Series 2009 H, | |
| 5.000% 01/01/36 | | | 3,000,000 | | | | 3,037,680 | | |
| NY Triborough Bridge & Tunnel Authority | | | |
| Series 2002, | |
Insured: NPFGC
5.500% 11/15/20 | | | 6,800,000 | | | | 8,056,436 | | |
| TX Central Texas Regional Mobility Authority | | | |
| Series 2010, | |
| (a) 01/01/25 | | | 2,000,000 | | | | 830,240 | | |
| TX North Texas Tollway Authority | | | |
| Series 2008 F, | |
| 5.750% 01/01/38 | | | 11,355,000 | | | | 11,354,319 | | |
| Series 2009 C, | |
| 5.250% 01/01/44 | | | 10,000,000 | | | | 9,112,500 | | |
| | | Par ($) | | Value ($) | |
| TX Turnpike Authority | |
| Series 2002 A, | |
Insured: AMBAC:
(a) 08/15/16 | | | 7,000,000 | | | | 5,556,180 | | |
| (a) 08/15/18 | | | 10,000,000 | | | | 6,968,500 | | |
| (a) 08/15/19 | | | 10,330,000 | | | | 6,716,463 | | |
| VA Richmond Metropolitan Authority | |
| Series 1998, | |
Insured: NPFGC
5.250% 07/15/22 | | | 7,800,000 | | | | 8,564,790 | | |
| Toll Facilities Total | | | 129,247,025 | | |
| Transportation – 1.6% | |
| IN Finance Authority Highway Revenue | |
| Series 2007 A, | |
Insured: NPFGC
4.500% 06/01/29 | | | 10,000,000 | | | | 9,962,700 | | |
| NV Department of Business & Industry | |
| Las Vegas Monorail Co., 2nd Tier, | |
Series 2000:
7.375% 01/01/30 (i) | | | 1,650,000 | | | | 17 | | |
| 7.375% 01/01/40 (i) | | | 3,750,000 | | | | 38 | | |
| NY Metropolitan Transportation Authority | |
| Series 2007 A, | |
Insured: AGMC
5.000% 11/15/33 | | | 12,000,000 | | | | 11,918,760 | | |
| Series 2007 B, | |
| 5.000% 11/15/24 | | | 6,820,000 | | | | 7,067,020 | | |
| OH Toledo-Lucas County Port Authority | |
| Series 1992, | |
| 6.450% 12/15/21 | | | 3,950,000 | | | | 4,518,049 | | |
| Transportation Total | | | 33,466,584 | | |
| Transportation Total | | | 191,906,141 | | |
| Utilities – 14.7% | |
| Independent Power Producers – 0.6% | |
| NY Port Authority of New York & New Jersey | |
| KIAC Partners, | |
Series 1996 IV, AMT,
6.750% 10/01/19 | | | 7,000,000 | | | | 6,738,550 | | |
| NY Suffolk County Industrial Development Agency | |
| Nissequogue Cogeneration Partners Facilities, | |
Series 1998, AMT,
5.500% 01/01/23 | | | 7,800,000 | | | | 6,838,884 | | |
| Independent Power Producers Total | | | 13,577,434 | | |
See Accompanying Notes to Financial Statements.
22
Columbia Tax-Exempt Fund
November 30, 2010
| Municipal Bonds (continued) | |
| | | Par ($) | | Value ($) | |
| Investor Owned – 3.6% | |
| DE Economic Development Authority | |
| Delmarva Power & Light Co., | |
Series 2010,
5.400% 02/01/31 | | | 5,000,000 | | | | 5,022,050 | | |
| HI Department of Budget & Finance | |
| Hawaiian Electric Co., | |
Series 2009,
GTY AGMT: Hawaiian Electric Co.
6.500% 07/01/39 | | | 5,250,000 | | | | 5,616,240 | | |
| IN Development Finance Authority | |
| Series 1999, AMT, | |
| 5.950% 08/01/30 | | | 5,000,000 | | | | 5,000,750 | | |
| IN Jasper County Pollution Control Revenue | |
| Northern Indiana Public Service Co.: | |
Series 1994 C,
Insured: NPFGC
5.850% 04/01/19 | | | 3,000,000 | | | | 3,338,460 | | |
| Series 2003, | |
Insured: AMBAC
5.700% 07/01/17 | | | 2,000,000 | | | | 2,227,640 | | |
| IN Petersburg | |
| Series 1995 C, AMT, | |
| 5.950% 12/01/29 | | | 5,000,000 | | | | 4,949,550 | | |
| MA Development Finance Agency | |
| Dominion Energy Brayton, | |
Series 2006, AMT,
5.000% 02/01/36 (c) | | | 3,000,000 | | | | 2,855,490 | | |
| MI Strategic Fund | |
| Detroit Edison Co., | |
Series 1991 BB,
Insured: AMBAC
7.000% 05/01/21 | | | 2,505,000 | | | | 3,003,645 | | |
| NY Energy & Research Development Authority | |
| Brooklyn Union Gas Co., | |
Series 1993,
10.450% 04/01/20
(12/15/10) (c)(d) | | | 13,000,000 | | | | 13,472,940 | | |
| PA Economic Development Financing Authority | |
| Allegheny Energy Speciality Co., | |
Series 2009,
7.000% 07/15/39 | | | 13,000,000 | | | | 14,305,070 | | |
| | | Par ($) | | Value ($) | |
| TX Brazos River Authority Pollution Control Revenue | |
| TXU Energy Co. LLC: | |
Series 1999 B, AMT,
6.750% 09/01/34
(04/01/13) (c)(d) | | | 12,455,000 | | | | 9,302,764 | | |
| Series 2001 A, AMT, | |
| 8.250% 10/01/30 | | | 5,250,000 | | | | 2,077,740 | | |
| Series 2003 A, AMT, | |
| 6.750% 04/01/38 (c) | | | 1,900,000 | | | | 1,418,578 | | |
| TX Matagorda County Navigation District No. 1 | |
| Series 2001 A, | |
| 6.300% 11/01/29 | | | 2,800,000 | | | | 2,984,744 | | |
| TX Sabine River Authority Pollution Control Revenue | |
| Series 2001 C, | |
| 5.200% 05/01/28 | | | 3,000,000 | | | | 1,007,910 | | |
| Investor Owned Total | | | 76,583,571 | | |
| Joint Power Authority – 4.0% | |
AZ Salt River Project Agricultural Improvement &
Power District | |
| Series 2006 A, | |
| 5.000% 01/01/37 | | | 5,000,000 | | | | 5,080,500 | | |
| GA Municipal Electric Authority | |
| Series 1991, | |
Insured: NPFGC
6.600% 01/01/18 | | | 17,280,000 | | | | 20,305,728 | | |
| KY Ohio County Pollution Control | |
| Series 2010 A, | |
| 6.000% 07/15/31 | | | 10,770,000 | | | | 10,815,988 | | |
| NC Eastern Municipal Power Agency | |
| Series 1991 A, | |
| 6.500% 01/01/18 | | | 2,185,000 | | | | 2,662,051 | | |
| Series 2009 B, | |
| 5.000% 01/01/26 | | | 7,000,000 | | | | 7,253,960 | | |
| ND McLean | |
| Great River Energy, | |
Series 2010 B,
5.150% 07/01/40 | | | 7,900,000 | | | | 7,700,604 | | |
| SC Piedmont Municipal Power Agency | |
| Series 1993, | |
Insured: NPFGC
5.375% 01/01/25 | | | 11,370,000 | | | | 12,486,534 | | |
| Series 2004 A, | |
Insured: NPFGC
(a) 01/01/24 | | | 5,000,000 | | | | 2,528,050 | | |
See Accompanying Notes to Financial Statements.
23
Columbia Tax-Exempt Fund
November 30, 2010
| Municipal Bonds (continued) | |
| | | Par ($) | | Value ($) | |
| SC Public Service Authority | |
| Series 2008 A, | |
| 5.500% 01/01/38 | | | 3,000,000 | | | | 3,209,730 | | |
| TX Sam Rayburn Municipal Power Agency | |
| Series 2002, | |
| 6.000% 10/01/16 | | | 5,000,000 | | | | 5,231,950 | | |
| WY Campbell | |
| Basin Electric Power Cooperative, | |
Series 2009,
5.750% 07/15/39 | | | 7,900,000 | | | | 8,430,248 | | |
| Joint Power Authority Total | | | 85,705,343 | | |
| Municipal Electric – 1.7% | |
| NY Long Island Power Authority | |
| Series 2008 A, | |
| 6.000% 05/01/33 | | | 2,725,000 | | | | 2,962,947 | | |
| PA Westmoreland County Municipal Authority | |
| Series 1995 A, | |
Insured: NPFGC
(a) 08/15/23 | | | 5,540,000 | | | | 2,958,028 | | |
| Series 1999 A, | |
Insured: NPFGC
(a) 08/15/22 | | | 2,000,000 | | | | 1,182,240 | | |
PR Commonwealth of Puerto Rico Electric
Power Authority | |
| Series 2007 VV, | |
Insured: NPFGC
5.250% 07/01/34 | | | 10,870,000 | | | | 10,811,302 | | |
| Series 2010 XX, | |
| 5.250% 07/01/40 | | | 4,250,000 | | | | 4,187,015 | | |
| SD Heartland Consumers Power District | |
| Series 1992, | |
Insured: AGMC
6.000% 01/01/17 | | | 13,600,000 | | | | 15,532,288 | | |
| Municipal Electric Total | | | 37,633,820 | | |
| Water & Sewer – 4.8% | |
| AL Birmingham Waterworks & Sewer Board | |
| Series 2007 A, | |
Insured: AMBAC
4.375% 01/01/32 | | | 6,000,000 | | | | 5,525,520 | | |
| AL Jefferson County | |
| Series 1997 A, | |
Insured: FGIC
5.625% 02/01/22 | | | 570,000 | | | | 216,988 | | |
| | | Par ($) | | Value ($) | |
| CA Castaic Lake Water Agency | |
| Series 1999, | |
Insured: AMBAC
(a) 08/01/24 | | | 9,445,000 | | | | 4,427,627 | | |
| CA San Diego Public Facilities Financing Authority | |
| Series 2009, | |
| 5.250% 05/15/39 | | | 17,000,000 | | | | 17,658,070 | | |
CA San Francisco City & County Public
Utilities Commission | |
| Series 2006 A, | |
Insured: AGMC
4.500% 11/01/31 | | | 17,800,000 | | | | 16,963,756 | | |
| FL Seminole County | |
| Series 1992, | |
Insured: NPFGC
6.000% 10/01/19 | | | 470,000 | | | | 546,337 | | |
| GA Atlanta Water & Wastewater Revenue | |
| Series 1991 A, | |
Insured: NPFGC
5.500% 11/01/22 | | | 5,475,000 | | | | 5,995,453 | | |
| Series 2001 A, | |
Insured: NPFGC
5.500% 11/01/27 | | | 1,500,000 | | | | 1,586,655 | | |
| GA Henry County Water & Sewer Authority | |
| Series 1997, | |
Insured: AMBAC
6.150% 02/01/20 | | | 5,390,000 | | | | 6,460,616 | | |
| GA Milledgeville Water & Sewer Revenue | |
| Series 1996, | |
Insured: AGMC
6.000% 12/01/21 | | | 1,000,000 | | | | 1,187,430 | | |
| IL Chicago | |
| Series 1998, | |
Insured: NPFGC
(a) 01/01/20 | | | 7,275,000 | | | | 5,000,035 | | |
| IN Bond Bank Revenue | |
| Series 2008 B, | |
Insured: AGMC
(a) 06/01/29 | | | 8,075,000 | | | | 2,948,425 | | |
| MA Water Resources Authority | |
| Series 2002 J, | |
Insured: AGMC
5.500% 08/01/21 | | | 5,000,000 | | | | 6,039,850 | | |
| Series 2006 A, | |
Insured: AMBAC
5.000% 08/01/24 | | | 2,170,000 | | | | 2,364,627 | | |
See Accompanying Notes to Financial Statements.
24
Columbia Tax-Exempt Fund
November 30, 2010
| Municipal Bonds (continued) | |
| | | Par ($) | | Value ($) | |
| MS V Lakes Utility District | |
| Series 1994, | |
7.000% 07/15/37
(07/15/24) (c)(d) | | | 465,000 | | | | 418,705 | | |
| NY New York City Municipal Water Finance Authority | |
| Series 2001 D, | |
| 5.250% 06/15/25 | | | 2,535,000 | | | | 2,602,963 | | |
| OH Cleveland Waterworks Revenue | |
| Series 1993 G, | |
Insured: NPFGC
5.500% 01/01/21 | | | 4,015,000 | | | | 4,614,961 | | |
| OH Lakewood Water Systems Revenue | |
| Series 1995, | |
Insured: AMBAC
5.850% 07/01/20 | | | 1,825,000 | | | | 2,135,652 | | |
| OH Water Development Authority | |
| Series 2005 B, | |
| 4.750% 06/01/25 | | | 920,000 | | | | 965,181 | | |
| TX Houston Water & Sewer Systems | |
| Series 1998 A, | |
Insured: AGMC:
(a) 12/01/19 | | | 9,545,000 | | | | 6,947,233 | | |
| (a) 12/01/23 | | | 985,000 | | | | 571,704 | | |
| VA Fairfax County Water Authority | |
| Series 2005 B, | |
| 5.250% 04/01/24 | | | 6,175,000 | | | | 7,375,296 | | |
| Water & Sewer Total | | | 102,553,084 | | |
| Utilities Total | | | 316,053,252 | | |
Total Municipal Bonds
(cost of $2,030,064,245) | | | 2,084,931,619 | | |
| Municipal Preferred Stocks – 0.4% | |
| | | Shares | | | |
| Housing – 0.4% | |
| Multi-Family – 0.4% | |
| Munimae TE Bond Subsidiary LLC | |
| Series 2000 B, AMT, | |
| 7.750% 06/30/50 (f) | | | 10,000,000 | | | | 8,201,200 | | |
| Series 2005 C-3, AMT, | |
| 5.500% 11/29/49 (f) | | | 1,000,000 | | | | 659,430 | | |
| Multi-Family Total | | | 8,860,630 | | |
| Housing Total | | | 8,860,630 | | |
Total Municipal Preferred Stocks
(cost of $11,000,000) | | | 8,860,630 | | |
| Investment Companies – 1.3% | |
| | | Shares | | Value ($) | |
| BofA Tax-Exempt Reserves, | |
Capital Class Shares
(7 day yield of 0.140%) (l) | | | 13,045,002 | | | | 13,045,002 | | |
| Dreyfus Tax-Exempt Cash | |
Management Fund
(7 day yield of 0.100%) | | | 14,105,852 | | | | 14,105,852 | | |
Total Investment Companies
(cost of $27,150,854) | | | 27,150,854 | | |
Total Investments – 99.0%
(cost of $2,068,215,099) (b) | | | 2,120,943,103 | | |
| Other Assets & Liabilities, Net – 1.0% | | | 22,473,210 | | |
| Net Assets – 100.0% | | | 2,143,416,313 | | |
Notes to Investment Portfolio:
(a) Zero coupon bond.
(b) Cost for federal income tax purposes is $2,063,492,950.
(c) The interest rate shown on floating rate or variable rate securities reflects the rate at November 30, 2010.
(d) Parenthetical date represents the next interest rate reset date for the security.
(e) The issuer is in default of certain debt covenants. Income is being partially accrued based on the execution of a forbearance agreement with the borrower. At November 30, 2010, the value of these securities amounted to $8,127,057, which represents 0.4% of net assets.
(f) Security exempt from registration pursuant to Rule 144A under the Securities Act of 1933. These securities may be resold in transactions exempt from registration, normally to qualified institutional buyers. At November 30, 2010, these securities, which are not illiquid except for the following, amounted to $42,706,230, which represents 2.0% of net assets.
| Security | | Acquisition
Date | | Par/
Shares | | Cost | | Value | |
Resolution Trust
Corp. Pass-Through
Certificates,
Series 1993 A,
8.500% 12/01/16 | | 08/27/93 | | $ | 6,615,223 | | | $ | 6,751,636 | | | $ | 6,296,104 | | |
CA Cabazon Band
Mission Indians,
Series 2004: | | 10/08/04- | | | | | | | |
| 4.840% 10/01/15 | | 05/14/10 | | $ | 1,740,000 | | | | 1,670,000 | | | | 1,168,758 | | |
| | | 10/08/04- | | | | | | | | | | | | | |
| 5.050% 10/01/19 | | 05/14/10 | | $ | 8,670,000 | | | | 8,323,500 | | | | 5,715,958 | | |
OR Cow Creek
Band Umpqua
Tribe of Indians,
Series 2006 C,
5.625% 10/01/26 | | 06/15/06 | | $ | 3,500,000 | | | | 3,500,000 | | | | 2,806,195 | | |
Munimae TE Bond
Subsidiary, LLC:
Series 2000 B,
AMT,
7.750% 06/30/50 | | 09/05/02 | | | 10,000,000 | | | | 10,000,000 | | | | 8,201,200 | | |
Series 2005 C-3,
AMT,
5.500% 11/29/49 | | 11/04/05 | | | 1,000,000 | | | | 1,000,000 | | | | 659,430 | | |
| | | $ | 24,847,645 | | |
See Accompanying Notes to Financial Statements.
25
Columbia Tax-Exempt Fund
November 30, 2010
(g) Security purchased on a delayed delivery basis.
(h) The Fund has been informed that each issuer has placed direct obligations of the U.S. Government in an irrevocable trust, solely for the payment of principal and interest.
(i) The issuer is in default of certain debt covenants. Income is not being accrued. At November 30, 2010, the value of these securities amounted to $2,603,535, which represents 0.1% of net assets.
(j) Position reflects anticipated residual bankruptcy claims. Income is not being accrued.
(k) The issuer is in default of certain debt covenants. Income is not being accrued. Amounts represent residual bankruptcy claims. At November 30, 2010, the value of this security amounted to $6,745, which represents less than 0.1% of net assets.
(l) Investments in affiliates during the year ended November 30, 2010:
| Affiliate | | Value
beginning
of period | | Purchases | | Sales
Proceeds | | Dividend
Income | | Value,
end of
Period | |
BofA Tax-Exempt
Reserves, Capital
Class Shares
(7 day yield of
0.140%)* | | $ | 8,400,884 | | | $ | 130,116,324 | | | $ | 128,662,066 | | | $ | 5,793 | | | $ | — | | |
* As of May 1, 2010, this company was no longer an affiliate of the fund. The above table reflects activity for the period from December 1, 2009 through April 30, 2010.
The following table summarizes the inputs used, as of November 30, 2010, in valuing the Fund's assets:
| Description | | Quoted
Prices
(Level 1) | | Other
Significant
Observable
Inputs
(Level 2) | | Significant
Unobservable
Inputs
(Level 3) | | Total | |
| Municipal Bonds | |
| Education | | $ | — | | | $ | 146,929,219 | | | $ | — | | | $ | 146,929,219 | | |
| Health Care | | | — | | | | 176,343,550 | | | | 4,759,227 | | | | 181,102,777 | | |
| Housing | | | — | | | | 84,096,007 | | | | — | | | | 84,096,007 | | |
| Industrials | | | — | | | | 66,147,058 | | | | — | | | | 66,147,058 | | |
| Other | | | — | | | | 285,437,327 | | | | — | | | | 285,437,327 | | |
| Other Revenue | | | — | | | | 31,672,197 | | | | — | | | | 31,672,197 | | |
| Resource Recovery | | | — | | | | 7,585,644 | | | | — | | | | 7,585,644 | | |
| Tax-Backed | | | — | | | | 774,001,997 | | | | — | | | | 774,001,997 | | |
| Transportation | | | — | | | | 191,906,141 | | | | — | | | | 191,906,141 | | |
| Utilities | | | — | | | | 316,053,252 | | | | — | | | | 316,053,252 | | |
Total Municipal
Bonds | | | — | | | | 2,080,172,392 | | | | 4,759,227 | | | | 2,084,931,619 | | |
Total Municipal
Preferred Stocks | | | — | | | | 8,860,630 | | | | — | | | | 8,860,630 | | |
Total Investment
Companies | | | 27,150,854 | | | | — | | | | — | | | | 27,150,854 | | |
| Total Investments | | $ | 27,150,854 | | | $ | 2,089,033,022 | | | $ | 4,759,227 | | | $ | 2,120,943,103 | | |
The following table reconciles asset balances for the year ending November 30, 2010, in which significant unobservable inputs (Level 3) were used in determining value:
Investment in
Securities | | Balance
as of
November 30,
2009 | | Accrued
Discounts/
(Premiums) | | Realized
Gain
(Loss) | | Change in
Unrealized
Appreciation
(Depreciation) | | Purchases | | (Sales) | | Transfers
into
Level 3 | | Transfers
(out of)
Level 3 | | Balance
as of
November 30,
2010 | |
Municipal Bonds
Health Care | | $ | 6,849,500 | | | $ | — | | | $ | — | | | $ | (1,690,273 | ) | | $ | — | | | $ | (400,000 | ) | | $ | — | | | $ | — | | | $ | 4,759,227 | | |
The information in the above reconciliation table represents fiscal year to date activity for any securities identified as using Level 3 inputs at either the beginning or the end of the current fiscal period.
The change in unrealized depreciation attributed to securities owned at November 30, 2010, which were valued using significant unobservable inputs (Level 3) amounted to $1,690,273. This amount is included in net change in unrealized appreciation (depreciation) on investments on the Statement of Changes in Net Assets.
For more information on valuation inputs, and their aggregation into the levels used in the tables above, please refer to the Security Valuation section in the accompanying Notes to Financial Statements.
At November 30, 2010, the composition of the Fund by revenue source is as follows:
| Holdings by Revenue Source (Unaudited) | | % of
Net Assets | |
| Tax-Backed | | | 36.1 | | |
| Utilities | | | 14.7 | | |
| Refunded/Escrowed | | | 10.6 | | |
| Transportation | | | 9.0 | | |
| Health Care | | | 8.4 | | |
| Education | | | 6.9 | | |
| Housing | | | 4.3 | | |
| Industrials | | | 3.1 | | |
| Pool/Bond Bank | | | 1.5 | | |
| Other Revenue | | | 1.5 | | |
| Other | | | 0.8 | | |
| Tobacco | | | 0.4 | | |
| Resource Recovery | | | 0.4 | | |
| | | | 97.7 | | |
| Investment Companies | | | 1.3 | | |
| Other Assets & Liabilities, Net | | | 1.0 | | |
| | | | 100.0 | | |
At November 30, 2010, the Fund held investments in the following states/territories:
| State/Territory | | % of Total
Investments | |
| California | | | 12.7 | | |
| New York | | | 12.4 | | |
| Massachusetts | | | 9.6 | | |
| Texas | | | 7.9 | | |
| Illinois | | | 7.7 | | |
| New Jersey | | | 5.2 | | |
| Other* | | | 44.5 | | |
| | | | 100.0 | | |
* Includes all states/territories that are individually less than 5.0% of total investments.
See Accompanying Notes to Financial Statements.
26
Columbia Tax-Exempt Fund
November 30, 2010
| Acronym | | Name | |
| AGMC | | Assured Guaranty Municipal Corp. | |
|
| AGC | | Assured Guarantee Corp. | |
|
| AMBAC | | Ambac Assurance Corp. | |
|
| AMT | | Alternative Minimum Tax | |
|
| CAP | | Capital Markets Assurance Corp. | |
|
| CGIC | | Capital Guaranty Insurance Corp. | |
|
| FGIC | | Financial Guaranty Insurance Co. | |
|
| FHA | | Federal Housing Administration | |
|
| GNMA | | Government National Mortgage Association | |
|
| GTY AGMT | | Guaranty Agreement | |
|
| LOC | | Letter of Credit | |
|
| NPFGC | | National Public Finance Guarantee Corp. | |
|
| PSFG | | Permanent School Fund Guarantee | |
|
| RAD | | Radian Asset Assurance, Inc. | |
|
See Accompanying Notes to Financial Statements.
27
Statement of Assets and Liabilities – Columbia Tax-Exempt Fund
November 30, 2010
| | | | | ($) | |
| Assets | | Investments, at cost | | | 2,068,215,099 | | |
| | | Investments, at value | | | 2,120,943,103 | | |
| | | Cash | | | 81 | | |
| | | Receivable for: | | | | | |
| | | Fund shares sold | | | 968,643 | | |
| | | Interest | | | 32,334,990 | | |
| | | Trustees' deferred compensation plan | | | 225,592 | | |
| | | Prepaid expenses | | | 21,322 | | |
| | | Total Assets | | | 2,154,493,731 | | |
| Liabilities | | Expense reimbursement due to investment adviser | | | 89 | | |
| | | Payable for: | | | | | |
| | | Investments purchased on a delayed delivery basis | | | 2,800,000 | | |
| | | Fund shares repurchased | | | 2,667,281 | | |
| | | Distributions | | | 3,860,967 | | |
| | | Investment advisory fee | | | 869,855 | | |
| | | Pricing and bookkeeping fees | | | 21,261 | | |
| | | Transfer agent fee | | | 210,666 | | |
| | | Trustees' fees | | | 29,674 | | |
| | | Custody fee | | | 9,819 | | |
| | | Distribution and service fees | | | 248,364 | | |
| | | Chief compliance officer expenses | | | 544 | | |
| | | Trustees' deferred compensation plan | | | 225,592 | | |
| | | Other liabilities | | | 133,306 | | |
| | | Total Liabilities | | | 11,077,418 | | |
| | | Net Assets | | | 2,143,416,313 | | |
| Net Assets Consist of | | Paid-in capital | | | 2,087,575,482 | | |
| | | Undistributed net investment income | | | 8,356,194 | | |
| | | Accumulated net realized loss | | | (5,243,367 | ) | |
| | | Net unrealized appreciation (depreciation) on investments | | | 52,728,004 | | |
| | | Net Assets | | | 2,143,416,313 | | |
See Accompanying Notes to Financial Statements.
28
Statement of Assets and Liabilities (continued) – Columbia Tax-Exempt Fund
November 30, 2010
| Class A | | Net assets | | $ | 1,305,921,016 | | |
| | | Shares outstanding | | | 99,478,215 | | |
| | | Net asset value per share | | $ | 13.13 | (a) | |
| | | Maximum sales charge | | | 4.75 | % | |
| | | Maximum offering price per share ($13.13/0.9525) | | $ | 13.78 | (b) | |
| Class B | | Net assets | | $ | 6,816,517 | | |
| | | Shares outstanding | | | 519,249 | | |
| | | Net asset value and offering price per share | | $ | 13.13 | (a) | |
| Class C | | Net assets | | $ | 37,376,611 | | |
| | | Shares outstanding | | | 2,847,159 | | |
| | | Net asset value and offering price per share | | $ | 13.13 | (a) | |
| Class Z | | Net assets | | $ | 793,302,169 | | |
| | | Shares outstanding | | | 60,429,711 | | |
| | | Net asset value, offering and redemption price per share | | $ | 13.13 | | |
(a) Redemption price per share is equal to net asset value less any applicable contingent deferred sales charge.
(b) On sales of $50,000 or more the offering price is reduced.
See Accompanying Notes to Financial Statements.
29
Statement of Operations – Columbia Tax-Exempt Fund
For the Year Ended November 30, 2010
| | | | | ($) | |
| Investment Income | | Interest | | | 116,854,165 | | |
| | | Dividends | | | 21,936 | | |
| | | Dividends from affiliates | | | 5,793 | | |
| | | Total Investment Income | | | 116,881,894 | | |
| Expenses | | Investment advisory fee | | | 10,831,315 | | |
| | | Distribution fee: | | | | | |
| | | Class B | | | 72,353 | | |
| | | Class C | | | 274,807 | | |
| | | Service fee: | | | | | |
| | | Class A | | | 2,710,660 | | |
| | | Class B | | | 19,294 | | |
| | | Class C | | | 73,251 | | |
| | | Transfer agent fee | | | 1,614,176 | | |
| | | Pricing and bookkeeping fees | | | 196,542 | | |
| | | Trustees' fees | | | 109,617 | | |
| | | Custody fee | | | 59,378 | | |
| | | Chief compliance officer expenses | | | 2,772 | | |
| | | Other expenses | | | 592,023 | | |
| | | Total Expenses | | | 16,556,188 | | |
| | | Fees waived by distributor—Class C | | | (55,053 | ) | |
| | | Expense reductions | | | (144 | ) | |
| | | Net Expenses | | | 16,500,991 | | |
| | | Net Investment Income | | | 100,380,903 | | |
| Net Realized and Unrealized Gain (Loss) on Investments | | Net realized gain on investments | | | 23,322,707 | | |
| | | Net change in unrealized appreciation (depreciation) in investments | | | (8,982,008 | ) | |
| | | Net Gain | | | 14,340,699 | | |
| | | Net Increase Resulting from Operations | | | 114,721,602 | | |
See Accompanying Notes to Financial Statements.
30
Statement of Changes in Net Assets – Columbia Tax-Exempt Fund
| | | | | Year Ended November 30, | |
| Increase (Decrease) in Net Assets | | | | 2010 ($) | | 2009 ($) | |
| Operations | | Net investment income | | | 100,380,903 | | | | 105,632,423 | | |
| | | Net realized gain (loss) on investments | | | 23,322,707 | | | | (6,883,770 | ) | |
| | | Net change in unrealized appreciation (depreciation)
on investments | | | (8,982,008 | ) | | | 197,868,412 | | |
| | | Net increase resulting from operations | | | 114,721,602 | | | | 296,617,065 | | |
| Distributions to Shareholders | | From net investment income: | | | | | |
| | | Class A | | | (59,546,856 | ) | | | (62,571,869 | ) | |
| | | Class B | | | (351,849 | ) | | | (620,807 | ) | |
| | | Class C | | | (1,387,776 | ) | | | (1,223,251 | ) | |
| | | Class Z | | | (38,237,268 | ) | | | (40,295,250 | ) | |
| | | Total distributions to shareholders | | | (99,523,749 | ) | | | (104,711,177 | ) | |
| | | Net Capital Stock Transactions | | | (115,047,540 | ) | | | (102,215,429 | ) | |
| | | Increase from regulatory settlements | | | 19,753 | | | | — | | |
| | | Total increase (decrease) in net assets | | | (99,829,934 | ) | | | 89,690,459 | | |
| Net Assets | | Beginning of period | | | 2,243,246,247 | | | | 2,153,555,788 | | |
| | | End of period | | | 2,143,416,313 | | | | 2,243,246,247 | | |
| | | Undistributed net investment income at end of period | | | 8,356,194 | | | | 8,200,811 | | |
See Accompanying Notes to Financial Statements.
31
Statement of Changes in Net Assets (continued) – Columbia Tax-Exempt Fund
| | | Capital Stock Activity | |
| | | Year Ended
November 30, 2010 | | Year Ended
November 30, 2009 | |
| | | Shares | | Dollars ($) | | Shares | | Dollars ($) | |
| Class A | |
| Subscriptions | | | 3,085,001 | | | | 41,173,657 | | | | 3,984,731 | | | | 50,149,108 | | |
| Distributions reinvested | | | 3,170,799 | | | | 42,260,626 | | | | 3,542,315 | | | | 44,739,739 | | |
| Redemptions | | | (11,207,263 | ) | | | (149,201,003 | ) | | | (11,594,982 | ) | | | (145,408,139 | ) | |
| Net decrease | | | (4,951,463 | ) | | | (65,766,720 | ) | | | (4,067,936 | ) | | | (50,519,292 | ) | |
| Class B | |
| Subscriptions | | | 15,355 | | | | 204,468 | | | | 111,746 | | | | 1,389,261 | | |
| Distributions reinvested | | | 14,784 | | | | 196,559 | | | | 28,610 | | | | 360,464 | | |
| Redemptions | | | (489,987 | ) | | | (6,520,004 | ) | | | (651,960 | ) | | | (8,243,436 | ) | |
| Net decrease | | | (459,848 | ) | | | (6,118,977 | ) | | | (511,604 | ) | | | (6,493,711 | ) | |
| Class C | |
| Subscriptions | | | 641,984 | | | | 8,576,510 | | | | 948,430 | | | | 11,941,752 | | |
| Distributions reinvested | | | 50,282 | | | | 670,608 | | | | 44,909 | | | | 568,462 | | |
| Redemptions | | | (457,045 | ) | | | (6,102,688 | ) | | | (475,178 | ) | | | (5,991,496 | ) | |
| Net increase | | | 235,221 | | | | 3,144,430 | | | | 518,161 | | | | 6,518,718 | | |
| Class Z | |
| Subscriptions | | | 5,904,278 | | | | 78,403,006 | | | | 9,841,312 | | | | 122,702,549 | | |
| Distributions reinvested | | | 666,949 | | | | 8,890,492 | | | | 729,539 | | | | 9,211,438 | | |
| Redemptions | | | (10,050,193 | ) | | | (133,599,771 | ) | | | (14,772,539 | ) | | | (183,635,131 | ) | |
| Net decrease | | | (3,478,966 | ) | | | (46,306,273 | ) | | | (4,201,688 | ) | | | (51,721,144 | ) | |
See Accompanying Notes to Financial Statements.
32
Financial Highlights – Columbia Tax-Exempt Fund
Selected data for a share outstanding throughout each period is as follows:
| | | Year Ended November 30, | |
| Class A Shares | | 2010 | | 2009 | | 2008 | | 2007 | | 2006 | |
| Net Asset Value, Beginning of Period | | $ | 13.05 | | | $ | 11.95 | | | $ | 13.52 | | | $ | 13.88 | | | $ | 13.49 | | |
| Income from Investment Operations: | |
| Net investment income (a) | | | 0.59 | | | | 0.60 | | | | 0.59 | | | | 0.60 | | | | 0.61 | | |
Net realized and unrealized gain (loss) on investments
and futures contracts | | | 0.08 | | | | 1.09 | | | | (1.57 | ) | | | (0.37 | ) | | | 0.38 | | |
| Total from investment operations | | | 0.67 | | | | 1.69 | | | | (0.98 | ) | | | 0.23 | | | | 0.99 | | |
| Less Distributions to Shareholders: | |
| From net investment income | | | (0.59 | ) | | | (0.59 | ) | | | (0.59 | ) | | | (0.59 | ) | | | (0.60 | ) | |
| Increase from regulatory settlements | | | — | (b) | | | — | | | | — | | | | — | | | | — | | |
| Net Asset Value, End of Period | | $ | 13.13 | | | $ | 13.05 | | | $ | 11.95 | | | $ | 13.52 | | | $ | 13.88 | | |
| Total return (c) | | | 5.12 | % | | | 14.42 | % | | | (7.48 | )% | | | 1.74 | % | | | 7.53 | % | |
| Ratios to Average Net Assets/Supplemental Data: | |
| Net expenses before interest expense and fees (d) | | | 0.80 | % | | | 0.80 | % | | | 0.78 | % | | | 0.78 | % | | | 0.80 | % | |
| Interest expense and fees | | | — | | | | — | %(e)(f) | | | 0.02 | %(e) | | | 0.04 | %(e) | | | 0.05 | %(e) | |
| Net expenses (d) | | | 0.80 | % | | | 0.80 | % | | | 0.80 | % | | | 0.82 | % | | | 0.85 | % | |
| Net investment income (d) | | | 4.43 | % | | | 4.73 | % | | | 4.56 | % | | | 4.40 | % | | | 4.46 | % | |
| Portfolio turnover rate | | | 11 | % | | | 12 | % | | | 14 | % | | | 13 | % | | | 5 | % | |
| Net assets, end of period (000s) | | $ | 1,305,921 | | | $ | 1,362,545 | | | $ | 1,296,698 | | | $ | 1,533,614 | | | $ | 1,646,201 | | |
(a) Per share data was calculated using the average shares outstanding during the period.
(b) Rounds to less than $0.01 per share.
(c) Total return at net asset value assuming all distributions reinvested and no initial sales charge or contingent deferred sales charge.
(d) The benefits derived from expense reductions had an impact of less than 0.01%.
(e) Interest expense and fees relate to the Fund's liability with respect to floating-rate notes held in conjunction with investments in inverse floating rate obligations.
(f) Rounds to less than 0.01%.
See Accompanying Notes to Financial Statements.
33
Financial Highlights – Columbia Tax-Exempt Fund
Selected data for a share outstanding throughout each period is as follows:
| | | Year Ended November 30, | |
| Class B Shares | | 2010 | | 2009 | | 2008 | | 2007 | | 2006 | |
| Net Asset Value, Beginning of Period | | $ | 13.05 | | | $ | 11.95 | | | $ | 13.52 | | | $ | 13.88 | | | $ | 13.49 | | |
| Income from Investment Operations: | |
| Net investment income (a) | | | 0.49 | | | | 0.50 | | | | 0.50 | | | | 0.50 | | | | 0.50 | | |
Net realized and unrealized gain (loss) on investments
and futures contracts | | | 0.08 | | | | 1.10 | | | | (1.58 | ) | | | (0.37 | ) | | | 0.39 | | |
| Total from investment operations | | | 0.57 | | | | 1.60 | | | | (1.08 | ) | | | 0.13 | | | | 0.89 | | |
| Less Distributions to Shareholders: | |
| From net investment income | | | (0.49 | ) | | | (0.50 | ) | | | (0.49 | ) | | | (0.49 | ) | | | (0.50 | ) | |
| Increase from regulatory settlements | | | — | (b) | | | — | | | | — | | | | — | | | | — | | |
| Net Asset Value, End of Period | | $ | 13.13 | | | $ | 13.05 | | | $ | 11.95 | | | $ | 13.52 | | | $ | 13.88 | | |
| Total return (c) | | | 4.34 | % | | | 13.57 | % | | | (8.17 | )% | | | 0.98 | % | | | 6.73 | % | |
| Ratios to Average Net Assets/Supplemental Data: | |
| Net expenses before interest expense and fees (d) | | | 1.55 | % | | | 1.55 | % | | | 1.53 | % | | | 1.53 | % | | | 1.55 | % | |
| Interest expense and fees | | | — | | | | — | %(e)(f) | | | 0.02 | %(e) | | | 0.04 | %(e) | | | 0.05 | %(e) | |
| Net expenses (d) | | | 1.55 | % | | | 1.55 | % | | | 1.55 | % | | | 1.57 | % | | | 1.60 | % | |
| Net investment income (d) | | | 3.69 | % | | | 4.00 | % | | | 3.81 | % | | | 3.65 | % | | | 3.71 | % | |
| Portfolio turnover rate | | | 11 | % | | | 12 | % | | | 14 | % | | | 13 | % | | | 5 | % | |
| Net assets, end of period (000s) | | $ | 6,817 | | | $ | 12,775 | | | $ | 17,816 | | | $ | 27,047 | | | $ | 43,771 | | |
(a) Per share data was calculated using the average shares outstanding during the period.
(b) Rounds to less than $0.01 per share.
(c) Total return at net asset value assuming all distributions reinvested and no contingent deferred sales charge.
(d) The benefits derived from expense reductions had an impact of less than 0.01%.
(e) Interest expense and fees relate to the Fund's liability with respect to floating-rate notes held in conjunction with investments in inverse floating rate obligations.
(f) Rounds to less than 0.01%.
See Accompanying Notes to Financial Statements.
34
Financial Highlights – Columbia Tax-Exempt Fund
Selected data for a share outstanding throughout each period is as follows:
| | | Year Ended November 30, | |
| Class C Shares | | 2010 | | 2009 | | 2008 | | 2007 | | 2006 | |
| Net Asset Value, Beginning of Period | | $ | 13.05 | | | $ | 11.95 | | | $ | 13.52 | | | $ | 13.88 | | | $ | 13.49 | | |
| Income from Investment Operations: | |
| Net investment income (a) | | | 0.51 | | | | 0.52 | | | | 0.51 | | | | 0.51 | | | | 0.52 | | |
Net realized and unrealized gain (loss) on investments
and futures contracts | | | 0.08 | | | | 1.09 | | | | (1.57 | ) | | | (0.36 | ) | | | 0.39 | | |
| Total from investment operations | | | 0.59 | | | | 1.61 | | | | (1.06 | ) | | | 0.15 | | | | 0.91 | | |
| Less Distributions to Shareholders: | |
| From net investment income | | | (0.51 | ) | | | (0.51 | ) | | | (0.51 | ) | | | (0.51 | ) | | | (0.52 | ) | |
| Increase from regulatory settlements | | | — | (b) | | | — | | | | — | | | | — | | | | — | | |
| Net Asset Value, End of Period | | $ | 13.13 | | | $ | 13.05 | | | $ | 11.95 | | | $ | 13.52 | | | $ | 13.88 | | |
| Total return (c)(d) | | | 4.49 | % | | | 13.74 | % | | | (8.05 | )% | | | 1.13 | % | | | 6.89 | % | |
| Ratios to Average Net Assets/Supplemental Data: | |
| Net expenses before interest expense and fees (e) | | | 1.40 | % | | | 1.40 | % | | | 1.38 | % | | | 1.38 | % | | | 1.40 | % | |
| Interest expense and fees | | | — | | | | — | %(f)(g) | | | 0.02 | %(f) | | | 0.04 | %(f) | | | 0.05 | %(f) | |
| Net expenses (e) | | | 1.40 | % | | | 1.40 | % | | | 1.40 | % | | | 1.42 | % | | | 1.45 | % | |
| Waiver/Reimbursement | | | 0.15 | % | | | 0.15 | % | | | 0.15 | % | | | 0.15 | % | | | 0.15 | % | |
| Net investment income (e) | | | 3.83 | % | | | 4.11 | % | | | 3.95 | % | | | 3.78 | % | | | 3.83 | % | |
| Portfolio turnover rate | | | 11 | % | | | 12 | % | | | 14 | % | | | 13 | % | | | 5 | % | |
| Net assets, end of period (000s) | | $ | 37,377 | | | $ | 34,079 | | | $ | 25,023 | | | $ | 22,650 | | | $ | 20,789 | | |
(a) Per share data was calculated using the average shares outstanding during the period.
(b) Rounds to less than $0.01 per share.
(c) Total return at net asset value assuming all distributions reinvested and no contingent deferred sales charge.
(d) Had the investment adviser and/or any of its affiliates not waived fees or reimbursed a portion of expenses, total return would have been reduced.
(e) The benefits derived from expense reductions had an impact of less than 0.01%.
(f) Interest expense and fees relate to the Fund's liability with respect to floating-rate notes held in conjunction with investments in inverse floating rate obligations.
(g) Rounds to less than 0.01%.
See Accompanying Notes to Financial Statements.
35
Financial Highlights – Columbia Tax-Exempt Fund
Selected data for a share outstanding throughout each period is as follows:
| | | Year Ended November 30, | |
| Class Z Shares | | 2010 | | 2009 | | 2008 | | 2007 | | 2006 | |
| Net Asset Value, Beginning of Period | | $ | 13.05 | | | $ | 11.95 | | | $ | 13.52 | | | $ | 13.88 | | | $ | 13.49 | | |
| Income from Investment Operations: | |
| Net investment income (a) | | | 0.62 | | | | 0.62 | | | | 0.62 | | | | 0.62 | | | | 0.62 | | |
Net realized and unrealized gain (loss) on investments
and futures contracts | | | 0.07 | | | | 1.10 | | | | (1.58 | ) | | | (0.36 | ) | | | 0.40 | | |
| Total from investment operations | | | 0.69 | | | | 1.72 | | | | (0.96 | ) | | | 0.26 | | | | 1.02 | | |
| Less Distributions to Shareholders: | |
| From net investment income | | | (0.61 | ) | | | (0.62 | ) | | | (0.61 | ) | | | (0.62 | ) | | | (0.63 | ) | |
| Increase from regulatory settlements | | | — | (b) | | | — | | | | — | | | | — | | | | — | | |
| Net Asset Value, End of Period | | $ | 13.13 | | | $ | 13.05 | | | $ | 11.95 | | | $ | 13.52 | | | $ | 13.88 | | |
| Total return (c) | | | 5.33 | % | | | 14.64 | % | | | (7.30 | )% | | | 1.94 | % | | | 7.75 | % | |
| Ratios to Average Net Assets/Supplemental Data: | |
| Net expenses before interest expense and fees (d) | | | 0.60 | % | | | 0.60 | % | | | 0.58 | % | | | 0.58 | % | | | 0.60 | % | |
| Interest expense and fees | | | — | | | | — | %(e)(f) | | | 0.02 | %(e) | | | 0.04 | %(e) | | | 0.05 | %(e) | |
| Net expenses (d) | | | 0.60 | % | | | 0.60 | % | | | 0.60 | % | | | 0.62 | % | | | 0.65 | % | |
| Net investment income (d) | | | 4.63 | % | | | 4.93 | % | | | 4.76 | % | | | 4.59 | % | | | 4.62 | % | |
| Portfolio turnover rate | | | 11 | % | | | 12 | % | | | 14 | % | | | 13 | % | | | 5 | % | |
| Net assets, end of period (000s) | | $ | 793,302 | | | $ | 833,847 | | | $ | 814,018 | | | $ | 884,741 | | | $ | 889,644 | | |
(a) Per share data was calculated using the average shares outstanding during the period.
(b) Rounds to less than $0.01 per share.
(c) Total return at net asset value assuming all distributions reinvested.
(d) The benefits derived from expense reductions had an impact of less than 0.01%.
(e) Interest expense and fees relate to the Fund's liability with respect to floating-rate notes held in conjunction with investments in inverse floating rate obligations.
(f) Rounds to less than 0.01%.
See Accompanying Notes to Financial Statements.
36
Notes to Financial Statements – Columbia Tax-Exempt Fund
November 30, 2010
Note 1. Organization
Columbia Tax-Exempt Fund (the "Fund"), a series of Columbia Funds Series Trust I (the "Trust"), is a diversified fund. The Trust is registered under the Investment Company Act of 1940, as amended ("the 1940 Act"), as an open-end management investment company organized as a Massachusetts business trust.
Investment Objective
The Fund seeks total return, consisting of current income exempt from federal income tax and of capital appreciation, consistent with moderate fluctuation of principal.
Fund Shares
The Trust may issue an unlimited number of shares, and the Fund offers four classes of shares: Class A, Class B, Class C and Class Z. Each share class has its own expense structure and sales charges, as applicable.
Class A shares are subject to a maximum front-end sales charge of 4.75% based on the amount of initial investment. Class A shares purchased without an initial sales charge in accounts aggregating $1 million to $50 million at the time of purchase are subject to a maximum contingent deferred sales charge ("CDSC") of 1.00% based upon the holding period after purchase.
Class B shares are subject to a maximum CDSC of 5.00% based upon the holding period after purchase. Class B shares will convert to Class A shares eight years after purchase. The Fund no longer accepts investments by new or existing investors in the Fund's Class B shares, except in connection with the reinvestment of any dividend and/or capital gain distributions in Class B shares of the Fund and exchanges by existing Class B shareholders of other Columbia Funds.
Class C shares are subject to a 1.00% CDSC on shares sold within one year after purchase.
Class Z shares are offered continuously at net asset value. There are certain restrictions on the purchase of Class Z shares, as described in the Fund's prospectus.
Note 2. Significant Accounting Policies
Use of Estimates
The preparation of financial statements in accordance with accounting principles generally accepted in the United States of America ("GAAP") requires management to make certain estimates and assumptions that affect the reported amounts of assets and liabilities, the disclosure of contingent assets and liabilities at the date of the financial statements and the reported amounts of revenue and expenses during the reporting period. Actual results could differ from those estimates.
The following is a summary of significant accounting policies consistently followed by the Fund in the preparation of its financial statements.
Security Valuation
Debt securities generally are valued by pricing services approved by the Trust's Board of Trustees, based upon market transactions for normal, institutional-size trading units of similar securities. The services may use various pricing techniques which take into account appropriate factors such as yield, quality, coupon rate, maturity, type of issue, trading characteristics and other data, as well as broker quotes. Debt securities for which quotations are readily available may also be valued based upon an over-the-counter or exchange bid quotation.
Certain debt securities, which tend to be more thinly traded and of lesser quality, are priced based on fundamental analysis of the financial condition of the issuer and the estimated value of any collateral. Valuations developed through pricing techniques may vary from the actual amounts realized upon sale of the securities, and the potential variation may be greater for those securities valued using fundamental analysis.
Short-term investments maturing in 60 days or less are valued at amortized cost, which approximates market value.
Investments in other open-end investment companies are valued at net asset value.
Investments for which market quotations are not readily available, or that have quotations which management believes
37
Columbia Tax-Exempt Fund, November 30, 2010
are not reliable, are valued at fair value as determined in good faith under consistently applied procedures established by and under the general supervision of the Board of Trustees. If a security is valued at fair value, such value is likely to be different from the last quoted market price for the security. The determination of fair value often requires significant judgment. To determine fair value, management may use assumptions including but not limited to future cash flows and estimated risk premiums. Multiple inputs from various sources may be used to determine value.
GAAP establishes a hierarchy that prioritizes the inputs to valuation techniques used to measure fair value giving the highest priority to unadjusted quoted prices in active markets for identical securities (Level 1 measurements) and the lowest priority to unobservable inputs (Level 3 measurements) when market prices are not readily available or reliable. The three levels of the fair value hierarchy are described below:
• Level 1 – quoted prices in active markets for identical securities
• Level 2 – prices determined using other significant observable inputs (including quoted prices for similar securities, interest rates, prepayment speeds, credit risk and others)
• Level 3 – prices determined using significant unobservable inputs. In situations where quoted prices or observable inputs are unavailable or less reliable, unobservable inputs may be used. Unobservable inputs may include management's own assumptions about the factors market participants would use in pricing an investment.
The inputs or methodology used for valuing securities are not necessarily an indication of the risk associated with investing in those securities.
On January 21, 2010, the Financial Accounting Standards Board issued an Accounting Standards Update (the "amendment"), Fair Value Measurements and Disclosures (Topic 820): Improving Disclosures about Fair Value Measurements, which provides guidance on how investment assets and liabilities are to be valued and disclosed. Specifically, the amendment requires reporting entities to disclose the input and valuation techniques used to measure fair value for both recurring and nonrecurring fair value measurements for Level 2 or Level 3 positions. The amendment also requires that significant transfers between all levels (including Level 1 and Level 2) be disclosed on a gross basis (i.e., transfers out must be disclosed separately from transfers in ), and requires disclosure of the reason(s) for significant transfers. Additionally purchases, sales, issuances and settlements must be disclosed on a gross basis in the Level 3 roll forward. The effective date of the amendment is for interim and annual periods beginning after December 15, 2009; except for the requirement to provide the Level 3 activity for purchases, sales, issuances and settlements on a gross basis, which will be effective for interim and annual periods beginning after December 15, 2010.
Security Transactions
Security transactions are accounted for on the trade date. Cost is determined and gains (losses) are based upon the specific identification method for both financial statement and federal income tax purposes.
Delayed Delivery Securities
The Fund may trade securities on other than normal settlement terms, including securities purchased or sold on a "when-issued" basis. This may increase the risk if the other party to the transaction fails to deliver and causes the Fund to subsequently invest at less advantageous prices. The Fund identifies within its portfolio of investments cash or liquid securities in an amount equal to the delayed delivery commitment.
Income Recognition
Interest income is recorded on the accrual basis. Market premium and discount are amortized and accreted, respectively, on all debt securities, unless otherwise noted. Original issue discount is accreted to interest income over the life of the security with a corresponding increase in the cost basis, if any. Dividend income is recorded on the ex-date.
Expenses
General expenses of the Trust are allocated to the Fund and other series of the Trust based upon relative net assets or other expense allocation methodologies determined by the nature of the expense. Expenses directly attributable to the Fund are charged to the Fund. Expenses directly attributable to a specific class of shares are charged to that share class.
38
Columbia Tax-Exempt Fund, November 30, 2010
Determination of Class Net Asset Value
All income, expenses (other than class-specific expenses, as shown on the Statement of Operations) and realized and unrealized gains (losses) are allocated to each class of the Fund on a daily basis for purposes of determining the net asset value of each class. Income and expenses are allocated to each class based on the settled shares method, while realized and unrealized gains (losses) are allocated based on the relative net assets of each class.
Federal Income Tax Status
The Fund intends to qualify each year as a "regulated investment company" under Subchapter M of the Internal Revenue Code, as amended, and will distribute substantially all of its tax exempt and taxable income, if any, for its tax year, and as such will not be subject to federal income taxes. In addition, the Fund intends to distribute in each calendar year substantially all of its net investment income, capital gains and certain other amounts, if any, such that the Fund should not be subject to federal excise tax. Therefore, no federal income or excise tax provision is recorded.
Distributions to Shareholders
Distributions from net investment income are declared daily and paid monthly. Net realized capital gains, if any, are distributed at least annually. Income distributions and capital gain distributions are determined in accordance with federal income tax regulations which may differ from GAAP.
Indemnification
In the normal course of business, the Fund enters into contracts that contain a variety of representations and warranties and which provide general indemnities. The Fund's maximum exposure under these arrangements is unknown because this would involve future claims against the Fund. Also, under the Trust's organizational documents and by contract, the Trustees and officers of the Trust are indemnified against certain liabilities that may arise out of actions relating to their duties to the Trust. However, based on experience, the Fund expects the risk of loss due to these representations, warranties and indemnities to be minimal.
Note 3. Federal Tax Information
The timing and character of income and capital gain distributions are determined in accordance with income tax regulations, which may differ from GAAP. Reclassifications are made to the Fund's capital accounts for permanent tax differences to reflect income and gains available for distribution (or available capital loss carryforwards) under income tax regulations.
For the year ended November 30, 2010, permanent book and tax basis differences resulting primarily from differing treatments of discount accretion/premium amortization on debt securities, paydown reclassifications, proceeds from litigation settlements and market discount reclassifications were identified and reclassified among the components of the Fund's net assets as follows:
Undistributed
Net Investment
Income | | Accumulated
Net Realized
Loss | | Paid-In Capital | |
| $ | (701,771 | ) | | $ | 380,029 | | | $ | 321,742 | | |
Net investment income and net realized gains (losses), as disclosed on the Statement of Operations, and net assets were not affected by this reclassification.
The tax character of distributions paid during the years ended November 30, 2010 and November 30, 2009 was as follows:
| | | November 30, | |
| | | 2010 | | 2009 | |
| Tax-Exempt Income | | $ | 98,646,693 | | | $ | 104,333,465 | | |
| Ordinary Income* | | | 877,056 | | | | 377,712 | | |
* For tax purposes short-term capital gain distributions, if any, are considered ordinary income distributions.
As of November 30, 2010, the components of distributable earnings on a tax basis were as follows:
Undistributed
Tax-Exempt
Income | | Undistributed
Long-Term
Capital Gains | | Net Unrealized
Appreciation* | |
| $ | 8,894,909 | | | $ | — | | | $ | 57,450,153 | | |
* The differences between book-basis and tax-basis net unrealized appreciation are primarily due to capital loss carryforwards, discount accretion/premium amortization on debt securities and market discount reclassifications.
39
Columbia Tax-Exempt Fund, November 30, 2010
Unrealized appreciation and depreciation at November 30, 2010, based on cost of investments for federal income tax purposes were:
| Unrealized appreciation | | $ | 129,148,069 | | |
| Unrealized depreciation | | | (71,697,916 | ) | |
| Net unrealized appreciation | | $ | 57,450,153 | | |
The following capital loss carryforwards may be available to reduce taxable income arising from future net realized gains on investments, if any, to the extent permitted by the Internal Revenue Code:
| Year of Expiration | | Capital Loss
Carryforwards | |
| 2017 | | $ | 1,455,576 | | |
Capital loss carryforwards of $22,381,476 were utilized during the year ended November 30, 2010.
Any capital loss carryforwards acquired as part of a merger that are permanently lost due to provisions under the Internal Revenue Code are included as being expired. Expired capital loss carryforwards are recorded as a reduction of paid-in capital.
Management is required to determine whether a tax position of the Fund is more likely than not to be sustained upon examination by the applicable taxing authority, including resolution of any related appeals or litigation processes, based on the technical merits of the position. The tax benefit to be recognized by the Fund is measured as the largest amount of benefit that is greater than fifty percent likely of being realized upon ultimate settlement. Management is not aware of any tax positions for which it is reasonably possible that the total amounts of unrecognized tax benefits will significantly change in the next twelve months. However, management's conclusions may be subject to review and adjustment at a later date based on factors including, but not limited to, new tax laws, regulations, and administrative interpretations (including relevant court decisions). The Fund's federal tax returns for the prior thr ee fiscal years remain subject to examination by the Internal Revenue Service.
Note 4. Fees and Compensation Paid to Affiliates
Investment Advisory Fee
After the close of business on April 30, 2010, Ameriprise Financial, Inc. ("Ameriprise Financial") acquired a portion of the asset management business of Columbia Management Group, LLC (the "Transaction"), including the business of managing the Fund. In connection with the closing of the Transaction (the "Closing"), RiverSource Investments, LLC, a wholly owned subsidiary of Ameriprise Financial, became the investment adviser of the Fund and changed its name to Columbia Management Investment Advisers, LLC (the "New Adviser"). The New Adviser receives a monthly investment advisory fee based on the Fund's average daily net assets at the following annual rates:
| Average Daily Net Assets | | Annual Fee Rate | |
| First $500 million | | | 0.55 | % | |
| $500 million to $1 billion | | | 0.50 | % | |
| $1 billion to $1.5 billion | | | 0.47 | % | |
| $1.5 billion to $3 billion | | | 0.44 | % | |
| $3 billion to $6 billion | | | 0.43 | % | |
| Over $6 billion | | | 0.42 | % | |
Prior to the Closing, Columbia Management Advisors, LLC ("Columbia"), an indirect, wholly owned subsidiary of Bank of America Corporation ("BOA"), provided investment advisory, administrative and other services to the Fund under the same fee structure.
For the year ended November 30, 2010, the Fund's effective investment advisory fee rate was 0.48% of the Fund's average daily net assets.
Administration Fee
Effective upon the Closing, the New Adviser became the administrator of the Fund under a new Administrative Services Agreement (the "Administrative Agreement"). Under the Administrative Agreement, the New Adviser provides administrative and other services to the Fund, including services previously performed under the Pricing and Bookkeeping Oversight and Services Agreement discussed below. The New Adviser does not receive a fee for its services
40
Columbia Tax-Exempt Fund, November 30, 2010
under the Administrative Agreement. Prior to the Closing, Columbia provided administrative services to the Fund as discussed in the Investment Advisory Fee note above.
Pricing and Bookkeeping Fees
Prior to the Closing, the Fund entered into a Financial Reporting Services Agreement (the "Financial Reporting Services Agreement") with State Street Bank and Trust Company ("State Street") and Columbia pursuant to which State Street provides financial reporting services to the Fund. The Fund also entered into an Accounting Services Agreement (collectively with the Financial Reporting Services Agreement, the "State Street Agreements") with State Street and Columbia pursuant to which State Street provides accounting services to the Fund. Upon the Closing, Columbia assigned and delegated its rights and obligations under the State Street Agreements to the New Adviser. Under the State Street Agreements, the Fund pays State Street an annual fee of $38,000 paid monthly plus an additional monthly fee based on an annualized percentage rate of average daily net assets of the Fund for the month. The aggregate fee will not ex ceed $140,000 per year (exclusive of out-of-pocket expenses and charges). The Fund also reimburses State Street for certain out-of-pocket expenses and charges.
Also prior to the Closing, the Fund entered into a Pricing and Bookkeeping Oversight and Services Agreement (the "Services Agreement") with Columbia. Under the Services Agreement, Columbia provided services related to Fund expenses and the requirements of the Sarbanes-Oxley Act of 2002, and provided oversight of the accounting and financial reporting services provided by State Street. Under the Services Agreement, the Fund reimbursed Columbia for out-of-pocket expenses and charges, including fees payable to third parties, such as for pricing the Fund's portfolio securities, incurred by Columbia in the performance of services under the Services Agreement. The Services Agreement was terminated upon the Closing. These services are now provided under the Administrative Agreement discussed above.
Transfer Agent Fee
In connection with the Closing, RiverSource Service Corporation, a wholly owned subsidiary of Ameriprise Financial, became the transfer agent of the Fund and changed its name to Columbia Management Investment Services Corp. (the "New Transfer Agent"). The New Transfer Agent has contracted with Boston Financial Data Services ("BFDS") to serve as sub-transfer agent. The New Transfer Agent receives monthly account-based service fees based on the number of open accounts and asset-based fees, calculated based on assets held in omnibus accounts, which are intended to reimburse the New Transfer Agent for certain sub-transfer agent fees (exclusive of BFDS fees). The New Transfer Agent pays the fees of BFDS for services as sub-transfer agent and is not entitled to reimbursement for such fees from the Fund.
The New Transfer Agent may also retain, as additional compensation for its services, fees for wire, telephone and redemption orders, Individual Retirement Account ("IRA") trustee agent fees and account transcript fees due to the New Transfer Agent from shareholders of the Fund and credits (net of bank charges) earned with respect to balances in accounts the New Transfer Agent maintains in connection with its services to the Fund. The New Transfer Agent also receives reimbursement for certain out-of-pocket expenses.
Prior to the Closing, Columbia Management Services, Inc., an affiliate of Columbia and an indirect, wholly owned subsidiary of BOA, provided shareholder services to the Fund and contracted with BFDS to serve as sub-transfer agent, under the same fee structure.
For the year ended November 30, 2010, the Fund's annualized effective transfer agent fee rate for each class was 0.07% of the Fund's average daily net assets.
An annual minimum account balance fee of $20 may apply to certain accounts with a value below the Fund's initial minimum investment requirements to reduce the impact of small accounts on transfer agent fees. These minimum account balance fees are recorded as part of expense reductions on the Statement of Operations. For the year ended November 30, 2010, no minimum account balance fees were charged by the Fund.
Underwriting Discounts, Service and Distribution Fees
In connection with the Closing, RiverSource Fund Distributors, Inc., an indirect wholly owned subsidiary of Ameriprise Financial, became the distributor of the Fund's
41
Columbia Tax-Exempt Fund, November 30, 2010
shares and changed its name to Columbia Management Investment Distributors, Inc. (the "New Distributor").
For the year ended November 30, 2010, initial sales charges paid by shareholders on the purchase of Class A shares amounted to $82,122. For the same time period, net CDSC fees paid by shareholders on certain redemptions of Class A, Class B and Class C shares amounted to $3,623, $5,696 and $2,737, respectively.
The Fund has adopted distribution and shareholder servicing plans (the "Plans") pursuant to Rule 12b-1 under the 1940 Act for Class A, Class B and Class C shares, which require the payment of distribution and service fees. The fees are intended to compensate the New Distributor and/or eligible selling and/or servicing agents for selling shares of the Fund and providing services to investors.
Payments under the Plans, which are calculated daily and paid monthly, are based on the average daily net assets of the applicable class of the Fund at the following annual rates:
| Distribution Fee | | Service Fee | |
| Class B | | Class C | | Class A | | Class B | | Class C | |
| | 0.75 | % | | | 0.75 | % | | | 0.20 | % | | | 0.20 | % | | | 0.20 | % | |
The New Distributor has voluntarily agreed to waive a portion of the distribution fee for Class C shares so that the combined distribution and service fees does not exceed 0.80% annually of Class C shares average daily net assets. This arrangement may be modified or terminated by the New Distributor at any time.
Prior to the Closing, Columbia Management Distributors, Inc., an affiliate of Columbia and an indirect, wholly owned subsidiary of BOA, was the principal underwriter of the Fund's shares. There were no changes to the underwriting discount structure of the Fund or the service or distribution fee rates paid by the Fund as a result of the Transaction.
Fee Waivers and Expense Reimbursements
In connection with the Closing, the New Adviser has voluntarily agreed to reimburse a portion of the Fund's expenses so that the Fund's ordinary operating expenses (excluding any distribution and service fees, brokerage commissions, interest, taxes and extraordinary expenses, but including custodian charges relating to overdrafts, if any), after giving effect to any balance credits from the Fund's custodian, do not exceed 0.60% of the Fund's average daily net assets on an annualized basis. This arrangement may be modified or terminated by the New Adviser at any time. For the period January 1, 2009 through the Closing, Columbia voluntarily reimbursed a portion of the Fund's expenses in the same manner.
Fees Paid to Officers and Trustees
All officers of the Fund are employees of the New Adviser or its affiliates and, with the exception of the Fund's Chief Compliance Officer, receive no compensation from the Fund. The Board of Trustees has appointed a Chief Compliance Officer to the Fund in accordance with federal securities regulations. The Fund, along with other affiliated funds, pays its pro-rata share of the expenses associated with the Chief Compliance Officer. The Fund's expenses for the Chief Compliance Officer will not exceed $15,000 per year.
Trustees are compensated for their services to the Fund, as set forth on the Statement of Operations. The Trust's eligible Trustees may participate in a deferred compensation plan which may be terminated at any time. Obligations of the plan will be paid solely out of the Fund's assets.
As a result of a fund merger, the Fund assumed the liabilities of the deferred compensation plan of the acquired fund, which are included in Trustees' fees on the Statement of Assets and Liabilities. The deferred compensation plan may be terminated at any time. Any payments to plan participants are paid solely out of the Fund's assets.
Other
Prior to the Closing, the Fund made daily investments of cash balances in BofA (formerly Columbia) Tax-Exempt Reserves, formerly an affiliated open-ended investment company managed by Columbia. The income earned prior to the Closing by the Fund from such investments is included as "Dividends from affiliates" on the Statement of Operations. As an investing Fund, the Fund was indirectly allocated its proportionate share of the expenses of BofA Tax-Exempt Reserves.
42
Columbia Tax-Exempt Fund, November 30, 2010
Note 5. Custody Credits
The Fund has an agreement with its custodian bank under which custody fees may be reduced by balance credits. These credits are recorded as part of expense reductions on the Statement of Operations. The Fund could have invested a portion of the assets utilized in connection with the expense offset arrangement in an income-producing asset if it had not entered into such an agreement. For the year ended November 30, 2010, these custody credits reduced total expenses by $144 for the Fund.
Note 6. Portfolio Information
For the year ended November 30, 2010, the cost of purchases and proceeds from sales of securities, excluding short-term obligations, for the Fund were $241,045,286 and $380,811,727, respectively.
Note 7. Regulatory Settlements
During the year ended November 30, 2010, the Fund received payments totaling $19,753 relating to certain regulatory settlements with third parties that the Fund had participated in during the year. The payments have been included in "Increase from regulatory settlements" on the Statement of Changes in Net Assets.
Note 8. Line of Credit
The Fund and other affiliated funds participate in a $280,000,000 committed, unsecured revolving line of credit provided by State Street. The maximum amount that may be borrowed by any fund is limited to the lesser of $200,000,000 and the Fund's borrowing limit set forth in the Fund's registration statement. Borrowings are available for short-term liquidity or temporary or emergency purposes.
Effective October 14, 2010, interest is charged to each participating fund based on the fund's borrowings at a rate per annum equal to the greater of the Federal Funds Rate plus 1.25% or the overnight LIBOR Rate plus 1.25%. In addition, a commitment fee of 0.125% per annum is accrued and apportioned among the participating funds pro rata based on their relative net assets.
Prior to October 14, 2010, interest was charged to each participating fund at the same rates. In addition, a commitment fee of 0.15% per annum was accrued and apportioned among the participating funds pro rata based on their relative net assets.
For the year ended November 30, 2010, the Fund did not borrow under these arrangements.
Note 9. Shareholder Concentration
As of November 30, 2010, two shareholder accounts owned 36.9% of the outstanding shares of the Fund. Purchase and redemption activity of these accounts may have a significant effect on the operations of the Fund.
Note 10. Significant Risks and Contingencies
Sector Focus Risk
The Fund may focus its investments in certain sectors, subjecting it to greater risk than a fund that is less focused.
High-Yield Securities Risk
Investing in high-yield securities may involve greater credit risk and considerations not typically associated with investing in U.S. Government bonds and other higher quality fixed income securities. These securities are non-investment grade securities, often referred to as "junk" bonds. Economic downturns may disrupt the high yield market and impair the ability of issuers to repay principal and interest. Also, an increase in interest rates would likely have an adverse impact on the value of such obligations. Moreover, high-yield securities may be less liquid to the extent that there is no established secondary market.
Geographic Concentration of Risk
At November 30, 2010, the Fund had greater than 5% of its total net assets invested in debt obligations issued by each of California, New York, Massachusetts, Texas, Illinois and New Jersey and their political subdivisions, agencies and public authorities. The Fund is more susceptible to economic and political factors adversely affecting issuers of these states' municipal securities than are municipal bond funds that are not concentrated to the same extent in these issuers.
Tax Development Risk
The Fund purchases municipal securities whose interest, in the opinion of bond counsel, is free from federal income tax. There is no assurance that the Internal Revenue Service
43
Columbia Tax-Exempt Fund, November 30, 2010
("IRS") will agree with this opinion. In the event the IRS determines that an issuer does not comply with relevant tax requirements, interest payments from a security could become federally taxable, possibly retroactively to the date the security was issued. As a shareholder of the Fund, you may be required to file an amended tax return as a result.
Information Regarding Pending and Settled Legal Proceedings
In June 2004, an action captioned John E. Gallus et al. v. American Express Financial Corp. and American Express Financial Advisors Inc. was filed in the United States District Court for the District of Arizona. The plaintiffs allege that they are investors in several American Express Company (now known as legacy RiverSource) mutual funds and they purport to bring the action derivatively on behalf of those funds under the Investment Company Act of 1940. The plaintiffs allege that fees allegedly paid to the defendants by the funds for investment advisory and administrative services are excessive. The plaintiffs seek remedies including restitution and rescission of investment advisory and distribution agreements. The plaintiffs voluntarily a greed to transfer this case to the United States District Court for the District of Minnesota (the District Court). In response to defendants' motion to dismiss the complaint, the District Court dismissed one of plaintiffs' four claims and granted plaintiffs limited discovery. Defendants moved for summary judgment in April 2007. Summary judgment was granted in the defendants' favor on July 9, 2007. The plaintiffs filed a notice of appeal with the Eighth Circuit Court of Appeals (the Eighth Circuit) on August 8, 2007. On April 8, 2009, the Eighth Circuit reversed summary judgment and remanded to the District Court for further proceedings. On August 6, 2009, defendants filed a writ of certiorari with the U.S. Supreme Court (the Supreme Court), asking the Supreme Court to stay the District Court proceedings while the Supreme Court considers and rules in a case captioned Jones v. Harris Associates, which involves issues of law similar to those presented in the Gallus case. On March 30, 2010, the Supreme Court issued its ruling in Jones v. Harris Associates, and on April 5, 2010, the Supreme Court vacated the Eighth Circuit's decision in the Gallus case and remanded the case to the Eighth Circuit for further consideration in light of the Supreme Court's decision in Jones v. Harris Associates. On June 4, 2010, the Eighth Circuit remanded the Gallus case to the District Court for further consideration in light of the Supreme Court's decision in Jones v. Harris Associates. On December 9, 2010, the District Court reinstated its July 9,2007 summary judgment order in favor of the defendants.
In December 2005, without admitting or denying the allegations, American Express Financial Corporation (AEFC, which is now known as Ameriprise Financial, Inc. (Ameriprise Financial)), entered into settlement agreements with the Securities and Exchange Commission (SEC) and Minnesota Department of Commerce (MDOC) related to market timing activities. As a result, AEFC was censured and ordered to cease and desist from committing or causing any violations of certain provisions of the Investment Advisers Act of 1940, the Investment Company Act of 1940, and various Minnesota laws. AEFC agreed to pay disgorgement of $10 million and civil money penalties of $7 million. AEFC also agreed to retain an independent distribution consultant to assist in developing a plan for distribution of all disgorgement and civil penalties ordered by the SEC in accordance with various undertakings detailed at http://www.sec.gov/litigation/admi n/ia-2451.pdf. Ameriprise Financial and its affiliates have cooperated with the SEC and the MDOC in these legal proceedings, and have made regular reports to the funds' Boards of Directors/Trustees.
Ameriprise Financial and certain of its affiliates have historically been involved in a number of legal, arbitration and regulatory proceedings, including routine litigation, class actions, and governmental actions, concerning matters arising in connection with the conduct of their business activities. Ameriprise Financial believes that the Funds are not currently the subject of, and that neither Ameriprise Financial nor any of its affiliates are the subject of, any pending legal, arbitration or regulatory proceedings that are likely to have a material adverse effect on the Funds or the ability of Ameriprise Financial or its affiliates to perform under their contracts with the Funds. Ameriprise Financial is required to make 10-Q, 10-K and, as necessary, 8-K filings with the Securities and Exchange Commission on legal and regulatory matters that relate to Ameriprise Financial and its affiliates. Copies of these fili ngs may be obtained by accessing the SEC website at www.sec.gov.
There can be no assurance that these matters, or the adverse publicity associated with them, will not result in increased fund redemptions, reduced sale of fund shares or other adverse consequences to the Funds. Further, although we
44
Columbia Tax-Exempt Fund, November 30, 2010
believe proceedings are not likely to have a material adverse effect on the Funds or the ability of Ameriprise Financial or its affiliates to perform under their contracts with the Funds, these proceedings are subject to uncertainties and, as such, we are unable to estimate the possible loss or range of loss that may result. An adverse outcome in one or more of these proceedings could result in adverse judgments, settlements, fines, penalties or other relief that could have a material adverse effect on the consolidated financial condition or results of operations of Ameriprise Financial.
Note 11. Subsequent Events
Management has evaluated the events and transactions that have occurred through the date the financial statements were issued and noted no items requiring adjustment of the financial statements or additional disclosures.
45
Report of Independent Registered Public Accounting Firm
To the Trustees of Columbia Funds Series Trust I and the Shareholders of Columbia Tax-Exempt Fund
In our opinion, the accompanying statement of assets and liabilities, including the investment portfolio, and the related statements of operations and of changes in net assets and the financial highlights present fairly, in all material respects, the financial position of Columbia Tax-Exempt Fund (the "Fund") (a series of Columbia Funds Series Trust I) at November 30, 2010, the results of its operations for the year then ended, the changes in its net assets for each of the two years in the period then ended, and the financial highlights for each of the five years in the period then ended, in conformity with accounting principles generally accepted in the United States of America. These financial statements and financial highlights (hereafter referred to as "financial statements") are the responsibility of the Fund's management. Our responsibility is to express an opinion on these financial statements based on our a udits. We conducted our audits of these financial statements in accordance with the standards of the Public Company Accounting Oversight Board (United States). Those standards require that we plan and perform the audit to obtain reasonable assurance about whether the financial statements are free of material misstatement. An audit includes examining, on a test basis, evidence supporting the amounts and disclosures in the financial statements, assessing the accounting principles used and significant estimates made by management, and evaluating the overall financial statement presentation. We believe that our audits, which included confirmation of securities at November 30, 2010 by correspondence with the custodian and brokers, provide a reasonable basis for our opinion.
PricewaterhouseCoopers LLP
Boston, Massachusetts
January 21, 2011
46
Federal Income Tax Information (Unaudited) – Columbia Tax-Exempt Fund
For the fiscal year ended November 30, 2010, 99.12% of the distributions from net investment income of the Fund qualifies as exempt interest dividends for federal income tax purposes. A portion of the income may be subject to federal alternative minimum tax.
The Fund will notify shareholders in January 2011 of amounts for use in preparing 2010 income tax returns.
47
Fund Governance
The Trustees serve terms of indefinite duration. The names, addresses and birth years of the Trustees and Officers of the Funds in the Columbia Funds Series Trust I, the year each was first elected or appointed to office, their principal business occupations during at least the last five years, the number of Funds overseen by each Trustee and other directorships they hold are shown below. Each officer listed below serves as an officer of each Fund in the Columbia Funds Series Trust I.
Independent Trustees
Name, Address and Year of Birth,
Position with Funds, Year First
Elected or Appointed to Office | | Principal Occupation(s) During Past Five Years, Number of Funds in Columbia
Funds Complex Overseen by Trustee, Other Directorships Held
| |
| John D. Collins (Born 1938) | |
|
c/o Columbia Management
Investment Advisers, LLC
One Financial Center
Boston, MA 02111
Trustee (since 2005) | | Retired. Consultant, KPMG, LLP (accounting and tax firm) from July 1999 to June 2000; Partner, KPMG, LLP from March 1962 to June 1999. Oversees 64; Mrs. Fields Original Cookies, Inc. (consumer products); Suburban Propane Partners, L.P.; and Montpelier Re (insurance underwriting firm) | |
|
| Rodman L. Drake (Born 1943) | |
|
c/o Columbia Management
Investment Advisers, LLC
One Financial Center
Boston, MA 02111
Trustee (since 1994) and Chairman of the Board (since 2009) | | Independent consultant since 2010; Co-Founder of Baringo Capital LLC (private equity) from 1997 to 2008; CEO of Crystal River Capital, Inc. (real estate investment trust) from 2003 to 2010; Oversees 64; Jackson Hewitt Tax Service Inc. (tax preparation services); Celgene Corporation (global biotechnology company); Student Loan Corporation (student loan provider); Crystal River Capital, Inc. from 2005 to 2010; Parsons Brinckerhoff from 1995 to 2008; the Helios Funds (exchange-traded funds); and Apex Silver Mines Ltd. from 2007 to 2009 | |
|
| Douglas A. Hacker (Born 1955) | |
|
c/o Columbia Management
Investment Advisers, LLC
One Financial Center
Boston, MA 02111
Trustee (since 1996) | | Independent business executive since May 2006; Executive Vice President—Strategy of United Airlines (airline) from December 2002 to May 2006; President of UAL Loyalty Services (airline marketing company) from September 2001 to December 2002; Executive Vice President and Chief Financial Officer of United Airlines from July 1999 to September 2001. Oversees 64; Nash Finch Company (food distributor); Aircastle Limited (aircraft leasing); and SeaCube Container Leasing Ltd. (container leasing) | |
|
| Janet Langford Kelly (Born 1957) | |
|
c/o Columbia Management
Investment Advisers, LLC
One Financial Center
Boston, MA 02111
Trustee (since 1996) | | Senior Vice President, General Counsel and Corporate Secretary, ConocoPhillips (integrated energy company) since September 2007; Deputy General Counsel—Corporate Legal Services, ConocoPhillips from August 2006 to August 2007; Partner, Zelle, Hofmann, Voelbel, Mason & Gette LLP (law firm) from March 2005 to July 2006; Adjunct Professor of Law, Northwestern University, from September 2004 to June 2006; Director, UAL Corporation (airline) from February 2006 to July 2006; Oversees 64; None | |
|
| William E. Mayer (Born 1940) | |
|
c/o Columbia Management
Investment Advisers, LLC
One Financial Center
Boston, MA 02111
Trustee (since 1994) | | Partner, Park Avenue Equity Partners (private equity) since February 1999; Dean and Professor, College of Business and Management, University of Maryland from 1992 to 1996. Oversees 64; DynaVox Inc. (software developer); Lee Enterprises (print media); WR Hambrecht + Co. (financial service provider); BlackRock Kelso Capital Corporation (investment company) | |
|
48
Fund Governance (continued)
Independent Trustees (continued)
Name, Address and Year of Birth,
Position with Funds, Year First
Elected or Appointed to Office | | Principal Occupation(s) During Past Five Years, Number of Funds in Columbia
Funds Complex Overseen by Trustee, Other Directorships Held
| |
| Charles R. Nelson (Born 1942) | |
|
c/o Columbia Management
Investment Advisers, LLC
One Financial Center
Boston, MA 02111
Trustee (since 1981) | | Professor of Economics, University of Washington, since January 1976; Ford and Louisa Van Voorhis Professor of Political Economy, University of Washington, since September 1993; Adjunct Professor of Statistics, University of Washington, since September 1980; Associate Editor, Journal of Money Credit and Banking, 1993-2008; Consultant on econometric and statistical matters. Oversees 64; None | |
|
| John J. Neuhauser (Born 1943) | |
|
c/o Columbia Management
Investment Advisers, LLC
One Financial Center
Boston, MA 02111
Trustee (since 1984) | | President, Saint Michael's College, since August 2007; Director or Trustee of several non-profit organizations, including Fletcher Allen Health Care, Inc.; University Professor, Boston College from November 2005 to August 2007; Academic Vice President and Dean of Faculties, Boston College from August 1999 to October 2005. Oversees 64; Liberty All-Star Equity Fund and Liberty All-Star Growth Fund, Inc. (closed-end funds) | |
|
| Jonathan Piel (Born 1938) | |
|
c/o Columbia Management
Investment Advisers, LLC
One Financial Center
Boston, MA 02111
Trustee (since 1994) | | Cable television producer and website designer; The Editor, Scientific American from 1984 to 1994; Vice President, Scientific American, Inc., from 1984 to 1994; Member, Advisory Board, Stone Age Institute, Bloomington, Indiana (research institute that explores the effect of technology on human evolution); Member, Board of Directors of the National Institute of Social Sciences, New York City; Member, Board of Trustees of the William Alanson White Institute, New York City (institution for training psychoanalysts); and Member, Advisory Board, Mount Sinai Children's Environmental Health Center, New York. Oversees 64; None | |
|
| Patrick J. Simpson (Born 1944) | |
|
c/o Columbia Management
Investment Advisers, LLC
One Financial Center
Boston, MA 02111
Trustee (since 2000) | | Partner, Perkins Coie LLP (law firm). Oversees 64; None | |
|
| Anne-Lee Verville (Born 1945) | |
|
c/o Columbia Management
Investment Advisers, LLC
One Financial Center
Boston, MA 02111
Trustee (since 1998) | | Retired since 1997 (formerly General Manager–Global Education Industry from 1994 to 1997, President–Application Systems Division from 1991 to 1994, Chief Financial Officer–US Marketing & Services from 1988 to 1991, and Chief Information Officer from 1987 to 1988, IBM Corporation (computer and technology)). Oversees 64; Enesco Group, Inc. (producer of giftware and home and garden decor products) from 2001 to 2006 | |
|
49
Fund Governance (continued)
Interested Trustee
Name, Address and Year of Birth,
Position with Funds, Year First
Elected or Appointed to Office | | Principal Occupation(s) During Past Five Years, Number of Funds in Columbia
Funds Complex Overseen by Trustee, Other Directorships Held
| |
| Michael A. Jones (Born 1959) | |
|
c/o Columbia Management
Investment Advisers, LLC
One Financial Center
Boston, MA 02111
Trustee (since 2011)
Senior Vice President (since 2010) | | Director and President, Columbia Management Investment Advisers, LLC since May 2010; President and Director, Columbia Management Investment Distributors, Inc. since May 2010; Manager, Chairman, Chief Executive Officer and President, Columbia Management Advisors, LLC from 2007 to April 2010; Chief Executive Officer, President and Director, Columbia Management Distributors, Inc. from November 2006 to April 2010; previously, co-president and senior managing director at Robeco Investment Management. Oversees 64; None | |
|
The Statement of Additional Information includes additional information about the Trustees of the Funds and is available, without charge, upon request by calling 1-800-345-6611.
Officers
| Name, Year of Birth and Address | | Principal Occupation(s) During the Past Five Years | |
| J. Kevin Connaughton (Born 1964) | |
|
One Financial Center
Boston, MA 02111
President (since 2009) | | Senior Vice President and General Manager–Mutual Fund Products, Columbia Management Investment Advisers, LLC since May 2010; President, Columbia Funds, since 2009, and RiverSource Funds, since May 2010 (previously Senior Vice President and Chief Financial Officer, Columbia Funds, from June 2008 to January 2009, Treasurer, Columbia Funds, from October 2003 to May 2008, and senior officer of various other affiliated funds since 2000); Managing Director, Columbia Management Advisors, LLC from December 2004 to April 2010. | |
|
| Michael G. Clarke (Born 1969) | |
|
One Financial Center
Boston, MA 02111
Senior Vice President and Chief
Financial Officer (since 2009) | | Vice President, Columbia Management Investment Advisers, LLC since May 2010; Managing Director of Fund Administration, Columbia Management Advisors, LLC, from September 2004 to April 2010; senior officer of Columbia Funds and affiliated funds since 2002. | |
|
| Scott R. Plummer (Born 1959) | |
|
5228 Ameriprise Financial Center
Minneapolis, MN 55474
Senior Vice President, Secretary
and Chief Legal Officer (since 2010) | | Chief Legal Officer and Assistant Secretary, Columbia Management Investment Advisers, LLC since June 2005; Vice President and Lead Chief Counsel–Asset Management, Ameriprise Financial, Inc. since May 2010 (previously Vice President and Chief Counsel–Asset Management, from 2005 to April 2010, and Vice President–Asset Management Compliance from 2004 to 2005); Vice President, Chief Counsel and Assistant Secretary, Columbia Management Investment Distributors, Inc. since 2008; Vice President, General Counsel and Secretary, Ameriprise Certificate Company since 2005; Chief Counsel, RiverSource Distributors, Inc. since 2006; Vice President, General Counsel and Secretary, RiverSource Funds, since December 2006; Senior Vice President, Secretary and Chief Legal Officer, Columbia Funds, since May 2010. | |
|
50
Fund Governance (continued)
Officers (continued)
| Name, Year of Birth and Address | | Principal Occupation(s) During the Past Five Years | |
| Linda J. Wondrack (Born 1964) | |
|
One Financial Center
Boston, MA 02111
Senior Vice President and Chief
Compliance Officer (since 2007) | | Vice President and Chief Compliance Officer, Columbia Management Investment Advisers, LLC since May 2010; Chief Compliance Officer, Columbia Funds, since 2007, and RiverSource Funds, since May 2010; Director (Columbia Management Group, LLC and Investment Product Group Compliance), Bank of America, from June 2005 to April 2010; Director of Corporate Compliance and Conflicts Officer of MFS Investment Management (investment management) from August 2004 to May 2005. | |
|
| William F. Truscott (Born 1960) | |
|
53600 Ameriprise Financial Center
Minneapolis, MN 55474
Senior Vice President (since 2010) | | Chairman of the Board, Columbia Management Investment Advisers, LLC since May 2010 (previously President, Chairman of the Board and Chief Investment Officer, from 2001 to April 2010); Chief Executive Officer, U.S. Asset Management & President, Annuities, Ameriprise Financial, Inc. since May 2010 (previously President–U.S. Asset Management and Chief Investment Officer from 2005 to April 2010, and Senior Vice President—Chief Investment Officer, from 2001 to 2005); Director, President and Chief Executive Officer, Ameriprise Certificate Company since 2006; Director, Columbia Management Investment Distributors, Inc. since May 2010 (previously Chairman of the Board and Chief Executive Officer from 2008 to April 2010); Chairman of the Board and Chief Executive Officer, RiverSource Distributors, Inc. since 2006. | |
|
| Colin Moore (Born 1958) | |
|
One Financial Center
Boston, MA 02111
Senior Vice President (since 2010) | | Director and Chief Investment Officer, Columbia Management Investment Advisers, LLC since May 2010; Manager, Managing Director and Chief Investment Officer of Columbia Management Advisors, LLC from 2007 to April 2010; Head of Equities, Columbia Management Advisors, LLC from 2002 to 2007. | |
|
| Amy Johnson (Born 1965) | |
|
5228 Ameriprise Financial Center
Minneapolis, MN 55474
Senior Vice President (since 2010) | | Senior Vice President and Chief Operating Officer, Columbia Management Investment Advisers, LLC since May 2010 (previously Chief Administrative Officer, from 2009 until April 2010, Vice President—Asset Management and Trust Company Services, from 2006 to 2009, and Vice President—Operations and Compliance from 2004 to 2006). | |
|
| Joseph F. DiMaria (Born 1968) | |
|
One Financial Center
Boston, MA 02111
Treasurer (since 2009) and
Chief Accounting Officer (since 2008) | | Vice President, Mutual Fund Administration, Columbia Management Investment Advisers, LLC, since May 2010; Director of Fund Administration, Columbia Management Advisors, LLC from January 2006 to April 2010; Head of Tax/Compliance and Assistant Treasurer, Columbia Management Advisors, LLC, from November 2004 to December 2005. | |
|
| Marybeth Pilat (Born 1968) | |
|
One Financial Center
Boston, MA 02111
Deputy Treasurer (since 2010) | | Vice President, Mutual Fund Administration, Columbia Management Investment Advisers, LLC, since May 2010; Vice President, Investment Operations, Bank of America, from October 2008 to April 2010; Finance Manager, Boston Children's Hospital from August 2008 to October 2008; Director, Mutual Fund Administration, Columbia Management Advisors, LLC, from May 2007 to July 2008; Vice President, Mutual Fund Valuation, Columbia Management Advisors, LLC, from January 2006 to May 2007; Vice President, Mutual Fund Accounting Oversight, Columbia Management Advisors, LLC from January 2005 to January 2006. | |
|
51
Fund Governance (continued)
Officers (continued)
| Name, Year of Birth and Address | | Principal Occupation(s) During the Past Five Years | |
| Julian Quero (Born 1967) | |
|
One Financial Center
Boston, MA 02111
Deputy Treasurer (since 2008) | | Vice President, Mutual Fund Administration, Columbia Management Investment Advisers, LLC since May 2010; Director of Fund Administration, Columbia Management Advisors, LLC, from August 2008 to April 2010; Senior Tax Manager, Columbia Management Advisors, LLC from August 2006 to July 2008; Senior Compliance Manager, Columbia Management Advisors, LLC from April 2002 to August 2006. | |
|
| Stephen T. Welsh (Born 1957) | |
|
One Financial Center
Boston, MA 02111
Vice President (since 2006) | | President and Director, Columbia Management Investment Services Corp. since May 2010; President and Director, Columbia Management Services, Inc. from July 2004 to April 2010; Managing Director, Columbia Management Distributors, Inc. from August 2007 to April 2010. | |
|
52
Board Consideration and Approval of Advisory Agreements
In September 2010, the Board of Trustees (the "Board") unanimously approved new Investment Management Services Agreements (the "Advisory Agreements") on behalf of various Columbia funds that would increase or decrease the contractual investment advisory fee rates payable by each affected Columbia fund (each, an "Affected Fund") to Columbia Management for investment advisory services. For Columbia Tax-Exempt Fund, the Advisory Agreement will decrease contractual investment advisory fee rates. As detailed below, the Board held numerous meetings and discussions with the management team of Columbia Management and reviewed and considered materials in connection with the approval of the investment advisory fee before determining to approve the Advisory Agreements.
On April 30, 2010, Ameriprise Financial, Inc. acquired the long-term asset management business of Columbia Management Group, LLC, a subsidiary of Bank of America and the parent of the Affected Funds' former investment adviser. In connection with that acquisition, the Affected Funds entered into investment management services agreements with Columbia Management, a subsidiary of Ameriprise Financial, Inc.
Beginning in April 2010, Columbia Management presented to the Advisory Fees and Expenses Committee (the "Committee") of the Board a proposal to rationalize the fees and expenses, including the advisory fees, of the various registered investment companies in the combined complex of Columbia-, RiverSource-, Seligman- and Threadneedle-branded funds (the "Columbia Funds Complex"). Because these funds were organized at different times by many different sponsors, their fees and expenses did not reflect a common overall design, and Columbia Management proposed to implement a more consistent schedule of fees for similar funds based on a uniform pricing model across all of the funds. In this regard, Columbia Management presented the Committee with various data comparing current and proposed fee schedules to the fee schedules of peer funds, as selected by an independent third-party data provider. While Columbia Management pr ojected that the proposed rationalization would reduce the overall fees and expenses of all of the funds in the aggregate, it was expected that certain fees and expenses, including advisory fees, would increase for certain funds. At the same time, Columbia Management presented the Committee with proposals to provide for consistent administrative services fee schedules across funds in the same asset class, reduced custody fee rates and a consistent transfer agency fee schedule across the funds, as well as initial proposals to merge various funds. In connection with these proposals, the Committee and the trustees considered a proposal by Columbia Management to contractually limit the total operating expenses (exclusive of brokerage commissions, interest (but including custodial charges relating to overdrafts), taxes and extraordinary expenses, after giving effect to any balance credits from each fund's custodian) of class A shares of funds, the expenses of which exceed the median expenses of such fund's class A shares peer group (as determined from time to time, generally annually, by an independent third-party data provider), to such median expenses (or a lower, agreed-upon rate), and to limit the total expenses of such funds' other classes to a corresponding amount, adjusted to reflect any class-specific expenses (including transfer agency fees and payments under any distribution plan, shareholder servicing plan, and/or plan administration agreement).
The Committee and the trustees who are not "interested persons" (as defined in the Investment Company Act of 1940 (the "1940 Act")) of the Trust (the "Independent Trustees") requested and evaluated materials from, and were provided materials and information regarding the Advisory Agreements by, Columbia Management. The Committee, at meetings held on April 20, 2010, May 3, 2010, June 7, 2010, July 27, 2010 and August 10, 2010, and the Independent Trustees, at meetings held on April 20, 2010, May 4, 2010, June 7, 2010 and August 11, 2010, reviewed the materials provided in connection with their consideration of the Advisory Agreements and other matters relating to the proposals and discussed them with representatives of Columbia Management. The Committee and the Independent Trustees also reviewed and considered information that they had previously received in connection with their most recent consideration and approv al of the current investment management services agreements with Columbia Management. They also consulted with Fund counsel and with the Independent Trustees' independent legal counsel, who advised on the legal standards for consideration by the trustees and otherwise assisted the trustees in their deliberations. The trustees also met with, and reviewed and considered a report prepared and provided by, the independent fee consultant (the "Fee Consultant") appointed by the Independent Trustees pursuant to an assurance of
53
discontinuance entered into by Columbia Management Advisors, LLC, the Affected Funds' previous adviser, with the New York Attorney General ("NYAG") to settle a civil complaint filed by the NYAG relating to trading in mutual fund shares (the "NYAG Settlement"). Under the NYAG Settlement, the Fee Consultant's role is to manage the process by which management fees are negotiated so that they are negotiated in a manner that is at arms' length and reasonable. On August 10, 2010, the Committee recommended that the trustees approve the Advisory Agreements. On September 14, 2010, the trustees, including a majority of the Independent Trustees, approved the Advisory Agreement for each Affected Fund, subject to shareholder approval.
The trustees considered all materials that they, their legal counsel or Columbia Management believed reasonably necessary to evaluate and to determine whether to approve the Advisory Agreements. The factors considered by the Committee and the trustees in recommending approval and approving the Advisory Agreement for each Affected Fund included the following:
• The expected benefits of continuing to retain Columbia Management as the Affected Funds' investment manager;
• The terms and conditions of the Advisory Agreements, including the increase or decrease, as applicable, in the advisory fee schedule for each Affected Fund;
• The impact of the proposed changes in investment advisory fee rates, as well as proposed changes in administrative services, transfer agency and custody fee rates, on each Affected Fund's total expense ratio;
• The willingness of Columbia Management to agree to contractually limit or cap total operating expenses for Columbia Tax-Exempt Fund so that total operating expenses (exclusive of brokerage commissions, interest (but including custodial charges relating to overdrafts), taxes and extraordinary expenses, after giving effect to any balance credits from each fund's custodian) of class A shares would not exceed the median expenses of such fund's class A shares peer group (as determined from time to time, generally annually, by an independent third-party data provider);
• That Columbia Management, and not any Affected Fund, would bear the costs of obtaining any necessary shareholder approvals of the Advisory Agreements;
• The expected impact on expenses for certain Affected Funds of proposed mergers; and
• The expected benefits of further integrating the Combined Fund Complex by:
o Standardizing total management fees across similar funds in the Combined Fund Complex to promote comparability of pricing among a menu of funds available to investors, including through exchange privileges; and
o Aligning investment advisory fee rates across funds in the Combined Fund Complex that are in the same investment category (e.g., the amendment would align the investment advisory fee rates of Columbia Large Cap Growth Fund with those of all other actively managed large-cap funds in the Combined Fund Complex).
Nature, Extent and Quality of Services Provided under the Advisory Agreements
The trustees considered the nature, extent and quality of services provided to the Affected Funds by Columbia Management and its affiliates under the Advisory Agreements and under separate agreements for the provision of transfer agency and administrative services, and the resources dedicated to the Affected Funds by Columbia Management and its affiliates. The trustees considered, among other things, the ability of Columbia Management to attract, motivate and retain highly qualified research, advisory and supervisory investment professionals (including Columbia Management's personnel and other resources, compensation programs for personnel involved in fund management, reputation and other attributes), the portfolio management services provided by those investment professionals, the trade execution services provided on behalf of the Affected Funds and the quality of Columbia Management's investment research capabili ties and the other resources that it devotes to each Affected Fund. For each Affected Fund, the trustees also considered the potential benefits to shareholders of investing in a mutual fund that is part of a fund complex offering exposure to a variety of asset classes and investment disciplines and providing a variety of
54
fund and shareholder services. After reviewing these and related factors, the trustees concluded, within the context of their overall conclusions, that the nature, extent and quality of the services to be provided to each Affected Fund under the Advisory Agreements supported the approval of the Advisory Agreements.
Investment Performance
The trustees reviewed information about the performance of each Affected Fund over various time periods, including information prepared by an independent third-party data provider that compared the performance of each Affected Fund to the performance of peer groups of mutual funds and performance benchmarks. The trustees also reviewed a description of the third party's methodology for identifying each Fund's peer group for purposes of performance and expense comparisons. In the case of each Affected Fund whose performance lagged that of a relevant peer group for certain (although not necessarily all) periods, the trustees concluded that other factors relevant to performance were sufficient, in light of other considerations, to warrant approval of the Affected Fund's Advisory Agreement. Those factors varied from fund to fund, but included one or more of the following: (i) that the Affected Fund's performance, althou gh lagging in certain recent periods, was stronger over the longer term; (ii) that the underperformance was attributable, to a significant extent, to investment decisions that were reasonable and consistent with the Affected Fund's investment strategy and policies and that the Affected Fund was performing within a reasonable range of expectations, given those investment decisions, market conditions and the Affected Fund's investment strategy; (iii) that the Affected Fund's performance was competitive when compared to other relevant performance benchmarks or peer groups; and (iv) that Columbia Management had taken or was taking steps designed to help improve the Affected Fund's investment performance, including, but not limited to, replacing portfolio managers, enhancing the resources supporting the portfolio managers, or modifying investment strategies.
The trustees noted that, through February 28, 2010, Columbia Tax-Exempt Fund's performance was in the third quintile (where the best performance would be in the first quintile) for the one- and three-year periods and in the second quintile for the five- and ten-year periods of the peer group selected by an independent third-party data provider for the purposes of performance comparisons.
After reviewing those and related factors, the trustees concluded, within the context of their overall conclusions regarding each of the Advisory Agreements, that the performance of each Affected Fund and Columbia Management was sufficient, in light of other considerations, to warrant the approval of the Advisory Agreement pertaining to that Affected Fund.
Investment Advisory Fee Rates and Other Expenses
The trustees considered that the Advisory Agreement for Columbia Tax-Exempt Fund would decrease the contractual investment advisory fee rates payable by that Fund and would be otherwise identical to that Fund's current investment management services agreement. The trustees reviewed and considered information that they had previously received in connection with the most recent approval of Columbia Tax-Exempt Fund's current investment management services agreement with Columbia Management.
After reviewing these and related factors, the trustees concluded, within the context of their overall conclusions, that the advisory fee rates under the Advisory Agreements and anticipated total expenses of each Affected Fund supported the approval of the Advisory Agreements.
Costs of Services Provided and Profitability
The trustees considered information about the advisory fees charged by Columbia Management to comparable institutional accounts. In considering the fees charged to those accounts, the trustees took into account, among other things, Columbia Management's representations about the differences between managing mutual funds as compared to other types of accounts, including differences in the services provided, differences in the risk profile of such business for Columbia Management, and the additional resources required to manage mutual funds effectively. In evaluating each Affected Fund's proposed advisory fees, the trustees also took into account the demands, complexity and quality of the investment management of the Affected Fund.
The trustees also considered the compensation directly or indirectly received by Columbia Management and its affiliates in connection with their relationships with the Affected Funds. The trustees reviewed information provided by management
55
as to the projected profitability to Columbia Management and its affiliates of their relationships with each Affected Fund, and information about the allocation of expenses used to calculate profitability. When reviewing profitability, the trustees also considered court cases in which adviser profitability was an issue in whole or in part, the performance of the relevant Affected Funds, the current and anticipated expense levels of each Affected Fund, and the implementation of breakpoints and/or expense limitations with respect to each Affected Fund.
After reviewing those and related factors, the trustees concluded, within the context of their overall conclusions, that the proposed changes to the advisory fees, and the related profitability to Columbia Management and its affiliates of their relationships with the Affected Fund, supported the approval of the Advisory Agreement pertaining to that Affected Fund.
Economies of Scale
The trustees considered the existence of any economies of scale in the provision by Columbia Management of services to each Affected Fund, to groups of related funds and to Columbia Management's investment advisory clients as a whole, and whether those economies of scale were shared with the Affected Funds through breakpoints in the proposed investment advisory fees or other means, such as expense limitation arrangements and additional investments by Columbia Management in investment, trading and compliance resources. The trustees noted that all of the Affected Funds were expected to benefit from breakpoints and/or expense limitation arrangements. In considering those issues, the trustees also took note of the costs of the services to be provided (both on an absolute and relative basis) and the projected profitability to Columbia Management and its affiliates of their relationships with the Affected Funds, as discu ssed above. The trustees also noted the expected expense synergies and other anticipated benefits to Columbia Management and fund shareholders of both the rationalization of fees and expenses and the proposed mergers of certain Affected Funds. After reviewing these and related factors, the trustees concluded, within the context of their overall conclusions, that the extent to which economies of scale were expected to be shared with the Affected Funds supported the approval of the Advisory Agreements.
Other Benefits to Columbia Management
The trustees received and considered information regarding any expected "fall-out" or ancillary benefits to be received by Columbia Management and its affiliates as a result of their relationships with the Affected Funds, such as the provision by Columbia Management of administrative services to the Affected Funds and the provision by Columbia Management's affiliates of distribution and transfer agency services to the Affected Funds, and how the proposed rationalization of fees and expenses might affect such benefits, including the fact that to the extent fees payable by the Affected Funds decrease, and the fees for such Funds were subject to a contractual limit or cap on expenses, Columbia Management may pay less in expense reimbursements. The trustees considered that the Affected Funds' distributor, an affiliate of Columbia Management, retains a portion of the distribution fees from the Affected Funds and receive s a portion of the sales charges on sales or redemptions of certain classes of shares of the Affected Funds, and that other affiliates of Columbia Management receive various forms of compensation in connection with their sale of shares of the Affected Funds. The trustees also considered the benefits of research made available to Columbia Management by reason of brokerage commissions generated by the Affected Funds' securities transactions, and reviewed information about Columbia Management's practices with respect to allocating portfolio brokerage and the use of "soft" commission dollars to pay for research. The trustees considered the possible conflicts of interest associated with certain fall-out or other ancillary benefits and the reporting, disclosure and other processes that would be in place to disclose and to monitor such possible conflicts of interest. The trustees recognized that Columbia Management's profitability would be somewhat lower without these benefits.
In their deliberations, the trustees did not identify any single item that was paramount or controlling and individual trustees may have attributed different weights to various factors. The trustees also evaluated all information available to them on a fund-by-fund basis, and their determinations were made separately in respect of each Affected Fund.
Based on their evaluation of all factors that they deemed to be material, including those factors described above, and assisted by the advice of independent legal counsel and the Fee Consultant, the trustees, including the Independent Trustees, approved each Advisory Agreement.
56
Summary of Management Fee Evaluation by Independent Fee Consultant
REPORT OF INDEPENDENT FEE CONSULTANT TO THE FUNDS SUPERVISED BY THE COLUMBIA ATLANTIC BOARD
Prepared Pursuant to the February 9, 2005
Assurance of Discontinuance among the
Office of Attorney General of New York State,
Columbia Management Advisors, LLC, and
Columbia Management Distributors, Inc.
September 21, 2010
I. Overview
On February 9, 2005, Columbia Management Advisors, LLC ("CMA") and Columbia Management Distributors, Inc.1 ("CMD") agreed to the New York Attorney General's Assurance of Discontinuance ("AOD"). Among other things, the AOD stipulates that CMA may manage or advise a Columbia Fund ("Columbia Fund" and, together with some or all of such funds, the "Columbia Funds") only if the Independent Members of the Columbia Fund's Board of Trustees appoint a Senior Officer or retain an Independent Fee Consultant ("IFC") who is to manage the process by which proposed management fees are negotiated. The AOD further stipulates that the Senior Officer or IFC is to prepare a written annual evaluation of the fee negotiation process.
With effect from January 1, 2007, the Independent Members of the Board of Trustees for certain Columbia Funds known collectively as the "Atlantic Funds" (together with the other members of that Board, the "Trustees") retained me as IFC for the Atlantic Funds.2 In this capacity, I have prepared this written evaluation of the fee negotiation process. As has been the case with my previous reports, my immediate predecessor as IFC, John Rea, provided invaluable assistance in the preparation of this report.
On September 29, 2009, Ameriprise entered into an asset purchase agreement with Bank of America, N.A. and its parent, Bank of America Corporation (together, the "Bank") pursuant to which the Bank agreed to sell certain CMG assets relating to Columbia's long-term asset management business, including management of the Atlantic Funds (the "Transaction"). The Transaction, which closed on April 30, 2010,3 resulted in the termination of the existing Investment Management Agreements with CMA. Prior to the closing of the Transaction, the Trustees and the shareholders of the Funds approved new Advisory and Administrative Agreements with an Ameriprise subsidiary now called Columbia Management Investment Advisers, LLC ("CMIA"). Those Agreements did not change the rates paid by the Funds from the levels specified in the former agreements with CMA.
CMIA serves as the adviser of funds supervised by three different Boards of Trustees: the Atlantic, Nations, and RiverSource Boards, and a subsidiary of CMIA serves as adviser to funds overseen by a fourth Board, Columbia/Wanger. After reviewing the range of funds overseen by all four Boards, CMIA proposed a series of changes intended, among other things, to rationalize its mutual fund product offerings (by, for example, proposing to merge funds with similar investment strategies) and the fees charged to the funds by CMIA and its affiliates. These proposals included (1) changes to the advisory fees paid by certain funds, (2) changes to administrative and similar fees paid by certain funds, (3) changes to the transfer agency, sub-transfer agency, custody, and pricing/bookkeeping fees paid by the Funds, and (4) mergers involving more than 60 funds. CMIA asked the Trustees to consider these proposals together. This re port, consistent with and (to the extent applicable) in fulfillment of the terms of the AOD, will focus on changes to advisory and aggregate management fees and discuss other proposals insofar as they affect total fund expenses, which may be a relevant factor in considering the appropriate level of advisory and management fees (defined for purposes of this report as advisory plus administrative fees).
A. Role of the Independent Fee Consultant
The AOD charges the IFC with "managing the process by which proposed management fees ... to be charged the Columbia Fund are negotiated so that they are negotiated in a manner which is at arms' length and reasonable and consistent with this Assurance of Discontinuance." The AOD also provides that CMA "may manage or advise a Columbia Fund only if the reasonableness of the proposed management fees is determined by the Board of Trustees ... using ... an
1 CMA and CMD are subsidiaries of Columbia Management Group, LLC ("CMG"), and are the successors to the entities named in the AOD.
2 I have no material relationship with Bank of America, CMG or Ameriprise Financial, Inc. ("Ameriprise"), aside from serving as IFC, and I am aware of no material relationship with any of their affiliates. I retained John Rea, an independent economic consultant, to assist me with this report.
3 CMIA, Materials Prepared for the Atlantic Fees and Expense Committee, June 7, 2010 ("June 7 Materials"), Tab 1 at p. 1.
Unless otherwise stated or required by the context, this report covers only the Atlantic Funds.
57
annual independent written evaluation prepared by or under the direction of ... the Independent Fee Consultant." Therefore, the AOD makes clear that the IFC does not supplant the Trustees in negotiating management fees, nor does the IFC substitute his or her judgment for that of the Trustees with respect to the reasonableness of proposed fees or any other matter that is committed to the business judgment of the Trustees.
B. Elements Involved in Managing the Fee Negotiation Process
In preparing the report required by the AOD, the IFC must consider at least the following six factors set forth in the AOD:
1. The nature and quality of the adviser's services, including the Fund's performance;
2. Management fees (including any components thereof) charged by other mutual fund companies for like services;
3. Possible economies of scale as the Fund grows larger;
4. Management fees (including any components thereof) charged to institutional and other clients of the adviser for like services;
5. Costs to the adviser and its affiliates of supplying services pursuant to the management fee agreements, excluding any intra-corporate profit; and
6. Profit margins of the adviser and its affiliates from supplying such services.
II. Findings
1. Based upon my examination of the information supplied by CMIA and Ameriprise in the light of the six factors set forth in the AOD, I conclude that the Trustees have the relevant information necessary to evaluate the reasonableness of the proposed contractual advisory and/or administrative fee changes at any asset level for each affected Atlantic Fund (each a "Fee Change Fund").
2. In my view, the process by which the proposed management fees of each Fee Change Fund have been negotiated with CMIA thus far has been, to the extent practicable, at arm's length and reasonable and consistent with the AOD.
3. There are 25 Funds for which CMIA has proposed an increase either in the contractual advisory or management fee (each a "Fee Increase Fund"). Seven of these Funds have a combination of higher contractual advisory fees and either lower or unchanged contractual management fees. The remaining 18 Funds have higher contractual management fees with the majority resulting from higher contractual advisory fees. For five Funds, however, the higher management fees result from a combination of lower advisory fees and higher administrative fees.
4. The actual management fee, computed on the basis of assets as of October 31, 2009, would increase for 16 of the Fee Increase Funds after accounting for CMIA's proposed expense limitation program, non-management fee changes, and proposed mergers. Seven Funds would have lower actual management fees, and two would experience no change in actual management fees.
5. Sixteen of the 25 Fee Increase Funds have generally median or better-than-median performance. Only one Fee Increase Fund – High Yield Opportunity Fund – would be identified for further review based on performance criteria used by the Trustees in past contract review processes.
6. CMIA proposed that the Funds and most other mutual funds it or its affiliates advise or sponsor (together, the "CMIA Funds") be subject to a contractual expense limitation calculated as the median of the relevant fund's Lipper expense group. As a result, all Fee Increase Funds are projected to have total expenses in the first, second, or third quintiles after full implementation of the proposed fee changes, expense limitations, and mergers. The expense limitation would be recalculated every year based on updated Lipper data. An analysis of the changes in median expenses for 2009 and 2010 indicates that some Funds are likely to experience sizable changes in their expense limits. Some Funds would have higher-than-median actual management fees notwithstanding the newly-established expense limitations.
58
7. CMIA reviewed differences between management of retail mutual funds and advising institutional accounts and supplied charts plotting contractual and actual institutional and fund fees against assets in various investment categories. The data showed that mutual fund fees are often lower at small asset levels reflecting CMIA's reimbursement of fund expenses. At higher asset levels, mutual fund fees typically exceed institutional fees.
8. CMIA provided fund-by-fund projected profitability data. Due to the significant changes in the operations of the Funds (including the change of the Funds' investment adviser), historical profitability data was judged to have little relevance.
9. CMIA provided projections of both the cumulative benefit to CMIA Fund shareholders of all aspects of its proposals (including proposed mergers) and the synergies in the form of decreased expenses that would benefit CMIA and its parent, Ameriprise.
59
This page intentionally left blank.
Important Information About This Report
The fund mails one shareholder report to each shareholder address. If you would like more than one report, please call shareholder services at 1-800-345-6611 and additional reports will be sent to you. This report has been prepared for shareholders of Columbia Tax-Exempt Fund.
A description of the policies and procedures that the fund uses to determine how to vote proxies and a copy of the fund's voting records are available (i) at www.columbiamanagement.com, (ii) on the Securities and Exchange Commission's website at www.sec.gov, and (iii) without charge, upon request, by calling 1-800-368-0346. Information regarding how the fund voted proxies relating to portfolio securities during the 12-month period ended June 30 is available from the SEC's website. Information regarding how the fund voted proxies relating to portfolio securities is also available from the fund's website, www.columbiamanagement.com.
The fund files a complete schedule of portfolio holdings with the SEC for the first and third quarters of each fiscal year on Form N-Q. The fund's Form N-Q is available on the SEC's website at www.sec.gov and may be reviewed and copied at the SEC's Public Reference Room in Washington, D.C. Information on the operation of the Public Reference Room may be obtained by calling 1-800-SEC-0330.
Transfer Agent
Columbia Management Investment
Services Corp.
P.O. Box 8081
Boston, MA 02266-8081
1-800-345-6611
Distributor
Columbia Management Investment
Distributors, Inc.
One Financial Center
Boston, MA 02111
Investment Adviser
Columbia Management Investment Advisers, LLC
100 Federal Street
Boston, MA 02110
61

PRSRT STD
U.S. Postage
PAID
Holliston, MA
Permit NO. 20
Columbia Tax-Exempt Fund
P. O. Box 8081
Boston, MA 02266-8081
columbiamanagement.com
This information is for use with concurrent or prior delivery of a fund prospectus. Investors should consider the investment objectives, risks, charges and expenses of a mutual fund carefully before investing. For a free prospectus, which contains this and other important information about the funds, visit columbiamanagement.com. Read the prospectus carefully before investing. The Fund is distributed by Columbia Management Investment Distributors, Inc., member FINRA, and managed by Columbia Management Investment Advisers, LLC.
© 2011 Columbia Management Investment Advisers, LLC. All rights reserved.
C-1051 A (01/11)
Item 2. Code of Ethics.
(a) The registrant has adopted a code of ethics that applies to the registrant’s principal executive officer, principal financial officer, principal accounting officer or controller, or persons performing similar functions, regardless of whether these individuals are employed by the registrant or a third party.
(b) During the period covered by this report, there were not any amendments to a provision of the code of ethics adopted in 2(a) above.
(c) During the period covered by this report, there were no waivers, including any implicit waivers, from a provision of the code of ethics described in 2(a) above that relates to one or more of the items set forth in paragraph (b) of this item’s instructions.
Item 3. Audit Committee Financial Expert.
The registrant’s Board of Trustees has determined that John D. Collins, Douglas A. Hacker, Charles R. Nelson and Anne-Lee Verville, each of whom are members of the registrant’s Board of Trustees and Audit Committee, each qualify as an audit committee financial expert. Mr. Collins, Mr. Hacker, Mr. Nelson and Ms. Verville are each independent trustees, as defined in paragraph (a)(2) of this item’s instructions.
Item 4. Principal Accountant Fees and Services.
Fee information below is disclosed for the one series of the registrant whose report to stockholders is included in this annual filing.
(a) Audit Fees. Aggregate Audit Fees billed by the principal accountant for professional services rendered during the fiscal years ended November 30, 2010 and November 30, 2009 are approximately as follows:
2010 | | 2009 | |
$ | 58,200 | | $ | 58,200 | |
| | | | | |
Audit Fees include amounts related to the audit of the registrant’s annual financial statements or services that are normally provided by the accountant in connection with statutory and regulatory filings or engagements for those fiscal years.
(b) Audit-Related Fees. Aggregate Audit-Related Fees billed to the registrant by the principal accountant for professional services rendered during the fiscal years ended November 30, 2010 and November 30, 2009 are approximately as follows:
Audit-Related Fees include amounts for assurance and related services by the principal accountant that are reasonably related to the performance of the audit of the registrant’s financial statements and are not reported in Audit Fees above. In both fiscal years 2010 and 2009, Audit-Related Fees consist of agreed-upon procedures performed for semi-annual shareholder reports.
During the fiscal years ended November 30, 2010 and November 30, 2009, there were no Audit-Related Fees billed by the registrant’s principal accountant to the registrant’s investment adviser (not including any sub-adviser whose role is primarily portfolio management and is subcontracted with or overseen by another investment adviser) and any entity controlling, controlled by, or under common control with the adviser that provides ongoing services to the registrant for an engagement that related directly to the operations and financial reporting of the registrant.
(c) Tax Fees. Aggregate Tax Fees billed by the principal accountant to the registrant for professional services rendered during the fiscal years ended November 30, 2010 and November 30, 2009 are approximately as follows:
Tax Fees include amounts for the review of annual tax returns, the review of required shareholder distribution calculations and typically include amounts for professional services by the principal accountant for tax compliance, tax advice and tax planning.
During the fiscal years ended November 30, 2010 and November 30, 2009, there were no Tax Fees billed by the registrant’s principal accountant to the registrant’s investment adviser (not including any sub-adviser whose role is primarily portfolio management and is subcontracted with or overseen by another investment adviser) and any entity controlling, controlled by, or under common control with the adviser that provides ongoing services to the registrant for an engagement that related directly to the operations and financial reporting of the registrant.
(d) All Other Fees. Aggregate All Other Fees billed by the principal accountant to the registrant for professional services rendered during the fiscal years ended November 30, 2010 and November 30, 2009 are approximately as follows:
All Other Fees include amounts for products and services provided by the principal accountant, other than the services reported in paragraphs (a) through (c) above.
Aggregate All Other Fees billed by the registrant’s principal accountant to the registrant’s investment adviser (not including any sub-adviser whose role is primarily portfolio management and is subcontracted with or overseen by another investment adviser) and any entity controlling, controlled by, or under common control with the adviser that provides ongoing services to the registrant for an engagement that related directly to the operations and financial reporting of the registrant during the fiscal years ended November 30, 2010 and November 30, 2009 are approximately as follows:
2010 | | 2009 | |
$ | 1,048,800 | | $ | 893,200 | |
| | | | | |
In both fiscal years 2010 and 2009, All Other Fees consist of fees billed for internal control examinations of the registrant’s transfer agent and investment advisor. Fiscal year 2009 also includes fees for agreed upon procedures related to the sale of the long-term asset management business. Fiscal year 2010 also includes fees related to the review of revenue modeling schedules.
(e)(1) Audit Committee Pre-Approval Policies and Procedures
The registrant’s Audit Committee is required to pre-approve the engagement of the registrant’s independent accountants to provide audit and non-audit services to the registrant and non-audit services to its investment adviser (not including any sub-adviser whose role is primarily portfolio management and is subcontracted with or overseen by another investment adviser) or any entity controlling, controlled by or under common control with such investment adviser that provides ongoing services to the registrant (“Adviser Affiliates”), if the engagement relates directly to the operations and financial reporting of the registrant.
The Audit Committee has adopted a Policy for Engagement of Independent Accountants for Audit and Non-Audit Services (“Policy”). The Policy sets forth the understanding of the Audit Committee regarding the engagement of the registrant’s independent accountants to provide (i) audit and permissible audit-related, tax and other services to the registrant (collectively “Fund Services”); (ii) non-audit services to the registrant’s investment adviser (not including any sub-adviser whose role is primarily portfolio management and is subcontracted with or overseen by another investment adviser) and Adviser Affiliates, if the engagement relates directly to the operations or financial reporting of a Fund (collectively “Fund-related Adviser Services”); and (iii) certain other audit and non-audit services to the registrant’s investment adviser (n ot including any sub-adviser whose role is primarily portfolio management and is subcontracted with or overseen by another investment adviser) and Adviser Affiliates. Unless a type of service receives general pre-approval under the Policy, it requires specific pre-approval by the Audit Committee if it is to be provided by the independent
accountants. Pre-approval of non-audit services to the registrant, the registrant’s investment adviser (not including any sub-adviser whose role is primarily portfolio management and is subcontracted with or overseen by another investment adviser) and Adviser Affiliates may be waived provided that the “de minimis” requirements set forth under paragraph (c)(7)(i)(C) of Rule 2-01 of Regulation S-X are met.
Under the Policy, the Audit Committee may delegate pre-approval authority to any pre-designated member or members who are Independent Trustees/Directors. The member(s) to whom such authority is delegated must report, for informational purposes only, any pre-approval decisions to the Audit Committee at its next regular meeting. The Audit Committee’s responsibilities with respect to the pre-approval of services performed by the independent accountants may not be delegated to management.
The Policy requires the Fund Treasurer and/or Director of Board Administration to submit to the Audit Committee, on an annual basis, a schedule of the types of services that are subject to general pre-approval. The schedule(s) provide a description of each type of service that is subject to general pre-approval and, where possible, will provide estimated fee caps for each instance of providing each service. The Audit Committees will review and approve the types of services and review the projected fees for the next fiscal year and may add to, or subtract from, the list of general pre-approved services from time to time based on subsequent determinations. That approval acknowledges that the Audit Committee is in agreement with the specific types of services that the independent accountants will be permitted to perform.
The Fund Treasurer and/or Director of Board Administration shall report to the Audit Committee at each of its regular meetings regarding all Fund Services or Fund-related Adviser Services initiated since the last such report was rendered, including a general description of the services, actual billed and projected fees, and the means by which such Fund Services or Fund-related Adviser Services were pre-approved by the Audit Committee.
*****
(e)(2) The percentage of services described in paragraphs (b) through (d) of this Item approved pursuant to the “de minimis” exception under paragraph (c)(7)(i)(C) of Rule 2-01 of Regulation S-X during both fiscal years ended November 30, 2010 and November 30, 2009 was zero.
(f) Not applicable.
(g) The aggregate non-audit fees billed by the registrant’s accountant for services rendered to the registrant, and rendered to the registrant’s investment adviser (not including any sub-adviser whose role is primarily portfolio management and is subcontracted with or overseen by another investment adviser), and any entity controlling, controlled by, or under common control with the adviser that provides
ongoing services to the registrant for the fiscal years ended November 30, 2010 and November 30, 2009 are approximately as follows:
2010 | | 2009 | |
$ | 1,061,200 | | $ | 905,500 | |
| | | | | |
(h) The registrant’s Audit Committee of the Board of Directors has considered whether the provision of non-audit services that were rendered to the registrant’s adviser (not including any sub-adviser whose role is primarily portfolio management and is subcontracted with or overseen by another investment adviser), and any entity controlling, controlled by, or under common control with the investment adviser that provides ongoing services to the registrant that were not pre-approved pursuant to paragraph (c)(7)(ii) of Rule 2-01 of Regulation S-X, is compatible with maintaining the principal accountant’s independence.
Item 5. Audit Committee of Listed Registrants.
Not applicable.
Item 6. Investments
(a) The registrant’s “Schedule I — Investments in securities of unaffiliated issuers” (as set forth in 17 CFR 210.12-12) is included in Item 1 of this Form N-CSR.
(b) Not applicable.
Item 7. Disclosure of Proxy Voting Policies and Procedures for Closed-End Management Investment Companies.
Not applicable.
Item 8. Portfolio Managers of Closed-End Management Investment Companies.
Not applicable.
Item 9. Purchases of Equity Securities by Closed-End Management Investment Company and Affiliated Purchasers.
Not applicable.
Item 10. Submission of Matters to a Vote of Security Holders.
There were no material changes to the procedures by which shareholders may recommend nominees to the registrant’s board of directors.
Item 11. Controls and Procedures.
(a) The registrant’s principal executive officer and principal financial officers, based on their evaluation of the registrant’s disclosure controls and procedures as of a date within 90 days of the filing of this report, have concluded that such controls and procedures are adequately designed to ensure that material information required to be disclosed by the registrant in Form N-CSR is accumulated and communicated to the registrant’s management, including the principal executive officer and principal financial officer, or persons performing similar functions, as appropriate to allow timely decisions regarding required disclosure.
(b) There was no change in the registrant’s internal control over financial reporting that occurred during the registrant’s second fiscal quarter of the period covered by this report that has materially affected, or is reasonably likely to materially affect, the registrant’s internal control over financial reporting.
Item 12. Exhibits.
(a)(1) Code of ethics required to be disclosed under Item 2 of Form N-CSR attached hereto as Exhibit 99.CODE ETH.
(a)(2) Certifications pursuant to Rule 30a-2(a) under the Investment Company Act of 1940 (17 CFR 270.30a-2(a)) attached hereto as Exhibit 99.CERT.
(a)(3) Not applicable.
(b) Certification pursuant to Rule 30a-2(b) under the Investment Company Act of 1940 (17 CFR 270.30a-2(b)) attached hereto as Exhibit 99.906CERT.
SIGNATURES
Pursuant to the requirements of the Securities Exchange Act of 1934 and the Investment Company Act of 1940, the registrant has duly caused this report to be signed on its behalf by the undersigned, thereunto duly authorized.
(registrant) | | Columbia Funds Series Trust I | |
| | | |
| | | |
By (Signature and Title) | | /s/J. Kevin Connaughton | |
| | J. Kevin Connaughton, President | |
| | | |
| | | |
Date | | January 21, 2011 | |
|
|
Pursuant to the requirements of the Securities Exchange Act of 1934 and the Investment Company Act of 1940, this report has been signed below by the following persons on behalf of the registrant and in the capacities and on the dates indicated. |
|
|
By (Signature and Title) | | /s/J. Kevin Connaughton | |
| | J. Kevin Connaughton, President | |
| | | |
| | | |
Date | | January 21, 2011 | |
| | | |
| | | |
By (Signature and Title) | | /s/Michael G. Clarke | |
| | Michael G. Clarke, Chief Financial Officer | |
| | | |
| | | |
Date | | January 21, 2011 | |
| | | | | | | |