UNITED STATES
SECURITIES AND EXCHANGE COMMISSION
Washington, D.C. 20549
FORM N-CSR
CERTIFIED SHAREHOLDER REPORT OF REGISTERED
MANAGEMENT INVESTMENT COMPANIES
Investment Company Act file number | 811-04367 |
|
Columbia Funds Series Trust I |
(Exact name of registrant as specified in charter) |
|
225 Franklin Street, Boston, Massachusetts | | 02110 |
(Address of principal executive offices) | | (Zip code) |
|
Scott R. Plummer 5228 Ameriprise Financial Center Minneapolis, MN 55474 |
(Name and address of agent for service) |
|
Registrant’s telephone number, including area code: | 1-612-671-1947 | |
|
Date of fiscal year end: | May 31 | |
|
Date of reporting period: | May 31, 2011 | |
| | | | | | | | |
Form N-CSR is to be used by management investment companies to file reports with the Commission not later than 10 days after the transmission to stockholders of any report that is required to be transmitted to stockholders under Rule 30e-1 under the Investment Company Act of 1940 (17 CFR 270.30e-1). The Commission may use the information provided on Form N-CSR in its regulatory, disclosure review, inspection, and policymaking roles.
A registrant is required to disclose the information specified by Form N-CSR, and the Commission will make this information public. A registrant is not required to respond to the collection of information contained in Form N-CSR unless the Form displays a currently valid Office of Management and Budget ("OMB") control number. Please direct comments concerning the accuracy of the information collection burden estimate and any suggestions for reducing the burden to Secretary, Securities and Exchange Commission, 450 Fifth Street, NW, Washington, DC 20549-0609. The OMB has reviewed this collection of information under the clearance requirements of 44 U.S.C. § 3507.
Item 1. Reports to Stockholders.

Columbia Strategic Income Fund
Annual Report for the Period Ended May 31, 2011
Not FDIC insured • No bank guarantee • May lose value
Table of Contents
| Fund Profile | | | 1 | | |
|
| Performance Information | | | 2 | | |
|
| Understanding Your Expenses | | | 3 | | |
|
| Portfolio Managers' Report | | | 4 | | |
|
| Portfolio of Investments | | | 6 | | |
|
Statement of Assets and
Liabilities | | | 30 | | |
|
| Statement of Operations | | | 32 | | |
|
Statement of Changes in
Net Assets | | | 33 | | |
|
| Financial Highlights | | | 35 | | |
|
| Notes to Financial Statements | | | 43 | | |
|
Report of Independent Registered
Public Accounting Firm | | | 55 | | |
|
| Fund Governance | | | 56 | | |
|
| Shareholder Meeting Results | | | 61 | | |
|
Important Information About
This Report | | | 65 | | |
|
The views expressed in this report reflect the current views of the respective parties. These views are not guarantees of future performance and involve certain risks, uncertainties and assumptions that are difficult to predict, so actual outcomes and results may differ significantly from the views expressed. These views are subject to change at any time based upon economic, market or other conditions and the respective parties disclaim any responsibility to update such views. These views may not be relied on as investment advice and, because investment decisions for a Columbia Fund are based on numerous factors, may not be relied on as an indication of trading intent on behalf of any particular Columbia Fund. References to specific securities should not be construed as a recommendation or investment advice.
President's Message

Dear Shareholder:
The Columbia Management story began over 100 years ago, and today, we are one of the nation's largest dedicated asset managers. The recent acquisition by Ameriprise Financial, Inc. brings together the talents, resources and capabilities of Columbia Management with those of RiverSource Investments, Threadneedle (acquired by Ameriprise in 2003) and Seligman Investments (acquired by Ameriprise in 2008) to build a best-in-class asset management business that we believe is truly greater than its parts.
RiverSource Investments traces its roots to 1894 when its then newly-founded predecessor, Investors Syndicate, offered a face-amount savings certificate that gave small investors the opportunity to build a safe and secure fund for retirement, education or other special needs. A mutual fund pioneer, Investors Syndicate launched Investors Mutual Fund in 1940. In the decades that followed, its mutual fund products and services lineup grew to include a full spectrum of styles and specialties. More than 110 years later, RiverSource continues to be a trusted financial products leader.
Threadneedle, a leader in global asset management and one of Europe's largest asset managers, offers sophisticated international experience from a dedicated U.K. management team. Headquartered in London, it is named for Threadneedle Street in the heart of the city's financial district, where British investors pioneered international and global investing. Threadneedle was acquired in 2003 and today operates as an affiliate of Columbia Management.
Seligman Investments' beginnings date back to the establishment of the investment firm J. & W. Seligman & Co. in 1864. In the years that followed, Seligman played a major role in the geographical expansion and industrial development of the United States. In 1874, President Ulysses S. Grant named Seligman as fiscal agent for the U.S. Navy—an appointment that would last through World War I. Seligman helped finance the westward path of the railroads and the building of the Panama Canal. The firm organized its first investment company in 1929 and began managing its first mutual fund in 1930. In 2008, J. & W. Seligman & Co. Incorporated was acquired and Seligman Investments became an offering brand of RiverSource Investments, LLC.
We are proud of the rich and distinctive history of these firms, the strength and breadth of products and services they offer, and the combined cultures of pioneering spirit and forward thinking. Together we are committed to providing more for our shareholders than ever before.
> A singular focus on our shareholders
Our business is asset management, so investors are our first priority. We dedicate our resources to identifying timely investment opportunities and provide a comprehensive choice of equity, fixed-income and alternative investments to help meet your individual needs.
> First-class research and thought leadership
We are dedicated to helping you take advantage of today's opportunities and anticipate tomorrow's. We stay abreast of the latest investment trends and ideas, using our collective insight to evaluate events and transform them into solutions you can use.
> A disciplined investment approach
We aren't distracted by passing fads. Our teams adhere to a rigorous investment process that helps ensure the integrity of our products and enables you and your financial advisor to match our solutions to your objectives with confidence.
When you choose Columbia Management, you can be confident that we will take the time to understand your needs and help you and your financial advisor identify the solutions that are right for you. Because at Columbia Management, we don't consider ourselves successful unless you are.
Sincerely,

J. Kevin Connaughton
President, Columbia Funds
Investors should consider the investment objectives, risks, charges and expenses of a mutual fund carefully before investing. For a free prospectus, which contains this and other important information about the funds, visit www.columbiamanagement.com. The prospectus should be read carefully before investing.
Columbia Funds are distributed by Columbia Management Investment Distributors, Inc., member FINRA, and managed by Columbia Management Investment Advisers, LLC.
© 2011 Columbia Management Investment Advisers, LLC. All rights reserved.
Fund Profile – Columbia Strategic Income Fund
Summary
g For the 12-month period that ended May 31, 2011, the fund's Class A shares returned 13.21% without sales charge.
g The fund outperformed the Barclays Capital Government/Credit Bond Index1 and a blended benchmark that consists of 35% Barclays Capital Aggregate Bond Index, 35% JP Morgan Global High Yield Index, 15% Citigroup Non-U.S. World Government Bond Index—Unhedged and 15% JP Morgan EMBI Global Diversified Index;2 and its peer group, the Lipper Multi-Sector Income Funds Classification.3
g Sector allocations were the biggest contributors to outperformance, especially overweights in high-yield bonds and bank loans and underweights in U.S. Treasury securities and agency mortgage-backed securities.
Portfolio Management
Colin J. Lundgren, CFA, lead manager, has co-managed the fund since 2010 and has been associated with the fund's adviser or its predecessors since 1986.
Brian Lavin, CFA has co-managed the fund since 2010 and has been associated with the fund's adviser or its predecessors since 1994.
Gene R. Tannuzzo, CFA has co-managed the fund since 2010 and has been associated with the fund's adviser or its predecessors since 2003.
1The Barclays Capital Government/Credit Bond Index is an index that tracks the performance of U.S. government and corporate bonds rated investment grade or better, with maturities of at least one year.
2The Barclays Capital Aggregate Bond Index is a market value-weighted index that tracks the daily price, coupon, pay-downs and total return performance of fixed-rate, publicly placed, dollar-denominated and non-convertible investment grade debt issues with at least $250 million par amount outstanding and with at least one year to final maturity. The JPMorgan Global High Yield Index is designed to mirror the investable universe of the U.S. dollar global high yield corporate debt market, including domestic and international issues. The Citigroup Non-U.S. World Government Bond Index—Unhedged is calculated on a market-weighted basis and includes all fixed-rate bonds with a remaining maturity of one year or longer and with amounts outstanding of at least the equivalent of U.S. $25 million. The index excludes floating or variable rate bonds, securities aimed principally at non-institutional investors and private placement-type securities. The JPMorgan Emerging Markets Bond Index Global ("EMBI Global") tracks total returns for traded external debt instruments in the emerging markets and is an expanded version of the JPMorgan Emerging Markets Bond Index Plus ("EMBI+"). As with EMBI+, the EMBI Global includes U.S. dollar-denominated Brady bonds, loans and Eurobonds with an outstanding face value of at least $500 million. It covers more of the eligible instruments than the EMBI+ by relaxing somewhat the strict EMBI+ limits on secondary market trading liquidity.
3Lipper Inc., a widely respected data provider in the industry, calculates an average total return (assuming reinvestment of distributions) for mutual funds with investment objectives similar to those of the fund. Lipper makes no adjustments for the effect of sales loads.
Indices are not available for investment, are not professionally managed and do not reflect sales charges, fees, brokerage commissions, taxes or other expenses of investing. Securities in the fund may not match those in an index.
Performance data quoted represents past performance and current performance may be lower or higher. Past performance is no guarantee of future results. The investment return and principal value will fluctuate so that shares, when redeemed, may be worth more or less than the original cost. Please visit www.columbiamanagement.com for daily and most recent month-end performance updates.
Summary
1-year return as of 05/31/11
| | | | +13.21% | |
|
|  | | | Class A shares
(without sales charge) | |
|
| | | | +6.04% | |
|
|  | | | Barclays Capital Government/
Credit Bond Index | |
|
| | | | +12.50% | |
|
|  | | | Blended Benchmark | |
|
1
Performance Information – Columbia Strategic Income Fund
Performance data quoted represents past performance and current performance may be lower or higher. Past performance is no guarantee of future results. The investment return and principal value will fluctuate so that shares, when redeemed, may be worth more or less than the original cost. Please visit www.columbiamanagement.com for daily and most recent month-end performance updates.
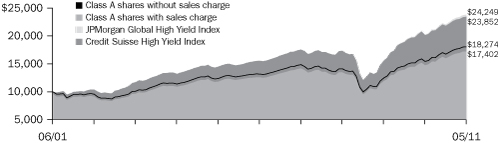
Performance of a $10,000 investment 06/01/01 – 05/31/11
The chart above shows the change in value of a hypothetical $10,000 investment in Class A shares of Columbia Strategic Income Fund during the stated time period, and does not reflect the deduction of taxes that a shareholder may pay on fund distributions or on the redemption of fund shares.
Performance of a $10,000 investment 06/01/01 – 05/31/11 ($)
| Sales charge | | without | | with | |
| Class A | | | 21,054 | | | | 20,059 | | |
| Class B | | | 19,542 | | | | 19,542 | | |
| Class C | | | 19,857 | | | | 19,857 | | |
| Class R | | | n/a | | | | n/a | | |
| Class R4 | | | n/a | | | | n/a | | |
| Class R5 | | | n/a | | | | n/a | | |
| Class W | | | n/a | | | | n/a | | |
| Class Z | | | 21,484 | | | | n/a | | |
Average annual total return as of 05/31/11 (%)
| Share class | | A | | B | | C | | R | | R4 | | R5 | | W | | Z | |
| Inception | | 04/21/77 | | 05/15/92 | | 07/01/97 | | 09/27/10 | | 03/07/11 | | 03/07/11 | | 09/27/10 | | 01/29/99 | |
| Sales charge | | without | | with | | without | | with | | without | | with | | without | | without | | without | | without | | without | |
| 1-year | | | 13.21 | | | | 7.85 | | | | 12.37 | | | | 7.37 | | | | 12.72 | | | | 11.72 | | | | n/a | | | | n/a | | | | n/a | | | | n/a | | | | 13.46 | | |
| 5-year | | | 7.37 | | | | 6.34 | | | | 6.57 | | | | 6.26 | | | | 6.72 | | | | 6.72 | | | | n/a | | | | n/a | | | | n/a | | | | n/a | | | | 7.64 | | |
| 10-year/Life | | | 7.73 | | | | 7.21 | | | | 6.93 | | | | 6.93 | | | | 7.10 | | | | 7.10 | | | | 5.86 | | | | 2.62 | | | | 2.68 | | | | 5.53 | | | | 7.95 | | |
The "with sales charge" returns include the maximum initial sales charge of 4.75% for Class A shares and the applicable contingent deferred sales charge of 5.00% in the first year, declining to 1.00% in the sixth year and eliminated thereafter for Class B shares and 1.00% for Class C shares for the first year only. The "without sales charge" returns do not include the effect of sales charges. If they had, returns would be lower.
Performance results reflect any fee waivers or reimbursements of fund expenses by the investment advisor and/or any of its affiliates. Absent these fee waivers or expense reimbursement arrangements, performance results would have been lower.
All results shown assume reinvestment of distributions. Class Z, Class R4 and Class R5 shares are sold at net asset value with no distribution and service (Rule 12b-1) fees. Class R shares are sold at net asset value with a distribution fee and Class W shares are sold at net asset value with a service fee. Class R, Class R4, Class R5, Class W and Class Z shares have limited eligibility and the investment minimum requirements may vary. Please see the fund's prospectus for details. Performance for different share classes will vary based on differences in sales charges and fees associated with each class.
Class R and Class W shares commenced operations on September 27, 2010. And, Class R4 and R5 shares commenced operations on March 7, 2011, the date of their inception.
The tables do not reflect the deduction of taxes that a shareholder may pay on fund distributions or on the redemption of fund shares.
2
Understanding Your Expenses – Columbia Strategic Income Fund
As a fund shareholder, you incur two types of costs. There are transaction costs, which generally include sales charges on purchases and may include redemption fees or exchange fees. There are also ongoing costs, which generally include investment advisory fees, distribution and service (Rule 12b-1) fees and other fund expenses. The information on this page is intended to help you understand the ongoing costs of investing in the fund and to compare these costs with the ongoing costs of investing in other mutual funds.
Analyzing your fund's expenses by share class
To illustrate these ongoing costs, we have provided an example and calculated the expenses paid by investors in each share class during the period. The information in the following table is based on an initial investment of $1,000, which is invested at the beginning of the period and held for the entire period. Expense information is calculated two ways and each method provides you with different information. The amount listed in the "Actual" column is calculated using the fund's actual operating expenses and total return for the period. The amount listed in the "Hypothetical" column for each share class assumes that the return each year is 5% before expenses and is calculated based on the fund's actual operating expenses. You should not use the hypothetical account values and expenses to estimate either your actual account balance at the end of the period or the expenses you paid during this period.
Compare with other funds
Since all mutual funds are required to include the same hypothetical calculations about expenses in shareholder reports, you can use this information to compare the ongoing cost of investing in the fund with other funds. To do so, compare the 5% hypothetical example with the 5% hypothetical examples that appear in the shareholder reports of other funds. As you compare hypothetical examples of other funds, it is important to note that hypothetical examples are meant to highlight the ongoing costs of investing in a fund and do not reflect any transaction costs, such as sales charges, redemption fees or exchange fees.
As a shareholder of the underlying funds in which it invests, the fund will bear its allocable share of the costs and expenses of these underlying funds. These costs and expenses are not included in the fund's annualized expense ratios used to calculate the expense information below.
Estimating your actual expenses
To estimate the expenses that you paid over the period, first you will need your account balance at the end of the period:
g For shareholders who receive their account statements from Columbia Management Investment Services Corp., your account balance is available online at www.columbiamanagement.com or by calling Shareholder Services at 800.345.6611.
g For shareholders who receive their account statements from their financial intermediary, contact your financial intermediary to obtain your account balance.
1. Divide your ending account balance by $1,000. For example, if an account balance was $8,600 at the end of the period, the result would be 8.6.
2. In the section of the table below titled "Expenses paid during the period," locate the amount for your share class. You will find this number in the column labeled "Actual." Multiply this number by the result from step 1. Your answer is an estimate of the expenses you paid on your account during the period.
If the value of your account falls below the minimum initial investment requirement applicable to you, your account may be subject to a $20 annual fee. This fee is not included in the accompanying table. If you are subject to the fee, keep it in mind when you are estimating the ongoing expenses of investing in the fund and when comparing the expenses of this fund with other funds.
12/01/10 – 05/31/11
| | | Account value at the
beginning of the period ($) | | Account value at the
end of the period ($) | | Expenses paid
during the period ($) | | Fund's annualized
expense ratio (%) | |
| | | Actual | | Hypothetical | | Actual | | Hypothetical | | Actual | | Hypothetical | | Actual | |
| Class A | | | 1,000.00 | | | | 1,000.00 | | | | 1,060.70 | | | | 1,019.95 | | | | 5.14 | | | | 5.04 | | | | 1.00 | | |
| Class B | | | 1,000.00 | | | | 1,000.00 | | | | 1,056.80 | | | | 1,016.21 | | | | 8.97 | | | | 8.80 | | | | 1.75 | | |
| Class C | | | 1,000.00 | | | | 1,000.00 | | | | 1,059.20 | | | | 1,016.95 | | | | 8.21 | | | | 8.05 | | | | 1.60 | | |
| Class R | | | 1,000.00 | | | | 1,000.00 | | | | 1,062.60 | | | | 1,018.95 | | | | 6.17 | | | | 6.04 | | | | 1.20 | | |
| Class R4 | | | 1,000.00 | | | | 1,000.00 | | | | 1,026.20 | * | | | 1,020.49 | | | | 2.10 | * | | | 4.48 | | | | 0.89 | | |
| Class R5 | | | 1,000.00 | | | | 1,000.00 | | | | 1,026.80 | * | | | 1,021.79 | | | | 1.49 | * | | | 3.18 | | | | 0.63 | | |
| Class W | | | 1,000.00 | | | | 1,000.00 | | | | 1,060.60 | | | | 1,020.54 | | | | 4.52 | | | | 4.43 | | | | 0.88 | | |
| Class Z | | | 1,000.00 | | | | 1,000.00 | | | | 1,062.80 | | | | 1,021.19 | | | | 3.86 | | | | 3.78 | | | | 0.75 | | |
Expenses paid during the period are equal to the annualized expense ratio for the share class, multiplied by the average account value over the period, then multiplied by the number of days in the fund's most recent fiscal half-year and divided by 365.
Had the Investment Manager and/or any of its affiliates not waived fees or reimbursed a portion of expenses, account value at the end of the period would have been reduced.
It is important to note that the expense amounts shown in the table are meant to highlight only ongoing costs of investing in the fund and do not reflect any transaction costs, such as sales charges, redemption fees or exchange fees. Therefore, the hypothetical examples provided may not help you determine the relative total costs of owning shares of different funds. If these transaction costs were included, your costs would have been higher.
*For the period March 7, 2011 through May 31, 2011. Class R4 shares and Class R5 shares commenced operations on March 7, 2011.
3
Portfolio Managers' Report – Columbia Strategic Income Fund
Performance data quoted represents past performance and current performance may be lower or higher. Past performance is no guarantee of future results. The investment return and principal value will fluctuate so that shares, when redeemed, may be worth more or less than the original cost. Please visit www.columbiamanagement.com for daily and most recent month-end performance updates.
Net asset value per share
as of 05/31/11 ($)
| Class A | | | 6.16 | | |
| Class B | | | 6.16 | | |
| Class C | | | 6.17 | | |
| Class R | | | 6.19 | | |
| Class R4 | | | 6.09 | | |
| Class R5 | | | 6.09 | | |
| Class W | | | 6.16 | | |
| Class Z | | | 6.09 | | |
Distributions declared per share
06/01/10 – 05/31/11 ($)
| Class A | | | 0.43 | | |
| Class B | | | 0.38 | | |
| Class C | | | 0.39 | | |
| Class R | | | 0.32 | | |
| Class R4 | | | 0.08 | | |
| Class R5 | | | 0.08 | | |
| Class W | | | 0.33 | | |
| Class Z | | | 0.44 | | |
30-day SEC yields
as of 05/31/11 (%)
| Class A | | | 4.41 | | |
| Class B | | | 3.88 | | |
| Class C | | | 4.02 | | |
| Class R | | | 4.95 | | |
| Class R4 | | | 4.71 | | |
| Class R5 | | | 4.95 | | |
| Class W | | | 4.85 | | |
| Class Z | | | 4.88 | | |
The 30-day SEC yields reflect the fund's earning power net of expenses, expressed as an annualized percentage of the public offering price per share at the end of the period.
Had the Investment Manager and/or any of its affiliates not waived fees or reimbursed a portion of expenses, the 30-day SEC yields would have been lower.
For the 12-month period that ended May 31, 2011, the fund's Class A shares returned 13.21% without sales charge. This was higher than the 6.04% return of the Barclays Capital Government/Credit Bond Index and the 12.50% gain of the fund's blended benchmark, which consists of 35% Barclays Capital Aggregate Bond Index, 35% JPMorgan Global High Yield Index, 15% Citigroup Non-U.S. World Government Bond Index—Unhedged and 15% JPMorgan EMBI Global Diversified Index. The fund also outpaced the 11.24% advance of its peer group, the Lipper Multi-Sector Income Funds Classification. Sector allocations were the biggest contributors to outperformance, especially overweights in high-yield bonds and bank loans and underweights in U.S. Treasury securities and agency mortgage-backed securities.
During the past 12 months, the fund's turnover increased as the new portfolio management team aligned the fund's holdings to fit with our investment outlook. We would expect that under normal market conditions, the fund's turnover would generally be lower than that which occurred during this transition period.
A sluggish expansion
During the 12 months that ended May 31, 2011, global economic growth shifted, as a relatively fast-paced recovery began to lose some steam midway through the period. The impact of higher oil prices, continued concerns about highly indebted eurozone governments and unresolved turmoil in the Middle East and North Africa, as well as the loss of output and supply-chain disruptions from an earthquake, tsunami and nuclear disaster in Japan, have clearly put a dent in the outlook for global growth. A stalemate over the U.S. debt limit and uncertainties associated with the end of the Fed's latest round of large-scale Treasury purchases, known as QE2 (the QE for quantitative easing), also buffeted the markets. However, we believe that any softness should be limited as fundamental adjustments occurring in the global economy have the potential to support a stronger expansion of private spending ahead, raising hopes that the outlook will brighten in the second half of the year, especially in the United States.
Global monetary conditions remain highly accommodative. However, the trend is starting to turn. The European Central Bank (ECB) raised short-term interest rates in April 2011, and more hikes are expected. If the ECB raises short-term rates too quickly, it could complicate the debt crisis in the periphery of the eurozone. In the United States, we believe that the Fed's Federal Open Market Committee is poised to increase the federal funds rate to 0.75% in the year ahead.
Strong returns despite market volatility
Global bonds performed well despite a shifting economic environment and unforeseen challenges. As economic data slowed throughout the summer of 2010, investors moved toward sectors that historically have provided a safer haven, including U.S. government bonds. To revive economic growth, the Federal Reserve initiated a second round of large-scale asset purchases. Economic data began to improve in the manufacturing and services sectors with clear signs that hiring was starting to pick up. Investors became more willing to take on added risk for higher returns, benefiting high-yield bonds and emerging market debt. This momentum continued through the first quarter of 2011, before rising gasoline prices and supply chain disruptions triggered by the earthquake and tsunami in Japan led to weakening economic data. Although investors shifted back toward higher-quality sectors late in the period, higher-risk assets finished the year well ahead of U.S. and foreign government issues.
Biggest boost from high-yield sector
The Fund benefited from having an overweight (roughly 45% of assets at period end) versus the blended benchmark in high-yield bonds and bank loans, which were the strongest performers in
4
Portfolio Managers' Report (continued) – Columbia Strategic Income Fund
the fixed-income market over the past year. The Fund's high-yield portfolio also modestly outperformed the JPMorgan Global High Yield Index's 18.04% return. Within the sector, the strongest gains came from the lowest-quality issues—with CCC- and B-rated bonds returning 22.75% and 18.94%, respectively—and financials, which climbed over 20% within the JPMorgan index. Both segments benefited as an improving economy lowered the risk of defaults. Underweights in both CCC issues and financials modestly hindered relative results, but were more than offset by overweights in BB and B rated securities, as well as in the energy, telecommunications and cable/satellite industries.
More contributions from sector allocations and positioning
An overweight in emerging markets and an underweight in U.S. investment grade securities further aided performance. In the emerging market segment, strong country and currency selection led to gains that nicely outpaced the 12.52% return of the JPMorgan EMBI Global Diversified Index. Performance benefited from a focus on Latin America and Russia as well as currencies in Brazil, Mexico and Indonesia. Having less exposure than the blended index to the U.S. investment grade sector also was positive. In addition, investments in this segment outperformed the 5.84% return of the Barclays Capital Aggregate Bond Index, thanks to the Fund's bias toward investment-grade corporate bonds and commercial mortgage-backed securities—which are bonds issued for large-scale commercial projects, such as office parks and retail shopping malls. Decisions regarding duration, a measure of interest-rate sensitivity, and maturity allocations gave an added boost to performance. Finally, the Fund had below-average exposure—about 10% at period end—to government bonds in foreign developed markets, with notable underweights in Europe and Japan. Returns in this segment were modestly ahead of the 15.39% gain posted by the Citigroup Non-U.S. World Government Bond Index—Unhedged.
Rationale for future
We believe some of the weather-related factors that slowed economic growth this past spring will subside, leading to stronger growth later this year. Given our expectation of a rise in interest rates, we plan to keep the Fund's sensitivity to interest-rate changes shorter than that of the blended benchmark, which should help preserve principal. Going forward, we also may look for opportunities to reduce our stake in high-yield and investment grade corporate bonds, where valuations are no longer as compelling as they once were.
Portfolio characteristics and holdings are subject to change and may not be representative of current characteristics and holdings. The outlook for the fund may differ from that presented for other Columbia Funds.
Investing in fixed-income securities may involve certain risks, including the credit quality of individual issuers, possible prepayments, market or economic developments and yields and share price fluctuations due to changes in interest rates. When interest rates go up, bond prices typically drop, and vice versa.
Investments in high-yield bonds (sometimes referred to as "junk" bonds) offer the potential for high current income and attractive total return, but involve certain risks. Changes in economic conditions or other circumstances may adversely affect a high-yield bond issuer's ability to make principal and interest payments.
Investing in emerging markets may involve greater risks than investing in more developed countries. In addition, concentration of investments in a single region may result in greater volatility.
Maturity breakdown
as of 05/31/11 (%)
| 0-1 year | | | 2.7 | | |
| 1-3 years | | | 11.0 | | |
| 3-5 years | | | 18.6 | | |
| 5-7 years | | | 29.7 | | |
| 7-10 years | | | 22.8 | | |
| 10-15 years | | | 3.8 | | |
| 15-20 years | | | 1.4 | | |
| 20-30 years | | | 5.9 | | |
| 30 years and over | | | 0.5 | | |
| Other | | | 3.6 | | |
Portfolio structure
as of 05/31/11 (%)
| US High Yield | | | 44.5 | | |
| US Investment Grade | | | 26.9 | | |
| Foreign Emerging Markets | | | 18.6 | | |
| Foreign Developed | | | 10.0 | | |
Quality breakdown
as of 05/31/11 (%)
| AAA | | | 19.7 | | |
| AA | | | 2.2 | | |
| A | | | 5.5 | | |
| BBB | | | 17.3 | | |
| BB | | | 19.6 | | |
| B | | | 27.4 | | |
| CCC | | | 6.5 | | |
| CC | | | 0.3 | | |
| D | | | 0.0 | * | |
| Non-Rated | | | 1.5 | | |
* Rounds to less than 0.1%.
The fund is actively managed and the composition of its portfolio will change over time. Maturity breakdown, portfolio structure and quality breakdown are calculated as a percentage of total investments. Ratings shown in the quality breakdown are assigned to individual bonds by taking the lower of the ratings available from one of the following nationally recognized rating agencies: Standard & Poor's or Moody's Investor Services. If a security is rated by only one of the two agencies, that rating is used. If a security is not rated by either of the two agencies, it is designated as Non-Rated. Ratings are relative and subjective and are not absolute standards of quality. The credit quality of the fund's investments does not remove market risk.
5
Portfolio of Investments – Columbia Strategic Income Fund
May 31, 2011
(Percentages represent value of investments compared to net assets)
| Issuer | | Coupon
Rate | | Principal
Amount | | Value | |
| Corporate Bonds & Notes(a) 52.3% | |
| Aerospace & Defense 1.0% | |
ADS Tactical, Inc.
Senior Secured(b) | |
| 04/01/18 | | | 11.000 | % | | $ | 4,725,000 | | | $ | 5,032,125 | | |
| Huntington Ingalls Industries, Inc.(b) | |
| 03/15/18 | | | 6.875 | % | | | 1,708,000 | | | | 1,780,590 | | |
| 03/15/21 | | | 7.125 | % | | | 2,262,000 | | | | 2,360,962 | | |
Kratos Defense & Security Solutions, Inc.
Senior Secured | |
| 06/01/17 | | | 10.000 | % | | | 2,590,000 | | | | 2,849,000 | | |
Kratos Defense & Security Solutions, Inc.(b)
Senior Secured | |
| 06/01/17 | | | 10.000 | % | | | 3,344,000 | | | | 3,678,400 | | |
| Oshkosh Corp. | |
| 03/01/17 | | | 8.250 | % | | | 672,000 | | | | 732,480 | | |
| 03/01/20 | | | 8.500 | % | | | 383,000 | | | | 421,300 | | |
| TransDigm, Inc.(b) | |
| 12/15/18 | | | 7.750 | % | | | 1,545,000 | | | | 1,641,563 | | |
| Total | | | 18,496,420 | | |
| Automotive 1.2% | |
Accuride Corp.
Senior Secured | |
| 08/01/18 | | | 9.500 | % | | | 785,000 | | | | 861,538 | | |
| Allison Transmission, Inc.(b) | |
| 05/15/19 | | | 7.125 | % | | | 1,349,000 | | | | 1,345,628 | | |
Chrysler Group LLC/Co-Issuer, Inc.(b)
Senior Secured | |
| 06/15/19 | | | 8.000 | % | | | 1,382,000 | | | | 1,375,090 | | |
| 06/15/21 | | | 8.250 | % | | | 2,355,000 | | | | 2,349,112 | | |
Dana Holding Corp.
Senior Unsecured | |
| 02/15/19 | | | 6.500 | % | | | 600,000 | | | | 597,000 | | |
| 02/15/21 | | | 6.750 | % | | | 4,800,000 | | | | 4,800,000 | | |
Delphi Corp.(b)
Senior Notes | |
| 05/15/19 | | | 5.875 | % | | | 956,000 | | | | 952,415 | | |
| 05/15/21 | | | 6.125 | % | | | 637,000 | | | | 638,593 | | |
International Automotive Components Group SL
Senior Secured(b)(c)(d) | |
| 06/01/18 | | | 9.125 | % | | | 536,000 | | | | 548,060 | | |
| Lear Corp. | |
| 03/15/18 | | | 7.875 | % | | | 3,307,000 | | | | 3,629,432 | | |
| 03/15/20 | | | 8.125 | % | | | 762,000 | | | | 838,200 | | |
| Tenneco, Inc. | |
| 08/15/18 | | | 7.750 | % | | | 496,000 | | | | 524,520 | | |
Visteon Corp.
Senior Notes(b) | |
| 04/15/19 | | | 6.750 | % | | | 3,036,000 | | | | 2,944,920 | | |
| Total | | | 21,404,508 | | |
| Banking 1.5% | |
BES Investimento do Brasil SA
Senior Unsecured(b) | |
| 03/25/15 | | | 5.625 | % | | | 2,000,000 | | | | 1,973,388 | | |
BanColombia SA
Senior Notes(b)(c)(d) | |
| 06/03/21 | | | 5.950 | % | | | 2,000,000 | | | | 2,007,500 | | |
| Issuer | | Coupon
Rate | | Principal
Amount | | Value | |
| Corporate Bonds & Notes(a) (continued) | |
| Banking (cont.) | |
Bank of America Corp.
Senior Notes | |
| 05/13/21 | | | 5.000 | % | | $ | 11,210,000 | | | $ | 11,189,418 | | |
Citigroup, Inc.
Senior Unsecured | |
| 01/15/15 | | | 6.010 | % | | | 15,000 | | | | 16,629 | | |
| 08/09/20 | | | 5.375 | % | | | 785,000 | | | | 827,128 | | |
| JPMorgan Chase & Co. | |
| 05/10/21 | | | 4.625 | % | | | 2,400,000 | | | | 2,408,580 | | |
| Lloyds Banking Group PLC(b)(d)(e) | |
| 11/29/49 | | | 6.267 | % | | | 1,316,000 | | | | 1,075,830 | | |
Morgan Stanley
Senior Unsecured | |
| 01/25/21 | | | 5.750 | % | | | 6,895,000 | | | | 7,211,191 | | |
Santander U.S. Debt SA Unipersonal
Bank Guaranteed(b)(d) | |
| 10/07/15 | | | 3.781 | % | | | 1,800,000 | | | | 1,778,265 | | |
| Total | | | 28,487,929 | | |
| Brokerage 0.4% | |
E*Trade Financial Corp.
Senior Notes | |
| 06/01/16 | | | 6.750 | % | | | 2,460,000 | | | | 2,460,000 | | |
Senior Unsecured
12/01/15 | | | 7.875 | % | | | 2,180,000 | | | | 2,248,125 | | |
Senior Unsecured PIK
11/30/17 | | | 12.500 | % | | | 2,830,000 | | | | 3,403,075 | | |
| Total | | | 8,111,200 | | |
| Building Materials 0.7% | |
Building Materials Corp. of America
Senior Notes(b) | |
| 05/01/21 | | | 6.750 | % | | | 4,932,000 | | | | 4,968,990 | | |
Euramax International, Inc.
Senior Secured(b) | |
| 04/01/16 | | | 9.500 | % | | | 2,005,000 | | | | 2,055,125 | | |
| Gibraltar Industries, Inc. | |
| 12/01/15 | | | 8.000 | % | | | 1,525,000 | | | | 1,566,938 | | |
| Interface, Inc. | |
| 12/01/18 | | | 7.625 | % | | | 665,000 | | | | 711,550 | | |
Norcraft Companies LP/Finance Corp.
Secured | |
| 12/15/15 | | | 10.500 | % | | | 1,690,000 | | | | 1,774,500 | | |
| Nortek, Inc.(b) | |
| 04/15/21 | | | 8.500 | % | | | 1,815,000 | | | | 1,731,056 | | |
| Total | | | 12,808,159 | | |
| Chemicals 1.5% | |
| CF Industries, Inc. | |
| 05/01/18 | | | 6.875 | % | | | 5,125,000 | | | | 5,880,937 | | |
| 05/01/20 | | | 7.125 | % | | | 81,000 | | | | 94,973 | | |
| Celanese U.S. Holdings LLC | |
| 10/15/18 | | | 6.625 | % | | | 250,000 | | | | 263,438 | | |
Senior Notes
06/15/21 | | | 5.875 | % | | | 410,000 | | | | 419,225 | | |
| Chemtura Corp.(b) | |
| 09/01/18 | | | 7.875 | % | | | 922,000 | | | | 1,000,370 | | |
The Accompanying Notes to Financial Statements are an integral part of this statement.
6
Columbia Strategic Income Fund
May 31, 2011
(Percentages represent value of investments compared to net assets)
| Issuer | | Coupon
Rate | | Principal
Amount | | Value | |
| Corporate Bonds & Notes(a) (continued) | |
| Chemicals (cont.) | |
Dow Chemical Co. (The)
Senior Unsecured | |
| 11/15/20 | | | 4.250 | % | | $ | 1,690,000 | | | $ | 1,671,824 | | |
Hexion U.S. Finance Corp./Nova Scotia ULC
Senior Secured | |
| 02/01/18 | | | 8.875 | % | | | 1,303,000 | | | | 1,399,096 | | |
Lyondell Chemical Co.
Senior Secured(b) | |
| 11/01/17 | | | 8.000 | % | | | 5,041,000 | | | | 5,708,932 | | |
MacDermid, Inc.
Senior Subordinated Notes(b) | |
| 04/15/17 | | | 9.500 | % | | | 1,325,000 | | | | 1,397,875 | | |
| Nalco Co.(b) | |
| 01/15/19 | | | 6.625 | % | | | 3,935,000 | | | | 4,087,481 | | |
NOVA Chemicals Corp.(d)
Senior Unsecured | |
| 11/01/16 | | | 8.375 | % | | | 1,095,000 | | | | 1,223,663 | | |
| 11/01/19 | | | 8.625 | % | | | 1,870,000 | | | | 2,117,775 | | |
| Polypore International, Inc.(b) | |
| 11/15/17 | | | 7.500 | % | | | 2,310,000 | | | | 2,454,375 | | |
| Total | | | 27,719,964 | | |
| Construction Machinery 1.5% | |
Case New Holland, Inc.
Senior Notes(b) | |
| 12/01/17 | | | 7.875 | % | | | 4,786,000 | | | | 5,354,337 | | |
| Columbus McKinnon Corp.(b) | |
| 02/01/19 | | | 7.875 | % | | | 806,000 | | | | 834,210 | | |
| Manitowoc Co., Inc. (The) | |
| 02/15/18 | | | 9.500 | % | | | 2,200,000 | | | | 2,431,000 | | |
| 11/01/20 | | | 8.500 | % | | | 1,950,000 | | | | 2,120,625 | | |
Neff Rental LLC/Finance Corp.
Secured(b) | |
| 05/15/16 | | | 9.625 | % | | | 2,441,000 | | | | 2,437,949 | | |
| RSC Equipment Rental, Inc./Holdings III LLC | |
| 02/01/21 | | | 8.250 | % | | | 1,235,000 | | | | 1,275,138 | | |
| United Rentals North America, Inc. | |
| 12/15/19 | | | 9.250 | % | | | 6,935,000 | | | | 7,749,862 | | |
| 09/15/20 | | | 8.375 | % | | | 4,775,000 | | | | 4,966,000 | | |
| Xerium Technologies, Inc.(b) | |
| 06/15/18 | | | 8.875 | % | | | 1,615,000 | | | | 1,615,000 | | |
| Total | | | 28,784,121 | | |
| Consumer Cyclical Services 0.2% | |
Garda World Security Corp.
Senior Unsecured(b)(d) | |
| 03/15/17 | | | 9.750 | % | | | 1,540,000 | | | | 1,667,050 | | |
| West Corp.(b) | |
| 01/15/19 | | | 7.875 | % | | | 2,790,000 | | | | 2,866,725 | | |
| Total | | | 4,533,775 | | |
| Consumer Products 0.6% | |
| Central Garden and Pet Co. | |
| 03/01/18 | | | 8.250 | % | | | 3,015,000 | | | | 3,180,825 | | |
Libbey Glass, Inc.
Senior Secured | |
| 02/15/15 | | | 10.000 | % | | | 2,700,000 | | | | 2,943,000 | | |
| Issuer | | Coupon
Rate | | Principal
Amount | | Value | |
| Corporate Bonds & Notes(a) (continued) | |
| Consumer Products (cont.) | |
| NBTY, Inc.(b) | |
| 10/01/18 | | | 9.000 | % | | $ | 310,000 | | | $ | 332,475 | | |
Spectrum Brands Holdings, Inc.
Senior Secured(b) | |
| 06/15/18 | | | 9.500 | % | | | 4,559,000 | | | | 5,083,285 | | |
| Total | | | 11,539,585 | | |
| Diversified Manufacturing 0.5% | |
Amsted Industries, Inc.
Senior Notes(b) | |
| 03/15/18 | | | 8.125 | % | | | 1,500,000 | | | | 1,593,750 | | |
CPM Holdings, Inc.
Senior Secured(b) | |
| 09/01/14 | | | 10.875 | % | | | 2,419,000 | | | | 2,636,710 | | |
Pinafore LLC/Inc.
Secured(b) | |
| 10/01/18 | | | 9.000 | % | | | 520,000 | | | | 569,400 | | |
| SPX Corp.(b) | |
| 09/01/17 | | | 6.875 | % | | | 2,325,000 | | | | 2,487,750 | | |
WireCo WorldGroup
Senior Unsecured(b) | |
| 05/15/17 | | | 9.500 | % | | | 1,490,000 | | | | 1,583,125 | | |
| Total | | | 8,870,735 | | |
| Electric 4.3% | |
AES Corp. (The)
Senior Unsecured | |
| 03/01/14 | | | 7.750 | % | | | 3,625,000 | | | | 3,969,375 | | |
CMS Energy Corp.
Senior Unsecured | |
| 12/15/15 | | | 6.875 | % | | | 1,615,000 | | | | 1,828,038 | | |
Calpine Corp.
Senior Secured(b) | |
| 02/15/21 | | | 7.500 | % | | | 2,050,000 | | | | 2,132,000 | | |
| CenterPoint Energy Houston Electric LLC | |
| 03/01/14 | | | 7.000 | % | | | 675,000 | | | | 776,309 | | |
Consolidated Edison Co. of New York, Inc.
Senior Unsecured | |
| 04/01/38 | | | 6.750 | % | | | 895,000 | | | | 1,086,065 | | |
Dominion Resources, Inc.
Senior Unsecured | |
| 08/15/19 | | | 5.200 | % | | | 3,319,000 | | | | 3,655,842 | | |
Duke Energy Corp.
Senior Unsecured | |
| 09/15/14 | | | 3.950 | % | | | 3,390,000 | | | | 3,612,903 | | |
| 04/01/15 | | | 3.350 | % | | | 7,000,000 | | | | 7,283,885 | | |
Duke Energy Ohio, Inc.
1st Mortgage | |
| 04/01/19 | | | 5.450 | % | | | 3,030,000 | | | | 3,435,790 | | |
Edison Mission Energy
Senior Unsecured | |
| 05/15/17 | | | 7.000 | % | | | 3,720,000 | | | | 3,078,300 | | |
Energy Future Holdings Corp.
Senior Secured(e) | |
| 01/15/20 | | | 10.000 | % | | | 3,200,000 | | | | 3,464,505 | | |
Energy Future Intermediate Holding Co. LLC/Finance, Inc.
Senior Secured | |
| 12/01/20 | | | 10.000 | % | | | 338,000 | | | | 367,628 | | |
The Accompanying Notes to Financial Statements are an integral part of this statement.
7
Columbia Strategic Income Fund
May 31, 2011
(Percentages represent value of investments compared to net assets)
| Issuer | | Coupon
Rate | | Principal
Amount | | Value | |
| Corporate Bonds & Notes(a) (continued) | |
| Electric (cont.) | |
Florida Power Corp.
1st Mortgage | |
| 06/15/38 | | | 6.400 | % | | $ | 1,270,000 | | | $ | 1,505,264 | | |
GenOn Energy, Inc.
Senior Unsecured | |
| 10/15/18 | | | 9.500 | % | | | 1,567,000 | | | | 1,649,267 | | |
Ipalco Enterprises, Inc.
Senior Secured(b) | |
| 04/01/16 | | | 7.250 | % | | | 2,415,000 | | | | 2,710,837 | | |
| Kansas City Power & Light Co. | |
| 04/01/19 | | | 7.150 | % | | | 835,000 | | | | 1,007,101 | | |
| Majapahit Holding BV(b)(d) | |
| 06/29/37 | | | 7.875 | % | | | 2,780,000 | | | | 3,224,800 | | |
| NRG Energy, Inc.(b) | |
| 05/15/19 | | | 7.625 | % | | | 3,428,000 | | | | 3,423,715 | | |
| Nevada Power Co. | |
| 01/15/15 | | | 5.875 | % | | | 3,740,000 | | | | 4,209,938 | | |
| 05/15/18 | | | 6.500 | % | | | 9,575,000 | | | | 11,230,173 | | |
| 04/01/36 | | | 6.650 | % | | | 950,000 | | | | 1,119,098 | | |
Pacific Gas & Electric Co.
Senior Unsecured | |
| 10/01/20 | | | 3.500 | % | | | 5,005,000 | | | | 4,811,567 | | |
| Sierra Pacific Power Co. | |
| 05/15/16 | | | 6.000 | % | | | 2,535,000 | | | | 2,921,666 | | |
Texas Competitive Electric Holdings Co. LLC/Finance, Inc.
Senior Secured(b) | |
| 10/01/20 | | | 11.500 | % | | | 904,000 | | | | 915,300 | | |
TransAlta Corp.
Senior Unsecured(d) | |
| 05/15/18 | | | 6.650 | % | | | 6,340,000 | | | | 7,308,955 | | |
| Total | | | 80,728,321 | | |
| Entertainment 0.4% | |
| AMC Entertainment, Inc. | |
| 06/01/19 | | | 8.750 | % | | | 1,935,000 | | | | 2,077,706 | | |
AMC Entertainment, Inc.(b)
Senior Subordinated Notes | |
| 12/01/20 | | | 9.750 | % | | | 2,535,000 | | | | 2,690,269 | | |
Cinemark U.S.A., Inc.
Senior Subordinated Notes(b)(c) | |
| 06/15/21 | | | 7.375 | % | | | 452,000 | | | | 452,000 | | |
| Regal Cinemas Corp. | |
| 07/15/19 | | | 8.625 | % | | | 1,148,000 | | | | 1,228,360 | | |
| Six Flags, Inc.(b)(g)(h)(i) | |
| 06/01/14 | | | 9.625 | % | | | 1,557,000 | | | | — | | |
| Speedway Motorsports, Inc. | |
| 02/01/19 | | | 6.750 | % | | | 1,048,000 | | | | 1,063,720 | | |
Vail Resorts, Inc.
Senior Subordinated Notes(b) | |
| 05/01/19 | | | 6.500 | % | | | 523,000 | | | | 534,114 | | |
| Total | | | 8,046,169 | | |
| Environmental 0.2% | |
Clean Harbors, Inc.
Senior Secured | |
| 08/15/16 | | | 7.625 | % | | | 1,800,000 | | | | 1,921,500 | | |
| Issuer | | Coupon
Rate | | Principal
Amount | | Value | |
| Corporate Bonds & Notes(a) (continued) | |
| Environmental (cont.) | |
Clean Harbors, Inc.(b)
Senior Secured | |
| 08/15/16 | | | 7.625 | % | | $ | 805,000 | | | $ | 859,338 | | |
| Total | | | 2,780,838 | | |
| Food and Beverage 2.3% | |
ARAMARK Holdings Corp.
Senior Notes PIK(b) | |
| 05/01/16 | | | 8.625 | % | | | 1,649,000 | | | | 1,686,102 | | |
| Anheuser-Busch InBev Worldwide, Inc.(d) | |
| 11/15/14 | | | 5.375 | % | | | 15,959,000 | | | | 17,869,771 | | |
ConAgra Foods, Inc.
Senior Unsecured | |
| 10/01/28 | | | 7.000 | % | | | 855,000 | | | | 925,970 | | |
| Cott Beverages, Inc. | |
| 11/15/17 | | | 8.375 | % | | | 1,150,000 | | | | 1,230,500 | | |
| 09/01/18 | | | 8.125 | % | | | 1,106,000 | | | | 1,186,185 | | |
| Darling International, Inc.(b) | |
| 12/15/18 | | | 8.500 | % | | | 490,000 | | | | 534,100 | | |
| Dean Foods Co. | |
| 06/01/16 | | | 7.000 | % | | | 69,000 | | | | 69,173 | | |
Dean Foods Co.(b)
Senior Notes | |
| 12/15/18 | | | 9.750 | % | | | 1,343,000 | | | | 1,447,083 | | |
Kraft Foods, Inc.
Senior Unsecured | |
| 02/01/18 | | | 6.125 | % | | | 13,232,000 | | | | 15,220,015 | | |
| MHP SA(b)(d) | |
| 04/29/15 | | | 10.250 | % | | | 2,692,000 | | | | 2,951,512 | | |
| Total | | | 43,120,411 | | |
| Gaming 1.9% | |
Boyd Gaming Corp.
Senior Notes(b) | |
| 12/01/18 | | | 9.125 | % | | | 2,746,000 | | | | 2,859,272 | | |
Caesars Entertainment Operating Co., Inc.
Secured | |
| 12/15/18 | | | 10.000 | % | | | 4,254,000 | | | | 3,934,950 | | |
FireKeepers Development Authority
Senior Secured(b) | |
| 05/01/15 | | | 13.875 | % | | | 2,800,000 | | | | 3,286,500 | | |
| MGM Resorts International | |
| 06/01/16 | | | 7.500 | % | | | 995,000 | | | | 975,100 | | |
Senior Secured
03/15/20 | | | 9.000 | % | | | 3,907,000 | | | | 4,356,305 | | |
Senior Unsecured
03/01/18 | | | 11.375 | % | | | 2,005,000 | | | | 2,305,750 | | |
Penn National Gaming, Inc.
Senior Subordinated Notes | |
| 08/15/19 | | | 8.750 | % | | | 626,000 | | | | 683,123 | | |
| Pinnacle Entertainment, Inc. | |
| 08/01/17 | | | 8.625 | % | | | 2,405,000 | | | | 2,645,500 | | |
Pokagon Gaming Authority
Senior Notes(b) | |
| 06/15/14 | | | 10.375 | % | | | 2,246,000 | | | | 2,304,958 | | |
| Seminole Indian Tribe of Florida(b) | |
| 10/01/20 | | | 7.804 | % | | | 2,875,000 | | | | 2,906,855 | | |
Senior Secured
10/01/20 | | | 6.535 | % | | | 1,235,000 | | | | 1,266,616 | | |
The Accompanying Notes to Financial Statements are an integral part of this statement.
8
Columbia Strategic Income Fund
May 31, 2011
(Percentages represent value of investments compared to net assets)
| Issuer | | Coupon
Rate | | Principal
Amount | | Value | |
| Corporate Bonds & Notes(a) (continued) | |
| Gaming (cont.) | |
| Seneca Gaming Corp.(b) | |
| 12/01/18 | | | 8.250 | % | | $ | 1,952,000 | | | $ | 2,049,600 | | |
Shingle Springs Tribal Gaming Authority
Senior Notes(b) | |
| 06/15/15 | | | 9.375 | % | | | 4,620,000 | | | | 3,349,500 | | |
Tunica-Biloxi Gaming Authority
Senior Unsecured(b) | |
| 11/15/15 | | | 9.000 | % | | | 2,012,000 | | | | 2,006,970 | | |
| Total | | | 34,930,999 | | |
| Gas Distributors 0.1% | |
Energy Transfer Equity LP
Senior Secured | |
| 10/15/20 | | | 7.500 | % | | | 1,666,000 | | | | 1,807,610 | | |
| Gas Pipelines 2.1% | |
El Paso Corp.
Senior Unsecured | |
| 06/15/14 | | | 6.875 | % | | | 2,970,000 | | | | 3,373,834 | | |
| 06/01/18 | | | 7.250 | % | | | 3,803,000 | | | | 4,449,510 | | |
| 09/15/20 | | | 6.500 | % | | | 4,284,000 | | | | 4,787,370 | | |
| Enterprise Products Operating LLC | |
| 02/01/16 | | | 3.200 | % | | | 2,170,000 | | | | 2,213,333 | | |
Kinder Morgan Energy Partners LP
Senior Unsecured | |
| 01/15/38 | | | 6.950 | % | | | 670,000 | | | | 760,855 | | |
| Nisource Finance Corp. | |
| 09/15/17 | | | 5.250 | % | | | 8,415,000 | | | | 9,201,281 | | |
| Plains All American Pipeline LP/Finance Corp. | |
| 05/01/19 | | | 8.750 | % | | | 2,715,000 | | | | 3,496,882 | | |
| Regency Energy Partners LP/Finance Corp. | |
| 06/01/16 | | | 9.375 | % | | | 1,740,000 | | | | 1,974,900 | | |
| 12/01/18 | | | 6.875 | % | | | 1,289,000 | | | | 1,353,450 | | |
| 07/15/21 | | | 6.500 | % | | | 3,198,000 | | | | 3,213,990 | | |
Southern Natural Gas Co.
Senior Unsecured | |
| 03/01/32 | | | 8.000 | % | | | 885,000 | | | | 1,129,926 | | |
Southern Star Central Corp.
Senior Unsecured | |
| 03/01/16 | | | 6.750 | % | | | 1,695,000 | | | | 1,733,137 | | |
TransCanada PipeLines Ltd.
Senior Unsecured(d) | |
| 01/15/39 | | | 7.625 | % | | | 575,000 | | | | 743,898 | | |
| Total | | | 38,432,366 | | |
| Health Care 2.2% | |
AMGH Merger Sub, Inc.
Senior Secured(b) | |
| 11/01/18 | | | 9.250 | % | | | 690,000 | | | | 738,300 | | |
American Renal Associates Holdings, Inc.
Senior Unsecured PIK(b) | |
| 03/01/16 | | | 9.750 | % | | | 535,000 | | | | 553,725 | | |
American Renal Holdings, Inc.
Senior Secured | |
| 05/15/18 | | | 8.375 | % | | | 998,000 | | | | 1,042,910 | | |
| CDRT Merger Sub, Inc.(b) | |
| 06/01/19 | | | 8.125 | % | | | 1,462,000 | | | | 1,474,792 | | |
| CHS/Community Health Systems, Inc. | |
| 07/15/15 | | | 8.875 | % | | | 1,228,000 | | | | 1,267,910 | | |
| Issuer | | Coupon
Rate | | Principal
Amount | | Value | |
| Corporate Bonds & Notes(a) (continued) | |
| Health Care (cont.) | |
ConvaTec Healthcare E SA
Senior Unsecured(b)(d) | |
| 12/15/18 | | | 10.500 | % | | $ | 4,610,000 | | | $ | 4,978,800 | | |
HCA, Inc.
Senior Secured | |
| 09/15/20 | | | 7.250 | % | | | 9,915,000 | | | | 10,807,350 | | |
| Hanger Orthopedic Group, Inc. | |
| 11/15/18 | | | 7.125 | % | | | 1,779,000 | | | | 1,823,475 | | |
| Healthsouth Corp. | |
| 02/15/20 | | | 8.125 | % | | | 1,694,000 | | | | 1,865,517 | | |
| 09/15/22 | | | 7.750 | % | | | 369,000 | | | | 393,908 | | |
| InVentiv Health, Inc.(b) | |
| 08/15/18 | | | 10.000 | % | | | 4,586,000 | | | | 4,769,440 | | |
| LifePoint Hospitals, Inc.(b) | |
| 10/01/20 | | | 6.625 | % | | | 1,002,000 | | | | 1,039,575 | | |
| Multiplan, Inc.(b) | |
| 09/01/18 | | | 9.875 | % | | | 2,699,000 | | | | 2,921,667 | | |
| Radnet Management, Inc. | |
| 04/01/18 | | | 10.375 | % | | | 455,000 | | | | 473,200 | | |
STHI Holding Corp.
Secured(b) | |
| 03/15/18 | | | 8.000 | % | | | 751,000 | | | | 773,530 | | |
Tenet Healthcare Corp.
Senior Secured | |
| 07/01/19 | | | 8.875 | % | | | 1,265,000 | | | | 1,407,313 | | |
| Vanguard Health Holding Co. II LLC/Inc. | |
| 02/01/18 | | | 8.000 | % | | | 2,300,000 | | | | 2,397,750 | | |
| Vanguard Health Holding Co. II LLC/Inc.(b) | |
| 02/01/18 | | | 8.000 | % | | | 1,835,000 | | | | 1,917,575 | | |
| 02/01/19 | | | 7.750 | % | | | 185,000 | | | | 190,550 | | |
| Total | | | 40,837,287 | | |
| Healthcare Insurance 0.1% | |
WellPoint, Inc.
Senior Unsecured | |
| 02/15/19 | | | 7.000 | % | | | 960,000 | | | | 1,164,648 | | |
| Home Construction 0.3% | |
| Beazer Homes U.S.A., Inc. | |
| 06/15/18 | | | 9.125 | % | | | 135,000 | | | | 127,069 | | |
| K Hovnanian Enterprises, Inc. | |
| 10/15/15 | | | 11.875 | % | | | 422,000 | | | | 342,875 | | |
Senior Secured
10/15/16 | | | 10.625 | % | | | 1,835,000 | | | | 1,844,175 | | |
Shea Homes LP/Funding Corp.
Senior Secured(b) | |
| 05/15/19 | | | 8.625 | % | | | 2,645,000 | | | | 2,674,756 | | |
| Total | | | 4,988,875 | | |
| Independent Energy 4.8% | |
Anadarko Petroleum Corp.
Senior Unsecured | |
| 09/15/16 | | | 5.950 | % | | | 3,875,000 | | | | 4,378,060 | | |
Berry Petroleum Co.
Senior Subordinated Notes | |
| 11/01/16 | | | 8.250 | % | | | 335,000 | | | | 350,913 | | |
Senior Unsecured
06/01/14 | | | 10.250 | % | | | 535,000 | | | | 617,925 | | |
| 11/01/20 | | | 6.750 | % | | | 760,000 | | | | 784,700 | | |
The Accompanying Notes to Financial Statements are an integral part of this statement.
9
Columbia Strategic Income Fund
May 31, 2011
(Percentages represent value of investments compared to net assets)
| Issuer | | Coupon
Rate | | Principal
Amount | | Value | |
| Corporate Bonds & Notes(a) (continued) | |
| Independent Energy (cont.) | |
| Brigham Exploration Co. | |
| 10/01/18 | | | 8.750 | % | | $ | 2,510,000 | | | $ | 2,754,725 | | |
| Brigham Exploration Co.(b) | |
| 06/01/19 | | | 6.875 | % | | | 406,000 | | | | 406,000 | | |
| Carrizo Oil & Gas, Inc.(b) | |
| 10/15/18 | | | 8.625 | % | | | 4,144,000 | | | | 4,371,920 | | |
| Chaparral Energy, Inc.(b) | |
| 10/01/20 | | | 9.875 | % | | | 928,000 | | | | 1,032,400 | | |
| 09/01/21 | | | 8.250 | % | | | 2,408,000 | | | | 2,492,280 | | |
| Chesapeake Energy Corp. | |
| 08/15/20 | | | 6.625 | % | | | 6,050,000 | | | | 6,360,062 | | |
| 02/15/21 | | | 6.125 | % | | | 2,376,000 | | | | 2,417,580 | | |
| Comstock Resources, Inc. | |
| 10/15/17 | | | 8.375 | % | | | 357,000 | | | | 376,635 | | |
| 04/01/19 | | | 7.750 | % | | | 664,000 | | | | 673,960 | | |
| Concho Resources, Inc. | |
| 01/15/21 | | | 7.000 | % | | | 3,343,000 | | | | 3,501,792 | | |
| 01/15/22 | | | 6.500 | % | | | 771,000 | | | | 774,855 | | |
| Continental Resources, Inc. | |
| 04/01/21 | | | 7.125 | % | | | 1,813,000 | | | | 1,912,715 | | |
| EXCO Resources, Inc. | |
| 09/15/18 | | | 7.500 | % | | | 4,716,000 | | | | 4,739,580 | | |
| Goodrich Petroleum Corp.(b) | |
| 03/15/19 | | | 8.875 | % | | | 1,677,000 | | | | 1,689,578 | | |
Hilcorp Energy I LP/Finance Co.
Senior Notes(b) | |
| 02/15/20 | | | 8.000 | % | | | 2,375,000 | | | | 2,529,375 | | |
Laredo Petroleum, Inc.
Senior Notes(b) | |
| 02/15/19 | | | 9.500 | % | | | 4,452,000 | | | | 4,741,380 | | |
| Linn Energy LLC/Finance Corp.(b) | |
| 05/15/19 | | | 6.500 | % | | | 3,170,000 | | | | 3,170,000 | | |
| MEG Energy Corp.(b)(d) | |
| 03/15/21 | | | 6.500 | % | | | 2,200,000 | | | | 2,216,500 | | |
NAK Naftogaz Ukraine
Government Guaranteed(d) | |
| 09/30/14 | | | 9.500 | % | | | 5,625,000 | | | | 6,175,712 | | |
Newfield Exploration Co.
Senior Subordinated Notes | |
| 04/15/16 | | | 6.625 | % | | | 3,810,000 | | | | 3,938,587 | | |
| 02/01/20 | | | 6.875 | % | | | 2,095,000 | | | | 2,220,700 | | |
Nexen, Inc.(d)
Senior Unsecured | |
| 03/10/35 | | | 5.875 | % | | | 960,000 | | | | 942,896 | | |
| 07/30/39 | | | 7.500 | % | | | 1,080,000 | | | | 1,264,769 | | |
Oasis Petroleum, Inc.
Senior Notes(b) | |
| 02/01/19 | | | 7.250 | % | | | 1,209,000 | | | | 1,212,023 | | |
| Petrohawk Energy Corp. | |
| 08/15/18 | | | 7.250 | % | | | 4,170,000 | | | | 4,373,287 | | |
| Petrohawk Energy Corp.(b) | |
| 06/01/19 | | | 6.250 | % | | | 6,420,000 | | | | 6,339,750 | | |
QEP Resources, Inc.
Senior Unsecured | |
| 03/01/21 | | | 6.875 | % | | | 2,810,000 | | | | 3,020,750 | | |
| Range Resources Corp. | |
| 05/15/19 | | | 8.000 | % | | | 1,115,000 | | | | 1,218,138 | | |
| 08/01/20 | | | 6.750 | % | | | 2,335,000 | | | | 2,463,425 | | |
| Issuer | | Coupon
Rate | | Principal
Amount | | Value | |
| Corporate Bonds & Notes(a) (continued) | |
| Independent Energy (cont.) | |
| Southwestern Energy Co. | |
| 02/01/18 | | | 7.500 | % | | $ | 1,595,000 | | | $ | 1,824,281 | | |
| Venoco, Inc.(b) | |
| 02/15/19 | | | 8.875 | % | | | 2,728,000 | | | | 2,762,100 | | |
| Total | | | 90,049,353 | | |
| Integrated Energy 0.1% | |
| Lukoil International Finance BV(b)(d) | |
| 11/09/20 | | | 6.125 | % | | | 2,300,000 | | | | 2,388,914 | | |
| Life Insurance 0.3% | |
| ING Groep NV(d)(e) | |
| 12/29/49 | | | 5.775 | % | | | 6,658,000 | | | | 6,191,940 | | |
| Media Cable 2.3% | |
| CCO Holdings LLC/Capital Corp. | |
| 01/15/19 | | | 7.000 | % | | | 5,180,000 | | | | 5,290,075 | | |
| 04/30/20 | | | 8.125 | % | | | 3,202,000 | | | | 3,474,170 | | |
CSC Holdings LLC
Senior Unsecured | |
| 02/15/19 | | | 8.625 | % | | | 346,000 | | | | 398,765 | | |
Cablevision Systems Corp.
Senior Unsecured | |
| 09/15/17 | | | 8.625 | % | | | 2,354,000 | | | | 2,654,135 | | |
Cequel Communications Holdings I LLC/Capital Corp.
Senior Unsecured(b) | |
| 11/15/17 | | | 8.625 | % | | | 4,010,000 | | | | 4,260,625 | | |
| Comcast Corp. | |
| 08/15/37 | | | 6.950 | % | | | 3,430,000 | | | | 3,949,449 | | |
| DIRECTV Holdings LLC/Financing Co., Inc. | |
| 06/15/15 | | | 6.375 | % | | | 335,000 | | | | 342,956 | | |
| DISH DBS Corp. | |
| 09/01/19 | | | 7.875 | % | | | 7,899,000 | | | | 8,600,036 | | |
| DISH DBS Corp.(b) | |
| 06/01/21 | | | 6.750 | % | | | 5,998,000 | | | | 6,057,980 | | |
Insight Communications Co., Inc.
Senior Notes(b) | |
| 07/15/18 | | | 9.375 | % | | | 1,755,000 | | | | 1,965,600 | | |
Kabel BW Erste Beteiligungs GmbH/Co. KG
Senior Secured(b)(d) | |
| 03/15/19 | | | 7.500 | % | | | 1,265,000 | | | | 1,329,661 | | |
Quebecor Media, Inc.
Senior Unsecured(d) | |
| 03/15/16 | | | 7.750 | % | | | 3,150,000 | | | | 3,268,125 | | |
| Time Warner Cable, Inc. | |
| 05/01/17 | | | 5.850 | % | | | 405,000 | | | | 453,162 | | |
| 02/01/20 | | | 5.000 | % | | | 650,000 | | | | 675,435 | | |
| Total | | | 42,720,174 | | |
| Media Non-Cable 3.6% | |
Belo Corp.
Senior Unsecured | |
| 11/15/16 | | | 8.000 | % | | | 2,625,000 | | | | 2,890,781 | | |
| CMP Susquehanna Corp.(b)(g)(i) | |
| 05/15/14 | | | 3.417 | % | | | 175,000 | | | | 161,000 | | |
| Clear Channel Communications, Inc.(b) | |
| 03/01/21 | | | 9.000 | % | | | 5,000,000 | | | | 5,012,500 | | |
| Clear Channel Worldwide Holdings, Inc. | |
| 12/15/17 | | | 9.250 | % | | | 6,590,000 | | | | 7,199,575 | | |
The Accompanying Notes to Financial Statements are an integral part of this statement.
10
Columbia Strategic Income Fund
May 31, 2011
(Percentages represent value of investments compared to net assets)
| Issuer | | Coupon
Rate | | Principal
Amount | | Value | |
| Corporate Bonds & Notes(a) (continued) | |
| Media Non-Cable (cont.) | |
Cumulus Media, Inc.
Senior Notes(b) | |
| 05/01/19 | | | 7.750 | % | | $ | 506,000 | | | $ | 506,000 | | |
Entravision Communications Corp.
Senior Secured | |
| 08/01/17 | | | 8.750 | % | | | 2,375,000 | | | | 2,523,438 | | |
| Intelsat Jackson Holdings SA(b)(d) | |
| 04/01/19 | | | 7.250 | % | | | 2,390,000 | | | | 2,407,925 | | |
| 10/15/20 | | | 7.250 | % | | | 2,430,000 | | | | 2,436,075 | | |
| 04/01/21 | | | 7.500 | % | | | 2,390,000 | | | | 2,419,875 | | |
Intelsat Luxembourg SA(b)(d)
PIK | |
| 02/04/17 | | | 11.500 | % | | | 1,631,000 | | | | 1,767,596 | | |
Intelsat Luxembourg SA(d)
PIK | |
| 02/04/17 | | | 11.500 | % | | | 1,627,000 | | | | 1,763,261 | | |
Interpublic Group of Companies, Inc. (The)
Senior Unsecured | |
| 07/15/17 | | | 10.000 | % | | | 1,200,000 | | | | 1,431,000 | | |
| News America, Inc. | |
| 12/15/35 | | | 6.400 | % | | | 150,000 | | | | 158,849 | | |
| Nielsen Finance LLC/Co.(b) | |
| 10/15/18 | | | 7.750 | % | | | 3,437,000 | | | | 3,703,368 | | |
RR Donnelley & Sons Co.
Senior Unsecured | |
| 06/15/20 | | | 7.625 | % | | | 710,000 | | | | 720,359 | | |
RR Donnelley & Sons Co.(c)
Senior Notes | |
| 05/15/18 | | | 7.250 | % | | | 1,047,000 | | | | 1,059,880 | | |
Salem Communications Corp.
Secured | |
| 12/15/16 | | | 9.625 | % | | | 3,892,000 | | | | 4,185,645 | | |
Sinclair Television Group, Inc.
Secured(b) | |
| 11/01/17 | | | 9.250 | % | | | 6,816,000 | | | | 7,616,880 | | |
| TCM Sub LLC(b) | |
| 01/15/15 | | | 3.550 | % | | | 4,660,000 | | | | 4,910,586 | | |
| Univision Communications, Inc.(b) | |
| 05/15/21 | | | 8.500 | % | | | 4,980,000 | | | | 5,067,150 | | |
Senior Secured
11/01/20 | | | 7.875 | % | | | 3,885,000 | | | | 4,079,250 | | |
| XM Satellite Radio, Inc.(b) | |
| 11/01/18 | | | 7.625 | % | | | 4,511,000 | | | | 4,792,937 | | |
| Total | | | 66,813,930 | | |
| Metals 1.8% | |
| Alpha Natural Resources, Inc.(c) | |
| 06/01/19 | | | 6.000 | % | | | 1,289,000 | | | | 1,300,279 | | |
| 06/01/21 | | | 6.250 | % | | | 1,289,000 | | | | 1,314,780 | | |
ArcelorMittal
Senior Unsecured(d) | |
| 03/01/21 | | | 5.500 | % | | | 4,590,000 | | | | 4,624,007 | | |
Calcipar SA
Senior Secured(b)(d) | |
| 05/01/18 | | | 6.875 | % | | | 2,680,000 | | | | 2,773,800 | | |
| Consol Energy, Inc. | |
| 04/01/17 | | | 8.000 | % | | | 375,000 | | | | 410,625 | | |
| 04/01/20 | | | 8.250 | % | | | 4,420,000 | | | | 4,906,200 | | |
| Issuer | | Coupon
Rate | | Principal
Amount | | Value | |
| Corporate Bonds & Notes(a) (continued) | |
| Metals (cont.) | |
| FMG Resources August 2006 Proprietary Ltd.(b)(d) | |
| 11/01/15 | | | 7.000 | % | | $ | 4,198,000 | | | $ | 4,432,864 | | |
| 02/01/16 | | | 6.375 | % | | | 1,945,000 | | | | 1,966,881 | | |
| 02/01/18 | | | 6.875 | % | | | 1,711,000 | | | | 1,787,995 | | |
JMC Steel Group
Senior Notes(b) | |
| 03/15/18 | | | 8.250 | % | | | 1,036,000 | | | | 1,069,670 | | |
| Novelis, Inc.(d) | |
| 12/15/20 | | | 8.750 | % | | | 2,835,000 | | | | 3,132,675 | | |
Rain CII Carbon LLC/Corp.
Senior Secured(b) | |
| 12/01/18 | | | 8.000 | % | | | 2,430,000 | | | | 2,606,175 | | |
United States Steel Corp.
Senior Unsecured | |
| 02/01/18 | | | 7.000 | % | | | 3,819,000 | | | | 3,981,308 | | |
| Total | | | 34,307,259 | | |
| Non-Captive Consumer 0.6% | |
General Motors Financial Co., Inc.
Senior Notes(b)(c) | |
| 06/01/18 | | | 6.750 | % | | | 739,000 | | | | 744,619 | | |
SLM Corp.
Senior Notes | |
| 01/25/16 | | | 6.250 | % | | | 2,065,000 | | | | 2,162,986 | | |
Senior Unsecured
03/25/20 | | | 8.000 | % | | | 3,057,000 | | | | 3,371,272 | | |
Springleaf Finance Corp.
Senior Unsecured | |
| 12/15/17 | | | 6.900 | % | | | 4,222,000 | | | | 4,010,900 | | |
| Total | | | 10,289,777 | | |
| Non-Captive Diversified 3.4% | |
| Ally Financial, Inc. | |
| 03/15/20 | | | 8.000 | % | | | 13,008,000 | | | | 14,357,580 | | |
| 09/15/20 | | | 7.500 | % | | | 3,430,000 | | | | 3,691,537 | | |
| Ally Financial, Inc.(b) | |
| 12/01/17 | | | 6.250 | % | | | 2,930,000 | | | | 3,018,363 | | |
CIT Group, Inc.
Secured | |
| 05/01/17 | | | 7.000 | % | | | 15,990,000 | | | | 16,049,962 | | |
CIT Group, Inc.(b)
Secured | |
| 04/01/18 | | | 6.625 | % | | | 2,630,000 | | | | 2,814,100 | | |
Ford Motor Credit Co. LLC
Senior Unsecured | |
| 01/15/20 | | | 8.125 | % | | | 6,025,000 | | | | 7,075,646 | | |
| 02/01/21 | | | 5.750 | % | | | 2,311,000 | | | | 2,328,961 | | |
General Electric Capital Corp.
Senior Unsecured | |
| 01/10/39 | | | 6.875 | % | | | 3,830,000 | | | | 4,499,756 | | |
The Accompanying Notes to Financial Statements are an integral part of this statement.
11
Columbia Strategic Income Fund
May 31, 2011
(Percentages represent value of investments compared to net assets)
| Issuer | | Coupon
Rate | | Principal
Amount | | Value | |
| Corporate Bonds & Notes(a) (continued) | |
| Non-Captive Diversified (cont.) | |
International Lease Finance Corp.
Senior Unsecured | |
| 03/15/17 | | | 8.750 | % | | $ | 2,560,000 | | | $ | 2,899,200 | | |
| 09/01/17 | | | 8.875 | % | | | 3,210,000 | | | | 3,651,375 | | |
| 05/15/19 | | | 6.250 | % | | | 1,215,000 | | | | 1,219,573 | | |
| 12/15/20 | | | 8.250 | % | | | 1,965,000 | | | | 2,205,713 | | |
| Total | | | 63,811,766 | | |
| Oil Field Services 0.6% | |
Offshore Group Investments Ltd.(b)(c)(d)
Senior Secured | |
| 08/01/15 | | | 11.500 | % | | | 1,050,000 | | | | 1,149,728 | | |
Offshore Group Investments Ltd.(d)
Senior Secured | |
| 08/01/15 | | | 11.500 | % | | | 4,885,000 | | | | 5,385,713 | | |
| Oil States International, Inc.(b)(c) | |
| 06/01/19 | | | 6.500 | % | | | 3,163,000 | | | | 3,182,769 | | |
Trinidad Drilling Ltd.
Senior Unsecured(b)(d) | |
| 01/15/19 | | | 7.875 | % | | | 1,913,000 | | | | 2,051,175 | | |
| Weatherford International Ltd.(d) | |
| 03/15/13 | | | 5.150 | % | | | 14,000 | | | | 14,870 | | |
| Total | | | 11,784,255 | | |
| Other Industry 0.1% | |
| Aquilex Holdings LLC/Finance Corp. | |
| 12/15/16 | | | 11.125 | % | | | 1,365,000 | | | | 1,344,525 | | |
| Interline Brands, Inc. | |
| 11/15/18 | | | 7.000 | % | | | 1,094,000 | | | | 1,119,983 | | |
| Total | | | 2,464,508 | | |
| Packaging 0.6% | |
ARD Finance SA
Senior Secured(b)(d) | |
| 06/01/18 | | | 11.125 | % | | | 649,000 | | | | 678,205 | | |
| Ardagh Packaging Finance PLC(b)(d) | |
| 10/15/20 | | | 9.125 | % | | | 1,715,000 | | | | 1,886,500 | | |
Senior Secured
10/15/17 | | | 7.375 | % | | | 790,000 | | | | 843,325 | | |
| Reynolds Group Issuer, Inc./LLC(b) | |
| 04/15/19 | | | 9.000 | % | | | 2,255,000 | | | | 2,393,119 | | |
| 02/15/21 | | | 8.250 | % | | | 2,439,000 | | | | 2,481,682 | | |
Senior Secured
04/15/19 | | | 7.125 | % | | | 1,961,000 | | | | 2,039,440 | | |
| Total | | | 10,322,271 | | |
| Paper 0.4% | |
| Cascades, Inc.(d) | |
| 12/15/17 | | | 7.750 | % | | | 3,715,000 | | | | 3,937,900 | | |
| Graphic Packaging International, Inc. | |
| 10/01/18 | | | 7.875 | % | | | 564,000 | | | | 611,940 | | |
Verso Paper Holdings LLC/Inc.
Secured(b) | |
| 02/01/19 | | | 8.750 | % | | | 2,678,000 | | | | 2,678,000 | | |
| Total | | | 7,227,840 | | |
| Pharmaceuticals 0.6% | |
Grifols, Inc.
Senior Secured(b) | |
| 02/01/18 | | | 8.250 | % | | | 2,604,000 | | | | 2,740,710 | | |
| Issuer | | Coupon
Rate | | Principal
Amount | | Value | |
| Corporate Bonds & Notes(a) (continued) | |
| Pharmaceuticals (cont.) | |
| Mylan, Inc.(b) | |
| 11/15/18 | | | 6.000 | % | | $ | 2,774,000 | | | $ | 2,850,285 | | |
| Valeant Pharmaceuticals International(b)(d) | |
| 10/01/17 | | | 6.750 | % | | | 1,050,000 | | | | 1,039,500 | | |
| 10/01/20 | | | 7.000 | % | | | 1,639,000 | | | | 1,606,220 | | |
| Warner Chilcott Co./Finance LLC(b) | |
| 09/15/18 | | | 7.750 | % | | | 3,296,000 | | | | 3,436,080 | | |
| Total | | | 11,672,795 | | |
| Railroads 0.2% | |
CSX Corp.
Senior Unsecured | |
| 04/15/41 | | | 5.500 | % | | | 2,765,000 | | | | 2,768,835 | | |
Union Pacific Corp.
Senior Unsecured | |
| 08/15/18 | | | 5.700 | % | | | 1,440,000 | | | | 1,653,885 | | |
| Total | | | 4,422,720 | | |
| Refining 0.2% | |
United Refining Co.
Senior Secured(b) | |
| 02/28/18 | | | 10.500 | % | | | 2,677,000 | | | | 2,710,463 | | |
| REITs —% | |
Duke Realty LP
Senior Unsecured | |
| 08/15/19 | | | 8.250 | % | | | 200 | | | | 246 | | |
| Retailers 0.7% | |
Asbury Automotive Group, Inc.
Subordinated Notes(b) | |
| 11/15/20 | | | 8.375 | % | | | 320,000 | | | | 335,200 | | |
| Ltd Brands, Inc. | |
| 04/01/21 | | | 6.625 | % | | | 1,405,000 | | | | 1,464,713 | | |
Needle Merger Sub Corp.
Senior Unsecured(b) | |
| 03/15/19 | | | 8.125 | % | | | 474,000 | | | | 479,925 | | |
QVC, Inc.(b)
Senior Secured | |
| 04/15/17 | | | 7.125 | % | | | 1,025,000 | | | | 1,091,625 | | |
| 10/15/20 | | | 7.375 | % | | | 2,652,000 | | | | 2,844,270 | | |
| Rite Aid Corp. | |
| 06/15/17 | | | 9.500 | % | | | 820,000 | | | | 752,350 | | |
Senior Secured
08/15/20 | | | 8.000 | % | | | 1,000,000 | | | | 1,076,250 | | |
Toys R Us, Inc.
Senior Unsecured | |
| 10/15/18 | | | 7.375 | % | | | 5,440,000 | | | | 5,440,000 | | |
| Total | | | 13,484,333 | | |
| Sovereign 0.2% | |
Morgan Stanley
Senior Unsecured(d) | |
| 10/22/20 | | | 11.500 | % | | BRL | 6,285,000 | | | | 4,063,191 | | |
| Supranational 0.4% | |
European Investment Bank
Senior Unsecured(d) | |
| 06/20/17 | | | 1.400 | % | | JPY | 400,000,000 | | | | 5,095,542 | | |
The Accompanying Notes to Financial Statements are an integral part of this statement.
12
Columbia Strategic Income Fund
May 31, 2011
(Percentages represent value of investments compared to net assets)
| Issuer | | Coupon
Rate | | Principal
Amount | | Value | |
| Corporate Bonds & Notes(a) (continued) | |
| Supranational (cont.) | |
International Finance Corp.
Senior Unsecured(d) | |
| 02/28/13 | | | 7.500 | % | | AUD | 2,675,000 | | | $ | 2,967,692 | | |
| Total | | | 8,063,234 | | |
| Technology 2.0% | |
Amkor Technology, Inc.
Senior Unsecured | |
| 05/01/18 | | | 7.375 | % | | $ | 1,843,000 | | | | 1,921,327 | | |
Amkor Technology, Inc.(b)
Senior Unsecured | |
| 06/01/21 | | | 6.625 | % | | | 3,087,000 | | | | 3,032,977 | | |
| CDW LLC/Finance Corp(b) | |
| 04/01/19 | | | 8.500 | % | | | 2,779,000 | | | | 2,806,790 | | |
| Cardtronics, Inc. | |
| 09/01/18 | | | 8.250 | % | | | 2,465,000 | | | | 2,686,850 | | |
| CommScope, Inc.(b) | |
| 01/15/19 | | | 8.250 | % | | | 693,000 | | | | 725,918 | | |
| First Data Corp. | |
| 09/24/15 | | | 9.875 | % | | | 1,558,000 | | | | 1,608,635 | | |
| 09/24/15 | | | 9.875 | % | | | 152,000 | | | | 156,560 | | |
| First Data Corp.(b) | |
| 01/15/21 | | | 12.625 | % | | | 5,150,000 | | | | 5,600,625 | | |
Senior Secured
06/15/19 | | | 7.375 | % | | | 1,330,000 | | | | 1,349,950 | | |
| 08/15/20 | | | 8.875 | % | | | 3,210,000 | | | | 3,482,850 | | |
Freescale Semiconductor, Inc.
Senior Secured(b) | |
| 04/15/18 | | | 9.250 | % | | | 1,775,000 | | | | 1,979,125 | | |
| Interactive Data Corp.(b) | |
| 08/01/18 | | | 10.250 | % | | | 3,755,000 | | | | 4,177,437 | | |
NXP BV/Funding LLC
Senior Secured(b)(d) | |
| 08/01/18 | | | 9.750 | % | | | 1,349,000 | | | | 1,554,723 | | |
| SunGard Data Systems, Inc. | |
| 11/15/18 | | | 7.375 | % | | | 3,488,000 | | | | 3,557,760 | | |
iGate Corp.
Senior Notes(b) | |
| 05/01/16 | | | 9.000 | % | | | 1,747,000 | | | | 1,790,675 | | |
| Total | | | 36,432,202 | | |
| Transportation Services 0.6% | |
| Avis Budget Car Rental LLC/Finance, Inc. | |
| 01/15/19 | | | 8.250 | % | | | 2,370,000 | | | | 2,455,913 | | |
| ERAC U.S.A. Finance LLC(b) | |
| 10/01/20 | | | 5.250 | % | | | 1,150,000 | | | | 1,223,169 | | |
| 10/15/37 | | | 7.000 | % | | | 147,000 | | | | 167,184 | | |
| Hertz Corp. (The)(b) | |
| 10/15/18 | | | 7.500 | % | | | 2,435,000 | | | | 2,526,312 | | |
| 04/15/19 | | | 6.750 | % | | | 1,865,000 | | | | 1,883,650 | | |
| 01/15/21 | | | 7.375 | % | | | 2,316,000 | | | | 2,397,060 | | |
| Total | | | 10,653,288 | | |
| Wireless 2.5% | |
Clearwire Communications LLC/Finance, Inc.(b)
Secured | |
| 12/01/17 | | | 12.000 | % | | | 904,000 | | | | 986,490 | | |
Senior Secured
12/01/15 | | | 12.000 | % | | | 1,073,000 | | | | 1,176,276 | | |
| Issuer | | Coupon
Rate | | Principal
Amount | | Value | |
| Corporate Bonds & Notes(a) (continued) | |
| Wireless (cont.) | |
Cricket Communications, Inc.
Senior Secured | |
| 05/15/16 | | | 7.750 | % | | $ | 921,000 | | | $ | 978,563 | | |
Cricket Communications, Inc.(b)
Senior Notes | |
| 10/15/20 | | | 7.750 | % | | | 1,321,000 | | | | 1,302,836 | | |
EH Holding Corp.(b)(c)
Senior Secured | |
| 06/15/19 | | | 6.500 | % | | | 2,973,000 | | | | 3,006,446 | | |
Senior Unsecured
06/15/21 | | | 7.625 | % | | | 3,260,000 | | | | 3,333,350 | | |
| MetroPCS Wireless, Inc. | |
| 09/01/18 | | | 7.875 | % | | | 1,695,000 | | | | 1,824,244 | | |
| 11/15/20 | | | 6.625 | % | | | 2,090,000 | | | | 2,084,775 | | |
| NII Capital Corp. | |
| 04/01/21 | | | 7.625 | % | | | 2,000,000 | | | | 2,122,500 | | |
| Nextel Communications, Inc. | |
| 08/01/15 | | | 7.375 | % | | | 1,384,000 | | | | 1,392,650 | | |
| SBA Telecommunications, Inc. | |
| 08/15/19 | | | 8.250 | % | | | 1,540,000 | | | | 1,695,925 | | |
| Sprint Capital Corp. | |
| 11/15/28 | | | 6.875 | % | | | 3,030,000 | | | | 2,939,100 | | |
Sprint Nextel Corp.
Senior Unsecured | |
| 08/15/17 | | | 8.375 | % | | | 9,850,000 | | | | 11,105,875 | | |
United States Cellular Corp.
Senior Unsecured | |
| 12/15/33 | | | 6.700 | % | | | 1,850,000 | | | | 1,876,703 | | |
| Wind Acquisition Finance SA(b)(d) | |
| 07/15/17 | | | 11.750 | % | | | 7,102,000 | | | | 8,256,075 | | |
Senior Secured
02/15/18 | | | 7.250 | % | | | 2,570,000 | | | | 2,724,200 | | |
| Total | | | 46,806,008 | | |
| Wirelines 3.3% | |
AT&T, Inc.
Senior Unsecured | |
| 02/15/39 | | | 6.550 | % | | | 4,130,000 | | | | 4,556,435 | | |
BellSouth Corp.
Senior Unsecured | |
| 09/15/14 | | | 5.200 | % | | | 2,205,000 | | | | 2,446,271 | | |
| Cincinnati Bell, Inc. | |
| 10/15/17 | | | 8.250 | % | | | 3,980,000 | | | | 4,054,625 | | |
Embarq Corp.
Senior Unsecured | |
| 06/01/16 | | | 7.082 | % | | | 4,725,000 | | | | 5,358,254 | | |
| 06/01/36 | | | 7.995 | % | | | 740,000 | | | | 807,209 | | |
Frontier Communications Corp.
Senior Unsecured | |
| 04/15/20 | | | 8.500 | % | | | 6,245,000 | | | | 6,846,081 | | |
ITC Deltacom, Inc.
Senior Secured | |
| 04/01/16 | | | 10.500 | % | | | 492,000 | | | | 531,360 | | |
Integra Telecom Holdings, Inc.
Senior Secured(b) | |
| 04/15/16 | | | 10.750 | % | | | 1,019,000 | | | | 1,067,403 | | |
The Accompanying Notes to Financial Statements are an integral part of this statement.
13
Columbia Strategic Income Fund
May 31, 2011
(Percentages represent value of investments compared to net assets)
| Issuer | | Coupon
Rate | | Principal
Amount | | Value | |
| Corporate Bonds & Notes(a) (continued) | |
| Wirelines (cont.) | |
Level 3 Communications, Inc.
Senior Unsecured(b) | |
| 02/01/19 | | | 11.875 | % | | $ | 1,725,000 | | | $ | 1,910,438 | | |
Level 3 Escrow, Inc.
Senior Unsecured(b)(c) | |
| 07/01/19 | | | 8.125 | % | | | 2,621,000 | | | | 2,647,210 | | |
| Level 3 Financing, Inc. | |
| 02/15/17 | | | 8.750 | % | | | 2,240,000 | | | | 2,307,200 | | |
| Level 3 Financing, Inc.(b) | |
| 04/01/19 | | | 9.375 | % | | | 840,000 | | | | 888,300 | | |
PAETEC Holding Corp.
Senior Secured | |
| 06/30/17 | | | 8.875 | % | | | 4,680,000 | | | | 5,077,800 | | |
| PAETEC Holding Corp.(b) | |
| 12/01/18 | | | 9.875 | % | | | 2,385,000 | | | | 2,557,912 | | |
| Qtel International Finance Ltd.(b)(d) | |
| 10/19/25 | | | 5.000 | % | | | 1,930,000 | | | | 1,823,886 | | |
Qwest Corp.
Senior Unsecured | |
| 06/15/23 | | | 7.500 | % | | | 5,245,000 | | | | 5,264,669 | | |
| Telefonica Emisiones SAU(d) | |
| 04/27/15 | | | 3.729 | % | | | 6,150,000 | | | | 6,350,828 | | |
| 06/20/16 | | | 6.421 | % | | | 1,425,000 | | | | 1,613,342 | | |
Verizon New York, Inc.
Senior Unsecured | |
| 04/01/32 | | | 7.375 | % | | | 3,535,000 | | | | 4,175,941 | | |
| Windstream Corp. | |
| 09/01/18 | | | 8.125 | % | | | 1,485,000 | | | | 1,620,506 | | |
| Total | | | 61,905,670 | | |
Total Corporate Bonds & Notes
(Cost: $931,153,006) | | $ | 976,180,057 | | |
| Residential Mortgage-Backed Securities—Agency 5.1% | |
Federal Home Loan Mortgage Corp.(e)(i)(k)
CMO IO Series 3852 Class SW | |
| 05/15/41 | | | 18.000 | % | | $ | 15,100,000 | | | $ | 3,010,638 | | |
| Federal Home Loan Mortgage Corp.(k) | |
| 05/01/21 | | | 5.000 | % | | | 6,650,567 | | | | 7,179,841 | | |
| 01/01/20 | | | 10.500 | % | | | 4,404 | | | | 4,435 | | |
| Federal National Mortgage Association(c)(e)(k) | |
| 06/01/41 | | | 4.000 | % | | | 14,350,000 | | | | 14,450,895 | | |
| Federal National Mortgage Association(c)(k) | |
| 07/01/40 | | | 4.500 | % | | | 14,242,195 | | | | 14,845,124 | | |
Federal National Mortgage Association(e)(k)
CMO IO Series 2010-135 Class MS | |
| 12/25/40 | | | 11.710 | % | | | 7,707,955 | | | | 1,299,703 | | |
| Federal National Mortgage Association(k) | |
| 09/01/37 | | | 5.000 | % | | | 6,773,553 | | | | 7,227,527 | | |
| 11/01/36 | | | 5.500 | % | | | 4,670,293 | | | | 5,078,442 | | |
| 10/01/36-08/01/37 | | | 6.000 | % | | | 17,613,316 | | | | 19,418,338 | | |
| 12/01/31-11/01/37 | | | 6.500 | % | | | 6,018,888 | | | | 6,803,117 | | |
| 04/01/16 | | | 9.000 | % | | | 11 | | | | 10 | | |
| 04/01/14 | | | 10.000 | % | | | 24,547 | | | | 24,910 | | |
| Issuer | | Coupon
Rate | | Principal
Amount | | Value | |
Residential Mortgage-Backed Securities—Agency
(continued) | |
| Federal National Mortgage Association(k)(j) | |
| 11/01/36 | | | 6.500 | % | | $ | 12,185,645 | | | $ | 13,778,348 | | |
| Government National Mortgage Association(k) | |
| 08/15/13 | | | 11.750 | % | | | 2,757 | | | | 2,778 | | |
| CMO IO Series 2010-167 Class GI | |
| 02/20/38 | | | 1.690 | % | | | 7,850,608 | | | | 1,276,700 | | |
Total Residential Mortgage-Backed Securities—Agency
(Cost: $89,149,615) | | $ | 94,400,806 | | |
| Residential Mortgage-Backed Securities—Non-Agency 2.0% | |
BCAP LLC Trust(b)(e)(k)
CMO Series 2010-RR7 Class 17A7 | |
| 03/26/36 | | | 5.058 | % | | $ | 1,504,159 | | | $ | 1,234,391 | | |
BCAP LLC Trust(b)(k)
CMO Series 2010-RR7 Class 8A6 | |
| 05/26/35 | | | 5.500 | % | | | 2,245,000 | | | | 2,211,220 | | |
Castle Peak Loan Trust
CMO Series 2010-NPL1 Class A(b)(k) | |
| 12/25/50 | | | 7.750 | % | | | 3,216,241 | | | | 3,216,241 | | |
Citigroup Mortgage Loan Trust, Inc.(b)(e)(k)
CMO Series 2009-3 Class 4A3 | |
| 10/25/33 | | | 2.623 | % | | | 5,195,977 | | | | 4,130,802 | | |
CMO Series 2009-4 Class 9A2
03/25/36 | | | 4.743 | % | | | 2,585,248 | | | | 2,132,830 | | |
CMO Series 2010-6 Class 2A2
09/25/35 | | | 2.808 | % | | | 973,314 | | | | 754,318 | | |
CMO Series 2010-6 Class 3A2
07/25/36 | | | 4.078 | % | | | 4,185,000 | | | | 3,935,309 | | |
CMO Series 2010-7 Class 3A4
12/25/35 | | | 7.954 | % | | | 2,185,000 | | | | 2,156,631 | | |
Credit Suisse Mortgage Capital Certificates(b)(e)(k)
CMO Series 2010-17R Class 1A2 | |
| 06/26/36 | | | 2.616 | % | | | 2,390,000 | | | | 1,667,779 | | |
Series 2011-4R Class 4A7
08/27/37 | | | 4.000 | % | | | 7,232,738 | | | | 6,670,856 | | |
Deutsche Mortgage Securities, Inc.
CMO Series 2003-1 Class 1A7(k) | |
| 04/25/33 | | | 5.500 | % | | | 4,014,683 | | | | 4,069,428 | | |
JP Morgan Reremic
CMO Series 2010-5 Class 1A6(b)(e)(k) | |
| 04/26/37 | | | 4.500 | % | | | 1,112,000 | | | | 1,023,040 | | |
RBSSP Resecuritization Trust
CMO Series 2010-12 Class 3A4(b)(e)(k) | |
| 06/27/32 | | | 4.000 | % | | | 3,433,066 | | | | 3,466,074 | | |
Total Residential Mortgage-Backed Securities—Non-Agency
(Cost: $36,984,169) | | $ | 36,668,919 | | |
| Commercial Mortgage-Backed Securities 3.0% | |
Bear Stearns Commercial Mortgage Securities(e)(k)
Series 2005-T18 Class A4 | |
| 02/13/42 | | | 4.933 | % | | $ | 4,845,000 | | | $ | 5,238,364 | | |
Bear Stearns Commercial Mortgage Securities(k)
Series 2006-PW14 Class A4 | |
| 12/11/38 | | | 5.201 | % | | | 5,000,000 | | | | 5,419,576 | | |
The Accompanying Notes to Financial Statements are an integral part of this statement.
14
Columbia Strategic Income Fund
May 31, 2011
(Percentages represent value of investments compared to net assets)
| Issuer | | Coupon
Rate | | Principal
Amount | | Value | |
| Commercial Mortgage-Backed Securities (continued) | |
GS Mortgage Securities Corp. II(e)(k)
Series 2006-GG6 Class A4 | |
| 04/10/38 | | | 5.553 | % | | $ | 4,898,000 | | | $ | 5,339,090 | | |
GS Mortgage Securities Corp. II(k)
Series 2005-GG4 Class A4A | |
| 07/10/39 | | | 4.751 | % | | | 4,825,000 | | | | 5,192,558 | | |
Greenwich Capital Commercial Funding Corp.(e)(k)
Series 2004-GG1 Class A7 | |
| 06/10/36 | | | 5.317 | % | | | 1,395,000 | | | | 1,508,047 | | |
Greenwich Capital Commercial Funding Corp.(k)
Series 2007-GG9 Class A4 | |
| 03/10/39 | | | 5.444 | % | | | 4,800,000 | | | | 5,198,602 | | |
JP Morgan Chase Commercial Mortgage Securities Corp.
Series 2007-CB18 Class A4(k) | |
| 06/12/47 | | | 5.440 | % | | | 4,000,000 | | | | 4,350,965 | | |
Morgan Stanley Capital I(e)(k)
Series 2006-T23 Class AAB | |
| 08/12/41 | | | 5.790 | % | | | 3,575,000 | | | | 3,850,088 | | |
Morgan Stanley Capital I(k)
Series 2005-HQ6 Class A4A | |
| 08/13/42 | | | 4.989 | % | | | 4,825,000 | | | | 5,233,037 | | |
Morgan Stanley Reremic Trust
Series 2010-GG10 Class A4A(b)(e)(k) | |
| 08/15/45 | | | 5.992 | % | | | 8,200,000 | | | | 9,040,941 | | |
Wachovia Bank Commercial Mortgage Trust
Series 2005-C21 Class A4(e)(k) | |
| 10/15/44 | | | 5.203 | % | | | 4,825,000 | | | | 5,294,633 | | |
Total Commercial Mortgage-Backed Securities
(Cost: $50,453,993) | | $ | 55,665,901 | | |
| Asset-Backed Securities 0.1% | |
GMAC Mortgage Corp Loan Trust
Series 2004-HE5 Class A5 (FGIC)(e) | |
| 09/25/34 | | | 4.865 | % | | $ | 2,298,155 | | | $ | 1,744,497 | | |
Total Asset-Backed Securities
(Cost: $2,298,155) | | $ | 1,744,497 | | |
| Inflation-Indexed Bonds 1.5% | |
| U.S. Treasury Inflation-Indexed Bond | |
| 02/15/41 | | | 2.125 | % | | $ | 22,616,060 | | | $ | 24,316,362 | | |
| 04/15/14 | | | 1.250 | % | | | 4,364,865 | | | | 4,660,269 | | |
Total Inflation-Indexed Bonds
(Cost: $28,364,981) | | $ | 28,976,631 | | |
| U.S. Treasury Obligations 2.9% | |
| U.S. Treasury | |
| 02/15/41 | | | 4.750 | % | | $ | 9,761,000 | | | $ | 10,656,269 | | |
| 04/30/16 | | | 2.000 | % | | | 24,416,000 | | | | 24,818,376 | | |
| 05/15/21 | | | 3.125 | % | | | 11,578,000 | | | | 11,652,215 | | |
| U.S. Treasury(c) | |
| 05/31/16 | | | 1.750 | % | | | 1,135,000 | | | | 1,138,371 | | |
| Issuer | | Coupon
Rate | | Principal
Amount | | Value | |
| U.S. Treasury Obligations (continued) | |
U.S. Treasury(f)
STRIPS | |
| 05/15/23 | | | 0.000 | % | | $ | 4,550,000 | | | $ | 2,916,422 | | |
| 11/15/13 | | | 0.000 | % | | | 2,250,000 | | | | 2,216,653 | | |
Total U.S. Treasury Obligations
(Cost: $52,004,309) | | $ | 53,398,306 | | |
| Foreign Government Obligations(a) 27.0% | |
| ARGENTINA 1.0% | |
Argentina Bonos(d)
Senior Unsecured | |
| 10/03/15 | | | 7.000 | % | | $ | 1,940,000 | | | $ | 1,878,890 | | |
| 04/17/17 | | | 7.000 | % | | | 2,660,000 | | | | 2,425,920 | | |
Argentine Republic Government International Bond
Senior Unsecured(d) | |
| 12/31/33 | | | 8.280 | % | | | 10,277,514 | | | | 9,018,519 | | |
Provincia de Buenos Aires
Senior Unsecured(b)(d) | |
| 01/26/21 | | | 10.875 | % | | | 2,115,000 | | | | 1,978,772 | | |
Provincia de Cordoba
Senior Unsecured(b)(d) | |
| 08/17/17 | | | 12.375 | % | | | 3,630,000 | | | | 3,793,350 | | |
| Total | | | 19,095,451 | | |
| AUSTRALIA 0.5% | |
Treasury Corp. of Victoria(d)
Local Government Guaranteed | |
| 11/15/16 | | | 5.750 | % | | AUD | 4,600,000 | | | | 4,995,294 | | |
| 06/15/20 | | | 6.000 | % | | AUD | 4,580,000 | | | | 5,010,009 | | |
| Total | | | 10,005,303 | | |
| BRAZIL 2.1% | |
| Banco Nacional de Desenvolvimento Economico e Social(b)(d) | |
| 07/12/20 | | | 5.500 | % | | | 850,000 | | | | 878,305 | | |
| Federative Republic of Brazil(d) | |
| 01/20/34 | | | 8.250 | % | | | 6,960,000 | | | | 9,455,160 | | |
| 08/17/40 | | | 11.000 | % | | | 4,700,000 | | | | 6,417,850 | | |
Senior Unsecured
02/03/15 | | | 7.375 | % | | EUR | 3,350,000 | | | | 5,445,783 | | |
| 01/05/22 | | | 12.500 | % | | BRL | 10,275,000 | | | | 8,010,299 | | |
| Petrobras International Finance Co.(d) | |
| 03/15/19 | | | 7.875 | % | | | 6,980,000 | | | | 8,386,749 | | |
| Total | | | 38,594,146 | | |
| CANADA 1.1% | |
| Canadian Government Bond(d) | |
| 06/01/19 | | | 3.750 | % | | CAD | 14,000,000 | | | | 15,369,871 | | |
| 06/01/23 | | | 8.000 | % | | CAD | 3,380,000 | | | | 5,165,747 | | |
| Total | | | 20,535,618 | | |
| COLOMBIA 0.7% | |
Colombia Government International Bond
Senior Unsecured(d) | |
| 05/21/24 | | | 8.125 | % | | | 2,590,000 | | | | 3,418,800 | | |
Ecopetrol SA
Senior Unsecured(d) | |
| 07/23/19 | | | 7.625 | % | | | 4,000,000 | | | | 4,745,000 | | |
The Accompanying Notes to Financial Statements are an integral part of this statement.
15
Columbia Strategic Income Fund
May 31, 2011
(Percentages represent value of investments compared to net assets)
| Issuer | | Coupon
Rate | | Principal
Amount | | Value | |
| Foreign Government Obligations(a) (continued) | |
| COLOMBIA (cont.) | |
Empresas Publicas de Medellin ESP
Senior Unsecured(b)(d) | |
| 02/01/21 | | | 8.375 | % | | COP | 8,400,000,000 | | | $ | 4,845,831 | | |
| Total | | | 13,009,631 | | |
| CROATIA 0.1% | |
Croatia Government International Bond
Senior Unsecured(b)(d) | |
| 07/14/20 | | | 6.625 | % | | $ | 1,395,000 | | | | 1,473,120 | | |
| DOMINICAN REPUBLIC 0.2% | |
Dominican Republic International Bond(b)(d)
Senior Unsecured | |
| 05/06/21 | | | 7.500 | % | | | 725,000 | | | | 766,695 | | |
| 04/20/27 | | | 8.625 | % | | | 2,100,000 | | | | 2,310,000 | | |
| Total | | | 3,076,695 | | |
| EL SALVADOR 0.1% | |
| El Salvador Government International Bond(b)(d) | |
| 02/01/41 | | | 7.625 | % | | | 1,500,000 | | | | 1,530,000 | | |
| FINLAND 0.2% | |
Finland Government Bond
Senior Unsecured(d) | |
| 07/04/15 | | | 4.250 | % | | EUR | 2,720,000 | | | | 4,201,586 | | |
| FRANCE 1.2% | |
| France Government Bond OAT(d) | |
| 04/25/13 | | | 4.000 | % | | EUR | 7,845,000 | | | | 11,771,807 | | |
| 04/25/29 | | | 5.500 | % | | EUR | 5,920,000 | | | | 10,268,090 | | |
| Total | | | 22,039,897 | | |
| GERMANY 1.3% | |
| Bundesrepublik Deutschland(d) | |
| 06/20/16 | | | 6.000 | % | | EUR | 12,600,000 | | | | 21,222,458 | | |
| 07/04/17 | | | 4.250 | % | | EUR | 1,850,000 | | | | 2,919,249 | | |
| Total | | | 24,141,707 | | |
| INDONESIA 2.1% | |
Indonesia Government International Bond(b)(d)
Senior Unsecured | |
| 05/04/14 | | | 10.375 | % | | | 6,180,000 | | | | 7,555,050 | | |
| 04/20/15 | | | 7.250 | % | | | 3,000,000 | | | | 3,450,000 | | |
| 03/13/20 | | | 5.875 | % | | | 11,125,000 | | | | 12,070,625 | | |
Indonesia Treasury Bond(d)
Senior Unsecured | |
| 09/15/19 | | | 11.500 | % | | IDR | 20,600,000,000 | | | | 3,017,635 | | |
| 09/15/25 | | | 11.000 | % | | IDR | 89,650,000,000 | | | | 12,881,021 | | |
| Total | | | 38,974,331 | | |
| IRELAND 0.1% | |
Ireland Government Bond
Senior Unsubordinated Notes(d) | |
| 10/18/18 | | | 4.500 | % | | EUR | 1,755,000 | | | | 1,698,555 | | |
| ITALY 0.8% | |
| Italy Buoni Poliennali Del Tesoro(d) | |
| 08/01/18 | | | 4.500 | % | | EUR | 10,395,000 | | | | 15,088,689 | | |
| Issuer | | Coupon
Rate | | Principal
Amount | | Value | |
| Foreign Government Obligations(a) (continued) | |
| JAPAN 0.2% | |
Japan Government 10-Year Bond
Senior Unsecured(d) | |
| 09/20/18 | | | 1.500 | % | | JPY | 330,000,000 | | | $ | 4,257,842 | | |
| KAZAKHSTAN 0.5% | |
KazMunayGas National Co.(b)(d)
Senior Unsecured | |
| 07/02/18 | | | 9.125 | % | | $ | 4,930,000 | | | | 6,094,959 | | |
| 04/09/21 | | | 6.375 | % | | | 2,300,000 | | | | 2,452,490 | | |
| Total | | | 8,547,449 | | |
| LITHUANIA 0.1% | |
Lithuania Government International Bond
Senior Unsecured(b)(d) | |
| 09/14/17 | | | 5.125 | % | | | 1,850,000 | | | | 1,918,638 | | |
| MEXICO 2.7% | |
| Mexican Bonos(d) | |
| 12/20/12 | | | 9.000 | % | | MXN | 4,000,000 | | | | 3,662,225 | | |
| 12/13/18 | | | 8.500 | % | | MXN | 5,586,000 | | | | 5,383,013 | | |
Mexico Government International Bond(d)
Senior Unsecured | |
| 09/15/16 | | | 11.375 | % | | | 5,690,000 | | | | 8,108,250 | | |
| 01/15/20 | | | 5.125 | % | | | 5,435,000 | | | | 5,842,625 | | |
| 01/11/40 | | | 6.050 | % | | | 3,350,000 | | | | 3,556,025 | | |
Pemex Finance Ltd.(d)
Senior Unsecured | |
| 11/15/18 | | | 9.150 | % | | | 2,485,000 | | | | 2,860,519 | | |
Senior Unsecured (MBIA)
08/15/17 | | | 10.610 | % | | | 1,650,000 | | | | 2,130,728 | | |
| Pemex Project Funding Master Trust(b)(c)(d) | |
| 06/02/41 | | | 6.500 | % | | | 2,000,000 | | | | 2,011,598 | | |
| Pemex Project Funding Master Trust(d) | |
| 03/01/18 | | | 5.750 | % | | | 10,370,000 | | | | 11,260,430 | | |
| 01/21/21 | | | 5.500 | % | | | 5,000,000 | | | | 5,198,260 | | |
| Total | | | 50,013,673 | | |
| NEW ZEALAND 0.3% | |
New Zealand Government Bond
Senior Unsecured(d) | |
| 05/15/21 | | | 6.000 | % | | NZD | 6,150,000 | | | | 5,399,931 | | |
| NORWAY 0.9% | |
| Norway Government Bond(d) | |
| 05/19/17 | | | 4.250 | % | | NOK | 87,185,000 | | | | 17,349,955 | | |
| PANAMA 0.3% | |
Panama Government International Bond
Senior Unsecured(d) | |
| 01/26/36 | | | 6.700 | % | | | 4,400,000 | | | | 5,137,000 | | |
| PERU 0.5% | |
Peruvian Government International Bond(b)(d)
Senior Unsecured | |
| 08/12/20 | | | 7.840 | % | | PEN | 3,100,000 | | | | 1,211,501 | | |
Peruvian Government International Bond(d)
Senior Unsecured | |
| 11/21/33 | | | 8.750 | % | | | 6,417,000 | | | | 8,717,494 | | |
| Total | | | 9,928,995 | | |
The Accompanying Notes to Financial Statements are an integral part of this statement.
16
Columbia Strategic Income Fund
May 31, 2011
(Percentages represent value of investments compared to net assets)
| Issuer | | Coupon
Rate | | Principal
Amount | | Value | |
| Foreign Government Obligations(a) (continued) | |
| PHILIPPINES 0.9% | |
Philippine Government International Bond(d)
Senior Unsecured | |
| 01/15/21 | | | 4.000 | % | | $ | 9,354,000 | | | $ | 9,038,770 | | |
| 03/30/26 | | | 5.500 | % | | | 3,245,000 | | | | 3,269,338 | | |
| 01/14/36 | | | 6.250 | % | | PHP | 94,000,000 | | | | 2,102,288 | | |
Power Sector Assets & Liabilities Management Corp.(b)(d)
Government Guaranteed | |
| 05/27/19 | | | 7.250 | % | | | 1,500,000 | | | | 1,747,500 | | |
| 12/02/24 | | | 7.390 | % | | | 1,390,000 | | | | 1,613,869 | | |
| Total | | | 17,771,765 | | |
| POLAND 0.8% | |
| Poland Government Bond(d) | |
| 10/24/15 | | | 6.250 | % | | PLN | 29,480,000 | | | | 11,042,063 | | |
| 10/25/19 | | | 5.500 | % | | PLN | 8,700,000 | | | | 3,069,918 | | |
Poland Government International Bond
Senior Unsecured(d) | |
| 07/15/19 | | | 6.375 | % | | | 1,470,000 | | | | 1,675,534 | | |
| Total | | | 15,787,515 | | |
| QATAR 0.2% | |
Nakilat, Inc.
Senior Secured(b)(d) | |
| 12/31/33 | | | 6.067 | % | | | 3,260,000 | | | | 3,308,900 | | |
| RUSSIAN FEDERATION 2.5% | |
Gazprom OAO Via Gaz Capital SA(b)(d)
Senior Unsecured | |
| 04/11/18 | | | 8.146 | % | | | 4,085,000 | | | | 4,871,363 | | |
| 03/07/22 | | | 6.510 | % | | | 4,235,000 | | | | 4,547,543 | | |
Russian Foreign Bond—Eurobond(b)(d)
Senior Unsecured | |
| 04/29/15 | | | 3.625 | % | | | 5,150,000 | | | | 5,238,580 | | |
Russian Foreign Bond—Eurobond(b)(d)(e)
Senior Unsecured | |
| 03/31/30 | | | 7.500 | % | | | 23,536,650 | | | | 27,729,233 | | |
Vnesheconombank Via VEB Finance Ltd.
Bank Guaranteed(b)(d) | |
| 11/22/25 | | | 6.800 | % | | | 4,400,000 | | | | 4,581,334 | | |
| Total | | | 46,968,053 | | |
| SOUTH AFRICA 0.4% | |
| South Africa Government Bond(d) | |
| 09/15/17 | | | 8.250 | % | | ZAR | 37,000,000 | | | | 5,483,977 | | |
South Africa Government International Bond
Senior Unsecured(d) | |
| 03/08/41 | | | 6.250 | % | | | 1,100,000 | | | | 1,189,100 | | |
| Total | | | 6,673,077 | | |
| SUPRA-NATIONAL 0.5% | |
European Investment Bank
Senior Unsecured(d) | |
| 12/07/11 | | | 5.500 | % | | GBP | 5,250,000 | | | | 8,858,016 | | |
| SWEDEN 1.0% | |
| Sweden Government Bond(d) | |
| 08/12/17 | | | 3.750 | % | | SEK | 107,000,000 | | | | 18,260,279 | | |
| Issuer | | Coupon
Rate | | Principal
Amount | | Value | |
| Foreign Government Obligations(a) (continued) | |
| TRINIDAD AND TOBAGO 0.1% | |
Petroleum Co. of Trinidad & Tobago Ltd.
Senior Unsecured(b)(d) | |
| 08/14/19 | | | 9.750 | % | | $ | 1,310,000 | | | $ | 1,591,937 | | |
| TURKEY 1.3% | |
| Turkey Government International Bond(d) | |
| 01/14/41 | | | 6.000 | % | | | 2,200,000 | | | | 2,150,500 | | |
Senior Unsecured
09/26/16 | | | 7.000 | % | | | 4,735,000 | | | | 5,427,494 | | |
| 03/30/21 | | | 5.625 | % | | | 6,450,000 | | | | 6,764,437 | | |
| 02/05/25 | | | 7.375 | % | | | 8,680,000 | | | | 10,253,250 | | |
| Total | | | 24,595,681 | | |
| UNITED KINGDOM 0.4% | |
| United Kingdom Gilt(d) | |
| 03/07/18 | | | 5.000 | % | | GBP | 1,900,000 | | | | 3,568,632 | | |
| 03/07/25 | | | 5.000 | % | | GBP | 2,510,000 | | | | 4,666,248 | | |
| Total | | | 8,234,880 | | |
| URUGUAY 0.6% | |
| Uruguay Government International Bond(d) | |
| 04/05/27 | | | 4.250 | % | | UYU | 57,922,489 | | | | 3,391,485 | | |
| 06/26/37 | | | 3.700 | % | | UYU | 61,029,324 | | | | 3,316,788 | | |
PIK
01/15/33 | | | 7.875 | % | | | 3,640,000 | | | | 4,531,800 | | |
| Total | | | 11,240,073 | | |
| VENEZUELA 1.3% | |
| Petroleos de Venezuela SA(b)(d) | |
| 11/02/17 | | | 8.500 | % | | | 6,800,000 | | | | 4,811,000 | | |
| Petroleos de Venezuela SA(d) | |
| 04/12/17 | | | 5.250 | % | | | 10,080,000 | | | | 6,048,000 | | |
Venezuela Government International Bond(b)(d)
Senior Unsecured | |
| 08/23/22 | | | 12.750 | % | | | 3,006,000 | | | | 2,585,160 | | |
| 05/07/23 | | | 9.000 | % | | | 14,654,000 | | | | 10,016,009 | | |
| Total | | | 23,460,169 | | |
Total Foreign Government Obligations
(Cost: $456,798,076) | | $ | 502,768,557 | | |
Issue
Description | | Coupon
Rate | | Principal
Amount | | Value | |
| Municipal Bonds 1.1% | |
Cabazon Band Mission Indians
Revenue Bonds
Series 2004(g)(l) | |
| 10/01/11 | | | 7.358 | % | | $ | 2,820,000 | | | $ | 1,628,550 | | |
California Educational Facilities Authority
Revenue Bonds
University of Southern California
Series 2009B | |
| 10/01/38 | | | 5.000 | % | | | 2,940,000 | | | | 3,017,851 | | |
Los Angeles Unified School District
Unlimited General Obligation Bonds
Build America Bonds
Series 2009 | |
| 07/01/34 | | | 5.750 | % | | | 625,000 | | | | 642,356 | | |
The Accompanying Notes to Financial Statements are an integral part of this statement.
17
Columbia Strategic Income Fund
May 31, 2011
(Percentages represent value of investments compared to net assets)
Issue
Description | | Coupon
Rate | | Principal
Amount | | Value | |
| Municipal Bonds (continued) | |
Missouri State Health & Educational Facilities Authority
Revenue Bonds
Washington University (The)
Series 2007A(e) | |
| 01/15/37 | | | 0.070 | % | | $ | 2,945,000 | | | $ | 3,036,472 | | |
New York City Transitional Finance Authority
Subordinated Revenue Bonds
Future Tax Secured
Series 2011C | |
| 11/01/39 | | | 5.000 | % | | | 2,945,000 | | | | 3,034,086 | | |
State of California
Unlimited General Obligation Bonds
Taxable Build America Bonds
Series 2009 | |
| 04/01/39 | | | 7.550 | % | | | 1,465,000 | | | | 1,727,689 | | |
State of Illinois
Unlimited General Obligation Taxable Bonds
Series 2011 | |
| 03/01/19 | | | 5.877 | % | | | 4,930,000 | | | | 5,181,923 | | |
State of Texas
Unlimited General Obligation Bonds
Transportation Commission Mobility Fund
Series 2007 | |
| 04/01/37 | | | 5.000 | % | | | 2,940,000 | | | | 3,016,029 | | |
Total Municipal Bonds
(Cost: $21,321,962) | | $ | 21,284,956 | | |
| Borrower | | Weighted*
Average
Coupon | | Principal
Amount | | Value | |
| Senior Loans 4.7% | |
| Aerospace & Defense —% | |
Huntington Ingalls Industries, Inc.
Term Loan(e)(m) | |
| 03/30/16 | | | 2.755 | % | | $ | 200,000 | | | $ | 199,500 | | |
TASC, Inc.
Tranche B Term Loan(e)(m) | |
| 12/18/15 | | | 4.500 | % | | | 99,823 | | | | 100,056 | | |
TransDigm, Inc.
1st Lien Term Loan(e)(m) | |
| 02/14/17 | | | 4.000 | % | | | 399,000 | | | | 400,249 | | |
| Total | | | 699,805 | | |
| Airlines 0.1% | |
Delta Air Lines, Inc.
Term Loan(e)(m) | |
| 04/20/17 | | | 5.500 | % | | | 550,000 | | | | 543,356 | | |
U.S. Airways Group, Inc.
Term Loan(e)(m) | |
| 03/21/14 | | | 2.694 | % | | | 912,153 | | | | 837,703 | | |
United Air Lines, Inc.
Tranche B Term Loan(e)(m) | |
| 02/01/14 | | | 2.268 | % | | | 570,816 | | | | 551,043 | | |
| Total | | | 1,932,102 | | |
| Borrower | | Weighted*
Average
Coupon | | Principal
Amount | | Value | |
| Senior Loans (continued) | |
| Automotive 0.2% | |
Allison Transmission, Inc.
Term Loan(e)(m) | |
| 08/07/14 | | | 2.960 | % | | $ | 598,268 | | | $ | 593,781 | | |
Autotrader.com, Inc.
Tranche B Term Loan(e)(m) | |
| 12/15/16 | | | 4.750 | % | | | 349,125 | | | | 349,670 | | |
Chrysler Group LLC
Tranche B Term Loan(e)(m) | |
| 05/24/17 | | | 6.000 | % | | | 350,000 | | | | 348,009 | | |
Ford Motor Co.
Tranche B1 Term Loan(e)(m) | |
| 12/15/13 | | | 2.950 | % | | | 636,777 | | | | 636,707 | | |
Goodyear Tire & Rubber Co. (The)
2nd Lien Term Loan(e)(m) | |
| 04/30/14 | | | 1.940 | % | | | 1,000,000 | | | | 972,500 | | |
UCI International, Inc.
Term Loan(e)(m) | |
| 07/26/17 | | | 5.500 | % | | | 473,813 | | | | 475,736 | | |
| Total | | | 3,376,403 | | |
| Building Materials 0.1% | |
Armstrong World Industries, Inc.
Tranche B1 Term Loan(e)(m) | |
| 03/10/18 | | | 4.000 | % | | | 325,000 | | | | 325,731 | | |
CPG International I, Inc.
Term Loan(e)(m) | |
| 02/18/17 | | | 6.000 | % | | | 648,375 | | | | 649,594 | | |
Potters Holdings II LP(e)(m)
1st Lien Tranche B Term Loan | |
| 05/06/17 | | | 6.000 | % | | | 500,000 | | | | 501,875 | | |
2nd Lien Tranche B Term Loan
11/06/17 | | | 10.250 | % | | | 125,000 | | | | 126,875 | | |
| Total | | | 1,604,075 | | |
| Chemicals 0.3% | |
Celanese U.S. Holdings LLC
Term Loan(e)(m) | |
| 04/02/14 | | | 1.711 | % | | | 925,000 | | | | 921,531 | | |
Houghton International, Inc.
Tranche B1 Term Loan(e)(m) | |
| 01/29/16 | | | 6.750 | % | | | 256,521 | | | | 257,911 | | |
ISP Chemco LLC
Term Loan(e)(m) | |
| 06/04/14 | | | 1.750 | % | | | 324,158 | | | | 319,134 | | |
Momentive Specialty Chemicals, Inc.
Tranche C4A Term Loan(e)(m) | |
| 05/05/13 | | | 2.562 | % | | | 816,460 | | | | 810,851 | | |
Omnova Solutions, Inc.
Term Loan(e)(m)(n) | |
| 05/31/17 | | | 4.309 | % | | | 648,371 | | | | 654,855 | | |
PQ Corp.
1st Lien Term Loan(e)(m) | |
| 07/30/14 | | | 3.513 | % | | | 579,555 | | | | 565,727 | | |
Rockwood Specialties Group, Inc.
Term Loan(e)(m) | |
| 02/10/18 | | | 4.116 | % | | | 400,000 | | | | 402,272 | | |
The Accompanying Notes to Financial Statements are an integral part of this statement.
18
Columbia Strategic Income Fund
May 31, 2011
(Percentages represent value of investments compared to net assets)
| Borrower | | Weighted*
Average
Coupon | | Principal
Amount | | Value | |
| Senior Loans (continued) | |
| Chemicals (cont.) | |
Solutia, Inc.
Tranche 1 Term Loan(e)(m) | |
| 08/01/17 | | | 3.500 | % | | $ | 567,813 | | | $ | 569,550 | | |
Styron S.A.R.L.
Term Loan(d)(e)(m) | |
| 06/17/16 | | | 6.000 | % | | | 448,875 | | | | 450,931 | | |
Univar, Inc.
Tranche B Term Loan(e)(m) | |
| 06/30/17 | | | 5.000 | % | | | 972,563 | | | | 972,125 | | |
| Total | | | 5,924,887 | | |
| Construction Machinery 0.1% | |
Douglas Dynamics LLC
Term Loan(e)(m) | |
| 04/18/18 | | | 5.750 | % | | | 725,000 | | | | 723,789 | | |
NACCO Materials Handling Group, Inc.
Term Loan(e)(m)(n) | |
| 03/21/13 | | | 2.308 | % | | | 300,000 | | | | 296,250 | | |
| Total | | | 1,020,039 | | |
| Consumer Cyclical Services 0.1% | |
Instant Web, Inc.(e)(m)
Delayed Draw Term Loan | |
| 07/27/11 | | | 3.568 | % | | | 25,893 | | | | 23,142 | | |
Term Loan
07/27/11 | | | 3.568 | % | | | 248,396 | | | | 222,004 | | |
KAR Auction Services, Inc.
Term Loan(e)(m) | |
| 05/19/17 | | | 5.000 | % | | | 125,000 | | | | 125,704 | | |
Live Nation Entertainment, Inc.
Tranche B Term Loan(e)(m) | |
| 11/06/16 | | | 4.500 | % | | | 522,362 | | | | 523,177 | | |
Sabre, Inc.
Term Loan(e)(m) | |
| 09/30/14 | | | 2.214 | % | | | 643,247 | | | | 577,558 | | |
ServiceMaster Co. (The)(e)(m)
Delayed Draw Term Loan | |
| 07/24/14 | | | 2.700 | % | | | 58,715 | | | | 57,247 | | |
Term Loan
07/24/14 | | | 2.724 | % | | | 589,601 | | | | 574,861 | | |
| Total | | | 2,103,693 | | |
| Consumer Products 0.2% | |
Affinion Group, Inc.
Tranche B Term Loan(e)(m) | |
| 10/09/16 | | | 5.000 | % | | | 248,745 | | | | 248,568 | | |
Amscan Holdings, Inc.
Term Loan(e)(m) | |
| 12/02/17 | | | 6.750 | % | | | 921,061 | | | | 923,944 | | |
Jarden Corp.
Tranche B Term Loan(e)(m) | |
| 01/31/17 | | | 5.250 | % | | | 225,000 | | | | 226,012 | | |
NBTY, Inc.
Tranche B1 Term Loan(e)(m) | |
| 10/01/17 | | | 4.250 | % | | | 922,687 | | | | 921,645 | | |
Simmons Holdco, Inc.
Term Loan(e)(g)(i)(m)(o) | |
| 02/15/12 | | | 6.732 | % | | | 2,601,458 | | | | 6,504 | | |
| Borrower | | Weighted*
Average
Coupon | | Principal
Amount | | Value | |
| Senior Loans (continued) | |
| Consumer Products (cont.) | |
Visant Corp.
Tranche B Term Loan(e)(m) | |
| 12/22/16 | | | 5.250 | % | | $ | 924,250 | | | $ | 923,677 | | |
| Total | | | 3,250,350 | | |
| Diversified Manufacturing 0.1% | |
Acosta, Inc.
Tranche B Term Loan(e)(m) | |
| 03/01/18 | | | 4.750 | % | | | 625,000 | | | | 625,781 | | |
Generac Acquisition Corp.
1st Lien Term Loan(e)(m)(n) | |
| 11/10/13 | | | 2.792 | % | | | 650,000 | | | | 646,516 | | |
Tomkins LLC/Inc.
Tranche B1 Term Loan(d)(e)(m) | |
| 09/29/16 | | | 4.250 | % | | | 723,188 | | | | 724,547 | | |
| Total | | | 1,996,844 | | |
| Electric 0.2% | |
Calpine Corp.
Term Loan(e)(m) | |
| 04/01/18 | | | 4.500 | % | | | 150,000 | | | | 150,265 | | |
Covanta Energy Corp.(e)(m)
Letter of Credit | |
| 02/10/14 | | | 1.703 | % | | | 76,140 | | | | 75,284 | | |
Term Loan
02/10/14 | | | 1.813 | % | | | 148,473 | | | | 146,803 | | |
Dynegy Holdings, Inc.(e)(m)
Letter of Credit | |
| 03/27/13 | | | 4.030 | % | | | 602,032 | | | | 595,572 | | |
Tranche B Term Loan
03/27/13 | | | 4.030 | % | | | 47,844 | | | | 47,330 | | |
NRG Energy, Inc.(e)(m)
Credit Linked Deposit | |
| 02/01/13 | | | 2.057 | % | | | 257,031 | | | | 256,324 | | |
Term Loan
02/01/13 | | | 2.057 | % | | | 281,184 | | | | 280,411 | | |
TPF Generation Holdings LLC(e)(m)
1st Lien Synthetic Letter of Credit | |
| 12/15/13 | | | 2.307 | % | | | 270,268 | | | | 267,622 | | |
1st Lien Term Loan
12/15/13 | | | 2.307 | % | | | 492,193 | | | | 487,375 | | |
| Synthetic Revolving Term Loan | |
| 12/15/11 | | | 2.307 | % | | | 84,723 | | | | 83,894 | | |
Texas Competitive Electric Holdings Co. LLC
Term Loan(e)(m) | |
| 10/10/14 | | | 3.706 | % | | | 1,345,945 | | | | 1,144,053 | | |
| Total | | | 3,534,933 | | |
| Entertainment 0.1% | |
AMC Entertainment, Inc.
Tranche B2 Term Loan(e)(m) | |
| 12/15/16 | | | 3.442 | % | | | 573,487 | | | | 570,723 | | |
Cedar Fair LP
Tranche 1 Term Loan(e)(m) | |
| 12/15/17 | | | 4.000 | % | | | 324,187 | | | | 325,504 | | |
Regal Cinemas Corp.
Term Loan(e)(m) | |
| 08/23/17 | | | 3.557 | % | | | 299,250 | | | | 298,813 | | |
The Accompanying Notes to Financial Statements are an integral part of this statement.
19
Columbia Strategic Income Fund
May 31, 2011
(Percentages represent value of investments compared to net assets)
| Borrower | | Weighted*
Average
Coupon | | Principal
Amount | | Value | |
| Senior Loans (continued) | |
| Entertainment (cont.) | |
Six Flags Theme Parks, Inc.
Tranche B Term Loan(e)(m) | |
| 06/30/16 | | | 5.250 | % | | $ | 325,000 | | | $ | 327,031 | | |
| Total | | | 1,522,071 | | |
| Environmental —% | |
EnviroSolutions Real Property Holdings, Inc.
2nd Lien Term Loan(e)(m) | |
| 07/29/14 | | | 8.000 | % | | | 831,000 | | | | 833,078 | | |
| Food and Beverage 0.4% | |
Advantage Sales & Marketing, Inc.
1st Lien Term Loan(e)(m) | |
| 12/17/17 | | | 5.250 | % | | | 174,562 | | | | 174,926 | | |
Aramark Corp.(e)(m)
2nd Letter of Credit | |
| 07/26/16 | | | 3.448 | % | | | 35,481 | | | | 35,426 | | |
Tranche B Term Loan
07/26/16 | | | 3.557 | % | | | 539,519 | | | | 538,677 | | |
Dean Foods Co.
Tranche B Term Loan(e)(m) | |
| 04/02/16 | | | 3.560 | % | | | 972,550 | | | | 959,353 | | |
Del Monte Foods Co.
Term Loan(e)(m) | |
| 03/08/18 | | | 4.500 | % | | | 300,000 | | | | 299,838 | | |
Dole Food Co., Inc.
Tranche B1 Term Loan(e)(m) | |
| 03/02/17 | | | 5.049 | % | | | 252,614 | | | | 253,639 | | |
Earthbound Holdings III LLC
Term Loan(e)(m) | |
| 12/21/16 | | | 5.500 | % | | | 847,875 | | | | 851,055 | | |
Green Mountain Coffee Roasters, Inc.
Tranche B Term Loan(e)(m) | |
| 12/16/16 | | | 5.500 | % | | | 234,739 | | | | 234,933 | | |
JBS U.S.A. LLC
Tranche B Term Loan(d)(e)(m)(n) | |
| 05/25/18 | | | 4.250 | % | | | 150,000 | | | | 149,907 | | |
Pierre Foods, Inc.
1st Lien Term Loan(e)(m) | |
| 09/30/16 | | | 7.000 | % | | | 722,061 | | | | 730,184 | | |
Solvest Ltd.
Tranche C1 Term Loan(e)(m) | |
| 03/02/17 | | | 5.085 | % | | | 627,429 | | | | 629,976 | | |
U.S. Foodservice, Inc.
Term Loan(e)(m) | |
| 07/03/14 | | | 2.700 | % | | | 748,057 | | | | 707,146 | | |
WM. Bolthouse Farms, Inc.
1st Lien Term Loan(e)(m) | |
| 02/11/16 | | | 5.502 | % | | | 569,189 | | | | 572,747 | | |
Windsor Quality Food Co., Ltd.
Tranche B Term Loan(e)(m) | |
| 02/16/17 | | | 5.000 | % | | | 729,000 | | | | 729,000 | | |
| Total | | | 6,866,807 | | |
| Gaming 0.2% | |
Ameristar Casinos, Inc.
Tranche B Term Loan(e)(m) | |
| 09/16/11 | | | 4.000 | % | | | 225,000 | | | | 225,644 | | |
| Borrower | | Weighted*
Average
Coupon | | Principal
Amount | | Value | |
| Senior Loans (continued) | |
| Gaming (cont.) | |
Caesars Entertainment Operating Co., Inc.
Tranche B2 Term Loan(e)(m) | |
| 01/28/15 | | | 3.274 | % | | $ | 800,000 | | | $ | 741,712 | | |
Caesars Octavius LLC
Tranche B Term Loan(e)(m) | |
| 04/25/17 | | | 9.250 | % | | | 600,000 | | | | 604,500 | | |
Isle of Capri Casinos, Inc.
Term Loan(e)(m) | |
| 11/01/13 | | | 4.750 | % | | | 249,375 | | | | 250,088 | | |
Las Vegas Sands LLC(e)(m)
Tranche B Term Loan | |
| 05/23/14 | | | 2.000 | % | | | 434,532 | | | | 426,845 | | |
| 11/23/16 | | | 3.000 | % | | | 221,527 | | | | 217,650 | | |
Tranche I Delayed Draw Term Loan
05/23/14 | | | 2.000 | % | | | 89,146 | | | | 87,569 | | |
| 11/23/16 | | | 3.000 | % | | | 27,845 | | | | 27,358 | | |
Penn National Gaming, Inc.
Tranche B Term Loan(e)(m) | |
| 10/03/12 | | | 1.980 | % | | | 700,000 | | | | 698,439 | | |
Twin River Worldwide Holdings, Inc.
Term Loan(e)(m) | |
| 11/05/15 | | | 8.500 | % | | | 288,889 | | | | 289,371 | | |
| Total | | | 3,569,176 | | |
| Health Care 0.4% | |
Alere, Inc.
1st Lien Term Loan(e)(m) | |
| 06/26/14 | | | 2.200 | % | | | 648,316 | | | | 639,240 | | |
Community Health Systems, Inc.(e)(m)
Delayed Draw Term Loan | |
| 07/25/14 | | | 2.504 | % | | | 87,708 | | | | 84,738 | | |
Term Loan
07/25/14 | | | 2.504 | % | | | 1,707,241 | | | | 1,649,434 | | |
ConvaTec, Inc.
Term Loan(e)(m) | |
| 12/22/16 | | | 5.750 | % | | | 673,313 | | | | 674,013 | | |
DaVita, Inc.
Tranche B Term Loan(e)(m) | |
| 10/20/18 | | | 4.500 | % | | | 573,563 | | | | 577,147 | | |
Emdeon Business Services LLC
2nd Lien Term Loan(e)(m) | |
| 05/16/14 | | | 5.200 | % | | | 575,000 | | | | 573,562 | | |
HCA, Inc.
Tranche A1 Term Loan(e)(m) | |
| 11/16/12 | | | 1.557 | % | | | 850,000 | | | | 845,393 | | |
Health Management Associates, Inc.
Tranche B Term Loan(e)(m) | |
| 02/28/14 | | | 2.057 | % | | | 428,945 | | | | 418,706 | | |
Inventiv Health, Inc.(e)(m)
Tranche B1 Term Loan | |
| 08/04/16 | | | 4.750 | % | | | 182,820 | | | | 182,743 | | |
Tranche B2 Term Loan
08/04/16 | | | 4.750 | % | | | 366,555 | | | | 366,402 | | |
MedAssets, Inc.
Term Loan(e)(m) | |
| 11/16/16 | | | 5.250 | % | | | 694,644 | | | | 697,687 | | |
The Accompanying Notes to Financial Statements are an integral part of this statement.
20
Columbia Strategic Income Fund
May 31, 2011
(Percentages represent value of investments compared to net assets)
| Borrower | | Weighted*
Average
Coupon | | Principal
Amount | | Value | |
| Senior Loans (continued) | |
| Health Care (cont.) | |
Onex Carestream Finance LP
Term Loan(e)(m) | |
| 02/25/17 | | | 5.000 | % | | $ | 700,000 | | | $ | 665,511 | | |
Quintiles Transnational Corp.
Tranche B Term Loan(e)(m)(n) | |
| 06/08/18 | | | 5.000 | % | | | 825,000 | | | | 819,588 | | |
Res-Care, Inc.
Tranche B Term Loan(e)(m) | |
| 12/22/16 | | | 7.250 | % | | | 224,437 | | | | 224,437 | | |
Select Medical Corp.
Tranche B Term Loan(e)(m)(n) | |
| 06/01/18 | | | 5.500 | % | | | 225,000 | | | | 222,750 | | |
| Total | | | 8,641,351 | | |
| Independent Energy —% | |
MEG Energy Corp.
Term Loan(d)(e)(m) | |
| 11/23/17 | | | 4.000 | % | | | 175,000 | | | | 175,137 | | |
| Life Insurance —% | |
CNO Financial Group, Inc.
Tranche B1 Term Loan(e)(m) | |
| 09/30/16 | | | 6.250 | % | | | 606,667 | | | | 609,197 | | |
| Media Cable 0.2% | |
Bresnan Broadband Holdings LLC
Tranche B Term Loan(e)(m) | |
| 12/14/17 | | | 4.500 | % | | | 224,438 | | | | 225,279 | | |
Cequel Communications LLC
Term Loan(e)(m) | |
| 11/05/13 | | | 2.209 | % | | | 573,506 | | | | 570,117 | | |
Charter Communications Operating LLC
Tranche B1 Term Loan(e)(m) | |
| 03/06/14 | | | 2.190 | % | | | 47,901 | | | | 47,829 | | |
MCC Iowa LLC
Tranche F Term Loan(e)(m) | |
| 10/23/17 | | | 4.500 | % | | | 698,241 | | | | 698,241 | | |
Mediacom Illinois LLC
Tranche E Term Loan(e)(m) | |
| 10/23/17 | | | 4.500 | % | | | 922,676 | | | | 921,522 | | |
TWCC Holding Corp.
Term Loan(e)(m) | |
| 02/11/17 | | | 4.250 | % | | | 274,312 | | | | 275,555 | | |
WideOpenWest Finance LLC
1st Lien Term Loan(e)(m) | |
| 06/30/14 | | | 2.698 | % | | | 546,490 | | | | 531,462 | | |
| Total | | | 3,270,005 | | |
| Media Non-Cable 0.5% | |
CMP Susquehanna Corp.
Term Loan(e)(m) | |
| 05/05/13 | | | 2.250 | % | | | 897,380 | | | | 883,695 | | |
Citadel Broadcasting Corp.
Term Loan(e)(m)(n) | |
| 12/30/16 | | | 4.250 | % | | | 550,000 | | | | 549,483 | | |
Clear Channel Communications, Inc.
Tranche B Term Loan(e)(m) | |
| 01/29/16 | | | 3.841 | % | | | 924,818 | | | | 810,205 | | |
| Borrower | | Weighted*
Average
Coupon | | Principal
Amount | | Value | |
| Senior Loans (continued) | |
| Media Non-Cable (cont.) | |
Encompass Digital Media
Tranche B Term Loan(e)(m) | |
| 06/01/18 | | | 7.750 | % | | $ | 525,000 | | | $ | 525,000 | | |
Getty Images, Inc.
Term Loan(e)(m) | |
| 11/07/16 | | | 5.250 | % | | | 199,000 | | | | 200,144 | | |
Gray Television, Inc
Tranche B Term Loan(e)(m) | |
| 12/31/14 | | | 3.710 | % | | | 922,616 | | | | 914,894 | | |
Hubbard Radio LLC
lst Lien Term Loan(e)(m) | |
| 04/29/17 | | | 5.250 | % | | | 300,000 | | | | 301,749 | | |
NextMedia Operating, Inc.(e)(m)(n)
Term Loan | |
| 05/27/16 | | | 8.250 | % | | | 500,000 | | | | 500,000 | | |
NextMedia Operating, Inc.(e)(m)
Term Loan | |
| 05/27/16 | | | 8.250 | % | | | 548,615 | | | | 548,615 | | |
Postmedia Network, Inc.
Tranche C Term Loan(d)(e)(m) | |
| 07/13/16 | | | 6.250 | % | | | 286,207 | | | | 288,056 | | |
Quad/Graphics, Inc.
Term Loan(e)(m) | |
| 07/02/16 | | | 5.500 | % | | | 648,367 | | | | 650,396 | | |
Radio One, Inc.
Term Loan(e)(m) | |
| 03/31/16 | | | 7.500 | % | | | 750,000 | | | | 763,357 | | |
Spanish Broadcasting System, Inc.
1st Lien Term Loan(e)(m) | |
| 06/11/12 | | | 2.060 | % | | | 650,000 | | | | 627,250 | | |
Univision Communications, Inc.
1st Lien Term Loan(e)(m) | |
| 03/31/17 | | | 4.441 | % | | | 1,189,452 | | | | 1,148,512 | | |
| Total | | | 8,711,356 | | |
| Non-Captive Diversified —% | |
CIT Group, Inc.
Tranche 3 Term Loan(e)(m)(n) | |
| 08/11/15 | | | 9.500 | % | | | 500,000 | | | | 504,195 | | |
iStar Financial, Inc.
Tranche A2 Term Loan(e)(m) | |
| 06/30/14 | | | 7.000 | % | | | 175,000 | | | | 176,335 | | |
| Total | | | 680,530 | | |
| Other Financial Institutions 0.1% | |
Fifth Third Processing Solutions LLC
1st Lien Tranche B1 Term Loan(e)(m) | |
| 11/03/16 | | | 4.500 | % | | | 675,000 | | | | 675,283 | | |
Harland Clarke Holdings Corp.
Tranche B Term Loan(e)(m) | |
| 03/26/14 | | | 2.766 | % | | | 572,352 | | | | 528,590 | | |
Springleaf Financial Funding Co.
Term Loan(e)(m)(n) | |
| 05/10/17 | | | 5.500 | % | | | 225,000 | | | | 224,559 | | |
| Total | | | 1,428,432 | | |
The Accompanying Notes to Financial Statements are an integral part of this statement.
21
Columbia Strategic Income Fund
May 31, 2011
(Percentages represent value of investments compared to net assets)
| Borrower | | Weighted*
Average
Coupon | | Principal
Amount | | Value | |
| Senior Loans (continued) | |
| Other Industry —% | |
Rexnord LLC/RBS Global, Inc.
Tranche B1 Term Loan(e)(m) | |
| 07/19/13 | | | 2.791 | % | | $ | 75,000 | | | $ | 74,406 | | |
| Packaging 0.1% | |
BWAY Holding Co.
Tranche B Term Loan(e)(m) | |
| 02/22/18 | | | 4.500 | % | | | 297,752 | | | | 298,124 | | |
Berry Plastics Holding Corp.
Tranche C Term Loan(e)(m) | |
| 04/03/15 | | | 2.261 | % | | | 373,057 | | | | 358,467 | | |
Graham Packaging Co. LP
Tranche C Term Loan(e)(m) | |
| 04/05/14 | | | 6.750 | % | | | 646,701 | | | | 648,777 | | |
ICL Industrial Containers ULC
Tranche C Term Loan(e)(m) | |
| 02/23/18 | | | 4.503 | % | | | 26,435 | | | | 26,468 | | |
Reynolds Group Holdings, Inc.
Term Loan(e)(m) | |
| 05/04/16 | | | 4.116 | % | | | 525,000 | | | | 524,764 | | |
| Total | | | 1,856,600 | | |
| Paper 0.1% | |
Georgia-Pacific LLC
Tranche B Term Loan(e)(m) | |
| 12/23/12 | | | 2.309 | % | | | 698,158 | | | | 697,222 | | |
Rock-Tenn Co.
Tranche B Term Loan(e)(m)(n) | |
| 04/02/18 | | | 3.057 | % | | | 250,000 | | | | 250,600 | | |
| Total | | | 947,822 | | |
| Property & Casualty —% | |
Asurion LLC
2nd Lien Term Loan(e)(m)(n) | |
| 05/24/19 | | | 9.000 | % | | | 850,000 | | | | 858,347 | | |
| REITs —% | |
CB Richard Ellis Services, Inc.
Tranche C Term Loan(e)(m)(n)(p) | |
| 03/03/18 | | | 3.550 | % | | | 225,000 | | | | 223,875 | | |
| Retailers 0.5% | |
Claire's Stores, Inc.
Tranche B Term Loan(e)(m) | |
| 05/29/14 | | | 3.051 | % | | | 971,674 | | | | 893,765 | | |
Dollar General Corp.
Tranche B1 Term Loan(e)(m) | |
| 07/06/14 | | | 2.973 | % | | | 675,000 | | | | 673,387 | | |
General Nutrition Centers, Inc.(e)(m)(n)
Tranche B Term Loan | |
| 03/02/18 | | | 4.250 | % | | | 550,000 | | | | 550,275 | | |
General Nutrition Centers, Inc.(e)(m)
Tranche B Term Loan | |
| 03/02/18 | | | 4.250 | % | | | 693,750 | | | | 694,097 | | |
J. Crew Group, Inc.
Term Loan(e)(m) | |
| 03/07/18 | | | 4.750 | % | | | 925,000 | | | | 906,037 | | |
Jo-Ann Stores, Inc.
Term Loan(e)(m) | |
| 03/18/18 | | | 4.750 | % | | | 850,000 | | | | 839,018 | | |
| Borrower | | Weighted*
Average
Coupon | | Principal
Amount | | Value | |
| Senior Loans (continued) | |
| Retailers (cont.) | |
Michaels Stores, Inc.(e)(m)
Tranche B1 Term Loan | |
| 10/31/13 | | | 2.563 | % | | $ | 861,634 | | | $ | 850,864 | | |
Tranche B2 Term Loan
07/31/16 | | | 4.813 | % | | | 50,000 | | | | 50,125 | | |
Neiman Marcus Group, Inc. (The)
Term Loan(e)(m) | |
| 05/16/18 | | | 4.750 | % | | | 925,000 | | | | 917,406 | | |
Orchard Supply Hardware LLC
Term Loan(e)(m) | |
| 12/21/13 | | | 5.000 | % | | | 922,334 | | | | 822,418 | | |
Pep Boys-Manny, Moe & Jack (The)
Term Loan(e)(m) | |
| 10/27/13 | | | 2.250 | % | | | 423,460 | | | | 422,579 | | |
PetCo Animal Supplies, Inc.
Term Loan(e)(m) | |
| 11/24/17 | | | 4.500 | % | | | 915,750 | | | | 913,744 | | |
Rite Aid Corp.
Tranche 2 Term Loan(e)(m)(n) | |
| 06/04/14 | | | 1.954 | % | | | 899,023 | | | | 862,127 | | |
Toys 'R' Us-Delaware, Inc.
Term Loan(e)(m) | |
| 09/01/16 | | | 6.000 | % | | | 648,367 | | | | 648,665 | | |
| Total | | | 10,044,507 | | |
| Supermarkets 0.1% | |
Great Atlantic & Pacific Tea Co., Inc. (The)
Debtor In Possession Term Loan(e)(m) | |
| 06/14/12 | | | 8.750 | % | | | 525,000 | | | | 530,686 | | |
Sprouts Farmers Markets Holdings LLC
Term Loan(e)(m) | |
| 04/18/18 | | | 6.000 | % | | | 650,000 | | | | 645,938 | | |
Supervalu, Inc.
Tranche B2 Term Loan(e)(m) | |
| 10/05/15 | | | 3.441 | % | | | 748,111 | | | | 740,390 | | |
| Total | | | 1,917,014 | | |
| Technology 0.4% | |
Aeroflex, Inc.
Tranche B Term Loan(e)(m) | |
| 05/09/18 | | | 5.250 | % | | | 200,000 | | | | 199,876 | | |
CommScope, Inc.
Term Loan(e)(m) | |
| 01/14/18 | | | 5.000 | % | | | 225,000 | | | | 226,030 | | |
Dealer Computer Services, Inc.(e)(m)
Tranche A Term Loan | |
| 04/21/16 | | | 2.695 | % | | | 46,667 | | | | 46,491 | | |
Tranche B Term Loan
04/21/18 | | | 3.750 | % | | | 150,000 | | | | 150,188 | | |
Edwards (Cayman Islands II) Ltd.
1st Lien Term Loan(d)(e)(m) | |
| 08/31/11 | | | 5.500 | % | | | 699,375 | | | | 697,501 | | |
Fidelity National Information Services, Inc.
Tranche B Term Loan(e)(m) | |
| 07/18/16 | | | 5.250 | % | | | 448,872 | | | | 450,668 | | |
The Accompanying Notes to Financial Statements are an integral part of this statement.
22
Columbia Strategic Income Fund
May 31, 2011
(Percentages represent value of investments compared to net assets)
| Borrower | | Weighted*
Average
Coupon | | Principal
Amount | | Value | |
| Senior Loans (continued) | |
| Technology (cont.) | |
First Data Corp.(e)(m)
Term Loan | |
| 03/24/18 | | | 4.195 | % | | $ | 848,315 | | | $ | 791,300 | | |
Tranche B1 Term Loan
09/24/14 | | | 2.945 | % | | | 90,278 | | | | 84,419 | | |
Freescale Semiconductor, Inc.
Term Loan(e)(m) | |
| 12/01/16 | | | 4.441 | % | | | 697,733 | | | | 694,495 | | |
Infor Enterprise Solutions Holdings, Inc.(e)(m)
1st Lien Delayed Draw Term Loan | |
| 07/25/15 | | | 5.950 | % | | | 250,825 | | | | 244,554 | | |
1st Lien Term Loan
07/28/15 | | | 5.950 | % | | | 472,282 | | | | 460,475 | | |
Interactive Data Corp.
Tranche B Term Loan(e)(m) | |
| 02/11/18 | | | 4.750 | % | | | 900,000 | | | | 900,981 | | |
Kasima LLC
Term Loan(e)(m) | |
| 03/31/17 | | | 5.000 | % | | | 275,000 | | | | 275,344 | | |
NDS Finance Ltd.
Tranche B Term Loan(e)(m) | |
| 03/12/18 | | | 4.000 | % | | | 125,000 | | | | 124,961 | | |
Novell, Inc.
1st Lien Term Loan(e)(m) | |
| 04/27/17 | | | 6.500 | % | | | 150,000 | | | | 150,703 | | |
Rovi Solutions Corp./Guides, Inc.(e)(m)
Tranche A Term Loan | |
| 02/07/16 | | | 2.700 | % | | | 100,000 | | | | 99,750 | | |
Tranche B Term Loan
02/07/18 | | | 4.000 | % | | | 100,000 | | | | 100,500 | | |
Sensata Technology BV/Finance Co. LLC
Term Loan(e)(m) | |
| 05/12/18 | | | 4.000 | % | | | 275,000 | | | | 275,280 | | |
SunGard Data Systems, Inc.
Tranche B Term Loan(e)(m) | |
| 02/28/16 | | | 3.873 | % | | | 562,350 | | | | 563,289 | | |
Syniverse Holdings, Inc.
Term Loan(e)(m) | |
| 12/21/17 | | | 5.250 | % | | | 199,500 | | | | 200,831 | | |
Trans Union LLC
Term Loan(e)(m) | |
| 02/10/18 | | | 4.750 | % | | | 200,000 | | | | 200,700 | | |
Verint Systems, Inc.
Term Loan(e)(m) | |
| 10/29/17 | | | 4.500 | % | | | 175,000 | | | | 175,492 | | |
| Total | | | 7,113,828 | | |
| Textile —% | |
Springs Window Fashions LLC
Tranche B Term Loan(e)(m)(n) | |
| 05/31/17 | | | 6.000 | % | | | 200,000 | | | | 197,000 | | |
| Borrower | | Weighted*
Average
Coupon | | Principal
Amount | | Value | |
| Senior Loans (continued) | |
| Transportation Services 0.1% | |
Hertz Corp. (The)(e)(m)
Letter of Credit | |
| 09/30/11 | | | 3.750 | % | | $ | 425,000 | | | $ | 417,563 | | |
Tranche B Term Loan
07/18/11 | | | 3.750 | % | | | 550,000 | | | | 549,846 | | |
| Total | | | 967,409 | | |
| Wireless 0.1% | |
MetroPCS Wireless, Inc.
Tranche B3 Term Loan(e)(m) | |
| 03/17/18 | | | 4.000 | % | | | 574,375 | | | | 572,583 | | |
Ntelos, Inc.
Tranche B Term Loan(e)(m)(n) | |
| 08/07/15 | | | 4.000 | % | | | 375,000 | | �� | | 375,311 | | |
| Total | | | 947,894 | | |
| Wirelines —% | |
Windstream Corp.
Tranche B2 Term Loan(e)(m) | |
| 12/17/15 | | | 3.013 | % | | | 765,755 | | | | 766,713 | | |
Total Senior Loans
(Cost: $89,996,004) | | $ | 87,665,686 | | |
| Issuer | | | | Shares | | Value | |
| Common Stocks 0.1% | |
| CONSUMER DISCRETIONARY 0.1% | |
| Hotels, Restaurants & Leisure 0.1% | |
| Six Flags Entertainment Corp. | | | | | 30,810 | | | $ | 2,455,516 | | |
| TOTAL CONSUMER DISCRECTIONARY | | | 2,455,516 | | |
Total Common Stocks
(Cost: $2,346,754) | | $ | 2,455,516 | | |
| Preferred Stocks —% | |
| FINANCIALS —% | |
| Commercial Banks —% | |
| Lloyds Banking Group PLC(b)(d)(q) | | | | | 230,000 | | | $ | 178,825 | | |
| TOTAL FINANCIALS | | | 178,825 | | |
| INFORMATION TECHNOLOGY —% | |
| Communications Equipment —% | |
| CMP Susquehanna Radio Holdings Corp.(b)(e)(g)(i)(q) | | | | | 40,765 | | | | 408 | | |
| TOTAL INFORMATION TECHNOLOGY | | | 408 | | |
Total Preferred Stocks
(Cost: $125,160) | | $ | 179,233 | | |
The Accompanying Notes to Financial Statements are an integral part of this statement.
23
Columbia Strategic Income Fund
May 31, 2011
(Percentages represent value of investments compared to net assets)
| Issuer | | Shares | | Value | |
| Warrants —% | |
| INFORMATION TECHNOLOGY —% | |
| Communications Equipment —% | |
| CMP Susquehanna Corp.(b)(g)(i) | | | 46,584 | | | $ | 466 | | |
| TOTAL INFORMATION TECHNOLOGY | | | | | 466 | | |
Total Warrants
(Cost: $466) | | | | $ | 466 | | |
| | | Shares | | Value | |
| Money Market Fund 0.7% | |
Columbia Short-Term Cash Fund,
0.166%(r)(s) | | | 12,988,808 | | | $ | 12,988,808 | | |
Total Money Market Fund
(Cost: $12,988,808) | | | | $ | 12,988,808 | | |
Total Investments
(Cost: $1,773,985,458) | | | | $ | 1,874,378,339 | | |
| Other Assets & Liabilities, Net | | | | | (9,723,026 | ) | |
| Net Assets | | | | $ | 1,864,655,313 | | |
Investment in Derivatives
Futures Contracts Outstanding at May 31, 2011
| Contract Description | | Number of
Contracts
Long (Short) | | Notional
Market Value | | Expiration
Date | | Unrealized
Appreciation | | Unrealized
Depreciation | |
| U.S. Treasury Long Bond, 20-year | | | 279 | | | | 34,831,406 | | | Sept. 2011 | | $ | 289,228 | | | $ | — | | |
| U.S. Treasury Note, 2-year | | | (385 | ) | | | (84,387,188 | ) | | Oct. 2011 | | | — | | | | (102,485 | ) | |
| U.S. Treasury Note, 5-year | | | (231 | ) | | | (27,521,486 | ) | | Oct. 2011 | | | — | | | | (170,742 | ) | |
| U.S. Treasury Note, 10-year | | | (1,496 | ) | | | (183,423,632 | ) | | Sept. 2011 | | | — | | | | (197,815 | ) | |
| U.S. Treasury Ultra Bond, 30-year | | | 225 | | | | 29,039,063 | | | Sept. 2011 | | | 222,703 | | | | — | | |
| Total | | | | | | | | $ | 511,931 | | | $ | (471,042 | ) | |
Credit Default Swap Contract Outstanding at May 31, 2011
Buy Protection
| Counterparty | | Reference
Entity | | Expiration
Date | | Pay Fixed
Rate | | Notional
Amount | | Market
Value | | Periodic
Payments
Receivable
(Payable) | | Unrealized
Appreciation | | Unrealized
Depreciation | |
| Barclays Captial | | Federative | | September 20, | | | 1.470 | % | | $ | 10,000,000 | | | $ | (215,176 | ) | | $ | (29,809 | ) | | $ | — | | | $ | (244,985 | ) | |
| | | Republic | | | 2014 | | | | | | | | | | | | |
| |
| | | of Brazil | | | | | | | | | | | | | | | |
| Total | | | | | | | | | | | | | | $ | — | | | $ | (244,985 | ) | |
Forward Foreign Currency Exchange Contracts Open at May 31, 2011
| Counterparty | | Exchange Date | | Currency to be
Delivered | | Currency to be
Received | | Unrealized
Appreciation | | Unrealized
Depreciation | |
| UBS Securities LLC | | June 9, 2011
| | | 6,100,000
(NZD) | | | | 4,808,142
(USD) | | | $ | —
| | | $ | (219,703
| ) | |
State Street Bank &
Trust Company | | June 21, 2011
| | | 4,378,000
(EUR) | | | | 6,191,981
(USD) | | | | —
| | | | (105,430
| ) | |
| HSBC Securities (USA), Inc. | | June 29, 2011
| | | 12,340,000
(CHF) | | | | 13,976,035
(USD) | | | | —
| | | | (494,540
| ) | |
| HSBC Securities (USA), Inc. | | June 29, 2011
| | | 7,506,000
(CHF) | | | | 8,801,079
(USD) | | | | 516
| | | | —
| | |
| Barclays Bank PLC | | June 29, 2011
| | | 1,135,483,000
(JPY) | | | | 13,883,586
(USD) | | | | —
| | | | (48,319
| ) | |
| J.P. Morgan Securities, Inc. | | June 29, 2011
| | | 57,377,000
(SEK) | | | | 8,984,539
(USD) | | | | —
| | | | (298,700
| ) | |
| UBS Securities LLC | | June 29, 2011
| | | 13,781,708
(USD) | | | | 13,512,000
(CAD) | | | | 154,367
| | | | —
| | |
State Street Bank &
Trust Company | | June 29, 2011
| | | 9,319,426
(USD) | | | | 6,647,000
(EUR) | | | | 239,868
| | | | —
| | |
| Goldman, Sachs & Co. | | June 29, 2011
| | | 9,289,042
(USD) | | | | 5,644,000
(GBP) | | | | —
| | | | (4,666
| ) | |
| HSBC Securities (USA), Inc. | | June 29, 2011
| | | 22,267,232
(USD) | | | | 125,330,000
(NOK) | | | | 966,259
| | | | —
| | |
| Total | | | | | | | | $ | 1,361,010 | | | $ | (1,171,358 | ) | |
The Accompanying Notes to Financial Statements are an integral part of this statement.
24
Columbia Strategic Income Fund
May 31, 2011
| Notes to Portfolio of Investments | |
* Represents the weighted average of the coupon rates in effect over the life of the Senior Loans.
(a) Principal amounts are denominated in United States Dollars unless otherwise noted.
(b) Security exempt from registration pursuant to Rule 144A under the Securities Act of 1933. This security may be resold in transactions exempt from registration, normally to qualified institutional buyers. At May 31, 2011, the value of these securities amounted to $538,335,238 or 28.87% of net assets.
(c) Represents a security purchased on a when-issued or delayed delivery basis.
(d) Represents a foreign security. At May 31, 2011, the value of foreign securities, excluding short-term securities, represented 35.36% of net assets.
(e) Variable rate security. The interest rate shown reflects the rate as of May 31, 2011.
(f) Zero coupon bond.
(g) Identifies issues considered to be illiquid as to their marketability. The aggregate value of such securities at May 31, 2011 was $1,796,927, representing 0.10% of net assets. Information concerning such security holdings at May 31, 2011 was as follows:
| Security | | Acquisition
Dates | | Cost | |
Cabazon Band Mission Indians
Revenue Bonds
Series 2004 | | | 10-04-04 | | | $ | 2,820,000 | | |
| CMP Susquehanna Corp. | | | 03-26-09 | | | | 163,904 | | |
| CMP Susquehanna Radio Holdings Corp. | | | 03-26-09 | | | | 408 | | |
Simmons Holdco, Inc.
Term Loan | | | 02-02-07 | thru 02-16-10 | | | 2,282,513 | | |
| Six Flags, Inc. | | | 05-07-10 | | | | — | | |
CMP Susquehanna Corp.
Warrants | | | 03-26-09 | | | | 466 | | |
(h) Negligible market value.
(i) Represents fair value as determined in good faith under procedures approved by the Board of Trustees. At May 31, 2011, the value of these securities amounted to $3,179,015, which represents 0.17% of net assets.
(j) At May 31, 2011, investments in securities included securities valued at $2,676,342 that were partially pledged as collateral to cover initial margin deposits on open interest rate futures contracts.
(k) The maturity dates shown represent the original maturity of the underlying obligation. Actual maturity may vary based upon prepayment activity on these obligations. Unless otherwise noted, the coupon rates presented are fixed rates.
(l) Municipal obligations include debt obligations issued by or on behalf of territories, possessions, or sovereign nations within the territorial boundaries of the United States. These securities represented 0.09% of net assets at May 31, 2011.
(m) Senior loans have rates of interest that float periodically based primarily on the London Interbank Offered Rate ("LIBOR") and other short-term rates. Remaining maturities of senior loans may be less than the stated maturities shown as a result of contractual or optional prepayments by the borrower. Such prepayments cannot be predicted with certainty.
(n) Represents a senior loan purchased on a when-issued or delayed delivery basis. Certain details associated with this purchase are not known prior to the settlement date of the transaction. In addition, senior loans typically trade without accrued interest and therefore a weighted average coupon rate is not available prior to settlement. At settlement, if still unknown, the borrower or counterparty will provide the Fund with the final weighted average coupon rate and maturity date.
(o) Represents securities that have defaulted on payment of interest. The Fund has stopped accruing interest on these securities. At May 31, 2011, the value of these securities amounted to $6,504, which represents less than 0.01% of net assets.
(p) At May 31, 2011, the Fund had unfunded senior loan commitments pursuant to the terms of the loan agreement. The Fund receives a stated coupon rate until the borrower draws on the loan commitment, at which time the rate will become the stated rate in the loan agreement.
| Borrower | | Unfunded Commitment | |
CB Richard Ellis Services, Inc.
Tranche C Term Loan | | $ | 223,875 | | |
(q) Non-income producing.
The Accompanying Notes to Financial Statements are an integral part of this statement.
25
Columbia Strategic Income Fund
May 31, 2011
(r) Investments in affiliates during the year ended May 31, 2011:
| Issuer | | Beginning
Cost | | Purchase
Cost | | Sales Cost/
Proceeds
from Sales | | Realized
Gain/Loss | | Ending
Cost | | Dividends
or Interest
Income | | Value | |
Columbia Short-Term
Cash Fund | | $ | — | | | $ | 32,177,618 | | | $ | (19,188,810 | ) | | $ | — | | | $ | 12,988,808 | | | $ | 1,038 | | | $ | 12,988,808 | | |
(s) The rate shown is the seven-day current annualized yield at May 31, 2011.
CMO Collateralized Mortgage Obligation
FGIC Financial Guaranty Insurance Company
IO Interest Only
PIK Payment-in-Kind
STRIPS Separate Trading of Registered Interest and Principal Securities
AUD Australian Dollar
BRL Brazilian Real
CAD Canadian Dollar
CHF Swiss Franc
COP Colombian Peso
EUR Euro
GBP Pound Sterling
IDR Indonesian Rupiah
JPY Japanese Yen
MXN Mexican Peso
NOK Norwegian Krone
NZD New Zealand Dollar
PEN Peru Nuevos Soles
PHP Philippine Peso
PLN Polish Zloty
SEK Swedish Krona
USD US Dollar
UYU Uruguay Pesos
ZAR South African Rand
The Accompanying Notes to Financial Statements are an integral part of this statement.
26
Columbia Strategic Income Fund
May 31, 2011
Generally accepted accounting principles (GAAP) require disclosure regarding the inputs and valuation techniques used to measure fair value and any changes in valuation inputs or techniques. In addition, investments shall be disclosed by major category.
The Fund categorizes its fair value measurements according to a three-level hierarchy that maximizes the use of observable inputs and minimizes the use of unobservable inputs by prioritizing that the most observable input be used when available. Observable inputs are those that market participants would use in pricing an investment based on market data obtained from sources independent of the reporting entity. Unobservable inputs are those that reflect the Fund's assumptions about the information market participants would use in pricing an investment. An investment's level within the fair value hierarchy is based on the lowest level of any input that is deemed significant to the asset or liability's fair value measurement. The input levels are not necessarily an indication of the risk or liquidity associated with investments at that level. For example, certain U.S. government securities are generally high quality and liquid, however, they are reflected as Level 2 because the inputs used to determine fair value may not always be quoted prices in an active market.
Fair value inputs are summarized in the three broad levels listed below:
• Level 1 — Valuations based on quoted prices for investments in active markets that the Fund has the ability to access at the measurement date (including NAV for open-end mutual funds). Valuation adjustments are not applied to Level 1 investments.
• Level 2 — Valuations based on other significant observable inputs (including quoted prices for similar securities, interest rates, prepayment speeds, credit risks, etc.).
• Level 3 — Valuations based on significant unobservable inputs (including the Fund's own assumptions and judgment in determining the fair value of investments).
Inputs that are used in determining fair value of an investment may include price information, credit data, volatility statistics, and other factors. These inputs can be either observable or unobservable. The availability of observable inputs can vary between investments, and is affected by various factors such as the type of investment, and the volume and level of activity for that investment or similar investments in the marketplace. The inputs will be considered by the Fund Administrator, along with any other relevant factors in the calculation of an investment's fair value. The Fund uses prices and inputs that are current as of the measurement date, which may include periods of market dislocations. During these periods, the availability of prices and inputs may be reduced for many investments. This condition could cause an investment to be reclassified between the various levels within the hierarchy.
Investments falling into the Level 3 category are primarily supported by quoted prices from brokers and dealers participating in the market for those investments. However, these may be classified as Level 3 investments due to lack of market transparency and corroboration to support these quoted prices. Additionally, valuation models may be used as the pricing source for any remaining investments classified as Level 3. These models rely on one or more significant unobservable inputs and/or significant assumptions by the Fund Administrator. Inputs used in valuations may include, but are not limited to, financial statement analysis, capital account balances, discount rates and estimated cash flows, and comparable company data.
The Accompanying Notes to Financial Statements are an integral part of this statement.
27
Columbia Strategic Income Fund
May 31, 2011
| Fair Value Measurements (continued) | |
The following table is a summary of the inputs used to value the Fund's investments as of May 31, 2011:
| | | Fair value at May 31, 2011 | |
| Description(a) | | Level 1
quoted prices
in active
markets for
identical assets | | Level 2
other
significant
observable
inputs(b) | | Level 3
significant
unobservable
inputs | | Total | |
| Bonds | |
| Corporate Bonds & Notes | |
| Media Non-Cable | | $ | — | | | $ | 66,652,930 | | | $ | 161,000 | | | $ | 66,813,930 | | |
| All other industries | | | — | | | | 909,366,127 | | | | — | | | | 909,366,127 | | |
| Residential Mortgage-Backed Securities—Agency | | | — | | | | 94,400,806 | | | | — | | | | 94,400,806 | | |
| Residential Mortgage-Backed Securities—Non-Agency | | | — | | | | 25,411,688 | | | | 11,257,231 | | | | 36,668,919 | | |
| Commercial Mortgage-Backed Securities | | | — | | | | 55,665,901 | | | | — | | | | 55,665,901 | | |
| Asset-Backed Securities | | | — | | | | 1,744,497 | | | | — | | | | 1,744,497 | | |
| Inflation-Indexed Bonds | | | — | | | | 28,976,631 | | | | — | | | | 28,976,631 | | |
| U.S. Treasury Obligations | | | 48,265,231 | | | | 5,133,075 | | | | — | | | | 53,398,306 | | |
| Foreign Government Obligations | | | — | | | | 502,768,557 | | | | — | | | | 502,768,557 | | |
| Municipal Bonds | | | — | | | | 21,284,956 | | | | — | | | | 21,284,956 | | |
| Total Bonds | | | 48,265,231 | | | | 1,711,405,168 | | | | 11,418,231 | | | | 1,771,088,630 | | |
| Senior Loans | |
| Building Materials | | | — | | | | 975,325 | | | | 628,750 | | | | 1,604,075 | | |
| Chemicals | | | — | | | | 5,270,032 | | | | 654,855 | | | | 5,924,887 | | |
| Consumer Products | | | — | | | | 3,243,846 | | | | 6,504 | | | | 3,250,350 | | |
| Health Care | | | — | | | | 8,416,914 | | | | 224,437 | | | | 8,641,351 | | |
| Media Non-Cable | | | — | | | | 8,186,356 | | | | 525,000 | | | | 8,711,356 | | |
| Technology | | | — | | | | 7,014,078 | | | | 99,750 | | | | 7,113,828 | | |
| All other industries | | | — | | | | 52,419,839 | | | | — | | | | 52,419,839 | | |
| Total Senior Loans | | | — | | | | 85,526,390 | | | | 2,139,296 | | | | 87,665,686 | | |
| Equity Securities | |
| Common Stocks | |
| Consumer Discretionary | | | 2,455,516 | | | | — | | | | — | | | | 2,455,516 | | |
| Preferred Stocks | |
| Financials | | | — | | | | 178,825 | | | | — | | | | 178,825 | | |
| Information Technology | | | — | | | | — | | | | 408 | | | | 408 | | |
| Warrants | |
| Information Technology | | | — | | | | — | | | | 466 | | | | 466 | | |
| Total Equity Securities | | | 2,455,516 | | | | 178,825 | | | | 874 | | | | 2,635,215 | | |
| Other | |
| Affiliated Money Market Fund(c) | | | 12,988,808 | | | | — | | | | — | | | | 12,988,808 | | |
| Total Other | | | 12,988,808 | | | | — | | | | — | | | | 12,988,808 | | |
| Investments in Securities | | | 63,709,555 | | | | 1,797,110,383 | | | | 13,558,401 | | | | 1,874,378,339 | | |
| Derivatives(d) | |
| Assets | |
| Futures Contracts | | | 511,931 | | | | — | | | | — | | | | 511,931 | | |
| Forward Foreign Currency Exchange Contracts | | | — | | | | 1,361,010 | | | | — | | | | 1,361,010 | | |
| Liabilities | |
| Futures Contracts | | | (471,042 | ) | | | — | | | | — | | | | (471,042 | ) | |
| Forward Foreign Currency Exchange Contracts | | | — | | | | (1,171,358 | ) | | | — | | | | (1,171,358 | ) | |
| Credit Default Swap Contract | | | — | | | | (244,985 | ) | | | — | | | | (244,985 | ) | |
| Total | | $ | 63,750,444 | | | $ | 1,797,055,050 | | | $ | 13,558,401 | | | $ | 1,874,363,895 | | |
(a) See the Portfolio of Investments for all investment classifications not indicated in the table.
(b) There were no significant transfers between Levels 1 and 2 during the period.
(c) Money market fund that is a sweep investment for cash balances in the Fund at May 31, 2011.
(d) Futures contracts, forward foreign currency contracts and credit default swap contracts are valued at unrealized appreciation (depreciation).
The Accompanying Notes to Financial Statements are an integral part of this statement.
28
Columbia Strategic Income Fund
May 31, 2011
| Fair Value Measurements (continued) | |
The following table is a reconciliation of Level 3 assets for which significant unobservable inputs were used to determine fair value.
| | | Corporate Bonds
& Notes | | Residential Mortgage-
Backed Securities—
Non-Agency | | Senior
Loans | | Preferred
Stocks | | Warrants | | Total | |
| Balance as of May 31, 2010 | | $ | 103,250 | | | $ | — | | | $ | — | | | $ | 408 | | | $ | 466 | | | $ | 104,124 | | |
| Accrued discounts/premiums | | | 6,638 | | | | 42,523 | | | | 343 | | | | — | | | | — | | | | 49,504 | | |
| Realized gain (loss) | | | — | | | | 1,615 | | | | — | | | | — | | | | — | | | | 1,615 | | |
| Change in unrealized appreciation (depreciation)* | | | 51,112 | | | | (88,999 | ) | | | 26,341 | | | | — | | | | — | | | | (11,546 | ) | |
| Sales | | | — | | | | (1,321,355 | ) | | | — | | | | — | | | | — | | | | (1,321,355 | ) | |
| Purchases | | | — | | | | 12,623,447 | | | | 2,106,108 | | | | — | | | | — | | | | 14,729,555 | | |
| Transfers into Level 3 | | | — | | | | — | | | | 6,504 | | | | — | | | | — | | | | 6,504 | | |
| Balance as of May 31, 2011 | | $ | 161,000 | | | $ | 11,257,231 | | | $ | 2,139,296 | | | $ | 408 | | | $ | 466 | | | $ | 13,558,401 | | |
Certain corporate fixed-income bonds classified as Level 3 are valued using the income approach. To determine fair value for these securities, management considered estimates of future distributions from the liquidation of company assets or potential actions related to the respective company's bankruptcy filing.
Certain preferred stock, warrants and corporate fixed-income bonds classified as Level 3 are valued using the market approach. To determine fair value for these securities, management considered various factors which may have included, but were not limited to, trades of similar securities, estimated earnings of the respective company, market multiples derived from a set of comparable companies, and the position of the security within the respective company's capital structure.
Certain Residential Mortgage-Backed Securities—Non-Agency bonds and Senior Loans classified as Level 3 securities are valued using the market approach and utilize single market quotations from broker dealers.
* Change in unrealized appreciation (depreciation) relating to securities held at May 31, 2011 was $(11,546), which is comprised of Corporate Bonds & Notes of $51,112, Residential Mortgage-Backed Securities—Non Agency of $(88,999) and Senior Loans of $26,341.
Transfers in and/or out of Level 3 are determined based on the fair value at the beginning of the period for security positions held throughout the period.
The Accompanying Notes to Financial Statements are an integral part of this statement.
29
Statement of Assets and Liabilities – Columbia Strategic Income Fund
May 31, 2011
| Assets | |
| Investments, at value | |
| Unaffiliated issuers (identified cost $1,760,996,650) | | $ | 1,861,389,531 | | |
| Affiliated issuers (identified cost $12,988,808) | | | 12,988,808 | | |
| Total investments (identified cost $1,773,985,458) | | | 1,874,378,339 | | |
| Foreign currency (identified cost $4,209,265) | | | 4,287,664 | | |
| Unrealized appreciation on forward foreign currency exchange contracts | | | 1,361,010 | | |
| Receivable for: | |
| Capital shares sold | | | 1,706,588 | | |
| Investments sold | | | 40,255,979 | | |
| Dividends | | | 4,736 | | |
| Interest | | | 27,803,924 | | |
| Foreign tax reclaims | | | 202,363 | | |
| Trustees' deferred compensation plan | | | 165,715 | | |
| Total assets | | | 1,950,166,318 | | |
| Liabilities | |
| Disbursements in excess of cash | | | 11,218 | | |
| Unrealized depreciation on forward foreign currency exchange contracts | | | 1,171,358 | | |
| Unrealized depreciation on credit default swap contract | | | 244,985 | | |
| Payable for: | |
| Investments purchased | | | 19,277,489 | | |
| Investments purchased on a delayed delivery basis | | | 60,647,870 | | |
| Capital shares purchased | | | 3,041,791 | | |
| Variation margin on futures contracts | | | 150,369 | | |
| Investment management fees | | | 106,418 | | |
| Distribution and service fees | | | 49,919 | | |
| Transfer agent fees | | | 310,721 | | |
| Administration fees | | | 13,061 | | |
| Plan administration fees | | | 1 | | |
| Chief compliance officer expenses | | | 450 | | |
| Other expenses | | | 319,640 | | |
| Trustees' deferred compensation plan | | | 165,715 | | |
| Total liabilities | | | 85,511,005 | | |
| Net assets applicable to outstanding capital stock | | $ | 1,864,655,313 | | |
The Accompanying Notes to Financial Statements are an integral part of this statement.
30
Statement of Assets and Liabilities (continued) – Columbia Strategic Income Fund
May 31, 2011
| Net assets represented by | |
| Paid-in capital | | $ | 1,803,225,152 | | |
| Undistributed net investment income | | | 4,632,213 | | |
| Accumulated net realized loss | | | (43,577,744 | ) | |
| Unrealized appreciation (depreciation) on: | |
| Investments | | | 100,392,881 | | |
| Foreign currency translations | | | (2,745 | ) | |
| Forward foreign currency exchange contracts | | | 189,652 | | |
| Futures contracts | | | 40,889 | | |
| Credit default swap contract | | | (244,985 | ) | |
| Total — representing net assets applicable to outstanding capital stock | | $ | 1,864,655,313 | | |
| Net assets applicable to outstanding shares(b) | |
| Class A | | $ | 956,131,585 | | |
| Class B | | $ | 61,684,286 | | |
| Class C | | $ | 185,859,066 | | |
| Class R | | $ | 2,512 | | |
| Class R4 | | $ | 2,534 | | |
| Class R5 | | $ | 2,534 | | |
| Class W | | $ | 2,500 | | |
| Class Z | | $ | 660,970,296 | | |
| Shares outstanding(b) | |
| Class A | | | 155,102,563 | | |
| Class B | | | 10,013,773 | | |
| Class C | | | 30,140,859 | | |
| Class R | | | 406 | | |
| Class R4 | | | 416 | | |
| Class R5 | | | 416 | | |
| Class W | | | 406 | | |
| Class Z | | | 108,518,259 | | |
| Net asset value per share(b) | |
| Class A(a) | | $ | 6.16 | | |
| Class B | | $ | 6.16 | | |
| Class C | | $ | 6.17 | | |
| Class R | | $ | 6.19 | | |
| Class R4 | | $ | 6.09 | | |
| Class R5 | | $ | 6.09 | | |
| Class W | | $ | 6.16 | | |
| Class Z | | $ | 6.09 | | |
(a) The maximum offering price per share for Class A is $6.47. The offering price is calculated by dividing the net asset value by 1.0 minus the maximum sales charge of 4.75%.
(b) Class R and Class W shares commenced operations on September 27, 2010. Class R4 and Class R5 shares commenced operations on March 7, 2011.
The Accompanying Notes to Financial Statements are an integral part of this statement.
31
Statement of Operations – Columbia Strategic Income Fund
Year ended May 31, 2011
| Net investment income | |
| Income: | |
| Dividends | | $ | 5,546 | | |
| Interest | | | 121,498,321 | | |
| Dividends from affiliates | | | 1,038 | | |
| Income from securities lending — net | | | 48,643 | | |
| Foreign taxes withheld | | | (182,738 | ) | |
| Total income | | | 121,370,810 | | |
| Expenses: | |
| Investment management fees | | | 10,514,321 | | |
| Distribution fees | |
| Class B | | | 585,742 | | |
| Class C | | | 1,453,249 | | |
| Class R | | | 8 | | |
| Service fees | |
| Class A | | | 2,468,063 | | |
| Class B | | | 193,884 | | |
| Class C | | | 479,423 | | |
| Class W | | | 4 | | |
| Transfer agent fees | |
| Class A | | | 1,494,302 | | |
| Class B | | | 117,319 | | |
| Class C | | | 290,819 | | |
| Class R | | | 3 | | |
| Class R4 | | | 1 | | |
| Class R5 | | | 1 | | |
| Class W | | | 1 | | |
| Class Z | | | 1,021,081 | | |
| Administration fees | | | 101,296 | | |
| Plan administration fees | |
| Class R4 | | | 2 | | |
| Compensation of board members | | | 96,794 | | |
| Pricing and bookkeeping fees | | | 181,794 | | |
| Custodian fees | | | 247,849 | | |
| Printing and postage fees | | | 299,941 | | |
| Registration fees | | | 144,158 | | |
| Professional fees | | | 188,441 | | |
| Chief compliance officer expenses | | | 2,974 | | |
| Other | | | 88,693 | | |
| Total expenses | | | 19,970,163 | | |
| Fees waived or expenses reimbursed by Investment Manager | | | (59,857 | ) | |
| Fees waived by distributor—Class C | | | (290,741 | ) | |
| Earnings credits on cash balances | | | (1,208 | ) | |
| Total net expenses | | | 19,618,357 | | |
| Net investment income | | | 101,752,453 | | |
| Realized and unrealized gain (loss) — net | |
| Net realized gain (loss) on: | |
| Investments | | | 124,325,234 | | |
| Foreign currency transactions | | | (5,150,601 | ) | |
| Forward foreign currency exchange contracts | | | (602,853 | ) | |
| Futures contracts | | | (4,039,903 | ) | |
| Credit default swap contract | | | (140,574 | ) | |
| Net realized gain | | | 114,391,303 | | |
| Net change in unrealized appreciation (depreciation) on: | |
| Investments | | | 28,877,634 | | |
| Foreign currency translations | | | 454,550 | | |
| Forward foreign currency exchange contracts | | | (586,777 | ) | |
| Futures contracts | | | 40,889 | | |
| Credit default swap contract | | | (136,743 | ) | |
| Net change in unrealized appreciation | | | 28,649,553 | | |
| Net realized and unrealized gain | | | 143,040,856 | | |
| Net increase in net assets resulting from operations | | $ | 244,793,309 | | |
The Accompanying Notes to Financial Statements are an integral part of this statement.
32
Statement of Changes in Net Assets – Columbia Strategic Income Fund
| Year ended May 31, | | 2011(a) | | 2010 | |
| Operations | |
| Net investment income | | $ | 101,752,453 | | | $ | 105,321,629 | | |
| Net realized gain | | | 114,391,303 | | | | 37,804,686 | | |
| Net change in unrealized appreciation | | | 28,649,553 | | | | 109,164,528 | | |
| Net increase in net assets resulting from operations | | | 244,793,309 | | | | 252,290,843 | | |
| Distributions to shareholders from: | |
| Net investment income | |
| Class A | | | (69,981,175 | ) | | | (45,728,859 | ) | |
| Class B | | | (4,835,348 | ) | | | (4,162,812 | ) | |
| Class C | | | (12,463,225 | ) | | | (7,513,696 | ) | |
| Class J | | | — | | | | (401,498 | ) | |
| Class R | | | (129 | ) | | | — | | |
| Class R4 | | | (32 | ) | | | — | | |
| Class R5 | | | (33 | ) | | | — | | |
| Class W | | | (133 | ) | | | — | | |
| Class Z | | | (49,909,500 | ) | | | (35,781,204 | ) | |
| Total distributions to shareholders | | | (137,189,575 | ) | | | (93,588,069 | ) | |
| Decrease in net assets from share transactions | | | (259,350,846 | ) | | | (108,698,488 | ) | |
| Total increase (decrease) in net assets | | | (151,747,112 | ) | | | 50,004,286 | | |
| Net assets at beginning of year | | | 2,016,402,425 | | | | 1,966,398,139 | | |
| Net assets at end of year | | $ | 1,864,655,313 | | | $ | 2,016,402,425 | | |
| Undistributed net investment income | | $ | 4,632,213 | | | $ | 11,466,073 | | |
(a) Class R and Class W shares are for the period from September 27, 2010 (commencement of operations) to May 31, 2011. Class R4 and Class R5 shares are for the period from March 7, 2011 (commencement of operations) to May 31, 2011.
The Accompanying Notes to Financial Statements are an integral part of this statement.
33
Statement of Changes in Net Assets (continued) – Columbia Strategic Income Fund
| Year ended May 31, | | 2011(a) | | 2010 | |
| | | Shares | | Dollars ($) | | Shares | | Dollars ($) | |
| Capital stock activity | |
| Class A shares | |
| Subscriptions | | | 22,444,538 | | | | 136,451,728 | | | | 44,764,586 | | | | 256,688,153 | | |
| Distributions reinvested | | | 7,415,133 | | | | 44,784,581 | | | | 6,141,676 | | | | 35,355,066 | | |
| Redemptions | | | (48,368,248 | ) | | | (294,113,944 | ) | | | (46,242,720 | ) | | | (267,867,373 | ) | |
| Net increase (decrease) | | | (18,508,577 | ) | | | (112,877,635 | ) | | | 4,663,542 | | | | 24,175,846 | | |
| Class B shares | |
| Subscriptions | | | 715,729 | | | | 4,343,096 | | | | 1,173,175 | | | | 6,680,312 | | |
| Distributions reinvested | | | 423,625 | | | | 2,552,887 | | | | 470,990 | | | | 2,700,137 | | |
| Redemptions | | | (6,851,911 | ) | | | (41,582,909 | ) | | | (8,675,260 | ) | | | (50,017,718 | ) | |
| Net decrease | | | (5,712,557 | ) | | | (34,686,926 | ) | | | (7,031,095 | ) | | | (40,637,269 | ) | |
| Class C shares | |
| Subscriptions | | | 4,802,590 | | | | 29,231,386 | | | | 11,456,717 | | | | 65,253,232 | | |
| Distributions reinvested | | | 1,104,074 | | | | 6,665,128 | | | | 824,665 | | | | 4,752,182 | | |
| Redemptions | | | (9,369,474 | ) | | | (56,956,485 | ) | | | (7,807,939 | ) | | | (45,308,794 | ) | |
| Net increase (decrease) | | | (3,462,810 | ) | | | (21,059,971 | ) | | | 4,473,443 | | | | 24,696,620 | | |
| Class J shares | |
| Redemptions | | | — | | | | — | | | | (12,782,816 | ) | | | (69,808,201 | ) | |
| Net decrease | | | — | | | | — | | | | (12,782,816 | ) | | | (69,808,201 | ) | |
| Class R shares | |
| Subscriptions | | | 406 | | | | 2,500 | | | | — | | | | — | | |
| Net increase | | | 406 | | | | 2,500 | | | | — | | | | — | | |
| Class R4 shares | |
| Subscriptions | | | 416 | | | | 2,500 | | | | — | | | | — | | |
| Net increase | | | 416 | | | | 2,500 | | | | — | | | | — | | |
| Class R5 shares | |
| Subscriptions | | | 416 | | | | 2,500 | | | | — | | | | — | | |
| Net increase | | | 416 | | | | 2,500 | | | | — | | | | — | | |
| Class W shares | |
| Subscriptions | | | 430 | | | | 2,650 | | | | — | | | | — | | |
| Redemptions | | | (24 | ) | | | (151 | ) | | | — | | | | — | | |
| Net increase | | | 406 | | | | 2,499 | | | | — | | | | — | | |
| Class Z shares | |
| Subscriptions | | | 20,596,037 | | | | 124,112,385 | | | | 33,564,084 | | | | 190,800,424 | | |
| Distributions reinvested | | | 1,743,711 | | | | 10,411,117 | | | | 1,389,689 | | | | 7,904,514 | | |
| Redemptions | | | (37,504,048 | ) | | | (225,259,815 | ) | | | (42,944,059 | ) | | | (245,830,422 | ) | |
| Net decrease | | | (15,164,300 | ) | | | (90,736,313 | ) | | | (7,990,286 | ) | | | (47,125,484 | ) | |
| Total net decrease | | | (42,846,600 | ) | | | (259,350,846 | ) | | | (18,667,212 | ) | | | (108,698,488 | ) | |
(a) Class R and Class W shares are for the period from September 27, 2010 (commencement of operations) to May 31, 2011. Class R4 and Class R5 shares are for the period from March 7, 2011 (commencement of operations) to May 31, 2011.
The Accompanying Notes to Financial Statements are an integral part of this statement.
34
Financial Highlights – Columbia Strategic Income Fund
The following tables are intended to help you understand the Fund's financial performance. Certain information reflects financial results for a single share of a class held for the periods shown. Per share net investment income (loss) amounts are calculated based on average shares outstanding during the period. Total returns assume reinvestment of all dividends and distributions. Total returns do not reflect payment of sales charges, if any, and are not annualized for periods of less than one year.
| | | Year ended May 31, | |
| | | 2011 | | 2010 | | 2009 | | 2008 | | 2007 | |
| Class A | |
| Per share data | |
| Net asset value, beginning of period | | $ | 5.84 | | | $ | 5.40 | | | $ | 5.91 | | | $ | 6.01 | | | $ | 5.88 | | |
| Income from investment operations: | |
| Net investment income | | | 0.32 | | | | 0.29 | | | | 0.29 | | | | 0.31 | | | | 0.33 | | |
Net realized and unrealized gain (loss) on investments, foreign currency, futures contracts
and credit default swap contracts | | | 0.43 | | | | 0.41 | | | | (0.41 | ) | | | (0.05 | ) | | | 0.16 | | |
| Total from investment operations | | | 0.75 | | | | 0.70 | | | | (0.12 | ) | | | 0.26 | | | | 0.49 | | |
| Less distributions to shareholders from: | |
| Net investment income | | | (0.43 | ) | | | (0.26 | ) | | | (0.38 | ) | | | (0.36 | ) | | | (0.36 | ) | |
| Tax return of capital | | | — | | | | — | | | | (0.01 | ) | | | — | | | | — | | |
| Total distributions to shareholders | | | (0.43 | ) | | | (0.26 | ) | | | (0.39 | ) | | | (0.36 | ) | | | (0.36 | ) | |
| Net asset value, end of period | | $ | 6.16 | | | $ | 5.84 | | | $ | 5.40 | | | $ | 5.91 | | | $ | 6.01 | | |
| Total return | | | 13.21 | % | | | 13.14 | % | | | (1.79 | %) | | | 4.47 | % | | | 8.57 | %(a) | |
| Ratios to average net assets(b) | |
| Expenses prior to fees waived or expenses reimbursed | | | 1.01 | % | | | 0.99 | % | | | 0.98 | % | | | 0.95 | % | | | 0.96 | % | |
| Net expenses after fees waived or expenses reimbursed(c)(d) | | | 1.00 | % | | | 0.99 | % | | | 0.98 | % | | | 0.95 | % | | | 0.95 | % | |
| Net investment income(d) | | | 5.22 | % | | | 5.09 | % | | | 5.46 | % | | | 5.24 | % | | | 5.49 | % | |
| Supplemental data | |
| Net assets, end of period (in thousands) | | $ | 956,132 | | | $ | 1,013,941 | | | $ | 913,087 | | | $ | 865,282 | | | $ | 835,878 | | |
| Portfolio turnover | | | 128 | % | | | 50 | % | | | 43 | % | | | 41 | % | | | 49 | % | |
See Accompanying Notes to Financial Highlights.
35
Financial Highlights (continued) – Columbia Strategic Income Fund
| | | Year ended May 31, | |
| | | 2011 | | 2010 | | 2009 | | 2008 | | 2007 | |
| Class B | |
| Per share data | |
| Net asset value, beginning of period | | $ | 5.84 | | | $ | 5.40 | | | $ | 5.91 | | | $ | 6.00 | | | $ | 5.88 | | |
| Income from investment operations: | |
| Net investment income | | | 0.27 | | | | 0.25 | | | | 0.25 | | | | 0.27 | | | | 0.28 | | |
Net realized and unrealized gain (loss) on investments, foreign currency, futures contracts
and credit default swap contracts | | | 0.43 | | | | 0.41 | | | | (0.41 | ) | | | (0.05 | ) | | | 0.16 | | |
| Total from investment operations | | | 0.70 | | | | 0.66 | | | | (0.16 | ) | | | 0.22 | | | | 0.44 | | |
| Less distributions to shareholders from: | |
| Net investment income | | | (0.38 | ) | | | (0.22 | ) | | | (0.34 | ) | | | (0.31 | ) | | | (0.32 | ) | |
| Tax return of capital | | | — | | | | — | | | | (0.01 | ) | | | — | | | | — | | |
| Total distributions to shareholders | | | (0.38 | ) | | | (0.22 | ) | | | (0.35 | ) | | | (0.31 | ) | | | (0.32 | ) | |
| Net asset value, end of period | | $ | 6.16 | | | $ | 5.84 | | | $ | 5.40 | | | $ | 5.91 | | | $ | 6.00 | | |
| Total return | | | 12.37 | % | | | 12.30 | % | | | (2.52 | %) | | | 3.86 | % | | | 7.59 | %(a) | |
| Ratios to average net assets(b) | |
| Expenses prior to fees waived or expenses reimbursed | | | 1.76 | % | | | 1.74 | % | | | 1.73 | % | | | 1.70 | % | | | 1.71 | % | |
| Net expenses after fees waived or expenses reimbursed(c)(d) | | | 1.75 | % | | | 1.74 | % | | | 1.73 | % | | | 1.70 | % | | | 1.70 | % | |
| Net investment income(d) | | | 4.47 | % | | | 4.43 | % | | | 4.71 | % | | | 4.50 | % | | | 4.75 | % | |
| Supplemental data | |
| Net assets, end of period (in thousands) | | $ | 61,684 | | | $ | 91,784 | | | $ | 122,915 | | | $ | 169,001 | | | $ | 217,270 | | |
| Portfolio turnover | | | 128 | % | | | 50 | % | | | 43 | % | | | 41 | % | | | 49 | % | |
See Accompanying Notes to Financial Highlights.
36
Financial Highlights (continued) – Columbia Strategic Income Fund
| | | Year ended May 31, | |
| | | 2011 | | 2010 | | 2009 | | 2008 | | 2007 | |
| Class C | |
| Per share data | |
| Net asset value, beginning of period | | $ | 5.84 | | | $ | 5.41 | | | $ | 5.91 | | | $ | 6.01 | | | $ | 5.89 | | |
| Income from investment operations: | |
| Net investment income | | | 0.28 | | | | 0.26 | | | | 0.26 | | | | 0.28 | | | | 0.29 | | |
Net realized and unrealized gain (loss) on investments, foreign currency, futures contracts
and credit default swap contracts | | | 0.44 | | | | 0.40 | | | | (0.41 | ) | | | (0.06 | ) | | | 0.15 | | |
| Total from investment operations | | | 0.72 | | | | 0.66 | | | | (0.15 | ) | | | 0.22 | | | | 0.44 | | |
| Less distributions to shareholders from: | |
| Net investment income | | | (0.39 | ) | | | (0.23 | ) | | | (0.34 | ) | | | (0.32 | ) | | | (0.32 | ) | |
| Tax return of capital | | | — | | | | — | | | | (0.01 | ) | | | — | | | | — | | |
| Total distributions to shareholders | | | (0.39 | ) | | | (0.23 | ) | | | (0.35 | ) | | | (0.32 | ) | | | (0.32 | ) | |
| Net asset value, end of period | | $ | 6.17 | | | $ | 5.84 | | | $ | 5.41 | | | $ | 5.91 | | | $ | 6.01 | | |
| Total return | | | 12.72 | % | | | 12.26 | % | | | (2.21 | %) | | | 3.84 | % | | | 7.74 | %(a) | |
| Ratios to average net assets(b) | |
| Expenses prior to fees waived or expenses reimbursed | | | 1.76 | % | | | 1.74 | % | | | 1.73 | % | | | 1.70 | % | | | 1.71 | % | |
| Net expenses after fees waived or expenses reimbursed(c)(d) | | | 1.60 | % | | | 1.59 | % | | | 1.58 | % | | | 1.55 | % | | | 1.55 | % | |
| Net investment income(d) | | | 4.62 | % | | | 4.47 | % | | | 4.85 | % | | | 4.63 | % | | | 4.89 | % | |
| Supplemental data | |
| Net assets, end of period (in thousands) | | $ | 185,859 | | | $ | 196,319 | | | $ | 157,492 | | | $ | 130,420 | | | $ | 106,401 | | |
| Portfolio turnover | | | 128 | % | | | 50 | % | | | 43 | % | | | 41 | % | | | 49 | % | |
See Accompanying Notes to Financial Highlights.
37
Financial Highlights (continued) – Columbia Strategic Income Fund
| | | Period ended
May 31, 2011(e) | |
| Class R | |
| Per share data | |
| Net asset value, beginning of period | | $ | 6.16 | | |
| Income from investment operations: | |
| Net investment income | | | 0.22 | | |
| Net realized and unrealized gain on investments, foreign currency, futures contracts and credit default swap contracts | | | 0.13 | | |
| Total from investment operations | | | 0.35 | | |
| Less distributions to shareholders from: | |
| Net investment income | | | (0.32 | ) | |
| Total distributions to shareholders | | | (0.32 | ) | |
| Net asset value, end of period | | $ | 6.19 | | |
| Total return | | | 5.86 | % | |
| Ratios to average net assets(b) | |
| Expenses prior to fees waived or expenses reimbursed | | | 1.36 | %(f) | |
| Net expenses after fees waived or expenses reimbursed(c)(d) | | | 1.25 | %(f) | |
| Net investment income(d) | | | 5.31 | %(f) | |
| Supplemental data | |
| Net assets, end of period (in thousands) | | $ | 3 | | |
| Portfolio turnover | | | 128 | % | |
See Accompanying Notes to Financial Highlights.
38
Financial Highlights (continued) – Columbia Strategic Income Fund
| | | Period ended
May 31, 2011(g) | |
| Class R4 | |
| Per share data | |
| Net asset value, beginning of period | | $ | 6.01 | | |
| Income from investment operations: | |
| Net investment income | | | 0.07 | | |
| Net realized and unrealized gain on investments, foreign currency, futures contracts and credit default swap contracts | | | 0.09 | | |
| Total from investment operations | | | 0.16 | | |
| Less distributions to shareholders from: | |
| Net investment income | | | (0.08 | ) | |
| Total distributions to shareholders | | | (0.08 | ) | |
| Net asset value, end of period | | $ | 6.09 | | |
| Total return | | | 2.62 | % | |
| Ratios to average net assets(b) | |
| Expenses prior to fees waived or expenses reimbursed | | | 0.89 | %(f) | |
| Net expenses after fees waived or expenses reimbursed(c)(d) | | | 0.89 | %(f) | |
| Net investment income(d) | | | 5.19 | %(f) | |
| Supplemental data | |
| Net assets, end of period (in thousands) | | $ | 3 | | |
| Portfolio turnover | | | 128 | % | |
See Accompanying Notes to Financial Highlights.
39
Financial Highlights (continued) – Columbia Strategic Income Fund
| | | Period ended
May 31, 2011(g) | |
| Class R5 | |
| Per share data | |
| Net asset value, beginning of period | | $ | 6.01 | | |
| Income from investment operations: | |
| Net investment income | | | 0.08 | | |
| Net realized and unrealized gain on investments, foreign currency, futures contracts and credit default swap contracts | | | 0.08 | | |
| Total from investment operations | | | 0.16 | | |
| Less distributions to shareholders from: | |
| Net investment income | | | (0.08 | ) | |
| Total distributions to shareholders | | | (0.08 | ) | |
| Net asset value, end of period | | $ | 6.09 | | |
| Total return | | | 2.68 | % | |
| Ratios to average net assets(b) | |
| Expenses prior to fees waived or expenses reimbursed | | | 0.63 | %(f) | |
| Net expenses after fees waived or expenses reimbursed(c)(d) | | | 0.63 | %(f) | |
| Net investment income(d) | | | 5.45 | %(f) | |
| Supplemental data | |
| Net assets, end of period (in thousands) | | $ | 3 | | |
| Portfolio turnover | | | 128 | % | |
See Accompanying Notes to Financial Highlights.
40
Financial Highlights (continued) – Columbia Strategic Income Fund
| | | Period ended
May 31, 2011(e) | |
| Class W | |
| Per share data | |
| Net asset value, beginning of period | | $ | 6.16 | | |
| Income from investment operations: | |
| Net investment income | | | 0.21 | | |
| Net realized and unrealized gain on investments, foreign currency, futures contracts and credit default swap contracts | | | 0.12 | | |
| Total from investment operations | | | 0.33 | | |
| Less distributions to shareholders from: | |
| Net investment income | | | (0.33 | ) | |
| Total distributions to shareholders | | | (0.33 | ) | |
| Net asset value, end of period | | $ | 6.16 | | |
| Total return | | | 5.53 | % | |
| Ratios to average net assets(b) | |
| Expenses prior to fees waived or expenses reimbursed | | | 0.89 | %(f) | |
| Net expenses after fees waived or expenses reimbursed(c)(d) | | | 0.89 | %(f) | |
| Net investment income(d) | | | 5.10 | %(f) | |
| Supplemental data | |
| Net assets, end of period (in thousands) | | $ | 3 | | |
| Portfolio turnover | | | 128 | % | |
See Accompanying Notes to Financial Highlights.
41
Financial Highlights (continued) – Columbia Strategic Income Fund
| | | Year ended May 31, | |
| | | 2011 | | 2010 | | 2009 | | 2008 | | 2007 | |
| Class Z | |
| Per share data | |
| Net asset value, beginning of period | | $ | 5.78 | | | $ | 5.35 | | | $ | 5.85 | | | $ | 5.95 | | | $ | 5.83 | | |
| Income from investment operations: | |
| Net investment income | | | 0.33 | | | | 0.31 | | | | 0.30 | | | | 0.32 | | | | 0.34 | | |
Net realized and unrealized gain (loss) on investments, foreign currency, futures contracts
and credit default swap contracts | | | 0.42 | | | | 0.39 | | | | (0.40 | ) | | | (0.05 | ) | | | 0.15 | | |
| Total from investment operations | | | 0.75 | | | | 0.70 | | | | (0.10 | ) | | | 0.27 | | | | 0.49 | | |
| Less distributions to shareholders from: | |
| Net investment income | | | (0.44 | ) | | | (0.27 | ) | | | (0.39 | ) | | | (0.37 | ) | | | (0.37 | ) | |
| Tax return of capital | | | — | | | | — | | | | (0.01 | ) | | | — | | | | — | | |
| Total distributions to shareholders | | | (0.44 | ) | | | (0.27 | ) | | | (0.40 | ) | | | (0.37 | ) | | | (0.37 | ) | |
| Net asset value, end of period | | $ | 6.09 | | | $ | 5.78 | | | $ | 5.35 | | | $ | 5.85 | | | $ | 5.95 | | |
| Total return | | | 13.46 | % | | | 13.36 | % | | | (1.38 | %) | | | 4.77 | % | | | 8.73 | %(a) | |
| Ratios to average net assets(b) | |
| Expenses prior to fees waived or expenses reimbursed | | | 0.76 | % | | | 0.74 | % | | | 0.73 | % | | | 0.70 | % | | | 0.72 | % | |
| Net expenses after fees waived or expenses reimbursed(c)(d) | | | 0.75 | % | | | 0.74 | % | | | 0.73 | % | | | 0.70 | % | | | 0.71 | % | |
| Net investment income(d) | | | 5.47 | % | | | 5.35 | % | | | 5.71 | % | | | 5.47 | % | | | 5.73 | % | |
| Supplemental data | |
| Net assets, end of period (in thousands) | | $ | 660,970 | | | $ | 714,358 | | | $ | 704,118 | | | $ | 726,217 | | | $ | 524,975 | | |
| Portfolio turnover | | | 128 | % | | | 50 | % | | | 43 | % | | | 41 | % | | | 49 | % | |
| Notes to Financial Highlights | |
(a) Total return includes a voluntary reimbursement by the investment adviser for a realized investment loss due to a trading error. This reimbursement increased total return and net asset value per share by less than 0.01% and less than $0.01, respectively.
(b) In addition to the fees and expenses which the Fund bears directly, the Fund indirectly bears a pro rata share of the fees and expenses of the acquired funds in which it invests. Such indirect expenses are not included in the reported expense ratios.
(c) The Investment Manager and its affiliates agreed to waive/reimburse certain fees and expenses.
(d) The benefits derived from expense reductions had an impact of less than 0.01%.
(e) For the period from September 27, 2010 (commencement of operations) to May 31, 2011.
(f) Annualized.
(g) For the period from March 07, 2011 (commencement of operations) to May 31, 2011.
See Accompanying Notes to Financial Highlights.
42
Notes to Financial Statements – Columbia Strategic Income Fund
May 31, 2011
Note 1. Organization
Columbia Strategic Income Fund (the Fund), a series of Columbia Funds Series Trust I (the Trust), is a diversified fund. The Trust is registered under the Investment Company Act of 1940, as amended (the 1940 Act), as an open-end management investment company organized as a Massachusetts business trust.
Investment Objective
The Fund seeks total return, consisting of current income and capital appreciation.
Fund Shares
The Trust may issue an unlimited number of shares (without par value). The Fund offers Class A, Class B, Class C, Class R, Class R4, Class R5, Class W, and Class Z shares. All share classes have identical voting, dividend and liquidation rights. Each share class has its own expense structure and sales charges, as applicable.
Class A shares are subject to a maximum front-end sales charge of 4.75% based on the initial investment amount. Class A shares purchased without an initial sales charge in accounts aggregating $1 million to $50 million at the time of purchase are subject to a contingent deferred sales charge (CDSC) if the shares are sold within 18 months of purchase, charged as follows: 1.00% CDSC if redeemed within 12 months of purchase, and 0.50% CDSC if redeemed more than 12, but less than 18, months after purchase.
Class B shares may be subject to a maximum CDSC of 5.00% based upon the holding period after purchase. Class B shares will generally convert to Class A shares eight years after purchase. The Fund no longer accepts investments by new or existing investors in the Fund's Class B shares, except in connection with the reinvestment of any dividend and/or capital gain distributions in Class B shares of the Fund and exchanges by existing Class B shareholders of certain other funds within the Columbia Family of Funds.
Class C shares are subject to a 1.00% CDSC on shares redeemed within one year of purchase.
Class R shares are not subject to sales charges and are available to qualifying institutional investors. Class R shares commenced operations on September 27, 2010.
The Fund is authorized to issue Class R4 and Class R5 shares, which are not subject to sales charges; however, these share classes are closed to new investors. Class R4 and Class R5 shares commenced operations on March 7, 2011.
Class W shares are not subject to sales charges and are only available to investors purchasing through authorized investment programs managed by investment professionals, including discretionary managed account programs. Class W shares commenced operations on September 27, 2010.
Class Z shares are not subject to sales charges, and are only available to certain investors, as described in the Fund's prospectus.
Note 2. Summary of Significant Accounting Policies
Use of Estimates
The preparation of financial statements in accordance with U.S. generally accepted accounting principles (GAAP) requires management to make certain estimates and assumptions that affect the reported amounts of assets and liabilities, the disclosure of contingent assets and liabilities at the date of the financial statements and the reported amounts of revenue and expenses during the reporting period. Actual results could differ from those estimates.
The following is a summary of significant accounting policies consistently followed by the Fund in the preparation of its financial statements.
Security Valuation
All securities are valued at the close of business of the New York Stock Exchange (NYSE). Equity securities are valued at the last quoted sales price on the principal exchange or market on which they trade, except for securities traded on the NASDAQ Stock Market, which are valued at the NASDAQ official close price. Unlisted securities or listed securities for which there were no sales during the day are valued at the mean of the latest quoted bid and asked prices on such exchanges or markets.
Debt securities are generally traded in the over-the-counter market and are valued by an independent pricing service using an evaluated bid. When market quotes are not readily available, the pricing service, in determining fair values of debt securities, takes into consideration such factors as current quotations by broker/dealers, coupon, maturity, quality, type of issue, trading characteristics, and other yield and risk factors it deems relevant in determining valuations.
Certain debt securities, which tend to be more thinly traded and of lesser quality, are priced based on fundamental analysis of the financial condition of the issuer and the estimated value of any collateral. Valuations developed through pricing techniques may vary
43
Columbia Strategic Income Fund, May 31, 2011
from the actual amounts realized upon sale of the securities, and the potential variation may be greater for those securities valued using fundamental analysis.
Foreign securities are valued based on quotations from the principal market in which such securities are normally traded. However, many securities markets and exchanges outside the U.S. close prior to the close of the NYSE; therefore, the closing prices for securities in such markets or on such exchanges may not fully reflect events that occur after such close but before the close of the NYSE. In those situations, foreign securities will be fair valued pursuant to the policy adopted by the Board of Trustees (the Board), including utilizing a third party pricing service to determine these fair values. The third party pricing service takes into account multiple factors, including, but not limited to, movements in the U.S. securities markets, certain depositary receipts, futures contracts and foreign exchange rates that have occurred subsequent to the close of the foreign exchange, to determine a good faith estimate that reasonably reflects the current market conditions as of the close of the NYSE. The fair value of a security is likely to be different from the quoted or published price, if available.
Investments in other open-end investment companies, including money market funds, are valued at net asset value.
Short-term securities purchased within 60 days to maturity are valued at amortized cost, which approximates market value. The value of short-term securities originally purchased with maturities greater than 60 days is determined based on an amortized value to par upon reaching 60 days to maturity. Short-term securities maturing in more than 60 days from the valuation date are valued at the market price or approximate market value based on current interest rates.
Forward foreign currency exchange contracts are marked-to-market daily based upon foreign currency exchange rates provided by a pricing service.
Futures are valued daily based upon the last sale price at the close of the market on the principal exchange on which they are traded.
Swap transactions are valued through an independent pricing service or broker, or if neither is available, through an internal model based upon observable inputs.
The policy adopted by the Board generally contemplates the use of fair valuation in the event that price quotations or valuations are not readily available, price quotations or valuations from other sources are not reflective of market value and thus deemed unreliable, or a significant event has occurred in relation to a security or class of securities (such as foreign securities) that is not reflected in price quotations or valuations from other sources. A fair value price is a good faith estimate of the value of a security at a given point in time.
Foreign Currency Transactions and Translation
The values of all assets and liabilities denominated in foreign currencies are translated into U.S. dollars at that day's exchange rates. Net realized and unrealized gains (losses) on foreign currency transactions and translations include gains (losses) arising from the fluctuation in exchange rates between trade and settlement dates on securities transactions, gains (losses) arising from the disposition of foreign currency and currency gains (losses) between the accrual and payment dates on dividends, interest income and foreign withholding taxes.
For financial statement purposes, the Fund does not distinguish that portion of gains (losses) on investments which is due to changes in foreign exchange rates from that which is due to changes in market prices of the investments. Such fluctuations are included with the net realized and unrealized gains (losses) on investments in the Statement of Operations.
Derivative Instruments
The Fund invests in certain derivative instruments as detailed below to meet its investment objectives. Derivatives are instruments whose values depend on, or are derived from, in whole or in part, the value of one or more other assets, such as securities, currencies, commodities or indices. Derivative instruments may be used to maintain cash reserves while maintaining exposure to certain other assets, to offset anticipated declines in values of investments, to facilitate trading, to reduce transaction costs and to pursue higher investment returns. The Fund may also use derivative instruments to mitigate certain investment risks, such as foreign currency exchange rate risk, interest rate risk and credit risk. Derivatives may involve various risks, including the potential inability of the counterparty to fulfill its obligation under the terms of the contract, the potential for an illiquid secondary market and the potential for market movements which may expose the Fund to gains or losses in excess of the amount shown in the Statement of Assets and Liabilities.
The Fund and any counterparty are required to maintain an agreement that requires the Fund and that counterparty to monitor (on a daily basis) the net fair value of all derivatives entered into pursuant to the contract between the Fund and such counterparty. If the net fair value of such derivatives between the Fund and that counterparty exceeds a certain threshold (as defined in the agreement), the Fund or the counterparty (as the case may be) is
44
Columbia Strategic Income Fund, May 31, 2011
required to post cash and/or securities as collateral. Fair values of derivatives presented in the financial statements are not netted with the fair value of other derivatives or with any collateral amounts posted by the Fund or any counterparty.
Forward Foreign Currency Exchange Contracts
Forward foreign currency exchange contracts are agreements between two parties to buy and sell a currency at a set price on a future date. These contracts are intended to be used to minimize the exposure to foreign exchange rate fluctuations during the period between the trade and settlement dates of the contract. The Fund utilized forward foreign currency exchange contracts to shift foreign currency exposure back to U.S. dollars.
The values of forward foreign currency exchange contracts fluctuate with changes in foreign currency exchange rates. The Fund will record a realized gain or loss when the forward foreign currency exchange contract is closed.
The use of forward foreign currency exchange contracts does not eliminate fluctuations in the prices of the Fund's portfolio securities. The risks of forward foreign currency exchange contracts include movement in the values of the foreign currencies relative to the U.S. dollar (or other foreign currencies) and the possibility that counterparties will not complete their contractual obligations, which may be in excess of the amount reflected, if any, in the Statement of Assets and Liabilities.
Futures Contracts
Futures contracts represent commitments for the future purchase or sale of an asset at a specified price on a specified date. The Fund bought and sold futures contracts to manage the duration and yield curve exposure of the Fund versus the benchmark and manage exposure to movements in interest rates. Upon entering into futures contracts, the Fund bears risks which may include interest rates, exchange rates or securities prices moving unexpectedly, in which case, the Fund may not achieve the anticipated benefits of the futures contracts and may realize a loss. Additional risks include counterparty credit risk, the possibility of an illiquid market, and that a change in the value of the contract or option may not correlate with changes in the value of the underlying asset.
Upon entering into a futures contract, the Fund pledges cash or securities with the broker in an amount sufficient to meet the initial margin requirement. Subsequent payments (variation margin) are made or received by the Fund each day. The variation margin payments are equal to the daily change in the contract value and are recorded as variation margin receivable or payable and are offset in unrealized gains or losses. The Fund recognizes a realized gain or loss when the contract is closed or expires. Futures contracts involve, to varying degrees, risk of loss in excess of the variation margin disclosed in the Statement of Assets and Liabilities.
Credit Default Swap Contracts
Credit default swap contracts are agreements in which one party pays fixed periodic payments to a counterparty in consideration for a guarantee from the counterparty to make a specific payment should a specified negative credit event(s) take place. The Fund entered into a credit default swap contract to increase or decrease its credit exposure to a single issuer of debt securities.
As the purchaser of a credit default swap contract, the Fund purchases protection by paying a periodic interest rate on the notional amount to the counterparty. The interest amount is accrued daily as a component of unrealized appreciation (depreciation) and is recorded as a realized loss upon payment. If a credit event as specified in the contract occurs, the Fund may have the option either to deliver the reference obligation to the seller in exchange for a cash payment of its par amount, or to receive a net cash settlement equal to the par amount less an agreed-upon value of the reference obligation as of the date of the credit event. The difference between the value of the obligation or cash delivered and the notional amount received will be recorded as a realized gain (loss).
As the seller of a credit default swap contract, the Fund sells protection to a buyer and will generally receive a periodic interest rate on the notional amount. The interest amount is accrued daily as a component of unrealized appreciation (depreciation) and is recorded as a realized gain upon receipt of the payment. If a credit event as specified in the contract occurs, the Fund may either be required to accept the reference obligation from the buyer in exchange for a cash payment of its notional amount, or to pay the buyer a net cash settlement equal to the notional amount less an agreed-upon value of the reference obligation as of the date of the credit event. The difference between the value of the obligation or cash received and the notional amount paid will be recorded as a realized gain (loss).
The notional amounts and market values of credit default swap contracts are not recorded in the financial statements. Any premium paid or received by the Fund upon entering into a credit default swap contract is recorded as an asset or liability, respectively, and amortized daily as a component of realized gain (loss) in the Statement of Operations. Credit default swap contracts are valued
45
Columbia Strategic Income Fund, May 31, 2011
daily, and the change in value is recorded as unrealized appreciation (depreciation) until the termination of the credit default swap contract, at which time a realized gain (loss) is recorded.
Credit default swap contracts can involve greater risks than if a fund had invested in the reference obligation directly since, in addition to general market risks, credit default swap contracts are subject to counterparty credit risk, leverage risk, hedging risk, correlation risk and liquidity risk. The Fund will enter into credit default swap contracts only with counterparties that meet certain standards of creditworthiness.
Effects of Derivative Transactions in the Financial Statements
The following tables are intended to provide additional information about the effect of derivatives on the financial statements of the Fund including: the fair value of derivatives by risk category and the location of those fair values in the Statement of Assets and Liabilities; the impact of derivative transactions on the Fund's operations over the period including realized gains or losses and unrealized gains or losses. The derivative schedules following the Portfolio of Investments present additional information regarding derivative instruments outstanding at the end of the period, if any.
Fair Values of Derivative Instruments at May 31, 2011
| | | Asset derivatives | | Liability derivatives | |
| Risk Exposure Category | | Statement of Assets and
Liabilities Location | | Fair Value | | Statement of Assets and
Liabilities Location | | Fair Value | |
| Credit risk | | | | | | | | Unrealized depreciation
on credit default swap contract | | $ | 244,985 | | |
Foreign currency exchange
rate risk | | Unrealized appreciation on
forward foreign currency
exchange contracts | | $ | 1,361,010 | | | Unrealized depreciation on
forward foreign currency
exchange contracts | | | 1,171,358 | | |
| Interest rate risk | | Net assets—unrealized
appreciation on
futures contracts | | | 511,931 | * | | Net assets—unrealized
depreciation on
futures contracts | | | (471,042 | )* | |
| Total | | | | | | $ | 1,872,941 | | | | | | | $ | 945,301 | | |
* Includes cumulative appreciation (depreciation) of futures contracts as reported in the Futures Contracts Outstanding table following the Portfolio of Investments. Only the current day's variation margin is reported in receivables or payables in the Statement of Assets and Liabilities.
Effect of Derivative Instruments in the Statement of Operations for the Year Ended May 31, 2011
| Amount of Realized Gain (Loss) on Derivatives Recognized in Income | |
| Risk Exposure Category | | Forward Foreign Currency
Exchange Contracts | | Futures
Contracts | | Credit Default
Swap Contracts | | Total | |
| Credit risk | | $ | — | | | $ | — | | | $ | (140,574 | ) | | $ | (140,574 | ) | |
| Foreign currency exchange rate risk | | | (602,853 | ) | | | — | | | | — | | | $ | (602,853 | ) | |
| Interest rate risk | | | — | | | | (4,039,903 | ) | | | — | | | $ | (4,039,903 | ) | |
| Total | | $ | (602,853 | ) | | $ | (4,039,903 | ) | | $ | (140,574 | ) | | $ | (4,783,330 | ) | |
| Change in Unrealized Appreciation (Depreciation) on Derivatives Recognized in Income | |
| Risk Exposure Category | | Forward Foreign Currency
Exchange Contracts | | Futures
Contracts | | Credit Default
Swap Contracts | | Total | |
| Credit risk | | $ | — | | | $ | — | | | $ | (136,743 | ) | | $ | (136,743 | ) | |
| Foreign currency exchange rate risk | | | (586,777 | ) | | | — | | | | — | | | $ | (586,777 | ) | |
| Interest rate risk | | | — | | | | 40,889 | | | | — | | | $ | 40,889 | | |
| Total | | $ | (586,777 | ) | | $ | 40,889 | | | $ | (136,743 | ) | | $ | (682,631 | ) | |
46
Columbia Strategic Income Fund, May 31, 2011
Volume of Derivative Instruments for the Year Ended May 31, 2011
| | | Contracts
Opened | |
| Forward Foreign Currency Exchange Contracts | | | 319 | | |
| Futures Contracts | | | 19,229 | | |
| Credit Default Swap Contracts | | | — | | |
| | | Aggregate
Notional
Opened | |
| Credit Default Swap Contracts—Buy Protection | | $ | — | | |
Repurchase Agreements
The Fund may engage in repurchase agreement transactions with institutions that management has determined are creditworthy. The Fund, through the custodian, receives delivery of the underlying securities collateralizing a repurchase agreement. Management is responsible for determining that the collateral is at least equal, at all times, to the value of the repurchase obligation including interest. A repurchase agreement transaction involves certain risks in the event of default or insolvency of the counterparty. These risks include possible delays in or restrictions on a Fund's ability to dispose of the underlying securities and a possible decline in the value of the underlying securities during the period while the Fund seeks to assert its rights.
Delayed Delivery Securities
The Fund may trade securities on other than normal settlement terms, including securities purchased or sold on a "when-issued" basis. This may increase the risk if the other party to the transaction fails to deliver and causes the Fund to subsequently invest at less advantageous prices. The Fund identifies within its portfolio of investments cash or liquid securities in an amount equal to the delayed delivery commitment.
Loan Participations and Commitments
The Fund may invest in loan participations. When the Fund purchases loan participation, the Fund typically enters into a contractual relationship with the lender or third party selling such participation (Selling Participant), but not the borrower. However, the Fund assumes the credit risk of the borrower, Selling Participant and any other persons interpositioned between the Fund and the borrower. The Fund may not directly benefit from the collateral supporting the senior loan which it has purchased from the Selling Participant.
Stripped Securities
The Fund may invest in Interest only (IO) and Principal Only (PO) stripped mortgage-backed securities. These securities are derivative multi-class mortgage securities structured so that one class receives most, if not all, of the principal from the underlying mortgage assets, while the other class receives most, if not all, of the interest and the remainder of the principal. If the underlying mortgage assets experience greater than anticipated prepayments of principal, the Fund may fail to fully recoup its initial investment in an IO security, therefore the daily interest accrual factor is adjusted each month to reflect the paydown of principal. The market value of these securities can be extremely volatile in response to changes in interest rates. Credit risk reflects the risk that the Fund may not receive all or part of its principal because the issuer or credit enhancer has defaulted on its obligation.
Security Transactions
Security transactions are accounted for on the trade date. Cost is determined and gains (losses) are based upon the specific identification method for both financial statement and federal income tax purposes.
Income Recognition
Interest income is recorded on the accrual basis. Market premium and discount are amortized and accreted, respectively, on all debt securities, unless otherwise noted. Original issue discount is accreted to interest income over the life of the security with a corresponding increase in the cost basis, if any.
Corporate actions and dividend income are recorded net of any non-reclaimable tax withholdings, on the ex-dividend date or upon receipt of ex-dividend notification in the case of certain foreign securities.
The value of additional securities received as an income payment is recorded as income and increases the cost basis of such securities.
Expenses
General expenses of the Trust are allocated to the Fund and other funds of the Trust based upon relative net assets or other expense allocation methodologies determined by the nature of the expense.
47
Columbia Strategic Income Fund, May 31, 2011
Expenses directly attributable to a specific class of shares are charged to that share class. Expenses directly attributable to the Fund are charged to the Fund.
Determination of Class Net Asset Value
All income, expenses (other than class-specific expenses, which are charged to that share class, as shown in the Statement of Operations) and realized and unrealized gains (losses) are allocated to each class of the Fund on a daily basis, based on the relative net assets of each class, for purposes of determining the net asset value of each class.
Federal Income Tax Status
The Fund intends to qualify each year as a regulated investment company under Subchapter M of the Internal Revenue Code, as amended, and will distribute substantially all of its tax exempt or taxable income, if any, for its tax year, and as such will not be subject to federal income taxes. In addition, the Fund intends to distribute in each calendar year substantially all of its net investment income, capital gains and certain other amounts, if any, such that the Fund should not be subject to federal excise tax. Therefore, no federal income or excise tax provision is recorded.
Foreign Taxes
The Fund may be subject to foreign taxes on income, gains on investments or currency repatriation, a portion of which may be recoverable. The Fund will accrue such taxes and recoveries, as applicable, based upon its current interpretation of tax rules and regulations that exist in the markets in which it invests.
Realized gains in certain countries may be subject to foreign taxes at the Fund level, based on statutory rates. The Fund accrues for such foreign taxes on net realized and unrealized gains at the appropriate rate for each jurisdiction.
Distributions to Shareholders
Distributions from net investment income are declared and paid monthly. Net realized capital gains, if any, are distributed along with the income dividend. Income distributions and capital gain distributions are determined in accordance with federal income tax regulations which may differ from GAAP.
Guarantees and Indemnifications
Under the Trust's organizational documents and, in some cases, by contract, its officers and trustees are indemnified against certain liabilities arising out of the performance of their duties to the Fund. In addition, certain of the Fund's contracts with its service providers contain general indemnification clauses. The Fund's maximum exposure under these arrangements is unknown since the amount of any future claims that may be made against the Fund cannot be determined and the Fund has no historical basis for predicting the likelihood of any such claims.
Note 3. Fees and Compensation Paid to Affiliates
Investment Management Fees
Under an Investment Management Services Agreement (IMSA), Columbia Management Investment Advisers, LLC (the Investment Manager), a wholly-owned subsidiary of Ameriprise Financial, Inc. (Ameriprise Financial), determines which securities will be purchased, held or sold. In September 2010, the Board approved an amended IMSA that includes an annual management fee rate that declines from 0.530% to 0.353% as the Fund's net assets increase. The amended IMSA was approved by the Fund's shareholders at a meeting held on February 15, 2011. The amended IMSA became effective on May 1, 2011. Prior to May 1, 2011, the management fee was equal to a percentage of the Fund's average daily net assets that declined from 0.60% to 0.49% as the Fund's net assets increased. The management fee for the year ended May 31, 2011 was 0.54% of the Fund's average daily net assets.
Administration Fees
Under an Administrative Services Agreement, the Investment Manager serves as the Fund Administrator. In September 2010, the Board approved an amended Administrative Services Agreement that includes an annual fee for administration and accounting services equal to a percentage of the Fund's average daily net assets that declines from 0.07% to 0.04% as the Fund's net assets increase. The amended Administrative Services Agreement became effective on May 1, 2011. Prior to May 1, 2011, the Fund Administrator did not receive a fee of its services under the Administrative Services Agreement. The administrative fee for the period from May 1, 2011 to May 31, 2011 was 0.06% of the Fund's average daily net assets.
Pricing and Bookkeeping Fees
Prior to May 16, 2011, the Fund had entered into a Financial Reporting Services Agreement (the Financial Reporting Services Agreement) with State Street Bank and Trust Company (State Street) and the Investment Manager pursuant to which State Street provided financial reporting services to the Fund. The Fund also entered into an Accounting Services Agreement (collectively with the Financial
48
Columbia Strategic Income Fund, May 31, 2011
Reporting Services Agreement, the State Street Agreements) with State Street and the Investment Manager pursuant to which State Street provided accounting services to the Fund. Under the State Street Agreements, the Fund paid State Street an annual fee of $38,000 paid monthly plus an additional monthly fee based on an annualized percentage rate of average daily net assets of the Fund for the month. The aggregate fee did not exceed $140,000 per year (exclusive of out-of-pocket expenses and charges). The Fund also reimbursed State Street for certain out-of-pocket expenses and charges. Effective May 16, 2011, these services are now provided under the Administrative Services Agreement discussed above.
Compensation of Board Members
Trustees are compensated for their services to the Fund, as set forth on the Statement of Operations. The Trust's eligible Trustees may participate in a deferred compensation plan which may be terminated at any time. Obligations of the plan will be paid solely out of the Fund's assets.
Compensation of Chief Compliance Officer
The board has appointed a Chief Compliance Officer to the Fund in accordance with federal securities regulations. The Fund, along with other affiliated funds, pays its pro-rata share of the expenses associated with the Chief Compliance Officer. The Fund's expenses for the Chief Compliance Officer will not exceed $15,000 per year.
Transfer Agent Fees
Under a Transfer Agency Agreement, Columbia Management Investment Services Corp. (the Transfer Agent), an affiliate of the Investment Manager and a wholly-owned subsidiary of Ameriprise Financial, is responsible for providing transfer agency services to the Fund. The Transfer Agent has contracted with Boston Financial Data Services (BFDS) to serve as sub-transfer agent.
The Transfer Agent receives monthly account-based service fees based on the number of open accounts and is reimbursed by the Fund for the fees and expenses the Transfer Agent pays to financial intermediaries that maintain omnibus accounts with the Fund that is a percentage of the average aggregate value of the Fund's shares maintained in each such omnibus account (other than omnibus accounts for which American Enterprise Investment Services Inc. is the broker of record or accounts where the beneficial shareholder is a customer of Ameriprise Financial Services, Inc., which are paid a per account fee). The Transfer Agent pays the fees of BFDS for services as sub-transfer agent and is not entitled to reimbursement for such fees from the Fund (with the exception of out-of-pocket fees). The Transfer Agent also receives compensation from fees for various shareholder services and reimbursements for certain out-of-pocket expenses. Total transfer agent fees for Class R4 and Class R5 shares are subject to an annual limitation of not more than 0.05% of the average daily net assets attributable to each share class.
For the year ended May 31, 2011, the Fund's annualized effective transfer agent fee rate for each class as a percentage of each class' average daily net assets were as follows:
| Class A | | | 0.15 | % | |
| Class B | | | 0.15 | | |
| Class C | | | 0.15 | | |
| Class R | | | 0.17 | | |
| Class R4 | | | 0.05 | | |
| Class R5 | | | 0.05 | | |
| Class W | | | 0.07 | | |
| Class Z | | | 0.15 | | |
An annual minimum account balance fee of $20 may apply to certain accounts with a value below the Fund's initial minimum investment requirements to reduce the impact of small accounts on transfer agent fees. These minimum account balance fees are recorded as part of expense reductions on the Statement of Operations. For the year ended May 31, 2011, no minimum account balance fees were charged by the Fund.
Plan Administration Fees
Under a Plan Administration Services Agreement with the Transfer Agent, the Fund pays an annual fee at a rate of 0.25% of the Fund's average daily net assets attributable to Class R4 shares for the provision of various administrative, recordkeeping, communication and educational services.
Underwriting Discounts, Service and Distribution Fee
The Fund has an agreement with Columbia Management Investment Distributors, Inc. (the Distributor), an affiliate of the Investment Manager and a wholly-owned subsidiary of Ameriprise Financial, for distribution and shareholder services. Pursuant to Rule 12b-1 under the 1940 Act, the Board of Trustees has approved, and the Fund has adopted, distribution and shareholder service plans (the Plans) which set the distribution and service fees for the Fund. These fees are
49
Columbia Strategic Income Fund, May 31, 2011
calculated daily and are intended to compensate the Distributor and/or eligible selling and/or servicing agents for selling shares of the Fund and providing services to investors.
The Plans require the payment of a monthly service fee to the Distributor which is equal to 0.15% annually of the average daily net assets attributable to outstanding Class A and Class B shares of the Fund issued prior to January 1, 1993 and 0.25% annually of the average daily net assets attributable to outstanding Class A, Class B, Class C and Class W shares issued thereafter. This arrangement results in an annual rate of service fee for shares that is a blend between the 0.15% and 0.25% rates. For the year ended May 31, 2011, the Fund's effective service fee rate was 0.25% of the Fund's average daily net assets attributable to Class A, Class B, Class C and Class W shares.
Effective July 1, 2011, the Fund pays a monthly service fee to the Distributor equal to 0.25% annually on the average daily net assets attributable to all Class A, Class B, Class C and Class W shares of the Fund.
The Plans also require the payment of a monthly distribution fee to the Distributor at the maximum annual rates of 0.75% of the average daily net assets attributable to Class B and Class C shares, 0.50% of the average daily net assets attributable to Class R shares and 0.25% of the average daily net assets attributable to Class W shares.
The Distributor has voluntarily agreed to waive a portion of the distribution fee for Class C shares so that the combined distribution and service fee does not exceed 0.85% annually of Class C shares average daily net assets. This arrangement may be modified or terminated by the Distributor at any time.
The Fund may pay a distribution fee of up to 0.25% of the Fund's average daily net assets attributable to Class W shares and a service fee of up to 0.25% of the Fund's average daily net assets attributable to Class W shares, provided, however, that the aggregate fee shall not exceed 0.25% of the Fund's average daily net assets attributable to Class W shares.
Sales Charges
Sales charges, including front-end charges and CDSCs, received by the Distributor for distributing Fund shares were $83,447 for Class A, $71,922 for Class B and $15,383 for Class C for the year ended May 31, 2011.
Expenses Waived/Reimbursed by the Investment Manager and its Affiliates
Effective May 1, 2011, the Investment Manager and certain of its affiliates have contractually agreed to waive fees and/or reimburse expenses (excluding certain fees and expenses described below), through September 30, 2012, unless sooner terminated at the sole direction of the Board, so that the Fund's net operating expenses, after giving effect to fees waived/expenses reimbursed and any balance credits and/or overdraft charges from the Fund's custodian, do not exceed the following annual rates as a percentage of the class' average daily net assets:
| Class A | | | 1.02 | % | |
| Class B | | | 1.77 | | |
| Class C | | | 1.77 | | |
| Class R | | | 1.27 | | |
| Class R4 | | | 0.97 | | |
| Class R5 | | | 0.72 | | |
| Class W | | | 1.02 | | |
| Class Z | | | 0.77 | | |
For the period September 27, 2010 through April 30, 2011, the Investment Manager and certain of its affiliates contractually agreed to waive fees and/or reimburse expenses (excluding certain fees and expenses described below), so that the Fund's net operating expenses, after giving effect to fees waived/expenses reimbursed and any balance credits and/or overdraft charges from the Fund's custodian, did not exceed the following annual rates as a percentage of the class' average daily net assets:
| Class A | | | 1.05 | % | |
| Class B | | | 1.80 | | |
| Class C | | | 1.80 | | |
| Class R | | | 1.30 | | |
| Class R4 | | | 0.98 | | |
| Class R5 | | | 0.73 | | |
| Class W | | | 1.05 | | |
| Class Z | | | 0.80 | | |
Under the agreement, the following fees and expenses are excluded from the waiver/reimbursement commitment, and therefore will be paid by the Fund, if applicable: taxes (including foreign transaction
50
Columbia Strategic Income Fund, May 31, 2011
taxes), expenses associated with investments in affiliated and non-affiliated pooled investment vehicles (including mutual funds and exchange traded funds), transaction costs and brokerage commissions, costs related to any securities lending program, dividend expenses associated with securities sold short, inverse floater program fees and expenses, transaction charges and interest on borrowed money, interest, extraordinary expenses and any other expenses the exclusion of which is specifically approved by the Fund's Board. This agreement may be modified or amended only with approval from all parties.
Prior to September 27, 2010, the Investment Manager voluntarily reimbursed a portion of the Fund's expenses so that the Fund's net ordinary operating expenses (excluding any distribution and service fees, brokerage commissions, interest, taxes and extraordinary expenses, but including custodian charges relating to overdrafts, if any,) after giving effect to any balance credits from the Fund's custodian, did not exceed 0.80% of the class' average daily net assets.
Note 4. Federal Tax Information
The timing and character of income and capital gain distributions are determined in accordance with income tax regulations, which may differ from GAAP. Reclassifications are made to the Fund's capital accounts for permanent tax differences to reflect income and gains available for distribution (or available capital loss carryforwards) under income tax regulations.
For the year ended May 31, 2011, permanent and timing book to tax differences resulting primarily from differing treatments for discount accretion/premium amortization on debt securities, Section 988 bond bifurcation, defaulted bond sales, paydown reclasses and market discount adjustments were identified and permanent differences reclassed among the components of the Fund's net assets in the Statement of Assets and Liabilities as follows:
Undistributed
net investment income | | $ | 28,603,262 | | |
| Accumulated net realized loss | | | (27,852,931 | ) | |
| Paid-in capital | | | (750,331 | ) | |
Net investment income and net realized gains (losses), as disclosed in the Statement of Operations, and net assets were not affected by this reclassification.
The tax character of distributions paid during the years indicated was as follows:
| Year ended May 31, | | 2011 | | 2010 | |
| Ordinary income* | | $ | 137,189,575 | | | $ | 93,588,069 | | |
* For tax purposes short-term capital gain distributions, if any, are considered ordinary income distributions.
At May 31, 2011, the components of distributable earnings on a tax basis were as follows:
| Undistributed ordinary income | | $ | 9,977,907 | | |
| Undistributed long-term capital gains | | | — | | |
| Net unrealized appreciation* | | | 95,506,542 | | |
* The differences between book-basis and tax-basis net unrealized appreciation/depreciation are primarily due to deferral of losses from wash sales and discount accretion/premium amortization on debt securities.
At May 31, 2011, the cost of investments for federal income tax purposes was $1,778,871,797 and the aggregate gross unrealized appreciation and depreciation based on that cost was:
| Unrealized appreciation | | $ | 106,510,826 | | |
| Unrealized depreciation | | | (11,004,284 | ) | |
| Net unrealized appreciation/depreciation | | | 95,506,542 | | |
The following capital loss carryforward determined at May 31, 2011, may be available to reduce taxable income arising from future net realized gains on investments, if any, to the extent permitted by the Internal Revenue Code:
| Year of Expiration | | Amount | |
| | 2018 | | | $ | 43,186,468 | | |
For the year ended May 31, 2011, $78,792,930 of capital loss carryforward was utilized.
It is unlikely the Board will authorize a distribution of any net realized capital gains until the available capital loss carryforward has been offset or expires. There is no assurance that the Fund will be able to utilize all of its capital loss carryforward before it expires.
Management of the Fund has concluded that there are no significant uncertain tax positions that would require recognition in the
51
Columbia Strategic Income Fund, May 31, 2011
financial statements. However, management's conclusion may be subject to review and adjustment at a later date based on factors including, but not limited to, new tax laws, regulations, and administrative interpretations (including relevant court decisions). Generally, the Fund's federal tax returns for the prior three fiscal years remain subject to examination by the Internal Revenue Service.
Note 5. Portfolio Information
The cost of purchases and proceeds from sales of securities, excluding short-term obligations, aggregated to $2,449,973,489 and $2,668,125,390, respectively, for the year ended May 31, 2011.
Note 6. Custody Credits
Prior to May 16, 2011 the Fund had an agreement with its custodian bank under which custody fees may have been reduced by balance credits. These credits were recorded as part of expense reductions on the Statement of Operations. The Fund could have invested a portion of the assets utilized in connection with the expense offset arrangement in an income-producing asset if it had not entered into such an agreement. Effective May 16, 2011, the Fund may invest its daily balance in an affiliated money market fund as detailed below. For the period June 1, 2010 through May 16, 2011, these credits reduced total expenses by $1,208.
Note 7. Affiliated Money Market Fund
Effective May 16, 2011, the Fund may invest its daily cash balances in Columbia Short-Term Cash Fund, a money market fund established for the exclusive use by the Fund and other affiliated Funds. The income earned by the Fund from such investments is included as "Dividends from affiliates" in the Statement of Operations. As an investing fund, the Fund indirectly bears its proportionate share of the expenses of Columbia Short-Term Cash Fund.
Note 8. Shareholder Concentration
As of May 31, 2011, one shareholder account owned 24.9% of the outstanding shares of the Fund. Purchase and redemption activity of this account may have a significant effect on the operations of the Fund.
The Investment Manager and/or affiliates owned 100% of the outstanding shares of Class R, Class R4, Class R5 and Class W shares.
Note 9. Line of Credit
The Fund has entered into a revolving credit facility with a syndicate of banks led by JPMorgan Chase Bank, N.A. (the Administrative Agent), whereby the Fund may borrow for the temporary funding of shareholder redemptions or for other temporary or emergency purposes. The credit facility became effective on May 16, 2011, replacing a prior credit facility with State Street. The credit facility agreement, which is a collective agreement between the Fund and certain other funds managed by the Investment Manager, severally and not jointly, permits collective borrowings up to $422,500,000. The collective borrowing amount will increase during the third quarter of 2011 to a final collective borrowing amount of $500,000,000. Interest is charged to each fund based on its borrowings at a rate equal to the sum of the federal funds rate plus (i) 1.25% per annum plus (ii) if one-month LIBOR exceeds the federal funds rate, the amount of such excess. Each borrowing under the credit facility matures no later than 60 days after the date of borrowing. The Fund also pays a commitment fee equal to its pro rata share of the amount of the credit facility at a rate of 0.10% per annum.
Prior to May 16, 2011, the Fund and certain other funds managed by the Investment Manager participated in a $225 million committed, unsecured revolving credit facility provided by State Street. Prior to March 29, 2011, the collective borrowing amount of the commitment was $280 million. Interest was charged to each fund based on its borrowings at a rate equal to the greater of the (i) federal funds rate plus 1.25% per annum or (ii) the overnight LIBOR rate plus 1.25% per annum. The Fund also paid a commitment fee equal to its pro rata share of the amount of the credit facility at a rate of 0.15% per annum. The Fund also paid a commitment fee equal to its pro rata share of the amount of the credit facility at a rate of 0.125% per annum.
Prior to October 14, 2010, interest was charged to each participating fund at the same rates. In addition, a commitment fee of 0.15% per annum was accrued and apportioned among the participating funds pro rata based on their relative net assets.
Note 10. Lending of Portfolio Securities
Effective May 15, 2011, the Fund has entered into a Master Securities Lending Agreement (the Agreement) with JPMorgan Chase Bank, National Association (JPMorgan).The Agreement, which replaces the previous security lending arrangement with State Street, authorizes JPMorgan as lending agent to lend securities to authorized borrowers in order to generate additional income on
52
Columbia Strategic Income Fund, May 31, 2011
behalf of the Fund. Pursuant to the Agreement, the securities loaned are secured by cash or U.S. government securities equal to at least 100% of the market value of the loaned securities. Any additional collateral required to maintain those levels due to market fluctuations of the loaned securities is delivered the following business day. Cash collateral received is invested by the lending agent on behalf of the Fund into authorized investments pursuant to the Agreement. The investments made with the cash collateral are listed in the Portfolio of Investments. The values of such investments and any uninvested cash collateral are disclosed in the Statement of Assets and Liabilities along with the related obligation to return the collateral upon the return of the securities loaned. At May 31, 2011, there were no securities on loan.
Risks of delay in recovery of securities or even loss of rights in the securities may occur should the borrower of the securities fail financially. Risks may also arise to the extent that the value of the securities loaned increases above the value of the collateral received. JPMorgan will indemnify the Fund from losses resulting from a borrower's failure to return a loaned security when due. Such indemnification does not extend to losses associated with declines in the value of cash collateral investments. Loans are subject to termination by the Fund or the borrower at any time, and are, therefore, not considered to be illiquid investments.
Pursuant to the Agreement, the Fund receives income for lending its securities either in the form of fees or by earning interest on invested cash collateral, net of negotiated rebates paid to borrowers and fees paid to the lending agent for services provided and any other securities lending expenses. The Fund did not engage in any securities lending activity during the period May 15, 2011 through May 31, 2011.
Prior to May 15, 2011, the Fund conducted its security lending activity with State Street serving as the lending agent. Under this security lending arrangement with State Street, the Fund was allowed to lend its securities to certain approved brokers, dealers and other financial institutions. Each loan was collateralized by cash, in an amount at least equal to the market value of the securities loaned plus accrued income from the investment of collateral. The market value of the loaned securities was determined at the close of business of the Fund and any additional required collateral was delivered to the Fund on the next business day. The collateral received was invested and the income generated by the investment of the collateral, net of any fees was remitted to State Street as the lending agent and borrower rebates, were paid to the Fund. Generally, in the event of borrower default, the Fund had the right to use the collateral to offset any losses incurred. In the event the Fund was delayed or prevented from exercising its right to dispose of the collateral, there may have been a potential loss to the Fund. The Fund bore the risk of loss with respect to the investment of collateral.
Net income earned from securities lending for the year ended May 31, 2011 (all of which was earned during the period June 1, 2010 through May 14, 2011, with State Street serving as the lending agent) is disclosed in the Statement of Operations.
Note 11. Significant Risks
Foreign Securities Risk
Investing in foreign securities may include certain risks and considerations not typically associated with investing in U.S. securities, such as fluctuating currency values and changing local and regional economic, political and social conditions, which may result in greater market volatility. In addition, certain foreign securities may not be as liquid as U.S. securities. Investing in emerging markets may accentuate these risks.
Investments in emerging market countries are subject to additional risk. The risk of foreign investments is typically increased in less developed countries. These countries are also more likely to experience high levels of inflation, deflation or currency devaluation which could hurt their economies and securities markets.
High Yield Securities Risk
Investing in high-yield fixed income securities may involve greater credit risk and considerations not typically associated with investing in U.S. Government bonds and other higher quality fixed income securities. These securities are non-investment grade securities, often referred to as "junk" bonds. Economic downturns may disrupt the high yield market and impair the ability of issuers to repay principal and interest. Also, an increase in interest rates would likely have an adverse impact on the value of such obligations. Moreover, high-yield securities may be less liquid to the extent that there is no established secondary market.
Sector Focus Risk
The Fund may focus its investments in certain sectors, subjecting it to greater risk than a fund that that invests in a wider range of industries.
Note 12. Subsequent Events
Management has evaluated the events and transactions that have occurred through the date the financial statements were issued.
53
Columbia Strategic Income Fund, May 31, 2011
Other than as noted in Note 3 above, there were no items requiring adjustment of the financial statements or additional disclosure.
Note 13. Information Regarding Pending and Settled Legal Proceedings
In June 2004, an action captioned John E. Gallus et al. v. American Express Financial Corp. and American Express Financial Advisors Inc. was filed in the United States District Court for the District of Arizona. The plaintiffs allege that they are investors in several American Express Company mutual funds (branded as Columbia or RiverSource) and they purport to bring the action derivatively on behalf of those funds under the Investment Company Act of 1940. The plaintiffs allege that fees allegedly paid to the defendants by the funds for investment advisory and administrative services are excessive. The plaintiffs seek remedies including restitution and rescission of investment advisory and distribution agreements. The plaintiffs voluntarily agreed to transfer this case to the United States District Court for the District of Minnesota (the District Court). In response to defendants' motion to dismiss the complaint, the District Court dismissed one of plaintiffs' four claims and granted plaintiffs limited discovery. Defendants moved for summary judgment in April 2007. Summary judgment was granted in the defendants' favor on July 9, 2007. The plaintiffs filed a notice of appeal with the Eighth Circuit Court of Appeals (the Eighth Circuit) on August 8, 2007. On April 8, 2009, the Eighth Circuit reversed summary judgment and remanded to the District Court for further proceedings. On August 6, 2009, defendants filed a writ of certiorari with the U.S. Supreme Court (the Supreme Court), asking the Supreme Court to stay the District Court proceedings while the Supreme Court considers and rules in a case captioned Jones v. Harris Associates, which involves issues of law similar to those presented in the Gallus case. On March 30, 2010, the Supreme Court issued its ruling in Jones v. Harris Associates, and on April 5, 2010, the Supreme Court vacated the Eighth Circuit's decision in the Gallus case and remanded the case to the Eighth Circuit for further consideration in light of the Supreme Court's decision in Jones v. Harris Associates. On June 4, 2010, the Eighth Circuit remanded the Gallus case to the District Court for further consideration in light of the Supreme Court's decision in Jones v. Harris Associates. On December 9, 2010, the District Court reinstated its July 9, 2007, summary judgment order in favor of the defendants. On January 10, 2011, plaintiffs filed a notice of appeal with the Eighth Circuit. In response to the plaintiffs' opening appellate brief filed on March 18, 2011, the defendants filed a response brief on May 4, 2011 with the Eighth Circuit. The plaintiffs filed a reply brief on May 26, 2011.
In December 2005, without admitting or denying the allegations, American Express Financial Corporation (AEFC, which is now known as Ameriprise Financial, Inc. (Ameriprise Financial)), entered into settlement agreements with the Securities and Exchange Commission (SEC) and Minnesota Department of Commerce (MDOC) related to market timing activities. As a result, AEFC was censured and ordered to cease and desist from committing or causing any violations of certain provisions of the Investment Advisers Act of 1940, the Investment Company Act of 1940, and various Minnesota laws. AEFC agreed to pay disgorgement of $10 million and civil money penalties of $7 million. AEFC also agreed to retain an independent distribution consultant to assist in developing a plan for distribution of all disgorgement and civil penalties ordered by the SEC in accordance with various undertakings detailed at http://www.sec.gov/litigation/admin/ia-2451.pdf. Ameriprise Financial and its affiliates have cooperated with the SEC and the MDOC in these legal proceedings, and have made regular reports to the funds' Boards of Directors/Trustees.
Ameriprise Financial and certain of its affiliates have historically been involved in a number of legal, arbitration and regulatory proceedings, including routine litigation, class actions, and governmental actions, concerning matters arising in connection with the conduct of their business activities. Ameriprise Financial believes that the Funds are not currently the subject of, and that neither Ameriprise Financial nor any of its affiliates are the subject of, any pending legal, arbitration or regulatory proceedings that are likely to have a material adverse effect on the Funds or the ability of Ameriprise Financial or its affiliates to perform under their contracts with the Funds. Ameriprise Financial is required to make 10-Q, 10-K and, as necessary, 8-K filings with the Securities and Exchange Commission on legal and regulatory matters that relate to Ameriprise Financial and its affiliates. Copies of these filings may be obtained by accessing the SEC website at www.sec.gov.
There can be no assurance that these matters, or the adverse publicity associated with them, will not result in increased fund redemptions, reduced sale of fund shares or other adverse consequences to the Funds. Further, although we believe proceedings are not likely to have a material adverse effect on the Funds or the ability of Ameriprise Financial or its affiliates to perform under their contracts with the Funds, these proceedings are subject to uncertainties and, as such, we are unable to estimate the possible loss or range of loss that may result. An adverse outcome in one or more of these proceedings could result in adverse judgments, settlements, fines, penalties or other relief that could have a material adverse effect on the consolidated financial condition or results of operations of Ameriprise Financial.
54
Report of Independent Registered Public Accounting Firm
To the Trustees of Columbia Funds Series Trust and the Shareholders of Columbia Strategic Income Fund
In our opinion, the accompanying statement of assets and liabilities, including the investment portfolio, and the related statements of operations and of changes in net assets and the financial highlights present fairly, in all material respects, the financial position of Columbia Strategic Income Fund (the "Fund") (a series of Columbia Funds Series Trust) at May 31, 2011, and the results of its operations for the year then ended, the changes in its net assets for each of the two years in the period then ended and the financial highlights for each of the periods indicated, in conformity with accounting principles generally accepted in the United States of America. These financial statements and financial highlights (hereafter referred to as "financial statements") are the responsibility of the Fund's management. Our responsibility is to express an opinion on these financial statements based on our audits. We conducted our audits of these financial statements in accordance with the standards of the Public Company Accounting Oversight Board (United States). Those standards require that we plan and perform the audit to obtain reasonable assurance about whether the financial statements are free of material misstatement. An audit includes examining, on a test basis, evidence supporting the amounts and disclosures in the financial statements, assessing the accounting principles used and significant estimates made by management, and evaluating the overall financial statement presentation. We believe that our audits, which included confirmation of securities at May 31, 2011 by correspondence with the custodian, brokers and agent banks, provide a reasonable basis for our opinion.
PricewaterhouseCoopers LLP
Boston, Massachusetts
July 28, 2011
55
Fund Governance
The Trustees serve terms of indefinite duration. The names, addresses and birth years of the Trustees and Officers of the Funds in the Columbia Funds Series Trust I, the year each was first elected or appointed to office, their principal business occupations during at least the last five years, the number of Funds overseen by each Trustee and other directorships they hold are shown below. Each officer listed below serves as an officer of each Fund in Columbia Funds Series Trust I.
Independent Trustees
Name, Address and Year of Birth,
Position with Funds, Year First
Elected or Appointed to Office | | Principal Occupation(s) During Past Five Years, Number of Funds in Columbia
Funds Complex Overseen by Trustee, Other Directorships Held
| |
| Rodman L. Drake (Born 1943) | |
|
c/o Columbia Management
Investment Advisers, LLC
225 Franklin Street
Boston, MA 02110
Trustee (since 1994) and Chairman of the Board (since 2009) | | Independent consultant since 2010; Co-Founder of Baringo Capital LLC (private equity) from 1997 to 2008; CEO of Crystal River Capital, Inc. (real estate investment trust) from 2003 to 2010; Oversees 43; Jackson Hewitt Tax Service Inc. (tax preparation services); Student Loan Corporation (student loan provider); Celgene Corporation (global biotechnology company); the Helios Funds (exchange-traded funds); Crystal River Capital, Inc. from 2005 to 2010; Parson Brinckerhoff from 1995 to 2008; and Apex Silver Mines Ltd. from 2007 to 2009 | |
|
| Douglas A. Hacker (Born 1955) | |
|
c/o Columbia Management
Investment Advisers, LLC
225 Franklin Street
Boston, MA 02110
Trustee (since 1996) | | Independent business executive since May 2006; Executive Vice President—Strategy of United Airlines from December 2002 to May 2006; President of UAL Loyalty Services (airline marketing company) from September 2001 to December 2002; Executive Vice President and Chief Financial Officer of United Airlines from July 1999 to September 2001. Oversees 43; Nash Finch Company (food distributor); Aircastle Limited (aircraft leasing); and SeaCube Container Leasing Ltd (container leasing) | |
|
| Janet Langford Kelly (Born 1957) | |
|
c/o Columbia Management
Investment Advisers, LLC
225 Franklin Street
Boston, MA 02110
Trustee (since 1996) | | Senior Vice President, General Counsel and Corporate Secretary, ConocoPhillips (integrated energy company) since September 2007; Deputy General Counsel—Corporate Legal Services, ConocoPhillips from August 2006 to August 2007; Partner, Zelle, Hofmann, Voelbel, Mason & Gette LLP (law firm) from March 2005 to July 2006; Adjunct Professor of Law, Northwestern University, from September 2004 to June 2006; Director, UAL Corporation (airline) from February 2006 to July 2006; Oversees 43; None | |
|
| William E. Mayer (Born 1940) | |
|
c/o Columbia Management
Investment Advisers, LLC
225 Franklin Street
Boston, MA 02110
Trustee (since 1994) | | Partner, Park Avenue Equity Partners (private equity) since February 1999; Dean and Professor, College of Business and Management, University of Maryland from 1992 to 1996. Oversees 43; DynaVox Inc. (software developer); Lee Enterprises (print media); WR Hambrecht + Co. (financial service provider); BlackRock Kelso Capital Corporation (investment company) | |
|
56
Fund Governance (continued)
Independent Trustees (continued)
Name, Address and Year of Birth,
Position with Funds, Year First
Elected or Appointed to Office | | Principal Occupation(s) During Past Five Years, Number of Funds in Columbia
Funds Complex Overseen by Trustee, Other Directorships Held
| |
| David M. Moffett (Born 1952) | |
|
c/o Columbia Management
Investment Advisers, LLC
225 Franklin Street
Boston, MA 02110
Trustee (since 2011) | | Retired. Chief Executive Officer, Federal Home Loan Mortgage Corporation, from 2008 to 2009; Senior Adviser, Global Financial Services Group, Carlyle Group, Inc., from 2007 to 2008; Vice Chairman and Chief Financial Officer, U.S. Bancorp, from 1993 to 2007. Oversees 43; CIT Group Inc. (commercial and consumer finance), eBay Inc. (online trading community), MBIA Corp (financial service provider), E.W. Scripps Co. (print and television media), Building Materials Holding Corp. (building materials and construction services), and University of Oklahoma Foundation. | |
|
| Charles R. Nelson (Born 1942) | |
|
c/o Columbia Management
Investment Advisers, LLC
225 Franklin Street
Boston, MA 02110
Trustee (since 1981) | | Professor of Economics, University of Washington, since January 1976; Ford and Louisa Van Voorhis Professor of Political Economy, University of Washington, since September 1993; Adjunct Professor of Statistics, University of Washington, since September 1980; Associate Editor, Journal of Money Credit and Banking from 1993 to 2008; consultant on econometric and statistical matters. Oversees 43; None | |
|
| John J. Neuhauser (Born 1943) | |
|
c/o Columbia Management
Investment Advisers, LLC
225 Franklin Street
Boston, MA 02110
Trustee (since 1984) | | President, Saint Michael's College, since August 2007; Director or Trustee of several non-profit organizations, including Fletcher Allen Health Care, Inc.; University Professor, Boston College from November 2005 to August 2007; Academic Vice President and Dean of Faculties, Boston College from August 1999 to October 2005. Oversees 43; Liberty All-Star Equity Fund and Liberty All-Star Growth Fund (closed-end funds) | |
|
| Patrick J. Simpson (Born 1944) | |
|
c/o Columbia Management
Investment Advisers, LLC
225 Franklin Street
Boston, MA 02110
Trustee (since 2000) | | Partner, Perkins Coie LLP (law firm). Oversees 43; None | |
|
| Anne-Lee Verville (Born 1945) | |
|
c/o Columbia Management
Investment Advisers, LLC
225 Franklin Street
Boston, MA 02110
Trustee (since 1998) | | Retired since 1997 (formerly General Manager–Global Education Industry from 1994 to 1997, President–Application Systems Division from 1991 to 1994, Chief Financial Officer–US Marketing & Services from 1988 to 1991, and Chief Information Officer from 1987 to 1988, IBM Corporation (computer and technology)). Oversees 43; Enesco Group, Inc. (producer of giftware and home and garden decor products) from 2001 to 2006 | |
|
57
Fund Governance (continued)
Interested Trustee
Name, Address and Year of Birth,
Position with Funds, Year First
Elected or Appointed to Office | | Principal Occupation(s) During Past Five Years, Number of Funds in Columbia
Funds Complex Overseen by Trustee, Other Directorships Held
| |
| Michael A. Jones (born 1959) | |
|
c/o Columbia Management
Investment Advisers, LLC
225 Franklin Street
Boston, MA 02110
Trustee (since 2011)
Senior Vice President (since 2011) | | President and Director, Columbia Management Investment Advisers, LLC since May 2010; President and Director, Columbia Management Investment Distributors, Inc. since May 2010; Manager, Chairman, Chief Executive Officer and President, Columbia Management Advisors, LLC from 2007 to April 2010; Chief Executive Officer, President and Director, Columbia Management Distributors, Inc. from November 2006 to April 2010; previously, co-president and senior managing director at Robeco Investment Management. Oversees 43; None | |
|
The Statement of Additional Information includes additional information about the Trustees of the Funds and is available, without charge, upon request by calling 1-800-345-6611.
Officers
| Name, Year of Birth and Address | | Principal Occupation(s) During the Past Five Years | |
| J. Kevin Connaughton (Born 1964) | |
|
225 Franklin Street
Boston, MA 02110
President (since 2009) | | Senior Vice President and General Manager–Mutual Fund Products, Columbia Management Investment Advisers, LLC since May 2010; President, Columbia Funds, since 2009, and RiverSource Funds, since May 2010 (previously Senior Vice President and Chief Financial Officer, Columbia Funds, from June 2008 to January 2009, Treasurer, Columbia Funds, from October 2003 to May 2008, and senior officer of various other affiliated funds since 2000); Managing Director, Columbia Management Advisors, LLC from December 2004 to April 2010. | |
|
| Michael G. Clarke (Born 1969) | |
|
225 Franklin Street
Boston, MA 02110
Treasurer (since 2011) and Chief
Financial Officer (since 2009) | | Vice President, Columbia Management Investment Advisers, LLC since May 2010; Managing Director of Fund Administration, Columbia Management Advisors, LLC, from September 2004 to April 2010; senior officer of Columbia Funds and affiliated funds since 2002. | |
|
| Scott R. Plummer (Born 1959) | |
|
5228 Ameriprise Financial Center
Minneapolis, MN 55474
Senior Vice President, Assistant Secretary
and Chief Legal Officer (since 2010) | | Chief Legal Officer and Assistant Secretary, Columbia Management Investment Advisers, LLC since June 2005; Vice President and Lead Chief Counsel–Asset Management, Ameriprise Financial, Inc. since May 2010 (previously Vice President and Chief Counsel–Asset Management, from 2005 to April 2010, and Vice President–Asset Management Compliance from 2004 to 2005); Vice President, Chief Counsel and Assistant Secretary, Columbia Management Investment Distributors, Inc. since 2008; Vice President, General Counsel and Secretary, Ameriprise Certificate Company since 2005; Chief Counsel, RiverSource Distributors, Inc. since 2006; Vice President, General Counsel and Secretary, RiverSource Funds, since December 2006; Senior Vice President, Secretary and Chief Legal Officer, Columbia Funds, since May 2010. | |
|
58
Fund Governance (continued)
Officers (continued)
| Name, Year of Birth and Address | | Principal Occupation(s) During the Past Five Years | |
| Linda J. Wondrack (Born 1964) | |
|
225 Franklin Street
Boston, MA 02110
Senior Vice President and Chief
Compliance Officer (since 2007) | | Vice President and Chief Compliance Officer, Columbia Management Investment Advisers, LLC since May 2010; Chief Compliance Officer, Columbia Funds, since 2007, and RiverSource Funds, since May 2010; Director (Columbia Management Group, LLC and Investment Product Group Compliance), Bank of America, from June 2005 to April 2010; Director of Corporate Compliance and Conflicts Officer of MFS Investment Management (investment management) from August 2004 to May 2005. | |
|
| William F. Truscott (Born 1960) | |
|
53600 Ameriprise Financial Center
Minneapolis, MN 55474
Senior Vice President (since 2010) | | Chairman of the Board, Columbia Management Investment Advisers, LLC since May 2010 (previously President, Chairman of the Board and Chief Investment Officer, from 2001 to April 2010); Chief Executive Officer, U.S. Asset Management & President, Annuities, Ameriprise Financial, Inc. since May 2010 (previously President–U.S. Asset Management and Chief Investment Officer from 2005 to April 2010, and Senior Vice President—Chief Investment Officer, from 2001 to 2005); Director, President and Chief Executive Officer, Ameriprise Certificate Company since 2006; Director, Columbia Management Investment Distributors, Inc. since May 2010 (previously Chairman of the Board and Chief Executive Officer from 2008 to April 2010); Chairman of the Board and Chief Executive Officer, RiverSource Distributors, Inc. since 2006. | |
|
| Colin Moore (Born 1958) | |
|
225 Franklin Street
Boston, MA 02110
Senior Vice President (since 2010) | | Director and Chief Investment Officer, Columbia Management Investment Advisers, LLC since May 2010; Manager, Managing Director and Chief Investment Officer of Columbia Management Advisors, LLC from 2007 to April 2010; Head of Equities, Columbia Management Advisors, LLC from 2002 to 2007. | |
|
| Amy Johnson (Born 1965) | |
|
5228 Ameriprise Financial Center
Minneapolis, MN 55474
Vice President (since 2010) | | Senior Vice President and Chief Operating Officer, Columbia Management Investment Advisers, LLC since May 2010 (previously Chief Administrative Officer, from 2009 until April 2010, Vice President—Asset Management and Trust Company Services, from 2006 to 2009, and Vice President—Operations and Compliance from 2004 to 2006). | |
|
| Joseph F. DiMaria (Born 1968) | |
|
225 Franklin Street
Boston, MA 02110
Vice President (since 2011) and
Chief Accounting Officer (since 2008) | | Vice President, Mutual Fund Administration, Columbia Management Investment Advisers, LLC, since May 2010; Director of Fund Administration, Columbia Management Advisors, LLC from January 2006 to April 2010; Head of Tax/Compliance and Assistant Treasurer, Columbia Management Advisors, LLC, from November 2004 to December 2005. | |
|
| Stephen T. Welsh (born 1957) | |
|
225 Franklin Street
Boston, MA 02110
Vice President (since 2006) | | President and Director, Columbia Management Investment Services Corp. since May 2010; President and Director, Columbia Management Services, Inc. from July 2004 to April 2010; Managing Director, Columbia Management Distributors, Inc. from August 2007 to April 2010. | |
|
59
Fund Governance (continued)
Officers (continued)
| Name, Year of Birth and Address | | Principal Occupation(s) During the Past Five Years | |
| Paul D. Pearson (born 1956) | |
|
5228 Ameriprise Financial Center
Minneapolis, MN 55474
Vice President and Assistant
Treasurer (since 2011) | | Vice President, Investment Accounting, Columbia Management Investment Advisers, LLC, since May 2010; Vice President, Managed Assets, Investment Accounting, Ameriprise Financial Corporation. | |
|
| Paul B. Goucher (born 1968) | |
|
5228 Ameriprise Financial Center
Minneapolis, MN 55474
Vice President and Assistant
Secretary (since 2010) | | Vice President and Chief Counsel of Ameriprise Financial since January 2010 (formerly Vice President and Group Counsel from November 2008 to January 2010); Director, Managing Director and General Counsel of J. & W. Seligman & Co. Incorporated (Seligman) from July 2008 to November 2008 and Managing Director and Associate General Counsel of Seligman from January 2005 to July 2008. | |
|
| Christopher O. Petersen (born 1970) | |
|
5228 Ameriprise Financial Center
Minneapolis, MN 55474
Vice President (since 2010) and
Secretary (since 2011) | | Vice President and Chief Counsel, Ameriprise Financial since January 2010 (formerly Vice President and Group Counsel or Counsel from April 2004 to January 2010); Assistant Secretary of RiverSource Funds since January 2007. | |
|
| Michael E. DeFao (born 1968) | |
|
5228 Ameriprise Financial Center
Minneapolis, MN 55474
Vice President and Assistant
Secretary (since 2011) | | Vice President and Chief Counsel, Ameriprise Financial since May 2010; Associate General Counsel Bank of America from June 2005 to April 2010 | |
|
60
Shareholder Meeting Results
At a Joint Special Meeting of Shareholders held on February 15, 2011, shareholders of Columbia Strategic Income Fund considered a proposal to approve a proposed amendment to the Investment Management Services Agreement with Columbia Management Investment Advisers, LLC. The proposal was approved as follows:
| Votes For | | Votes Against | | Abstentions | | Broker Non-Votes | |
| | 1,054,856,737 | | | | 60,370,684 | | | | 33,730,551 | | | | 0 | | |
61
This page intentionally left blank.
This page intentionally left blank.
This page intentionally left blank.
Important Information About This Report
The fund mails one shareholder report to each shareholder address. If you would like more than one report, please call shareholder services at 1-800-345-6611 and additional reports will be sent to you. This report has been prepared for shareholders of Columbia Strategic Income Fund.
A description of the policies and procedures that the fund uses to determine how to vote proxies and a copy of the fund's voting records are available (i) at www.columbiamanagement.com, (ii) on the Securities and Exchange Commission's website at www.sec.gov, and (iii) without charge, upon request, by calling 1-800-368-0346. Information regarding how the fund voted proxies relating to portfolio securities during the 12-month period ended June 30 is available from the SEC's website. Information regarding how the fund voted proxies relating to portfolio securities is also available from the fund's website, www.columbiamanagement.com.
The fund files a complete schedule of portfolio holdings with the SEC for the first and third quarters of each fiscal year on Form N-Q. The fund's Form N-Q is available on the SEC's website at www.sec.gov and may be reviewed and copied at the SEC's Public Reference Room in Washington, D.C. Information on the operation of the Public Reference Room may be obtained by calling 1-800-SEC-0330.
Transfer Agent
Columbia Management Investment
Services Corp.
P.O. Box 8081
Boston, MA 02266-8081
1-800-345-6611
Distributor
Columbia Management Investment
Distributors, Inc.
225 Franklin Street
Boston, MA 02110
Investment Manager
Columbia Management Investment Advisers, LLC
225 Franklin Street
Boston, MA 02110
65

Columbia Strategic Income Fund
P. O. Box 8081
Boston, MA 02266-8081
columbiamanagement.com
This information is for use with concurrent or prior delivery of a fund prospectus. Investors should consider the investment objectives, risks, charges and expenses of a mutual fund carefully before investing. For a free prospectus, which contains this and other important information about the funds, visit columbiamanagement.com. Read the prospectus carefully before investing. The Fund is distributed by Columbia Management Investment Distributors, Inc., member FINRA, and managed by Columbia Management Investment Advisers, LLC.
© 2011 Columbia Management Investment Advisers, LLC. All rights reserved.
C-1036 C (07/11)

Columbia High Yield Opportunity Fund
Annual Report for the Period Ended May 31, 2011
Not FDIC insured • No bank guarantee • May lose value
Table of Contents
| Fund Profile | | | 1 | | |
|
| Performance Information | | | 2 | | |
|
| Understanding Your Expenses | | | 3 | | |
|
| Portfolio Managers' Report | | | 4 | | |
|
| Investment Portfolio | | | 6 | | |
|
Statement of Assets and
Liabilities | | | 20 | | |
|
| Statement of Operations | | | 22 | | |
|
Statement of Changes in
Net Assets | | | 23 | | |
|
| Financial Highlights | | | 25 | | |
|
| Notes to Financial Statements | | | 29 | | |
|
Report of Independent Registered
Public Accounting Firm | | | 38 | | |
|
| Fund Governance | | | 39 | | |
|
| Shareholder Meeting Results | | | 44 | | |
|
Important Information About
This Report | | | 45 | | |
|
The views expressed in this report reflect the current views of the respective parties. These views are not guarantees of future performance and involve certain risks, uncertainties and assumptions that are difficult to predict, so actual outcomes and results may differ significantly from the views expressed. These views are subject to change at any time based upon economic, market or other conditions and the respective parties disclaim any responsibility to update such views. These views may not be relied on as investment advice and, because investment decisions for a Columbia Fund are based on numerous factors, may not be relied on as an indication of trading intent on behalf of any particular Columbia Fund. References to specific securities should not be construed as a recommendation or investment advice.
President's Message

Dear Shareholder:
The Columbia Management story began over 100 years ago, and today, we are one of the nation's largest dedicated asset managers. The recent acquisition by Ameriprise Financial, Inc. brings together the talents, resources and capabilities of Columbia Management with those of RiverSource Investments, Threadneedle (acquired by Ameriprise in 2003) and Seligman Investments (acquired by Ameriprise in 2008) to build a best-in-class asset management business that we believe is truly greater than its parts.
RiverSource Investments traces its roots to 1894 when its then newly-founded predecessor, Investors Syndicate, offered a face-amount savings certificate that gave small investors the opportunity to build a safe and secure fund for retirement, education or other special needs. A mutual fund pioneer, Investors Syndicate launched Investors Mutual Fund in 1940. In the decades that followed, its mutual fund products and services lineup grew to include a full spectrum of styles and specialties. More than 110 years later, RiverSource continues to be a trusted financial products leader.
Threadneedle, a leader in global asset management and one of Europe's largest asset managers, offers sophisticated international experience from a dedicated U.K. management team. Headquartered in London, it is named for Threadneedle Street in the heart of the city's financial district, where British investors pioneered international and global investing. Threadneedle was acquired in 2003 and today operates as an affiliate of Columbia Management.
Seligman Investments' beginnings date back to the establishment of the investment firm J. & W. Seligman & Co. in 1864. In the years that followed, Seligman played a major role in the geographical expansion and industrial development of the United States. In 1874, President Ulysses S. Grant named Seligman as fiscal agent for the U.S. Navy—an appointment that would last through World War I. Seligman helped finance the westward path of the railroads and the building of the Panama Canal. The firm organized its first investment company in 1929 and began managing its first mutual fund in 1930. In 2008, J. & W. Seligman & Co. Incorporated was acquired and Seligman Investments became an offering brand of RiverSource Investments, LLC.
We are proud of the rich and distinctive history of these firms, the strength and breadth of products and services they offer, and the combined cultures of pioneering spirit and forward thinking. Together we are committed to providing more for our shareholders than ever before.
> A singular focus on our shareholders
Our business is asset management, so investors are our first priority. We dedicate our resources to identifying timely investment opportunities and provide a comprehensive choice of equity, fixed-income and alternative investments to help meet your individual needs.
> First-class research and thought leadership
We are dedicated to helping you take advantage of today's opportunities and anticipate tomorrow's. We stay abreast of the latest investment trends and ideas, using our collective insight to evaluate events and transform them into solutions you can use.
> A disciplined investment approach
We aren't distracted by passing fads. Our teams adhere to a rigorous investment process that helps ensure the integrity of our products and enables you and your financial advisor to match our solutions to your objectives with confidence.
When you choose Columbia Management, you can be confident that we will take the time to understand your needs and help you and your financial advisor identify the solutions that are right for you. Because at Columbia Management, we don't consider ourselves successful unless you are.
Sincerely,

J. Kevin Connaughton
President, Columbia Funds
Investors should consider the investment objectives, risks, charges and expenses of a mutual fund carefully before investing. For a free prospectus, which contains this and other important information about the funds, visit www.columbiamanagement.com. The prospectus should be read carefully before investing.
Columbia Funds are distributed by Columbia Management Investment Distributors, Inc., member FINRA, and managed by Columbia Management Investment Advisers, LLC.
© 2011 Columbia Management Investment Advisers, LLC. All rights reserved.
Fund Profile – Columbia High Yield Opportunity Fund
Summary
g For the 12-month period that ended May 31, 2011, the fund's Class A shares returned 17.21% without sales charge.
g The fund trailed its primary benchmark—the JPMorgan Global High Yield Index, beat its other benchmark—the Credit Suisse High Yield Index,1 and performed in line with its peer group—the Lipper High Current Yield Funds Classification.2
g Underweights in CCC rated3 bonds and financial industry bonds contributed to underperformance relative to the JPMorgan index.
Portfolio Management
Brian Lavin, CFA has co-managed the fund since May 2010 and has been associated with the fund's adviser or its predecessors since 1994.
Jennifer Ponce de Leon has co-managed the fund since May 2010 and has been associated with the fund's adviser or its predecessors since 1997.
1The JP Morgan Global High Yield Index is designed to mirror the investable universe of the U.S. dollar global high-yield corporate debt market, including domestic and international issues. The Credit Suisse High Yield Index is a broad-based index that tracks the performance of high-yield bonds.
2Lipper Inc., a widely respected data provider in the industry, calculates an average total return (assuming reinvestment of distributions) for mutual funds with investment objectives similar to those of the fund. Lipper makes no adjustment for the effect of sales loads.
3The credit quality ratings represent those of Moody's Investors Service, Inc. ("Moody's"), Standard & Poor's Corporation ("S&P") or Fitch Ratings ("Fitch") credit ratings. The ratings represent their opinions as to the quality of the securities they rate. Ratings are relative and subjective and are not absolute standards of quality. The security's credit quality does not eliminate risk.
Indices are not available for investment, are not professionally managed and do not reflect sales charges, fees, brokerage commissions, taxes or other expenses of investing. Securities in the fund may not match those in an index.
Performance data quoted represents past performance and current performance may be lower or higher. Past performance is no guarantee of future results. The investment return and principal value will fluctuate so that shares, when redeemed, may be worth more or less than the original cost. Please visit www.columbiamanagement.com for daily and most recent month-end performance updates.
Summary
1-year return as of 05/31/2011
| | | | +17.21% | |
|
|  | | | Class A shares
(without sales charge) | |
|
| | | | +18.04% | |
|
|  | | | JP Morgan Global
High Yield Index | |
|
| | | | +16.82% | |
|
|  | | | Credit Suisse High Yield Index | |
|
1
Performance Information – Columbia High Yield Opportunity Fund
Performance data quoted represents past performance and current performance may be lower or higher. Past performance is no guarantee of future results. The investment return and principal value will fluctuate so that shares, when redeemed, may be worth more or less than the original cost. Please visit www.columbiamanagement.com for daily and most recent month-end performance updates.
Performance of a $10,000 investment 06/01/01 – 05/31/11
The chart above shows the change in value of a hypothetical $10,000 investment in Class A shares of Columbia High Yield Opportunity Fund during the stated time period, and does not reflect the deduction of taxes that a shareholder may pay on fund distributions or on the redemption of fund shares.
Performance of a $10,000 investment 06/01/01 – 05/31/11 ($)
| Sales charge | | without | | with | |
| Class A | | | 18,274 | | | | 17,402 | | |
| Class B | | | 16,966 | | | | 16,966 | | |
| Class C | | | 17,216 | | | | 17,216 | | |
| Class Z | | | 18,732 | | | | n/a | | |
Average annual total return as of 05/31/11 (%)
| Share class | | A | | B | | C | | Z | |
| Inception | | 10/21/71 | | 06/08/92 | | 01/15/96 | | 01/08/99 | |
| Sales charge | | without | | with | | without | | with | | without | | with | | without | |
| 1-year | | | 17.21 | | | | 11.62 | | | | 16.34 | | | | 11.34 | | | | 16.52 | | | | 15.52 | | | | 17.50 | | |
| 5-year | | | 6.61 | | | | 5.60 | | | | 5.83 | | | | 5.53 | | | | 5.98 | | | | 5.98 | | | | 6.88 | | |
| 10-year | | | 6.21 | | | | 5.70 | | | | 5.43 | | | | 5.43 | | | | 5.58 | | | | 5.58 | | | | 6.48 | | |
The "with sales charge" returns include the maximum initial sales charge of 4.75% for Class A shares and the applicable contingent deferred sales charge of 5.00% in the first year, declining to 1.00% in the sixth year and eliminated thereafter for Class B shares and 1.00% for Class C shares for the first year only. The "without sales charge" returns do not include the effect of sales charges. If they had, returns would be lower.
Performance results reflect any fee waivers or reimbursements of fund expenses by the investment advisor and/or any of its affiliates. Absent these fee waivers or expense reimbursement arrangements, performance results would have been lower.
All results shown assume reinvestment of distributions. Class Z shares are sold at net asset value with no distribution and service ( Rule 12b-1) fees. Class Z shares have limited eligibility and the investment minimum requirements may vary. Please see the fund's prospectus for details. Performance for different share classes will vary based on differences in sales charges and fees associated with each class.
The tables do not reflect the deduction of taxes that a shareholder may pay on fund distributions or on the redemption of fund shares.
2
Understanding Your Expenses – Columbia High Yield Opportunity Fund
As a fund shareholder, you incur two types of costs. There are transaction costs, which generally include sales charges on purchases and may include redemption fees or exchange fees. There are also ongoing costs, which generally include investment advisory fees, distribution and service (Rule 12b-1) fees and other fund expenses. The information on this page is intended to help you understand the ongoing costs of investing in the fund and to compare these costs with the ongoing costs of investing in other mutual funds.
Analyzing your fund's expenses by share class
To illustrate these ongoing costs, we have provided an example and calculated the expenses paid by investors in each share class during the period. The information in the following table is based on an initial investment of $1,000, which is invested at the beginning of the period and held for the entire period. Expense information is calculated two ways and each method provides you with different information. The amount listed in the "Actual" column is calculated using the fund's actual operating expenses and total return for the period. The amount listed in the "Hypothetical" column for each share class assumes that the return each year is 5% before expenses and is calculated based on the fund's actual operating expenses. You should not use the hypothetical account values and expenses to estimate either your actual account balance at the end of the period or the expenses you paid during this period.
Compare with other funds
Since all mutual funds are required to include the same hypothetical calculations about expenses in shareholder reports, you can use this information to compare the ongoing cost of investing in the fund with other funds. To do so, compare the 5% hypothetical example with the 5% hypothetical examples that appear in the shareholder reports of other funds. As you compare hypothetical examples of other funds, it is important to note that hypothetical examples are meant to highlight the ongoing costs of investing in a fund and do not reflect any transaction costs, such as sales charges, redemption fees or exchange fees.
As a shareholder of the underlying funds in which it invests, the fund will bear its allocable share of the costs and expenses of these underlying funds. These costs and expenses are not included in the fund's annualized expense ratios used to calculate the expense information below.
Estimating your actual expenses
To estimate the expenses that you paid over the period, first you will need your account balance at the end of the period:
g For shareholders who receive their account statements from Columbia Management Investment Services Corp., your account balance is available online at www.columbiamanagement.com or by calling Shareholder Services at 800.345.6611.
g For shareholders who receive their account statements from their financial intermediary, contact your financial intermediary to obtain your account balance.
1. Divide your ending account balance by $1,000. For example, if an account balance was $8,600 at the end of the period, the result would be 8.6.
2. In the section of the table below titled "Expenses paid during the period," locate the amount for your share class. You will find this number in the column labeled "Actual." Multiply this number by the result from step 1. Your answer is an estimate of the expenses you paid on your account during the period.
If the value of your account falls below the minimum initial investment requirement applicable to you, your account may be subject to a $20 annual fee. This fee is not included in the accompanying table. If you are subject to the fee, keep it in mind when you are estimating the ongoing expenses of investing in the fund and when comparing the expenses of this fund with other funds.
12/01/10 – 05/31/11
| | | Account value at the
beginning of the period ($) | | Account value at the
end of the period ($) | | Expenses paid
during the period ($) | | Fund's annualized
expense ratio (%) | |
| | | Actual | | Hypothetical | | Actual | | Hypothetical | | Actual | | Hypothetical | | Actual | |
| Class A | | | 1,000.00 | | | | 1,000.00 | | | | 1,078.40 | | | | 1,019.70 | | | | 5.44 | | | | 5.29 | | | | 1.05 | | |
| Class B | | | 1,000.00 | | | | 1,000.00 | | | | 1,074.40 | | | | 1,015.96 | | | | 9.31 | | | | 9.05 | | | | 1.80 | | |
| Class C | | | 1,000.00 | | | | 1,000.00 | | | | 1,075.20 | | | | 1,016.70 | | | | 8.54 | | | | 8.30 | | | | 1.65 | | |
| Class Z | | | 1,000.00 | | | | 1,000.00 | | | | 1,079.70 | | | | 1,020.94 | | | | 4.15 | | | | 4.03 | | | | 0.80 | | |
Expenses paid during the period are equal to the annualized expense ratio for the share class, multiplied by the average account value over the period, then multiplied by the number of days in the fund's most recent fiscal half-year and divided by 365.
Had the Investment Manager and/or any of its affiliates not waived fees or reimbursed a portion of expenses, account value at the end of the period would have been reduced.
It is important to note that the expense amounts shown in the table are meant to highlight only ongoing costs of investing in the fund and do not reflect any transaction costs, such as sales charges, redemption fees or exchange fees. Therefore, the hypothetical examples provided may not help you determine the relative total costs of owning shares of different funds. If these transaction costs were included, your costs would have been higher.
3
Portfolio Managers' Report – Columbia High Yield Opportunity Fund
Performance data quoted represents past performance and current performance may be lower or higher. Past performance is no guarantee of future results. The investment return and principal value will fluctuate so that shares, when redeemed, may be worth more or less than the original cost. Please visit www.columbiamanagement.com for daily and most recent month-end performance updates.
Net asset value per share
as of 05/31/11 ($)
| Class A | | | 4.14 | | |
| Class B | | | 4.14 | | |
| Class C | | | 4.14 | | |
| Class Z | | | 4.14 | | |
Distributions declared per share
06/01/10 – 05/31/11 ($)
| Class A | | | 0.28 | | |
| Class B | | | 0.25 | | |
| Class C | | | 0.26 | | |
| Class Z | | | 0.29 | | |
Top 10 issuers
as of 05/31/11 (%)
| CIT Group, Inc. | | | 2.4 | | |
| Ally Financial, Inc. | | | 2.2 | | |
| DISH DBS Corp. | | | 1.9 | | |
| First Data Corp. | | | 1.6 | | |
| HCA, Inc. | | | 1.5 | | |
United Rentals
North America, Inc. | | | 1.5 | | |
| PetroHawk Energy Corp. | | | 1.4 | | |
| Wind Acquisition Finance SA | | | 1.3 | | |
International Lease
Finance Corp. | | | 1.3 | | |
| Sprint Nextel Corp. | | | 1.3 | | |
Top 10 issuers is calculated as a percentage of net assets.
For the 12-month period that ended May 31, 2011, the fund's Class A shares returned 17.21% without sales charge. The fund's benchmarks, the JPMorgan Global High Yield Index and the Credit Suisse High Yield Index, returned 18.04% and 16.82%, respectively. The average return of the fund's peer group, the Lipper High Current Yield Funds Classification, was 17.24%. The fund benefited from strong credit selection, but modestly lagged the JPMorgan index because of underweights in CCC rated securities and financials, both of which were very strong performers.
A sluggish expansion
The U.S. economy expanded at an estimated 2.3% over the past 12 months, as measured by gross domestic product (GDP). Growth picked up in the third and fourth quarters of 2010, but concerns emerged as the housing market continued its five-year slide and the job market disappointed with fewer-than-expected new jobs and higher unemployment at the end of the period. The Federal Reserve Board is nearing an end to its program of large-scale Treasury purchases aimed at shoring up the economy. Yet it has not done much to lift growth. GDP expanded at 1.9% in the first quarter, and second quarter growth is not expected to be much higher.
Despite the loss of momentum, there were positive data points as well. Personal income surged in January as payroll tax cuts kicked in and continued to edge higher through the end of the period. With incomes on the rise, consumer spending on cars, clothing and other goods trended upward during the 12-month period. And despite a disappointing spring, news on the job front was generally positive for the year. Massive layoffs declined and job growth turned solidly positive, with the addition of 722,000 new jobs in 2011 so far.
Strong performance from high-yield bonds
High-yield issues produced the best gains in the fixed-income market over the past year, but lagged stocks, which returned 28.14%, as measured by the Standard & Poor's 500 Index. Riskier assets climbed as economic growth improved. High-yield bonds further benefited from positive corporate earnings growth, low default rates and strong demand for yield as interest rates remained near historical lows. In the spring of 2011, high-yield bonds lost a bit of their steam as investors became more risk averse due to concerns around slowing economic growth in the United States, Europe and China.
Gains from low quality issues and certain industries
The strongest returns this past year came from the lowest-rated, highest-risk securities with CCC rated bonds returning 22.75% and B rated issues up 18.94%. While an underweight versus the JPMorgan Global High Yield Index in CCC securities modestly hindered relative results, an overweight in B rated bonds—many of which were added this past year—was quite helpful. Within the index, certain industries—including technology, broadcasting and financials—produced returns that topped 20% for the 12-month period. Returns in many other industries were not far behind. The fund benefited the most from overweights in energy, gaming and leisure, telecommunications and cable and satellite, industries that produced above-average returns.
Lost ground from underweight in financials
Having less exposure than the JPMorgan index to financials hampered relative results. Within the index, financials returned more than 20% for the year, buoyed by an improving economic
4
Portfolio Managers' Report (continued) – Columbia High Yield Opportunity Fund
outlook. We added to financials exposure over the year but did not eliminate the fund's underweight before period end. Additions included high-yield issues from dominant commercial lender CIT Group, online broker e-Trade Financial and aviation lender International Lease Finance (2.4%, 1.0% and 1.0% of net assets, respectively). Below-average exposure in technology hurt relative performance. Offsetting some of these losses was an underweight in the weaker performing retail and housing industries. Individual disappointments included a non-rated issue from Cabazon Band of Mission Indians (0.6% of net assets), a Native American tribe in southern California that owns and operates the Fantasy Springs Resort gaming casino and hotel.
Positive outlook for high yield
Given our expectations for slow but steady improvement in the economy and employment, continued low interest rates, adequate levels of liquidity for corporate issuers and low default rates, we remain optimistic about prospects for the high-yield sector. We recognize, however, that broader concerns could cast a shadow over higher-risk assets. Macro events that could still have an impact on investment markets include the widening sovereign debt crisis in Europe; the effect on global economies of slowing growth in China; recent deceleration in the U.S. economy, where unemployment remains high and the housing market continues to be weak; further turmoil in the Middle East and northern Africa; and the fallout from the devastating earthquake and tsunami in Japan. On the positive side, expectations for corporate earnings growth remain strong, while valuations on high-yield bonds seem attractive relative to other fixed-income asset classes. In addition, we think the credit outlook will improve along with the economy, keeping default rates near historical lows for the next year or two. Going forward, we plan to maintain a disciplined approach to credit selection, focusing on bottom-up analysis and rigorous risk management.
Portfolio characteristics and holdings are subject to change periodically and may not be representative of current characteristics and holdings. The outlook for the fund may differ from that presented for other Columbia Funds.
Investing in fixed-income securities may involve certain risks, including the credit quality of individual issuers, possible prepayments, market or economic developments and yield and share price fluctuations due to changes in interest rates. When interest rates go up, bond prices typically drop, and vice versa.
Investing in high-yield or "junk" bonds offers the potential for higher income than investments in investment-grade bonds, but also has a higher degree of risk. Changes in economic conditions or other circumstances may adversely affect a high-yield bond issuer's ability to make timely principal and interest payments. Rising interest rates tend to lower the value of all bonds. International investing involves special risks, including foreign taxation, currency fluctuations, risks associated with possible differences in financial standards and other monetary and political risks.
Maturity breakdown
as of 05/31/11 (%)
| 0 – 1 year | | | 1.1 | | |
| 1 – 3 years | | | 0.5 | | |
| 3 – 5 years | | | 8.2 | | |
| 5 – 7 years | | | 28.3 | | |
| 7 – 10 years | | | 53.6 | | |
| 10 – 15 years | | | 6.4 | | |
| 15 – 20 years | | | 0.4 | | |
| 20 – 30 years | | | 0.4 | | |
| 30 years and over | | | 1.1 | | |
Maturity breakdown is based on weighted average life and calculated as a percentage of total investments.
Portfolio Structure
as of 05/31/11 (%)
| Corporate Bonds | | | 95.1 | | |
| Cash & Equivalents | | | 3.5 | | |
| Municipal Bonds | | | 0.6 | | |
| Common Stock | | | 0.4 | | |
| Bank Loan | | | 0.4 | | |
The fund is actively managed and the composition of its portfolio will change over time. Portfolio structure is calculated as a percentage of total investments.
Quality breakdown
as of 05/31/11 (%)
| *AAA | | | 0.5 | | |
| BBB | | | 1.8 | | |
| BB | | | 36.0 | | |
| B | | | 47.4 | | |
| CCC | | | 13.0 | | |
| CC | | | 0.2 | | |
| Other | | | 1.1 | | |
*Repurchase agreement included.
Quality breakdown is calculated as a percentage of total net assets. Ratings shown in the quality breakdown are assigned to individual bonds by taking the lower of the ratings available from one of the following nationally recognized rating agencies: Standard & Poor's or Moody's Investor Services. If a security is rated by only one of the two agencies, that rating is used. If a security is not rated by either of the two agencies, it is designated as Non-Rated. Ratings are relative and subjective and are not absolute standards of quality. The credit quality of the fund's investments does not remove market risk.
30-day SEC yields
as of 05/31/11 (%)
| Class A | | | 5.32 | | |
| Class B | | | 4.82 | | |
| Class C | | | 4.98 | | |
| Class Z | | | 5.85 | | |
The 30-day SEC yields reflect the fund's earning power, net of expenses, expressed as an annualized percentage of the public offering price per share at the end of the period. Had the investment advisor not waived fees or reimbursed a portion of expenses, the 30-day SEC yields would have been lower.
5
Investment Portfolio – Columbia High Yield Opportunity Fund
May 31, 2011
| Corporate Fixed-Income Bonds & Notes – 96.7% | |
| | | Par ($) | | Value ($) | |
| Basic Materials – 6.4% | |
| Chemicals – 3.3% | |
| Agricultural Chemicals – 0.7% | |
CF Industries, Inc.
6.875% 05/01/18 | | | 1,840,000 | | | | 2,111,400 | | |
| 7.125% 05/01/20 | | | 84,000 | | | | 98,490 | | |
| | | | 2,209,890 | | |
| Chemicals-Diversified – 1.4% | |
Celanese U.S. Holdings LLC
5.875% 06/15/21 | | | 180,000 | | | | 184,050 | | |
| 6.625% 10/15/18 | | | 102,000 | | | | 107,483 | | |
Chemtura Corp.
7.875% 09/01/18 (a) | | | 369,000 | | | | 400,365 | | |
Lyondell Chemical Co.
8.000% 11/01/17 (a) | | | 2,027,000 | | | | 2,295,577 | | |
NOVA Chemicals Corp.
8.375% 11/01/16 | | | 500,000 | | | | 558,750 | | |
| 8.625% 11/01/19 | | | 805,000 | | | | 911,663 | | |
| | | | 4,457,888 | | |
| Chemicals-Plastics – 0.2% | |
Hexion U.S. Finance Corp./
Hexion Nova Scotia Finance ULC
8.875% 02/01/18 | | | 575,000 | | | | 617,406 | | |
| | | | 617,406 | | |
| Chemicals-Specialty – 1.0% | |
MacDermid, Inc.
9.500% 04/15/17 (a) | | | 580,000 | | | | 611,900 | | |
Nalco Co.
6.625% 01/15/19 (a) | | | 1,575,000 | | | | 1,636,031 | | |
Rain CII Carbon LLC & CII Carbon Corp.
8.000% 12/01/18 (a) | | | 960,000 | | | | 1,029,600 | | |
| | | | 3,277,531 | | |
| Chemicals Total | | | 10,562,715 | | |
| Forest Products & Paper – 1.1% | |
| Paper & Related Products – 1.1% | |
Cascades, Inc.
7.750% 12/15/17 | | | 1,630,000 | | | | 1,727,800 | | |
Verso Paper Holdings LLC/Verso Paper, Inc.
8.750% 02/01/19 (a) | | | 1,135,000 | | | | 1,135,000 | | |
Xerium Technologies, Inc.
8.875% 06/15/18 (a) | | | 715,000 | | | | 715,000 | | |
| | | | 3,577,800 | | |
| Forest Products & Paper Total | | | 3,577,800 | | |
| | | Par ($) | | Value ($) | |
| Iron/Steel – 0.6% | |
| Steel-Producers – 0.6% | |
JMC Steel Group
8.250% 03/15/18 (a) | | | 402,000 | | | | 415,065 | | |
United States Steel Corp.
7.000% 02/01/18 | | | 1,520,000 | | | | 1,584,600 | | |
| | | | 1,999,665 | | |
| Iron/Steel Total | | | 1,999,665 | | |
| Metals & Mining – 1.4% | |
| Diversified Minerals – 1.0% | |
FMG Resources August 2006 Pty Ltd.
6.375% 02/01/16 (a) | | | 770,000 | | | | 778,662 | | |
| 6.875% 02/01/18 (a) | | | 711,000 | | | | 742,995 | | |
| 7.000% 11/01/15 (a) | | | 1,687,000 | | | | 1,781,382 | | |
| | | | 3,303,039 | | |
| Metal-Aluminum – 0.4% | |
Novelis, Inc.
8.750% 12/15/20 | | | 1,120,000 | | | | 1,237,600 | | |
| | | | 1,237,600 | | |
| Metals & Mining Total | | | 4,540,639 | | |
| Basic Materials Total | | | 20,680,819 | | |
| Communications – 22.5% | |
| Advertising – 0.2% | |
| Advertising Agencies – 0.2% | |
Interpublic Group of Companies, Inc.
10.000% 07/15/17 | | | 524,000 | | | | 624,870 | | |
| | | | 624,870 | | |
| Advertising Total | | | 624,870 | | |
| Media – 9.4% | |
| Broadcast Services/Programs – 1.4% | |
Clear Channel Communications, Inc.
9.000% 03/01/21 (a) | | | 2,205,000 | | | | 2,210,513 | | |
Clear Channel Worldwide Holdings, Inc.
9.250% 12/15/17 | | | 2,075,000 | | | | 2,266,937 | | |
| | | | 4,477,450 | | |
| Cable TV – 3.9% | |
CCO Holdings LLC/
CCO Holdings Capital Corp.
7.000% 01/15/19 | | | 2,110,000 | | | | 2,154,838 | | |
| 8.125% 04/30/20 | | | 1,289,000 | | | | 1,398,565 | | |
Cequel Communications Holdings I LLC &
Cequel Capital Corp.
8.625% 11/15/17 (a) | | | 1,610,000 | | | | 1,710,625 | | |
See Accompanying Notes to Financial Statements.
6
Columbia High Yield Opportunity Fund
May 31, 2011
| Corporate Fixed-Income Bonds & Notes (continued) | |
| | | Par ($) | | Value ($) | |
DISH DBS Corp.
6.750% 06/01/21 (a) | | | 2,614,000 | | | | 2,640,140 | | |
| 7.875% 09/01/19 | | | 3,078,000 | | | | 3,351,172 | | |
Insight Communications Co., Inc.
9.375% 07/15/18 (a) | | | 705,000 | | | | 789,600 | | |
Kabel BW Erste Beteiligungs GmbH/
Kabel Baden-Wurttemberg GmbH & Co. KG
7.500% 03/15/19 (a) | | | 550,000 | | | | 578,113 | | |
| | | | 12,623,053 | | |
| Publishing-Periodicals – 0.2% | |
RR Donnelley & Sons Co.
7.250% 05/15/18 (b) | | | 458,000 | | | | 463,634 | | |
| 7.625% 06/15/20 | | | 310,000 | | | | 314,523 | | |
| | | | 778,157 | | |
| Radio – 1.3% | |
CMP Susquehanna Corp.
3.268% 05/15/14
(08/07/11)(a)(c)(d)(e) | | | 112,000 | | | | 103,040 | | |
Cumulus Media, Inc.
7.750% 05/01/19 (a) | | | 220,000 | | | | 220,000 | | |
Salem Communications Corp.
9.625% 12/15/16 | | | 1,510,000 | | | | 1,619,475 | | |
XM Satellite Radio, Inc.
7.625% 11/01/18 (a) | | | 2,041,000 | | | | 2,168,563 | | |
| | | | 4,111,078 | | |
| Television – 2.6% | |
Belo Corp.
8.000% 11/15/16 | | | 840,000 | | | | 925,050 | | |
Entravision Communications Corp.
8.750% 08/01/17 | | | 1,025,000 | | | | 1,089,063 | | |
Sinclair Television Group, Inc.
9.250% 11/01/17 (a) | | | 2,309,000 | | | | 2,580,307 | | |
Univision Communications, Inc.
7.875% 11/01/20 (a) | | | 1,580,000 | | | | 1,659,000 | | |
| 8.500% 05/15/21 (a) | | | 2,000,000 | | | | 2,035,000 | | |
| | | | 8,288,420 | | |
| Media Total | | | 30,278,158 | | |
| Telecommunication Services – 12.9% | |
| Cellular Telecommunications – 4.6% | |
Clearwire Communications LLC/Clearwire Finance, Inc.
12.000% 12/01/15 (a) | | | 460,000 | | | | 504,275 | | |
| 12.000% 12/01/17 (a) | | | 392,000 | | | | 427,770 | | |
Cricket Communications, Inc.
7.750% 05/15/16 | | | 399,000 | | | | 423,938 | | |
| 7.750% 10/15/20 (a) | | | 573,000 | | | | 565,121 | | |
| | | Par ($) | | Value ($) | |
MetroPCS Wireless, Inc.
6.625% 11/15/20 | | | 935,000 | | | | 932,662 | | |
| 7.875% 09/01/18 | | | 740,000 | | | | 796,425 | | |
Nextel Communications, Inc.
7.375% 08/01/15 | | | 582,000 | | | | 585,638 | | |
NII Capital Corp.
7.625% 04/01/21 | | | 870,000 | | | | 923,288 | | |
Sprint Capital Corp.
6.875% 11/15/28 | | | 1,275,000 | | | | 1,236,750 | | |
Sprint Nextel Corp.
8.375% 08/15/17 | | | 3,797,000 | | | | 4,281,117 | | |
Wind Acquisition Finance SA
7.250% 02/15/18 (a) | | | 1,030,000 | | | | 1,091,800 | | |
| 11.750% 07/15/17 (a) | | | 2,816,000 | | | | 3,273,600 | | |
| | | | 15,042,384 | | |
| Media – 1.2% | |
Nielsen Finance LLC/Nielsen Finance Co.
7.750% 10/15/18 (a) | | | 1,471,000 | | | | 1,585,002 | | |
Quebecor Media, Inc.
7.750% 03/15/16 | | | 2,365,000 | | | | 2,453,688 | | |
| | | | 4,038,690 | | |
| Satellite Telecommunications – 2.1% | |
EH Holding Corp.
6.500% 06/15/19 (a)(b) | | | 1,308,000 | | | | 1,322,715 | | |
| 7.625% 06/15/21 (a)(b) | | | 1,427,000 | | | | 1,459,107 | | |
Intelsat Jackson Holdings SA
7.250% 04/01/19 (a) | | | 1,150,000 | | | | 1,158,625 | | |
| 7.500% 04/01/21 (a) | | | 1,150,000 | | | | 1,164,375 | | |
Intelsat Luxembourg SA
PIK:
11.500% 02/04/17 (a) | | | 712,000 | | | | 771,630 | | |
| 11.500% 02/04/17 | | | 712,000 | | | | 771,630 | | |
| | | | 6,648,082 | | |
| Telecommunication Equipment – 0.2% | |
Avaya, Inc.
9.750% 11/01/15 | | | 442,000 | | | | 459,128 | | |
CommScope, Inc.
8.250% 01/15/19 (a) | | | 278,000 | | | | 291,205 | | |
| | | | 750,333 | | |
| Telecommunication Services – 1.0% | |
ITC Deltacom, Inc.
10.500% 04/01/16 | | | 191,000 | | | | 206,280 | | |
PAETEC Holding Corp.
8.875% 06/30/17 | | | 785,000 | | | | 851,725 | | |
| 9.875% 12/01/18 (a) | | | 955,000 | | | | 1,024,238 | | |
West Corp.
7.875% 01/15/19 (a) | | | 1,125,000 | | | | 1,155,937 | | |
| | | | 3,238,180 | | |
See Accompanying Notes to Financial Statements.
7
Columbia High Yield Opportunity Fund
May 31, 2011
| Corporate Fixed-Income Bonds & Notes (continued) | |
| | | Par ($) | | Value ($) | |
| Telephone-Integrated – 3.6% | |
Cincinnati Bell, Inc.
8.250% 10/15/17 | | | 1,690,000 | | | | 1,721,687 | | |
Frontier Communications Corp.
8.500% 04/15/20 | | | 2,855,000 | | | | 3,129,794 | | |
Integra Telecom Holdings, Inc.
10.750% 04/15/16 (a) | | | 401,000 | | | | 420,048 | | |
Level 3 Communications, Inc.
11.875% 02/01/19 (a) | | | 750,000 | | | | 830,625 | | |
Level 3 Escrow, Inc.
8.125% 07/01/19 (a)(b) | | | 1,143,000 | | | | 1,154,430 | | |
Level 3 Financing, Inc.
8.750% 02/15/17 | | | 975,000 | | | | 1,004,250 | | |
| 9.375% 04/01/19 (a) | | | 340,000 | | | | 359,550 | | |
Qwest Corp.
7.500% 06/15/23 | | | 2,260,000 | | | | 2,268,475 | | |
Windstream Corp.
8.125% 09/01/18 | | | 630,000 | | | | 687,487 | | |
| | | | 11,576,346 | | |
| Wireless Equipment – 0.2% | |
SBA Telecommunications, Inc.
8.250% 08/15/19 | | | 540,000 | | | | 594,675 | | |
| | | | 594,675 | | |
| Telecommunication Services Total | | | 41,888,690 | | |
| Communications Total | | | 72,791,718 | | |
| Consumer Cyclical – 11.9% | |
| Auto Manufacturers – 0.7% | |
| Auto-Cars/Light Trucks – 0.5% | |
Chrysler Group LLC/CG Co-Issuer, Inc.
8.000% 06/15/19 (a) | | | 603,000 | | | | 599,985 | | |
| 8.250% 06/15/21 (a) | | | 1,027,000 | | | | 1,024,433 | | |
| | | | 1,624,418 | | |
| Auto-Medium & Heavy Duty Trucks – 0.2% | |
Oshkosh Corp.
8.250% 03/01/17 | | | 293,000 | | | | 319,370 | | |
| 8.500% 03/01/20 | | | 158,000 | | | | 173,800 | | |
| | | | 493,170 | | |
| Auto Manufacturers Total | | | 2,117,588 | | |
| Auto Parts & Equipment – 2.8% | |
| Auto/Truck Parts & Equipment-Original – 2.6% | |
Accuride Corp.
9.500% 08/01/18 | | | 315,000 | | | | 345,713 | | |
Dana Holding Corp.
6.500% 02/15/19 | | | 245,000 | | | | 243,775 | | |
| 6.750% 02/15/21 | | | 1,904,000 | | | | 1,904,000 | | |
| | | Par ($) | | Value ($) | |
Delphi Corp.
5.875% 05/15/19 (a) | | | 417,000 | | | | 415,436 | | |
| 6.125% 05/15/21 (a) | | | 278,000 | | | | 278,695 | | |
International Automotive Components Group SL
9.125% 06/01/18 (a)(b) | | | 233,000 | | | | 238,243 | | |
Lear Corp.
7.875% 03/15/18 | | | 1,325,000 | | | | 1,454,187 | | |
| 8.125% 03/15/20 | | | 330,000 | | | | 363,000 | | |
Pinafore LLC/Pinafore, Inc.
9.000% 10/01/18 (a) | | | 210,000 | | | | 229,950 | | |
Tenneco, Inc.
7.750% 08/15/18 | | | 202,000 | | | | 213,615 | | |
TRW Automotive, Inc.
7.000% 03/15/14 (a) | | | 1,475,000 | | | | 1,622,500 | | |
Visteon Corp.
6.750% 04/15/19 (a) | | | 1,322,000 | | | | 1,282,340 | | |
| | | | 8,591,454 | | |
| Auto/Truck Parts & Equipment-Replacement – 0.2% | |
Allison Transmission, Inc.
7.125% 05/15/19 (a) | | | 585,000 | | | | 583,537 | | |
| | | | 583,537 | | |
| Auto Parts & Equipment Total | | | 9,174,991 | | |
| Entertainment – 2.4% | |
| Casino Hotels – 0.7% | |
Boyd Gaming Corp.
9.125% 12/01/18 (a) | | | 1,197,000 | | | | 1,246,376 | | |
Pinnacle Entertainment, Inc.
8.625% 08/01/17 | | | 990,000 | | | | 1,089,000 | | |
| | | | 2,335,376 | | |
| Casino Services – 0.3% | |
Tunica-Biloxi Gaming Authority
9.000% 11/15/15 (a) | | | 876,000 | | | | 873,810 | | |
| | | | 873,810 | | |
| Gambling (Non-Hotel) – 0.4% | |
Shingle Springs Tribal Gaming Authority
9.375% 06/15/15 (a) | | | 1,830,000 | | | | 1,326,750 | | |
| | | | 1,326,750 | | |
| Racetracks – 0.4% | |
Penn National Gaming, Inc.
8.750% 08/15/19 | | | 270,000 | | | | 294,638 | | |
Speedway Motorsports, Inc.
6.750% 02/01/19 | | | 176,000 | | | | 178,640 | | |
| 8.750% 06/01/16 | | | 850,000 | | | | 935,000 | | |
| | | | 1,408,278 | | |
See Accompanying Notes to Financial Statements.
8
Columbia High Yield Opportunity Fund
May 31, 2011
| Corporate Fixed-Income Bonds & Notes (continued) | |
| | | Par ($) | | Value ($) | |
| Resorts/Theme Parks – 0.1% | |
Six Flags, Inc.
9.625% 06/01/14 (a)(e)(f)(g) | | | 950,000 | | | | — | | |
Vail Resorts, Inc.
6.500% 05/01/19 (a) | | | 228,000 | | | | 232,845 | | |
| | | | 232,845 | | |
| Theaters – 0.5% | |
AMC Entertainment, Inc.
9.750% 12/01/20 (a) | | | 1,000,000 | | | | 1,061,250 | | |
Cinemark USA, Inc.
7.375% 06/15/21 (a) | | | 195,000 | | | | 195,000 | | |
Regal Cinemas Corp.
8.625% 07/15/19 | | | 456,000 | | | | 487,920 | | |
| | | | 1,744,170 | | |
| Entertainment Total | | | 7,921,229 | | |
| Home Builders – 0.7% | |
| Building-Residential/Commercial – 0.7% | |
Beazer Homes USA, Inc.
9.125% 06/15/18 | | | 57,000 | | | | 53,651 | | |
K Hovnanian Enterprises, Inc.
10.625% 10/15/16 | | | 750,000 | | | | 753,750 | | |
| 11.875% 10/15/15 | | | 169,000 | | | | 137,313 | | |
Shea Homes LP/Shea Homes Funding Corp.
8.625% 05/15/19 (a) | | | 1,145,000 | | | | 1,157,881 | | |
| | | | 2,102,595 | | |
| Home Builders Total | | | 2,102,595 | | |
| Home Furnishings – 0.2% | |
| Home Furnishings – 0.2% | |
Norcraft Companies LP/Norcraft Finance Corp.
10.500% 12/15/15 | | | 650,000 | | | | 682,500 | | |
Simmons Co.
PIK,
7.351% 02/15/12 (e)(h)(i) | | | 1,922,817 | | | | 4,807 | | |
| | | | 687,307 | | |
| Home Furnishings Total | | | 687,307 | | |
| Lodging – 3.2% | |
| Casino Hotels – 2.7% | |
Caesars Entertainment Operating Co., Inc.
9.250% 04/25/17
(06/27/11)(a)(c)(d)(i) | | | 1,240,000 | | | | 1,249,300 | | |
| 10.000% 12/15/18 | | | 745,000 | | | | 689,125 | | |
MGM Resorts International
7.500% 06/01/16 | | | 470,000 | | | | 460,600 | | |
| 9.000% 03/15/20 | | | 1,526,000 | | | | 1,701,490 | | |
| 11.375% 03/01/18 | | | 725,000 | | | | 833,750 | | |
| | | Par ($) | | Value ($) | |
Pokagon Gaming Authority
10.375% 06/15/14 (a) | | | 1,005,000 | | | | 1,031,381 | | |
Seminole Indian Tribe of Florida
6.535% 10/01/20 (a) | | | 310,000 | | | | 317,936 | | |
| 7.804% 10/01/20 (a) | | | 1,785,000 | | | | 1,804,778 | | |
Seneca Gaming Corp.
8.250% 12/01/18 (a) | | | 790,000 | | | | 829,500 | | |
| | | | 8,917,860 | | |
| Hotels & Motels – 0.5% | |
Starwood Hotels & Resorts Worldwide, Inc.
6.750% 05/15/18 | | | 1,395,000 | | | | 1,531,013 | | |
| | | | 1,531,013 | | |
| Lodging Total | | | 10,448,873 | | |
| Office Furnishings – 0.1% | |
| Office Furnishings-Original – 0.1% | |
Interface, Inc.
7.625% 12/01/18 | | | 265,000 | | | | 283,550 | | |
| | | | 283,550 | | |
| Office Furnishings Total | | | 283,550 | | |
| Retail – 1.8% | |
| Retail-Apparel/Shoe – 0.2% | |
Limited Brands, Inc.
6.625% 04/01/21 | | | 605,000 | | | | 630,712 | | |
| | | | 630,712 | | |
| Retail-Automobiles – 0.1% | |
Asbury Automotive Group, Inc.
8.375% 11/15/20 (a) | | | 140,000 | | | | 146,650 | | |
| | | | 146,650 | | |
| Retail-Drug Stores – 0.2% | |
Rite Aid Corp.
8.000% 08/15/20 | | | 400,000 | | | | 430,500 | | |
| 9.500% 06/15/17 | | | 355,000 | | | | 325,712 | | |
| | | | 756,212 | | |
| Retail-Fabric Store – 0.1% | |
Needle Merger Sub Corp.
8.125% 03/15/19 (a) | | | 203,000 | | | | 205,538 | | |
| | | | 205,538 | | |
| Retail-Mail Order – 0.5% | |
QVC, Inc.
7.125% 04/15/17 (a) | | | 255,000 | | | | 271,575 | | |
| 7.375% 10/15/20 (a) | | | 1,297,000 | | | | 1,391,032 | | |
| | | | 1,662,607 | | |
See Accompanying Notes to Financial Statements.
9
Columbia High Yield Opportunity Fund
May 31, 2011
| Corporate Fixed-Income Bonds & Notes (continued) | |
| | | Par ($) | | Value ($) | |
| Retail-Toy Store – 0.7% | |
Toys R Us, Inc.
7.375% 10/15/18 | | | 2,265,000 | | | | 2,265,000 | | |
| | | | 2,265,000 | | |
| Retail-Vitamins/Nutritional Supplements – 0.0% | |
NBTY, Inc.
9.000% 10/01/18 (a) | | | 125,000 | | | | 134,063 | | |
| | | | 134,063 | | |
| Retail Total | | | 5,800,782 | | |
| Consumer Cyclical Total | | | 38,536,915 | | |
| Consumer Non-Cyclical – 12.4% | |
| Beverages – 0.3% | |
| Beverages-Non-Alcoholic – 0.3% | |
Cott Beverages, Inc.
8.125% 09/01/18 | | | 435,000 | | | | 466,538 | | |
| 8.375% 11/15/17 | | | 400,000 | | | | 428,000 | | |
| | | | 894,538 | | |
| Beverages Total | | | 894,538 | | |
| Biotechnology – 0.1% | |
| Medical-Biomedical/Gene – 0.1% | |
STHI Holding Corp.
8.000% 03/15/18 (a) | | | 325,000 | | | | 334,750 | | |
| | | | 334,750 | | |
| Biotechnology Total | | | 334,750 | | |
| Commercial Services – 4.6% | |
| Commercial Services – 0.2% | |
ARAMARK Holdings Corp.
PIK,
8.625% 05/01/16 (a) | | | 719,000 | | | | 735,177 | | |
| | | | 735,177 | | |
| Commercial Services-Finance – 0.8% | |
Cardtronics, Inc.
8.250% 09/01/18 | | | 970,000 | | | | 1,057,300 | | |
Interactive Data Corp.
10.250% 08/01/18 (a) | | | 1,505,000 | | | | 1,674,312 | | |
| | | | 2,731,612 | | |
| Human Resources – 0.2% | |
CDRT Merger Sub, Inc.
8.125% 06/01/19 (a) | | | 634,000 | | | | 639,548 | | |
| | | | 639,548 | | |
| | | Par ($) | | Value ($) | |
| Rental Auto/Equipment – 3.2% | |
Avis Budget Car Rental LLC/
Avis Budget Finance, Inc.
8.250% 01/15/19 | | | 1,045,000 | | | | 1,082,881 | | |
Hertz Corp.
6.750% 04/15/19 (a) | | | 670,000 | | | | 676,700 | | |
| 7.375% 01/15/21 (a) | | | 1,142,000 | | | | 1,181,970 | | |
| 7.500% 10/15/18 (a) | | | 980,000 | | | | 1,016,750 | | |
Neff Rental, LLC/Neff Finance Corp.
9.625% 05/15/16 (a) | | | 1,070,000 | | | | 1,068,662 | | |
RSC Equipment Rental, Inc./
RSC Holdings III LLC
8.250% 02/01/21 | | | 485,000 | | | | 500,763 | | |
United Rentals North America, Inc.
8.375% 09/15/20 | | | 1,915,000 | | | | 1,991,600 | | |
| 9.250% 12/15/19 | | | 2,420,000 | | | | 2,704,350 | | |
| | | | 10,223,676 | | |
| Security Services – 0.2% | |
Garda World Security Corp.
9.750% 03/15/17 (a) | | | 653,000 | | | | 706,873 | | |
| | | | 706,873 | | |
| Commercial Services Total | | | 15,036,886 | | |
| Food – 0.2% | |
| Food-Dairy Products – 0.2% | |
Dean Foods Co.
7.000% 06/01/16 | | | 27,000 | | | | 27,068 | | |
| 9.750% 12/15/18 (a) | | | 537,000 | | | | 578,617 | | |
| | | | 605,685 | | |
| Food Total | | | 605,685 | | |
| Health Care Equipment & Services – 0.5% | |
| Advertising Services – 0.5% | |
inVentiv Health, Inc.
10.000% 08/15/18 (a) | | | 1,502,000 | | | | 1,562,080 | | |
| | | | 1,562,080 | | |
| Health Care Equipment & Services Total | | | 1,562,080 | | |
| Healthcare Products – 0.2% | |
| Medical Products – 0.2% | |
Hanger Orthopedic Group, Inc.
7.125% 11/15/18 | | | 708,000 | | | | 725,700 | | |
| | | | 725,700 | | |
| Healthcare Products Total | | | 725,700 | | |
See Accompanying Notes to Financial Statements.
10
Columbia High Yield Opportunity Fund
May 31, 2011
| Corporate Fixed-Income Bonds & Notes (continued) | |
| | | Par ($) | | Value ($) | |
| Healthcare Services – 3.8% | |
| Medical Labs & Testing Services – 0.2% | |
American Renal Associates Holdings, Inc.
PIK,
9.750% 03/01/16 (a) | | | 210,000 | | | | 217,350 | | |
American Renal Holdings, Inc.
8.375% 05/15/18 | | | 409,000 | | | | 427,405 | | |
| | | | 644,755 | | |
| Medical-HMO – 0.3% | |
Multiplan, Inc.
9.875% 09/01/18 (a) | | | 909,000 | | | | 983,993 | | |
| | | | 983,993 | | |
| Medical-Hospitals – 2.6% | |
Capella Healthcare, Inc.
9.250% 07/01/17 (a) | | | 165,000 | | | | 176,550 | | |
Community Health Systems, Inc.
8.875% 07/15/15 | | | 532,000 | | | | 549,290 | | |
HCA, Inc.
7.250% 09/15/20 | | | 4,562,000 | | | | 4,972,580 | | |
LifePoint Hospitals, Inc.
6.625% 10/01/20 (a) | | | 401,000 | | | | 416,037 | | |
Tenet Healthcare Corp.
8.875% 07/01/19 | | | 550,000 | | | | 611,875 | | |
Vanguard Health Holding Co. II, LLC/
Vanguard Holding Co. II, Inc.
7.750% 02/01/19 (a) | | | 90,000 | | | | 92,700 | | |
| 8.000% 02/01/18 | | | 740,000 | | | | 771,450 | | |
| 8.000% 02/01/18 (a) | | | 700,000 | | | | 731,500 | | |
| | | | 8,321,982 | | |
| MRI/Medical Diagnostic Imaging – 0.1% | |
Radnet Management, Inc.
10.375% 04/01/18 | | | 180,000 | | | | 187,200 | | |
| | | | 187,200 | | |
| Physical Therapy/Rehab Centers – 0.6% | |
Healthsouth Corp.
7.750% 09/15/22 | | | 150,000 | | | | 160,125 | | |
| 8.125% 02/15/20 | | | 726,000 | | | | 799,507 | | |
| 10.750% 06/15/16 | | | 1,030,000 | | | | 1,089,225 | | |
| | | | 2,048,857 | | |
| Healthcare Services Total | | | 12,186,787 | | |
| Household Products/Wares – 0.8% | |
| Consumer Products-Miscellaneous – 0.8% | |
Central Garden & Pet Co.
8.250% 03/01/18 | | | 400,000 | | | | 422,000 | | |
| | | Par ($) | | Value ($) | |
Spectrum Brands Holdings, Inc.
9.500% 06/15/18 (a) | | | 1,915,000 | | | | 2,135,225 | | |
| | | | 2,557,225 | | |
| Household Products/Wares Total | | | 2,557,225 | | |
| Pharmaceuticals – 1.9% | |
| Medical-Drugs – 1.2% | |
ConvaTec Healthcare E SA
10.500% 12/15/18 (a) | | | 1,494,000 | | | | 1,613,520 | | |
Giant Funding Corp.
8.250% 02/01/18 (a) | | | 1,036,000 | | | | 1,090,390 | | |
Valeant Pharmaceuticals International
6.750% 10/01/17 (a) | | | 420,000 | | | | 415,800 | | |
| 7.000% 10/01/20 (a) | | | 689,000 | | | | 675,220 | | |
| | | | 3,794,930 | | |
| Medical-Generic Drugs – 0.3% | |
Mylan, Inc.
6.000% 11/15/18 (a) | | | 1,134,000 | | | | 1,165,185 | | |
| | | | 1,165,185 | | |
| Therapeutics – 0.4% | |
Warner Chilcott Co., LLC/
Warner Chilcott Finance LLC
7.750% 09/15/18 (a) | | | 1,315,000 | | | | 1,370,888 | | |
| | | | 1,370,888 | | |
| Pharmaceuticals Total | | | 6,331,003 | | |
| Consumer Non-Cyclical Total | | | 40,234,654 | | |
| Energy – 16.2% | |
| Coal – 1.3% | |
| Coal – 1.3% | |
Alpha Natural Resources, Inc.
6.000% 06/01/19 (b) | | | 563,000 | | | | 567,926 | | |
| 6.250% 06/01/21 (b) | | | 563,000 | | | | 574,260 | | |
Consol Energy, Inc.
8.000% 04/01/17 | | | 880,000 | | | | 963,600 | | |
| 8.250% 04/01/20 | | | 1,785,000 | | | | 1,981,350 | | |
| | | | 4,087,136 | | |
| Coal Total | | | 4,087,136 | | |
| Oil & Gas – 10.7% | |
| Oil Companies-Exploration & Production – 10.4 % | |
Berry Petroleum Co.
6.750% 11/01/20 | | | 305,000 | | | | 314,913 | | |
| 8.250% 11/01/16 | | | 135,000 | | | | 141,413 | | |
| 10.250% 06/01/14 | | | 240,000 | | | | 277,200 | | |
See Accompanying Notes to Financial Statements.
11
Columbia High Yield Opportunity Fund
May 31, 2011
| Corporate Fixed-Income Bonds & Notes (continued) | |
| | | Par ($) | | Value ($) | |
Brigham Exploration Co.
6.875% 06/01/19 (a) | | | 211,000 | | | | 211,000 | | |
| 8.750% 10/01/18 | | | 735,000 | | | | 806,662 | | |
Carrizo Oil & Gas, Inc.
8.625% 10/15/18 (a) | | | 1,649,000 | | | | 1,739,695 | | |
Chaparral Energy, Inc.
8.250% 09/01/21 | | | 987,000 | | | | 1,021,545 | | |
| 9.875% 10/01/20 | | | 367,000 | | | | 379,845 | | |
Chesapeake Energy Corp.
6.125% 02/15/21 | | | 1,424,000 | | | | 1,448,920 | | |
| 6.625% 08/15/20 | | | 2,400,000 | | | | 2,523,000 | | |
Comstock Resources, Inc.
7.750% 04/01/19 | | | 260,000 | | | | 263,900 | | |
| 8.375% 10/15/17 | | | 892,000 | | | | 941,060 | | |
Concho Resources, Inc./Midland TX
6.500% 01/15/22 | | | 782,000 | | | | 785,910 | | |
| 7.000% 01/15/21 | | | 1,003,000 | | | | 1,050,642 | | |
| 8.625% 10/01/17 | | | 691,000 | | | | 753,190 | | |
Continental Resources, Inc.
7.125% 04/01/21 | | | 736,000 | | | | 776,480 | | |
EXCO Resources, Inc.
7.500% 09/15/18 | | | 1,913,000 | | | | 1,922,565 | | |
Goodrich Petroleum Corp.
8.875% 03/15/19 (a) | | | 666,000 | | | | 670,995 | | |
Hilcorp Energy I LP/Hilcorp Finance Co.
7.625% 04/15/21 (a) | | | 1,277,000 | | | | 1,347,235 | | |
| 7.750% 11/01/15 (a) | | | 1,455,000 | | | | 1,505,925 | | |
Laredo Petroleum, Inc.
9.500% 02/15/19 (a) | | | 1,788,000 | | | | 1,904,220 | | |
Linn Energy LLC/Linn Energy Finance Corp.
6.500% 05/15/19 (a) | | | 1,382,000 | | | | 1,382,000 | | |
MEG Energy Corp.
6.500% 03/15/21 (a) | | | 945,000 | | | | 952,087 | | |
Oasis Petroleum, Inc.
7.250% 02/01/19 (a) | | | 487,000 | | | | 488,218 | | |
PetroHawk Energy Corp.
6.250% 06/01/19 (a) | | | 2,770,000 | | | | 2,735,375 | | |
| 7.250% 08/15/18 | | | 1,653,000 | | | | 1,733,584 | | |
QEP Resources, Inc.
6.875% 03/01/21 | | | 1,105,000 | | | | 1,187,875 | | |
Quicksilver Resources, Inc.
7.125% 04/01/16 | | | 342,000 | | | | 336,870 | | |
Range Resources Corp.
5.750% 06/01/21 | | | 712,000 | | | | 709,330 | | |
| 6.750% 08/01/20 | | | 945,000 | | | | 996,975 | | |
| 8.000% 05/15/19 | | | 480,000 | | | | 524,400 | | |
Southwestern Energy Co.
7.500% 02/01/18 | | | 655,000 | | | | 749,156 | | |
Venoco, Inc.
8.875% 02/15/19 (a) | | | 1,172,000 | | | | 1,186,650 | | |
| | | | 33,768,835 | | |
| | | Par ($) | | Value ($) | |
| Oil Refining & Marketing – 0.3% | |
United Refining Co.
10.500% 02/28/18 (a) | | | 1,056,000 | | | | 1,069,200 | | |
| | | | 1,069,200 | | |
| Oil & Gas Total | | | 34,838,035 | | |
| Oil & Gas Services – 1.7% | |
| Oil-Field Services – 1.7% | |
Aquilex Holdings LLC/Aquilex Finance Corp.
11.125% 12/15/16 | | | 546,000 | | | | 537,810 | | |
Offshore Group Investments Ltd.
11.500% 08/01/15 (a)(b) | | | 460,000 | | | | 503,691 | | |
| 11.500% 08/01/15 | | | 1,960,000 | | | | 2,160,900 | | |
Oil States International, Inc.
6.500% 06/01/19 (a) | | | 1,372,000 | | | | 1,380,575 | | |
Trinidad Drilling Ltd.
7.875% 01/15/19 (a) | | | 764,000 | | | | 819,183 | | |
| | | | 5,402,159 | | |
| Oil & Gas Services Total | | | 5,402,159 | | |
| Pipelines – 2.5% | |
| Pipelines – 2.5% | |
El Paso Corp.
6.500% 09/15/20 | | | 2,518,000 | | | | 2,813,865 | | |
| 6.875% 06/15/14 | | | 340,000 | | | | 386,230 | | |
| 7.250% 06/01/18 | | | 787,000 | | | | 920,790 | | |
Energy Transfer Equity LP
7.500% 10/15/20 | | | 661,000 | | | | 717,185 | | |
Regency Energy Partners LP/
Regency Energy Finance Corp.
6.500% 07/15/21 | | | 1,389,000 | | | | 1,395,945 | | |
| 6.875% 12/01/18 | | | 525,000 | | | | 551,250 | | |
| 9.375% 06/01/16 | | | 480,000 | | | | 544,800 | | |
Southern Star Central Corp.
6.750% 03/01/16 | | | 755,000 | | | | 771,988 | | |
| | | | 8,102,053 | | |
| Pipelines Total | | | 8,102,053 | | |
| Energy Total | | | 52,429,383 | | |
| Financials – 10.7% | |
| Banks – 2.8% | |
| Commercial Banks-Non U.S. – 0.1% | |
Lloyds Banking Group PLC
6.267% 11/29/49 (a) | | | 516,000 | | | | 421,830 | | |
| | | | 421,830 | | |
See Accompanying Notes to Financial Statements.
12
Columbia High Yield Opportunity Fund
May 31, 2011
| Corporate Fixed-Income Bonds & Notes (continued) | |
| | | Par ($) | | Value ($) | |
| Diversified Financial Services – 2.7% | |
Capital One Capital IV
6.745% 02/05/82
(02/17/32)(c)(d) | | | 1,115,000 | | | | 1,130,331 | | |
CIT Group, Inc.
6.625% 04/01/18 (a) | | | 1,135,000 | | | | 1,214,450 | | |
| 7.000% 05/01/17 | | | 6,375,000 | | | | 6,398,907 | | |
| | | | 8,743,688 | | |
| Banks Total | | | 9,165,518 | | |
| Diversified Financial Services – 7.0% | |
| Diversified Banking Institutional – 2.2% | |
Ally Financial, Inc.
6.250% 12/01/17 (a) | | | 1,165,000 | | | | 1,200,134 | | |
| 7.500% 09/15/20 | | | 950,000 | | | | 1,022,438 | | |
| 8.000% 03/15/20 | | | 4,398,000 | | | | 4,854,292 | | |
| | | | 7,076,864 | | |
| Finance-Auto Loans – 1.2% | |
Ford Motor Credit Co., LLC
5.750% 02/01/21 | | | 3,525,000 | | | | 3,552,396 | | |
General Motors Financial Co., Inc.
6.750% 06/01/18 (a) | | | 321,000 | | | | 323,441 | | |
| | | | 3,875,837 | | |
| Finance-Consumer Loans – 1.2% | |
SLM Corp.
6.250% 01/25/16 | | | 820,000 | | | | 858,910 | | |
| 8.000% 03/25/20 | | | 1,321,000 | | | | 1,456,804 | | |
Springleaf Finance Corp.
6.900% 12/15/17 | | | 1,675,000 | | | | 1,591,250 | | |
| | | | 3,906,964 | | |
| Finance-Investment Banker/Broker – 1.1% | |
E*Trade Financial Corp.
6.750% 06/01/16 | | | 1,070,000 | | | | 1,070,000 | | |
| 7.875% 12/01/15 | | | 870,000 | | | | 897,187 | | |
PIK,
12.500% 11/30/17 | | | 1,150,000 | | | | 1,382,875 | | |
| | | | 3,350,062 | | |
| Finance-Leasing Company – 1.3% | |
International Lease Finance Corp.
6.250% 05/15/19 | | | 810,000 | | | | 813,049 | | |
| 8.250% 12/15/20 | | | 785,000 | | | | 881,163 | | |
| 8.750% 03/15/17 | | | 1,019,000 | | | | 1,154,017 | | |
| 8.875% 09/01/17 | | | 1,260,000 | | | | 1,433,250 | | |
| | | | 4,281,479 | | |
| Diversified Financial Services Total | | | 22,491,206 | | |
| | | Par ($) | | Value ($) | |
| Insurance – 0.9% | |
| Multi-Line Insurance – 0.9% | |
ING Groep NV
5.775% 12/29/49
(12/08/15)(c)(d) | | | 3,135,000 | | | | 2,915,550 | | |
| | | | 2,915,550 | | |
| Insurance Total | | | 2,915,550 | | |
| Financials Total | | | 34,572,274 | | |
| Industrials – 9.9% | |
| Aerospace & Defense – 1.9% | |
| Aerospace/Defense – 1.6% | |
ADS Tactical, Inc.
11.000% 04/01/18 (a) | | | 2,030,000 | | | | 2,161,950 | | |
Kratos Defense & Security Solutions, Inc.
10.000% 06/01/17 (a) | | | 1,438,000 | | | | 1,581,800 | | |
| 10.000% 06/01/17 | | | 1,100,000 | | | | 1,210,000 | | |
| | | | 4,953,750 | | |
| Aerospace/Defense-Equipment – 0.3% | |
TransDigm, Inc.
7.750% 12/15/18 (a) | | | 999,000 | | | | 1,061,437 | | |
| | | | 1,061,437 | | |
| Aerospace & Defense Total | | | 6,015,187 | | |
| Building Materials – 1.9% | |
| Building & Construction Products-Miscellaneous – 1.9% | |
Building Materials Corp. of America
6.750% 05/01/21 (a) | | | 2,155,000 | | | | 2,171,162 | | |
Calcipar SA
6.875% 05/01/18 (a) | | | 1,164,000 | | | | 1,204,740 | | |
Euramax International, Inc.
9.500% 04/01/16 (a) | | | 865,000 | | | | 886,625 | | |
Gibraltar Industries, Inc.
8.000% 12/01/15 | | | 620,000 | | | | 637,050 | | |
Interline Brands, Inc.
7.000% 11/15/18 | | | 448,000 | | | | 458,640 | | |
Nortek, Inc.
8.500% 04/15/21 (a) | | | 750,000 | | | | 715,313 | | |
| | | | 6,073,530 | | |
| Building Materials Total | | | 6,073,530 | | |
| Electrical Components & Equipment – 0.2% | |
| Wire & Cable Products – 0.2% | |
WireCo WorldGroup
9.500% 05/15/17 (a) | | | 660,000 | | | | 701,250 | | |
| | | | 701,250 | | |
| Electrical Components & Equipment Total | | | 701,250 | | |
See Accompanying Notes to Financial Statements.
13
Columbia High Yield Opportunity Fund
May 31, 2011
| Corporate Fixed-Income Bonds & Notes (continued) | |
| | | Par ($) | | Value ($) | |
| Environmental Control – 0.5% | |
| Alternative Waste Technology – 0.1% | |
Darling International, Inc.
8.500% 12/15/18 (a) | | | 195,000 | | | | 212,550 | | |
| | | | 212,550 | | |
| Hazardous Waste Disposal – 0.4% | |
Clean Harbors, Inc.
7.625% 08/15/16 (a) | | | 345,000 | | | | 368,288 | | |
| 7.625% 08/15/16 | | | 877,000 | | | | 936,197 | | |
| | | | 1,304,485 | | |
| Environmental Control Total | | | 1,517,035 | | |
| Machinery-Diversified – 1.6% | |
| Machinery-Farm – 0.7% | |
Case New Holland, Inc.
7.875% 12/01/17 (a) | | | 1,947,000 | | | | 2,178,206 | | |
| | | | 2,178,206 | | |
| Machinery-General Industry – 0.8% | |
CPM Holdings, Inc.
10.875% 09/01/14 (a) | | | 902,000 | | | | 983,180 | | |
Manitowoc Co., Inc.
8.500% 11/01/20 | | | 795,000 | | | | 864,563 | | |
| 9.500% 02/15/18 | | | 850,000 | | | | 939,250 | | |
| | | | 2,786,993 | | |
| Machinery-Material Handling – 0.1% | |
Columbus McKinnon Corp.
7.875% 02/01/19 (a) | | | 319,000 | | | | 330,165 | | |
| | | | 330,165 | | |
| Machinery-Diversified Total | | | 5,295,364 | | |
| Miscellaneous Manufacturing – 0.9% | |
| Diversified Manufacturing Operators – 0.6% | |
Amsted Industries, Inc.
8.125% 03/15/18 (a) | | | 1,000,000 | | | | 1,062,500 | | |
SPX Corp.
6.875% 09/01/17 (a) | | | 943,000 | | | | 1,009,010 | | |
| | | | 2,071,510 | | |
| Filtration/Separate Products – 0.3% | |
Polypore International, Inc.
7.500% 11/15/17 (a) | | | 920,000 | | | | 977,500 | | |
| | | | 977,500 | | |
| Miscellaneous Manufacturing Total | | | 3,049,010 | | |
| | | Par ($) | | Value ($) | |
| Packaging & Containers – 2.3% | |
| Containers-Metal/Glass – 1.7% | |
ARD Finance SA
PIK,
11.125% 06/01/18 (a) | | | 282,000 | | | | 294,690 | | |
Ardagh Packaging Finance PLC
7.375% 10/15/17 (a) | | | 315,000 | | | | 336,263 | | |
| 9.125% 10/15/20 (a) | | | 685,000 | | | | 753,500 | | |
Reynolds Group Issuer, Inc./
Reynolds Group Issuer LLC
7.125% 04/15/19 (a) | | | 2,083,000 | | | | 2,166,320 | | |
| 8.250% 02/15/21 (a) | | | 988,000 | | | | 1,005,290 | | |
| 9.000% 04/15/19 (a) | | | 945,000 | | | | 1,002,881 | | |
| | | | 5,558,944 | | |
| Containers-Paper/Plastic – 0.6% | |
Graham Packaging Co., LP/
GPC Capital Corp. I
8.250% 01/01/17 | | | 1,455,000 | | | | 1,582,312 | | |
Graphic Packaging International, Inc.
7.875% 10/01/18 | | | 231,000 | | | | 250,635 | | |
| | | | 1,832,947 | | |
| Packaging & Containers Total | | | 7,391,891 | | |
| Shipbuilding – 0.5% | |
| Shipbuilding – 0.5% | |
Huntington Ingalls Industries, Inc.
6.875% 03/15/18 (a) | | | 666,000 | | | | 694,305 | | |
| 7.125% 03/15/21 (a) | | | 902,000 | | | | 941,463 | | |
| | | | 1,635,768 | | |
| Shipbuilding Total | | | 1,635,768 | | |
| Transportation – 0.1% | |
| Transportation-Air Freight – 0.1% | |
AMGH Merger Sub, Inc.
9.250% 11/01/18 (a) | | | 272,000 | | | | 291,040 | | |
| | | | 291,040 | | |
| Transportation Total | | | 291,040 | | |
| Industrials Total | | | 31,970,075 | | |
See Accompanying Notes to Financial Statements.
14
Columbia High Yield Opportunity Fund
May 31, 2011
| Corporate Fixed-Income Bonds & Notes (continued) | |
| | | Par ($) | | Value ($) | |
| Information Technology – 1.6% | |
| IT Services – 1.6% | |
| Data Processing/Management – 1.6% | |
First Data Corp.
7.375% 06/15/19 (a) | | | 617,000 | | | | 626,255 | | |
| 8.875% 08/15/20 (a) | | | 1,260,000 | | | | 1,367,100 | | |
| 9.875% 09/24/15 | | | 843,000 | | | | 870,397 | | |
| 12.625% 01/15/21 (a) | | | 2,020,000 | | | | 2,196,750 | | |
| | | | 5,060,502 | | |
| IT Services Total | | | 5,060,502 | | |
| Information Technology Total | | | 5,060,502 | | |
| Technology – 2.8% | |
| Computers – 0.4% | |
| Office Automation & Equipment – 0.4% | |
CDW LLC/CDW Finance Corp.
8.500% 04/01/19 (a) | | | 1,210,000 | | | | 1,222,100 | | |
| | | | 1,222,100 | | |
| Computers Total | | | 1,222,100 | | |
| Semiconductors – 1.7% | |
| Electronic Components-Miscellaneous – 0.3% | |
NXP BV/NXP Funding LLC
9.750% 08/01/18 (a) | | | 922,000 | | | | 1,062,605 | | |
| | | | 1,062,605 | | |
| Electronic Components-Semiconductors – 1.4% | |
Amkor Technology, Inc.
6.625% 06/01/21 (a) | | | 1,363,000 | | | | 1,339,147 | | |
| 7.375% 05/01/18 | | | 777,000 | | | | 810,023 | | |
| 9.250% 06/01/16 | | | 1,640,000 | | | | 1,719,950 | | |
Freescale Semiconductor, Inc.
9.250% 04/15/18 (a) | | | 700,000 | | | | 780,500 | | |
| | | | 4,649,620 | | |
| Semiconductors Total | | | 5,712,225 | | |
| Software – 0.7% | |
| Computer Services – 0.7% | |
iGate Corp.
9.000% 05/01/16 (a) | | | 762,000 | | | | 781,050 | | |
SunGard Data Systems, Inc.
7.375% 11/15/18 | | | 1,442,000 | | | | 1,470,840 | | |
| | | | 2,251,890 | | |
| Software Total | | | 2,251,890 | | |
| Technology Total | | | 9,186,215 | | |
| | | Par ($) | | Value ($) | |
| Utilities – 2.3% | |
| Electric – 2.3% | |
| Electric-Generation – 0.4% | |
Edison Mission Energy
7.000% 05/15/17 | | | 1,624,000 | | | | 1,343,860 | | |
| | | | 1,343,860 | | |
| Electric-Integrated – 0.5% | |
Ipalco Enterprises, Inc.
7.250% 04/01/16 (a) | | | 1,025,000 | | | | 1,150,563 | | |
Texas Competitive Electric Holdings Co., LLC/
TCEH Finance, Inc.
11.500% 10/01/20 (a) | | | 392,000 | | | | 396,900 | | |
| | | | 1,547,463 | | |
| Independent Power Producer – 1.4% | |
Calpine Corp.
7.500% 02/15/21 (a) | | | 840,000 | | | | 873,600 | | |
Energy Future Holdings Corp.
10.000% 01/15/20 | | | 1,450,000 | | | | 1,569,854 | | |
GenOn Energy, Inc.
9.500% 10/15/18 | | | 673,000 | | | | 708,332 | | |
NRG Energy, Inc.
7.625% 05/15/19 (a) | | | 1,497,000 | | | | 1,495,129 | | |
| | | | 4,646,915 | | |
| Electric Total | | | 7,538,238 | | |
| Utilities Total | | | 7,538,238 | | |
Total Corporate Fixed-Income
Bonds & Notes
(cost of $299,251,941) | | | 313,000,793 | | |
| Municipal Bond – 0.6% | |
| California – 0.6% | |
CA Cabazon Band Mission Indians
Series 2004,
7.358% 10/01/11 (j) | | | 3,250,000 | | | | 1,876,875 | | |
| California Total | | | 1,876,875 | | |
Total Municipal Bond
(cost of $3,250,000) | | | 1,876,875 | | |
See Accompanying Notes to Financial Statements.
15
Columbia High Yield Opportunity Fund
May 31, 2011
| Common Stocks – 0.5% | |
| | | Shares | | Value ($) | |
| Consumer Discretionary – 0.5% | |
| Hotels, Restaurants & Leisure – 0.5% | |
| Six Flags Entertainment Corp. (k) | | | 18,799 | | | | 1,498,257 | | |
| Hotels, Restaurants & Leisure Total | | | 1,498,257 | | |
| Consumer Discretionary Total | | | 1,498,257 | | |
| Industrials – 0.0% | |
| Commercial Services & Supplies – 0.0% | |
| Fairlane Management Corp. (e)(f)(k) | | | 50,004 | | | | — | | |
| Commercial Services & Supplies Total | | | — | | |
| Industrials Total | | | — | | |
Total Common Stocks
(cost of $1,430,661) | | | 1,498,257 | | |
| Warrants – 0.0% | |
| | | Units | | | |
| Financials – 0.0% | |
| Banks – 0.0% | |
CMP Susquehanna Radio Holdings Corp. (a)(e)(k)
Expires 03/23/19 | | | 29,954 | | | | 300 | | |
| Banks Total | | | 300 | | |
| Financials Total | | | 300 | | |
Total Warrants
(cost of $300) | | | 300 | | |
| Preferred Stock – 0.0% | |
| | | Shares | | | |
| Communications – 0.0% | |
| Media – 0.0% | |
CMP Susquehanna Radio Holdings Corp.,
Series A (a)(e)(k) | | | 26,213 | | | | 262 | | |
| Media Total | | | 262 | | |
| Communications Total | | | 262 | | |
Total Preferred Stock
(cost of $262) | | | 262 | | |
| Short-Term Obligation – 3.5% | |
| | | Par ($) | | Value ($) | |
Repurchase agreement with
Fixed Income Clearing Corp.,
dated 05/31/11, due 06/01/11
at 0.010%, collateralized
by a U.S. Government
Agency obligation maturing
02/26/29, market value
$11,674,881 (repurchase
proceeds $11,445,003) | | | 11,445,000 | | | | 11,445,000 | | |
Total Short-Term Obligation
(cost of $11,445,000) | | | 11,445,000 | | |
Total Investments — 101.3%
(cost of $315,378,164) (l) | | | 327,821,487 | | |
| Other Assets & Liabilities, Net — (1.3)% | | | (4,088,248 | ) | |
| Net Assets — 100.0% | | | 323,733,239 | | |
Notes to Investment Portfolio:
(a) Security exempt from registration pursuant to Rule 144A under the Securities Act of 1933. These securities may be resold in transactions exempt from registration, normally to qualified institutional buyers. At May 31, 2011, these securities, which are not illiquid except for the following, amounted to $147,246,705, which represents 45.5% of net assets.
| Security | | Acquisition
Date(s) | | Par/
Shares/
Units | | Cost | | Value | |
CMP Susquehanna
Corp., 3.268%
05/15/14 | | 03/26/09 | | $ | 112,000 | | | $ | 100,887 | | | $ | 103,040 | | |
CMP Susquehanna
Radio Holdings
Corp., Series A | | 03/26/09 | | | 26,213 | | | | 262 | | | | 262 | | |
CMP Susquehanna
Radio Holdings Corp.
Warrants Expiring
03/23/19 | | 03/26/06 | | | 29,954 | | | | 300 | | | | 300 | | |
Six Flags, Inc.
9.625% 06/01/14 | | 05/07/10 | | $ | 950,000 | | | | — | | | | — | | |
| | | | | | | | | $ | 103,602 | | |
(b) Security, or a portion thereof, purchased on a delayed delivery basis.
(c) The interest rate shown on floating rate or variable rate securities reflects the rate at May 31, 2011.
(d) Parenthetical date represents the next interest rate reset date for the security.
(e) Represents fair value as determined in good faith under procedures approved by the Board of Trustees. At May 31, 2011, the value of these securities amounted to $108,409, which represents less than 0.1% of net assets.
(f) Security has no value.
(g) Position reflects anticipated residual bankruptcy claims. Income is not being accrued.
(h) The issuer has filed for bankruptcy protection under Chapter 11, and is in default of certain debt covenants. Income is not being accrued. At May 31, 2011, the value of this security amounted to $4,807, which represents less than 0.1% of net assets.
(i) Loan participation agreement.
(j) The issuer is in default of certain debt covenants. Income is being partially accrued. At May 31, 2011, the value of this security amounted to $1,876,875, which represents 0.6% of net assets.
(k) Non-income producing security.
(l) Cost for federal income tax purposes is $315,645,757.
See Accompanying Notes to Financial Statements.
16
Columbia High Yield Opportunity Fund
May 31, 2011
Generally accepted accounting principles (GAAP) require disclosure regarding the inputs and valuation techniques used to measure fair value and any changes in valuation inputs or techniques. In addition, investments shall be disclosed by major category.
The Fund categorizes its fair value measurements according to a three-level hierarchy that maximizes the use of observable inputs and minimizes the use of unobservable inputs by prioritizing that the most observable input be used when available. Observable inputs are those that market participants would use in pricing an investment based on market data obtained from sources independent of the reporting entity. Unobservable inputs are those that reflect the Fund's assumptions about the information market participants would use in pricing an investment. An investment's level within the fair value hierarchy is based on the lowest level of any input that is deemed significant to the asset or liability's fair value measurement. The input levels are not necessarily an indication of the risk or liquidity associated with investments at that level. For example, certain U.S. government securities are generally high quality and liquid, however, they are reflected as Level 2 because the inputs used to determine fair value may not always be quoted prices in an active market.
Fair value inputs are summarized in the three broad levels listed below:
• Level 1 — Valuations based on quoted prices for investments in active markets that the Fund has the ability to access at the measurement date (including NAV for open-end mutual funds). Valuation adjustments are not applied to Level 1 investments.
• Level 2 — Valuations based on other significant observable inputs (including quoted prices for similar securities, interest rates, prepayment speeds, credit risks, etc.).
• Level 3 — Valuations based on significant unobservable inputs (including the Fund's own assumptions and judgment in determining the fair value of investments).
Inputs that are used in determining fair value of an investment may include price information, credit data, volatility statistics, and other factors. These inputs can be either observable or unobservable. The availability of observable inputs can vary between investments, and is affected by various factors such as the type of investment, and the volume and level of activity for that investment or similar investments in the marketplace. The inputs will be considered by the Investment Manager, along with any other relevant factors in the calculation of an investment's fair value. The Fund uses prices and inputs that are current as of the measurement date, which may include periods of market dislocations. During these periods, the availability of prices and inputs may be reduced for many investments. This condition could cause an investment to be reclassified between the various levels within the hierarchy.
Investments falling into the Level 3 category are primarily supported by quoted prices from brokers and dealers participating in the market for those investments. However, these may be classified as Level 3 investments due to lack of market transparency and corroboration to support these quoted prices. Additionally, valuation models may be used as the pricing source for any remaining investments classified as Level 3. These models rely on one or more significant unobservable inputs and/or significant assumptions by the Investment Manager. Inputs used in valuations may include, but are not limited to, financial statement analysis, capital account balances, discount rates and estimated cash flows, and comparable company data.
See Accompanying Notes to Financial Statements.
17
Columbia High Yield Opportunity Fund
May 31, 2011
The following table is a summary of the inputs used to value the Fund's investments as of May 31, 2011:
| Description | |
Quoted
Prices
(Level 1) | | Other
Significant
Observable
Inputs
(Level 2) | |
Significant
Unobservable
Inputs
(Level 3) | |
Total | |
Corporate Fixed-Income
Bonds & Notes | |
| Basic Materials | | $ | — | | | $ | 20,680,819 | | | $ | — | | | $ | 20,680,819 | | |
| Communications | | | — | | | | 72,688,678 | | | | 103,040 | | | | 72,791,718 | | |
| Consumer Cyclical | | | — | | | | 38,532,108 | | | | 4,807 | | | | 38,536,915 | | |
| Consumer Non-Cyclical | | | — | | | | 40,234,654 | | | | — | | | | 40,234,654 | | |
| Energy | | | — | | | | 52,429,383 | | | | — | | | | 52,429,383 | | |
| Financials | | | — | | | | 34,572,274 | | | | — | | | | 34,572,274 | | |
| Industrials | | | — | | | | 31,970,075 | | | | — | | | | 31,970,075 | | |
| Information Technology | | | — | | | | 5,060,502 | | | | — | | | | 5,060,502 | | |
| Technology | | | — | | | | 9,186,215 | | | | — | | | | 9,186,215 | | |
| Utilities | | | — | | | | 7,538,238 | | | | — | | | | 7,538,238 | | |
Total Corporate
Fixed-Income
Bonds & Notes | | | — | | | | 312,892,946 | | | | 107,847 | | | | 313,000,793 | | |
| Total Municipal Bond | | | — | | | | 1,876,875 | | | | — | | | | 1,876,875 | | |
| Total Common Stocks | | | 1,498,257 | | | | — | | | | — | | | | 1,498,257 | | |
| Total Warrants | | | — | | | | — | | | | 300 | | | | 300 | | |
| Total Preferred Stock | | | — | | | | — | | | | 262 | | | | 262 | | |
| Total Short-Term Obligation | | | — | | | | 11,445,000 | | | | — | | | | 11,445,000 | | |
| Total Investments | | $ | 1,498,257 | | | $ | 326,214,821 | | | $ | 108,409 | | | $ | 327,821,487 | | |
The Fund's assets assigned to the Level 2 input category are generally valued using the market approach, in which a security's value is determined through its correlation to prices and information from market transactions for similar or identical assets.
Certain short-term obligations may be valued using amortized cost, an income approach which converts future cash flows to a present value based upon the discount or premium at purchase.
The Fund's assets assigned to the Level 3 category are valued utilizing the valuation technique deemed the most appropriate in the circumstances.
Certain corporate fixed–income bonds & notes classified as Level 3 are valued using an income approach. To determine fair value for these securities, management considered estimates of future distributions from the liquidation of company assets or potential actions related to the respective company's bankruptcy filing.
Certain preferred stocks, corporate fixed–income bonds & notes and warrants classified as Level 3 are valued using a market approach. To determine fair value for these securities, management considered various factors which may have included, but were not limited to, trades of similar securities, estimated earnings of the respective company, market multiples derived from a set of comparable companies, and the position of the security within the respective company's capital structure.
There were no significant transfers of financial assets between Levels 1 and 2 during the period.
The following table reconciles asset balances for the year ending May 31, 2011, in which significant unobservable inputs (Level 3) were used in determining value:
Investments
in Securities | | Balance
as of
May 31,
2010 | | Accrued
Discounts
(Premiums) | | Realized
Gain
(Loss) | | Change in
Unrealized
Appreciation
(Depreciation) | | Purchases | | Sales | | Transfers
into
Level 3 | | Transfers
out of
Level 3 | | Balance
as of
May 31,
2011 | |
| Corporate Fixed-Income | |
| Bonds & Notes | |
| Communications | | $ | 66,080 | | | $ | 2,054 | | | $ | — | | | $ | 34,906 | | | $ | — | | | $ | — | | | $ | — | | | $ | — | | | $ | 103,040 | | |
| Consumer Cyclical | | | — | | | | — | | | | — | | | | — | | | | — | | | | — | | | | 4,807 | | | | — | | | | 4,807 | | |
| Preferred Stocks | |
| Communications | | | 262 | | | | — | | | | — | | | | — | | | | — | | | | — | | | | — | | | | — | | | | 262 | | |
| Warrants | |
| Communications | | | — | | | | — | | | | (2,467 | ) | | | 2,467 | | | | — | | | | — | | | | — | | | | — | | | | — | | |
| Consumer Non-Cyclical | | | — | | | | — | | | | (7,278,928 | ) | | | 7,278,928 | | | | — | | | | — | | | | — | | | | — | | | | — | | |
| Financials | | | 300 | | | | — | | | | — | | | | — | | | | — | | | | — | | | | — | | | | — | | | | 300 | | |
| | | $ | 66,642 | | | $ | 2,054 | | | $ | (7,281,395 | ) | | $ | 7,316,301 | | | $ | — | | | $ | — | | | $ | 4,807 | | | $ | — | | | $ | 108,409 | | |
The information in the above reconciliation represents fiscal year to date activity for any securities identified as using Level 3 inputs at either the beginning or the end of the current fiscal period.
The change in unrealized appreciation attributed to securities owned at May 31, 2011, which were valued using significant unobservable inputs (Level 3) amounted to $34,906. This amount is included in net change in unrealized appreciation (depreciation) on the Statement of Changes in Net Assets.
Financial Assets were transferred from Level 2 to Level 3 due to the pricing vendor discontinuing coverage; as a result the security was fair valued by management.
The following table shows transfers between Level 2 and Level 3 of the fair value hierarchy:
| Transfers In | | Transfers Out | |
| Level 2 | | Level 3 | | Level 2 | | Level 3 | |
| $ | — | | | $ | 4,807 | | | $ | 4,807 | | | $ | — | | |
See Accompanying Notes to Financial Statements.
18
Columbia High Yield Opportunity Fund
May 31, 2011
At May 31, 2011, the asset allocation of the Fund is as follows:
| Asset Allocation (Unaudited) | | % of
Net Assets | |
| Corporate Fixed-Income Bonds & Notes | | | 96.7 | | |
| Municipal Bond | | | 0.6 | | |
| Common Stocks | | | 0.5 | | |
| Warrants | | | 0.0 | * | |
| Preferred Stock | | | 0.0 | * | |
| | | | 97.8 | | |
| Short-Term Obligation | | | 3.5 | | |
| Other Assets & Liabilities, Net | | | (1.3 | ) | |
| | | | 100.0 | | |
* Rounds to less than 0.1%.
| Acronym | | Name | |
| PIK | | Payment-In-Kind | |
|
See Accompanying Notes to Financial Statements.
19
Statement of Assets and Liabilities – Columbia High Yield Opportunity Fund
May 31, 2011
| | | | | ($) | |
| Assets | | Investments, at cost | | | 315,378,164 | | |
| | | Investments, at value | | | 327,821,487 | | |
| | | Cash | | | 659 | | |
| | | Receivable for: | | | |
| | | Investments sold | | | 713,739 | | |
| | | Fund shares sold | | | 103,772 | | |
| | | Dividends | | | 2,256 | | |
| | | Interest | | | 5,957,726 | | |
| | | Expense reimbursement due from Investment Manager | | | 34,285 | | |
| | | Trustees' deferred compensation plan | | | 76,033 | | |
| | | Prepaid expenses | | | 2,031 | | |
| | | Total Assets | | | 334,711,988 | | |
| Liabilities | | Payable for: | | | |
| | | Investments purchased | | | 2,781,339 | | |
| | | Investments purchased on a delayed delivery basis | | | 6,361,722 | | |
| | | Fund shares repurchased | | | 357,504 | | |
| | | Distributions | | | 1,000,451 | | |
| | | Investment advisory fee | | | 166,136 | | |
| | | Pricing and bookkeeping fees | | | 11,418 | | |
| | | Transfer agent fee | | | 52,067 | | |
| | | Trustees' fees | | | 484 | | |
| | | Audit fee | | | 53,650 | | |
| | | Custody fee | | | 8,997 | | |
| | | Distribution and service fees | | | 57,879 | | |
| | | Chief compliance officer expenses | | | 175 | | |
| | | Reports to shareholders | | | 44,591 | | |
| | | Trustees' deferred compensation plan | | | 76,033 | | |
| | | Other liabilities | | | 6,303 | | |
| | | Total Liabilities | | | 10,978,749 | | |
| | | Net Assets | | | 323,733,239 | | |
| Net Assets Consist of | | Paid-in capital | | | 404,724,174 | | |
| | | Overdistributed net investment income | | | (1,613,184 | ) | |
| | | Accumulated net realized loss | | | (91,821,074 | ) | |
| | | Net unrealized appreciation on investments | | | 12,443,323 | | |
| | | Net Assets | | | 323,733,239 | | |
See Accompanying Notes to Financial Statements.
20
Statement of Assets and Liabilities (continued) – Columbia High Yield Opportunity Fund
May 31, 2011
| Class A | | Net assets | | $ | 193,413,403 | | |
| | | Shares outstanding | | | 46,717,502 | | |
| | | Net asset value per share | | $ | 4.14 | (a) | |
| | | Maximum sales charge | | | 4.75 | % | |
| | | Maximum offering price per share ($4.14/0.9525) | | $ | 4.35 | (b) | |
| Class B | | Net assets | | $ | 8,283,394 | | |
| | | Shares outstanding | | | 2,000,997 | | |
| | | Net asset value and offering price per share | | $ | 4.14 | (a) | |
| Class C | | Net assets | | $ | 12,524,857 | | |
| | | Shares outstanding | | | 3,025,295 | | |
| | | Net asset value and offering price per share | | $ | 4.14 | (a) | |
| Class Z | | Net assets | | $ | 109,511,585 | | |
| | | Shares outstanding | | | 26,452,111 | | |
| | | Net asset value, offering and redemption price per share | | $ | 4.14 | | |
(a) Redemption price per share is equal to net asset value less any applicable contingent deferred sales charge.
(b) On sales of $50,000 or more the offering price is reduced.
See Accompanying Notes to Financial Statements.
21
Statement of Operations – Columbia High Yield Opportunity Fund
For the Year Ended May 31, 2011
| | | | | ($) | |
| Investment Income | | Dividends | | | 3,384 | | |
| | | Interest | | | 26,034,218 | | |
| | | Foreign taxes withheld | | | (316 | ) | |
| | | Total Investment Income | | | 26,037,286 | | |
| Expenses | | Investment advisory fee | | | 1,953,985 | | |
| | | Distribution fee: | | | |
| | | Class B | | | 92,451 | | |
| | | Class C | | | 96,688 | | |
| | | Service fee: | | | |
| | | Class A | | | 480,455 | | |
| | | Class B | | | 30,817 | | |
| | | Class C | | | 32,223 | | |
| | | Transfer agent fee | | | 431,924 | | |
| | | Pricing and bookkeeping fees | | | 111,434 | | |
| | | Trustees' fees | | | 27,841 | | |
| | | Custody fee | | | 36,005 | | |
| | | Chief compliance officer expenses | | | 1,155 | | |
| | | Other expenses | | | 291,387 | | |
| | | Total Expenses | | | 3,586,365 | | |
| | | Fees waived or expenses reimbursed by Investment Manager | | | (247,123 | ) | |
| | | Fees waived by distributor—Class C | | | (19,352 | ) | |
| | | Expense reductions | | | (247 | ) | |
| | | Net Expenses | | | 3,319,643 | | |
| | | Net Investment Income | | | 22,717,643 | | |
Net Realized and Unrealized
Gain (Loss) on Investments,
Foreign Currency and
Forward Foreign Currency
Exchange Contracts | |
| | | Net realized gain on: | | | |
| | | Investments | | | 10,358,987 | | |
| | | Forward foreign currency exchange contracts | | | 27,973 | | |
| | | Net realized gain | | | 10,386,960 | | |
| | | Net change in unrealized appreciation (depreciation) on: | | | |
| | | Investments | | | 19,082,328 | | |
| | | Forward foreign currency exchange contracts | | | (27,973 | ) | |
| | | Net change in unrealized appreciation (depreciation) | | | 19,054,355 | | |
| | | Net Gain | | | 29,441,315 | | |
| | | Net Increase Resulting from Operations | | | 52,158,958 | | |
See Accompanying Notes to Financial Statements.
22
Statement of Changes in Net Assets – Columbia High Yield Opportunity Fund
| | | | | Year Ended May 31, | |
| Increase (Decrease) in Net Assets | | | | 2011 ($) | | 2010 ($) | |
| Operations | | Net investment income | | | 22,717,643 | | | | 24,785,080 | | |
| | | Net realized gain on investments, foreign
currency transactions and forward foreign
currency exchange contracts | | | 10,386,960 | | | | 321,475 | | |
| | | Net change in unrealized appreciation (depreciation)
on investments, foreign currency translations and
forward foreign currency exchange contracts | | | 19,054,355 | | | | 48,902,119 | | |
| | | Net increase resulting from operations | | | 52,158,958 | | | | 74,008,674 | | |
| Distributions to Shareholders | | From net investment income: | | | | | |
| | | Class A | | | (13,614,354 | ) | | | (17,071,049 | ) | |
| | | Class B | | | (791,063 | ) | | | (1,751,647 | ) | |
| | | Class C | | | (837,050 | ) | | | (1,106,430 | ) | |
| | | Class Z | | | (7,944,339 | ) | | | (11,127,296 | ) | |
| | | Total distributions to shareholders | | | (23,186,806 | ) | | | (31,056,422 | ) | |
| | | Net Capital Stock Transactions | | | (26,520,862 | ) | | | (39,502,420 | ) | |
| | | Increase from regulatory settlements | | | 17,121 | | | | 133,454 | | |
| | | Total increase in net assets | | | 2,468,411 | | | | 3,583,286 | | |
| Net Assets | | Beginning of period | | | 321,264,828 | | | | 317,681,542 | | |
| | | End of period | | | 323,733,239 | | | | 321,264,828 | | |
| | | Overdistributed net investment income at end of period | | | (1,613,184 | ) | | | (2,292,629 | ) | |
See Accompanying Notes to Financial Statements.
23
Statement of Changes in Net Assets (continued) – Columbia High Yield Opportunity Fund
| | | Capital Stock Activity | |
| | | Year Ended
May 31, 2011 | | Year Ended
May 31, 2010 | |
| | | Shares | | Dollars ($) | | Shares | | Dollars ($) | |
| Class A | |
| Subscriptions | | | 3,955,095 | | | | 15,833,710 | | | | 8,318,813 | | | | 31,487,410 | | |
| Distributions reinvested | | | 1,895,314 | | | | 7,612,707 | | | | 2,581,565 | | | | 9,663,388 | | |
| Redemptions | | | (7,770,032 | ) | | | (31,253,032 | ) | | | (13,378,029 | ) | | | (50,009,107 | ) | |
| Net decrease | | | (1,919,623 | ) | | | (7,806,615 | ) | | | (2,477,651 | ) | | | (8,858,309 | ) | |
| Class B | |
| Subscriptions | | | 99,478 | | | | 398,681 | | | | 184,940 | | | | 661,584 | | |
| Distributions reinvested | | | 105,284 | | | | 420,348 | | | | 262,227 | | | | 978,083 | | |
| Redemptions | | | (2,466,393 | ) | | | (9,887,582 | ) | | | (3,287,225 | ) | | | (12,223,852 | ) | |
| Net decrease | | | (2,261,631 | ) | | | (9,068,553 | ) | | | (2,840,058 | ) | | | (10,584,185 | ) | |
| Class C | |
| Subscriptions | | | 259,490 | | | | 1,041,748 | | | | 418,033 | | | | 1,537,653 | | |
| Distributions reinvested | | | 124,951 | | | | 501,709 | | | | 177,579 | | | | 664,707 | | |
| Redemptions | | | (730,026 | ) | | | (2,927,483 | ) | | | (723,614 | ) | | | (2,708,990 | ) | |
| Net decrease | | | (345,585 | ) | | | (1,384,026 | ) | | | (128,002 | ) | | | (506,630 | ) | |
| Class Z | |
| Subscriptions | | | 6,939,307 | | | | 27,789,426 | | | | 7,510,656 | | | | 27,350,410 | | |
| Distributions reinvested | | | 363,491 | | | | 1,462,635 | | | | 501,381 | | | | 1,871,962 | | |
| Redemptions | | | (9,384,416 | ) | | | (37,513,729 | ) | | | (13,102,656 | ) | | | (48,775,668 | ) | |
| Net decrease | | | (2,081,618 | ) | | | (8,261,668 | ) | | | (5,090,619 | ) | | | (19,553,296 | ) | |
See Accompanying Notes to Financial Statements.
24
Financial Highlights – Columbia High Yield Opportunity Fund
Selected data for a share outstanding throughout each period is as follows:
| | | Year Ended May 31, | |
| Class A Shares | | 2011 | | 2010 | | 2009 | | 2008 | | 2007 | |
| Net Asset Value, Beginning of Period | | $ | 3.79 | | | $ | 3.33 | | | $ | 4.17 | | | $ | 4.72 | | | $ | 4.50 | | |
| Income from Investment Operations: | |
| Net investment income (a) | | | 0.28 | | | | 0.27 | | | | 0.30 | | | | 0.31 | | | | 0.33 | | |
Net realized and unrealized gain (loss) on
investments, foreign currency and credit
default swap contracts | | | 0.35 | | | | 0.53 | | | | (0.83 | ) | | | (0.55 | ) | | | 0.23 | | |
| Total from investment operations | | | 0.63 | | | | 0.80 | | | | (0.53 | ) | | | (0.24 | ) | | | 0.56 | | |
| Less Distributions to Shareholders: | |
| From net investment income | | | (0.28 | ) | | | (0.34 | ) | | | (0.32 | ) | | | (0.31 | ) | | | (0.34 | ) | |
| Increase from regulatory settlements | | | — | (b) | | | — | (b) | | | 0.01 | | | | — | | | | — | | |
| Net Asset Value, End of Period | | $ | 4.14 | | | $ | 3.79 | | | $ | 3.33 | | | $ | 4.17 | | | $ | 4.72 | | |
| Total return (c) | | | 17.21 | %(d) | | | 24.50 | %(d) | | | (12.04 | )% | | | (5.03 | )%(d) | | | 12.98 | % | |
Ratios to Average Net Assets/
Supplemental Data: | |
| Net expenses before interest expense (e) | | | 1.05 | % | | | 1.08 | % | | | 1.10 | % | | | 1.13 | % | | | 1.12 | % | |
| Interest expense | | | — | | | | — | %(f) | | | — | | | | — | %(f) | | | — | %(f) | |
| Net expenses (e) | | | 1.05 | % | | | 1.08 | % | | | 1.10 | % | | | 1.13 | % | | | 1.12 | % | |
| Waiver/Reimbursement | | | 0.08 | % | | | 0.04 | % | | | — | | | | 0.01 | % | | | — | | |
| Net investment income (e) | | | 6.94 | % | | | 7.23 | % | | | 9.08 | % | | | 7.23 | % | | | 7.19 | % | |
| Portfolio turnover rate | | | 109 | % | | | 60 | % | | | 44 | % | | | 50 | % | | | 75 | % | |
| Net assets, end of period (000s) | | $ | 193,413 | | | $ | 184,253 | | | $ | 170,321 | | | $ | 205,330 | | | $ | 270,866 | | |
(a) Per share data was calculated using the average shares outstanding during the period.
(b) Rounds to less than $0.01 per share.
(c) Total return at net asset value assuming all distributions reinvested and no initial sales charge or contingent deferred sales charge.
(d) Had the Investment Manager and/or any of its affiliates not waived fees or reimbursed a portion of expenses, total return would have been reduced.
(e) The benefits derived from expense reductions had an impact of less than 0.01%.
(f) Rounds to less than 0.01%.
See Accompanying Notes to Financial Statements.
25
Financial Highlights – Columbia High Yield Opportunity Fund
Selected data for a share outstanding throughout each period is as follows:
| | | Year Ended May 31, | |
| Class B Shares | | 2011 | | 2010 | | 2009 | | 2008 | | 2007 | |
| Net Asset Value, Beginning of Period | | $ | 3.79 | | | $ | 3.33 | | | $ | 4.17 | | | $ | 4.72 | | | $ | 4.50 | | |
| Income from Investment Operations: | |
| Net investment income (a) | | | 0.25 | | | | 0.24 | | | | 0.28 | | | | 0.28 | | | | 0.29 | | |
Net realized and unrealized gain (loss) on
investments, foreign currency and credit
default swap contracts | | | 0.35 | | | | 0.53 | | | | (0.84 | ) | | | (0.55 | ) | | | 0.24 | | |
| Total from investment operations | | | 0.60 | | | | 0.77 | | | | (0.56 | ) | | | (0.27 | ) | | | 0.53 | | |
| Less Distributions to Shareholders: | |
| From net investment income | | | (0.25 | ) | | | (0.31 | ) | | | (0.29 | ) | | | (0.28 | ) | | | (0.31 | ) | |
| Increase from regulatory settlements | | | — | (b) | | | — | (b) | | | 0.01 | | | | — | | | | — | | |
| Net Asset Value, End of Period | | $ | 4.14 | | | $ | 3.79 | | | $ | 3.33 | | | $ | 4.17 | | | $ | 4.72 | | |
| Total return (c) | | | 16.34 | %(d) | | | 23.59 | %(d) | | | (12.69 | )% | | | (5.73 | )%(d) | | | 12.15 | % | |
Ratios to Average Net Assets/
Supplemental Data: | |
| Net expenses before interest expense (e) | | | 1.80 | % | | | 1.83 | % | | | 1.85 | % | | | 1.88 | % | | | 1.87 | % | |
| Interest expense | | | — | | | | — | %(f) | | | — | | | | — | %(f) | | | — | %(f) | |
| Net expenses (e) | | | 1.80 | % | | | 1.83 | % | | | 1.85 | % | | | 1.88 | % | | | 1.87 | % | |
| Waiver/Reimbursement | | | 0.08 | % | | | 0.04 | % | | | — | | | | 0.01 | % | | | — | | |
| Net investment income (e) | | | 6.27 | % | | | 6.50 | % | | | 8.35 | % | | | 6.47 | % | | | 6.46 | % | |
| Portfolio turnover rate | | | 109 | % | | | 60 | % | | | 44 | % | | | 50 | % | | | 75 | % | |
| Net assets, end of period (000s) | | $ | 8,283 | | | $ | 16,149 | | | $ | 23,665 | | | $ | 46,732 | | | $ | 88,774 | | |
(a) Per share data was calculated using the average shares outstanding during the period.
(b) Rounds to less than $0.01 per share.
(c) Total return at net asset value assuming all distributions reinvested and no contingent deferred sales charge.
(d) Had the Investment Manager and/or any of its affiliates not waived fees or reimbursed a portion of expenses, total return would have been reduced.
(e) The benefits derived from expense reductions had an impact of less than 0.01%.
(f) Rounds to less than 0.01%.
See Accompanying Notes to Financial Statements.
26
Financial Highlights – Columbia High Yield Opportunity Fund
Selected data for a share outstanding throughout each period is as follows:
| | | Year Ended May 31, | |
| Class C Shares | | 2011 | | 2010 | | 2009 | | 2008 | | 2007 | |
| Net Asset Value, Beginning of Period | | $ | 3.79 | | | $ | 3.33 | | | $ | 4.17 | | | $ | 4.72 | | | $ | 4.50 | | |
| Income from Investment Operations: | |
| Net investment income (a) | | | 0.25 | | | | 0.25 | | | | 0.28 | | | | 0.29 | | | | 0.30 | | |
Net realized and unrealized gain (loss) on
investments, foreign currency and credit
default swap contracts | | | 0.36 | | | | 0.52 | | | | (0.83 | ) | | | (0.55 | ) | | | 0.23 | | |
| Total from investment operations | | | 0.61 | | | | 0.77 | | | | (0.55 | ) | | | (0.26 | ) | | | 0.53 | | |
| Less Distributions to Shareholders: | |
| From net investment income | | | (0.26 | ) | | | (0.31 | ) | | | (0.30 | ) | | | (0.29 | ) | | | (0.31 | ) | |
| Increase from regulatory settlements | | | — | (b) | | | — | (b) | | | 0.01 | | | | — | | | | — | | |
| Net Asset Value, End of Period | | $ | 4.14 | | | $ | 3.79 | | | $ | 3.33 | | | $ | 4.17 | | | $ | 4.72 | | |
| Total return (c)(d) | | | 16.52 | % | | | 23.76 | % | | | (12.57 | )% | | | (5.59 | )% | | | 12.31 | % | |
Ratios to Average Net Assets/
Supplemental Data: | |
| Net expenses before interest expense (e) | | | 1.65 | % | | | 1.68 | % | | | 1.70 | % | | | 1.73 | % | | | 1.72 | % | |
| Interest expense | | | — | | | | — | %(f) | | | — | | | | — | %(f) | | | — | %(f) | |
| Net expenses (e) | | | 1.65 | % | | | 1.68 | % | | | 1.70 | % | | | 1.73 | % | | | 1.72 | % | |
| Waiver/Reimbursement | | | 0.23 | % | | | 0.19 | % | | | 0.15 | % | | | 0.16 | % | | | 0.15 | % | |
| Net investment income (e) | | | 6.35 | % | | | 6.63 | % | | | 8.49 | % | | | 6.63 | % | | | 6.60 | % | |
| Portfolio turnover rate | | | 109 | % | | | 60 | % | | | 44 | % | | | 50 | % | | | 75 | % | |
| Net assets, end of period (000s) | | $ | 12,525 | | | $ | 12,769 | | | $ | 11,658 | | | $ | 15,202 | | | $ | 21,161 | | |
(a) Per share data was calculated using the average shares outstanding during the period.
(b) Rounds to less than $0.01 per share.
(c) Total return at net asset value assuming all distributions reinvested and no contingent deferred sales charge.
(d) Had the Investment Manager and/or any of its affiliates not waived fees or reimbursed a portion of expenses, total return would have been reduced.
(e) The benefits derived from expense reductions had an impact of less than 0.01%.
(f) Rounds to less than 0.01%.
See Accompanying Notes to Financial Statements.
27
Financial Highlights – Columbia High Yield Opportunity Fund
Selected data for a share outstanding throughout each period is as follows:
| | | Year Ended May 31, | |
| Class Z Shares | | 2011 | | 2010 | | 2009 | | 2008 | | 2007 | |
| Net Asset Value, Beginning of Period | | $ | 3.79 | | | $ | 3.33 | | | $ | 4.17 | | | $ | 4.72 | | | $ | 4.50 | | |
| Income from Investment Operations: | |
| Net investment income (a) | | | 0.29 | | | | 0.28 | | | | 0.31 | | | | 0.31 | | | | 0.34 | | |
Net realized and unrealized gain (loss) on
investments, foreign currency and credit
default swap contracts | | | 0.35 | | | | 0.53 | | | | (0.83 | ) | | | (0.54 | ) | | | 0.23 | | |
| Total from investment operations | | | 0.64 | | | | 0.81 | | | | (0.52 | ) | | | (0.23 | ) | | | 0.57 | | |
| Less Distributions to Shareholders: | |
| From net investment income | | | (0.29 | ) | | | (0.35 | ) | | | (0.33 | ) | | | (0.32 | ) | | | (0.35 | ) | |
| Increase from regulatory settlements | | | — | (b) | | | — | (b) | | | 0.01 | | | | — | | | | — | | |
| Net Asset Value, End of Period | | $ | 4.14 | | | $ | 3.79 | | | $ | 3.33 | | | $ | 4.17 | | | $ | 4.72 | | |
| Total return (c) | | | 17.50 | %(d) | | | 24.80 | %(d) | | | (11.83 | )% | | | (4.79 | )%(d) | | | 13.26 | % | |
Ratios to Average Net Assets/
Supplemental Data: | |
| Net expenses before interest expense (e) | | | 0.80 | % | | | 0.83 | % | | | 0.85 | % | | | 0.88 | % | | | 0.87 | % | |
| Interest expense | | | — | | | | — | %(f) | | | — | | | | — | %(f) | | | — | %(f) | |
| Net expenses (e) | | | 0.80 | % | | | 0.83 | % | | | 0.85 | % | | | 0.88 | % | | | 0.87 | % | |
| Waiver/Reimbursement | | | 0.08 | % | | | 0.04 | % | | | — | | | | 0.01 | % | | | — | | |
| Net investment income (e) | | | 7.19 | % | | | 7.48 | % | | | 9.39 | % | | | 7.47 | % | | | 7.44 | % | |
| Portfolio turnover rate | | | 109 | % | | | 60 | % | | | 44 | % | | | 50 | % | | | 75 | % | |
| Net assets, end of period (000s) | | $ | 109,512 | | | $ | 108,094 | | | $ | 112,037 | | | $ | 122,766 | | | $ | 29,220 | | |
(a) Per share data was calculated using the average shares outstanding during the period.
(b) Rounds to less than $0.01 per share.
(c) Total return at net asset value assuming all distributions reinvested.
(d) Had the Investment Manager and/or any of its affiliates not waived fees or reimbursed a portion of expenses, total return would have been reduced.
(e) The benefits derived from expense reductions had an impact of less than 0.01%.
(f) Rounds to less than 0.01%.
See Accompanying Notes to Financial Statements.
28
Notes to Financial Statements – Columbia High Yield Opportunity Fund
May 31, 2011
Note 1. Organization
Columbia High Yield Opportunity Fund (the Fund), a series of Columbia Funds Series Trust I (the Trust), is a diversified fund. The Trust is registered under the Investment Company Act of 1940, as amended (the 1940 Act), as an open-end management investment company organized as a Massachusetts business trust.
Investment Objective
The Fund seeks total return, consisting of current income and capital appreciation.
Fund Shares
The Trust may issue an unlimited number of shares (without par value). The Fund offers Class A, Class B, Class C and Class Z shares. All share classes have identical voting, dividend and liquidation rights. Each share class has its own expense structure and sales charges, as applicable.
Class A shares are subject to a maximum front-end sales charge of 4.75% based on the initial investment amount. Class A shares purchased without an initial sales charge in accounts aggregating $1 million to $50 million at the time of purchase are subject to a 1.00% contingent deferred sales charge (CDSC) if the shares are sold within 18 months of purchase, charged as follows: 1.00% CDSC if redeemed within 12 months of purchase, and 0.50% CDSC if redeemed more than 12, but less than 18 months after purchase.
Class B shares are subject to a maximum CDSC of 5.00% based upon the holding period after purchase. Class B shares will generally convert to Class A shares eight years after purchase. The Fund no longer accepts investments by new or existing investors in the Fund's Class B shares, except in connection with the reinvestment of any dividend and/or capital gain distributions in Class B shares of the Fund and exchanges by existing Class B shareholders of other funds within the Columbia Family of Funds.
Class C shares are subject to a 1.00% CDSC on shares redeemed within one year of purchase.
Class Z shares are not subject to sales charges and are available only to certain investors, as described in the Fund's prospectus.
Note 2. Summary of Significant Accounting Policies
The preparation of financial statements in accordance with U.S. generally accepted accounting principles (GAAP) requires management to make certain estimates and assumptions that affect the reported amounts of assets and liabilities, the disclosure of contingent assets and liabilities at the date of the financial statements and the reported amounts of revenue and expenses during the reporting period. Actual results could differ from those estimates.
The following is a summary of significant accounting policies consistently followed by the Fund in the preparation of its financial statements.
Security Valuation
Debt securities generally are valued by pricing services approved by the Trust's Board of Trustees, based upon market transactions for normal, institutional-size trading units of similar securities. The services may use various pricing techniques which take into account appropriate factors such as yield, quality, coupon rate, maturity, type of issue, trading characteristics and other data, as well as broker quotes. Debt securities for which quotations are readily available may also be valued based upon an over-the-counter or exchange bid quotation.
Certain debt securities, which tend to be more thinly traded and of lesser quality, are priced based on fundamental analysis of the financial condition of the issuer and the estimated value of any collateral. Valuations developed through pricing techniques may vary from the actual amounts realized upon sale of the securities, and the potential variation may be greater for those securities valued using fundamental analysis.
Equity securities are valued at the last sale price on the principal exchange on which they trade, except for securities traded on the NASDAQ, which are valued at the NASDAQ official close price. Unlisted securities or listed securities for which there were no sales during the day are valued at the closing bid price on such exchanges or over-the-counter markets.
Short-term investments maturing in 60 days or less are valued at amortized cost, which approximates market value.
Forward foreign currency exchange contracts are valued at the prevailing forward exchange rate of the underlying currencies.
Foreign securities are generally valued at the last sale price on the foreign exchange or market on which they trade. If any foreign share prices are not readily available as a result of limited share activity, the securities are valued at the last sale price of the local shares in the principal market in which such securities are normally traded.
Generally, trading in foreign securities is substantially completed each day at various times prior to the close of the New York Stock
29
Columbia High Yield Opportunity Fund, May 31, 2011
Exchange (NYSE). The values of such securities used in computing the net asset value of the Fund's shares are determined as of such times. Foreign currency exchange rates are generally determined at 4:00 p.m. Eastern (U.S.) time. Occasionally, events affecting the values of such foreign securities and such exchange rates may occur between the times at which they are determined and the close of the customary trading session of the NYSE, which would not be reflected in the computation of the Fund's net asset value. If events materially affecting the values of such foreign securities occur and it is determined that market quotations are not reliable, then these foreign securities will be valued at their fair value using procedures approved by the Board of Trustees.
Investments for which market quotations are not readily available, or that have quotations which management believes are not reliable, are valued at fair value as determined in good faith under consistently applied procedures established by and under the general supervision of the Board of Trustees. If a security is valued at fair value, such value is likely to be different from the last quoted market price for the security. The determination of fair value often requires significant judgment. To determine fair value, management may use assumptions including but not limited to future cash flows and estimated risk premiums. Multiple inputs from various sources may be used to determine value.
Foreign Currency Transactions and Translations
The values of all assets and liabilities quoted in foreign currencies are translated into U.S. dollars at that day's exchange rates. Net realized and unrealized gains (losses) on foreign currency transactions and translations include gains (losses) arising from the fluctuation in exchange rates between trade and settlement dates on securities transactions, gains (losses) arising from the disposition of foreign currency and currency gains (losses) between the accrual and payment dates on dividends, interest income and foreign withholding taxes.
For financial statement purposes, the Fund does not distinguish that portion of gains (losses) on investments which is due to changes in foreign exchange rates from that which is due to changes in market prices of the investments. Such fluctuations are included with the net realized and unrealized gains (losses) on investments on the Statement of Operations.
Derivative Instruments
The Fund may use derivative instruments including forward foreign currency exchange contracts in order to meet its investment objectives. The Fund employs strategies in differing combinations to permit it to increase, decrease or change the level of exposure to market risk factors. The achievement of any strategy relating to derivatives depends on an analysis of various risk factors, and if the strategies for the use of derivatives do not work as intended, the Fund may not achieve its investment objectives.
In pursuit of its investment objectives, the Fund is exposed to the following market risks among others:
Foreign Exchange Rate Risk: Foreign exchange rate risk relates to the change in the U.S. dollar value of a security held that is denominated in a foreign currency. The U.S. dollar value of a foreign-currency-denominated security will decrease as the dollar appreciates against the currency, while the U.S. dollar value will increase as the dollar depreciates against the currency. The following notes provide more detailed information about the derivative type held by the Fund:
Forward Foreign Currency Exchange Contracts—The Fund entered into forward foreign currency exchange contracts to shift its foreign currency exposure from one currency to another. Forward foreign currency exchange contracts are agreements to exchange one currency for another at a future date at a specified price. These contracts are used to minimize the exposure to foreign exchange rate fluctuations during the period between the trade and settlement dates of the contract. Contracts to buy generally are used to acquire exposure to foreign currencies, while contracts to sell are generally used to reduce the exposure to foreign exchange rate fluctuations. Forward foreign currency exchange contracts are valued daily at the current exchange rate of the underlying currency, resulting in unrealized gains (losses) which become realized at the time the forward foreign currency exchange contracts are closed or mature. Realized and unrealized gains (losses) arising from such transactions are included in net realized and unrealized gains (losses) on foreign currency transactions. The use of forward foreign currency exchange contracts does not eliminate fluctuations in the prices of the Fund's portfolio securities. While the maximum potential loss from such contracts is the aggregate face value in U.S. dollars at the time the contract was opened, exposure is typically limited to the change in value of the contract (in U.S. dollars) over the period it remains open. The Fund could also be exposed to risk that counterparties of the contracts may be unable to fulfill the terms of the contracts.
During the year ended May 31, 2011, the Fund entered into 4 forward foreign currency exchange contracts.
30
Columbia High Yield Opportunity Fund, May 31, 2011
The effect of derivative instruments on the Fund's Statement of Operations for the year ended May 31, 2011:
| | | Amount of Realized Gain or (Loss)
and Change in Unrealized Appreciation or
(Depreciation) on Derivatives Recognized in Income | |
| | | Risk Exposure | | Net Realized
Gain | | Change in
Unrealized
Appreciation
(Depreciation) | |
| Forward foreign currency exchange contracts | | Foreign Exchange Rate | | $ | 27,973 | | | $ | (27,973 | ) | |
Repurchase Agreements
The Fund may engage in repurchase agreement transactions with institutions that the Investment Manager has determined are creditworthy. The Fund, through the custodian, receives delivery of the underlying securities collateralizing a repurchase agreement. The Investment Manager is responsible for determining that the collateral is at least equal, at all times, to the value of the repurchase obligation including interest. A repurchase agreement transaction involves certain risks in the event of default or insolvency of the counterparty. These risks include possible delays in or restrictions on the Fund's ability to dispose of the underlying securities and a possible decline in the value of the underlying securities during the period while the Fund seeks to assert its rights.
Loan Participations and Commitments
The Fund may invest in loan participations. When the Fund purchases a loan participation, the Fund typically enters into a contractual relationship with the lender or third party selling such participation (Selling Participant), but not the borrower. However, the Fund assumes the credit risk of the borrower, Selling Participant and any other persons interpositioned between the Fund and the borrower. The Fund may not directly benefit from the collateral supporting the senior loan which it has purchased from the Selling Participant.
Delayed Delivery Securities
The Fund may trade securities on other than normal settlement terms, including securities purchased or sold on a "when-issued" basis. This may increase the risk if the other party to the transaction fails to deliver and causes the Fund to subsequently invest at less advantageous prices. The Fund identifies within its portfolio of investments cash or liquid securities in an amount equal to the delayed delivery commitment.
Security Transactions
Security transactions are accounted for on the trade date. Cost is determined and gains (losses) are based upon the specific identification method for both financial statement and federal income tax purposes.
Income Recognition
Interest income is recorded on the accrual basis. Market premium and discount are amortized and accreted, respectively, on all debt securities, unless otherwise noted. Original issue discount is accreted to interest income over the life of the security with a corresponding increase in the cost basis, if any.
Corporate actions and dividend income are recorded on the ex-date.
The value of additional securities received as an income payment is recorded as income and increases the cost basis of such securities.
Expenses
General expenses of the Trust are allocated to the Fund and other series of the Trust based upon relative net assets or other expense allocation methodologies determined by the nature of the expense. Expenses directly attributable to a specific class of shares are charged to that share class. Expenses directly attributable to the Fund are charged to the Fund.
Determination of Class Net Asset Value
All income, expenses (other than class-specific expenses which are charged directly to a share class, as shown in the Statement of Operations) and realized and unrealized gains (losses) are allocated to each class of the Fund on a daily basis for purposes of determining the net asset value of each class. Income and expenses are allocated to each class based on the settled shares method, while
31
Columbia High Yield Opportunity Fund, May 31, 2011
realized and unrealized gains (losses) are allocated based on the relative net assets of each class.
Federal Income Tax Status
The Fund intends to qualify each year as a regulated investment company under Subchapter M of the Internal Revenue Code, as amended, and will distribute substantially all of its tax exempt or taxable income, if any, for its tax year, and as such will not be subject to federal income taxes. In addition, the Fund intends to distribute in each calendar year substantially all of its net investment income, capital gains and certain other amounts, if any, such that the Fund should not be subject to federal excise tax. Therefore, no federal income or excise tax provision is recorded.
Distributions to Shareholders
Distributions from net investment income are declared daily and paid monthly. Net realized capital gains, if any, are distributed at least annually. Income distributions and capital gain distributions are determined in accordance with federal income tax regulations which may differ from GAAP.
Indemnifications
Under the Trust's organizational documents and, in some cases, by contract, its officers and trustees are indemnified against certain liabilities arising out of the performance of their duties to the Fund. In addition, certain of the Fund's contracts with its service providers contain general indemnification clauses. The Fund's maximum exposure under these arrangements is unknown since the amount of any future claims that may be made against the Fund cannot be determined and the Fund has no historical basis for predicting the likelihood of any such claims.
Note 3. Federal Tax Information
The timing and character of income and capital gain distributions are determined in accordance with income tax regulations, which may differ from GAAP. Reclassifications are made to the Fund's capital accounts for permanent tax differences to reflect income and gains available for distribution (or available capital loss carryforwards) under income tax regulations.
For the year ended May 31, 2011, permanent book and tax basis differences resulting primarily from differing treatments for paydowns, discount accretion/premium amortization on debt securities, Section 988 foreign currency transactions, market discount, distribution in excess and expired capital loss carryforwards were identified and reclassified among the components of the Fund's net assets as follows:
Undistributed
Net Investment
Income | | Accumulated
Net Realized
Gain | | Paid-In Capital | |
| $ | 1,148,608 | | | $ | 17,292,938 | | | $ | (18,441,546 | ) | |
Net investment income and net realized gains (losses), as disclosed on the Statement of Operations, and net assets were not affected by this reclassification.
The tax character of distributions paid during the years ended May 31, 2011 and May 31, 2010 was as follows:
| Distributions paid from: | | May 31, 2011 | | May 31, 2010 | |
| Ordinary Income* | | $ | 23,186,806 | | | $ | 31,056,422 | | |
* For tax purposes short-term capital gain distributions, if any, are considered ordinary income distributions.
As of May 31, 2011, the components of distributable earnings on a tax basis were as follows:
Undistributed
Ordinary
Income | | Undistributed
Long-Term
Capital Gains | | Net Unrealized
Appreciation* | |
| $ | — | | | $ | — | | | $ | 12,175,730 | | |
* The differences between book-basis and tax-basis net unrealized depreciation are primarily due to deferral of losses from wash sales.
Unrealized appreciation and depreciation at May 31, 2011, based on cost of investments for federal income tax purposes were:
| Unrealized appreciation | | $ | 16,687,158 | | |
| Unrealized depreciation | | | (4,511,428 | ) | |
| Net unrealized appreciation | | $ | 12,175,730 | | |
32
Columbia High Yield Opportunity Fund, May 31, 2011
The following capital loss carryforwards may be available to reduce taxable income arising from future net realized gains on investments, if any, to the extent permitted by the Internal Revenue Code:
| Year of Expiration | | Capital Loss
Carryforward | |
| 2012 | | $ | 1,461,417 | | |
| 2013 | | | 6,017,018 | | |
| 2014 | | | 7,033,993 | | |
| 2015 | | | 6,703,180 | | |
| 2016 | | | 378,711 | | |
| 2017 | | | 25,681,397 | | |
| 2018 | | | 44,544,886 | | |
| Total | | $ | 91,820,602 | | |
Capital loss carryforwards of $18,121,155 expired and capital loss carryforwards of $6,624,251 were utilized, during the year ended May 31, 2011.
The availability of a portion of the capital loss carryforwards acquired by the Fund as a result of its merger with High Yield Fund has been limited in certain years and has been excluded from the schedule of available loss carryforwards above.
Of the capital loss carryforwards attributable to the Fund, $7,478,435 ($1,461,417 expiring May 31, 2012 and $6,017,018 expiring May 31, 2013) was obtained in the merger with High Yield Fund. Utilization of these losses could be subject to limitations imposed by the Internal Revenue Code
Management of the Fund has concluded that there are no significant uncertain tax positions that would require recognition in the financial statements. However, management's conclusion may be subject to review and adjustment at a later date based on factors including, but not limited to, new tax laws, regulations, and administrative interpretations (including relevant court decisions). The Fund's federal tax returns for the prior three fiscal years remain subject to examination by the Internal Revenue Service.
Note 4. Fees and Compensation Paid to Affiliates
Investment Management Fee
Under an Investment Management Services Agreement (IMSA), Columbia Management Investment Advisers, LLC (the Investment Manager), a wholly-owned subsidiary of Ameriprise Financial, Inc. (Ameriprise Financial), determines which securities will be purchased, held or sold. The annual management fee is equal to a percentage of the Fund's average daily net assets that declines from 0.60% to 0.49% as the Fund's net assets increase. The effective management fee rate for the year ended May 31, 2011, was 0.60% of the Fund's average daily net assets.
In September 2010, the Fund's Board of Trustees approved an amended IMSA that includes an annual management fee that declines from 0.59% to 0.36% as the Fund's net assets increase. The amended IMSA was approved by the Fund's shareholders at a meeting held on February 15, 2011. The amended IMSA became effective on July 1, 2011.
Administration Fee
The Investment Manager also serves as the Fund Administrator and provides administration and other services to the Fund. Under an Administrative Services Agreement, the Fund Administrator does not receive a fee from the Fund for its administration services.
In September 2010, the Board of Trustees approved an amended Administrative Services Agreement that includes an annual administration fee rate that declines from 0.07% to 0.04% as the Fund's net assets increase. The amended Administrative Services Agreement became effective on July 1, 2011.
Pricing and Bookkeeping Fees
The Fund entered into a Financial Reporting Services Agreement (the Financial Reporting Services Agreement) with State Street Bank and Trust Company (State Street) and the Investment Manager pursuant to which State Street provides financial reporting services to the Fund. The Fund also entered into an Accounting Services Agreement (collectively with the Financial Reporting Services Agreement, the State Street Agreements) with State Street and the Investment Manager pursuant to which State Street provides accounting services to the Fund. Under the State Street Agreements, the Fund pays State Street an annual fee of $38,000 paid monthly plus an additional monthly fee based on an annualized percentage rate of average daily net assets of the Fund for the month. The aggregate fee will not exceed $140,000 per year (exclusive of out-of-pocket expenses and charges). The Fund also reimburses State Street for certain out-of-pocket expenses and charges. Effective June 27, 2011, these services are provided under the Administrative Services Agreement discussed above and the Fund no longer pays State Street a fee for pricing and bookkeeping services.
33
Columbia High Yield Opportunity Fund, May 31, 2011
Transfer Agent Fee
Under a Transfer Agency Agreement, Columbia Management Investment Services Corp. (the Transfer Agent), an affiliate of the Investment Manager and a wholly-owned subsidiary of Ameriprise Financial, is responsible for providing transfer agency services to the Fund. The Transfer Agent has contracted with Boston Financial Data Services (BFDS) to serve as sub-transfer agent.
The Transfer Agent receives monthly account-based service fees based on the number of open accounts and is reimbursed by the Fund for the fees and expenses the Transfer Agent pays to financial intermediaries that maintain omnibus accounts with the Fund that is a percentage of the average aggregate value of the Fund's shares maintained in each such omnibus account (other than omnibus accounts for which American Enterprise Investment Services Inc. is the broker of record or accounts where the beneficial shareholder is a customer of Ameriprise Financial Services, Inc., which are paid a per account fee). The Transfer Agent pays the fees of BFDS for services as sub-transfer agent and is not entitled to reimbursement for such fees from the Fund (with the exception of out-of pocket fees). The Transfer Agent also receives compensation from fees for various shareholder services and reimbursements for certain out-of -pocket expenses.
For the year ended May 31, 2011, the Fund's annualized effective transfer agent fee rate for each class was 0.13% of the Fund's average daily net assets.
An annual minimum account balance fee of $20 may apply to certain accounts with a value below the Fund's initial minimum investment requirements to reduce the impact of small accounts on transfer agent fees. These minimum account balance fees are recorded as part of expense reductions on the Statement of Operations. For the year ended May 31, 2011, no minimum account balance fees were charged by the Fund.
Underwriting Discounts, Service and Distribution Fees
The Fund has an agreement with Columbia Management Investment Distributors, Inc. (the Distributor), an affiliate of the Investment Manager and a wholly-owned subsidiary of Ameriprise Financial, for distribution and shareholder services. Pursuant to Rule 12b-1 under the 1940 Act, the Board of Trustees has approved, and the Fund has adopted, distribution and shareholder service plans (the Plans) which set the distribution and service fees for the Fund. These fees are calculated daily and are intended to compensate the Distributor and/or eligible selling and/or servicing agents for selling shares of the Fund and providing services to investors.
The Plans require the payment of a monthly service fee to the Distributor at the maximum annual rate of 0.25% of the average daily net assets attributable to Class A, Class B and Class C shares of the Fund. The Plans also require the payment of a monthly distribution fee to the Distributor at the maximum annual rate of 0.75% of the average daily net assets attributable to Class B and Class C shares only.
The Distributor has voluntarily agreed to waive a portion of the distribution fee for Class C shares so that the combined distribution and service fee does not exceed 0.85% annually of the average daily net assets attributable to Class C shares. This arrangement may be modified or terminated by the Distributor at any time.
Sales Charges
Sales charges, including front-end charges and CDSC's, received by the Distributor for distributing Fund shares were $11,550 for Class A, $7,686 for Class B and $150 for Class C shares for the year ended May 31, 2011.
Fee Waivers and Expense Reimbursements
The Investment Manager has voluntarily agreed to bear a portion of the Fund's expenses (excluding certain fees and expenses described below as well as any distribution and service fees) so that the Fund's operating expenses, after giving effect to any balance credits or overdraft charges from the Fund's custodian, do not exceed 0.80% of the Fund's average daily net assets on an annualized basis.
Effective July 1, 2011, the Investment Manager and certain of its affiliates have contractually agreed to waive fees and/or reimburse expenses (excluding certain fees and expenses described below), through September 30, 2012, unless sooner terminated at the sole discretion of the Board of Trustees, so that the Fund's operating expenses, after giving effect to any balance credits or overdraft charges from the Fund's custodian, do not exceed the annual rates of 1.12%, 1.87%, 1.87% and 0.87% of the Fund's average daily net assets attributable to Class A, Class B, Class C and Class Z shares, respectively.
Under the agreement, the following fees and expenses are excluded from the Fund's operating expenses when calculating the waiver/reimbursement commitment, and therefore will be paid by the Fund: taxes (including foreign transaction taxes), expenses associated with investments in other affiliated and non-affiliated
34
Columbia High Yield Opportunity Fund, May 31, 2011
pooled investment vehicles (including mutual funds and exchange traded funds), transaction costs and brokerage commissions, costs related to any securities lending program, dividend expenses associated with securities sold short, inverse floater program fees and expenses, transaction charges and interest on borrowed money, interest, extraordinary expenses and any other expenses the exclusion of which is specifically approved by the Fund's Board of Trustees. This agreement may be modified or amended only with approval from all parties.
Fees Paid to Officers and Trustees
All officers of the Fund are employees of the Investment Manager or its affiliates and, with the exception of the Fund's Chief Compliance Officer, receive no compensation from the Fund. The Board of Trustees has appointed a Chief Compliance Officer to the Fund in accordance with federal securities regulations. The Fund, along with other affiliated funds, pays its pro-rata share of the expenses associated with the Chief Compliance Officer. The Fund's expenses for the Chief Compliance Officer will not exceed $15,000 per year.
Trustees are compensated for their services to the Fund, as set forth on the Statement of Operations. The Trust's eligible Trustees may participate in a deferred compensation plan which may be terminated at any time. Obligations of the plan will be paid solely out of the Fund's assets.
Note 5. Custody Credits
The Fund has an agreement with its custodian bank under which custody fees may be reduced by balance credits. These credits are recorded as part of expense reductions on the Statement of Operations. The Fund could have invested a portion of the assets utilized in connection with the expense offset arrangement in an income-producing asset if it had not entered into such an agreement. For the year ended May 31, 2011, these custody credits reduced total expenses by $247 for the Fund.
Note 6. Portfolio Information
The cost of purchases and proceeds from sales of securities, excluding short-term obligations, aggregated $340,393,878 and $364,562,317, respectively, for the year ended May 31, 2011.
Note 7. Regulatory Settlements
During the year ended May 31, 2011 and the year ended May 31, 2010, the Fund received payments totaling $17,121 and $133,454, respectively, resulting from certain regulatory settlements with third parties in which the Fund had participated. The payments have been included in "Increase from regulatory settlements" in the Statement of Changes in Net Assets.
Note 8. Shareholder Concentration
As of May 31, 2011, one shareholder account owned 24.3% of the outstanding shares of the Fund. Purchase and redemption activity of this account may have a significant effect on the operations of the Fund.
Note 9. Line of Credit
The Fund and other affiliated funds participate in a $150 million committed, unsecured revolving line of credit provided by State Street. The maximum amount that may be borrowed by any fund is limited to the lesser of $120 million and the fund's borrowing limit set forth in the fund's registration statement (Borrowing Limit). For the period March 29, 2011 through May 15, 2011, the collective borrowing amount of the commitment was $225 million and the maximum amount that may have been borrowed by any fund was limited to the lesser of $200 million and the fund's Borrowing Limit. Prior to March 29, 2011, the collective borrowing amount of the commitment was $280 million. Borrowings are available for short-term liquidity or temporary or emergency purposes.
Effective October 14, 2010, interest is charged to each participating fund based on the fund's borrowings at a rate per annum equal to the greater of the Federal Funds Rate plus 1.25% or the overnight LIBOR Rate plus 1.25%. In addition, a commitment fee of 0.125% per annum is accrued and apportioned among the participating funds pro rata based on their relative net assets. Prior to October 14, 2010, interest was charged to each participating fund at the same rates. In addition, a commitment fee of 0.15% per annum was accrued and apportioned among the participating funds pro rata based on their relative net assets.
For the year ended May 31, 2011, the Fund did not borrow under these arrangements.
Note 10. Significant Risks and Contingencies
High-Yield Securities Risk
Investing in high-yield fixed income securities may involve greater credit risk and considerations not typically associated with investing in U.S. Government bonds and other higher quality fixed income securities. These securities are non-investment grade securities, often referred to as "junk" bonds. Economic downturns may disrupt the
35
Columbia High Yield Opportunity Fund, May 31, 2011
high yield market and impair the ability of issuers to repay principal and interest. Also, an increase in interest rates would likely have an adverse impact on the value of such obligations. Moreover, high-yield securities may be less liquid to the extent that there is no established secondary market.
Foreign Securities Risk
Investing in foreign securities may include certain risks and considerations not typically associated with investing in U.S. securities, such as fluctuating currency values and changing local and regional economic, political and social conditions, which may result in greater market volatility. In addition, certain foreign securities may not be as liquid as U.S. securities. Investing in emerging markets may accentuate these risks.
Note 11. Subsequent Events
Management has evaluated the events and transactions that have occurred through the date the financial statements were issued. Other than as noted below and in Note 4 above, there were no items requiring adjustment of the financial statements or additional disclosure.
Effective June 27, 2011, the Fund has entered into a revolving credit facility with a syndicate of banks led by JPMorgan Chase Bank, N.A. (the Administrative Agent). The credit facility replaced the prior credit facility with State Street. The credit facility agreement, which is a collective agreement between the Fund and certain other funds managed by the Investment Manager, severally and not jointly, permits collective borrowings up to $422,500,000. The collective borrowing amount will increase during the third quarter of 2011 to a collective borrowing amount of $500,000,000.
Interest is charged to each fund based on its borrowings at a rate equal to the sum of the federal funds rate plus (i) 1.25% per annum plus (ii) if one-month LIBOR exceeds the federal funds rate, the amount of such excess. Each borrowing under the credit facility matures no later than 60 days after the date of borrowing. The Fund also pays a commitment fee equal to its pro rata share of the amount of the credit facility at a rate of 0.10% per annum.
Note 12. Information Regarding Pending and Settled Legal Proceedings
In June 2004, an action captioned John E. Gallus et al. v. American Express Financial Corp. and American Express Financial Advisors Inc. was filed in the United States District Court for the District of Arizona. The plaintiffs allege that they are investors in several American Express Company (now known as RiverSource) mutual funds and they purport to bring the action derivatively on behalf of those funds under the Investment Company Act of 1940. The plaintiffs allege that fees allegedly paid to the defendants by the funds for investment advisory and administrative services are excessive. The plaintiffs seek remedies including restitution and rescission of investment advisory and distribution agreements. The plaintiffs voluntarily agreed to transfer this case to the United States District Court for the District of Minnesota (the District Court). In response to defendants' motion to dismiss the complaint, the District Court dismissed one of plaintiffs' four claims and granted plaintiffs limited discovery. Defendants moved for summary judgment in April 2007. Summary judgment was granted in the defendants' favor on July 9, 2007. The plaintiffs filed a notice of appeal with the Eighth Circuit Court of Appeals (the Eighth Circuit) on August 8, 2007. On April 8, 2009, the Eighth Circuit reversed summary judgment and remanded to the District Court for further proceedings. On August 6, 2009, defendants filed a writ of certiorari with the U.S. Supreme Court (the Supreme Court), asking the Supreme Court to stay the District Court proceedings while the Supreme Court considers and rules in a case captioned Jones v. Harris Associates, which involves issues of law similar to those presented in the Gallus case. On March 30, 2010, the Supreme Court issued its ruling in Jones v. Harris Associates, and on April 5, 2010, the Supreme Court vacated the Eighth Circuit's decision in the Gallus case and remanded the case to the Eighth Circuit for further consideration in light of the Supreme Court's decision in Jones v. Harris Associates. On June 4, 2010, the Eighth Circuit remanded the Gallus case to the District Court for further consideration in light of the Supreme Court's decision in Jones v. Harris Associates. On December 9, 2010, the District Court reinstated its July 9, 2007 summary judgment order in favor of the defendants. On January 10, 2011 plaintiffs filed a notice of appeal with the Eighth Circuit. In response to the plaintiffs' opening appellate brief filed on March 18, 2011, the defendants filed a response brief on May 4, 2011 with the Eighth Circuit. The plaintiffs filed a reply brief on May 26, 2011.
In December 2005, without admitting or denying the allegations, American Express Financial Corporation (AEFC, which is now known as Ameriprise Financial, Inc. (Ameriprise Financial)), entered into settlement agreements with the Securities and Exchange Commission (SEC) and Minnesota Department of Commerce (MDOC) related to market timing activities. As a result, AEFC was censured and ordered to cease and desist from committing or causing any violations of certain provisions of the Investment Advisers Act of 1940, the Investment Company Act of 1940, and various Minnesota laws. AEFC agreed to pay disgorgement of $10 million
36
Columbia High Yield Opportunity Fund, May 31, 2011
and civil money penalties of $7 million. AEFC also agreed to retain an independent distribution consultant to assist in developing a plan for distribution of all disgorgement and civil penalties ordered by the SEC in accordance with various undertakings detailed at http://www.sec.gov/litigation/admin/ia-2451.pdf. Ameriprise Financial and its affiliates have cooperated with the SEC and the MDOC in these legal proceedings, and have made regular reports to the funds' Boards of Directors/Trustees.
Ameriprise Financial and certain of its affiliates have historically been involved in a number of legal, arbitration and regulatory proceedings, including routine litigation, class actions, and governmental actions, concerning matters arising in connection with the conduct of their business activities. Ameriprise Financial believes that the Funds are not currently the subject of, and that neither Ameriprise Financial nor any of its affiliates are the subject of, any pending legal, arbitration or regulatory proceedings that are likely to have a material adverse effect on the Funds or the ability of Ameriprise Financial or its affiliates to perform under their contracts with the Funds. Ameriprise Financial is required to make 10-Q, 10-K and, as necessary, 8-K filings with the Securities and Exchange Commission on legal and regulatory matters that relate to Ameriprise Financial and its affiliates. Copies of these filings may be obtained by accessing the SEC website at www.sec.gov.
There can be no assurance that these matters, or the adverse publicity associated with them, will not result in increased fund redemptions, reduced sale of fund shares or other adverse consequences to the Funds. Further, although we believe proceedings are not likely to have a material adverse effect on the Funds or the ability of Ameriprise Financial or its affiliates to perform under their contracts with the Funds, these proceedings are subject to uncertainties and, as such, we are unable to estimate the possible loss or range of loss that may result. An adverse outcome in one or more of these proceedings could result in adverse judgments, settlements, fines, penalties or other relief that could have a material adverse effect on the consolidated financial condition or results of operations of Ameriprise Financial.
37
Report of Independent Registered Public Accounting Firm
To the Trustees of Columbia Funds Series Trust and the Shareholders of Columbia High Yield Opportunity Fund
In our opinion, the accompanying statement of assets and liabilities, including the investment portfolio, and the related statements of operations and of changes in net assets and the financial highlights present fairly, in all material respects, the financial position of Columbia High Yield Opportunity Fund (the "Fund") (a series of Columbia Funds Series Trust) at May 31, 2011, and the results of its operations for the year then ended, the changes in its net assets for each of the two years in the period then ended and the financial highlights for each of the five years in the period then ended, indicated, in conformity with accounting principles generally accepted in the United States of America. These financial statements and financial highlights (hereafter referred to as "financial statements") are the responsibility of the Fund's management. Our responsibility is to express an opinion on these financial statements based on our audits. We conducted our audits of these financial statements in accordance with the standards of the Public Company Accounting Oversight Board (United States). Those standards require that we plan and perform the audit to obtain reasonable assurance about whether the financial statements are free of material misstatement. An audit includes examining, on a test basis, evidence supporting the amounts and disclosures in the financial statements, assessing the accounting principles used and significant estimates made by management, and evaluating the overall financial statement presentation. We believe that our audits, which included confirmation of securities at May 31, 2011 by correspondence with the custodian and brokers, provide a reasonable basis for our opinion.
PricewaterhouseCoopers LLP
Boston, Massachusetts
July 22, 2011
38
Fund Governance
The Trustees serve terms of indefinite duration. The names, addresses and birth years of the Trustees and Officers of the Funds in the Columbia Funds Series Trust I, the year each was first elected or appointed to office, their principal business occupations during at least the last five years, the number of Funds overseen by each Trustee and other directorships they hold are shown below. Each officer listed below serves as an officer of each Fund in Columbia Funds Series Trust I.
Independent Trustees
Name, Address and Year of Birth,
Position with Funds, Year First
Elected or Appointed to Office | | Principal Occupation(s) During Past Five Years, Number of Funds in Columbia
Funds Complex Overseen by Trustee, Other Directorships Held
| |
| Rodman L. Drake (Born 1943) | |
|
c/o Columbia Management
Investment Advisers, LLC
225 Franklin Street
Boston, MA 02110
Trustee (since 1994) and Chairman of the Board (since 2009) | | Independent consultant since 2010; Co-Founder of Baringo Capital LLC (private equity) from 1997 to 2008; CEO of Crystal River Capital, Inc. (real estate investment trust) from 2003 to 2010; Oversees 43; Jackson Hewitt Tax Service Inc. (tax preparation services); Student Loan Corporation (student loan provider); Celgene Corporation (global biotechnology company); the Helios Funds (exchange-traded funds); Crystal River Capital, Inc. from 2005 to 2010; Parson Brinckerhoff from 1995 to 2008; and Apex Silver Mines Ltd. from 2007 to 2009 | |
|
| Douglas A. Hacker (Born 1955) | |
|
c/o Columbia Management
Investment Advisers, LLC
225 Franklin Street
Boston, MA 02110
Trustee (since 1996) | | Independent business executive since May 2006; Executive Vice President—Strategy of United Airlines from December 2002 to May 2006; President of UAL Loyalty Services (airline marketing company) from September 2001 to December 2002; Executive Vice President and Chief Financial Officer of United Airlines from July 1999 to September 2001. Oversees 43; Nash Finch Company (food distributor); Aircastle Limited (aircraft leasing); and SeaCube Container Leasing Ltd (container leasing) | |
|
| Janet Langford Kelly (Born 1957) | |
|
c/o Columbia Management
Investment Advisers, LLC
225 Franklin Street
Boston, MA 02110
Trustee (since 1996) | | Senior Vice President, General Counsel and Corporate Secretary, ConocoPhillips (integrated energy company) since September 2007; Deputy General Counsel—Corporate Legal Services, ConocoPhillips from August 2006 to August 2007; Partner, Zelle, Hofmann, Voelbel, Mason & Gette LLP (law firm) from March 2005 to July 2006; Adjunct Professor of Law, Northwestern University, from September 2004 to June 2006; Director, UAL Corporation (airline) from February 2006 to July 2006; Oversees 43; None | |
|
| William E. Mayer (Born 1940) | |
|
c/o Columbia Management
Investment Advisers, LLC
225 Franklin Street
Boston, MA 02110
Trustee (since 1994) | | Partner, Park Avenue Equity Partners (private equity) since February 1999; Dean and Professor, College of Business and Management, University of Maryland from 1992 to 1996. Oversees 43; DynaVox Inc. (software developer); Lee Enterprises (print media); WR Hambrecht + Co. (financial service provider); BlackRock Kelso Capital Corporation (investment company) | |
|
39
Fund Governance (continued)
Independent Trustees (continued)
Name, Address and Year of Birth,
Position with Funds, Year First
Elected or Appointed to Office | | Principal Occupation(s) During Past Five Years, Number of Funds in Columbia
Funds Complex Overseen by Trustee, Other Directorships Held
| |
| David M. Moffett (Born 1952) | |
|
c/o Columbia Management
Investment Advisers, LLC
225 Franklin Street
Boston, MA 02110
Trustee (since 2011) | | Retired. Chief Executive Officer, Federal Home Loan Mortgage Corporation, from 2008 to 2009; Senior Adviser, Global Financial Services Group, Carlyle Group, Inc., from 2007 to 2008; Vice Chairman and Chief Financial Officer, U.S. Bancorp, from 1993 to 2007. Oversees 43; CIT Group Inc. (commercial and consumer finance), eBay Inc. (online trading community), MBIA Corp (financial service provider), E.W. Scripps Co. (print and television media), Building Materials Holding Corp. (building materials and construction services), and University of Oklahoma Foundation. | |
|
| Charles R. Nelson (Born 1942) | |
|
c/o Columbia Management
Investment Advisers, LLC
225 Franklin Street
Boston, MA 02110
Trustee (since 1981) | | Professor of Economics, University of Washington, since January 1976; Ford and Louisa Van Voorhis Professor of Political Economy, University of Washington, since September 1993; Adjunct Professor of Statistics, University of Washington, since September 1980; Associate Editor, Journal of Money Credit and Banking from 1993 to 2008; consultant on econometric and statistical matters. Oversees 43; None | |
|
| John J. Neuhauser (Born 1943) | |
|
c/o Columbia Management
Investment Advisers, LLC
225 Franklin Street
Boston, MA 02110
Trustee (since 1984) | | President, Saint Michael's College, since August 2007; Director or Trustee of several non-profit organizations, including Fletcher Allen Health Care, Inc.; University Professor, Boston College from November 2005 to August 2007; Academic Vice President and Dean of Faculties, Boston College from August 1999 to October 2005. Oversees 43; Liberty All-Star Equity Fund and Liberty All-Star Growth Fund (closed-end funds) | |
|
| Patrick J. Simpson (Born 1944) | |
|
c/o Columbia Management
Investment Advisers, LLC
225 Franklin Street
Boston, MA 02110
Trustee (since 2000) | | Partner, Perkins Coie LLP (law firm). Oversees 43; None | |
|
| Anne-Lee Verville (Born 1945) | |
|
c/o Columbia Management
Investment Advisers, LLC
225 Franklin Street
Boston, MA 02110
Trustee (since 1998) | | Retired since 1997 (formerly General Manager–Global Education Industry from 1994 to 1997, President–Application Systems Division from 1991 to 1994, Chief Financial Officer–US Marketing & Services from 1988 to 1991, and Chief Information Officer from 1987 to 1988, IBM Corporation (computer and technology)). Oversees 43; Enesco Group, Inc. (producer of giftware and home and garden decor products) from 2001 to 2006 | |
|
40
Fund Governance (continued)
Interested Trustee
Name, Address and Year of Birth,
Position with Funds, Year First
Elected or Appointed to Office | | Principal Occupation(s) During Past Five Years, Number of Funds in Columbia
Funds Complex Overseen by Trustee, Other Directorships Held
| |
| Michael A. Jones (born 1959) | |
|
c/o Columbia Management
Investment Advisers, LLC
225 Franklin Street
Boston, MA 02110
Trustee (since 2011)
Senior Vice President (since 2011) | | President and Director, Columbia Management Investment Advisers, LLC since May 2010; President and Director, Columbia Management Investment Distributors, Inc. since May 2010; Manager, Chairman, Chief Executive Officer and President, Columbia Management Advisors, LLC from 2007 to April 2010; Chief Executive Officer, President and Director, Columbia Management Distributors, Inc. from November 2006 to April 2010; previously, co-president and senior managing director at Robeco Investment Management. Oversees 43; None | |
|
The Statement of Additional Information includes additional information about the Trustees of the Funds and is available, without charge, upon request by calling 1-800-345-6611.
Officers
| Name, Year of Birth and Address | | Principal Occupation(s) During the Past Five Years | |
| J. Kevin Connaughton (Born 1964) | |
|
225 Franklin Street
Boston, MA 02110
President (since 2009) | | Senior Vice President and General Manager–Mutual Fund Products, Columbia Management Investment Advisers, LLC since May 2010; President, Columbia Funds, since 2009, and RiverSource Funds, since May 2010 (previously Senior Vice President and Chief Financial Officer, Columbia Funds, from June 2008 to January 2009, Treasurer, Columbia Funds, from October 2003 to May 2008, and senior officer of various other affiliated funds since 2000); Managing Director, Columbia Management Advisors, LLC from December 2004 to April 2010. | |
|
| Michael G. Clarke (Born 1969) | |
|
225 Franklin Street
Boston, MA 02110
Treasurer (since 2011) and Chief
Financial Officer (since 2009) | | Vice President, Columbia Management Investment Advisers, LLC since May 2010; Managing Director of Fund Administration, Columbia Management Advisors, LLC, from September 2004 to April 2010; senior officer of Columbia Funds and affiliated funds since 2002. | |
|
| Scott R. Plummer (Born 1959) | |
|
5228 Ameriprise Financial Center
Minneapolis, MN 55474
Senior Vice President, Assistant Secretary and Chief Legal Officer (since 2010) | | Chief Legal Officer and Assistant Secretary, Columbia Management Investment Advisers, LLC since June 2005; Vice President and Lead Chief Counsel–Asset Management, Ameriprise Financial, Inc. since May 2010 (previously Vice President and Chief Counsel–Asset Management, from 2005 to April 2010, and Vice President–Asset Management Compliance from 2004 to 2005); Vice President, Chief Counsel and Assistant Secretary, Columbia Management Investment Distributors, Inc. since 2008; Vice President, General Counsel and Secretary, Ameriprise Certificate Company since 2005; Chief Counsel, RiverSource Distributors, Inc. since 2006; Vice President, General Counsel and Secretary, RiverSource Funds, since December 2006; Senior Vice President, Secretary and Chief Legal Officer, Columbia Funds, since May 2010. | |
|
41
Fund Governance (continued)
Officers (continued)
| Name, Year of Birth and Address | | Principal Occupation(s) During the Past Five Years | |
| Linda J. Wondrack (Born 1964) | |
|
225 Franklin Street
Boston, MA 02110
Senior Vice President and Chief
Compliance Officer (since 2007) | | Vice President and Chief Compliance Officer, Columbia Management Investment Advisers, LLC since May 2010; Chief Compliance Officer, Columbia Funds, since 2007, and RiverSource Funds, since May 2010; Director (Columbia Management Group, LLC and Investment Product Group Compliance), Bank of America, from June 2005 to April 2010; Director of Corporate Compliance and Conflicts Officer of MFS Investment Management (investment management) from August 2004 to May 2005. | |
|
| William F. Truscott (Born 1960) | |
|
53600 Ameriprise Financial Center
Minneapolis, MN 55474
Senior Vice President (since 2010) | | Chairman of the Board, Columbia Management Investment Advisers, LLC since May 2010 (previously President, Chairman of the Board and Chief Investment Officer, from 2001 to April 2010); Chief Executive Officer, U.S. Asset Management & President, Annuities, Ameriprise Financial, Inc. since May 2010 (previously President–U.S. Asset Management and Chief Investment Officer from 2005 to April 2010, and Senior Vice President—Chief Investment Officer, from 2001 to 2005); Director, President and Chief Executive Officer, Ameriprise Certificate Company since 2006; Director, Columbia Management Investment Distributors, Inc. since May 2010 (previously Chairman of the Board and Chief Executive Officer from 2008 to April 2010); Chairman of the Board and Chief Executive Officer, RiverSource Distributors, Inc. since 2006. | |
|
| Colin Moore (Born 1958) | |
|
225 Franklin Street
Boston, MA 02110
Senior Vice President (since 2010) | | Director and Chief Investment Officer, Columbia Management Investment Advisers, LLC since May 2010; Manager, Managing Director and Chief Investment Officer of Columbia Management Advisors, LLC from 2007 to April 2010; Head of Equities, Columbia Management Advisors, LLC from 2002 to 2007. | |
|
| Amy Johnson (Born 1965) | |
|
5228 Ameriprise Financial Center
Minneapolis, MN 55474
Vice President (since 2010) | | Senior Vice President and Chief Operating Officer, Columbia Management Investment Advisers, LLC since May 2010 (previously Chief Administrative Officer, from 2009 until April 2010, Vice President—Asset Management and Trust Company Services, from 2006 to 2009, and Vice President—Operations and Compliance from 2004 to 2006). | |
|
| Joseph F. DiMaria (Born 1968) | |
|
225 Franklin Street
Boston, MA 02110
Vice President (since 2011) and
Chief Accounting Officer (since 2008) | | Vice President, Mutual Fund Administration, Columbia Management Investment Advisers, LLC, since May 2010; Director of Fund Administration, Columbia Management Advisors, LLC from January 2006 to April 2010; Head of Tax/Compliance and Assistant Treasurer, Columbia Management Advisors, LLC, from November 2004 to December 2005. | |
|
| Stephen T. Welsh (born 1957) | |
|
225 Franklin Street
Boston, MA 02110
Vice President (since 2006) | | President and Director, Columbia Management Investment Services Corp. since May 2010; President and Director, Columbia Management Services, Inc. from July 2004 to April 2010; Managing Director, Columbia Management Distributors, Inc. from August 2007 to April 2010. | |
|
42
Fund Governance (continued)
Officers (continued)
| Name, Year of Birth and Address | | Principal Occupation(s) During the Past Five Years | |
| Paul D. Pearson (born 1956) | |
|
5228 Ameriprise Financial Center
Minneapolis, MN 55474
Vice President and Assistant Treasurer
(since 2011) | | Vice President, Investment Accounting, Columbia Management Investment Advisers, LLC, since May 2010; Vice President, Managed Assets, Investment Accounting, Ameriprise Financial Corporation. | |
|
| Paul B. Goucher (born 1968) | |
|
5228 Ameriprise Financial Center
Minneapolis, MN 55474
Vice President and Assistant Secretary
(since 2010) | | Vice President and Chief Counsel of Ameriprise Financial since January 2010 (formerly Vice President and Group Counsel from November 2008 to January 2010); Director, Managing Director and General Counsel of J. & W. Seligman & Co. Incorporated (Seligman) from July 2008 to November 2008 and Managing Director and Associate General Counsel of Seligman from January 2005 to July 2008. | |
|
| Christopher O. Petersen (born 1970) | |
|
5228 Ameriprise Financial Center
Minneapolis, MN 55474
Vice President (since 2010) and Secretary (since 2011) | | Vice President and Chief Counsel, Ameriprise Financial since January 2010 (formerly Vice President and Group Counsel or Counsel from April 2004 to January 2010); Assistant Secretary of RiverSource Funds since January 2007. | |
|
| Michael E. DeFao (born 1968) | |
|
5228 Ameriprise Financial Center
Minneapolis, MN 55474
Vice President and Assistant Secretary
(since 2011) | | Vice President and Chief Counsel, Ameriprise Financial since May 2010; Associate General Counsel Bank of America from June 2005 to April 2010 | |
|
43
Shareholder Meeting Results
At a Joint Special Meeting of Shareholders held on February 15, 2011, shareholders of Columbia High Yield Opportunity Fund considered a proposal to approve a proposed amendment to the Investment Management Services Agreement with Columbia Management Investment Advisers, LLC. The proposal was approved as follows:
| Votes For | | Votes Against | | Abstentions | | Broker Non-Votes | |
| | 176,409,526 | | | | 9,471,504 | | | | 6,126,212 | | | | 0 | | |
44
Important Information About This Report
The fund mails one shareholder report to each shareholder address. If you would like more than one report, please call shareholder services at 1-800-345-6611 and additional reports will be sent to you. This report has been prepared for shareholders of Columbia High Yield Opportunity Fund.
A description of the policies and procedures that the fund uses to determine how to vote proxies and a copy of the fund's voting records are available (i) at www.columbiamanagement.com, (ii) on the Securities and Exchange Commission's website at www.sec.gov, and (iii) without charge, upon request, by calling 1-800-368-0346. Information regarding how the fund voted proxies relating to portfolio securities during the 12-month period ended June 30 is available from the SEC's website. Information regarding how the fund voted proxies relating to portfolio securities is also available from the fund's website, www.columbiamanagement.com.
The fund files a complete schedule of portfolio holdings with the SEC for the first and third quarters of each fiscal year on Form N-Q. The fund's Form N-Q is available on the SEC's website at www.sec.gov and may be reviewed and copied at the SEC's Public Reference Room in Washington, D.C. Information on the operation of the Public Reference Room may be obtained by calling 1-800-SEC-0330.
Transfer Agent
Columbia Management Investment
Services Corp.
P.O. Box 8081
Boston, MA 02266-8081
1-800-345-6611
Distributor
Columbia Management Investment
Distributors, Inc.
225 Franklin Street
Boston, MA 02110
Investment Manager
Columbia Management Investment Advisers, LLC
225 Franklin Street
Boston, MA 02110
45

Columbia High Yield Opportunity Fund
P. O. Box 8081
Boston, MA 02266-8081
columbiamanagement.com
This information is for use with concurrent or prior delivery of a fund prospectus. Investors should consider the investment objectives, risks, charges and expenses of a mutual fund carefully before investing. For a free prospectus, which contains this and other important information about the funds, visit columbiamanagement.com. Read the prospectus carefully before investing. The Fund is distributed by Columbia Management Investment Distributors, Inc., member FINRA, and managed by Columbia Management Investment Advisers, LLC.
© 2011 Columbia Management Investment Advisers, LLC. All rights reserved.
C-1041 C (07/11)

Columbia International Bond Fund
Annual Report for the Period Ended May 31, 2011
Table of Contents
The views expressed in this report reflect the current views of the respective parties. These views are not guarantees of future performance and involve certain risks, uncertainties and assumptions that are difficult to predict, so actual outcomes and results may differ significantly from the views expressed. These views are subject to change at any time based upon economic, market or other conditions and the respective parties disclaim any responsibility to update such views. These views may not be relied on as investment advice and, because investment decisions for a Columbia Fund are based on numerous factors, may not be relied on as an indication of trading intent on behalf of any particular Columbia Fund. References to specific securities should not be construed as a recommendation or investment advice.
President’s Message

Dear Shareholder:
The Columbia Management story began over 100 years ago, and today, we are one of the nation’s largest dedicated asset managers. The recent acquisition by Ameriprise Financial, Inc. brings together the talents, resources and capabilities of Columbia Management with those of RiverSource Investments, Threadneedle (acquired by Ameriprise in 2003) and Seligman Investments (acquired by Ameriprise in 2008) to build a best-in-class asset management business that we believe is truly greater than its parts.
RiverSource Investments traces its roots to 1894 when its then newly-founded predecessor, Investors Syndicate, offered a face-amount savings certificate that gave small investors the opportunity to build a safe and secure fund for retirement, education or other special needs. A mutual fund pioneer, Investors Syndicate launched Investors Mutual Fund in 1940. In the decades that followed, its mutual fund products and services lineup grew to include a full spectrum of styles and specialties. More than 110 years later, RiverSource continues to be a trusted financial products leader.
Threadneedle, a leader in global asset management and one of Europe’s largest asset managers, offers sophisticated international experience from a dedicated U.K. management team. Headquartered in London, it is named for Threadneedle Street in the heart of the city’s financial district, where British investors pioneered international and global investing. Threadneedle was acquired in 2003 and today operates as an affiliate of Columbia Management.
Seligman Investments’ beginnings date back to the establishment of the investment firm J. & W. Seligman & Co. in 1864. In the years that followed, Seligman played a major role in the geographical expansion and industrial development of the United States. In 1874, President Ulysses S. Grant named Seligman as fiscal agent for the U.S. Navy — an appointment that would last through World War I. Seligman helped finance the westward path of the railroads and the building of the Panama Canal. The firm organized its first investment company in 1929 and began managing its first mutual fund in 1930. In 2008, J. & W. Seligman & Co. Incorporated was acquired and Seligman Investments became an offering brand of RiverSource Investments, LLC.
We are proud of the rich and distinctive history of these firms, the strength and breadth of products and services they offer, and the combined cultures of pioneering spirit and forward thinking. Together we are committed to providing more for our shareholders than ever before.
| n | | A singular focus on our shareholders. Our business is asset management, so investors are our first priority. We dedicate our resources to identifying timely investment opportunities and provide a comprehensive choice of equity, fixed-income and alternative investments to help meet your individual needs. |
| n | | First-class research and thought leadership. We are dedicated to helping you take advantage of today’s opportunities and anticipate tomorrow’s. We stay abreast of the latest investment trends and ideas, using our collective insight to evaluate events and transform them into solutions you can use. |
| n | | A disciplined investment approach. We aren’t distracted by passing fads. Our teams adhere to a rigorous investment process that helps ensure the integrity of our products and enables you and your financial advisor to match our solutions to your objectives with confidence. |
When you choose Columbia Management, you can be confident that we will take the time to understand your needs and help you and your financial advisor identify the solutions that are right for you. Because at Columbia Management, we don’t consider ourselves successful unless you are.
Sincerely,

J. Kevin Connaughton
President, Columbia Funds
Investors should consider the investment objectives, risks, charges and expenses of a mutual fund carefully before investing. For a free prospectus, which contains this and other important information about the funds, visit www.columbiamanagement.com. The prospectus should be read carefully before investing.
Columbia Funds are distributed by Columbia Management Investment Distributors, Inc., member FINRA, and managed by Columbia Management Investment Advisers, LLC.
© 2011 Columbia Management Investment Advisers, LLC. All rights reserved.
Fund Profile – Columbia International Bond Fund
Performance data quoted represents past performance and current performance may be lower or higher. Past performance is no guarantee of future results. The investment return and principal value will fluctuate so that shares, when redeemed, may be worth more or less than the original cost. Please visit www.columbiamanagement.com for daily and most recent month-end performance updates.
Summary
1-year return as of 05/31/11
| | |
 | | +15.86% Class A shares
(without sales charge) |
| |
| | +15.39% Citigroup Non-U.S. World Government Bond Index — Unhedged |
Summary
| n | | For the 12-month period that ended May 31, 2011, the fund’s Class A shares returned 15.86% without sales charge. |
| n | | The fund outperformed both its benchmark, the Citigroup Non-U.S. World Government Bond Index — Unhedged1, and its peer group, the Lipper International Income Funds Classification.2 |
| n | | The fund’s performance relative to the index was aided by a higher-than-index yield, lower overall duration, country allocations and other factors. |
Portfolio Management
Nicholas Pifer has managed the fund since July 2010 and has been associated with the fund’s adviser or its predecessors since 2000.
| 1 | The Citigroup Non-U.S. World Government Bond Index — Unhedged is calculated on a market-weighted basis and includes all fixed-rate bonds with a remaining maturity of one year or longer and with amounts outstanding of at least the equivalent of U.S. $25 million. The index excludes floating or variable rate bonds, securities aimed principally at non-institutional investors and private placement-type securities. |
| 2 | Lipper Inc., a widely respected data provider in the industry, calculates an average total return (assuming reinvestment of distributions) for mutual funds with investment objectives similar to those of the fund. Lipper makes no adjustments for the effect of sales loads. |
Indices are not available for investment, are not professionally managed and do not reflect sales charges, fees, brokerage commissions, taxes or other expenses of investing. Securities in the fund may not match those in an index.
1
Performance Information – Columbia International Bond Fund
Performance data quoted represents past performance and current performance may be lower or higher. Past performance is no guarantee of future results. The investment return and principal value will fluctuate so that shares, when redeemed, may be worth more or less than the original cost. Please visit www.columbiamanagement.com for daily and most recent month-end performance updates.
| | | | |
| Net asset value per share | |
| |
as of 05/31/11 ($) | | | | |
Class A | | | 11.50 | |
Class C | | | 11.49 | |
Class I | | | 11.48 | |
Class Z | | | 11.49 | |
| Distributions declared per share | |
| |
06/01/10 – 05/31/11 ($) | | | | |
Class A | | | 0.38 | |
Class C | | | 0.30 | |
Class I | | | 0.34 | |
Class Z | | | 0.41 | |
|
| Performance of a $10,000 investment 12/01/08 – 05/31/11 |
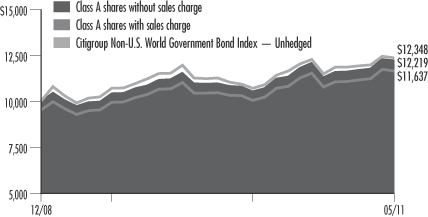
The chart above shows the change in value of a hypothetical $10,000 investment in Class A shares of Columbia International Bond Fund during the stated time period, and does not reflect the deduction of taxes that a shareholder may pay on fund distributions or on the redemption of fund shares.
| | | | | | | | |
| Performance of a $10,000 investment 12/01/08 – 05/31/11 ($) | |
| | |
| Sales charge | | without | | | with | |
Class A | | | 12,219 | | | | 11,637 | |
Class C | | | 11,983 | | | | 11,983 | |
Class I | | | n/a | | | | n/a | |
Class Z | | | 12,284 | | | | n/a | |
| | | | | | | | | | | | | | | | | | | | | | | | |
| Average annual total return as of 05/31/11 (%) | | | | | | | |
| | | | |
| Share class | | A | | | C | | | I | | | Z | |
| Inception | | 12/01/08 | | | 12/01/08 | | | 9/27/10 | | | 12/01/08 | |
| Sales charge | | without | | | with | | | without | | | with | | | without | | | without | |
1-year | | | 15.86 | | | | 10.39 | | | | 15.01 | | | | 14.01 | | | | n/a | | | | 16.05 | |
Life | | | 8.36 | | | | 6.26 | | | | 7.52 | | | | 7.52 | | | | 4.44 | | | | 8.59 | |
The “with sales charge” returns include the maximum initial sales charge of 4.75% for Class A shares and the applicable contingent deferred sales charge of 1.00% for Class C shares for the first year only. The “without sales charge” returns do not include the effect of sales charges. If they had, returns would be lower.
Performance results reflect any fee waivers or reimbursements of fund expenses by the Investment Manager and/or any of its affiliates. Absent these fee waivers or expense reimbursement arrangements, performance results would have been lower.
All results shown assume reinvestment of distributions. Class Z shares are sold at net asset value with no distribution and service (Rule 12b-1) fees. Class Z shares have limited eligibility and the investment minimum requirements may vary. Please see the fund’s prospectus for details. Performance for different share classes will vary based on differences in sales charges and fees associated with each class.
Class I shares were initially offered by the fund on September 27, 2010.
The tables do not reflect the deduction of taxes that a shareholder may pay on fund distributions or on the redemption of fund shares.
2
Understanding Your Expenses – Columbia International Bond Fund
As a fund shareholder, you incur two types of costs. There are transaction costs, which generally include sales charges on purchases and may include redemption fees or exchange fees. There are also ongoing costs, which generally include investment advisory fees, distribution and service (Rule 12b-1) fees and other fund expenses. The information on this page is intended to help you understand the ongoing costs of investing in the fund and to compare these costs with the ongoing costs of investing in other mutual funds.
Analyzing your fund’s expenses by share class
To illustrate these ongoing costs, we have provided an example and calculated the expenses paid by investors in each share class during the period. The information in the following table is based on an initial investment of $1,000, which is invested at the beginning of the period and held for the entire period. Expense information is calculated two ways and each method provides you with different information. The amount listed in the “Actual” column is calculated using the fund’s actual operating expenses and total return for the period. The amount listed in the “Hypothetical” column for each share class assumes that the return each year is 5% before expenses and is calculated based on the fund’s actual operating expenses. You should not use the hypothetical account values and expenses to estimate either your actual account balance at the end of the period or the expenses you paid during this period.
Compare with other funds
Since all mutual funds are required to include the same hypothetical calculations about expenses in shareholder reports, you can use this information to compare the ongoing costs of investing in the fund with other funds. To do so, compare the 5% hypothetical example with the 5% hypothetical examples that appear in the shareholder reports of other funds. As you compare hypothetical examples of other funds, it is important to note that hypothetical examples are meant to highlight the ongoing costs of investing in a fund and do not reflect any transaction costs, such as sales charges, redemption fees or exchange fees.
Estimating your actual expenses
To estimate the expenses that you paid over the period, first you will need your account balance at the end of the period:
| | n | | For shareholders who receive their account statements from Columbia Management Investment Services Corp., your account balance is available online at www.columbiamanagement.com or by calling Shareholder Services at 800.345.6611. | |
| | n | | For shareholders who receive their account statements from their financial intermediary, contact your financial intermediary firm to obtain your account balance. | |
| | 1. | Divide your ending account balance by $1,000. For example, if an account balance was $8,600 at the end of the period, the result would be 8.6. | |
| | 2. | In the section of the table below titled “Expenses paid during the period,” locate the amount for your share class. You will find this number in the column labeled “Actual.” Multiply this number by the result from step 1. Your answer is an estimate of the expenses you paid on your account during the period. | |
If the value of your account falls below the minimum initial investment requirement applicable to you, your account may be subject to a $20 annual fee. This fee is not included in the accompanying table. If you are subject to the fee, keep it in mind when you are estimating the ongoing expenses of investing in the fund and when comparing the expenses of this fund with other funds.
| | | | | | | | | | | | | | | | | | | | | | | | | | | | |
| 12/01/10 – 05/31/11 | | | | | | | | | | | | | | | | |
| | | | |
| | | Account value at the
beginning of the period ($) | | | Account value at the
end of the period ($) | | | Expenses paid
during the period ($) | | | Fund’s annualized
expense ratio (%) | |
| | | Actual | | | Hypothetical | | | Actual | | | Hypothetical | | | Actual | | | Hypothetical | | | Actual | |
Class A | | | 1,000.00 | | | | 1,000.00 | | | | 1,081.30 | | | | 1,019.50 | | | | 5.69 | | | | 5.49 | | | | 1.09 | |
Class C | | | 1,000.00 | | | | 1,000.00 | | | | 1,076.30 | | | | 1,015.76 | | | | 9.58 | | | | 9.25 | | | | 1.84 | |
Class I | | | 1,000.00 | | | | 1,000.00 | | | | 1,080.80 | | | | 1,020.74 | | | | 4.38 | | | | 4.23 | | | | 0.84 | |
Class Z | | | 1,000.00 | | | | 1,000.00 | | | | 1,081.70 | | | | 1,020.74 | | | | 4.38 | | | | 4.23 | | | | 0.84 | |
Expenses paid during the period are equal to the annualized expense ratio for the share class, multiplied by the average account value over the period, then multiplied by the number of days in the fund’s most recent fiscal half-year and divided by 365.
Had the Investment Manager and/or any of its affiliates not waived fees or reimbursed a portion of expenses, account value at the end of the period would have been reduced.
It is important to note that the expense amounts shown in the table are meant to highlight only ongoing costs of investing in the fund and do not reflect any transaction costs, such as sales charges, redemption fees or exchange fees. Therefore, the hypothetical examples provided may not help you determine the relative total costs of owning shares of different funds. If these transaction costs were included, your costs would have been higher.
3
Portfolio Manager’s Report – Columbia International Bond Fund
Performance data quoted represents past performance and current performance may be lower or higher. Past performance is no guarantee of future results. The investment return and principal value will fluctuate so that shares, when redeemed, may be worth more or less than the original cost. Please visit www.columbiamanagement.com for daily and most recent month-end performance updates.
| | | | |
| Portfolio structure | | | |
| |
as of 05/31/11 (%) | | | | |
Foreign Government Obligations | | | 92.7 | |
Corporate Fixed-Income Bonds & Notes | | | 5.1 | |
Short-Term Obligation | | | 0.4 | |
Other Assets & Liabilities, Net | | | 1.8 | |
The fund is actively managed and the composition of its portfolio will change over time. Portfolio structure is calculated as a percentage of net assets.
For the 12-month period that ended May 31, 2011, the fund’s Class A shares returned 15.86% without sales charge. The fund outperformed its benchmark, the Citigroup Non-U.S. World Government Bond Index — Unhedged, which returned 15.39% over the same period. The average return of the fund’s peer group, the Lipper International Income Funds Classification, was 14.13%. A number of factors helped the fund’s performance relative to the index: a higher-than-index yield; overweight positions in the Canadian dollar, Australian dollar and non-euro European currencies; country selection; lower overall duration (a measure of interest-rate sensitivity), yield curve positioning and an overweight relative to the index in emerging market debt. The fund’s underweight positions in the euro and the Japanese yen hurt results relative to the index.
Economy loses some steam
During the 12 months that ended May 31, 2011, global economic growth oscillated, accelerating midway through the period but then losing steam again as the period came to a close. The impact of higher oil prices, continued concerns about highly indebted eurozone governments and unresolved turmoil in the Middle East and North Africa, as well as the loss of output and supply-chain disruptions from an earthquake, tsunami and nuclear disaster in Japan, have clearly put a dent in our outlook for above-average growth. A stalemate over the U.S. debt limit and uncertainties associated with the end of the Federal Reserve Board’s (the Fed’s) latest round of large-scale Treasury purchases, known as QE2 (the QE for quantitative easing), also buffeted the markets. And, the news could very well worsen further. However, we expect a limit to the softness as fundamental adjustments occurring in the global economy should support a stronger expansion of private spending ahead. We believe the global recovery process is more advanced and durable now and expect the outlook to brighten in the second half of the year, especially in the United States.
Global monetary conditions remain highly accommodative, supporting growth. However, the trend is starting to turn. The European Central Bank (ECB) raised short-term interest rates in April, and we expect two more hikes this year. If the ECB raises short-term rates too quickly, it could complicate the debt crisis in the periphery of the eurozone. In the United States, we expect the Fed’s Federal Open Market Committee (FOMC) to increase the federal funds rate to 0.75% in the year ahead, with its first hike in early 2012. We expect the Fed to complete its $600 billion Treasury purchase program on schedule by the end of June 20113 and then maintain its balance sheet at end-of-June levels.
Favorable currency positioning
Global government bond markets posted 0.70% returns in local currency terms over the 12-month period ended May 31, 2011. Yields on most high quality global government bonds fluctuated with position adjustments, shifting global growth momentum, flight-to-quality flows and surging interest in riskier assets. Among major countries/regions, the government bond market in the eurozone suffered the worst loss (–1.7%), due in part to the massive sell-off in Greece (–22.2% and now out of the index), Ireland (–21.9%) and Portugal (–19.3%). The German and French government bond markets returned 0.3% and –0.4%, respectively. The U.S. government bond market gained 4.4%, as measured by the Citigroup U.S. Government Bond Index4, and the Japanese government bond market rose 1.6%.
| 3 | On June 30, 2011, the Fed terminated QE2. |
| 4 | The Citigroup U.S. Government Bond Index is the U.S. Sector of Citigroup’s World Government Bond Index. It is designed to track those fixed-rate issues of the United States Government with at least U.S. $1 billion in public amount outstanding and with a remaining maturity of at least one year. The index includes fixed-rate non-callable and callable bonds; it excludes savings bonds, inflation-indexed securities and “strips” of bonds. |
| | Indices are not available for investment, are not professionally managed and do not reflect sales charges, fees, brokerage commissions, taxes or other expenses of investing. Securities in the fund may not match those in an index. |
4
Portfolio Manager’s Report (continued) – Columbia International Bond Fund
By contrast to these lackluster returns in local currencies, a falling dollar enhanced returns to dollar-based international bond investors. As the Fed took steps to stimulate the U.S. economy through a second round of large-scale Treasury purchases, the trade-weighted U.S. dollar fell 11.9% during the period. This dollar weakness and firming global growth supported commodity prices, which in turn favored the commodity currencies. In this environment, the fund benefited from its exposure to the Australian dollar, Canadian dollar and Norwegian krone. It also profited from the appreciating Mexican peso and Swedish krona. Mexico’s economy benefits from strong manufacturing exports. Sweden enjoys relatively strong growth and Sweden’s Riksbank remains hawkish because of stubbornly high inflation, which has driven the Swedish krona higher.
Country allocations aided performance
The fund had a favorable bond positioning in the past 12 months. Of the three problematic eurozone government bond markets, it had zero exposure to Greece and Portugal and one-third the index weight, on a duration-contribution basis, in Ireland. Meanwhile, the fund had more exposure than the index to Australia, Canada, Norway and Mexico, all of which recorded strong returns, measured in local currencies.
The fund also benefited from its exposure to emerging market bonds, which accounted for approximately 10% of the fund’s assets. Emerging market bonds climbed 12.5% for the period, as measured by the J.P. Morgan Emerging Markets Bond Index Plus Index.5 Financial markets began reflecting the underlying strength of emerging economies. Commodity price trends were generally supportive of emerging market bonds, and many traditional emerging markets could borrow more cheaply than some eurozone members and, in several cases, more cheaply than the United States.
Looking ahead
Looking further out, we expect the U.S. dollar to remain broadly weak through 2011 and much of 2012. Historically, the United States has needed to offer global investors a reasonable yield premium at the front end of the yield curve for the dollar to perform well on a sustained, multi-year basis. (The yield curve is a graphic depiction of bond yields ranging from short term to long term.) In practice, this means the U.S. dollar historically has not appreciated in earnest until some six to nine months, on average, after the FOMC starts to raise short-term interest rates — and in some cases much longer. As a result, we see sustained dollar appreciation as more of a risk in 2013-2014 than in 2011-2012. We do, however, think the Japanese yen is becoming even less desirable to hold than the U.S. dollar, since Japan will likely be the last major central bank to raise short-term interest rates.
We believe that the current economic soft patch is transitory and that trend-like growth will resume in the second half of 2011 as auto production picks up, growth in emerging markets remains strong and near-term concerns get resolved. As a result, we plan to maintain a pro-growth bias in positioning the portfolio. The recovery’s uneven pace across geographic regions and countries creates a market environment that we believe will be positive not only for higher quality government bonds, but also for emerging market sovereign credit and currency markets with stronger economic prospects.
| 5 | The J.P. Morgan Emerging Market Bond Plus Index (EMBI+) tracks returns for actively-traded external debt instruments in emerging markets. It includes U.S.-dollar denominated Brady bonds, eurobonds and traded loans issued by sovereign entities. |
| | Indices are not available for investment, are not professionally managed and do not reflect sales charges, fees, brokerage commissions, taxes or other expenses of investing. Securities in the fund may not match those in an index. |
| | | | |
| Quality breakdown | | | |
| |
as of 05/31/11 (%) | | | | |
AAA | | | 45.5 | |
AA | | | 34.7 | |
A | | | 3.7 | |
BBB | | | 8.2 | |
BB | | | 2.6 | |
B | | | 1.4 | |
Other | | | 3.9 | |
| | | | |
| Maturity breakdown | | | |
| |
as of 05/31/11 (%) | | | | |
0-1 year | | | 0.7 | |
1-3 years | | | 4.8 | |
3-5 years | | | 11.7 | |
5-7 years | | | 23.1 | |
7-10 years | | | 41.2 | |
10-15 years | | | 8.0 | |
15-20 years | | | 4.3 | |
20-30 years | | | 1.5 | |
Other | | | 4.7 | |
Quality and maturity breakdowns are calculated as a percentage of total net assets.
Ratings shown in the quality breakdown are assigned to individual bonds by taking the lower of the ratings available from one of the following nationally recognized rating agencies: Standard & Poor’s or Moody’s Investor Services. If a security is rated by only one of the two agencies, that rating is used. If a security is not rated by either of the two agencies, it is designated as Non-Rated. Ratings are relative and subjective and are not absolute standards of quality. The credit quality of the fund’s investments does not remove market risk.
| | | | |
| 30-day SEC yields | |
| |
as of 05/31/11 (%) | | | | |
Class A | | | 2.54 | |
Class C | | | 2.04 | |
Class I | | | 2.93 | |
Class Z | | | 2.89 | |
The 30-day SEC yields reflect the fund’s earning power, net of expenses, expressed as an annualized percentage of the public offering price per share at the end of the period. Had the Investment Manager not waived fees or reimbursed a portion of expenses, the 30-day SEC yields would have been reduced.
5
Portfolio Manager’s Report (continued) – Columbia International Bond Fund
Portfolio characteristics and holdings are subject to change and may not be representative of current characteristics and holdings. The outlook for the fund may differ from that presented for other Columbia Funds.
Investing in fixed-income securities may involve certain risks, including the credit quality of individual issuers, possible prepayments, market or economic developments and yield and share price fluctuations due to changes in interest rates. When interest rates go up, bond prices typically drop, and vice versa.
Investments in high-yield bonds (sometimes referred to as “junk” bonds) offer the potential for high current income and attractive total return, but involve certain risks. Changes in economic conditions or other circumstances may adversely affect a high-yield bond issuer’s ability to make principal and interest payments.
International investing involves special risks, including foreign taxation, currency risks, risks associated with possible differences in financial standards and other risks associated with future political and economic developments.
Investing in emerging markets may involve greater risks than investing in more developed countries. In addition, concentration of investments in a single region may result in greater volatility.
The fund is non-diversified, which generally means that it may invest a greater percentage of its total assets in the securities of fewer issuers than a “diversified” fund. This increases the risk that a change in the value of any one investment held by the Fund could affect the overall value of the Fund more than it would affect that of a diversified fund holding a greater number of investments. Accordingly, the fund’s value will likely be more volatile than the value of more diversified funds.
6
Investment Portfolio – Columbia International Bond Fund
May 31, 2011
Government & Agency Obligations – 92.7%
| | | | | | | | | | |
| | | | | Par (a) | | | Value ($) | |
| Foreign Government Obligations – 92.7% | |
| Asian Development Bank | | | | | | | | | | |
2.350% 06/21/27 | | JPY | | | 50,000,000 | �� | | | 669,227 | |
| | | |
| Development Bank of Japan | | | | | | | | | | |
1.750% 03/17/17 | | JPY | | | 10,000,000 | | | | 130,070 | |
| | | |
| Eksportfinans A/S | | | | | | | | | | |
1.600% 03/20/14 | | JPY | | | 65,000,000 | | | | 821,720 | |
| | | |
| Eurofima | | | | | | | | | | |
4.375% 10/21/19 | | EUR | | | 100,000 | | | | 152,036 | |
| | | |
| European Investment Bank | | | | | | | | | | |
1.400% 06/20/17 | | JPY | | | 49,000,000 | | | | 624,204 | |
| | | |
| Federal Republic of Germany | | | | | | | | | | |
3.750% 01/04/19 | | EUR | | | 190,000 | | | | 291,735 | |
4.250% 07/04/14 | | EUR | | | 325,000 | | | | 500,653 | |
4.250% 07/04/17 | | EUR | | | 555,000 | | | | 875,775 | |
4.750% 07/04/28 | | EUR | | | 200,000 | | | | 331,148 | |
| | | |
| Federative Republic of Brazil | | | | | | | | | | |
7.375% 02/03/15 | | EUR | | | 30,000 | | | | 48,768 | |
7.875% 03/07/15 | | | | | 50,000 | | | | 60,425 | |
8.250% 01/20/34 | | | | | 70,000 | | | | 95,095 | |
| | | |
| Government of Belgium | | | | | | | | | | |
3.500% 03/28/15 | | EUR | | | 75,000 | | | | 109,373 | |
| | | |
| Government of Canada | | | | | | | | | | |
3.750% 06/01/19 | | CAD | | | 1,320,000 | | | | 1,449,159 | |
| | | |
| Government of Denmark | | | | | | | | | | |
5.000% 11/15/13 | | DKK | | | 695,000 | | | | 144,355 | |
| | | |
| Government of Japan | | | | | | | | | | |
1.100% 06/20/20 | | JPY | | | 70,500,000 | | | | 868,514 | |
1.400% 12/20/18 | | JPY | | | 105,000,000 | | | | 1,346,419 | |
1.500% 09/20/18 | | JPY | | | 5,900,000 | | | | 76,125 | |
1.900% 09/20/23 | | JPY | | | 29,000,000 | | | | 374,638 | |
1.900% 06/20/25 | | JPY | | | 20,000,000 | | | | 254,706 | |
2.000% 09/20/40 | | JPY | | | 20,000,000 | | | | 241,373 | |
| | | |
| Government of Malaysia | | | | | | | | | | |
7.500% 07/15/11 | | | | | 60,000 | | | | 60,416 | |
| | | |
| Government of New Zealand | | | | | | | | | | |
6.000% 05/15/21 | | NZD | | | 150,000 | | | | 131,706 | |
6.500% 04/15/13 | | NZD | | | 55,000 | | | | 47,983 | |
| | | |
| Instituto de Credito Oficial | | | | | | | | | | |
1.500% 09/20/12 | | JPY | | | 18,000,000 | | | | 219,745 | |
| | | |
| Kingdom of Netherlands | | | | | | | | | | |
4.000% 07/15/16 | | EUR | | | 240,000 | | | | 368,905 | |
| | | | | | | | | | |
| | | | | Par (a) | | | Value ($) | |
| Kingdom of Norway | | | | | | | | | | |
4.250% 05/19/17 | | NOK | | | 3,240,000 | | | | 644,765 | |
4.500% 05/22/19 | | NOK | | | 3,500,000 | | | | 709,192 | |
5.000% 05/15/15 | | NOK | | | 2,300,000 | | | | 465,678 | |
| | | |
| Kingdom of Spain | | | | | | | | | | |
3.250% 04/30/16 | | EUR | | | 300,000 | | | | 404,350 | |
5.500% 04/30/21 | | EUR | | | 1,000,000 | | | | 1,450,454 | |
| | | |
| Kingdom of Sweden | | | | | | | | | | |
3.750% 08/12/17 | | SEK | | | 7,180,000 | | | | 1,225,316 | |
5.500% 10/08/12 | | SEK | | | 2,775,000 | | | | 468,851 | |
| | | |
| Nordic Investment Bank | | | | | | | | | | |
1.700% 04/27/17 | | JPY | | | 50,000,000 | | | | 648,674 | |
|
| Pemex Project Funding Master Trust | |
5.500% 02/24/25 | | EUR | | | 20,000 | | | | 27,752 | |
| | | |
| Province of Ontario | | | | | | | | | | |
4.400% 06/02/19 | | CAD | | | 2,000,000 | | | | 2,189,379 | |
| | | |
| Province of Quebec | | | | | | | | | | |
5.000% 04/29/19 | | EUR | | | 50,000 | | | | 79,921 | |
| | | |
| Republic of Argentina | | | | | | | | | | |
7.000% 10/03/15 | | | | | 100,000 | | | | 96,850 | |
7.000% 04/17/17 | | | | | 220,000 | | | | 200,640 | |
8.280% 12/31/33 | | | | | 52,038 | | | | 45,663 | |
| | | |
| Republic of Austria | | | | | | | | | | |
4.300% 09/15/17 (b) | | EUR | | | 170,000 | | | | 262,195 | |
| | | |
| Republic of Bulgaria | | | | | | | | | | |
8.250% 01/15/15 | | | | | 60,000 | | | | 70,500 | |
| | | |
| Republic of China | | | | | | | | | | |
4.750% 10/29/13 | | | | | 50,000 | | | | 54,302 | |
| | | |
| Republic of Colombia | | | | | | | | | | |
8.125% 05/21/24 | | | | | 50,000 | | | | 66,000 | |
| | | |
| Republic of Finland | | | | | | | | | | |
4.250% 07/04/15 | | EUR | | | 145,000 | | | | 223,982 | |
| | | |
| Republic of France | | | | | | | | | | |
2.250% 02/25/16 | | EUR | | | 1,600,000 | | | | 2,265,948 | |
2.500% 10/25/20 | | EUR | | | 1,500,000 | | | | 2,006,054 | |
4.250% 04/25/19 | | EUR | | | 228,000 | | | | 352,441 | |
5.500% 04/25/29 | | EUR | | | 420,000 | | | | 728,479 | |
| | | |
| Republic of Hungary | | | | | | | | | | |
3.500% 07/18/16 | | EUR | | | 40,000 | | | | 53,086 | |
| | | |
| Republic of Indonesia | | | | | | | | | | |
7.250% 04/20/15 | | | | | 38,000 | | | | 43,633 | |
7.250% 04/20/15 (b) | | | | | 80,000 | | | | 92,000 | |
See Accompanying Notes to Financial Statements.
7
Columbia International Bond Fund
May 31, 2011
Government & Agency Obligations (continued)
| | | | | | | | | | |
| | | | | Par (a) | | | Value ($) | |
| Foreign Government Obligations (continued) | |
| Republic of Ireland | | | | | | | | | | |
4.500% 10/18/18 | | EUR | | | 90,000 | | | | 87,105 | |
| | | |
| Republic of Italy | | | | | | | | | | |
2.250% 11/01/13 | | EUR | | | 300,000 | | | | 421,960 | |
4.250% 09/01/19 | | EUR | | | 270,000 | | | | 384,026 | |
4.500% 02/01/18 | | EUR | | | 2,750,000 | | | | 4,011,742 | |
4.500% 08/01/18 | | EUR | | | 210,000 | | | | 304,822 | |
4.500% 03/01/26 | | EUR | | | 1,000,000 | | | | 1,355,747 | |
5.000% 03/01/25 | | EUR | | | 407,000 | | | | 587,441 | |
5.250% 08/01/17 | | EUR | | | 230,000 | | | | 351,084 | |
| | | |
| Republic of Lithuania | | | | | | | | | | |
6.125% 03/09/21 (b) | | | | | 120,000 | | | | 129,194 | |
| | | |
| Republic of Panama | | | | | | | | | | |
6.700% 01/26/36 | | | | | 65,000 | | | | 75,888 | |
| | | |
| Republic of Peru | | | | | | | | | | |
6.550% 03/14/37 | | | | | 45,000 | | | | 49,613 | |
7.350% 07/21/25 | | | | | 200,000 | | | | 242,000 | |
8.750% 11/21/33 | | | | | 27,000 | | | | 36,680 | |
| | | |
| Republic of Philippines | | | | | | | | | | |
8.875% 03/17/15 | | | | | 105,000 | | | | 130,462 | |
| | | |
| Republic of Poland | | | | | | | | | | |
5.000% 10/19/15 | | | | | 50,000 | | | | 53,800 | |
5.500% 10/25/19 | | PLN | | | 1,875,000 | | | | 661,620 | |
6.250% 10/24/15 | | PLN | | | 2,300,000 | | | | 861,491 | |
| | | |
| Republic of South Africa | | | | | | | | | | |
5.250% 05/16/13 | | EUR | | | 50,000 | | | | 74,761 | |
6.250% 03/08/41 | | | | | 120,000 | | | | 129,720 | |
| | | |
| Republic of Turkey | | | | | | | | | | |
5.625% 03/30/21 | | | | | 250,000 | | | | 262,187 | |
7.375% 02/05/25 | | | | | 140,000 | | | | 165,375 | |
| | | |
| Republic of Uruguay | | | | | | | | | | |
4.250% 04/05/27 | | UYU | | | 1,744,192 | | | | 104,330 | |
PIK, | | | | | | | | | | |
7.875% 01/15/33 | | | | | 40,000 | | | | 49,800 | |
| | | |
| Republic of Venezuela | | | | | | | | | | |
12.750% 08/23/22 | | | | | 84,000 | | | | 72,240 | |
| | | |
| Russian Federation | | | | | | | | | | |
5.000% 04/29/20 (b) | | | | | 100,000 | | | | 102,100 | |
7.500% 03/31/30 | | | | | 122,830 | | | | 144,710 | |
7.500% 03/31/30 (b) | | | | | 173,000 | | | | 203,707 | |
| | | |
| Treasury Corp. of Victoria | | | | | | | | | | |
5.500% 11/15/18 | | AUD | | | 1,300,000 | | | | 1,382,592 | |
5.750% 11/15/16 | | AUD | | | 95,000 | | | | 103,164 | |
6.000% 06/15/20 | | AUD | | | 120,000 | | | | 131,267 | |
| | | | | | | | | | |
| | | | | Par (a) | | | Value ($) | |
| United Kingdom Treasury | | | | | | | | | | |
4.000% 09/07/16 | | GBP | | | 255,000 | | | | 454,660 | |
4.500% 03/07/19 | | GBP | | | 1,340,000 | | | | 2,433,149 | |
5.000% 03/07/25 | | GBP | | | 253,000 | | | | 470,343 | |
| | | |
| United Mexican States | | | | | | | | | | |
5.625% 01/15/17 | | | | | 90,000 | | | | 101,160 | |
6.050% 01/11/40 | | | | | 40,000 | | | | 42,460 | |
8.500% 12/13/18 | | MXN | | | 7,205,000 | | | | 694,318 | |
8.500% 05/31/29 | | MXN | | | 19,000,000 | | | | 1,797,897 | |
| | | | | | | | | | |
Foreign Government Obligations Total | | | | 43,834,993 | |
| | | | | | | | | | |
Total Government & Agency Obligations (cost of $41,642,239) | | | | 43,834,993 | |
|
| Corporate Fixed-Income Bonds & Notes – 5.1% | |
| | | | | | | | | | |
| Energy – 3.0% | |
| Oil & Gas – 2.2% | | | | | | | | | | |
| Ecopetrol SA | | | | | | | | | | |
7.625% 07/23/19 | | | | | 45,000 | | | | 53,381 | |
| | | |
| Gazprom International SA | | | | | | | | | | |
6.510% 03/07/22 (b) | | | | | 200,000 | | | | 214,760 | |
7.201% 02/01/20 | | | | | 20,701 | | | | 22,647 | |
8.146% 04/11/18 (b) | | | | | 200,000 | | | | 238,500 | |
| | |
| Petroleos de Venezuela SA | | | | | | | | |
8.500% 11/02/17 | | | | | 300,000 | | | | 212,250 | |
| | | |
| Petroleos Mexicanos | | | | | | | | | | |
5.500% 01/21/21 | | | | | 300,000 | | | | 311,896 | |
| | | | | | | | | | |
Oil & Gas Total | | | | | | | | | 1,053,434 | |
| |
| Oil, Gas & Consumable Fuels – 0.8% | | | | | |
| KazMunayGas National Co. | | | | | | | | |
7.000% 05/05/20 (b) | | | | | 200,000 | | | | 223,238 | |
|
| Petrobras International Finance Co. – Pifco | |
5.375% 01/27/21 | | | | | 150,000 | | | | 154,246 | |
| | | | | | | | | | |
Oil, Gas & Consumable Fuels Total | | | | 377,484 | |
| | | | | | | | | | |
Energy Total | | | | | | | | | 1,430,918 | |
| | | | | | | | | | |
| Financials – 1.9% | | | | | | | | | | |
| Banks – 0.5% | | | | | | | | | | |
| Bank Nederlandse Gemeenten | | | | | | | | |
1.850% 11/07/16 | | JPY | | | 18,000,000 | | | | 231,289 | |
| | | | | | | | | | |
Banks Total | | | | | | | | | 231,289 | |
| |
| Diversified Financial Services – 1.4% | | | | | |
| General Electric Capital Corp. | | | | | |
1.000% 03/21/12 | | JPY | | | 20,000,000 | | | | 246,283 | |
See Accompanying Notes to Financial Statements.
8
Columbia International Bond Fund
May 31, 2011
Corporate Fixed-Income Bonds & Notes (continued)
| | | | | | | | | | | | |
| | | | | | Par (a) | | | Value ($) | |
| Financials (continued) | | | | | | | | | | | | |
| Majapahit Holding BV | | | | | | | | | | | | |
8.000% 08/07/19 (b) | | | | | | | 250,000 | | | | 293,450 | |
|
| Network Rail Infrastructure Finance PLC | |
4.375% 12/09/30 | | | GBP | | | | 60,000 | | | | 99,266 | |
| | | | | | | | | | | | |
Diversified Financial Services Total | | | | 638,999 | |
| | | | | | | | | | | | |
Financials Total | | | | | | | | | | | 870,288 | |
| | | | | | | | | | | | |
| Utilities – 0.2% | | | | | | | | | | | | |
| Electric – 0.2% | | | | | | | | | | | | |
| Empresas Publicas de Medellin ESP | | | | | |
8.375% 02/01/21 (b) | | | COP | | | | 180,000,000 | | | | 103,839 | |
| | | | | | | | | | | | |
Electric Total | | | | | | | | | | | 103,839 | |
| | | | | | | | | | | | |
Utilities Total | | | | | | | | | | | 103,839 | |
| | | | | | | | | | | | |
Total Corporate Fixed-Income Bonds & Notes (cost of $2,310,405) | | | | 2,405,045 | |
| | |
Short-Term Obligation – 0.4% | | | | | | | | | |
Repurchase agreement with State Street Bank and Trust Co., dated 05/31/11, due 06/01/11 at 0.010%, collateralized by a U.S. Treasury obligation maturing 04/30/17, market value $196,589 (repurchase proceeds $192,000) | | | | | | | 192,000 | | | | 192,000 | |
| | | | | | | | | | | | |
Total Short-Term Obligation (cost of $192,000) | | | | | | | | 192,000 | |
| | | | | | | | | | | | |
Total Investments – 98.2%
(cost of $44,144,644)(c) | | | | 46,432,038 | |
| | | | | | | | | | | | |
Other Assets & Liabilities, Net – 1.8% | | | | 854,497 | |
| | | | | | | | | | | | |
Net Assets – 100.0% | | | | | | | | | | | 47,286,535 | |
Notes to Investment Portfolio:
| (a) | Principal amount is stated in United States dollars unless otherwise noted. |
| (b) | Security exempt from registration pursuant to Rule 144A under the Securities Act of 1933. These securities may be resold in transactions exempt from registration, normally to qualified institutional buyers. At May 31, 2011, these securities, which are not illiquid, amounted to $1,862,983, which represents 3.9% of net assets. |
| (c) | Cost for federal income tax purposes is $44,262,968. |
Generally accepted accounting principles (GAAP) require disclosure regarding the inputs and valuation techniques used to measure fair value and any changes in valuation inputs or techniques. In addition, investments shall be disclosed by major category.
The Fund categorizes its fair value measurements according to a three-level hierarchy that maximizes the use of observable inputs and minimizes the use of unobservable inputs by prioritizing that the most observable input be used when available. Observable inputs are those that market participants would use in pricing an investment based on market data obtained from sources independent of the reporting entity. Unobservable inputs are those that reflect the Fund’s assumptions about the information market participants would use in pricing an investment. An investment’s level within the fair value hierarchy is based on the lowest level of any input that is deemed significant to the asset or liability’s fair value measurement. The input levels are not necessarily an indication of the risk or liquidity associated with investments at that level. For example, certain U.S. government securities are generally high quality and liquid, however, they are reflected as Level 2 because the inputs used to determine fair value may not always be quoted prices in an active market.
Fair value inputs are summarized in the three broad levels listed below:
| • | | Level 1 — Valuations based on quoted prices for investments in active markets that the Fund has the ability to access at the measurement date (including NAV for open-end mutual funds). Valuation adjustments are not applied to Level 1 investments. |
| • | | Level 2 — Valuations based on other significant observable inputs (including quoted prices for similar securities, interest rates, prepayment speeds, credit risks, etc.). |
| • | | Level 3 — Valuations based on significant unobservable inputs (including the Fund’s own assumptions and judgment in determining the fair value of investments). |
Inputs that are used in determining fair value of an investment may include price information, credit data, volatility statistics, and other factors. These inputs can be either observable or unobservable. The availability of observable inputs can vary between investments, and is affected by various factors such as the type of investment, and the volume and level of activity for that investment or similar investments in the marketplace. The inputs will be considered by the Investment Manager, along with any other relevant factors in the calculation of an investment’s fair value. The Fund uses prices and inputs that are current as of the measurement date, which may include periods of market dislocations. During these periods, the availability of prices and inputs may be reduced for many investments. This condition could cause an investment to be reclassified between the various levels within the hierarchy.
Investments falling into the Level 3 category are primarily supported by quoted prices from brokers and dealers participating in the market for those investments. However, these may be classified as Level 3 investments due to lack of market transparency and corroboration to support these quoted prices. Additionally, valuation models may be used as the pricing source for any remaining investments classified as Level 3. These models rely on one or more significant unobservable inputs and/or significant assumptions by the Investment Manager. Inputs used in valuations may include, but are not limited to, financial statement analysis, capital account balances, discount rates and estimated cash flows, and comparable company data.
The following table is a summary of the inputs used to value the Fund’s investments as of May 31, 2011:
| | | | | | | | | | | | | | | | |
Description | | Quoted Prices
(Level 1) | | | Other
Significant
Observable
Inputs
(Level 2) | | | Significant
Unobservable
Inputs
(Level 3) | | | Total | |
Total Government & Agency Obligations | | $ | — | | | $ | 43,834,993 | | | $ | — | | | $ | 43,834,993 | |
| | | | | | | | | | | | | | | | |
Total Corporate Fixed-Income Bonds & Notes | | | — | | | | 2,405,045 | | | | — | | | | 2,405,045 | |
| | | | | | | | | | | | | | | | |
Total Short-Term Obligation | | | — | | | | 192,000 | | | | — | | | | 192,000 | |
| | | | | | | | | | | | | | | | |
Total Investments | | | — | | | | 46,432,038 | | | | — | | | | 46,432,038 | |
| | | | | | | | | | | | | | | | |
See Accompanying Notes to Financial Statements.
9
Columbia International Bond Fund
May 31, 2011
| | | | | | | | | | | | | | | | |
Description | | Quoted Prices
(Level 1) | | | Other
Significant
Observable
Inputs
(Level 2) | | | Significant
Unobservable
Inputs
(Level 3) | | | Total | |
Unrealized Depreciation on Futures Contracts | | $ | (498 | ) | | $ | — | | | $ | — | | | $ | (498 | ) |
| | | | | | | | | | | | | | | | |
Unrealized Appreciation on Forward Foreign Currency Exchange Contracts | | | — | | | | 8,521 | | | | — | | | | 8,521 | |
| | | | | | | | | | | | | | | | |
Unrealized Depreciation on Forward Foreign Currency Exchange Contracts | | | — | | | | (11,348 | ) | | | — | | | | (11,348 | ) |
| | | | | | | | | | | | | | | | |
Total | | $ | (498 | ) | | $ | 46,429,211 | | | $ | — | | | $ | 46,428,713 | |
| | | | | | | | | | | | | | | | |
The Fund’s assets assigned to the Level 2 input category are generally valued using the market approach, in which a security’s value is determined through its correlation to prices and information from market transactions for similar or identical assets.
Certain short-term obligations may be valued using amortized cost, an income approach which converts future cash flows to a present value based upon the premium or discount at purchase.
There were no significant transfers of financial assets between Levels 1 and 2 during the period.
Forward foreign currency exchange contracts outstanding on May 31, 2011 are:
Foreign Exchange Rate Risk
| | | | | | | | | | | | | | | | | | | | |
Counterparty | | Forward
Foreign
Currency
Exchange
Contracts
to Buy | | | Value | | | Aggregate
Face Value | | | Settlement
Date | | | Unrealized
Appreciation
(Depreciation) | |
HSBC | | | CAD | | | $ | 188,852 | | | $ | 190,297 | | | | 06/08/11 | | | $ | (1,445 | ) |
Barclays Bank PLC | | | GBP | | | | 143,066 | | | | 140,729 | | | | 06/30/11 | | | | 2,337 | |
JPMorgan | | | MXN | | | | 302,790 | | | | 301,049 | | | | 06/03/11 | | | | 1,741 | |
Barclays Bank PLC | | | PLN | | | | 302,328 | | | | 312,231 | | | | 06/09/11 | | | | (9,903 | ) |
Barclays Bank PLC | | | SEK | | | | 145,688 | | | | 141,245 | | | | 06/22/11 | | | | 4,443 | |
| | | | | | | | | | | | | | | | | | | | |
| | | | | | | | | | | | | | | | | | $ | (2,827 | ) |
| | | | | | | | | | | | | | | | | | | | |
At May 31, 2011, the Fund held the following open short futures contracts:
Risk Exposure/Type
| | | | | | | | | | | | | | | | | | | | |
Risk | | Number of
Contracts | | | Value | | | Aggregate
Face Value | | | Expiration
Date | | | Unrealized
Depreciation | |
Interest Rate | | | | | | | | | | | | | |
10-Year U.S. Treasury Notes | | | 5 | | | $ | 613,047 | | | $ | 612,549 | | | | Sept-2011 | | | $ | (498 | ) |
| | | | | | | | | | | | | | | | | | | | |
At May 31, 2011, cash of $8,000 was pledged as collateral for open futures contracts.
The Fund was invested in the following countries at May 31, 2011:
| | | | | | | | |
Summary of Securities
by Country (Unaudited) | | Value | | | % of Total Investments | |
Italy | | $ | 7,416,822 | | | | 16.0 | |
France | | | 5,352,923 | | | | 11.5 | |
Canada | | | 3,718,460 | | | | 8.0 | |
United Kingdom | | | 3,457,419 | | | | 7.4 | |
Japan | | | 3,291,846 | | | | 7.1 | |
Mexico | | | 2,947,731 | | | | 6.4 | |
Norway | | | 2,641,354 | | | | 5.7 | |
Spain | | | 2,074,548 | | | | 4.5 | |
Germany | | | 1,999,311 | | | | 4.3 | |
Sweden | | | 1,694,167 | | | | 3.7 | |
Australia | | | 1,617,022 | | | | 3.5 | |
Poland | | | 1,576,911 | | | | 3.4 | |
Luxembourg | | | 1,100,110 | | | | 2.4 | |
Netherlands | | | 893,643 | | | | 1.9 | |
Finland | | | 872,655 | | | | 1.9 | |
Philippines | | | 799,690 | | | | 1.7 | |
United States* | | | 620,282 | | | | 1.3 | |
Russian Federation | | | 450,517 | | | | 1.0 | |
Turkey | | | 427,562 | | | | 0.9 | |
Argentina | | | 343,153 | | | | 0.7 | |
Peru | | | 328,292 | | | | 0.7 | |
Venezuela | | | 284,490 | | | | 0.6 | |
Austria | | | 262,195 | | | | 0.6 | |
Kazakhstan | | | 223,238 | | | | 0.5 | |
Colombia | | | 223,221 | | | | 0.5 | |
South Africa | | | 204,481 | | | | 0.4 | |
Brazil | | | 204,288 | | | | 0.4 | |
New Zealand | | | 179,689 | | | | 0.4 | |
Uruguay | | | 154,130 | | | | 0.3 | |
Switzerland | | | 152,036 | | | | 0.3 | |
Denmark | | | 144,355 | | | | 0.3 | |
Indonesia | | | 135,633 | | | | 0.3 | |
Lithuania | | | 129,194 | | | | 0.3 | |
Belgium | | | 109,373 | | | | 0.2 | |
Ireland | | | 87,105 | | | | 0.2 | |
Panama | | | 75,888 | | | | 0.2 | |
Bulgaria | | | 70,500 | | | | 0.2 | |
Malaysia | | | 60,416 | | | | 0.1 | |
China | | | 54,302 | | | | 0.1 | |
Hungary | | | 53,086 | | | | 0.1 | |
| | | | | | | | |
| | $ | 46,432,038 | | | | 100.0 | |
| | | | | | | | |
* Includes short-term obligation.
Certain securities are listed by country of underlying exposure but may trade predominantly on another exchange.
| | |
Acronym | | Name |
| AUD | | Australian Dollar |
| CAD | | Canadian Dollar |
| COP | | Colombian Peso |
| DKK | | Danish Krone |
| EUR | | Euro |
| GBP | | Pound Sterling |
| JPY | | Japanese Yen |
| MXN | | Mexican Peso |
| NOK | | Norwegian Krone |
| NZD | | New Zealand Dollar |
| PIK | | Payment-In-Kind |
| PLN | | Polish Zloty |
| SEK | | Swedish Krona |
| UYU | | Uruguayan Peso |
See Accompanying Notes to Financial Statements.
10
Statement of Assets and Liabilities – Columbia International Bond Fund
May 31, 2011
| | | | | | |
| | | | | ($) | |
| Assets | | Investments, at cost | | | 44,144,644 | |
| | | | | | |
| | Investments, at value | | | 46,432,038 | |
| | Cash | | | 987 | |
| | Cash collateral for open futures contracts | | | 8,000 | |
| | Foreign currency (cost of $239,002) | | | 244,274 | |
| | Unrealized appreciation on forward foreign currency exchange contracts | | | 8,521 | |
| | Receivable for: | | | | |
| | Investments sold | | | 1,961,396 | |
| | Fund shares sold | | | 5,243 | |
| | Interest | | | 681,726 | |
| | Foreign tax reclaims | | | 766 | |
| | Expense reimbursement due from Investment Manager | | | 27,295 | |
| | Trustees’ deferred compensation plan | | | 4,927 | |
| | | | | | |
| | Total Assets | | | 49,375,173 | |
| | |
| Liabilities | | Unrealized depreciation on forward foreign currency exchange contracts | | | 11,348 | |
| | Payable for: | | | | |
| | Investments purchased | | | 1,984,135 | |
| | Fund shares repurchased | | | 745 | |
| | Futures variation margin | | | 703 | |
| | Investment advisory fee | | | 21,617 | |
| | Administration fee | | | 1,965 | |
| | Pricing and bookkeeping fees | | | 5,636 | |
| | Transfer agent fee | | | 2,635 | |
| | Trustees’ fees | | | 890 | |
| | Audit fee | | | 31,082 | |
| | Custody fee | | | 7,847 | |
| | Registration fee | | | 4,057 | |
| | Reports to shareholders | | | 9,653 | |
| | Distribution and service fees | | | 615 | |
| | Chief compliance officer expenses | | | 161 | |
| | Trustees’ deferred compensation plan | | | 4,927 | |
| | Other liabilities | | | 622 | |
| | | | | | |
| | Total Liabilities | | | 2,088,638 | |
| | |
| | | | | | |
| | Net Assets | | | 47,286,535 | |
| | |
| Net Assets Consist of | | Paid-in capital | | | 44,845,936 | |
| | Undistributed net investment income | | | 179,889 | |
| | Accumulated net realized loss | | | (40,379 | ) |
| | Net unrealized appreciation (depreciation) on: | | | | |
| | Investments | | | 2,287,394 | |
| | Foreign currency translations | | | 14,193 | |
| | Futures contracts | | | (498 | ) |
| | | | | | |
| | Net Assets | | | 47,286,535 | |
See Accompanying Notes to Financial Statements.
11
Statement of Assets and Liabilities (continued) – Columbia International Bond Fund
May 31, 2011
| | | | | | |
| | | | | | |
| Class A | | Net assets | | $ | 1,253,693 | |
| | Shares outstanding | | | 109,064 | |
| | Net asset value per share | | $ | 11.50 | (a) |
| | Maximum sales charge | | | 4.75 | % |
| | Maximum offering price per share ($11.50/0.9525) | | $ | 12.07 | (b) |
| | |
| Class C | | Net assets | | $ | 418,152 | |
| | Shares outstanding | | | 36,409 | |
| | Net asset value and offering price per share | | $ | 11.49 | (a)(c) |
| | |
| Class I (d) | | Net assets | | $ | 29,869,854 | |
| | Shares outstanding | | | 2,600,786 | |
| | Net asset value, offering and redemption price per share | | $ | 11.48 | |
| | |
| Class Z | | Net assets | | $ | 15,744,836 | |
| | Shares outstanding | | | 1,369,812 | |
| | Net asset value, offering and redemption price per share | | $ | 11.49 | |
| (a) | Redemption price per share is equal to net asset value less any applicable contingent deferred sales charge. |
| (b) | On sales of $50,000 or more the offering price is reduced. |
| (c) | Net asset value per share rounds to this amount due to fractional shares outstanding. |
| (d) | Shares commenced operation on September 27, 2010. |
See Accompanying Notes to Financial Statements.
12
Statement of Operations – Columbia International Bond Fund
For the Year Ended May 31, 2011
| | | | | | |
| | | | | ($) | |
| Investment Income | | Interest | | | 661,671 | |
| | | | | | |
| | |
| Expenses | | Investment advisory fee | | | 116,214 | |
| | Administration fee | | | 10,565 | |
| | Distribution fee – Class C | | | 3,190 | |
| | Service fee: | | | | |
| | Class A | | | 3,058 | |
| | Class C | | | 1,064 | |
| | Transfer agent fee – Class A, Class C and Class Z | | | 12,806 | |
| | Pricing and bookkeeping fees | | | 50,767 | |
| | Trustees’ fees | | | 14,864 | |
| | Custody fee | | | 25,279 | |
| | Registration fees | | | 44,064 | |
| | Audit fee | | | 42,658 | |
| | Reports to shareholders | | | 42,505 | |
| | Chief compliance officer expenses | | | 999 | |
| | Other expenses | | | 7,448 | |
| | | | | | |
| | Total Expenses | | | 375,481 | |
| | |
| | Fees waived or expenses reimbursed by Investment Manager | | | (192,393 | ) |
| | Expense reductions | | | (7 | ) |
| | | | | | |
| | Net Expenses | | | 183,081 | |
| | |
| | | | | | |
| | Net Investment Income | | | 478,590 | |
| | |
| Net Realized and Unrealized Gain (Loss) on Investments, Foreign Currency, Forward Foreign Currency Exchange Contracts and Futures Contracts | | Net realized gain (loss) on: | | | | |
| | Investments | | | 167,487 | |
| | Foreign currency transactions and forward foreign currency exchange contracts | | | 163,632 | |
| | Futures contracts | | | (33,173 | ) |
| | | | | | |
| | Net realized gain | | | 297,946 | |
| | |
| | Net change in unrealized appreciation (depreciation) on: | | | | |
| | Investments | | | 2,657,046 | |
| | Foreign currency translations and forward foreign currency exchange contracts | | | 34,955 | |
| | Futures contracts | | | (498 | ) |
| | | | | | |
| | Net change in unrealized appreciation (depreciation) | | | 2,691,503 | |
| | | | | | |
| | Net Gain | | | 2,989,449 | |
| | |
| | | | | | |
| | Net Increase Resulting from Operations | | | 3,468,039 | |
See Accompanying Notes to Financial Statements.
13
Statement of Changes in Net Assets – Columbia International Bond Fund
| | | | | | | | | | |
| Increase (Decrease) in Net Assets | | Year
Ended
May 31,
2011 ($)(a) | | | Year
Ended
May 31,
2010 ($) | |
| Operations | | Net investment income | | | 478,590 | | | | 274,463 | |
| | Net realized gain on investments, foreign currency transactions, forward foreign currency exchange contracts and futures contracts | | | 297,946 | | | | 139,307 | |
| | Net change in unrealized appreciation (depreciation) on investments, foreign currency translations, forward foreign currency exchange contracts and futures contracts | | | 2,691,503 | | | | (630,509 | ) |
| | | | | | | | | | |
| | Net increase (decrease) resulting from operations | | | 3,468,039 | | | | (216,739 | ) |
| | | |
| Distributions to Shareholders | | From net investment income: | | | | | | | | |
| | Class A | | | (40,571 | ) | | | (17,337 | ) |
| | Class C | | | (11,080 | ) | | | (2,076 | ) |
| | Class I | | | (94,773 | ) | | | — | |
| | Class Z | | | (535,996 | ) | | | (325,033 | ) |
| | From net realized gains: | | | | | | | | |
| | Class A | | | (2,451 | ) | | | (441 | ) |
| | Class C | | | (862 | ) | | | (75 | ) |
| | Class I | | | (5 | ) | | | — | |
| | Class Z | | | (29,528 | ) | | | (6,885 | ) |
| | | | | | | | | | |
| | Total distributions to shareholders | | | (715,266 | ) | | | (351,847 | ) |
| | | |
| | Net Capital Stock Transactions | | | 28,627,049 | | | | 7,521,442 | |
| | Redemption fees | | | — | | | | 1,011 | |
| | | | | | | | | | |
| | Total increase in net assets | | | 31,379,822 | | | | 6,953,867 | |
| | | |
| Net Assets | | Beginning of period | | | 15,906,713 | | | | 8,952,846 | |
| | End of period | | | 47,286,535 | | | | 15,906,713 | |
| | Undistributed net investment income at end of period | | | 179,889 | | | | 65,869 | |
| (a) | Class I shares commenced operations on September 27, 2010. |
See Accompanying Notes to Financial Statements.
14
Statement of Changes in Net Assets (continued) – Columbia International Bond Fund
| | | | | | | | | | | | | | | | |
| | | Capital Stock Activity | |
| | | Year Ended
May 31, 2011 | | | Year Ended
May 31, 2010 | |
| | | Shares | | | Dollars ($) | | | Shares | | | Dollars ($) | |
Class A | | | | | | | | | | | | | | | | |
Subscriptions | | | 113,078 | | | | 1,250,049 | | | | 100,376 | | | | 1,098,612 | |
Distributions reinvested | | | 3,656 | | | | 39,797 | | | | 1,621 | | | | 17,516 | |
Redemptions | | | (104,010 | ) | | | (1,168,412 | ) | | | (18,289 | ) | | | (194,447 | ) |
| | | | | | | | | | | | | | | | |
Net increase | | | 12,724 | | | | 121,434 | | | | 83,708 | | | | 921,681 | |
| | | | |
Class C | | | | | | | | | | | | | | | | |
Subscriptions | | | 9,393 | | | | 102,727 | | | | 38,877 | | | | 416,152 | |
Distributions reinvested | | | 880 | | | | 9,533 | | | | 115 | | | | 1,250 | |
Redemptions | | | (8,389 | ) | | | (93,288 | ) | | | (7,520 | ) | | | (79,856 | ) |
| | | | | | | | | | | | | | | | |
Net increase | | | 1,884 | | | | 18,972 | | | | 31,472 | | | | 337,546 | |
| | | | |
Class I (a)(b) | | | | | | | | | | | | | | | | |
Subscriptions | | | 2,653,291 | | | | 29,563,477 | | | | — | | | | — | |
Distributions reinvested | | | 8,366 | | | | 94,707 | | | | — | | | | — | |
Redemptions | | | (60,871 | ) | | | (687,724 | ) | | | — | | | | — | |
| | | | | | | | | | | | | | | | |
Net increase | | | 2,600,786 | | | | 28,970,460 | | | | — | | | | — | |
| | | | |
Class Z | | | | | | | | | | | | | | | | |
Subscriptions | | | 712,564 | | | | 8,201,837 | | | | 720,985 | | | | 7,850,434 | |
Distributions reinvested | | | 5,500 | | | | 60,356 | | | | 12,579 | | | | 135,913 | |
Redemptions | | | (765,179 | ) | | | (8,746,010 | ) | | | (162,469 | ) | | | (1,724,132 | ) |
| | | | | | | | | | | | | | | | |
Net increase (decrease) | | | (47,115 | ) | | | (483,817 | ) | | | 571,095 | | | | 6,262,215 | |
| (a) | Shares commenced operations on September 27, 2010. |
| (b) | Shares reflect activity for the period September 27, 2010 through May 31, 2011. |
See Accompanying Notes to Financial Statements.
15
Financial Highlights – Columbia International Bond Fund
Selected data for a share outstanding throughout each period is as follows:
| | | | | | | | | | | | |
| | | Year Ended
May 31, | | | Period Ended
May 31, | |
| Class A Shares | | 2011 | | | 2010 | | | 2009 (a) | |
Net Asset Value, Beginning of Period | | $ | 10.28 | | | $ | 10.39 | | | $ | 10.00 | |
| | | |
Income from Investment Operations: | | | | | | | | | | | | |
Net investment income (b) | | | 0.21 | | | | 0.19 | | | | 0.07 | |
Net realized and unrealized gain (loss) on investments, foreign currency and futures contracts | | | 1.39 | | | | (0.07 | ) | | | 0.36 | |
| | | | | | | | | | | | |
Total from investment operations | | | 1.60 | | | | 0.12 | | | | 0.43 | |
| | | |
Less Distributions to Shareholders: | | | | | | | | | | | | |
From net investment income | | | (0.36 | ) | | | (0.22 | ) | | | (0.04 | ) |
From net realized gains | | | (0.02 | ) | | | (0.01 | ) | | | — | |
| | | | | | | | | | | | |
Total distributions to shareholders | | | (0.38 | ) | | | (0.23 | ) | | | (0.04 | ) |
| | | |
Redemption Fees: | | | | | | | | | | | | |
Redemption fees added to paid-in-capital | | | — | | | | — | (b)(c) | | | — | (b)(c) |
| | | |
Net Asset Value, End of Period | | $ | 11.50 | | | $ | 10.28 | | | $ | 10.39 | |
Total return (d)(e) | | | 15.86 | % | | | 1.07 | % | | | 4.35 | %(f) |
| | | |
Ratios to Average Net Assets/Supplemental Data: | | | | | | | | | | | | |
Net expenses (g) | | | 1.07 | % | | | 1.05 | % | | | 1.05 | %(h) |
Waiver/Reimbursement | | | 1.02 | % | | | 1.07 | % | | | 3.82 | %(h) |
Net investment income (g) | | | 1.90 | % | | | 1.78 | % | | | 1.41 | %(h) |
Portfolio turnover rate | | | 31 | % | | | 30 | % | | | 4 | %(f) |
Net assets, end of period (000s) | | $ | 1,254 | | | $ | 990 | | | $ | 131 | |
| (a) | Class A shares commenced operations on December 1, 2008. Per share data and total return reflect activity from that date. |
| (b) | Per share data was calculated using the average shares outstanding during the period. |
| (c) | Rounds to less than $0.01 per share. |
| (d) | Total return at net asset value assuming all distributions reinvested and no initial sales charge or contingent deferred sales charge. |
| (e) | Had the Investment Manager and/or any of its affiliates not waived fees or reimbursed a portion of expenses, total return would have been reduced. |
| (g) | The benefits derived from expense reductions had an impact of less than 0.01%. |
See Accompanying Notes to Financial Statements.
16
Financial Highlights – Columbia International Bond Fund
Selected data for a share outstanding throughout each period is as follows:
| | | | | | | | | | | | |
| | | Year Ended
May 31, | | | Period Ended
May 31, | |
| Class C Shares | | 2011 | | | 2010 | | | 2009 (a) | |
Net Asset Value, Beginning of Period | | $ | 10.27 | | | $ | 10.39 | | | $ | 10.00 | |
| | | |
Income from Investment Operations: | | | | | | | | | | | | |
Net investment income (b) | | | 0.12 | | | | 0.11 | | | | 0.03 | |
Net realized and unrealized gain (loss) on investments, foreign currency and futures contracts | | | 1.40 | | | | (0.08 | ) | | | 0.37 | |
| | | | | | | | | | | | |
Total from investment operations | | | 1.52 | | | | 0.03 | | | | 0.40 | |
| | | |
Less Distributions to Shareholders: | | | | | | | | | | | | |
From net investment income | | | (0.28 | ) | | | (0.14 | ) | | | (0.01 | ) |
From net realized gains | | | (0.02 | ) | | | (0.01 | ) | | | — | |
| | | | | | | | | | | | |
Total distributions to shareholders | | | (0.30 | ) | | | (0.15 | ) | | | (0.01 | ) |
| | | |
Redemption Fees: | | | | | | | | | | | | |
Redemption fees added to paid-in-capital | | | — | | | | — | (b)(c) | | | — | (b)(c) |
| | | |
Net Asset Value, End of Period | | $ | 11.49 | | | $ | 10.27 | | | $ | 10.39 | |
Total return (d)(e) | | | 15.01 | % | | | 0.21 | % | | | 3.97 | %(f) |
| | | |
Ratios to Average Net Assets/Supplemental Data: | | | | | | | | | | | | |
Net expenses (g) | | | 1.83 | % | | | 1.80 | % | | | 1.80 | %(h) |
Waiver/Reimbursement | | | 1.02 | % | | | 1.07 | % | | | 3.82 | %(h) |
Net investment income (g) | | | 1.10 | % | | | 1.06 | % | | | 0.59 | %(h) |
Portfolio turnover rate | | | 31 | % | | | 30 | % | | | 4 | %(f) |
Net assets, end of period (000s) | | $ | 418 | | | $ | 355 | | | $ | 32 | |
| (a) | Class C shares commenced operations on December 1, 2008. Per share data and total return reflect activity from that date. |
| (b) | Per share data was calculated using the average shares outstanding during the period. |
| (c) | Rounds to less than $0.01 per share. |
| (d) | Total return at net asset value assuming all distributions reinvested and no contingent deferred sales charge. |
| (e) | Had the Investment Manager and/or any of its affiliates not waived fees or reimbursed a portion of expenses, total return would have been reduced. |
| (g) | The benefits derived from expense reductions had an impact of less than 0.01%. |
See Accompanying Notes to Financial Statements.
17
Financial Highlights – Columbia International Bond Fund
Selected data for a share outstanding throughout the period is as follows:
| | | | |
| Class I Shares | | Period Ended
May 31,
2011 (a) | |
Net Asset Value, Beginning of Period | | $ | 11.34 | |
| |
Income from Investment Operations: | | | | |
Net investment income (b) | | | 0.23 | |
Net realized and unrealized gain on investments, foreign currency and futures contracts | | | 0.25 | |
| | | | |
Total from investment operations | | | 0.48 | |
| |
Less Distributions to Shareholders: | | | | |
From net investment income | | | (0.32 | ) |
From net realized gains | | | (0.02 | ) |
| | | | |
Total distributions to shareholders | | | (0.34 | ) |
| |
Net Asset Value, End of Period | | $ | 11.48 | |
Total return (c)(d)(e) | | | 4.44 | % |
| |
Ratios to Average Net Assets/Supplemental Data: | | | | |
Net expenses (f)(g) | | | 0.84 | % |
Waiver/Reimbursement (g) | | | 0.49 | % |
Net investment income (f)(g) | | | 2.96 | % |
Portfolio turnover rate (e) | | | 31 | % |
Net assets, end of period (000s) | | $ | 29,870 | |
| (a) | Class I shares commenced operations on September 27, 2010. Per share data and total return reflect activity from that date. |
| (b) | Per share data was calculated using the average shares outstanding during the period. |
| (c) | Total return at net asset value assuming all distributions reinvested. |
| (d) | Had the Investment Manager and/or any of its affiliates not waived fees or reimbursed a portion of expenses, total return would have been reduced. |
| (f) | The benefits derived from expense reductions had an impact of less than 0.01%. |
See Accompanying Notes to Financial Statements.
18
Financial Highlights – Columbia International Bond Fund
Selected data for a share outstanding throughout each period is as follows:
| | | | | | | | | | | | |
| | | Year Ended
May 31, | | | Period Ended
May 31, | |
| Class Z Shares | | 2011 | | | 2010 | | | 2009 (a) | |
Net Asset Value, Beginning of Period | | $ | 10.28 | | | $ | 10.39 | | | $ | 10.00 | |
| | | |
Income from Investment Operations: | | | | | | | | | | | | |
Net investment income (b) | | | 0.23 | | | | 0.21 | | | | 0.07 | |
Net realized and unrealized gain (loss) on investments, foreign currency and futures contracts | | | 1.39 | | | | (0.06 | ) | | | 0.38 | |
| | | | | | | | | | | | |
Total from investment operations | | | 1.62 | | | | 0.15 | | | | 0.45 | |
| | | |
Less Distributions to Shareholders: | | | | | | | | | | | | |
From net investment income | | | (0.39 | ) | | | (0.25 | ) | | | (0.06 | ) |
From net realized gains | | | (0.02 | ) | | | (0.01 | ) | | | — | |
| | | | | | | | | | | | |
Total distributions to shareholders | | | (0.41 | ) | | | (0.26 | ) | | | (0.06 | ) |
| | | |
Redemption Fees: | | | | | | | | | | | | |
Redemption fees added to paid-in-capital | | | — | | | | — | (b)(c) | | | — | (b)(c) |
| | | |
Net Asset Value, End of Period | | $ | 11.49 | | | $ | 10.28 | | | $ | 10.39 | |
Total return (d)(e) | | | 16.05 | % | | | 1.31 | % | | | 4.48 | %(f) |
| | | |
Ratios to Average Net Assets/Supplemental Data: | | | | | | | | | | | | |
Net expenses (g) | | | 0.83 | % | | | 0.80 | % | | | 0.80 | %(h) |
Waiver/Reimbursement | | | 1.02 | % | | | 1.07 | % | | | 3.82 | %(h) |
Net investment income (g) | | | 2.11 | % | | | 1.98 | % | | | 1.50 | %(h) |
Portfolio turnover rate | | | 31 | % | | | 30 | % | | | 4 | %(f) |
Net assets, end of period (000s) | | $ | 15,745 | | | $ | 14,562 | | | $ | 8,790 | |
| (a) | Class Z shares commenced operations on December 1, 2008. Per share data and total return reflect activity from that date. |
| (b) | Per share data was calculated using the average shares outstanding during the period. |
| (c) | Rounds to less than $0.01 per share. |
| (d) | Total return at net asset value assuming all distributions reinvested. |
| (e) | Had the Investment Manager and/or any of its affiliates not waived fees or reimbursed a portion of expenses, total return would have been reduced. |
| (g) | The benefits derived from expense reductions had an impact of less than 0.01%. |
See Accompanying Notes to Financial Statements.
19
Notes to Financial Statements – Columbia International Bond Fund
May 31, 2011
Note 1. Organization
Columbia International Bond Fund (the Fund), a series of Columbia Funds Series Trust I (the Trust), is a non-diversified fund. The Trust is registered under the Investment Company Act of 1940, as amended (the 1940 Act), as an open-end management investment company organized as a Massachusetts business trust.
Investment Objective
The Fund seeks total return, consisting of current income and capital appreciation.
Fund Shares
The Trust may issue an unlimited number of shares (without par). The Fund offers Class A, Class C, Class I and Class Z shares. All share classes have identical voting, dividend and liquidation rights. Each share class has its own expense structure and sales charges, as applicable.
Class A shares are subject to a maximum front-end sales charge of 4.75% based on the investment amount. Class A shares purchased without an initial sales charge in accounts aggregating $1 million to $50 million at the time of purchase are subject to a 1.00% contingent deferred sales charge (CDSC) if the shares are sold within 18 months of purchase, charged as follows: 1.00% CDSC if redeemed within 12 months of purchase, and 0.50% CDSC if redeemed more than 12, but less than 18 months after purchase.
Class C shares are subject to a 1.00% CDSC on shares redeemed within one year of purchase.
Class I shares are not subject to sales charges and are available only to the Columbia Family of Funds. Class I shares commenced operations on September 27, 2010.
Class Z shares are not subject to sales charges and are available only to certain investors, as described in the Fund’s prospectus.
Note 2. Summary of Significant Accounting Policies
The preparation of financial statements in accordance with U.S. generally accepted accounting principles (GAAP) requires management to make certain estimates and assumptions that affect the reported amounts of assets and liabilities, the disclosure of contingent assets and liabilities at the date of the financial statements and the reported amounts of revenue and expenses during the reporting period. Actual results could differ from those estimates.
The following is a summary of significant accounting policies consistently followed by the Fund in the preparation of its financial statements.
Security Valuation
Debt securities generally are valued by pricing services approved by the Trust’s Board of Trustees, based upon market transactions for normal, institutional-size trading units of similar securities. The services may use various pricing techniques which take into account appropriate factors such as yield, quality, coupon rate, maturity, type of issue, trading characteristics and other data, as well as broker quotes. Debt securities for which quotations are readily available may also be valued based upon an over-the-counter or exchange bid quotation.
Certain debt securities, which tend to be more thinly traded and of lesser quality, are priced based on fundamental analysis of the financial condition of the issuer and the estimated value of any collateral. Valuations developed through pricing techniques may vary from the actual amounts realized upon sale of the securities, and the potential variation may be greater for those securities valued using fundamental analysis.
Short-term investments maturing in 60 days or less are valued at amortized cost, which approximates market value.
Forward foreign currency exchange contracts are valued at the prevailing forward exchange rate of the underlying currencies.
Futures contracts are valued at the settlement price established each day by the board of trade or exchange on which they are traded.
Generally, trading in foreign securities is substantially completed each day at various times prior to the close of the New York Stock Exchange (NYSE). The values of such securities used in computing the net asset value of the Fund’s shares are determined as of such times. Foreign currency exchange rates are generally determined at 4:00 p.m. Eastern (U.S.) time. Occasionally, events affecting the values of such foreign securities may occur between the times at which they are determined and the close of the customary trading session of the NYSE, which would not be reflected in the computation of the Fund’s net asset value. If events materially affecting the values of such foreign securities occur and it is determined that market quotations are not reliable, then these foreign securities will be valued at their fair value using procedures approved by the Board of Trustees.
Investments for which market quotations are not readily available, or that have quotations which management believes are not reliable, are
20
Columbia International Bond Fund
May 31, 2011
valued at fair value as determined in good faith under consistently applied procedures established by and under the general supervision of the Board of Trustees. If a security is valued at fair value, such value is likely to be different from the last quoted market price for the security. The determination of fair value often requires significant judgment. To determine fair value, management may use assumptions including but not limited to future cash flows and estimated risk premiums. Multiple inputs from various sources may be used to determine value.
Foreign Currency Transactions and Translations
The values of all assets and liabilities quoted in foreign currencies are translated into U.S. dollars at that day’s exchange rates. Net realized and unrealized gains (losses) on foreign currency transactions and translations include gains (losses) arising from the fluctuation in exchange rates between trade and settlement dates on securities transactions, gains (losses) arising from the disposition of foreign currency and currency gains (losses) between the accrual and payment dates on dividends, interest income and foreign withholding taxes.
For financial statement purposes, the Fund does not distinguish that portion of gains (losses) on investments which is due to changes in foreign exchange rates from that which is due to changes in market prices of the investments. Such fluctuations are included with the net realized and unrealized gains (losses) on investments on the Statement of Operations.
Derivative Instruments
The Fund may use derivative instruments including futures contracts and forward contracts in order to meet its investment objectives. The Fund employs strategies in differing combinations to permit it to increase, decrease or change the level of exposure to market risk factors. The achievement of any strategy relating to derivatives depends on an analysis of various risk factors, and if the strategies for the use of derivatives do not work as intended, the Fund may not achieve its investment objectives.
In pursuit of its investment objectives, the Fund is exposed to the following market risks among others:
Foreign Exchange Rate Risk: Foreign exchange rate risk relates to the change in the U.S. dollar value of a security held that is denominated in a foreign currency. The U.S. dollar value of a foreign-currency-denominated security will decrease as the dollar appreciates against the currency, while the U.S. dollar value will increase as the dollar depreciates against the currency.
Interest Rate Risk: Interest rate risk relates to the fluctuation in value of fixed income securities because of the inverse relationship of price and yield. Fixed income securities generally will decline in value upon an increase in general interest rates and their value generally will increase upon a decline in general interest rates. Fixed income securities with longer durations tend to be more sensitive to changes in interest rates, usually making them more volatile than securities with shorter durations.
The following provides more detailed information about each derivative type held by the Fund:
Forward Foreign Currency Exchange Contracts — The Fund entered into forward foreign currency exchange contracts to shift its foreign currency exposure back to U.S. dollars.
Forward foreign currency exchange contracts are agreements to exchange one currency for another at a future date at a specified price. These contracts are used to minimize the exposure to foreign exchange rate fluctuations during the period between the trade and settlement dates of the contract. Contracts to buy generally are used to acquire exposure to foreign currencies, while contracts to sell are generally used to reduce the exposure to foreign exchange rate fluctuations. Forward foreign currency exchange contracts are valued daily at the current exchange rate of the underlying currency, resulting in unrealized gains (losses) which become realized at the time the forward foreign currency exchange contracts are closed or mature. Realized and unrealized gains (losses) arising from such transactions are included in net realized and unrealized gains (losses) on foreign currency transactions. The use of forward foreign currency exchange contracts does not eliminate fluctuations in the prices of the Fund’s portfolio securities. While the maximum potential loss from such contracts is the aggregate face value in U.S. dollars at the time the contract was opened, exposure is typically limited to the change in value of the contract (in U.S. dollars) over the period it remains open. The Fund could also be exposed to risk that counterparties of the contracts may be unable to fulfill the terms of the contracts.
During the year ended May 31, 2011, the Fund entered into 133 forward foreign currency exchange contracts.
Futures Contracts
The Fund entered into interest rate futures contracts to manage the duration and yield curve exposure of the Fund versus the benchmark.
The use of futures contracts involves certain risks, which include, among others: (1) imperfect correlation between the price movement of the instruments and the underlying securities, (2) inability to close
21
Columbia International Bond Fund
May 31, 2011
out positions due to differing trading hours, or the temporary absence of a liquid market, for either the instruments or the underlying securities, and (3) an inaccurate prediction of the future direction of interest rates by the Fund’s Investment Manager.
Upon entering into a futures contract, the Fund identifies within its portfolio of investments cash or securities in an amount sufficient to meet the initial margin requirement. Subsequent payments are made or received by the Fund equal to the daily change in the contract value and are recorded as variation margin receivable or payable and offset in unrealized gains or losses. The Fund recognizes a realized gain or loss when the contract is closed or expires.
Futures contracts involve, to varying degrees, risk of loss in excess of the variation margin disclosed on the Statement of Assets and Liabilities.
During the year ended May 31, 2011, the Fund entered into 15 futures contracts.
The following table is a summary of the value of the Fund’s derivative instruments as of May 31, 2011.
| | | | | | | | |
| Fair Value of Derivative Instruments | |
| Assets | | Liabilities | |
Statement of
Assets and
Liabilities | | Fair Value | | Statement of
Assets and
Liabilities | | Fair Value | |
Futures variation
margin | | $— | | Futures variation
margin | | $ | 703 | * |
Unrealized
appreciation on
forward foreign
currency exchange
contracts | | 8,521 | | Unrealized
depreciation on
forward foreign
currency exchange
contracts | | | 11,348 | |
| * | Includes only current day’s variation margin. |
The effect of derivative instruments on the Fund’s Statement of Operations for the year ended May 31, 2011:
| | | | | | | | | | |
| | | | | | | | | |
| | | Amount of Realized Gain or (Loss) and
Change in Unrealized Appreciation or
(Depreciation) on Derivatives | |
| | | Risk
Exposure | | Net
Realized Gain
(Loss) | | | Change in Unrealized Appreciation (Depreciation) | |
| Futures Contracts | | Interest
Rate Risk | | $ | (33,173 | ) | | $ | (498 | ) |
| Forward Foreign Currency Exchange Contracts | | Foreign
Exchange
Rate Risk | | | (3,373 | ) | | | (80 | ) |
Repurchase Agreements
The Fund may engage in repurchase agreement transactions with institutions that the Investment Manager has determined are creditworthy. The Fund, through the custodian, receives delivery of the underlying securities collateralizing a repurchase agreement. The Investment Manager is responsible for determining that the collateral is at least equal, at all times, to the value of the repurchase obligation including interest. A repurchase agreement transaction involves certain risks in the event of default or insolvency of the counterparty. These risks include possible delays in or restrictions on the Fund’s ability to dispose of the underlying securities and a possible decline in the value of the underlying securities during the period while the Fund seeks to assert its rights.
Security Transactions
Security transactions are accounted for on the trade date. Cost is determined and gains (losses) are based upon the specific identification method for both financial statement and federal income tax purposes.
Income Recognition
Interest income is recorded on the accrual basis. Market premium and discount are amortized and accreted, respectively, on all debt securities, unless otherwise noted. Original issue discount is accreted to interest income over the life of the security with a corresponding increase in the cost basis, if any.
Expenses
General expenses of the Trust are allocated to the Fund and other series of the Trust based upon relative net assets or other expense allocation methodologies determined by the nature of the expense. Expenses directly attributable to a specific class of shares are charged to that share class. Expenses directly attributable to the Fund are charged to the Fund.
Determination of Class Net Asset Value
All income, expenses (other than class-specific expenses which are charged directly to a share class, as shown in the Statement of Operations) and realized and unrealized gains (losses) are allocated to each class of the Fund on a daily basis, based on the relative net assets of each class, for purposes of determining the net asset value of each class.
22
Columbia International Bond Fund
May 31, 2011
Federal Income Tax Status
The Fund intends to qualify each year as a regulated investment company under Subchapter M of the Internal Revenue Code, as amended, and will distribute substantially all of its taxable income, if any, for its tax year, and as such will not be subject to federal income taxes. In addition, the Fund intends to distribute in each calendar year substantially all of its net investment income, capital gains and certain other amounts, if any, such that the Fund should not be subject to federal excise tax. Therefore, no federal income or excise tax provision is recorded.
Foreign Taxes
The Fund may be subject to foreign taxes on income and/or gains on investments or currency repatriation, a portion of which may be recoverable. The Fund will accrue such taxes and recoveries as applicable, based upon its current interpretation of tax rules and regulations that exist in the markets in which it invests.
Realized gains in certain countries may be subject to foreign taxes at the Fund level, based on statutory rates. The Fund accrues for such foreign taxes on net realized and unrealized gains at the appropriate rate for each jurisdiction.
Distributions to Shareholders
Distributions from net investment income are declared and paid monthly. Net realized capital gains, if any, are distributed at least annually. Income distributions and capital gain distributions are determined in accordance with federal income tax regulations which may differ from GAAP.
Indemnifications
Under the Trust’s organizational documents and, in some cases, by contract, its officers and trustees are indemnified against certain liabilities arising out of the performance of their duties to the Fund. In addition, certain of the Fund’s contracts with its service providers contain general indemnification clauses. The Fund’s maximum exposure under these arrangements is unknown since the amount of any future claims that may be made against the Fund cannot be determined and the Fund has no historical basis for predicting the likelihood of any such claims.
Note 3. Fees and Compensation Paid to Affiliates
Investment Management Fee
Under an Investment Management Services Agreement (IMSA), Columbia Management Investment Advisers, LLC (the Investment Manager), a wholly-owned subsidiary of Ameriprise Financial, Inc. (Ameriprise Financial), determines which securities will be purchased, held or sold. The annual management fee is equal to a percentage of the Fund’s average daily net assets that declines from 0.55% to 0.44% as the Fund’s net assets increase. The effective management fee rate for the year ended May 31, 2011, was 0.55% of the Fund’s average daily net assets.
In September 2010, the Fund’s Board of Trustees approved an amended IMSA that includes an annual management fee that declines from 0.57% to 0.47% as the Fund’s net assets increase. The amended IMSA was approved by the Fund’s shareholders at a meeting held on February 15, 2011. The amended IMSA became effective on July 1, 2011.
Administration Fee
The Investment Manager also serves as the Fund Administrator and provides administration and other services to the Fund. Under an Administrative Services Agreement, the Fund pays the Fund Administrator an annual fee equal to 0.05% of the Fund’s average daily net assets.
In September 2010, the Board of Trustees approved an amended Administrative Services Agreement that includes an annual administration fee rate that declines from 0.08% to 0.05% as the Fund’s net assets increase. The amended Administrative Services Agreement became effective on July 1, 2011.
Pricing and Bookkeeping Fees
The Fund entered into a Financial Reporting Services Agreement (the Financial Reporting Services Agreement) with State Street Bank and Trust Company (State Street) and the Investment Manager pursuant to which State Street provides financial reporting services to the Fund. The Fund also entered into an Accounting Services Agreement (collectively with the Financial Reporting Services Agreement, the State Street Agreements) with State Street and the Investment Manager pursuant to which State Street provides accounting services to the Fund. Under the State Street Agreements, the Fund pays State Street an annual fee of $38,000 paid monthly plus an additional monthly fee based on an annualized percentage rate of average daily net assets of the Fund for the month. The aggregate fee will not exceed $140,000 per year (exclusive of out-of-pocket expenses and charges). The Fund also reimburses State Street for certain out-of-pocket expenses and charges. Effective June 27, 2011, these services are provided under the Administrative Services Agreement discussed above and the Fund no longer pays State Street a fee for pricing and bookkeeping services.
23
Columbia International Bond Fund
May 31, 2011
Transfer Agent Fee
Under a Transfer Agency Agreement, Columbia Management Investment Services Corp. (the Transfer Agent), an affiliate of the Investment Manager and wholly-owned subsidiary of Ameriprise Financial, is responsible for providing transfer agency services to the Fund. The Transfer Agent has contracted with Boston Financial Data Services (BFDS) to serve as sub-transfer agent.
The Transfer Agent receives monthly account-based service fees based on the number of open accounts and is reimbursed by the Fund for the fees and expenses the Transfer Agent pays to financial intermediaries that maintain omnibus accounts with the Fund that is a percentage of the average aggregate value of the Fund’s shares maintained in each such omnibus account (other than omnibus accounts for which American Enterprise Investment Services Inc. is the broker of record or accounts where the beneficial shareholder is a customer of Ameriprise Financial Services, Inc., which are paid a per account fee). The Transfer Agent pays the fees of BFDS for services as sub-transfer agent and is not entitled to reimbursement for such fees from the Fund (with the exception of out-of pocket fees). The Transfer Agent also receives compensation from fees for various shareholder services and reimbursements for certain out-of -pocket expenses.
Class I shares do not pay any transfer agency fees.
For the year ended May 31, 2011, the Fund’s effective transfer agent fee rate for each class was 0.08% of the Fund’s average daily net assets.
An annual minimum account balance fee of $20 may apply to certain accounts with a value below the Fund’s initial minimum investment requirements to reduce the impact of small accounts on transfer agent fees. These minimum account balance fees are recorded as part of expense reductions on the Statement of Operations. For the year ended May 31, 2011, no minimum account balance fees were charged by the Fund.
Underwriting Discounts, Service and Distribution Fees
The Fund has an agreement with Columbia Management Investment Distributors, Inc. (the Distributor), an affiliate of the Investment Manager and wholly-owned subsidiary of Ameriprise Financial, for distribution and shareholder services. Pursuant to Rule 12b-1 under the 1940 Act, the Board of Trustees has approved, and the Fund has adopted, distribution and shareholder service plans (the Plans) which set the distribution and service fees for the Fund. These fees are calculated daily and are intended to compensate the Distributor and/or eligible selling and/or servicing agents for selling shares of the Fund and providing services to investors.
The Plans require the payment of a monthly service fee to the Distributor at the maximum annual rate of 0.25% of the average daily net assets attributable to Class A and Class C shares of the Fund. The Plans also require the payment of a monthly distribution fee to the Distributor at the maximum annual rate of 0.75% of the average daily net assets attributable to Class C shares only.
Sales Charges
Sales charges, including front-end charges and CDSC’s, received by the Distributor for distributing Fund shares were $1,205 for Class A shares for the year ended May 31, 2011.
Fee Waivers and Expense Reimbursements
Effective September 27, 2010, the Investment Manager and certain of its affiliates have contractually agreed to waive fees and/or reimburse expenses (excluding certain fees and expenses described below), so that the Fund’s operating expenses, after giving effect to any balance credits or overdraft charges from the Fund’s custodian, do not exceed the annual rates of 1.10%, 1.85%, 0.84% and 0.85% of the Fund’s average daily net assets attributable to Class A, Class C, Class I and Class Z shares, respectively.
Prior to September 27, 2010, the Investment Manager voluntarily agreed to reimburse a portion of the Fund’s expenses (excluding certain fees and expenses described below as well as any distribution and service fees) so that the Fund’s operating expenses, after giving effect to any balance credits or overdraft charges from the Fund’s custodian, did not exceed 0.80% of the Fund’s average daily net assets on an annualized basis.
Effective July 1, 2011, the Investment Manager and certain of its affiliates have contractually agreed to waive fees and/or reimburse expenses (excluding certain fees and expenses described below), through September 30, 2012, unless sooner terminated at the sole discretion of the Board of Trustees, so that the Fund’s operating expenses, after giving effect to any balance credits or overdraft charges from the Fund’s custodian, do not exceed the annual rates of 1.10%, 1.85%, 0.81% and 0.85% of the Fund’s average daily net assets attributable to Class A, Class C, Class I and Class Z shares, respectively.
Under the agreement, the following fees and expenses are excluded from the Fund’s operating expenses when calculating the waiver/reimbursement commitment, and therefore will be paid by the Fund: taxes (including foreign transaction taxes), expenses associated with investments in affiliated and non-affiliated pooled investment vehicles (including mutual funds and exchange traded funds),
24
Columbia International Bond Fund
May 31, 2011
transaction costs and brokerage commissions, costs related to any securities lending program, dividend expenses associated with securities sold short, inverse floater program fees and expenses, transaction charges and interest on borrowed money, interest, extraordinary expenses and any other expenses the exclusion of which is specifically approved by the Fund’s Board of Trustees. This agreement may be modified or amended only with approval from all parties.
The Investment Manager is entitled to recover from the Fund any fees waived and/or expenses reimbursed for a three year period following the date of such fee waiver and/or reimbursement under these arrangements if such recovery does not cause the Fund’s expenses to exceed the expense limitations in effect at the time of recovery.
Effective June 1, 2011, the Investment Manager has eliminated the fee recoupment provisions detailed above.
Fees Paid to Officers and Trustees
All officers of the Fund are employees of the Investment Manager or its affiliates and, with the exception of the Fund’s Chief Compliance Officer, receive no compensation from the Fund. The Board of Trustees has appointed a Chief Compliance Officer to the Fund in accordance with federal securities regulations. The Fund, along with other affiliated funds, pays its pro-rata share of the expenses associated with the Chief Compliance Officer. The Fund’s expenses for the Chief Compliance Officer will not exceed $15,000 per year.
Trustees are compensated for their services to the Fund, as set forth on the Statement of Operations. The Trust’s eligible Trustees may participate in a deferred compensation plan which may be terminated at any time. Obligations of the plan will be paid solely out of the Fund’s assets.
Note 4. Custody Credits
The Fund has an agreement with its custodian bank under which custody fees may be reduced by balance credits. These credits are recorded as a reduction of total expenses on the Statement of Operations. The Fund could have invested a portion of the assets utilized in connection with the expense offset arrangement in an income-producing asset if it had not entered into such an agreement. For the year ended May 31, 2011, these custody credits reduced total expenses by $7 for the Fund.
Note 5. Portfolio Information
The cost of purchases and proceeds from sales of securities, excluding short-term obligations, aggregated $35,063,121 and $6,768,558, respectively, for the year ended May 31, 2011 of which $0 and $61,685, respectively were U.S. Government securities.
Note 6. Shareholder Concentration
As of May 31, 2011, three shareholder accounts owned 92.6% of the outstanding shares of the Fund. Purchase and redemption activity of these accounts may have a significant effect on the operations of the Fund.
Note 7. Line of Credit
The Fund and other affiliated funds participate in a $150 million committed, unsecured revolving line of credit provided by State Street. The maximum amount that may be borrowed by any fund is limited to the lesser of $120 million and the fund’s borrowing limit set forth in the fund’s registration statement (Borrowing Limit). For the period March 29, 2011 through May 15, 2011, the collective borrowing amount of the commitment was $225 million and the maximum amount that may have been borrowed by any fund was limited to the lesser of $200 million and the fund’s Borrowing Limit. Prior to March 29, 2011, the collective borrowing amount of the commitment was $280 million. Borrowings are available for short-term liquidity or temporary or emergency purposes.
Effective October 14, 2010, interest is charged to each participating fund based on the fund’s borrowings at a rate per annum equal to the greater of the Federal Funds Rate plus 1.25% or the overnight LIBOR Rate plus 1.25%. In addition, a commitment fee of 0.125% per annum is accrued and apportioned among the participating funds pro rata based on their relative net assets. Prior to October 14, 2010, interest was charged to each participating fund at the same rates. In addition, a commitment fee of 0.15% per annum was accrued and apportioned among the participating funds pro rata based on their relative net assets.
For the year ended May 31, 2011, the Fund did not borrow under these arrangements.
Note 8. Federal Tax Information
The timing and character of income and capital gain distributions are determined in accordance with income tax regulations, which may differ from GAAP. Reclassifications are made to the Fund’s capital accounts for permanent tax differences to reflect income and gains available for distribution (or available capital loss carryforwards) under income tax regulations.
25
Columbia International Bond Fund
May 31, 2011
For the year ended May 31, 2011, permanent book and tax basis differences resulting primarily from differing treatments for foreign currency transactions, distribution reclassifications, paydown reclassifications, market discount reclassifications and discount accretion/premium amortization on debt securities were identified and reclassified among the components of the Fund’s net assets as follows:
| | | | |
| | | | | |
Overdistributed Net Investment
Income | | Accumulated Net Realized
Gain | | Paid-In Capital |
| $317,850 | | $(317,851) | | $1 |
Net investment income and net realized gains (losses), as disclosed on the Statement of Operations, and net assets were not affected by this reclassification.
The tax character of distributions paid during the years ended May 31, 2011 and May 31, 2010 was as follows:
| | | | | | | | |
| | | May 31, 2011 | | | May 31, 2010 | |
| Ordinary Income* | | $ | 695,472 | | | $ | 351,847 | |
| Long-Term Capital Gains | | | 19,794 | | | | — | |
| * | For tax purposes short-term capital gain distributions, if any, are considered ordinary income distributions. |
As of May 31, 2011, the components of distributable earnings on a tax basis were as follows:
| | | | |
| | | | | |
Undistributed
Ordinary Income | | Undistributed Long-Term Capital Gains | | Net
Unrealized Appreciation* |
| $299,611 | | $— | | $2,169,070 |
| * | The differences between book-basis and tax-basis net unrealized appreciation are primarily due to AICPA amortization. |
Unrealized appreciation and depreciation at May 31, 2011, based on cost of investments for federal income tax purposes were:
| | | | |
| | | | |
| Unrealized appreciation | | $ | 2,279,682 | |
| Unrealized depreciation | | | (110,612 | ) |
| | | | |
| Net unrealized appreciation | | $ | 2,169,070 | |
Under current tax rules, certain currency and capital losses realized after October 31 may be deferred and treated as occurring on the first day of the following fiscal year. As of May 31, 2011, post-October capital losses of $40,877 attributed to security transactions were deferred to June 1, 2011.
Management of the Fund has concluded that there are no significant uncertain tax positions that would require recognition in the financial statements. However, management’s conclusion may be subject to review and adjustment at a later date based on factors including, but not limited to, new tax laws, regulations, and administrative interpretations (including relevant court decisions). The Fund’s federal tax returns for the prior three fiscal years remain subject to examination by the Internal Revenue Service.
Note 9. Significant Risks and Contingencies
Non-Diversification Risk
As a non-diversified fund, the Fund is permitted to invest a greater percentage of its total assets in securities of fewer issuers than a diversified fund. The Fund may, therefore, have a greater risk of loss from a few issuers than a similar fund that invests more broadly.
Foreign Securities Risk
Investing in foreign securities may include certain risks and considerations not typically associated with investing in U.S. securities, such as fluctuating currency values and changing local and regional economic, political and social conditions, which may result in greater market volatility. In addition, certain foreign securities may not be as liquid as U.S. securities. Investing in emerging markets may accentuate these risks.
Investments in emerging market countries are subject to additional risk. The risk of foreign investments is typically increased in less developed countries. These countries are also more likely to experience high levels of inflation, deflation or currency devaluation which could hurt their economies and securities markets.
Note 10. Subsequent Events
Management has evaluated the events and transactions that have occurred through the date the financial statements were issued. Other than as noted below and in Note 3 above, there were no items requiring adjustment of the financial statements or additional disclosure.
Effective June 27, 2011, the Fund has entered into a revolving credit facility with a syndicate of banks led by JPMorgan Chase Bank, N.A. (the Administrative Agent). The credit facility replaced the prior credit facility with State Street. The credit facility agreement, which is a collective agreement between the Fund and certain other funds managed by the Investment Manager, severally and not jointly, permits collective borrowings up to $422,500,000. The collective borrowing amount will increase during the third quarter of 2011 to a collective borrowing amount of $500,000,000.
26
Columbia International Bond Fund
May 31, 2011
Interest is charged to each fund based on its borrowings at a rate equal to the sum of the federal funds rate plus (i) 1.25% per annum plus (ii) if one-month LIBOR exceeds the federal funds rate, the amount of such excess. Each borrowing under the credit facility matures no later than 60 days after the date of borrowing. The Fund also pays a commitment fee equal to its pro rata share of the amount of the credit facility at a rate of 0.10% per annum.
Note 11. Information Regarding Pending and Settled Legal Proceedings
In June 2004, an action captioned John E. Gallus et al. v. American Express Financial Corp. and American Express Financial Advisors Inc. was filed in the United States District Court for the District of Arizona. The plaintiffs allege that they are investors in several American Express Company mutual funds (branded as Columbia or RiverSource) and they purport to bring the action derivatively on behalf of those funds under the Investment Company Act of 1940. The plaintiffs allege that fees allegedly paid to the defendants by the funds for investment advisory and administrative services are excessive. The plaintiffs seek remedies including restitution and rescission of investment advisory and distribution agreements. The plaintiffs voluntarily agreed to transfer this case to the United States District Court for the District of Minnesota (the District Court). In response to defendants’ motion to dismiss the complaint, the District Court dismissed one of plaintiffs’ four claims and granted plaintiffs limited discovery. Defendants moved for summary judgment in April 2007. Summary judgment was granted in the defendants’ favor on July 9, 2007. The plaintiffs filed a notice of appeal with the Eighth Circuit Court of Appeals (the Eighth Circuit) on August 8, 2007. On April 8, 2009, the Eighth Circuit reversed summary judgment and remanded to the District Court for further proceedings. On August 6, 2009, defendants filed a writ of certiorari with the U.S. Supreme Court (the Supreme Court), asking the Supreme Court to stay the District Court proceedings while the Supreme Court considers and rules in a case captioned Jones v. Harris Associates, which involves issues of law similar to those presented in the Gallus case. On March 30, 2010, the Supreme Court issued its ruling in Jones v. Harris Associates, and on April 5, 2010, the Supreme Court vacated the Eighth Circuit’s decision in the Gallus case and remanded the case to the Eighth Circuit for further consideration in light of the Supreme Court’s decision in Jones v. Harris Associates. On June 4, 2010, the Eighth Circuit remanded the Gallus case to the District Court for further consideration in light of the Supreme Court’s decision in Jones v. Harris Associates. On December 9, 2010, the District Court reinstated its July 9, 2007 summary judgment order in favor of the defendants. On January 10, 2011 plaintiffs filed a notice of appeal with the Eighth Circuit. In response to the plaintiffs’ opening appellate brief filed on March 18, 2011, the defendants filed a response brief on May 4, 2011 with the Eighth Circuit. The plaintiffs filed a reply brief on May 26, 2011.
In December 2005, without admitting or denying the allegations, American Express Financial Corporation (AEFC, which is now known as Ameriprise Financial, Inc. (Ameriprise Financial)), entered into settlement agreements with the Securities and Exchange Commission (SEC) and Minnesota Department of Commerce (MDOC) related to market timing activities. As a result, AEFC was censured and ordered to cease and desist from committing or causing any violations of certain provisions of the Investment Advisers Act of 1940, the Investment Company Act of 1940, and various Minnesota laws. AEFC agreed to pay disgorgement of $10 million and civil money penalties of $7 million. AEFC also agreed to retain an independent distribution consultant to assist in developing a plan for distribution of all disgorgement and civil penalties ordered by the SEC in accordance with various undertakings detailed at http://www.sec.gov/litigation/admin/ia-2451.pdf. Ameriprise Financial and its affiliates have cooperated with the SEC and the MDOC in these legal proceedings, and have made regular reports to the RiverSource, Seligman and Threadneedle funds’ Boards of Directors/Trustees.
Ameriprise Financial and certain of its affiliates have historically been involved in a number of legal, arbitration and regulatory proceedings, including routine litigation, class actions, and governmental actions, concerning matters arising in connection with the conduct of their business activities. Ameriprise Financial believes that the Funds are not currently the subject of, and that neither Ameriprise Financial nor any of its affiliates are the subject of, any pending legal, arbitration or regulatory proceedings that are likely to have a material adverse effect on the Funds or the ability of Ameriprise Financial or its affiliates to perform under their contracts with the Funds. Ameriprise Financial is required to make 10-Q, 10-K and, as necessary, 8-K filings with the Securities and Exchange Commission on legal and regulatory matters that relate to Ameriprise Financial and its affiliates. Copies of these filings may be obtained by accessing the SEC website at www.sec.gov.
There can be no assurance that these matters, or the adverse publicity associated with them, will not result in increased fund redemptions, reduced sale of fund shares or other adverse consequences to the Funds. Further, although we believe proceedings are not likely to have a material adverse effect on the Funds or the ability of Ameriprise Financial or its affiliates to perform under their contracts with the Funds, these proceedings are subject to uncertainties and, as such, we are unable to estimate the possible loss or range of loss that may result. An adverse outcome in one or more of these proceedings could result in adverse judgments, settlements, fines, penalties or other relief that could have a material adverse effect on the consolidated financial condition or results of operations of Ameriprise Financial.
27
Report of Independent Registered Public Accounting Firm
To the Trustees of Columbia Funds Series Trust I and the Shareholders of Columbia International Bond Fund
In our opinion, the accompanying statement of assets and liabilities, including the investment portfolio, and the related statements of operations and of changes in net assets and the financial highlights present fairly, in all material respects, the financial position of Columbia International Bond Fund (the “Fund”) (a series of Columbia Funds Series Trust I) at May 31, 2011, the results of its operations for the year then ended, the changes in its net assets for each of the two years in the period then ended, and the financial highlights for the periods indicated, in conformity with accounting principles generally accepted in the United States of America. These financial statements and financial highlights (hereafter referred to as “financial statements”) are the responsibility of the Fund’s management. Our responsibility is to express an opinion on these financial statements based on our audits. We conducted our audits of these financial statements in accordance with the standards of the Public Company Accounting Oversight Board (United States). Those standards require that we plan and perform the audit to obtain reasonable assurance about whether the financial statements are free of material misstatement. An audit includes examining, on a test basis, evidence supporting the amounts and disclosures in the financial statements, assessing the accounting principles used and significant estimates made by management, and evaluating the overall financial statement presentation. We believe that our audits, which included confirmation of securities at May 31, 2011 by correspondence with the custodian and brokers, provide a reasonable basis for our opinion.
PricewaterhouseCoopers LLP
Boston, Massachusetts
July 22, 2011
28
Federal Income Tax Information (Unaudited) – Columbia International Bond Fund
The Fund hereby designates as a capital gain dividend with respect to the fiscal year ended May 31, 2011, $7,792, or, if subsequently determined to be different, the net capital gain of such year.
29
Fund Governance
The Trustees serve terms of indefinite duration. The names, addresses and birth years of the Trustees and Officers of the Funds in Columbia Funds Series Trust I, the year each was first elected or appointed to office, their principal business occupations during at least the last five years, the number of Funds overseen by each Trustee and other directorships they hold are shown below, as of May 2, 2011. Each officer listed below serves as an officer of each Fund in Columbia Funds Series Trust I.
Independent Trustees
| | |
Name, Address and Year of Birth,
Position with Funds, Year First
Elected or Appointed to Office | | Principal Occupation(s) During Past Five Years, Number of Funds in Columbia Funds
Complex Overseen by Trustee, Other Directorships Held |
| |
| Rodman L. Drake (born 1943) | | |
c/o Columbia Management Investment Advisers, LLC 225 Franklin Street Boston, MA 02110 Trustee (since 1994) and Chairman of the Board (since 2009) | | Independent consultant since 2010; Co-Founder of Baringo Capital LLC (private equity) from 1997 to 2008; CEO of Crystal River Capital, Inc. (real estate investment trust) from 2003 to 2010; Oversees 43; Jackson Hewitt Tax Service Inc. (tax preparation services); Celgene Corporation (global biotechnology company); Student Loan Corporation (student loan provider); Celgene Corporation (global biotechnology company); the Helios Funds (exchange-traded funds); Crystal River Capital, Inc. from 2005 to 2010; Parsons Brinckerhoff from 1995 to 2008; and Apex Silver Mines Ltd. from 2007 to 2009 |
| |
| Douglas A. Hacker (born 1955) | | |
c/o Columbia Management Investment Advisers, LLC 225 Franklin Street Boston, MA 02110 Trustee (since 1996) | | Independent business executive since May 2006; Executive Vice President–Strategy of United Airlines (airline) from December 2002 to May 2006; President of UAL Loyalty Services (airline marketing company) from September 2001 to December 2002; Executive Vice President and Chief Financial Officer of United Airlines from July 1999 to September 2001. Oversees 43; Nash Finch Company (food distributor); Aircastle Limited (aircraft leasing); and SeaCube Container Leasing Ltd (container leasing) |
|
| Janet Langford Kelly (born 1957) |
c/o Columbia Management Investment Advisers, LLC 225 Franklin Street Boston, MA 02110 Trustee (since 1996) | | Senior Vice President, General Counsel and Corporate Secretary, ConocoPhillips (integrated energy company) since September 2007; Deputy General Counsel–Corporate Legal Services, ConocoPhillips from August 2006 to August 2007; Partner, Zelle, Hofmann, Voelbel, Mason & Gette LLP (law firm) from March 2005 to July 2006; Adjunct Professor of Law, Northwestern University, from September 2004 to June 2006; Director, UAL Corporation (airline) from February 2006 to July 2006; Oversees 43; None |
|
| William E. Mayer (born 1940) |
c/o Columbia Management Investment Advisers, LLC 225 Franklin Street Boston, MA 02110 Trustee (since 1994) | | Partner, Park Avenue Equity Partners (private equity) since February 1999; Dean and Professor, College of Business and Management, University of Maryland from 1992 to 1996. Oversees 43; DynaVox Inc. (software developer); Lee Enterprises (print media), WR Hambrecht + Co. (financial service provider); BlackRock Kelso Capital Corporation (investment company) |
30
Fund Governance (continued)
Independent Trustees (continued)
| | |
Name, Address and Year of Birth,
Position with Funds, Year First
Elected or Appointed to Office | | Principal Occupation(s) During Past Five Years, Number of Funds in Columbia Funds
Complex Overseen by Trustee, Other Directorships Held |
| |
| David M. Moffett (born 1952) | | |
c/o Columbia Management Investment Advisers, LLC 225 Franklin Street Boston, MA 02110 Trustee (since 2011) | | Retired. Chief Executive Officer, Federal Home Loan Mortgage Corporation, from 2008 to 2009; Senior Adviser, Global Financial Services Group, Carlyle Group, Inc., from 2007 to 2008; Vice Chairman and Chief Financial Officer, U.S. Bancorp, from 1993 to 2007. Oversees 43; CIT Group Inc. (commercial and consumer finance), eBay Inc. (online trading community), MBIA Corp (financial service provider), E.W. Scripps Co. (print and television media), Building Materials Holding Corp. (building materials and construction services), and University of Oklahoma Foundation. |
| |
| Charles R. Nelson (born 1942) | | |
c/o Columbia Management Investment Advisers, LLC 225 Franklin Street Boston, MA 02110 Trustee (since 1981) | | Professor of Economics, University of Washington, since January 1976; Ford and Louisa Van Voorhis Professor of Political Economy, University of Washington, since September 1993; Adjunct Professor of Statistics, University of Washington, since September 1980; Associate Editor, Journal of Money Credit and Banking from 1993 to 2008; consultant on econometric and statistical matters. Oversees 43; None |
| |
| John J. Neuhauser (born 1943) | | |
c/o Columbia Management Investment Advisers, LLC 225 Franklin Street Boston, MA 02110 Trustee (since 1984) | | President, Saint Michael’s College, since August 2007; Director or Trustee of several non-profit organization, including Fletcher Allen Health Care, Inc.; University Professor, Boston College from November 2005 to August 2007; Academic Vice President and Dean of Faculties, Boston College from August 1999 to October 2005. Oversees 43; Liberty All-Star Equity Fund and Liberty All-Star Growth Fund, Inc. (closed-end funds) |
| |
| Patrick J. Simpson (born 1944) | | |
c/o Columbia Management Investment Advisers, LLC 225 Franklin Street Boston, MA 02110 Trustee (since 2000) | | Partner, Perkins Coie LLP (law firm). Oversees 43; None |
| |
| Anne-Lee Verville (born 1945) | | |
c/o Columbia Management Investment Advisers, LLC 225 Franklin Street Boston, MA 02110 Trustee (since 1998) | | Retired since 1997 (formerly General Manager–Global Education Industry from 1994 to 1997, President–Application Systems Division from 1991 to 1994, Chief Financial Officer–US Marketing & Services from 1988 to 1991, and Chief Information Officer from 1987 to 1988, IBM Corporation (computer and technology)). Oversees 43; Enesco Group, Inc. (producer of giftware and home and garden decor products) from 2001 to 2006 |
31
Fund Governance (continued)
Interested Trustee
| | |
Name, Address and Year of Birth,
Position with Funds, Year First
Elected or Appointed to Office | | Principal Occupation(s) During Past Five Years, Number of Funds in Columbia Funds
Complex Overseen by Trustee, Other Directorships Held |
| |
| Michael A. Jones (born 1959) | | |
c/o Columbia Management Investment Advisers, LLC 225 Franklin Street Boston, MA 02110 Trustee (since 2011) Senior Vice President (since 2011) | | President and Director, Columbia Management Investment Advisers, LLC since May 2010; President and Director, Columbia Management Investment Distributors, Inc. since May 2010; Manager, Chairman, Chief Executive Officer and President, Columbia Management Advisors, LLC from 2007 to April 2010; Chief Executive Officer, President and Director, Columbia Management Distributors, Inc. from November 2006 to April 2010; previously, co-president and senior managing director at Robeco Investment Management. Oversees 43; None |
The Statement of Additional Information includes additional information about the Trustees of the Funds and is available, without charge, upon request by calling 1-800-345-6611.
32
Fund Governance (continued)
Officers
| | |
| Name, Year of birth and address | | Principal occupation(s) during the past five years |
|
| J. Kevin Connaughton (born 1964) |
225 Franklin Street Boston, MA 02110 President (since 2009) | | Senior Vice President and General Manager–Mutual Fund Products, Columbia Management Investment Advisers, LLC since May 2010; President, Columbia Funds, since 2009, and RiverSource Funds, since May 2010 (previously Senior Vice President and Chief Financial Officer, Columbia Funds, from June 2008 to January 2009, Treasurer, Columbia Funds, from October 2003 to May 2008, and senior officer of various other affiliated funds since 2000); Managing Director, Columbia Management Advisors, LLC from December 2004 to April 2010. |
| |
| Michael G. Clarke (born 1969) | | |
225 Franklin Street Boston, MA 02110 Treasurer (since 2011) and Chief Financial Officer (since 2009) | | Vice President, Columbia Management Investment Advisers, LLC since May 2010; Managing Director of Fund Administration, Columbia Management Advisors, LLC, from September 2004 to April 2010; senior officer of Columbia Funds and affiliated funds since 2002. |
| |
| Scott R. Plummer (born 1959) | | |
5228 Ameriprise Financial Center Minneapolis, MN 55474 Senior Vice President, Assistant Secretary and Chief Legal Officer (since 2010) | | Chief Legal Officer and Assistant Secretary, Columbia Management Investment Advisers, LLC since June 2005; Vice President and Lead Chief Counsel–Asset Management, Ameriprise Financial, Inc. since May 2010 (previously Vice President and Chief Counsel–Asset Management, from 2005 to April 2010, and Vice President–Asset Management Compliance from 2004 to 2005); Vice President, Chief Counsel and Assistant Secretary, Columbia Management Investment Distributors, Inc. since 2008; Vice President, General Counsel and Secretary, Ameriprise Certificate Company since 2005; Chief Counsel, RiverSource Distributors, Inc. since 2006; Vice President, General Counsel and Secretary, RiverSource Funds, since December 2006; Senior Vice President, Secretary and Chief Legal Officer, Columbia Funds, since May 2010. |
| |
| Linda J. Wondrack (born 1964) | | |
225 Franklin Street Boston, MA 02110 Senior Vice President and Chief Compliance Officer (since 2007) | | Vice President and Chief Compliance Officer, Columbia Management Investment Advisers, LLC since May 2010; Chief Compliance Officer, Columbia Funds, since 2007, and RiverSource Funds, since May 2010; Director (Columbia Management Group, LLC and Investment Product Group Compliance), Bank of America, from June 2005 to April 2010; Director of Corporate Compliance and Conflicts Officer of MFS Investment Management (investment management) from August 2004 to May 2005. |
| |
| William F. Truscott (born 1960) | | |
53600 Ameriprise Financial Center Minneapolis, MN 55474 Senior Vice President (since 2010) | | Chairman of the Board, Columbia Management Investment Advisers, LLC since May 2010 (previously President, Chairman of the Board and Chief Investment Officer, from 2001 to April 2010); Chief Executive Officer, U.S. Asset Management & President, Annuities, Ameriprise Financial, Inc. since May 2010 (previously President–U.S. Asset Management and Chief Investment Officer from 2005 to April 2010, and Senior Vice President–Chief Investment Officer, from 2001 to 2005); Director, President and Chief Executive Officer, Ameriprise Certificate Company since 2006; Director, Columbia Management Investment Distributors, Inc. since May 2010 (previously Chairman of the Board and Chief Executive Officer from 2008 to April 2010); Chairman of the Board and Chief Executive Officer, RiverSource Distributors, Inc. since 2006. |
33
Fund Governance (continued)
Officers (continued)
| | |
| Name, Year of birth and address | | Principal occupation(s) during the past five years |
|
| Colin Moore (born 1958) |
225 Franklin Street Boston, MA 02110 Senior Vice President (since 2010) | | Director and Chief Investment Officer, Columbia Management Investment Advisers, LLC since May 2010; Manager, Managing Director and Chief Investment Officer of Columbia Management Advisors, LLC from 2007 to April 2010; Head of Equities, Columbia Management Advisors, LLC from 2002 to 2007. |
| |
| Amy Johnson (born 1965) | | |
5228 Ameriprise Financial Center Minneapolis, MN 55474 Vice President (since 2010) | | Senior Vice President and Chief Operating Officer, Columbia Management Investment Advisers, LLC since May 2010 (previously Chief Administrative Officer, from 2009 until April 2010, Vice President–Asset Management and Trust Company Services, from 2006 to 2009, and Vice President–Operations and Compliance from 2004 to 2006). |
| |
| Joseph F. DiMaria (born 1968) | | |
225 Franklin Street Boston, MA 02110 Vice President (since 2011) and Chief Accounting Officer (since 2008) | | Vice President, Mutual Fund Administration, Columbia Management Investment Advisers, LLC, since May 2010; Director of Fund Administration, Columbia Management Advisors, LLC from January 2006 to April 2010; Head of Tax/Compliance and Assistant Treasurer, Columbia Management Advisors, LLC, from November 2004 to December 2005. |
| |
| Stephen T. Welsh (born 1957) | | |
225 Franklin Street Boston, MA 02110 Vice President (since 2006) | | President and Director, Columbia Management Investment Services Corp. since May 2010; President and Director, Columbia Management Services, Inc. from July 2004 to April 2010; Managing Director, Columbia Management Distributors, Inc. from August 2007 to April 2010. |
| |
| Paul D. Pearson (born 1956) | | |
5228 Ameriprise Financial Center Minneapolis, MN 55474 Vice President and Assistant Treasurer (since 2011) | | Vice President, Investment Accounting, Columbia Management Investment Advisers, LLC, since May 2010; Vice President, Managed Assets, Investment Accounting, Ameriprise Financial Corporation. |
| |
| Paul B. Goucher (born 1968) | | |
5228 Ameriprise Financial Center Minneapolis, MN 55474 Vice President and Assistant Secretary (since 2010) | | Vice President and Chief Counsel of Ameriprise Financial since January 2010 (formerly Vice President and Group Counsel from November 2008 to January 2010); Director, Managing Director and General Counsel of J. & W. Seligman & Co. Incorporated (Seligman) from July 2008 to November 2008 and Managing Director and Associate General Counsel of Seligman from January 2005 to July 2008. |
| |
| Christopher O. Petersen (born 1970) | | |
5228 Ameriprise Financial Center Minneapolis, MN 55474 Vice President (since 2010) and Secretary (since 2011) | | Vice President and Chief Counsel, Ameriprise Financial since January 2010 (formerly Vice President and Group Counsel or Counsel from April 2004 to January 2010); Assistant Secretary of RiverSource Funds since January 2007. |
| |
| Michael E. DeFao (born 1968) | | |
5228 Ameriprise Financial Center Minneapolis, MN 55474 Vice President and Assistant Secretary (since 2011) | | Vice President and Chief Counsel, Ameriprise Financial since May 2010; Associate General Counsel Bank of America from June 2005 to April 2010. |
34
Shareholder Meeting Results
At a Joint Special Meeting of Shareholders held on February 15, 2011, shareholders of Columbia International Bond Fund considered a proposal to approve a proposed amendment to the Investment Management Services Agreement with Columbia Management Investment Advisers, LLC. The proposal was approved as follows:
| | | | | | |
| | | | | | | |
| Votes For | | Votes Against | | Abstentions | | Broker Non-Votes |
| 13,835,257 | | 110,571 | | 9,247 | | 0 |
35
[THIS PAGE INTENTIONALLY LEFT BLANK]
36
Important Information About This Report
The fund mails one shareholder report to each shareholder address. If you would like more than one report, please call shareholder services at 1-800-345-6611 and additional reports will be sent to you. This report has been prepared for shareholders of Columbia International Bond Fund.
A description of the policies and procedures that the fund uses to determine how to vote proxies and a copy of the fund’s voting records are available (i) at www.columbiamanagement.com, (ii) on the Securities and Exchange Commission’s website at www.sec.gov, and (iii) without charge, upon request, by calling 1-800-368-0346. Information regarding how the fund voted proxies relating to portfolio securities during the 12-month period ended June 30 is available from the SEC’s website. Information regarding how the fund voted proxies relating to portfolio securities is also available from the fund’s website, www.columbiamanagement.com.
The fund files a complete schedule of portfolio holdings with the SEC for the first and third quarters of each fiscal year on Form N-Q. The fund’s Form N-Q is available on the SEC’s website at www.sec.gov and may be reviewed and copied at the SEC’s Public Reference Room in Washington, D.C. Information on the operation of the Public Reference Room may be obtained by calling
1-800-SEC-0330.
Transfer Agent
Columbia Management Investment Services Corp.
P.O. Box 8081
Boston, MA 02266-8081
1-800-345-6611
Distributor
Columbia Management Investment
Distributors, Inc.
225 Franklin Street Boston, MA 02110
Investment Manager
Columbia Management Investment Advisers, LLC
225 Franklin Street Boston, MA 02110
37

Columbia International Bond Fund
P.O. Box 8081
Boston, MA 02266-8081
columbiamanagement.com
This information is for use with concurrent or prior delivery of a fund prospectus. Investors should consider the investment objectives, risks, charges and expenses of a mutual fund carefully before investing. For a free prospectus, which contains this and other important information about the funds, visit columbiamanagement.com. Read the prospectus carefully before investing. The Fund is distributed by Columbia Management Investment Distributors, Inc., member FINRA, and managed by Columbia Management Investment Advisers, LLC.
©2011 Columbia Management Investment Advisers, LLC. All rights reserved.
C-1046 C (07/11)
Item 2. Code of Ethics.
(a) The registrant has adopted a code of ethics that applies to the registrant’s principal executive officer, principal financial officer, principal accounting officer or controller, or persons performing similar functions, regardless of whether these individuals are employed by the registrant or a third party.
(b) During the period covered by this report, there were not any amendments to a provision of the code of ethics adopted in 2(a) above.
(c) During the period covered by this report, there were no waivers, including any implicit waivers, from a provision of the code of ethics described in 2(a) above that relates to one or more of the items set forth in paragraph (b) of this item’s instructions.
Item 3. Audit Committee Financial Expert.
The registrant’s Board of Trustees has determined that Douglas A. Hacker, David M. Moffett, Charles R. Nelson and Anne-Lee Verville, each of whom are members of the registrant’s Board of Trustees and Audit Committee, each qualify as an audit committee financial expert. Mr. Hacker, Mr. Moffett, Mr. Nelson and Ms. Verville are each independent trustees, as defined in paragraph (a)(2) of this item’s instructions.
Item 4. Principal Accountant Fees and Services.
Fee information below is disclosed for the three series of the registrant whose report to stockholders are included in this annual filing.
(a) Audit Fees. Aggregate Audit Fees billed by the principal accountant for professional services rendered during the fiscal years ended May 31, 2011 and May 31, 2010 are approximately as follows:
2011 | | 2010 | |
$ | 129,800 | | $ | 138,900 | |
| | | | | |
Audit Fees include amounts related to the audit of the registrant’s annual financial statements or services that are normally provided by the accountant in connection with statutory and regulatory filings or engagements for those fiscal years. Fiscal year 2011
also includes audit fees for the review and provision of consent in connection with filing Form N-1A for new share classes.
(b) Audit-Related Fees. Aggregate Audit-Related Fees billed to the registrant by the principal accountant for professional services rendered during the fiscal years ended May 31, 2011 and May 31, 2010 are approximately as follows:
2011 | | 2010 | |
$ | 28,300 | | $ | 13,800 | |
| | | | | |
Audit-Related Fees include amounts for assurance and related services by the principal accountant that are reasonably related to the performance of the audit of the registrant’s financial statements and are not reported in Audit Fees above. In both fiscal years 2011 and 2010, Audit-Related Fees consist of agreed-upon procedures performed for semi-annual shareholder reports. Fiscal year 2011 also includes Audit-Related Fees for agreed- upon procedures related to fund mergers and fund accounting and custody conversions.
During the fiscal years ended May 31, 2011 and May 31, 2010, there were no Audit-Related Fees billed by the registrant’s principal accountant to the registrant’s investment adviser (not including any sub-adviser whose role is primarily portfolio management and is subcontracted with or overseen by another investment adviser) and any entity controlling, controlled by, or under common control with the adviser that provides ongoing services to the registrant for an engagement that related directly to the operations and financial reporting of the registrant.
(c) Tax Fees. Aggregate Tax Fees billed by the principal accountant to the registrant for professional services rendered during the fiscal years ended May 31, 2011 and May 31, 2010 are approximately as follows:
2011 | | 2010 | |
$ | 15,700 | | $ | 15,300 | |
| | | | | |
Tax Fees include amounts for the review of annual tax returns, the review of required shareholder distribution calculations and typically include amounts for professional services by the principal accountant for tax compliance, tax advice and tax planning.
During the fiscal years ended May 31, 2011 and May 31, 2010, there were no Tax Fees billed by the registrant’s principal accountant to the registrant’s investment adviser (not including any sub-adviser whose role is primarily portfolio management and is subcontracted with or overseen by another investment adviser) and any entity controlling, controlled by, or under common control with the adviser that provides ongoing services to the registrant for an engagement that related directly to the operations and financial reporting of the registrant.
(d) All Other Fees. Aggregate All Other Fees billed by the principal accountant to the registrant for professional services rendered during the fiscal years ended May 31, 2011 and May 31, 2010 are approximately as follows:
All Other Fees include amounts for products and services provided by the principal accountant, other than the services reported in paragraphs (a) through (c) above.
Aggregate All Other Fees billed by the registrant’s principal accountant to the registrant’s investment adviser (not including any sub-adviser whose role is primarily portfolio management and is subcontracted with or overseen by another investment adviser) and any entity controlling, controlled by, or under common control with the adviser that provides ongoing services to the registrant for an engagement that related directly to the operations and financial reporting of the registrant during the fiscal years ended May 31, 2011 and May 31, 2010 are approximately as follows:
2011 | | 2010 | |
$ | 495,300 | | $ | 1,424,400 | |
| | | | | |
In both fiscal years 2011 and 2010, All Other Fees consist of fees billed for internal control examinations of the registrant’s transfer agent and investment advisor. Fiscal year 2010 also includes fees for agreed upon procedures related to the sale of the long-term asset management business and fees related to the review of revenue modeling schedules.
(e)(1) Audit Committee Pre-Approval Policies and Procedures
The registrant’s Audit Committee is required to pre-approve the engagement of the registrant’s independent accountants to provide audit and non-audit services to the registrant and non-audit services to its investment adviser (not including any sub-adviser whose role is primarily portfolio management and is subcontracted with or overseen by another investment adviser) or any entity controlling, controlled by or under common control with such investment adviser that provides ongoing services to the registrant (“Adviser Affiliates”), if the engagement relates directly to the operations and financial reporting of the registrant.
The Audit Committee has adopted a Policy for Engagement of Independent Accountants for Audit and Non-Audit Services (“Policy”). The Policy sets forth the understanding of the Audit Committee regarding the engagement of the registrant’s independent accountants to provide (i) audit and permissible audit-related, tax and other services to the registrant (collectively “Fund Services”); (ii) non-audit services to the registrant’s investment adviser (not including any sub-adviser whose role is primarily portfolio management and is subcontracted with or overseen by another investment adviser) and Adviser Affiliates, if the engagement relates directly to the operations or
financial reporting of a Fund (collectively “Fund-related Adviser Services”); and (iii) certain other audit and non-audit services to the registrant’s investment adviser (not including any sub-adviser whose role is primarily portfolio management and is subcontracted with or overseen by another investment adviser) and Adviser Affiliates. Unless a type of service receives general pre-approval under the Policy, it requires specific pre-approval by the Audit Committee if it is to be provided by the independent accountants. Pre-approval of non-audit services to the registrant, the registrant’s investment adviser (not including any sub-adviser whose role is primarily portfolio management and is subcontracted with or overseen by another investment adviser) and Adviser Affiliates may be waived provided that the “de minimis” requirements set forth under paragraph (c)(7)(i)(C) of Rule 2-01 of Regulation S-X are met.
Under the Policy, the Audit Committee may delegate pre-approval authority to any pre-designated member or members who are Independent Trustees/Directors. The member(s) to whom such authority is delegated must report, for informational purposes only, any pre-approval decisions to the Audit Committee at its next regular meeting. The Audit Committee’s responsibilities with respect to the pre-approval of services performed by the independent accountants may not be delegated to management.
The Policy requires the Fund Treasurer and/or Director of Board Administration to submit to the Audit Committee, on an annual basis, a schedule of the types of services that are subject to general pre-approval. The schedule(s) provide a description of each type of service that is subject to general pre-approval and, where possible, will provide estimated fee caps for each instance of providing each service. The Audit Committees will review and approve the types of services and review the projected fees for the next fiscal year and may add to, or subtract from, the list of general pre-approved services from time to time based on subsequent determinations. That approval acknowledges that the Audit Committee is in agreement with the specific types of services that the independent accountants will be permitted to perform.
The Fund Treasurer and/or Director of Board Administration shall report to the Audit Committee at each of its regular meetings regarding all Fund Services or Fund-related Adviser Services initiated since the last such report was rendered, including a general description of the services, actual billed and projected fees, and the means by which such Fund Services or Fund-related Adviser Services were pre-approved by the Audit Committee.
*****
(e)(2) The percentage of services described in paragraphs (b) through (d) of this Item approved pursuant to the “de minimis” exception under paragraph (c)(7)(i)(C) of Rule 2-01 of Regulation S-X during both fiscal years ended May 31, 2011 and May 31, 2010 was zero.
(f) Not applicable.
(g) The aggregate non-audit fees billed by the registrant’s accountant for services rendered to the registrant, and rendered to the registrant’s investment adviser (not including any sub-adviser whose role is primarily portfolio management and is subcontracted with or overseen by another investment adviser), and any entity controlling, controlled by, or under common control with the adviser that provides ongoing services to the registrant for the fiscal years ended May 31, 2011 and May 31, 2010 are approximately as follows:
2011 | | 2010 | |
$ | 539,300 | | $ | 1,453,500 | |
| | | | | |
(h) The registrant’s Audit Committee of the Board of Directors has considered whether the provision of non-audit services that were rendered to the registrant’s adviser (not including any sub-adviser whose role is primarily portfolio management and is subcontracted with or overseen by another investment adviser), and any entity controlling, controlled by, or under common control with the investment adviser that provides ongoing services to the registrant that were not pre-approved pursuant to paragraph (c)(7)(ii) of Rule 2-01 of Regulation S-X, is compatible with maintaining the principal accountant’s independence.
Item 5. Audit Committee of Listed Registrants.
Not applicable.
Item 6. Investments
(a) The registrant’s “Schedule I — Investments in securities of unaffiliated issuers” (as set forth in 17 CFR 210.12-12) is included in Item 1 of this Form N-CSR.
(b) Not applicable.
Item 7. Disclosure of Proxy Voting Policies and Procedures for Closed-End Management Investment Companies.
Not applicable.
Item 8. Portfolio Managers of Closed-End Management Investment Companies.
Not applicable.
Item 9. Purchases of Equity Securities by Closed-End Management Investment Company and Affiliated Purchasers.
Not applicable.
Item 10. Submission of Matters to a Vote of Security Holders.
There were no material changes to the procedures by which shareholders may recommend nominees to the registrant’s board of directors.
Item 11. Controls and Procedures.
(a) The registrant’s principal executive officer and principal financial officers, based on their evaluation of the registrant’s disclosure controls and procedures as of a date within 90 days of the filing of this report, have concluded that such controls and procedures are adequately designed to ensure that material information required to be disclosed by the registrant in Form N-CSR is accumulated and communicated to the registrant’s management, including the principal executive officer and principal financial officer, or persons performing similar functions, as appropriate to allow timely decisions regarding required disclosure.
(b) There was no change in the registrant’s internal control over financial reporting that occurred during the registrant’s second fiscal quarter of the period covered by this report that has materially affected, or is reasonably likely to materially affect, the registrant’s internal control over financial reporting.
Item 12. Exhibits.
(a)(1) Code of ethics required to be disclosed under Item 2 of Form N-CSR attached hereto as Exhibit 99.CODE ETH.
(a)(2) Certifications pursuant to Rule 30a-2(a) under the Investment Company Act of 1940 (17 CFR 270.30a-2(a)) attached hereto as Exhibit 99.CERT.
(a)(3) Not applicable.
(b) Certification pursuant to Rule 30a-2(b) under the Investment Company Act of 1940 (17 CFR 270.30a-2(b)) attached hereto as Exhibit 99.906CERT.
SIGNATURES
Pursuant to the requirements of the Securities Exchange Act of 1934 and the Investment Company Act of 1940, the registrant has duly caused this report to be signed on its behalf by the undersigned, thereunto duly authorized.
(registrant) | | Columbia Funds Series Trust I |
| |
| |
By (Signature and Title) | | /s/ J. Kevin Connaughton |
| J. Kevin Connaughton, President |
| |
| |
Date | | July 28, 2011 |
| | | | |
Pursuant to the requirements of the Securities Exchange Act of 1934 and the Investment Company Act of 1940, this report has been signed below by the following persons on behalf of the registrant and in the capacities and on the dates indicated.
By (Signature and Title) | | /s/ J. Kevin Connaughton |
| J. Kevin Connaughton, President |
| |
| |
Date | | July 28, 2011 |
| |
| |
By (Signature and Title) | | /s/ Michael G. Clarke |
| Michael G. Clarke, Chief Financial Officer |
| |
| |
Date | | July 28, 2011 |
| | | | |