UNITED STATES
SECURITIES AND EXCHANGE COMMISSION
Washington, D.C. 20549
FORM N-CSR
CERTIFIED SHAREHOLDER REPORT OF REGISTERED
MANAGEMENT INVESTMENT COMPANIES
Investment Company Act file number 811-04367
Columbia Funds Series Trust I
(Exact name of registrant as specified in charter)
One Financial Center, Boston, Massachusetts 02111
(Address of principal executive offices) (Zip code)
Scott R. Plummer
5228 Ameriprise Financial Center
Minneapolis, MN 55474
(Name and address of agent for service)
Registrant’s telephone number, including area code: 1-612-671-1947
Date of fiscal year end: December 31
Date of reporting period: December 31, 2010
Form N-CSR is to be used by management investment companies to file reports with the Commission not later than 10 days after the transmission to stockholders of any report that is required to be transmitted to stockholders under Rule 30e-1 under the Investment Company Act of 1940 (17 CFR 270.30e-1). The Commission may use the information provided on Form N-CSR in its regulatory, disclosure review, inspection, and policymaking roles.
A registrant is required to disclose the information specified by Form N-CSR, and the Commission will make this information public. A registrant is not required to respond to the collection of information contained in Form N-CSR unless the Form displays a currently valid Office of Management and Budget (“OMB”) control number. Please direct comments concerning the accuracy of the information collection burden estimate and any suggestions for reducing the burden to Secretary, Securities and Exchange Commission, 450 Fifth Street, NW, Washington, DC 20549-0609. The OMB has reviewed this collection of information under the clearance requirements of 44 U.S.C. § 3507.
Item 1. Reports to Stockholders.

Columbia Real Estate Equity Fund
Annual Report for the Period Ended December 31, 2010
Table of Contents
The views expressed in this report reflect the current views of the respective parties. These views are not guarantees of future performance and involve certain risks, uncertainties and assumptions that are difficult to predict, so actual outcomes and results may differ significantly from the views expressed. These views are subject to change at any time based upon economic, market or other conditions and the respective parties disclaim any responsibility to update such views. These views may not be relied on as investment advice and, because investment decisions for a Columbia Fund are based on numerous factors, may not be relied on as an indication of trading intent on behalf of any particular Columbia Fund. References to specific securities should not be construed as a recommendation or investment advice.
President’s Message

Dear Shareholder:
The Columbia Management story began over 100 years ago, and today, we are one of the nation’s largest dedicated asset managers. The recent acquisition by Ameriprise Financial, Inc. brings together the talents, resources and capabilities of Columbia Management with those of RiverSource Investments, Threadneedle (acquired by Ameriprise in 2003) and Seligman Investments (acquired by Ameriprise in 2008) to build a best-in-class asset management business that we believe is truly greater than its parts.
RiverSource Investments traces its roots to 1894 when its then newly-founded predecessor, Investors Syndicate, offered a face-amount savings certificate that gave small investors the opportunity to build a safe and secure fund for retirement, education or other special needs. A mutual fund pioneer, Investors Syndicate launched Investors Mutual Fund in 1940. In the decades that followed, its mutual fund products and services lineup grew to include a full spectrum of styles and specialties. More than 110 years later, RiverSource continues to be a trusted financial products leader.
Threadneedle, a leader in global asset management and one of Europe’s largest asset managers, offers sophisticated international experience from a dedicated U.K. management team. Headquartered in London, it is named for Threadneedle Street in the heart of the city’s financial district, where British investors pioneered international and global investing. Threadneedle was acquired in 2003 and today operates as an affiliate of Columbia Management.
Seligman Investments’ beginnings date back to the establishment of the investment firm J. & W. Seligman & Co. in 1864. In the years that followed, Seligman played a major role in the geographical expansion and industrial development of the United States. In 1874, President Ulysses S. Grant named Seligman as fiscal agent for the U.S. Navy — an appointment that would last through World War I. Seligman helped finance the westward path of the railroads and the building of the Panama Canal. The firm organized its first investment company in 1929 and began managing its first mutual fund in 1930. In 2008, J. & W. Seligman & Co. Incorporated was acquired and Seligman Investments became an offering brand of RiverSource Investments, LLC.
We are proud of the rich and distinctive history of these firms, the strength and breadth of products and services they offer, and the combined cultures of pioneering spirit and forward thinking. Together we are committed to providing more for our shareholders than ever before.
| n | | A singular focus on our shareholders. Our business is asset management, so investors are our first priority. We dedicate our resources to identifying timely investment opportunities and provide a comprehensive choice of equity, fixed-income and alternative investments to help meet your individual needs. |
| n | | First-class research and thought leadership. We are dedicated to helping you take advantage of today’s opportunities and anticipate tomorrow’s. We stay abreast of the latest investment trends and ideas, using our collective insight to evaluate events and transform them into solutions you can use. |
| n | | A disciplined investment approach. We aren’t distracted by passing fads. Our teams adhere to a rigorous investment process that helps ensure the integrity of our products and enables you and your financial advisor to match our solutions to your objectives with confidence. |
When you choose Columbia Management, you can be confident that we will take the time to understand your needs and help you and your financial advisor identify the solutions that are right for you. Because at Columbia Management, we don’t consider ourselves successful unless you are.
Sincerely,

J. Kevin Connaughton
President, Columbia Funds
Investors should consider the investment objectives, risks, charges and expenses of a mutual fund carefully before investing. For a free prospectus, which contains this and other important information about the funds, visit www.columbiamanagement.com. The prospectus should be read carefully before investing.
Columbia Funds are distributed by Columbia Management Investment Distributors, Inc., member FINRA, and managed by Columbia Management Investment Advisers, LLC.
© 2011 Columbia Management Investment Advisers, LLC. All rights reserved.
Fund Profile – Columbia Real Estate Equity Fund
Performance data quoted represents past performance and current performance may be lower or higher. Past performance is no guarantee of future results. The investment return and principal value will fluctuate so that shares, when redeemed, may be worth more or less than the original cost. Please visit www.columbiamanagement.com for daily and most recent month-end performance updates.
Summary
1-year return as of 12/31/10
| | |
| |
 | | +26.04% Class A shares (without sales charge) |
| |
| | +27.95% FTSE NAREIT Equity REITs Index |
Summary
| n | | For the 12-month period that ended December 31, 2010, the fund’s Class A shares returned 26.04% without sales charge. |
| n | | The fund’s return lagged its benchmark, the FTSE NAREIT Equity REITs Index,1 and the average return of the funds in its peer group, the Lipper Real Estate Funds Classification.2 |
| n | | The fund’s overweight in the office real estate group and an emphasis on lower-risk, more defensive stocks in the residential sector accounted for its modest shortfall to these comparative measures. |
Portfolio Management
Arthur Hurley has managed the fund since September 2006. From 2006 until joining Columbia Management Investment Advisers, LLC in May 2010, Mr. Hurley was associated with the fund’s previous adviser or its predecessors as an investment professional.
| 1 | The FTSE National Association of Real Estate Investment Trusts (NAREIT) Equity REITs Index tracks performance of all publicly traded equity real estate investment trusts (REITs). |
| 2 | Lipper Inc., a widely respected data provider in the industry, calculates an average total return (assuming reinvestment of distributions) for mutual funds with investment objectives similar to those of the fund. Lipper makes no adjustment for the effect of sales loads. |
Indices are not available for investment, are not professionally managed and do not reflect sales charges, fees, brokerage commissions, taxes or other expenses of investing. Securities in the fund may not match those in an index.
1
Economic Update – Columbia Real Estate Equity Fund
Summary
For the 12-month period that ended December 31, 2010
| | n | | The U.S. stock market, as measured by the S&P 500 Index, delivered solid returns, despite a summer correction. Emerging market stocks, as measured by the MSCI Emerging Markets Index (Net), outperformed U.S. stocks as well as stock markets in developed foreign markets, as measured by the MSCI EAFE Index (Net). | |
| | |
| S&P Index | | MSCI Emerging Markets Index |
| |

| |
|
15.06% | | 18.88% |
| | |
| MSCI EAFE Index | | |
| | |
| | |
| |
| | |
7.75% | | |
| | n | | Modest economic growth and relatively low interest rates boosted bond market returns until the final months of the period. The Barclays Capital Aggregate Bond Index delivered solid results. High-yield bonds was the leading fixed-income sector, as measured by the JPMorgan Developed BB High Yield Index. | |
| | |
| Barclays Aggregate Index | | JPMorgan Index |
| |
| |
|
6.54% | | 12.86% |
The U.S. economy expanded at a modest pace in 2010, as measured by gross domestic product (GDP). Yet, growth was strong enough to allay fears of a relapse into recession. GDP expanded by 3.7% in the first quarter of 2010, 1.7% in the second quarter, 2.6% in the third quarter and 3.2% in the fourth quarter. With the Federal Reserve Board providing additional monetary stimulus to shore up economic growth and the extension of key tax cuts for the next two years, economists are revising 2011 expectations upward. In addition, there is evidence that consumers are starting to feel more confident. Even though job growth has not met expectations, the unemployment rate fell to 9.4% in December.
Consumer spending on cars, clothing and other goods generally trended higher throughout the year. Holiday spending rose 5.5% between November 5 and December 24, in all retail categories, excluding automobiles, compared with the same period in 2009, according to MasterCard Advisors’ SpendingPulse, which tracks spending on all transactions including cash. Analysts say that an increase in personal savings and a decline in consumer debt gave consumers confidence to spend a little more this year. The personal savings rate edged higher, ending November, the last month for which data was available, at 5.7%. Personal income also increased modestly during the year.
News on the job front was mostly positive in 2010. A good portion of the jobs added in March, April and May were temporary, government-sponsored census positions, which began to unwind in June, July and August. However, private sector payroll employment trended modestly higher, massive layoffs declined and job growth turned solidly positive, with the addition of 384,000 new jobs in the last quarter of the year.
Despite some glimmers of improvement early in the year, the housing market remained troublesome. Both new and existing home sales fell after a federal tax credit for new and repeat homebuyers expired. Distressed properties pressured prices. And foreclosures continued — another drag on prices. The inventory of unsold new homes rose from 7.2 months to 10.5 months over the one-year period, according to the National Association of Realtors, raising concerns that a meaningful turnaround in housing could remain elusive for months to come.
Reports from the business side of the economy were generally positive. A key measure of the nation’s manufacturing situation — the Institute for Supply Management’s Index — took a somewhat surprising turn higher in the final months of the period. Industrial production was disappointingly flat at year end, while the amount of manufacturing capacity utilized — a key measure of the health of the manufacturing sector — inched higher.
Stocks moved higher despite summer setback
Against a strengthening economic backdrop, a stock market rally that began early in 2009 continued into 2010 despite a summer setback linked to a debt crisis brewing in Europe, which raised concerns among U.S. investors. These fears were short-lived and stocks regained their footing in September 2010, moving higher through the end of the year.
2
Economic Update (continued) – Columbia Real Estate Equity Fund
The S&P 500 Index1 returned 15.06% for the 12-month period. Outside the United States, stock market returns were mixed. The MSCI EAFE Index (Net),2 a broad gauge of stock market performance in foreign developed markets, returned 7.75% (in U.S. dollars) for the period, as concerns about the impact of a bailout for weak euro zone economies weighed on the markets. Emerging stock markets were more resilient. The MSCI Emerging Markets Index (Net)3 returned 18.88% (in U.S. dollars) for the
12-month period.
Bonds delivered solid returns
As the economy strengthened, bonds delivered solid returns. The Barclays Capital Aggregate Bond Index4 returned 6.54%. The high-yield bond market led the fixed-income markets. For the 12 months covered by this report, the JPMorgan Developed BB High Yield Index5 returned 12.86%. Despite rising yields in the second half of the year, the Treasury market was also positive. The Barclays Capital U.S. Treasury Index6 returned 5.87%. However, municipal bonds struggled in the final months of the period, as interest rates inched higher and issue supply surged ahead of the expiration of the Buy America Bonds program. Nevertheless, the Barclays Capital Municipal Bond Index7 gained 2.38% for the period. Despite positive economic activity, the Federal Reserve Board (the Fed) kept a key short-term interest rate — the federal funds rate — close to zero.
Past performance is no guarantee of future results.
| 1 | The Standard & Poor’s (S&P) 500 Index tracks the performance of 500 widely held, large-capitalization U.S. stocks. |
| 2 | The Morgan Stanley Capital International Europe, Australasia, Far East (MSCI EAFE) Index (Net) is a free float- adjusted market capitalization index that is designed to measure the equity market performance of developed markets, excluding the U.S. & Canada. As of May 27, 2010, the MSCI EAFE Index (Net) consisted of the following 22 developed market country indices: Australia, Austria, Belgium, Denmark, Finland, France, Germany, Greece, Hong Kong, Ireland, Israel, Italy, Japan, the Netherlands, New Zealand, Norway, Portugal, Singapore, Spain, Sweden, Switzerland and the United Kingdom. |
| 3 | The Morgan Stanley Capital International Emerging Markets (MSCI EM) Index (Net) is a free float-adjusted market capitalization index that is designed to measure equity market performance of emerging markets. As of May 27, 2010, the MSCI EM Index (Net) consisted of the following 21 emerging market country indices: Brazil, Chile, China, Colombia, Czech Republic, Egypt, Hungary, India, Indonesia, Korea, Malaysia, Mexico, Morocco, Peru, Philippines, Poland, Russia, South Africa, Taiwan, Thailand and Turkey. |
| 4 | The Barclays Capital Aggregate Bond Index is a market value-weighted index that tracks the daily price, coupon, pay-downs and total return performance of fixed-rate, publicly placed, dollar-denominated and non-convertible investment grade debt issues with at least $250 million par amount outstanding and with at least one year to final maturity. |
| 5 | The JPMorgan Developed BB High Yield Index is an unmanaged index designed to mirror the investable universe of the U.S. dollar developed, BB-rated, high yield corporate debt market. |
| 6 | The Barclays Capital U.S. Treasury Index includes public obligations of the U.S. Treasury. Treasury bills are excluded by the maturity constraint. In addition, certain special issues, such as state and local government series bonds (SLGs), as well as U.S. Treasury TIPS, are excluded. STRIPS are excluded from the index because their inclusion would result in double-counting. |
| 7 | The Barclays Capital Municipal Bond Index is considered representative of the broad market for investment-grade, tax-exempt bonds with a maturity of at least one year. |
Indices are not available for investment, are not professionally managed and do not reflect sales charges, fees, brokerage commissions, taxes or other expenses of investing. Securities in the fund may not match those in an index.
3
Performance Information – Columbia Real Estate Equity Fund
Performance data quoted represents past performance and current performance may be lower or higher. Past performance is no guarantee of future results. The investment return and principal value will fluctuate so that shares, when redeemed, may be worth more or less than the original cost. Please visit www.columbiamanagement.com for daily and most recent month-end performance updates.
| | | | |
| Net asset value per share as of | |
| |
12/31/10 ($) | | | | |
Class A | | | 12.41 | |
Class B | | | 12.43 | |
Class C | | | 12.40 | |
Class I | | | 12.42 | |
Class R | | | 12.40 | |
Class W | | | 12.41 | |
Class Z | | | 12.43 | |
| Distributions declared per share | |
| |
01/01/10 – 12/31/10 ($) | | | | |
Class A | | | 0.26 | |
Class B | | | 0.18 | |
Class C | | | 0.18 | |
Class I | | | 0.12 | |
Class R | | | 0.10 | |
Class W | | | 0.10 | |
Class Z | | | 0.29 | |
|
| Performance of a $10,000 investment 01/01/01 – 12/31/10 |
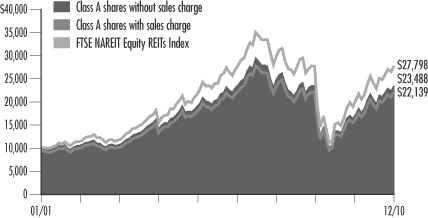
The chart above shows the change in value of a hypothetical $10,000 investment in Class A shares of Columbia Real Estate Equity Fund during the stated time period, and does not reflect the deduction of taxes that a shareholder may pay on fund distributions or on the redemption of fund shares.
| | | | | | | | |
Performance of a $10,000 investment 01/01/01 – 12/31/10 | |
| Sales charge | | without | | | with | |
Class A | | | 23,488 | | | | 22,139 | |
Class B | | | 22,124 | | | | 22,124 | |
Class C | | | 22,107 | | | | 22,107 | |
Class I | | | n/a | | | | n/a | |
Class R | | | n/a | | | | n/a | |
Class W | | | n/a | | | | n/a | |
Class Z | | | 24,035 | | | | n/a | |
| | | | | | | | | | | | | | | | | | | | | | | | | | | | | | | | | | | | | | | | |
| Average annual total return as of 12/31/10 (%) | |
| Share class | | A | | | B | | | C | | | I | | | R | | | W | | | Z | |
| Inception | | 11/01/02 | | | 11/01/02 | | | 10/13/03 | | | 9/27/10 | | | 9/27/10 | | | 9/27/10 | | | 04/01/94 | |
| Sales charge | | without | | | with | | | without | | | with | | | without | | | with | | | without | | | without | | | without | | | without | |
1-year | | | 26.04 | | | | 18.84 | | | | 25.07 | | | | 20.07 | | | | 25.02 | | | | 24.02 | | | | n/a | | | | n/a | | | | n/a | | | | 26.29 | |
5-year | | | 2.77 | | | | 1.56 | | | | 2.01 | | | | 1.83 | | | | 2.01 | | | | 2.01 | | | | n/a | | | | n/a | | | | n/a | | | | 3.03 | |
10-year/Life | | | 8.91 | | | | 8.27 | | | | 8.26 | | | | 8.26 | | | | 8.26 | | | | 8.26 | | | | 6.52 | | | | 6.36 | | | | 6.51 | | | | 9.17 | |
The “with sales charge” returns include the maximum initial sales charge of 5.75% for Class A shares and the applicable contingent deferred sales charge of 5.00% in the first year, declining to 1.00% in the sixth year, and eliminated thereafter for Class B shares and 1.00% for Class C shares in the first year only. The “without sales charge” returns do not include the effect of sales charges. If they had, returns would be lower.
Performance results reflect any fee waivers or reimbursements of fund expenses by the investment adviser and/or any of its affiliates. Absent these fee waivers or expense reimbursement arrangements, performance results would have been lower.
All results shown assume reinvestment of distributions. Class I and Z shares are sold at net asset value with no distribution and service (Rule 12b-1) fees. Class R and W shares are sold at net asset value with a distribution (12b-1) fee. Class I, R, W, and Z shares have limited eligibility and the investment minimum requirements may vary. Please see the fund’s prospectuses for details. Performance for different share classes will vary based on differences in sales charges and fees associated with each class.
The tables do not reflect the deduction of taxes that a shareholder may pay on fund distributions or on the redemption of fund shares.
Class A, Class B and Class C are newer classes of shares. Class A and Class B share performance information includes the returns of Class Z shares (the oldest existing share class) for periods prior to their inception. Class C share performance information includes returns of Class B shares for the period from November 1, 2002 through October 12, 2003, and the returns of Class Z shares for periods prior thereto. These returns reflect differences in sales charges, but have not been restated to reflect any differences in expenses (such as distribution and service (Rule 12b-1) fees) between Class Z shares and the newer classes of shares. If differences in expenses had been reflected, the returns shown for periods prior to the inception of the newer classes of shares would have been lower, since the newer classes of shares are subject to distribution and service (Rule 12b-1) fees. Class A and Class B shares were initially offered on November 1, 2002, Class C shares were initially offered on October 13, 2003, Class I, Class R and Class W shares were initially offered on September 27, 2010, and Class Z shares were initially offered on April 1, 1994.
4
Understanding Your Expenses – Columbia Real Estate Equity Fund
Estimating your actual expenses
To estimate the expenses that you paid over the period, first you will need your account balance at the end of the period:
| | n | | For shareholders who receive their account statements from Columbia Management Investment Services Corp., your account balance is available online at www.columbiamanagement.com or by calling Shareholder Services at 800.345.6611. | |
| | n | | For shareholders who receive their account statements from their financial intermediary, contact your financial intermediary to obtain your account balance. | |
| | 1. | Divide your ending account balance by $1,000. For example, if an account balance was $8,600 at the end of the period, the result would be 8.6. | |
| | 2. | In the section of the table below titled “Expenses paid during the period,” locate the amount for your share class. You will find this number in the column labeled “Actual.” Multiply this number by the result from step 1. Your answer is an estimate of the expenses you paid on your account during the period. | |
If the value of your account falls below the minimum initial
investment requirement applicable to you, your account may be subject to a $20 annual fee. This fee is not included in the accompanying table. If you are subject to the fee, keep it in mind when you are estimating the ongoing expenses of investing in the fund and when comparing the expenses of this fund with other funds.
As a fund shareholder, you incur two types of costs. There are transaction costs, which generally include sales charges on purchases and may include redemption fees or exchange fees. There are also ongoing costs, which generally include investment advisory fees, distribution and service (Rule 12b-1) fees and other fund expenses. The information on this page is intended to help you understand the ongoing costs of investing in the fund and to compare these costs with the ongoing costs of investing in other mutual funds.
Analyzing your fund’s expenses by share class
To illustrate these ongoing costs, we have provided an example and calculated the expenses paid by investors in each share class during the period. The information in the following table is based on an initial investment of $1,000, which is invested at the beginning of the period and held for the entire period. Expense information is calculated two ways and each method provides you with different information. The amount listed in the “Actual” column is calculated using the fund’s actual operating expenses and total return for the period. The amount listed in the “Hypothetical” column for each share class assumes that the return each year is 5% before expenses and is calculated based on the fund’s actual operating expenses. You should not use the hypothetical account values and expenses to estimate either your actual account balance at the end of the period or the expenses you paid during this period.
Compare with other funds
Since all mutual funds are required to include the same hypothetical calculations about expenses in shareholder reports, you can use this information to compare the ongoing costs of investing in the fund with other funds. To do so, compare the 5% hypothetical example with the 5% hypothetical examples that appear in the shareholder reports of other funds. As you compare hypothetical examples of other funds, it is important to note that hypothetical examples are meant to highlight the ongoing costs of investing in a fund and do not reflect any transaction costs, such as sales charges, redemption fees or exchange fees.
| | | | | | | | | | | | | | | | | | | | | | | | | | | | |
| 07/01/10 – 12/31/10 | |
| | | | |
| | | Account value at the
beginning of the period ($) | | | Account value at the end of the period ($) | | | Expenses paid during the period ($) | | | Fund’s annualized
expense ratio (%) | |
| | | Actual | | | Hypothetical | | | Actual | | | Hypothetical | | | Actual | | | Hypothetical | | | Actual | |
Class A | | | 1,000.00 | | | | 1,000.00 | | | | 1,199.30 | | | | 1,018.70 | | | | 7.15 | | | | 6.56 | | | | 1.29 | |
Class B | | | 1,000.00 | | | | 1,000.00 | | | | 1,194.50 | | | | 1,014.92 | | | | 11.28 | | | | 10.36 | | | | 2.04 | |
Class C | | | 1,000.00 | | | | 1,000.00 | | | | 1,193.90 | | | | 1,014.92 | | | | 11.28 | | | | 10.36 | | | | 2.04 | |
Class I | | | 1,000.00 | | | | 1,000.00 | | | | 1,065.20 | * | | | 1,020.37 | | | | 2.58 | * | | | 4.89 | | | | 0.96 | |
Class R | | | 1,000.00 | | | | 1,000.00 | | | | 1,063.60 | * | | | 1,016.33 | | | | 4.73 | * | | | 8.94 | | | | 1.76 | |
Class W | | | 1,000.00 | | | | 1,000.00 | | | | 1,065.10 | * | | | 1,019.06 | | | | 3.28 | * | | | 6.21 | | | | 1.22 | |
Class Z | | | 1,000.00 | | | | 1,000.00 | | | | 1,200.40 | | | | 1,019.96 | | | | 5.77 | | | | 5.30 | | | | 1.04 | |
Expenses paid during the period are equal to the annualized expense ratio for the share class, multiplied by the average account value over the period, then multiplied by the number of days in the fund’s most recent fiscal half-year and divided by 365.
It is important to note that the expense amounts shown in the table are meant to highlight only ongoing costs of investing in the fund and do not reflect any transaction costs, such as sales charges, redemption fees or exchange fees. Therefore, the hypothetical examples provided may not help you determine the relative total costs of owning shares of different funds. If these transaction costs were included, your costs would have been higher.
| * | For the period September 27, 2010 through December 31, 2010. Class I, Class R and Class W shares commenced operations on September 27, 2010. |
5
Portfolio Manager’s Report – Columbia Real Estate Equity Fund
Performance data quoted represents past performance and current performance may be lower or higher. Past performance is no guarantee of future results. The investment return and principal value will fluctuate so that shares, when redeemed, may be worth more or less than the original cost. Please visit www.columbiamanagement.com for daily and most recent month-end performance updates.
| | | | |
| Top 10 holdings | | | |
| |
as of 12/31/10 (%) | | | | |
Simon Property Group, Inc. | | | 8.1 | |
Health Care REIT, Inc. | | | 5.6 | |
Alexandria Real Estate Equities, Inc. | | | 5.0 | |
Entertainment Properties Trust | | | 4.3 | |
ProLogis | | | 4.2 | |
Equity Lifestyle Properties, Inc. | | | 4.0 | |
Duke Realty Corp. | | | 4.0 | |
National Retail Properties, Inc. | | | 4.0 | |
Mid-America Apartment Communities, Inc. | | | 3.4 | |
AvalonBay Communities, Inc. | | | 3.4 | |
| | | | |
| Top sectors | | | |
| |
as of 12/31/10 (%) | | | | |
Retail REITs | | | 27.0 | |
Specialized REITs | | | 21.4 | |
Residential REITs | | | 20.5 | |
Office REITs | | | 15.4 | |
Hotel Resorts & Cruise Lines | | | 5.6 | |
Industrial REITs | | | 5.5 | |
Diversified REITs | | | 2.2 | |
Leisure Facilities | | | 1.1 | |
Real Estate Services | | | 1.0 | |
The fund is actively managed and the composition of its portfolio will change over time. Information provided is calculated as a percentage of net assets.
Portfolio Manager’s Report
For the 12-month period that ended December 31, 2010, the fund’s Class A shares returned 26.04% without sales charge. The fund’s benchmark, the FTSE NAREIT Equity REITs Index, returned 27.95%. The average return of the fund’s peer group, the Lipper Real Estate Funds Classification, was 27.60%. In a favorable environment for real estate investment trusts (REITs), the fund achieved solid positive returns. It trailed its benchmark by a small margin due to an overweight in the office group as well as its emphasis on lower-risk, slower-growth properties in the residential sector, which lagged as the economic outlook brightened.
Strengthening economy boosted real estate sector
Signs of an improving economy helped support real estate investments in 2010, in general, but particularly in areas where rental income tends to respond more quickly to a changing environment, such as for lodging institutions and apartments. These shorter-lease properties were among the segment’s best performers. Although the fund was underweight in the group, a position in Starwood Hotels & Resorts Worldwide, Inc. (1.5% of net assets) boosted performance. Starwood gained greater pricing power in setting nightly room rates as the economic climate improved and demand increased. A position in CBL & Associates Properties, Inc. (1.8% of net assets), owner and operator of shopping malls, also benefited from improved utilization rates and greater demand for retail space as consumer spending increased. The fund had less exposure than the benchmark to diversified and industrial REITs, which also helped performance when those groups were hurt by deteriorating rent trends.
A sizeable position in the office sector detracted from performance as investors shifted away from longer-lease duration assets to shorter-lease duration assets, such as lodging and apartments. Stock selection within the residential sector also hurt performance as lower risk, lower growth stocks underperformed their higher-growth peers. In this regard, an overweight relative to the benchmark in Equity Lifestyle Properties, Inc. (4.0% of net assets), an owner of manufactured home communities, detracted from relative performance. Although the stock gained ground, it underperformed the benchmark as investors favored names with exposure to residential markets that were perceived to offer greater growth opportunities. Nationwide Health Properties, Inc. (1.4% of net assets), a REIT that invests in long-term care and medical office facilities, also lost favor as investors traded defensive names for those with more exposure to the economic recovery.
Strategic effort to increase fund’s yield
Given the current environment of generally low interest rates, we sought to increase the dividend yield of the fund. Through security selection, we placed moderately more importance on the dividend yield of individual securities and sought out REITs with relatively low payout ratios and strong balance sheets.
Looking ahead: opportunities and risks
We anticipate continued improvements in the fundamental outlook for real estate investment trusts, given our expectation of a sustained expansion of the economy and
6
Portfolio Manager’s Report (continued) – Columbia Real Estate Equity Fund
improved conditions in the capital markets. Moreover, REITs have the advantage of lower capital costs and greater access to capital, compared to private real estate investors. Nevertheless, some challenges cloud the outlook. First, employment trends need to improve in order to sustain a widespread recovery in underlying REIT fundamentals. Second, any increase in interest rates could undermine property values and make other income-oriented investments appear more attractive. Given these mixed influences affecting real estate investing, we believe it makes sense to have exposure to both defensive properties and to growth-oriented real estate investments, with a tilt in favor of growth opportunities.
Portfolio characteristics and holdings are subject to change periodically and may not be representative of current characteristics and holdings. The outlook for the fund may differ from those presented for other Columbia Funds.
Equity securities are subject to stock market fluctuations that occur in response to economic and business developments.
The fund may be subject to the same types of risks associated with direct ownership of real estate, including the decline of property values due to general, local and regional economic conditions. In addition, the fund’s share price will likely be subject to more volatility than the overall stock market because it concentrates in real estate stocks.
7
Investment Portfolio – Columbia Real Estate Equity Fund
December 31, 2010
Common Stocks – 98.6%
| | | | | | | | |
| | | Shares | | | Value ($) | |
| Consumer Discretionary – 2.6% | |
| Hotels, Restaurants & Leisure – 2.6% | | | | | |
Starwood Hotels & Resorts Worldwide, Inc. | | | 94,552 | | | | 5,746,870 | |
Vail Resorts, Inc. (a) | | | 76,167 | | | | 3,963,731 | |
| | | | | | | | |
Hotels, Restaurants & Leisure Total | | | | 9,710,601 | |
| | | | | | | | |
Consumer Discretionary Total | | | | | | | 9,710,601 | |
| | | | | | | | |
| Financials – 96.0% | | | | | |
| Real Estate Investment Trusts (REITs) – 95.0% | |
Alexandria Real Estate Equities, Inc. | | | 259,200 | | | | 18,988,992 | |
AMB Property Corp. | | | 147,300 | | | | 4,670,883 | |
American Campus Communities, Inc. | | | 292,100 | | | | 9,277,096 | |
Apartment Investment & Management Co., Class A | | | 409,800 | | | | 10,589,232 | |
AvalonBay Communities, Inc. | | | 112,700 | | | | 12,684,385 | |
Boardwalk Real Estate Investment Trust CAD (b) | | | 151,137 | | | | 6,270,141 | |
Boston Properties, Inc. | | | 70,036 | | | | 6,030,100 | |
CBL & Associates Properties, Inc. | | | 376,104 | | | | 6,581,820 | |
Cousins Properties, Inc. | | | 989,800 | | | | 8,254,932 | |
Developers Diversified Realty Corp. | | | 600,000 | | | | 8,454,000 | |
DiamondRock Hospitality Co. (a) | | | 892,100 | | | | 10,705,200 | |
Digital Realty Trust, Inc. | | | 198,850 | | | | 10,248,729 | |
Douglas Emmett, Inc. | | | 431,300 | | | | 7,159,580 | |
Duke Realty Corp. | | | 1,216,000 | | | | 15,151,360 | |
Entertainment Properties Trust | | | 350,106 | | | | 16,192,402 | |
Equity Lifestyle Properties, Inc. | | | 271,491 | | | | 15,184,492 | |
Equity Residential Property Trust | | | 187,244 | | | | 9,727,326 | |
Extra Space Storage, Inc. | | | 531,052 | | | | 9,240,305 | |
Federal Realty Investment Trust | | | 104,653 | | | | 8,155,608 | |
General Growth Properties, Inc. | | | 683,400 | | | | 10,579,032 | |
Getty Realty Corp. | | | 294,000 | | | | 9,196,320 | |
Health Care REIT, Inc. | | | 440,307 | | | | 20,976,225 | |
Host Hotels & Resorts, Inc. | | | 376,619 | | | | 6,730,182 | |
LaSalle Hotel Properties | | | 312,200 | | | | 8,242,080 | |
Mid-America Apartment Communities, Inc. | | | 200,932 | | | | 12,757,173 | |
National Retail Properties, Inc. | | | 565,100 | | | | 14,975,150 | |
Nationwide Health Properties, Inc. | | | 146,600 | | | | 5,333,308 | |
ProLogis | | | 1,097,193 | | | | 15,843,467 | |
Public Storage | | | 109,364 | | | | 11,091,697 | |
Ramco-Gershenson Properties Trust | | | 397,407 | | | | 4,947,717 | |
Simon Property Group, Inc. | | | 308,848 | | | | 30,727,287 | |
U-Store-It Trust | | | 655,700 | | | | 6,248,821 | |
Weingarten Realty Investors | | | 303,900 | | | | 7,220,664 | |
| | | | | | | | |
Real Estate Investment Trusts (REITs) Total | | | | | | | 358,435,706 | |
| | | | | | | | |
| | | Shares | | | Value ($) | |
| Real Estate Management & Development – 1.0% | |
Jones Lang LaSalle, Inc. | | | 43,691 | | | | 3,666,549 | |
| | | | | | | | |
Real Estate Management & Development Total | | | | | | | 3,666,549 | |
| | | | | | | | |
Financials Total | | | | | | | 362,102,255 | |
| | | | | | | | |
Total Common Stocks
(cost of $293,042,239) | | | | 371,812,856 | |
| | | | | | | | |
|
Convertible Preferred Stock – 0.5% | |
| | | | | | | | |
| Financials – 0.5% | | | | | | | | |
| Real Estate Investment Trusts (REITs) – 0.5% | |
Alexandria Real Estate Equities, Inc., Series D, 7.000% | | | 82,100 | | | | 2,031,975 | |
| | | | | | | | |
Real Estate Investment Trusts (REITs) Total | | | | | | | 2,031,975 | |
| | | | | | | | |
Financials Total | | | | | | | 2,031,975 | |
| | | | | | | | |
Total Convertible Preferred Stock
(cost of $2,054,963) | | | | 2,031,975 | |
| | | | | | | | |
|
Short-Term Obligation – 0.7% | |
| | | Par ($) | | | | |
Repurchase agreement with Fixed Income Clearing Corp., dated 12/31/10, due 01/03/11 at 0.150%, collateralized by a U.S. Treasury obligation maturing 08/15/19, market value $2,658,600 (repurchase proceeds $2,603,033) | | | 2,603,000 | | | | 2,603,000 | |
| | | | | | | | |
Total Short-Term Obligation
(cost of $2,603,000) | | | | 2,603,000 | |
| | | | | | | | |
Total Investments – 99.8%
(cost of $297,700,202) (c) | | | | | | | 376,447,831 | |
| | | | | | | | |
Other Assets & Liabilities, Net – 0.2% | | | | 839,152 | |
| | | | | | | | |
Net Assets – 100.0% | | | | | | | 377,286,983 | |
Notes to Investment Portfolio:
| (a) | Non-income producing security. |
| (b) | This security denominated in Canadian dollars. |
| (c) | Cost for federal income tax purposes is $298,650,330. |
See Accompanying Notes to Financial Statements.
8
Columbia Real Estate Equity Fund
December 31, 2010
The following table summarizes the inputs used, as of December 31, 2010, in valuing the Fund’s assets:
| | | | | | | | | | | | | | | | |
Description | | Quoted Prices
(Level 1) | | | Other
Significant
Observable
Inputs
(Level 2) | | | Significant
Unobservable
Inputs
(Level 3) | | | Total | |
Total Common Stocks | | $ | 371,812,856 | | | $ | — | | | $ | — | | | $ | 371,812,856 | |
Total Convertible Preferred Stock | | | 2,031,975 | | | | — | | | | — | | | | 2,031,975 | |
Total Short-Term Obligation | | | — | | | | 2,603,000 | | | | — | | | | 2,603,000 | |
| | | | | | | | | | | | | | | | |
Total Investments | | $ | 373,844,831 | | | $ | 2,603,000 | | | $ | — | | | $ | 376,447,831 | |
| | | | | | | | | | | | | | | | |
The Fund’s assets assigned to the Level 2 input category represent certain short-term obligations which are valued using amortized cost, an income approach which converts future cash flows to a present value based upon the discount or premium at purchase.
There were no significant transfers of financial assets between Levels 1 and 2 during the period.
For more information on valuation inputs, please refer to the Security Valuation section in the accompanying Notes to Financial Statements.
At December 31, 2010, the Fund held investments in the following sectors:
| | | | |
Sector (Unaudited) | | % of
Net Assets | |
Financials | | | 96.5 | |
Consumer Discretionary | | | 2.6 | |
| | | | |
| | | 99.1 | |
Short-Term Obligation | | | 0.7 | |
Other Assets & Liabilities, Net | | | 0.2 | |
| | | | |
| | | 100.0 | |
| | | | |
| | |
Acronym | | Name |
| CAD | | Canadian Dollar |
See Accompanying Notes to Financial Statements.
9
Statement of Assets and Liabilities – Columbia Real Estate Equity Fund
December 31, 2010
| | | | | | |
| | | | | ($) | |
| Assets | | Investments, at cost | | | 297,700,202 | |
| | | | | | |
| | Investments, at value | | | 376,447,831 | |
| | Cash | | | 447 | |
| | Receivable for: | | | | |
| | Investments sold | | | 944,534 | |
| | Fund shares sold | | | 307,544 | |
| | Dividends | | | 1,538,017 | |
| | Interest | | | 11 | |
| | Trustees’ deferred compensation plan | | | 49,558 | |
| | Prepaid expenses | | | 4,464 | |
| | | | | | |
| | Total Assets | | | 379,292,406 | |
| | |
| Liabilities | | Payable for: | | | | |
| | Investments purchased | | | 1,007,569 | |
| | Fund shares repurchased | | | 540,322 | |
| | Investment advisory fee | | | 234,321 | |
| | Pricing and bookkeeping fees | | | 8,531 | |
| | Transfer agent fee | | | 90,732 | |
| | Trustees’ fees | | | 5,105 | |
| | Custody fee | | | 3,480 | |
| | Distribution and service fees | | | 13,774 | |
| | Chief compliance officer expenses | | | 306 | |
| | Trustees’ deferred compensation plan | | | 49,558 | |
| | Other liabilities | | | 51,725 | |
| | | | | | |
| | Total Liabilities | | | 2,005,423 | |
| | |
| | | | | | |
| | Net Assets | | | 377,286,983 | |
| | |
| Net Assets Consist of | | Paid-in capital | | | 299,539,076 | |
| | Overdistributed net investment income | | | (849,468 | ) |
| | Accumulated net realized loss | | | (150,371 | ) |
| | Net unrealized appreciation (depreciation) on: | | | | |
| | Investments | | | 78,747,629 | |
| | Foreign currency translations | | | 117 | |
| | | | | | |
| | Net Assets | | | 377,286,983 | |
See Accompanying Notes to Financial Statements.
10
Statement of Assets and Liabilities (continued) – Columbia Real Estate Equity Fund
December 31, 2010
| | | | | | |
| | | | | | |
| Class A | | Net assets | | $ | 27,511,112 | |
| | Shares outstanding | | | 2,217,495 | |
| | Net asset value per share | | $ | 12.41 | (a) |
| | Maximum sales charge | | | 5.75 | % |
| | Maximum offering price per share ($12.41/0.9425) | | $ | 13.17 | (b) |
| | |
| Class B | | Net assets | | $ | 2,985,691 | |
| | Shares outstanding | | | 240,222 | |
| | Net asset value and offering price per share | | $ | 12.43 | (a) |
| | |
| Class C | | Net assets | | $ | 6,900,124 | |
| | Shares outstanding | | | 556,482 | |
| | Net asset value and offering price per share | | $ | 12.40 | (a) |
| | |
| Class I (c) | | Net assets | | $ | 35,387,722 | |
| | Shares outstanding | | | 2,848,391 | |
| | Net asset value, offering and redemption price per share | | $ | 12.42 | |
| | |
| Class R (c) | | Net assets | | $ | 2,639 | |
| | Shares outstanding | | | 213 | |
| | Net asset value, offering and redemption price per share | | $ | 12.40 | (d) |
| | |
| Class W (c) | | Net assets | | $ | 2,641 | |
| | Shares outstanding | | | 213 | |
| | Net asset value, offering and redemption price per share | | $ | 12.41 | (e) |
| | |
| Class Z | | Net assets | | $ | 304,497,054 | |
| | Shares outstanding | | | 24,498,686 | |
| | Net asset value, offering and redemption price per share | | $ | 12.43 | |
| (a) | Redemption price per share is equal to net asset value less any applicable contingent deferred sales charge. |
| (b) | On sales of $50,000 or more the offering price is reduced. |
| (c) | Class I, Class R and Class W shares commenced operations on September 27, 2010. |
| (d) | Net asset value rounds to $12.40 per share due to fractional shares outstanding. |
| (e) | Net asset value rounds to $12.41 per share due to fractional shares outstanding. |
See Accompanying Notes to Financial Statements.
11
Statement of Operations – Columbia Real Estate Equity Fund
For the Year Ended December 31, 2010
| | | | | | |
| | | | | ($) (a) | |
| Investment Income | | Dividends | | | 7,864,747 | |
| | Interest | | | 4,433 | |
| | Foreign taxes withheld | | | (67,558 | ) |
| | | | | | |
| | Total Investment Income | | | 7,801,622 | |
| | |
| Expenses | | Investment advisory fee | | | 2,589,427 | |
| | Distribution fee: | | | | |
| | Class B | | | 24,265 | |
| | Class C | | | 44,792 | |
| | Class R | | | 3 | |
| | Service fee: | | | | |
| | Class A | | | 55,762 | |
| | Class B | | | 8,089 | |
| | Class C | | | 14,930 | |
| | Class W | | | 2 | |
| | Transfer agent fee – Class A, Class B, Class C, Class R, Class W and Class Z | | | 547,068 | |
| | Pricing and bookkeeping fees | | | 94,050 | |
| | Trustees’ fees | | | 32,131 | |
| | Custody fee | | | 14,062 | |
| | Chief compliance officer expenses | | | 1,246 | |
| | Other expenses | | | 250,813 | |
| | | | | | |
| | Expenses before interest expense | | | 3,676,640 | |
| | Interest expense | | | 913 | |
| | | | | | |
| | Total Expenses | | | 3,677,553 | |
| | |
| | Expense reductions | | | (58 | ) |
| | | | | | |
| | Net Expenses | | | 3,677,495 | |
| | |
| | | | | | |
| | Net Investment Income | | | 4,124,127 | |
| | |
| Net Realized and Unrealized Gain (Loss) on Investments and Foreign Currency | | Net realized gain (loss) on: | | | | |
| | Investments | | | 53,184,060 | |
| | Foreign currency transactions | | | 7,103 | |
| | Net realized loss on violation of investment restriction (See Note 10) | | | (7,545 | ) |
| | Reimbursement of realized loss on violation of investment restriction (See Note 10) | | | 7,545 | |
| | | | | | |
| | Net realized gain | | | 53,191,163 | |
| | |
| | Net change in unrealized appreciation (depreciation) on: | | | | |
| | Investments | | | 19,302,073 | |
| | Foreign currency translations | | | 257 | |
| | | | | | |
| | Net change in unrealized appreciation (depreciation) | | | 19,302,330 | |
| | | | | | |
| | Net Gain | | | 72,493,493 | |
| | |
| | | | | | |
| | Net Increase Resulting from Operations | | | 76,617,620 | |
| (a) | Class I, Class R and Class W shares commenced operations on September 27, 2010. |
See Accompanying Notes to Financial Statements.
12
Statement of Changes in Net Assets – Columbia Real Estate Equity Fund
| | | | | | | | | | | | | | |
| Increase (Decrease) in Net Assets | | | | Year Ended
December 31,
2010 ($)(a)(b) | | | Period From
September 1,
2009 through
December 31,
2009 ($)(c) | | | Year Ended
August 31,
2009 ($) | |
| Operations | | Net investment income | | | 4,124,127 | | | | 2,048,366 | | | | 6,478,152 | |
| | Net realized gain (loss) on investments and foreign currency transactions | | | 53,191,163 | | | | 24,306,236 | | | | (91,398,068 | ) |
| | Net change in unrealized appreciation (depreciation) on investments and foreign currency translations | | | 19,302,330 | | | | 7,629,618 | | | | (8,110,279 | ) |
| | | | | | | | | | | | | | |
| | Net increase (decrease) resulting from operations | | | 76,617,620 | | | | 33,984,220 | | | | (93,030,195 | ) |
| | | | |
| Distributions to Shareholders | | From net investment income: | | | | | | | | | | | | |
| | Class A | | | (531,336 | ) | | | (217,802 | ) | | | (551,971 | ) |
| | Class B | | | (47,805 | ) | | | (29,707 | ) | | | (117,661 | ) |
| | Class C | | | (95,953 | ) | | | (33,297 | ) | | | (110,966 | ) |
| | Class I | | | (50,957 | ) | | | — | | | | — | |
| | Class R | | | (20 | ) | | | — | | | | — | |
| | Class W | | | (22 | ) | | | — | | | | — | |
| | Class Z | | | (7,975,040 | ) | | | (3,425,286 | ) | | | (8,341,582 | ) |
| | From return of capital: | | | | | | | | | | | | |
| | Class A | | | — | | | | (151,558 | ) | | | (299,968 | ) |
| | Class B | | | — | | | | (29,124 | ) | | | (73,441 | ) |
| | Class C | | | — | | | | (33,092 | ) | | | (72,111 | ) |
| | Class Z | | | — | | | | (2,168,787 | ) | | | (4,249,735 | ) |
| | | | | | | | | | | | | | |
| | Total distributions to shareholders | | | (8,701,133 | ) | | | (6,088,653 | ) | | | (13,817,435 | ) |
| | | | |
| | Net Capital Stock Transactions | | | 9,449,400 | | | | 9,494,663 | | | | 51,156,494 | |
| | Increase from Regulatory Settlements | | | 22,629 | | | | — | | | | — | |
| | | | | | | | | | | | | | |
| | Total increase (decrease) in net assets | | | 77,388,516 | | | | 37,390,230 | | | | (55,691,136 | ) |
| | | | |
| Net Assets | | Beginning of period | | | 299,898,467 | | | | 262,508,237 | | | | 318,199,373 | |
| | End of period | | | 377,286,983 | | | | 299,898,467 | | | | 262,508,237 | |
| | Undistributed (overdistributed) net investment income at end of period | | | (849,468 | ) | | | (387,652 | ) | | | 1,268,255 | |
| (a) | Class I, Class R and Class W shares commenced operations on September 27, 2010. |
| (b) | Class I, Class R and Class W shares reflect activity for the period September 27, 2010 through December 31, 2010 |
| (c) | The fund changed its fiscal year end from August 31 to December 31. |
See Accompanying Notes to Financial Statements.
13
|
| Statement of Changes in Net Assets (continued) – Columbia Real Estate Equity Fund |
| | | | | | | | | | | | | | | | | | | | | | | | |
| | | Capital Stock Activity | |
| | | Year Ended
December 31, 2010 | | | Period From
September 1, 2009
through
December 31, 2009 (c) | | | Year Ended
August 31, 2009 | |
| | | Shares | | | Dollars ($) | | | Shares | | | Dollars ($) | | | Shares | | | Dollars ($) | |
Class A | | | | | | | | | | | | | | | | | | | | | | | | |
Subscriptions | | | 909,223 | | | | 10,332,381 | | | | 148,133 | | | | 1,400,964 | | | | 897,568 | | | | 7,501,890 | |
Distributions reinvested | | | 40,227 | | | | 466,486 | | | | 36,378 | | | | 347,579 | | | | 103,384 | | | | 796,102 | |
Redemptions | | | (543,168 | ) | | | (6,044,112 | ) | | | (251,800 | ) | | | (2,376,319 | ) | | | (733,801 | ) | | | (5,988,913 | ) |
| | | | | | | | | | | | | | | | | | | | | | | | |
Net increase (decrease) | | | 406,282 | | | | 4,754,755 | | | | (67,289 | ) | | | (627,776 | ) | | | 267,151 | | | | 2,309,079 | |
| | | | | | |
Class B | | | | | | | | | | | | | | | | | | | | | | | | |
Subscriptions | | | 15,589 | | | | 179,794 | | | | 4,866 | | | | 44,893 | | | | 26,122 | | | | 254,768 | |
Distributions reinvested | | | 3,404 | | | | 39,297 | | | | 5,598 | | | | 53,604 | | | | 22,182 | | | | 170,811 | |
Redemptions | | | (110,506 | ) | | | (1,256,435 | ) | | | (46,753 | ) | | | (442,409 | ) | | | (194,445 | ) | | | (1,599,367 | ) |
| | | | | | | | | | | | | | | | | | | | | | | | |
Net decrease | | | (91,513 | ) | | | (1,037,344 | ) | | | (36,289 | ) | | | (343,912 | ) | | | (146,141 | ) | | | (1,173,788 | ) |
| | | | | | |
Class C | | | | | | | | | | | | | | | | | | | | | | | | |
Subscriptions | | | 226,594 | | | | 2,494,066 | | | | 126,941 | | | | 1,237,016 | | | | 97,202 | | | | 833,369 | |
Distributions reinvested | | | 7,494 | | | | 86,990 | | | | 6,394 | | | | 61,091 | | | | 22,330 | | | | 170,897 | |
Redemptions | | | (151,955 | ) | | | (1,693,165 | ) | | | (49,543 | ) | | | (470,948 | ) | | | (196,401 | ) | | | (1,646,317 | ) |
| | | | | | | | | | | | | | | | | | | | | | | | |
Net increase (decrease) | | | 82,133 | | | | 887,891 | | | | 83,792 | | | | 827,159 | | | | (76,869 | ) | | | (642,051 | ) |
| | | | | | |
Class I (a)(b) | | | | | | | | | | | | | | | | | | | | | | | | |
Subscriptions | | | 2,855,527 | | | | 34,553,546 | | | | — | | | | — | | | | — | | | | — | |
Distributions reinvested | | | 4,171 | | | | 50,933 | | | | — | | | | — | | | | — | | | | — | |
Redemptions | | | (11,307 | ) | | | (138,200 | ) | | | — | | | | — | | | | — | | | | — | |
| | | | | | | | | | | | | | | | | | | | | | | | |
Net increase | | | 2,848,391 | | | | 34,466,279 | | | | — | | | | — | | | | — | | | | — | |
| | | | | | |
Class R (a)(b) | | | | | | | | | | | | | | | | | | | | | | | | |
Subscriptions | | | 213 | | | | 2,500 | | | | — | | | | — | | | | — | | | | — | |
| | | | | | | | | | | | | | | | | | | | | | | | |
Net increase | | | 213 | | | | 2,500 | | | | — | | | | — | | | | — | | | | — | |
| | | | | | |
Class W (a)(b) | | | | | | | | | | | | | | | | | | | | | | | | |
Subscriptions | | | 225 | | | | 2,650 | | | | — | | | | — | | | | — | | | | — | |
Redemptions | | | (12 | ) | | | (150 | ) | | | — | | | | — | | | | — | | | | — | |
| | | | | | | | | | | | | | | | | | | | | | | | |
Net increase | | | 213 | | | | 2,500 | | | | — | | | | — | | | | — | | | | — | |
| | | | | | |
Class Z | | | | | | | | | | | | | | | | | | | | | | | | |
Subscriptions | | | 8,883,775 | | | | 101,334,335 | | | | 2,795,492 | | | | 26,785,491 | | | | 15,480,870 | | | | 128,665,264 | |
Distributions reinvested | | | 401,949 | | | | 4,657,790 | | | | 334,240 | | | | 3,200,691 | | | | 976,848 | | | | 7,579,012 | |
Redemptions | | | (11,894,503 | ) | | | (135,619,306 | ) | | | (2,147,820 | ) | | | (20,346,990 | ) | | | (10,673,077 | ) | | | (85,581,022 | ) |
| | | | | | | | | | | | | | | | | | | | | | | | |
Net increase (decrease) | | | (2,608,779 | ) | | | (29,627,181 | ) | | | 981,912 | | | | 9,639,192 | | | | 5,784,641 | | | | 50,663,254 | |
| (a) | Class I, Class R and Class W shares commenced operations on September 27, 2010. |
| (b) | Class I, Class R and Class W shares reflect activity for the period September 27, 2010 through December 31, 2010 |
| (c) | The Fund changed its fiscal year end from August 31 to December 31. |
See Accompanying Notes to Financial Statements.
14
Financial Highlights – Columbia Real Estate Equity Fund
Selected data for a share outstanding throughout each period is as follows:
| | | | | | | | | | | | | | | | | | | | | | | | |
Class A Shares | | Year Ended
December 31, | | | Period Ended
December 31, | | | Year Ended August 31, | |
| | 2010 | | | 2009 (a) | | | 2009 | | | 2008 | | | 2007 | | | 2006 | |
Net Asset Value, Beginning of Period | | $ | 10.07 | | | $ | 9.11 | | | $ | 13.85 | | | $ | 20.72 | | | $ | 29.07 | | | $ | 27.84 | |
| | | | | | |
Income from Investment Operations: | | | | | | | | | | | | | | | | | | | | | | | | |
Net investment income (b) | | | 0.12 | | | | 0.06 | | | | 0.22 | | | | 0.29 | | | | 0.22 | | | | 0.39 | |
Net realized and unrealized gain (loss) on investments and foreign currency | | | 2.48 | | | | 1.10 | | | | (4.46 | ) | | | (1.10 | ) | | | 1.24 | | | | 4.90 | |
| | | | | | | | | | | | | | | | | | | | | | | | |
Total from investment operations | | | 2.60 | | | | 1.16 | | | | (4.24 | ) | | | (0.81 | ) | | | 1.46 | | | | 5.29 | |
| | | | | | |
Less Distributions to Shareholders: | | | | | | | | | | | | | | | | | | | | | | | | |
From net investment income | | | (0.26 | ) | | | (0.12 | ) | | | (0.33 | ) | | | (0.16 | ) | | | (0.33 | ) | | | (0.78 | ) |
From net realized gains | | | — | | | | — | | | | — | | | | (5.90 | ) | | | (9.48 | ) | | | (3.28 | ) |
From return of capital | | | — | | | | (0.08 | ) | | | (0.17 | ) | | | — | | | | — | | | | — | |
| | | | | | | | | | | | | | | | | | | | | | | | |
Total distributions to shareholders | | | (0.26 | ) | | | (0.20 | ) | | | (0.50 | ) | | | (6.06 | ) | | | (9.81 | ) | | | (4.06 | ) |
| | | | | | |
Increase from regulatory settlements | | | — | (c) | | | — | | | | — | | | | — | | | | — | | | | — | |
| | | | | | |
Net Asset Value, End of Period | | $ | 12.41 | | | $ | 10.07 | | | $ | 9.11 | | | $ | 13.85 | | | $ | 20.72 | | | $ | 29.07 | |
Total return (d) | | | 26.04 | %(i) | | | 12.86 | %(e) | | | (29.89 | )% | | | (5.46 | )% | | | 1.72 | % | | | 21.66 | % |
| | | | | | |
Ratios to Average Net Assets/ Supplemental Data: | | | | | | | | | | | | | | | | | | | | | | | | |
Net expenses before interest expense (f) | | | 1.27 | % | | | 1.39 | %(g) | | | 1.31 | % | | | 1.28 | % | | | 1.21 | % | | | 1.19 | % |
Interest expense | | | — | %(h) | | | — | | | | — | | | | — | %(h) | | | — | %(h) | | | — | %(h) |
Net expenses (f) | | | 1.27 | % | | | 1.39 | %(g) | | | 1.31 | % | | | 1.28 | % | | | 1.21 | % | | | 1.19 | % |
Net investment income (f) | | | 1.04 | % | | | 1.99 | %(g) | | | 2.69 | % | | | 1.93 | % | | | 0.84 | % | | | 1.45 | % |
Portfolio turnover rate | | | 108 | % | | | 32 | %(e) | | | 110 | % | | | 78 | % | | | 67 | % | | | 10 | % |
Net assets, end of period (000s) | | $ | 27,511 | | | $ | 18,245 | | | $ | 17,114 | | | $ | 22,321 | | | $ | 31,069 | | | $ | 44,685 | |
| (a) | The Fund changed its fiscal year end from August 31 to December 31. Per share data and total return reflect activity from September 1, 2009 through December 31, 2009. |
| (b) | Per share data was calculated using the average shares outstanding during the period. |
| (c) | Rounds to less than $0.01 per share. |
| (d) | Total return at net asset value assuming all distributions reinvested and no initial sales charge or contingent deferred sales charge. |
| (f) | The benefits derived from expense reductions had an impact of less than 0.01%. |
| (h) | Rounds to less than 0.01%. |
| (i) | Total return includes a reimbursement of a loss experienced by the Fund due to a compliance violation. This reimbursement had an impact of less than 0.01% on total return. |
See Accompanying Notes to Financial Statements.
15
Financial Highlights – Columbia Real Estate Equity Fund
Selected data for a share outstanding throughout each period is as follows:
| | | | | | | | | | | | | | | | | | | | | | | | |
| | | Year Ended
December 31, | | | Period Ended
December 31, | | | Year Ended August 31, | |
| Class B Shares | | 2010 | | | 2009 (a) | | | 2009 | | | 2008 | | | 2007 | | | 2006 | |
Net Asset Value, Beginning of Period | | $ | 10.09 | | | $ | 9.12 | | | $ | 13.85 | | | $ | 20.76 | | | $ | 29.09 | | | $ | 27.85 | |
| | | | | | |
Income from Investment Operations: | | | | | | | | | | | | | | | | | | | | | | | | |
Net investment income (b) | | | 0.02 | | | | 0.04 | | | | 0.16 | | | | 0.20 | | | | 0.03 | | | | 0.19 | |
Net realized and unrealized gain (loss) on investments and foreign currency | | | 2.50 | | | | 1.10 | | | | (4.46 | ) | | | (1.14 | ) | | | 1.24 | | | | 4.90 | |
| | | | | | | | | | | | | | | | | | | | | | | | |
Total from investment operations | | | 2.52 | | | | 1.14 | | | | (4.30 | ) | | | (0.94 | ) | | | 1.27 | | | | 5.09 | |
| | | | | | |
Less Distributions to Shareholders: | | | | | | | | | | | | | | | | | | | | | | | | |
From net investment income | | | (0.18 | ) | | | (0.09 | ) | | | (0.26 | ) | | | (0.07 | ) | | | (0.12 | ) | | | (0.57 | ) |
From net realized gains | | | — | | | | — | | | | — | | | | (5.90 | ) | | | (9.48 | ) | | | (3.28 | ) |
From return of capital | | | — | | | | (0.08 | ) | | | (0.17 | ) | | | — | | | | — | | | | — | |
| | | | | | | | | | | | | | | | | | | | | | | | |
Total distributions to shareholders | | | (0.18 | ) | | | (0.17 | ) | | | (0.43 | ) | | | (5.97 | ) | | | (9.60 | ) | | | (3.85 | ) |
| | | | | | |
Increase from regulatory settlements | | | — | (c) | | | — | | | | — | | | | — | | | | — | | | | — | |
| | | | | | |
Net Asset Value, End of Period | | $ | 12.43 | | | $ | 10.09 | | | $ | 9.12 | | | $ | 13.85 | | | $ | 20.76 | | | $ | 29.09 | |
Total return (d) | | | 25.07 | %(i) | | | 12.57 | %(e) | | | (30.38 | )% | | | (6.21 | )% | | | 0.99 | % | | | 20.78 | % |
| | | | | | |
Ratios to Average Net Assets/Supplemental Data: | | | | | | | | | | | | | | | | | | | | | | | | |
Net expenses before interest expense (f) | | | 2.02 | % | | | 2.14 | %(g) | | | 2.06 | % | | | 2.03 | % | | | 1.96 | % | | | 1.94 | % |
Interest expense | | | — | %(h) | | | — | | | | — | | | | — | %(h) | | | — | %(h) | | | — | %(h) |
Net expenses (f) | | | 2.02 | % | | | 2.14 | %(g) | | | 2.06 | % | | | 2.03 | % | | | 1.96 | % | | | 1.94 | % |
Net investment income (f) | | | 0.21 | % | | | 1.22 | %(g) | | | 1.96 | % | | | 1.30 | % | | | 0.10 | % | | | 0.72 | % |
Portfolio turnover rate | | | 108 | % | | | 32 | %(e) | | | 110 | % | | | 78 | % | | | 67 | % | | | 10 | % |
Net assets, end of period (000s) | | $ | 2,986 | | | $ | 3,348 | | | $ | 3,356 | | | $ | 7,123 | | | $ | 9,663 | | | $ | 13,309 | |
| (a) | The Fund changed its fiscal year end from August 31 to December 31. Per share data and total return reflect activity from September 1, 2009 through December 31, 2009. |
| (b) | Per share data was calculated using the average shares outstanding during the period. |
| (c) | Rounds to less than $0.01 per share. |
| (d) | Total return at net asset value assuming all distributions reinvested and no contingent deferred sales charge. |
| (f) | The benefits derived from expense reductions had an impact of less than 0.01%. |
| (h) | Rounds to less than 0.01%. |
| (i) | Total return includes a reimbursement of a loss experienced by the Fund due to a compliance violation. This reimbursement had an impact of less than 0.01% on total return. |
See Accompanying Notes to Financial Statements.
16
Financial Highlights – Columbia Real Estate Equity Fund
Selected data for a share outstanding throughout each period is as follows:
| | | | | | | | | | | | | | | | | | | | | | | | |
| | | Year Ended
December 31, | | | Period Ended
December 31, | | | Year Ended August 31, | |
| Class C Shares | | 2010 | | | 2009 (a) | | | 2009 | | | 2008 | | | 2007 | | | 2006 | |
Net Asset Value, Beginning of Period | | $ | 10.07 | | | $ | 9.10 | | | $ | 13.82 | | | $ | 20.72 | | | $ | 29.06 | | | $ | 27.83 | |
| | | | | | |
Income from Investment Operations: | | | | | | | | | | | | | | | | | | | | | | | | |
Net investment income (b) | | | 0.03 | | | | 0.04 | | | | 0.16 | | | | 0.19 | | | | 0.03 | | | | 0.18 | |
Net realized and unrealized gain (loss) on investments and foreign currency | | | 2.48 | | | | 1.10 | | | | (4.45 | ) | | | (1.12 | ) | | | 1.23 | | | | 4.90 | |
| | | | | | | | | | | | | | | | | | | | | | | | |
Total from investment operations | | | 2.51 | | | | 1.14 | | | | (4.29 | ) | | | (0.93 | ) | | | 1.26 | | | | 5.08 | |
| | | | | | |
Less Distributions to Shareholders: | | | | | | | | | | | | | | | | | | | | | | | | |
From net investment income | | | (0.18 | ) | | | (0.09 | ) | | | (0.26 | ) | | | (0.07 | ) | | | (0.12 | ) | | | (0.57 | ) |
From net realized gains | | | — | | | | — | | | | — | | | | (5.90 | ) | | | (9.48 | ) | | | (3.28 | ) |
From return of capital | | | — | | | | (0.08 | ) | | | (0.17 | ) | | | — | | | | — | | | | — | |
| | | | | | | | | | | | | | | | | | | | | | | | |
Total distributions to shareholders | | | (0.18 | ) | | | (0.17 | ) | | | (0.43 | ) | | | (5.97 | ) | | | (9.60 | ) | | | (3.85 | ) |
| | | | | | |
Increase from regulatory settlements | | | — | (c) | | | — | | | | — | | | | — | | | | — | | | | — | |
| | | | | | |
Net Asset Value, End of Period | | $ | 12.40 | | | $ | 10.07 | | | $ | 9.10 | | | $ | 13.82 | | | $ | 20.72 | | | $ | 29.06 | |
Total return (d) | | | 25.02 | %(i) | | | 12.60 | %(e) | | | (30.37 | )% | | | (6.18 | )% | | | 0.94 | % | | | 20.75 | % |
| | | | | | |
Ratios to Average Net Assets/Supplemental Data: | | | | | | | | | | | | | | | | | | | | | | | | |
Net expenses before interest expense (f) | | | 2.02 | % | | | 2.14 | %(g) | | | 2.06 | % | | | 2.03 | % | | | 1.96 | % | | | 1.94 | % |
Interest expense | | | — | %(h) | | | — | | | | — | | | | — | %(h) | | | — | %(h) | | | — | %(h) |
Net expenses (f) | | | 2.02 | % | | | 2.14 | %(g) | | | 2.06 | % | | | 2.03 | % | | | 1.96 | % | | | 1.94 | % |
Net investment income (f) | | | 0.28 | % | | | 1.37 | %(g) | | | 1.95 | % | | | 1.26 | % | | | 0.11 | % | | | 0.66 | % |
Portfolio turnover rate | | | 108 | % | | | 32 | %(e) | | | 110 | % | | | 78 | % | | | 67 | % | | | 10 | % |
Net assets, end of period (000s) | | $ | 6,900 | | | $ | 4,777 | | | $ | 3,553 | | | $ | 6,462 | | | $ | 8,263 | | | $ | 5,486 | |
| (a) | The Fund changed its fiscal year end from August 31 to December 31. Per share data and total return reflect activity from September 1, 2009 through December 31, 2009. |
| (b) | Per share data was calculated using the average shares outstanding during the period. |
| (c) | Rounds to less than $0.01 per share. |
| (d) | Total return at net asset value assuming all distributions reinvested and no contingent deferred sales charge. |
| (f) | The benefits derived from expense reductions had an impact of less than 0.01%. |
| (h) | Rounds to less than 0.01%. |
| (i) | Total return includes a reimbursement of a loss experienced by the Fund due to a compliance violation. This reimbursement had an impact of less than 0.01% on total return. |
See Accompanying Notes to Financial Statements.
17
Financial Highlights – Columbia Real Estate Equity Fund
Selected data for a share outstanding throughout the period is as follows:
| | | | |
| | | Period Ended
December 31, | |
| Class I Shares | | 2010 (a) | |
Net Asset Value, Beginning of Period | | $ | 11.77 | |
| |
Income from Investment Operations: | | | | |
Net investment income (b) | | | 0.07 | |
Net realized and unrealized gain on investments and foreign currency | | | 0.70 | |
| | | | |
Total from investment operations | | | 0.77 | |
| |
Less Distributions to Shareholders: | | | | |
From net investment income | | | (0.12 | ) |
| |
Net Asset Value, End of Period | | $ | 12.42 | |
Total return (c)(d)(h) | | | 6.52 | % |
| |
Ratios to Average Net Assets/Supplemental Data: | | | | |
Net expenses before interest expense (e)(f) | | | 0.96 | % |
Interest expense (f)(g) | | | — | % |
Net expenses (e)(f) | | | 0.96 | % |
Net investment income (e)(f) | | | 2.34 | % |
Portfolio turnover rate (d) | | | 108 | % |
Net assets, end of period (000s) | | $ | 35,388 | |
| (a) | Class I shares commenced operations on September 27, 2010. Per share data and total return reflect activity from that date. |
| (b) | Per share data was calculated using the average shares outstanding during the period. |
| (c) | Total return at net asset value assuming all distributions reinvested. |
| (e) | The benefits derived from expense reductions had an impact of less than 0.01%. |
| (g) | Rounds to less than 0.01%. |
| (h) | Total return includes a reimbursement of a loss experienced by the Fund due to a compliance violation. This reimbursement had an impact of less than 0.01% on total return. |
See Accompanying Notes to Financial Statements.
18
Financial Highlights – Columbia Real Estate Equity Fund
Selected data for a share outstanding throughout the period is as follows:
| | | | |
| | | Period Ended
December 31, | |
| Class R Shares | | 2010 (a) | |
Net Asset Value, Beginning of Period | | $ | 11.75 | |
| |
Income from Investment Operations: | | | | |
Net investment loss (b) | | | (0.07 | ) |
Net realized and unrealized gain on investments and foreign currency | | | 0.82 | |
| | | | |
Total from investment operations | | | 0.75 | |
| |
Less Distributions to Shareholders: | | | | |
From net investment income | | | (0.10 | ) |
| |
Net Asset Value, End of Period | | $ | 12.40 | |
Total return (c)(d)(h) | | | 6.36 | % |
| |
Ratios to Average Net Assets/Supplemental Data: | | | | |
Net expenses before interest expense (e)(f) | | | 1.76 | % |
Interest expense (f) (g) | | | — | % |
Net expenses (e)(f) | | | 1.76 | % |
Net investment loss (e)(f) | | | (2.20 | )% |
Portfolio turnover rate (d) | | | 108 | % |
Net assets, end of period (000s) | | $ | 3 | |
| (a) | Class R shares commenced operations on September 27, 2010. Per share data and total return reflect activity from that date. |
| (b) | Per share data was calculated using the average shares outstanding during the period. |
| (c) | Total return at net asset value assuming all distributions reinvested. |
| (e) | The benefits derived from expense reductions had an impact of less than 0.01%. |
| (g) | Rounds to less than 0.01%. |
| (h) | Total return includes a reimbursement of a loss experienced by the Fund due to a compliance violation. This reimbursement had an impact of less than 0.01% on total return. |
See Accompanying Notes to Financial Statements.
19
Financial Highlights – Columbia Real Estate Equity Fund
Selected data for a share outstanding throughout the period is as follows:
| | | | |
| | | Period Ended
December 31, | |
| Class W Shares | | 2010 (a) | |
Net Asset Value, Beginning of Period | | $ | 11.75 | |
| |
Income from Investment Operations: | | | | |
Net investment loss (b) | | | (0.05 | ) |
Net realized and unrealized gain on investments and foreign currency | | | 0.81 | |
| | | | |
Total from investment operations | | | 0.76 | |
| |
Less Distributions to Shareholders: | | | | |
From net investment income | | | (0.10 | ) |
| |
Net Asset Value, End of Period | | $ | 12.41 | |
Total return (c)(d)(h) | | | 6.51 | % |
| |
Ratios to Average Net Assets/Supplemental Data: | | | | |
Net expenses before interest expense (e)(f) | | | 1.22 | % |
Interest expense (f)(g) | | | — | % |
Net expenses (e)(f) | | | 1.22 | % |
Net investment loss (e)(f) | | | (1.64 | )% |
Portfolio turnover rate (d) | | | 108 | % |
Net assets, end of period (000s) | | $ | 3 | |
| (a) | Class W shares commenced operations on September 27, 2010. Per share data and total return reflect activity from that date. |
| (b) | Per share data was calculated using the average shares outstanding during the period. |
| (c) | Total return at net asset value assuming all distributions reinvested. |
| (e) | The benefits derived from expense reductions had an impact of less than 0.01%. |
| (g) | Rounds to less than 0.01%. |
| (h) | Total return includes a reimbursement of a loss experienced by the Fund due to a compliance violation. This reimbursement had an impact of less than 0.01% on total return. |
See Accompanying Notes to Financial Statements.
20
Financial Highlights – Columbia Real Estate Equity Fund
Selected data for a share outstanding throughout each period is as follows:
| | | | | | | | | | | | | | | | | | | | | | | | |
| | | Year Ended
December 31, | | | Period Ended
December 31, | | | Year Ended August 31, | |
| Class Z Shares | | 2010 | | | 2009 (a) | | | 2009 | | | 2008 | | | 2007 | | | 2006 | |
Net Asset Value, Beginning of Period | | $ | 10.09 | | | $ | 9.13 | | | $ | 13.88 | | | $ | 20.74 | | | $ | 29.10 | | | $ | 27.86 | |
| | | | | | |
Income from Investment Operations: | | | | | | | | | | | | | | | | | | | | | | | | |
Net investment income (b) | | | 0.14 | | | | 0.07 | | | | 0.24 | | | | 0.33 | | | | 0.29 | | | | 0.48 | |
Net realized and unrealized gain (loss) on investments and foreign currency | | | 2.49 | | | | 1.10 | | | | (4.47 | ) | | | (1.10 | ) | | | 1.22 | | | | 4.88 | |
| | | | | | | | | | | | | | | | | | | | | | | | |
Total from investment operations | | | 2.63 | | | | 1.17 | | | | (4.23 | ) | | | (0.77 | ) | | | 1.51 | | | | 5.36 | |
| | | | | | |
Less Distributions to Shareholders: | | | | | | | | | | | | | | | | | | | | | | | | |
From net investment income | | | (0.29 | ) | | | (0.13 | ) | | | (0.35 | ) | | | (0.19 | ) | | | (0.39 | ) | | | (0.84 | ) |
From net realized gains | | | — | | | | — | | | | — | | | | (5.90 | ) | | | (9.48 | ) | | | (3.28 | ) |
From return of capital | | | — | | | | (0.08 | ) | | | (0.17 | ) | | | — | | | | — | | | | — | |
| | | | | | | | | | | | | | | | | | | | | | | | |
Total distributions to shareholders | | | (0.29 | ) | | | (0.21 | ) | | | (0.52 | ) | | | (6.09 | ) | | | (9.87 | ) | | | (4.12 | ) |
| | | | | | |
Increase from regulatory settlements | | | — | (c) | | | — | | | | — | | | | — | | | | — | | | | — | |
| | | | | | |
Net Asset Value, End of Period | | $ | 12.43 | | | $ | 10.09 | | | $ | 9.13 | | | $ | 13.88 | | | $ | 20.74 | | | $ | 29.10 | |
Total return (d) | | | 26.29 | %(i) | | | 12.97 | %(e) | | | (29.71 | )% | | | (5.21 | )% | | | 1.95 | % | | | 21.99 | % |
| | | | | | |
Ratios to Average Net Assets/ Supplemental Data: | | | | | | | | | | | | | | | | | | | | | | | | |
Net expenses before interest expense (f) | | | 1.02 | % | | | 1.14 | %(g) | | | 1.06 | % | | | 1.03 | % | | | 0.96 | % | | | 0.94 | % |
Interest expense | | | — | %(h) | | | — | | | | — | | | | — | %(h) | | | — | %(h) | | | — | %(h) |
Net expenses (f) | | | 1.02 | % | | | 1.14 | %(g) | | | 1.06 | % | | | 1.03 | % | | | 0.96 | % | | | 0.94 | % |
Net investment income (f) | | | 1.23 | % | | | 2.28 | %(g) | | | 2.96 | % | | | 2.17 | % | | | 1.11 | % | | | 1.78 | % |
Portfolio turnover rate | | | 108 | % | | | 32 | %(e) | | | 110 | % | | | 78 | % | | | 67 | % | | | 10 | % |
Net assets, end of period (000s) | | $ | 304,497 | | | $ | 273,528 | | | $ | 238,485 | | | $ | 282,293 | | | $ | 377,388 | | | $ | 578,899 | |
| (a) | The Fund changed its fiscal year end from August 31 to December 31. Per share data and total return reflect activity from September 1, 2009 through December 31, 2009. |
| (b) | Per share data was calculated using the average shares outstanding during the period. |
| (c) | Rounds to less than $0.01 per share. |
| (d) | Total return at net asset value assuming all distributions reinvested. |
| (f) | The benefits derived from expense reductions had an impact of less than 0.01%. |
| (h) | Rounds to less than 0.01%. |
| (i) | Total return includes a reimbursement of a loss experienced by the Fund due to a compliance violation. This reimbursement had an impact of less than 0.01% on total return. |
See Accompanying Notes to Financial Statements.
21
Notes to Financial Statements – Columbia Real Estate Equity Fund
December 31, 2010
Note 1. Organization
Columbia Real Estate Equity Fund (the Fund), a series of Columbia Funds Series Trust I (the Trust), is a non-diversified fund. The Trust is registered under the Investment Company Act of 1940, as amended (the 1940 Act), as an open-end management investment company organized as a Massachusetts business trust.
Investment Objective
The Fund seeks capital appreciation and above-average income by investing, under normal market conditions, at least 80% of its net assets (plus any borrowings for investment purposes) in stocks of companies principally engaged in the real estate industry, including real estate investment trusts (REITs).
Fund Shares
The Trust may issue an unlimited number of shares, and the Fund offers seven classes of shares: Class A, Class B, Class C, Class I, Class R, Class W and Class Z. Effective September 27, 2010, Class I, Class R and Class W shares commenced operations. On December 10, 2010, Columbia Management Investment Advisers, LLC exchanged Class Z shares valued at $28,950,360 for Class I shares. The Fund is also authorized to issue Class R4 and Class R5 shares; however these share classes are not currently offered for sale. Each share class has its own expense structure and sales charges, as applicable.
Class A shares are subject to a maximum front-end sales charge of 5.75% based on the amount of initial investment. Class A shares purchased without an initial sales charge in accounts aggregating $1 million to $50 million at the time of purchase are subject to a maximum contingent deferred sales charge (CDSC) of 1.00% based upon the holding period after purchase.
Class B shares are subject to a maximum CDSC of 5.00% based upon the holding period after purchase. Class B shares will convert to Class A shares eight years after purchase. The Fund no longer accepts investments by new or existing investors in the Fund’s Class B shares, except in connection with the reinvestment of any dividend and/or capital gain distributions in Class B shares of the Fund and exchanges by existing Class B shareholders of other Columbia Funds.
Class C shares are subject to a 1.00% CDSC on shares sold within one year after purchase.
Class I, Class R, Class W and Class Z shares are offered continuously at net asset value. There are certain restrictions on the purchase of Class I, Class R, Class W and Class Z shares, as described in the Fund’s prospectuses.
Note 2. Significant Accounting Policies
The preparation of financial statements in accordance with accounting principles generally accepted in the United States of America (GAAP) requires management to make certain estimates and assumptions that affect the reported amounts of assets and liabilities, the disclosure of contingent assets and liabilities at the date of the financial statements and the reported amounts of revenue and expenses during the reporting period. Actual results could differ from those estimates.
The following is a summary of significant accounting policies consistently followed by the Fund in the preparation of its financial statements.
Equity securities and securities of certain investment companies are valued at the last sale price on the principal exchange on which they trade, except for securities traded on the NASDAQ, which are valued at the NASDAQ official close price. Unlisted securities or listed securities for which there were no sales during the day are valued at the closing bid price on such exchanges or over-the-counter markets.
Short-term investments maturing in 60 days or less are valued at amortized cost, which approximates market value.
Investments in other open-end investment companies are valued at net asset value.
Investments for which market quotations are not readily available, or that have quotations which management believes are not reliable, are valued at fair value as determined in good faith under consistently applied procedures established by and under the general supervision of the Board of Trustees. If a security is valued at fair value, such value is likely to be different from the last quoted market price for the security. The determination of fair value often requires significant judgment. To determine fair value, management may use assumptions including but not limited to future cash flows and estimated risk premiums. Multiple inputs from various sources may be used to determine value.
22
Columbia Real Estate Equity Fund
December 31, 2010
GAAP establishes a hierarchy that prioritizes the inputs to valuation techniques used to measure fair value giving the highest priority to unadjusted quoted prices in active markets for identical securities (Level 1 measurements) and the lowest priority to unobservable inputs (Level 3 measurements) when market prices are not readily available or reliable. The three levels of the fair value hierarchy are described below:
| n | | Level 1 — quoted prices in active markets for identical securities |
| n | | Level 2 — prices determined using other significant observable inputs (including quoted prices for similar securities, interest rates, prepayment speeds, credit risk and others) |
| n | | Level 3 — prices determined using significant unobservable inputs. In situations where quoted prices or observable inputs are unavailable or less reliable, unobservable inputs may be used. Unobservable inputs may include management’s own assumptions about the factors market participants would use in pricing an investment. |
The inputs or methodology used for valuing securities are not necessarily an indication of the risk associated with investing in those securities.
On January 21, 2010, the Financial Accounting Standards Board issued an Accounting Standards Update (the “amendment”), Fair Value Measurements and Disclosures (Topic 820): Improving Disclosures about Fair Value Measurements, which provides guidance on how investment assets and liabilities are to be valued and disclosed. Specifically, the amendment requires reporting entities to disclose the inputs and valuation techniques used to measure fair value for both recurring and nonrecurring fair value measurements for Level 2 and Level 3 positions. The amendment also requires that significant transfers between all levels (including Level 1 and Level 2) be disclosed on a gross basis (i.e., transfers out must be disclosed separately from transfers in), and requires disclosure of the reason(s) for the transfer. Additionally purchases, sales, issuances and settlements must be disclosed on a gross basis in the Level 3 roll forward. The effective date of the amendment is for interim and annual periods beginning after December 15, 2009; except for the requirement to provide the Level 3 activity for purchases, sales, issuances and settlements on a gross basis, which will be effective for interim and annual periods beginning after December 15, 2010.
Security Transactions
Security transactions are accounted for on the trade date. Cost is determined and gains (losses) are based upon the specific identification method for both financial statement and federal income tax purposes.
Repurchase Agreements
The Fund may engage in repurchase agreement transactions with institutions that management has determined are creditworthy. The Fund, through its custodian, receives delivery of the underlying securities collateralizing a repurchase agreement. Management is responsible for determining that the collateral is at least equal, at all times, to the value of the repurchase obligation including interest. A repurchase agreement transaction involves certain risks in the event of default or insolvency of the counterparty. These risks include possible delays in or restrictions on the Fund’s ability to dispose of the underlying securities and a possible decline in the value of the underlying securities during the period while the Fund seeks to assert its rights.
Income Recognition
Interest income is recorded on the accrual basis.
Distributions received from real estate investment trusts (REITs) in excess of their income are recorded as a reduction of the cost of the related investments. If the Fund no longer owns the applicable securities, any distributions received in excess of income are recorded as realized gains.
Expenses
General expenses of the Trust are allocated to the Fund and other series of the Trust based upon relative net assets or other expense allocation methodologies determined by the nature of the expense. Expenses directly attributable to the Fund are charged to the Fund. Expenses directly attributable to a specific class of shares are charged to that share class.
Determination of Class Net Asset Value
All income, expenses (other than class-specific expenses, as shown on the Statement of Operations) and realized and unrealized gains (losses) are allocated to each class of the Fund on a daily basis, based on the relative net assets of each class, for purposes of determining the net asset value of each class.
23
Columbia Real Estate Equity Fund
December 31, 2010
Federal Income Tax Status
The Fund intends to qualify each year as a “regulated investment company” under Subchapter M of the Internal Revenue Code, as amended, and will distribute substantially all of its taxable income, if any, for its tax year, and as such will not be subject to federal income taxes. In addition, the Fund intends to distribute in each calendar year substantially all of its net investment income, capital gains and certain other amounts, if any, such that the Fund should not be subject to federal excise tax. Therefore, no federal income or excise tax provision is recorded.
Distributions to Shareholders
Distributions from net investment income are declared and paid quarterly. Net realized capital gains, if any, are distributed at least annually. Income distributions and capital gain distributions are determined in accordance with federal income tax regulations which may differ from GAAP.
Indemnification
In the normal course of business, the Fund enters into contracts that contain a variety of representations and warranties and which provide general indemnities. The Fund’s maximum exposure under these arrangements is unknown because this would involve future claims against the Fund. Also, under the Trust’s organizational documents and by contract, the Trustees and officers of the Trust are indemnified against certain liabilities that may arise out of actions relating to their duties to the Trust. However, based on experience, the Fund expects the risk of loss due to these representations, warranties and indemnities to be minimal.
Note 3. Federal Tax Information
The timing and character of income and capital gain distributions are determined in accordance with income tax regulations, which may differ from GAAP. Reclassifications are made to the Fund’s capital accounts for permanent tax differences to reflect income and gains available for distribution (or available capital loss carryforwards) under income tax regulations.
For the year ended December 31, 2010, permanent book and tax basis differences resulting primarily from differing treatments for foreign currency transactions, excess distributions and REIT adjustments were identified and reclassified among the components of the Fund’s net assets as follows:
| | | | |
| | | |
Overdistributed Net Investment
Income | | Accumulated Net Realized
Loss | | Paid-In Capital |
| $4,115,190 | | $(582,297) | | $(3,532,893) |
Net investment income and net realized gains (losses), as disclosed on the Statement of Operations, and net assets were not affected by this reclassification.
The tax character of distributions paid during the years ended December 31, 2010 and December 31, 2009 was as follows:
| | | | | | | | |
| | | December 31, 2010 | | | December 31, 2009 | |
| Distributions paid from: | | | | |
Ordinary Income* | | $ | 8,104,155 | | | $ | 3,706,092 | |
Long-Term Capital Gains | | | 596,978 | | | | — | |
Tax Return
of Capital | | | — | | | | 2,382,561 | |
| * | For tax purposes short-term capital gain distributions, if any, are considered ordinary income distributions. |
As of December 31, 2010, the components of distributable earnings on a tax basis were as follows:
| | | | |
| | | | | |
Undistributed
Ordinary Income | | Undistributed Long-Term Capital Gains | | Net Unrealized Appreciation* |
| $— | | $— | | $77,797,501 |
| * | The differences between book-basis and tax-basis net unrealized depreciation are primarily due to deferral of losses from wash sales. |
Unrealized appreciation and depreciation at December 31, 2010, based on cost of investments for federal income tax purposes were:
| | | | |
| | |
Unrealized appreciation | | $ | 78,738,868 | |
Unrealized depreciation | | | (941,367 | ) |
| | | | |
Net unrealized appreciation | | $ | 77,797,501 | |
Capital loss carryforwards of $52,295,199 were utilized during the year ended December 31, 2010.
24
Columbia Real Estate Equity Fund
December 31, 2010
Management is required to determine whether a tax position of the Fund is more likely than not to be sustained upon examination by the applicable taxing authority, including resolution of any related appeals or litigation processes, based on the technical merits of the position. The tax benefit to be recognized by the Fund is measured as the largest amount of benefit that is greater than fifty percent likely of being realized upon ultimate settlement. Management is not aware of any tax positions for which it is reasonably possible that the total amounts of unrecognized tax benefits will significantly change in the next twelve months. However, management’s conclusions may be subject to review and adjustment at a later date based on factors including, but not limited to, new tax laws, regulations, and administrative interpretations (including relevant court decisions). The Fund’s federal tax returns for the prior three fiscal years remain subject to examination by the Internal Revenue Service.
Note 4. Fees and Compensation Paid to Affiliates
Investment Advisory Fee
After the close of business on April 30, 2010, Ameriprise Financial, Inc. (Ameriprise Financial) acquired a portion of the asset management business of Columbia Management Group, LLC (the Transaction), including the business of managing the Fund. In connection with the closing of the Transaction (the Closing), RiverSource Investments, LLC, a wholly owned subsidiary of Ameriprise Financial, became the investment adviser of the Fund and changed its name to Columbia Management Investment Advisers, LLC (the New Adviser). The New Adviser receives a monthly investment advisory fee at the annual rate of 0.75% of the Fund’s average daily net assets.
Prior to the Closing, Columbia Management Advisors, LLC (Columbia), an indirect, wholly owned subsidiary of Bank of America Corporation (BOA), provided investment advisory, administrative and other services to the Fund under the same fee structure.
Administration Fee
Effective upon the Closing, the New Adviser became the administrator of the Fund under a new Administrative Services Agreement (the Administrative Agreement). Under the Administrative Agreement, the New Adviser provides administrative and other services to the Fund, including services previously performed under the Pricing and Bookkeeping Oversight and Services Agreement discussed below. The New Adviser does not receive a fee for its services under the Administrative Agreement. Prior to the Closing, Columbia provided administrative services to the Fund as discussed in the Investment Advisory Fee note above.
Pricing and Bookkeeping Fees
Prior to the Closing, the Fund entered into a Financial Reporting Services Agreement (the Financial Reporting Services Agreement) with State Street Bank and Trust Company (State Street) and Columbia pursuant to which State Street provides financial reporting services to the Fund. The Fund also entered into an Accounting Services Agreement (collectively with the Financial Reporting Services Agreement, the State Street Agreements) with State Street and Columbia pursuant to which State Street provides accounting services to the Fund. Upon the Closing, Columbia assigned and delegated its rights and obligations under the State Street Agreements to the New Adviser. Under the State Street Agreements, the Fund pays State Street an annual fee of $38,000 paid monthly plus an additional monthly fee based on an annualized percentage rate of average daily net assets of the Fund for the month. The aggregate fee will not exceed $140,000 per year (exclusive of out-of-pocket expenses and charges). The Fund also reimburses State Street for certain out-of-pocket expenses and charges.
Also prior to the Closing, the Fund entered into a Pricing and Bookkeeping Oversight and Services Agreement (the Services Agreement) with Columbia. Under the Services Agreement, Columbia provided services related to Fund expenses and the requirements of the Sarbanes-Oxley Act of 2002, and provided oversight of the accounting and financial reporting services provided by State Street. Under the Services Agreement, the Fund reimbursed Columbia for out-of-pocket expenses and charges, including fees payable to third parties, such as for pricing the Fund’s portfolio securities, incurred by Columbia in the performance of services under the Services Agreement. The Services Agreement was terminated upon the Closing. These services are now provided under the Administrative Agreement discussed above.
25
Columbia Real Estate Equity Fund
December 31, 2010
Transfer Agent Fee
In connection with the Closing, RiverSource Service Corporation, a wholly owned subsidiary of Ameriprise Financial, became the transfer agent of the Fund and changed its name to Columbia Management Investment Services Corp. (the New Transfer Agent). The New Transfer Agent has contracted with Boston Financial Data Services (BFDS) to serve as sub-transfer agent. The New Transfer Agent receives monthly account-based service fees based on the number of open accounts and asset-based fees, calculated based on assets held in omnibus accounts, which are intended to reimburse the New Transfer Agent for certain sub-transfer agent fees (exclusive of BFDS fees). The New Transfer Agent pays the fees of BFDS for services as sub-transfer agent and is not entitled to reimbursement for such fees from the Fund.
The New Transfer Agent may also retain, as additional compensation for its services, fees for wire, telephone and redemption orders, Individual Retirement Account (IRA) trustee agent fees and account transcript fees due to the New Transfer Agent from shareholders of the Fund and credits (net of bank charges) earned with respect to balances in accounts the New Transfer Agent maintains in connection with its services to the Fund. The New Transfer Agent also receives reimbursement for certain out-of-pocket expenses.
Prior to the Closing, Columbia Management Services, Inc., an affiliate of Columbia and an indirect, wholly owned subsidiary of BOA, provided shareholder services to the Fund and contracted with BFDS to serve as sub-transfer agent, under the same fee structure.
Class I shares do not pay transfer agent fees. For the year ended December 31, 2010, the Fund’s annualized effective transfer agent fee rate for each class, with the exception of Class I shares, was 0.16% of the Fund’s average daily net assets.
An annual minimum account balance fee of $20 may apply to certain accounts with a value below the Fund’s initial minimum investment requirements to reduce the impact of small accounts on transfer agent fees. These minimum account balance fees are recorded as part of expense reductions on the Statement of Operations. For the year ended December 31, 2010, no minimum account balance fees were charged by the Fund.
Underwriting Discounts, Service and Distribution Fees
In connection with the Closing, RiverSource Fund Distributors, Inc., an indirect wholly owned subsidiary of Ameriprise Financial, became the distributor of the Fund’s shares and changed its name to Columbia Management Investment Distributors, Inc. (the New Distributor).
For the year ended December 31, 2010, initial sales charges paid by shareholders on the purchase of Class A shares amounted to $3,000 and net CDSC fees paid by shareholders on certain redemptions of Class A, Class B and Class C shares amounted to $47, $4,665 and $226, respectively.
The Fund has adopted distribution and shareholder servicing plans (the Plans) pursuant to Rule 12b-1 under the 1940 Act for Class A, Class B, Class C, Class R and Class W shares, which require the payment of distribution and service fees. The fees are intended to compensate the New Distributor and/or eligible selling and/or servicing agents for selling shares of the Fund and providing services to investors.
Payments under the Plans, which are calculated daily and paid monthly, are based on the average daily net assets of the applicable class of the Fund at the following annual rates:
| | | | | | | | |
| Distribution Fee |
| Class A(1) | | Class B | | Class C | | Class R | | Class W(2) |
| 0.10% | | 0.75% | | 0.75% | | 0.50% | | 0.25% |
| | | | | | |
| Service Fee |
| Class A(1) | | Class B | | Class C | | Class W(2) |
| 0.25% | | 0.25% | | 0.25% | | 0.25% |
| 1 | The Fund may pay distribution and service fees up to a maximum of 0.35% of the Fund’s average daily net assets attributable to Class A shares (comprised of up to 0.10% for distribution services and 0.25% for shareholder liaison services), but currently limit such fees to an aggregate fee of not more than 0.25% of the Fund’s average daily net assets attributable to Class A shares. |
| 2 | The Fund may pay a distribution fee of up to 0.25% of the Fund’s average daily net assets attributable to Class W shares and a service fee of up to 0.25% of the Fund’s average daily net assets attributable to Class W shares, provided, however, that the aggregate fee shall not exceed 0.25% of the Fund’s average daily net assets attributable to Class W shares. |
Prior to the Closing, Columbia Management Distributors, Inc., an affiliate of Columbia and an indirect, wholly owned subsidiary of BOA, was the principal underwriter of the Fund’s shares. There were no changes to the underwriting discount structure of the Fund or the service or distribution fee rates paid by the Fund as a result of the Transaction.
26
Columbia Real Estate Equity Fund
December 31, 2010
Fees Paid to Officers and Trustees
All officers of the Fund are employees of the New Adviser or its affiliates and, with the exception of the Fund’s Chief Compliance Officer, receive no compensation from the Fund. The Board of Trustees has appointed a Chief Compliance Officer to the Fund in accordance with federal securities regulations. The Fund, along with other affiliated funds, pays its pro-rata share of the expenses associated with the Chief Compliance Officer. The Fund’s expenses for the Chief Compliance Officer will not exceed $15,000 per year.
Trustees are compensated for their services to the Fund, as set forth on the Statement of Operations. The Trust’s eligible Trustees may participate in a deferred compensation plan which may be terminated at any time. Obligations of the plan will be paid solely out of the Fund’s assets.
Fee Waivers and Expense Reimbursements
Effective September 27, 2010, the New Adviser has voluntarily agreed to reimburse a portion of the Fund’s expenses so that the Fund’s ordinary operating expenses (excluding brokerage commissions, interest, taxes and extraordinary expenses, but including custodian charges relating to overdrafts, if any), after giving effect to any balance credits from the Fund’s custodian, do not exceed the annual rates of 1.45%, 2.20%, 2.20%, 1.07%, 1.70%, 1.45% and 1.20% of the Fund’s average daily net assets attributable to Class A, Class B, Class C, Class I, Class R, Class W and Class Z shares, respectively. This arrangement may be modified or terminated by the New Adviser at any time.
For the period May 1, 2010 through September 27, 2010, the New Adviser had voluntarily agreed to reimburse a portion of the Fund’s expenses so that the Fund’s ordinary operating expenses (excluding any distribution and service fees, brokerage commissions, interest, taxes and extraordinary expenses, but including custodian charges relating to overdrafts, if any), after giving effect to any balance credits from the Fund’s custodian, did not exceed 1.20% of the Fund’s average daily net assets on an annualized basis. Prior to May 1, 2010, Columbia voluntarily reimbursed a portion of the Fund’s expenses in the same manner.
Note 5. Custody Credits
The Fund has an agreement with its custodian bank under which custody fees may be reduced by balance credits. These credits are recorded as part of expense reductions on the Statement of Operations. The Fund could have invested a portion of the assets utilized in connection with the expense offset arrangement in an income-producing asset if it had not entered into such an agreement. For the year ended December 31, 2010, these custody credits reduced total expenses by $58 for the Fund.
Note 6. Portfolio Information
For the year ended December 31, 2010, the cost of purchases and proceeds from sales of securities, excluding short-term obligations, for the Fund were $375,865,469 and $364,892,872, respectively.
Note 7. Regulatory Settlements
During the year ended December 31, 2010, the Fund received payments totaling $22,629 relating to certain regulatory settlements with third parties that the Fund had participated in during the year. The payments have been included in “Increase from regulatory settlements” on the Statement of Changes in Net Assets.
Note 8. Line of Credit
The Fund and other affiliated funds participate in a $280,000,000 committed, unsecured revolving line of credit provided by State Street. The maximum amount that may be borrowed by any fund is limited to the lesser of $200,000,000 and the Fund’s borrowing limit set forth in the Fund’s registration statement. Borrowings are available for short-term liquidity or temporary or emergency purposes.
Effective October 14, 2010, interest is charged to each participating fund based on the fund’s borrowings at a rate per annum equal to the greater of the Federal Funds Rate plus 1.25% or the overnight LIBOR Rate plus 1.25%. In addition, a commitment fee of 0.125% per annum is accrued and apportioned among the participating funds pro rata based on their relative net assets.
Prior to October 14, 2010, interest was charged to each participating fund at the same rates. In addition, a commitment fee of 0.15% per annum was accrued and apportioned among the participating funds pro rata based on their relative net assets.
27
Columbia Real Estate Equity Fund
December 31, 2010
For the year ended December 31, 2010, the average daily loan balance outstanding on days where borrowing existed was $2,377,778 at a weighted average interest rate of 2.00%
Note 9. Shareholder Concentration
As of December 31, 2010, two shareholder accounts owned 50.7% of the outstanding shares of the Fund. Purchase and redemption activity of these accounts may have a significant effect on the operations of the Fund.
Note 10. Other
During the year ended December 31, 2010, the Fund purchased a security in violation of investment restrictions and experienced a realized loss of $7,545. The New Adviser reimbursed the fund for the loss.
Note 11. Significant Risks and Contingencies
Sector Focus Risk
The Fund may focus its investments in certain sectors, subjecting it to greater risk than a fund that is less focused.
Non-Diversified Risk
The Fund is a non-diversified fund, which generally means that it may invest a greater percentage of its total assets in the securities of fewer issuers than a “diversified” fund. This increases the risk that a change in the value of any one investment held by the Fund could affect the overall value of the Fund more than it would affect that of a diversified fund holding a greater number of investments. Accordingly, the Fund’s value will likely be more volatile than the value of more diversified funds. The Fund may not operate as a non-diversified fund at all times.
Real Estate Sector Risk
Interests held in REITs and other companies principally engaged in the real estate industry are subject to risks similar to those of direct investments in real estate. These risks include fluctuating property values, locally, regionally and nationally, which are affected by various factors including interest rates, property taxes, operating expenses, occupancy rates, environmental regulations and contamination, availability of credit, uninsured casualty and condemnation. The value of REITs and other companies principally engaged in the real estate industry are also affected by, among other factors, changes in the prospect for earnings and/or cash flow growth of the REIT or such real estate-related company itself. Because the value of REITs and real estate-related companies may fluctuate widely in response to changes in factors affecting the real estate markets, the value of an investment in the Fund may be more volatile than the value of an investment in a fund that is invested in a more diverse range of market sectors.
Information Regarding Pending and Settled Legal Proceedings
In June 2004, an action captioned John E. Gallus et al. v. American Express Financial Corp. and American Express Financial Advisors Inc. was filed in the United States District Court for the District of Arizona. The plaintiffs allege that they are investors in several American Express Company (now known as legacy RiverSource) mutual funds and they purport to bring the action derivatively on behalf of those funds under the Investment Company Act of 1940. The plaintiffs allege that fees allegedly paid to the defendants by the funds for investment advisory and administrative services are excessive. The plaintiffs seek remedies including restitution and rescission of investment advisory and distribution agreements. The plaintiffs voluntarily agreed to transfer this case to the United States District Court for the District of Minnesota (the District Court). In response to defendants’ motion to dismiss the complaint, the District Court dismissed one of plaintiffs’ four claims and granted plaintiffs limited discovery. Defendants moved for summary judgment in April 2007. Summary judgment was granted in the defendants’ favor on July 9, 2007. The plaintiffs filed a notice of appeal with the Eighth Circuit Court of Appeals (the Eighth Circuit) on August 8, 2007. On April 8, 2009, the Eighth Circuit reversed summary judgment and remanded to the District Court for further proceedings. On August 6, 2009, defendants filed a writ of certiorari with the U.S. Supreme Court (the Supreme Court), asking the Supreme Court to stay the District Court proceedings while the Supreme Court considers and rules in a case captioned Jones v. Harris Associates, which involves issues of law similar to those presented in the Gallus case. On March 30, 2010, the Supreme Court issued its ruling in Jones v. Harris Associates, and on April 5, 2010, the Supreme Court vacated the Eighth Circuit’s decision in the Gallus case and remanded the case to the Eighth Circuit for further consideration in light of the
28
Columbia Real Estate Equity Fund
December 31, 2010
Supreme Court’s decision in Jones v. Harris Associates. On June 4, 2010, the Eighth Circuit remanded the Gallus case to the District Court for further consideration in light of the Supreme Court’s decision in Jones v. Harris Associates. On December 9, 2010, the District Court reinstated its July 9, 2007 summary judgment order in favor of the defendants. On January 10, 2011, plaintiffs filed a notice of appeal with the Eighth Circuit.
In December 2005, without admitting or denying the allegations, American Express Financial Corporation (AEFC, which is now known as Ameriprise Financial, Inc. (Ameriprise Financial)), entered into settlement agreements with the Securities and Exchange Commission (SEC) and Minnesota Department of Commerce (MDOC) related to market timing activities. As a result, AEFC was censured and ordered to cease and desist from committing or causing any violations of certain provisions of the Investment Advisers Act of 1940, the Investment Company Act of 1940, and various Minnesota laws. AEFC agreed to pay disgorgement of $10 million and civil money penalties of $7 million. AEFC also agreed to retain an independent distribution consultant to assist in developing a plan for distribution of all disgorgement and civil penalties ordered by the SEC in accordance with various undertakings detailed at http://www.sec.gov/litigation/admin/ia-2451.pdf. Ameriprise Financial and its affiliates have cooperated with the SEC and the MDOC in these legal proceedings, and have made regular reports to the funds’ Boards of Directors/Trustees.
Ameriprise Financial and certain of its affiliates have historically been involved in a number of legal, arbitration and regulatory proceedings, including routine litigation, class actions, and governmental actions, concerning matters arising in connection with the conduct of their business activities. Ameriprise Financial believes that the Funds are not currently the subject of, and that neither Ameriprise Financial nor any of its affiliates are the subject of, any pending legal, arbitration or regulatory proceedings that are likely to have a material adverse effect on the Funds or the ability of Ameriprise Financial or its affiliates to perform under their contracts with the Funds. Ameriprise Financial is required to make 10-Q, 10-K and, as necessary, 8-K filings with the Securities and Exchange Commission on legal and regulatory matters that relate to Ameriprise Financial and its affiliates. Copies of these filings may be obtained by accessing the SEC website at www.sec.gov.
There can be no assurance that these matters, or the adverse publicity associated with them, will not result in increased fund redemptions, reduced sale of fund shares or other adverse consequences to the Funds. Further, although we believe proceedings are not likely to have a material adverse effect on the Funds or the ability of Ameriprise Financial or its affiliates to perform under their contracts with the Funds, these proceedings are subject to uncertainties and, as such, we are unable to estimate the possible loss or range of loss that may result. An adverse outcome in one or more of these proceedings could result in adverse judgments, settlements, fines, penalties or other relief that could have a material adverse effect on the consolidated financial condition or results of operations of Ameriprise Financial.
Note 12. Subsequent Events
Management has evaluated the events and transactions that have occurred through the date the financial statements were issued and noted no items requiring adjustment of the financial statements or additional disclosures.
29
Report of Independent Registered Public Accounting Firm
To the Trustees of Columbia Funds Series Trust I and the Shareholders of Columbia Real Estate Equity Fund
In our opinion, the accompanying statement of assets and liabilities, including the investment portfolio, and the related statements of operations and of changes in net assets and the financial highlights present fairly, in all material respects, the financial position of Columbia Real Estate Equity Fund (the “Fund”) (a series of Columbia Funds Series Trust I) at December 31, 2010, the results of its operations for the year then ended, the changes in its net assets for each of the two years in the period then ended, and the financial highlights for each of the five years in the period then ended, in conformity with accounting principles generally accepted in the United States of America. These financial statements and financial highlights (hereafter referred to as “financial statements”) are the responsibility of the Fund’s management. Our responsibility is to express an opinion on these financial statements based on our audits. We conducted our audits of these financial statements in accordance with the standards of the Public Company Accounting Oversight Board (United States). Those standards require that we plan and perform the audit to obtain reasonable assurance about whether the financial statements are free of material misstatement. An audit includes examining, on a test basis, evidence supporting the amounts and disclosures in the financial statements, assessing the accounting principles used and significant estimates made by management, and evaluating the overall financial statement presentation. We believe that our audits, which included confirmation of securities at December 31, 2010 by correspondence with the custodian and brokers, provide a reasonable basis for our opinion.
PricewaterhouseCoopers LLP
Boston, Massachusetts
February 18, 2011
30
Federal Income Tax Information (Unaudited) – Columbia Real Estate Equity Fund
For the fiscal year ended December 31, 2010, the Fund designates long-term capital gains of $626,827.
0.91% of the ordinary income distributed by the Fund for the fiscal year ended December 31, 2010, qualifies for the corporate dividends received deduction.
For non-corporate shareholders, 1.32% or the maximum amount allowable under the Jobs and Growth Tax Relief Reconciliation Act of 2003, of the ordinary income distributed by the Fund for the fiscal year ended December 31, 2010 may represent qualified dividend income.
The Fund will notify shareholders in February 2011 of amounts for use in preparing 2010 income tax returns.
31
Fund Governance
The Trustees serve terms of indefinite duration. The names, addresses and birth years of the Trustees and Officers of the Funds in the Columbia Funds Series Trust I, the year each was first elected or appointed to office, their principal business occupations during at least the last five years, the number of Funds overseen by each Trustee and other directorships they hold are shown below. Each officer listed below serves as an officer of each Fund in the Columbia Funds Series Trust I.
Independent Trustees
| | |
Name, Address and Year of Birth,
Position with Funds, Year First
Elected or Appointed to Office | | Principal Occupation(s) During Past Five Years, Number of Funds in Columbia Funds
Complex Overseen by Trustee, Other Directorships Held |
| |
| John D. Collins (born 1938) | | |
c/o Columbia Management Investment Advisers, LLC One Financial Center Boston, MA 02111 Trustee (since 2005) | | Retired. Consultant, KPMG, LLP (accounting and tax firm) from July 1999 to June 2000; Partner, KPMG, LLP from March 1962 to June 1999. Oversees 64; Mrs. Fields Original Cookies, Inc. (consumer products); Suburban Propane Partners, L.P.; and Montpelier Re (insurance underwriting firm) |
| |
| Rodman L. Drake (born 1943) | | |
c/o Columbia Management Investment Advisers, LLC One Financial Center Boston, MA 02111 Trustee (since 1994) and Chairman of the Board (since 2009) | | Independent consultant since 2010; Co-Founder of Baringo Capital LLC (private equity) from 1997 to 2008; CEO of Crystal River Capital, Inc. (real estate investment trust) from 2003 to 2010; Oversees 64; Jackson Hewitt Tax Service Inc. (tax preparation services); Celgene Corporation (global biotechnology company); Student Loan Corporation (student loan provider); Crystal River Capital, Inc. from 2005 to 2010; Parsons Brinckerhoff from 1995 to 2008; the Helios Funds (exchange-traded funds); and Apex Silver Mines Ltd. from 2007 to 2009 |
| |
| Douglas A. Hacker (born 1955) | | |
c/o Columbia Management Investment Advisers, LLC One Financial Center Boston, MA 02111 Trustee (since 1996) | | Independent business executive since May 2006; Executive Vice President–Strategy of United Airlines (airline) from December 2002 to May 2006; President of UAL Loyalty Services (airline marketing company) from September 2001 to December 2002; Executive Vice President and Chief Financial Officer of United Airlines from July 1999 to September 2001. Oversees 64; Nash Finch Company (food distributor); Aircastle Limited (aircraft leasing); and SeaCube Container Leasing Ltd (container leasing) |
|
| Janet Langford Kelly (born 1957) |
c/o Columbia Management Investment Advisers, LLC One Financial Center Boston, MA 02111 Trustee (since 1996) | | Senior Vice President, General Counsel and Corporate Secretary, ConocoPhillips (integrated energy company) since September 2007; Deputy General Counsel–Corporate Legal Services, ConocoPhillips from August 2006 to August 2007; Partner, Zelle, Hofmann, Voelbel, Mason & Gette LLP (law firm) from March 2005 to July 2006; Adjunct Professor of Law, Northwestern University, from September 2004 to June 2006; Director, UAL Corporation (airline) from February 2006 to July 2006; Oversees 64; None |
| |
| William E. Mayer (born 1940) | | |
c/o Columbia Management Investment Advisers, LLC One Financial Center Boston, MA 02111 Trustee (since 1994) | | Partner, Park Avenue Equity Partners (private equity) since February 1999; Dean and Professor, College of Business and Management, University of Maryland from 1992 to 1996. Oversees 64; DynaVox Inc. (software developer); Lee Enterprises (print media), WR Hambrecht + Co. (financial service provider); BlackRock Kelso Capital Corporation (investment company) |
32
Fund Governance (continued)
Independent Trustees (continued)
| | |
Name, Address and Year of Birth,
Position with Funds, Year First
Elected or Appointed to Office | | Principal Occupation(s) During Past Five Years, Number of Funds in Columbia Funds
Complex Overseen by Trustee, Other Directorships Held |
| |
| Charles R. Nelson (born 1942) | | |
c/o Columbia Management Investment Advisers, LLC One Financial Center Boston, MA 02111 Trustee (since 1981) | | Professor of Economics, University of Washington, since January 1976; Ford and Louisa Van Voorhis Professor of Political Economy, University of Washington, since September 1993; Adjunct Professor of Statistics, University of Washington, since September 1980; Associate Editor, Journal of Money Credit and Banking, 1993-2008; Consultant on econometric and statistical matters. Oversees 64; None |
| |
| John J. Neuhauser (born 1943) | | |
c/o Columbia Management Investment Advisers, LLC One Financial Center Boston, MA 02111 Trustee (since 1984) | | President, Saint Michael’s College, since August 2007; Director or Trustee of several non-profit organization, including Fletcher Allen Health Care, Inc.; University Professor, Boston College from November 2005 to August 2007; Academic Vice President and Dean of Faculties, Boston College from August 1999 to October 2005. Oversees 64; Liberty All-Star Equity Fund and Liberty All-Star Growth Fund, Inc. (closed-end funds) |
| |
| Jonathan Piel (born 1938) | | |
c/o Columbia Management Investment Advisers, LLC One Financial Center Boston, MA 02111 Trustee (since 1994) | | Cable television producer and website designer; The Editor, Scientific American from 1984 to 1994; Vice President, Scientific American, Inc., from 1984 to 1994; Member, Advisory Board, Stone Age Institute, Bloomington, Indiana (research institute that explores the effect of technology on human evolution); Member, Board of Directors of the National Institute of Social Sciences, New York City; Member, Board of Trustees of the William Alanson White Institute, New York City (institution for training psychoanalysts); and Member, Advisory Board, Mount Sinai Children’s Environmental Health Center, New York. Oversees 64; None |
| |
| Patrick J. Simpson (born 1944) | | |
c/o Columbia Management Investment Advisers, LLC One Financial Center Boston, MA 02111 Trustee (since 2000) | | Partner, Perkins Coie LLP (law firm). Oversees 64; None |
| |
| Anne-Lee Verville (born 1945) | | |
c/o Columbia Management Investment Advisers, LLC One Financial Center Boston, MA 02111 Trustee (since 1998) | | Retired since 1997 (formerly General Manager–Global Education Industry from 1994 to 1997, President–Application Systems Division from 1991 to 1994, Chief Financial Officer–US Marketing & Services from 1988 to 1991, and Chief Information Officer from 1987 to 1988, IBM Corporation (computer and technology)). Oversees 64; Enesco Group, Inc. (producer of giftware and home and garden decor products) from 2001 to 2006 |
33
Fund Governance (continued)
Interested Trustee
| | |
Name, Address and Year of Birth,
Position with Funds, Year First
Elected or Appointed to Office | | Principal Occupation(s) During Past Five Years, Number of Funds in Columbia Funds
Complex Overseen by Trustee, Other Directorships Held |
| |
| Michael A. Jones (born 1959) | | |
c/o Columbia Management Investment Advisers, LLC One Financial Center Boston, MA 02111 Trustee (since 2011) Senior Vice President (since 2010) | | President and Director, Columbia Management Investment Advisers, LLC since May 2010; President and Director, Columbia Management Investment Distributors, Inc. since May 2010; Manager, Chairman, Chief Executive Officer and President, Columbia Management Advisors, LLC from 2007 to April 2010; Chief Executive Officer, President and Director, Columbia Management Distributors, Inc. from November 2006 to April 2010; previously, co-president and senior managing director at Robeco Investment Management. Oversees 64; None |
The Statement of Additional Information includes additional information about the Trustees of the Funds and is available, without charge, upon request by calling 1-800-345-6611.
34
Fund Governance (continued)
Officers
| | |
| Name, Year of Birth and Address | | Principal Occupation(s) During the Past Five Years |
|
| J. Kevin Connaughton (born 1964) |
One Financial Center Boston, MA 02111 President (since 2009) | | Senior Vice President and General Manager–Mutual Fund Products, Columbia Management Investment Advisers, LLC since May 2010; President, Columbia Funds, since 2009, and RiverSource Funds, since May 2010 (previously Senior Vice President and Chief Financial Officer, Columbia Funds, from June 2008 to January 2009, Treasurer, Columbia Funds, from October 2003 to May 2008, and senior officer of various other affiliated funds since 2000); Managing Director, Columbia Management Advisors, LLC from December 2004 to April 2010. |
| |
| Michael G. Clarke (born 1969) | | |
One Financial Center Boston, MA 02111 Senior Vice President and Chief Financial Officer (since 2009) | | Vice President, Columbia Management Investment Advisers, LLC since May 2010; Managing Director of Fund Administration, Columbia Management Advisors, LLC, from September 2004 to April 2010; senior officer of Columbia Funds and affiliated funds since 2002. |
| |
| Scott R. Plummer (born 1959) | | |
5228 Ameriprise Financial Center Minneapolis, MN 55474 Senior Vice President, Secretary and Chief Legal Officer (since 2010) | | Chief Legal Officer and Assistant Secretary, Columbia Management Investment Advisers, LLC since June 2005; Vice President and Lead Chief Counsel–Asset Management, Ameriprise Financial, Inc. since May 2010 (previously Vice President and Chief Counsel–Asset Management, from 2005 to April 2010, and Vice President–Asset Management Compliance from 2004 to 2005); Vice President, Chief Counsel and Assistant Secretary, Columbia Management Investment Distributors, Inc. since 2008; Vice President, General Counsel and Secretary, Ameriprise Certificate Company since 2005; Chief Counsel, RiverSource Distributors, Inc. since 2006; Vice President, General Counsel and Secretary, RiverSource Funds, since December 2006; Senior Vice President, Secretary and Chief Legal Officer, Columbia Funds, since May 2010. |
| |
| Linda J. Wondrack (born 1964) | | |
One Financial Center Boston, MA 02111 Senior Vice President and Chief Compliance Officer (since 2007) | | Vice President and Chief Compliance Officer, Columbia Management Investment Advisers, LLC since May 2010; Chief Compliance Officer, Columbia Funds, since 2007, and RiverSource Funds, since May 2010; Director (Columbia Management Group, LLC and Investment Product Group Compliance), Bank of America, from June 2005 to April 2010; Director of Corporate Compliance and Conflicts Officer of MFS Investment Management (investment management) from August 2004 to May 2005. |
| |
| William F. Truscott (born 1960) | | |
53600 Ameriprise Financial Center Minneapolis, MN 55474 Senior Vice President (since 2010) | | Chairman of the Board, Columbia Management Investment Advisers, LLC since May 2010 (previously President, Chairman of the Board and Chief Investment Officer, from 2001 to April 2010); Chief Executive Officer, U.S. Asset Management & President, Annuities, Ameriprise Financial, Inc. since May 2010 (previously President–U.S. Asset Management and Chief Investment Officer from 2005 to April 2010, and Senior Vice President–Chief Investment Officer, from 2001 to 2005); Director, President and Chief Executive Officer, Ameriprise Certificate Company since 2006; Director, Columbia Management Investment Distributors, Inc. since May 2010 (previously Chairman of the Board and Chief Executive Officer from 2008 to April 2010); Chairman of the Board and Chief Executive Officer, RiverSource Distributors, Inc. since 2006. |
35
Fund Governance (continued)
Officers (continued)
| | |
| Name, Year of Birth and Address | | Principal Occupation(s) During the Past Five Years |
|
| Colin Moore (born 1958) |
One Financial Center Boston, MA 02111 Senior Vice President (since 2010) | | Director and Chief Investment Officer, Columbia Management Investment Advisers, LLC since May 2010; Manager, Managing Director and Chief Investment Officer of Columbia Management Advisors, LLC from 2007 to April 2010; Head of Equities, Columbia Management Advisors, LLC from 2002 to 2007. |
| |
| Amy Johnson (born 1965) | | |
5228 Ameriprise Financial Center Minneapolis, MN 55474 Senior Vice President (since 2010) | | Senior Vice President and Chief Operating Officer, Columbia Management Investment Advisers, LLC since May 2010 (previously Chief Administrative Officer, from 2009 until April 2010, Vice President–Asset Management and Trust Company Services, from 2006 to 2009, and Vice President–Operations and Compliance from 2004 to 2006). |
| |
| Joseph F. DiMaria (born 1968) | | |
One Financial Center Boston, MA 02111 Treasurer (since 2009) and Chief Accounting Officer (since 2008) | | Vice President, Mutual Fund Administration, Columbia Management Investment Advisers, LLC, since May 2010; Director of Fund Administration, Columbia Management Advisors, LLC from January 2006 to April 2010; Head of Tax/Compliance and Assistant Treasurer, Columbia Management Advisors, LLC, from November 2004 to December 2005. |
| |
| Marybeth Pilat (born 1968) | | |
One Financial Center Boston, MA 02111 Deputy Treasurer (since 2010) | | Vice President, Mutual Fund Administration, Columbia Management Investment Advisers, LLC, since May 2010; Vice President, Investment Operations, Bank of America, from October 2008 to April 2010; Finance Manager, Boston Children’s Hospital from August 2008 to October 2008; Director, Mutual Fund Administration, Columbia Management Advisors, LLC, from May 2007 to July 2008; Vice President, Mutual Fund Valuation, Columbia Management Advisors, LLC, from January 2006 to May 2007; Vice President, Mutual Fund Accounting Oversight, Columbia Management Advisors, LLC from January 2005 to January 2006. |
| |
| Julian Quero (born 1967) | | |
One Financial Center Boston, MA 02111 Deputy Treasurer (since 2008) | | Vice President, Mutual Fund Administration, Columbia Management Investment Advisers, LLC since May 2010; Director of Fund Administration, Columbia Management Advisors, LLC, from August 2008 to April 2010; Senior Tax Manager, Columbia Management Advisors, LLC from August 2006 to July 2008; Senior Compliance Manager, Columbia Management Advisors, LLC from April 2002 to August 2006. |
| |
| Stephen T. Welsh (born 1957) | | |
One Financial Center Boston, MA 02111 Vice President (since 2006) | | President and Director, Columbia Management Investment Services Corp. since May 2010; President and Director, Columbia Management Services, Inc. from July 2004 to April 2010; Managing Director, Columbia Management Distributors, Inc. from August 2007 to April 2010. |
36
Board Consideration and Approval of Advisory Agreements
In September 2010, the Board of Trustees (the “Board”) unanimously approved new Investment Management Services Agreements (the “Advisory Agreements”) on behalf of various Columbia funds that would increase or decrease the contractual investment advisory fee rates payable by each affected Columbia fund (each, an “Affected Fund”) to Columbia Management for investment advisory services. For Columbia Real Estate Equity Fund, the Advisory Agreement will decrease contractual investment advisory fee rates. As detailed below, the Board held numerous meetings and discussions with the management team of Columbia Management and reviewed and considered materials in connection with the approval of the investment advisory fee before determining to approve the Advisory Agreements.
On April 30, 2010, Ameriprise Financial, Inc. acquired the long-term asset management business of Columbia Management Group, LLC, a subsidiary of Bank of America and the parent of the Affected Funds’ former investment adviser. In connection with that acquisition, the Affected Funds entered into investment management services agreements with Columbia Management, a subsidiary of Ameriprise Financial, Inc.
Beginning in April 2010, Columbia Management presented to the Advisory Fees and Expenses Committee (the “Committee”) of the Board a proposal to rationalize the fees and expenses, including the advisory fees, of the various registered investment companies in the combined complex of Columbia-, RiverSource-, Seligman- and Threadneedle-branded funds (the “Columbia Funds Complex”). Because these funds were organized at different times by many different sponsors, their fees and expenses did not reflect a common overall design, and Columbia Management proposed to implement a more consistent schedule of fees for similar funds based on a uniform pricing model across all of the funds. In this regard, Columbia Management presented the Committee with various data comparing current and proposed fee schedules to the fee schedules of peer funds, as selected by an independent third-party data provider. While Columbia Management projected that the proposed rationalization would reduce the overall fees and expenses of all of the funds in the aggregate, it was expected that certain fees and expenses, including advisory fees, would increase for certain funds. At the same time, Columbia Management presented the Committee with proposals to provide for consistent administrative services fee schedules across funds in the same asset class, reduced custody fee rates and a consistent transfer agency fee schedule across the funds, as well as initial proposals to merge various funds. In connection with these proposals, the Committee and the trustees considered a proposal by Columbia Management to contractually limit the total operating expenses (exclusive of brokerage commissions, interest (but including custodial charges relating to overdrafts), taxes and extraordinary expenses, after giving effect to any balance credits from each fund’s custodian) of class A shares of funds, the expenses of which exceed the median expenses of such fund’s class A shares peer group (as determined from time to time, generally annually, by an independent third-party data provider), to such median expenses (or a lower, agreed-upon rate), and to limit the total expenses of such funds’ other classes to a corresponding amount, adjusted to reflect any class-specific expenses (including transfer agency fees and payments under any distribution plan, shareholder servicing plan, and/or plan administration agreement).
The Committee and the trustees who are not “interested persons” (as defined in the Investment Company Act of 1940 (the “1940 Act”)) of the Trust (the “Independent Trustees”) requested and evaluated materials from, and were provided materials and information regarding the Advisory Agreements by, Columbia Management. The Committee, at meetings held on April 20, 2010, May 3, 2010, June 7, 2010, July 27, 2010 and August 10, 2010, and the Independent Trustees, at meetings held on April 20, 2010, May 4, 2010, June 7, 2010 and August 11, 2010, reviewed the materials provided in connection with their consideration of the Advisory Agreements and other matters relating to the proposals and discussed them with representatives of Columbia Management. The Committee and the Independent Trustees also reviewed and considered information that they had previously received in connection with their most recent consideration and approval of the current investment management services agreements with Columbia Management. They also consulted with Fund counsel and with the Independent Trustees’ independent legal counsel, who advised on the legal standards for consideration by the trustees and otherwise assisted the trustees in their deliberations. The trustees also met with, and reviewed and considered a report prepared and provided by, the independent fee consultant (the “Fee Consultant”) appointed by the Independent Trustees pursuant to an assurance of
37
discontinuance entered into by Columbia Management Advisors, LLC, the Affected Funds’ previous adviser, with the New York Attorney General (“NYAG”) to settle a civil complaint filed by the NYAG relating to trading in mutual fund shares (the “NYAG Settlement”). Under the NYAG Settlement, the Fee Consultant’s role is to manage the process by which management fees are negotiated so that they are negotiated in a manner that is at arms’ length and reasonable. On August 10, 2010, the Committee recommended that the trustees approve the Advisory Agreements. On September 14, 2010, the trustees, including a majority of the Independent Trustees, approved the Advisory Agreement for each Affected Fund, subject to shareholder approval.
The trustees considered all materials that they, their legal counsel or Columbia Management believed reasonably necessary to evaluate and to determine whether to approve the Advisory Agreements. The factors considered by the Committee and the trustees in recommending approval and approving the Advisory Agreement for each Affected Fund included the following:
| n | | The expected benefits of continuing to retain Columbia Management as the Affected Funds’ investment manager; |
| n | | The terms and conditions of the Advisory Agreements, including the increase or decrease, as applicable, in the advisory fee schedule for each Affected Fund; |
| n | | The impact of the proposed changes in investment advisory fee rates, as well as proposed changes in administrative services, transfer agency and custody fee rates, on each Affected Fund’s total expense ratio; |
| n | | The willingness of Columbia Management to agree to contractually limit or cap total operating expenses for Columbia Real Estate Equity Fund so that total operating expenses (exclusive of brokerage commissions, interest (but including custodial charges relating to overdrafts), taxes and extraordinary expenses, after giving effect to any balance credits from each fund’s custodian) of class A shares would not exceed the median expenses of such fund’s class A shares peer group (as determined from time to time, generally annually, by an independent third-party data provider); |
| n | | That Columbia Management, and not any Affected Fund, would bear the costs of obtaining any necessary shareholder approvals of the Advisory Agreements; |
| n | | The expected impact on expenses for certain Affected Funds of proposed mergers; and |
| n | | The expected benefits of further integrating the Combined Fund Complex by: |
| | • | | Standardizing total management fees across similar funds in the Combined Fund Complex to promote comparability of pricing among a menu of funds available to investors, including through exchange privileges; and | |
| | • | | Aligning investment advisory fee rates across funds in the Combined Fund Complex that are in the same investment category (e.g., the amendment would align the investment advisory fee rates of Columbia Large Cap Growth Fund with those of all other actively managed large-cap funds in the Combined Fund Complex). | |
Nature, Extent and Quality of Services Provided under the Advisory Agreements
The trustees considered the nature, extent and quality of services provided to the Affected Funds by Columbia Management and its affiliates under the Advisory Agreements and under separate agreements for the provision of transfer agency and administrative services, and the resources dedicated to the Affected Funds by Columbia Management and its affiliates. The trustees considered, among other things, the ability of Columbia Management to attract, motivate and retain highly qualified research, advisory and supervisory investment professionals (including Columbia Management’s personnel and other resources, compensation programs for personnel involved in fund management, reputation and other attributes), the portfolio management services provided by those investment professionals, the trade execution services provided on behalf of the Affected Funds and the quality of Columbia Management’s investment research capabilities and the other resources that it devotes to each Affected Fund. For each Affected Fund, the trustees also considered the potential benefits to shareholders of investing in a mutual fund that is part of a fund complex offering exposure to a variety of asset classes and investment disciplines and providing a variety of fund and shareholder services. After reviewing these and related factors, the trustees concluded, within the context of their overall conclusions, that the nature, extent and quality
38
of the services to be provided to each Affected Fund under the Advisory Agreements supported the approval of the Advisory Agreements.
Investment Performance
The trustees reviewed information about the performance of each Affected Fund over various time periods, including information prepared by an independent third-party data provider that compared the performance of each Affected Fund to the performance of peer groups of mutual funds and performance benchmarks. The trustees also reviewed a description of the third party’s methodology for identifying each Fund’s peer group for purposes of performance and expense comparisons. In the case of each Affected Fund whose performance lagged that of a relevant peer group for certain (although not necessarily all) periods, the trustees concluded that other factors relevant to performance were sufficient, in light of other considerations, to warrant approval of the Affected Fund’s Advisory Agreement. Those factors varied from fund to fund, but included one or more of the following: (i) that the Affected Fund’s performance, although lagging in certain recent periods, was stronger over the longer term; (ii) that the underperformance was attributable, to a significant extent, to investment decisions that were reasonable and consistent with the Affected Fund’s investment strategy and policies and that the Affected Fund was performing within a reasonable range of expectations, given those investment decisions, market conditions and the Affected Fund’s investment strategy; (iii) that the Affected Fund’s performance was competitive when compared to other relevant performance benchmarks or peer groups; and (iv) that Columbia Management had taken or was taking steps designed to help improve the Affected Fund’s investment performance, including, but not limited to, replacing portfolio managers, enhancing the resources supporting the portfolio managers, or modifying investment strategies.
The trustees noted that, through February 28, 2010, Columbia Real Estate Equity Fund’s performance was in the fifth quintile (where the best performance would be in the first quintile) for the one-year period, in the second quintile for the three-year period and in the third quintile for the five-year period of the peer group selected by an independent third-party data provider for the purposes of performance comparisons.
After reviewing those and related factors, the trustees concluded, within the context of their overall conclusions regarding each of the Advisory Agreements, that the performance of each Affected Fund and Columbia Management was sufficient, in light of other considerations, to warrant the approval of the Advisory Agreement pertaining to that Affected Fund.
Investment Advisory Fee Rates and Other Expenses
The trustees considered that the Advisory Agreement for Columbia Real Estate Equity Fund would decrease the contractual investment advisory fee rates payable by that Fund and would be otherwise identical to that Fund’s current investment management services agreement. The trustees reviewed and considered information that they had previously received in connection with the most recent approval of Columbia Real Estate Equity Fund’s current investment management services agreement with Columbia Management.
After reviewing these and related factors, the trustees concluded, within the context of their overall conclusions, that the advisory fee rates under the Advisory Agreements and anticipated total expenses of each Affected Fund supported the approval of the Advisory Agreements.
Costs of Services Provided and Profitability
The trustees considered information about the advisory fees charged by Columbia Management to comparable institutional accounts. In considering the fees charged to those accounts, the trustees took into account, among other things, Columbia Management’s representations about the differences between managing mutual funds as compared to other types of accounts, including differences in the services provided, differences in the risk profile of such business for Columbia Management, and the additional resources required to manage mutual funds effectively. In evaluating each Affected Fund’s proposed advisory fees, the trustees also took into account the demands, complexity and quality of the investment management of the Affected Fund.
The trustees also considered the compensation directly or indirectly received by Columbia Management and its affiliates in connection with their relationships with the Affected Funds. The trustees reviewed information provided
39
by management as to the projected profitability to Columbia Management and its affiliates of their relationships with each Affected Fund, and information about the allocation of expenses used to calculate profitability. When reviewing profitability, the trustees also considered court cases in which adviser profitability was an issue in whole or in part, the performance of the relevant Affected Funds, the current and anticipated expense levels of each Affected Fund, and the implementation of breakpoints and/or expense limitations with respect to each Affected Fund.
After reviewing those and related factors, the trustees concluded, within the context of their overall conclusions, that the proposed changes to the advisory fees, and the related profitability to Columbia Management and its affiliates of their relationships with the Affected Fund, supported the approval of the Advisory Agreement pertaining to that Affected Fund.
Economies of Scale
The trustees considered the existence of any economies of scale in the provision by Columbia Management of services to each Affected Fund, to groups of related funds and to Columbia Management’s investment advisory clients as a whole, and whether those economies of scale were shared with the Affected Funds through breakpoints in the proposed investment advisory fees or other means, such as expense limitation arrangements and additional investments by Columbia Management in investment, trading and compliance resources. The trustees noted that all of the Affected Funds were expected to benefit from breakpoints and/or expense limitation arrangements. In considering those issues, the trustees also took note of the costs of the services to be provided (both on an absolute and relative basis) and the projected profitability to Columbia Management and its affiliates of their relationships with the Affected Funds, as discussed above. The trustees also noted the expected expense synergies and other anticipated benefits to Columbia Management and fund shareholders of both the rationalization of fees and expenses and the proposed mergers of certain Affected Funds. After reviewing these and related factors, the trustees concluded, within the context of their overall conclusions, that the extent to which economies of scale were expected to be shared with the Affected Funds supported the approval of the Advisory Agreements.
Other Benefits to Columbia Management
The trustees received and considered information regarding any expected “fall-out” or ancillary benefits to be received by Columbia Management and its affiliates as a result of their relationships with the Affected Funds, such as the provision by Columbia Management of administrative services to the Affected Funds and the provision by Columbia Management’s affiliates of distribution and transfer agency services to the Affected Funds, and how the proposed rationalization of fees and expenses might affect such benefits, including the fact that to the extent fees payable by the Affected Funds decrease, and the fees for such Funds were subject to a contractual limit or cap on expenses, Columbia Management may pay less in expense reimbursements. The trustees considered that the Affected Funds’ distributor, an affiliate of Columbia Management, retains a portion of the distribution fees from the Affected Funds and receives a portion of the sales charges on sales or redemptions of certain classes of shares of the Affected Funds, and that other affiliates of Columbia Management receive various forms of compensation in connection with their sale of shares of the Affected Funds. The trustees also considered the benefits of research made available to Columbia Management by reason of brokerage commissions generated by the Affected Funds’ securities transactions, and reviewed information about Columbia Management’s practices with respect to allocating portfolio brokerage and the use of “soft” commission dollars to pay for research. The trustees considered the possible conflicts of interest associated with certain fall-out or other ancillary benefits and the reporting, disclosure and other processes that would be in place to disclose and to monitor such possible conflicts of interest. The trustees recognized that Columbia Management’s profitability would be somewhat lower without these benefits.
In their deliberations, the trustees did not identify any single item that was paramount or controlling and individual trustees may have attributed different weights to various factors. The trustees also evaluated all information available to them on a fund-by-fund basis, and their determinations were made separately in respect of each Affected Fund.
Based on their evaluation of all factors that they deemed to be material, including those factors described above, and assisted by the advice of independent legal counsel and the Fee Consultant, the trustees, including the Independent Trustees, approved each Advisory Agreement.
40
Summary of Management Fee Evaluation by Independent Fee Consultant
REPORT OF INDEPENDENT FEE CONSULTANT TO THE FUNDS
SUPERVISED BY THE COLUMBIA ATLANTIC BOARD
Prepared Pursuant to the February 9, 2005 Assurance of Discontinuance among the Office of Attorney General of New York State, Columbia Management Advisors, LLC, and Columbia Management Distributors, Inc. September 21, 2010
I. Overview
On February 9, 2005, Columbia Management Advisors, LLC (“CMA”) and Columbia Management Distributors, Inc.1 (“CMD”) agreed to the New York Attorney General’s Assurance of Discontinuance (“AOD”). Among other things, the AOD stipulates that CMA may manage or advise a Columbia Fund (“Columbia Fund” and, together with some or all of such funds, the “Columbia Funds”) only if the Independent Members of the Columbia Fund’s Board of Trustees appoint a Senior Officer or retain an Independent Fee Consultant (“IFC”) who is to manage the process by which proposed management fees are negotiated. The AOD further stipulates that the Senior Officer or IFC is to prepare a written annual evaluation of the fee negotiation process.
With effect from January 1, 2007, the Independent Members of the Board of Trustees for certain Columbia Funds known collectively as the “Atlantic Funds” (together with the other members of that Board, the “Trustees”) retained me as IFC for the Atlantic Funds.2 In this capacity, I have prepared this written evaluation of the fee negotiation process. As has been the case with my previous reports, my immediate predecessor as IFC, John Rea, provided invaluable assistance in the preparation of this report.
On September 29, 2009, Ameriprise entered into an asset purchase agreement with Bank of America, N.A. and its parent, Bank of America Corporation (together, the “Bank”) pursuant to which the Bank agreed to sell certain CMG assets relating to Columbia’s long-term asset management business, including management of the Atlantic Funds (the “Transaction”). The Transaction, which closed on April 30, 2010,3 resulted in the termination of the existing Investment Management Agreements with CMA. Prior to the closing of the Transaction, the Trustees and the shareholders of the Funds approved new Advisory and Administrative Agreements with an Ameriprise subsidiary now called Columbia Management Investment Advisers, LLC (“CMIA”). Those Agreements did not change the rates paid by the Funds from the levels specified in the former agreements with CMA.
CMIA serves as the adviser of funds supervised by three different Boards of Trustees: the Atlantic, Nations, and RiverSource Boards, and a subsidiary of CMIA serves as adviser to funds overseen by a fourth Board, Columbia/Wanger. After reviewing the range of funds overseen by all four Boards, CMIA proposed a series of changes intended, among other things, to rationalize its mutual fund product offerings (by, for example, proposing to merge funds with similar investment strategies) and the fees charged to the funds by CMIA and its affiliates. These proposals included (1) changes to the advisory fees paid by certain funds, (2) changes to administrative and similar fees paid by certain funds, (3) changes to the transfer agency, sub-transfer agency, custody, and pricing/bookkeeping fees paid by the Funds, and (4) mergers involving more than 60 funds. CMIA asked the Trustees to consider these proposals together. This report, consistent with and (to the extent applicable) in fulfillment of the terms of the AOD, will focus on changes to advisory and aggregate management fees and discuss other proposals insofar as they affect total fund expenses, which may be a relevant factor in considering the appropriate level of advisory and management fees (defined for purposes of this report as advisory plus administrative fees).
| 1 | CMA and CMD are subsidiaries of Columbia Management Group, LLC (“CMG”), and are the successors to the entities named in the AOD. |
| 2 | I have no material relationship with Bank of America, CMG or Ameriprise Financial, Inc. (“Ameriprise”), aside from serving as IFC, and I am aware of no material relationship with any of their affiliates. I retained John Rea, an independent economic consultant, to assist me with this report. |
| | Unless otherwise stated or required by the context, this report covers only the Atlantic Funds. |
| 3 | CMIA, Materials Prepared for the Atlantic Fees and Expense Committee, June 7, 2010 (“June 7 Materials”), Tab 1 at p. 1. |
41
A. Role of the Independent Fee Consultant
The AOD charges the IFC with “managing the process by which proposed management fees … to be charged the Columbia Fund are negotiated so that they are negotiated in a manner which is at arms’ length and reasonable and consistent with this Assurance of Discontinuance.” The AOD also provides that CMA “may manage or advise a Columbia Fund only if the reasonableness of the proposed management fees is determined by the Board of Trustees … using … an annual independent written evaluation prepared by or under the direction of … the Independent Fee Consultant.” Therefore, the AOD makes clear that the IFC does not supplant the Trustees in negotiating management fees, nor does the IFC substitute his or her judgment for that of the Trustees with respect to the reasonableness of proposed fees or any other matter that is committed to the business judgment of the Trustees.
B. Elements Involved in Managing the Fee Negotiation Process
In preparing the report required by the AOD, the IFC must consider at least the following six factors set forth in the AOD:
| 1. | The nature and quality of the adviser’s services, including the Fund’s performance; |
| 2. | Management fees (including any components thereof) charged by other mutual fund companies for like services; |
| 3. | Possible economies of scale as the Fund grows larger; |
| 4. | Management fees (including any components thereof) charged to institutional and other clients of the adviser for like services; |
| 5. | Costs to the adviser and its affiliates of supplying services pursuant to the management fee agreements, excluding any intra-corporate profit; and |
| 6. | Profit margins of the adviser and its affiliates from supplying such services. |
II. Findings
| 1. | Based upon my examination of the information supplied by CMIA and Ameriprise in the light of the six factors set forth in the AOD, I conclude that the Trustees have the relevant information necessary to evaluate the reasonableness of the proposed contractual advisory and/or administrative fee changes at any asset level for each affected Atlantic Fund (each a “Fee Change Fund”). |
| 2. | In my view, the process by which the proposed management fees of each Fee Change Fund have been negotiated with CMIA thus far has been, to the extent practicable, at arm’s length and reasonable and consistent with the AOD. |
| 3. | There are 25 Funds for which CMIA has proposed an increase either in the contractual advisory or management fee (each a “Fee Increase Fund”). Seven of these Funds have a combination of higher contractual advisory fees and either lower or unchanged contractual management fees. The remaining 18 Funds have higher contractual management fees with the majority resulting from higher contractual advisory fees. For five Funds, however, the higher management fees result from a combination of lower advisory fees and higher administrative fees. |
| 4. | The actual management fee, computed on the basis of assets as of October 31, 2009, would increase for 16 of the Fee Increase Funds after accounting for CMIA’s proposed expense limitation program, non-management fee changes, and proposed mergers. Seven Funds would have lower actual management fees, and two would experience no change in actual management fees. |
| 5. | Sixteen of the 25 Fee Increase Funds have generally median or better-than-median performance. Only one Fee Increase Fund — High Yield Opportunity Fund — would be identified for further review based on performance criteria used by the Trustees in past contract review processes. |
| 6. | CMIA proposed that the Funds and most other mutual funds it or its affiliates advise or sponsor (together, the “CMIA Funds”) be subject to a contractual expense limitation calculated as the median of the relevant fund’s Lipper expense group. As a result, all Fee Increase Funds are projected to have total expenses in the first, second, or third quintiles after full implementation of the proposed fee changes, expense limitations, and mergers. The expense limitation would be recalculated every year based on updated Lipper data. An analysis of the changes in median expenses for 2009 and 2010 indicates that some Funds are likely to experience sizable changes in their expense limits. Some Funds would have higher-than-median actual management fees notwithstanding the newly-established expense limitations. |
42
| 7. | CMIA reviewed differences between management of retail mutual funds and advising institutional accounts and supplied charts plotting contractual and actual institutional and fund fees against assets in various investment categories. The data showed that mutual fund fees are often lower at small asset levels reflecting CMIA’s reimbursement of fund expenses. At higher asset levels, mutual fund fees typically exceed institutional fees. |
| 8. | CMIA provided fund-by-fund projected profitability data. Due to the significant changes in the operations of the Funds (including the change of the Funds’ investment adviser), historical profitability data was judged to have little relevance. |
| 9. | CMIA provided projections of both the cumulative benefit to CMIA Fund shareholders of all aspects of its proposals (including proposed mergers) and the synergies in the form of decreased expenses that would benefit CMIA and its parent, Ameriprise. |
43
[THIS PAGE INTENTIONALLY LEFT BLANK]
44
Important Information About This Report
The fund mails one shareholder report to each shareholder address. If you would like more than one report, please call shareholder services at 1-800-345-6611 and additional reports will be sent to you. This report has been prepared for shareholders of Columbia Real Estate Equity Fund.
A description of the policies and procedures that the fund uses to determine how to vote proxies and a copy of the fund’s voting records are available (i) at www.columbiamanagement.com, (ii) on the Securities and Exchange Commission’s website at www.sec.gov, and (iii) without charge, upon request, by calling 1-800-368-0346. Information regarding how the fund voted proxies relating to portfolio securities during the 12-month period ended June 30 is available from the SEC’s website. Information regarding how the fund voted proxies relating to portfolio securities is also available from the fund’s website, www.columbiamanagement.com.
The fund files a complete schedule of portfolio holdings with the SEC for the first and third quarters of each fiscal year on Form N-Q. The fund’s Form N-Q is available on the SEC’s website at www.sec.gov and may be reviewed and copied at the SEC’s Public Reference Room in Washington, D.C. Information on the operation of the Public Reference Room may be obtained by calling
1-800-SEC-0330.
Transfer Agent
Columbia Management Investment Services Corp.
P.O. Box 8081
Boston, MA 02266-8081
1-800-345-6611
Distributor
Columbia Management Investment
Distributors, Inc.
One Financial Center
Boston, MA 02111
Investment Adviser
Columbia Management Investment Advisers, LLC
100 Federal Street
Boston, MA 02110
45

Columbia Real Estate Equity Fund
P.O. Box 8081
Boston, MA 02266-8081
columbiamanagement.com
This information is for use with concurrent or prior delivery of a fund prospectus. Investors should consider the investment objectives, risks, charges and expenses of a mutual fund carefully before investing. For a free prospectus, which contains this and other important information about the funds, visit columbiamanagement.com. Read the prospectus carefully before investing. The Fund is distributed by Columbia Management Investment Distributors, Inc., member FINRA, and managed by Columbia Management Investment Advisers, LLC.
©2011 Columbia Management Investment Advisers, LLC. All rights reserved.
C-1441 A (2/11)
Item 2. Code of Ethics.
| | (a) | The registrant has adopted a code of ethics that applies to the registrant’s principal executive officer, principal financial officer, principal accounting officer or controller, or persons performing similar functions, regardless of whether these individuals are employed by the registrant or a third party. |
| | (b) | During the period covered by this report, there were not any amendments to a provision of the code of ethics adopted in 2(a) above. |
| | (c) | During the period covered by this report, there were no waivers, including any implicit waivers, from a provision of the code of ethics described in 2(a) above that relates to one or more of the items set forth in paragraph (b) of this item’s instructions. |
Item 3. Audit Committee Financial Expert.
The registrant’s Board of Trustees has determined that John D. Collins, Douglas A. Hacker, Charles R. Nelson and Anne-Lee Verville, each of whom are members of the registrant’s Board of Trustees and Audit Committee, each qualify as an audit committee financial expert. Mr. Collins, Mr. Hacker, Mr. Nelson and Ms. Verville are each independent trustees, as defined in paragraph (a)(2) of this item’s instructions.
Item 4. Principal Accountant Fees and Services.
Fee information below is disclosed for the one series of the registrant whose report to stockholders is included in this annual filing. This series changed its fiscal year end from August 31 to December 31 in 2009.
(a) Audit Fees. Aggregate Audit Fees billed by the principal accountant for professional services rendered during the fiscal years ended December 31, 2010 and December 31, 2009 are approximately $30,800 and $28,400, respectively.
Audit Fees include amounts related to the audit of the registrant’s annual financial statements or services that are normally provided by the accountant in connection with statutory and regulatory filings or engagements for those fiscal years. Fiscal year 2010 also includes audit fees for the review of and provision of consent in connection with filing Form N-1A for a new share class.
(b) Audit-Related Fees. Aggregate Audit-Related Fees billed to the registrant by the principal accountant for professional services rendered during the fiscal years ended December 31, 2010 and December 31, 2009 are approximately $9,600 and $0, respectively.
Audit-Related Fees include amounts for assurance and related services by the principal accountant that are reasonably related to the performance of the audit of the registrant’s financial statements and are not reported in Audit Fees above. In both fiscal years 2010
and 2009, Audit-Related Fees consist of agreed-upon procedures performed for semi-annual shareholder reports. Fiscal year 2010 also includes Audit-Related Fees for agreed- upon procedures related to fund mergers.
During the fiscal years ended December 31, 2010 and December 31, 2009, there were no Audit-Related Fees billed by the registrant’s principal accountant to the registrant’s investment adviser (not including any sub-adviser whose role is primarily portfolio management and is subcontracted with or overseen by another investment adviser) and any entity controlling, controlled by, or under common control with the adviser that provides ongoing services to the registrant for an engagement that related directly to the operations and financial reporting of the registrant.
(c) Tax Fees. Aggregate Tax Fees billed by the principal accountant to the registrant for professional services rendered during the fiscal years ended December 31, 2010 and December 31, 2009 are approximately $4,000 and $0, respectively.
Tax Fees include amounts for the review of annual tax returns, the review of required shareholder distribution calculations and typically include amounts for professional services by the principal accountant for tax compliance, tax advice and tax planning.
During the fiscal years ended December 31, 2010 and December 31, 2009, there were no Tax Fees billed by the registrant’s principal accountant to the registrant’s investment adviser (not including any sub-adviser whose role is primarily portfolio management and is subcontracted with or overseen by another investment adviser) and any entity controlling, controlled by, or under common control with the adviser that provides ongoing services to the registrant for an engagement that related directly to the operations and financial reporting of the registrant.
(d) All Other Fees. There were no aggregate All Other Fees billed by the principal accountant to the registrant for professional services rendered during the fiscal years ended December 31, 2010 and December 31, 2009.
All Other Fees include amounts for products and services provided by the principal accountant, other than the services reported in paragraphs (a) through (c) above.
Aggregate All Other Fees billed by the registrant’s principal accountant to the registrant’s investment adviser (not including any sub-adviser whose role is primarily portfolio management and is subcontracted with or overseen by another investment adviser) and any entity controlling, controlled by, or under common control with the adviser that provides ongoing services to the registrant for an engagement that related directly to the operations and financial reporting of the registrant during the fiscal years ended December 31, 2010 and December 31, 2009 are approximately $995,300 and $1,037,000, respectively.
In both fiscal years 2010 and 2009, All Other Fees consist of fees billed for internal control examinations of the registrant’s transfer agent and investment advisor. Fiscal
year 2009 also includes fees for agreed upon procedures related to the sale of the long-term asset management business. Fiscal year 2010 also includes fees related to the review of revenue modeling schedules.
(e)(1) Audit Committee Pre-Approval Policies and Procedures
The registrant’s Audit Committee is required to pre-approve the engagement of the registrant’s independent accountants to provide audit and non-audit services to the registrant and non-audit services to its investment adviser (not including any sub-adviser whose role is primarily portfolio management and is subcontracted with or overseen by another investment adviser) or any entity controlling, controlled by or under common control with such investment adviser that provides ongoing services to the registrant (“Adviser Affiliates”), if the engagement relates directly to the operations and financial reporting of the registrant.
The Audit Committee has adopted a Policy for Engagement of Independent Accountants for Audit and Non-Audit Services (“Policy”). The Policy sets forth the understanding of the Audit Committee regarding the engagement of the registrant’s independent accountants to provide (i) audit and permissible audit-related, tax and other services to the registrant (collectively “Fund Services”); (ii) non-audit services to the registrant’s investment adviser (not including any sub-adviser whose role is primarily portfolio management and is subcontracted with or overseen by another investment adviser) and Adviser Affiliates, if the engagement relates directly to the operations or financial reporting of a Fund (collectively “Fund-related Adviser Services”); and (iii) certain other audit and non-audit services to the registrant’s investment adviser (not including any sub-adviser whose role is primarily portfolio management and is subcontracted with or overseen by another investment adviser) and Adviser Affiliates. Unless a type of service receives general pre-approval under the Policy, it requires specific pre-approval by the Audit Committee if it is to be provided by the independent accountants. Pre-approval of non-audit services to the registrant, the registrant’s investment adviser (not including any sub-adviser whose role is primarily portfolio management and is subcontracted with or overseen by another investment adviser) and Adviser Affiliates may be waived provided that the “de minimis” requirements set forth under paragraph (c)(7)(i)(C) of Rule 2-01 of Regulation S-X are met.
Under the Policy, the Audit Committee may delegate pre-approval authority to any pre-designated member or members who are Independent Trustees/Directors. The member(s) to whom such authority is delegated must report, for informational purposes only, any pre-approval decisions to the Audit Committee at its next regular meeting. The Audit Committee’s responsibilities with respect to the pre-approval of services performed by the independent accountants may not be delegated to management.
The Policy requires the Fund Treasurer and/or Director of Board Administration to submit to the Audit Committee, on an annual basis, a schedule of the types of services that are subject to general pre-approval. The schedule(s) provide a description of each type of service that is subject to general pre-approval and, where possible, will provide
estimated fee caps for each instance of providing each service. The Audit Committees will review and approve the types of services and review the projected fees for the next fiscal year and may add to, or subtract from, the list of general pre-approved services from time to time based on subsequent determinations. That approval acknowledges that the Audit Committee is in agreement with the specific types of services that the independent accountants will be permitted to perform.
The Fund Treasurer and/or Director of Board Administration shall report to the Audit Committee at each of its regular meetings regarding all Fund Services or Fund-related Adviser Services initiated since the last such report was rendered, including a general description of the services, actual billed and projected fees, and the means by which such Fund Services or Fund-related Adviser Services were pre-approved by the Audit Committee.
*****
(e)(2) The percentage of services described in paragraphs (b) through (d) of this Item approved pursuant to the “de minimis” exception under paragraph (c)(7)(i)(C) of Rule 2-01 of Regulation S-X during both fiscal years ended December 31, 2010 and December 31, 2009 was zero.
(f) Not applicable.
(g) The aggregate non-audit fees billed by the registrant’s accountant for services rendered to the registrant, and rendered to the registrant’s investment adviser (not including any sub-adviser whose role is primarily portfolio management and is subcontracted with or overseen by another investment adviser), and any entity controlling, controlled by, or under common control with the adviser that provides ongoing services to the registrant for the fiscal years ended December 31, 2010 and December 31, 2009 are approximately $1,008,900 and $1,037,000, respectively.
(h) The registrant’s Audit Committee of the Board of Directors has considered whether the provision of non-audit services that were rendered to the registrant’s adviser (not including any sub-adviser whose role is primarily portfolio management and is subcontracted with or overseen by another investment adviser), and any entity controlling, controlled by, or under common control with the investment adviser that provides ongoing services to the registrant that were not pre-approved pursuant to paragraph (c)(7)(ii) of Rule 2-01 of Regulation S-X, is compatible with maintaining the principal accountant’s independence.
Item 5. Audit Committee of Listed Registrants.
Not applicable.
Item 6. Investments
| | (a) | The registrant’s “Schedule I – Investments in securities of unaffiliated issuers” (as set forth in 17 CFR 210.12-12) is included in Item 1 of this Form N-CSR. |
Item 7. Disclosure of Proxy Voting Policies and Procedures for Closed-End Management Investment Companies.
Not applicable.
Item 8. Portfolio Managers of Closed-End Management Investment Companies.
Not applicable.
Item 9. Purchases of Equity Securities by Closed-End Management Investment Company and Affiliated Purchasers.
Not applicable.
Item 10. Submission of Matters to a Vote of Security Holders.
There were no material changes to the procedures by which shareholders may recommend nominees to the registrant’s board of directors.
Item 11. Controls and Procedures.
| | (a) | The registrant’s principal executive officer and principal financial officers, based on their evaluation of the registrant’s disclosure controls and procedures as of a date within 90 days of the filing of this report, have concluded that such controls and procedures are adequately designed to ensure that material information required to be disclosed by the registrant in Form N-CSR is accumulated and communicated to the registrant’s management, including the principal executive officer and principal financial officer, or persons performing similar functions, as appropriate to allow timely decisions regarding required disclosure. |
| | (b) | There was no change in the registrant’s internal control over financial reporting that occurred during the registrant’s second fiscal quarter of the period covered by this report that has materially affected, or is reasonably likely to materially affect, the registrant’s internal control over financial reporting. |
Item 12. Exhibits.
(a)(1) Code of ethics required to be disclosed under Item 2 of Form N-CSR attached hereto as Exhibit 99.CODE ETH.
(a)(2) Certifications pursuant to Rule 30a-2(a) under the Investment Company Act of 1940 (17 CFR 270.30a-2(a)) attached hereto as Exhibit 99.CERT.
(a)(3) Not applicable.
(b) Certification pursuant to Rule 30a-2(b) under the Investment Company Act of 1940 (17 CFR 270.30a-2(b)) attached hereto as Exhibit 99.906CERT.
SIGNATURES
Pursuant to the requirements of the Securities Exchange Act of 1934 and the Investment Company Act of 1940, the registrant has duly caused this report to be signed on its behalf by the undersigned, thereunto duly authorized.
| | |
| (registrant) | | Columbia Funds Series Trust I |
| |
| By (Signature and Title) | | /s/ J. Kevin Connaughton |
| | J. Kevin Connaughton, President |
| |
| Date | | February 18, 2011 |
Pursuant to the requirements of the Securities Exchange Act of 1934 and the Investment Company Act of 1940, this report has been signed below by the following persons on behalf of the registrant and in the capacities and on the dates indicated.
| | |
| By (Signature and Title) | | /s/ J. Kevin Connaughton |
| | J. Kevin Connaughton, President |
| |
| Date | | February 18, 2011 |
| |
| By (Signature and Title) | | /s/ Michael G. Clarke |
| | Michael G. Clarke, Chief Financial Officer |
| |
| Date | | February 18, 2011 |
