UNITED STATES
SECURITIES AND EXCHANGE COMMISSION
Washington, D.C. 20549
FORM N-CSR
CERTIFIED SHAREHOLDER REPORT OF REGISTERED
MANAGEMENT INVESTMENT COMPANIES
Investment Company Act file number 811-04367
|
| Columbia Funds Series Trust I |
(Exact name of registrant as specified in charter)
|
| 225 Franklin Street, Boston, Massachusetts 02110 |
(Address of principal executive offices) (Zip code)
|
Scott R. Plummer 5228 Ameriprise Financial Center Minneapolis, MN 55474 |
(Name and address of agent for service)
Registrant’s telephone number, including area code: 1-612-671-1947
Date of fiscal year end: March 31
Date of reporting period: March 31, 2011
Form N-CSR is to be used by management investment companies to file reports with the Commission not later than 10 days after the transmission to stockholders of any report that is required to be transmitted to stockholders under Rule 30e-1 under the Investment Company Act of 1940 (17 CFR 270.30e-1). The Commission may use the information provided on Form N-CSR in its regulatory, disclosure review, inspection, and policymaking roles.
A registrant is required to disclose the information specified by Form N-CSR, and the Commission will make this information public. A registrant is not required to respond to the collection of information contained in Form N-CSR unless the Form displays a currently valid Office of Management and Budget (“OMB”) control number. Please direct comments concerning the accuracy of the information collection burden estimate and any suggestions for reducing the burden to Secretary, Securities and Exchange Commission, 450 Fifth Street, NW, Washington, DC 20549-0609. The OMB has reviewed this collection of information under the clearance requirements of 44 U.S.C. § 3507.
Item 1. Reports to Stockholders.

Columbia Corporate Income Fund
Annual Report for the Period Ended March 31, 2011
Table of contents
The views expressed in this report reflect the current views of the respective parties. These views are not guarantees of future performance and involve certain risks, uncertainties and assumptions that are difficult to predict, so actual outcomes and results may differ significantly from the views expressed. These views are subject to change at any time based upon economic, market or other conditions and the respective parties disclaim any responsibility to update such views. These views may not be relied on as investment advice and, because investment decisions for a Columbia Fund are based on numerous factors, may not be relied on as an indication of trading intent on behalf of any particular Columbia Fund. References to specific securities should not be construed as a recommendation or investment advice.
President’s Message

Dear Shareholder:
The Columbia Management story began over 100 years ago, and today, we are one of the nation’s largest dedicated asset managers. The recent acquisition by Ameriprise Financial, Inc. brings together the talents, resources and capabilities of Columbia Management with those of RiverSource Investments, Threadneedle (acquired by Ameriprise in 2003) and Seligman Investments (acquired by Ameriprise in 2008) to build a best-in-class asset management business that we believe is truly greater than its parts.
RiverSource Investments traces its roots to 1894 when its then newly-founded predecessor, Investors Syndicate, offered a face-amount savings certificate that gave small investors the opportunity to build a safe and secure fund for retirement, education or other special needs. A mutual fund pioneer, Investors Syndicate launched Investors Mutual Fund in 1940. In the decades that followed, its mutual fund products and services lineup grew to include a full spectrum of styles and specialties. More than 110 years later, RiverSource continues to be a trusted financial products leader.
Threadneedle, a leader in global asset management and one of Europe’s largest asset managers, offers sophisticated international experience from a dedicated U.K. management team. Headquartered in London, it is named for Threadneedle Street in the heart of the city’s financial district, where British investors pioneered international and global investing. Threadneedle was acquired in 2003 and today operates as an affiliate of Columbia Management.
Seligman Investments’ beginnings date back to the establishment of the investment firm J. & W. Seligman & Co. in 1864. In the years that followed, Seligman played a major role in the geographical expansion and industrial development of the United States. In 1874, President Ulysses S. Grant named Seligman as fiscal agent for the U.S. Navy — an appointment that would last through World War I. Seligman helped finance the westward path of the railroads and the building of the Panama Canal. The firm organized its first investment company in 1929 and began managing its first mutual fund in 1930. In 2008, J. & W. Seligman & Co. Incorporated was acquired and Seligman Investments became an offering brand of RiverSource Investments, LLC.
We are proud of the rich and distinctive history of these firms, the strength and breadth of products and services they offer, and the combined cultures of pioneering spirit and forward thinking. Together we are committed to providing more for our shareholders than ever before.
| n | | A singular focus on our shareholders. Our business is asset management, so investors are our first priority. We dedicate our resources to identifying timely investment opportunities and provide a comprehensive choice of equity, fixed-income and alternative investments to help meet your individual needs. |
| n | | First-class research and thought leadership. We are dedicated to helping you take advantage of today’s opportunities and anticipate tomorrow’s. We stay abreast of the latest investment trends and ideas, using our collective insight to evaluate events and transform them into solutions you can use. |
| n | | A disciplined investment approach. We aren’t distracted by passing fads. Our teams adhere to a rigorous investment process that helps ensure the integrity of our products and enables you and your financial advisor to match our solutions to your objectives with confidence. |
When you choose Columbia Management, you can be confident that we will take the time to understand your needs and help you and your financial advisor identify the solutions that are right for you. Because at Columbia Management, we don’t consider ourselves successful unless you are.
Sincerely,

J. Kevin Connaughton
President, Columbia Funds
Investors should consider the investment objectives, risks, charges and expenses of a mutual fund carefully before investing. For a free prospectus, which contains this and other important information about the funds, visit www.columbiamanagement.com. The prospectus should be read carefully before investing.
Columbia Funds are distributed by Columbia Management Investment Distributors, Inc., member FINRA, and managed by Columbia Management Investment Advisers, LLC.
© 2011 Columbia Management Investment Advisers, LLC. All rights reserved.
Fund Profile – Columbia Corporate Income Fund
Summary
| n | | For the 12-month period that ended March 31, 2011, the fund’s Class A shares returned 7.43% without sales charge. |
| n | | The fund’s return was higher than the return of the Barclays Capital Credit Bond Index1 and slightly lower than the return of its blended benchmark2 and the average return of the funds in its peer group, the Lipper Corporate Debt Funds BBB-Rated Classification.3 |
| n | | The fund had more exposure than the Barclays Capital Credit Bond Index to financials and preferred securities, which contributed to its outperformance relative to that measure. The fund’s allocation to high-yield securities also bolstered performance. |
Portfolio Management
Brian Lavin has co-managed the fund since 2010 and has been associated with the fund’s adviser or the fund’s previous adviser or its predecessors since 1994.
Tom Murphy has co-managed the fund since 2011 and has been associated with the fund’s adviser or its predecessors since 2002.
Tim Doubek has co-managed the fund since 2011 and has been associated with the fund’s adviser or its predecessors since 2001.
| 1 | The Barclays Capital Credit Bond Index is an index of publicly issued investment grade, corporate securities and dollar-denominated SEC registered global debentures. |
| 2 | A weighted custom composite of the Barclays Capital Credit Bond Index (85%) and JPMorgan Global High Yield Index (15%) established by the advisor. The JPMorgan Global High Yield Index is designed to mirror the investable universe of the U.S. dollar global high yield corporate debt market including domestic and international issues. |
| 3 | Lipper Inc., a widely respected data provider in the industry, calculates an average total return (assuming reinvestment of distributions) for mutual funds with investment objectives similar to those of the fund. Lipper makes no adjustment for the effect of sales loads. |
Indices are not available for investment, are not professionally managed and do not reflect sales charges, fees, brokerage commissions, taxes or other expenses of investing. Securities in the fund may not match those in an index.
Performance data quoted represents past performance and current performance may be lower or higher. Past performance is no guarantee of future results. The investment return and principal value will fluctuate so that shares, when redeemed, may be worth more or less than the original cost. Please visit www.columbiamanagement.com for daily and most recent month-end performance updates
Summary
1-year return as of 03/31/11
| | |
| |
 | | 7.43% Class A shares (without sales charge) |
| |
| | 7.01% Barclays Capital Credit Bond Index |
| |
| | 8.12% Blended Benchmark |
1
Economic Update – Columbia Corporate Income Fund
Summary
For the 12-month period that ended March 31, 2011
| | n | | Strengthening economic growth and rising interest rates kept a lid on most bond market sectors. The Barclays Capital Aggregate Bond Index delivered modest results. However, high-yield bonds were strong performers, as measured by the JPMorgan Developed BB High Yield Index. | |
| | |
Barclays
Aggregate Index | | JPMorgan
Index |
| |

| |
|
5.12% | | 13.04% |
| | n | | The U.S. stock market, as measured by the S&P 500 Index, delivered solid returns, despite a summer 2010 correction. Foreign stock market returns were also positive, as measured by the MSCI EAFE Index (Net). | |
| | |
| S&P Index | | MSCI Index |
| |
| |
|
15.65% | | 10.42% |
The U.S. economy continued to expand at a solid but uneven pace over the past 12 months, as measured by gross domestic product (GDP). Although lackluster second quarter 2010 GDP growth raised fears that the economy was losing steam and might lapse back into recession, the pace picked up in the third quarter of 2010, inspiring confidence among consumers, businesses and investors. GDP expanded by 2.6% in the third quarter and 3.1% in the fourth quarter. With the Federal Reserve Board (the Fed) providing additional monetary stimulus to shore up economic growth and the extension of key tax cuts for the next two years, expectations are for continued growth in 2011. However, early estimates of first quarter 2011 growth place it just under 2.0%, a disappointment after two strong quarters and a pick-up in employment.
Consumer spending on cars, clothing and other goods generally trended higher during the 12-month period, accelerating in the fourth quarter. Holiday spending rose 5.5% between November 5, 2010 and December 24, 2010, in all retail categories, excluding automobiles, compared with the same period in 2009, according to MasterCard Advisors’ SpendingPulse, which tracks spending on all transactions including cash. Personal income surged in January 2011 as payroll tax cuts kicked in. The personal savings rate edged higher, ending February 2011, the last month for which data was available, at 5.8%.
News on the job front was increasingly positive. A good portion of the jobs added in March, April and May of 2010 were temporary, government-sponsored census positions, which began to unwind in June, July and August of 2010. However, private sector payroll employment began to trend higher in the third quarter, massive layoffs declined and job growth turned solidly positive, with the addition of 444,000 new jobs in the first quarter of 2011.
Despite some glimmers of improvement early in 2010, the housing market remained troublesome throughout the period. Both new and existing home sales fell after a federal tax credit for new and repeat homebuyers expired. Distressed properties pressured prices and foreclosures continued — another drag on prices. The inventory of unsold homes ended the period higher than it started, at 8.9 and 8.6 months for both new and existing homes, respectively, according to the National Association of Realtors and a joint release from the U.S. Census Bureau and the U.S. Department of Housing and Urban Development. The new year brought more disappointing news: Existing home sales fell in January 2011 after three months of sustained improvement. Tight credit and weak appraisals were cited as possible reasons for the decline.
Reports from the business side of the economy were generally positive. A key measure of the nation’s manufacturing situation — the Institute for Supply Management’s Index — took a somewhat surprising turn higher in the final months of the period. Technology spending rose 12% in 2010, according to the NPD Group, a national marketing research firm. Purchases of computers, networking and software returned to prerecession levels. Industrial production rose over the period, and manufacturing capacity utilized, per the report issued by the Fed — a key measure of the health of the manufacturing sector — also edged higher.
2
Economic Update (continued) – Columbia Corporate Income Fund
Bonds delivered modest returns
As the economy strengthened and interest rates edged higher, most bond sectors delivered modest returns. The Barclays Capital Aggregate Bond Index1 returned 5.12%. High-yield bonds led the fixed-income markets. For the 12 months covered by this report, the JPMorgan Developed BB High Yield Index2 returned 13.04% as default fears abated and investors grew more comfortable with risk. Despite rising yields in the second half of the period, the Treasury market was also positive. The Barclays Capital U.S. Treasury Index3 returned 4.53%. However, municipal bonds struggled in the second half of the period, as interest rates inched higher and issue supply surged ahead of the year-end expiration of the Build America Bonds program. The Barclays Capital Municipal Bond Index4 gained 1.63% for the period. Despite positive economic activity, the Fed kept a key short-term interest rate — the federal funds rate — close to zero, reflecting ongoing concerns about employment and the housing market.
Stocks moved higher despite summer 2010 decline
Against a strengthening economic backdrop, stock prices continued to rally despite a summer 2010 setback linked to a debt crisis brewing in Europe, which raised concerns among U.S. investors. These fears were short-lived and stocks regained their footing. In this environment, the S&P 500 Index5 returned 15.65% for the 12 months through March 31, 2011. Outside the United States, stock markets also delivered solid gains. The MSCI EAFE Index (Net),6 a broad gauge of stock market performance in foreign developed markets, returned 10.42% (in U.S. dollars) for the 12-month period, as concerns about the impact of a bailout for weak euro zone economies eased yet continued to restrain market performance. Emerging stock markets were strong. The MSCI Emerging Markets Index (Net)7 returned 18.46% (in U.S. dollars) for the 12-month period.
Past performance is no guarantee of future results.
| 1 | The Barclays Capital Aggregate Bond Index is a market value-weighted index that tracks the daily price, coupon, pay-downs and total return performance of fixed-rate, publicly placed, dollar-denominated and non-convertible investment grade debt issues with at least $250 million par amount outstanding and with at least one year to final maturity. |
| 2 | The JPMorgan Developed BB High Yield Index is an unmanaged index designed to mirror the investable universe of the U.S. dollar developed, BB-rated, high yield corporate debt market. |
| 3 | The Barclays Capital U.S. Treasury Index includes public obligations of the U.S. Treasury. Treasury bills are excluded by the maturity constraint. In addition, certain special issues, such as state and local government series bonds (SLGs), as well as U.S. Treasury TIPS, are excluded. STRIPS are excluded from the index because their inclusion would result in double-counting. |
| 4 | The Barclays Capital Municipal Bond Index is considered representative of the broad market for investment-grade, tax-exempt bonds with a maturity of at least one year |
| 5 | The Standard & Poor’s (S&P) 500 Index tracks the performance of 500 widely held, large-capitalization U.S. stocks. |
| 6 | The Morgan Stanley Capital International Europe, Australasia, Far East (MSCI EAFE) Index (Net) is a free float-adjusted market capitalization index that is designed to measure the equity market performance of developed markets, excluding the U.S. & Canada. As of December 31, 2010, the MSCI EAFE Index (Net) consisted of the following 22 developed market country indices: Australia, Austria, Belgium, Denmark, Finland, France, Germany, Greece, Hong Kong, Ireland, Israel, Italy, Japan, the Netherlands, New Zealand, Norway, Portugal, Singapore, Spain, Sweden, Switzerland and the United Kingdom. |
| 7 | The Morgan Stanley Capital International Emerging Markets (MSCI EM) Index (Net) is a free float-adjusted market capitalization index that is designed to measure equity market performance of emerging markets. As of December 31, 2010, the MSCI EM Index (Net) consisted of the following 21 emerging market country indices: Brazil, Chile, China, Colombia, Czech Republic, Egypt, Hungary, India, Indonesia, Korea, Malaysia, Mexico, Morocco, Peru, Philippines, Poland, Russia, South Africa, Taiwan, Thailand and Turkey. |
Indices are not available for investment, are not professionally managed and do not reflect sales charges, fees, brokerage commissions, taxes or other expenses of investing. Securities in the fund may not match those in an index.
3
Performance Information – Columbia Corporate Income Fund
Performance data quoted represents past performance and current performance may be lower or higher. Past performance is no guarantee of future results. The investment return and principal value will fluctuate so that shares, when redeemed, may be worth more or less than the original cost. Please visit www.columbiamanagement.com for daily and most recent month-end performance updates.
| | | | |
| Net asset value per share | |
|
As of 03/31/11 ($) | |
Class A | | | 9.71 | |
Class B | | | 9.71 | |
Class C | | | 9.71 | |
Class I | | | 9.71 | |
Class W | | | 9.71 | |
Class Z | | | 9.71 | |
| | | | |
| Distributions declared per share | |
|
04/01/10 – 03/31/11 ($) | |
Class A | | | 0.51 | |
Class B | | | 0.44 | |
Class C | | | 0.46 | |
Class I | | | 0.27 | |
Class W | | | 0.26 | |
Class Z | | | 0.54 | |
|
| Performance of a $10,000 investment 04/01/01 – 03/31/11 |
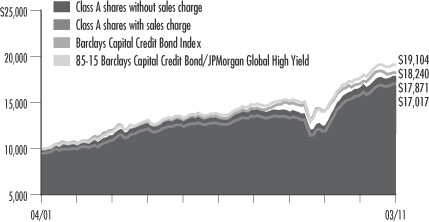
The chart above shows the change in value of a hypothetical $10,000 investment in Class A shares of Columbia Corporate Income Fund during the stated time period, and does not reflect the deduction of taxes that a shareholder may pay on fund distributions or on the redemption of fund shares.
| | | | | | | | |
| Performance of a $10,000 investment 04/01/01 – 03/31/11 ($) | |
| | |
| Sales charge | | without | | | With | |
Class A | | | 17,871 | | | | 17,017 | |
Class B | | | 16,743 | | | | 16,743 | |
Class C | | | 16,959 | | | | 16,959 | |
Class I | | | n/a | | | | n/a | |
Class W | | | n/a | | | | n/a | |
Class Z | | | 18,376 | | | | n/a | |
| | | | | | | | | | | | | | | | | | | | | | | | | | | | | | | | | | | | |
| Average annual total return as of 3/31/11 (%) | |
| | | | | | |
| Share class | | A | | | B | | | C | | | I | | | W | | | Z | |
| Inception | | 07/31/00 | | | 07/15/02 | | | 07/15/02 | | | 9/27/10 | | | 9/27/10 | | | 03/05/86 | |
| Sales charge | | without | | | with | | | without | | | with | | | without | | | with | | | without | | | without | | | without | |
1-year | | | 7.43 | | | | 2.28 | | | | 6.64 | | | | 1.64 | | | | 6.79 | | | | 5.79 | | | | n/a | | | | n/a | | | | 7.70 | |
5-year | | | 6.04 | | | | 5.01 | | | | 5.25 | | | | 4.92 | | | | 5.41 | | | | 5.41 | | | | n/a | | | | n/a | | | | 6.30 | |
10-year/Life | | | 5.98 | | | | 5.46 | | | | 5.29 | | | | 5.29 | | | | 5.42 | | | | 5.42 | | | | 1.50 | | | | 1.31 | | | | 6.27 | |
The “with sales charge” returns include the maximum initial sales charge of 4.75% for Class A shares and the applicable contingent deferred sales charge of 5.00% in the first year, declining to 1.00% in the sixth year and eliminated thereafter for Class B shares and 1.00% for Class C shares for the first year only. The “without sales charge” returns do not include the effect of sales charges. If they had, returns would be lower.
Performance results reflect any fee waivers or reimbursements of fund expenses by the investment advisor and/or any of its affiliates. Absent these fee waivers or expense reimbursement arrangements, performance results would have been lower.
All results shown assume the reinvestment of distributions. Class I and Class Z shares are sold at net asset value with no distribution and service (Rule 12b-1) fees. Class W shares are sold at net asset value with a service (Rule 12b-1) fee. Class I, Class W and Class Z shares have limited eligibility and the investment minimum requirements may vary. Please see the fund’s prospectus for details. Performance for different share classes will vary based on differences in sales charges and fees associated with each class.
Class I and Class W shares were initially offered by the fund on September 27, 2010, the date of their inception.
The tables do not reflect the deduction of taxes that a shareholder may pay on fund distributions or on the redemption of fund shares.
Class B and Class C shares performance information includes returns of the Class A shares. These returns shown for these share classes reflect any difference in sales charges, but have not been restated to reflect any difference in expenses, such as distribution and service (rule 12b-1) fees, between Class A and the corresponding newer share classes. If differences in expenses had been reflected, the returns shown for periods prior to the inception of the newer share classes of shares would have been lower. Class A shares were initially offered on July 31, 2000, Class B shares and Class C shares were initially offered on July 15, 2002, and Class Z shares were initially offered on March 5, 1986.
4
Understanding Your Expenses – Columbia Corporate Income Fund
As a fund shareholder, you incur two types of costs. There are transaction costs, which generally include sales charges on purchases and may include redemption fees or exchange fees. There are also ongoing costs, which generally include investment advisory fees, distribution and service (Rule 12b-1) fees and other fund expenses. The information on this page is intended to help you understand the ongoing costs of investing in the fund and to compare these costs with the ongoing costs of investing in other mutual funds.
Analyzing your fund’s expenses by share class
To illustrate these ongoing costs, we have provided an example and calculated the expenses paid by investors in each share class during the period. The information in the following table is based on an initial investment of $1,000, which is invested at the beginning of the period and held for the entire period. Expense information is calculated two ways and each method provides you with different information. The amount listed in the “Actual” column is calculated using the fund’s actual operating expenses and total return for the period. The amount listed in the “Hypothetical” column for each share class assumes that the return each year is 5% before expenses and is calculated based on the fund’s actual operating expenses. You should not use the hypothetical account values and expenses to estimate either your actual account balance at the end of the period or the expenses you paid during this period.
Compare with other funds
Since all mutual funds are required to include the same hypothetical calculations about expenses in shareholder reports, you can use this information to compare the ongoing costs of investing in the fund with other funds. To do so, compare the 5% hypothetical example with the 5% hypothetical examples that appear in the shareholder reports of other funds. As you compare hypothetical examples of other funds, it is important to note that hypothetical examples are meant to highlight the ongoing costs of investing in a fund and do not reflect any transaction costs, such as sales charges, redemption fees or exchange fees.
Estimating your actual expenses
To estimate the expenses that you paid over the period, first you will need your account balance at the end of the period:
| | n | | For shareholders who receive their account statements from Columbia Management Investment Services Corp., your account balance is available online at www.columbiamanagement.com or by calling Shareholder Services at 800.345.6611. | |
| | n | | For shareholders who receive their account statements from their financial intermediary, contact your financial intermediary to obtain your account balance. | |
| | 1. | Divide your ending account balance by $1,000. For example, if an account balance was $8,600 at the end of the period, the result would be 8.6. | |
| | 2. | In the section of the table below titled “Expenses paid during the period,” locate the amount for your share class. You will find this number in the column labeled “Actual.” Multiply this number by the result from step 1. Your answer is an estimate of the expenses you paid on your account during the period. | |
If the value of your account falls below the minimum initial investment requirement applicable to you, your account may be subject to a $20 annual fee. This fee is not included in the accompanying table. If you are subject to the fee, keep it in mind when you are estimating the ongoing expenses of investing in the fund and when comparing the expenses of this fund with other funds.
| | | | | | | | | | | | | | | | | | | | | | | | | | | | |
| 10/01/10 – 3/31/11 | | | | | | | | | | | | | | | | |
| | | | |
| | | Account value at the
beginning of the period ($) | | | Account value at the
end of the period ($) | | | Expenses paid
during the period ($) | | | Fund’s annualized
expense ratio (%) | |
| | | Actual | | | Hypothetical | | | Actual | | | Hypothetical | | | Actual | | | Hypothetical | | | Actual | |
Class A | | | 1,000.00 | | | | 1,000.00 | | | | 1,011.70 | | | | 1,020.19 | | | | 4.76 | | | | 4.78 | | | | 0.95 | |
Class B | | | 1,000.00 | | | | 1,000.00 | | | | 1,007.90 | | | | 1,016.45 | | | | 8.51 | | | | 8.55 | | | | 1.70 | |
Class C | | | 1,000.00 | | | | 1,000.00 | | | | 1,008.70 | | | | 1,017.20 | | | | 7.76 | | | | 7.80 | | | | 1.55 | |
Class I | | | 1,000.00 | | | | 1,000.00 | | | | 1,013.50 | | | | 1,021.69 | | | | 3.26 | | | | 3.28 | | | | 0.65 | |
Class W | | | 1,000.00 | | �� | | 1,000.00 | | | | 1,011.70 | | | | 1,020.19 | | | | 4.76 | | | | 4.78 | | | | 0.95 | |
Class Z | | | 1,000.00 | | | | 1,000.00 | | | | 1,012.90 | | | | 1,021.44 | | | | 3.51 | | | | 3.53 | | | | 0.70 | |
Expenses paid during the period are equal to the annualized expense ratio for the share class, multiplied by the average account value over the period, then multiplied by the number of days in the fund’s most recent fiscal half-year and divided by 365.
Had the Investment Manager and/or any of its affiliates not waived fees or reimbursed a portion of expenses, account value at the end of the period would have been reduced.
It is important to note that the expense amounts shown in the table are meant to highlight only ongoing costs of investing in the fund and do not reflect any transaction costs, such as sales charges, redemption fees or exchange fees. Therefore, the hypothetical examples provided may not help you determine the relative total costs of owning shares of different funds. If these transaction costs were included, your costs would have been higher.
5
Portfolio Managers’ Report – Columbia Corporate Income Fund
Performance data quoted represents past performance and current performance may be lower or higher. Past performance is no guarantee of future results. The investment return and principal value will fluctuate so that shares, when redeemed, may be worth more or less than the original cost. Please visit www.columbiamanagement.com for daily and most recent month-end performance updates.
| | | | |
| 30-day SEC yields | |
| |
as of 03/31/11 (%) | | | | |
Class A | | | 4.04 | |
Class B | | | 3.54 | |
Class C | | | 3.68 | |
Class I | | | 4.61 | |
Class W | | | 4.29 | |
Class Z | | | 4.54 | |
The 30-day SEC yields reflect the fund’s earning power, net of expenses, expressed as an annualized percentage of the public offering price per share at the end of the period.
Had the Investment Manager and/or any of its affiliates not waived fees or reimbursed a portion of expenses, the 30-day SEC yields would have been lower.
| | | | |
| Portfolio structure | |
| |
as of 03/31/11 (%) | | | | |
Corporate Fixed-Income Bonds & Notes | | | 85.3 | |
Government & Agency Obligations | | | 5.4 | |
Asset-Backed Securities | | | 3.0 | |
Municipal Bonds | | | 2.7 | |
Preferred Stocks | | | 1.4 | |
Commercial Mortgage-Backed Securities | | | 0.9 | |
Common Stock | | | 0.1 | |
Collateralized Mortgage Obligations | | | 0.0 | * |
Mortgage-Backed Securities | | | 0.0 | * |
Warrants | | | 0.0 | * |
Short-Term Obligation | | | 5.9 | |
Other Assets & Liabilities, Net | | | (4.7 | ) |
| | * | Rounds to less than 0.1% of net assets. |
For the 12-month period that ended March 31, 2011, the fund’s Class A shares returned 7.43% without sales charge. The fund’s return was higher than the 7.01% return of the Barclays Capital Credit Bond Index and slightly lower than the 8.12% return of its blended benchmark, which is a weighted custom composite of the Barclays Capital Credit Bond Index (85%) and JPMorgan Global High Yield Index (15%). The average return of the funds in its peer group, the Lipper Corporate Debt Funds BBB-Rated Classification, was 8.15% for the 12-month period.
The fund had more exposure than the Barclays Capital Credit Bond Index to financials and preferred securities, which contributed to its outperformance relative to that measure. The fund’s allocation to high-yield securities also bolstered performance. The Federal Reserve Board’s (the Fed’s) highly accommodative monetary policies worked to expand liquidity in the economy, much of which found its way into higher-risk assets, such as stocks and corporate bonds. Riskier segments of the bond market outperformed higher-quality Treasuries for the period.
Sector allocation, security selection aided returns
The fund’s overweight stake in investment-grade bonds, combined with strong security selection in the financials sector and among preferred issues, generally accounted for the fund’s performance advantage over the Barclays benchmark. The best results for the period were in the intermediate quality tier, where the fund had strong representation.
Holdings of certain bonds in euro zone banks benefited from better financial positions and more conservative operating policies. In this regard, the bonds of Barclays Bank, Lloyds and ING rose. The fund had more exposure than the benchmark to the telecommunications sector, which aided performance, thanks to gains by both AT&T and Verizon. Both companies benefited from improving business activity. Issuance of new telecommunications bonds was low, and that helped bolster prices. Lower vacancies brightened the outlook for Brandywine Realty, a real estate investment trust, pushing its securities higher.
The fund held fewer non-corporate issues than the index, which hampered results somewhat as yields fell and prices rose on Treasury debt.
Looking ahead
Core inflation, which does not take into account food and energy prices, remains benign. Wages and salaries are relatively stable, so there is little upward pressure on prices in the current environment. The global economic outlook looks positive overall, and the recent restructuring of banks should help them maintain momentum. Against that backdrop, the Fed’s goal is to keep interest rates relatively low in the five-to-seven year range, that portion of the yield curve that tends to influence mortgage rates. (The yield curve is a graphic depiction of yields from short-term to long-term and points in between.) This policy has aided non-Treasury segments of the bond market, and we expect that policy to persist. As a result, we have made few changes to the fund’s positioning for the period ahead. However, we will begin to rethink positioning once the Fed begins to shift its policies and rates move higher, a point that, in our opinion is still six to 12 months away.
6
Portfolio Managers’ Report (continued) – Columbia Corporate Income Fund
Portfolio characteristics and holdings are subject to change periodically and may not be representative of current characteristics and holdings. The outlook for the fund may differ from that presented for other Columbia Funds.
Investing in fixed-income securities may involve certain risks, including the credit quality of individual issuers, possible prepayments, market or economic developments and yields and share price fluctuations due to changes in interest rates. When interest rates go up, bond prices typically drop, and vice versa.
Investments in high-yield bonds (sometimes referred to as “junk” bonds) offer the potential for high current income and attractive total return, but involve certain risks. Changes in economic conditions or other circumstances may adversely affect a high-yield bond issuer’s ability to make principal and interest payments.
| | | | |
| Quality breakdown | |
| |
as of 03/31/11 (%) | | | | |
Cash and Equivalents | | | 0.2 | |
Treasury | | | 5.0 | |
Agency | | | 0.1 | |
AAA | | | 4.7 | |
AA | | | 11.7 | |
A | | | 26.3 | |
BBB | | | 36.9 | |
BB | | | 7.7 | |
B | | | 6.2 | |
CCC | | | 0.9 | |
Non-Rated | | | 0.3 | |
| | | | |
| Maturity breakdown | |
| |
as of 03/31/11 (%) | | | | |
0-1 year | | | 1.9 | |
1-2 year | | | 4.3 | |
2-3 years | | | 3.6 | |
3-4 years | | | 4.1 | |
4-5 years | | | 12.3 | |
5-6 years | | | 5.5 | |
6-7 years | | | 10.0 | |
7-8 years | | | 7.2 | |
8-9 years | | | 7.5 | |
9-10 years | | | 8.4 | |
10-20 years | | | 3.8 | |
20 -30 years | | | 28.4 | |
30 years and over | | | 2.8 | |
Cash and Equivalents | | | 0.2 | |
Portfolio structure is calculated as a percentage of net assets.
Quality and maturity breakdowns are calculated as a percentage of total investments.
Ratings shown in the quality breakdown are assigned to individual bonds by taking the lower of the ratings available from one of the following nationally recognized rating agencies: Standard & Poor’s or Moody’s Investor Services. If a security is rated by only one of the two agencies, that rating is used. If a security is not rated by either of the two agencies, it is designated as Non-Rated. Ratings are relative and subjective and are not absolute standards of quality. The credit quality of the fund’s investments does not remove market risk.
The fund is actively managed and the composition of its portfolio will change over time.
7
Investment Portfolio – Columbia Corporate Income Fund
March 31, 2011
Corporate Fixed-Income Bonds & Notes – 85.3%
| | | | | | | | |
| | | Par ($) | | | Value ($) | |
| Basic Materials – 3.8% | |
| Chemicals – 1.4% | |
| CF Industries, Inc. | | | | | |
6.875% 05/01/18 | | | 435,000 | | | | 487,200 | |
7.125% 05/01/20 | | | 153,000 | | | | 173,273 | |
| |
| Chemtura Corp. | | | | | |
7.875% 09/01/18 (a) | | | 102,000 | | | | 107,865 | |
| |
| Dow Chemical Co. | | | | | |
4.250% 11/15/20 | | | 2,185,000 | | | | 2,086,747 | |
5.900% 02/15/15 | | | 1,800,000 | | | | 1,995,046 | |
8.550% 05/15/19 | | | 378,000 | | | | 477,809 | |
9.400% 05/15/39 | | | 220,000 | | | | 326,670 | |
| |
| Hexion U.S. Finance Corp./Hexion Nova Scotia Finance ULC | | | | | |
8.875% 02/01/18 | | | 780,000 | | | | 824,850 | |
9.000% 11/15/20 (a) | | | 110,000 | | | | 114,056 | |
| |
| Lubrizol Corp. | | | | | |
8.875% 02/01/19 | | | 715,000 | | | | 918,951 | |
| |
| Lyondell Chemical Co. | | | | | |
8.000% 11/01/17 (a) | | | 499,000 | | | | 551,395 | |
| |
| MacDermid, Inc. | | | | | |
9.500% 04/15/17 (a) | | | 270,000 | | | | 286,537 | |
| |
| Momentive Performance Materials, Inc. | | | | | |
9.000% 01/15/21 (a) | | | 180,000 | | | | 186,075 | |
| |
| Nalco Co. | | | | | |
6.625% 01/15/19 (a) | | | 385,000 | | | | 396,069 | |
| |
| NOVA Chemicals Corp. | | | | | |
8.375% 11/01/16 | | | 360,000 | | | | 395,100 | |
8.625% 11/01/19 | | | 345,000 | | | | 385,969 | |
| |
| Rain CII Carbon LLC & CII Carbon Corp. | | | | | |
8.000% 12/01/18 (a) | | | 205,000 | | | | 218,837 | |
| | | | | | | | |
Chemicals Total | | | | | | | 9,932,449 | |
| |
| Forest Products & Paper – 0.1% | | | | | |
| Cascades, Inc. | | | | | |
7.750% 12/15/17 | | | 370,000 | | | | 390,813 | |
7.875% 01/15/20 | | | 205,000 | | | | 216,275 | |
| |
| Verso Paper Holdings LLC/Verso Paper, Inc. | | | | | |
8.750% 02/01/19 (a) | | | 133,000 | | | | 138,320 | |
| | | | | | | | |
Forest Products & Paper Total | | | | | | | 745,408 | |
| |
| Iron/Steel – 1.5% | | | | | |
| ArcelorMittal | | | | | |
6.750% 03/01/41 | | | 2,976,000 | | | | 2,916,602 | |
7.000% 10/15/39 | | | 5,633,000 | | | | 5,648,074 | |
| | | | | | | | |
| | | Par ($) | | | Value ($) | |
| JMC Steel Group | | | | | |
8.250% 03/15/18 (a) | | | 113,000 | | | | 115,543 | |
| |
| Nucor Corp. | | | | | |
5.000% 06/01/13 | | | 1,110,000 | | | | 1,194,084 | |
| |
| United States Steel Corp. | | | | | |
7.000% 02/01/18 | | | 454,000 | | | | 471,592 | |
7.375% 04/01/20 | | | 78,000 | | | | 81,705 | |
| | | | | | | | |
Iron/Steel Total | | | | | | | 10,427,600 | |
| |
| Metals & Mining – 0.8% | | | | | |
| FMG Resources August 2006 Pty Ltd. | | | | | |
6.375% 02/01/16 (a) | | | 410,000 | | | | 413,075 | |
6.875% 02/01/18 (a) | | | 117,000 | | | | 121,972 | |
7.000% 11/01/15 (a) | | | 373,000 | | | | 384,764 | |
| |
| Freeport-McMoRan Copper & Gold, Inc. | | | | | |
8.375% 04/01/17 | | | 180,000 | | | | 198,450 | |
| |
| Noranda Aluminum Acquisition Corp. | | | | | |
PIK, | | | | | | | | |
5.193% 05/15/15 (05/15/11) (b)(c) | | | 945,000 | | | | 891,023 | |
| |
| Novelis, Inc. | | | | | |
8.375% 12/15/17 (a) | | | 280,000 | | | | 303,100 | |
8.750% 12/15/20 (a) | | | 275,000 | | | | 302,500 | |
| |
| Vale Overseas Ltd. | | | | | |
6.875% 11/21/36 | | | 2,850,000 | | | | 3,034,854 | |
| | | | | | | | |
Metals & Mining Total | | | | | | | 5,649,738 | |
| | | | | | | | |
Basic Materials Total | | | | | | | 26,755,195 | |
| | | | | | | | |
| Communications – 10.0% | | | | | |
| Advertising – 0.2% | | | | | |
| Interpublic Group of Companies, Inc. | | | | | |
6.250% 11/15/14 | | | 100,000 | | | | 109,250 | |
10.000% 07/15/17 | | | 380,000 | | | | 452,200 | |
| |
| inVentiv Health, Inc. | | | | | |
10.000% 08/15/18 (a) | | | 345,000 | | | | 358,800 | |
| |
| Visant Corp. | | | | | |
10.000% 10/01/17 | | | 303,000 | | | | 327,240 | |
| | | | | | | | |
Advertising Total | | | | | | | 1,247,490 | |
| | |
| Media – 3.5% | | | | | | | | |
| Belo Corp. | | | | | | | | |
8.000% 11/15/16 | | | 360,000 | | | | 392,400 | |
| | |
| Bresnan Broadband Holdings LLC | | | | | | | | |
8.000% 12/15/18 (a) | | | 10,000 | | | | 10,600 | |
| | |
| Cablevision Systems Corp. | | | | | | | | |
8.625% 09/15/17 | | | 555,000 | | | | 617,437 | |
See Accompanying Notes to Financial Statements.
8
Columbia Corporate Income Fund
March 31, 2011
Corporate Fixed-Income Bonds & Notes (continued)
| | | | | | | | |
| | | Par ($) | | | Value ($) | |
| Communications (continued) | | | | | |
| CCO Holdings LLC/CCO Holdings Capital Corp. | | | | | | | | |
7.000% 01/15/19 | | | 315,000 | | | | 322,875 | |
8.125% 04/30/20 | | | 565,000 | | | | 614,438 | |
| | |
| Cequel Communications Holdings I LLC & Cequel Capital Corp. | | | | | | | | |
8.625% 11/15/17 (a) | | | 425,000 | | | | 443,063 | |
| | |
| Clear Channel Communications, Inc. | | | | | | | | |
9.000% 03/01/21 (a) | | | 700,000 | | | | 698,250 | |
| |
| Clear Channel Worldwide Holdings, Inc. | | | | | |
9.250% 12/15/17 | | | 695,000 | | | | 761,894 | |
| | |
| CMP Susquehanna Corp. | | | | | | | | |
3.312% 05/15/14 (05/09/11) (a)(b)(c)(d) | | | 30,000 | | | | 17,700 | |
| | |
| Comcast Corp. | | | | | | | | |
6.950% 08/15/37 | | | 2,850,000 | | | | 3,102,749 | |
| | |
| DirecTV Holdings LLC | | | | | | | | |
6.375% 06/15/15 | | | 1,070,000 | | | | 1,106,112 | |
| | |
| DISH DBS Corp. | | | | | | | | |
7.875% 09/01/19 | | | 450,000 | | | | 487,125 | |
| | |
| Entravision Communications Corp. | | | | | | | | |
8.750% 08/01/17 | | | 445,000 | | | | 473,925 | |
| | |
| Gray Television, Inc. | | | | | | | | |
10.500% 06/29/15 | | | 343,000 | | | | 364,866 | |
| | |
| Insight Communications Co., Inc. | | | | | | | | |
9.375% 07/15/18 (a) | | | 155,000 | | | | 172,050 | |
| |
| Kabel BW Erste Beteiligungs GmbH/Kabel Baden-Wurttemberg GmbH & Co. KG | | | | | |
7.500% 03/15/19 (a) | | | 160,000 | | | | 163,936 | |
| | |
| NBC Universal Media, LLC | | | | | | | | |
5.950% 04/01/41 (a) | | | 2,130,000 | | | | 2,041,109 | |
| | |
| News America, Inc. | | | | | | | | |
6.150% 02/15/41 (a) | | | 3,395,000 | | | | 3,366,631 | |
6.400% 12/15/35 | | | 1,435,000 | | | | 1,476,398 | |
6.550% 03/15/33 | | | 500,000 | | | | 525,139 | |
| | |
| Salem Communications Corp. | | | | | | | | |
9.625% 12/15/16 | | | 401,000 | | | | 433,080 | |
| |
| Sinclair Television Group, Inc. | | | | | |
9.250% 11/01/17 (a) | | | 507,000 | | | | 565,305 | |
| |
| Sirius XM Radio, Inc. | | | | | |
8.750% 04/01/15 (a) | | | 260,000 | | | | 292,500 | |
| | | | | | | | |
| | | Par ($) | | | Value ($) | |
| Time Warner Cable, Inc. | | | | | |
5.850% 05/01/17 | | | 1,070,000 | | | | 1,170,258 | |
5.875% 11/15/40 | | | 3,910,000 | | | | 3,674,028 | |
| |
| Univision Communications, Inc. | | | | | |
7.875% 11/01/20 (a) | | | 355,000 | | | | 376,300 | |
8.500% 05/15/21 (a) | | | 485,000 | | | | 500,763 | |
| |
| XM Satellite Radio, Inc. | | | | | |
7.625% 11/01/18 (a) | | | 389,000 | | | | 410,395 | |
| | | | | | | | |
Media Total | | | | | | | 24,581,326 | |
| |
| Telecommunication Services – 6.3% | | | | | |
| AT&T, Inc. | | | | | |
5.625% 06/15/16 | | | 1,575,000 | | | | 1,761,886 | |
6.550% 02/15/39 | | | 2,125,000 | | | | 2,214,756 | |
| |
| Avaya, Inc. | | | | | |
7.000% 04/01/19 (a) | | | 205,000 | | | | 199,875 | |
9.750% 11/01/15 | | | 126,000 | | | | 128,048 | |
| |
| British Telecommunications PLC | | | | | |
5.950% 01/15/18 | | | 5,565,000 | | | | 6,139,380 | |
|
| Cellco Partnership/Verizon Wireless Capital LLC | |
5.550% 02/01/14 | | | 2,685,000 | | | | 2,948,237 | |
| |
| Cincinnati Bell, Inc. | | | | | |
8.250% 10/15/17 | | | 405,000 | | | | 408,037 | |
8.375% 10/15/20 | | | 124,000 | | | | 121,830 | |
| |
| Clearwire Communications LLC/Clearwire Finance, Inc. | | | | | |
12.000% 12/01/15 (a) | | | 195,000 | | | | 210,213 | |
12.000% 12/01/17 (a) | | | 220,000 | | | | 235,125 | |
| |
| CommScope, Inc. | | | | | |
8.250% 01/15/19 (a) | | | 173,000 | | | | 180,785 | |
| |
| Cricket Communications, Inc. | | | | | |
7.750% 05/15/16 | | | 380,000 | | | | 403,750 | |
| |
| Crown Castle International Corp. | | | | | |
9.000% 01/15/15 | | | 310,000 | | | | 341,775 | |
| |
| Frontier Communications Corp. | | | | | |
8.500% 04/15/20 | | | 250,000 | | | | 270,937 | |
| |
| Integra Telecom Holdings, Inc. | | | | | |
10.750% 04/15/16 (a) | | | 159,000 | | | | 172,515 | |
| |
| Intelsat Jackson Holdings SA | | | | | |
7.250% 10/15/20 (a) | | | 815,000 | | | | 816,019 | |
| |
| ITC Deltacom, Inc. | | | | | |
10.500% 04/01/16 | | | 217,000 | | | | 239,242 | |
| |
| Level 3 Financing, Inc. | | | | | |
8.750% 02/15/17 | | | 400,000 | | | | 397,000 | |
See Accompanying Notes to Financial Statements.
9
Columbia Corporate Income Fund
March 31, 2011
Corporate Fixed-Income Bonds & Notes (continued)
| | | | | | | | |
| | | Par ($) | | | Value ($) | |
| Communications (continued) | | | | | |
9.250% 11/01/14 | | | 115,000 | | | | 117,588 | |
9.375% 04/01/19 (a) | | | 115,000 | | | | 111,263 | |
| |
| MetroPCS Wireless, Inc. | | | | | |
6.625% 11/15/20 | | | 205,000 | | | | 204,744 | |
7.875% 09/01/18 | | | 365,000 | | | | 390,550 | |
| |
| Nextel Communications, Inc. | | | | | |
7.375% 08/01/15 | | | 142,000 | | | | 142,533 | |
| |
| Nielsen Finance LLC/Nielsen Finance Co. | | | | | |
7.750% 10/15/18 (a) | | | 589,000 | | | | 631,702 | |
11.500% 05/01/16 | | | 146,000 | | | | 171,915 | |
| |
| NII Capital Corp. | | | | | |
7.625% 04/01/21 | | | 250,000 | | | | 255,625 | |
10.000% 08/15/16 | | | 210,000 | | | | 239,400 | |
| |
| PAETEC Holding Corp. | | | | | |
8.875% 06/30/17 | | | 435,000 | | | | 468,712 | |
9.875% 12/01/18 (a) | | | 205,000 | | | | 216,275 | |
| |
| Quebecor Media, Inc. | | | | | |
7.750% 03/15/16 | | | 615,000 | | | | 638,063 | |
| |
| Qwest Corp. | | | | | |
7.500% 06/15/23 | | | 400,000 | | | | 401,000 | |
| |
| SBA Telecommunications, Inc. | | | | | |
8.250% 08/15/19 | | | 205,000 | | | | 226,525 | |
| |
| Sprint Capital Corp. | | | | | |
6.875% 11/15/28 | | | 285,000 | | | | 262,912 | |
| |
| Sprint Nextel Corp. | | | | | |
8.375% 08/15/17 | | | 1,108,000 | | | | 1,234,035 | |
| |
| Telefonica Emisiones SAU | | | | | |
5.134% 04/27/20 | | | 4,045,000 | | | | 4,024,605 | |
6.221% 07/03/17 | | | 730,000 | | | | 796,386 | |
6.421% 06/20/16 | | | 1,855,000 | | | | 2,061,272 | |
| |
| tw telecom holdings, inc. | | | | | |
8.000% 03/01/18 | | | 210,000 | | | | 226,538 | |
| |
| Verizon Communications, Inc. | | | | | |
3.000% 04/01/16 | | | 10,380,000 | | | | 10,327,114 | |
4.600% 04/01/21 | | | 745,000 | | | | 741,811 | |
| |
| Virgin Media Finance PLC | | | | | |
9.500% 08/15/16 | | | 540,000 | | | | 614,250 | |
| |
| West Corp. | | | | | |
7.875% 01/15/19 (a) | | | 250,000 | | | | 255,000 | |
| |
| Wind Acquisition Finance SA | | | | | |
7.250% 02/15/18 (a) | | | 220,000 | | | | 231,000 | |
11.750% 07/15/17 (a)(d)(e) | | | 592,000 | | | | 1,184 | |
11.750% 07/15/17 (a) | | | 592,000 | | | | 680,800 | |
| | | | | | | | |
| | | Par ($) | | | Value ($) | |
| Windstream Corp. | | | | | |
7.750% 10/15/20 | | | 700,000 | | | | 719,250 | |
8.125% 09/01/18 | | | 290,000 | | | | 309,575 | |
| | | | | | | | |
Telecommunication Services Total | | | | | | | 43,891,037 | |
| | | | | | | | |
Communications Total | | | | | | | 69,719,853 | |
| | | | | | | | |
| Consumer Cyclical – 4.2% | |
| Airlines – 0.3% | |
| Continental Airlines, Inc. | |
7.461% 04/01/15 | | | 2,310,205 | | | | 2,333,307 | |
| | | | | | | | |
Airlines Total | | | | | | | 2,333,307 | |
| |
| Auto Manufacturers – 0.1% | | | | | |
| Oshkosh Corp. | | | | | |
8.500% 03/01/20 | | | 384,000 | | | | 430,560 | |
| | | | | | | | |
Auto Manufacturers Total | | | | | | | 430,560 | |
| |
| Auto Parts & Equipment – 0.3% | | | | | |
| Accuride Corp. | | | | | |
9.500% 08/01/18 | | | 70,000 | | | | 77,875 | |
| |
| Dana Holding Corp. | | | | | |
6.500% 02/15/19 | | | 65,000 | | | | 64,513 | |
6.750% 02/15/21 | | | 571,000 | | | | 569,572 | |
| |
| Lear Corp. | | | | | |
7.875% 03/15/18 | | | 230,000 | | | | 250,700 | |
8.125% 03/15/20 | | | 425,000 | | | | 467,500 | |
| |
| Pinafore LLC/Pinafore, Inc. | | | | | |
9.000% 10/01/18 (a) | | | 45,000 | | | | 48,600 | |
| |
| Tenneco, Inc. | | | | | |
7.750% 08/15/18 | | | 47,000 | | | | 50,173 | |
| |
| TRW Automotive, Inc. | | | | | |
7.000% 03/15/14 (a) | | | 305,000 | | | | 332,450 | |
| |
| Visteon Corp. | | | | | |
6.750% 04/15/19 | | | 165,000 | | | | 165,000 | |
| | | | | | | | |
Auto Parts & Equipment Total | | | | | | | 2,026,383 | |
| |
| Entertainment – 0.4% | | | | | |
| AMC Entertainment, Inc. | | | | | |
8.750% 06/01/19 | | | 350,000 | | | | 379,750 | |
9.750% 12/01/20 (a) | | | 230,000 | | | | 246,100 | |
| |
| Boyd Gaming Corp. | | | | | |
9.125% 12/01/18 (a) | | | 681,000 | | | | 699,727 | |
| |
| Pinnacle Entertainment, Inc. | | | | | |
8.625% 08/01/17 | | | 210,000 | | | | 228,900 | |
8.750% 05/15/20 | | | 69,000 | | | | 71,760 | |
| |
| Shingle Springs Tribal Gaming Authority | | | | | |
9.375% 06/15/15 (a) | | | 875,000 | | | | 577,500 | |
See Accompanying Notes to Financial Statements.
10
Columbia Corporate Income Fund
March 31, 2011
Corporate Fixed-Income Bonds & Notes (continued)
| | | | | | | | |
| | | Par ($) | | | Value ($) | |
| Consumer Cyclical (continued) | |
| Six Flags, Inc. | | | | | |
9.625% 06/01/14 (a)(d)(e)(f) | | | 259,000 | | | | — | |
| |
| Speedway Motorsports, Inc. | | | | | |
6.750% 02/01/19 (a) | | | 104,000 | | | | 104,780 | |
8.750% 06/01/16 | | | 400,000 | | | | 438,000 | |
| |
| Tunica-Biloxi Gaming Authority | | | | | |
9.000% 11/15/15 (a) | | | 198,000 | | | | 196,020 | |
| | | | | | | | |
Entertainment Total | | | | | | | 2,942,537 | |
| |
| Home Builders – 0.1% | | | | | |
| Beazer Homes USA, Inc. | | | | | |
9.125% 06/15/18 | | | 155,000 | | | | 157,325 | |
| |
| K Hovnanian Enterprises, Inc. | | | | | |
10.625% 10/15/16 | | | 190,000 | | | | 201,875 | |
11.875% 10/15/15 | | | 230,000 | | | | 218,500 | |
| | | | | | | | |
Home Builders Total | | | | | | | 577,700 | |
| |
| Home Furnishings – 0.0% | | | | | |
| Norcraft Companies LP/Norcraft Finance Corp. | | | | | |
10.500% 12/15/15 | | | 145,000 | | | | 155,150 | |
| |
| Sealy Mattress Co. | | | | | |
10.875% 04/15/16 (a) | | | 42,000 | | | | 47,723 | |
| | | | | | | | |
Home Furnishings Total | | | | | | | 202,873 | |
| |
| Housewares – 0.1% | | | | | |
| Libbey Glass, Inc. | | | | | |
10.000% 02/15/15 | | | 450,000 | | | | 490,500 | |
| | | | | | | | |
Housewares Total | | | | | | | 490,500 | |
| |
| Lodging – 0.5% | | | | | |
| MGM Resorts International | | | | | |
9.000% 03/15/20 | | | 500,000 | | | | 550,000 | |
11.375% 03/01/18 | | | 445,000 | | | | 493,950 | |
| |
| Penn National Gaming, Inc. | | | | | |
8.750% 08/15/19 | | | 500,000 | | | | 551,875 | |
| |
| Pokagon Gaming Authority | | | | | |
10.375% 06/15/14 (a) | | | 226,000 | | | | 233,910 | |
| |
| Seminole Indian Tribe of Florida | | | | | |
6.535% 10/01/20 (a) | | | 65,000 | | | | 63,874 | |
7.804% 10/01/20 (a) | | | 505,000 | | | | 499,304 | |
| |
| Seneca Gaming Corp. | | | | | |
8.250% 12/01/18 (a) | | | 175,000 | | | | 180,250 | |
| |
| Wyndham Worldwide Corp. | | | | | |
6.000% 12/01/16 | | | 100,000 | | | | 105,964 | |
7.375% 03/01/20 | | | 395,000 | | | | 435,487 | |
| | | | | | | | |
Lodging Total | | | | | | | 3,114,614 | |
| | | | | | | | |
| | | Par ($) | | | Value ($) | |
| Office Furnishings – 0.0% | | | | | |
| Interface, Inc. | | | | | |
7.625% 12/01/18 (a) | | | 56,000 | | | | 59,080 | |
| | | | | | | | |
Office Furnishings Total | | | | | | | 59,080 | |
| |
| Retail – 2.4% | | | | | |
| CVS Pass-Through Trust | | | | | |
5.298% 01/11/27 (a) | | | 1,597,790 | | | | 1,614,530 | |
6.036% 12/10/28 | | | 2,136,141 | | | | 2,199,606 | |
8.353% 07/10/31 (a) | | | 7,076,121 | | | | 8,455,328 | |
| |
| Ltd. Brands, Inc. | | | | | |
6.625% 04/01/21 | | | 175,000 | | | | 178,937 | |
7.000% 05/01/20 | | | 500,000 | | | | 529,375 | |
| |
| Macy’s Retail Holdings, Inc. | | | | | |
5.350% 03/15/12 | | | 645,000 | | | | 664,350 | |
| |
| McDonald’s Corp. | | | | | |
5.700% 02/01/39 | | | 1,265,000 | | | | 1,341,913 | |
| |
| Michaels Stores, Inc. | | | | | |
11.375% 11/01/16 | | | 65,000 | | | | 70,850 | |
| |
| NBTY, Inc. | | | | | |
9.000% 10/01/18 (a) | | | 30,000 | | | | 32,550 | |
| |
| Needle Merger Sub Corp. | | | | | |
8.125% 03/15/19 (a) | | | 242,000 | | | | 244,420 | |
| |
| QVC, Inc. | | | | | |
7.125% 04/15/17 (a) | | | 55,000 | | | | 57,544 | |
7.375% 10/15/20 (a) | | | 50,000 | | | | 52,063 | |
7.500% 10/01/19 (a) | | | 405,000 | | | | 425,250 | |
| |
| Rite Aid Corp. | | | | | |
8.000% 08/15/20 | | | 330,000 | | | | 349,387 | |
| |
| Toys R Us Property Co. II, LLC | | | | | |
8.500% 12/01/17 | | | 200,000 | | | | 215,000 | |
| |
| Toys R Us, Inc. | | | | | |
7.375% 10/15/18 | | | 420,000 | | | | 421,050 | |
| | | | | | | | |
Retail Total | | | | | | | 16,852,153 | |
| | | | | | | | |
Consumer Cyclical Total | | | | | | | 29,029,707 | |
| | | | | | | | |
| Consumer Non-cyclical – 6.2% | |
| Beverages – 1.3% | | | | | |
| Anheuser-Busch InBev Worldwide, Inc. | | | | | |
7.200% 01/15/14 | | | 3,935,000 | | | | 4,470,424 | |
7.750% 01/15/19 | | | 460,000 | | | | 565,942 | |
8.000% 11/15/39 | | | 1,860,000 | | | | 2,486,197 | |
| |
| Cott Beverages, Inc. | | | | | |
8.125% 09/01/18 | | | 101,000 | | | | 107,817 | |
8.375% 11/15/17 | | | 105,000 | | | | 112,087 | |
See Accompanying Notes to Financial Statements.
11
Columbia Corporate Income Fund
March 31, 2011
Corporate Fixed-Income Bonds & Notes (continued)
| | | | | | | | |
| | | Par ($) | | | Value ($) | |
| Consumer Non-cyclical (continued) | |
| PepsiCo, Inc. | | | | | |
4.500% 01/15/20 | | | 1,175,000 | | | | 1,225,952 | |
| | | | | | | | |
Beverages Total | | | | | | | 8,968,419 | |
| |
| Biotechnology – 0.0% | | | | | |
| STHI Holding Corp. | | | | | |
8.000% 03/15/18 (a) | | | 93,000 | | | | 96,255 | |
| | | | | | | | |
Biotechnology Total | | | | | | | 96,255 | |
| |
| Commercial Services – 0.8% | | | | | |
| Avis Budget Car Rental LLC/Avis Budget Finance, Inc. | | | | | |
8.250% 01/15/19 | | | 300,000 | | | | 314,250 | |
| |
| Brickman Group Holdings, Inc. | | | | | |
9.125% 11/01/18 (a) | | | 20,000 | | | | 21,450 | |
| |
| Cardtronics, Inc. | | | | | |
8.250% 09/01/18 | | | 225,000 | | | | 244,406 | |
| |
| Garda World Security Corp. | | | | | |
9.750% 03/15/17 (a) | | | 162,000 | | | | 174,555 | |
| |
| Hertz Corp. | | | | | |
6.750% 04/15/19 (a) | | | 260,000 | | | | 257,725 | |
7.375% 01/15/21 (a) | | | 301,000 | | | | 307,773 | |
7.500% 10/15/18 (a) | | | 220,000 | | | | 227,700 | |
| |
| Interactive Data Corp. | | | | | |
10.250% 08/01/18 (a) | | | 355,000 | | | | 398,487 | |
| |
| Iron Mountain, Inc. | | | | | |
8.000% 06/15/20 | | | 100,000 | | | | 106,000 | |
| |
| President & Fellows of Harvard College | | | | | |
4.875% 10/15/40 | | | 1,490,000 | | | | 1,423,784 | |
6.500% 01/15/39 (a) | | | 490,000 | | | | 589,592 | |
| |
| RSC Equipment Rental, Inc./RSC Holdings III LLC | | | | | |
8.250% 02/01/21 (a) | | | 120,000 | | | | 124,800 | |
9.500% 12/01/14 | | | 345,000 | | | | 361,388 | |
| |
| United Rentals North America, Inc. | | | | | |
8.375% 09/15/20 | | | 425,000 | | | | 444,125 | |
9.250% 12/15/19 | | | 611,000 | | | | 681,265 | |
10.875% 06/15/16 | | | 74,000 | | | | 85,470 | |
| | | | | | | | |
Commercial Services Total | | | | | | | 5,762,770 | |
| |
| Food – 1.6% | | | | | |
| ConAgra Foods, Inc. | | | | | |
7.000% 10/01/28 | | | 2,130,000 | | | | 2,289,009 | |
| |
| Dean Foods Co. | | | | | |
7.000% 06/01/16 | | | 8,000 | | | | 7,630 | |
9.750% 12/15/18 (a) | | | 148,000 | | | | 151,885 | |
| | | | | | | | |
| | | Par ($) | | | Value ($) | |
| Kraft Foods, Inc. | | | | | |
6.500% 02/09/40 | | | 6,450,000 | | | | 6,842,983 | |
| |
| Kroger Co. | | | | | |
8.000% 09/15/29 | | | 1,371,000 | | | | 1,700,838 | |
| | | | | | | | |
Food Total | | | | | | | 10,992,345 | |
| |
| Healthcare Products – 0.0% | | | | | |
| Hanger Orthopedic Group, Inc. | | | | | | | | |
7.125% 11/15/18 | | | 162,000 | | | | 165,240 | |
| | | | | | | | |
Healthcare Products Total | | | | | | | 165,240 | |
| |
| Healthcare Services – 1.0% | | | | | |
| American Renal Holdings Co., Inc. | | | | | | | | |
8.375% 05/15/18 | | | 55,000 | | | | 58,025 | |
PIK, | | | | | |
9.750% 03/01/16 (a) | | | 60,000 | | | | 58,950 | |
| |
| Apria Healthcare Group, Inc. | | | | | |
11.250% 11/01/14 | | | 348,000 | | | | 374,970 | |
| |
| Capella Healthcare, Inc. | | | | | |
9.250% 07/01/17 (a) | | | 40,000 | | | | 43,000 | |
| |
| HCA, Inc. | | | | | |
7.250% 09/15/20 | | | 1,062,000 | | | | 1,136,340 | |
7.875% 02/15/20 | | | 326,000 | | | | 354,525 | |
| |
| Healthsouth Corp. | | | | | |
7.750% 09/15/22 | | | 27,000 | | | | 28,080 | |
8.125% 02/15/20 | | | 177,000 | | | | 191,160 | |
10.750% 06/15/16 | | | 270,000 | | | | 287,550 | |
| |
| LifePoint Hospitals, Inc. | | | | | |
6.625% 10/01/20 (a) | | | 90,000 | | | | 92,250 | |
| |
| Multiplan, Inc. | | | | | |
9.875% 09/01/18 (a) | | | 214,000 | | | | 230,050 | |
| |
| Radiation Therapy Services, Inc. | | | | | |
9.875% 04/15/17 | | | 134,000 | | | | 136,680 | |
| |
| Radnet Management, Inc. | | | | | |
10.375% 04/01/18 | | | 50,000 | | | | 50,562 | |
| |
| Roche Holdings, Inc. | | | | | |
6.000% 03/01/19 (a) | | | 1,275,000 | | | | 1,445,176 | |
| |
| Tenet Healthcare Corp. | | | | | |
8.875% 07/01/19 | | | 420,000 | | | | 478,800 | |
| |
| UnitedHealth Group, Inc. | | | | | |
6.000% 02/15/18 | | | 1,370,000 | | | | 1,523,769 | |
| |
| Vanguard Health Holding Co. II, LLC/Vanguard Holding Co. II, Inc. | | | | | |
7.750% 02/01/19 (a) | | | 111,000 | | | | 112,387 | |
8.000% 02/01/18 | | | 200,000 | | | | 204,750 | |
See Accompanying Notes to Financial Statements.
12
Columbia Corporate Income Fund
March 31, 2011
Corporate Fixed-Income Bonds & Notes (continued)
| | | | | | | | |
| | | Par ($) | | | Value ($) | |
| Consumer Non-cyclical (continued) | |
8.000% 02/01/18 (a) | | | 165,000 | | | | 169,125 | |
| | | | | | | | |
Healthcare Services Total | | | | | | | 6,976,149 | |
| |
| Household Products/Wares – 0.3% | | | | | |
| Central Garden & Pet Co. | | | | | |
8.250% 03/01/18 | | | 300,000 | | | | 313,500 | |
| |
| Reynolds Group Issuer, Inc./Reynolds Group Issuer LLC | | | | | |
6.875% 02/15/21 (a) | | | 180,000 | | | | 180,900 | |
7.125% 04/15/19 (a) | | | 541,000 | | | | 554,525 | |
7.750% 10/15/16 (a) | | | 243,000 | | | | 257,580 | |
8.250% 02/15/21 (a) | | | 274,000 | | | | 271,945 | |
9.000% 04/15/19 (a) | | | 200,000 | | | | 207,000 | |
| |
| Spectrum Brands Holdings, Inc. | | | | | |
9.500% 06/15/18 (a) | | | 419,000 | | | | 460,900 | |
| | | | | | | | |
Household Products/Wares Total | �� | | | | | | 2,246,350 | |
| |
| Pharmaceuticals – 1.2% | | | | | |
| ConvaTec Healthcare E SA | | | | | |
10.500% 12/15/18 (a) | | | 400,000 | | | | 420,000 | |
| |
| Giant Funding Corp. | | | | | |
8.250% 02/01/18 (a) | | | 257,000 | | | | 263,425 | |
| |
| Mylan, Inc. | | | | | |
6.000% 11/15/18 (a) | | | 200,000 | | | | 200,000 | |
| |
| Novartis Securities Investment Ltd. | | | | | |
5.125% 02/10/19 | | | 4,215,000 | | | | 4,562,729 | |
| |
| Valeant Pharmaceuticals International | | | | | |
6.750% 10/01/17 (a) | | | 95,000 | | | | 93,575 | |
7.000% 10/01/20 (a) | | | 158,000 | | | | 153,260 | |
| |
| Warner Chilcott Co., LLC/Warner Chilcott Finance LLC | | | | | |
7.750% 09/15/18 (a) | | | 296,000 | | | | 310,060 | |
| |
| Wyeth | | | | | |
6.500% 02/01/34 | | | 1,810,000 | | | | 2,079,665 | |
| | | | | | | | |
Pharmaceuticals Total | | | | | | | 8,082,714 | |
| | | | | | | | |
Consumer Non-cyclical Total | | | | | | | 43,290,242 | |
| | | | | | | | |
| Energy – 11.4% | | | | | |
| Coal – 0.2% | | | | | |
| Arch Coal, Inc. | | | | | | | | |
7.250% 10/01/20 | | | 525,000 | | | | 562,406 | |
| |
| Consol Energy, Inc. | | | | | |
8.000% 04/01/17 | | | 215,000 | | | | 235,425 | |
8.250% 04/01/20 | | | 435,000 | | | | 482,306 | |
| | | | | | | | |
Coal Total | | | | | | | 1,280,137 | |
| | | | | | | | |
| | | Par ($) | | | Value ($) | |
| Oil & Gas – 6.6% | | | | | |
| Anadarko Petroleum Corp. | | | | | | | | |
6.200% 03/15/40 | | | 7,760,000 | | | | 7,496,889 | |
| |
| Berry Petroleum Co. | | | | | |
6.750% 11/01/20 | | | 70,000 | | | | 72,100 | |
8.250% 11/01/16 | | | 30,000 | | | | 31,725 | |
10.250% 06/01/14 | | | 55,000 | | | | 63,800 | |
| |
| Brigham Exploration Co. | | | | | |
8.750% 10/01/18 (a) | | | 360,000 | | | | 401,400 | |
| |
| Canadian Natural Resources Ltd. | | | | | |
6.250% 03/15/38 | | | 1,580,000 | | | | 1,701,598 | |
| |
| Carrizo Oil & Gas, Inc. | | | | | |
8.625% 10/15/18 (a) | | | 377,000 | | | | 401,505 | |
| |
| Chaparral Energy, Inc. | | | | | |
8.250% 09/01/21 (a) | | | 210,000 | | | | 216,300 | |
9.875% 10/01/20 (a) | | | 97,000 | | | | 107,670 | |
| |
| Chesapeake Energy Corp. | | | | | |
6.125% 02/15/21 | | | 190,000 | | | | 196,175 | |
6.625% 08/15/20 | | | 731,000 | | | | 776,687 | |
| |
| Comstock Resources, Inc. | | | | | |
7.750% 04/01/19 | | | 74,000 | | | | 75,295 | |
8.375% 10/15/17 | | | 33,000 | | | | 34,238 | |
| |
| Concho Resources, Inc./Midland TX | | | | | |
7.000% 01/15/21 | | | 183,000 | | | | 192,608 | |
8.625% 10/01/17 | | | 500,000 | | | | 552,500 | |
| |
| Continental Resources, Inc. | | | | | |
7.125% 04/01/21 | | | 361,000 | | | | 383,562 | |
| |
| Denbury Resources, Inc. | | | | | |
8.250% 02/15/20 | | | 500,000 | | | | 557,500 | |
| |
| Devon Energy Corp. | | | | | |
6.300% 01/15/19 | | | 735,000 | | | | 861,396 | |
| |
| EXCO Resources, Inc. | | | | | |
7.500% 09/15/18 | | | 476,000 | | | | 483,735 | |
| |
| Gazprom International SA | | | | | |
7.201% 02/01/20 (a) | | | 1,449,045 | | | | 1,575,837 | |
| |
| Goodrich Petroleum Corp. | | | | | |
8.875% 03/15/19 (a) | | | 185,000 | | | | 185,000 | |
| |
| Hess Corp. | | | | | |
7.300% 08/15/31 | | | 2,640,000 | | | | 3,095,300 | |
| |
| Hilcorp Energy I LP/Hilcorp Finance Co. | | | | | |
7.625% 04/15/21 (a) | | | 278,000 | | | | 291,205 | |
7.750% 11/01/15 (a) | | | 320,000 | | | | 331,200 | |
See Accompanying Notes to Financial Statements.
13
Columbia Corporate Income Fund
March 31, 2011
Corporate Fixed-Income Bonds & Notes (continued)
| | | | | | | | |
| | | Par ($) | | | Value ($) | |
| Energy (continued) | | | | | |
| Laredo Petroleum, Inc. | | | | | |
9.500% 02/15/19 (a) | | | 509,000 | | | | 529,996 | |
| |
| MEG Energy Corp. | | | | | |
6.500% 03/15/21 (a) | | | 270,000 | | | | 274,388 | |
| |
| Nexen, Inc. | | | | | |
5.875% 03/10/35 | | | 1,875,000 | | | | 1,779,737 | |
7.500% 07/30/39 | | | 1,015,000 | | | | 1,142,913 | |
| | |
| Oasis Petroleum, Inc. | | | | | | | | |
7.250% 02/01/19 (a) | | | 139,000 | | | | 141,085 | |
| | |
| PetroHawk Energy Corp. | | | | | | | | |
7.250% 08/15/18 (a) | | | 187,000 | | | | 192,143 | |
7.250% 08/15/18 | | | 170,000 | | | | 175,100 | |
7.875% 06/01/15 | | | 320,000 | | | | 339,200 | |
| | |
| Qatar Petroleum | | | | | | | | |
5.579% 05/30/11 (a) | | | 116,760 | | | | 117,368 | |
| | |
| QEP Resources, Inc. | | | | | | | | |
6.875% 03/01/21 | | | 255,000 | | | | 267,750 | |
| | |
| Quicksilver Resources, Inc. | | | | | | | | |
8.250% 08/01/15 | | | 93,000 | | | | 96,953 | |
| | |
| Range Resources Corp. | | | | | | | | |
6.750% 08/01/20 | | | 220,000 | | | | 234,025 | |
7.500% 05/15/16 | | | 205,000 | | | | 212,688 | |
8.000% 05/15/19 | | | 105,000 | | | | 115,763 | |
| | |
| Ras Laffan Liquefied Natural Gas Co., Ltd. III | | | | | | | | |
5.832% 09/30/16 (a) | | | 537,920 | | | | 576,650 | |
5.838% 09/30/27 (a) | | | 1,200,000 | | | | 1,203,324 | |
| | |
| Shell International Finance BV | | | | | | | | |
5.500% 03/25/40 | | | 3,865,000 | | | | 3,916,663 | |
| | |
| Southwestern Energy Co. | | | | | | | | |
7.500% 02/01/18 | | | 2,280,000 | | | | 2,584,950 | |
| | |
| Talisman Energy, Inc. | | | | | | | | |
5.850% 02/01/37 | | | 4,845,000 | | | | 4,813,890 | |
7.750% 06/01/19 | | | 5,616,000 | | | | 6,852,565 | |
| | |
| United Refining Co. | | | | | | | | |
10.500% 02/28/18 (a) | | | 299,000 | | | | 299,000 | |
| | |
| Venoco, Inc. | | | | | | | | |
8.875% 02/15/19 (a) | | | 57,000 | | | | 57,000 | |
| | | | | | | | |
Oil & Gas Total | | | | | | | 46,008,376 | |
| | |
| Oil & Gas Services – 0.4% | | | | | | | | |
| Aquilex Holdings LLC/Aquilex Finance Corp. | | | | | |
11.125% 12/15/16 | | | 113,000 | | | | 119,356 | |
| | | | | | | | |
| | | Par ($) | | | Value ($) | |
| Key Energy Services, Inc. | | | | | | | | |
6.750% 03/01/21 | | | 187,000 | | | | 190,272 | |
| |
| Trinidad Drilling Ltd. | | | | | |
7.875% 01/15/19 (a) | | | 191,000 | | | | 201,943 | |
| |
| Weatherford International Ltd. | | | | | |
5.125% 09/15/20 | | | 555,000 | | | | 551,090 | |
7.000% 03/15/38 | | | 1,520,000 | | | | 1,609,949 | |
| | | | | | | | |
Oil & Gas Services Total | | | | | | | 2,672,610 | |
| |
| Pipelines – 4.2% | | | | | |
| Copano Energy LLC/Copano Energy Finance Corp. | |
7.125% 04/01/21 (g) | | | 130,000 | | | | 131,625 | |
| |
| El Paso Corp. | | | | | |
6.500% 09/15/20 (a) | | | 658,000 | | | | 708,995 | |
7.250% 06/01/18 | | | 255,000 | | | | 286,556 | |
7.750% 01/15/32 | | | 300,000 | | | | 336,174 | |
| |
| Energy Transfer Equity LP | | | | | |
7.500% 10/15/20 | | | 305,000 | | | | 332,450 | |
| |
| Energy Transfer Partners LP | | | | | |
6.000% 07/01/13 | | | 1,620,000 | | | | 1,759,965 | |
| |
| Enterprise Products Operating LLC | | | | | |
5.950% 02/01/41 | | | 6,265,000 | | | | 6,093,715 | |
| |
| Kinder Morgan Energy Partners LP | | | | | |
5.625% 02/15/15 | | | 1,025,000 | | | | 1,130,973 | |
6.500% 09/01/39 | | | 1,695,000 | | | | 1,737,168 | |
6.950% 01/15/38 | | | 1,320,000 | | | | 1,422,951 | |
|
| Plains All American Pipeline LP/PAA Finance Corp. | |
5.750% 01/15/20 | | | 1,215,000 | | | | 1,300,384 | |
6.500% 05/01/18 | | | 2,130,000 | | | | 2,394,380 | |
8.750% 05/01/19 | | | 545,000 | | | | 681,822 | |
| |
| Regency Energy Partners LP/Regency Energy Finance Corp. | | | | | |
6.875% 12/01/18 | | | 622,000 | | | | 660,875 | |
9.375% 06/01/16 | | | 110,000 | | | | 125,125 | |
| |
| Southern Natural Gas Co. | | | | | |
8.000% 03/01/32 | | | 1,750,000 | | | | 2,135,443 | |
| |
| Southern Star Central Corp. | | | | | |
6.750% 03/01/16 | | | 65,000 | | | | 65,975 | |
| |
| TransCanada Pipelines Ltd. | | | | | |
6.350% 05/15/67 (05/15/17) (b)(c) | | | 7,670,000 | | | | 7,701,263 | |
| |
| Williams Companies, Inc. | | | | | |
7.875% 09/01/21 | | | 107,000 | | | | 133,157 | |
| | | | | | | | |
Pipelines Total | | | | | | | 29,138,996 | |
| | | | | | | | |
Energy Total | | | | | | | 79,100,119 | |
See Accompanying Notes to Financial Statements.
14
Columbia Corporate Income Fund
March 31, 2011
Corporate Fixed-Income Bonds & Notes (continued)
| | | | | | | | |
| | | Par ($) | | | Value ($) | |
| Financials – 35.7% | | | | | | | | |
| Banks – 19.8% | | | | | | | | |
| Bank of New York Mellon Corp. | | | | | | | | |
4.150% 02/01/21 | | | 13,670,000 | | | | 13,508,639 | |
| | |
| Barclays Bank PLC | | | | | | | | |
3.900% 04/07/15 | | | 965,000 | | | | 998,230 | |
5.000% 09/22/16 | | | 1,800,000 | | | | 1,908,326 | |
6.860% 09/29/49 (a)(c) | | | 2,360,000 | | | | 2,206,600 | |
7.375% 06/29/49 (a)(c) | | | 700,000 | | | | 700,000 | |
7.434% 09/29/49 (a)(c) | | | 4,095,000 | | | | 4,095,000 | |
| | |
| Capital One Capital IV | | | | | | | | |
6.745% 02/17/37 (c) | | | 6,895,000 | | | | 6,920,856 | |
| | |
| Capital One Capital V | | | | | | | | |
10.250% 08/15/39 | | | 7,145,000 | | | | 7,752,325 | |
| | |
| Capital One Financial Corp. | | | | | | | | |
7.375% 05/23/14 | | | 255,000 | | | | 292,687 | |
| | |
| Chinatrust Commercial Bank | | | | | | | | |
5.625% 12/29/49 (03/17/15) (a)(b)(c) | | | 825,000 | | | | 807,711 | |
| | |
| CIT Group, Inc. | | | | | | | | |
6.625% 04/01/18 (a) | | | 305,000 | | | | 309,575 | |
7.000% 05/01/17 | | | 1,695,000 | | | | 1,697,119 | |
| | |
| Discover Bank/Greenwood DE | | | | | | | | |
8.700% 11/18/19 | | | 705,000 | | | | 844,634 | |
| | |
| Discover Financial Services | | | | | | | | |
10.250% 07/15/19 | | | 545,000 | | | | 701,125 | |
| | |
| Fifth Third Bank/Ohio | | | | | | | | |
0.424% 05/17/13 (05/17/11) (b)(c) | | | 1,065,000 | | | | 1,046,937 | |
| | |
| HSBC USA, Inc. | | | | | | | | |
5.000% 09/27/20 | | | 4,470,000 | | | | 4,389,048 | |
| | |
| ING Bank NV | | | | | | | | |
4.000% 03/15/16 (a) | | | 3,660,000 | | | | 3,654,887 | |
| | |
| JPMorgan Chase & Co. | | | | | | | | |
7.900% 04/29/49 (04/30/18) (b)(c) | | | 1,915,000 | | | | 2,095,221 | |
| | |
| JPMorgan Chase Capital XVII | | | | | | | | |
5.850% 08/01/35 | | | 2,190,000 | | | | 2,113,315 | |
| | |
| JPMorgan Chase Capital XX | | | | | | | | |
6.550% 09/15/66 | | | 1,850,000 | | | | 1,880,329 | |
| |
| JPMorgan Chase Capital XXIII | | | | | |
1.313% 05/15/77 (05/16/11) (b)(c) | | | 2,755,000 | | | | 2,280,327 | |
| |
| JPMorgan Chase Capital XXV | | | | | |
6.800% 10/01/37 | | | 8,185,000 | | | | 8,227,022 | |
| | | | | | | | |
| | | Par ($) | | | Value ($) | |
| Lloyds Banking Group PLC | | | | | |
6.267% 12/31/49 (11/14/16) (a)(b)(c) | | | 1,720,000 | | | | 1,388,900 | |
6.657% 01/29/49 (a) | | | 2,296,000 | | | | 1,836,800 | |
| |
| Lloyds TSB Bank PLC | | | | | |
4.375% 01/12/15 (a) | | | 5,928,000 | | | | 6,037,804 | |
| |
| Merrill Lynch & Co., Inc. | | | | | |
5.700% 05/02/17 (h) | | | 2,215,000 | | | | 2,298,689 | |
| |
| PNC Funding Corp. | | | | | |
3.625% 02/08/15 | | | 1,870,000 | | | | 1,933,294 | |
| |
| Santander U.S. Debt SA Unipersonal | | | | | |
3.724% 01/20/15 (a) | | | 1,695,000 | | | | 1,639,150 | |
3.781% 10/07/15 (a) | | | 3,515,000 | | | | 3,377,698 | |
| |
| State Street Corp. | | | | | |
2.875% 03/07/16 | | | 1,455,000 | | | | 1,445,397 | |
4.956% 03/15/18 | | | 11,715,000 | | | | 12,071,839 | |
| |
| SunTrust Preferred Capital I | | | | | |
5.853% 12/31/49 (12/15/11) (b)(c) | | | 545,000 | | | | 433,275 | |
| |
| U.S. Bancorp | | | | | |
3.442% 02/01/16 | | | 11,875,000 | | | | 11,839,054 | |
| |
| USB Capital XIII Trust | | | | | |
6.625% 12/15/39 | | | 8,715,000 | | | | 9,123,472 | |
| |
| Wachovia Capital Trust III | | | | | |
5.570% 03/29/49 (06/15/11) (b)(c) | | | 540,000 | | | | 495,450 | |
| |
| Wells Fargo & Co. | | | | | |
3.676% 06/15/16 | | | 12,565,000 | | | | 12,639,259 | |
| |
| Wells Fargo Capital X | | | | | |
5.950% 12/01/86 | | | 2,740,000 | | | | 2,697,944 | |
| | | | | | | | |
Banks Total | | | | | | | 137,687,938 | |
| |
| Diversified Financial Services – 2.4% | | | | | |
| Ally Financial, Inc. | | | | | |
6.250% 12/01/17 (a) | | | 265,000 | | | | 269,969 | |
7.500% 09/15/20 (a) | | | 220,000 | | | | 232,100 | |
8.000% 03/15/20 | | | 1,060,000 | | | | 1,154,075 | |
| |
| E*Trade Financial Corp. | | | | | |
7.375% 09/15/13 | | | 75,000 | | | | 75,281 | |
7.875% 12/01/15 | | | 695,000 | | | | 703,687 | |
PIK, | | | | | |
12.500% 11/30/17 | | | 250,000 | | | | 298,125 | |
| Eaton Vance Corp. | | | | | |
6.500% 10/02/17 | | | 1,830,000 | | | | 2,072,803 | |
| |
| Ford Motor Credit Co., LLC | | | | | |
5.750% 02/01/21 | | | 545,000 | | | | 538,186 | |
See Accompanying Notes to Financial Statements.
15
Columbia Corporate Income Fund
March 31, 2011
Corporate Fixed-Income Bonds & Notes (continued)
| | | | | | | | |
| | | Par ($) | | | Value ($) | |
| Financials (continued) | | | | | | | | |
7.000% 04/15/15 | | | 140,000 | | | | 151,540 | |
7.500% 08/01/12 | | | 1,150,000 | | | | 1,226,206 | |
| |
| General Electric Capital Corp. | | | | | |
4.375% 09/16/20 | | | 2,860,000 | | | | 2,779,348 | |
4.625% 01/07/21 | | | 3,300,000 | | | | 3,249,913 | |
| |
| HSBC Finance Capital Trust IX | | | | | |
5.911% 11/30/35 (c) | | | 985,000 | | | | 943,137 | |
| |
| International Lease Finance Corp. | | | | | |
8.250% 12/15/20 | | | 175,000 | | | | 191,844 | |
8.875% 09/01/17 | | | 295,000 | | | | 334,087 | |
9.000% 03/15/17 (a) | | | 231,000 | | | | 259,875 | |
| |
| Lehman Brothers Holdings, Inc. | | | | | |
5.625% 01/24/13 (i) | | | 6,170,000 | | | | 1,604,200 | |
6.875% 05/02/18 (i) | | | 600,000 | | | | 157,500 | |
| |
| PF Export Receivables Master Trust | | | | | |
3.748% 06/01/13 (a) | | | 299,463 | | | | 299,405 | |
| |
| SLM Corp. | | | | | |
6.250% 01/25/16 | | | 233,000 | | | | 242,903 | |
8.000% 03/25/20 | | | 110,000 | | | | 119,900 | |
| |
| Springleaf Finance Corp. | | | | | |
6.900% 12/15/17 | | | 328,000 | | | | 300,120 | |
| | | | | | | | |
Diversified Financial Services Total | | | | | | | 17,204,204 | |
| |
| Insurance – 10.2% | | | | | |
| CNA Financial Corp. | | | | | |
5.750% 08/15/21 | | | 2,245,000 | | | | 2,298,467 | |
5.850% 12/15/14 | | | 933,000 | | | | 1,005,925 | |
7.350% 11/15/19 | | | 2,287,000 | | | | 2,582,903 | |
| |
| ING Groep NV | | | | | |
5.775% 12/29/49 (12/08/15) (b)(c) | | | 8,064,000 | | | | 7,459,200 | |
| |
| Liberty Mutual Group, Inc. | | | | | |
7.500% 08/15/36 (a) | | | 5,290,000 | | | | 5,660,300 | |
10.750% 06/15/88 (06/15/58) (a)(b)(c) | | | 6,810,000 | | | | 8,853,000 | |
| |
| Lincoln National Corp. | | | | | |
8.750% 07/01/19 | | | 7,115,000 | | | | 9,009,440 | |
| |
| MetLife Capital Trust X | | | | | |
9.250% 04/08/68 (04/08/38) (a)(b)(c) | | | 1,860,000 | | | | 2,245,950 | |
| |
| MetLife, Inc. | | | | | |
6.750% 06/01/16 | | | 2,705,000 | | | | 3,126,829 | |
10.750% 08/01/39 | | | 6,710,000 | | | | 9,259,800 | |
| |
| OneBeacon U.S. Holdings, Inc. | | | | | |
5.875% 05/15/13 | | | 1,472,000 | | | | 1,582,400 | |
| |
| Provident Companies, Inc. | | | | | |
7.000% 07/15/18 | | | 120,000 | | | | 132,753 | |
| | | | | | | | |
| | | Par ($) | | | Value ($) | |
| Prudential Financial, Inc. | | | | | |
4.500% 07/15/13 | | | 1,580,000 | | | | 1,659,687 | |
4.750% 06/13/15 | | | 1,075,000 | | | | 1,139,697 | |
8.875% 06/15/68 (06/15/38) (b)(c) | | | 2,930,000 | | | | 3,457,400 | |
| |
| Transatlantic Holdings, Inc. | | | | | |
8.000% 11/30/39 | | | 8,870,000 | | | | 9,314,653 | |
| |
| Unum Group | | | | | |
7.125% 09/30/16 | | | 1,735,000 | | | | 1,955,924 | |
| | | | | | | | |
Insurance Total | | | | | | | 70,744,328 | |
| |
| Investment Companies – 0.1% | | | | | |
| Offshore Group Investments Ltd. | | | | | |
11.500% 08/01/15 | | | 485,000 | | | | 538,350 | |
| | | | | | | | |
Investment Companies Total | | | | | | | 538,350 | |
|
| Real Estate Investment Trusts (REITs) – 3.2% | |
| Boston Properties LP | | | | | |
4.125% 05/15/21 | | | 10,635,000 | | | | 10,115,023 | |
| |
| Brandywine Operating Partnership LP | | | | | |
7.500% 05/15/15 | | | 1,250,000 | | | | 1,412,249 | |
| |
| Duke Realty LP | | | | | |
7.375% 02/15/15 | | | 1,860,000 | | | | 2,111,189 | |
8.250% 08/15/19 | | | 6,325,000 | | | | 7,595,806 | |
| |
| Highwoods Properties, Inc. | | | | | |
5.850% 03/15/17 | | | 740,000 | | | | 787,558 | |
| | | | | | | | |
Real Estate Investment Trusts (REITs) Total | | | | 22,021,825 | |
| |
| Savings & Loans – 0.0% | | | | | |
| Washington Mutual Bank | | | | | |
5.125% 01/15/15 (i) | | | 6,350,000 | | | | 7,937 | |
| |
| Washington Mutual Preferred Funding Delaware | | | | | |
6.534% 03/29/49 (a)(i) | | | 1,075,000 | | | | 21,500 | |
| | | | | | | | |
Savings & Loans Total | | | | | | | 29,437 | |
| | | | | | | | |
Financials Total | | | | | | | 248,226,082 | |
| | | | | | | | |
| Industrials – 4.0% | | | | | | | | |
| Aerospace & Defense – 1.1% | | | | | |
| Acquisition Co. Lanza Parent | | | | | |
10.000% 06/01/17 (a) | | | 413,000 | | | | 456,365 | |
| |
| ADS Tactical, Inc. | | | | | |
11.000% 04/01/18 (a) | | | 585,000 | | | | 599,625 | |
| |
| Embraer Overseas Ltd. | | | | | |
6.375% 01/15/20 | | | 2,600,000 | | | | 2,795,000 | |
| |
| Kratos Defense & Security Solutions, Inc. | | | | | |
10.000% 06/01/17 | | | 255,000 | | | | 281,137 | |
See Accompanying Notes to Financial Statements.
16
Columbia Corporate Income Fund
March 31, 2011
Corporate Fixed-Income Bonds & Notes (continued)
| | | | | | | | |
| | | Par ($) | | | Value ($) | |
| Industrials (continued) | | | | | | | | |
| L-3 Communications Corp. | | | | | |
4.950% 02/15/21 | | | 2,795,000 | | | | 2,811,309 | |
| |
| Systems 2001 Asset Trust | | | | | |
6.664% 09/15/13 (a) | | | 365,636 | | | | 399,574 | |
| |
| TransDigm, Inc. | | | | | |
7.750% 12/15/18 (a) | | | 229,000 | | | | 245,889 | |
| | | | | | | | |
Aerospace & Defense Total | | | | | | | 7,588,899 | |
| |
| Air Transportation – 0.0% | | | | | |
| Air 2 US | | | | | |
8.027% 10/01/19 (a) | | | 314,887 | | | | 324,334 | |
| | | | | | | | |
Air Transportation Total | | | | | | | 324,334 | |
| |
| Building Materials – 0.2% | | | | | |
| Associated Materials LLC | | | | | |
9.125% 11/01/17 (a) | | | 132,000 | | | | 140,250 | |
| |
| Euramax International, Inc. | | | | | |
9.500% 04/01/16 (a) | | | 245,000 | | | | 248,063 | |
| |
| Gibraltar Industries, Inc. | | | | | |
8.000% 12/01/15 | | | 645,000 | | | | 659,512 | |
| |
| Interline Brands, Inc. | | | | | |
7.000% 11/15/18 | | | 99,000 | | | | 101,475 | |
| |
| Nortek, Inc. | | | | | |
11.000% 12/01/13 | | | 345,933 | | | | 365,824 | |
| | | | | | | | |
Building Materials Total | | | | | | | 1,515,124 | |
|
| Electrical Components & Equipment – 0.0% | |
| WireCo WorldGroup | | | | | |
9.500% 05/15/17 (a) | | | 228,000 | | | | 242,820 | |
| | | | | | | | |
Electrical Components & Equipment Total | | | | 242,820 | |
| |
| Environmental Control – 0.1% | | | | | |
| Clean Harbors, Inc. | | | | | |
7.625% 08/15/16 (a) | | | 100,000 | | | | 106,125 | |
7.625% 08/15/16 | | | 243,000 | | | | 257,884 | |
| |
| Darling International, Inc. | | | | | |
8.500% 12/15/18 (a) | | | 45,000 | | | | 48,937 | |
| | | | | | | | |
Environmental Control Total | | | | | | | 412,946 | |
| |
| Machinery-Diversified – 0.3% | | | | | |
| Case New Holland, Inc. | | | | | |
7.875% 12/01/17 (a) | | | 943,000 | | | | 1,046,730 | |
| |
| Columbus McKinnon Corp. | | | | | |
7.875% 02/01/19 (a) | | | 81,000 | | | | 83,835 | |
| |
| CPM Holdings, Inc. | | | | | |
10.875% 09/01/14 (a) | | | 255,000 | | | | 275,400 | |
| | | | | | | | |
| | | Par ($) | | | Value ($) | |
| Manitowoc Co., Inc. | | | | | |
7.125% 11/01/13 | | | 300,000 | | | | 303,375 | |
8.500% 11/01/20 | | | 595,000 | | | | 638,138 | |
| | | | | | | | |
Machinery-Diversified Total | | | | | | | 2,347,478 | |
| |
| Miscellaneous Manufacturing – 0.9% | | | | | |
| Amsted Industries, Inc. | | | | | |
8.125% 03/15/18 (a) | | | 375,000 | | | | 401,250 | |
| |
| Bombardier, Inc. | | | | | |
6.300% 05/01/14 (a) | | | 105,000 | | | | 111,563 | |
| |
| Ingersoll-Rand Global Holding Co., Ltd. | | | | | |
9.500% 04/15/14 | | | 2,275,000 | | | | 2,730,416 | |
| |
| Polypore International, Inc. | | | | | |
7.500% 11/15/17 (a) | | | 215,000 | | | | 225,750 | |
| |
| SPX Corp. | | | | | |
6.875% 09/01/17 (a) | | | 181,000 | | | | 194,575 | |
| |
| Tyco International Ltd./Tyco International Finance SA | | | | | |
6.875% 01/15/21 | | | 2,345,000 | | | | 2,801,140 | |
| | | | | | | | |
Miscellaneous Manufacturing Total | | | | | | | 6,464,694 | |
| |
| Packaging & Containers – 0.3% | | | | | |
| Ardagh Packaging Finance PLC | | | | | |
9.125% 10/15/20 (a) | | | 505,000 | | | | 546,662 | |
| |
| Crown Americas LLC & Crown Americas Capital Corp. II | | | | | |
7.625% 05/15/17 | | | 220,000 | | | | 240,350 | |
| |
| Graham Packaging Co., LP/GPC Capital Corp. I | | | | | |
8.250% 01/01/17 | | | 100,000 | | | | 107,250 | |
| |
| Graphic Packaging International, Inc. | | | | | |
7.875% 10/01/18 | | | 56,000 | | | | 59,920 | |
9.500% 06/15/17 | | | 450,000 | | | | 499,500 | |
| |
| Greif, Inc. | | | | | |
7.750% 08/01/19 | | | 275,000 | | | | 300,438 | |
| | | | | | | | |
Packaging & Containers Total | | | | | | | 1,754,120 | |
| |
| Shipbuilding – 0.1% | | | | | |
| Huntington Ingalls Industries, Inc. | | | | | |
6.875% 03/15/18 (a) | | | 190,000 | | | | 198,313 | |
7.125% 03/15/21 (a) | | | 261,000 | | | | 272,092 | |
| | | | | | | | |
Shipbuilding Total | | | | | | | 470,405 | |
| |
| Transportation – 1.0% | | | | | |
| AMGH Merger Sub, Inc. | | | | | |
9.250% 11/01/18 (a) | | | 247,000 | | | | 264,908 | |
| |
| BNSF Funding Trust I | | | | | |
6.613% 12/15/55 (01/15/26) (b)(c) | | | 3,275,000 | | | | 3,401,906 | |
See Accompanying Notes to Financial Statements.
17
Columbia Corporate Income Fund
March 31, 2011
Corporate Fixed-Income Bonds & Notes (continued)
| | | | | | | | |
| | | Par ($) | | | Value ($) | |
| Industrials (continued) | | | | | | | | |
| Bristow Group, Inc. | | | | | |
7.500% 09/15/17 | | | 300,000 | | | | 315,375 | |
| |
| Burlington Northern Santa Fe LLC | | | | | |
7.950% 08/15/30 | | | 855,000 | | | | 1,085,795 | |
| |
| Union Pacific Corp. | | | | | |
5.700% 08/15/18 | | | 1,810,000 | | | | 2,026,568 | |
| | | | | | | | |
Transportation Total | | | | | | | 7,094,552 | |
| | | | | | | | |
Industrials Total | | | | | | | 28,215,372 | |
| | | | | | | | |
| Information Technology – 0.2% | | | | | | | | |
| IT Services – 0.2% | | | | | |
| First Data Corp. | | | | | |
7.375% 06/15/19 (g) | | | 201,000 | | | | 205,271 | |
8.875% 08/15/20 (a) | | | 295,000 | | | | 323,762 | |
9.875% 09/24/15 | | | 215,000 | | | | 220,343 | |
12.625% 01/15/21 (a) | | | 514,000 | | | | 557,690 | |
PIK, | | | | | |
10.550% 09/24/15 | | | 5,263 | | | | 5,510 | |
| | | | | | | | |
IT Services Total | | | | | | | 1,312,576 | |
| | | | | | | | |
Information Technology Total | | | | | | | 1,312,576 | |
| | | | | | | | |
| Technology – 1.2% | | | | | | | | |
| Computers – 0.0% | | | | | |
| CDW Escrow Corp. | | | | | |
8.500% 04/01/19 (a)(g) | | | 245,000 | | | | 245,306 | |
| | | | | | | | |
Computers Total | | | | | | | 245,306 | |
| |
| Networking Products – 0.3% | | | | | |
| Cisco Systems, Inc. | | | | | |
5.500% 01/15/40 | | | 795,000 | | | | 780,282 | |
5.900% 02/15/39 | | | 1,290,000 | | | | 1,338,588 | |
| | | | | | | | |
Networking Products Total | | | | | | | 2,118,870 | |
| |
| Semiconductors – 0.2% | | | | | |
| Amkor Technology, Inc. | | | | | |
7.375% 05/01/18 | | | 118,000 | | | | 122,130 | |
9.250% 06/01/16 | | | 160,000 | | | | 167,800 | |
| |
| Freescale Semiconductor, Inc. | | | | | |
9.250% 04/15/18 (a) | | | 165,000 | | | | 180,675 | |
| |
| NXP BV/NXP Funding LLC | | | | | |
9.750% 08/01/18 (a) | | | 570,000 | | | | 641,962 | |
| | | | | | | | |
Semiconductors Total | | | | | | | 1,112,567 | |
| |
| Software – 0.7% | | | | | |
| Oracle Corp. | | | | | |
5.375% 07/15/40 (a) | | | 2,220,000 | | | | 2,157,594 | |
6.500% 04/15/38 | | | 1,850,000 | | | | 2,074,871 | |
| | | | | | | | |
| | | Par ($) | | | Value ($) | |
| Sungard Data Systems, Inc. | | | | | |
7.375% 11/15/18 (a) | | | 385,000 | | | | 393,663 | |
| | | | | | | | |
Software Total | | | | | | | 4,626,128 | |
| | | | | | | | |
Technology Total | | | | | | | 8,102,871 | |
| | | | | | | | |
| Utilities – 8.6% | | | | | | | | |
| Electric – 7.7% | | | | | |
| American Electric Power Co., Inc. | | | | | |
5.250% 06/01/15 | | | 1,825,000 | | | | 1,978,218 | |
| |
| Calpine Corp. | | | | | |
7.500% 02/15/21 (a) | | | 400,000 | | | | 414,500 | |
| |
| CMS Energy Corp. | | | | | |
4.250% 09/30/15 | | | 1,480,000 | | | | 1,485,550 | |
6.875% 12/15/15 | | | 205,000 | | | | 225,098 | |
| |
| Commonwealth Edison Co. | | | | | |
5.900% 03/15/36 | | | 690,000 | | | | 702,858 | |
5.950% 08/15/16 | | | 1,495,000 | | | | 1,677,913 | |
6.150% 09/15/17 | | | 1,890,000 | | | | 2,115,256 | |
6.950% 07/15/18 | | | 2,645,000 | | | | 2,921,540 | |
| |
| Consolidated Edison Co. of New York, Inc. | | | | | |
6.750% 04/01/38 | | | 1,610,000 | | | | 1,899,438 | |
| |
| Dominion Resources, Inc. | | | | | |
8.875% 01/15/19 | | | 1,500,000 | | | | 1,914,685 | |
| |
| DTE Energy Co. | | | | | |
7.625% 05/15/14 | | | 955,000 | | | | 1,097,152 | |
| |
| Edison Mission Energy | | | | | |
7.000% 05/15/17 | | | 317,000 | | | | 254,392 | |
| |
| Energy Future Holdings Corp. | | | | | |
10.000% 01/15/20 | | | 292,000 | | | | 309,425 | |
| |
| Energy Future Intermediate Holding Co., LLC/EFIH Finance, Inc. | | | | | |
10.000% 12/01/20 | | | 107,000 | | | | 113,385 | |
| |
| Exelon Generation Co., LLC | | | | | |
6.200% 10/01/17 | | | 1,000,000 | | | | 1,107,719 | |
| |
| FPL Energy American Wind LLC | | | | | |
6.639% 06/20/23 (a) | | | 798,713 | | | | 807,307 | |
| |
| FPL Energy National Wind LLC | | | | | |
5.608% 03/10/24 (a) | | | 148,751 | | | | 148,164 | |
| |
| GenOn Energy, Inc. | | | | | |
9.500% 10/15/18 (a) | | | 171,000 | | | | 178,268 | |
| |
| Georgia Power Co. | | | | | |
4.750% 09/01/40 | | | 4,425,000 | | | | 3,962,667 | |
See Accompanying Notes to Financial Statements.
18
Columbia Corporate Income Fund
March 31, 2011
Corporate Fixed-Income Bonds & Notes (continued)
| | | | | | | | |
| | | Par ($) | | | Value ($) | |
| Utilities (continued) | | | | | | | | |
| Ipalco Enterprises, Inc. | | | | | |
7.250% 04/01/16 (a) | | | 330,000 | | | | 357,225 | |
| |
| Kansas City Power & Light Co. | | | | | |
7.150% 04/01/19 | | | 5,120,000 | | | | 6,001,787 | |
| |
| Nevada Power Co. | | | | | |
5.375% 09/15/40 | | | 445,000 | | | | 426,286 | |
| |
| Niagara Mohawk Power Corp. | | | | | |
4.881% 08/15/19 (a) | | | 3,800,000 | | | | 3,993,272 | |
| |
| NRG Energy, Inc. | | | | | |
7.375% 01/15/17 | | | 880,000 | | | | 917,400 | |
| |
| Oncor Electric Delivery Co., LLC | | | | | |
5.250% 09/30/40 (a) | | | 4,660,000 | | | | 4,270,517 | |
5.950% 09/01/13 | | | 4,665,000 | | | | 5,089,235 | |
7.250% 01/15/33 | | | 1,300,000 | | | | 1,513,797 | |
| |
| Southern California Edison Co. | | | | | |
4.500% 09/01/40 | | | 5,120,000 | | | | 4,473,062 | |
| |
| Southern Co. | | | | | |
4.150% 05/15/14 | | | 1,010,000 | | | | 1,068,548 | |
| |
| Tenaska Alabama II Partners LP | | | | | |
6.125% 03/30/23 (a) | | | 924,148 | | | | 938,380 | |
| |
| Windsor Financing LLC | | | | | |
5.881% 07/15/17 (a) | | | 1,458,335 | | | | 1,302,526 | |
| | | | | | | | |
Electric Total | | | | | | | 53,665,570 | |
| |
| Gas – 0.9% | | | | | |
| Atmos Energy Corp. | | | | | |
6.350% 06/15/17 | | | 1,375,000 | | | | 1,532,210 | |
8.500% 03/15/19 | | | 1,705,000 | | | | 2,129,842 | |
| |
| Nakilat, Inc. | | | | | |
6.067% 12/31/33 (a) | | | 1,160,000 | | | | 1,154,200 | |
| |
| Sempra Energy | | | | | |
6.500% 06/01/16 | | | 1,120,000 | | | | 1,278,255 | |
| | | | | | | | |
Gas Total | | | | | | | 6,094,507 | |
| | | | | | | | |
Utilities Total | | | | | | | 59,760,077 | |
| | | | | | | | |
Total Corporate Fixed-Income Bonds & Notes
(Cost of $584,871,054) | | | | 593,512,094 | |
|
Government & Agency Obligations – 5.4% | |
| | | | | | | | |
| Foreign Government Obligations – 0.4% | | | | | |
| Federative Republic of Brazil | | | | | |
6.000% 01/17/17 | | | 1,000,000 | | | | 1,121,000 | |
| | | | | | | | |
| | | Par ($) | | | Value ($) | |
| Republic of Italy | | | | | |
5.375% 06/12/17 | | | 1,600,000 | | | | 1,701,294 | |
| | | | | | | | |
Foreign Government Obligations Total | | | | 2,822,294 | |
| | | | | | | | |
| U.S. Government Obligations – 5.0% | | | | | |
| U.S. Treasury Bonds | | | | | |
4.250% 11/15/40 | | | 2,439,000 | | | | 2,332,674 | |
| |
| U.S. Treasury Notes | | | | | |
0.750% 03/31/13 | | | 20,000,000 | | | | 19,984,400 | |
2.125% 02/29/16 | | | 10,185,000 | | | | 10,153,172 | |
3.625% 02/15/21 | | | 2,500,000 | | | | 2,535,548 | |
| | | | | | | | |
U.S. Government Obligations Total | | | | | | | 35,005,794 | |
| | | | | | | | |
Total Government & Agency Obligations
(Cost of $37,745,423) | | | | 37,828,088 | |
| | |
Asset-Backed Securities – 3.0% | | | | | | | | |
| Bay View Auto Trust | | | | | | | | |
5.310% 06/25/14 | | | 443,379 | | | | 444,683 | |
|
| Citicorp Residential Mortgage Securities, Inc. | |
5.892% 03/25/37 (04/01/11) (b)(c) | | | 3,300,000 | | | | 3,175,389 | |
6.080% 06/25/37 (04/01/11) (b)(c) | | | 4,000,000 | | | | 3,948,780 | |
| |
| Citigroup Mortgage Loan Trust, Inc. | | | | | |
5.517% 08/25/35 (04/01/11) (b)(c) | | | 1,200,000 | | | | 119,099 | |
5.598% 03/25/36 (04/01/11) (b)(c) | | | 291,632 | | | | 220,564 | |
5.666% 08/25/35 (04/01/11) (b)(c) | | | 1,000,000 | | | | 29,103 | |
| |
| Countrywide Asset-Backed Certificates | | | | | |
0.360% 06/25/21 (04/25/11) (b)(c) | | | 68,877 | | | | 67,046 | |
| |
| Ford Credit Auto Owner Trust | | | | | |
5.470% 09/15/12 | | | 4,000,000 | | | | 4,054,888 | |
5.690% 11/15/12 | | | 3,000,000 | | | | 3,104,536 | |
| |
| Green Tree Financial Corp. | | | | | |
6.870% 01/15/29 | | | 308,541 | | | | 328,715 | |
| |
| Harley-Davidson Motorcycle Trust | | | | | |
5.540% 04/15/15 | | | 1,400,000 | | | | 1,429,209 | |
| |
| JPMorgan Auto Receivables Trust | | | | | |
5.610% 12/15/14 (a) | | | 281,111 | | | | 281,177 | |
| |
| Residential Asset Mortgage Products, Inc. | | | | | |
4.120% 06/25/33 (04/01/11) (b)(c) | | | 206,174 | | | | 132,575 | |
| |
| Small Business Administration Participation Certificates | | | | | |
5.570% 03/01/26 | | | 702,071 | | | | 752,851 | |
| |
| Wachovia Auto Loan Owner Trust | | | | | |
5.650% 02/20/13 | | | 2,500,000 | | | | 2,511,268 | |
| | | | | | | | |
Total Asset-Backed Securities
(cost of $22,739,445) | | | | | | | 20,599,883 | |
See Accompanying Notes to Financial Statements.
19
Columbia Corporate Income Fund
March 31, 2011
Municipal Bonds – 2.7%
| | | | | | | | |
| | | Par ($) | | | Value ($) | |
| California – 1.0% | | | | | |
| CA Educational Facilities Authority | | | | | |
University of Southern California, Series 2009 A, | | | | | | | | |
5.250% 10/01/38 | | | 1,530,000 | | | | 1,544,152 | |
| |
| CA Los Angeles Unified School District | | | | | |
Series 2009,
5.750% 07/01/34 | | | 2,055,000 | | | | 1,940,475 | |
| |
| CA State | | | | | |
Series 2010,
3.950% 11/01/15 | | | 3,550,000 | | | | 3,546,379 | |
| | | | | | | | |
California Total | | | | | | | 7,031,006 | |
| | | | | | | | |
| Illinois – 0.1% | | | | | |
| IL Chicago | | | | | |
Series 2010 B,
6.742% 11/01/40 | | | 430,000 | | | | 439,563 | |
| | | | | | | | |
Illinois Total | | | | | | | 439,563 | |
| | | | | | | | |
| Kentucky – 0.6% | | | | | |
| KY Asset Liability Commission | | | | | |
Series 2010,
3.165% 04/01/18 | | | 4,365,000 | | | | 4,235,665 | |
| | | | | | | | |
Kentucky Total | | | | | | | 4,235,665 | |
| | | | | | | | |
| Massachusetts – 0.8% | | | | | |
| MA State | | | | | |
Series 2010:
5.631% 06/01/30 | | | 1,700,000 | | | | 1,769,156 | |
5.731% 06/01/40 | | | 3,450,000 | | | | 3,544,496 | |
| | | | | | | | |
Massachusetts Total | | | | | | | 5,313,652 | |
| | | | | | | | |
| New York – 0.2% | | | | | |
| NY New York City Municipal Water Finance Authority | | | | | |
Series 2005 D,
5.000% 06/15/39 | | | 1,895,000 | | | | 1,825,529 | |
| | | | | | | | |
New York Total | | | | | | | 1,825,529 | |
| | | | | | | | |
Total Municipal Bonds
(cost of $18,895,258) | | | | | | | 18,845,415 | |
| | |
Preferred Stocks – 1.4% | | | | | | | | |
| | | Shares | | | | |
| Communications – 0.0% | | | | | |
| Media – 0.0% | | | | | |
CMP Susquehanna Radio Holdings Corp., Series A (a)(d)(j) | | | 7,089 | | | | 71 | |
| | | | | | | | |
Media Total | | | | | | | 71 | |
| | | | | | | | |
Communications Total | | | | | | | 71 | |
| | | | | | | | |
| | | Shares | | | Value ($) | |
| Financials – 1.4% | | | | | | | | |
| Diversified Financial Services – 1.4% | | | | | |
Citigroup Capital XIII 7.875% 10/30/40 (10/30/15) (b)(c) | | | 361,140 | | | | 9,895,236 | |
| | | | | | | | |
Diversified Financial Services Total | | | | | | | 9,895,236 | |
| | | | | | | | |
Financials Total | | | | | | | 9,895,236 | |
| | | | | | | | |
Total Preferred Stocks
(cost of $9,485,630) | | | | | | | 9,895,307 | |
| |
Commercial Mortgage-Backed Securities – 0.9% | | | | | |
| | | Par ($) | | | | |
| Bear Stearns Commercial Mortgage Securities | | | | | |
5.723% 09/11/38 (04/01/11) (b)(c) | | | 3,750,000 | | | | 4,113,402 | |
| |
| GMAC Commercial Mortgage Securities, Inc. | | | | | |
5.472% 05/10/40 (04/01/11) (b)(c) | | | 1,230,000 | | | | 1,314,356 | |
| |
| LB-UBS Commercial Mortgage Trust | | | | | |
5.430% 02/15/40 | | | 695,000 | | | | 732,335 | |
| | | | | | | | |
Total Commercial Mortgage-Backed Securities
(Cost of $3,880,698) | | | | 6,160,093 | |
| |
Common Stock – 0.1% | | | | | |
| | | Shares | | | | |
| Consumer Discretionary – 0.1% | | | | | | | | |
Six Flags Entertainment Corp. | | | 5,126 | | | | 369,040 | |
| | | | | | | | |
Consumer Discretionary Total | | | | | | | 369,040 | |
| | | | | | | | |
Total Common Stock
(Cost of $369,395) | | | | 369,040 | |
| |
Collateralized Mortgage Obligations – 0.0% | | | | | |
| | | Par ($) | | | | |
| Non-Agency – 0.0% | | | | | |
| Citicorp Mortgage Securities, Inc. | | | | | |
5.949% 05/25/37 (04/01/11) (b)(c) | | | 1,300,182 | | | | 13 | |
| |
| Countrywide Alternative Loan Trust | | | | | |
5.500% 09/25/35 | | | 1,989,227 | | | | 16,238 | |
| Sequoia Mortgage Trust | | | | | |
5.537% 07/20/37 (04/01/11) (b)(c) | | | 724,110 | | | | 90,617 | |
| | | | | | | | |
Non-Agency Total | | | | | | | 106,868 | |
| | | | | | | | |
Total Collateralized Mortgage Obligations
(cost of $4,199,435) | | | | 106,868 | |
See Accompanying Notes to Financial Statements.
20
Columbia Corporate Income Fund
March 31, 2011
Mortgage-Backed Securities – 0.0%
| | | | | | | | |
| | | Par ($) | | | Value ($) | |
| Government National Mortgage Association | |
10.000% 10/15/17 | | | 1,021 | | | | 1,028 | |
10.000% 01/15/19 | | | 233 | | | | 261 | |
10.500% 01/15/16 | | | 2,003 | | | | 2,015 | |
10.500% 04/15/20 | | | 1,259 | | | | 1,267 | |
10.500% 05/15/20 | | | 5,924 | | | | 6,698 | |
11.500% 05/15/13 | | | 1,841 | | | | 1,854 | |
12.500% 11/15/13 | | | 1,348 | | | | 1,358 | |
12.500% 12/15/13 | | | 3,589 | | | | 3,616 | |
14.000% 08/15/11 | | | 21 | | | | 21 | |
| | | | | | | | |
Total Mortgage-Backed Securities
(cost of $17,459) | | | | 18,118 | |
| | |
Warrants – 0.0% | | | | | | | | |
| | | Units | | | | |
| Financials – 0.0% | | | | | | | | |
CNB Capital Trust I Expires 03/23/19 (a)(d)(j) | | | 8,101 | | | | 81 | |
| | | | | | | | |
Financials Total | | | | | | | 81 | |
| | | | | | | | |
Total Warrants
(Cost of $81) | | | | 81 | |
| | |
Short-Term Obligation – 5.9% | | | | | | | | |
| | | Par ($) | | | | |
Repurchase agreement with Fixed Income Clearing Corp., dated 03/31/11, due 04/01/11 at 0.070%, collateralized by a U.S. Government Agency obligation maturing 06/23/15, market value $42,131,688 (repurchase proceeds $41,301,080) | | | 41,301,000 | | | | 41,301,000 | |
| | | | | | | | |
Total Short-Term Obligation
(cost of $41,301,000) | | | | 41,301,000 | |
| | | | | | | | |
Total Investments – 104.7%
(cost of $723,504,878)(k) | | | | 728,635,987 | |
| | | | | | | | |
Other Assets & Liabilities, Net – (4.7)% | | | | (32,439,477 | ) |
| | | | | | | | |
Net Assets – 100.0% | | | | 696,196,510 | |
Notes to Investment Portfolio:
| (a) | Security exempt from registration pursuant to Rule 144A under the Securities Act of 1933. These securities may be resold in transactions exempt from registration, normally to qualified institutional buyers. At March 31, 2011, these securities, which are not illiquid except for the following, amounted to $115,532,232, which represents 16.6% of net assets. |
| | | | | | | | | | | | | | | | |
Security | | Acquisition
Dates | | | Shares/
Par/Units | | | Cost | | | Value | |
CMP Susquehanna Radio Holdings Corp.
Series A | | | 03/26/09 | | | | 7,089 | | | $ | 71 | | | $ | 71 | |
CNB Capital Trust I
Expires 03/23/19 | | | 03/26/09 | | | | 8,101 | | | | 81 | | | | 81 | |
CMP Susquehanna Corp.
3.312% 05/15/14 | | | 03/26/09 | | | $ | 30,000 | | | | 27,777 | | | | 17,700 | |
Six Flags, Inc.
9.625% 06/01/14 | | | 05/07/10 | | | $ | 259,000 | | | | — | | | | — | |
Systems 2001 Asset Trust
6.664% 09/15/13 | | | 06/04/01 | | | $ | 365,636 | | | | 365,636 | | | | 399,574 | |
Wind Acquisition Finance SA
11.750% 07/15/17 | | | 03/04/11 | | | $ | 592,000 | | | | — | | | | 1,184 | |
| | | | | | | | | | | | | | | | |
| | | | | | | | | | | | | | $ | 418,610 | |
| | | | | | | | | | | | | | | | |
| (b) | Parenthetical date represents the next interest rate reset date for the security. |
| (c) | The interest rate shown on floating rate or variable rate securities reflects the rate at March 31, 2011. |
| (d) | Represents fair value as determined in good faith under procedures approved by the Board of Trustees. At March 31, 2011, the value of these securities amounted to $19,036, which represents less than 0.1% of net assets. |
| (e) | Position reflects anticipated residual bankruptcy claims. Income is not being accrued. |
| (f) | Security has no value. |
| (g) | Security purchased on a delayed delivery basis. |
| (h) | Investments in affiliates during the year ended March 31, 2011: |
| | | | | | | | | | | | | | | | | | | | |
Affiliate | | Value,
beginning
of period | | | Purchases | | | Sales
Proceeds | | | Interest
Income | | | Value, end
of period | |
Merrill Lynch & Co., Inc.,
5.700% 05/02/17 | | $ | 6,331,748 | | | $ | — | | | $ | 1,899,302 | | | $ | 27,257 | | | $ | — | |
Merrill Lynch & Co., Inc.,
7.750% 05/14/38 | | | 2,865,398 | | | | — | | | | — | | | | 16,695 | | | | — | |
| | | | | | | | | | | | | | | | | | | | |
| | $ | 9,197,146 | | | $ | — | | | $ | 1,899,302 | | | $ | 43,952 | | | $ | — | |
| | | | | | | | | | | | | | | | | | | | |
As of May 1, 2010, this company was no longer an affiliate of the fund. The above table reflects activity for the period from April 1, 2010 through April 30, 2010.
| (i) | The issuer has filed for bankruptcy protection under Chapter 11 and is in default of certain debt covenants. Income is not being accrued. At March 31, 2011, the value of these securities amounted to $1,791,137, which represents 0.3% of net assets. |
| (j) | Non-income producing security. |
| (k) | Cost for federal income tax purposes is $724,893,645. |
Generally accepted accounting principles (GAAP) require disclosure regarding the inputs and valuation techniques used to measure fair value and any changes in valuation inputs or techniques. In addition, investments shall be disclosed by major category.
The Fund categorizes its fair value measurements according to a three-level hierarchy that maximizes the use of observable inputs and minimizes the use of unobservable inputs by prioritizing that the most observable input be used when available. Observable inputs are those that market participants would use in pricing an investment based on market data obtained from sources independent of the reporting entity. Unobservable inputs are those that reflect the Fund’s assumptions about the information market participants would use in pricing an investment. An investment’s level within the fair value hierarchy is based on the lowest level of any input that is deemed significant to the asset or liability’s fair value measurement. The input levels are not necessarily an indication of the risk or liquidity associated with investments at that level. For example, certain U.S. government securities are generally high quality and liquid, however, they are reflected as Level 2 because the inputs used to determine fair value may not always be quoted prices in an active market.
See Accompanying Notes to Financial Statements.
21
Columbia Corporate Income Fund
March 31, 2011
Fair value inputs are summarized in the three broad levels listed below:
| • | | Level 1 — Valuations based on quoted prices for investments in active markets that the Fund has the ability to access at the measurement date (including NAV for open-end mutual funds). Valuation adjustments are not applied to Level 1 investments. |
| • | | Level 2 — Valuations based on other significant observable inputs (including quoted prices for similar securities, interest rates, prepayment speeds, credit risks, etc.). |
| • | | Level 3 — Valuations based on significant unobservable inputs (including the Fund’s own assumptions and judgment in determining the fair value of investments). |
Inputs that are used in determining fair value of an investment may include price information, credit data, volatility statistics, and other factors. These inputs can be either observable or unobservable. The availability of observable inputs can vary between investments, and is affected by various factors such as the type of investment, and the volume and level of activity for that investment or similar investments in the marketplace. The inputs will be considered by the Investment Manager, along with any other relevant factors in the calculation of an investment’s fair value. The Fund uses prices and inputs that are current as of the measurement date, which may include periods of market dislocations. During these periods, the availability of prices and inputs may be reduced for many investments. This condition could cause an investment to be reclassified between the various levels within the hierarchy. Non-U.S. equity securities actively traded in foreign markets may be reflected in Level 2 despite the availability of closing prices, because the Fund evaluates and determines whether those closing prices reflect fair value at the close of the New York Stock Exchange (NYSE) or require adjustment, as described in Note 2 to the financial statements — Security Valuation.
Investments falling into the Level 3 category are primarily supported by quoted prices from brokers and dealers participating in the market for those investments. However, these may be classified as Level 3 investments due to lack of market transparency and corroboration to support these quoted prices. Additionally, valuation models may be used as the pricing source for any remaining investments classified as Level 3. These models rely on one or more significant unobservable inputs and/or significant assumptions by the Investment Manager. Inputs used in valuations may include, but are not limited to, financial statement analysis, capital account balances, discount rates and estimated cash flows, and comparable company data.
The following table is a summary of the inputs used to value the Fund’s investments as of March 31, 2011:
| | | | | | | | | | | | | | | | |
Description | | Quoted Prices
(Level 1) | | | Other
Significant
Observable
Inputs
(Level 2) | | | Significant
Unobservable
Inputs
(Level 3) | | | Total | |
Corporate Fixed-Income Bonds & Notes | | | | | | | | | | | | | | | | |
Basic Materials | | $ | — | | | $ | 26,755,195 | | | $ | — | | | $ | 26,755,195 | |
Communications | | | — | | | | 69,700,969 | | | | 18,884 | | | | 69,719,853 | |
Consumer Cyclical | | | — | | | | 26,696,400 | | | | 2,333,307 | | | | 29,029,707 | |
Consumer Non-Cyclical | | | — | | | | 43,290,242 | | | | — | | | | 43,290,242 | |
Energy | | | — | | | | 79,100,119 | | | | — | | | | 79,100,119 | |
Financials | | | — | | | | 248,226,082 | | | | — | | | | 248,226,082 | |
Industrials | | | — | | | | 27,891,038 | | | | 324,334 | | | | 28,215,372 | |
Information Technology | | | — | | | | 1,312,576 | | | | — | | | | 1,312,576 | |
Technology | | | — | | | | 8,102,871 | | | | — | | | | 8,102,871 | |
Utilities | | | — | | | | 59,760,077 | | | | — | | | | 59,760,077 | |
| | | | | | | | | | | | | | | | |
Total Corporate Fixed-Income Bonds & Notes | | | — | | | | 590,835,569 | | | | 2,676,525 | | | | 593,512,094 | |
| | | | | | | | | | | | | | | | |
| | | | | | | | | | | | | | | | |
Description | | Quoted Prices
(Level 1) | | | Other
Significant
Observable
Inputs
(Level 2) | | | Significant
Unobservable
Inputs
(Level 3) | | | Total | |
Government & Agency Obligations | | | | | | | | | | | | | | | | |
Foreign Government Obligations | | | — | | | | 2,822,294 | | | | — | | | | 2,822,294 | |
U.S. Government Obligations | | | 35,005,794 | | | | — | | | | — | | | | 35,005,794 | |
| | | | | | | | | | | | | | | | |
Total Government & Agency Obligations | | | 35,005,794 | | | | 2,822,294 | | | | — | | | | 37,828,088 | |
| | | | | | | | | | | | | | | | |
Total Asset-Backed Securities | | | — | | | | 20,599,883 | | | | — | | | | 20,599,883 | |
| | | | | | | | | | | | | | | | |
Total Municipal Bonds | | | — | | | | 18,845,415 | | | | — | | | | 18,845,415 | |
| | | | | | | | | | | | | | | | |
Preferred Stocks | | | | | | | | | | | | | | | | |
Communications | | | — | | | | — | | | | 71 | | | | 71 | |
Energy | | | — | | | | 9,895,236 | | | | — | | | | 9,895,236 | |
| | | | | | | | | | | | | | | | |
Total Preferred Stocks | | | — | | | | 9,895,236 | | | | 71 | | | | 9,895,307 | |
| | | | | | | | | | | | | | | | |
Total Commercial Mortgage-Backed Securities | | | — | | | | 6,160,093 | | | | — | | | | 6,160,093 | |
| | | | | | | | | | | | | | | | |
Total Common Stock | | | 369,040 | | | | — | | | | — | | | | 369,040 | |
| | | | | | | | | | | | | | | | |
Total Collateralized Mortgage Obligations | | | — | | | | 106,868 | | | | — | | | | 106,868 | |
| | | | | | | | | | | | | | | | |
Total Mortgage-Backed Securities | | | — | | | | 18,118 | | | | — | | | | 18,118 | |
| | | | | | | | | | | | | | | | |
Total Warrants | | | — | | | | — | | | | 81 | | | | 81 | |
| | | | | | | | | | | | | | | | |
Total Short-Term Obligation | | | — | | | | 41,301,000 | | | | — | | | | 41,301,000 | |
| | | | | | | | | | | | | | | | |
Total Investments | | | 35,374,834 | | | | 690,584,476 | | | | 2,676,677 | | | | 728,635,987 | |
| | | | | | | | | | | | | | | | |
Unrealized Depreciation on Credit Default Swap Contracts | | | — | | | | (22,489 | ) | | | — | | | | (22,489 | ) |
| | | | | | | | | | | | | | | | |
Unrealized Depreciation on Futures Contracts | | | (87,521 | ) | | | — | | | | — | | | | (87,521 | ) |
| | | | | | | | | | | | | | | | |
Total | | $ | 35,287,313 | | | $ | 690,561,987 | | | $ | 2,676,677 | | | $ | 728,525,977 | |
| | | | | | | | | | | | | | | | |
The Fund’s assets assigned to the Level 2 input category are generally valued using the market approach, in which a security’s value is determined through its reference to prices and information from market transactions for similar or identical assets.
The Fund’s assets assigned to the Level 3 category are valued utilizing the valuation technique deemed the most appropriate in the circumstances.
Certain corporate fixed-income bonds & notes, preferred stock and warrants classified as Level 3 are valued using a market approach. To determine fair value for these securities, management considered earnings of the respective company, market multiples derived from a set of comparable companies and the position of the security within the respective company’s capital structure. Certain corporate fixed-income bonds & notes classified as Level 3 securities are valued using the market approach and may utilize single market quotations from broker dealers.
See Accompanying Notes to Financial Statements.
22
Columbia Corporate Income Fund
March 31, 2011
Certain corporate fixed-income bonds & notes are valued using a market approach. To determine fair value for these securities, management considered estimates of the securities cash flow and loan performance data. Management also took into account available market data, including observed yields on securities management deemed comparable.
Certain corporate fixed-income bonds & notes classified as Level 3 securities are valued using an income approach, which considers estimates of distributions from potential actions related to the respective company’s bankruptcy filing.
There were no significant transfers of financial assets between Levels 1 and 2 during the period.
The following table reconciles asset balances for the year ending March 31, 2011, in which significant unobservable inputs (Level 3) were used in determining value:
| | | | | | | | | | | | | | | | | | | | | | | | | | | | | | | | | | | | |
Investments in Securities | | Balance
as of
March 31,
2010 | | | Accrued
Discounts/
Premiums | | | Realized
Gain/
(Loss) | | | Change in
Unrealized
Appreciation
(Depreciation) | | | Purchases | | | Sales | | | Transfers
into
Level 3 | | | Transfers
out of
Level 3 | | | Balance
as of
March 31,
2011 | |
Corporate Fixed-Income Bonds & Notes | | | | | | | | | | | | | | | | | | | | | | | | | | | | | | | | | | | | |
Communications | | $ | 17,700 | | | $ | 522 | | | $ | — | | | $ | 662 | | | $ | — | | | $ | — | | | $ | — | | | $ | — | | | $ | 18,884 | |
Consumer Cyclical | | | 3,240,053 | | | | — | | | | 99,217 | | | | (35,102 | ) | | | — | | | | (970,861 | ) | | | — | | | | — | | | | 2,333,307 | |
Industrials | | | 341,792 | | | | — | | | | (47,436 | ) | | | 117,791 | | | | — | | | | (87,813 | ) | | | — | | | | — | | | | 324,334 | |
Warrants | | | | | | | | | | | | | | | | | | | | | | | | | | | | | | | | | | | | |
Financials | | | 81 | | | | �� | | | | — | | | | — | | | | — | | | | — | | | | — | | | | — | | | | 81 | |
Preferred Stocks | | | | | | | | | | | | | | | | | | | | | | | | | | | | | | | | | | | | |
Communications | | | 71 | | | | — | | | | — | | | | — | | | | — | | | | — | | | | — | | | | — | | | | 71 | |
| | | | | | | | | | | | | | | | | | | | | | | | | | | | | | | | | | | | |
| | $ | 3,599,697 | | | $ | 522 | | | $ | 51,781 | | | $ | 83,351 | | | $ | — | | | $ | (1,058,674 | ) | | $ | — | | | $ | — | | | $ | 2,676,677 | |
| | | | | | | | | | | | | | | | | | | | | | | | | | | | | | | | | | | | |
The information in the above reconciliation represents fiscal year to date activity for any securities identified as using Level 3 inputs at either the beginning or the end of the current fiscal period.
The change in unrealized appreciation attributable to securities owned at March 31, 2011, which were valued using significant unobservable inputs (Level 3) amounted to $83,351. This amount is included in net change in unrealized appreciation on the Statement of Changes in Net Assets.
At March 31, 2011, the Fund has entered into the following credit default swap contract:
Credit Risk
| | | | | | | | | | | | | | | | | | | | | | | | | | |
Swap Counterparty | | Referenced Obligation | | Receive
Buy/Sell
Protection | | | Fixed
Rate | | | Expiration
Date | | | Notional
Amount | | | Upfront
Premium
Paid
(Received) | | | Value of
Contract | |
JPMorgan | | D.R. Horton, Inc. | | | Buy | | | | 1.000 | % | | | 03/20/15 | | | $ | 4,500,000 | | | $ | 196,380 | | | $ | (22,489 | ) |
At March 31, 2011, the Fund held the following open short futures contracts:
Interest Rate Risk
| | | | | | | | | | | | | | | | | | | | |
Type | | Number of
Contracts | | | Value | | | Aggregate
Face Value | | | Expiration
Date | | | Unrealized
Depreciation | |
2-Year U.S. Treasury Notes | | | 134 | | | $ | 29,228,750 | | | $ | 29,209,471 | | | | Jun-2011 | | | $ | (19,279 | ) |
5-Year U.S. Treasury Notes | | | 349 | | | | 40,759,383 | | | | 40,752,796 | | | | Jun-2011 | | | | (6,587 | ) |
30-Year U.S. Treasury Bonds | | | 175 | | | | 21,032,813 | | | | 21,010,369 | | | | Jun-2011 | | | | (22,444 | ) |
Ultra Long U.S. Treasury Bonds | | | 36 | | | | 4,448,250 | | | | 4,409,039 | | | | Jun-2011 | | | | (39,211 | ) |
| | | | | | | | | | | | | | | | | | | | |
| | | | | | | | | | | | | | | | | | $ | (87,521 | ) |
| | | | | | | | | | | | | | | | | | | | |
At March 31, 2011, cash of $1,678,000 was pledged as collateral for open futures contracts.
At March 31, 2011, asset allocation of the Fund is as follows:
| | | | |
Asset Allocation (Unaudited) | | % of
Net Assets | |
Corporate Fixed-Income Bonds & Notes | | | 85.3 | |
Government & Agency Obligations | | | 5.4 | |
Asset-Backed Securities | | | 3.0 | |
Municipal Bonds | | | 2.7 | |
Preferred Stocks | | | 1.4 | |
Commercial Mortgage-Backed Securities | | | 0.9 | |
Common Stock | | | 0.1 | |
Collateralized Mortgage Obligations | | | 0.0 | * |
Mortgage-Backed Securities | | | 0.0 | * |
Warrants | | | 0.0 | * |
| | | | |
| | | 98.8 | |
Short-Term Obligation | | | 5.9 | |
Other Assets & Liabilities, Net | | | (4.7 | ) |
| | | | |
| | | 100.0 | |
| | | | |
| * | Represents less than 0.1% of net assets. |
| | |
Acronym | | Name |
| PIK | | Payment-In-Kind |
See Accompanying Notes to Financial Statements.
23
Statement of Assets and Liabilities – Columbia Corporate Income Fund
March 31, 2011
| | | | | | |
| | | | | ($) | |
| Assets | | Investments, at identified cost | | | 723,504,878 | |
| | | | | | |
| | Investments, at value | | | 728,635,987 | |
| | Cash | | | 483 | |
| | Cash collateral for open futures contracts | | | 1,678,000 | |
| | Credit default swap contracts premiums paid | | | 154,314 | |
| | Receivable for: | | | | |
| | Investments sold | | | 30,862,803 | |
| | Fund shares sold | | | 699,085 | |
| | Dividends | | | 308 | |
| | Interest | | | 8,623,575 | |
| | Foreign tax reclaims | | | 1,184 | |
| | Expense reimbursement due from Investment Manager | | | 179,015 | |
| | Trustees’ deferred compensation plan | | | 60,896 | |
| | Prepaid expenses | | | 741 | |
| | Other assets | | | 254,316 | |
| | | | | | |
| | Total Assets | | | 771,150,707 | |
| | |
| Liabilities | | Open credit default swap contracts | | | 22,489 | |
| | Payable for: | | | | |
| | Investments purchased | | | 71,514,899 | |
| | Investments purchased on a delayed delivery basis | | | 576,000 | |
| | Fund shares repurchased | | | 904,192 | |
| | Futures variation margin | | | 5,516 | |
| | Distributions | | | 1,271,660 | |
| | Investment advisory fee | | | 229,158 | |
| | Administration fee | | | 72,142 | |
| | Pricing and bookkeeping fees | | | 16,782 | |
| | Transfer agent fee | | | 159,130 | |
| | Trustees’ fees | | | 333 | |
| | Custody fee | | | 8,420 | |
| | Distribution and service fees | | | 50,861 | |
| | Chief compliance officer expenses | | | 296 | |
| | Trustees’ deferred compensation plan | | | 60,896 | |
| | Other liabilities | | | 61,423 | |
| | | | | | |
| | Total Liabilities | | | 74,954,197 | |
| | |
| | | | | | |
| | Net Assets | | | 696,196,510 | |
| | |
| Net Assets Consist of | | Paid-in capital | | | 722,389,801 | |
| | Overdistributed net investment income | | | (831,992 | ) |
| | Accumulated net realized loss | | | (30,058,724 | ) |
| | Net unrealized appreciation (depreciation) on: | | | | |
| | Investments | | | 5,131,109 | |
| | Futures contracts | | | (87,521 | ) |
| | Credit default swap contracts | | | (346,163 | ) |
| | | | | | |
| | Net Assets | | | 696,196,510 | |
See Accompanying Notes to Financial Statements.
24
Statement of Assets and Liabilities (continued) – Columbia Corporate Income Fund
March 31, 2011
| | | | | | |
| | | | | | |
| Class A | | Net assets | | $ | 81,878,583 | |
| | Shares outstanding | | | 8,431,267 | |
| | Net asset value per share | | $ | 9.71 | (a) |
| | Maximum sales charge | | | 4.75 | % |
| | Maximum offering price per share ($9.71/0.9525) | | $ | 10.19 | (b) |
| | |
| Class B | | Net assets | | $ | 4,343,737 | |
| | Shares outstanding | | | 447,298 | |
| | Net asset value and offering price per share | | $ | 9.71 | (a) |
| | |
| Class C | | Net assets | | $ | 9,952,400 | |
| | Shares outstanding | | | 1,024,842 | |
| | Net asset value and offering price per share | | $ | 9.71 | (a) |
| | |
| Class I(c) | | Net assets | | $ | 98,729,249 | |
| | Shares outstanding | | | 10,165,405 | |
| | Net asset value, offering and redemption price per share | | $ | 9.71 | |
| | |
| Class W(c) | | Net assets | | $ | 104,340,378 | |
| | Shares outstanding | | | 10,744,157 | |
| | Net asset value, offering and redemption price per share | | $ | 9.71 | |
| | |
| Class Z | | Net assets | | $ | 396,952,163 | |
| | Shares outstanding | | | 40,875,321 | |
| | Net asset value, offering and redemption price per share | | $ | 9.71 | |
| (a) | Redemption price per share is equal to net asset value less any applicable contingent deferred sales charge. |
| (b) | On sales of $50,000 or more the offering price is reduced. |
| (c) | Class I and Class W shares commenced operations on September 27, 2010. |
See Accompanying Notes to Financial Statements.
25
Statement of Operations – Columbia Corporate Income Fund
For the Year Ended March 31, 2011
| | | | | | |
| | | | | ($) (a) | |
| Investment Income | | Interest | | | 31,962,038 | |
| | Interest from affiliates | | | 43,952 | |
| | Dividends | | | 227,738 | |
| | Foreign taxes withheld | | | (1,401 | ) |
| | | | | | |
| | Total Investment Income | | | 32,232,327 | |
| | |
| Expenses | | Investment advisory fee | | | 2,217,763 | |
| | Administration fee | | | 691,021 | |
| | Distribution fee: | | | | |
| | Class B | | | 41,014 | |
| | Class C | | | 82,344 | |
| | Service fee: | | | | |
| | Class A | | | 210,260 | |
| | Class B | | | 13,671 | |
| | Class C | | | 27,454 | |
| | Class W | | | 82,399 | |
| | Pricing and bookkeeping fees | | | 160,650 | |
| | Transfer agent fee: | | | | |
| | Class A, Class B, Class C, Class W and Class Z | | | 633,929 | |
| | Trustees’ fees | | | 34,220 | |
| | Custody fee | | | 51,869 | |
| | Chief compliance officer expenses | | | 1,463 | |
| | Other expenses | | | 307,410 | |
| | | | | | |
| | Expenses before interest expense | | | 4,555,467 | |
| | Interest expense | | | 30,027 | |
| | | | | | |
| | Total Expenses | | | 4,585,494 | |
| | |
| | Fees waived or expenses reimbursed by Investment Manager | | | (366,513 | ) |
| | Fees waived by distributor—Class C | | | (16,471 | ) |
| | Expense reductions | | | (46 | ) |
| | | | | | |
| | Net Expenses | | | 4,202,464 | |
| | |
| | | | | | |
| | Net Investment Income | | | 28,029,863 | |
| | |
| Net Realized and Unrealized Gain (Loss) on Investments, Foreign Currency, Futures Contracts and Credit Default Swap Contracts | | Net realized gain (loss) on: | | | | |
| | Investments | | | 20,808,883 | |
| | Foreign currency transactions and forward foreign currency exchange contracts | | | 35,518 | |
| | Futures contracts | | | (5,962,504 | ) |
| | Credit default swap contracts | | | (2,825,316 | ) |
| | | | | | |
| | Net realized gain | | | 12,056,581 | |
| | |
| | Net change in unrealized appreciation (depreciation) on: | | | | |
| | Investments | | | (2,787,378 | ) |
| | Foreign currency translations and forward foreign currency exchange contracts | | | (6,766 | ) |
| | Futures contracts | | | 298,698 | |
| | Credit default swap contracts | | | 483,953 | |
| | | | | | |
| | Net change in unrealized appreciation (depreciation) | | | (2,011,493 | ) |
| | | | | | |
| | Net Gain | | | 10,045,088 | |
| | |
| | | | | | |
| | Net Increase Resulting from Operations | | | 38,074,951 | |
| (a) | Class W shares commenced operations on September 27, 2010. |
See Accompanying Notes to Financial Statements.
26
Statement of Changes in Net Assets – Columbia Corporate Income Fund
| | | | | | | | | | |
| | | | | Year Ended March 31, | |
| Increase (Decrease) in Net Assets | | | | 2011 ($)(a)(b) | | | 2010 ($) | |
| Operations | | Net investment income | | | 28,029,863 | | | | 32,355,478 | |
| | Net realized gain on investments, futures contracts, credit default swap contracts, foreign currency transactions and forward foreign currency exchange contracts | | | 12,056,581 | | | | 8,048,067 | |
| | Net change in unrealized appreciation (depreciation) on investments, futures contracts, credit default swap contracts, foreign currency translations and forward foreign currency exchange contracts | | | (2,011,493 | ) | | | 105,540,713 | |
| | | | | | | | | | |
| | Net increase resulting from operations | | | 38,074,951 | | | | 145,944,258 | |
| | | |
| Distributions to Shareholders | | From net investment income: | | | | | | | | |
| | Class A | | | (4,481,416 | ) | | | (5,249,455 | ) |
| | Class B | | | (251,572 | ) | | | (428,888 | ) |
| | Class C | | | (519,875 | ) | | | (652,222 | ) |
| | Class I | | | (517,220 | ) | | | — | |
| | Class W | | | (1,678,751 | ) | | | — | |
| | Class Z | | | (21,713,307 | ) | | | (27,984,986 | ) |
| | | | | | | | | | |
| | Total distributions to shareholders | | | (29,162,141 | ) | | | (34,315,551 | ) |
| | | |
| | Net Capital Stock Transactions | | | 132,880,043 | | | | (4,548,848 | ) |
| | | |
| | Increase from regulatory settlements | | | — | | | | 6,535 | |
| | | | | | | | | | |
| | Total increase in net assets | | | 141,792,853 | | | | 107,086,394 | |
| | | |
| Net Assets | | Beginning of period | | | 554,403,657 | | | | 447,317,263 | |
| | End of period | | | 696,196,510 | | | | 554,403,657 | |
| | Overdistributed net investment income at end of period | | | (831,992 | ) | | | (1,133,287 | ) |
| (a) | Class I and Class W shares commenced operations on September 27, 2010. |
| (b) | Class I and Class W shares reflect activity for the period September 27, 2010 through March 31, 2011. |
See Accompanying Notes to Financial Statements.
27
Statement of Changes in Net Assets (continued) – Columbia Corporate Income Fund
| | | | | | | | | | | | | | | | |
| | | Capital Stock Activity | |
| | | Year Ended
March 31, 2011 (a)(b) | | | Year Ended
March 31, 2010 | |
| | | Shares | | | Dollars ($) | | | Shares | | | Dollars ($) | |
Class A | | | | | | | | | | | | | | | | |
Subscriptions | | | 1,507,952 | | | | 14,565,372 | | | | 1,348,388 | | | | 12,079,886 | |
Distributions reinvested | | | 326,686 | | | | 3,163,931 | | | | 457,555 | | | | 4,138,916 | |
Redemptions | | | (2,358,254 | ) | | | (22,786,915 | ) | | | (2,216,339 | ) | | | (19,741,567 | ) |
| | | | | | | | | | | | | | | | |
Net decrease | | | (523,616 | ) | | | (5,057,612 | ) | | | (410,396 | ) | | | (3,522,765 | ) |
| | | | |
Class B | | | | | | | | | | | | | | | | |
Subscriptions | | | 51,445 | | | | 495,733 | | | | 89,784 | | | | 791,251 | |
Distributions reinvested | | | 17,124 | | | | 165,660 | | | | 34,497 | | | | 311,148 | |
Redemptions | | | (311,899 | ) | | | (3,013,501 | ) | | | (445,888 | ) | | | (3,963,679 | ) |
| | | | | | | | | | | | | | | | |
Net decrease | | | (243,330 | ) | | | (2,352,108 | ) | | | (321,607 | ) | | | (2,861,280 | ) |
| | | | |
Class C | | | | | | | | | | | | | | | | |
Subscriptions | | | 183,718 | | | | 1,774,340 | | | | 175,170 | | | | 1,550,578 | |
Distributions reinvested | | | 31,891 | | | | 308,829 | | | | 46,533 | | | | 420,434 | |
Redemptions | | | (372,498 | ) | | | (3,606,826 | ) | | | (350,263 | ) | | | (3,118,901 | ) |
| | | | | | | | | | | | | | | | |
Net decrease | | | (156,889 | ) | | | (1,523,657 | ) | | | (128,560 | ) | | | (1,147,889 | ) |
| | | | |
Class I | | | | | | | | | | | | | | | | |
Subscriptions | | | 10,334,592 | | | | 100,306,262 | | | | — | | | | — | |
Distributions reinvested | | | 53,189 | | | | 517,152 | | | | — | | | | — | |
Redemptions | | | (222,376 | ) | | | (2,163,407 | ) | | | — | | | | — | |
| | | | | | | | | | | | | | | | |
Net increase | | | 10,165,405 | | | | 98,660,007 | | | | — | | | | — | |
| | | | |
Class W | | | | | | | | | | | | | | | | |
Subscriptions | | | 11,612,702 | | | | 112,516,104 | | | | — | | | | — | |
Distributions reinvested | | | 173,020 | | | | 1,678,648 | | | | — | | | | — | |
Redemptions | | | (1,041,565 | ) | | | (10,082,908 | ) | | | — | | | | — | |
| | | | | | | | | | | | | | | | |
Net increase | | | 10,744,157 | | | | 104,111,844 | | | | — | | | | — | |
| | | | |
Class Z | | | | | | | | | | | | | | | | |
Subscriptions | | | 10,893,155 | | | | 105,352,950 | | | | 11,799,027 | | | | 105,854,141 | |
Distributions reinvested | | | 782,503 | | | | 7,573,182 | | | | 1,359,023 | | | | 12,296,549 | |
Redemptions | | | (18,133,934 | ) | | | (173,884,563 | ) | | | (12,900,249 | ) | | | (115,167,604 | ) |
| | | | | | | | | | | | | | | | |
Net increase (decrease) | | | (6,458,276 | ) | | | (60,958,431 | ) | | | 257,801 | | | | 2,983,086 | |
| (a) | Class I and Class W shares commenced operations on September 27, 2010. |
| (b) | Class I and Class W shares reflect activity for the period September 27, 2010 through March 31, 2011. |
See Accompanying Notes to Financial Statements.
28
Financial Highlights – Columbia Corporate Income Fund
Selected data for a share outstanding throughout each period is as follows:
| | | | | | | | | | | | | | | | | | | | |
| | | Year Ended March 31, | |
| Class A Shares | | 2011 (a) | | | 2010 | | | 2009 | | | 2008 | | | 2007 | |
Net Asset Value, Beginning of Period | | $ | 9.53 | | | $ | 7.61 | | | $ | 9.06 | | | $ | 9.68 | | | $ | 9.62 | |
| | | | | |
Income from Investment Operations: | | | | | | | | | | | | | | | | | | | | |
Net investment income (b) | | | 0.50 | | | | 0.54 | | | | 0.50 | | | | 0.51 | | | | 0.49 | |
Net realized and unrealized gain (loss) on investments, foreign currency, futures contracts and credit default swap contracts | | | 0.19 | | | | 1.95 | | | | (1.45 | ) | | | (0.62 | ) | | | 0.08 | |
| | | | | | | | | | | | | | | | | | | | |
Total from investment operations | | | 0.69 | | | | 2.49 | | | | (0.95 | ) | | | (0.11 | ) | | | 0.57 | |
| | | | | |
Less Distributions to Shareholders: | | | | | | | | | | | | | | | | | | | | |
From net investment income | | | (0.51 | ) | | | (0.57 | ) | | | (0.50 | ) | | | (0.51 | ) | | | (0.51 | ) |
| | | | | |
Increase from regulatory settlements | | | — | | | | — | (c) | | | — | | | | — | | | | — | |
| | | | | |
Net Asset Value, End of Period | | $ | 9.71 | | | $ | 9.53 | | | $ | 7.61 | | | $ | 9.06 | | | $ | 9.68 | |
Total return (d) | | | 7.43 | %(e) | | | 33.42 | % | | | (10.77 | )% | | | (1.15 | )% | | | 6.04 | %(f) |
| | | | | |
Ratios to Average Net Assets/Supplemental Data: | | | | | | | | | | | | | | | | | | | | |
Net expenses before interest expense (g) | | | 0.95 | % | | | 0.95 | % | | | 1.03 | % | | | 1.00 | % | | | 0.97 | % |
Interest expense | | | 0.01 | % | | | — | %(h) | | | — | %(h) | | | — | %(h) | | | — | |
Net expenses (g) | | | 0.96 | % | | | 0.95 | % | | | 1.03 | % | | | 1.00 | % | | | 0.97 | % |
Waiver/Reimbursement | | | 0.07 | % | | | — | | | | — | | | | — | | | | — | |
Net investment income (g) | | | 5.14 | % | | | 6.04 | % | | | 5.95 | % | | | 5.41 | % | | | 5.13 | % |
Portfolio turnover rate | | | 108 | % | | | 131 | % | | | 147 | % | | | 193 | % | | | 142 | % |
Net assets, end of period (000s) | | $ | 81,879 | | | $ | 85,361 | | | $ | 71,290 | | | $ | 108,294 | | | $ | 123,330 | |
| (a) | On September 27, 2010, Columbia Income Fund was renamed Columbia Corporate Income Fund. |
| (b) | Per share data was calculated using the average shares outstanding during the period. |
| (c) | Rounds to less than $0.01 per share. |
| (d) | Total return at net asset value assuming all distributions reinvested and no initial sales charge or contingent deferred sales charge. |
| (e) | Had the Investment Manager and/or any of its affiliates not waived fees or reimbursed a portion of expenses, total return would have been reduced. |
| (f) | Total return includes a voluntary reimbursement by the Investment Manager for a realized investment loss due to a trading error. This reimbursement increased total return and net asset value per share by less than 0.01% and less than $0.01, respectively. |
| (g) | The benefits derived from expense reductions had an impact of less than 0.01%. |
| (h) | Rounds to less than 0.01%. |
See Accompanying Notes to Financial Statements.
29
Financial Highlights – Columbia Corporate Income Fund
Selected data for a share outstanding throughout each period is as follows:
| | | | | | | | | | | | | | | | | | | | |
| | | Year Ended March 31, | |
| Class B Shares | | 2011 (a) | | | 2010 | | | 2009 | | | 2008 | | | 2007 | |
Net Asset Value, Beginning of Period | | $ | 9.53 | | | $ | 7.61 | | | $ | 9.06 | | | $ | 9.68 | | | $ | 9.62 | |
| | | | | |
Income from Investment Operations: | | | | | | | | | | | | | | | | | | | | |
Net investment income (b) | | | 0.43 | | | | 0.48 | | | | 0.43 | | | | 0.44 | | | | 0.42 | |
Net realized and unrealized gain (loss) on investments, foreign currency, futures contracts and credit default swap contracts | | | 0.19 | | | | 1.95 | | | | (1.45 | ) | | | (0.62 | ) | | | 0.07 | |
| | | | | | | | | | | | | | | | | | | | |
Total from investment operations | | | 0.62 | | | | 2.43 | | | | (1.02 | ) | | | (0.18 | ) | | | 0.49 | |
| | | | | |
Less Distributions to Shareholders: | | | | | | | | | | | | | | | | | | | | |
From net investment income | | | (0.44 | ) | | | (0.51 | ) | | | (0.43 | ) | | | (0.44 | ) | | | (0.43 | ) |
| | | | | |
Increase from regulatory settlements | | | — | | | | — | (c) | | | — | | | | — | | | | — | |
| | | | | |
Net Asset Value, End of Period | | $ | 9.71 | | | $ | 9.53 | | | $ | 7.61 | | | $ | 9.06 | | | $ | 9.68 | |
Total return (d) | | | 6.64 | %(f) | | | 32.44 | % | | | (11.44 | )% | | | (1.88 | )% | | | 5.26 | %(e) |
| | | | | |
Ratios to Average Net Assets/Supplemental Data: | | | | | | | | | | | | | | | | | | | | |
Net expenses before interest expense (g) | | | 1.70 | % | | | 1.70 | % | | | 1.78 | % | | | 1.75 | % | | | 1.72 | % |
Interest expense | | | 0.01 | % | | | — | %(h) | | | — | %(h) | | | — | %(h) | | | — | |
Net expenses (g) | | | 1.71 | % | | | 1.70 | % | | | 1.78 | % | | | 1.75 | % | | | 1.72 | % |
Waiver/Reimbursement | | | 0.07 | % | | | — | | | | — | | | | — | | | | — | |
Net investment income (g) | | | 4.42 | % | | | 5.33 | % | | | 5.17 | % | | | 4.67 | % | | | 4.38 | % |
Portfolio turnover rate | | | 108 | % | | | 131 | % | | | 147 | % | | | 193 | % | | | 142 | % |
Net assets, end of period (000s) | | $ | 4,344 | | | $ | 6,583 | | | $ | 7,705 | | | $ | 14,290 | | | $ | 20,105 | |
| (a) | On September 27, 2010, Columbia Income Fund was renamed Columbia Corporate Income Fund. |
| (b) | Per share data was calculated using the average shares outstanding during the period. |
| (c) | Rounds to less than $0.01 per share. |
| (d) | Total return at net asset value assuming all distributions reinvested and no contingent deferred sales charge. |
| (e) | Total return includes a voluntary reimbursement by the Investment Manager for a realized investment loss due to a trading error. This reimbursement increased total return and net asset value per share by less than 0.01% and less than $0.01, respectively. |
| (f) | Had the Investment Manager and/or any of its affiliates not waived fees or reimbursed a portion of expenses, total return would have been reduced. |
| (g) | The benefits derived from expense reductions had an impact of less than 0.01%. |
| (h) | Rounds to less than 0.01%. |
See Accompanying Notes to Financial Statements.
30
Financial Highlights – Columbia Corporate Income Fund
Selected data for a share outstanding throughout each period is as follows:
| | | | | | | | | | | | | | | | | | | | |
| | | Year Ended March 31, | |
| Class C Shares | | 2011 (a) | | | 2010 | | | 2009 | | | 2008 | | | 2007 | |
Net Asset Value, Beginning of Period | | $ | 9.53 | | | $ | 7.61 | | | $ | 9.06 | | | $ | 9.68 | | | $ | 9.62 | |
| | | | | |
Income from Investment Operations: | | | | | | | | | | | | | | | | | | | | |
Net investment income (b) | | | 0.44 | | | | 0.49 | | | | 0.45 | | | | 0.45 | | | | 0.44 | |
Net realized and unrealized gain (loss) on investments, foreign currency, futures contracts and credit default swap contracts | | | 0.20 | | | | 1.95 | | | | (1.45 | ) | | | (0.61 | ) | | | 0.07 | |
| | | | | | | | | | | | | | | | | | | | |
Total from investment operations | | | 0.64 | | | | 2.44 | | | | (1.00 | ) | | | (0.16 | ) | | | 0.51 | |
| | | | | |
Less Distributions to Shareholders: | | | | | | | | | | | | | | | | | | | | |
From net investment income | | | (0.46 | ) | | | (0.52 | ) | | | (0.45 | ) | | | (0.46 | ) | | | (0.45 | ) |
| | | | | |
Increase from regulatory settlements | | | — | | | | — | (c) | | | — | | | | — | | | | — | |
| | | | | |
Net Asset Value, End of Period | | $ | 9.71 | | | $ | 9.53 | | | $ | 7.61 | | | $ | 9.06 | | | $ | 9.68 | |
Total return (d)(e) | | | 6.79 | % | | | 32.63 | % | | | (11.31 | )% | | | (1.74 | )% | | | 5.41 | %(f) |
| | | | | |
Ratios to Average Net Assets/Supplemental Data: | | | | | | | | | | | | | | | | | | | | |
Net expenses before interest expense (g) | | | 1.55 | % | | | 1.55 | % | | | 1.63 | % | | | 1.60 | % | | | 1.57 | % |
Interest expense | | | 0.01 | % | | | — | %(h) | | | — | %(h) | | | — | %(h) | | | — | |
Net expenses (g) | | | 1.56 | % | | | 1.55 | % | | | 1.63 | % | | | 1.60 | % | | | 1.57 | % |
Waiver/Reimbursement | | | 0.22 | % | | | 0.15 | % | | | 0.15 | % | | | 0.15 | % | | | 0.15 | % |
Net investment income (g) | | | 4.55 | % | | | 5.45 | % | | | 5.35 | % | | | 4.81 | % | | | 4.52 | % |
Portfolio turnover rate | | | 108 | % | | | 131 | % | | | 147 | % | | | 193 | % | | | 142 | % |
Net assets, end of period (000s) | | $ | 9,952 | | | $ | 11,265 | | | $ | 9,974 | | | $ | 14,510 | | | $ | 16,660 | |
| (a) | On September 27, 2010, Columbia Income Fund was renamed Columbia Corporate Income Fund. |
| (b) | Per share data was calculated using the average shares outstanding during the period. |
| (c) | Rounds to less than $0.01 per share. |
| (d) | Total return at net asset value assuming all distributions reinvested and no contingent deferred sales charge. |
| (e) | Had the Investment Manager and/or any of its affiliates not waived fees or reimbursed a portion of expenses, total return would have been reduced. |
| (f) | Total return includes a voluntary reimbursement by the Investment Manager for a realized investment loss due to a trading error. This reimbursement increased total return and net asset value per share by less than 0.01% and less than $0.01, respectively. |
| (g) | The benefits derived from expense reductions had an impact of less than 0.01%. |
| (h) | Rounds to less than 0.01%. |
See Accompanying Notes to Financial Statements.
31
Financial Highlights – Columbia Corporate Income Fund
Selected data for a share outstanding throughout the period is as follows:
| | | | |
| Class I Shares | | Period Ended
March 31, 2011 (a)(b) | |
Net Asset Value, Beginning of Period | | $ | 9.84 | |
| |
Income from Investment Operations: | | | | |
Net investment income (c) | | | 0.25 | |
Net realized and unrealized gain (loss) on investments, foreign currency,
futures contracts and credit default swap contracts | | | (0.11 | ) |
| | | | |
Total from investment operations | | | 0.14 | |
| |
Less Distributions to Shareholders: | | | | |
From net investment income | | | (0.27 | ) |
| |
Net Asset Value, End of Period | | $ | 9.71 | |
Total return (d)(e)(f) | | | 1.50 | % |
| |
Ratios to Average Net Assets/Supplemental Data: | | | | |
Net expenses before interest expense (g)(h) | | | 0.65 | % |
Interest expense (h)(i) | | | — | % |
Net expenses (g)(h) | | | 0.65 | % |
Waiver/Reimbursement (h)(i) | | | — | % |
Net investment income (g)(h) | | | 5.15 | % |
Portfolio turnover rate (f) | | | 108 | % |
Net assets, end of period (000s) | | $ | 98,729 | |
| (a) | Class I shares commenced operations on September 27, 2010. Per share data and total return reflect activity from that date. |
| (b) | On September 27, 2010, Columbia Income Fund was renamed Columbia Corporate Income Fund. |
| (c) | Per share data was calculated using the average shares outstanding during the period. |
| (d) | Total return at net asset value assuming all distributions reinvested. |
| (e) | Had the Investment Manager and/or any of its affiliates not waived fees or reimbursed a portion of expenses, total return would have been reduced. |
| (g) | The benefits derived from expense reductions had an impact of less than 0.01%. |
| (i) | Rounds to less than 0.01%. |
See Accompanying Notes to Financial Statements.
32
Financial Highlights – Columbia Corporate Income Fund
Selected data for a share outstanding throughout the period is as follows:
| | | | |
| Class W Shares | | Period Ended
March 31,
2011 (a)(b) | |
Net Asset Value, Beginning of Period | | $ | 9.84 | |
| |
Income from Investment Operations: | | | | |
Net investment income (c) | | | 0.23 | |
Net realized and unrealized gain (loss) on investments, foreign currency,
futures contracts and credit default swap contracts | | | (0.10 | ) |
| | | | |
Total from investment operations | | | 0.13 | |
| |
Less Distributions to Shareholders: | | | | |
From net investment income | | | (0.26 | ) |
| |
Net Asset Value, End of Period | | $ | 9.71 | |
Total Return (d)(e)(f) | | | 1.31 | % |
| |
Ratios to Average Net Assets/Supplemental Data: | | | | |
Net expenses before interest expense (g)(h) | | | 0.95 | % |
Interest expense (h)(i) | | | — | % |
Net expenses (g)(h) | | | 0.95 | % |
Waiver/Reimbursement (h) | | | 0.11 | % |
Net investment income (g)(h) | | | 4.70 | % |
Portfolio turnover rate (f) | | | 108 | % |
Net assets, end of period (000s) | | $ | 104,340 | |
| (a) | Class W shares commenced operations on September 27, 2010. Per share data and total return reflect activity from that date. |
| (b) | On September 27, 2010, Columbia Income Fund was renamed Columbia Corporate Income Fund. |
| (c) | Per share data was calculated using the average shares outstanding during the period. |
| (d) | Total return at net asset value assuming all distributions reinvested. |
| (e) | Had the Investment Manager and/or any of its affiliates not waived fees or reimbursed a portion of expenses, total return would have been reduced. |
| (g) | The benefits derived from expense reductions had an impact of less than 0.01%. |
| (i) | Rounds to less than 0.01%. |
See Accompanying Notes to Financial Statements.
33
Financial Highlights – Columbia Corporate Income Fund
Selected data for a share outstanding throughout each period is as follows:
| | | | | | | | | | | | | | | | | | | | |
| | | Year Ended March 31, | |
| Class Z Shares | | 2011 (a) | | | 2010 | | | 2009 | | | 2008 | | | 2007 | |
Net Asset Value, Beginning of Period | | $ | 9.53 | | | $ | 7.61 | | | $ | 9.06 | | | $ | 9.68 | | | $ | 9.62 | |
| | | | | |
Income from Investment Operations: | | | | | | | | | | | | | | | | | | | | |
Net investment income (b) | | | 0.52 | | | | 0.56 | | | | 0.52 | | | | 0.53 | | | | 0.52 | |
Net realized and unrealized gain (loss) on investments, foreign currency, futures contracts and credit default swap contracts | | | 0.20 | | | | 1.96 | | | | (1.45 | ) | | | (0.61 | ) | | | 0.07 | |
| | | | | | | | | | | | | | | | | | | | |
Total from investment operations | | | 0.72 | | | | 2.52 | | | | (0.93 | ) | | | (0.08 | ) | | | 0.59 | |
| | | | | |
Less Distributions to Shareholders: | | | | | | | | | | | | | | | | | | | | |
From net investment income | | | (0.54 | ) | | | (0.60 | ) | | | (0.52 | ) | | | (0.54 | ) | | | (0.53 | ) |
| | | | | |
Increase from regulatory settlements | | | — | | | | — | (c) | | | — | | | | — | | | | — | |
| | | | | |
Net Asset Value, End of Period | | $ | 9.71 | | | $ | 9.53 | | | $ | 7.61 | | | $ | 9.06 | | | $ | 9.68 | |
Total return (d) | | | 7.70 | %(e) | | | 33.74 | % | | | (10.55 | )% | | | (0.90 | )% | | | 6.31 | %(f) |
| | | | | |
Ratios to Average Net Assets/Supplemental Data: | | | | | | | | | | | | | | | | | | | | |
Net expenses before interest expense (g) | | | 0.70 | % | | | 0.70 | % | | | 0.78 | % | | | 0.75 | % | | | 0.72 | % |
Interest expense | | | 0.01 | % | | | — | %(h) | | | — | %(h) | | | — | %(h) | | | — | |
Net expenses (g) | | | 0.71 | % | | | 0.70 | % | | | 0.78 | % | | | 0.75 | % | | | 0.72 | % |
Waiver/Reimbursement | | | 0.07 | % | | | — | | | | — | | | | — | | | | — | |
Net investment income (g) | | | 5.37 | % | | | 6.29 | % | | | 6.22 | % | | | 5.66 | % | | | 5.39 | % |
Portfolio turnover rate | | | 108 | % | | | 131 | % | | | 147 | % | | | 193 | % | | | 142 | % |
Net assets, end of period (000s) | | $ | 396,952 | | | $ | 451,195 | | | $ | 358,348 | | | $ | 478,519 | | | $ | 509,037 | |
| (a) | On September 27, 2010, Columbia Income Fund was renamed Columbia Corporate Income Fund. |
| (b) | Per share data was calculated using the average shares outstanding during the period. |
| (c) | Rounds to less than $0.01 per share. |
| (d) | Total return at net asset value assuming all distributions reinvested. |
| (e) | Had the Investment Manager and/or any of its affiliates not waived fees or reimbursed a portion of expenses, total return would have been reduced. |
| (f) | Total return includes a voluntary reimbursement by the Investment Manager for a realized investment loss due to a trading error. This reimbursement increased total return and net asset value per share by less than 0.01% and less than $0.01, respectively. |
| (g) | The benefits derived from expense reductions had an impact of less than 0.01%. |
| (h) | Rounds to less than 0.01%. |
See Accompanying Notes to Financial Statements.
34
Notes to Financial Statements – Columbia Corporate Income Fund
March 31, 2011
Note 1. Organization
Columbia Corporate Income Fund, formerly known as Columbia Income Fund (the Fund), a series of Columbia Funds Series Trust I (the Trust), is a diversified fund. The Trust is registered under the Investment Company Act of 1940, as amended (the 1940 Act), as an open-end management investment company organized as a Massachusetts business trust.
After the close of business on April 30, 2010, Ameriprise Financial, Inc. (Ameriprise Financial) acquired a portion of the asset management business of Columbia Management Group, LLC (the Transaction), including the business of managing the Fund. In connection with the closing of the Transaction (the Closing), RiverSource Investments, LLC, a wholly owned subsidiary of Ameriprise Financial, became the investment manager of the Fund and changed its name to Columbia Management Investment Advisers, LLC (the Investment Manager).
Investment Objective
The Fund seeks total return, consisting primarily of current income and secondarily of capital appreciation.
Fund Shares
The Trust has unlimited authorized shares of beneficial interest. The Fund offers Class A, Class B, Class C, Class I, Class W and Class Z shares. All share classes have identical voting, dividend and liquidation rights. Each share class has its own expense structure and sales charges, as applicable.
Class A shares are subject to a maximum front-end sales charge of 4.75% based on the initial investment amount. Class A shares purchased without an initial sales charge in accounts aggregating $1 million to $50 million at the time of purchase are subject to a 1.00% contingent deferred sales charge (CDSC) if the shares are sold within 18 months of purchase, charged as follows: 1.00% CDSC if redeemed within 12 months of purchase, and 0.50% CDSC if redeemed more than 12, but less than 18 months after purchase.
The Fund no longer accepts investments by new or existing investors in the Fund’s Class B shares, except in connection with the reinvestment of any dividend and/or capital gain distributions in Class B shares of the Fund and exchanges by existing Class B shareholders of other funds within the Columbia Family of Funds. Class B shares are subject to a maximum CDSC of 5.00% based upon the holding period after purchase. Class B shares will generally convert to Class A shares eight years after purchase.
Class C shares are subject to a 1.00% CDSC on shares redeemed within one year of purchase.
Class I shares are not subject to sales charges and are available only to the Columbia Family of Funds. Class I shares commenced operations on September 27, 2010.
Class W shares are not subject to sales charges and are available only to investors purchasing through authorized investment programs managed by investment professionals, including discretionary managed account programs. Class W shares commenced operations on September 27, 2010.
Class Z shares are not subject to sales charges and are available only to certain investors, as described in the Fund’s prospectus.
Note 2. Summary of Significant Accounting Policies
The preparation of financial statements in accordance with U.S. generally accepted accounting principles (GAAP) requires management to make certain estimates and assumptions that affect the reported amounts of assets and liabilities, the disclosure of contingent assets and liabilities at the date of the financial statements and the reported amounts of revenue and expenses during the reporting period. Actual results could differ from those estimates.
The following is a summary of significant accounting policies consistently followed by the Fund in the preparation of its financial statements.
Security Valuation
Debt securities generally are valued by pricing services approved by the Trust’s Board of Trustees, based upon market transactions for normal, institutional-size trading units of similar securities. The services may use various pricing techniques which take into account appropriate factors such as yield, quality, coupon rate, maturity, type of issue, trading characteristics and other data, as well as broker quotes. Debt securities for which quotations are readily available may also be valued based upon an over-the-counter or exchange bid quotation.
Certain debt securities, which tend to be more thinly traded and of lesser quality, are priced based on fundamental analysis of the financial condition of the issuer and the estimated value of any collateral. Valuations developed through pricing techniques may vary from the actual amounts realized upon sale of the securities, and the potential variation may be greater for those securities valued using fundamental analysis.
35
Columbia Corporate Income Fund
March 31, 2011
Equity securities are valued at the last sale price on the principal exchange on which they trade, except for securities traded on the NASDAQ, which are valued at the NASDAQ official close price. Unlisted securities or listed securities for which there were no sales during the day are valued at the closing bid price on such exchanges or over-the-counter markets.
Short-term investments maturing in 60 days or less are valued at amortized cost, which approximates market value.
Futures contracts are valued at the settlement price established each day by the board of trade or exchange on which they are traded.
Forward foreign currency exchange contracts are valued at the prevailing forward exchange rate of the underlying currencies.
Credit default swap contracts are marked to market daily based upon spread quotations from market makers.
Foreign securities are generally valued at the last sale price on the foreign exchange or market on which they trade. If any foreign share prices are not readily available as a result of limited share activity, the securities are valued at the last sale price of the local shares in the principal market in which such securities are normally traded.
Generally, trading in foreign securities is substantially completed each day at various times prior to the close of the New York Stock Exchange (NYSE). The values of such securities used in computing the net asset value of the Fund’s shares are determined as of such times. Foreign currency exchange rates are generally determined at 4:00 p.m. Eastern (U.S.) time. Occasionally, events affecting the values of such foreign securities may occur between the times at which they are determined and the close of the customary trading session of the NYSE, which would not be reflected in the computation of the Fund’s net asset value. If events materially affecting the values of such foreign securities occur and it is determined that market quotations are not reliable, then these foreign securities will be valued at their fair value using procedures approved by the Board of Trustees.
Investments for which market quotations are not readily available, or that have quotations which management believes are not reliable, are valued at fair value as determined in good faith under consistently applied procedures established by and under the general supervision of the Board of Trustees. If a security is valued at fair value, such value is likely to be different from the last quoted market price for the security. The determination of fair value often requires significant judgment. To determine fair value, management may use assumptions including but not limited to future cash flows and estimated risk premiums. Multiple inputs from various sources may be used to determine value.
Foreign Currency Transactions and Translations
The values of all assets and liabilities quoted in foreign currencies are translated into U.S. dollars at that day’s exchange rates. Net realized and unrealized gains (losses) on foreign currency transactions and translations include gains (losses) arising from the fluctuation in exchange rates between trade and settlement dates on securities transactions, gains (losses) arising from the disposition of foreign currency and currency gains (losses) between the accrual and payment dates on dividends, interest income and foreign withholding taxes.
For financial statement purposes, the Fund does not distinguish that portion of gains (losses) on investments which is due to changes in foreign exchange rates from that which is due to changes in market prices of the investments. Such fluctuations are included with the net realized and unrealized gains (losses) on investments on the Statement of Operations.
Derivative Instruments
The Fund may use derivative instruments including futures contracts, credit default swap contracts and forward foreign currency exchange contracts in order to meet its investment objectives. The Fund employs strategies in differing combinations to permit it to increase, decrease or change the level of exposure to market risk factors. The achievement of any strategy relating to derivatives depends on an analysis of various risk factors, and if the strategies for the use of derivatives do not work as intended, the Fund may not achieve its investment objectives.
In pursuit of its investment objectives, the Fund is exposed to the following market risks among others:
Credit Risk: Credit risk relates to the ability of the issuer or guarantor of a fixed income security, or counterparty to a derivative contract to make timely principal and /or interest payments, or to otherwise honor its obligations. Securities are subject to varying degrees of credit risk, which are often reflected in credit ratings. Generally, lower-yield higher-quality bonds are subject to credit risk to a lesser extent than lower-grade higher-yield bonds.
Foreign Exchange Rate Risk: Foreign exchange rate risk relates to the change in the U.S. dollar value of a security held that is denominated in a foreign currency. The U.S. dollar value of a foreign-currency-denominated security will decrease as the dollar
36
Columbia Corporate Income Fund
March 31, 2011
appreciates against the currency, while the U.S. dollar value will increase as the dollar depreciates against the currency.
Interest Rate Risk: Interest rate risk relates to the fluctuation in value of fixed income securities because of the inverse relationship of price and yield. Fixed income securities generally will decline in value upon an increase in general interest rates and their value generally will increase upon a decline in general interest rates. Fixed income securities with longer durations tend to be more sensitive to changes in interest rates, usually making them more volatile than securities with shorter durations.
The following provides more detailed information about each derivative type held by the Fund:
Forward Foreign Currency Exchange Contracts — The Fund entered into forward foreign currency exchange contracts for the purpose of shifting foreign currency exposure back to U.S. dollars.
The Fund entered into forward foreign currency exchange contracts to shift its investment exposure from one currency to another.
Forward foreign currency exchange contracts are agreements to exchange one currency for another at a future date at a specified price. These contracts are used to minimize the exposure to foreign exchange rate fluctuations during the period between the trade and settlement dates of the contract. Contracts to buy generally are used to acquire exposure to foreign currencies, while contracts to sell are generally used to reduce the exposure to foreign exchange rate fluctuations. Forward foreign currency exchange contracts are valued daily at the current exchange rate of the underlying currency, resulting in unrealized gains (losses) which become realized at the time the forward foreign currency exchange contracts are closed or mature. Realized and unrealized gains (losses) arising from such transactions are included in net realized and unrealized gains (losses) on foreign currency transactions. The use of forward foreign currency exchange contracts does not eliminate fluctuations in the prices of the Fund’s portfolio securities. While the maximum potential loss from such contracts is the aggregate face value in U.S. dollars at the time the contract was opened, exposure is typically limited to the change in value of the contract (in U.S. dollars) over the period it remains open. The Fund could also be exposed to risk that counterparties of the contracts may be unable to fulfill the terms of the contracts.
During the year ended March 31, 2011, the Fund entered into 12 forward foreign currency exchange contracts. The Fund did not have any open forward foreign currency exchange contracts at the end of the period.
Futures Contracts — The Fund entered into interest rate futures contracts to manage the duration and yield curve exposure of the Fund versus the benchmark.
The use of futures contracts involves certain risks, which include, among others: (1) imperfect correlation between the price movement of the instruments and the underlying securities, (2) inability to close out positions due to differing trading hours, or the temporary absence of a liquid market, for either the instruments or the underlying securities, and (3) an inaccurate prediction of the future direction of interest rates by the Fund’s Investment Manager. In addition, upon entering into index futures contracts, the Fund bears risks which may include securities prices moving unexpectedly, in which case, the Fund may not achieve the anticipated benefits of the futures contracts and may realize a loss.
Upon entering into a futures contract, the Fund identifies within its portfolio of investments cash or securities in an amount sufficient to meet the initial margin requirement. Subsequent payments are made or received by the Fund equal to the daily change in the contract value and are recorded as variation margin receivable or payable and offset in unrealized gains or losses. The Fund recognizes a realized gain or loss when the contract is closed or expires.
Futures contracts involve, to varying degrees, risk of loss in excess of the variation margin disclosed on the Statement of Assets and Liabilities.
During the year ended March 31, 2011, the Fund entered into 3,119 futures contracts.
Credit Default Swaps — The Fund entered into credit default swap transactions as a protection buyer to reduce overall credit exposure.
Credit default swaps are agreements in which one party pays fixed periodic payments to a counterparty in consideration for a guarantee from the counterparty to make a specific payment should a negative credit event take place. The Fund may receive or make an upfront payment as the protection buyer or seller. Credit default swaps are marked to market daily based on quotations from market makers and any change is recorded as unrealized appreciation/depreciation on the Statement of Assets and Liabilities. Periodic payments received or made are recorded as a realized gain or loss and premiums received or made are amortized on the Statement of Operations.
If the Fund is a buyer of protection and a credit event occurs, as defined under the terms of that particular swap agreement, the Fund will either (i) receive from the seller of protection an amount equal to the notional amount of the swap and deliver the referenced
37
Columbia Corporate Income Fund
March 31, 2011
obligation or underlying securities comprising the referenced index or (ii) receive a net settlement amount in the form of cash or securities equal to the notional amount of the swap less the recovery value of the referenced obligation or underlying securities comprising the referenced index.
If the Fund is a seller of protection and a credit event occurs, as defined under the terms of that particular swap agreement, the Fund will either (i) pay to the buyer of protection an amount equal to the notional amount of the swap and take delivery of the referenced obligation or underlying securities comprising the referenced index or (ii) pay a net settlement amount in the form of cash or securities equal to the notional amount of the swap less the recovery value of the referenced obligation or underlying securities comprising the referenced index.
Credit default swap agreements involve greater risks than if the Fund had invested in the reference obligation directly since, in addition to general market risks, credit default swaps are subject to illiquidity risk, counterparty risk and credit risk.
During the year ended March 31, 2011, the Fund purchased credit default swaps with a notional amount of $151,490,000.
The following table is a summary of the value of the Fund’s derivative instruments as of March 31, 2011:
| | | | | | | | |
| Fair Value of Derivative Instruments | |
| Statement of Assets and Liabilities | |
| Assets | | Fair Value | | Liabilities | | Fair Value | |
Open credit
default
swaps/
Premiums | | $154,314 | | Open credit
default
swaps/
Premiums | | $ | 22,489 | |
| — | | — | | Futures
variation
margin | | | 5,516 | |
| * | Includes only current day’s variation margin. |
The effect of derivative instruments on the Fund’s Statement of Operations for the year ended March 31, 2011:
| | | | | | | | | | |
| | | | | | | | | |
| | | Risk
Exposure | | Amount of
Realized
Gain or
(Loss) on
Derivatives | | | Change in
Unrealized
Appreciation
(Depreciation)
on Derivatives | |
| Forward Foreign Currency Exchange Contracts | | Foreign
Exchange
Rate | | $ | 37,003 | | | $ | (6,888 | ) |
| Futures Contracts | | Interest
Rate Risk | | | (5,962,504 | ) | | | 298,698 | |
| Credit Default Swap Contracts | | Credit | | | (2,825,316 | ) | | | 483,953 | |
Repurchase Agreements
The Fund may engage in repurchase agreement transactions with institutions that the Investment Manager has determined are creditworthy. The Fund, through the custodian, receives delivery of the underlying securities collateralizing a repurchase agreement. The Investment Manager is responsible for determining that the collateral is at least equal, at all times, to the value of the repurchase obligation including interest. A repurchase agreement transaction involves certain risks in the event of default or insolvency of the counterparty. These risks include possible delays in or restrictions on the Fund’s ability to dispose of the underlying securities and a possible decline in the value of the underlying securities during the period while the Fund seeks to assert its rights.
Loan Participations and Commitments
The Fund may invest in loan participations. When the Fund purchases a loan participation, the Fund typically enters into a contractual relationship with the lender or third party selling such participation (“Selling Participant”), but not the borrower. However, the Fund assumes the credit risk of the borrower, Selling Participant and any other persons interpositioned between the Fund and the borrower. The Fund may not directly benefit from the collateral supporting the senior loan which it has purchased from the Selling Participant.
Delayed Delivery Securities
The Fund may trade securities on other than normal settlement terms, including securities purchased or sold on a “when-issued”
38
Columbia Corporate Income Fund
March 31, 2011
basis. This may increase the risk if the other party to the transaction fails to deliver and causes the Fund to subsequently invest at less advantageous prices. The Fund identifies within its portfolio of investments cash or liquid securities in an amount equal to the delayed delivery commitment.
Security Transactions
Security transactions are accounted for on the trade date. Cost is determined and gains (losses) are based upon the specific identification method for both financial statement and federal income tax purposes.
Income Recognition
Interest income is recorded on the accrual basis and includes accretion of discounts, amortization of premiums and paydown gains and losses. Fee income attributable to mortgage dollar roll transactions is recorded on the accrual basis over the term of the transaction. The value of additional securities received as an income payment is recorded as income and as the cost basis of such securities.
Expenses
General expenses of the Trust are allocated to the Fund and other series of the Trust based upon relative net assets or other expense allocation methodologies determined by the nature of the expense. Expenses directly attributable to a specific class of shares are charged to that share class. Expenses directly attributable to the Fund are charged to the Fund.
Determination of Class Net Asset Value
All income, expenses (other than class-specific expenses which are charged directly to a share class, as shown in the Statement of Operations) and realized and unrealized gains (losses) are allocated to each class of the Fund on a daily basis for purposes of determining the net asset value of each class. Income and expenses are allocated to each class based on the settled shares method, while realized and unrealized gains (losses) are allocated based on the relative net assets of each class.
Federal Income Tax Status
The Fund intends to qualify each year as a regulated investment company under Subchapter M of the Internal Revenue Code, as amended, and will distribute substantially all of its tax exempt or taxable income, if any, for its tax year, and as such will not be subject to federal income taxes. In addition, the Fund intends to distribute in each calendar year substantially all of its net investment income, capital gains and certain other amounts, if any, such that the Fund should not be subject to federal excise tax. Therefore, no federal income or excise tax provision is recorded.
Distributions to Shareholders
Distributions from net investment income are declared daily and paid monthly. Net realized capital gains, if any, are distributed at least annually. Income distributions and capital gain distributions are determined in accordance with federal income tax regulations which may differ from GAAP.
Indemnifications
Under the Trust’s organizational documents and, in some cases, by contract, its officers and directors are indemnified against certain liabilities arising out of the performance of their duties to the Fund. In addition, certain of the Fund’s contracts with its service providers contain general indemnification clauses. The Fund’s maximum exposure under these arrangements is unknown since the amount of any future claims that may be made against the Fund cannot be determined and the Fund has no historical basis for predicting the likelihood of any such claims.
Note 3. Fees and Compensation Paid to Affiliates
Investment Management Fee
Under an Investment Management Services Agreement (IMSA), the Investment Manager determines which securities will be purchased, held or sold. The management fee is equal to a percentage of the Fund’s average daily net assets that declines from 0.42% to 0.32% as the Fund’s net assets increase.
Prior to the Closing, Columbia Management Advisors, LLC (Columbia), an indirect, wholly owned subsidiary of Bank of America Corporation (BOA), provided investment management services to the Fund under the same fee structure. The effective management fee rate for the year ended March 31, 2011, was 0.42% of the Fund’s average daily net assets.
Administration Fee
Effective upon the Closing, the Investment Manager provides administration and accounting services to the Fund under an Administrative Services Agreement, including services previously performed under the Pricing and Bookkeeping Oversight and Services Agreement (the Services Agreement) as discussed in the
39
Columbia Corporate Income Fund
March 31, 2011
Pricing and Bookkeeping Fees note below. The Fund pays an annual administration fee equal to a percentage of the Fund’s average daily net assets that declines from 0.15% to 0.10% as the Fund’s net assets increase.
Prior to the Closing, Columbia provided administrative services to the Fund at the same fee rates. For the year ended March 31, 2011, the Fund’s effective administration fee rate was 0.13% of the Fund’s average daily net assets.
Pricing and Bookkeeping Fees
Prior to the Closing, the Fund entered into a Financial Reporting Services Agreement (the Financial Reporting Services Agreement) with State Street Bank and Trust Company (State Street) and Columbia pursuant to which State Street provides financial reporting services to the Fund. The Fund also entered into an Accounting Services Agreement (collectively with the Financial Reporting Services Agreement, the State Street Agreements) with State Street and Columbia pursuant to which State Street provides accounting services to the Fund. Upon the Closing, Columbia assigned and delegated its rights and obligations under the State Street Agreements to the Investment Manager. Under the State Street Agreements, the Fund pays State Street an annual fee of $38,000 paid monthly plus an additional monthly fee based on an annualized percentage rate of average daily net assets of the Fund for the month. The aggregate fee will not exceed $140,000 per year (exclusive of out-of-pocket expenses and charges). The Fund also reimburses State Street for certain out-of-pocket expenses and charges.
Also prior to the Closing, the Fund entered into the Services Agreement with Columbia. Under the Services Agreement, Columbia provided services related to Fund expenses and the requirements of the Sarbanes-Oxley Act of 2002, and provided oversight of the accounting and financial reporting services provided by State Street. Under the Services Agreement, the Fund reimbursed Columbia for out-of-pocket expenses and charges, including fees payable to third parties, such as for pricing the Fund’s portfolio securities, incurred by Columbia in the performance of services under the Services Agreement. The Services Agreement was terminated upon the Closing. These services are now provided under the Administrative Services Agreement note discussed above.
Transfer Agent Fee
In connection with the Closing, RiverSource Service Corporation, a wholly owned subsidiary of Ameriprise Financial, provides transfer agency services to the Fund under a Transfer Agency Agreement and changed its name to Columbia Management Investment Services Corp. (the Transfer Agent). The Transfer Agent has contracted with Boston Financial Data Services (BFDS) to serve as sub-transfer agent.
The Transfer Agent receives monthly account-based service fees based on the number of open accounts and is reimbursed by the Fund for the fees and expenses the Transfer Agent pays to financial intermediaries that maintain omnibus accounts with the Fund that is a percentage of the average aggregate value of the Fund’s shares maintained in each such omnibus account (other than omnibus accounts for which American Enterprise Investment Services Inc. is the broker of record or accounts where the beneficial shareholder is a customer of Ameriprise Financial Services, Inc., which are paid a per account fee). The Transfer Agent pays the fees of BFDS for services as sub-transfer agent and, is not entitled to reimbursement for such fees from the Fund (with the exception of out-of pocket fees). The Transfer Agent also receives compensation from fees for various shareholder services and reimbursements for certain out-of -pocket expenses.
Prior to the Closing, Columbia Management Services, Inc., an affiliate of Columbia and an indirect, wholly owned subsidiary of BOA, provided transfer agency services to the Fund and contracted with BFDS to serve as sub-transfer agent, under the same fee structure.
Class I shares do not pay transfer agent fees. For the year ended March 31, 2011, the Fund’s effective transfer agent fee rate for each class, with the exception of Class I shares, as a percentage of each class’ average daily net assets was as follows:
| | | | | | | | |
| | | | | | | | | |
| Class A | | Class B | | Class C | | Class W | | Class Z |
| 0.12% | | 0.12% | | 0.12% | | 0.16% | | 0.12% |
An annual minimum account balance fee of $20 may apply to certain accounts with a value below the Fund’s initial minimum investment requirements to reduce the impact of small accounts on transfer agent fees. These minimum account balance fees are recorded as part of expense reductions on the Statement of Operations. For the year ended March 31, 2011, no minimum account balance fees were charged by the Fund.
Underwriting Discounts, Service and Distribution Fees
In connection with the Closing, RiverSource Fund Distributors, Inc., an indirect wholly owned subsidiary of Ameriprise Financial,
40
Columbia Corporate Income Fund
March 31, 2011
provides distribution and shareholder services to the Fund and changed its name to Columbia Management Investment Distributors, Inc. (the Distributor). Pursuant to Rule 12b-1 under the 1940 Act, the Board of Trustees has approved, and the Fund has adopted, distribution and shareholder service plans (the Plans) which set the distribution and service fees for the Fund. These fees are calculated daily and are intended to compensate the Distributor and/or eligible selling and/or servicing agents for selling shares of the Fund and providing services to investors.
The Plans require the payment of a monthly service fee to the Distributor at the maximum annual rate of 0.25% of the average daily net assets attributable to Class A, Class B, Class C and Class W shares of the Fund. The Plans also require the payment of a monthly distribution fee to the Distributor at the maximum annual rates of 0.75% of the average daily net assets attributable to Class B and Class C shares and 0.25% of the average daily net assets attributable to Class W shares.
The Distributor has voluntarily agreed to waive a portion of the Fund’s distribution and service fees for the Class C shares so that the combined fee will not exceed 0.85% annually of Class C average daily net assets. This arrangement may be modified or terminated by the Distributor at any time.
The Fund may pay a distribution fee of up to 0.25% of the Fund’s average daily net assets attributable to Class W shares and a service fee of up to 0.25% of the Fund’s average daily net assets attributable to Class W shares, provided, however, that the aggregate fee shall not exceed 0.25% of the Fund’s average daily net assets attributable to Class W shares.
Prior to the Closing, Columbia Management Distributors, Inc., an affiliate of Columbia and an indirect, wholly owned subsidiary of BOA, was the principal underwriter of the Fund’s shares. There were no changes to the underwriting discount structure of the Fund, the service or distribution fee rates paid by the Fund, or the distribution and service fee waivers for the Class C shares as a result of the Transaction.
Sales Charges
Sales charges, including front-end and CDSC’s, received by the Distributor for distributing Fund shares were $12,826 for Class A, $2,559 for Class B and $201 for Class C shares for the year ended March 31, 2011.
Fee Waivers and Expense Reimbursements
The Investment Manager has voluntarily agreed to bear a portion of the Fund’s expenses so that the Fund’s ordinary operating expenses (excluding brokerage commissions, interest, taxes and extraordinary expenses, but including custodian charges relating to overdrafts, if any), after giving effect to any balance credits from the Fund’s custodian, do not exceed the annual rates of 0.95%, 1.70%, 1.70%, 0.65%, 0.95% and 0.70% of the Fund’s average daily net assets attributable to Class A, Class B, Class C, Class I, Class W and Class Z shares, respectively. The Investment Manager, in its discretion, may revise or discontinue this arrangement at any time. Prior to May 1, 2010, Columbia voluntarily agreed to reimburse a portion of the Fund’s expenses so that the Fund’s ordinary operating expenses (excluding any distribution and service fees, brokerage commissions, interest, taxes and extraordinary expenses, but including custodian charges relating to overdrafts, if any), after giving effect to any balance credits from the Fund’s custodian, did not exceed 0.70% of the Fund’s average daily net assets on an annualized basis.
Fees Paid to Officers and Trustees
All officers of the Fund are employees of the Investment Manager or its affiliates and, with the exception of the Fund’s Chief Compliance Officer, receive no compensation from the Fund. The Board of Trustees has appointed a Chief Compliance Officer to the Fund in accordance with federal securities regulations. The Fund, along with other affiliated funds, pays its pro-rata share of the expenses associated with the Chief Compliance Officer. The Fund’s expenses for the Chief Compliance Officer will not exceed $15,000 per year.
Trustees are compensated for their services to the Fund, as set forth on the Statement of Operations. The Trust’s eligible Trustees may participate in a deferred compensation plan which may be terminated at any time. Obligations of the plan will be paid solely out of the Fund’s assets.
Note 4. Custody Credits
The Fund has an agreement with its custodian bank under which custody fees may be reduced by balance credits. These credits are recorded as part of expense reductions on the Statement of Operations. The Fund could have invested a portion of the assets utilized in connection with the expense offset arrangement in an income-producing asset if it had not entered into such an agreement. For the year ended March 31, 2011, these custody credits reduced total expenses by $46 for the Fund.
41
Columbia Corporate Income Fund
March 31, 2011
Note 5. Portfolio Information
The cost of purchases and proceeds from sales of securities, excluding short-term obligations, aggregated $701,819,075 and $577,003,308, respectively, for the year ended March 31, 2011, of which $198,807,845 and $172,369,891, respectively, were U.S. Government securities.
Note 6. Regulatory Settlements
During the year ended March 31, 2010, the Fund received payments totaling $6,535 resulting from certain regulatory settlements with third parties in which the Fund had participated. The payments have been included in “Increase from regulatory settlements” in the Statement of Changes in Net Assets.
Note 7. Shareholder Concentration
As of March 31, 2011, two shareholder accounts owned 51.6% of the outstanding shares of the Fund. Purchase and redemption activity of these accounts may have a significant effect on the operations of the Fund.
Note 8. Line of Credit
Prior to March 28, 2011, the Fund and other affiliated funds participated in a $280,000,000 committed, unsecured revolving line of credit provided by State Street. Effective March 28, 2011, the commitment was reduced to $225,000,000. The maximum amount that may be borrowed by any fund is limited to the lesser of $200,000,000 and the Fund’s borrowing limit set forth in the Fund’s registration statement. Borrowings are available for short-term liquidity or temporary or emergency purposes.
Effective October 14, 2010, interest is charged to each participating fund based on the fund’s borrowings at a rate per annum equal to the greater of the Federal Funds Rate plus 1.25% or the overnight LIBOR Rate plus 1.25%. In addition, a commitment fee of 0.125% per annum is accrued and apportioned among the participating funds pro rata based on their relative net assets.
Prior to October 14, 2010, interest was charged to each participating fund at the same rates. In addition, a commitment fee of 0.15% per annum was accrued and apportioned among the participating funds pro rata based on their relative net assets.
For the year ended March 31, 2011, the average daily loan balance outstanding on days where borrowing existed was $7,106,061 at a weighted average interest rate of 1.52%.
Note 9. Federal Tax Information
The timing and character of income and capital gain distributions are determined in accordance with income tax regulations, which may differ from GAAP. Reclassifications are made to the Fund’s capital accounts for permanent tax differences to reflect income and gains available for distribution (or available capital loss carryforwards) under income tax regulations.
For the year ended March 31, 2011, permanent book and tax basis differences resulting primarily from differing treatments for discount accretion/premium amortization on debt securities, paydown gain/loss, market discount, Section 988 currency gain/loss and defaulted securities basis adjustments were identified and reclassified among the components of the Fund’s net assets as follows:
| | | | |
| | | | | |
Overdistributed Net Investment
Income | | Accumulated Net Realized
Loss | | Paid-In
Capital |
| $1,433,573 | | $(1,433,572) | | $(1) |
Net investment income and net realized gains (losses), as disclosed on the Statement of Operations, and net assets were not affected by this reclassification.
The tax character of distributions paid during the years ended March 31, 2011 and March 31, 2010 was as follows:
| | | | | | | | |
| | | March 31,
2011 | | | March 31,
2010 | |
| Distributions paid from: | | | | | | |
Ordinary Income* | | $ | 29,162,141 | | | $ | 34,315,551 | |
| * | For tax purposes short-term capital gain distributions, if any, are considered ordinary income distributions. |
As of March 31, 2011, the components of distributable earnings on a tax basis were as follows:
| | | | |
| | | | | |
Overdistributed
Ordinary Income | | Undistributed Long-Term Capital Gains | | Net Unrealized Appreciation* |
| $2,055,113 | | $— | | $3,742,342 |
| * | The differences between book-basis and tax-basis net unrealized appreciation are primarily due to deferral of losses from wash sales and differing treatments for discount accretion/premium amortization on debt securities. |
42
Columbia Corporate Income Fund
March 31, 2011
Unrealized appreciation and depreciation at March 31, 2011, based on cost of investments for federal income tax purposes were:
| | | | |
| | | | |
Unrealized appreciation | | $ | 27,814,041 | |
Unrealized depreciation | | | (24,071,699 | ) |
| | | | |
Net unrealized appreciation | | $ | 3,742,342 | |
The following capital loss carryforwards may be available to reduce taxable income arising from future net realized gains on investments, if any, to the extent permitted by the Internal Revenue Code:
| | | | |
| | | | |
| Year of Expiration | | Capital Loss Carryforwards | |
2015 | | $ | 2,624,677 | |
2016 | | | 4,172,850 | |
2017 | | | 15,893,321 | |
2018 | | | 6,922,021 | |
| | | | |
Total | | $ | 29,612,869 | |
Capital loss carryforwards of $10,801,470 were utilized during the year ended March 31, 2011.
Management of the Fund has concluded that there are no significant uncertain tax positions that would require recognition in the financial statements. However, management’s conclusion may be subject to review and adjustment at a later date based on factors including, but not limited to, new tax laws, regulations, and administrative interpretations (including relevant court decisions). The Fund’s federal tax returns for the prior three fiscal years remain subject to examination by the Internal Revenue Service.
Note 10. Significant Risks and Contingencies
Sector Focus Risk
The Fund may focus its investments in certain sectors, subjecting it to greater risk than a fund that is less focused.
High-Yield Securities Risk
Investing in high-yield fixed income securities may involve greater credit risk and considerations not typically associated with investing in U.S. Government bonds and other higher quality fixed income securities. These securities are non-investment grade securities, often referred to as “junk” bonds. Economic downturns may disrupt the high yield market and impair the ability of issuers to repay principal and interest. Also, an increase in interest rates would likely have an adverse impact on the value of such obligations. Moreover, high-yield securities may be less liquid to the extent that there is no established secondary market.
Asset-Backed Securities Risk
The value of asset-backed securities may be affected by, among other factors, changes in interest rates, the market’s assessment of the quality of underlying assets, the creditworthiness of the servicer for the underlying assets, factors concerning the interests in and structure of the issuer or the originator of the underlying assets, or the creditworthiness or rating of the entities that provide any supporting letters of credit, surety bonds, derivative instruments, or other credit enhancement. The value of asset-backed securities also will be affected by the exhaustion, termination or expiration of any credit enhancement. Most asset-backed securities are subject to prepayment risk, which is the possibility that the underlying debt may be refinanced or prepaid prior to maturity during periods of declining or low interest rates, causing the Fund to have to reinvest the money received in securities that have lower yields. In addition, the impact of prepayments on the value of asset-backed securities may be difficult to predict and may result in greater volatility.
Note 11. Subsequent Events
Management has evaluated the events and transactions that have occurred through the date the financial statements were issued. Other than as noted below, these were no items requiring adjustment of the financial statements or additional disclosure.
Effective May 16, 2011, the line of credit commitment with State Street was reduced to $150,000,000, and the maximum amount that may be borrowed by any fund was limited to the lesser of $120,000,000 and the Fund’s borrowing limit set forth in the Fund’s registration statement.
Note 12. Information Regarding Pending and Settled Legal Proceedings
In June 2004, an action captioned John E. Gallus et al. v. American Express Financial Corp. and American Express Financial Advisors Inc. was filed in the United States District Court for the District of Arizona. The plaintiffs allege that they are investors in several American Express Company (now known as RiverSource) mutual funds and they purport to bring the action derivatively on behalf of those funds under the Investment Company Act of 1940. The plaintiffs allege that fees allegedly paid to the defendants by the funds for investment advisory and administrative services are excessive. The plaintiffs seek remedies including restitution and rescission of investment advisory and distribution agreements. The plaintiffs voluntarily agreed to transfer this case to the United States District Court for the District of Minnesota (the District Court).
43
Columbia Corporate Income Fund
March 31, 2011
In response to defendants’ motion to dismiss the complaint, the District Court dismissed one of plaintiffs’ four claims and granted plaintiffs limited discovery. Defendants moved for summary judgment in April 2007. Summary judgment was granted in the defendants’ favor on July 9, 2007. The plaintiffs filed a notice of appeal with the Eighth Circuit Court of Appeals (the Eighth Circuit) on August 8, 2007. On April 8, 2009, the Eighth Circuit reversed summary judgment and remanded to the District Court for further proceedings. On August 6, 2009, defendants filed a writ of certiorari with the U.S. Supreme Court (the Supreme Court), asking the Supreme Court to stay the District Court proceedings while the Supreme Court considers and rules in a case captioned Jones v. Harris Associates, which involves issues of law similar to those presented in the Gallus case. On March 30, 2010, the Supreme Court issued its ruling in Jones v. Harris Associates, and on April 5, 2010, the Supreme Court vacated the Eighth Circuit’s decision in the Gallus case and remanded the case to the Eighth Circuit for further consideration in light of the Supreme Court’s decision in Jones v. Harris Associates. On June 4, 2010, the Eighth Circuit remanded the Gallus case to the District Court for further consideration in light of the Supreme Court’s decision in Jones v. Harris Associates. On December 9, 2010, the District Court reinstated its July 9, 2007 summary judgment order in favor of the defendants. On January 10, 2011, plaintiffs filed a notice of appeal with the Eighth Circuit.
In December 2005, without admitting or denying the allegations, American Express Financial Corporation (AEFC, which is now known as Ameriprise Financial, Inc. (Ameriprise Financial)), entered into settlement agreements with the Securities and Exchange Commission (SEC) and Minnesota Department of Commerce (MDOC) related to market timing activities. As a result, AEFC was censured and ordered to cease and desist from committing or causing any violations of certain provisions of the Investment Advisers Act of 1940, the Investment Company Act of 1940, and various Minnesota laws. AEFC agreed to pay disgorgement of $10 million and civil money penalties of $7 million. AEFC also agreed to retain an independent distribution consultant to assist in developing a plan for distribution of all disgorgement and civil penalties ordered by the SEC in accordance with various undertakings detailed at http://www.sec.gov/litigation/admin/ia-2451.pdf. Ameriprise Financial and its affiliates have cooperated with the SEC and the MDOC in these legal proceedings, and have made regular reports to the funds’ Boards of Directors/Trustees.
Ameriprise Financial and certain of its affiliates have historically been involved in a number of legal, arbitration and regulatory proceedings, including routine litigation, class actions, and governmental actions, concerning matters arising in connection with the conduct of their business activities. Ameriprise Financial believes that the Funds are not currently the subject of, and that neither Ameriprise Financial nor any of its affiliates are the subject of, any pending legal, arbitration or regulatory proceedings that are likely to have a material adverse effect on the Funds or the ability of Ameriprise Financial or its affiliates to perform under their contracts with the Funds. Ameriprise Financial is required to make 10-Q, 10-K and, as necessary, 8-K filings with the Securities and Exchange Commission on legal and regulatory matters that relate to Ameriprise Financial and its affiliates. Copies of these filings may be obtained by accessing the SEC website at www.sec.gov.
There can be no assurance that these matters, or the adverse publicity associated with them, will not result in increased fund redemptions, reduced sale of fund shares or other adverse consequences to the Funds. Further, although we believe proceedings are not likely to have a material adverse effect on the Funds or the ability of Ameriprise Financial or its affiliates to perform under their contracts with the Funds, these proceedings are subject to uncertainties and, as such, we are unable to estimate the possible loss or range of loss that may result. An adverse outcome in one or more of these proceedings could result in adverse judgments, settlements, fines, penalties or other relief that could have a material adverse effect on the consolidated financial condition or results of operations of Ameriprise Financial.
44
Report of Independent Registered Public Accounting Firm
To the Trustees of Columbia Funds Series Trust I and the Shareholders of Columbia Corporate Income Fund
In our opinion, the accompanying statement of assets and liabilities, including the investment portfolio and the related statements of operations and of changes in net assets and the financial highlights present fairly, in all material respects, the financial position of Columbia Corporate Income Fund (formerly known as Columbia Income Fund) (the “Fund”) (a series of Columbia Funds Series Trust I) at March 31, 2011, the results of its operations for the year then ended, the changes in its net assets for each of the two years in the period then ended, and the financial highlights for the periods indicated, in conformity with accounting principles generally accepted in the United States of America. These financial statements and financial highlights (hereafter referred to as “financial statements”) are the responsibility of the Fund’s management; our responsibility is to express an opinion on these financial statements based on our audits. We conducted our audits of these financial statements in accordance with the standards of the Public Company Accounting Oversight Board (United States). Those standards require that we plan and perform the audit to obtain reasonable assurance about whether the financial statements are free of material misstatement. An audit includes examining, on a test basis, evidence supporting the amounts and disclosures in the financial statements, assessing the accounting principles used and significant estimates made by management, and evaluating the overall financial statement presentation. We believe that our audits, which included confirmation of securities at March 31, 2011 by correspondence with the custodian and brokers, provide a reasonable basis for our opinion.
PricewaterhouseCoopers LLP
Boston, Massachusetts
May 20, 2011
45
Fund Governance
The Trustees serve terms of indefinite duration. The names, addresses and birth years of the Trustees and Officers of the Funds in the Columbia Funds Series Trust I, the year each was first elected or appointed to office, their principal business occupations during at least the last five years, the number of Funds overseen by each Trustee and other directorships they hold are shown below. Each officer listed below serves as an officer of each Fund in the Columbia Funds Series Trust I.
Independent Trustees
| | |
Name, Address and Year of Birth,
Position with Funds, Year First
Elected or Appointed to Office | | Principal Occupation(s) During Past Five Years, Number of Funds in Columbia Funds
Complex Overseen by Trustee, Other Directorships Held |
| |
| John D. Collins (born 1938) | | |
c/o Columbia Management Investment Advisers, LLC 225 Franklin Street Boston, MA 02110 Trustee (since 2005) | | Retired. Consultant, KPMG, LLP (accounting and tax firm) from July 1999 to June 2000; Partner, KPMG, LLP from March 1962 to June 1999. Oversees 46; Mrs. Fields Original Cookies, Inc. (consumer products); Suburban Propane Partners, L.P.; and Montpelier Re (insurance underwriting firm) |
| |
| Rodman L. Drake (born 1943) | | |
c/o Columbia Management Investment Advisers, LLC 225 Franklin Street Boston, MA 02110 Trustee (since 1994) and Chairman of the Board (since 2009) | | Independent consultant since 2010; Co-Founder of Baringo Capital LLC (private equity) from 1997 to 2008; CEO of Crystal River Capital, Inc. (real estate investment trust) from 2003 to 2010; Oversees 46; Jackson Hewitt Tax Service Inc. (tax preparation services); Celgene Corporation (global biotechnology company); Student Loan Corporation (student loan provider); Crystal River Capital, Inc. from 2005 to 2010; Parsons Brinckerhoff from 1995 to 2008; the Helios Funds (closed-end funds); and Apex Silver Mines Ltd. from 2007 to 2009 |
| |
| Douglas A. Hacker (born 1955) | | |
c/o Columbia Management Investment Advisers, LLC 225 Franklin Street Boston, MA 02110 Trustee (since 1996) | | Independent business executive since May 2006; Executive Vice President–Strategy of United Airlines (airline) from December 2002 to May 2006; President of UAL Loyalty Services (airline marketing company) from September 2001 to December 2002; Executive Vice President and Chief Financial Officer of United Airlines from July 1999 to September 2001. Oversees 46; Nash Finch Company (food distributor); Aircastle Limited (aircraft leasing); and SeaCube Container Leasing Ltd (container leasing) |
|
| Janet Langford Kelly (born 1957) |
c/o Columbia Management Investment Advisers, LLC 225 Franklin Street Boston, MA 02110 Trustee (since 1996) | | Senior Vice President, General Counsel and Corporate Secretary, ConocoPhillips (integrated energy company) since September 2007; Deputy General Counsel–Corporate Legal Services, ConocoPhillips from August 2006 to August 2007; Partner, Zelle, Hofmann, Voelbel, Mason & Gette LLP (law firm) from March 2005 to July 2006; Adjunct Professor of Law, Northwestern University, from September 2004 to June 2006; Director, UAL Corporation (airline) from February 2006 to July 2006; Oversees 46; None |
| |
| William E. Mayer (born 1940) | | |
c/o Columbia Management Investment Advisers, LLC 225 Franklin Street Boston, MA 02110 Trustee (since 1994) | | Partner, Park Avenue Equity Partners (private equity) since February 1999; Dean and Professor, College of Business and Management, University of Maryland from 1992 to 1996. Oversees 46; DynaVox Inc. (software developer); Lee Enterprises (print media), WR Hambrecht + Co. (financial service provider); BlackRock Kelso Capital Corporation (investment company) |
46
Fund Governance (continued)
Independent Trustees (continued)
| | |
Name, Address and Year of Birth,
Position with Funds, Year First
Elected or Appointed to Office | | Principal Occupation(s) During Past Five Years, Number of Funds in Columbia Funds
Complex Overseen by Trustee, Other Directorships Held |
| |
| David M. Moffett (born 1952) | | |
c/o Columbia Management Investment Advisers, LLC 225 Franklin Street Boston, MA 02110 Trustee (since 2011) | | Retired. Chief Executive Officer, Federal Home Loan Mortgage Corporation, from 2008 to 2009; Senior Adviser, Global Financial Services Group, Carlyle Group, Inc., from 2007 to 2008; Vice Chairman and Chief Financial Officer, U.S. Bancorp, from 1993 to 2007. Oversees 46; CIT Group Inc. (commercial and consumer finance), eBay Inc. (online trading community), MBIA Corp (financial service provider), E.W. Scripps Co. (print and television media), Building Materials Holding Corp. (building materials and construction services), and University of Oklahoma Foundation. |
| |
| Charles R. Nelson (born 1942) | | |
c/o Columbia Management Investment Advisers, LLC 225 Franklin Street Boston, MA 02110 Trustee (since 1981) | | Professor of Economics, University of Washington, since January 1976; Ford and Louisa Van Voorhis Professor of Political Economy, University of Washington, since September 1993; Adjunct Professor of Statistics, University of Washington, since September 1980; Associate Editor, Journal of Money Credit and Banking, 1993-2008; Consultant on econometric and statistical matters. Oversees 46; None |
| |
| John J. Neuhauser (born 1943) | | |
c/o Columbia Management Investment Advisers, LLC 225 Franklin Street Boston, MA 02110 Trustee (since 1984) | | President, Saint Michael’s College, since August 2007; Director or Trustee of several non-profit organization, including Fletcher Allen Health Care, Inc.; University Professor, Boston College from November 2005 to August 2007; Academic Vice President and Dean of Faculties, Boston College from August 1999 to October 2005. Oversees 46; Liberty All-Star Equity Fund and Liberty All-Star Growth Fund, Inc. (closed-end funds) |
| |
| Jonathan Piel (born 1938) | | |
c/o Columbia Management Investment Advisers, LLC 225 Franklin Street Boston, MA 02110 Trustee (since 1994) | | Cable television producer and website designer; The Editor, Scientific American from 1984 to 1994; Vice President, Scientific American, Inc., from 1984 to 1994; Member, Advisory Board, Stone Age Institute, Bloomington, Indiana (research institute that explores the effect of technology on human evolution); Member, Board of Directors of the National Institute of Social Sciences, New York City; Member, Board of Trustees of the William Alanson White Institute, New York City (institution for training psychoanalysts); and Member, Advisory Board, Mount Sinai Children’s Environmental Health Center, New York. Oversees 46; None |
| |
| Patrick J. Simpson (born 1944) | | |
c/o Columbia Management Investment Advisers, LLC 225 Franklin Street Boston, MA 02110 Trustee (since 2000) | | Partner, Perkins Coie LLP (law firm). Oversees 46; None |
| |
| Anne-Lee Verville (born 1945) | | |
c/o Columbia Management Investment Advisers, LLC 225 Franklin Street Boston, MA 02110 Trustee (since 1998) | | Retired since 1997 (formerly General Manager–Global Education Industry from 1994 to 1997, President–Application Systems Division from 1991 to 1994, Chief Financial Officer–US Marketing & Services from 1988 to 1991, and Chief Information Officer from 1987 to 1988, IBM Corporation (computer and technology)). Oversees 46; Enesco Group, Inc. (producer of giftware and home and garden decor products) from 2001 to 2006 |
47
Fund Governance (continued)
Interested Trustee
| | |
Name, Address and Year of Birth,
Position with Funds, Year First
Elected or Appointed to Office | | Principal Occupation(s) During Past Five Years, Number of Funds in Columbia Funds
Complex Overseen by Trustee, Other Directorships Held |
| |
| Michael A. Jones (born 1959) | | |
c/o Columbia Management Investment Advisers, LLC 225 Franklin Street Boston, MA 02110 Trustee (since 2011) Senior Vice President (since 2010) | | President and Director, Columbia Management Investment Advisers, LLC since May 2010; President and Director, Columbia Management Investment Distributors, Inc. since May 2010; Manager, Chairman, Chief Executive Officer and President, Columbia Management Advisors, LLC from 2007 to April 2010; Chief Executive Officer, President and Director, Columbia Management Distributors, Inc. from November 2006 to April 2010; previously, co-president and senior managing director at Robeco Investment Management. Oversees 46; None |
The Statement of Additional Information includes additional information about the Trustees of the Funds and is available, without charge, upon request by calling 1-800-345-6611.
48
Fund Governance (continued)
Officers
| | |
| Name, Year of Birth and Address | | Principal Occupation(s) During the Past Five Years |
|
| J. Kevin Connaughton (born 1964) |
225 Franklin Street Boston, MA 02110 President (since 2009) | | Senior Vice President and General Manager–Mutual Fund Products, Columbia Management Investment Advisers, LLC since May 2010; President, Columbia Funds, since 2009, and RiverSource Funds, since May 2010 (previously Senior Vice President and Chief Financial Officer, Columbia Funds, from June 2008 to January 2009, Treasurer, Columbia Funds, from October 2003 to May 2008, and senior officer of various other affiliated funds since 2000); Managing Director, Columbia Management Advisors, LLC from December 2004 to April 2010. |
| |
| Michael G. Clarke (born 1969) | | |
225 Franklin Street Boston, MA 02110 Treasurer (since 2011) and Chief Financial Officer (since 2009) | | Vice President, Columbia Management Investment Advisers, LLC since May 2010; Managing Director of Fund Administration, Columbia Management Advisors, LLC, from September 2004 to April 2010; senior officer of Columbia Funds and affiliated funds since 2002. |
| |
| Scott R. Plummer (born 1959) | | |
5228 Ameriprise Financial Center Minneapolis, MN 55474 Senior Vice President, Secretary and Chief Legal Officer (since 2010) | | Chief Legal Officer and Assistant Secretary, Columbia Management Investment Advisers, LLC since June 2005; Vice President and Lead Chief Counsel–Asset Management, Ameriprise Financial, Inc. since May 2010 (previously Vice President and Chief Counsel–Asset Management, from 2005 to April 2010, and Vice President–Asset Management Compliance from 2004 to 2005); Vice President, Chief Counsel and Assistant Secretary, Columbia Management Investment Distributors, Inc. since 2008; Vice President, General Counsel and Secretary, Ameriprise Certificate Company since 2005; Chief Counsel, RiverSource Distributors, Inc. since 2006; Vice President, General Counsel and Secretary, RiverSource Funds, since December 2006; Senior Vice President, Secretary and Chief Legal Officer, Columbia Funds, since May 2010. |
| |
| Linda J. Wondrack (born 1964) | | |
225 Franklin Street Boston, MA 02110 Senior Vice President and Chief Compliance Officer (since 2007) | | Vice President and Chief Compliance Officer, Columbia Management Investment Advisers, LLC since May 2010; Chief Compliance Officer, Columbia Funds, since 2007, and RiverSource Funds, since May 2010; Director (Columbia Management Group, LLC and Investment Product Group Compliance), Bank of America, from June 2005 to April 2010; Director of Corporate Compliance and Conflicts Officer of MFS Investment Management (investment management) from August 2004 to May 2005. |
| |
| William F. Truscott (born 1960) | | |
53600 Ameriprise Financial Center Minneapolis, MN 55474 Senior Vice President (since 2010) | | Chairman of the Board, Columbia Management Investment Advisers, LLC since May 2010 (previously President, Chairman of the Board and Chief Investment Officer, from 2001 to April 2010); Chief Executive Officer, U.S. Asset Management & President, Annuities, Ameriprise Financial, Inc. since May 2010 (previously President–U.S. Asset Management and Chief Investment Officer from 2005 to April 2010, and Senior Vice President–Chief Investment Officer, from 2001 to 2005); Director, President and Chief Executive Officer, Ameriprise Certificate Company since 2006; Director, Columbia Management Investment Distributors, Inc. since May 2010 (previously Chairman of the Board and Chief Executive Officer from 2008 to April 2010); Chairman of the Board and Chief Executive Officer, RiverSource Distributors, Inc. since 2006. |
49
Fund Governance (continued)
Officers (continued)
| | |
| Name, Year of Birth and Address | | Principal Occupation(s) During the Past Five Years |
|
| Colin Moore (born 1958) |
225 Franklin Street Boston, MA 02110 Senior Vice President (since 2010) | | Director and Chief Investment Officer, Columbia Management Investment Advisers, LLC since May 2010; Manager, Managing Director and Chief Investment Officer of Columbia Management Advisors, LLC from 2007 to April 2010; Head of Equities, Columbia Management Advisors, LLC from 2002 to 2007. |
| |
| Amy Johnson (born 1965) | | |
5228 Ameriprise Financial Center Minneapolis, MN 55474 Vice President (since 2010) | | Senior Vice President and Chief Operating Officer, Columbia Management Investment Advisers, LLC since May 2010 (previously Chief Administrative Officer, from 2009 until April 2010, Vice President–Asset Management and Trust Company Services, from 2006 to 2009, and Vice President–Operations and Compliance from 2004 to 2006). |
| |
| Joseph F. DiMaria (born 1968) | | |
225 Franklin Street Boston, MA 02110 Vice President (since 2011) and Chief Accounting Officer (since 2008) | | Vice President, Mutual Fund Administration, Columbia Management Investment Advisers, LLC, since May 2010; Director of Fund Administration, Columbia Management Advisors, LLC from January 2006 to April 2010; Head of Tax/Compliance and Assistant Treasurer, Columbia Management Advisors, LLC, from November 2004 to December 2005. |
| |
| Paul D. Pearson (born 1956) | | |
5228 Ameriprise Financial Center Minneapolis, MN 55474 Vice President and Assistant Treasurer (since 2011) | | Vice President, Investment Accounting, Columbia Management Investment Advisers, LLC, since May 2010; Vice President, Managed Assets, Investment Accounting, Ameriprise Financial Corporation. |
| |
| Paul B. Goucher (born 1968) | | |
5228 Ameriprise Financial Center Minneapolis, MN 55474 Vice President and Assistant Treasurer (since 2010) | | Vice President and Chief Counsel of Ameriprise Financial since January 2010 (formerly Vice President and Group Counsel from November 2008 to January 2010); Director, Managing Director and General Counsel of J. & W. Seligman & Co. Incorporated (Seligman) from July 2008 to November 2008 and Managing Director and Associate General Counsel of Seligman from January 2005 to July 2008. |
| |
| Christopher O. Petersen (born 1970) | | |
5228 Ameriprise Financial Center Minneapolis, MN 55474 Vice President and Assistant Treasurer (since 2010) | | Vice President and Chief Counsel, Ameriprise Financial since January 2010 (formerly Vice President and Group Counsel or Counsel from April 2004 to January 2010); Assistant Secretary of RiverSource Funds since January 2007. |
| |
| Michael E. DeFao (born 1968) | | |
5228 Ameriprise Financial Center Minneapolis, MN 55474 Vice President and Assistant Treasurer (since 2011) | | Vice President and Chief Counsel, Ameriprise Financial since May 2010; Associate General Counsel Bank of America from June 2005 to April 2010 |
| |
| Stephen T. Welsh (born 1957) | | |
225 Franklin Street Boston, MA 02110 Vice President (since 2006) | | President and Director, Columbia Management Investment Services Corp. since May 2010; President and Director, Columbia Management Services, Inc. from July 2004 to April 2010; Managing Director, Columbia Management Distributors, Inc. from August 2007 to April 2010. |
50
Shareholder Meeting Results
At a Joint Special Meeting of Shareholders held on February 15, 2011, shareholders of the Fund considered a proposal to approve a proposed amendment to the Investment Management Services Agreement with Columbia Management Investment Advisers, LLC. The proposal was approved as follows:
| | | | | | |
| |
| Votes For | | Votes Against | | Abstentions | | Broker Non-Votes |
| 314,248,609 | | 8,371,927 | | 4,925,324 | | 0 |
51
[THIS PAGE INTENTIONALLY LEFT BLANK]
52
Important Information About This Report
The fund mails one shareholder report to each shareholder address. If you would like more than one report, please call shareholder services at 1-800-345-6611 and additional reports will be sent to you. This report has been prepared for shareholders of Columbia Corporate Income Fund.
A description of the policies and procedures that the fund uses to determine how to vote proxies and a copy of the fund’s voting records are available (i) at www.columbiamanagement.com, (ii) on the Securities and Exchange Commission’s website at www.sec.gov, and (iii) without charge, upon request, by calling 1-800-368-0346. Information regarding how the fund voted proxies relating to portfolio securities during the 12-month period ended June 30 is available from the SEC’s website. Information regarding how the fund voted proxies relating to portfolio securities is also available from the fund’s website, www.columbiamanagement.com.
The fund files a complete schedule of portfolio holdings with the SEC for the first and third quarters of each fiscal year on Form N-Q. The fund’s Form N-Q is available on the SEC’s website at www.sec.gov and may be reviewed and copied at the SEC’s Public Reference Room in Washington, D.C. Information on the operation of the Public Reference Room may be obtained by calling
1-800-SEC-0330.
Transfer Agent
Columbia Management Investment Services Corp.
P.O. Box 8081
Boston, MA 02266-8081
1-800-345-6611
Distributor
Columbia Management Investment
Distributors, Inc.
225 Franklin Street
Boston, MA 02110
Investment Manager
Columbia Management Investment Advisers, LLC
225 Franklin Street
Boston, MA 02110
53

Columbia Corporate Income Fund
P.O. Box 8081
Boston, MA 02266-8081
columbiamanagement.com
This information is for use with concurrent or prior delivery of a fund prospectus. Investors should consider the investment objectives, risks, charges and expenses of a mutual fund carefully before investing. For a free prospectus, which contains this and other important information about the funds, visit columbiamanagement.com. Read the prospectus carefully before investing. The Fund is distributed by Columbia Management Investment Distributors, Inc., member FINRA, and managed by Columbia Management Investment Advisers, LLC.
©2011 Columbia Management Investment Advisers, LLC. All rights reserved.
C-1181 A (05/11)

Columbia Intermediate Bond Fund
Annual Report for the Period Ended March 31, 2011
Table of contents
The views expressed in this report reflect the current views of the respective parties. These views are not guarantees of future performance and involve certain risks, uncertainties and assumptions that are difficult to predict, so actual outcomes and results may differ significantly from the views expressed. These views are subject to change at any time based upon economic, market or other conditions and the respective parties disclaim any responsibility to update such views. These views may not be relied on as investment advice and, because investment decisions for a Columbia Fund are based on numerous factors, may not be relied on as an indication of trading intent on behalf of any particular Columbia Fund. References to specific securities should not be construed as a recommendation or investment advice.
President’s Message

Dear Shareholder:
The Columbia Management story began over 100 years ago, and today, we are one of the nation’s largest dedicated asset managers. The recent acquisition by Ameriprise Financial, Inc. brings together the talents, resources and capabilities of Columbia Management with those of RiverSource Investments, Threadneedle (acquired by Ameriprise in 2003) and Seligman Investments (acquired by Ameriprise in 2008) to build a best-in-class asset management business that we believe is truly greater than its parts.
RiverSource Investments traces its roots to 1894 when its then newly-founded predecessor, Investors Syndicate, offered a face-amount savings certificate that gave small investors the opportunity to build a safe and secure fund for retirement, education or other special needs. A mutual fund pioneer, Investors Syndicate launched Investors Mutual Fund in 1940. In the decades that followed, its mutual fund products and services lineup grew to include a full spectrum of styles and specialties. More than 110 years later, RiverSource continues to be a trusted financial products leader.
Threadneedle, a leader in global asset management and one of Europe’s largest asset managers, offers sophisticated international experience from a dedicated U.K. management team. Headquartered in London, it is named for Threadneedle Street in the heart of the city’s financial district, where British investors pioneered international and global investing. Threadneedle was acquired in 2003 and today operates as an affiliate of Columbia Management.
Seligman Investments’ beginnings date back to the establishment of the investment firm J. & W. Seligman & Co. in 1864. In the years that followed, Seligman played a major role in the geographical expansion and industrial development of the United States. In 1874, President Ulysses S. Grant named Seligman as fiscal agent for the U.S. Navy — an appointment that would last through World War I. Seligman helped finance the westward path of the railroads and the building of the Panama Canal. The firm organized its first investment company in 1929 and began managing its first mutual fund in 1930. In 2008, J. & W. Seligman & Co. Incorporated was acquired and Seligman Investments became an offering brand of RiverSource Investments, LLC.
We are proud of the rich and distinctive history of these firms, the strength and breadth of products and services they offer, and the combined cultures of pioneering spirit and forward thinking. Together we are committed to providing more for our shareholders than ever before.
| n | | A singular focus on our shareholders. Our business is asset management, so investors are our first priority. We dedicate our resources to identifying timely investment opportunities and provide a comprehensive choice of equity, fixed-income and alternative investments to help meet your individual needs. |
| n | | First-class research and thought leadership. We are dedicated to helping you take advantage of today’s opportunities and anticipate tomorrow’s. We stay abreast of the latest investment trends and ideas, using our collective insight to evaluate events and transform them into solutions you can use. |
| n | | A disciplined investment approach. We aren’t distracted by passing fads. Our teams adhere to a rigorous investment process that helps ensure the integrity of our products and enables you and your financial advisor to match our solutions to your objectives with confidence. |
When you choose Columbia Management, you can be confident that we will take the time to understand your needs and help you and your financial advisor identify the solutions that are right for you. Because at Columbia Management, we don’t consider ourselves successful unless you are.
Sincerely,

J. Kevin Connaughton
President, Columbia Funds
Investors should consider the investment objectives, risks, charges and expenses of a mutual fund carefully before investing. For a free prospectus, which contains this and other important information about the funds, visit www.columbiamanagement.com. The prospectus should be read carefully before investing.
Columbia Funds are distributed by Columbia Management Investment Distributors, Inc., member FINRA, and managed by Columbia Management Investment Advisers, LLC.
© 2011 Columbia Management Investment Advisers, LLC. All rights reserved.
Fund Profile – Columbia Intermediate Bond Fund
Summary
| n | | For the 12-month period that ended March 31, 2011, the fund’s Class A shares returned 5.80% without sales charge. |
| n | | The fund’s return exceeded that of its benchmark, the Barclays Capital Aggregate Bond Index1 but trailed the average return of the funds in its peer group, the Lipper Intermediate Investment Grade Debt Funds Classification.2 |
| n | | Strong results among intermediate grade bonds and issues backed by commercial mortgages drove performance. Results were also strong among high-yield issues, a category that is not in the benchmark. |
Portfolio Management
Carl W. Pappo, lead manager for the fund, has co-managed the fund since March 2005 and has been associated with the fund’s adviser or the fund’s previous adviser or its predecessors since 1993.
Alexander D. Powers has co-managed the fund since May 2010 and has been associated with the fund’s adviser or the fund’s previous adviser or its predecessors since 1996.
Brian Lavin has co-managed the fund since May 2010 and has been associated with the fund’s adviser or the fund’s previous adviser or its predecessors since 1994.
Michael Zazzarino has co-managed the fund since May 2010 and has been associated with the fund’s adviser or the fund’s previous adviser or its predecessors since 2005.
| 1 | The Barclays Capital Aggregate Bond Index is a market value-weighted index that tracks the daily price, coupon, pay-downs and total return performance of fixed-rate, publicly placed, dollar denominated and non-convertible investment grade debt issues with a least $250 million par amount outstanding and with at least one year to final maturity. |
| 2 | Lipper Inc., a widely respected data provider in the industry, calculates an average total return (assuming reinvestment of distributions) for mutual funds with investment objectives similar to those of the fund. Lipper makes no adjustment for the effect of sales loads. |
Indices are not available for investment, are not professionally managed and do not reflect sales charges, fees, brokerage commissions, taxes or other expenses of investing. Securities in the fund may not match those in an index.
Performance data quoted represents past performance and current performance may be lower or higher. Past performance is no guarantee of future results. The investment return and principal value will fluctuate so that shares, when redeemed, may be worth more or less than the original cost. Please visit www.columbiamanagement.com for daily and most recent month-end performance updates.
Summary
1-year return as of 03/31/11
| | |
| |
 | | +5.80% Class A shares
(without sales charge) |
| |
| | +5.12% Barclays Capital Aggregate Bond Index |
1
Economic Update – Columbia Intermediate Bond Fund
Summary
For the 12-month period that ended March 31, 2011
| | n | | Strengthening economic growth and rising interest rates kept a lid on most bond market sectors. The Barclays Capital Aggregate Bond Index delivered modest results. However, high-yield bonds were strong performers, as measured by the JPMorgan Developed BB High Yield Index. | |
| | |
| Barclays Aggregate Index | | JPMorgan Index |
| |

| |
|
5.12% | | 13.04% |
| | n | | The U.S. stock market, as measured by the S&P 500 Index, delivered solid returns, despite a summer 2010 correction. Foreign stock market returns were also positive, as measured by the MSCI EAFE Index (Net). | |
| | |
| S&P Index | | MSCI Index |
| |
| |
|
15.65% | | 10.42% |
The U.S. economy continued to expand at a solid but uneven pace over the past 12 months, as measured by gross domestic product (GDP). Although lackluster second quarter 2010 GDP growth raised fears that the economy was losing steam and might lapse back into recession, the pace picked up in the third quarter of 2010, inspiring confidence among consumers, businesses and investors. GDP expanded by 2.6% in the third quarter and 3.1% in the fourth quarter. With the Federal Reserve Board (the Fed) providing additional monetary stimulus to shore up economic growth and the extension of key tax cuts for the next two years, expectations are for continued growth in 2011. However, early estimates of first quarter 2011 growth place it just under 2.0%, a disappointment after two strong quarters and a pick-up in employment.
Consumer spending on cars, clothing and other goods generally trended higher during the 12-month period, accelerating in the fourth quarter. Holiday spending rose 5.5% between November 5, 2010 and December 24, 2010, in all retail categories, excluding automobiles, compared with the same period in 2009, according to MasterCard Advisors’ SpendingPulse, which tracks spending on all transactions including cash. Personal income surged in January 2011 as payroll tax cuts kicked in. The personal savings rate edged higher, ending February 2011, the last month for which data was available, at 5.8%.
News on the job front was increasingly positive. A good portion of the jobs added in March, April and May of 2010 were temporary, government-sponsored census positions, which began to unwind in June, July and August of 2010. However, private sector payroll employment began to trend higher in the third quarter, massive layoffs declined and job growth turned solidly positive, with the addition of 444,000 new jobs in the first quarter of 2011.
Despite some glimmers of improvement early in 2010, the housing market remained troublesome throughout the period. Both new and existing home sales fell after a federal tax credit for new and repeat homebuyers expired. Distressed properties pressured prices and foreclosures continued — another drag on prices. The inventory of unsold homes ended the period higher than it started, at 8.9 and 8.6 months for both new and existing homes, respectively, according to the National Association of Realtors and a joint release from the U.S. Census Bureau and the U.S. Department of Housing and Urban Development. The new year brought more disappointing news: Existing home sales fell in January 2011 after three months of sustained improvement. Tight credit and weak appraisals were cited as possible reasons for the decline.
Reports from the business side of the economy were generally positive. A key measure of the nation’s manufacturing situation — the Institute for Supply Management’s Index — took a somewhat surprising turn higher in the final months of the period. Technology spending rose 12% in 2010, according to the NPD Group, a national marketing research firm. Purchases of computers, networking and software returned to prerecession levels. Industrial production rose over the period, and manufacturing capacity utilized, per the report issued by the Fed — a key measure of the health of the manufacturing sector — also edged higher.
2
Economic Update (continued) – Columbia Intermediate Bond Fund
Bonds delivered modest returns
As the economy strengthened and interest rates edged higher, most bond sectors delivered modest returns. The Barclays Capital Aggregate Bond Index1 returned 5.12%. High-yield bonds led the fixed-income markets. For the 12 months covered by this report, the JPMorgan Developed BB High Yield Index2 returned 13.04% as default fears abated and investors grew more comfortable with risk. Despite rising yields in the second half of the period, the Treasury market was also positive. The Barclays Capital U.S. Treasury Index3 returned 4.53%. However, municipal bonds struggled in the second half of the period, as interest rates inched higher and issue supply surged ahead of the year-end expiration of the Build America Bonds program. The Barclays Capital Municipal Bond Index4 gained 1.63% for the period. Despite positive economic activity, the Fed kept a key short-term interest rate — the federal funds rate — close to zero, reflecting ongoing concerns about employment and the housing market.
Stocks moved higher despite summer 2010 decline
Against a strengthening economic backdrop, stock prices continued to rally despite a summer 2010 setback linked to a debt crisis brewing in Europe, which raised concerns among U.S. investors. These fears were short-lived and stocks regained their footing. In this environment, the S&P 500 Index5 returned 15.65% for the 12 months through March 31, 2011. Outside the United States, stock markets also delivered solid gains. The MSCI EAFE Index (Net),6 a broad gauge of stock market performance in foreign developed markets, returned 10.42% (in U.S. dollars) for the 12-month period, as concerns about the impact of a bailout for weak euro zone economies eased yet continued to restrain market performance. Emerging stock markets were strong. The MSCI Emerging Markets Index (Net)7 returned 18.46% (in U.S. dollars) for the 12-month period.
Past performance is no guarantee of future results.
| 1 | The Barclays Capital Aggregate Bond Index is a market value-weighted index that tracks the daily price, coupon, pay-downs and total return performance of fixed-rate, publicly placed, dollar-denominated and non-convertible investment grade debt issues with at least $250 million par amount outstanding and with at least one year to final maturity. |
| 2 | The JPMorgan Developed BB High Yield Index is an unmanaged index designed to mirror the investable universe of the U.S. dollar developed, BB-rated, high yield corporate debt market. |
| 3 | The Barclays Capital U.S. Treasury Index includes public obligations of the U.S. Treasury. Treasury bills are excluded by the maturity constraint. In addition, certain special issues, such as state and local government series bonds (SLGs), as well as U.S. Treasury TIPS, are excluded. STRIPS are excluded from the index because their inclusion would result in double-counting. |
| 4 | The Barclays Capital Municipal Bond Index is considered representative of the broad market for investment-grade, tax-exempt bonds with a maturity of at least one year |
| 5 | The Standard & Poor’s (S&P) 500 Index tracks the performance of 500 widely held, large-capitalization U.S. stocks. |
| 6 | The Morgan Stanley Capital International Europe, Australasia, Far East (MSCI EAFE) Index (Net) is a free float-adjusted market capitalization index that is designed to measure the equity market performance of developed markets, excluding the U.S. & Canada. As of December 31, 2010, the MSCI EAFE Index (Net) consisted of the following 22 developed market country indices: Australia, Austria, Belgium, Denmark, Finland, France, Germany, Greece, Hong Kong, Ireland, Israel, Italy, Japan, the Netherlands, New Zealand, Norway, Portugal, Singapore, Spain, Sweden, Switzerland and the United Kingdom. |
| 7 | The Morgan Stanley Capital International Emerging Markets (MSCI EM) Index (Net) is a free float-adjusted market capitalization index that is designed to measure equity market performance of emerging markets. As of December 31, 2010, the MSCI EM Index (Net) consisted of the following 21 emerging market country indices: Brazil, Chile, China, Colombia, Czech Republic, Egypt, Hungary, India, Indonesia, Korea, Malaysia, Mexico, Morocco, Peru, Philippines, Poland, Russia, South Africa, Taiwan, Thailand and Turkey. |
Indices are not available for investment, are not professionally managed and do not reflect sales charges, fees, brokerage commissions, taxes or other expenses of investing. Securities in the fund may not match those in an index.
3
Performance Information – Columbia Intermediate Bond Fund
Performance data quoted represents past performance and current performance may be lower or higher. Past performance is no guarantee of future results. The investment return and principal value will fluctuate so that shares, when redeemed, may be worth more or less than the original cost. Please visit www.columbiamanagement.com for daily and most recent month-end performance updates.
| | | | |
| Net asset value per share | | | |
| |
as of 03/31/11 ($) | | | | |
Class A | | | 9.08 | |
Class B | | | 9.08 | |
Class C | | | 9.08 | |
Class I | | | 9.08 | |
Class R | | | 9.08 | |
Class W | | | 9.08 | |
Class Z | | | 9.08 | |
| | | | |
| Distributions declared per share | |
| |
04/01/10 – 03/31/11 ($) | | | | |
Class A | | | 0.38 | |
Class B | | | 0.32 | |
Class C | | | 0.33 | |
Class I | | | 0.21 | |
Class R | | | 0.36 | |
Class W | | | 0.19 | |
Class Z | | | 0.41 | |
|
| Performance of a $10,000 investment 04/01/01 – 03/31/11 |
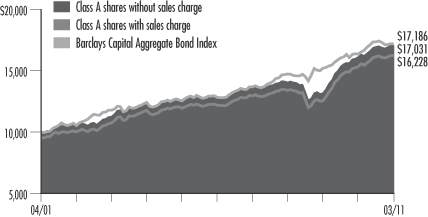
The chart above shows the change in value of a hypothetical $10,000 investment in Class A shares of Columbia Intermediate Bond Fund during the stated time period, and does not reflect the deduction of taxes that a shareholder may pay on fund distributions or on the redemption of fund shares.
| | | | | | | | |
| Performance of a $10,000 investment 04/01/01 – 03/31/11 ($) | |
| | |
| Sales charge | | without | | | with | |
Class A | | | 17,031 | | | | 16,228 | |
Class B | | | 15,909 | | | | 15,909 | |
Class C | | | 16,125 | | | | 16,125 | |
Class I | | | n/a | | | | n/a | |
Class R | | | 16,812 | | | | n/a | |
Class W | | | n/a | | | | n/a | |
Class Z | | | 17,481 | | | | n/a | |
| | | | | | | | | | | | | | | | | | | | | | | | | | | | | | | | | | | | | | | | |
| Average annual total return as of 3/31/11 (%) | | | | | | | | | | |
| | | | | | | |
| Share class | | A | | | B | | | C | | | I | | | R | | | W | | | Z | |
| Inception | | 07/31/00 | | | 02/01/02 | | | 02/01/02 | | | 09/27/10 | | | 01/23/06 | | | 09/27/10 | | | 12/05/78 | |
| Sales charge | | without | | | with | | | without | | | with | | | without | | | with | | | without | | | without | | | without | | | without | |
1-year | | | 5.80 | | | | 2.37 | | | | 5.03 | | | | 2.03 | | | | 5.17 | | | | 4.17 | | | | n/a | | | | 5.54 | | | | n/a | | | | 6.07 | |
5-year | | | 5.90 | | | | 5.21 | | | | 5.12 | | | | 5.12 | | | | 5.27 | | | | 5.27 | | | | n/a | | | | 5.64 | | | | n/a | | | | 6.17 | |
10-year/Life | | | 5.47 | | | | 4.96 | | | | 4.75 | | | | 4.75 | | | | 4.89 | | | | 4.89 | | | | 0.87 | | | | 5.33 | | | | 0.69 | | | | 5.74 | |
The “with sales charge” returns include the maximum initial sales charge of 3.25% for Class A shares and, the applicable contingent deferred sales charge of 3.00% in the first year, declining to 1.00% in the fourth year and eliminated thereafter for Class B shares and 1.00% for Class C shares for the first year only. The “without sales charge” returns do not include the effect of sales charges. If they had, returns would be lower. Prior to August 22, 2005, new purchases of Class A shares had a maximum initial sales charge of 4.75%. The 5 & 10 year average annual returns with sales charge as of 03/31/10 include the previous sales charge of 4.75%.
4
Performance Information (continued) – Columbia Intermediate Bond Fund
Performance results reflect any fee waivers or reimbursements of fund expenses by the investment advisor and/or any of its affiliates. Absent these fee waivers or expense reimbursement arrangements, performance results would have been lower.
All results shown assume reinvestment of distributions. Class I and Class Z shares are sold at net asset value with no distribution and service (Rule 12b-1) fees. Class R shares are sold at net asset value with a distribution (12b-1) fee. Class W shares are sold at net asset value with a service (Rule 12b-1) fee. Class R, Class I, Class W and Class Z shares have limited eligibility and the investment minimum requirements may vary. Please see the fund’s prospectuses for details. Performance for different share classes will vary based on differences in sales charges and fees associated with each class.
The tables do not reflect the deduction of taxes that a shareholder may pay on fund distributions or on the redemption of fund shares.
Class B, Class C and Class R shares performance information includes returns of Class A shares. These returns shown for these share classes reflect any differences in sales charges, but have not been restated to reflect any differences in expenses, such as distribution and service (Rule 12b-1) fees, between Class A and the corresponding newer share classes. If differences in expenses had been reflected, the returns shown for periods prior to the inception of the newer classes of shares would have been lower. Class B and Class C shares were initially offered on February 1, 2002; Class R shares were initially offered on January 23, 2006.
Class I and Class W shares were initially offered by the fund on September 27, 2010.
5
Understanding Your Expenses – Columbia Intermediate Bond Fund
Estimating your actual expenses
To estimate the expenses that you paid over the period, first you will need your account balance at the end of the period:
| | n | | For shareholders who receive their account statements from Columbia Management Investment Services Corp., your account balance is available online at www.columbiamanagement.com or by calling Shareholder Services at 800.345.6611. | |
| | n | | For shareholders who receive their account statements from their financial intermediary, contact your financial intermediary to obtain your account balance. | |
| | 1. | Divide your ending account balance by $1,000. For example, if an account balance was $8,600 at the end of the period, the result would be 8.6. | |
| | 2. | In the section of the table below titled “Expenses paid during the period,” locate the amount for your share class. You will find this number in the column labeled “Actual.” Multiply this number by the result from step 1. Your answer is an estimate of the expenses you paid on your account during the period. | |
If the value of your account falls below the minimum initial investment requirement applicable to you, your account may be subject to a $20 annual fee. This fee is not included in the accompanying table. If you are subject to the fee, keep it in mind when you are estimating the ongoing expenses of investing in the fund and when comparing the expenses of this fund with other funds.
As a fund shareholder, you incur two types of costs. There are transaction costs, which
generally include sales charges on purchases and may include redemption fees or exchange fees. There are also ongoing costs, which generally include investment advisory fees, distribution and service (Rule 12b-1) fees and other fund expenses. The information on this page is intended to help you understand the ongoing costs of investing in the fund and to compare these costs with the ongoing costs of investing in other mutual funds.
Analyzing your fund’s expenses by share class
To illustrate these ongoing costs, we have provided an example and calculated the expenses paid by investors in each share class during the period. The information in the following table is based on an initial investment of $1,000, which is invested at the beginning of the period and held for the entire period. Expense information is calculated two ways and each method provides you with different information. The amount listed in the “Actual” column is calculated using the fund’s actual operating expenses and total return for the period. The amount listed in the ��Hypothetical” column for each share class assumes that the return each year is 5% before expenses and is calculated based on the fund’s actual operating expenses. You should not use the hypothetical account values and expenses to estimate either your actual account balance at the end of the period or the expenses you paid during this period.
Compare with other funds
Since all mutual funds are required to include the same hypothetical calculations about expenses in shareholder reports, you can use this information to compare the ongoing costs of investing in the fund with other funds. To do so, compare the 5% hypothetical example with the 5% hypothetical examples that appear in the shareholder reports of other funds. As you compare hypothetical examples of other funds, it is important to note that hypothetical examples are meant to highlight the ongoing costs of investing in a fund and do not reflect any transaction costs, such as sales charges, redemption fees or exchange fees.
| | | | | | | | | | | | | | | | | | | | | | | | | | | | |
| 10/01/10 – 3/31/11 | | | | | | | | | | | | | | | | |
| | | | |
| | | Account value at the
beginning of the period ($) | | | Account value at the
end of the period ($) | | | Expenses paid
during the period ($) | | | Fund’s annualized
expense ratio (%) | |
| | | Actual | | | Hypothetical | | | Actual | | | Hypothetical | | | Actual | | | Hypothetical | | | Actual | |
Class A | | | 1,000.00 | | | | 1,000.00 | | | | 1,005.90 | | | | 1,020.29 | | | | 4.65 | | | | 4.68 | | | | 0.93 | |
Class B | | | 1,000.00 | | | | 1,000.00 | | | | 1,002.20 | | | | 1,016.55 | | | | 8.39 | | | | 8.45 | | | | 1.68 | |
Class C | | | 1,000.00 | | | | 1,000.00 | | | | 1,003.00 | | | | 1,017.30 | | | | 7.64 | | | | 7.70 | | | | 1.53 | |
Class I | | | 1,000.00 | | | | 1,000.00 | | | | 1,008.30 | | | | 1,022.34 | | | | 2.60 | | | | 2.62 | | | | 0.52 | |
Class R | | | 1,000.00 | | | | 1,000.00 | | | | 1,004.70 | | | | 1,019.10 | | | | 5.85 | | | | 5.89 | | | | 1.17 | |
Class W | | | 1,000.00 | | | | 1,000.00 | | | | 1,006.50 | | | | 1,020.29 | | | | 4.65 | | | | 4.68 | | | | 0.93 | |
Class Z | | | 1,000.00 | | | | 1,000.00 | | | | 1,007.20 | | | | 1,021.54 | | | | 3.40 | | | | 3.43 | | | | 0.68 | |
Expenses paid during the period are equal to the annualized expense ratio for the share class, multiplied by the average account value over the period, then multiplied by the number of days in the fund’s most recent fiscal half-year and divided by 365.
Had the Investment Manager and/or any of its affiliates not waived fees or reimbursed a portion of expenses, account value at the end of the period would have been reduced.
It is important to note that the expense amounts shown in the table are meant to highlight only ongoing costs of investing in the fund and do not reflect any transaction costs, such as sales charges, redemption fees or exchange fees. Therefore, the hypothetical examples provided may not help you determine the relative total costs of owning shares of different funds. If these transaction costs were included, your costs would have been higher.
6
Portfolio Managers’ Report – Columbia Intermediate Bond Fund
For the 12-month period that ended March 31, 2011, the fund’s Class A shares returned 5.80% without sales charge. The fund’s return surpassed the 5.12% return of its benchmark, the Barclays Capital Aggregate Bond Index, for the same period. The average return of funds in its peer group, the Lipper Intermediate Investment Grade Debt Funds Classification, was 6.14%.
Exposure to mid-grade and lower rated bonds boosted returns
Overall, the fund’s emphasis on investment-grade, high-yield and commercial mortgage-backed securities (CMBS) accounted for its slight performance advantage over the benchmark. The Federal Reserve Board’s (the Fed’s) highly accommodative monetary policies worked to expand liquidity in the economy, much of which found its way into riskier assets, such as stocks and corporate bonds. In general, non-Treasury segments of the bond market performed better than higher quality Treasury issues. Best results were generated by the intermediate and lower quality tiers, where the fund had strong representation. Improving conditions in the commercial real estate market helped results among commercial mortgage-backed securities (CMBS).
The fund’s holdings in euro zone bank bonds benefited as the financial underpinnings of many institutions strengthened and more conservative operating policies prevailed. In this regard, bonds of Barclay’s Bank and ING performed well. The fund was overweight relative to the benchmark in telecommunications, where AT&T’s and Verizon’s obligations rose due to improving business activity and low new-issue activity in the sector. Lower vacancies brightened the outlook for Brandywine Realty, a real estate investment trust, pushing its securities higher.
Approach to yield curve detracted
The fund’s positioning along the yield curve — a graphic depiction of Treasury yields, from short-term to long-term — detracted modestly from performance. The portfolio has more exposure than its benchmark to bonds in the 10- to 30-year range and less exposure to bonds maturing in five years or less. As rates fell during the period, prices rose more among shorter-maturity bonds, where the fund’s exposure was lower than the benchmark, and less among bonds in the 10- to 30-year range, where the portfolio had more exposure than the benchmark.
Positioned for continued favorable environment
Core inflation, which does not take into account food and energy prices, remains benign. Wages and salaries are relatively stable, so there is little upward pressure on prices in the current environment. The global economic outlook looks positive overall, and the recent restructuring of banks should help them maintain momentum. Against that backdrop, the Fed’s goal is to keep interest rates relatively low in the five-to-seven year range, that portion of the yield curve that tends to influence mortgage rates. This policy has aided non-Treasury segments of the bond market, and we expect that policy to persist. As a result, we have made few changes to portfolio positioning for the period ahead. However, we will begin to rethink positioning once the Fed begins to shift its policies and rates move higher, a point that, in our opinion, is still six to 12 months away.
Performance data quoted represents past performance and current performance may be lower or higher. Past performance is no guarantee of future results. The investment return and principal value will fluctuate so that shares, when redeemed, may be worth more or less than the original cost. Please visit www.columbiamanagement.com for daily and most recent month-end performance updates.
| | | | |
| Portfolio structure as of | | | |
| |
03/31/11 (%) | | | | |
Corporate Fixed-Income Bonds & Notes | | | 44.2 | |
Commercial Mortgage-Backed Securities | | | 18.6 | |
Government & Agency Obligations | | | 15.7 | |
Mortgage-Backed Securities | | | 15.1 | |
Asset-Backed Securities | | | 4.0 | |
Municipal Bonds | | | 2.4 | �� |
Preferred Stocks | | | 1.0 | |
Collateralized Mortgage Obligations | | | 0.4 | |
Common Stocks | | | 0.0 | * |
Warrants | | | 0.0 | * |
Short-Term Obligation | | | 0.0 | * |
Other Assets & Liabilities, Net | | | -1.4 | |
| | * | Rounds to less than 0.1% of net assets. |
| | | | |
| Maturity breakdown as of | | | |
| |
03/31/11 (%) | | | | |
0 - 1 year | | | 1.6 | |
1 - 2 year | | | 5.5 | |
2 - 3 years | | | 6.5 | |
3 - 4 years | | | 10.1 | |
4 - 5 years | | | 17.2 | |
5 - 6 years | | | 7.2 | |
6 - 7 years | | | 8.7 | |
7 - 8 years | | | 3.5 | |
8 - 9 years | | | 5.7 | |
9 - 10 years | | | 9.3 | |
10 - 20 years | | | 7.1 | |
20 - 30 years | | | 16.1 | |
30 years and over | | | 1.5 | |
7
Portfolio Managers’ Report (continued) – Columbia Intermediate Bond Fund
| | | | |
| Quality breakdown as of | | | |
| |
03/31/11 (%) | | | | |
Treasury | | | 13.6 | |
Agency | | | 15.4 | |
AAA | | | 21.3 | |
AA | | | 8.8 | |
A | | | 14.4 | |
BBB | | | 20.7 | |
BB | | | 2.7 | |
B | | | 2.4 | |
CCC and Below | | | 0.4 | |
Non-Rated | | | 0.3 | |
Portfolio structure is calculated as a percentage of net assets.
Quality and maturity breakdowns are calculated as a percentage of total investments.
Ratings shown in the quality breakdown are assigned to individual bonds by taking the lower of the ratings available from one of the following nationally recognized rating agencies: Standard & Poor’s or Moody’s Investor Services. If a security is rated by only one of the two agencies, that rating is used. If a security is not rated by either of the two agencies, it is designated as Non-Rated. Ratings are relative and subjective and are not absolute standards of quality. The credit quality of the fund’s investments does not remove market risk.
The fund is actively managed and the composition of its portfolio will change over time.
| | | | |
| 30-day SEC yields | |
| |
as of 03/31/11 (%) | | | | |
Class A | | | 3.76 | |
Class B | | | 3.26 | |
Class C | | | 3.35 | |
Class I | | | 4.23 | |
Class R | | | 3.70 | |
Class W | | | 4.03 | |
Class Z | | | 4.16 | |
The 30-day SEC yields reflect the portfolio’s earning power net of expenses, expressed as an annualized percentage of the public offering price at the end of the period. Had the Investment Manager and/or any of its affiliates not waived fees or reimbursed a portion of expenses, the 30-day SEC yields would have been lower.
Portfolio characteristics and holdings are subject to change periodically and may not be representative of current characteristics and holdings. The outlook for the fund may differ from that presented for other Columbia Funds.
Investing in fixed-income securities may involve certain risks, including the credit quality of individual issuers, possible prepayments, market or economic developments and yields and share price fluctuations due to changes in interest rates. When interest rates go up, bond prices typically drop, and vice versa.
Investments in high-yield bonds (sometimes referred to as “junk” bonds) offer the potential for high current income and attractive total return, but involve certain risks. Changes in economic conditions or other circumstances may adversely affect a high-yield bond issuer’s ability to make principal and interest payments.
8
Investment Portfolio – Columbia Intermediate Bond Fund
March 31, 2011
Corporate Fixed-Income Bonds & Notes – 44.2%
| | | | | | | | |
| | | Par ($) | | | Value ($) | |
| Basic Materials – 2.5% | | | | | | | | |
| Chemicals – 0.7% | | | | | | | | |
| Ashland, Inc. | | | | | | | | |
9.125% 06/01/17 | | | 675,000 | | | | 774,563 | |
| |
| CF Industries, Inc. | | | | | |
6.875% 05/01/18 | | | 1,065,000 | | | | 1,192,800 | |
7.125% 05/01/20 | | | 73,000 | | | | 82,673 | |
| |
| Chemtura Corp. | | | | | |
7.875% 09/01/18 (a) | | | 6,000 | | | | 6,345 | |
| |
| Dow Chemical Co. | | | | | |
4.250% 11/15/20 | | | 6,030,000 | | | | 5,758,849 | |
5.900% 02/15/15 | | | 4,365,000 | | | | 4,837,987 | |
8.550% 05/15/19 | | | 323,000 | | | | 408,286 | |
9.400% 05/15/39 | | | 125,000 | | | | 185,608 | |
|
Hexion U.S. Finance Corp./Hexion Nova
Scotia Finance ULC | |
8.875% 02/01/18 | | | 866,000 | | | | 915,795 | |
9.000% 11/15/20 (a) | | | 285,000 | | | | 295,509 | |
| |
| Koppers, Inc. | | | | | |
7.875% 12/01/19 | | | 105,000 | | | | 113,925 | |
| |
| Lubrizol Corp. | | | | | |
8.875% 02/01/19 | | | 2,880,000 | | | | 3,701,508 | |
| |
| Lyondell Chemical Co. | | | | | |
8.000% 11/01/17 (a) | | | 1,334,000 | | | | 1,474,070 | |
| |
| MacDermid, Inc. | | | | | |
9.500% 04/15/17 (a) | | | 594,000 | | | | 630,383 | |
| |
| Momentive Performance Materials, Inc. | | | | | |
9.000% 01/15/21 (a) | | | 296,000 | | | | 305,990 | |
| |
| Nalco Co. | | | | | |
6.625% 01/15/19 (a) | | | 608,000 | | | | 625,480 | |
| |
| NOVA Chemicals Corp. | | | | | |
8.375% 11/01/16 | | | 350,000 | | | | 384,125 | |
8.625% 11/01/19 | | | 395,000 | | | | 441,906 | |
| |
| Rain CII Carbon LLC & CII Carbon Corp. | | | | | |
8.000% 12/01/18 (a) | | | 545,000 | | | | 581,788 | |
| | | | | | | | |
Chemicals Total | | | | | | | 22,717,590 | |
| | |
| Forest Products & Paper – 0.9% | | | | | | | | |
| Cascades, Inc. | | | | | |
7.750% 12/15/17 | | | 658,000 | | | | 695,013 | |
| |
| Georgia-Pacific LLC | | | | | |
8.250% 05/01/16 (a) | | | 23,337,000 | | | | 26,312,467 | |
| |
| Verso Paper Holdings LLC/Verso Paper, Inc. | | | | | |
8.750% 02/01/19 (a) | | | 309,000 | | | | 321,360 | |
| | | | | | | | |
Forest Products & Paper Total | | | | | | | 27,328,840 | |
| | | | | | | | |
| | | Par ($) | | | Value ($) | |
| Iron/Steel – 0.8% | | | | | | | | |
| ArcelorMittal | | | | | |
6.750% 03/01/41 | | | 10,579,000 | | | | 10,367,854 | |
7.000% 10/15/39 | | | 6,317,000 | | | | 6,333,904 | |
| |
| JMC Steel Group | | | | | |
8.250% 03/15/18 (a) | | | 161,000 | | | | 164,623 | |
| |
| Nucor Corp. | | | | | |
5.000% 06/01/13 | | | 645,000 | | | | 693,859 | |
5.850% 06/01/18 | | | 4,955,000 | | | | 5,649,057 | |
| |
| United States Steel Corp. | | | | | |
7.000% 02/01/18 | | | 890,000 | | | | 924,487 | |
7.375% 04/01/20 | | | 194,000 | | | | 203,215 | |
| | | | | | | | |
Iron/Steel Total | | | | | | | 24,336,999 | |
| | |
| Metals & Mining – 0.1% | | | | | | | | |
| FMG Resources August 2006 Pty Ltd. | | | | | |
6.875% 02/01/18 (a) | | | 161,000 | | | | 167,843 | |
7.000% 11/01/15 (a) | | | 985,000 | | | | 1,016,065 | |
| |
| Freeport-McMoRan Copper & Gold, Inc. | | | | | |
8.375% 04/01/17 | | | 585,000 | | | | 644,962 | |
| |
| Novelis, Inc. | | | | | |
8.375% 12/15/17 (a) | | | 337,000 | | | | 364,802 | |
8.750% 12/15/20 (a) | | | 330,000 | | | | 363,000 | |
| | | | | | | | |
Metals & Mining Total | | | | | | | 2,556,672 | |
| | | | | | | | |
Basic Materials Total | | | | | | | 76,940,101 | |
| | | | | | | | |
| Communications – 4.8% | | | | | | | | |
| Advertising – 0.1% | | | | | | | | |
| Interpublic Group of Companies, Inc. | | | | | |
10.000% 07/15/17 | | | 1,010,000 | | | | 1,201,900 | |
| |
| inVentiv Health, Inc. | | | | | |
10.000% 08/15/18 (a) | | | 877,000 | | | | 912,080 | |
| |
| Visant Corp. | | | | | |
10.000% 10/01/17 | | | 302,000 | | | | 326,160 | |
| | | | | | | | |
Advertising Total | | | | | | | 2,440,140 | |
| | |
| Media – 2.2% | | | | | | | | |
| Belo Corp. | | | | | |
8.000% 11/15/16 | | | 450,000 | | | | 490,500 | |
|
| CCO Holdings LLC/CCO Holdings Capital Corp. | |
7.000% 01/15/19 | | | 915,000 | | | | 937,875 | |
8.125% 04/30/20 | | | 443,000 | | | | 481,763 | |
|
| Cequel Communications Holdings I LLC & Cequel Capital Corp. | |
8.625% 11/15/17 (a) | | | 945,000 | | | | 985,162 | |
|
| Clear Channel Communications, Inc. | |
9.000% 03/01/21 (a) | | | 943,000 | | | | 940,642 | |
See Accompanying Notes to Financial Statements.
9
Columbia Intermediate Bond Fund
March 31, 2011
Corporate Fixed-Income Bonds & Notes (continued)
| | | | | | | | |
| | | Par ($) | | | Value ($) | |
| Communications (continued) | |
| Clear Channel Worldwide Holdings, Inc. | |
9.250% 12/15/17 | | | 1,005,000 | | | | 1,101,731 | |
|
| CMP Susquehanna Corp. | |
3.312% 05/15/14 (05/09/11) (b)(c)(d) | | | 65,000 | | | | 38,350 | |
|
| Comcast Cable Holdings LLC | |
9.875% 06/15/22 | | | 2,089,000 | | | | 2,747,785 | |
|
| Comcast Corp. | |
6.950% 08/15/37 | | | 4,094,000 | | | | 4,457,072 | |
|
| DirecTV Holdings LLC | |
3.125% 02/15/16 | | | 11,255,000 | | | | 11,091,780 | |
6.375% 06/15/15 | | | 1,675,000 | | | | 1,731,531 | |
|
| DISH DBS Corp. | |
7.875% 09/01/19 | | | 925,000 | | | | 1,001,312 | |
|
| Entravision Communications Corp. | |
8.750% 08/01/17 | | | 870,000 | | | | 926,550 | |
|
| Gray Television, Inc. | |
10.500% 06/29/15 | | | 694,000 | | | | 738,243 | |
|
| Insight Communications Co., Inc. | |
9.375% 07/15/18 (a) | | | 400,000 | | | | 444,000 | |
|
Kabel BW Erste Beteiligungs GmbH/Kabel
Baden-Wurttemberg GmbH & Co. KG | |
7.500% 03/15/19 (a) | | | 220,000 | | | | 225,413 | |
|
| NBC Universal Media, LLC. | |
5.950% 04/01/41 (a) | | | 6,035,000 | | | | 5,783,141 | |
|
| NBC Universal, Inc. | |
2.875% 04/01/16 (a) | | | 4,215,000 | | | | 4,117,663 | |
|
| News America, Inc. | |
6.150% 02/15/41 (a) | | | 8,030,000 | | | | 7,962,901 | |
6.400% 12/15/35 | | | 4,195,000 | | | | 4,316,022 | |
6.550% 03/15/33 | | | 530,000 | | | | 556,647 | |
|
| Salem Communications Corp. | |
9.625% 12/15/16 | | | 431,000 | | | | 465,480 | |
|
| Sinclair Television Group, Inc. | |
9.250% 11/01/17 (a) | | | 656,000 | | | | 731,440 | |
|
| Sirius XM Radio, Inc. | |
8.750% 04/01/15 (a) | | | 635,000 | | | | 714,375 | |
|
| Time Warner Cable, Inc. | |
5.850% 05/01/17 | | | 2,335,000 | | | | 2,553,787 | |
5.875% 11/15/40 | | | 7,955,000 | | | | 7,474,908 | |
7.300% 07/01/38 | | | 2,720,000 | | | | 3,011,451 | |
| | | | | | | | |
| | | Par ($) | | | Value ($) | |
| Univision Communications, Inc. | |
7.875% 11/01/20 (a) | | | 272,000 | | | | 288,320 | |
8.500% 05/15/21 (a) | | | 893,000 | | | | 922,023 | |
|
| XM Satellite Radio, Inc. | |
7.625% 11/01/18 (a) | | | 498,000 | | | | 525,390 | |
| | | | | | | | |
Media Total | | | | | | | 67,763,257 | |
|
| Telecommunication Services – 2.5% | |
| AT&T, Inc. | |
6.550% 02/15/39 | | | 15,115,000 | | | | 15,753,427 | |
|
| Avaya, Inc. | |
7.000% 04/01/19 (a) | | | 375,000 | | | | 365,625 | |
9.750% 11/01/15 | | | 176,000 | | | | 178,860 | |
|
| BellSouth Corp. | |
5.200% 09/15/14 | | | 305,000 | | | | 333,479 | |
|
| British Telecommunications PLC | |
5.150% 01/15/13 | | | 605,000 | | | | 643,637 | |
5.950% 01/15/18 | | | 2,865,000 | | | | 3,160,705 | |
|
| Cincinnati Bell, Inc. | |
8.250% 10/15/17 | | | 699,000 | | | | 704,242 | |
8.375% 10/15/20 | | | 278,000 | | | | 273,135 | |
|
| Clearwire Communications LLC/Clearwire Finance, Inc. | |
12.000% 12/01/15 (a) | | | 83,000 | | | | 89,640 | |
12.000% 12/01/17 (a) | | | 492,000 | | | | 525,825 | |
|
| CommScope, Inc. | |
8.250% 01/15/19 (a) | | | 392,000 | | | | 409,640 | |
|
| Frontier Communications Corp. | |
8.500% 04/15/20 | | | 829,000 | | | | 898,429 | |
|
| Integra Telecom Holdings, Inc. | |
10.750% 04/15/16 (a) | | | 341,000 | | | | 369,985 | |
| | |
| Intelsat Jackson Holdings SA | | | | | | | | |
7.250% 04/01/19 (a)(e) | | | 380,000 | | | | 380,475 | |
7.250% 10/15/20 (a) | | | 525,000 | | | | 525,656 | |
| | |
| ITC Deltacom, Inc. | | | | | | | | |
10.500% 04/01/16 | | | 265,000 | | | | 292,163 | |
| | |
| Level 3 Financing, Inc. | | | | | | | | |
8.750% 02/15/17 | | | 832,000 | | | | 825,760 | |
9.250% 11/01/14 | | | 335,000 | | | | 342,538 | |
9.375% 04/01/19 (a) | | | 205,000 | | | | 198,338 | |
| | |
| MetroPCS Wireless, Inc. | | | | | | | | |
7.875% 09/01/18 | | | 945,000 | | | | 1,011,150 | |
| |
| Nielsen Finance LLC/Nielsen Finance Co. | | | | | |
7.750% 10/15/18 (a) | | | 1,138,000 | | | | 1,220,505 | |
See Accompanying Notes to Financial Statements.
10
Columbia Intermediate Bond Fund
March 31, 2011
Corporate Fixed-Income Bonds & Notes (continued)
| | | | | | | | |
| | | Par ($) | | | Value ($) | |
| Communications (continued) | |
| NII Capital Corp. | | | | | |
7.625% 04/01/21 | | | 345,000 | | | | 352,763 | |
10.000% 08/15/16 | | | 512,000 | | | | 583,680 | |
| | |
| PAETEC Holding Corp. | | | | | | | | |
8.875% 06/30/17 | | | 757,000 | | | | 815,667 | |
9.875% 12/01/18 (a) | | | 428,000 | | | | 451,540 | |
| | |
| Quebecor Media, Inc. | | | | | | | | |
7.750% 03/15/16 | | | 697,000 | | | | 723,138 | |
| | |
| Qwest Corp. | | | | | | | | |
7.500% 10/01/14 | | | 272,000 | | | | 310,760 | |
7.500% 06/15/23 | | | 655,000 | | | | 656,637 | |
| | |
| SBA Telecommunications, Inc. | | | | | | | | |
8.250% 08/15/19 | | | 469,000 | | | | 518,245 | |
| | |
| Sprint Capital Corp. | | | | | | | | |
6.875% 11/15/28 | | | 345,000 | | | | 318,263 | |
| | |
| Sprint Nextel Corp. | | | | | | | | |
8.375% 08/15/17 | | | 1,144,000 | | | | 1,274,130 | |
| | |
| Telefonica Emisiones SAU | | | | | | | | |
5.134% 04/27/20 | | | 5,030,000 | | | | 5,004,639 | |
6.221% 07/03/17 | | | 2,375,000 | | | | 2,590,982 | |
6.421% 06/20/16 | | | 5,115,000 | | | | 5,683,778 | |
| | |
| Verizon Communications, Inc. | | | | | | | | |
3.000% 04/01/16 | | | 25,170,000 | | | | 25,041,759 | |
4.600% 04/01/21 | | | 1,800,000 | | | | 1,792,294 | |
| | |
| Virgin Media Finance PLC | | | | | | | | |
9.500% 08/15/16 | | | 445,000 | | | | 506,187 | |
| | |
| West Corp. | | | | | | | | |
7.875% 01/15/19 (a) | | | 665,000 | | | | 678,300 | |
| |
| Wind Acquisition Finance SA | | | | | |
7.250% 02/15/18 (a) | | | 390,000 | | | | 409,500 | |
11.750% 07/15/17 | | | 811,000 | | | | 932,650 | |
11.750% 07/15/17 (a)(d)(l) | | | 1,466,000 | | | | 2,932 | |
| |
| Windstream Corp. | | | | | |
7.750% 10/15/20 | | | 396,000 | | | | 406,890 | |
7.750% 10/15/20 (a) | | | 140,000 | | | | 143,850 | |
8.125% 09/01/18 | | | 378,000 | | | | 403,515 | |
| | | | | | | | |
Telecommunication Services Total | | | | 78,105,313 | |
| | | | | | | | |
Communications Total | | | | | | | 148,308,710 | |
| | | | | | | | |
| Consumer Cyclical – 1.9% | | | | | | | | |
| Airlines – 0.2% | | | | | | | | |
| Continental Airlines, Inc. | | | | | |
6.940% 10/15/13 | | | 334,100 | | | | 339,946 | |
| | | | | | | | |
| | | Par ($) | | | Value ($) | |
7.461% 04/01/15 | | | 4,902,335 | | | | 4,951,359 | |
| | | | | | | | |
Airlines Total | | | | | | | 5,291,305 | |
| | |
| Auto Parts & Equipment – 0.1% | | | | | | | | |
| Accuride Corp. | | | | | | | | |
9.500% 08/01/18 | | | 180,000 | | | | 200,250 | |
| |
| Dana Holding Corp. | | | | | |
6.500% 02/15/19 | | | 125,000 | | | | 124,062 | |
6.750% 02/15/21 | | | 822,000 | | | | 819,945 | |
| |
| Lear Corp. | | | | | |
7.875% 03/15/18 | | | 540,000 | | | | 588,600 | |
8.125% 03/15/20 | | | 115,000 | | | | 126,500 | |
| |
| Visteon Corp. | | | | | |
6.750% 04/15/19 (a) | | | 227,000 | | | | 227,000 | |
| | | | | | | | |
Auto Parts & Equipment Total | | | | | | | 2,086,357 | |
| | |
| Entertainment – 0.1% | | | | | | | | |
| AMC Entertainment, Inc. | | | | | | | | |
9.750% 12/01/20 (a) | | | 560,000 | | | | 599,200 | |
| |
| Boyd Gaming Corp. | | | | | |
9.125% 12/01/18 (a) | | | 710,000 | | | | 729,525 | |
| |
| Pinnacle Entertainment, Inc. | | | | | |
8.750% 05/15/20 | | | 122,000 | | | | 126,880 | |
| |
| Shingle Springs Tribal Gaming Authority | | | | | |
9.375% 06/15/15 (a) | | | 1,285,000 | | | | 848,100 | |
| | |
| Six Flags, Inc. | | | | | | | | |
9.625% 06/01/14 (a)(d)(f)(l) | | | 458,000 | | | | – | |
| | |
| Speedway Motorsports, Inc. | | | | | | | | |
6.750% 02/01/19 | | | 76,000 | | | | 76,570 | |
| | |
| Tunica-Biloxi Gaming Authority | | | | | | | | |
9.000% 11/15/15 (a) | | | 389,000 | | | | 385,110 | |
| | | | | | | | |
Entertainment Total | | | | | | | 2,765,385 | |
| | |
| Home Builders – 0.0% | | | | | | | | |
Beazer Homes USA, Inc. | | | | | | | | |
9.125% 06/15/18 | | | 378,000 | | | | 383,670 | |
| | |
| K Hovnanian Enterprises, Inc. | | | | | | | | |
10.625% 10/15/16 | | | 415,000 | | | | 440,938 | |
11.875% 10/15/15 | | | 430,000 | | | | 408,500 | |
| | | | | | | | |
Home Builders Total | | | | | | | 1,233,108 | |
| | |
| Home Furnishings – 0.0% | | | | | | | | |
| Norcraft Companies LP/Norcraft Finance Corp. | |
10.500% 12/15/15 | | | 255,000 | | | | 272,850 | |
| | | | | | | | |
Home Furnishings Total | | | | | | | 272,850 | |
| | |
| Housewares – 0.0% | | | | | | | | |
| Libbey Glass, Inc. | | | | | | | | |
10.000% 02/15/15 | | | 276,000 | | | | 300,840 | |
| | | | | | | | |
Housewares Total | | | | | | | 300,840 | |
See Accompanying Notes to Financial Statements.
11
Columbia Intermediate Bond Fund
March 31, 2011
Corporate Fixed-Income Bonds & Notes (continued)
| | | | | | | | |
| | | Par ($) | | | Value ($) | |
| Consumer Cyclical (continued) | |
| Lodging – 0.1% | | | | | |
| MGM Resorts International | | | | | | | | |
9.000% 03/15/20 | | | 83,000 | | | | 91,300 | |
11.375% 03/01/18 | | | 574,000 | | | | 637,140 | |
| | |
| Penn National Gaming, Inc. | | | | | | | | |
8.750% 08/15/19 | | | 208,000 | | | | 229,580 | |
| | |
| Pokagon Gaming Authority | | | | | | | | |
10.375% 06/15/14 (a) | | | 352,000 | | | | 364,320 | |
| | |
| Seminole Indian Tribe of Florida | | | | | | | | |
6.535% 10/01/20 (a) | | | 110,000 | | | | 108,095 | |
7.804% 10/01/20 (a) | | | 810,000 | | | | 800,863 | |
| | |
| Seneca Gaming Corp. | | | | | | | | |
8.250% 12/01/18 (a) | | | 463,000 | | | | 476,890 | |
| | | | | | | | |
Lodging Total | | | | | | | 2,708,188 | |
| | |
| Office Furnishings – 0.0% | | | | | | | | |
| Interface, Inc. | | | | | | | | |
7.625% 12/01/18 (a) | | | 148,000 | | | | 156,140 | |
| | | | | | | | |
Office Furnishings Total | | | | | | | 156,140 | |
| | |
| Retail – 1.4% | | | | | | | | |
| CVS Pass-Through Trust | | | | | | | | |
5.298% 01/11/27 (a) | | | 4,997,299 | | | | 5,049,655 | |
6.036% 12/10/28 | | | 4,616,389 | | | | 4,753,542 | |
8.353% 07/10/31 (a) | | | 9,863,832 | | | | 11,786,391 | |
| | |
| Limited Brands, Inc. | | | | | | | | |
6.625% 04/01/21 | | | 240,000 | | | | 245,400 | |
8.500% 06/15/19 | | | 181,000 | | | | 207,697 | |
| | |
| Macy’s Retail Holdings, Inc. | | | | | | | | |
5.350% 03/15/12 | | | 1,250,000 | | | | 1,287,500 | |
5.750% 07/15/14 | | | 13,445,000 | | | | 14,386,150 | |
| | |
| McDonald’s Corp. | | | | | | | | |
5.000% 02/01/19 | | | 1,000,000 | | | | 1,090,680 | |
5.700% 02/01/39 | | | 2,555,000 | | | | 2,710,347 | |
| | |
| Needle Merger Sub Corp. | | | | | | | | |
8.125% 03/15/19 (a) | | | 331,000 | | | | 334,310 | |
| | |
| QVC, Inc. | | | | | | | | |
7.125% 04/15/17 (a) | | | 85,000 | | | | 88,931 | |
7.375% 10/15/20 (a) | | | 167,000 | | | | 173,889 | |
7.500% 10/01/19 (a) | | | 290,000 | | | | 304,500 | |
| | |
| Rite Aid Corp. | | | | | | | | |
8.000% 08/15/20 | | | 275,000 | | | | 291,156 | |
| | |
| Toys R Us, Inc. | | | | | | | | |
7.375% 10/15/18 | | | 566,000 | | | | 567,415 | |
| | | | | | | | |
Retail Total | | | | | | | 43,277,563 | |
| | | | | | | | |
Consumer Cyclical Total | | | | 58,091,736 | |
| | | | | | | | |
| | | Par ($) | | | Value ($) | |
| Consumer Non-Cyclical – 2.6% | |
| Beverages – 0.6% | | | | | | | | |
| Anheuser-Busch InBev Worldwide, Inc. | | | | | |
7.200% 01/15/14 | | | 4,795,000 | | | | 5,447,441 | |
7.750% 01/15/19 | | | 2,445,000 | | | | 3,008,103 | |
8.000% 11/15/39 | | | 4,255,000 | | | | 5,687,510 | |
| |
| PepsiCo, Inc. | | | | | |
4.500% 01/15/20 | | | 3,445,000 | | | | 3,594,385 | |
| | | | | | | | |
Beverages Total | | | | | | | 17,737,439 | |
| | |
| Biotechnology – 0.0% | | | | | | | | |
| STHI Holding Corp. | | | | | | | | |
8.000% 03/15/18 (a) | | | 127,000 | | | | 131,445 | |
| | | | | | | | |
Biotechnology Total | | | | | | | 131,445 | |
| | |
| Commercial Services – 0.4% | | | | | | | | |
| Avis Budget Car Rental LLC/Avis Budget Finance, Inc. | |
8.250% 01/15/19 | | | 597,000 | | | | 625,357 | |
| | |
| Cardtronics, Inc. | | | | | | | | |
8.250% 09/01/18 | | | 575,000 | | | | 624,594 | |
| | |
| Garda World Security Corp. | | | | | | | | |
9.750% 03/15/17 (a) | | | 321,000 | | | | 345,878 | |
| | |
| Hertz Corp. | | | | | | | | |
6.750% 04/15/19 (a) | | | 240,000 | | | | 237,900 | |
7.375% 01/15/21 (a) | | | 299,000 | | | | 305,728 | |
7.500% 10/15/18 (a) | | | 570,000 | | | | 589,950 | |
| | |
| Interactive Data Corp. | | | | | | | | |
10.250% 08/01/18 (a) | | | 679,000 | | | | 762,177 | |
| | |
| Iron Mountain, Inc. | | | | | | | | |
8.000% 06/15/20 | | | 250,000 | | | | 265,000 | |
|
| President & Fellows of Harvard College | |
4.875% 10/15/40 | | | 5,690,000 | | | | 5,437,136 | |
6.500% 01/15/39 (a) | | | 1,895,000 | | | | 2,280,159 | |
|
| RSC Equipment Rental, Inc./RSC Holdings III LLC | |
8.250% 02/01/21 (a) | | | 275,000 | | | | 286,000 | |
10.000% 07/15/17 (a) | | | 88,000 | | | | 99,880 | |
|
| United Rentals North America, Inc. | |
8.375% 09/15/20 | | | 1,125,000 | | | | 1,175,625 | |
9.250% 12/15/19 | | | 86,000 | | | | 95,890 | |
10.875% 06/15/16 | | | 109,000 | | | | 125,895 | |
| | | | | | | | |
Commercial Services Total | | | | | | | 13,257,169 | |
| | |
| Food – 0.6% | | | | | | | | |
| ConAgra Foods, Inc. | | | | | | | | |
7.000% 10/01/28 | | | 7,960,000 | | | | 8,554,230 | |
| | |
| Dean Foods Co. | | | | | | | | |
7.000% 06/01/16 | | | 10,000 | | | | 9,538 | |
9.750% 12/15/18 (a) | | | 275,000 | | | | 282,219 | |
See Accompanying Notes to Financial Statements.
12
Columbia Intermediate Bond Fund
March 31, 2011
Corporate Fixed-Income Bonds & Notes (continued)
| | | | | | | | |
| | | Par ($) | | | Value ($) | |
| Consumer Non-Cyclical (continued) | |
| Hershey Co. | | | | | | | | |
4.125% 12/01/20 | | | 5,035,000 | | | | 5,044,773 | |
| | |
| Kraft Foods, Inc. | | | | | | | | |
6.500% 02/09/40 | | | 5,160,000 | | | | 5,474,386 | |
| | |
| Kroger Co. | | | | | | | | |
8.000% 09/15/29 | | | 820,000 | | | | 1,017,277 | |
| | | | | | | | |
Food Total | | | | | | | 20,382,423 | |
| | |
| Healthcare Products – 0.0% | | | | | | | | |
| Hanger Orthopedic Group, Inc. | |
7.125% 11/15/18 | | | 407,000 | | | | 415,140 | |
| | | | | | | | |
Healthcare Products Total | | | | | | | 415,140 | |
| | |
| Healthcare Services – 0.5% | | | | | | | | |
| American Renal Holdings Co., Inc. | | | | | | | | |
8.375% 05/15/18 | | | 120,000 | | | | 126,600 | |
PIK, | | | | | | | | |
9.750% 03/01/16 (a) | | | 80,000 | | | | 78,600 | |
| | |
| Capella Healthcare, Inc. | | | | | | | | |
9.250% 07/01/17 (a) | | | 95,000 | | | | 102,125 | |
| | |
| HCA, Inc. | | | | | | | | |
7.250% 09/15/20 | | | 1,604,000 | | | | 1,716,280 | |
7.875% 02/15/20 | | | 866,000 | | | | 941,775 | |
| | |
| Healthsouth Corp. | | | | | | | | |
7.750% 09/15/22 | | | 37,000 | | | | 38,480 | |
8.125% 02/15/20 | | | 390,000 | | | | 421,200 | |
| | |
| LifePoint Hospitals, Inc. | | | | | | | | |
6.625% 10/01/20 (a) | | | 237,000 | | | | 242,925 | |
| | |
| Multiplan, Inc. | | | | | | | | |
9.875% 09/01/18 (a) | | | 541,000 | | | | 581,575 | |
| | |
| Radiation Therapy Services, Inc. | | | | | | | | |
9.875% 04/15/17 | | | 350,000 | | | | 357,000 | |
| | |
| Radnet Management, Inc. | | | | | | | | |
10.375% 04/01/18 | | | 90,000 | | | | 91,013 | |
| | |
| Roche Holdings, Inc. | | | | | | | | |
6.000% 03/01/19 (a) | | | 4,245,000 | | | | 4,811,584 | |
| | |
| Tenet Healthcare Corp. | | | | | | | | |
8.875% 07/01/19 | | | 563,000 | | | | 641,820 | |
| | |
| UnitedHealth Group, Inc. | | | | | | | | |
6.000% 02/15/18 | | | 3,835,000 | | | | 4,265,440 | |
|
Vanguard Health Holding Co. II, LLC/Vanguard
Holding Co. II, Inc. | |
8.000% 02/01/18 | | | 489,000 | | | | 500,614 | |
8.000% 02/01/18 (a) | | | 571,000 | | | | 585,275 | |
| | | | | | | | |
Healthcare Services Total | | | | | | | 15,502,306 | |
| | | | | | | | |
| | | Par ($) | | | Value ($) | |
| Household Products/Wares – 0.1% | | | | | | | | |
| Central Garden & Pet Co. | | | | | | | | |
8.250% 03/01/18 | | | 225,000 | | | | 235,125 | |
|
| Reynolds Group Issuer, Inc./Reynolds Group Issuer LLC | |
6.875% 02/15/21 (a) | | | 253,000 | | | | 254,265 | |
7.125% 04/15/19 (a) | | | 293,000 | | | | 300,325 | |
7.750% 10/15/16 (a) | | | 383,000 | | | | 405,980 | |
8.250% 02/15/21 (a) | | | 374,000 | | | | 371,195 | |
9.000% 04/15/19 (a) | | | 287,000 | | | | 297,045 | |
| |
| Spectrum Brands Holdings, Inc. | | | | | |
9.500% 06/15/18 (a) | | | 836,000 | | | | 919,600 | |
| | | | | | | | |
Household Products/Wares Total | | | | 2,783,535 | |
| | |
| Pharmaceuticals – 0.4% | | | | | | | | |
| ConvaTec Healthcare E SA | | | | | | | | |
10.500% 12/15/18 (a) | | | 772,000 | | | | 810,600 | |
| | |
| Giant Funding Corp. | | | | | | | | |
8.250% 02/01/18 (a) | | | 584,000 | | | | 598,600 | |
| | |
| Mylan, Inc. | | | | | | | | |
6.000% 11/15/18 (a) | | | 525,000 | | | | 525,000 | |
| |
| Novartis Securities Investment Ltd. | | | | | |
5.125% 02/10/19 | | | 5,590,000 | | | | 6,051,164 | |
|
| Valeant Pharmaceuticals International | |
6.750% 10/01/17 (a) | | | 117,000 | | | | 115,245 | |
7.000% 10/01/20 (a) | | | 278,000 | | | | 269,660 | |
|
| Warner Chilcott Co., LLC/Warner Chilcott Finance LLC | |
7.750% 09/15/18 (a) | | | 784,000 | | | | 821,240 | |
|
| Wyeth | |
5.500% 02/01/14 | | | 1,000,000 | | | | 1,102,769 | |
5.500% 02/15/16 | | | 1,395,000 | | | | 1,560,978 | |
| | | | | | | | |
Pharmaceuticals Total | | | | 11,855,256 | |
| | | | | |
Consumer Non-Cyclical Total | | | | | | | 82,064,713 | |
| | | | | | | | |
| Energy – 5.3% | | | | | | | | |
| Coal – 0.0% | | | | | |
| Arch Coal, Inc. | |
7.250% 10/01/20 | | | 63,000 | | | | 67,489 | |
| |
| Consol Energy, Inc. | | | | | |
8.000% 04/01/17 | | | 110,000 | | | | 120,450 | |
8.250% 04/01/20 | | | 1,045,000 | | | | 1,158,644 | |
| | | | | | | | |
Coal Total | | | | 1,346,583 | |
| | |
| Oil & Gas – 2.8% | | | | | | | | |
| Anadarko Petroleum Corp. | | | | | | | | |
6.200% 03/15/40 | | | 4,135,000 | | | | 3,994,799 | |
6.375% 09/15/17 | | | 8,430,000 | | | | 9,282,883 | |
See Accompanying Notes to Financial Statements.
13
Columbia Intermediate Bond Fund
March 31, 2011
Corporate Fixed-Income Bonds & Notes – (continued)
| | | | | | | | |
| | | Par ($) | | | Value ($) | |
| Energy (continued) | | | | | | | | |
| Berry Petroleum Co. | | | | | | | | |
6.750% 11/01/20 | | | 180,000 | | | | 185,400 | |
8.250% 11/01/16 | | | 80,000 | | | | 84,600 | |
10.250% 06/01/14 | | | 85,000 | | | | 98,600 | |
| | |
| Brigham Exploration Co. | | | | | | | | |
8.750% 10/01/18 (a) | | | 430,000 | | | | 479,450 | |
| | |
| Canadian Natural Resources Ltd. | | | | | | | | |
6.250% 03/15/38 | | | 1,480,000 | | | | 1,593,902 | |
| | |
| Carrizo Oil & Gas, Inc. | | | | | | | | |
8.625% 10/15/18 (a) | | | 884,000 | | | | 941,460 | |
| | |
| Chaparral Energy, Inc. | | | | | | | | |
8.250% 09/01/21 (a) | | | 390,000 | | | | 401,700 | |
9.875% 10/01/20 (a) | | | 197,000 | | | | 218,670 | |
| | |
| Chesapeake Energy Corp. | | | | | | | | |
6.125% 02/15/21 | | | 340,000 | | | | 351,050 | |
6.625% 08/15/20 | | | 1,415,000 | | | | 1,503,437 | |
| | |
| Comstock Resources, Inc. | | | | | | | | |
7.750% 04/01/19 | | | 102,000 | | | | 103,785 | |
8.375% 10/15/17 | | | 84,000 | | | | 87,150 | |
| | |
| Concho Resources, Inc./Midland TX | | | | | | | | |
7.000% 01/15/21 | | | 418,000 | | | | 439,945 | |
8.625% 10/01/17 | | | 325,000 | | | | 359,125 | |
| | |
| Continental Resources, Inc. | | | | | | | | |
7.125% 04/01/21 | | | 421,000 | | | | 447,313 | |
| | |
| Devon Energy Corp. | | | | | | | | |
6.300% 01/15/19 | | | 2,325,000 | | | | 2,724,826 | |
| | |
| EXCO Resources, Inc. | | | | | | | | |
7.500% 09/15/18 | | | 848,000 | | | | 861,780 | |
| | |
| Gazprom International SA | | | | | | | | |
7.201% 02/01/20 (a) | | | 3,832,205 | | | | 4,167,523 | |
| | |
| Goodrich Petroleum Corp. | | | | | | | | |
8.875% 03/15/19 (a) | | | 250,000 | | | | 250,000 | |
| | |
| Hess Corp. | | | | | | | | |
7.300% 08/15/31 | | | 4,095,000 | | | | 4,801,232 | |
| |
| Hilcorp Energy I LP/Hilcorp Finance Co. | | | | | |
7.625% 04/15/21 (a) | | | 739,000 | | | | 774,102 | |
| | |
| Laredo Petroleum, Inc. | | | | | | | | |
9.500% 02/15/19 (a) | | | 919,000 | | | | 956,909 | |
| | |
| Marathon Oil Corp. | | | | | | | | |
6.000% 10/01/17 | | | 897,000 | | | | 1,009,439 | |
| | | | | | | | |
| | | Par ($) | | | Value ($) | |
| MEG Energy Corp. | | | | | | | | |
6.500% 03/15/21 (a) | | | 370,000 | | | | 376,013 | |
| | |
| Nexen, Inc. | | | | | | | | |
5.875% 03/10/35 | | | 1,980,000 | | | | 1,879,402 | |
7.500% 07/30/39 | | | 9,210,000 | | | | 10,370,672 | |
| | |
| Oasis Petroleum, Inc. | | | | | | | | |
7.250% 02/01/19 (a) | | | 250,000 | | | | 253,750 | |
| | |
| PetroHawk Energy Corp. | | | | | | | | |
7.250% 08/15/18 | | | 387,000 | | | | 398,610 | |
7.250% 08/15/18 (a) | | | 360,000 | | | | 369,900 | |
7.875% 06/01/15 | | | 585,000 | | | | 620,100 | |
| | |
| Qatar Petroleum | | | | | | | | |
5.579% 05/30/11 (a) | | | 549,328 | | | | 552,191 | |
| | |
| QEP Resources, Inc. | | | | | | | | |
6.875% 03/01/21 | | | 277,000 | | | | 290,850 | |
| | |
| Range Resources Corp. | | | | | | | | |
6.750% 08/01/20 | | | 555,000 | | | | 590,381 | |
7.500% 05/15/16 | | | 555,000 | | | | 575,812 | |
| | |
Ras Laffan Liquefied Natural
Gas Co., Ltd. II | | | | | | | | |
5.298% 09/30/20 (a) | | | 3,133,780 | | | | 3,251,297 | |
| | |
Ras Laffan Liquefied Natural
Gas Co., Ltd. III | | | | | | | | |
5.832% 09/30/16 (a) | | | 1,874,315 | | | | 2,009,266 | |
| | |
| Shell International Finance BV | | | | | | | | |
5.500% 03/25/40 | | | 8,200,000 | | | | 8,309,609 | |
| | |
| Southwestern Energy Co. | | | | | | | | |
7.500% 02/01/18 | | | 6,700,000 | | | | 7,596,125 | |
| | |
| Talisman Energy, Inc. | | | | | | | | |
5.850% 02/01/37 | | | 3,400,000 | | | | 3,378,169 | |
7.750% 06/01/19 | | | 7,147,000 | | | | 8,720,669 | |
| | |
| United Refining Co. | | | | | | | | |
10.500% 02/28/18 (a) | | | 411,000 | | | | 411,000 | |
| | |
| Venoco, Inc. | | | | | | | | |
8.875% 02/15/19 (a) | | | 102,000 | | | | 102,000 | |
| | | | | | | | |
Oil & Gas Total | | | | | | | 86,174,896 | |
| | |
| Oil & Gas Services – 0.3% | | | | | | | | |
| Aquilex Holdings LLC/Aquilex Finance Corp. | |
11.125% 12/15/16 | | | 214,000 | | | | 226,038 | |
| | |
| Key Energy Services, Inc. | | | | | | | | |
6.750% 03/01/21 | | | 257,000 | | | | 261,497 | |
See Accompanying Notes to Financial Statements.
14
Columbia Intermediate Bond Fund
March 31, 2011
Corporate Fixed-Income Bonds & Notes (continued)
| | | | | | | | |
| | | Par ($) | | | Value ($) | |
| Energy (continued) | | | | | | | | |
| Trinidad Drilling Ltd. | | | | | | | | |
7.875% 01/15/19 (a) | | | 413,000 | | | | 436,661 | |
| | |
| Weatherford International Ltd. | | | | | | | | |
5.125% 09/15/20 | | | 1,645,000 | | | | 1,633,411 | |
5.150% 03/15/13 | | | 17,000 | | | | 17,994 | |
7.000% 03/15/38 | | | 6,390,000 | | | | 6,768,141 | |
| | | | | | | | |
Oil & Gas Services Total | | | | | | | 9,343,742 | |
| | |
| Pipelines – 2.2% | | | | | | | | |
Copano Energy LLC/Copano
Energy Finance Corp. | | | | | | | | |
7.125% 04/01/21 (e) | | | 175,000 | | | | 177,188 | |
| | |
| El Paso Corp. | | | | | | | | |
6.500% 09/15/20 (a) | | | 834,000 | | | | 898,635 | |
7.250% 06/01/18 | | | 202,000 | | | | 226,998 | |
7.750% 01/15/32 | | | 515,000 | | | | 577,100 | |
| | |
| Energy Transfer Equity LP | | | | | | | | |
7.500% 10/15/20 | | | 785,000 | | | | 855,650 | |
| | |
| Enterprise Products Operating LLC | | | | | | | | |
5.950% 02/01/41 | | | 16,735,000 | | | | 16,277,465 | |
| | |
| Kinder Morgan Energy Partners LP | | | | | | | | |
5.625% 02/15/15 | | | 2,990,000 | | | | 3,299,130 | |
6.500% 09/01/39 | | | 5,530,000 | | | | 5,667,575 | |
6.950% 01/15/38 | | | 3,510,000 | | | | 3,783,755 | |
| | |
| NGPL PipeCo LLC | | | | | | | | |
6.514% 12/15/12 (a) | | | 9,050,000 | | | | 9,694,713 | |
| | |
| Plains All American Pipeline LP/PAA Finance Corp. | | | | | | | | |
5.750% 01/15/20 | | | 3,465,000 | | | | 3,708,503 | |
6.650% 01/15/37 | | | 2,050,000 | | | | 2,167,701 | |
8.750% 05/01/19 | | | 1,905,000 | | | | 2,383,250 | |
| | |
| Regency Energy Partners LP/Regency Energy Finance Corp. | | | | | | | | |
6.875% 12/01/18 | | | 303,000 | | | | 321,937 | |
9.375% 06/01/16 | | | 180,000 | | | | 204,750 | |
| | |
| Southern Natural Gas Co. | | | | | | | | |
8.000% 03/01/32 | | | 4,885,000 | | | | 5,960,936 | |
| | |
| Southern Star Central Corp. | | | | | | | | |
6.750% 03/01/16 | | | 105,000 | | | | 106,575 | |
| | |
| TransCanada Pipelines Ltd. | | | | | | | | |
6.350% 05/15/67
(05/15/17) (b)(c) | | | 12,070,000 | | | | 12,119,197 | |
| | | | | | | | |
| | | Par ($) | | | Value ($) | |
| Williams Companies, Inc. | | | | | | | | |
7.875% 09/01/21 | | | 233,000 | | | | 289,958 | |
| | | | | | | | |
Pipelines Total | | | | | | | 68,721,016 | |
| | | | | | | | |
Energy Total | | | | | | | 165,586,237 | |
| | | | | | | | |
| Financials – 20.1% | | | | | | | | |
| Banks – 12.5% | | | | | | | | |
| Bank of New York Mellon Corp. | | | | | | | | |
4.150% 02/01/21 | | | 32,310,000 | | | | 31,928,613 | |
5.450% 05/15/19 | | | 5,355,000 | | | | 5,874,039 | |
| | |
| Barclays Bank PLC | | | | | | | | |
3.900% 04/07/15 | | | 2,540,000 | | | | 2,627,465 | |
5.000% 09/22/16 | | | 1,445,000 | | | | 1,531,962 | |
6.860% 09/29/49 (a)(b) | | | 5,055,000 | | | | 4,726,425 | |
7.375% 06/29/49 (12/01/11) (a)(b)(c) | | | 15,965,000 | | | | 15,965,000 | |
7.434% 09/29/49 (12/15/17) (a)(b)(c) | | | 11,280,000 | | | | 11,280,000 | |
| | |
| Capital One Capital IV | | | | | | | | |
6.745% 02/17/37 (b) | | | 24,085,000 | | | | 24,175,319 | |
| | |
| Capital One Capital V | | | | | | | | |
10.250% 08/15/39 | | | 13,460,000 | | | | 14,604,100 | |
| | |
| Chinatrust Commercial Bank | | | | | | | | |
5.625% 03/29/49 (03/17/15) (a)(b)(c) | | | 3,570,000 | | | | 3,495,184 | |
| | |
| CIT Group, Inc. | | | | | | | | |
6.625% 04/01/18 (a) | | | 415,000 | | | | 421,225 | |
7.000% 05/01/17 | | | 2,558,000 | | | | 2,561,198 | |
| | |
| Deutsche Bank AG London | | | | | | | | |
4.875% 05/20/13 | | | 555,000 | | | | 590,090 | |
| | |
| Discover Bank/Greenwood DE | | | | | | | | |
8.700% 11/18/19 | | | 6,225,000 | | | | 7,457,942 | |
| | |
| Discover Financial Services | | | | | | | | |
10.250% 07/15/19 | | | 2,585,000 | | | | 3,325,520 | |
| | |
| Fifth Third Bancorp | | | | | | | | |
3.625% 01/25/16 | | | 1,095,000 | | | | 1,094,035 | |
| | |
| Fifth Third Bank/Ohio | | | | | | | | |
0.424% 05/17/13
(05/17/11) (b)(c) | | | 2,685,000 | | | | 2,639,460 | |
| | |
| HSBC USA, Inc. | | | | | | | | |
5.000% 09/27/20 | | | 17,125,000 | | | | 16,814,866 | |
| | |
| ING Bank NV | | | | | | | | |
4.000% 03/15/16 (a) | | | 9,965,000 | | | | 9,951,079 | |
See Accompanying Notes to Financial Statements.
15
Columbia Intermediate Bond Fund
March 31, 2011
Corporate Fixed-Income Bonds & Notes (continued)
| | | | | | | | |
| | | Par ($) | | | Value ($) | |
| Financials (continued) | | | | | | | | |
| JPMorgan Chase & Co. | | | | | | | | |
7.900% 04/29/49
(04/30/18) (b)(c) | | | 5,100,000 | | | | 5,579,961 | |
| JPMorgan Chase Capital XVII | | | | | | | | |
5.850% 08/01/35 | | | 5,245,000 | | | | 5,061,341 | |
| | |
| JPMorgan Chase Capital XX | | | | | | | | |
6.550% 09/15/66 | | | 3,760,000 | | | | 3,821,641 | |
| | |
| JPMorgan Chase Capital XXIII | | | | | | | | |
1.313% 05/15/77
(05/16/11) (b)(c) | | | 2,385,000 | | | | 1,974,076 | |
| | |
| JPMorgan Chase Capital XXV | | | | | | | | |
6.800% 10/01/37 | | | 19,800,000 | | | | 19,901,653 | |
| | |
| Lloyds Banking Group PLC | | | | | | | | |
6.267% 12/31/49 (a) | | | 8,080,000 | | | | 6,524,600 | |
6.657% 01/29/49 (a) | | | 5,799,000 | | | | 4,639,200 | |
| | |
| Lloyds TSB Bank PLC | | | | | | | | |
4.375% 01/12/15 (a) | | | 3,085,000 | | | | 3,142,143 | |
| | |
| Marshall & IIsley Bank | | | | | | | | |
5.300% 09/08/11 | | | 2,347,000 | | | | 2,359,352 | |
| | |
| Merrill Lynch & Co., Inc. | | | | | | | | |
5.000% 02/03/14 | | | 785,000 | | | | 835,658 | |
5.700% 05/02/17 (g) | | | 4,805,000 | | | | 4,986,547 | |
6.150% 04/25/13 | | | 2,035,000 | | | | 2,192,141 | |
| | |
| National City Bank of Cleveland | | | | | | | | |
6.200% 12/15/11 | | | 1,995,000 | | | | 2,070,206 | |
| | |
| National City Corp. | | | | | | | | |
6.875% 05/15/19 | | | 2,545,000 | | | | 2,905,364 | |
| |
| National City Preferred Capital Trust I | | | | | |
12.000% 12/29/49
(12/10/12) (b)(c) | | | 6,525,000 | | | | 7,400,786 | |
| | |
| Northern Trust Co. | | | | | | | | |
6.500% 08/15/18 | | | 5,485,000 | | | | 6,317,387 | |
| | |
| Northern Trust Corp. | | | | | | | | |
5.500% 08/15/13 | | | 615,000 | | | | 673,341 | |
| | |
| PNC Funding Corp. | | | | | | | | |
3.625% 02/08/15 | | | 3,155,000 | | | | 3,261,787 | |
5.125% 02/08/20 | | | 4,695,000 | | | | 4,941,826 | |
| | |
| Santander U.S. Debt SA Unipersonal | | | | | | | | |
3.724% 01/20/15 (a) | | | 4,100,000 | | | | 3,964,905 | |
3.781% 10/07/15 (a) | | | 7,425,000 | | | | 7,134,967 | |
| | |
| State Street Corp. | | | | | | | | |
2.875% 03/07/16 | | | 3,975,000 | | | | 3,948,765 | |
4.956% 03/15/18 | | | 23,600,000 | | | | 24,318,856 | |
| | | | | | | | |
| | | Par ($) | | | Value ($) | |
| U.S. Bancorp | | | | | | | | |
3.442% 02/01/16 | | | 28,105,000 | | | | 28,019,926 | |
| | |
| USB Capital XIII Trust | | | | | | | | |
6.625% 12/15/39 | | | 21,140,000 | | | | 22,130,832 | |
| | |
| Wachovia Capital Trust III | | | | | | | | |
5.570% 03/29/49
(06/15/11) (b)(c) | | | 1,640,000 | | | | 1,504,700 | |
| | |
| Wachovia Corp. | | | | | | | | |
5.750% 02/01/18 | | | 940,000 | | | | 1,035,547 | |
| | |
| Wells Fargo & Co. | | | | | | | | |
3.676% 06/15/16 | | | 29,740,000 | | | | 29,915,763 | |
| | |
| Wells Fargo Capital X | | | | | | | | |
5.950% 12/01/86 | | | 17,675,000 | | | | 17,403,706 | |
| | | | | | | | |
Banks Total | | | | | | | 389,030,499 | |
| |
| Diversified Financial Services – 2.0% | | | | | |
| Ally Financial, Inc. | | | | | | | | |
8.000% 03/15/20 | | | 2,164,000 | | | | 2,356,055 | |
| | |
| E*Trade Financial Corp. | | | | | | | | |
7.875% 12/01/15 | | | 369,000 | | | | 373,613 | |
12.500% 11/30/17 | | | 463,000 | | | | 552,128 | |
| | |
| Eaton Vance Corp. | | | | | | | | |
6.500% 10/02/17 | | | 5,790,000 | | | | 6,558,211 | |
| | |
| ERAC USA Finance LLC | | | | | | | | |
2.750% 07/01/13 (a) | | | 6,420,000 | | | | 6,523,837 | |
5.250% 10/01/20 (a) | | | 4,960,000 | | | | 5,108,808 | |
| | |
| Ford Motor Credit Co., LLC | | | | | | | | |
5.750% 02/01/21 | | | 995,000 | | | | 982,561 | |
7.500% 08/01/12 | | | 3,470,000 | | | | 3,699,943 | |
| | |
| General Electric Capital Corp. | | | | | | | | |
4.375% 09/16/20 | | | 7,005,000 | | | | 6,807,459 | |
4.625% 01/07/21 | | | 8,971,000 | | | | 8,834,838 | |
| | |
| HSBC Finance Capital Trust IX | | | | | | | | |
5.911% 11/30/35 (b) | | | 10,668,000 | | | | 10,214,610 | |
|
| International Lease Finance Corp. | |
8.250% 12/15/20 | | | 445,000 | | | | 487,831 | |
9.000% 03/15/17 (a) | | | 585,000 | | | | 658,125 | |
| | |
| Lehman Brothers Holdings, Inc. | | | | | | | | |
5.625% 01/24/13 (h) | | | 30,750,000 | | | | 7,995,000 | |
6.875% 05/02/18 (h) | | | 2,345,000 | | | | 615,562 | |
| |
| PF Export Receivables Master Trust | | | | | |
3.748% 06/01/13 (a) | | | 937,625 | | | | 937,442 | |
See Accompanying Notes to Financial Statements.
16
Columbia Intermediate Bond Fund
March 31, 2011
Corporate Fixed-Income Bonds & Notes (continued)
| | | | | | | | |
| | | Par ($) | | | Value ($) | |
| Financials (continued) | | | | | | | | |
| SLM Corp. | | | | | | | | |
6.250% 01/25/16 | | | 369,000 | | | | 384,682 | |
8.000% 03/25/20 | | | 200,000 | | | | 218,000 | |
| | |
| Springleaf Finance Corp. | | | | | | | | |
6.900% 12/15/17 | | | 736,000 | | | | 673,440 | |
| | | | | | | | |
Diversified Financial Services Total | | | | | | | 63,982,145 | |
| | |
| Insurance – 4.5% | | | | | | | | |
| Berkshire Hathaway Finance Corp. | |
4.850% 01/15/15 | | | 3,610,000 | | | | 3,938,546 | |
| | |
| CNA Financial Corp. | | | | | | | | |
5.750% 08/15/21 | | | 4,565,000 | | | | 4,673,720 | |
5.850% 12/15/14 | | | 2,162,000 | | | | 2,330,986 | |
7.350% 11/15/19 | | | 4,238,000 | | | | 4,786,334 | |
| | |
| ING Groep NV | | | | | | | | |
5.775% 12/29/49
(12/08/15) (b)(c) | | | 23,420,000 | | | | 21,663,500 | |
| | |
| Liberty Mutual Group, Inc. | | | | | | | | |
7.500% 08/15/36 (a) | | | 9,660,000 | | | | 10,336,200 | |
10.750% 06/15/88 (06/15/58) (a)(b)(c) | | | 8,310,000 | | | | 10,803,000 | |
| | |
| Lincoln National Corp. | | | | | | | | |
8.750% 07/01/19 | | | 655,000 | | | | 829,400 | |
| | |
| MetLife Capital Trust X | | | | | | | | |
9.250% 04/08/68 (04/08/38) (a)(b)(c) | | | 7,085,000 | | | | 8,555,138 | |
| | |
| MetLife, Inc. | | | | | | | | |
10.750% 08/01/69 | | | 14,265,000 | | | | 19,685,700 | |
| | |
| OneBeacon U.S. Holdings, Inc. | | | | | | | | |
5.875% 05/15/13 | | | 5,525,000 | | | | 5,939,375 | |
| | |
| Provident Companies, Inc. | | | | | | | | |
7.000% 07/15/18 | | | 320,000 | | | | 354,007 | |
| | |
| Prudential Financial, Inc. | | | | | | | | |
4.750% 06/13/15 | | | 2,570,000 | | | | 2,724,670 | |
8.875% 06/15/68
(06/15/18) (b)(c) | | | 16,625,000 | | | | 19,617,500 | |
| | |
| Transatlantic Holdings, Inc. | | | | | | | | |
8.000% 11/30/39 | | | 16,520,000 | | | | 17,348,148 | |
| | |
| Unum Group | | | | | | | | |
7.125% 09/30/16 | | | 4,850,000 | | | | 5,467,570 | |
| | | | | | | | |
Insurance Total | | | | | | | 139,053,794 | |
| | | | | | | | |
| | | Par ($) | | | Value ($) | |
| Investment Companies – 0.0% | | | | | | | | |
| Offshore Group Investments Ltd. | | | | | | | | |
11.500% 08/01/15 | | | 906,000 | | | | 1,005,660 | |
| | | | | | | | |
Investment Companies Total | | | | | | | 1,005,660 | |
|
| Real Estate Investment Trusts (REITs) – 1.1% | |
| Boston Properties LP | | | | | | | | |
4.125% 05/15/21 | | | 16,220,000 | | | | 15,426,956 | |
|
| Brandywine Operating Partnership LP | |
7.500% 05/15/15 | | | 3,945,000 | | | | 4,457,057 | |
| Duke Realty LP | | | | | | | | |
7.375% 02/15/15 | | | 3,170,000 | | | | 3,598,102 | |
8.250% 08/15/19 | | | 6,245,200 | | | | 7,499,973 | |
| | |
| Highwoods Properties, Inc. | | | | | | | | |
5.850% 03/15/17 | | | 1,975,000 | | | | 2,101,927 | |
| | | | | | | | |
Real Estate Investment Trusts (REITs) Total | | | | | | | 33,084,015 | |
| | |
| Savings & Loans – 0.0% | | | | | | | | |
| Washington Mutual Bank | | | | | | | | |
5.125% 01/15/15 (h) | | | 27,379,000 | | | | 34,224 | |
|
| Washington Mutual Preferred Funding Delaware | |
6.534% 03/29/49 (a)(h) | | | 2,725,000 | | | | 54,500 | |
| | | | | | | | |
Savings & Loans Total | | | | | | | 88,724 | |
| | | | | | | | |
Financials Total | | | | | | | 626,244,837 | |
| | | | | | | | |
| Industrials – 1.6% | | | | | | | | |
Aerospace & Defense – 0.6% | | | | | | | | |
| Acquisition Co. Lanza Parent | | | | | | | | |
10.000% 06/01/17 (a) | | | 566,000 | | | | 625,430 | |
| | |
| ADS Tactical, Inc. | | | | | | | | |
11.000% 04/01/18 (a) | | | 800,000 | | | | 820,000 | |
| | |
| Embraer Overseas Ltd. | | | | | | | | |
6.375% 01/15/20 | | | 6,405,000 | | | | 6,885,375 | |
|
| Kratos Defense & Security Solutions, Inc. | |
10.000% 06/01/17 | | | 610,000 | | | | 672,525 | |
| | |
| L-3 Communications Corp. | | | | | | | | |
4.950% 02/15/21 | | | 6,615,000 | | | | 6,653,599 | |
| | |
| Raytheon Co. | | | | | | | | |
7.200% 08/15/27 | | | 2,055,000 | | | | 2,550,374 | |
| | |
| Systems 2001 Asset Trust | | | | | | | | |
6.664% 09/15/13 (a) | | | 1,144,813 | | | | 1,251,074 | |
| | |
| TransDigm, Inc. | | | | | | | | |
7.750% 12/15/18 (a) | | | 558,000 | | | | 599,152 | |
| | | | | | | | |
Aerospace & Defense Total | | | | | | | 20,057,529 | |
See Accompanying Notes to Financial Statements.
17
Columbia Intermediate Bond Fund
March 31, 2011
Corporate Fixed-Income Bonds & Notes (continued)
| | | | | | | | |
| | | Par ($) | | | Value ($) | |
| Industrials (continued) | | | | | | | | |
| Air Transportation – 0.1% | | | | | | | | |
| Air 2 US | | | | | | | | |
8.027% 10/01/19 (a) | | | 1,478,403 | | | | 1,522,755 | |
| | | | | | | | |
Air Transportation Total | | | | | | | 1,522,755 | |
| | |
| Building Materials – 0.0% | | | | | | | | |
| Associated Materials LLC | | | | | | | | |
9.125% 11/01/17 (a) | | | 68,000 | | | | 72,250 | |
| Euramax International, Inc. | | | | | | | | |
9.500% 04/01/16 (a) | | | 340,000 | | | | 344,250 | |
| | |
| Gibraltar Industries, Inc. | | | | | | | | |
8.000% 12/01/15 | | | 360,000 | | | | 368,100 | |
| | |
| Interline Brands, Inc. | | | | | | | | |
7.000% 11/15/18 | | | 261,000 | | | | 267,525 | |
| | |
| Nortek, Inc. | | | | | | | | |
11.000% 12/01/13 | | | 310,622 | | | | 328,483 | |
| | | | | | | | |
Building Materials Total | | | | | | | 1,380,608 | |
| |
| Electrical Components & Equipment – 0.0% | | | | | |
| WireCo WorldGroup | | | | | | | | |
9.500% 05/15/17 (a) | | | 519,000 | | | | 552,735 | |
| | | | | | | | |
Electrical Components & Equipment Total | | | | 552,735 | |
| | |
| Environmental Control – 0.0% | | | | | | | | |
| Clean Harbors, Inc. | | | | | | | | |
7.625% 08/15/16 (a) | | | 135,000 | | | | 143,269 | |
| | |
| Darling International, Inc. | | | | | | | | |
8.500% 12/15/18 (a) | | | 110,000 | | | | 119,625 | |
| | | | | | | | |
Environmental Control Total | | | | | | | 262,894 | |
| | |
| Machinery-Diversified – 0.1% | | | | | | | | |
| Case New Holland, Inc. | | | | | | | | |
7.875% 12/01/17 (a) | | | 704,000 | | | | 781,440 | |
| | |
| Columbus McKinnon Corp. | | | | | | | | |
7.875% 02/01/19 (a) | | | 185,000 | | | | 191,475 | |
| | |
| CPM Holdings, Inc. | | | | | | | | |
10.875% 09/01/14 (a) | | | 569,000 | | | | 614,520 | |
| | |
| Manitowoc Co., Inc. | | | | | | | | |
8.500% 11/01/20 | | | 645,000 | | | | 691,762 | |
| | | | | | | | |
Machinery-Diversified Total | | | | | | | 2,279,197 | |
| |
| Miscellaneous Manufacturing – 0.2% | | | | | |
| Ingersoll-Rand Global Holding Co., Ltd. | |
9.500% 04/15/14 | | | 2,310,000 | | | | 2,772,423 | |
| | |
| Polypore International, Inc. | | | | | | | | |
7.500% 11/15/17 (a) | | | 550,000 | | | | 577,500 | |
| | |
| SPX Corp. | | | | | | | | |
6.875% 09/01/17 (a) | | | 296,000 | | | | 318,200 | |
| | | | | | | | |
| | | Par ($) | | | Value ($) | |
| Tyco International Ltd./Tyco International Finance SA | |
6.875% 01/15/21 | | | 2,070,000 | | | | 2,472,648 | |
| | | | | | | | |
Miscellaneous Manufacturing Total | | | | | | | 6,140,771 | |
| | |
| Packaging & Containers – 0.0% | | | | | | | | |
| Ardagh Packaging Finance PLC | | | | | | | | |
9.125% 10/15/20 (a) | | | 260,000 | | | | 281,450 | |
|
| Graphic Packaging International, Inc. | |
7.875% 10/01/18 | | | 132,000 | | | | 141,240 | |
9.500% 06/15/17 | | | 838,000 | | | | 930,180 | |
| | | | | | | | |
Packaging & Containers Total | | | | | | | 1,352,870 | |
| | |
| Shipbuilding – 0.0% | | | | | | | | |
| Huntington Ingalls Industries, Inc. | | | | | |
6.875% 03/15/18 (a) | | | 260,000 | | | | 271,375 | |
7.125% 03/15/21 (a) | | | 353,000 | | | | 368,003 | |
| | | | | | | | |
Shipbuilding Total | | | | | | | 639,378 | |
| | |
| Transportation – 0.6% | | | | | | | | |
| AMGH Merger Sub, Inc. | | | | | | | | |
9.250% 11/01/18 (a) | | | 159,000 | | | | 170,527 | |
| | |
| BNSF Funding Trust I | | | | | | | | |
6.613% 12/15/55 (01/15/26) (b)(c) | | | 10,186,000 | | | | 10,580,707 | |
| | |
| Burlington Northern Santa Fe LLC | | | | | | | | |
7.950% 08/15/30 | | | 1,535,000 | | | | 1,949,352 | |
| | |
| Union Pacific Corp. | | | | | | | | |
5.700% 08/15/18 | | | 3,935,000 | | | | 4,405,827 | |
| | | | | | | | |
Transportation Total | | | | | | | 17,106,413 | |
| | | | | | | | |
Industrials Total | | | | | | | 51,295,150 | |
| | | | | | | | |
| Information Technology – 0.1% | |
| IT Services – 0.1% | |
| First Data Corp. | |
7.375% 06/15/19 (a)(e) | | | 148,000 | | | | 151,145 | |
8.875% 08/15/20 (a) | | | 465,000 | | | | 510,338 | |
9.875% 09/24/15 | | | 352,000 | | | | 360,800 | |
12.625% 01/15/21 (a) | | | 875,000 | | | | 949,375 | |
PIK, | |
10.550% 09/24/15 | | | 14,738 | | | | 14,427 | |
| | | | | | | | |
IT Services Total | | | | | | | 1,986,085 | |
| | | | | | | | |
Information Technology Total | | | | | | | 1,986,085 | |
| | | | | | | | |
| Technology – 0.5% | |
| Computers – 0.0% | |
| CDW Escrow Corp. | |
8.500% 04/01/19 (a) | | | 335,000 | | | | 335,419 | |
| | | | | | | | |
Computers Total | | | | | | | 335,419 | |
See Accompanying Notes to Financial Statements.
18
Columbia Intermediate Bond Fund
March 31, 2011
Corporate Fixed-Income Bonds & Notes (continued)
| | | | | | | | |
| | | Par ($) | | | Value ($) | |
| Technology (continued) | | | | | | | | |
| Networking Products – 0.1% | | | | | | | | |
| Cisco Systems, Inc. | | | | | | | | |
5.900% 02/15/39 | | | 4,200,000 | | | | 4,358,193 | |
| | | | | | | | |
Networking Products Total | | | | | | | 4,358,193 | |
| | |
| Semiconductors – 0.1% | | | | | | | | |
| Amkor Technology, Inc. | | | | | | | | |
7.375% 05/01/18 | | | 105,000 | | | | 108,675 | |
9.250% 06/01/16 | | | 425,000 | | | | 445,719 | |
|
| Freescale Semiconductor, Inc. | |
9.250% 04/15/18 (a) | | | 400,000 | | | | 438,000 | |
|
| NXP BV/NXP Funding LLC | |
9.750% 08/01/18 (a) | | | 549,000 | | | | 618,311 | |
| | | | | | | | |
Semiconductors Total | | | | | | | 1,610,705 | |
|
| Software – 0.3% | |
| Oracle Corp. | |
4.950% 04/15/13 | | | 1,615,000 | | | | 1,739,785 | |
6.500% 04/15/38 | | | 5,140,000 | | | | 5,764,777 | |
|
| Sungard Data Systems, Inc. | |
7.375% 11/15/18 (a) | | | 589,000 | | | | 602,252 | |
| | | | | | | | |
Software Total | | | | | | | 8,106,814 | |
| | | | | | | | |
Technology Total | | | | | | | 14,411,131 | |
| | | | | | | | |
| Utilities – 4. 8% | |
| Electric – 4.4% | |
| Alabama Power Co. | |
5.500% 03/15/41 | | | 24,503,000 | | | | 24,798,139 | |
|
| American Electric Power Co., Inc. | |
5.250% 06/01/15 | | | 4,818,000 | | | | 5,222,495 | |
|
| Calpine Corp. | |
7.500% 02/15/21 (a) | | | 920,000 | | | | 953,350 | |
|
| CMS Energy Corp. | |
4.250% 09/30/15 | | | 4,945,000 | | | | 4,963,544 | |
|
| Commonwealth Edison Co. | |
5.900% 03/15/36 | | | 3,570,000 | | | | 3,636,527 | |
5.950% 08/15/16 | | | 7,140,000 | | | | 8,013,579 | |
6.150% 09/15/17 | | | 500,000 | | | | 559,591 | |
6.950% 07/15/18 | | | 5,220,000 | | | | 5,765,761 | |
|
| Consolidated Edison Co. of New York, Inc. | |
6.750% 04/01/38 | | | 4,845,000 | | | | 5,716,010 | |
|
| DTE Energy Co. | |
7.625% 05/15/14 | | | 4,720,000 | | | | 5,422,572 | |
|
| Edison Mission Energy | |
7.000% 05/15/17 | | | 477,000 | | | | 382,793 | |
| | | | | | | | |
| | | Par ($) | | | Value ($) | |
| Energy Future Holdings Corp. | |
10.000% 01/15/20 | | | 430,000 | | | | 455,660 | |
|
| Energy Future Intermediate Holding Co., LLC/EFIH Finance, Inc. | |
10.000% 12/01/20 | | | 40,000 | | | | 42,387 | |
|
| Exelon Generation Co., LLC | |
6.200% 10/01/17 | | | 2,790,000 | | | | 3,090,536 | |
|
| FPL Energy American Wind LLC | |
6.639% 06/20/23 (a) | | | 2,465,293 | | | | 2,491,820 | |
|
| FPL Energy National Wind LLC | |
5.608% 03/10/24 (a) | | | 912,851 | | | | 909,245 | |
|
| GenOn Energy, Inc. | |
9.500% 10/15/18 (a) | | | 305,000 | | | | 317,963 | |
|
| Georgia Power Co. | |
4.750% 09/01/40 | | | 8,975,000 | | | | 8,037,274 | |
| | |
| Hydro Quebec | | | | | | | | |
8.500% 12/01/29 | | | 1,510,000 | | | | 2,155,943 | |
| | |
| Ipalco Enterprises, Inc. | | | | | | | | |
7.250% 04/01/16 (a) | | | 850,000 | | | | 920,125 | |
|
| MidAmerican Energy Holdings Co. | |
5.000% 02/15/14 | | | 2,660,000 | | | | 2,856,867 | |
5.875% 10/01/12 | | | 1,415,000 | | | | 1,511,128 | |
| | |
| Nevada Power Co. | | | | | | | | |
5.375% 09/15/40 | | | 1,450,000 | | | | 1,389,021 | |
| | |
| Niagara Mohawk Power Corp. | | | | | | | | |
4.881% 08/15/19 (a) | | | 7,495,000 | | | | 7,876,203 | |
| | |
| Nisource Finance Corp. | | | | | | | | |
6.250% 12/15/40 | | | 4,260,000 | | | | 4,349,251 | |
| | |
| NRG Energy, Inc. | | | | | | | | |
7.375% 01/15/17 | | | 1,219,000 | | | | 1,270,807 | |
| | |
| Oglethorpe Power Corp. | | | | | | | | |
6.974% 06/30/11 | | | 166,000 | | | | 166,287 | |
| | |
| Oncor Electric Delivery Co., LLC | | | | | | | | |
5.250% 09/30/40 (a) | | | 8,545,000 | | | | 7,830,809 | |
5.950% 09/01/13 | | | 6,745,000 | | | | 7,358,390 | |
| | |
| Southern California Edison Co. | | | | | | | | |
4.500% 09/01/40 | | | 10,310,000 | | | | 9,007,280 | |
5.000% 01/15/16 | | | 3,605,000 | | | | 3,943,538 | |
| | |
| Southern Co. | | | | | | | | |
4.150% 05/15/14 | | | 2,885,000 | | | | 3,052,238 | |
| | |
| Tenaska Alabama II Partners LP | | | | | | | | |
6.125% 03/30/23 (a) | | | 2,727,249 | | | | 2,769,249 | |
See Accompanying Notes to Financial Statements.
19
Columbia Intermediate Bond Fund
March 31, 2011
Corporate Fixed-Income Bonds & Notes (continued)
| | | | | | | | |
| | | Par ($) | | | Value ($) | |
| Utilities (continued) | | | | | | | | |
| Windsor Financing LLC | | | | | | | | |
5.881% 07/15/17 (a) | | | 1,050,001 | | | | 937,819 | |
| | | | | | | | |
Electric Total | | | | | | | 138,174,201 | |
| | |
| Gas – 0.4% | | | | | | | | |
| Atmos Energy Corp. | | | | | | | | |
6.350% 06/15/17 | | | 3,915,000 | | | | 4,362,621 | |
| | |
| Centerpoint Energy, Inc. | | | | | | | | |
5.950% 02/01/17 | | | 295,000 | | | | 321,066 | |
| | |
| Nakilat, Inc. | | | | | | | | |
6.067% 12/31/33 (a) | | | 4,795,000 | | | | 4,771,025 | |
| | |
| Sempra Energy | | | | | | | | |
6.500% 06/01/16 | | | 3,130,000 | | | | 3,572,266 | |
| | | | | | | | |
Gas Total | | | | | | | 13,026,978 | |
| | | | | | | | |
Utilities Total | | | | | | | 151,201,179 | |
| | | | | | | | |
Total Corporate Fixed-Income
Bonds & Notes
(cost of $1,349,250,357) | | | | 1,376,129,879 | |
|
Commercial Mortgage-Backed Securities – 18.6% | |
| Bear Stearns Commercial Mortgage Securities | |
4.740% 03/13/40 | | | 640,000 | | | | 668,720 | |
4.871% 09/11/42 | | | 18,515,000 | | | | 19,611,512 | |
5.200% 01/12/41 (04/01/11) (b)(c) | | | 6,136,000 | | | | 6,543,078 | |
5.201% 12/11/38 | | | 8,025,000 | | | | 8,462,799 | |
5.698% 09/11/38 (04/01/11) (b)(c) | | | 482,000 | | | | 513,404 | |
5.700% 06/13/50 | | | 16,660,000 | | | | 17,758,477 | |
5.723% 09/11/38 (04/01/11) (b)(c) | | | 1,290,000 | | | | 1,415,010 | |
5.742% 09/11/42 (04/01/11) (b)(c) | | | 16,570,000 | | | | 17,990,770 | |
|
| Citigroup Commercial Mortgage Trust | |
5.413% 10/15/49 | | | 5,750,000 | | | | 6,091,403 | |
|
| Citigroup/Deutsche Bank Commercial Mortgage Trust | |
5.322% 12/11/49 | | | 18,000,000 | | | | 18,563,841 | |
|
| Credit Suisse First Boston Mortgage Securities Corp. | |
4.801% 03/15/36 | | | 15,000,000 | | | | 15,660,488 | |
|
| Credit Suisse Mortgage Capital Certificates | |
5.825% 06/15/38 (04/01/11) (b)(c) | | | 27,666,000 | | | | 29,938,731 | |
|
| GE Capital Commercial Mortgage Corp. | |
4.819% 01/10/38 | | | 5,110,000 | | | | 5,337,412 | |
| | | | | | | | |
| | | Par ($) | | | Value ($) | |
| GMAC Commercial Mortgage Securities, Inc. | |
1.052% 07/15/29
(04/01/11) (b)(c) | | | 6,495,739 | | | | 233,994 | |
5.023% 04/10/40 | | | 10,600,000 | | | | 11,277,733 | |
5.472% 05/10/40
(04/01/11) (b)(c) | | | 12,745,000 | | | | 13,619,075 | |
|
| Greenwich Capital Commercial Funding Corp. | |
4.533% 01/05/36 | | | 729,635 | | | | 743,571 | |
4.799% 08/10/42
(04/01/11) (b)(c) | | | 6,960,000 | | | | 7,342,604 | |
5.317% 06/10/36
(04/01/11) (b)(c) | | | 4,216,000 | | | | 4,513,452 | |
|
| GS Mortgage Securities Corp. II | |
4.753% 03/10/44 | | | 6,850,000 | | | | 6,898,246 | |
5.162% 12/10/43
(04/01/11) (a)(b)(c) | | | 14,670,000 | | | | 15,233,871 | |
5.560% 11/10/39 | | | 10,000,000 | | | | 10,755,417 | |
|
| JPMorgan Chase Commercial Mortgage Securities Corp. | |
4.070% 11/15/43 (a) | | | 6,555,000 | | | | 6,301,692 | |
4.717% 02/15/46 (a) | | | 4,900,000 | | | | 4,917,176 | |
4.985% 01/12/37 | | | 15,000,000 | | | | 15,759,466 | |
4.999% 10/15/42
(04/01/11) (b)(c) | | | 3,550,000 | | | | 3,656,178 | |
5.440% 06/12/47 | | | 21,825,000 | | | | 23,014,120 | |
5.738% 02/12/49
(04/01/11) (b)(c) | | | 14,950,000 | | | | 16,010,260 | |
I.O., | | | | | | | | |
0.184% 10/15/42
(04/01/11) (b)(c) | | | 182,366,564 | | | | 641,146 | |
|
| LB-UBS Commercial Mortgage Trust | |
5.020% 08/15/29
(04/11/11) (b)(c) | | | 14,958,000 | | | | 15,909,109 | |
5.084% 02/15/31 | | | 5,145,068 | | | | 5,146,412 | |
5.430% 02/15/40 | | | 12,085,000 | | | | 12,734,209 | |
5.866% 09/15/45
(04/11/11) (b)(c) | | | 10,520,000 | | | | 11,283,315 | |
|
| Merrill Lynch Mortgage Investors, Inc. | |
I.O., | | | | | | | | |
0.276% 12/15/30
(04/01/11) (b)(c) | | | 18,968,400 | | | | 234,533 | |
|
| Merrill Lynch Mortgage Trust | |
4.747% 06/12/43
(04/01/11) (b)(c) | | | 6,450,000 | | | | 6,830,775 | |
|
| Morgan Stanley Capital I | |
4.660% 09/13/45 | | | 29,680,000 | | | | 31,324,204 | |
4.970% 12/15/41 | | | 9,194,000 | | | | 9,758,901 | |
5.033% 09/15/47
(04/01/11) (a)(b)(c) | | | 10,190,000 | | | | 10,562,088 | |
See Accompanying Notes to Financial Statements.
20
Columbia Intermediate Bond Fund
March 31, 2011
Commercial Mortgage-Backed Securities (continued)
| | | | | | | | |
| | | Par ($) | | | Value ($) | |
| Morgan Stanley Dean Witter Capital I | |
4.180% 03/12/35 | | | 4,397,279 | | | | 4,507,167 | |
4.920% 03/12/35 | | | 7,025,000 | | | | 7,379,157 | |
5.080% 09/15/37 | | | 5,755,000 | | | | 5,988,353 | |
5.980% 01/15/39 | | | 1,408,529 | | | | 1,456,543 | |
|
| Structured Asset Securities Corp. | |
I.O., | | | | | | | | |
2.092% 02/25/28
(04/01/11) (b)(c) | | | 1,622,178 | | | | 76 | |
|
| Wachovia Bank Commercial Mortgage Trust | |
3.989% 06/15/35 | | | 11,930,000 | | | | 12,320,533 | |
5.012% 12/15/35 (b) | | | 13,073,000 | | | | 13,867,740 | |
5.037% 03/15/42 | | | 10,007,027 | | | | 10,423,024 | |
5.077% 10/15/35
(04/01/11) (a)(b)(c) | | | 10,000,000 | | | | 10,659,993 | |
5.083% 03/15/42
(04/01/11) (b)(c) | | | 9,575,000 | | | | 10,169,241 | |
5.179% 07/15/42
(04/01/11) (b)(c) | | | 9,280,000 | | | | 9,762,685 | |
5.209% 10/15/44
(04/01/11) (b)(c) | | | 12,870,000 | | | | 13,836,303 | |
5.270% 12/15/44
(04/01/11) (b)(c) | | | 11,205,000 | | | | 12,051,152 | |
5.308% 07/15/41
(04/01/11) (b)(c) | | | 20,000,000 | | | | 21,469,502 | |
5.320% 12/15/44
(04/01/11) (b)(c) | | | 13,135,000 | | | | 13,811,371 | |
5.418% 01/15/45
(04/01/11) (b)(c) | | | 9,000,000 | | | | 9,663,894 | |
6.413% 04/15/34 | | | 5,000,000 | | | | 5,197,992 | |
I.O., | | | | | | | | |
0.248% 03/15/42 (04/01/11) (a)(b)(c) | | | 616,245,350 | | | | 1,740,708 | |
| |
| Wells Fargo Commercial Mortgage Trust | | �� | | | |
4.393% 11/15/43 (a) | | | 19,490,000 | | | | 19,305,151 | |
| |
| WF-RBS Commercial Mortgage Trust | | | | | |
4.869% 02/15/44 (a)(b) | | | 4,015,000 | | | | 4,107,378 | |
| | | | | | | | |
Total Commercial Mortgage-Backed Securities
(cost of $554,860,866) | | | | 580,975,155 | |
| |
Government & Agency Obligations – 15.7% | | | | | |
| | | | | | | | |
| Foreign Government Obligations – 0.4% | |
| Province of Quebec | | | | | | | | |
5.125% 11/14/16 | | | 3,060,000 | | | | 3,409,813 | |
| |
| Republic of Italy | | | | | |
5.375% 06/12/17 | | | 6,765,000 | | | | 7,193,285 | |
| | | | | | | | |
| | | Par ($) | | | Value ($) | |
Svensk Exportkredit AB | | | | | | | | |
5.125% 03/01/17 | | | 310,000 | | | | 342,908 | |
| | | | | | | | |
Foreign Government Obligations Total | | | | 10,946,006 | |
| | | | | | | | |
| U.S. Government Obligations – 15.3% | | | | | |
| U.S. Treasury Bills | | | | | | | | |
(i) 04/14/11 | | | 50,000,000 | | | | 49,999,007 | |
(i) 08/25/11 | | | 3,000,000 | | | | 2,998,299 | |
| |
| U.S. Treasury Bonds | | | | | |
4.250% 11/15/40 | | | 29,782,000 | | | | 28,483,683 | |
| |
| U.S. Treasury Notes | | | | | |
2.000% 01/31/16 | | | 99,943,000 | | | | 99,216,814 | |
2.125% 02/29/16 | | | 2,680,000 | | | | 2,671,625 | |
2.500% 06/30/17 | | | 9,800,000 | | | | 9,695,875 | |
2.625% 08/15/20 (j) | | | 10,861,200 | | | | 10,189,163 | |
2.625% 11/15/20 | | | 89,105,000 | | | | 83,146,103 | |
3.250% 07/31/16 | | | 1,525,000 | | | | 1,593,982 | |
3.625% 02/15/21 | | | 4,505,000 | | | | 4,569,057 | |
| |
| U.S. Treasury STRIPS | | | | | |
(i) 11/15/21 | | | 242,485,000 | | | | 161,821,880 | |
(i) 02/15/40 | | | 60,250,000 | | | | 15,167,215 | |
(i) 05/15/39 (j) | | | 27,965,000 | | | | 7,306,695 | |
| | | | | | | | |
U.S. Government Obligations Total | | | | 476,859,398 | |
| | | | | | | | |
Total Government & Agency Obligations (cost of $500,565,506) | | | | 487,805,404 | |
|
Mortgage-Backed Securities – 15.1% | |
| Federal Home Loan Mortgage Corp. | |
5.586% 08/01/37
(04/01/11) (b)(c) | | | 3,757,779 | | | | 4,003,442 | |
6.000% 05/01/17 | | | 32,661 | | | | 35,519 | |
6.000% 02/01/39 | | | 2,783,891 | | | | 3,027,865 | |
8.500% 11/01/26 | | | 122,060 | | | | 146,031 | |
12.000% 07/01/20 | | | 25,222 | | | | 28,084 | |
TBA, | |
5.500% 12/01/40 (e) | | | 37,000,000 | | | | 39,462,794 | |
|
| Federal National Mortgage Association | |
2.574% 08/01/36
(04/01/11) (b)(c) | | | 29,295 | | | | 29,669 | |
4.000% 12/01/40 | | | 35,526,021 | | | | 35,006,518 | |
4.000% 02/01/41 | | | 45,415,618 | | | | 44,751,499 | |
4.500% 04/01/40 | | | 2,809,194 | | | | 2,870,723 | |
4.500% 06/01/40 | | | 20,030,062 | | | | 20,449,993 | |
4.500% 07/01/40 | | | 15,409,367 | | | | 15,732,424 | |
5.000% 08/01/40 | | | 54,676,406 | | | | 57,302,685 | |
5.500% 06/01/35 | | | 9,364,733 | | | | 10,063,645 | |
5.500% 07/01/35 | | | 16,812,065 | | | | 18,103,565 | |
5.500% 01/01/38 | | | 11,180,160 | | | | 11,983,117 | |
See Accompanying Notes to Financial Statements.
21
Columbia Intermediate Bond Fund
March 31, 2011
Mortgage-Backed Securities (continued)
| | | | | | | | |
| | | Par ($) | | | Value ($) | |
5.500% 07/01/39 | | | 26,253,808 | | | | 28,260,713 | |
5.500% 01/01/40 | | | 11,338,373 | | | | 12,138,520 | |
5.500% 08/01/40 | | | 9,465,698 | | | | 10,133,691 | |
5.736% 07/01/37
(04/01/11) (b)(c) | | | 428,499 | | | | 461,379 | |
5.861% 07/01/32
(04/01/11) (b)(c) | | | 159,572 | | | | 169,187 | |
5.965% 06/01/32
(04/01/11) (b)(c) | | | 11,553 | | | | 12,243 | |
6.000% 01/01/14 | | | 76,785 | | | | 83,623 | |
6.000% 02/01/37 | | | 18,664,390 | | | | 20,434,248 | |
6.000% 05/01/37 | | | 9,051,806 | | | | 9,862,059 | |
6.000% 03/01/38 | | | 29,928,739 | | | | 32,598,394 | |
6.000% 05/01/38 | | | 1,550,080 | | | | 1,688,348 | |
6.000% 08/01/38 | | | 27,843,917 | | | | 30,327,604 | |
6.000% 12/01/38 | | | 7,067,895 | | | | 7,716,024 | |
6.500% 10/01/28 | | | 363,280 | | | | 410,954 | |
6.500% 12/01/31 | | | 410,593 | | | | 464,476 | |
6.500% 08/01/36 | | | 6,992,814 | | | | 7,862,416 | |
7.000% 10/01/11 | | | 5,995 | | | | 6,111 | |
10.000% 09/01/18 | | | 39,112 | | | | 44,432 | |
|
| Government National Mortgage Association | |
2.625% 07/20/25
(04/01/11) (b)(c) | | | 46,593 | | | | 48,109 | |
4.500% 09/15/40 | | | 28,229,195 | | | | 29,174,578 | |
4.500% 03/15/41 (e) | | | 13,229,345 | | | | 13,672,396 | |
7.000% 01/15/30 | | | 586,500 | | | | 678,056 | |
7.500% 12/15/23 | | | 524,665 | | | | 609,393 | |
7.500% 07/20/28 | | | 236,012 | | | | 273,439 | |
8.000% 05/15/17 | | | 5,971 | | | | 6,805 | |
8.500% 02/15/25 | | | 65,465 | | | | 77,769 | |
9.000% 06/15/16 | | | 610 | | | | 616 | |
9.000% 08/15/16 | | | 1,248 | | | | 1,410 | |
9.000% 10/15/16 | | | 2,438 | | | | 2,755 | |
| | | | | | | | |
Total Mortgage-Backed Securities
(cost of $468,554,772) | | | | 470,217,321 | |
| | |
Asset-Backed Securities – 4.0% | | | | | | | | |
| Ally Auto Receivables Trust | | | | | | | | |
1.450% 05/15/14 | | | 1,500,000 | | | | 1,511,690 | |
|
| Bay View Auto Trust | |
5.310% 06/25/14 | | | 1,398,041 | | | | 1,402,153 | |
|
| BMW Vehicle Lease Trust | |
0.820% 04/15/13 | | | 7,700,000 | | | | 7,702,764 | |
|
| Bombardier Capital Mortgage Securitization Corp. | |
6.230% 04/15/28 | | | 65,394 | | | | 63,327 | |
|
| Chrysler Financial Auto Securitization Trust | |
6.250% 05/08/14 (a) | | | 12,582,000 | | | | 13,074,097 | |
| | | | | | | | |
| | | Par ($) | | | Value ($) | |
| Citibank Credit Card Issuance Trust | |
6.300% 06/20/14 | | | 745,000 | | | | 787,149 | |
6.950% 02/18/14 | | | 2,585,000 | | | | 2,707,230 | |
|
| Citicorp Residential Mortgage Securities, Inc. | |
5.775% 09/25/36
(04/01/11) (b)(c) | | | 4,000,000 | | | | 3,942,852 | |
5.892% 03/25/37
(04/01/11) (b)(c) | | | 11,000,000 | | | | 10,584,629 | |
5.977% 06/25/37
(04/01/11) (b)(c) | | | 570,548 | | | | 573,260 | |
6.080% 06/25/37
(04/01/11) (b)(c) | | | 11,000,000 | | | | 10,859,145 | |
|
| Citigroup Mortgage Loan Trust, Inc. | |
5.517% 08/25/35
(04/01/11) (b)(c) | | | 3,775,000 | | | | 374,665 | |
5.598% 03/25/36
(04/01/11) (b)(c) | | | 1,560,232 | | | | 1,180,016 | |
5.666% 08/25/35
(04/01/11) (b)(c) | | | 2,330,000 | | | | 67,810 | |
|
| Contimortgage Home Equity Trust | |
6.880% 01/15/28 | | | 73,784 | | | | 65,733 | |
| |
| Countrywide Asset-Backed Certificates | | | | | |
0.360% 06/25/21
(04/25/11) (b)(c) | | | 147,593 | | | | 143,669 | |
5.779% 05/25/37
(04/01/11) (b)(c) | | | 3,282,664 | | | | 2,529,894 | |
5.813% 05/25/37
(04/01/11) (b)(c) | | | 5,772,154 | | | | 4,063,169 | |
| | |
| Daimler Chrysler Auto Trust | | | | | | | | |
5.280% 03/08/13 | | | 3,708,626 | | | | 3,784,550 | |
| | |
| Discover Card Master Trust | | | | | | | | |
1.555% 12/15/14
(04/15/11) (b)(c) | | | 2,865,000 | | | | 2,903,606 | |
|
| First Alliance Mortgage Loan Trust | |
7.625% 07/25/25 | | | 521,308 | | | | 471,460 | |
| | |
| Ford Credit Auto Lease Trust | | | | | | | | |
0.910% 07/15/13 (a) | | | 4,940,000 | | | | 4,935,936 | |
| | |
| Ford Credit Auto Owner Trust | | | | | | | | |
4.050% 10/15/16 | | | 7,000,000 | | | | 7,186,850 | |
4.950% 03/15/13 | | | 3,500,000 | | | | 3,591,209 | |
| | |
| Franklin Auto Trust | | | | | | | | |
5.360% 05/20/16 | | | 6,866,434 | | | | 6,983,224 | |
7.160% 05/20/16 (a) | | | 5,655,000 | | | | 6,018,546 | |
| | |
| Green Tree Financial Corp. | | | | | | | | |
6.870% 01/15/29 | | | 866,689 | | | | 923,357 | |
See Accompanying Notes to Financial Statements.
22
Columbia Intermediate Bond Fund
March 31, 2011
Asset-Backed Securities (continued)
| | | | | | | | |
| | | Par ($) | | | Value ($) | |
| Harley-Davidson Motorcycle Trust | |
5.540% 04/15/15 | | | 4,600,000 | | | | 4,695,974 | |
| | |
| IMC Home Equity Loan Trust | | | | | | | | |
7.500% 04/25/26 | | | 26,706 | | | | 26,795 | |
|
| JPMorgan Auto Receivables Trust | |
5.610% 12/15/14 (a) | | | 669,982 | | | | 670,139 | |
| |
| Renaissance Home Equity Loan Trust | | | | | |
5.355% 11/25/35
(04/01/11) (b)(c) | | | 4,750,000 | | | | 1,496,720 | |
| | |
| SACO I, Inc. | | | | | | | | |
0.450% 04/25/35 (04/25/11) (a)(b)(c) | | | 291,667 | | | | 121,136 | |
|
| Small Business Administration Participation Certificates | |
4.570% 06/01/25 | | | 2,623,263 | | | | 2,752,848 | |
5.390% 12/01/25 | | | 679,103 | | | | 727,817 | |
5.570% 03/01/26 | | | 2,422,892 | | | | 2,598,138 | |
5.780% 08/01/27 | | | 4,007,400 | | | | 4,265,999 | |
| |
| Wachovia Auto Loan Owner Trust | | | | | |
5.650% 02/20/13 | | | 8,000,000 | | | | 8,036,059 | |
| | | | | | | | |
Total Asset-Backed Securities
(cost of $134,612,068) | | | | 123,823,615 | |
| | |
Municipal Bonds – 2.4% | | | | | | | | |
| | | | | | | | |
| California – 0.8% | | | | | | | | |
CA Educational Facilities Authority
University of Southern California, | |
Series 2009 A, | | | | | | | | |
5.250% 10/01/38 | | | 4,510,000 | | | | 4,551,717 | |
|
| CA Los Angeles Unified School District | |
Series 2009, | | | | | | | | |
5.750% 07/01/34 | | | 9,955,000 | | | | 9,400,208 | |
|
| CA State | |
Series 2010, | | | | | | | | |
3.950% 11/01/15 | | | 11,165,000 | | | | 11,153,612 | |
| | | | | | | | |
California Total | | | | | | | 25,105,537 | |
| | | | | | | | |
| Illinois – 0.1% | | | | | | | | |
| IL Chicago | | | | | | | | |
Series 2010 B, | | | | | | | | |
6.742% 11/01/40 | | | 1,655,000 | | | | 1,691,807 | |
| | | | | | | | |
Illinois Total | | | | | | | 1,691,807 | |
| | | | | | | | |
| | | Par ($) | | | Value ($) | |
| Kentucky – 0.6% | | | | | | | | |
| KY Asset Liability Commission | | | | | | | | |
Series 2010, | | | | | | | | |
3.165% 04/01/18 | | | 19,460,000 | | | | 18,883,400 | |
| | | | | | | | |
Kentucky Total | | | | | | | 18,883,400 | |
| | | | | | | | |
| Massachusetts – 0.6% | | | | | | | | |
| MA State | | | | | | | | |
Series 2010: | | | | | | | | |
5.631% 06/01/30 | | | 5,635,000 | | | | 5,864,232 | |
5.731% 06/01/40 | | | 11,410,000 | | | | 11,722,520 | |
| | | | | | | | |
Massachusetts Total | | | | | | | 17,586,752 | |
| | | | | | | | |
| New York – 0.3% | | | | | | | | |
| NY Triborough Bridge & Tunnel Authority | | | | | |
Series 2008 C, | | | | | | | | |
5.000% 11/15/38 | | | 5,080,000 | | | | 4,917,186 | |
|
| NY New York City Municipal Water Finance Authority | |
Series 2005 D, | | | | | | | | |
5.000% 06/15/39 | | | 5,585,000 | | | | 5,380,254 | |
| | | | | | | | |
New York Total | | | | | | | 10,297,440 | |
| | | | | | | | |
Total Municipal Bonds
(cost of $73,977,413) | | | | | | | 73,564,936 | |
| | |
| | | Shares | | | | | |
|
Preferred Stocks – 1.0% | |
| | | | | | | | |
| Communications – 0.0% | |
| Media – 0.0% | |
CMP Susquehanna Radio Holdings
Corp., Series A (a)(d)(k) | | | 15,205 | | | | 152 | |
| | | | | | | | |
Media Total | | | | | | | 152 | |
| | | | | | | | |
Communications Total | | | | | | | 152 | |
| | | | | | | | |
| Financials – 1.0% | |
| Diversified Financial Services – 1.0% | |
Citigroup Capital XIII | | | 1,153,545 | | | | 31,607,133 | |
| | | | | | | | |
Diversified Financial Services Total | | | | | | | 31,607,133 | |
| | | | | | | | |
Financials Total | | | | | | | 31,607,133 | |
| | | | | | | | |
Total Preferred Stocks
(cost of $30,228,549) | | | | | | | 31,607,285 | |
23
Columbia Intermediate Bond Fund
March 31, 2011
Collateralized Mortgage Obligations – 0.4%
| | | | | | | | |
| | | Par ($) | | | Value ($) | |
| Agency – 0.0% | |
| Federal National Mortgage Association REMICS | |
9.250% 03/25/18 | | | 44,991 | | | | 50,354 | |
| | | | | | | | |
Agency Total | | | | | | | 50,354 | |
| | | | | | | | |
| Non-Agency – 0.4% | |
| American Mortgage Trust | |
8.445% 09/27/22 (d) | | | 6,993 | | | | 4,240 | |
|
| Countrywide Alternative Loan Trust | |
5.500% 09/25/35 | | | 6,044,860 | | | | 49,344 | |
|
| GSMPS Mortgage Loan Trust | |
7.750% 09/19/27 (a)(b) | | | 511,259 | | | | 517,053 | |
|
| Morgan Stanley Mortgage Loan Trust | |
0.470% 02/25/47
(04/25/11) (b)(c) | | | 7,463,033 | | | | 1,353,063 | |
|
| Nomura Asset Acceptance Corp. | |
5.957% 03/25/47
(04/01/11) (b)(c) | | | 1,357,552 | | | | 1,145,186 | |
6.138% 03/25/47
(04/01/11) (b)(c) | | | 8,597,829 | | | | 7,251,693 | |
|
| Sequoia Mortgage Trust | |
1.134% 07/20/34
(04/20/11) (b)(c) | | | 1,969,112 | | | | 672,111 | |
| | | | | | | | |
Non-Agency Total | | | | | | | 10,992,690 | |
| | | | | | | | |
Total Collateralized Mortgage Obligations
(cost of $25,544,805) | | | | 11,043,044 | |
|
Common Stocks – 0.0% | |
| | | Shares | | | | |
| Consumer Discretionary – 0.0% | |
| Hotels, Restaurants & Leisure – 0.0% | |
Six Flags Entertainment Corp. | | | 9,063 | | | | 652,534 | |
| | | | | | | | |
Hotels, Restaurants & Leisure Total | | | | | | | 652,534 | |
| | | | | | | | |
Consumer Discretionary Total | | | | | | | 652,534 | |
| | | | | | | | |
| Industrials – 0.0% | | | | | | | | |
| Airlines – 0.0% | | | | | | | | |
United Continental Holdings, Inc. (k) | | | 1,493 | | | | 34,324 | |
| | | | | | | | |
Airlines Total | | | | | | | 34,324 | |
| | | | | | | | |
Industrials Total | | | | | | | 34,324 | |
| | | | | | | | |
Total Common Stocks
(cost of $320,145) | | | | 686,858 | |
Warrants – 0.0%
| | | | | | | | |
| | | Units | | | Value ($) | |
| Financials – 0.0% | | | | | | | | |
CMP Susquehanna Radio Holdings Corp. Expires 03/23/19 (a)(d)(k) | | | 17,375 | | | | 174 | |
| | | | | | | | |
Financials Total | | | | | | | 174 | |
| | | | | | | | |
Total Warrants
(cost of $174) | | | | 174 | |
| | |
Short-Term Obligation – 0.0% | | | | | | | | |
| | | Par ($) | | | | |
Repurchase agreement with Fixed Income Clearing Corp., dated 03/31/11, due 04/01/11 at 0.070%, collateralized by a U.S. Government Agency obligation maturing 08/05/15, market value $1,370,119 (repurchase proceeds $1,343,003) | | | 1,343,000 | | | | 1,343,000 | |
| | | | | | | | |
Total Short-Term Obligation (cost of $1,343,000) | | | | | | | 1,343,000 | |
| | | | | | | | |
Total Investments – 101.4% (cost of $3,139,257,655) (m) | | | | | | | 3,157,196,671 | |
| | | | | | | | |
Other Assets & Liabilities, Net – (1.4)% | | | | (42,084,752 | ) |
| | | | | | | | |
Net Assets – 100.0% | | | | | | | 3,115,111,919 | |
Notes to Investment Portfolio:
| (a) | Security exempt from registration pursuant to Rule 144A under the Securities Act of 1933. These securities may be resold in transactions exempt from registration, normally to qualified institutional buyers. At March 31, 2011, these securities, which are not illiquid, except for the following, amounted to $384,738,966, which represents 12.4% of net assets. |
| | | | | | | | | | | | | | | | |
Security | | Acquisition
Date | | | Par/
Shares/
Units | | | Cost | | | Value | |
CMP Susquehanna Radio Holdings Corp., Series A | | | 03/26/09 | | | | 15,205 | | | $ | 152 | | | $ | 152 | |
CNB Capital Trust I Expires 03/23/19 | | | 03/26/09 | | | | 17,375 | | | | 174 | | | | 174 | |
Six Flags, Inc. 9.625% 06/01/14 | | | 05/07/10 | | | $ | 458,000 | | | | — | | | | — | |
Systems 2001 Asset Trust 6.664% 09/15/13 | | | 06/04/01 | | | $ | 1,144,813 | | | $ | 1,144,813 | | | $ | 1,251,074 | |
Wind Acquisition Finance SA 11.750% 07/15/17 | | | 03/04/11 | | | $ | 1,466,000 | | | | — | | | | 2,932 | |
| | | | | | | | | | | | | | | | |
| | | | | | | | | | | | | | $ | 1,254,332 | |
| | | | | | | | | | | | | | | | |
| (b) | The interest rate shown on floating rate or variable rate securities reflects the rate at March 31, 2011. |
| (c) | Parenthetical date represents the next interest rate reset date for the security. |
See Accompanying Notes to Financial Statements.
24
Columbia Intermediate Bond Fund
March 31, 2011
| (d) | Represents fair value as determined in good faith under procedures approved by the Board of Trustees. At March 31, 2011, the value of these securities amounted to $45,848, which represents less than 0.1% of net assets. |
| (e) | Security purchased on a delayed delivery basis. |
| (f) | Security has no value. |
| (g) | Investments in affiliates during the year ended March 31, 2011: |
| | | | | | | | | | | | | | | | | | | | |
Affiliate | | Value,
beginning of
period | | | Purchases | | | Sales
Proceeds | | | Interest
Income | | | Value,
end of
period | |
Merrill Lynch & Co., Inc. 5.700% 05/02/17 | | $ | 6,898,325 | | | $ | — | | | $ | 2,069,688 | | | $ | 29,695 | | | $ | — | |
Merrill Lynch & Co., Inc. 6.050% 08/15/12 | | | 1,602,008 | | | | — | | | | — | | | | 7,562 | | | | — | |
Merrill Lynch & Co., Inc. 7.750% 05/14/38 | | | 5,719,710 | | | | — | | | | — | | | | 33,325 | | | | — | |
| | | | | | | | | | | | | | | | | | | | |
Total | | $ | 14,220,043 | | | $ | — | | | $ | 2,069,688 | | | $ | 70,582 | | | $ | — | |
| | | | | | | | | | | | | | | | | | | | |
As of May 1, 2010, this company was no longer an affiliate of the Fund. The above table reflects activity for the period from April 1, 2010 through April 30, 2010.
| (h) | The issuer has filed for bankruptcy protection under Chapter 11, and is in default of certain debt covenants. Income is not being accrued. At March 31, 2011, the value of these securities amounted to $8,699,286, which represents 0.3% of net assets. |
| (j) | A portion of these securities with market values of $5,641,165 are pledged as collateral for open futures contracts. |
| (k) | Non-income producing security. |
| (l) | Position reflects anticipated residual bankruptcy claims. Income is not being accrued. |
| (m) | Cost for federal income tax purposes is $3,146,253,550 |
Generally accepted accounting principles (GAAP) require disclosure regarding the inputs and valuation techniques used to measure fair value and any changes in valuation inputs or techniques. In addition, investments shall be disclosed by major category.
The Fund categorizes its fair value measurements according to a three-level hierarchy that maximizes the use of observable inputs and minimizes the use of unobservable inputs by prioritizing that the most observable input be used when available. Observable inputs are those that market participants would use in pricing an investment based on market data obtained from sources independent of the reporting entity. Unobservable inputs are those that reflect the Fund’s assumptions about the information market participants would use in pricing an investment. An investment’s level within the fair value hierarchy is based on the lowest level of any input that is deemed significant to the asset or liability’s fair value measurement. The input levels are not necessarily an indication of the risk or liquidity associated with investments at that level. For example, certain U.S. government securities are generally high quality and liquid, however, they are reflected as Level 2 because the inputs used to determine fair value may not always be quoted prices in an active market.
Fair value inputs are summarized in the three broad levels listed below:
| • | | Level 1 — Valuations based on quoted prices for investments in active markets that the Fund has the ability to access at the measurement date (including NAV for open-end mutual funds). Valuation adjustments are not applied to Level 1 investments. |
| • | | Level 2 — Valuations based on other significant observable inputs (including quoted prices for similar securities, interest rates, prepayment speeds, credit risks, etc.). |
| • | | Level 3 — Valuations based on significant unobservable inputs (including the Fund’s own assumptions and judgment in determining the fair value of investments). |
Inputs that are used in determining fair value of an investment may include price information, credit data, volatility statistics, and other factors. These inputs can be either observable or unobservable. The availability of observable inputs can vary between investments, and is affected by various factors such as the type of investment, and the volume and level of activity for that investment or similar investments in the marketplace. The inputs will be considered by the Investment Manager, along with any other relevant factors in the calculation of an investment’s fair value. The Fund uses prices and inputs that are current as of the measurement date, which may include periods of market dislocations. During these periods, the availability of prices and inputs may be reduced for many investments. This condition could cause an investment to be reclassified between the various levels within the hierarchy. Non-U.S. equity securities actively traded in foreign markets may be reflected in Level 2 despite the availability of closing prices, because the Fund evaluates and determines whether those closing prices reflect fair value at the close of the New York Stock Exchange (NYSE) or require adjustment, as described in Note 2 to the financial statements — Security Valuation.
Investments falling into the Level 3 category are primarily supported by quoted prices from brokers and dealers participating in the market for those investments. However, these may be classified as Level 3 investments due to lack of market transparency and corroboration to support these quoted prices. Additionally, valuation models may be used as the pricing source for any remaining investments classified as Level 3. These models rely on one or more significant unobservable inputs and/or significant assumptions by the Investment Manager. Inputs used in valuations may include, but are not limited to, financial statement analysis, capital account balances, discount rates and estimated cash flows, and comparable company data.
The following table is a summary of the inputs used to value the Fund’s investments as of March 31, 2011:
| | | | | | | | | | | | | | | | |
Description | | Quoted
Prices
(Level 1) | | | Other
Significant
Observable
Inputs (Level 2) | | | Significant
Unobservable
Inputs
(Level 3) | | | Total | |
Corporate Fixed-Income Bonds & Notes | | | | | | | | | | | | | | | | |
Basic Materials | | $ | — | | | $ | 76,940,101 | | | $ | — | | | $ | 76,940,101 | |
Communications | | | — | | | | 148,267,428 | | | | 41,282 | | | | 148,308,710 | |
Consumer Cyclical | | | — | | | | 52,800,431 | | | | 5,291,305 | | | | 58,091,736 | |
Consumer Non-Cyclical | | | — | | | | 82,064,713 | | | | — | | | | 82,064,713 | |
Energy | | | — | | | | 165,586,237 | | | | — | | | | 165,586,237 | |
Financials | | | — | | | | 626,244,837 | | | | — | | | | 626,244,837 | |
Industrials | | | — | | | | 49,772,395 | | | | 1,522,755 | | | | 51,295,150 | |
Information Technology | | | — | | | | 1,986,085 | | | | — | | | | 1,986,085 | |
Technology | | | — | | | | 14,411,131 | | | | — | | | | 14,411,131 | |
Utilities | | | — | | | | 151,201,179 | | | | — | | | | 151,201,179 | |
| | | | | | | | | | | | | | | | |
Total Corporate Fixed-Income Bonds & Notes | | | — | | | | 1,369,274,537 | | | | 6,855,342 | | | | 1,376,129,879 | |
| | | | | | | | | | | | | | | | |
Total Commercial Mortgage-Backed Securities | | | — | | | | 580,975,155 | | | | — | | | | 580,975,155 | |
| | | | | | | | | | | | | | | | |
Government & Agency Obligations | | | | | | | | | | | | | | | | |
Foreign Government Obligations | | | — | | | | 10,946,006 | | | | — | | | | 10,946,006 | |
See Accompanying Notes to Financial Statements.
25
Columbia Intermediate Bond Fund
March 31, 2011
| | | | | | | | | | | | | | | | |
Description | | Quoted
Prices
(Level 1) | | | Other
Significant
Observable
Inputs
(Level 2) | | | Significant
Unobservable
Inputs
(Level 3) | | | Total | |
U.S. Government Obligations | | | 476,859,398 | | | | — | | | | — | | | | 476,859,398 | |
| | | | | | | | | | | | | | | | |
Total Government & Agency Obligations | | | 476,859,398 | | | | 10,946,006 | | | | — | | | | 487,805,404 | |
| | | | | | | | | | | | | | | | |
Total Mortgage-Backed Securities | | | — | | | | 470,217,321 | | | | — | | | | 470,217,321 | |
| | | | | | | | | | | | | | | | |
Total Asset-Backed Securities | | | — | | | | 123,823,615 | | | | — | | | | 123,823,615 | |
| | | | | | | | | | | | | | | | |
Total Municipal Bonds | | | — | | | | 73,564,936 | | | | — | | | | 73,564,936 | |
| | | | | | | | | | | | | | | | |
Preferred Stocks | | | | | | | | | | | | | | | | |
Communications | | | — | | | | — | | | | 152 | | | | 152 | |
Energy | | | — | | | | 31,607,133 | | | | — | | | | 31,607,133 | |
| | | | | | | | | | | | | | | | |
Total Preferred Stocks | | | — | | | | 31,607,133 | | | | 152 | | | | 31,607,285 | |
| | | | | | | | | | | | | | | | |
Collateralized Mortgage Obligations | | | | | | | | | | | | | | | | |
Agency | | | — | | | | 50,354 | | | | — | | | | 50,354 | |
Non—Agency | | | — | | | | 10,988,450 | | | | 4,240 | | | | 10,992,690 | |
| | | | | | | | | | | | | | | | |
Total Collateralized Mortgage Obligations | | | — | | | | 11,038,804 | | | | 4,240 | | | | 11,043,044 | |
| | | | | | | | | | | | | | | | |
Total Common Stocks | | | 686,858 | | | | — | | | | — | | | | 686,858 | |
| | | | | | | | | | | | | | | | |
Total Warrants | | | — | | | | — | | | | 174 | | | | 174 | |
| | | | | | | | | | | | | | | | |
Total Short-Term Obligation | | | — | | | | 1,343,000 | | | | — | | | | 1,343,000 | |
| | | | | | | | | | | | | | | | |
Total Investments | | | 477,546,256 | | | | 2,672,790,507 | | | | 6,859,908 | | | | 3,157,196,671 | |
| | | | | | | | | | | | | | | | |
Unrealized Appreciation on Credit Default Swap Contracts | | | — | | | | 141,149 | | | | — | | | | 141,149 | |
| | | | | | | | | | | | | | | | |
Description | | Quoted
Prices
(Level 1) | | | Other
Significant
Observable
Inputs (Level 2) | | | Significant
Unobservable
Inputs
(Level 3) | | | Total | |
Unrealized Depreciation on Credit Default Swap Contracts | | | — | | | | (101,914 | ) | | | — | | | | (101,914 | ) |
Unrealized Appreciation on Futures Contracts | | | 778,589 | | | | — | | | | — | | | | 778,589 | |
Unrealized Depreciation on Futures Contracts | | | (356,692 | ) | | | — | | | | — | | | | (356,692 | ) |
| | | | | | | | | | | | | | | | |
Total | | $ | 477,968,153 | | | $ | 2,672,829,742 | | | $ | 6,859,908 | | | $ | 3,157,657,803 | |
| | | | | | | | | | | | | | | | |
The Fund’s assets assigned to the Level 2 input category are generally valued using the market approach, in which a security’s value is determined through its correlation to prices and information from market transactions for similar or identical assets.
Certain short-term obligations may be valued using amortized cost, an income approach which converts future cash flows to a present value based upon the discount or premium at purchase.
The Fund’s assets assigned to the Level 3 category are valued utilizing the valuation technique deemed the most appropriate in the circumstances. Certain Corporate Fixed Income Bonds & Notes, Preferred Stock, and Warrants classified as Level 3 are valued using a market approach. To determine fair value for these securities, management considered various factors which may have included, but were not limited to, trades of similar securities, estimated earnings of the respective company, market multiples derived from a set of comparable companies, and the position of the security within the respective company’s capital structure. Certain Corporate Fixed-Income Bonds & Notes classified as Level 3 securities are valued using the market approach and utilize single market quotations from broker dealers. Certain Collateralized Mortgage Obligations classified as Level 3 securities are valued using the market approach. To determine fair value for these securities, management considered various factors which may have included, but were not limited to, estimated cash flows of the securities and observed yields on securities management deemed comparable.
There were no significant transfers of financial assets between Levels 1 and 2 during the period.
The following table reconciles asset balances for the year ending March 31, 2011, in which significant unobservable inputs (Level 3) were used in determining value:
| | | | | | | | | | | | | | | | | | | | | | | | | | | | | | | | | | | | |
Investments in
Securities | | Balance as of
March 31,
2010 | | | Accrued
Discounts
(Premiums) | | | Realized
Gain (Loss) | | | Change in
Unrealized
Appreciation
(Depreciation) | | | Purchases | | | Sales | | | Transfers
into Level 3 | | | Transfers out
of Level 3 | | | Balance as of
March 31, 2011 | |
Corporate Fixed-Income Bonds & Notes | | | | | | | | | | | | | | | | | | | | | | | | | | | | | | | | | | | | |
Communications | | $ | 22,420 | | | $ | 713 | | | $ | — | | | $ | (7,130 | ) | | $ | 25,279 | | | $ | — | | | $ | — | | | $ | — | | | $ | 41,282 | |
Consumer Cyclical | | | 4,982,801 | | | | 694 | | | | 136,905 | | | | 22,091 | | | | 1,635,554 | | | | (1,486,740 | ) | | | — | | | | — | | | | 5,291,305 | |
Industrials | | | 1,604,722 | | | | — | | | | — | | | | 330,319 | | | | — | | | | (412,286 | ) | | | — | | | | — | | | | 1,522,755 | |
Collateralized Mortgage Obligations | | | | | | | | | | | | | | | | | | | | | | | | | | | | | | | | | | | | |
Non-Agency | | | 4,573 | | | | — | | | | 44 | | | | 172 | | | | — | | | | (549 | ) | | | — | | | | — | | | | 4,240 | |
Warrants | | | | | | | | | | | | | | | | | | | | | | | | | | | | | | | | | | | | |
Financials | | | 101 | | | | — | | | | — | | | | — | | | | 73 | | | | — | | | | — | | | | — | | | | 174 | |
Preferred Stocks | | | | | | | | | | | | | | | | | | | | | | | | | | | | | | | | | | | | |
Communications | | | 89 | | | | — | | | | — | | | | — | | | | 63 | | | | — | | | | — | | | | — | | | | 152 | |
| | | | | | | | | | | | | | | | | | | | | | | | | | | | | | | | | | | | |
| | $ | 6,614,706 | | | $ | 1,407 | | | $ | 136,949 | | | $ | 345,452 | | | $ | 1,660,969 | | | $ | (1,899,575 | ) | | $ | — | | | $ | — | | | $ | 6,859,908 | |
| | | | | | | | | | | | | | | | | | | | | | | | | | | | | | | | | | | | |
See Accompanying Notes to Financial Statements.
26
Columbia Intermediate Bond Fund
March 31, 2011
The information in the above reconciliation represents fiscal year to date activity for any securities identified as using Level 3 inputs at either the beginning or the end of the current fiscal period.
The change in unrealized appreciation attributable to securities owned at March 31, 2011, which were valued using significant unobservable inputs (Level 3) amounted to $345,452. This amount is included in net change in unrealized appreciation (depreciation) on the Statement of Changes in Net Assets.
At March 31, 2011, the Fund has entered into the following credit default swap contracts:
Credit Risk
| | | | | | | | | | | | | | | | | | | | | | | | | | |
Swap Counterparty | | Referenced Obligation | | Receive
Buy/Sell
Protection | | | Fixed
Rate | | | Expiration
Date | | | Notional
Amount | | | Upfront Premium
Paid (Received) | | | Value of
Contract | |
Barclays Capital | | D.R. Horton, Inc. | | | Buy | | | | 1.000 | % | | | 06/20/16 | | | $ | 19,280,000 | | | $ | 1,064,568 | | | $ | (5,877 | ) |
Barclays Capital | | The Home Depot, Inc. | | | Buy | | | | 1.000 | % | | | 06/20/16 | | | | 21,410,000 | | | | (400,398 | ) | | | (2,858 | ) |
Barclays Capital | | Toll Brothers, Inc. | | | Buy | | | | 1.000 | % | | | 06/20/16 | | | | 24,000,000 | | | | 1,005,826 | | | | 53,494 | |
Credit Suisse First Boston | | Marriott International, Inc. | | | Buy | | | | 1.000 | % | | | 06/20/16 | | | | 11,000,000 | | | | (69,910 | ) | | | 27,793 | |
Credit Suisse First Boston | | Morgan Stanley | | | Buy | | | | 1.000 | % | | | 06/20/16 | | | | 12,000,000 | | | | 201,190 | | | | 28,679 | |
Credit Suisse First Boston | | Textron, Inc. | | | Buy | | | | 1.000 | % | | | 06/20/16 | | | | 12,000,000 | | | | 200,648 | | | | 10,905 | |
JPMorgan | | D.R. Horton, Inc. | | | Buy | | | | 1.000 | % | | | 03/20/15 | | | | 17,400,000 | | | | 759,337 | | | | (89,510 | ) |
JPMorgan | | Macy’s, Inc. | | | Buy | | | | 1.000 | % | | | 06/20/16 | | | | 12,010,000 | | | | 256,607 | | | | (3,669 | ) |
Morgan Stanley | | Limited Brands, Inc. | | | Buy | | | | 1.000 | % | | | 06/20/16 | | | | 11,750,000 | | | | 452,487 | | | | 20,278 | |
| | | | | | | | | | | | | | | | | | | | | | | | | | |
| | | | | | | | | | | | | | | | | | | | | | | | $ | 39,235 | |
| | | | | | | | | | | | | | | | | | | | | | | | | | |
At March 31, 2011, the Fund held the following open short futures contracts:
Risk Exposure/Type
| | | | | | | | | | | | | | | | | | | | |
Interest
Rate Risk | | Number of
Contracts | | | Value | | | Aggregate
Face Value | | | Expiration
Date | | | Unrealized
Appreciation
(Depreciation) | |
2-Year U.S. Treasury Notes | | | 1,252 | | | $ | 273,092,500 | | | $ | 273,114,536 | | | | June-2011 | | | $ | 22,036 | |
5-Year U.S. Treasury Notes | | | 1,969 | | | | 229,957,665 | | | | 229,920,500 | | | | June-2011 | | | | (37,165 | ) |
10-Year U.S. Treasury Notes | | | 1,899 | | | | 226,040,344 | | | | 226,796,897 | | | | June-2011 | | | | 756,553 | |
30-Year U.S. Treasury Bonds | | | 1,296 | | | | 155,763,000 | | | | 155,708,146 | | | | June-2011 | | | | (54,854 | ) |
Ultra Long U.S. Treasury Bonds | | | 243 | | | | 30,025,688 | | | | 29,761,015 | | | | June-2011 | | | | (264,673 | ) |
| | | | | | | | | | | | | | | | | | | | |
| | | | | | | | | | | | | | | | | | $ | 421,897 | |
| | | | | | | | | | | | | | | | | | | | |
At March 31, 2011, cash of $2,180,000 was pledged as collateral for open futures contracts.
At March 31, 2011, asset allocation of the Fund is as follows:
| | | | |
Asset Allocation (Unaudited) | | % of
Net Assets | |
Corporate Fixed-Income Bonds & Notes | | | 44.2 | |
Commercial Mortgage-Backed Securities | | | 18.6 | |
Government & Agency Obligations | | | 15.7 | |
Mortgage-Backed Securities | | | 15.1 | |
Asset-Backed Securities | | | 4.0 | |
Municipal Bonds | | | 2.4 | |
Preferred Stocks | | | 1.0 | |
Collateralized Mortgage Obligations | | | 0.4 | |
Common Stocks | | | 0.0 | * |
Warrants | | | 0.0 | * |
| | | | |
| | | 101.4 | |
Short-Term Obligation | | | 0.0 | * |
Other Assets & Liabilities, Net | | | (1.4 | ) |
| | | | |
| | | 100.0 | |
| | | | |
| * | Represents less than 0.1% of net assets. |
| | |
Acronym | | Name |
| I.O. | | Interest Only |
| PIK | | Payment-In-Kind |
| REMICS | | Real Estate Mortgage Investment Conduits |
| STRIPS | | Separate Trading of Registered Interest and Principal of
Securities |
| TBA | | To Be Announced |
See Accompanying Notes to Financial Statements.
27
Statement of Assets and Liabilities – Columbia Intermediate Bond Fund
March 31, 2011
| | | | | | |
| | | | | ($) | |
| Assets | | Investments, at identified cost | | | 3,139,257,655 | |
| | | | | | |
| | Investments, at value | | | 3,157,196,671 | |
| | Cash | | | 279,283 | |
| | Cash collateral for open futures contracts | | | 2,180,000 | |
| | Open credit default swap contracts | | | 141,149 | |
| | Credit default swap contracts premiums paid | | | 3,776,195 | |
| | Receivable for: | | | | |
| | Investments sold | | | 210,980,260 | |
| | Fund shares sold | | | 3,387,911 | |
| | Dividends | | | 544 | |
| | Interest | | | 26,521,066 | |
| | Futures variation margin | | | 100,953 | |
| | Foreign tax reclaims | | | 2,853 | |
| | Expense reimbursement due from Investment Manager | | | 315,066 | |
| | Trustees’ deferred compensation plan | | | 131,916 | |
| | Prepaid expenses | | | 6,189 | |
| | Other assets | | | 960,537 | |
| | | | | | |
| | Total Assets | | | 3,405,980,593 | |
| | |
| Liabilities | | Open credit default swap contracts | | | 101,914 | |
| | Credit default swap contracts premiums received | | | 469,423 | |
| | Payable for: | | | | |
| | Investments purchased | | | 224,517,945 | |
| | Investments purchased on a delayed delivery basis | | | 53,885,090 | |
| | Fund shares repurchased | | | 3,991,471 | |
| | Distributions | | | 5,393,619 | |
| | Investment advisory fee | | | 1,100,138 | |
| | Administration fee | | | 194,252 | |
| | Pricing and bookkeeping fees | | | 25,700 | |
| | Transfer agent fee | | | 634,174 | |
| | Trustees’ fees | | | 76,416 | |
| | Custody fee | | | 24,017 | |
| | Distribution and service fees | | | 81,650 | |
| | Chief compliance officer expenses | | | 1,146 | |
| | Trustees’ deferred compensation plan | | | 131,916 | |
| | Merger costs | | | 64,965 | |
| | Other liabilities | | | 174,838 | |
| | | | | | |
| | Total Liabilities | | | 290,868,674 | |
| | |
| | | | | | |
| | Net Assets | | | 3,115,111,919 | |
| | |
| Net Assets Consist of | | Paid-in capital | | | 3,138,197,589 | |
| | Undistributed net investment income | | | 5,971,277 | |
| | Accumulated net realized loss | | | (46,235,203 | ) |
| | Net unrealized appreciation (depreciation) on: | | | | |
| | Investments | | | 17,939,016 | |
| | Credit default swap contracts | | | (1,182,657 | ) |
| | Futures contracts | | | 421,897 | |
| | | | | | |
| | Net Assets | | | 3,115,111,919 | |
See Accompanying Notes to Financial Statements.
28
Statement of Assets and Liabilities (continued) – Columbia Intermediate Bond Fund
March 31, 2011
| | | | | | |
| | | | | | |
| Class A | | Net assets | | $ | 201,505,684 | |
| | Shares outstanding | | | 22,202,768 | |
| | Net asset value per share | | $ | 9.08 | (a) |
| | Maximum sales charge | | | 3.25 | % |
| | Maximum offering price per share ($9.08/0.9675) | | $ | 9.39 | (b) |
| | |
| Class B | | Net assets | | $ | 14,778,949 | |
| | Shares outstanding | | | 1,628,486 | |
| | Net asset value and offering price per share | | $ | 9.08 | (a) |
| | |
| Class C | | Net assets | | $ | 33,885,488 | |
| | Shares outstanding | | | 3,733,725 | |
| | Net asset value and offering price per share | | $ | 9.08 | (a) |
| | |
| Class I (c) | | Net assets | | $ | 26,865,991 | |
| | Shares outstanding | | | 2,960,065 | |
| | Net asset value, offering and redemption price per share | | $ | 9.08 | |
| | |
| Class R | | Net assets | | $ | 2,969,431 | |
| | Shares outstanding | | | 327,169 | |
| | Net asset value, offering and redemption price per share | | $ | 9.08 | |
| | |
| Class W (c) | | Net assets | | $ | 2,490 | |
| | Shares outstanding | | | 274 | |
| | Net asset value, offering and redemption price per share | | $ | 9.08 | (d) |
| | |
| Class Z | | Net assets | | $ | 2,835,103,886 | |
| | Shares outstanding | | | 312,382,349 | |
| | Net asset value, offering and redemption price per share | | $ | 9.08 | |
| (a) | Redemption price per share is equal to net asset value less any applicable contingent deferred sales charge. |
| (b) | On sales of $50,000 or more the offering price is reduced. |
| (c) | Shares commenced operations on September 27, 2010. |
| (d) | Net asset value per share rounds to this amount due to fractional shares outstanding. |
See Accompanying Notes to Financial Statements.
29
Statement of Operations – Columbia Intermediate Bond Fund
For the Year Ended March 31, 2011
| | | | | | |
| | | | | ($) | |
| Investment Income | | Dividends | | | 483,175 | |
| | Interest | | | 110,436,285 | |
| | Interest from affiliates | | | 70,582 | |
| | Securities lending | | | 424 | |
| | Foreign taxes withheld | | | (3,190 | ) |
| | | | | | |
| | Total Investment Income | | | 110,987,276 | |
| | |
| Expenses | | Investment advisory fee | | | 7,418,391 | |
| | Administration fee | | | 3,168,164 | |
| | Distribution fee: | | | | |
| | Class A | | | 73,213 | |
| | Class B | | | 157,315 | |
| | Class C | | | 239,349 | |
| | Class R | | | 10,576 | |
| | Service fee: | | | | |
| | Class A | | | 428,372 | |
| | Class B | | | 52,461 | |
| | Class C | | | 79,820 | |
| | Class W | | | 3 | |
| | Pricing and bookkeeping fees | | | 191,945 | |
| | Transfer agent fee: | | | | |
| | Class A, Class B, Class C, Class R, Class W and Class Z | | | 3,617,832 | |
| | Trustees’ fees | | | 107,922 | |
| | Custody fee | | | 97,986 | |
| | Chief compliance officer expenses | | | 3,247 | |
| | Merger costs | | | 38,176 | |
| | Other expenses | | | 588,117 | |
| | | | | | |
| | Expenses before interest expense | | | 16,272,889 | |
| | Interest expense | | | 6,262 | |
| | | | | | |
| | Total Expenses | | | 16,279,151 | |
| | Fees waived or expenses reimbursed by Investment Manager | | | (285,433 | ) |
| | Fees waived by distributor – Class A | | | (73,213 | ) |
| | Fees waived by distributor – Class C | | | (48,001 | ) |
| | Expense reductions | | | (1,296 | ) |
| | | | | | |
| | Net Expenses | | | 15,871,208 | |
| | |
| | | | | | |
| | Net Investment Income | | | 95,116,068 | |
| | |
| Net Realized and Unrealized Gain (Loss) on Investments, Foreign Currency, Credit Default Swap Contracts and Futures Contracts | | Net realized gain (loss) on: | | | | |
| | Investments | | | 84,593,635 | |
| | Foreign currency transactions and forward foreign currency exchange contracts | | | 57,774 | |
| | Credit default swap contracts | | | (7,308,077 | ) |
| | Futures contracts | | | (29,264,373 | ) |
| | | | | | |
| | Net realized gain | | | 48,078,959 | |
| | |
| | Net change in unrealized appreciation (depreciation) on: | | | | |
| | Investments | | | (16,534,410 | ) |
| | Foreign currency translations and forward foreign currency exchange contracts | | | (10,897 | ) |
| | Credit default swap contracts | | | 1,176,967 | |
| | Futures contracts | | | 555,447 | |
| | | | | | |
| | Net change in unrealized appreciation (depreciation) | | | (14,812,893 | ) |
| | | | | | |
| | Net Gain | | | 33,266,066 | |
| | |
| | | | | | |
| | Net Increase Resulting from Operations | | | 128,382,134 | |
See Accompanying Notes to Financial Statements.
30
Statement of Changes in Net Assets – Columbia Intermediate Bond Fund
| | | | | | | | | | |
| | | | | Year Ended March 31, | |
| Increase (Decrease) in Net Assets | | | | 2011 ($)(a)(b) | | | 2010 ($) | |
| Operations | | Net investment income | | | 95,116,068 | | | | 109,896,693 | |
| | Net realized gain on investments, futures contracts, credit default swap contracts, foreign currency transactions and forward foreign currency exchange contracts | | | 48,078,959 | | | | 45,143,681 | |
| | Net change in unrealized appreciation (depreciation) on investments, futures contracts, credit default swap contracts, foreign currency translations and forward foreign currency exchange contracts | | | (14,812,893 | ) | | | 268,129,654 | |
| | | | | | | | | | |
| | Net increase resulting from operations | | | 128,382,134 | | | | 423,170,028 | |
| | | |
| Distributions to Shareholders | | From net investment income: | | | | | | | | |
| | Class A | | | (7,214,879 | ) | | | (8,661,981 | ) |
| | Class B | | | (739,759 | ) | | | (1,657,924 | ) |
| | Class C | | | (1,154,247 | ) | | | (1,539,099 | ) |
| | Class I | | | (372,845 | ) | | | — | |
| | Class R | | | (83,519 | ) | | | (91,882 | ) |
| | Class W | | | (53 | ) | | | — | |
| | Class Z | | | (89,900,842 | ) | | | (106,473,961 | ) |
| | | | | | | | | | |
| | Total distributions to shareholders | | | (99,466,144 | ) | | | (118,424,847 | ) |
| | | |
| | Net Capital Stock Transactions | | | 885,941,150 | | | | (39,345,318 | ) |
| | | |
| | Increase from regulatory settlements | | | — | | | | 62,349 | |
| | | | | | | | | | |
| | Total increase in net assets | | | 914,857,140 | | | | 265,462,212 | |
| | | |
| Net Assets | | Beginning of period | | | 2,200,254,779 | | | | 1,934,792,567 | |
| | End of period | | | 3,115,111,919 | | | | 2,200,254,779 | |
| | Undistributed net investment income at end of period | | | 5,971,277 | | | | 3,578,700 | |
| (a) | Class I and Class W shares commenced operations on September 27, 2010. |
| (b) | Class I and Class W shares reflect activity for the period September 27, 2010 through March 31, 2011. |
See Accompanying Notes to Financial Statements.
31
Statement of Changes in Net Assets (continued) – Columbia Intermediate Bond Fund
| | | | | | | | | | | | | | | | |
| | | Capital Stock Activity | |
| | | Year Ended
March 31, 2011 | | | Year Ended
March 31, 2010 | |
| | | Shares | | | Dollars ($) | | | Shares | | | Dollars ($) | |
Class A | | | | | | | | | | | | | | | | |
Subscriptions | | | 8,124,359 | | | | 73,677,940 | | | | 4,024,261 | | | | 34,577,227 | |
Proceeds received in connection with merger | | | 2,333,001 | | | | 21,232,776 | | | | — | | | | — | |
Distributions reinvested | | | 609,774 | | | | 5,545,462 | | | | 925,715 | | | | 7,967,506 | |
Redemptions | | | (7,117,402 | ) | | | (64,633,788 | ) | | | (6,581,064 | ) | | | (55,926,745 | ) |
| | | | | | | | | | | | | | | | |
Net increase (decrease) | | | 3,949,732 | | | | 35,822,390 | | | | (1,631,088 | ) | | | (13,382,012 | ) |
| | | | |
Class B | | | | | | | | | | | | | | | | |
Subscriptions | | | 140,312 | | | | 1,277,407 | | | | 261,450 | | | | 2,231,931 | |
Proceeds received in connection with merger | | | 241,230 | | | | 2,196,216 | | | | — | | | | — | |
Distributions reinvested | | | 52,208 | | | | 474,114 | | | | 145,598 | | | | 1,250,813 | |
Redemptions | | | (2,322,802 | ) | | | (21,037,558 | ) | | | (1,716,488 | ) | | | (14,622,868 | ) |
| | | | | | | | | | | | | | | | |
Net decrease | | | (1,889,052 | ) | | | (17,089,821 | ) | | | (1,309,440 | ) | | | (11,140,124 | ) |
| | | | |
Class C | | | | | | | | | | | | | | | | |
Subscriptions | | | 954,928 | | | | 8,668,767 | | | | 568,812 | | | | 4,851,110 | |
Proceeds received in connection with merger | | | 356,235 | | | | 3,242,350 | | | | — | | | | — | |
Distributions reinvested | | | 78,335 | | | | 712,366 | | | | 118,250 | | | | 1,017,027 | |
Redemptions | | | (1,090,068 | ) | | | (9,890,301 | ) | | | (1,318,313 | ) | | | (11,247,492 | ) |
| | | | | | | | | | | | | | | | |
Net increase (decrease) | | | 299,430 | | | | 2,733,182 | | | | (631,251 | ) | | | (5,379,355 | ) |
| | | | |
Class I | | | | | | | | | | | | | | | | |
Subscriptions | | | 3,357,119 | | | | 30,325,418 | | | | — | | | | — | |
Distributions reinvested | | | 41,047 | | | | 372,817 | | | | — | | | | — | |
Redemptions | | | (438,101 | ) | | | (3,986,516 | ) | | | — | | | | — | |
| | | | | | | | | | | | | | | | |
Net increase | | | 2,960,065 | | | | 26,711,719 | | | | — | | | | — | |
| | | | |
Class R | | | | | | | | | | | | | | | | |
Subscriptions | | | 226,396 | | | | 2,049,043 | | | | 133,154 | | | | 1,145,681 | |
Distributions reinvested | | | 7,427 | | | | 67,565 | | | | 6,664 | | | | 57,659 | |
Redemptions | | | (95,997 | ) | | | (871,883 | ) | | | (186,232 | ) | | | (1,602,433 | ) |
| | | | | | | | | | | | | | | | |
Net increase (decrease) | | | 137,826 | | | | 1,244,725 | | | | (46,414 | ) | | | (399,093 | ) |
| | | | |
Class W | | | | | | | | | | | | | | | | |
Subscriptions | | | 287 | | | | 2,650 | | | | — | | | | — | |
Distributions reinvested | | | 3 | | | | 27 | | | | — | | | | — | |
Redemptions | | | (16 | ) | | | (150 | ) | | | — | | | | — | |
| | | | | | | | | | | | | | | | |
Net increase | | | 274 | | | | 2,527 | | | | — | | | | — | |
| | | | |
Class Z | | | | | | | | | | | | | | | | |
Subscriptions | | | 43,106,433 | | | | 391,038,496 | | | | 47,943,504 | | | | 410,119,481 | |
Proceeds received in connection with merger | | | 109,206,406 | | | | 993,835,287 | | | | — | | | | — | |
Distributions reinvested | | | 4,554,507 | | | | 41,422,559 | | | | 5,832,159 | | | | 50,260,132 | |
Redemptions | | | (64,976,377 | ) | | | (589,779,914 | ) | | | (55,004,873 | ) | | | (469,424,347 | ) |
| | | | | | | | | | | | | | | | |
Net increase (decrease) | | | 91,890,969 | | | | 836,516,428 | | | | (1,229,210 | ) | | | (9,044,734 | ) |
See Accompanying Notes to Financial Statements.
32
Financial Highlights – Columbia Intermediate Bond Fund
Selected data for a share outstanding throughout each period is as follows:
| | | | | | | | | | | | | | | | | | | | |
| | | Year Ended March 31, | |
| Class A Shares | | 2011 | | | 2010 | | | 2009 | | | 2008 | | | 2007 | |
Net Asset Value, Beginning of Period | | $ | 8.95 | | | $ | 7.72 | | | $ | 8.71 | | | $ | 8.84 | | | $ | 8.74 | |
| | | | | |
Income from Investment Operations: | | | | | | | | | | | | | | | | | | | | |
Net investment income (a) | | | 0.36 | | | | 0.43 | | | | 0.43 | | | | 0.43 | | | | 0.42 | |
Net realized and unrealized gain (loss) on investments, foreign currency, futures contracts and credit default swap contracts | | | 0.15 | | | | 1.26 | | | | (0.97 | ) | | | (0.13 | ) | | | 0.11 | |
| | | | | | | | | | | | | | | | | | | | |
Total from investment operations | | | 0.51 | | | | 1.69 | | | | (0.54 | ) | | | 0.30 | | | | 0.53 | |
| | | | | |
Less Distributions to Shareholders: | | | | | | | | | | | | | | | | | | | | |
From net investment income | | | (0.38 | ) | | | (0.46 | ) | | | (0.43 | ) | | | (0.43 | ) | | | (0.43 | ) |
From net realized gains | | | — | | | | — | | | | (0.02 | ) | | | — | | | | — | |
| | | | | | | | | | | | | | | | | | | | |
Total distributions to shareholders | | | (0.38 | ) | | | (0.46 | ) | | | (0.45 | ) | | | (0.43 | ) | | | (0.43 | ) |
| | | | | |
Increase from regulatory settlements | | | — | | | | — | (b) | | | — | | | | — | | | | — | |
| | | | | |
Net Asset Value, End of Period | | $ | 9.08 | | | $ | 8.95 | | | $ | 7.72 | | | $ | 8.71 | | | $ | 8.84 | |
Total return (c)(d) | | | 5.80 | % | | | 22.31 | % | | | (6.34 | )% | | | 3.48 | % | | | 6.21 | %(e) |
| | | | | |
Ratios to Average Net Assets/Supplemental Data: | | | | | | | | | | | | | | | | | | | | |
Net expenses before interest expense (f) | | | 0.92 | % | | | 0.90 | % | | | 0.89 | % | | | 0.88 | % | | | 0.87 | % |
Interest expense | | | — | %(g) | | | — | %(g) | | | — | %(g) | | | — | | | | — | |
Net expenses (f) | | | 0.92 | % | | | 0.90 | % | | | 0.89 | % | | | 0.88 | % | | | 0.87 | % |
Waiver/Reimbursement | | | 0.05 | % | | | 0.10 | % | | | 0.10 | % | | | 0.10 | % | | | 0.10 | % |
Net investment income (f) | | | 4.02 | % | | | 5.01 | % | | | 5.33 | % | | | 4.88 | % | | | 4.83 | % |
Portfolio turnover rate | | | 177 | % | | | 160 | % | | | 137 | % | | | 266 | % | | | 150 | % |
Net assets, end of period (000s) | | $ | 201,506 | | | $ | 163,333 | | | $ | 153,435 | | | $ | 207,215 | | | $ | 206,147 | |
| (a) | Per share data was calculated using the average shares outstanding during the period. |
| (b) | Rounds to less than $0.01 per share. |
| (c) | Total return at net asset value assuming all distributions reinvested and no initial sales charge or contingent deferred sales charge. |
| (d) | Had the Investment Manager and/or any of its affiliates not waived fees or reimbursed a portion of expenses, total return would have been reduced. |
| (e) | Total return includes a voluntary reimbursement by the investment advisor for a realized investment loss due to a trading error. This reimbursement increased total return and net asset value per share by less than 0.01% and less than $0.01, respectively. |
| (f) | The benefits derived from expense reductions had an impact of less than 0.01%. |
| (g) | Rounds to less than 0.01%. |
See Accompanying Notes to Financial Statements.
33
Financial Highlights – Columbia Intermediate Bond Fund
Selected data for a share outstanding throughout each period is as follows:
| | | | | | | | | | | | | | | | | | | | |
| | | Year Ended March 31, | |
| Class B Shares | | 2011 | | | 2010 | | | 2009 | | | 2008 | | | 2007 | |
Net Asset Value, Beginning of Period | | $ | 8.95 | | | $ | 7.72 | | | $ | 8.71 | | | $ | 8.84 | | | $ | 8.74 | |
| | | | | |
Income from Investment Operations: | | | | | | | | | | | | | | | | | | | | |
Net investment income (a) | | | 0.30 | | | | 0.37 | | | | 0.37 | | | | 0.36 | | | | 0.36 | |
Net realized and unrealized gain (loss) on investments, foreign currency, futures contracts and credit default swap contracts | | | 0.15 | | | | 1.26 | | | | (0.97 | ) | | | (0.12 | ) | | | 0.10 | |
| | | | | | | | | | | | | | | | | | | | |
Total from investment operations | | | 0.45 | | | | 1.63 | | | | (0.60 | ) | | | 0.24 | | | | 0.46 | |
| | | | | |
Less Distributions to Shareholders: | | | | | | | | | | | | | | | | | | | | |
From net investment income | | | (0.32 | ) | | | (0.40 | ) | | | (0.37 | ) | | | (0.37 | ) | | | (0.36 | ) |
From net realized gains | | | — | | | | — | | | | (0.02 | ) | | | — | | | | — | |
| | | | | | | | | | | | | | | | | | | | |
Total distributions to shareholders | | | (0.32 | ) | | | (0.40 | ) | | | (0.39 | ) | | | (0.37 | ) | | | (0.36 | ) |
| | | | | |
Increase from regulatory settlements | | | — | | | | — | (b) | | | — | | | | — | | | | — | |
| | | | | |
Net Asset Value, End of Period | | $ | 9.08 | | | $ | 8.95 | | | $ | 7.72 | | | $ | 8.71 | | | $ | 8.84 | |
Total return (c) | | | 5.03 | %(d) | | | 21.41 | % | | | (7.04 | )% | | | 2.72 | % | | | 5.42 | %(e) |
| | | | | |
Ratios to Average Net Assets/Supplemental Data: | | | | | | | | | | | | | | | | | | | | |
Net expenses before interest expense (f) | | | 1.67 | % | | | 1.65 | % | | | 1.64 | % | | | 1.63 | % | | | 1.62 | % |
Interest expense | | | — | %(g) | | | — | %(g) | | | — | %(g) | | | — | | | | — | |
Net expenses (f) | | | 1.67 | % | | | 1.65 | % | | | 1.64 | % | | | 1.63 | % | | | 1.62 | % |
Waiver/Reimbursement | | | 0.01 | % | | | — | | | | — | | | | — | | | | — | |
Net investment income (f) | | | 3.32 | % | | | 4.29 | % | | | 4.59 | % | | | 4.14 | % | | | 4.08 | % |
Portfolio turnover rate | | | 177 | % | | | 160 | % | | | 137 | % | | | 266 | % | | | 150 | % |
Net assets, end of period (000s) | | $ | 14,779 | | | $ | 31,476 | | | $ | 37,247 | | | $ | 56,087 | | | $ | 63,617 | |
| (a) | Per share data was calculated using the average shares outstanding during the period. |
| (b) | Rounds to less than $0.01 per share. |
| (c) | Total return at net asset value assuming all distributions reinvested and no contingent deferred sales charge. |
| (d) | Had the Investment Manager and/or any of its affiliates not waived fees or reimbursed a portion of expenses, total return would have been reduced. |
| (e) | Total return includes a voluntary reimbursement by the investment advisor for a realized investment loss due to a trading error. This reimbursement increased total return and net asset value per share by less than 0.01% and less than $0.01, respectively. |
| (f) | The benefits derived from expense reductions had an impact of less than 0.01%. |
| (g) | Rounds to less than 0.01%. |
See Accompanying Notes to Financial Statements.
34
Financial Highlights – Columbia Intermediate Bond Fund
Selected data for a share outstanding throughout each period is as follows:
| | | | | | | | | | | | | | | | | | | | |
| | | Year Ended March 31, | |
| Class C Shares | | 2011 | | | 2010 | | | 2009 | | | 2008 | | | 2007 | |
Net Asset Value, Beginning of Period | | $ | 8.95 | | | $ | 7.72 | | | $ | 8.71 | | | $ | 8.84 | | | $ | 8.74 | |
| | | | | |
Income from Investment Operations: | | | | | | | | | | | | | | | | | | | | |
Net investment income (a) | | | 0.31 | | | | 0.38 | | | | 0.39 | | | | 0.37 | | | | 0.37 | |
Net realized and unrealized gain (loss) on investments, foreign currency, futures contracts and credit default swap contracts | | | 0.15 | | | | 1.26 | | | | (0.98 | ) | | | (0.12 | ) | | | 0.11 | |
| | | | | | | | | | | | | | | | | | | | |
Total from investment operations | | | 0.46 | | | | 1.64 | | | | (0.59 | ) | | | 0.25 | | | | 0.48 | |
| | | | | |
Less Distributions to Shareholders: | | | | | | | | | | | | | | | | | | | | |
From net investment income | | | (0.33 | ) | | | (0.41 | ) | | | (0.38 | ) | | | (0.38 | ) | | | (0.38 | ) |
From net realized gains | | | — | | | | — | | | | (0.02 | ) | | | — | | | | — | |
| | | | | | | | | | | | | | | | | | | | |
Total distributions to shareholders | | | (0.33 | ) | | | (0.41 | ) | | | (0.40 | ) | | | (0.38 | ) | | | (0.38 | ) |
| | | | | |
Increase from regulatory settlements | | | — | | | | — | (b) | | | — | | | | — | | | | — | |
| | | | | |
Net Asset Value, End of Period | | $ | 9.08 | | | $ | 8.95 | | | $ | 7.72 | | | $ | 8.71 | | | $ | 8.84 | |
Total return (c)(d) | | | 5.17 | % | | | 21.59 | % | | | (6.91 | )% | | | 2.87 | % | | | 5.58 | %(e) |
| | | | | |
Ratios to Average Net Assets/Supplemental Data: | | | | | | | | | | | | | | | | | | | | |
Net expenses before interest expense (f) | | | 1.52 | % | | | 1.50 | % | | | 1.49 | % | | | 1.48 | % | | | 1.47 | % |
Interest expense | | | — | %(g) | | | — | %(g) | | | — | %(g) | | | — | | | | — | |
Net expenses (f) | | | 1.52 | % | | | 1.50 | % | | | 1.49 | % | | | 1.48 | % | | | 1.47 | % |
Waiver/Reimbursement | | | 0.16 | % | | | 0.15 | % | | | 0.15 | % | | | 0.15 | % | | | 0.15 | % |
Net investment income (f) | | | 3.42 | % | | | 4.43 | % | | | 4.74 | % | | | 4.28 | % | | | 4.23 | % |
Portfolio turnover rate | | | 177 | % | | | 160 | % | | | 137 | % | | | 266 | % | | | 150 | % |
Net assets, end of period (000s) | | $ | 33,885 | | | $ | 30,731 | | | $ | 31,372 | | | $ | 37,164 | | | $ | 35,458 | |
| (a) | Per share data was calculated using the average shares outstanding during the period. |
| (b) | Rounds to less than $0.01 per share. |
| (c) | Total return at net asset value assuming all distributions reinvested and no contingent deferred sales charge. |
| (d) | Had the Investment Manager and/or any of its affiliates not waived fees or reimbursed a portion of expenses, total return would have been reduced. |
| (e) | Total return includes a voluntary reimbursement by the investment advisor for a realized investment loss due to a trading error. This reimbursement increased total return and net asset value per share by less than 0.01% and less than $0.01, respectively. |
| (f) | The benefits derived from expense reductions had an impact of less than 0.01%. |
| (g) | Rounds to less than 0.01%. |
See Accompanying Notes to Financial Statements.
35
Financial Highlights – Columbia Intermediate Bond Fund
Selected data for a share outstanding throughout the period is as follows:
| | | | |
| Class I Shares | | Period Ended
March 31,
2011 (a) | |
Net Asset Value, Beginning of Period | | $ | 9.21 | |
| |
Income from Investment Operations: | | | | |
Net investment income (b) | | | 0.19 | |
Net realized and unrealized loss on investments, foreign currency,
futures contracts and credit default swap contracts | | | (0.11 | ) |
| | | | |
Total from investment operations | | | 0.08 | |
| |
Less Distributions to Shareholders: | | | | |
From net investment income | | | (0.21 | ) |
| |
Net Asset Value, End of Period | | $ | 9.08 | |
Total return (c)(d)(e) | | | 0.87 | % |
| |
Ratios to Average Net Assets/Supplemental Data: | | | | |
Net expenses before interest expense (f)(g) | | | 0.52 | % |
Interest expense (g)(h) | | | — | % |
Net expenses (f)(g) | | | 0.52 | % |
Waiver/Reimbursement (g) | | | 0.01 | % |
Net investment income (f)(g) | | | 4.05 | % |
Portfolio turnover rate (e) | | | 177 | % |
Net assets, end of period (000s) | | $ | 26,866 | |
(a) Class I shares commenced operations on September 27, 2010. Per share data and total return reflect activity from that date.
| (b) | Per share data was calculated using the average shares outstanding during the period. |
| (c) | Total return at net asset value assuming all distributions reinvested. |
(d) Had the Investment Manager and/or any of its affiliates not waived fees or reimbursed a portion of expenses, total return would have been reduced.
| (f) | The benefits derived from expense reductions had an impact of less than 0.01%. |
| (h) | Rounds to less than 0.01%. |
See Accompanying Notes to Financial Statements.
36
Financial Highlights – Columbia Intermediate Bond Fund
Selected data for a share outstanding throughout each period is as follows:
| | | | | | | | | | | | | | | | | | | | |
| | | Year Ended March 31, | |
| Class R Shares | | 2011 | | | 2010 | | | 2009 | | | 2008 | | | 2007 | |
Net Asset Value, Beginning of Period | | $ | 8.95 | | | $ | 7.72 | | | $ | 8.71 | | | $ | 8.84 | | | $ | 8.74 | |
| | | | | |
Income from Investment Operations: | | | | | | | | | | | | | | | | | | | | |
Net investment income (a) | | | 0.34 | | | | 0.41 | | | | 0.41 | | | | 0.40 | | | | 0.39 | |
Net realized and unrealized gain (loss) on investments, foreign currency, futures contracts and credit default swap contracts | | | 0.15 | | | | 1.26 | | | | (0.97 | ) | | | (0.12 | ) | | | 0.12 | |
| | | | | | | | | | | | | | | | | | | | |
Total from investment operations | | | 0.49 | | | | 1.67 | | | | (0.56 | ) | | | 0.28 | | | | 0.51 | |
| | | | | |
Less Distributions to Shareholders: | | | | | | | | | | | | | | | | | | | | |
From net investment income | | | (0.36 | ) | | | (0.44 | ) | | | (0.41 | ) | | | (0.41 | ) | | | (0.41 | ) |
From net realized gains | | | — | | | | — | | | | (0.02 | ) | | | — | | | | — | |
| | | | | | | | | | | | | | | | | | | | |
Total distributions to shareholders | | | (0.36 | ) | | | (0.44 | ) | | | (0.43 | ) | | | (0.41 | ) | | | (0.41 | ) |
| | | | | |
Increase from regulatory settlements | | | — | | | | — | (b) | | | — | | | | — | | | | — | |
| | | | | |
Net Asset Value, End of Period | | $ | 9.08 | | | $ | 8.95 | | | $ | 7.72 | | | $ | 8.71 | | | $ | 8.84 | |
Total return (c) | | | 5.54 | %(d) | | | 22.01 | % | | | (6.58 | )% | | | 3.24 | % | | | 5.94 | %(e) |
| | | | | |
Ratios to Average Net Assets/Supplemental Data: | | | | | | | | | | | | | | | | | | | | |
Net expenses before interest expense (f) | | | 1.17 | % | | | 1.15 | % | | | 1.14 | % | | | 1.13 | % | | | 1.12 | % |
Interest expense | | | — | %(g) | | | — | %(g) | | | — | %(g) | | | — | | | | — | |
Net expenses (f) | | | 1.17 | % | | | 1.15 | % | | | 1.14 | % | | | 1.13 | % | | | 1.12 | % |
Waiver/Reimbursement | | | 0.01 | % | | | — | | | | — | | | | — | | | | — | |
Net investment income (f) | | | 3.75 | % | | | 4.78 | % | | | 5.11 | % | | | 4.60 | % | | | 4.45 | % |
Portfolio turnover rate | | | 177 | % | | | 160 | % | | | 137 | % | | | 266 | % | | | 150 | % |
Net assets, end of period (000s) | | $ | 2,969 | | | $ | 1,694 | | | $ | 1,819 | | | $ | 1,606 | | | $ | 42 | |
| (a) | Per share data was calculated using the average shares outstanding during the period. |
| (b) | Rounds to less than $0.01 per share. |
| (c) | Total return at net asset value assuming all distributions reinvested. |
| (d) | Had the Investment Manager and/or any of its affiliates not waived fees or reimbursed a portion of expenses, total return would have been reduced. |
| (e) | Total return includes a voluntary reimbursement by the investment advisor for a realized investment loss due to a trading error. This reimbursement increased total return and net asset value per share by less than 0.01% and less than $0.01, respectively. |
| (f) | The benefits derived from expense reductions had an impact of less than 0.01%. |
| (g) | Rounds to less than 0.01%. |
See Accompanying Notes to Financial Statements.
37
Financial Highlights – Columbia Intermediate Bond Fund
Selected data for a share outstanding throughout the period is as follows:
| | | | |
| Class W Shares | | Period Ended
March 31,
2011 (a) | |
Net Asset Value, Beginning of Period | | $ | 9.21 | |
| |
Income from Investment Operations: | | | | |
Net investment income (b) | | | 0.17 | |
Net realized and unrealized loss on investments, foreign currency, futures contracts and credit default swap contracts | | | (0.11 | ) |
| | | | |
Total from investment operations | | | 0.06 | |
| |
Less Distributions to Shareholders: | | | | |
From net investment income | | | (0.19 | ) |
| |
Net Asset Value, End of Period | | $ | 9.08 | |
Total Return (c)(d)(e) | | | 0.69 | % |
| |
Ratios to Average Net Assets/Supplemental Data: | | | | |
Net expenses before interest expense (f)(g) | | | 0.87 | % |
Interest expense (g)(h) | | | — | % |
Net expenses (f)(g) | | | 0.87 | % |
Waiver/Reimbursement (g) | | | 0.02 | % |
Net investment income (f)(g) | | | 3.62 | % |
Portfolio turnover rate (e) | | | 177 | % |
Net assets, end of period (000s) | | $ | 2 | |
| (a) | Class W shares commenced operations on September 27, 2010. Per share data and total return reflect activity from that date. |
| (b) | Per share data was calculated using the average shares outstanding during the period. |
| (c) | Total return at net asset value assuming all distributions reinvested. |
| (d) | Had the Investment Manager and/or any of its affiliates not waived fees or reimbursed a portion of expenses, total return would have been reduced. |
| (f) | The benefits derived from expense reductions had an impact of less than 0.01%. |
| (h) | Rounds to less than 0.01%. |
See Accompanying Notes to Financial Statements.
38
Financial Highlights – Columbia Intermediate Bond Fund
Selected data for a share outstanding throughout each period is as follows:
| | | | | | | | | | | | | | | | | | | | |
| | | Year Ended March 31, | |
| Class Z Shares | | 2011 | | | 2010 | | | 2009 | | | 2008 | | | 2007 | |
Net Asset Value, Beginning of Period | | $ | 8.95 | | | $ | 7.72 | | | $ | 8.71 | | | $ | 8.84 | | | $ | 8.74 | |
| | | | | |
Income from Investment Operations: | | | | | | | | | | | | | | | | | | | | |
Net investment income (a) | | | 0.39 | | | | 0.45 | | | | 0.45 | | | | 0.45 | | | | 0.45 | |
Net realized and unrealized gain (loss) on investments, foreign currency, futures contracts and credit default swap contracts | | | 0.15 | | | | 1.26 | | | | (0.97 | ) | | | (0.13 | ) | | | 0.10 | |
| | | | | | | | | | | | | | | | | | | | |
Total from investment operations | | | 0.54 | | | | 1.71 | | | | (0.52 | ) | | | 0.32 | | | | 0.55 | |
| | | | | |
Less Distributions to Shareholders: | | | | | | | | | | | | | | | | | | | | |
From net investment income | | | (0.41 | ) | | | (0.48 | ) | | | (0.45 | ) | | | (0.45 | ) | | | (0.45 | ) |
From net realized gains | | | — | | | | — | | | | (0.02 | ) | | | — | | | | — | |
| | | | | | | | | | | | | | | | | | | | |
Total distributions to shareholders | | | (0.41 | ) | | | (0.48 | ) | | | (0.47 | ) | | | (0.45 | ) | | | (0.45 | ) |
| | | | | |
Increase from regulatory settlements | | | — | | | | — | (b) | | | — | | | | — | | | | — | |
| | | | | |
Net Asset Value, End of Period | | $ | 9.08 | | | $ | 8.95 | | | $ | 7.72 | | | $ | 8.71 | | | $ | 8.84 | |
Total return (c) | | | 6.07 | %(d) | | | 22.62 | % | | | (6.11 | )% | | | 3.74 | % | | | 6.48 | %(e) |
| | | | | |
Ratios to Average Net Assets/Supplemental Data: | | | | | | | | | | | | | | | | | | | | |
Net expenses before interest expense (f) | | | 0.67 | % | | | 0.65 | % | | | 0.64 | % | | | 0.63 | % | | | 0.62 | % |
Interest expense | | | — | %(g) | | | — | %(g) | | | — | %(g) | | | — | | | | — | |
Net expenses (f) | | | 0.67 | % | | | 0.65 | % | | | 0.64 | % | | | 0.63 | % | | | 0.62 | % |
Waiver/Reimbursement | | | 0.01 | % | | | — | | | | — | | | | — | | | | — | |
Net investment income (f) | | | 4.28 | % | | | 5.26 | % | | | 5.58 | % | | | 5.13 | % | | | 5.08 | % |
Portfolio turnover rate | | | 177 | % | | | 160 | % | | | 137 | % | | | 266 | % | | | 150 | % |
Net assets, end of period (000s) | | $ | 2,835,104 | | | $ | 1,973,020 | | | $ | 1,710,920 | | | $ | 2,259,863 | | | $ | 1,894,798 | |
| (a) | Per share data was calculated using the average shares outstanding during the period. |
| (b) | Rounds to less than $0.01 per share. |
| (c) | Total return at net asset value assuming all distributions reinvested. |
| (d) | Had the Investment Manager and/or any of its affiliates not waived fees or reimbursed a portion of expenses, total return would have been reduced. |
| (e) | Total return includes a voluntary reimbursement by the investment advisor for a realized investment loss due to a trading error. This reimbursement increased total return and net asset value per share by less than 0.01% and less than $0.01, respectively. |
| (f) | The benefits derived from expense reductions had an impact of less than 0.01%. |
| (g) | Rounds to less than 0.01%. |
See Accompanying Notes to Financial Statements.
39
Notes to Financial Statements – Columbia Intermediate Bond Fund
March 31, 2011
Note 1. Organization
Columbia Intermediate Bond Fund (the Fund), a series of Columbia Funds Series Trust I (the Trust), is a diversified fund. The Trust is registered under the Investment Company Act of 1940, as amended (the 1940 Act), as an open-end management investment company organized as a Massachusetts business trust.
After the close of business on April 30, 2010, Ameriprise Financial, Inc. (Ameriprise Financial) acquired a portion of the asset management business of Columbia Management Group, LLC (the Transaction), including the business of managing the Fund. In connection with the closing of the Transaction (the Closing), RiverSource Investments, LLC, a wholly owned subsidiary of Ameriprise Financial, became the investment manager of the Fund and changed its name to Columbia Management Investment Advisers, LLC (the Investment Manager).
Investment Objective
The Fund seeks total return, consisting of current income and capital appreciation.
Fund Shares
The Trust has unlimited authorized shares of beneficial interest. The Fund offers Class A, Class B, Class C, Class I, Class R, Class W and Class Z shares. On December 10, 2010, the Investment Manager exchanged Class Z shares of the Fund valued at $21,883,183 for Class I shares of the Fund. All share classes have identical voting, dividend and liquidation rights. Each share class has its own expense structure and sales charges, as applicable.
Class A shares are subject to a maximum front-end sales charge of 3.25% based on the initial investment amount. Class A shares purchased without an initial sales charge in accounts aggregating $1 million to $50 million at the time of purchase are subject to a 1.00% contingent deferred sales charge (CDSC) if the shares are sold within 18 months of purchase, charged as follows: 1.00% CDSC if redeemed within 12 months of purchase, and 0.50% CDSC if redeemed more than 12, but less than 18 months after purchase.
The Fund no longer accepts investments by new or existing investors in the Fund’s Class B shares, except in connection with the reinvestment of any dividend and/or capital gain distributions in Class B shares of the Fund and exchanges by existing Class B shareholders of other funds within the Columbia Family of Funds. Class B shares are subject to a maximum CDSC of 3.00% based upon the holding period after purchase. Class B shares will generally convert to Class A shares eight years after purchase.
Class C shares are subject to a 1.00% CDSC on shares redeemed within one year of purchase.
Class I shares are not subject to sales charges and are available only to the Columbia Family of Funds. Class I shares commenced operations on September 27, 2010.
Class R shares are not subject to sales charges and are available only to qualifying institutional investors.
Class W shares are not subject to sales charges and are available only to investors purchasing through authorized investment programs managed by investment professionals, including discretionary managed account programs. Class W shares commenced operations on September 27, 2010.
Class Z shares are not subject to sales charges and are available only to certain investors, as described in the Fund’s prospectus.
Note 2. Summary of Significant Accounting Policies
The preparation of financial statements in accordance with U.S. generally accepted accounting principles (GAAP) requires management to make certain estimates and assumptions that affect the reported amounts of assets and liabilities, the disclosure of contingent assets and liabilities at the date of the financial statements and the reported amounts of revenue and expenses during the reporting period. Actual results could differ from those estimates.
The following is a summary of significant accounting policies consistently followed by the Fund in the preparation of its financial statements.
Security Valuation
Debt securities generally are valued by pricing services approved by the Trust’s Board of Trustees, based upon market transactions for normal, institutional-size trading units of similar securities. The services may use various pricing techniques which take into account appropriate factors such as yield, quality, coupon rate, maturity, type of issue, trading characteristics and other data, as well as broker quotes. Debt securities for which quotations are readily available may also be valued based upon an over-the-counter or exchange bid quotation.
Certain debt securities, which tend to be more thinly traded and of lesser quality, are priced based on fundamental analysis of the financial condition of the issuer and the estimated value of any collateral. Valuations developed through pricing techniques may
40
Columbia Intermediate Bond Fund
March 31, 2011
vary from the actual amounts realized upon sale of the securities, and the potential variation may be greater for those securities valued using fundamental analysis.
Asset-backed and mortgage-backed securities are generally valued by pricing services, which utilize pricing models that incorporate the securities’ cash flow and loan performance data. These models also take into account available market data, including trades, market quotations, and benchmark yield curves for identical or similar securities. Factors used to identify similar securities may include, but are not limited to, issuer, collateral type, vintage, prepayment speeds, collateral performance, credit ratings, credit enhancement and expected life. Asset-backed and mortgage-backed securities for which quotations are readily available may also be valued based upon an over-the-counter or exchange bid quotation.
Equity securities are valued at the last sale price on the principal exchange on which they trade, except for securities traded on the NASDAQ, which are valued at the NASDAQ official close price. Unlisted securities or listed securities for which there were no sales during the day are valued at the closing bid price on such exchanges or over-the-counter markets.
Short-term investments maturing in 60 days or less are valued at amortized cost, which approximates market value.
Futures contracts are valued at the settlement price established each day by the board of trade or exchange on which they are traded.
Forward foreign currency exchange contracts are valued at the prevailing forward exchange rate of the underlying currencies.
Credit default swap contracts are marked to market daily based upon spread quotations from market makers.
Foreign securities are generally valued at the last sale price on the foreign exchange or market on which they trade. If any foreign share prices are not readily available as a result of limited share activity, the securities are valued at the last sale price of the local shares in the principal market in which such securities are normally traded.
Generally, trading in foreign securities is substantially completed each day at various times prior to the close of the New York Stock Exchange (NYSE). The values of such securities used in computing the net asset value of the Fund’s shares are determined as of such times. Foreign currency exchange rates are generally determined at 4:00 p.m. Eastern (U.S.) time. Occasionally, events affecting the values of such foreign securities may occur between the times at which they are determined and the close of the customary trading session of the NYSE, which would not be reflected in the computation of the Fund’s net asset value. If events materially affecting the values of such foreign securities occur and it is determined that market quotations are not reliable, then these foreign securities will be valued at their fair value using procedures approved by the Board of Trustees.
Investments for which market quotations are not readily available, or that have quotations which the Investment Manager believes are not reliable, are valued at fair value as determined in good faith under consistently applied procedures established by and under the general supervision of the Board of Trustees. If a security is valued at fair value, such value is likely to be different from the last quoted market price for the security. The determination of fair value often requires significant judgment. To determine fair value, the Investment Manager may use assumptions including but not limited to future cash flows and estimated risk premiums. Multiple inputs from various sources may be used to determine value.
Foreign Currency Transactions and Translations
The values of all assets and liabilities quoted in foreign currencies are translated into U.S. dollars at that day’s exchange rates. Net realized and unrealized gains (losses) on foreign currency transactions and translations include gains (losses) arising from the fluctuation in exchange rates between trade and settlement dates on securities transactions, gains (losses) arising from the disposition of foreign currency and currency gains (losses) between the accrual and payment dates on dividends, interest income and foreign withholding taxes.
For financial statement purposes, the Fund does not distinguish that portion of gains (losses) on investments which is due to changes in foreign exchange rates from that which is due to changes in market prices of the investments. Such fluctuations are included with the net realized and unrealized gains (losses) on investments on the Statement of Operations.
Derivative Instruments
The Fund may use derivative instruments including futures contracts, credit default swap contracts and forward foreign currency exchange contracts in order to meet its investment objectives. The Fund employs strategies in differing combinations to permit it to increase, decrease or change the level of exposure to market risk factors. The achievement of any strategy relating to derivatives depends on an analysis of various risk factors, and if the strategies for the use of derivatives do not work as intended, the Fund may not achieve its investment objectives.
41
Columbia Intermediate Bond Fund
March 31, 2011
In pursuit of its investment objectives, the Fund is exposed to the following market risks among others:
Credit Risk: Credit risk relates to the ability of the issuer or guarantor of a fixed income security, or counterparty to a derivative contract to make timely principal and /or interest payments, or to otherwise honor its obligations. Securities are subject to varying degrees of credit risk, which are often reflected in credit ratings. Generally, lower-yield higher-quality bonds are subject to credit risk to a lesser extent than lower-grade higher-yield bonds.
Foreign Exchange Rate Risk: Foreign exchange rate risk relates to the change in the U.S. dollar value of a security held that is denominated in a foreign currency. The U.S. dollar value of a foreign-currency-denominated security will decrease as the dollar appreciates against the currency, while the U.S. dollar value will increase as the dollar depreciates against the currency.
Interest Rate Risk: Interest rate risk relates to the fluctuation in value of fixed income securities because of the inverse relationship of price and yield. Fixed income securities generally will decline in value upon an increase in general interest rates and their value generally will increase upon a decline in general interest rates. Fixed income securities with longer durations tend to be more sensitive to changes in interest rates, usually making them more volatile than securities with shorter durations.
The following provides more detailed information about each derivative type held by the Fund:
Forward Foreign Currency Exchange Contracts – The Fund entered into forward foreign currency exchange contracts to shift its investment exposure from one currency to another.
Forward foreign currency exchange contracts are agreements to exchange one currency for another at a future date at a specified price. These contracts are used to minimize the exposure to foreign exchange rate fluctuations during the period between the trade and settlement dates of the contract. Contracts to buy generally are used to acquire exposure to foreign currencies, while contracts to sell are generally used to reduce the exposure to foreign exchange rate fluctuations. Forward foreign currency exchange contracts are valued daily at the current exchange rate of the underlying currency, resulting in unrealized gains (losses) which become realized at the time the forward foreign currency exchange contracts are closed or mature. Realized and unrealized gains (losses) arising from such transactions are included in net realized and unrealized gains (losses) on foreign currency transactions. The use of forward foreign currency exchange contracts does not eliminate fluctuations in the prices of the Fund’s portfolio securities. While the maximum potential loss from such contracts is the aggregate face value in U.S. dollars at the time the contract was opened, exposure is typically limited to the change in value of the contract (in U.S. dollars) over the period it remains open. The Fund could also be exposed to risk that counterparties of the contracts may be unable to fulfill the terms of the contracts.
During the year ended March 31, 2011, the Fund entered into 13 forward foreign currency exchange contracts. The Fund did not have any open forward foreign exchange contracts at the end of the period.
Futures Contracts – The Fund entered into interest rate futures contracts to manage the duration and yield curve exposure of the Fund versus the benchmark.
The use of futures contracts involves certain risks, which include, among others: (1) imperfect correlation between the price movement of the instruments and the underlying securities, (2) inability to close out positions due to differing trading hours, or the temporary absence of a liquid market, for either the instruments or the underlying securities, and (3) an inaccurate prediction of the future direction of interest rates by the Fund’s Investment Manager.
Upon entering into a futures contract, the Fund identifies within its portfolio of investments cash or securities in an amount sufficient to meet the initial margin requirement. Subsequent payments are made or received by the Fund equal to the daily change in the contract value and are recorded as variation margin receivable or payable and offset in unrealized gains or losses. The Fund recognizes a realized gain or loss when the contract is closed or expires.
Futures contracts involve, to varying degrees, risk of loss in excess of the variation margin disclosed on the Statement of Assets and Liabilities.
During the year ended March 31, 2011, the Fund entered into 29,381 futures contracts.
Credit Default Swaps – The Fund entered into credit default swap transactions as a protection buyer to reduce overall credit exposure.
Credit default swaps are agreements in which one party pays fixed periodic payments to a counterparty in consideration for a guarantee from the counterparty to make a specific payment should a negative credit event take place. The Fund may receive or make an upfront payment as the protection buyer or seller. Credit default swaps are marked to market daily based on quotations from market makers and any change is recorded as unrealized appreciation/depreciation on
42
Columbia Intermediate Bond Fund
March 31, 2011
the Statement of Assets and Liabilities. Periodic payments received or made are recorded as a realized gain or loss and premiums received or made are amortized on the Statement of Operations.
If the Fund is a buyer of protection and a credit event occurs, as defined under the terms of that particular swap agreement, the Fund will either (i) receive from the seller of protection an amount equal to the notional amount of the swap and deliver the referenced obligation or underlying securities comprising the referenced index or (ii) receive a net settlement amount in the form of cash or securities equal to the notional amount of the swap less the recovery value of the referenced obligation or underlying securities comprising the referenced index.
If the Fund is a seller of protection and a credit event occurs, as defined under the terms of that particular swap agreement, the Fund will either (i) pay to the buyer of protection an amount equal to the notional amount of the swap and take delivery of the referenced obligation or underlying securities comprising the referenced index or (ii) pay a net settlement amount in the form of cash or securities equal to the notional amount of the swap less the recovery value of the referenced obligation or underlying securities comprising the referenced index.
Credit default swap agreements involve greater risks than if the Fund had invested in the reference obligation directly since, in addition to general market risks, credit default swaps are subject to illiquidity risk, counterparty risk and credit risk.
During the year ended March 31, 2011, the Fund purchased credit default swaps with a notional amount of $573,465,000.
The following table is a summary of the value of the Fund’s derivative instruments as of March 31, 2011:
| | | | | | | | |
| Fair Value of Derivative Instruments | |
| Statement of Assets and Liabilities | |
| Asset | | Fair Value | | Liability | | Fair Value | |
Futures
Variation
Margin | | $100,953* | | Futures
Variation
Margin | | | $— | |
Open Credit
Default
Swaps/
Premiums | | 3,917,344 | | Open Credit
Default
Swaps/
Premiums | | | 571,337 | |
| * | Includes only current day’s variation margin. |
The effect of derivative instruments on the Fund’s Statement of Operations for the year ended March 31, 2011:
| | | | | | | | | | |
| | | | | | | | | |
| | | Amount of Realized Gain or (Loss) and
Change in Unrealized Appreciation
(Depreciation) on Derivatives | |
| | | Risk
Exposure | | Net
Realized
Gain
(Loss) | | | Change
in Unrealized
Appreciation
(Depreciation) | |
| Futures Contracts | | Interest
Rate Risk | | $ | (29,264,373 | ) | | $ | 555,447 | |
| Forward Foreign Currency Exchange Contracts | | Foreign
Exchange
Rate Risk | | | 60,282 | | | | (11,102 | ) |
| Credit Default Swap Contracts | | Equity
Risk | | | (7,308,077 | ) | | | 1,176,967 | |
Repurchase Agreements
The Fund may engage in repurchase agreement transactions with institutions that the Investment Manager has determined are creditworthy. The Fund, through the custodian, receives delivery of the underlying securities collateralizing a repurchase agreement. The Investment Manager is responsible for determining that the collateral is at least equal, at all times, to the value of the repurchase obligation including interest. A repurchase agreement transaction involves certain risks in the event of default or insolvency of the counterparty. These risks include possible delays in or restrictions on the Fund’s ability to dispose of the underlying securities and a possible decline in the value of the underlying securities during the period while the Fund seeks to assert its rights.
Loan Participations and Commitments
The Fund may invest in loan participations. When the Fund purchases a loan participation, the Fund typically enters into a contractual relationship with the lender or third party selling such participation (“Selling Participant”), but not the borrower. However, the Fund assumes the credit risk of the borrower, Selling Participant and any other persons interpositioned between the Fund and the borrower. The Fund may not directly benefit from the collateral supporting the senior loan which it has purchased from the Selling Participant.
43
Columbia Intermediate Bond Fund
March 31, 2011
Mortgage Dollar Roll Transactions
The Fund may enter into mortgage “dollar rolls” in which the Fund sells securities for delivery in the current month and simultaneously contracts with the same counterparty to repurchase similar (same type, coupon and maturity) but not identical securities on a specified future date not exceeding 120 days. During the roll period, the Fund loses the right to receive principal and interest paid on the securities sold. However, the Fund benefits because it receives negotiated amounts in the form of reductions of the purchase price for the future purchase plus the interest earned on the cash proceeds of the securities sold until the settlement date of the forward purchase. Unless such benefits exceed the income, capital appreciation and gain or loss due to mortgage prepayments that would have been realized on the securities sold as part of the mortgage dollar roll, the use of this technique will diminish the investment performance of the Fund compared to what the performance would have been without the use of mortgage dollar rolls. All cash proceeds will be invested in instruments that are permissible investments for the Fund. The Fund identifies within its portfolio of investments cash or liquid securities in an amount equal to the forward purchase price.
For financial reporting and tax purposes, the Fund treats “to be announced” mortgage dollar rolls as two separate transactions, one involving the purchase of a security and a separate transaction involving a sale. The Fund does not currently enter into mortgage dollar rolls that are accounted for as financing transactions.
Mortgage dollar rolls involve certain risks. If the broker-dealer to whom the Fund sells the securities becomes insolvent, the Fund’s right to purchase or repurchase the mortgage-related securities may be restricted and the instruments which the Fund is required to repurchase may be worth less than instruments which the Fund originally held. Successful use of mortgage dollar rolls may depend upon the Investment Manager’s ability to predict interest rates and mortgage prepayments. For these reasons, there is no assurance that mortgage dollar rolls can be successfully employed.
Delayed Delivery Securities
The Fund may trade securities on other than normal settlement terms, including securities purchased or sold on a “when-issued” basis. This may increase the risk if the other party to the transaction fails to deliver and causes the Fund to subsequently invest at less advantageous prices. The Fund identifies within its portfolio of investments cash or liquid securities in an amount equal to the delayed delivery commitment.
Stripped Securities
The Fund may invest in Interest Only (IO) and Principal Only (PO) stripped mortgage-backed securities. These securities are derivative multi-class mortgage securities structured so that one class receives most, if not all, of the principal from the underlying mortgage assets, while the other class receives most, if not all, of the interest and the remainder of the principal. If the underlying mortgage assets experience greater than anticipated prepayments of principal, the Fund may fail to fully recoup its initial investment in an IO security, therefore, the daily interest accrual factor is adjusted each month to reflect the paydown of principal. The market value of these securities can be extremely volatile in response to changes in interest rates. Credit risk reflects the risk that the Fund may not receive all or part of its principal because the issuer or credit enhancer has defaulted on its obligation.
Security Transactions
Security transactions are accounted for on the trade date. Cost is determined and gains (losses) are based upon the specific identification method for both financial statement and federal income tax purposes.
Income Recognition
Interest income is recorded on the accrual basis and includes accretion of discounts, amortization of premiums and paydown gains and losses. Fee income attributable to mortgage dollar roll transactions is recorded on the accrual basis over the term of the transaction. The value of additional securities received as an income payment is recorded as income and as the cost basis of such securities.
Expenses
General expenses of the Trust are allocated to the Fund and other series of the Trust based upon relative net assets or other expense allocation methodologies determined by the nature of the expense. Expenses directly attributable to a specific class of shares are charged to that share class. Expenses directly attributable to the Fund are charged to the Fund.
Determination of Class Net Asset Value
All income, expenses (other than class-specific expenses which are charged directly to a share class, as shown in the Statement of Operations) and realized and unrealized gains (losses) are allocated to each class of the Fund on a daily basis for purposes of determining the net asset value of each class. Income and expenses
44
Columbia Intermediate Bond Fund
March 31, 2011
are allocated to each class based on the settled shares method, while realized and unrealized gains (losses) are allocated based on the relative net assets of each class.
Federal Income Tax Status
The Fund intends to qualify each year as a regulated investment company under Subchapter M of the Internal Revenue Code, as amended, and will distribute substantially all of its tax exempt or taxable income, if any, for its tax year, and as such will not be subject to federal income taxes. In addition, the Fund intends to distribute in each calendar year substantially all of its net investment income, capital gains and certain other amounts, if any, such that the Fund should not be subject to federal excise tax. Therefore, no federal income or excise tax provision is recorded.
Distributions to Shareholders
Distributions from net investment income are declared daily and paid monthly. Net realized capital gains, if any, are distributed at least annually. Income distributions and capital gain distributions are determined in accordance with federal income tax regulations which may differ from GAAP.
Indemnifications
Under the Trust’s organizational documents and, in some cases, by contract, its officers and directors are indemnified against certain liabilities arising out of the performance of their duties to the Fund. In addition, certain of the Fund’s contracts with its service providers contain general indemnification clauses. The Fund’s maximum exposure under these arrangements is unknown since the amount of any future claims that may be made against the Fund cannot be determined and the Fund has no historical basis for predicting the likelihood of any such claims.
Note 3. Fees and Compensation Paid to Affiliates
Investment Management Fee
Under an Investment Management Services Agreement (IMSA), the Investment Manager determines which securities will be purchased, held or sold. In September 2010, the Board of Trustees approved an amended IMSA that includes an annual management fee rate that declines from 0.43% to 0.30% as the Fund’s net assets increase and would increase the management fees payable to the Investment Manager at certain asset levels. The amended IMSA was approved by the Fund’s shareholders at a meeting held on February 15, 2011. The amended IMSA was effective on March 1, 2011.
For the period from the Closing through February 28, 2011, the management fee was equal to a percentage of the Fund’s average daily net assets that declined from 0.35% to 0.27% as the Fund’s net assets increased. Prior to the Closing, Columbia Management Advisors, LLC (Columbia), an indirect, wholly owned subsidiary of Bank of America Corporation (BOA), provided investment management services to the Fund under the same fee structure. The effective management fee rate for the year ended March 31, 2011, was 0.33% of the Fund’s average daily net assets.
Administration Fee
Effective upon the Closing, the Investment Manager provides administration and accounting services to the Fund under an Administrative Services Agreement, including services previously performed under the Pricing and Bookkeeping Oversight and Services Agreement (the Services Agreement) as discussed in the Pricing and Bookkeeping Fees note below. In September 2010, the Board of Trustees approved an amended Administrative Services Agreement that includes an annual administration fee rate that declines from 0.07% to 0.04% as the Fund’s net assets increase and would increase the administration fees payable to the Investment Manager at certain asset levels. The amended Administrative Services Agreement was effective on March 1, 2011.
For the period from the Closing through February 28, 2011, the administration fee was equal to 0.15% of the Fund’s average daily net assets. Prior to the Closing, Columbia provided administrative services to the Fund at the same fee rates. The effective administration fee rate for the year ended March 31, 2011, was 0.14% of the Fund’s average daily net assets.
Pricing and Bookkeeping Fees
Prior to the Closing, the Fund entered into a Financial Reporting Services Agreement (the Financial Reporting Services Agreement) with State Street Bank and Trust Company (State Street) and Columbia pursuant to which State Street provides financial reporting services to the Fund. The Fund also entered into an Accounting Services Agreement (collectively with the Financial Reporting Services Agreement, the State Street Agreements) with State Street and Columbia pursuant to which State Street provides accounting services to the Fund. Upon the Closing, Columbia assigned and delegated its rights and obligations under the State Street Agreements to the Investment Manager. Under the State Street Agreements, the Fund pays State Street an annual fee of $38,000 paid monthly plus an additional monthly fee based on an annualized
45
Columbia Intermediate Bond Fund
March 31, 2011
percentage rate of average daily net assets of the Fund for the month. The aggregate fee will not exceed $140,000 per year (exclusive of out-of-pocket expenses and charges). The Fund also reimburses State Street for certain out-of-pocket expenses and charges.
Also prior to the Closing, the Fund entered into the Services Agreement with Columbia. Under the Services Agreement, Columbia provided services related to Fund expenses and the requirements of the Sarbanes-Oxley Act of 2002, and provided oversight of the accounting and financial reporting services provided by State Street. Under the Services Agreement, the Fund reimbursed Columbia for out-of-pocket expenses and charges, including fees payable to third parties, such as for pricing the Fund’s portfolio securities, incurred by Columbia in the performance of services under the Services Agreement. The Services Agreement was terminated upon the Closing. These services are now provided under the Administrative Services Agreement discussed above.
Transfer Agent Fee
In connection with the Closing, RiverSource Service Corporation, a wholly owned subsidiary of Ameriprise Financial, provides transfer agency services to the Fund under a Transfer Agency Agreement and changed its name to Columbia Management Investment Services Corp. (the Transfer Agent). The Transfer Agent has contracted with Boston Financial Data Services (BFDS) to serve as sub-transfer agent.
The Transfer Agent receives monthly account-based service fees based on the number of open accounts and is reimbursed by the Fund for the fees and expenses the Transfer Agent pays to financial intermediaries that maintain omnibus accounts with the Fund that is a percentage of the average aggregate value of the Fund’s shares maintained in each such omnibus account (other than omnibus accounts for which American Enterprise Investment Services Inc. is the broker of record or accounts where the beneficial shareholder is a customer of Ameriprise Financial Services, Inc., which are paid a per account fee). The Transfer Agent pays the fees of BFDS for services as sub-transfer agent and, is not entitled to reimbursement for such fees from the Fund (with the exception of out-of pocket fees). The Transfer Agent also receives compensation from fees for various shareholder services and reimbursements for certain out-of -pocket expenses.
Prior to the Closing, Columbia Management Services, Inc., an affiliate of Columbia and an indirect, wholly owned subsidiary of BOA, provided transfer agency services to the Fund and contracted with BFDS to serve as sub-transfer agent, under the same fee structure.
Class I shares do not pay transfer agent fees. For the year ended March 31, 2011, the Fund’s effective transfer agent fee rate for each class, with the exception of Class I shares, as a percentage of each class’ average daily net assets was as follows:
| | | | | | | | | | |
| | | | | | | | | | | |
| Class A | | Class B | | Class C | | Class R | | Class W | | Class Z |
| 0.16% | | 0.16% | | 0.16% | | 0.16% | | 0.17% | | 0.16% |
An annual minimum account balance fee of $20 may apply to certain accounts with a value below the Fund’s initial minimum investment requirements to reduce the impact of small accounts on transfer agent fees. These minimum account balance fees are recorded as part of expense reductions on the Statement of Operations. For the year ended March 31, 2011, no minimum account balance fees were charged by the Fund.
Underwriting Discounts, Service and Distribution Fees
In connection with the Closing, RiverSource Fund Distributors, Inc., an indirect wholly owned subsidiary of Ameriprise Financial, provides distribution and shareholder services to the Fund and changed its name to Columbia Management Investment Distributors, Inc. (the Distributor). Pursuant to Rule 12b-1 under the 1940 Act, the Board of Trustees has approved, and the Fund has adopted, distribution and shareholder service plans (the Plans) which set the distribution and service fees for the Fund. These fees are calculated daily and are intended to compensate the Distributor and/or eligible selling and/or servicing agents for selling shares of the Fund and providing services to investors.
The Plans require the payment of a monthly service fee to the Distributor at the maximum annual rate of 0.25% of the average daily net assets attributable to Class A, Class B, Class C and Class W shares of the Fund. The Plans also require the payment of a monthly distribution fee to the Distributor at the maximum annual rates of 0.10% of the average daily net assets attributable to Class A shares, 0.75% of the average daily net assets attributable to Class B and Class C shares, 0.50% of the average daily net assets attributable to Class R shares and 0.25% of the average daily net assets attributable to Class W shares.
Effective September 7, 2010, the Fund may pay distribution and service fees up to a maximum annual rate of 0.35% of the Fund’s average daily net assets attributable to Class A shares (comprised of up to 0.10% for distribution services and up to 0.25% for shareholder services), but limited such fees to an aggregate of not
46
Columbia Intermediate Bond Fund
March 31, 2011
more than 0.25% for Class A shares. Prior to September 7, 2010, the Distributor voluntarily agreed to waive a portion of the distribution and service fees for Class A shares of the Fund so that the combined fee did not exceed 0.25% annually of Class A average daily net assets.
The Distributor has voluntarily agreed to waive a portion of the distribution and service fees for Class C shares so that the combined fee will not exceed 0.85% annually of Class C average daily net assets. These arrangements may be modified or terminated by the Distributor at any time.
The Fund may pay a distribution fee of up to 0.25% of the Fund’s average daily net assets attributable to Class W shares and a service fee of up to 0.25% of the Fund’s average daily net assets attributable to Class W shares, provided, however, that the aggregate fee shall not exceed 0.25% of the Fund’s average daily net assets attributable to Class W shares.
Prior to the Closing, Columbia Management Distributors, Inc., an affiliate of Columbia and an indirect, wholly owned subsidiary of BOA, was the principal underwriter of the Fund’s shares. There were no changes to the underwriting discount structure of the Fund, the service or distribution fee rates paid by the Fund, or the distribution and service fee waivers for the Class A or Class C shares as a result of the Transaction.
Sales Charges
Sales charges, including front-end and CDSC’s, received by the Distributor for distributing Fund shares were $12,171 for Class A, $7,332 for Class B and $4,018 for Class C shares for the year ended March 31, 2011.
Fee Waivers and Expense Reimbursements
Effective March 1, 2011, the Investment Manager and certain of its affiliates have contractually agreed to waive fees or reimburse expenses, through July 31, 2012, so that the Fund’s ordinary operating expenses (excluding certain expenses described below), after giving effect to any balance credits or overdraft charges from the Fund’s custodian, do not exceed the annual rates of 0.84%, 1.59%, 1.59%, 0.52%, 1.09%, 0.84% and 0.59% of the Fund’s average daily net assets attributable to Class A, Class B, Class C, Class I, Class R, Class W and Class Z shares, respectively. The following expenses are excluded from the Fund’s ordinary operating expenses when calculating the cap, and therefore will be paid by the Fund: taxes (including foreign transaction taxes), expenses associated with investment in other pooled investment vehicles (including exchange traded funds and other affiliated and unaffiliated mutual funds), transaction costs and brokerage commissions, costs related to any securities lending program, dividend expenses associated with securities sold short, inverse floater program fees and expenses, transaction charges and interest on borrowed money, interest, extraordinary expenses and any other expenses the exclusion of which is specifically approved by the Fund’s Board. This agreement may be modified or amended only with approval from all parties. Merger costs are treated as extraordinary expenses and therefore not subject to the Fund’s expense limits.
For the period May 1, 2010 through February 28, 2011, the Investment Manager voluntarily agreed to bear a portion of the Fund’s expenses so that the Fund’s ordinary operating expenses (excluding brokerage commissions, interest, taxes and extraordinary expenses, but including custodian charges relating to overdrafts, if any), after giving effect to any balance credits from the Fund’s custodian, do not exceed the annual rates of 0.95%, 1.70%, 1.70%, 0.57%, 1.20%, 0.95% and 0.70% of the Fund’s average daily net assets attributable to Class A, Class B, Class C, Class I, Class R, Class W and Class Z shares, respectively.
Prior to May 1, 2010, Columbia voluntarily agreed to reimburse a portion of the Fund’s expenses so that the Fund’s ordinary operating expenses (excluding any distribution and service fees, brokerage commissions, interest, taxes and extraordinary expenses, but including custodian charges relating to overdrafts, if any), after giving effect to any balance credits from the Fund’s custodian, did not exceed 0.70% of the Fund’s average daily net assets on an annualized basis.
Fees Paid to Officers and Trustees
All officers of the Fund are employees of the Investment Manager or its affiliates and, with the exception of the Fund’s Chief Compliance Officer, receive no compensation from the Fund. The Board of Trustees has appointed a Chief Compliance Officer to the Fund in accordance with federal securities regulations. The Fund, along with other affiliated funds, pays its pro-rata share of the expenses associated with the Chief Compliance Officer. The Fund’s expenses for the Chief Compliance Officer will not exceed $15,000 per year.
Trustees are compensated for their services to the Fund, as set forth on the Statement of Operations. The Trust’s eligible Trustees may participate in a deferred compensation plan which may be terminated at any time. Obligations of the plan will be paid solely out of the Fund’s assets.
47
Columbia Intermediate Bond Fund
March 31, 2011
Note 4. Custody Credits
The Fund has an agreement with its custodian bank under which custody fees may be reduced by balance credits. These credits are recorded as part of expense reductions on the Statement of Operations. The Fund could have invested a portion of the assets utilized in connection with the expense offset arrangement in an income-producing asset if it had not entered into such an agreement. For the year ended March 31, 2011, these custody credits reduced total expenses by $1,296 for the Fund.
Note 5. Portfolio Information
The cost of purchases and proceeds from sales of securities, excluding short-term obligations, aggregated $3,955,491,446 and $4,048,824,498, respectively, for the year ended March 31, 2011, of which $2,528,248,891 and $2,422,247,279, respectively, were U.S. Government securities.
Note 6. Regulatory Settlements
During the year ended March 31, 2010, the Fund received payments totaling $62,349 resulting from certain regulatory settlements with third parties in which the Fund had participated. The payments have been included in “Increase from regulatory settlements” in the Statement of Changes in Net Assets.
Note 7. Lending of Portfolio Securities
The Fund may lend its securities to certain approved brokers, dealers and other financial institutions. Each loan is collateralized by cash, in an amount at least equal to the market value of the securities loaned plus accrued income from the investment of collateral. The market value of the loaned securities is determined at the close of business of the Fund and any additional required collateral is delivered to the Fund on the next business day. The collateral received is invested and the income generated by the investment of the collateral, net of any fees remitted to State Street as the lending agent and borrower rebates, is paid to the Fund. Generally, in the event of borrower default, the Fund has the right to use the collateral to offset any losses incurred. In the event the Fund is delayed or prevented from exercising its right to dispose of the collateral, there may be a potential loss to the Fund. The Fund bears the risk of loss with respect to the investment of collateral.
Note 8. Shareholder Concentration
As of March 31, 2011, one shareholder account owned 52.5% of the outstanding shares of the Fund. Purchase and redemption activity of this account may have a significant effect on the operations of the Fund.
Note 9. Line of Credit
Prior to March 28, 2011, the Fund and other affiliated funds participated in a $280,000,000 committed, unsecured revolving line of credit provided by State Street. Effective March 28, 2011, the commitment was reduced to $225,000,000. The maximum amount that may be borrowed by any fund is limited to the lesser of $200,000,000 and the Fund’s borrowing limit set forth in the Fund’s registration statement. Borrowings are available for short-term liquidity or temporary or emergency purposes.
Effective October 14, 2010, interest is charged to each participating fund based on the fund’s borrowings at a rate per annum equal to the greater of the Federal Funds Rate plus 1.25% or the overnight LIBOR Rate plus 1.25%. In addition, a commitment fee of 0.125% per annum is accrued and apportioned among the participating funds pro rata based on their relative net assets.
Prior to October 14, 2010, interest was charged to each participating fund at the same rates. In addition, a commitment fee of 0.15% per annum was accrued and apportioned among the participating funds pro rata based on their relative net assets.
For the year ended March 31, 2011, the average daily loan balance outstanding on days where borrowing existed was $9,773,333 at a weighted average interest rate of 1.51%.
Note 10. Federal Tax Information
The timing and character of income and capital gain distributions are determined in accordance with income tax regulations, which may differ from GAAP. Reclassifications are made to the Fund’s capital accounts for permanent tax differences to reflect income and gains available for distribution (or available capital loss carryforwards) under income tax regulations.
For the year ended March 31, 2011, permanent book and tax basis differences resulting primarily from differing treatments for foreign currency transactions, capital loss carryforwards from merger, market discount accretion/amortization on debt securities and defaulted bonds were identified and reclassified among the components of the Fund’s net assets as follows:
| | | | |
| | | | | |
Overdistributed
Net Investment
Income | | Accumulated Net Realized
Loss | | Paid-In
Capital |
| $6,742,653 | | $(39,874,419) | | $33,131,766 |
48
Columbia Intermediate Bond Fund
March 31, 2011
Net investment income and net realized gains (losses), as disclosed on the Statement of Operations, and net assets were not affected by this reclassification.
The tax character of distributions paid during the years ended March 31, 2011 and March 31, 2010 was as follows:
| | | | |
| | | March 31,
2011 | | March 31,
2010 |
| Distributions paid from: | | | | |
| Ordinary Income* | | $99,466,144 | | $118,424,847 |
| * | For tax purposes short-term capital gain distributions, if any, are considered ordinary income distributions. |
As of March 31, 2011, the components of distributable earnings on a tax basis were as follows:
| | | | |
| | | | | |
Undistributed
Ordinary
Income | | Undistributed
Long-Term Capital Gains | | Net
Unrealized
Appreciation* |
| $15,950,649 | | $— | | $10,943,121 |
| * | The differences between book-basis and tax-basis net unrealized appreciation are primarily due to deferral of losses from wash sales. |
Unrealized appreciation and depreciation at March 31, 2011, based on cost of investments for federal income tax purposes were:
| | | | |
| | | | |
Unrealized appreciation | | $ | 106,192,608 | |
Unrealized depreciation | | | (95,249,487 | ) |
| | | | |
Net unrealized appreciation | | $ | 10,943,121 | |
| | | | |
The following capital loss carryforwards may be available to reduce taxable income arising from future net realized gains on investments, if any, to the extent permitted by the Internal Revenue Code:
| | | | |
| | | | |
| Year of Expiration | | Capital Loss
Carryforwards | |
2016 | | $ | 29,716,227 | |
2017 | | | 3,958,085 | |
2018 | | | 3,942,436 | |
| | | | |
| | $ | 37,616,748 | |
Of the capital loss carryforwards attributable to the Fund, $29,716,227 [will expire in 2016] was acquired from the merger with Columbia Total Return Bond Fund, all of which remains.
Capital loss carryforwards of $44,174,559 were utilized during the year ended March 31, 2011. Any capital loss carryforwards acquired as part of a merger that are permanently lost due to provisions under the Internal Revenue Code are included as being expired.
Management of the Fund has concluded that there are no significant uncertain tax positions that would require recognition in the financial statements. However, management’s conclusion may be subject to review and adjustment at a later date based on factors including, but not limited to, new tax laws, regulations, and administrative interpretations (including relevant court decisions). The Fund’s federal tax returns for the prior three fiscal years remain subject to examination by the Internal Revenue Service.
Note 11. Significant Risks and Contingencies
Sector Focus Risk
The Fund may focus its investments in certain sectors, subjecting it to greater risk than a fund that is less focused.
High-Yield Securities Risk
Investing in high-yield fixed income securities may involve greater credit risk and considerations not typically associated with investing in U.S. Government bonds and other higher quality fixed income securities. These securities are non-investment grade securities, often referred to as “junk” bonds. Economic downturns may disrupt the high yield market and impair the ability of issuers to repay principal and interest. Also, an increase in interest rates would likely have an adverse impact on the value of such obligations. Moreover, high-yield securities may be less liquid to the extent that there is no established secondary market.
Asset-Backed Securities Risk
The value of asset-backed securities may be affected by, among other factors, changes in interest rates, the market’s assessment of the quality of underlying assets, the creditworthiness of the servicer for the underlying assets, factors concerning the interests in and structure of the issuer or the originator of the underlying assets, or the creditworthiness or rating of the entities that provide any supporting letters of credit, surety bonds, derivative instruments, or other credit enhancement. The value of asset-backed securities also will be affected by the exhaustion, termination or expiration of any credit enhancement. Most asset-backed securities are subject to prepayment risk, which is the possibility that the underlying debt may be refinanced or prepaid prior to maturity during periods of
49
Columbia Intermediate Bond Fund
March 31, 2011
declining or low interest rates, causing the Fund to have to reinvest the money received in securities that have lower yields. In addition, the impact of prepayments on the value of asset-backed securities may be difficult to predict and may result in greater volatility.
Mortgage-Backed Securities Risk
The value of mortgage-backed securities may be affected by, among other things, changes in interest rates, factors concerning the interests in and structure of the issuer or the originator of the mortgages, the creditworthiness of the entities that provide any supporting letters of credit, surety bonds or other credit enhancements or the quality of underlying assets or the market’s assessment thereof. Mortgage-backed securities are subject to prepayment risk, which is the possibility that the underlying mortgage may be refinanced or prepaid prior to maturity during periods of declining or low interest rates, causing the Fund to have to reinvest the money received in securities that have lower yields. In addition, the impact of prepayments on the value of mortgage-backed securities may be difficult to predict and may result in greater volatility.
Note 12. Subsequent Event
Management has evaluated the events and transactions that have occurred through the date the financial statements were issued. Other than as noted below, there were no items requiring adjustment of the financial statements or additional disclosure.
Effective May 16, 2011, the line of credit commitment with State Street was reduced to $150,000,000, and the maximum amount that may be borrowed by any fund was limited to the lesser of $120,000,000 and the Fund’s borrowing limit set forth in the Fund’s registration statement.
Note 13. Information Regarding Pending and Settled Legal Proceedings
In June 2004, an action captioned John E. Gallus et al. v. American Express Financial Corp. and American Express Financial Advisors Inc. was filed in the United States District Court for the District of Arizona. The plaintiffs allege that they are investors in several American Express Company (now known as RiverSource) mutual funds and they purport to bring the action derivatively on behalf of those funds under the Investment Company Act of 1940. The plaintiffs allege that fees allegedly paid to the defendants by the funds for investment advisory and administrative services are excessive. The plaintiffs seek remedies including restitution and rescission of investment advisory and distribution agreements. The plaintiffs voluntarily agreed to transfer this case to the United States District Court for the District of Minnesota (the District Court). In response to defendants’ motion to dismiss the complaint, the District Court dismissed one of plaintiffs’ four claims and granted plaintiffs limited discovery. Defendants moved for summary judgment in April 2007. Summary judgment was granted in the defendants’ favor on July 9, 2007. The plaintiffs filed a notice of appeal with the Eighth Circuit Court of Appeals (the Eighth Circuit) on August 8, 2007. On April 8, 2009, the Eighth Circuit reversed summary judgment and remanded to the District Court for further proceedings. On August 6, 2009, defendants filed a writ of certiorari with the U.S. Supreme Court (the Supreme Court), asking the Supreme Court to stay the District Court proceedings while the Supreme Court considers and rules in a case captioned Jones v. Harris Associates, which involves issues of law similar to those presented in the Gallus case. On March 30, 2010, the Supreme Court issued its ruling in Jones v. Harris Associates, and on April 5, 2010, the Supreme Court vacated the Eighth Circuit’s decision in the Gallus case and remanded the case to the Eighth Circuit for further consideration in light of the Supreme Court’s decision in Jones v. Harris Associates. On June 4, 2010, the Eighth Circuit remanded the Gallus case to the District Court for further consideration in light of the Supreme Court’s decision in Jones v. Harris Associates. On December 9, 2010, the District Court reinstated its July 9, 2007 summary judgment order in favor of the defendants. On January 10, 2011, plaintiffs filed a notice of appeal with the Eighth Circuit.
In December 2005, without admitting or denying the allegations, American Express Financial Corporation (AEFC, which is now known as Ameriprise Financial, Inc. (Ameriprise Financial)), entered into settlement agreements with the Securities and Exchange Commission (SEC) and Minnesota Department of Commerce (MDOC) related to market timing activities. As a result, AEFC was censured and ordered to cease and desist from committing or causing any violations of certain provisions of the Investment Advisers Act of 1940, the Investment Company Act of 1940, and various Minnesota laws. AEFC agreed to pay disgorgement of $10 million and civil money penalties of $7 million. AEFC also agreed to retain an independent distribution consultant to assist in developing a plan for distribution of all disgorgement and civil penalties ordered by the SEC in accordance with various undertakings detailed at http://www.sec.gov/litigation/admin/ia-2451.pdf. Ameriprise Financial and its affiliates have cooperated with the SEC and the MDOC in these legal proceedings, and have made regular reports to the funds’ Boards of Directors/Trustees.
50
Columbia Intermediate Bond Fund
March 31, 2011
Ameriprise Financial and certain of its affiliates have historically been involved in a number of legal, arbitration and regulatory proceedings, including routine litigation, class actions, and governmental actions, concerning matters arising in connection with the conduct of their business activities. Ameriprise Financial believes that the Funds are not currently the subject of, and that neither Ameriprise Financial nor any of its affiliates are the subject of, any pending legal, arbitration or regulatory proceedings that are likely to have a material adverse effect on the Funds or the ability of Ameriprise Financial or its affiliates to perform under their contracts with the Funds. Ameriprise Financial is required to make 10-Q, 10-K and, as necessary, 8-K filings with the Securities and Exchange Commission on legal and regulatory matters that relate to Ameriprise Financial and its affiliates. Copies of these filings may be obtained by accessing the SEC website at www.sec.gov.
There can be no assurance that these matters, or the adverse publicity associated with them, will not result in increased fund redemptions, reduced sale of fund shares or other adverse consequences to the Funds. Further, although we believe proceedings are not likely to have a material adverse effect on the Funds or the ability of Ameriprise Financial or its affiliates to perform under their contracts with the Funds, these proceedings are subject to uncertainties and, as such, we are unable to estimate the possible loss or range of loss that may result. An adverse outcome in one or more of these proceedings could result in adverse judgments, settlements, fines, penalties or other relief that could have a material adverse effect on the consolidated financial condition or results of operations of Ameriprise Financial.
Note 14. Fund Merger
At the close of business on March 11, 2011, Columbia Intermediate Bond Fund acquired the assets and assumed the identified liabilities of Columbia Total Return Bond Fund. The reorganization was completed after shareholders approved the plan on February 15, 2011. The purpose of the transaction was to combine two funds managed by the Investment Manager with comparable investment objectives and strategies.
The aggregate net assets of Columbia Intermediate Bond Fund immediately before the acquisition were $2,109,939,475 and the combined net assets immediately after the acquisition were $3,130,592,718.
The merger was accomplished by a tax-free exchange of 101,858,165 shares of Columbia Total Return Bond Fund, valued at $1,020,653,243.
In exchange for Columbia Total Return Bond Fund shares and net assets, Columbia Intermediate Bond Fund issued the following number of shares:
| | | | |
| | | | |
| | | Shares | |
Class A | | | 2,333,001 | |
Class B | | | 241,230 | |
Class C | | | 356,235 | |
Class Z | | | 109,206,406 | |
For financial reporting purposes, net assets received and shares issued by Columbia Intermediate Bond Fund were recorded at fair value; however, Columbia Total Return Bond Fund’s cost of investments was carried forward to align ongoing reporting of Columbia Intermediate Bond Fund’s realized and unrealized gains and losses with amounts distributable to shareholders for tax purposes.
The financial statements reflect the operations of Columbia Intermediate Bond Fund for the period prior to the merger and the combined fund for the period subsequent to the merger. Because the combined investment portfolios have been managed as a single integrated portfolio since the merger was completed, it is not practicable to separate the amounts of revenue and earnings of Columbia Total Return Bond Fund that have been included in the combined Fund’s Statement of Operations since the merger was completed.
Assuming the merger had been completed on April 1,2010, the Fund’s pro-forma net investment income (loss), net gain (loss) on investments, net change in unrealized appreciation (depreciation) and net increase in net assets from operations for the year ended March 31,2011 would have been approximately $142.3 million, $80.0, million ($24.8 million) and $197.5 million, respectively.
51
Report of Independent Registered Public Accounting Firm
To the Trustees of Columbia Funds Series Trust I and the Shareholders of Columbia Intermediate Bond Fund
In our opinion, the accompanying statement of assets and liabilities, including the investment portfolio, and the related statements of operations and of changes in net assets and the financial highlights present fairly, in all material respects, the financial position of Columbia Intermediate Bond Fund (the “Fund”) (a series of Columbia Funds Series Trust I) at March 31, 2011, the results of its operations for the year then ended, the changes in its net assets for each of the two years in the period then ended, and the financial highlights for the periods indicated, in conformity with accounting principles generally accepted in the United States of America. These financial statements and financial highlights (hereafter referred to as “financial statements”) are the responsibility of the Fund’s management; our responsibility is to express an opinion on these financial statements based on our audits. We conducted our audits of these financial statements in accordance with the standards of the Public Company Accounting Oversight Board (United States). Those standards require that we plan and perform the audit to obtain reasonable assurance about whether the financial statements are free of material misstatement. An audit includes examining, on a test basis, evidence supporting the amounts and disclosures in the financial statements, assessing the accounting principles used and significant estimates made by management, and evaluating the overall financial statement presentation. We believe that our audits, which included confirmation of securities at March 31, 2011 by correspondence with the custodian and brokers, provide a reasonable basis for our opinion.
PricewaterhouseCoopers LLP
Boston, Massachusetts
May 20, 2011
52
Fund Governance
The Trustees serve terms of indefinite duration. The names, addresses and birth years of the Trustees and Officers of the Funds in the Columbia Funds Series Trust I, the year each was first elected or appointed to office, their principal business occupations during at least the last five years, the number of Funds overseen by each Trustee and other directorships they hold are shown below. Each officer listed below serves as an officer of each Fund in the Columbia Funds Series Trust I.
Independent Trustees
| | |
Name, Address and Year of Birth,
Position with Funds, Year First
Elected or Appointed to Office | | Principal Occupation(s) During Past Five Years, Number of Funds in Columbia Funds
Complex Overseen by Trustee, Other Directorships Held |
| |
| John D. Collins (born 1938) | | |
c/o Columbia Management Investment Advisers, LLC 225 Franklin Street Boston, MA 02110 Trustee (since 2005) | | Retired. Consultant, KPMG, LLP (accounting and tax firm) from July 1999 to June 2000; Partner, KPMG, LLP from March 1962 to June 1999. Oversees 46; Mrs. Fields Original Cookies, Inc. (consumer products); Suburban Propane Partners, L.P.; and Montpelier Re (insurance underwriting firm) |
| |
| Rodman L. Drake (born 1943) | | |
c/o Columbia Management Investment Advisers, LLC 225 Franklin Street Boston, MA 02110 Trustee (since 1994) and Chairman of the Board (since 2009) | | Independent consultant since 2010; Co-Founder of Baringo Capital LLC (private equity) from 1997 to 2008; CEO of Crystal River Capital, Inc. (real estate investment trust) from 2003 to 2010; Oversees 46; Jackson Hewitt Tax Service Inc. (tax preparation services); Celgene Corporation (global biotechnology company); Student Loan Corporation (student loan provider); Crystal River Capital, Inc. from 2005 to 2010; Parsons Brinckerhoff from 1995 to 2008; the Helios Funds (closed-end funds); and Apex Silver Mines Ltd. from 2007 to 2009 |
| |
| Douglas A. Hacker (born 1955) | | |
c/o Columbia Management Investment Advisers, LLC 225 Franklin Street Boston, MA 02110 Trustee (since 1996) | | Independent business executive since May 2006; Executive Vice President–Strategy of United Airlines (airline) from December 2002 to May 2006; President of UAL Loyalty Services (airline marketing company) from September 2001 to December 2002; Executive Vice President and Chief Financial Officer of United Airlines from July 1999 to September 2001. Oversees 46; Nash Finch Company (food distributor); Aircastle Limited (aircraft leasing); and SeaCube Container Leasing Ltd (container leasing) |
|
| Janet Langford Kelly (born 1957) |
c/o Columbia Management Investment Advisers, LLC 225 Franklin Street Boston, MA 02110 Trustee (since 1996) | | Senior Vice President, General Counsel and Corporate Secretary, ConocoPhillips (integrated energy company) since September 2007; Deputy General Counsel–Corporate Legal Services, ConocoPhillips from August 2006 to August 2007; Partner, Zelle, Hofmann, Voelbel, Mason & Gette LLP (law firm) from March 2005 to July 2006; Adjunct Professor of Law, Northwestern University, from September 2004 to June 2006; Director, UAL Corporation (airline) from February 2006 to July 2006; Oversees 46; None |
| |
| William E. Mayer (born 1940) | | |
c/o Columbia Management Investment Advisers, LLC 225 Franklin Street Boston, MA 02110 Trustee (since 1994) | | Partner, Park Avenue Equity Partners (private equity) since February 1999; Dean and Professor, College of Business and Management, University of Maryland from 1992 to 1996. Oversees 46; DynaVox Inc. (software developer); Lee Enterprises (print media), WR Hambrecht + Co. (financial service provider); BlackRock Kelso Capital Corporation (investment company) |
53
Fund Governance (continued)
Independent Trustees (continued)
| | |
Name, Address and Year of Birth,
Position with Funds, Year First
Elected or Appointed to Office | | Principal Occupation(s) During Past Five Years, Number of Funds in Columbia Funds
Complex Overseen by Trustee, Other Directorships Held |
| |
| David M. Moffett (born 1952) | | |
c/o Columbia Management Investment Advisers, LLC 225 Franklin Street Boston, MA 02110 Trustee (since 2011) | | Retired. Chief Executive Officer, Federal Home Loan Mortgage Corporation, from 2008 to 2009; Senior Adviser, Global Financial Services Group, Carlyle Group, Inc., from 2007 to 2008; Vice Chairman and Chief Financial Officer, U.S. Bancorp, from 1993 to 2007. Oversees 46; CIT Group Inc. (commercial and consumer finance), eBay Inc. (online trading community), MBIA Corp (financial service provider), E.W. Scripps Co. (print and television media), Building Materials Holding Corp. (building materials and construction services), and University of Oklahoma Foundation. |
| |
| Charles R. Nelson (born 1942) | | |
c/o Columbia Management Investment Advisers, LLC 225 Franklin Street Boston, MA 02110 Trustee (since 1981) | | Professor of Economics, University of Washington, since January 1976; Ford and Louisa Van Voorhis Professor of Political Economy, University of Washington, since September 1993; Adjunct Professor of Statistics, University of Washington, since September 1980; Associate Editor, Journal of Money Credit and Banking, 1993-2008; Consultant on econometric and statistical matters. Oversees 46; None |
| |
| John J. Neuhauser (born 1943) | | |
c/o Columbia Management Investment Advisers, LLC 225 Franklin Street Boston, MA 02110 Trustee (since 1984) | | President, Saint Michael’s College, since August 2007; Director or Trustee of several non-profit organization, including Fletcher Allen Health Care, Inc.; University Professor, Boston College from November 2005 to August 2007; Academic Vice President and Dean of Faculties, Boston College from August 1999 to October 2005. Oversees 46; Liberty All-Star Equity Fund and Liberty All-Star Growth Fund, Inc. (closed-end funds) |
| |
| Jonathan Piel (born 1938) | | |
c/o Columbia Management Investment Advisers, LLC 225 Franklin Street Boston, MA 02110 Trustee (since 1994) | | Cable television producer and website designer; The Editor, Scientific American from 1984 to 1994; Vice President, Scientific American, Inc., from 1984 to 1994; Member, Advisory Board, Stone Age Institute, Bloomington, Indiana (research institute that explores the effect of technology on human evolution); Member, Board of Directors of the National Institute of Social Sciences, New York City; Member, Board of Trustees of the William Alanson White Institute, New York City (institution for training psychoanalysts); and Member, Advisory Board, Mount Sinai Children’s Environmental Health Center, New York. Oversees 46; None |
| |
| Patrick J. Simpson (born 1944) | | |
c/o Columbia Management Investment Advisers, LLC 225 Franklin Street Boston, MA 02110 Trustee (since 2000) | | Partner, Perkins Coie LLP (law firm). Oversees 46; None |
| |
| Anne-Lee Verville (born 1945) | | |
c/o Columbia Management Investment Advisers, LLC 225 Franklin Street Boston, MA 02110 Trustee (since 1998) | | Retired since 1997 (formerly General Manager–Global Education Industry from 1994 to 1997, President–Application Systems Division from 1991 to 1994, Chief Financial Officer–US Marketing & Services from 1988 to 1991, and Chief Information Officer from 1987 to 1988, IBM Corporation (computer and technology)). Oversees 46; Enesco Group, Inc. (producer of giftware and home and garden decor products) from 2001 to 2006 |
54
Fund Governance (continued)
Interested Trustee
| | |
Name, Address and Year of Birth,
Position with Funds, Year First
Elected or Appointed to Office | | Principal Occupation(s) During Past Five Years, Number of Funds in Columbia Funds
Complex Overseen by Trustee, Other Directorships Held |
| |
| Michael A. Jones (born 1959) | | |
c/o Columbia Management Investment Advisers, LLC 225 Franklin Street Boston, MA 02110 Trustee (since 2011) Senior Vice President (since 2010) | | President and Director, Columbia Management Investment Advisers, LLC since May 2010; President and Director, Columbia Management Investment Distributors, Inc. since May 2010; Manager, Chairman, Chief Executive Officer and President, Columbia Management Advisors, LLC from 2007 to April 2010; Chief Executive Officer, President and Director, Columbia Management Distributors, Inc. from November 2006 to April 2010; previously, co-president and senior managing director at Robeco Investment Management. Oversees 46; None |
The Statement of Additional Information includes additional information about the Trustees of the Funds and is available, without charge, upon request by calling 1-800-345-6611.
55
Fund Governance (continued)
Officers
| | |
| Name, Year of Birth and Address | | Principal Occupation(s) During the Past Five Years |
|
| J. Kevin Connaughton (born 1964) |
225 Franklin Street Boston, MA 02110 President (since 2009) | | Senior Vice President and General Manager–Mutual Fund Products, Columbia Management Investment Advisers, LLC since May 2010; President, Columbia Funds, since 2009, and RiverSource Funds, since May 2010 (previously Senior Vice President and Chief Financial Officer, Columbia Funds, from June 2008 to January 2009, Treasurer, Columbia Funds, from October 2003 to May 2008, and senior officer of various other affiliated funds since 2000); Managing Director, Columbia Management Advisors, LLC from December 2004 to April 2010. |
| |
| Michael G. Clarke (born 1969) | | |
225 Franklin Street Boston, MA 02110 Treasurer (since 2011) and Chief Financial Officer (since 2009) | | Vice President, Columbia Management Investment Advisers, LLC since May 2010; Managing Director of Fund Administration, Columbia Management Advisors, LLC, from September 2004 to April 2010; senior officer of Columbia Funds and affiliated funds since 2002. |
| |
| Scott R. Plummer (born 1959) | | |
5228 Ameriprise Financial Center Minneapolis, MN 55474 Senior Vice President, Secretary and Chief Legal Officer (since 2010) | | Chief Legal Officer and Assistant Secretary, Columbia Management Investment Advisers, LLC since June 2005; Vice President and Lead Chief Counsel–Asset Management, Ameriprise Financial, Inc. since May 2010 (previously Vice President and Chief Counsel–Asset Management, from 2005 to April 2010, and Vice President–Asset Management Compliance from 2004 to 2005); Vice President, Chief Counsel and Assistant Secretary, Columbia Management Investment Distributors, Inc. since 2008; Vice President, General Counsel and Secretary, Ameriprise Certificate Company since 2005; Chief Counsel, RiverSource Distributors, Inc. since 2006; Vice President, General Counsel and Secretary, RiverSource Funds, since December 2006; Senior Vice President, Secretary and Chief Legal Officer, Columbia Funds, since May 2010. |
| |
| Linda J. Wondrack (born 1964) | | |
225 Franklin Street Boston, MA 02110 Senior Vice President and Chief Compliance Officer (since 2007) | | Vice President and Chief Compliance Officer, Columbia Management Investment Advisers, LLC since May 2010; Chief Compliance Officer, Columbia Funds, since 2007, and RiverSource Funds, since May 2010; Director (Columbia Management Group, LLC and Investment Product Group Compliance), Bank of America, from June 2005 to April 2010; Director of Corporate Compliance and Conflicts Officer of MFS Investment Management (investment management) from August 2004 to May 2005. |
| |
| William F. Truscott (born 1960) | | |
53600 Ameriprise Financial Center Minneapolis, MN 55474 Senior Vice President (since 2010) | | Chairman of the Board, Columbia Management Investment Advisers, LLC since May 2010 (previously President, Chairman of the Board and Chief Investment Officer, from 2001 to April 2010); Chief Executive Officer, U.S. Asset Management & President, Annuities, Ameriprise Financial, Inc. since May 2010 (previously President–U.S. Asset Management and Chief Investment Officer from 2005 to April 2010, and Senior Vice President–Chief Investment Officer, from 2001 to 2005); Director, President and Chief Executive Officer, Ameriprise Certificate Company since 2006; Director, Columbia Management Investment Distributors, Inc. since May 2010 (previously Chairman of the Board and Chief Executive Officer from 2008 to April 2010); Chairman of the Board and Chief Executive Officer, RiverSource Distributors, Inc. since 2006. |
56
Fund Governance (continued)
Officers (continued)
| | |
| Name, Year of Birth and Address | | Principal Occupation(s) During the Past Five Years |
|
| Colin Moore (born 1958) |
225 Franklin Street Boston, MA 02110 Senior Vice President (since 2010) | | Director and Chief Investment Officer, Columbia Management Investment Advisers, LLC since May 2010; Manager, Managing Director and Chief Investment Officer of Columbia Management Advisors, LLC from 2007 to April 2010; Head of Equities, Columbia Management Advisors, LLC from 2002 to 2007. |
| |
| Amy Johnson (born 1965) | | |
5228 Ameriprise Financial Center Minneapolis, MN 55474 Vice President (since 2010) | | Senior Vice President and Chief Operating Officer, Columbia Management Investment Advisers, LLC since May 2010 (previously Chief Administrative Officer, from 2009 until April 2010, Vice President–Asset Management and Trust Company Services, from 2006 to 2009, and Vice President–Operations and Compliance from 2004 to 2006). |
| |
| Joseph F. DiMaria (born 1968) | | |
225 Franklin Street Boston, MA 02110 Vice President (since 2011) and Chief Accounting Officer (since 2008) | | Vice President, Mutual Fund Administration, Columbia Management Investment Advisers, LLC, since May 2010; Director of Fund Administration, Columbia Management Advisors, LLC from January 2006 to April 2010; Head of Tax/Compliance and Assistant Treasurer, Columbia Management Advisors, LLC, from November 2004 to December 2005. |
| |
| Paul D. Pearson (born 1956) | | |
| 5228 Ameriprise Financial Center Minneapolis, MN 55474 Vice President and Assistant Treasurer (since 2011) | | Vice President, Investment Accounting, Columbia Management Investment Advisers, LLC, since May 2010; Vice President, Managed Assets, Investment Accounting, Ameriprise Financial Corporation. |
| |
| Paul B. Goucher (born 1968) | | |
| 5228 Ameriprise Financial Center Minneapolis, MN 55474 Vice President and Assistant Treasurer (since 2010) | | Vice President and Chief Counsel of Ameriprise Financial since January 2010 (formerly Vice President and Group Counsel from November 2008 to January 2010); Director, Managing Director and General Counsel of J. & W. Seligman & Co. Incorporated (Seligman) from July 2008 to November 2008 and Managing Director and Associate General Counsel of Seligman from January 2005 to July 2008. |
| |
| Christopher O. Petersen (born 1970) | | |
| 5228 Ameriprise Financial Center Minneapolis, MN 55474 Vice President and Assistant Treasurer (since 2010) | | Vice President and Chief Counsel, Ameriprise Financial since January 2010 (formerly Vice President and Group Counsel or Counsel from April 2004 to January 2010); Assistant Secretary of RiverSource Funds since January 2007. |
| |
| Michael E. DeFao (born 1968) | | |
| 5228 Ameriprise Financial Center Minneapolis, MN 55474 Vice President and Assistant Treasurer (since 2011) | | Vice President and Chief Counsel, Ameriprise Financial since May 2010; Associate General Counsel Bank of America from June 2005 to April 2010. |
| |
| Stephen T. Welsh (born 1957) | | |
225 Franklin Street Boston, MA 02110 Vice President (since 2006) | | President and Director, Columbia Management Investment Services Corp. since May 2010; President and Director, Columbia Management Services, Inc. from July 2004 to April 2010; Managing Director, Columbia Management Distributors, Inc. from August 2007 to April 2010. |
57
Shareholder Meeting Results
At a Joint Special Meeting of Shareholders held on February 15, 2011, shareholders of the Fund considered a proposal to approve a proposed amendment to the Investment Management Services Agreement with Columbia Management Investment Advisers, LLC. The proposal was approved as follows:
| | | | | | |
| | | | | | | |
| Votes For | | Votes Against | | Abstentions | | Broker Non-Votes |
| 1,096,164,358 | | 413,329,174 | | 7,626,156 | | 0 |
58
[THIS PAGE INTENTIONALLY LEFT BLANK]
59
[THIS PAGE INTENTIONALLY LEFT BLANK]
60
Important Information About This Report
The fund mails one shareholder report to each shareholder address. If you would like more than one report, please call shareholder services at 1-800-345-6611 and additional reports will be sent to you. This report has been prepared for shareholders of Columbia Intermediate Bond Fund.
A description of the policies and procedures that the fund uses to determine how to vote proxies and a copy of the fund’s voting records are available (i) at www.columbiamanagement.com, (ii) on the Securities and Exchange Commission’s website at www.sec.gov, and (iii) without charge, upon request, by calling 1-800-368-0346. Information regarding how the fund voted proxies relating to portfolio securities during the 12-month period ended June 30 is available from the SEC’s website. Information regarding how the fund voted proxies relating to portfolio securities is also available from the fund’s website, www.columbiamanagement.com.
The fund files a complete schedule of portfolio holdings with the SEC for the first and third quarters of each fiscal year on Form N-Q. The fund’s Form N-Q is available on the SEC’s website at www.sec.gov and may be reviewed and copied at the SEC’s Public Reference Room in Washington, D.C. Information on the operation of the Public Reference Room may be obtained by calling
1-800-SEC-0330.
Transfer Agent
Columbia Management Investment Services Corp.
P.O. Box 8081
Boston, MA 02266-8081
1-800-345-6611
Distributor
Columbia Management Investment
Distributors, Inc.
225 Franklin Street
Boston, MA 02110
Investment Manager
Columbia Management Investment Advisers, LLC
225 Franklin Street
Boston, MA 02110
61

Columbia Intermediate Bond Fund
P.O. Box 8081
Boston, MA 02266-8081
columbiamanagement.com
This information is for use with concurrent or prior delivery of a fund prospectus. Investors should consider the investment objectives, risks, charges and expenses of a mutual fund carefully before investing. For a free prospectus, which contains this and other important information about the funds, visit columbiamanagement.com. Read the prospectus carefully before investing. The Fund is distributed by Columbia Management Investment Distributors, Inc., member FINRA, and managed by Columbia Management Investment Advisers, LLC.
©2011 Columbia Management Investment Advisers, LLC. All rights reserved.
C-1186 A (05/11)

Columbia U.S. Treasury Index Fund
Annual Report for the Period Ended March 31, 2011
Table of Contents
The views expressed in this report reflect the current views of the respective parties. These views are not guarantees of future performance and involve certain risks, uncertainties and assumptions that are difficult to predict, so actual outcomes and results may differ significantly from the views expressed. These views are subject to change at any time based upon economic, market or other conditions and the respective parties disclaim any responsibility to update such views. These views may not be relied on as investment advice and, because investment decisions for a Columbia Fund are based on numerous factors, may not be relied on as an indication of trading intent on behalf of any particular Columbia Fund. References to specific securities should not be construed as a recommendation or investment advice.
President’s Message

Dear Shareholder:
The Columbia Management story began over 100 years ago, and today, we are one of the nation’s largest dedicated asset managers. The recent acquisition by Ameriprise Financial, Inc. brings together the talents, resources and capabilities of Columbia Management with those of RiverSource Investments, Threadneedle (acquired by Ameriprise in 2003) and Seligman Investments (acquired by Ameriprise in 2008) to build a best-in-class asset management business that we believe is truly greater than its parts.
RiverSource Investments traces its roots to 1894 when its then newly-founded predecessor, Investors Syndicate, offered a face-amount savings certificate that gave small investors the opportunity to build a safe and secure fund for retirement, education or other special needs. A mutual fund pioneer, Investors Syndicate launched Investors Mutual Fund in 1940. In the decades that followed, its mutual fund products and services lineup grew to include a full spectrum of styles and specialties. More than 110 years later, RiverSource continues to be a trusted financial products leader.
Threadneedle, a leader in global asset management and one of Europe’s largest asset managers, offers sophisticated international experience from a dedicated U.K. management team. Headquartered in London, it is named for Threadneedle Street in the heart of the city’s financial district, where British investors pioneered international and global investing. Threadneedle was acquired in 2003 and today operates as an affiliate of Columbia Management.
Seligman Investments’ beginnings date back to the establishment of the investment firm J. & W. Seligman & Co. in 1864. In the years that followed, Seligman played a major role in the geographical expansion and industrial development of the United States. In 1874, President Ulysses S. Grant named Seligman as fiscal agent for the U.S. Navy — an appointment that would last through World War I. Seligman helped finance the westward path of the railroads and the building of the Panama Canal. The firm organized its first investment company in 1929 and began managing its first mutual fund in 1930. In 2008, J. & W. Seligman & Co. Incorporated was acquired and Seligman Investments became an offering brand of RiverSource Investments, LLC.
We are proud of the rich and distinctive history of these firms, the strength and breadth of products and services they offer, and the combined cultures of pioneering spirit and forward thinking. Together we are committed to providing more for our shareholders than ever before.
| n | | A singular focus on our shareholders. Our business is asset management, so investors are our first priority. We dedicate our resources to identifying timely investment opportunities and provide a comprehensive choice of equity, fixed-income and alternative investments to help meet your individual needs. |
| n | | First-class research and thought leadership. We are dedicated to helping you take advantage of today’s opportunities and anticipate tomorrow’s. We stay abreast of the latest investment trends and ideas, using our collective insight to evaluate events and transform them into solutions you can use. |
| n | | A disciplined investment approach. We aren’t distracted by passing fads. Our teams adhere to a rigorous investment process that helps ensure the integrity of our products and enables you and your financial advisor to match our solutions to your objectives with confidence. |
When you choose Columbia Management, you can be confident that we will take the time to understand your needs and help you and your financial advisor identify the solutions that are right for you. Because at Columbia Management, we don’t consider ourselves successful unless you are.
Sincerely,

J. Kevin Connaughton
President, Columbia Funds
Investors should consider the investment objectives, risks, charges and expenses of a mutual fund carefully before investing. For a free prospectus, which contains this and other important information about the funds, visit www.columbiamanagement.com. The prospectus should be read carefully before investing.
Columbia Funds are distributed by Columbia Management Investment Distributors, Inc., member FINRA, and managed by Columbia Management Investment Advisers, LLC.
© 2011 Columbia Management Investment Advisers, LLC. All rights reserved.
Fund Profile – Columbia U.S. Treasury Index Fund
Performance data quoted represents past performance and current performance may be lower or higher. Past performance is no guarantee of future results. The investment return and principal value will fluctuate so that shares, when redeemed, may be worth more or less than the original cost. Please visit www.columbiamanagement.com for daily and most recent month-end performance updates.
Summary
1-year return as of 03/31/11
| | |
| |
 | | +4.04% Class A shares
(without sales charge) |
| |
| | +4.46% Citigroup Bond U.S. Treasury Index |
Summary
| n | | For the 12-month period that ended March 31, 2011, the fund’s class A shares returned 4.04% without sales charge. |
| n | | The fund performed generally in line with its benchmark, the Citigroup Bond U.S. Treasury Index1, which posted a total return of 4.46% for the same period. |
| n | | Fees generally accounted for the small performance difference between the benchmark and the fund. |
Portfolio Management
William Finan has managed the fund since 2010 and has been associated with the fund’s adviser or the fund’s previous adviser or its predecessors since 2009.
Orhan Imer has managed the fund since 2010 and has been associated with the fund’s adviser or the fund’s previous adviser or its predecessors since 2009.
| 1 | The Citigroup Bond U.S. Treasury Index is composed of all U.S. Treasury notes and bonds with remaining maturities of at least one year and outstanding principal of at least $25 million that are included in the Citigroup Broad Investment-Grade Bond Index. Securities in the Citigroup Bond U.S. Treasury Index are weighted by market value, that is, the price per bond or note multiplied by the number of bonds or notes outstanding. |
Indices are not available for investment, are not professionally managed and do not reflect sales charges, fees, brokerage commissions, taxes or other expenses of investing. Securities in the fund may not match those in an index.
1
Economic Update – Columbia U.S. Treasury Index Fund
Summary
For the 12-month period that ended March 31, 2011
| | n | | Strengthening economic growth and rising interest rates kept a lid on most bond market sectors. The Barclays Capital Aggregate Bond Index delivered modest results. However, high-yield bonds were strong performers, as measured by the JPMorgan Developed BB High Yield Index. | |
| | |
| Barclays Aggregate Index | | JPMorgan Index |
| |

| |
|
5.12% | | 13.04% |
| | n | | The U.S. stock market, as measured by the S&P 500 Index, delivered solid returns, despite a summer 2010 correction. Foreign stock market returns were also positive, as measured by the MSCI EAFE Index (Net). | |
| | |
| S&P Index | | MSCI Index |
| |
| |
|
15.65% | | 10.42% |
The U.S. economy continued to expand at a solid but uneven pace over the past 12 months, as measured by gross domestic product (GDP). Although lackluster second quarter 2010 GDP growth raised fears that the economy was losing steam and might lapse back into recession, the pace picked up in the third quarter of 2010, inspiring confidence among consumers, businesses and investors. GDP expanded by 2.6% in the third quarter and 3.1% in the fourth quarter. With the Federal Reserve Board (the Fed) providing additional monetary stimulus to shore up economic growth and the extension of key tax cuts for the next two years, expectations are for continued growth in 2011. However, early estimates of first quarter 2011 growth place it just under 2.0%, a disappointment after two strong quarters and a pick-up in employment.
Consumer spending on cars, clothing and other goods generally trended higher during the 12-month period, accelerating in the fourth quarter. Holiday spending rose 5.5% between November 5, 2010 and December 24, 2010, in all retail categories, excluding automobiles, compared with the same period in 2009, according to MasterCard Advisors’ SpendingPulse, which tracks spending on all transactions including cash. Personal income surged in January 2011 as payroll tax cuts kicked in. The personal savings rate edged higher, ending February 2011, the last month for which data was available, at 5.8%.
News on the job front was increasingly positive. A good portion of the jobs added in March, April and May of 2010 were temporary, government-sponsored census positions, which began to unwind in June, July and August of 2010. However, private sector payroll employment began to trend higher in the third quarter, massive layoffs declined and job growth turned solidly positive, with the addition of 444,000 new jobs in the first quarter of 2011.
Despite some glimmers of improvement early in 2010, the housing market remained troublesome throughout the period. Both new and existing home sales fell after a federal tax credit for new and repeat homebuyers expired. Distressed properties pressured prices and foreclosures continued — another drag on prices. The inventory of unsold homes ended the period higher than it started, at 8.9 and 8.6 months for both new and existing homes, respectively, according to the National Association of Realtors and a joint release from the U.S. Census Bureau and the U.S. Department of Housing and Urban Development. The new year brought more disappointing news: Existing home sales fell in January 2011 after three months of sustained improvement. Tight credit and weak appraisals were cited as possible reasons for the decline.
Reports from the business side of the economy were generally positive. A key measure of the nation’s manufacturing situation — the Institute for Supply Management’s Index — took a somewhat surprising turn higher in the final months of the period. Technology spending rose 12% in 2010, according to the NPD Group, a national marketing research firm. Purchases of computers, networking and software returned to prerecession levels. Industrial production rose over the period, and manufacturing capacity utilized, per the report issued by the Fed — a key measure of the health of the manufacturing sector — also edged higher.
2
Economic Update (continued) – Columbia U.S. Treasury Index Fund
Bonds delivered modest returns
As the economy strengthened and interest rates edged higher, most bond sectors delivered modest returns. The Barclays Capital Aggregate Bond Index1 returned 5.12%. High-yield bonds led the fixed-income markets. For the 12 months covered by this report, the JPMorgan Developed BB High Yield Index2 returned 13.04% as default fears abated and investors grew more comfortable with risk. Despite rising yields in the second half of the period, the Treasury market was also positive. The Barclays Capital U.S. Treasury Index3 returned 4.53%. However, municipal bonds struggled in the second half of the period, as interest rates inched higher and issue supply surged ahead of the year-end expiration of the Build America Bonds program. The Barclays Capital Municipal Bond Index4 gained 1.63% for the period. Despite positive economic activity, the Fed kept a key short-term interest rate — the federal funds rate — close to zero, reflecting ongoing concerns about employment and the housing market.
Stocks moved higher despite summer 2010 decline
Against a strengthening economic backdrop, stock prices continued to rally despite a summer 2010 setback linked to a debt crisis brewing in Europe, which raised concerns among U.S. investors. These fears were short-lived and stocks regained their footing. In this environment, the S&P 500 Index5 returned 15.65% for the 12 months through March 31, 2011. Outside the United States, stock markets also delivered solid gains. The MSCI EAFE Index (Net),6 a broad gauge of stock market performance in foreign developed markets, returned 10.42% (in U.S. dollars) for the 12-month period, as concerns about the impact of a bailout for weak euro zone economies eased yet continued to restrain market performance. Emerging stock markets were strong. The MSCI Emerging Markets Index (Net)7 returned 18.46% (in U.S. dollars) for the 12-month period.
Past performance is no guarantee of future results.
| 1 | The Barclays Capital Aggregate Bond Index is a market value-weighted index that tracks the daily price, coupon, pay-downs and total return performance of fixed-rate, publicly placed, dollar-denominated and non-convertible investment grade debt issues with at least $250 million par amount outstanding and with at least one year to final maturity. |
| 2 | The JPMorgan Developed BB High Yield Index is an unmanaged index designed to mirror the investable universe of the U.S. dollar developed, BB-rated, high yield corporate debt market. |
| 3 | The Barclays Capital U.S. Treasury Index includes public obligations of the U.S. Treasury. Treasury bills are excluded by the maturity constraint. In addition, certain special issues, such as state and local government series bonds (SLGs), as well as U.S. Treasury TIPS, are excluded. STRIPS are excluded from the index because their inclusion would result in double-counting. |
| 4 | The Barclays Capital Municipal Bond Index is considered representative of the broad market for investment-grade, tax-exempt bonds with a maturity of at least one year |
| 5 | The Standard & Poor’s (S&P) 500 Index tracks the performance of 500 widely held, large-capitalization U.S. stocks. |
| 6 | The Morgan Stanley Capital International Europe, Australasia, Far East (MSCI EAFE) Index (Net) is a free float-adjusted market capitalization index that is designed to measure the equity market performance of developed markets, excluding the U.S. & Canada. As of December 31, 2010, the MSCI EAFE Index (Net) consisted of the following 22 developed market country indices: Australia, Austria, Belgium, Denmark, Finland, France, Germany, Greece, Hong Kong, Ireland, Israel, Italy, Japan, the Netherlands, New Zealand, Norway, Portugal, Singapore, Spain, Sweden, Switzerland and the United Kingdom. |
| 7 | The Morgan Stanley Capital International Emerging Markets (MSCI EM) Index (Net) is a free float-adjusted market capitalization index that is designed to measure equity market performance of emerging markets. As of December 31, 2010, the MSCI EM Index (Net) consisted of the following 21 emerging market country indices: Brazil, Chile, China, Colombia, Czech Republic, Egypt, Hungary, India, Indonesia, Korea, Malaysia, Mexico, Morocco, Peru, Philippines, Poland, Russia, South Africa, Taiwan, Thailand and Turkey. |
Indices are not available for investment, are not professionally managed and do not reflect sales charges, fees, brokerage commissions, taxes or other expenses of investing. Securities in the fund may not match those in an index.
3
Performance Information – Columbia U.S. Treasury Index Fund
Performance data quoted represents past performance and current performance may be lower or higher. Past performance is no guarantee of future results. The investment return and principal value will fluctuate so that shares, when redeemed, may be worth more or less than the original cost. Please visit www.columbiamanagement.com for daily and most recent month-end performance updates.
| | | | |
| Net asset value per share | |
| |
as of 03/31/11 ($) | | | | |
Class A | | | 11.03 | |
Class B | | | 11.03 | |
Class C | | | 11.03 | |
Class I | | | 11.03 | |
Class Z | | | 11.03 | |
| | | | |
| Distributions declared per share | |
| |
04/01/10 – 03/31/11 ($) | | | | |
Class A | | | 0.54 | |
Class B | | | 0.46 | |
Class C | | | 0.48 | |
Class I | | | 0.41 | |
Class Z | | | 0.57 | |
|
| Performance of a $10,000 investment 04/01/01 – 03/31/11 |
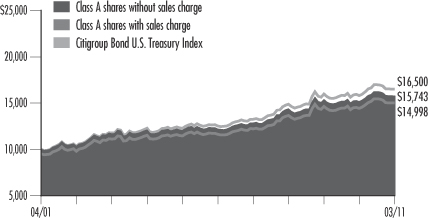
The chart above shows the change in value of a hypothetical $10,000 investment in Class A shares of Columbia U.S. Treasury Index Fund during the stated time period, and does not reflect the deduction of taxes that a shareholder may pay on fund distributions or on the redemption of fund shares.
| | | | | | | | |
| Performance of a $10,000 investment 04/01/01 – 03/31/11 ($) | |
| | |
| Sales charge | | without | | | with | |
Class A | | | 15,743 | | | | 14,998 | |
Class B | | | 14,794 | | | | 14,794 | |
Class C | | | 14,976 | | | | 14,976 | |
Class I | | | n/a | | | | n/a | |
Class Z | | | 16,067 | | | | n/a | |
| | | | | | | | | | | | | | | | | | | | | | | | | | | | | | | | |
| Average annual total return as of 03/31/11 (%) | |
| | | | | |
| Share class | | A | | | B | | | C | | | I | | | Z | |
| Inception | | 11/25/02 | | | 11/25/02 | | | 11/25/02 | | | 9/27/10 | | | 06/04/91 | |
| Sales charge | | without | | | with | | | without | | | with | | | without | | | with | | | without | | | without | |
1-year | | | 4.04 | | | | -0.86 | | | | 3.27 | | | | -1.69 | | | | 3.42 | | | | 2.43 | | | | n/a | | | | 4.40 | |
5-year | | | 5.25 | | | | 4.23 | | | | 4.47 | | | | 4.13 | | | | 4.62 | | | | 4.62 | | | | n/a | | | | 5.51 | |
10-year/Life | | | 4.64 | | | | 4.14 | | | | 3.99 | | | | 3.99 | | | | 4.12 | | | | 4.12 | | | | -2.78 | | | | 4.86 | |
The “with sales charge” returns include the maximum initial sales charge of 4.75% for Class A shares and the applicable contingent deferred sales charge of 5.00% in the first year, declining to 1.00% in the sixth year and eliminated thereafter for Class B shares and 1.00% for Class C shares for the first year only. The “without sales charge” returns do not include the effect of sales charges. If they had, returns would be lower.
Performance results reflect any fee waivers or reimbursements of fund expenses by the investment advisor and/or any of its affiliates. Absent these fee waivers or expense reimbursement arrangements, performance results would have been lower.
All results shown assume reinvestment of distributions. Class Z shares are sold at net asset value with no distribution and service (Rule 12b-1) fees. Class Z shares have limited eligibility and the investment minimum requirements may vary. Please see the fund’s prospectus for details. Performance for different share classes will vary based on differences in sales charges and fees associated with each class.
Class A, Class B, Class C and Class Z share performance information includes returns of Trust shares of the Galaxy II U.S. Treasury Index Fund, the predecessor to the Fund and a series of the Galaxy Fund (the “Predecessor Fund”), for periods prior to November 25, 2002, the date on which Class A, Class B, Class C and Class Z shares were initially offered by the Fund. These returns shown for all share classes reflect any differences in sales charges, but have not been restated to reflect any differences in expenses between the Predecessor Fund share class and the newer share classes. If differences in expenses had been reflected, the returns shown for periods prior to November 25, 2002 would be lower for Class A, Class B and Class C shares.
Class I shares were initially offered on September 27, 2010.
The tables do not reflect the deduction of taxes that a shareholder may pay on fund distributions or on the redemption of fund shares
4
Understanding Your Expenses – Columbia U.S. Treasury Index Fund
As a fund shareholder, you incur two types of costs. There are transaction costs, which generally include sales charges on purchases and may include redemption fees or exchange fees. There are also ongoing costs, which generally include investment advisory fees, distribution and service (Rule 12b-1) fees and other fund expenses. The information on this page is intended to help you understand the ongoing costs of investing in the fund and to compare these costs with the ongoing costs of investing in other mutual funds.
Analyzing your fund’s expenses by share class
To illustrate these ongoing costs, we have provided an example and calculated the expenses paid by investors in each share class during the period. The information in the following table is based on an initial investment of $1,000, which is invested at the beginning of the period and held for the entire period. Expense information is calculated two ways and each method provides you with different information. The amount listed in the “Actual” column is calculated using the fund’s actual operating expenses and total return for the period. The amount listed in the “Hypothetical” column for each share class assumes that the return each year is 5% before expenses and is calculated based on the fund’s actual operating expenses. You should not use the hypothetical account values and expenses to estimate either your actual account balance at the end of the period or the expenses you paid during this period.
Compare with other funds
Since all mutual funds are required to include the same hypothetical calculations about expenses in shareholder reports, you can use this information to compare the ongoing costs of investing in the fund with other funds. To do so, compare the 5% hypothetical example with the 5% hypothetical examples that appear in the shareholder reports of other funds. As you compare hypothetical examples of other funds, it is important to note that hypothetical examples are meant to highlight the ongoing costs of investing in a fund and do not reflect any transaction costs, such as sales charges, redemption fees or exchange fees.
Estimating your actual expenses
To estimate the expenses that you paid over the period, first you will need your account balance at the end of the period:
| | n | | For shareholders who receive their account statements from Columbia Management Investment Services Corp., your account balance is available online at www.columbiamanagement.com or by calling Shareholder Services at 800.345.6611. | |
| | n | | For shareholders who receive their account statements from their financial intermediary, contact your financial intermediary to obtain your account balance. | |
| | 1. | Divide your ending account balance by $1,000. For example, if an account balance was $8,600 at the end of the period, the result would be 8.6. | |
| | 2. | In the section of the table below titled “Expenses paid during the period,” locate the amount for your share class. You will find this number in the column labeled “Actual.” Multiply this number by the result from step 1. Your answer is an estimate of the expenses you paid on your account during the period. | |
If the value of your account falls below the minimum initial investment requirement applicable to you, your account may be subject to a $20 annual fee. This fee is not included in the accompanying table. If you are subject to the fee, keep it in mind when you are estimating the ongoing expenses of investing in the fund and when comparing the expenses of this fund with other funds.
| | | | | | | | | | | | | | | | | | | | | | | | | | | | |
10/01/10 – 3/31/11 | | | | | | | | | | | | | |
| | | Account value at the
beginning of the period ($) | | | Account value at the end of the period ($) | | | Expenses paid
during the period ($) | | | Fund’s annualized
expense ratio (%) | |
| | | Actual | | | Hypothetical | | | Actual | | | Hypothetical | | | Actual | | | Hypothetical | | | Actual | |
Class A | | | 1,000.00 | | | | 1,000.00 | | | | 970.80 | | | | 1,022.69 | | | | 2.21 | | | | 2.27 | | | | 0.45 | |
Class B | | | 1,000.00 | | | | 1,000.00 | | | | 967.20 | | | | 1,018.95 | | | | 5.89 | | | | 6.04 | | | | 1.20 | |
Class C | | | 1,000.00 | | | | 1,000.00 | | | | 967.90 | | | | 1,019.65 | | | | 5.20 | | | | 5.34 | | | | 1.06 | |
Class I | | | 1,000.00 | | | | 1,000.00 | | | | 972.00 | | | | 1,023.93 | | | | 0.98 | | | | 1.01 | | | | 0.20 | |
Class Z | | | 1,000.00 | | | | 1,000.00 | | | | 972.10 | | | | 1,023.93 | | | | 0.98 | | | | 1.01 | | | | 0.20 | |
Expenses paid during the period are equal to the annualized expense ratio for the share class, multiplied by the average account value over the period, then multiplied by the number of days in the fund’s most recent fiscal half-year and divided by 365.
Had the Investment Manager and/or any of its affiliates not waived fees or reimbursed a portion of expenses, account value at the end of the period would have been reduced.
It is important to note that the expense amounts shown in the table are meant to highlight only ongoing costs of investing in the fund and do not reflect any transaction costs, such as sales charges, redemption fees or exchange fees. Therefore, the hypothetical examples provided may not help you determine the relative total costs of owning shares of different funds. If these transaction costs were included, your costs would have been higher.
5
Portfolio Managers’ Report – Columbia U.S. Treasury Index Fund
Performance data quoted represents past performance and current performance may be lower or higher. Past performance is no guarantee of future results. The investment return and principal value will fluctuate so that shares, when redeemed, may be worth more or less than the original cost. Please visit www.columbiamanagement.com for daily and most recent month-end performance updates.
| | | | |
| Maturity breakdown | | | |
| |
as of 03/31/11 (%) | | | | |
1-5 years | | | 57.5 | |
5-10 years | | | 28.1 | |
10-20 years | | | 6.2 | |
20 years and over | | | 8.2 | |
| | | | |
| Asset Allocation | | | |
| |
as of 03/31/11 (%) | | | | |
Government obligations | | | 99.8 | |
Cash & Equivalents | | | 0.2 | |
Maturity breakdown and asset allocation are calculated as a percentage of total investments, excluding securities lending collateral. The fund is actively managed and the composition of its portfolio will change over time.
For the 12-month period that ended March 31, 2011, the fund’s Class A shares returned 4.04% without sales charge. The fund’s Class Z shares returned 4.40%. The Citigroup Bond U.S. Treasury Index posted a total return of 4.46% over the same period. The fund incurs expenses while the index does not, and fees generally accounted for the difference between the fund’s return and that of the index. The fund underperformed the 6.07% average return of the funds in its peer group, the Lipper General U.S. Treasury Funds Index Classification. In general, risk-taking was rewarded in the fixed-income market during the period, and funds in this category with the freedom to venture outside the Treasury market experienced incremental gains as a result.
Modest but solid returns
Treasury securities produced solid if unspectacular returns over the past 12 months. The Treasury market took its cues not only from the current state of the national economy, but also from the efforts of the federal government to manage the economy’s recovery. As a result, the period split into two very different market environments. During the first half of the period, the economy struggled with continuing high unemployment and concerns that the recovery would falter. In this environment, long-term Treasury yields declined sharply — and prices rose. The bellwether 10-year yield dropped from 3.84% to just 2.50% in August 2010. In November, the Federal Reserve Board (the Fed) announced that it would purchase an additional $600 billion of intermediate to long-term Treasury securities in a second round of quantitative easing, popularly referred to as “QE2.” The economy and the equity markets responded favorably to this initiative, but, paradoxically, long-term Treasuries began to weaken. As the economy improved and investors moved into equities, yields on the 10-year bond rose a full percentage point between the QE2 announcement and the end of March 2011. The net result of this volatility was that the 10-year bond finished the period just short of where it began, at a yield of 3.47%.
With the federal funds rate — a key short-term rate that the Fed employs to stimulate economic growth and manage inflation — at near zero, the difference between short-term and long-term yields was fairly wide by historical standards when the period came to a close. Throughout the period, the Treasury extended the duration of its debt, often through the use of long-duration Treasury Inflation-Protection Securities (TIPS). (Duration is a measure of interest-rate sensitivity.)
| 2 | The Citigroup Bond U.S. Treasury Index is composed of all U.S. Treasury notes and bonds with remaining maturities of at least one year and outstanding principal of at least $25 million that are included in the Citigroup Broad Investment-Grade Bond Index. Securities in the Citigroup U.S. Treasury Index are weighted by market value, that is, the price per bond or note multiplied by the number of bonds or notes outstanding. Indices are not available for investment, are not professionally managed and do not reflect sales charges, fees, brokerage commissions, taxes or other expenses of investing. Securities in the fund may not match those in an index. |
| 3 | Lipper Inc., a widely respected data provider in the industry, calculates an average total return (assuming reinvestment of distributions) for mutual funds with investment objectives similar to those of the fund. Lipper makes no adjustment for the effect of sales loads. |
6
Portfolio Managers’ Report (continued) – Columbia U.S. Treasury Index Fund
Looking ahead
We believe that the Fed will need to see a significant drop in the unemployment rate before it can start to reassess its current monetary policy. As a result, short-term interest rates are apt to remain low despite a widely-held belief that inflation will return to the national economic landscape. While some upward movement from today’s depressed inflation levels appears inevitable, the Fed has yet to raise short-term rates in response to this threat and may wait until late 2011 before acting. As the recovery process gains traction and as QE2 winds down, we would not be surprised to see short-term rates edge up and long-term rates move down to produce a flatter “yield curve” as the Fed gets closer to changing its policy.
Portfolio holdings and characteristics are subject to change periodically and may not be representative of current holdings and characteristics. The outlook for the fund may differ from that presented for other Columbia Funds.
The value of the fund may be affected by interest rate changes and the creditworthiness of issuers held in the fund. When interest rates go up, bond prices typically drop, and vice versa.
The fund is subject to indexing risk. Your investment in the fund will typically decline in value when its index declines. Since the fund is designed to track its index before fees and expenses, the fund cannot purchase other securities that may help offset declines in its index. In addition, because the fund may not hold all the issues included in its index, may not always be fully invested and bears advisory, administrative and other expenses and transaction costs in trading securities, the fund’s performance may fail to match the performance of its index, after taking expenses into account. Security prices in a market, sector or industry may fall, reducing the value of your investment. Fund shares are not guaranteed or backed by the U.S. government or any agency.
7
Investment Portfolio – Columbia U.S. Treasury Index Fund
March 31, 2011
Government & Agency Obligations – 99.2%
| | | | | | | | |
| | | Par ($) | | | Value ($) | |
| U.S. Treasury Bonds – 21.0% | | | | | | | | |
3.500% 05/15/20 | | | 5,595,000 | | | | 5,670,644 | |
3.500% 02/15/39 | | | 4,245,000 | | | | 3,559,169 | |
3.875% 08/15/40 | | | 3,710,000 | | | | 3,319,871 | |
4.250% 11/15/40 (a) | | | 3,640,000 | | | | 3,481,318 | |
4.375% 11/15/39 | | | 2,290,000 | | | | 2,240,264 | |
4.375% 05/15/40 | | | 3,435,000 | | | | 3,358,262 | |
4.500% 05/15/38 | | | 5,450,000 | | | | 5,466,181 | |
4.500% 08/15/39 | | | 3,540,000 | | | | 3,538,896 | |
4.625% 02/15/40 (a) | | | 4,745,000 | | | | 4,838,420 | |
4.750% 02/15/41 | | | 2,515,000 | | | | 2,614,028 | |
5.000% 05/15/37 | | | 1,275,000 | | | | 1,385,367 | |
5.375% 02/15/31 | | | 1,260,000 | | | | 1,440,928 | |
5.500% 08/15/28 | | | 2,290,000 | | | | 2,651,389 | |
6.125% 08/15/29 | | | 4,000,000 | | | | 4,965,000 | |
6.250% 08/15/23 (a) | | | 2,970,000 | | | | 3,688,369 | |
6.500% 11/15/26 (a) | | | 670,000 | | | | 856,239 | |
6.750% 08/15/26 (a) | | | 530,000 | | | | 692,726 | |
7.250% 08/15/22 | | | 4,300,000 | | | | 5,743,188 | |
7.500% 11/15/16 | | | 5,920,000 | | | | 7,500,362 | |
8.750% 05/15/17 | | | 6,015,000 | | | | 8,126,361 | |
11.250% 02/15/15 (a) | | | 9,975,000 | | | | 13,562,888 | |
| | | | | | | | |
U.S. Treasury Bonds Total | | | | 88,699,870 | |
| | | | | | | | |
| U.S. Treasury Notes – 78.2% | | | | | | | | |
0.375% 08/31/12 | | | 4,830,000 | | | | 4,821,886 | |
0.375% 09/30/12 (a) | | | 4,440,000 | | | | 4,428,900 | |
0.375% 10/31/12 | | | 3,285,000 | | | | 3,274,094 | |
0.500% 11/30/12 | | | 2,865,000 | | | | 2,858,958 | |
0.500% 10/15/13 | | | 3,890,000 | | | | 3,836,816 | |
0.500% 11/15/13 | | | 3,595,000 | | | | 3,540,513 | |
0.625% 06/30/12 | | | 2,975,000 | | | | 2,982,675 | |
0.625% 07/31/12 | | | 2,395,000 | | | | 2,400,437 | |
0.625% 12/31/12 | | | 2,855,000 | | | | 2,852,548 | |
0.625% 01/31/13 | | | 3,270,000 | | | | 3,263,869 | |
0.625% 02/28/13 (a) | | | 2,825,000 | | | | 2,817,937 | |
0.750% 12/15/13 | | | 1,860,000 | | | | 1,841,109 | |
1.000% 07/15/13 | | | 12,865,000 | | | | 12,885,069 | |
1.000% 01/15/14 (a) | | | 1,555,000 | | | | 1,547,225 | |
1.250% 02/15/14 (a) | | | 1,705,000 | | | | 1,705,799 | |
1.250% 10/31/15 | | | 5,530,000 | | | | 5,336,019 | |
1.375% 05/15/12 | | | 3,360,000 | | | | 3,397,407 | |
1.375% 09/15/12 (a) | | | 22,410,000 | | | | 22,684,007 | |
1.375% 10/15/12 | | | 1,935,000 | | | | 1,958,735 | |
1.375% 02/15/13 | | | 10,020,000 | | | | 10,137,422 | |
1.375% 11/30/15 (a) | | | 2,840,000 | | | | 2,750,140 | |
1.500% 07/15/12 (a) | | | 10,920,000 | | | | 11,069,298 | |
1.750% 04/15/13 | | | 11,915,000 | | | | 12,140,313 | |
1.875% 06/15/12 (a) | | | 6,135,000 | | | | 6,243,559 | |
| | | | | | | | |
| | | Par ($) | | | Value ($) | |
1.875% 02/28/14 | | | 10,780,000 | | | | 10,979,602 | |
1.875% 04/30/14 (a) | | | 9,335,000 | | | | 9,496,178 | |
1.875% 08/31/17 | | | 5,875,000 | | | | 5,570,693 | |
1.875% 09/30/17 | | | 2,485,000 | | | | 2,350,656 | |
1.875% 10/31/17 | | | 2,635,000 | | | | 2,488,634 | |
2.000% 01/31/16 | | | 2,660,000 | | | | 2,640,672 | |
2.125% 05/31/15 (a) | | | 4,040,000 | | | | 4,084,198 | |
2.125% 12/31/15 (a) | | | 1,675,000 | | | | 1,675,392 | |
2.250% 01/31/15 | | | 10,285,000 | | | | 10,497,128 | |
2.250% 11/30/17 (a) | | | 2,045,000 | | | | 1,975,343 | |
2.375% 09/30/14 | | | 5,285,000 | | | | 5,438,389 | |
2.375% 10/31/14 (a) | | | 9,980,000 | | | | 10,258,352 | |
2.500% 03/31/13 | | | 6,650,000 | | | | 6,878,594 | |
2.625% 06/30/14 | | | 9,815,000 | | | | 10,199,934 | |
2.625% 04/30/16 | | | 6,300,000 | | | | 6,411,233 | |
2.625% 01/31/18 (a) | | | 1,515,000 | | | | 1,493,814 | |
2.625% 08/15/20 | | | 5,975,000 | | | | 5,605,297 | |
2.625% 11/15/20 | | | 5,675,000 | | | | 5,295,484 | |
2.750% 12/31/17 (a) | | | 1,615,000 | | | | 1,607,556 | |
2.750% 02/15/19 | | | 1,230,000 | | | | 1,201,844 | |
3.125% 01/31/17 | | | 2,320,000 | | | | 2,393,950 | |
3.125% 04/30/17 | | | 11,745,000 | | | | 12,071,652 | |
3.125% 05/15/19 (a) | | | 2,940,000 | | | | 2,939,771 | |
3.250% 12/31/16 | | | 11,385,000 | | | | 11,832,396 | |
3.375% 11/15/19 (a) | | | 7,995,000 | | | | 8,082,449 | |
3.500% 02/15/18 | | | 6,700,000 | | | | 6,974,807 | |
3.625% 08/15/19 | | | 3,755,000 | | | | 3,881,731 | |
3.625% 02/15/20 | | | 3,790,000 | | | | 3,893,043 | |
3.625% 02/15/21 (a) | | | 4,005,000 | | | | 4,061,947 | |
3.875% 02/15/13 | | | 1,960,000 | | | | 2,076,375 | |
3.875% 05/15/18 (a) | | | 5,820,000 | | | | 6,188,295 | |
4.000% 02/15/15 | | | 6,690,000 | | | | 7,265,969 | |
4.500% 02/15/16 (a) | | | 12,520,000 | | | | 13,893,294 | |
4.875% 06/30/12 | | | 2,595,000 | | | | 2,738,535 | |
6.625% 02/15/27 | | | 2,230,000 | | | | 2,886,456 | |
8.000% 11/15/21 (a) | | | 2,160,000 | | | | 3,016,574 | |
| | | | | | | | |
U.S. Treasury Notes Total | | | | 331,120,972 | |
| | | | | | | | |
Total Government & Agency Obligations (cost of $415,920,636) | | | | 419,820,842 | |
| | | | | | | | |
| | | Share | | | Value ($) | |
| |
Securities Lending Collateral – 13.9% | | | | | |
State Street Navigator Securities Lending Prime Portfolio (7 day yield of 0.28%) (b) | | | 58,989,409 | | | | 58,989,409 | |
| | | | | | | | |
Total Securities Lending Collateral (cost of $58,989,409) | | | | 58,989,409 | |
See Accompanying Notes to Financial Statements.
8
Columbia U.S. Treasury Index Fund
March 31, 2011
Short-Term Obligation – 0.3%
| | | | | | | | |
| | | Par ($) | | | Value ($) | |
Repurchase agreement with
Fixed Income Clearing Corp., dated 03/31/11 due 04/01/11 at 0.040%, collateralized by a U.S. Treasury obligation maturing 11/15/39, market value $1,070,173 (repurchase proceeds $1,047,001) | | | 1,047,000 | | | | 1,047,000 | |
| | | | | | | | |
Total Short-Term Obligation
(cost of $1,047,000) | | | | | | | 1,047,000 | |
| | | | | | | | |
Total Investments – 113.4%
(cost of $475,957,045)(c) | | | | | | | 479,857,251 | |
| | | | | | | | |
Obligation to Return Collateral for Securities Loaned – (13.9)% | | | | (58,989,409 | ) |
| | | | | | | | |
Other Assets & Liabilities, Net – 0.5% | | | | 2,217,552 | |
| | | | | | | | |
Net Assets – 100.0% | | | | | | | 423,085,394 | |
Notes to Investment Portfolio:
| (a) | All or a portion of this security was on loan at March 31, 2011. The total market value of securities on loan at March 31, 2011 is $57,846,513. |
| (b) | Investment made with cash collateral received from securities lending activity. |
| (c) | Cost for federal income tax purposes is $477,897,829. |
Generally accepted accounting principles (GAAP) require disclosure regarding the inputs and valuation techniques used to measure fair value and any changes in valuation inputs or techniques. In addition, investments shall be disclosed by major category.
The Fund categorizes its fair value measurements according to a three-level hierarchy that maximizes the use of observable inputs and minimizes the use of unobservable inputs by prioritizing that the most observable input be used when available. Observable inputs are those that market participants would use in pricing an investment based on market data obtained from sources independent of the reporting entity. Unobservable inputs are those that reflect the Fund’s assumptions about the information market participants would use in pricing an investment. An investment’s level within the fair value hierarchy is based on the lowest level of any input that is deemed significant to the asset or liability’s fair value measurement. The input levels are not necessarily an indication of the risk or liquidity associated with investments at that level. For example, certain U.S. government securities are generally high quality and liquid, however, they are reflected as Level 2 because the inputs used to determine fair value may not always be quoted prices in an active market.
Fair value inputs are summarized in the three broad levels listed below:
| • | | Level 1 — Valuations based on quoted prices for investments in active markets that the Fund has the ability to access at the measurement date (including NAV for open-end mutual funds). Valuation adjustments are not applied to Level 1 investments. |
| • | | Level 2 — Valuations based on other significant observable inputs (including quoted prices for similar securities, interest rates, prepayment speeds, credit risks, etc.). |
| • | | Level 3 — Valuations based on significant unobservable inputs (including the Fund’s own assumptions and judgment in determining the fair value of investments). |
Inputs that are used in determining fair value of an investment may include price information, credit data, volatility statistics, and other factors. These inputs can be either observable or unobservable. The availability of observable inputs can vary between investments, and is affected by various factors such as the type of investment, and the volume and level of activity for that investment or similar investments in the marketplace. The inputs will be considered by the Investment Manager, along with any other relevant factors in the calculation of an investment’s fair value. The Fund uses prices and inputs that are current as of the measurement date, which may include periods of market dislocations. During these periods, the availability of prices and inputs may be reduced for many investments. This condition could cause an investment to be reclassified between the various levels within the hierarchy. Non-U.S. equity securities actively traded in foreign markets may be reflected in Level 2 despite the availability of closing prices, because the Fund evaluates and determines whether those closing prices reflect fair value at the close of the New York Stock Exchange (NYSE) or require adjustment, as described in Note 2 to the financial statements — Security Valuation.
Investments falling into the Level 3 category are primarily supported by quoted prices from brokers and dealers participating in the market for those investments. However, these may be classified as Level 3 investments due to lack of market transparency and corroboration to support these quoted prices. Additionally, valuation models may be used as the pricing source for any remaining investments classified as Level 3. These models rely on one or more significant unobservable inputs and/or significant assumptions by the Investment Manager. Inputs used in valuations may include, but are not limited to, financial statement analysis, capital account balances, discount rates and estimated cash flows, and comparable company data.
The following table summarizes the inputs used, as of March 31, 2011, in valuing the Fund’s assets:
| | | | | | | | | | | | | | | | |
Description | | Quoted Prices
in Active
Markets for
Identical
Assets
(Level 1) | | | Significant
Other
Observable
Inputs
(Level 2) | | | Significant
Unobservable
Inputs
(Level 3) | | | Total | |
Government & Agency Obligations | | | | | | | | | | | | | | | | |
U.S. Treasury Bonds | | $ | 88,699,870 | | | $ | — | | | $ | — | | | $ | 88,699,870 | |
U.S. Treasury Notes | | | 331,120,972 | | | | — | | | | — | | | | 331,120,972 | |
| | | | | | | | | | | | | | | | |
Total Government & Agency Obligations | | | 419,820,842 | | | | — | | | | — | | | | 419,820,842 | |
| | | | | | | | | | | | | | | | |
Total Securities Lending Collateral | | | 58,989,409 | | | | — | | | | — | | | | 58,989,409 | |
| | | | | | | | | | | | | | | | |
Total Short-Term Obligation | | | — | | | | 1,047,000 | | | | — | | | | 1,047,000 | |
| | | | | | | | | | | | | | | | |
Total Investments | | $ | 478,810,251 | | | $ | 1,047,000 | | | $ | — | | | $ | 479,857,251 | |
| | | | | | | | | | | | | | | | |
The Fund’s assets assigned to the Level 2 input category represent certain short-term obligations which are valued using amortized cost, an income approach which converts future cash flows to a present value based upon the discount or premium at purchase.
There were no significant transfers of financial assets between Levels 1 and 2 during the period.
See Accompanying Notes to Financial Statements.
9
Columbia U.S. Treasury Index Fund
March 31, 2011
At March 31, 2011, the Fund held Investments in the following:
| | | | |
Holdings by Revenue Sources (Unaudited) | | % of
Net Assets | |
U.S Treasury Notes | | | 78.2 | |
U.S Treasury Bonds | | | 21.0 | |
| | | | |
| | | 99.2 | |
Securities Lending Collateral | | | 13.9 | |
Short-Term Obligation | | | 0.3 | |
Obligation to Return Collateral for Securities Loaned | | | (13.9 | ) |
Other Assets & Liabilities, Net | | | 0.5 | |
| | | | |
| | | 100.0 | |
| | | | |
See Accompanying Notes to Financial Statements.
10
Statement of Assets and Liabilities – Columbia U.S. Treasury Index Fund
March 31, 2011
| | | | | | |
| | | | | ($) | |
| Assets | | Investments, at cost | | | 475,957,045 | |
| | | | | | |
| | Investments at value (including securities on loan of $57,846,513) | | | 479,857,251 | |
| | Cash | | | 87,374 | |
| | Receivable for: | | | | |
| | Investments sold | | | 9,195,712 | |
| | Fund shares sold | | | 175,974 | |
| | Interest | | | 2,780,396 | |
| | Securities lending | | | 1,551 | |
| | Expense reimbursement due from Investment Manager | | | 70,737 | |
| | Trustees’ deferred compensation plan | | | 30,057 | |
| | | | | | |
| | Total Assets | | | 492,199,052 | |
| | |
| Liabilities | | Collateral on securities loaned | | | 58,989,409 | |
| | Payable for: | | | | |
| | Investments purchased | | | 9,322,904 | |
| | Fund shares repurchased | | | 302,587 | |
| | Distributions | | | 300,283 | |
| | Investment advisory fee | | | 36,259 | |
| | Administration fee | | | 108,778 | |
| | Trustees’ fees | | | 1,108 | |
| | Distribution and service fees | | | 22,209 | |
| | Interest payable | | | 53 | |
| | Trustees’ deferred compensation plan | | | 30,057 | |
| | Other liabilities | | | 11 | |
| | | | | | |
| | Total Liabilities | | | 69,113,658 | |
| | |
| | | | | | |
| | Net Assets | | | 423,085,394 | |
| | | | | | |
| | |
| Net Assets Consist of | | Paid-in capital | | | 420,166,382 | |
| | Overdistributed net investment income | | | (764,567 | ) |
| | Accumulated net realized gain | | | (216,627 | ) |
| | Net unrealized appreciation (depreciation) on investments | | | 3,900,206 | |
| | |
| | | | | | |
| | Net Assets | | | 423,085,394 | |
See Accompanying Notes to Financial Statements.
11
Statement of Assets and Liabilities (continued) – Columbia U.S. Treasury Index Fund
March 31, 2011
| | | | | | |
| | | | | | |
| Class A | | Net assets | | $ | 41,738,744 | |
| | Shares outstanding | | | 3,784,346 | |
| | Net asset value per share | | $ | 11.03 | (a) |
| | Maximum sales charge | | | 4.75 | % |
| | Maximum offering price per share ($11.03/0.9525) | | $ | 11.58 | (b) |
| | |
| Class B | | Net assets | | $ | 4,052,791 | |
| | Shares outstanding | | | 367,453 | |
| | Net asset value and offering price per share | | $ | 11.03 | (a) |
| | |
| Class C | | Net assets | | $ | 13,141,954 | |
| | Shares outstanding | | | 1,191,545 | |
| | Net asset value and offering price per share | | $ | 11.03 | (a) |
| | |
| Class I (c) | | Net assets | | $ | 123,074,216 | |
| | Shares outstanding | | | 11,158,692 | |
| | Net asset value, offering and redemption price per share | | $ | 11.03 | |
| | |
| Class Z | | Net assets | | $ | 241,077,689 | |
| | Shares outstanding | | | 21,857,299 | |
| | Net asset value, offering and redemption price per share | | $ | 11.03 | |
| (a) | Redemption price per share is equal to net asset value less any applicable contingent deferred sales charge. |
| (b) | On sales of $50,000 or more the offering price is reduced. |
| (c) | Class I shares commenced operations on September 27, 2010. |
See Accompanying Notes to Financial Statements.
12
Statement of Operations – Columbia U.S. Treasury Index Fund
For the Year Ended March 31, 2011
| | | | | | |
| | | | | ($) | |
| Investment Income | | Interest | | | 9,346,297 | |
| | Securities lending | | | 78,964 | |
| | | | | | |
| | Total Investment Income | | | 9,425,261 | |
| | |
| Expenses | | Investment advisory fee | | | 382,965 | |
| | Administration fee | | | 1,148,894 | |
| | Distribution fee: | | | | |
| | Class B | | | 37,736 | |
| | Class C | | | 130,521 | |
| | Service fee: | | | | |
| | Class A | | | 113,887 | |
| | Class B | | | 12,579 | |
| | Class C | | | 43,506 | |
| | Trustees’ fees | | | 30,509 | |
| | Other expenses | | | 1,680 | |
| | | | | | |
| | Expenses before interest expense | | | 1,902,277 | |
| | Interest expense | | | 143 | |
| | | | | | |
| | Total Expenses | | | 1,902,420 | |
| | |
| | Fees waived or expenses reimbursed by investment advisor | | | (797,504 | ) |
| | Fees waived by distributor – Class C | | | (26,107 | ) |
| | | | | | |
| | Net Expenses | | | 1,078,809 | |
| | |
| | | | | | |
| | Net Investment Income | | | 8,346,452 | |
| | |
| Net Realized and Unrealized Gain (Loss) on Investments | | Net realized gain on investments | | | 10,420,614 | |
| | Net change in unrealized appreciation (depreciation) on investments | | | (3,380,514 | ) |
| | | | | | |
| | Net Gain | | | 7,040,100 | |
| | |
| | | | | | |
| | Net Increase Resulting from Operations | | | 15,386,552 | |
See Accompanying Notes to Financial Statements.
13
Statement of Changes in Net Assets – Columbia U.S. Treasury Index Fund
| | | | | | | | | | |
| | | | | Year Ended March 31, | |
| Increase (Decrease) in Net Assets | | | | 2011
($)(a)(b) | | | 2010 ($) | |
| Operations | | Net investment income | | | 8,346,452 | | | | 9,474,294 | |
| | Net realized gain on investments | | | 10,420,614 | | | | 3,023,496 | |
| | Net change in unrealized appreciation (depreciation) on investments | | | (3,380,514 | ) | | | (18,819,863 | ) |
| | | | | | | | | | |
| | Net increase (decrease) resulting from operations | | | 15,386,552 | | | | (6,322,073 | ) |
| | | |
| Distributions to Shareholders | | From net investment income: | | | | | | | | |
| | Class A | | | (1,091,659 | ) | | | (1,809,403 | ) |
| | Class B | | | (82,966 | ) | | | (172,057 | ) |
| | Class C | | | (312,898 | ) | | | (598,810 | ) |
| | Class I | | | (916,235 | ) | | | — | |
| | Class Z | | | (7,417,445 | ) | | | (9,187,511 | ) |
| | From net realized gains: | | | | | | | | |
| | Class A | | | (1,058,188 | ) | | | (8,095 | ) |
| | Class B | | | (115,280 | ) | | | (985 | ) |
| | Class C | | | (399,889 | ) | | | (3,463 | ) |
| | Class I | | | (55 | ) | | | — | |
| | Class Z | | | (6,977,073 | ) | | | (43,196 | ) |
| | | | | | | | | | |
| | Total distributions to shareholders | | | (18,371,688 | ) | | | (11,823,520 | ) |
| | | |
| | Net Capital Stock Transactions | | | 51,609,392 | | | | (23,765,633 | ) |
| | | | | | | | | | |
| | Total increase (decrease) in net assets | | | 48,624,256 | | | | (41,911,226 | ) |
| | | |
| Net Assets | | Beginning of period | | | 374,461,138 | | | | 416,372,364 | |
| | End of period | | | 423,085,394 | | | | 374,461,138 | |
| | Overdistributed net investment income at end of period | | | (764,567 | ) | | | (1,436,450 | ) |
| (a) | Class I shares commenced operations on September 27, 2010. |
| (b) | Class I shares reflect activity for the period September 27, 2010 through March 31, 2011. |
See Accompanying Notes to Financial Statements.
14
Statement of Changes in Net Assets (continued) – Columbia U.S. Treasury Index Fund
| | | | | | | | | | | | | | | | |
| | | Capital Stock Activity | |
| | | Year Ended
March 31, 2011 (a)(b) | | | Year Ended
March 31, 2010 | |
| | | Shares | | | Dollars ($) | | | Shares | | | Dollars ($) | |
Class A | | | | | | | | | | | | | | | | |
Subscriptions | | | 2,069,013 | | | | 23,492,987 | | | | 2,609,304 | | | | 29,342,018 | |
Distributions reinvested | | | 124,582 | | | | 1,412,024 | | | | 118,760 | | | | 1,337,514 | |
Redemptions | | | (2,647,070 | ) | | | (30,099,461 | ) | | | (5,286,491 | ) | | | (59,286,808 | ) |
| | | | | | | | | | | | | | | | |
Net decrease | | | (453,475 | ) | | | (5,194,450 | ) | | | (2,558,427 | ) | | | (28,607,276 | ) |
| | | | |
Class B | | | | | | | | | | | | | | | | |
Subscriptions | | | 37,879 | | | | 433,067 | | | | 79,716 | | | | 903,954 | |
Distributions reinvested | | | 11,772 | | | | 133,337 | | | | 13,425 | | | | 151,199 | |
Redemptions | | | (204,886 | ) | | | (2,315,670 | ) | | | (444,946 | ) | | | (5,010,830 | ) |
| | | | | | | | | | | | | | | | |
Net decrease | | | (155,235 | ) | | | (1,749,266 | ) | | | (351,805 | ) | | | (3,955,677 | ) |
| | | | |
Class C | | | | | | | | | | | | | | | | |
Subscriptions | | | 165,289 | | | | 1,884,048 | | | | 491,532 | | | | 5,532,053 | |
Distributions reinvested | | | 48,066 | | | | 544,129 | | | | 42,325 | | | | 476,675 | |
Redemptions | | | (782,293 | ) | | | (8,852,655 | ) | | | (1,560,413 | ) | | | (17,516,830 | ) |
| | | | | | | | | | | | | | | | |
Net decrease | | | (568,938 | ) | | | (6,424,478 | ) | | | (1,026,556 | ) | | | (11,508,102 | ) |
| | | | |
Class I | | | | | | | | | | | | | | | | |
Subscriptions | | | 11,553,981 | | | | 128,323,763 | | | | — | | | | — | |
Distributions reinvested | | | 82,788 | | | | 916,222 | | | | — | | | | — | |
Redemptions | | | (478,077 | ) | | | (5,278,910 | ) | | | — | | | | — | |
| | | | | | | | | | | | | | | | |
Net increase | | | 11,158,692 | | | | 123,961,075 | | | | — | | | | — | |
| | | | |
Class Z | | | | | | | | | | | | | | | | |
Subscriptions | | | 5,771,599 | | | | 65,893,139 | | | | 15,215,394 | | | | 170,416,067 | |
Distributions reinvested | | | 674,373 | | | | 7,642,007 | | | | 438,084 | | | | 4,930,440 | |
Redemptions | | | (11,757,882 | ) | | | (132,518,635 | ) | | | (13,798,165 | ) | | | (155,041,085 | ) |
| | | | | | | | | | | | | | | | |
Net increase (decrease) | | | (5,311,910 | ) | | | (58,983,489 | ) | | | 1,855,313 | | | | 20,305,422 | |
| (a) | Class I shares commenced operations on September 27, 2010. |
| (b) | Class I shares reflect activity for the period September 27, 2010 through March 31, 2011. |
See Accompanying Notes to Financial Statements.
15
Financial Highlights – Columbia U.S. Treasury Index Fund
Selected data for a share outstanding throughout each period is as follows:
| | | | | | | | | | | | | | | | | | | | |
| | | Year Ended March 31, | |
| Class A Shares | | 2011 | | | 2010 | | | 2009 | | | 2008 | | | 2007 | |
Net Asset Value, Beginning of Period | | $ | 11.12 | | | $ | 11.64 | | | $ | 11.27 | | | $ | 10.53 | | | $ | 10.45 | |
| | | | | |
Income from Investment Operations: | | | | | | | | | | | | | | | | | | | | |
Net investment income (a) | | | 0.23 | | | | 0.27 | | | | 0.33 | | | | 0.43 | | | | 0.42 | |
Net realized and unrealized gain (loss) on investments | | | 0.22 | | | | (0.45 | ) | | | 0.45 | | | | 0.78 | | | | 0.12 | |
| | | | | | | | | | | | | | | | | | | | |
Total from investment operations | | | 0.45 | | | | (0.18 | ) | | | 0.78 | | | | 1.21 | | | | 0.54 | |
| | | | | |
Less Distributions to Shareholders: | | | | | | | | | | | | | | | | | | | | |
From net investment income | | | (0.27 | ) | | | (0.34 | ) | | | (0.41 | ) | | | (0.47 | ) | | | (0.46 | ) |
From net realized gains | | | (0.27 | ) | | | — | (b) | | | — | | | | — | | | | — | |
| | | | | | | | | | | | | | | | | | | | |
Total distributions to shareholders | | | (0.54 | ) | | | (0.34 | ) | | | (0.41 | ) | | | (0.47 | ) | | | (0.46 | ) |
| | | | | |
Net Asset Value, End of Period | | $ | 11.03 | | | $ | 11.12 | | | $ | 11.64 | | | $ | 11.27 | | | $ | 10.53 | |
Total return (c)(d) | | | 4.04 | % | | | (1.53 | )% | | | 7.13 | % | | | 11.77 | %(e) | | | 5.30 | % |
| | | | | |
Ratios to Average Net Assets/Supplemental Data: | | | | | | | | | | | | | | | | | | | | |
Net expenses before interest expense | | | 0.45 | % | | | 0.48 | % | | | 0.55 | %(f) | | | 0.57 | %(f) | | | 0.60 | % |
Interest expense (g) | | | — | % | | | — | % | | | — | % | | | — | % | | | — | % |
Net expenses | | | 0.45 | % | | | 0.48 | % | | | 0.55 | %(f) | | | 0.57 | %(f) | | | 0.60 | % |
Waiver/Reimbursement | | | 0.21 | % | | | 0.18 | % | | | 0.11 | % | | | 0.09 | % | | | 0.06 | % |
Net investment income | | | 2.04 | % | | | 2.44 | % | | | 2.91 | %(f) | | | 3.94 | %(f) | | | 4.05 | % |
Portfolio turnover rate | | | 142 | % | | | 118 | % | | | 126 | % | | | 47 | % | | | 39 | % |
Net assets, end of period (000s) | | $ | 41,739 | | | $ | 47,105 | | | $ | 79,114 | | | $ | 17,817 | | | $ | 5,235 | |
| (a) | Per share data was calculated using the average shares outstanding during the period. |
| (b) | Rounds to less than $0.01 per share. |
| (c) | Total return at net asset value assuming all distributions reinvested and no initial sales charge or contingent deferred sales charge. |
| (d) | Had the Investment Manager and/or any of its affiliates not waived fees or reimbursed a portion of expenses, total return would have been reduced. |
| (e) | Total return includes a voluntary reimbursement by the Investment Manager for a realized investment loss due to a trading error. This reimbursement increased total return and net asset value per share by less than 0.01% and less than $0.01, respectively. |
| (f) | The benefits derived from expense reductions had an impact of less than 0.01%. |
| (g) | Rounds to less than 0.01%. |
See Accompanying Notes to Financial Statements.
16
Financial Highlights – Columbia U.S. Treasury Index Fund
Selected data for a share outstanding throughout each period is as follows:
| | | | | | | | | | | | | | | | | | | | |
| | | Year Ended March 31, | |
| Class B Shares | | 2011 | | | 2010 | | | 2009 | | | 2008 | | | 2007 | |
Net Asset Value, Beginning of Period | | $ | 11.12 | | | $ | 11.64 | | | $ | 11.27 | | | $ | 10.53 | | | $ | 10.45 | |
| | | | | |
Income from Investment Operations: | | | | | | | | | | | | | | | | | | | | |
Net investment income (a) | | | 0.15 | | | | 0.19 | | | | 0.25 | | | | 0.35 | | | | 0.35 | |
Net realized and unrealized gain (loss) on investments | | | 0.22 | | | | (0.45 | ) | | | 0.45 | | | | 0.78 | | | | 0.11 | |
| | | | | | | | | | | | | | | | | | | | |
Total from investment operations | | | 0.37 | | | | (0.26 | ) | | | 0.70 | | | | 1.13 | | | | 0.46 | |
| | | | | |
Less Distributions to Shareholders: | | | | | | | | | | | | | | | | | | | | |
From net investment income | | | (0.19 | ) | | | (0.26 | ) | | | (0.33 | ) | | | (0.39 | ) | | | (0.38 | ) |
From net realized gains | | | (0.27 | ) | | | — | (b) | | | — | | | | — | | | | — | |
| | | | | | | | | | | | | | | | | | | | |
Total distributions to shareholders | | | (0.46 | ) | | | (0.26 | ) | | | (0.33 | ) | | | (0.39 | ) | | | (0.38 | ) |
| | | | | |
Net Asset Value, End of Period | | $ | 11.03 | | | $ | 11.12 | | | $ | 11.64 | | | $ | 11.27 | | | $ | 10.53 | |
Total return (c)(d) | | | 3.27 | % | | | (2.26 | )% | | | 6.32 | % | | | 10.95 | %(e) | | | 4.52 | % |
| | | | | |
Ratios to Average Net Assets/Supplemental Data: | | | | | | | | | | | | | | | | | | | | |
Net expenses before interest expense | | | 1.20 | % | | | 1.23 | % | | | 1.30 | %(f) | | | 1.32 | %(f) | | | 1.35 | % |
Interest expense (g) | | | — | % | | | — | % | | | — | % | | | — | % | | | — | % |
Net expenses | | | 1.20 | % | | | 1.23 | % | | | 1.30 | %(f) | | | 1.32 | %(f) | | | 1.35 | % |
Waiver/Reimbursement | | | 0.21 | % | | | 0.18 | % | | | 0.11 | % | | | 0.09 | % | | | 0.06 | % |
Net investment income | | | 1.29 | % | | | 1.69 | % | | | 2.19 | %(f) | | | 3.25 | %(f) | | | 3.31 | % |
Portfolio turnover rate | | | 142 | % | | | 118 | % | | | 126 | % | | | 47 | % | | | 39 | % |
Net assets, end of period (000s) | | $ | 4,053 | | | $ | 5,810 | | | $ | 10,179 | | | $ | 3,610 | | | $ | 1,488 | |
| (a) | Per share data was calculated using the average shares outstanding during the period. |
| (b) | Rounds to less than $0.01 per share. |
| (c) | Total return at net asset value assuming all distributions reinvested and no contingent deferred sales charge. |
| (d) | Had the Investment Manager and/or any of its affiliates not waived fees or reimbursed a portion of expenses, total return would have been reduced. |
| (e) | Total return includes a voluntary reimbursement by the Investment Manager for a realized investment loss due to a trading error. This reimbursement increased total return and net asset value per share by less than 0.01% and less than $0.01, respectively. |
| (f) | The benefits derived from expense reductions had an impact of less than 0.01%. |
| (g) | Rounds to less than 0.01%. |
See Accompanying Notes to Financial Statements.
17
Financial Highlights – Columbia U.S. Treasury Index Fund
Selected data for a share outstanding throughout each period is as follows:
| | | | | | | | | | | | | | | | | | | | |
| | | Year Ended March 31, | |
| Class C Shares | | 2011 | | | 2010 | | | 2009 | | | 2008 | | | 2007 | |
Net Asset Value, Beginning of Period | | $ | 11.12 | | | $ | 11.64 | | | $ | 11.27 | | | $ | 10.53 | | | $ | 10.45 | |
| | | | | |
Income from Investment Operations: | | | | | | | | | | | | | | | | | | | | |
Net investment income (a) | | | 0.16 | | | | 0.21 | | | | 0.26 | | | | 0.36 | | | | 0.36 | |
Net realized and unrealized gain (loss) on investments | | | 0.23 | | | | (0.46 | ) | | | 0.45 | | | | 0.78 | | | | 0.12 | |
| | | | | | | | | | | | | | | | | | | | |
Total from investment operations | | | 0.39 | | | | (0.25 | ) | | | 0.71 | | | | 1.14 | | | | 0.48 | |
| | | | | |
Less Distributions to Shareholders: | | | | | | | | | | | | | | | | | | | | |
From net investment income | | | (0.21 | ) | | | (0.27 | ) | | | (0.34 | ) | | | (0.40 | ) | | | (0.40 | ) |
From net realized gains | | | (0.27 | ) | | | — | (b) | | | — | | | | — | | | | — | |
| | | | | | | | | | | | | | | | | | | | |
Total distributions to shareholders | | | (0.48 | ) | | | (0.27 | ) | | | (0.34 | ) | | | (0.40 | ) | | | (0.40 | ) |
| | | | | |
Net Asset Value, End of Period | | $ | 11.03 | | | $ | 11.12 | | | $ | 11.64 | | | $ | 11.27 | | | $ | 10.53 | |
Total return (c)(d) | | | 3.42 | % | | | (2.12 | )% | | | 6.48 | % | | | 11.09 | %(e) | | | 4.67 | % |
| | | | | |
Ratios to Average Net Assets/Supplemental Data: | | | | | | | | | | | | | | | | | | | | |
Net expenses before interest expense | | | 1.05 | % | | | 1.08 | % | | | 1.15 | %(f) | | | 1.17 | %(f) | | | 1.20 | % |
Interest expense (g) | | | — | % | | | — | % | | | — | % | | | — | % | | | — | % |
Net expenses | | | 1.05 | % | | | 1.08 | % | | | 1.15 | %(f) | | | 1.17 | %(f) | | | 1.20 | % |
Waiver/Reimbursement | | | 0.36 | % | | | 0.33 | % | | | 0.26 | % | | | 0.24 | % | | | 0.21 | % |
Net investment income | | | 1.44 | % | | | 1.83 | % | | | 2.28 | %(f) | | | 3.30 | %(f) | | | 3.44 | % |
Portfolio turnover rate | | | 142 | % | | | 118 | % | | | 126 | % | | | 47 | % | | | 39 | % |
Net assets, end of period (000s) | | $ | 13,142 | | | $ | 19,568 | | | $ | 32,440 | | | $ | 6,702 | | | $ | 973 | |
| (a) | Per share data was calculated using the average shares outstanding during the period. |
| (b) | Rounds to less than $0.01 per share. |
| (c) | Total return at net asset value assuming all distributions reinvested and no contingent deferred sales charge. |
| (d) | Had the Investment Manager and/or any of its affiliates not waived fees or reimbursed a portion of expenses, total return would have been reduced. |
| (e) | Total return includes a voluntary reimbursement by the Investment Manager for a realized investment loss due to a trading error. This reimbursement increased total return and net asset value per share by less than 0.01% and less than $0.01, respectively. |
| (f) | The benefits derived from expense reductions had an impact of less than 0.01%. |
| (g) | Rounds to less than 0.01%. |
See Accompanying Notes to Financial Statements.
18
Financial Highlights – Columbia U.S. Treasury Index Fund
Selected data for a share outstanding throughout the period is as follows:
| | | | |
| Class I Shares | | Period Ended
March 31,
2011 (a) | |
Net Asset Value, Beginning of Period | | $ | 11.76 | |
| |
Income from Investment Operations: | | | | |
Net investment income (b) | | | 0.11 | |
Net realized and unrealized loss on investments | | | (0.43 | ) |
| | | | |
Total from investment operations | | | (0.32 | ) |
| |
Less Distributions to Shareholders: | | | | |
From net investment income | | | (0.15 | ) |
From net realized gains | | | (0.26 | ) |
| | | | |
Total distributions to shareholders | | | (0.41 | ) |
| |
Net Asset Value, End of Period | | $ | 11.03 | |
Total return (c)(d)(e) | | | (2.78 | )% |
| |
Ratios to Average Net Assets/Supplemental Data: | | | | |
Net expenses before interest expense (f) | | | 0.20 | % |
Interest expense (f)(g) | | | — | % |
Net expenses (f) | | | 0.20 | % |
Waiver/Reimbursement (f) | | | 0.21 | % |
Net investment income (f) | | | 1.96 | % |
Portfolio turnover rate (e) | | | 142 | % |
Net assets, end of period (000s) | | $ | 123,074 | |
| (a) | Class I shares commenced operations on September 27, 2010. Per share data and total return reflect activity from that date. |
| (b) | Per share data was calculated using the average shares outstanding during the period. |
| (c) | Total return at net asset value assuming all distributions reinvested. |
| (d) | Had the Investment Manager not waived fees or reimbursed a portion of expenses, total return would have been reduced. |
| (g) | Rounds to less than 0.01%. |
See Accompanying Notes to Financial Statements.
19
Financial Highlights – Columbia U.S. Treasury Index Fund
Selected data for a share outstanding throughout each period is as follows:
| | | | | | | | | | | | | | | | | | | | |
| | | Year Ended March 31, | |
| Class Z Shares | | 2011 | | | 2010 | | | 2009 | | | 2008 | | | 2007 | |
Net Asset Value, Beginning of Period | | $ | 11.11 | | | $ | 11.64 | | | $ | 11.27 | | | $ | 10.53 | | | $ | 10.45 | |
| | | | | |
Income from Investment Operations: | | | | | | | | | | | | | | | | | | | | |
Net investment income (a) | | | 0.26 | | | | 0.30 | | | | 0.37 | | | | 0.46 | | | | 0.45 | |
Net realized and unrealized gain (loss) on investments | | | 0.23 | | | | (0.46 | ) | | | 0.44 | | | | 0.77 | | | | 0.12 | |
| | | | | | | | | | | | | | | | | | | | |
Total from investment operations | | | 0.49 | | | | (0.16 | ) | | | 0.81 | | | | 1.23 | | | | 0.57 | |
| | | | | |
Less Distributions to Shareholders: | | | | | | | | | | | | | | | | | | | | |
From net investment income | | | (0.30 | ) | | | (0.37 | ) | | | (0.44 | ) | | | (0.49 | ) | | | (0.49 | ) |
From net realized gains | | | (0.27 | ) | | | — | (b) | | | — | | | | — | | | | — | |
| | | | | | | | | | | | | | | | | | | | |
Total distributions to shareholders | | | (0.57 | ) | | | (0.37 | ) | | | (0.44 | ) | | | (0.49 | ) | | | (0.49 | ) |
| | | | | |
Net Asset Value, End of Period | | $ | 11.03 | | | $ | 11.11 | | | $ | 11.64 | | | $ | 11.27 | | | $ | 10.53 | |
Total return (c)(d) | | | 4.40 | % | | | (1.38 | )% | | | 7.40 | % | | | 12.04 | %(e) | | | 5.53 | % |
| | | | | |
Ratios to Average Net Assets/Supplemental Data: | | | | | | | | | | | | | | | | | | | | |
Net expenses before interest expense | | | 0.20 | % | | | 0.23 | % | | | 0.30 | %(f) | | | 0.33 | %(f) | | | 0.38 | % |
Interest expense (g) | | | — | % | | | — | % | | | — | % | | | — | % | | | — | % |
Net expenses | | | 0.20 | % | | | 0.23 | % | | | 0.30 | %(f) | | | 0.33 | %(f) | | | 0.38 | % |
Waiver/Reimbursement | | | 0.21 | % | | | 0.18 | % | | | 0.11 | % | | | 0.09 | % | | | 0.07 | % |
Net investment income | | | 2.29 | % | | | 2.64 | % | | | 3.31 | %(f) | | | 4.24 | %(f) | | | 4.28 | % |
Portfolio turnover rate | | | 142 | % | | | 118 | % | | | 126 | % | | | 47 | % | | | 39 | % |
Net assets, end of period (000s) | | $ | 241,078 | | | $ | 301,978 | | | $ | 294,640 | | | $ | 284,271 | | | $ | 138,132 | |
| (a) | Per share data was calculated using the average shares outstanding during the period. |
| (b) | Rounds to less than $0.01 per share. |
| (c) | Total return at net asset value assuming all distributions reinvested. |
| (d) | Had the Investment Manager and/or any of its affiliates not waived fees or reimbursed a portion of expenses, total return would have been reduced. |
| (e) | Total return includes a voluntary reimbursement by the Investment Manager for a realized investment loss due to a trading error. This reimbursement increased total return and net asset value per share by less than 0.01% and less than $0.01, respectively. |
| (f) | The benefits derived from expense reductions had an impact of less than 0.01%. |
| (g) | Rounds to less than 0.01%. |
See Accompanying Notes to Financial Statements.
20
Notes to Financial Statements – Columbia U.S. Treasury Index Fund
March 31, 2011
Note 1. Organization
Columbia U.S. Treasury Index Fund (the Fund), a series of Columbia Funds Series Trust I (the Trust), is a diversified fund. The Trust is registered under the Investment Company Act of 1940, as amended (the 1940 Act), as an open-end management investment company organized as a Massachusetts business trust.
After the close of business on April 30, 2010, Ameriprise Financial, Inc. (Ameriprise Financial) acquired a portion of the asset management business of Columbia Management Group, LLC (the Transaction), including the business of managing the Fund. In connection with the closing of the Transaction (the Closing), RiverSource Investments, LLC, a wholly owned subsidiary of Ameriprise Financial, became the investment manager of the Fund and changed its name to Columbia Management Investment Advisers, LLC (the Investment Manager).
Investment Objective
The Fund seeks total return that corresponds to the total return of the Citigroup Bond U.S. Treasury Index, before fees and expenses.
Fund Shares
The Trust has unlimited authorized shares of beneficial interest. The Fund offers Class A, Class B, Class C, Class I and Class Z shares. On December 8, 2010, the Investment Manager exchanged Class Z shares of the Fund valued at $22,319,748 for Class I shares of the Fund. All share classes have identical voting, dividend and liquidation rights. Each share class has its own expense structure and sales charges, as applicable.
Class A shares are subject to a maximum front-end sales charge of 4.75% based on the initial investment amount. Class A shares purchased without an initial sales charge in accounts aggregating $1 million to $50 million at the time of purchase are subject to a 1.00% contingent deferred sales charge (CDSC) if the shares are sold within 18 months of purchase, charged as follows: 1.00% CDSC if redeemed within 12 months of purchase, and 0.50% CDSC if redeemed more than 12, but less than 18 months after purchase.
The Fund no longer accepts investments by new or existing investors in the Fund’s Class B shares, except in connection with the reinvestment of any dividend and/or capital gain distributions in Class B shares of the Fund and exchanges by existing Class B shareholders of other funds within the Columbia Family of Funds. Class B shares are subject to a maximum CDSC of 5.00% based upon the holding period after purchase. Class B shares will generally convert to Class A shares eight years after purchase.
Class C shares are subject to a 1.00% CDSC on shares redeemed within one year of purchase.
Class I shares are not subject to sales charges and are available only to the Columbia Family of Funds. Class I shares commenced operations on September 27, 2010.
Class Z shares are not subject to sales charges and are available only to certain investors, as described in the Fund’s prospectus.
Note 2. Summary of Significant Accounting Policies
The preparation of financial statements in accordance with U.S. generally accepted accounting principles (GAAP) requires management to make certain estimates and assumptions that affect the reported amounts of assets and liabilities, the disclosure of contingent assets and liabilities at the date of the financial statements and the reported amounts of revenue and expenses during the reporting period. Actual results could differ from those estimates.
The following is a summary of significant accounting policies consistently followed by the Fund in the preparation of its financial statements.
Security Valuation
Debt securities generally are valued by pricing services approved by the Trust’s Board of Trustees, based upon market transactions for normal, institutional-size trading units of similar securities. The services may use various pricing techniques which take into account appropriate factors such as yield, quality, coupon rate, maturity, type of issue, trading characteristics and other data, as well as broker quotes. Debt securities for which quotations are readily available may also be valued based upon an over-the-counter or exchange bid quotation.
Short-term investments maturing in 60 days or less are valued at amortized cost, which approximates market value.
Investments for which market quotations are not readily available, or that have quotations which the Investment Manager believes are not reliable, are valued at fair value as determined in good faith under consistently applied procedures established by and under the general supervision of the Board of Trustees. If a security is valued at fair value, such value is likely to be different from the last quoted market price for the security. The determination of fair value often requires significant judgment. To determine fair value, management may use assumptions including but not limited to future cash flows and
estimated risk premiums. Multiple inputs from various sources may be used to determine value.
21
Columbia U.S. Treasury Index Fund
March 31, 2011
Repurchase Agreements
The Fund may engage in repurchase agreement transactions with institutions that the Investment Manager has determined are creditworthy. The Fund, through the custodian, receives delivery of the underlying securities collateralizing a repurchase agreement. The Investment Manager is responsible for determining that the collateral is at least equal, at all times, to the value of the repurchase obligation including interest. A repurchase agreement transaction involves certain risks in the event of default or insolvency of the counterparty. These risks include possible delays in or restrictions on the Fund’s ability to dispose of the underlying securities and a possible decline in the value of the underlying securities during the period while the Fund seeks to assert its rights.
Security Transactions
Security transactions are accounted for on the trade date. Cost is determined and gains (losses) are based upon the specific identification method for both financial statement and federal income tax purposes.
Income Recognition
Interest income is recorded on the accrual basis. Market premium and discount are amortized and accreted, respectively, on all debt securities, unless otherwise noted. Original issue discount is accreted to interest income over the life of the security with a corresponding increase in the cost basis, if any.
Corporate actions and dividend income are recorded on the ex-date.
Expenses
General expenses of the Trust are allocated to the Fund and other series of the Trust based upon relative net assets or other expense allocation methodologies determined by the nature of the expense. Expenses directly attributable to a specific class of shares are charged to that share class. Expenses directly attributable to the Fund are charged to the Fund.
Determination of Class Net Asset Value
All income, expenses (other than class-specific expenses which are charged directly to a share class, as shown in the Statement of Operations) and realized and unrealized gains (losses) are allocated to each class of the Fund on a daily basis for purposes of determining the net asset value of each class. Income and expenses are allocated to each class based on the settled shares method, while realized and unrealized gains (losses) are allocated based on the relative net assets of each class.
Federal Income Tax Status
The Fund intends to qualify each year as a regulated investment company under Subchapter M of the Internal Revenue Code, as amended, and will distribute substantially all of its taxable income, if any, for its tax year, and as such will not be subject to federal income taxes. In addition, the Fund intends to distribute in each calendar year substantially all of its net investment income, capital gains and certain other amounts, if any, such that the Fund should not be subject to federal excise tax. Therefore, no federal income or excise tax provision is recorded.
Distributions to Shareholders
Distributions from net investment income are declared daily and paid monthly. Net realized capital gains, if any, are distributed at least annually. Income distributions and capital gain distributions are determined in accordance with federal income tax regulations which may differ from GAAP.
Indemnifications
Under the Trust’s organizational documents and, in some cases, by contract, its officers and directors are indemnified against certain liabilities arising out of the performance of their duties to the Fund. In addition, certain of the Fund’s contracts with its service providers contain general indemnification clauses. The Fund’s maximum exposure under these arrangements is unknown since the amount of any future claims that may be made against the Fund cannot be determined and the Fund has no historical basis for predicting the likelihood of any such claims.
Note 3. Fees and Compensation Paid to Affiliates
Investment Management Fee
Under an Investment Management Services Agreement (IMSA), the Investment Manager determines which securities will be purchased, held or sold. The management fee is based on the annual rate of 0.10% of the Fund’s average daily net assets.
Prior to the Closing, Columbia Management Advisors, LLC (Columbia), an indirect, wholly owned subsidiary of Bank of America Corporation (BOA), provided investment management services to the Fund under the same fee structure.
Administration Fee
Effective upon the Closing, the Investment Manager provides administration and accounting services to the Fund under an
22
Columbia U.S. Treasury Index Fund
March 31, 2011
Administrative Services Agreement. The Investment Manager, from the administration fee it receives from the Fund, pays all expenses of the Fund, except the fees and expenses of the Trustees who are not interested persons, service and distribution fees, brokerage fees and commissions, interest expense and extraordinary expenses. The Fund pays an annual administration fee equal to 0.30% of the Fund’s average daily net assets. Prior to the Closing, Columbia provided administrative services to the Fund at the same fee rates.
Underwriting Discounts, Service and Distribution Fees
In connection with the Closing, RiverSource Fund Distributors, Inc., an indirect wholly owned subsidiary of Ameriprise Financial, provides distribution and shareholder services to the Fund and changed its name to Columbia Management Investment Distributors, Inc. (the Distributor). Pursuant to Rule 12b-1 under the 1940 Act, the Board of Trustees has approved, and the Fund has adopted, distribution and shareholder service plans (the Plans) which set the distribution and service fees for the Fund. These fees are calculated daily and are intended to compensate the Distributor and/or eligible selling and/or servicing agents for selling shares of the Fund and providing services to investors.
The Plans require the payment of a monthly service fee to the Distributor at the maximum annual rate of 0.25% of the average daily net assets attributable to Class A, Class B and Class C shares of the Fund. The Plans also require the payment of a monthly distribution fee to the Distributor at the maximum annual rate of 0.75% of the average daily net assets attributable to Class B and Class C shares only.
The Distributor has voluntarily agreed to waive a portion of the distribution fee for Class C shares so that the combined distribution and service fees do not exceed 0.85% annually of the average daily net assets attributable to Class C shares. This arrangement may be modified or terminated by the Distributor at any time.
Prior to the Closing, Columbia Management Distributors, Inc., an affiliate of Columbia and an indirect, wholly owned subsidiary of BOA, was the principal underwriter of the Fund’s shares. There were no changes to the underwriting discount structure of the Fund, the service or distribution fee rates paid by the Fund, or the distribution and service fee waiver for the Class C shares as a result of the Transaction.
Sales Charges
Sales charges, including front-end and CDSC’s, received by the Distributor for distributing Fund shares were $3,598 for Class A, $8,221 for Class B and $3,262 for Class C shares for the year ended March 31, 2011.
Minimum Account Balance Fee
An annual minimum account balance fee of up to $20 may apply to certain accounts with a value below the Fund’s initial minimum investment requirements to reduce the impact of small accounts on transfer agent fees. These minimum account balance fees are recorded as a reduction of total expenses on the Statement of Operations. For the year ended March 31, 2011, no minimum account balance fees were charged by the Fund.
Fee Waivers and Expense Reimbursements
The Investment Manager has voluntarily agreed to bear a portion of the Fund’s expenses so that the Fund’s ordinary operating expenses (excluding brokerage commissions, interest, taxes and extraordinary expenses, but including custodian charges relating to overdrafts, if any), after giving effect to any balance credits from the Fund’s custodian, do not exceed the annual rates of 0.45%, 1.20%, 1.20%, 0.20% and 0.20% of the Fund’s average daily net assets attributable to Class A, Class B, Class C, Class I and Class Z shares, respectively. The Investment Manager, in its discretion, may revise or discontinue this arrangement at any time.
Prior to May 1, 2010, Columbia voluntarily agreed to reimburse a portion of the Fund’s expenses so that the Fund’s ordinary operating expenses (excluding any distribution and service fees, brokerage commissions, interest, taxes and extraordinary expenses, but including custodian charges relating to overdrafts, if any), after giving effect to any balance credits from the Fund’s custodian, did not exceed 0.20% of the Fund’s average daily net assets on an annualized basis.
Fees Paid to Officers and Trustees
In connection with the Closing, all officers of the Fund are employees of the Investment Manager or its affiliates and, with the exception of the Fund’s Chief Compliance Officer, receive no compensation from the Fund. The Board of Trustees has appointed a Chief Compliance Officer to the Fund in accordance with federal securities regulations. Prior to the Closing, all officers of the Funds were employees of Columbia or its affiliates under the same fee structure.
23
Columbia U.S. Treasury Index Fund
March 31, 2011
Trustees are compensated for their services to the Fund, as set forth on the Statement of Operations. The Trust’s eligible Trustees may participate in a deferred compensation plan which may be terminated at any time. Obligations of the plan will be paid solely out of the Fund’s assets.
Note 4. Portfolio Information
The cost of purchases and proceeds from sales of securities, excluding short-term obligations, aggregated $585,037,114 and $542,842,662, respectively, for the year ended March 31, 2011, all of which were U.S. Government securities.
Note 5. Lending of Portfolio Securities
The Fund may lend its securities to certain approved brokers, dealers and other financial institutions. Each loan is collateralized by cash, in an amount at least equal to the market value of the securities loaned plus accrued income from the investment of collateral. The market value of the loaned securities is determined at the close of business of the Fund and any additional required collateral is delivered to the Fund on the next business day. The collateral received is invested and the income generated by the investment of the collateral, net of any fees remitted to State Street as the lending agent and borrower rebates, is paid to the Fund. Generally, in the event of borrower default, the Fund has the right to use the collateral to offset any losses incurred. In the event the Fund is delayed or prevented from exercising its right to dispose of the collateral, there may be a potential loss to the Fund. The Fund bears the risk of loss with respect to the investment of collateral.
At March 31, 2011, the market value of securities on loan and collateral held was $57,846,513 and $58,989,409, respectively, for the Fund.
Note 6. Shareholder Concentration
As of March 31, 2011, one shareholder account owned 17.8% of the outstanding shares of the Fund. Purchase and redemption activity of this account may have a significant effect on the operations of the Fund.
Note 7. Line of Credit
Prior to March 28, 2011, the Fund and other affiliated funds participated in a $280,000,000 committed, unsecured revolving line of credit provided by State Street. Effective March 28, 2011, the commitment was reduced to $225,000,000. The maximum amount that may be borrowed by any fund is limited to the lesser of $200,000,000 and the Fund’s borrowing limit set forth in the Fund’s registration statement. Borrowings are available for short-term liquidity or temporary or emergency purposes.
Effective October 14, 2010, interest is charged to each participating fund based on the fund’s borrowings at a rate per annum equal to the greater of the Federal Funds Rate plus 1.25% or the overnight LIBOR Rate plus 1.25%. In addition, a commitment fee of 0.125% per annum is accrued and apportioned among the participating funds pro rata based on their relative net assets.
Prior to October 14, 2010, interest was charged to each participating fund at the same rates. In addition, a commitment fee of 0.15% per annum was accrued and apportioned among the participating funds pro rata based on their relative net assets.
For the year ended March 31, 2011, the average daily loan balance outstanding on days where borrowing existed was $1,750,000 at a weighted average interest rate of 1.24%.
Note 8. Federal Tax Information
The timing and character of income and capital gain distributions are determined in accordance with income tax regulations, which may differ from GAAP. Reclassifications are made to the Fund’s capital accounts for permanent tax differences to reflect income and gains available for distribution (or available capital loss carryforwards) under income tax regulations.
For the year ended March 31, 2011, permanent book and tax basis differences resulting primarily from differing treatments for discount accretion/premium amortization on debt securities and market discount reclasses were identified and reclassified among the components of the Fund’s net assets as follows:
| | | | |
| | | | | |
Overdistributed
Net Investment
Income | | Accumulated
Net Realized
Gain | | Paid-In
Capital |
| $2,146,634 | | $(2,146,634) | | $— |
Net investment income and net realized gains (losses), as disclosed on the Statement of Operations, and net assets were not affected by this reclassification.
The tax character of distributions paid during the years ended March 31, 2011 and March 31, 2010 was as follows:
| | | | | | | | |
| | | March 31,
2011 | | | March 31,
2010 | |
| Distributions paid from: | | | | |
Ordinary Income* | | $ | 12,349,475 | | | $ | 11,767,781 | |
Long-Term Capital Gains | | | 6,022,213 | | | | 55,739 | |
| * | For tax purposes short-term capital gain distributions, if any, are considered ordinary income distributions. |
24
Columbia U.S. Treasury Index Fund
March 31, 2011
As of March 31, 2011, the components of distributable earnings on a tax basis were as follows:
| | | | |
| | | | | |
Undistributed
Ordinary
Income | | Undistributed
Long-Term
Capital Gains | | Net
Unrealized
Appreciation* |
| $468,290 | | $823,028 | | $1,959,422 |
| * | The differences between book-basis and tax-basis net unrealized depreciation are primarily due to deferral of losses from wash sales. |
Unrealized appreciation and depreciation at March 31, 2011, based on cost of investments for federal income tax purposes were:
| | |
| | | |
Unrealized appreciation | | $5,069,064 |
| Unrealized depreciation | | (3,109,642) |
| | |
Net unrealized appreciation | | $1,959,422 |
Management of the Fund has concluded that there are no significant uncertain tax positions that would require recognition in the financial statements. However, management’s conclusion may be subject to review and adjustment at a later date based on factors including, but not limited to, new tax laws, regulations, and administrative interpretations (including relevant court decisions). The Fund’s federal tax returns for the prior three fiscal years remain subject to examination by the Internal Revenue Service.
Note 9. Subsequent Events
Management has evaluated the events and transactions that have occurred through the date the financial statements were issued. Other than as noted below, there were no items requiring adjustment of the financial statements or additional disclosure.
Effective May 16, 2011, the line of credit commitment with State Street was reduced to $150,000,000, and the maximum amount that may be borrowed by any fund was limited to the lesser of $120,000,000 and the Fund’s borrowing limit set forth in the Fund’s registration statement.
Note 10. Information Regarding Pending and Settled Legal Proceedings
In June 2004, an action captioned John E. Gallus et al. v. American Express Financial Corp. and American Express Financial Advisors Inc. was filed in the United States District Court for the District of Arizona. The plaintiffs allege that they are investors in several American Express Company (now known as RiverSource) mutual funds and they purport to bring the action derivatively on behalf of those funds under the Investment Company Act of 1940. The plaintiffs allege that fees allegedly paid to the defendants by the funds for investment advisory and administrative services are excessive. The plaintiffs seek remedies including restitution and rescission of investment advisory and distribution agreements. The plaintiffs voluntarily agreed to transfer this case to the United States District Court for the District of Minnesota (the District Court). In response to defendants’ motion to dismiss the complaint, the District Court dismissed one of plaintiffs’ four claims and granted plaintiffs limited discovery. Defendants moved for summary judgment in April 2007. Summary judgment was granted in the defendants’ favor on July 9, 2007. The plaintiffs filed a notice of appeal with the Eighth Circuit Court of Appeals (the Eighth Circuit) on August 8, 2007. On April 8, 2009, the Eighth Circuit reversed summary judgment and remanded to the District Court for further proceedings. On August 6, 2009, defendants filed a writ of certiorari with the U.S. Supreme Court (the Supreme Court), asking the Supreme Court to stay the District Court proceedings while the Supreme Court considers and rules in a case captioned Jones v. Harris Associates, which involves issues of law similar to those presented in the Gallus case. On March 30, 2010, the Supreme Court issued its ruling in Jones v. Harris Associates, and on April 5, 2010, the Supreme Court vacated the Eighth Circuit’s decision in the Gallus case and remanded the case to the Eighth Circuit for further consideration in light of the Supreme Court’s decision in Jones v. Harris Associates. On June 4, 2010, the Eighth Circuit remanded the Gallus case to the District Court for further consideration in light of the Supreme Court’s decision in Jones v. Harris Associates. On December 9, 2010, the District Court reinstated its July 9, 2007 summary judgment order in favor of the defendants. On January 10, 2011 plaintiffs filed a notice of appeal with the Eighth Circuit.
In December 2005, without admitting or denying the allegations, American Express Financial Corporation (AEFC, which is now known as Ameriprise Financial, Inc. (Ameriprise Financial)), entered into settlement agreements with the Securities and Exchange Commission (SEC) and Minnesota Department of Commerce (MDOC) related to market timing activities. As a result, AEFC was censured and ordered to cease and desist from committing or causing any violations of certain provisions of the Investment Advisers Act of 1940, the Investment Company Act of 1940, and various Minnesota laws. AEFC agreed to pay disgorgement of $10 million and civil money penalties of $7 million. AEFC also agreed to retain an independent distribution consultant to assist in developing a plan for distribution of all disgorgement and civil penalties ordered by the SEC in accordance with various undertakings detailed at
25
Columbia U.S. Treasury Index Fund
March 31, 2011
http://www.sec.gov/litigation/admin/ia-2451.pdf. Ameriprise Financial and its affiliates have cooperated with the SEC and the MDOC in these legal proceedings, and have made regular reports to the RiverSource, Seligman and Threadneedle funds’ Boards of Directors/Trustees.
Ameriprise Financial and certain of its affiliates have historically been involved in a number of legal, arbitration and regulatory proceedings, including routine litigation, class actions, and governmental actions, concerning matters arising in connection with the conduct of their business activities. Ameriprise Financial believes that the Funds are not currently the subject of, and that neither Ameriprise Financial nor any of its affiliates are the subject of, any pending legal, arbitration or regulatory proceedings that are likely to have a material adverse effect on the Funds or the ability of Ameriprise Financial or its affiliates to perform under their contracts with the Funds. Ameriprise Financial is required to make 10-Q, 10-K and, as necessary, 8-K filings with the Securities and Exchange Commission on legal and regulatory matters that relate to Ameriprise Financial and its affiliates. Copies of these filings may be obtained by accessing the SEC website at www.sec.gov.
There can be no assurance that these matters, or the adverse publicity associated with them, will not result in increased fund redemptions, reduced sale of fund shares or other adverse consequences to the Funds. Further, although we believe proceedings are not likely to have a material adverse effect on the Funds or the ability of Ameriprise Financial or its affiliates to perform under their contracts with the Funds, these proceedings are subject to uncertainties and, as such, we are unable to estimate the possible loss or range of loss that may result. An adverse outcome in one or more of these proceedings could result in adverse judgments, settlements, fines, penalties or other relief that could have a material adverse effect on the consolidated financial condition or results of operations of Ameriprise Financial.
26
Report of Independent Registered Public Accounting Firm
To the Trustees of Columbia Funds Series Trust I and the Shareholders of Columbia U.S. Treasury Index Fund
In our opinion, the accompanying statement of assets and liabilities, including the investment portfolio, and the related statements of operations and of changes in net assets and the financial highlights present fairly, in all material respects, the financial position of Columbia U.S. Treasury Index Fund (the “Fund”) (a series of Columbia Funds Series Trust I) at March 31, 2011, and the results of its operations for the year then ended, the changes in its net assets for each of the two years in the period then ended, and the financial highlights for each of the periods indicated, in conformity with accounting principles generally accepted in the United States of America. These financial statements and financial highlights (hereafter referred to as “financial statements”) are the responsibility of the Fund’s management. Our responsibility is to express an opinion on these financial statements based on our audits. We conducted our audits of these financial statements in accordance with the standards of the Public Company Accounting Oversight Board (United States). Those standards require that we plan and perform the audit to obtain reasonable assurance about whether the financial statements are free of material misstatement. An audit includes examining, on a test basis, evidence supporting the amounts and disclosures in the financial statements, assessing the accounting principles used and significant estimates made by management, and evaluating the overall financial statement presentation. We believe that our audits, which included confirmation of securities at March 31, 2011 by correspondence with the custodian and brokers, provide a reasonable basis for our opinion.
PricewaterhouseCoopers LLP
Boston, Massachusetts
May 20, 2011
27
Federal Income Tax Information (Unaudited) – Columbia U.S. Treasury Index Fund
The Fund hereby designates as a capital gain dividend with respect to the fiscal year ended March 31, 2011, $6,764,619, or, if subsequently determined to be different, the net capital gain of such year.
The Fund will notify shareholders in January 2012 of amounts for use in preparing 2011 income tax returns.
28
Fund Governance
The Trustees serve terms of indefinite duration. The names, addresses and birth years of the Trustees and Officers of the Funds in the Columbia Funds Series Trust I, the year each was first elected or appointed to office, their principal business occupations during at least the last five years, the number of Funds overseen by each Trustee and other directorships they hold are shown below. Each officer listed below serves as an officer of each Fund in the Columbia Funds Series Trust I.
Independent Trustees
| | |
Name, Address and Year of Birth,
Position with Funds, Year First
Elected or Appointed to Office | | Principal Occupation(s) During Past Five Years, Number of Funds in Columbia Funds
Complex Overseen by Trustee, Other Directorships Held |
| |
| John D. Collins (born 1938) | | |
c/o Columbia Management Investment Advisers, LLC 225 Franklin Street Boston, MA 02110 Trustee (since 2005) | | Retired. Consultant, KPMG, LLP (accounting and tax firm) from July 1999 to June 2000; Partner, KPMG, LLP from March 1962 to June 1999. Oversees 46; Mrs. Fields Original Cookies, Inc. (consumer products); Suburban Propane Partners, L.P.; and Montpelier Re (insurance underwriting firm) |
| |
| Rodman L. Drake (born 1943) | | |
c/o Columbia Management Investment Advisers, LLC 225 Franklin Street Boston, MA 02110 Trustee (since 1994) and Chairman of the Board (since 2009) | | Independent consultant since 2010; Co-Founder of Baringo Capital LLC (private equity) from 1997 to 2008; CEO of Crystal River Capital, Inc. (real estate investment trust) from 2003 to 2010; Oversees 46; Jackson Hewitt Tax Service Inc. (tax preparation services); Celgene Corporation (global biotechnology company); Student Loan Corporation (student loan provider); Crystal River Capital, Inc. from 2005 to 2010; Parsons Brinckerhoff from 1995 to 2008; the Helios Funds (closed-end funds); and Apex Silver Mines Ltd. from 2007 to 2009 |
| |
| Douglas A. Hacker (born 1955) | | |
c/o Columbia Management Investment Advisers, LLC 225 Franklin Street Boston, MA 02110 Trustee (since 1996) | | Independent business executive since May 2006; Executive Vice President–Strategy of United Airlines (airline) from December 2002 to May 2006; President of UAL Loyalty Services (airline marketing company) from September 2001 to December 2002; Executive Vice President and Chief Financial Officer of United Airlines from July 1999 to September 2001. Oversees 46; Nash Finch Company (food distributor); Aircastle Limited (aircraft leasing); and SeaCube Container Leasing Ltd (container leasing) |
|
| Janet Langford Kelly (born 1957) |
c/o Columbia Management Investment Advisers, LLC 225 Franklin Street Boston, MA 02110 Trustee (since 1996) | | Senior Vice President, General Counsel and Corporate Secretary, ConocoPhillips (integrated energy company) since September 2007; Deputy General Counsel–Corporate Legal Services, ConocoPhillips from August 2006 to August 2007; Partner, Zelle, Hofmann, Voelbel, Mason & Gette LLP (law firm) from March 2005 to July 2006; Adjunct Professor of Law, Northwestern University, from September 2004 to June 2006; Director, UAL Corporation (airline) from February 2006 to July 2006; Oversees 46; None |
| |
| William E. Mayer (born 1940) | | |
c/o Columbia Management Investment Advisers, LLC 225 Franklin Street Boston, MA 02110 Trustee (since 1994) | | Partner, Park Avenue Equity Partners (private equity) since February 1999; Dean and Professor, College of Business and Management, University of Maryland from 1992 to 1996. Oversees 46; DynaVox Inc. (software developer); Lee Enterprises (print media), WR Hambrecht + Co. (financial service provider); BlackRock Kelso Capital Corporation (investment company) |
29
Fund Governance (continued)
Independent Trustees (continued)
| | |
Name, Address and Year of Birth,
Position with Funds, Year First
Elected or Appointed to Office | | Principal Occupation(s) During Past Five Years, Number of Funds in Columbia Funds
Complex Overseen by Trustee, Other Directorships Held |
| |
| David M. Moffett (born 1952) | | |
c/o Columbia Management Investment Advisers, LLC 225 Franklin Street Boston, MA 02110 Trustee (since 2011) | | Retired. Chief Executive Officer, Federal Home Loan Mortgage Corporation, from 2008 to 2009; Senior Adviser, Global Financial Services Group, Carlyle Group, Inc., from 2007 to 2008; Vice Chairman and Chief Financial Officer, U.S. Bancorp, from 1993 to 2007. Oversees 46; CIT Group Inc. (commercial and consumer finance), eBay Inc. (online trading community), MBIA Corp (financial service provider), E.W. Scripps Co. (print and television media), Building Materials Holding Corp. (building materials and construction services), and University of Oklahoma Foundation. |
| |
| Charles R. Nelson (born 1942) | | |
c/o Columbia Management Investment Advisers, LLC 225 Franklin Street Boston, MA 02110 Trustee (since 1981) | | Professor of Economics, University of Washington, since January 1976; Ford and Louisa Van Voorhis Professor of Political Economy, University of Washington, since September 1993; Adjunct Professor of Statistics, University of Washington, since September 1980; Associate Editor, Journal of Money Credit and Banking, 1993-2008; Consultant on econometric and statistical matters. Oversees 46; None |
| |
| John J. Neuhauser (born 1943) | | |
c/o Columbia Management Investment Advisers, LLC 225 Franklin Street Boston, MA 02110 Trustee (since 1984) | | President, Saint Michael’s College, since August 2007; Director or Trustee of several non-profit organization, including Fletcher Allen Health Care, Inc.; University Professor, Boston College from November 2005 to August 2007; Academic Vice President and Dean of Faculties, Boston College from August 1999 to October 2005. Oversees 46; Liberty All-Star Equity Fund and Liberty All-Star Growth Fund, Inc. (closed-end funds) |
| |
| Jonathan Piel (born 1938) | | |
c/o Columbia Management Investment Advisers, LLC 225 Franklin Street Boston, MA 02110 Trustee (since 1994) | | Cable television producer and website designer; The Editor, Scientific American from 1984 to 1994; Vice President, Scientific American, Inc., from 1984 to 1994; Member, Advisory Board, Stone Age Institute, Bloomington, Indiana (research institute that explores the effect of technology on human evolution); Member, Board of Directors of the National Institute of Social Sciences, New York City; Member, Board of Trustees of the William Alanson White Institute, New York City (institution for training psychoanalysts); and Member, Advisory Board, Mount Sinai Children’s Environmental Health Center, New York. Oversees 46; None |
| |
| Patrick J. Simpson (born 1944) | | |
c/o Columbia Management Investment Advisers, LLC 225 Franklin Street Boston, MA 02110 Trustee (since 2000) | | Partner, Perkins Coie LLP (law firm). Oversees 46; None |
| |
| Anne-Lee Verville (born 1945) | | |
c/o Columbia Management Investment Advisers, LLC 225 Franklin Street Boston, MA 02110 Trustee (since 1998) | | Retired since 1997 (formerly General Manager–Global Education Industry from 1994 to 1997, President–Application Systems Division from 1991 to 1994, Chief Financial Officer–US Marketing & Services from 1988 to 1991, and Chief Information Officer from 1987 to 1988, IBM Corporation (computer and technology)). Oversees 46; Enesco Group, Inc. (producer of giftware and home and garden decor products) from 2001 to 2006 |
30
Fund Governance (continued)
Interested Trustee
| | |
Name, Address and Year of Birth,
Position with Funds, Year First
Elected or Appointed to Office | | Principal Occupation(s) During Past Five Years, Number of Funds in Columbia Funds
Complex Overseen by Trustee, Other Directorships Held |
| |
| Michael A. Jones (born 1959) | | |
c/o Columbia Management Investment Advisers, LLC 225 Franklin Street Boston, MA 02110 Trustee (since 2011) Senior Vice President (since 2010) | | President and Director, Columbia Management Investment Advisers, LLC since May 2010; President and Director, Columbia Management Investment Distributors, Inc. since May 2010; Manager, Chairman, Chief Executive Officer and President, Columbia Management Advisors, LLC from 2007 to April 2010; Chief Executive Officer, President and Director, Columbia Management Distributors, Inc. from November 2006 to April 2010; previously, co-president and senior managing director at Robeco Investment Management. Oversees 46; None |
The Statement of Additional Information includes additional information about the Trustees of the Funds and is available, without charge, upon request by calling 1-800-345-6611.
31
Fund Governance (continued)
Officers
| | |
| Name, Year of Birth and Address | | Principal Occupation(s) During the Past Five Years |
|
| J. Kevin Connaughton (born 1964) |
225 Franklin Street Boston, MA 02110 President (since 2009) | | Senior Vice President and General Manager–Mutual Fund Products, Columbia Management Investment Advisers, LLC since May 2010; President, Columbia Funds, since 2009, and RiverSource Funds, since May 2010 (previously Senior Vice President and Chief Financial Officer, Columbia Funds, from June 2008 to January 2009, Treasurer, Columbia Funds, from October 2003 to May 2008, and senior officer of various other affiliated funds since 2000); Managing Director, Columbia Management Advisors, LLC from December 2004 to April 2010. |
| |
| Michael G. Clarke (born 1969) | | |
225 Franklin Street Boston, MA 02110 Treasurer (since 2011) and Chief Financial Officer (since 2009) | | Vice President, Columbia Management Investment Advisers, LLC since May 2010; Managing Director of Fund Administration, Columbia Management Advisors, LLC, from September 2004 to April 2010; senior officer of Columbia Funds and affiliated funds since 2002. |
| |
| Scott R. Plummer (born 1959) | | |
5228 Ameriprise Financial Center Minneapolis, MN 55474 Senior Vice President, Secretary and Chief Legal Officer (since 2010) | | Chief Legal Officer and Assistant Secretary, Columbia Management Investment Advisers, LLC since June 2005; Vice President and Lead Chief Counsel–Asset Management, Ameriprise Financial, Inc. since May 2010 (previously Vice President and Chief Counsel–Asset Management, from 2005 to April 2010, and Vice President–Asset Management Compliance from 2004 to 2005); Vice President, Chief Counsel and Assistant Secretary, Columbia Management Investment Distributors, Inc. since 2008; Vice President, General Counsel and Secretary, Ameriprise Certificate Company since 2005; Chief Counsel, RiverSource Distributors, Inc. since 2006; Vice President, General Counsel and Secretary, RiverSource Funds, since December 2006; Senior Vice President, Secretary and Chief Legal Officer, Columbia Funds, since May 2010. |
| |
| Linda J. Wondrack (born 1964) | | |
225 Franklin Street Boston, MA 02110 Senior Vice President and Chief Compliance Officer (since 2007) | | Vice President and Chief Compliance Officer, Columbia Management Investment Advisers, LLC since May 2010; Chief Compliance Officer, Columbia Funds, since 2007, and RiverSource Funds, since May 2010; Director (Columbia Management Group, LLC and Investment Product Group Compliance), Bank of America, from June 2005 to April 2010; Director of Corporate Compliance and Conflicts Officer of MFS Investment Management (investment management) from August 2004 to May 2005. |
| |
| William F. Truscott (born 1960) | | |
53600 Ameriprise Financial Center Minneapolis, MN 55474 Senior Vice President (since 2010) | | Chairman of the Board, Columbia Management Investment Advisers, LLC since May 2010 (previously President, Chairman of the Board and Chief Investment Officer, from 2001 to April 2010); Chief Executive Officer, U.S. Asset Management & President, Annuities, Ameriprise Financial, Inc. since May 2010 (previously President–U.S. Asset Management and Chief Investment Officer from 2005 to April 2010, and Senior Vice President–Chief Investment Officer, from 2001 to 2005); Director, President and Chief Executive Officer, Ameriprise Certificate Company since 2006; Director, Columbia Management Investment Distributors, Inc. since May 2010 (previously Chairman of the Board and Chief Executive Officer from 2008 to April 2010); Chairman of the Board and Chief Executive Officer, RiverSource Distributors, Inc. since 2006. |
32
Fund Governance (continued)
Officers (continued)
| | |
| Name, Year of Birth and Address | | Principal Occupation(s) During the Past Five Years |
|
| Colin Moore (born 1958) |
225 Franklin Street Boston, MA 02110 Senior Vice President (since 2010) | | Director and Chief Investment Officer, Columbia Management Investment Advisers, LLC since May 2010; Manager, Managing Director and Chief Investment Officer of Columbia Management Advisors, LLC from 2007 to April 2010; Head of Equities, Columbia Management Advisors, LLC from 2002 to 2007. |
| |
| Amy Johnson (born 1965) | | |
5228 Ameriprise Financial Center Minneapolis, MN 55474 Vice President (since 2010) | | Senior Vice President and Chief Operating Officer, Columbia Management Investment Advisers, LLC since May 2010 (previously Chief Administrative Officer, from 2009 until April 2010, Vice President–Asset Management and Trust Company Services, from 2006 to 2009, and Vice President–Operations and Compliance from 2004 to 2006). |
| |
| Joseph F. DiMaria (born 1968) | | |
225 Franklin Street Boston, MA 02110 Vice President (since 2011) and Chief Accounting Officer (since 2008) | | Vice President, Mutual Fund Administration, Columbia Management Investment Advisers, LLC, since May 2010; Director of Fund Administration, Columbia Management Advisors, LLC from January 2006 to April 2010; Head of Tax/Compliance and Assistant Treasurer, Columbia Management Advisors, LLC, from November 2004 to December 2005. |
| |
| Paul D. Pearson (born 1956) | | |
5228 Ameriprise Financial Center Minneapolis, MN 55474 Vice President and Assistant Treasurer (since 2011) | | Vice President, Investment Accounting, Columbia Management Investment Advisers, LLC, since May 2010; Vice President, Managed Assets, Investment Accounting, Ameriprise Financial Corporation. |
| |
| Paul B. Goucher (born 1968) | | |
5228 Ameriprise Financial Center Minneapolis, MN 55474 Vice President and Assistant Treasurer (since 2010) | | Vice President and Chief Counsel of Ameriprise Financial since January 2010 (formerly Vice President and Group Counsel from November 2008 to January 2010); Director, Managing Director and General Counsel of J. & W. Seligman & Co. Incorporated (Seligman) from July 2008 to November 2008 and Managing Director and Associate General Counsel of Seligman from January 2005 to July 2008. |
|
| Christopher O. Petersen (born 1970) |
5228 Ameriprise Financial Center Minneapolis, MN 55474 Vice President and Assistant Treasurer (since 2010) | | Vice President and Chief Counsel, Ameriprise Financial since January 2010 (formerly Vice President and Group Counsel or Counsel from April 2004 to January 2010); Assistant Secretary of RiverSource Funds since January 2007. |
| |
| Michael E. DeFao (born 1968) | | |
5228 Ameriprise Financial Center Minneapolis, MN 55474 Vice President and Assistant Treasurer (since 2011) | | Vice President and Chief Counsel, Ameriprise Financial since May 2010; Associate General Counsel Bank of America from June 2005 to April 2010 |
| |
| Stephen T. Welsh (born 1957) | | |
225 Franklin Street Boston, MA 02110 Vice President (since 2006) | | President and Director, Columbia Management Investment Services Corp. since May 2010; President and Director, Columbia Management Services, Inc. from July 2004 to April 2010; Managing Director, Columbia Management Distributors, Inc. from August 2007 to April 2010. |
33
[THIS PAGE INTENTIONALLY LEFT BLANK]
34
[THIS PAGE INTENTIONALLY LEFT BLANK]
35
[THIS PAGE INTENTIONALLY LEFT BLANK]
36
Important Information About This Report
The fund mails one shareholder report to each shareholder address. If you would like more than one report, please call shareholder services at 1-800-345-6611 and additional reports will be sent to you. This report has been prepared for shareholders of Columbia U.S. Treasury Index Fund.
A description of the policies and procedures that the fund uses to determine how to vote proxies and a copy of the fund’s voting records are available (i) at www.columbiamanagement.com, (ii) on the Securities and Exchange Commission’s website at www.sec.gov, and (iii) without charge, upon request, by calling 1-800-368-0346. Information regarding how the fund voted proxies relating to portfolio securities during the 12-month period ended June 30 is available from the SEC’s website. Information regarding how the fund voted proxies relating to portfolio securities is also available from the fund’s website, www.columbiamanagement.com.
The fund files a complete schedule of portfolio holdings with the SEC for the first and third quarters of each fiscal year on Form N-Q. The fund’s Form N-Q is available on the SEC’s website at www.sec.gov and may be reviewed and copied at the SEC’s Public Reference Room in Washington, D.C. Information on the operation of the Public Reference Room may be obtained by calling
1-800-SEC-0330.
Transfer Agent
Columbia Management Investment Services Corp.
P.O. Box 8081
Boston, MA 02266-8081
1-800-345-6611
Distributor
Columbia Management Investment
Distributors, Inc.
225 Franklin Street
Boston, MA 02110
Investment Manager
Columbia Management Investment Advisers, LLC
225 Franklin Street
Boston, MA 02110
37

Columbia U.S. Treasury Index Fund
P.O. Box 8081
Boston, MA 02266-8081
columbiamanagement.com
This information is for use with concurrent or prior delivery of a fund prospectus. Investors should consider the investment objectives, risks, charges and expenses of a mutual fund carefully before investing. For a free prospectus, which contains this and other important information about the funds, visit columbiamanagement.com. Read the prospectus carefully before investing. The Fund is distributed by Columbia Management Investment Distributors, Inc., member FINRA, and managed by Columbia Management Investment Advisers, LLC.
©2011 Columbia Management Investment Advisers, LLC. All rights reserved.
C-1196 A (05/11)

Columbia World Equity Fund
Annual Report for the Period Ended March 31, 2011
Table of contents
The views expressed in this report reflect the current views of the respective parties. These views are not guarantees of future performance and involve certain risks, uncertainties and assumptions that are difficult to predict, so actual outcomes and results may differ significantly from the views expressed. These views are subject to change at any time based upon economic, market or other conditions and the respective parties disclaim any responsibility to update such views. These views may not be relied on as investment advice and, because investment decisions for a Columbia Fund are based on numerous factors, may not be relied on as an indication of trading intent on behalf of any particular Columbia Fund. References to specific securities should not be construed as a recommendation or investment advice.
President’s Message

Dear Shareholder:
The Columbia Management story began over 100 years ago, and today, we are one of the nation’s largest dedicated asset managers. The recent acquisition by Ameriprise Financial, Inc. brings together the talents, resources and capabilities of Columbia Management with those of RiverSource Investments, Threadneedle (acquired by Ameriprise in 2003) and Seligman Investments (acquired by Ameriprise in 2008) to build a best-in-class asset management business that we believe is truly greater than its parts.
RiverSource Investments traces its roots to 1894 when its then newly-founded predecessor, Investors Syndicate, offered a face-amount savings certificate that gave small investors the opportunity to build a safe and secure fund for retirement, education or other special needs. A mutual fund pioneer, Investors Syndicate launched Investors Mutual Fund in 1940. In the decades that followed, its mutual fund products and services lineup grew to include a full spectrum of styles and specialties. More than 110 years later, RiverSource continues to be a trusted financial products leader.
Threadneedle, a leader in global asset management and one of Europe’s largest asset managers, offers sophisticated international experience from a dedicated U.K. management team. Headquartered in London, it is named for Threadneedle Street in the heart of the city’s financial district, where British investors pioneered international and global investing. Threadneedle was acquired in 2003 and today operates as an affiliate of Columbia Management.
Seligman Investments’ beginnings date back to the establishment of the investment firm J. & W. Seligman & Co. in 1864. In the years that followed, Seligman played a major role in the geographical expansion and industrial development of the United States. In 1874, President Ulysses S. Grant named Seligman as fiscal agent for the U.S. Navy — an appointment that would last through World War I. Seligman helped finance the westward path of the railroads and the building of the Panama Canal. The firm organized its first investment company in 1929 and began managing its first mutual fund in 1930. In 2008, J. & W. Seligman & Co. Incorporated was acquired and Seligman Investments became an offering brand of RiverSource Investments, LLC.
We are proud of the rich and distinctive history of these firms, the strength and breadth of products and services they offer, and the combined cultures of pioneering spirit and forward thinking. Together we are committed to providing more for our shareholders than ever before.
| n | | A singular focus on our shareholders. Our business is asset management, so investors are our first priority. We dedicate our resources to identifying timely investment opportunities and provide a comprehensive choice of equity, fixed-income and alternative investments to help meet your individual needs. |
| n | | First-class research and thought leadership. We are dedicated to helping you take advantage of today’s opportunities and anticipate tomorrow’s. We stay abreast of the latest investment trends and ideas, using our collective insight to evaluate events and transform them into solutions you can use. |
| n | | A disciplined investment approach. We aren’t distracted by passing fads. Our teams adhere to a rigorous investment process that helps ensure the integrity of our products and enables you and your financial advisor to match our solutions to your objectives with confidence. |
When you choose Columbia Management, you can be confident that we will take the time to understand your needs and help you and your financial advisor identify the solutions that are right for you. Because at Columbia Management, we don’t consider ourselves successful unless you are.
Sincerely,

J. Kevin Connaughton
President, Columbia Funds
Investors should consider the investment objectives, risks, charges and expenses of a mutual fund carefully before investing. For a free prospectus, which contains this and other important information about the funds, visit www.columbiamanagement.com. The prospectus should be read carefully before investing.
Columbia Funds are distributed by Columbia Management Investment Distributors, Inc., member FINRA, and managed by Columbia Management Investment Advisers, LLC.
© 2011 Columbia Management Investment Advisers, LLC. All rights reserved.
Fund Profile – Columbia World Equity Fund
Summary
| n | | For the 12-month period that ended March 31, 2011, the fund’s Class A shares returned 15.82% without sales charge. |
| n | | The fund outperformed its benchmark, the MSCI World Index (Net)1, which returned 13.45%, and the average return of the funds in its peer group, the Lipper Global Multi-Cap Core Classification2, which returned 14.69%. |
| n | | U.S. dollar weakness was the biggest contributor to the fund’s return. The fund also benefited from an allocation to Columbia Emerging Markets Fund, which covers markets that are not included in the index. An overweight in the U.S. stocks also aided performance as did an underweight in Japan. |
Portfolio Management
Fred Copper has co-managed the fund since 2005 and has been associated with the fund’s adviser or the fund’s previous adviser or its predecessors since 2005.
Colin Moore has co-managed the fund since 2004 and has been associated with the fund’s adviser or the fund’s previous adviser or its predecessors since 2002.
Performance data quoted represents past performance and current performance may be lower or higher. Past performance is no guarantee of future results. The investment return and principal value will fluctuate so that shares, when redeemed, may be worth more or less than the original cost. Please visit www.columbiamanagement.com for daily and most recent month-end performance updates.
Summary
1-year return as of 03/31/11
| | |
| |
 | | +15.82% Class A shares (without sales charge) |
| |
| | +13.45% MSCI World Index (Net) |
|
Morningstar Style BoxTM |
|
Equity Style |

|
The Morningstar Style BoxTM is based on the fund’s portfolio holdings. For equity funds, the vertical axis shows the market capitalization of the stocks owned, and the horizontal axis shows investment style (value, blend, or growth). Information shown is based on the most recent data provided by Morningstar.
© 2011 Morningstar, Inc. All rights reserved. The Morningstar information contained herein: (1) is proprietary to Morningstar and/or its content providers; (2) may not be copied or distributed; and (3) is not warranted to be accurate, complete or timely. Neither Morningstar nor its content providers are responsible for any damages or losses arising from any use of this information.
| 1 | The Morgan Stanley Capital International (MSCI) World Index (Net) is an index that tracks the performance of global stocks. |
| 2 | Lipper Inc., a widely respected data provider in the industry, calculates an average total return (assuming reinvestment of distributions) for mutual funds with investment objectives similar to those of the fund. Lipper makes no adjustment for the effect of sales loads. |
Indices are not available for investment, are not professionally managed and do not reflect sales charges, fees, brokerage commissions, taxes or other expenses of investing. Securities in the fund may not match those in an index.
1
Economic Update – Columbia World Equity Fund
As the world shed concerns that key economies might lapse back into recession, the World Bank reported that global gross domestic product (GDP) rose 3.9% in 2010. The improvement over 2009 was more notable in high-income developed economies than in emerging-market countries, which had less ground to make up. Emerging market countries expanded by an estimated 7%, contributing nearly half of all global growth in 2010. This two-speed global recovery is likely to result in slower growth in 2011, but global growth should remain solid at 3.3% to 3.6%1 — higher in emerging market economies, led by China and India.
Robust expansion in the Asia Pacific region
Asian Pacific economies led the global economy in 2010 and are poised to continue in that role. Exports from markets such as Singapore and South Korea have been solid and domestic demand continues to strengthen. Labor markets are healthy, income is rising and confidence runs high across the region. Higher oil prices pose a downside risk to the current expansion, because it could erode demand for Asian exports and increase the risk of inflation. However, if growth exceeds expectations in the United States or Europe, the picture gets even better for Asia.
Austerity measures weigh on Europe
Growth in the developed world was hampered by a debt crisis in Europe’s weakest nations. However, the European Union took steps to manage debt restructuring in an orderly fashion and fear subsided — at least for now. In addition, austerity measures were introduced in Greece, Ireland, Portugal and Spain. Public employment and government spending were cut back sharply. Layoffs and pay cuts have been met with resistance, but their necessity is hard to dispute.
Inflation a growing worry
As demand picked up and commodity prices began to rise across the globe, inflation has become a growing worry in both fast-growing emerging markets and slower-growth developed countries. In developed market economies, inflation is generally an external force, resulting from higher commodity prices, especially for food and energy. In emerging markets, excess demand is driving inflation concerns and policymakers have begun to shift their focus from stimulating growth to taming inflation. However, rising food prices are also a problem in Asia since food accounts for a greater percentage of household budgets than it does in more developed areas of the world.
| 1 | World Bank estimate, January 12, 2011. |
Summary
For the 12-month period that ended March 31, 2011
| | n | | Despite intermittent volatility, stock markets around the world gained ground, as measured by the S&P 500 Index, the MSCI EAFE Index (Net) and the MSCI Emerging Markets Index (Net). | |
| | |
| S&P Index | | MSCI EAFE Index |
| |

| |
|
15.65% | | 10.42% |
| | |
| MSCI EM Index | | |
| |
| | |
18.46% | | |
2
Economic Update (continued) – Columbia World Equity Fund
Stocks stall, then pick up steam
Despite a period of volatility in the summer of 2010, as the world sought to digest a mounting debt crisis within euro-zone countries, it was a good year for stock markets around the world. The U.S. stock market returned 15.65% for the 12-month period, as measured by the S&P 500 Index2. Outside the U.S., stock market returns were also positive. The MSCI EAFE Index (Net)3, a broad gauge of stock market performance in foreign developed markets, gained 10.42% (in U.S. dollars) for the period. Although the European Union took steps early in the year to rein in debt problems in Greece, Ireland and Spain, recent revelations that Portugal may also need a bailout hampered returns from European markets. The impact of an earthquake, tsunami and a nuclear power plant debacle took a significant bite out of Japan’s returns in March, and Japan is a major component of the index. Emerging markets remained resilient, despite mounting fears about rising inflation. The MSCI Emerging Markets Index (Net)4 returned 18.46% (in U.S. dollars), led by strong performances from Eastern European markets.
Past performance is no guarantee of future results.
| 2 | The Standard & Poor’s (S&P) 500 Index tracks the performance of 500 widely held, large-capitalization U.S. stocks. |
| 3 | The Morgan Stanley Capital International Europe, Australasia, Far East (MSCI EAFE) Index (Net) is a free float-adjusted market capitalization index that is designed to measure the equity market performance of developed markets, excluding the U.S. & Canada. As of December 31, 2010, the MSCI EAFE Index (Net) consisted of the following 22 developed market country indices: Australia, Austria, Belgium, Denmark, Finland, France, Germany, Greece, Hong Kong, Ireland, Israel, Italy, Japan, the Netherlands, New Zealand, Norway, Portugal, Singapore, Spain, Sweden, Switzerland and the United Kingdom. |
| 4 | The Morgan Stanley Capital International Emerging Markets (MSCI EM) Index (Net) is a free float-adjusted market capitalization index that is designed to measure equity market performance of emerging markets. As of December 31, 2010, the MSCI EM Index (Net) consisted of the following 21 emerging market country indices: Brazil, Chile, China, Colombia, Czech Republic, Egypt, Hungary, India, Indonesia, Korea, Malaysia, Mexico, Morocco, Peru, Philippines, Poland, Russia, South Africa, Taiwan, Thailand and Turkey. |
Indices are not available for investment, are not professionally managed and do not reflect sales charges, fees, brokerage commissions, taxes or other expenses of investing. Securities in the fund may not match those in an index.
3
Performance Information – Columbia World Equity Fund
Performance data quoted represents past performance and current performance may be lower or higher. Past performance is no guarantee of future results. The investment return and principal value will fluctuate so that shares, when redeemed, may be worth more or less than the original cost. Please visit www.columbiamanagement.com for daily and most recent month-end performance updates.
| | | | |
| Net asset value per share | |
| |
As of 03/31/11 ($) | | | | |
Class A | | | 12.90 | |
Class B | | | 12.20 | |
Class C | | | 12.18 | |
| | | | |
| Distributions declared per share | |
| |
04/01/10 – 03/31/11 ($) | | | | |
Class A | | | 0.06 | |
Class B | | | 0.00 | |
Class C | | | 0.00 | |
|
| Performance of a $10,000 investment 04/01/01 – 03/31/11 |
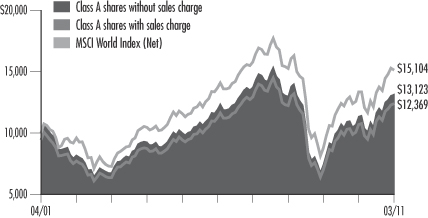
The chart above shows the change in value of a hypothetical $10,000 investment in Class A shares of Columbia World Equity Fund during the stated time period, and does not reflect the deduction of taxes that a shareholder may pay on fund distributions or on the redemption of fund shares.
| | | | | | | | |
| Performance of a $10,000 investment 04/01/01 – 03/31/11 ($) | |
|
| Share class | |
Sales charge: | | without | | | with | |
Class A | | | 13,123 | | | | 12,369 | |
Class B | | | 12,169 | | | | 12,169 | |
Class C | | | 12,153 | | | | 12,153 | |
| | | | | | | | | | | | | | | | | | | | | | | | |
| Average annual total return as of 03/31/11 (%) | |
| | | |
| Share class | | A | | | B | | | C | |
| Inception | | 10/15/91 | | | 03/27/95 | | | 03/27/95 | |
| Sales charge | | without | | | with | | | without | | | with | | | without | | | with | |
1-year | | | 15.82 | | | | 9.16 | | | | 14.88 | | | | 9.88 | | | | 14.91 | | | | 13.91 | |
5-year | | | 1.97 | | | | 0.77 | | | | 1.21 | | | | 0.86 | | | | 1.21 | | | | 1.21 | |
10-year | | | 2.76 | | | | 2.15 | | | | 1.98 | | | | 1.98 | | | | 1.97 | | | | 1.97 | |
The “with sales charge” returns include the maximum initial sales charge of 5.75% for Class A shares and the applicable contingent deferred sales charge of 5.00% in the first year, declining to 1.00% in the sixth year and eliminated thereafter for Class B shares and 1.00% for Class C shares for the first year only. The “without sales charge” returns do not include the effect of sales charges. If they had, returns would be lower.
Performance results reflect any fee waivers or reimbursements of fund expenses by the investment advisor and/or any of its affiliates. Absent these fee waivers or expense reimbursement arrangements, performance results would have been lower.
All results shown assume reinvestment of distributions. Please see the fund’s prospectus for details. Performance for different share classes will vary based on differences in sales charges and fees associated with each class.
The table does not reflect the deduction of taxes that a shareholder may pay on fund distributions or on the redemption of fund shares.
4
Understanding Your Expenses – Columbia World Equity Fund
As a fund shareholder, you incur two types of costs. There are transaction costs, which
generally include sales charges on purchases and may include redemption fees or exchange fees. There are also ongoing costs, which generally include investment advisory fees, distribution and service (Rule 12b-1) fees and other fund expenses. The information on this page is intended to help you understand the ongoing costs of investing in the fund and to compare these costs with the ongoing costs of investing in other mutual funds.
Analyzing your fund’s expenses by share class
To illustrate these ongoing costs, we have provided an example and calculated the expenses paid by investors in each share class during the period. The information in the following table is based on an initial investment of $1,000, which is invested at the beginning of the period and held for the entire period. Expense information is calculated two ways and each method provides you with different information. The amount listed in the “Actual” column is calculated using the fund’s actual operating expenses and total return for the period. The amount listed in the “Hypothetical” column for each share class assumes that the return each year is 5% before expenses and is calculated based on the fund’s actual operating expenses. You should not use the hypothetical account values and expenses to estimate either your actual account balance at the end of the period or the expenses you paid during this period.
Compare with other funds
Since all mutual funds are required to include the same hypothetical calculations about expenses in shareholder reports, you can use this information to compare the ongoing costs of investing in the fund with other funds. To do so, compare the 5% hypothetical example with the 5% hypothetical examples that appear in the shareholder reports of other funds. As you compare hypothetical examples of other funds, it is important to note that hypothetical examples are meant to highlight the ongoing costs of investing in a fund and do not reflect any transaction costs, such as sales charges, redemption fees or exchange fees.
Estimating your actual expenses
To estimate the expenses that you paid over the period, first you will need your account balance at the end of the period:
| | n | | For shareholders who receive their account statements from Columbia Management Investment Services Corp., your account balance is available online at www.columbiamanagement.com or by calling Shareholder Services at 800.345.6611. | |
| | n | | For shareholders who receive their account statements from their financial intermediary, contact your financial intermediary to obtain your account balance. | |
| | 1. | Divide your ending account balance by $1,000. For example, if an account balance was $8,600 at the end of the period, the result would be 8.6. | |
| | 2. | In the section of the table below titled “Expenses paid during the period,” locate the amount for your share class. You will find this number in the column labeled “Actual.” Multiply this number by the result from step 1. Your answer is an estimate of the expenses you paid on your account during the period. | |
If the value of your account falls below the minimum initial investment requirement applicable to you, your account may be subject to a $20 annual fee. This fee is not included in the accompanying table. If you are subject to the fee, keep it in mind when you are estimating the ongoing expenses of investing in the fund and when comparing the expenses of this fund with other funds.
| | | | | | | | | | | | | | | | | | | | | | | | | | | | |
| 10/01/10 – 3/31/11 | | | | | | | | | | | | | |
| | | | |
| | | Account value at the
beginning of the period ($) | | | Account value at the
end of the period ($) | | | Expenses paid
during the period ($) | | | Fund’s annualized
expense ratio (%) | |
| | | Actual | | | Hypothetical | | | Actual | | | Hypothetical | | | Actual | | | Hypothetical | | | Actual | |
Class A | | | 1,000.00 | | | | 1,000.00 | | | | 1,130.90 | | | | 1,017.75 | | | | 7.65 | | | | 7.24 | | | | 1.44 | |
Class B | | | 1,000.00 | | | | 1,000.00 | | | | 1,126.50 | | | | 1,014.01 | | | | 11.61 | | | | 11.00 | | | | 2.19 | |
Class C | | | 1,000.00 | | | | 1,000.00 | | | | 1,126.70 | | | | 1,014.01 | | | | 11.61 | | | | 11.00 | | | | 2.19 | |
Expenses paid during the period are equal to the annualized expense ratio for the share class, multiplied by the average account value over the period, then multiplied by the number of days in the fund’s most recent fiscal half-year and divided by 365.
Had the Investment Manager and/or any of its affiliates not waived fees or reimbursed a portion of expenses, account value at the end of the period would have been reduced.
It is important to note that the expense amounts shown in the table are meant to highlight only ongoing costs of investing in the fund and do not reflect any transaction costs, such as sales charges, redemption fees or exchange fees. Therefore, the hypothetical examples provided may not help you determine the relative total costs of owning shares of different funds. If these transaction costs were included, your costs would have been higher.
5
Portfolio Managers’ Report – Columbia World Equity Fund
Performance data quoted represents past performance and current performance may be lower or higher. Past performance is no guarantee of future results. The investment return and principal value will fluctuate so that shares, when redeemed, may be worth more or less than the original cost. Please visit www.columbiamanagement.com for daily and most recent month-end performance updates.
| | | | |
| Top 5 countries | | | |
| |
as of 03/31/11 (%) | | | | |
United States* | | | 59.1 | |
United Kingdom | | | 7.7 | |
Japan | | | 4.8 | |
Germany | | | 3.6 | |
Republic of Korea | | | 2.3 | |
| * | Includes short-term obligation and investment companies. |
| | | | |
| Top 5 sectors | | | |
| |
as of 03/31/11 (%) | | | | |
Information Technology | | | 15.8 | |
Health Care | | | 13.1 | |
Financials | | | 12.3 | |
Consumer Discretionary | | | 12.0 | |
Energy | | | 11.7 | |
The fund is actively managed and the composition of its portfolio will change over time.
Information provided is calculated as a percentage of net assets.
For the 12-month period that ended March 31, 2011, the fund’s Class��A shares returned 15.82% without sales charge. The fund outperformed its benchmark, the MSCI World Index (Net), which returned 13.45%. It also did better than the 14.69% average return of the funds in its peer group, the Lipper Global Multi-Cap Core Funds Classification. U.S. dollar weakness was the biggest contributor to return. With a weak dollar, earnings valued in foreign currencies were worth more when converted to U.S. dollars. The fund benefited from an allocation to Columbia Emerging Markets Fund (3.9% of net assets), which covers markets not included in the index. We emphasized this fund because we believed that emerging markets were likely to be leaders during the global economic recovery. An overweight in the U.S. stocks also aided performance as did an underweight in Japan.
U.S. stocks helped drive return
U.S. stocks make up 50% of the MSCI World Index, and the fund’s exposure to the U.S. market was higher than 50%. We favored the United States because of policies that helped keep interest rates at historical lows. We emphasized stocks that we expected to do well during an economic recovery. Technology stocks met this criterion. The fund was overweight in the sector, and technology stocks were the best performers in the portfolio. Because of cost-cutting and restructuring, most corporations have relatively large amounts of cash on their balance sheets, and they are spending a good portion of it on technology as a way to increase productivity. An example is Teradata (1.5% of net assets), a company that produces data storage systems that are in strong demand.
Health care and materials stocks were noteworthy
Stock selection in health care was positive, with Novo Nordisk in Denmark (1.7% of net assets) being the best performer. The company has a strong diabetes franchise. Materials stocks also did well. For example, Ahlstrom (1.6% of net assets), a specialty packaging company in Finland, was buoyed by high demand for its products and a favorable pricing environment.
Some stocks disappointed
In the energy sector, Transocean, an offshore drilling company, did poorly. The company was involved with the oil spill in the Gulf of Mexico. We sold the stock. Freenet AG (0.7% of net assets), a German telecommunications company that experienced a decline in subscriber growth, also held back results. We maintained a position in the stock because we believe the company has a strong potential for future cash flow growth.
The global markets face several headwinds
The dislocation in Japan that resulted from a major earthquake and tsunami could have a significant impact on businesses around the world, should Japanese manufacturers be unable to produce and export products. Unrest in the Mideast could also affect global markets. While oil prices have risen, the reaction of world stock markets to the Mideast turmoil has been muted. This situation could change if key countries, such as Bahrain and Saudi Arabia, become involved. Continuation of a sovereign debt crisis in Europe could also affect the financial markets. Ireland and Greece have been bailed out by the European Union and the International Monetary Fund; however, other countries may also seek help. So far there has been sufficient funding for bailouts, but this may not be the case if additional economies request support. In the
6
Portfolio Managers’ Report (continued) – Columbia World Equity Fund
United States, the Federal Reserve Board’s (the Fed’s) program of purchasing long-term Treasury securities will end in June. Known as “quantitative easing,” the central bank’s policy was aimed at pumping money into a sluggish economy. In an environment in which yields on long-term Treasuries are relatively low, market participants may be reluctant to purchase Treasuries unless the Fed raises interest rates. Higher interest rates could dampen corporate profits and, ultimately, stock prices. Given these concerns, the fund has a slightly defensive positioning. Its investment approach will continue to be based on individual stock selection.
Portfolio characteristics and holdings are subject to change periodically and may not be representative of current characteristics and holdings. The outlook for the fund may differ from that presented for other Columbia Funds.
Equity securities are subject to stock market fluctuations that occur in response to economic and business developments.
International investing involves special risks, including foreign taxation, currency risks, risks associated with possible differences in financial standards and other risks associated with future political and economic developments.
| | | | |
| Top 10 holdings | | | |
| |
as of 03/31/11 (%) | | | | |
Columbia Emerging Markets Fund, Class Z | | | 3.9 | |
Exxon Mobil | | | 2.3 | |
Novo Nordisk | | | 1.7 | |
Ahlstrom | | | 1.6 | |
Teradata | | | 1.5 | |
Tele2 | | | 1.5 | |
Verizon Communications | | | 1.5 | |
EMC | | | 1.4 | |
Peabody Energy | | | 1.4 | |
Qwest Communications | | | 1.4 | |
The fund is actively managed and the composition of its portfolio will change over time. Information provided is calculated as a percentage of net assets.
7
Investment Portfolio – Columbia World Equity Fund
March 31, 2011
Common Stocks – 94.1%
| | | | | | | | |
| | | Shares | | | Value ($) | |
| Consumer Discretionary – 12.0% | | | | | | | | |
| Auto Components – 1.8% | | | | | | | | |
Autoliv, Inc. | | | 7,063 | | | | 524,286 | |
Kongsberg Automotive Holding ASA (a) | | | 559,200 | | | | 442,891 | |
| | | | | | | | |
Auto Components Total | | | | | | | 967,177 | |
| | |
| Hotels, Restaurants & Leisure – 1.1% | | | | | | | | |
Yum! Brands, Inc. | | | 11,302 | | | | 580,697 | |
| | | | | | | | |
Hotels, Restaurants & Leisure Total | | | | | | | 580,697 | |
| | |
| Household Durables – 0.7% | | | | | | | | |
Arnest One Corp. | | | 38,500 | | | | 384,460 | |
| | | | | | | | |
Household Durables Total | | | | | | | 384,460 | |
| | |
| Internet & Catalog Retail – 1.3% | | | | | | | | |
Hyundai Home Shopping Network Corp. | | | 6,523 | | | | 721,858 | |
| | | | | | | | |
Internet & Catalog Retail Total | | | | | | | 721,858 | |
| | |
| Media – 1.0% | | | | | | | | |
Daiichikosho Co., Ltd. | | | 30,700 | | | | 521,929 | |
| | | | | | | | |
Media Total | | | | | | | 521,929 | |
| | |
| Multiline Retail – 2.5% | | | | | | | | |
Dollar Tree, Inc. (a) | | | 7,155 | | | | 397,246 | |
Kohl’s Corp. | | | 8,267 | | | | 438,482 | |
Target Corp. | | | 9,828 | | | | 491,498 | |
| | | | | | | | |
Multiline Retail Total | | | | | | | 1,327,226 | |
| | |
| Specialty Retail – 0.7% | | | | | | | | |
Inditex SA | | | 4,821 | | | | 386,846 | |
| | | | | | | | |
Specialty Retail Total | | | | | | | 386,846 | |
|
| Textiles, Apparel & Luxury Goods – 2.9% | |
Hanesbrands, Inc. (a) | | | 18,407 | | | | 497,725 | |
LG Fashion Corp. | | | 18,470 | | | | 498,283 | |
NIKE, Inc., Class B | | | 7,090 | | | | 536,713 | |
| | | | | | | | |
Textiles, Apparel & Luxury Goods Total | | | | | | | 1,532,721 | |
| | | | | | | | |
Consumer Discretionary Total | | | | | | | 6,422,914 | |
| | | | | | | | |
| Consumer Staples – 2.7% | | | | | | | | |
| Beverages – 1.1% | | | | | | | | |
PepsiCo, Inc. | | | 8,914 | | | | 574,151 | |
| | | | | | | | |
Beverages Total | | | | | | | 574,151 | |
| | |
| Food & Staples Retailing – 0.9% | | | | | | | | |
CVS Caremark Corp. | | | 13,553 | | | | 465,139 | |
| | | | | | | | |
Food & Staples Retailing Total | | | | | | | 465,139 | |
| | |
| Food Products – 0.7% | | | | | | | | |
Asian Citrus Holdings Ltd. | | | 351,000 | | | | 387,858 | |
| | | | | | | | |
Food Products Total | | | | | | | 387,858 | |
| | | | | | | | |
Consumer Staples Total | | | | | | | 1,427,148 | |
| | | | | | | | |
| | | Shares | | | Value ($) | |
| Energy – 11.7% | | | | | |
| Energy Equipment & Services – 1.6% | | | | | |
Oceaneering International, Inc. (a) | | | 3,909 | | | | 349,660 | |
Shinko Plantech Co., Ltd. | | | 45,700 | | | | 527,925 | |
| | | | | | | | |
Energy Equipment & Services Total | | | | | | | 877,585 | |
| |
| Oil, Gas & Consumable Fuels – 10.1% | | | | | |
Apache Corp. | | | 3,142 | | | | 411,351 | |
BG Group PLC | | | 21,667 | | | | 539,099 | |
Chevron Corp. | | | 6,822 | | | | 732,887 | |
Devon Energy Corp. | | | 7,370 | | | | 676,345 | |
Exxon Mobil Corp. | | | 14,558 | | | | 1,224,764 | |
Peabody Energy Corp. | | | 10,270 | | | | 739,029 | |
Royal Dutch Shell PLC, Class B | | | 14,871 | | | | 539,147 | |
Yanzhou Coal Mining Co., Ltd., Class H | | | 152,000 | | | | 548,193 | |
| | | | | | | | |
Oil, Gas & Consumable Fuels Total | | | | | | | 5,410,815 | |
| | | | | | | | |
Energy Total | | | | | | | 6,288,400 | |
| | | | | | | | |
| Financials – 12.3% | | | | | |
| Capital Markets – 1.9% | | | | | |
Deutsche Bank AG, Registered Shares | | | 10,360 | | | | 609,090 | |
Northern Trust Corp. | | | 8,090 | | | | 410,568 | |
| | | | | | | | |
Capital Markets Total | | | | | | | 1,019,658 | |
| |
| Commercial Banks – 5.5% | | | | | |
Banco Santander SA | | | 39,003 | | | | 452,813 | |
HSBC Holdings PLC | | | 59,051 | | | | 607,217 | |
PNC Financial Services Group, Inc. | | | 7,790 | | | | 490,692 | |
Standard Chartered PLC | | | 18,518 | | | | 480,355 | |
Synovus Financial Corp. | | | 162,087 | | | | 389,009 | |
U.S. Bancorp | | | 20,807 | | | | 549,929 | |
| | | | | | | | |
Commercial Banks Total | | | | | | | 2,970,015 | |
| |
| Diversified Financial Services – 1.7% | | | | | |
Citigroup, Inc. (a) | | | 115,462 | | | | 510,342 | |
JPMorgan Chase & Co. | | | 9,052 | | | | 417,297 | |
| | | | | | | | |
Diversified Financial Services Total | | | | | | | 927,639 | |
| |
| Insurance – 3.2% | | | | | |
Lancashire Holdings Ltd. | | | 49,322 | | | | 472,756 | |
Legal & General Group PLC | | | 323,355 | | | | 597,572 | |
Zurich Financial Services AG, Registered Shares | | | 2,223 | | | | 622,246 | |
| | | | | | | | |
Insurance Total | | | | | | | 1,692,574 | |
| | | | | | | | |
Financials Total | | | | | | | 6,609,886 | |
| | | | | | | | |
| Health Care – 13.1% | | | | | |
| Biotechnology – 1.9% | | | | | | | | |
Amgen, Inc. (a) | | | 11,726 | | | | 626,755 | |
Celgene Corp. (a) | | | 7,197 | | | | 414,043 | |
| | | | | | | | |
Biotechnology Total | | | | | | | 1,040,798 | |
See Accompanying Notes to Financial Statements.
8
Columbia World Equity Fund
March 31, 2011
Common Stocks (continued)
| | | | | | | | |
| | | Shares | | | Value ($) | |
| Health Care (continued) | | | | | |
| Health Care Equipment & Supplies – 0.8% | |
St. Shine Optical Co., Ltd. | | | 33,000 | | | | 405,810 | |
| | | | | | | | |
Health Care Equipment & Supplies Total | | | | | | | 405,810 | |
| |
| Health Care Providers & Services – 5.7% | | | | | |
Laboratory Corp. of America Holdings (a) | | | 6,902 | | | | 635,881 | |
McKesson Corp. | | | 8,557 | | | | 676,431 | |
Medco Health Solutions, Inc. (a) | | | 7,420 | | | | 416,707 | |
Miraca Holdings, Inc. | | | 17,300 | | | | 662,140 | |
UnitedHealth Group, Inc. | | | 15,080 | | | | 681,616 | |
| | | | | | | | |
Health Care Providers & Services Total | | | | | | | 3,072,775 | |
| | |
| Pharmaceuticals – 4.7% | | | | | | | | |
Allergan, Inc. | | | 7,968 | | | | 565,887 | |
Jazz Pharmaceuticals, Inc. (a) | | | 18,177 | | | | 578,938 | |
Novo-Nordisk A/S, Class B | | | 7,071 | | | | 888,377 | |
Sanofi-Aventis SA | | | 7,337 | | | | 514,441 | |
| | | | | | | | |
Pharmaceuticals Total | | | | | | | 2,547,643 | |
| | | | | | | | |
Health Care Total | | | | | | | 7,067,026 | |
| | | | | | | | |
| Industrials – 9.9% | | | | | |
| Aerospace & Defense – 2.0% | | | | | | | | |
Honeywell International, Inc. | | | 7,130 | | | | 425,732 | |
United Technologies Corp. | | | 7,473 | | | | 632,590 | |
| | | | | | | | |
Aerospace & Defense Total | | | | | | | 1,058,322 | |
| |
| Commercial Services & Supplies – 0.8% | | | | | |
Waste Management, Inc. | | | 11,163 | | | | 416,826 | |
| | | | | | | | |
Commercial Services & Supplies Total | | | | | | | 416,826 | |
| | |
| Construction & Engineering – 1.9% | | | | | | | | |
KBR, Inc. | | | 14,349 | | | | 541,962 | |
Macmahon Holdings Ltd. | | | 870,426 | | | | 508,599 | |
| | | | | | | | |
Construction & Engineering Total | | | | | | | 1,050,561 | |
| | |
| Electrical Equipment – 1.5% | | | | | | | | |
Emerson Electric Co. | | | 5,942 | | | | 347,191 | |
Nidec Corp. | | | 5,600 | | | | 485,017 | |
| | | | | | | | |
Electrical Equipment Total | | | | | | | 832,208 | |
| | |
| Industrial Conglomerates – 0.7% | | | | | | | | |
General Electric Co. | | | 19,023 | | | | 381,411 | |
| | | | | | | | |
Industrial Conglomerates Total | | | | | | | 381,411 | |
| | |
| Machinery – 3.0% | | | | | | | | |
Dover Corp. | | | 7,350 | | | | 483,189 | |
Parker Hannifin Corp. | | | 6,355 | | | | 601,691 | |
Sulzer AG, Registered Shares | | | 3,475 | | | | 523,615 | |
| | | | | | | | |
Machinery Total | | | | | | | 1,608,495 | |
| | | | | | | | |
Industrials Total | | | | 5,347,823 | |
| | | | | | | | |
| | | Shares | | | Value ($) | |
| Information Technology – 15.8% | |
| Communications Equipment – 1.2% | | | | | | | | |
Juniper Networks, Inc. (a) | | | 15,007 | | | | 631,495 | |
| | | | | | | | |
Communications Equipment Total | | | | | | | 631,495 | |
| |
| Computers & Peripherals – 2.5% | | | | | |
Apple, Inc. (a) | | | 1,778 | | | | 619,544 | |
EMC Corp. (a) | | | 28,049 | | | | 744,701 | |
| | | | | | | | |
Computers & Peripherals Total | | | | | | | 1,364,245 | |
|
| Electronic Equipment, Instruments & Components – 0.9% | |
Venture Corp., Ltd. | | | 65,000 | | | | 495,528 | |
| | | | | | | | |
Electronic Equipment, Instruments & Components Total | | | | | | | 495,528 | |
|
| Internet Software & Services – 2.7% | |
Akamai Technologies, Inc. (a) | | | 10,350 | | | | 393,300 | |
Google, Inc., Class A (a) | | | 910 | | | | 533,451 | |
Tencent Holdings Ltd. | | | 20,400 | | | | 497,063 | |
| | | | | | | | |
Internet Software & Services Total | | | | | | | 1,423,814 | |
|
| IT Services – 3.7% | |
Accenture PLC, Class A | | | 12,150 | | | | 667,886 | |
International Business Machines Corp. | | | 2,992 | | | | 487,905 | |
Teradata Corp. (a) | | | 16,139 | | | | 818,247 | |
| | | | | | | | |
IT Services Total | | | | | | | 1,974,038 | |
|
| Semiconductors & Semiconductor Equipment – 2.2% | |
ARM Holdings PLC | | | 55,891 | | | | 515,547 | |
First Solar, Inc. (a) | | | 4,288 | | | | 689,682 | |
| | | | | | | | |
Semiconductors & Semiconductor Equipment Total | | | | | | | 1,205,229 | |
|
| Software – 2.6% | |
Citrix Systems, Inc. (a) | | | 9,377 | | | | 688,834 | |
Oracle Corp. | | | 20,649 | | | | 689,057 | |
| | | | | | | | |
Software Total | | | | | | | 1,377,891 | |
| | | | | | | | |
Information Technology Total | | | | 8,472,240 | |
| | | | | | | | |
| Materials – 7.6% | |
| Chemicals – 4.6% | | | | | | | | |
Agrium, Inc. | | | 4,770 | | | | 440,080 | |
BASF SE | | | 5,681 | | | | 491,359 | |
LyondellBasell Industries NV, Class A (a) | | | 12,227 | | | | 483,578 | |
Potash Corp. of Saskatchewan, Inc. | | | 7,959 | | | | 469,024 | |
Praxair, Inc. | | | 5,670 | | | | 576,072 | |
| | | | | | | | |
Chemicals Total | | | | | | | 2,460,113 | |
| | |
| Metals & Mining – 1.5% | | | | | | | | |
Freeport-McMoRan Copper & Gold, Inc. | | | 6,948 | | | | 385,962 | |
Vale SA | | | 12,400 | | | | 405,194 | |
| | | | | | | | |
Metals & Mining Total | | | | | | | 791,156 | |
See Accompanying Notes to Financial Statements.
9
Columbia World Equity Fund
March 31, 2011
Common Stocks (continued)
| | | | | | | | |
| | | Shares | | | Value ($) | |
| Materials (continued) | |
| Paper & Forest Products – 1.5% | | | | | | | | |
Ahlstrom Oyj | | | 33,735 | | | | 830,924 | |
| | | | | | | | |
Paper & Forest Products Total | | | | | | | 830,924 | |
| | | | | | | | |
Materials Total | | | | 4,082,193 | |
| | | | | | | | |
| Telecommunication Services – 6.3% | |
| Diversified Telecommunication Services – 4.4% | |
Qwest Communications International, Inc. | | | 108,065 | | | | 738,084 | |
Tele2 AB, Class B | | | 35,020 | | | | 808,935 | |
Verizon Communications, Inc. | | | 20,926 | | | | 806,488 | |
| | | | | | | | |
Diversified Telecommunication Services Total | | | | 2,353,507 | |
|
| Wireless Telecommunication Services – 1.9% | |
Freenet AG | | | 31,791 | | | | 363,587 | |
Vivo Participacoes SA, ADR | | | 15,946 | | | | 643,900 | |
| | | | | | | | |
Wireless Telecommunication Services Total | | | | | | | 1,007,487 | |
| | | | | | | | |
Telecommunication Services Total | | | | 3,360,994 | |
| | | | | | | | |
| Utilities – 2.7% | |
| Gas Utilities – 1.1% | | | | | | | | |
Chesapeake Utilities Corp. | | | 13,815 | | | | 574,980 | |
| | | | | | | | |
Gas Utilities Total | | | | | | | 574,980 | |
|
| Independent Power Producers & Energy Traders – 0.6% | |
International Power PLC | | | 69,743 | | | | 344,596 | |
| | | | | | | | |
Independent Power Producers & Energy Traders Total | | | | | | | 344,596 | |
|
| Water Utilities – 1.0% | |
Hyflux Ltd. | | | 313,500 | | | | 537,202 | |
| | | | | | | | |
Water Utilities Total | | | | | | | 537,202 | |
| | | | | | | | |
Utilities Total | | | | 1,456,778 | |
| | | | | | | | |
Total Common Stocks
(cost of $37,859,186) | | | | 50,535,402 | |
|
Preferred Stock – 0.9% | |
| | | | | | | | |
| Consumer Staples – 0.9% | |
| Household Products – 0.9% | |
Henkel AG & Co., KGaA | | | 7,681 | | | | 475,805 | |
| | | | | | | | |
Household Products Total | | | | | | | 475,805 | |
| | | | | | | | |
Consumer Staples Total | | | | | | | 475,805 | |
| | | | | | | | |
Total Preferred Stock
(cost of $393,017) | | | | 475,805 | |
Investment Company – 3.8%
| | | | | | | | |
| | | Shares | | | Value ($) | |
Columbia Emerging Markets Fund, Class Z (b) | | | 180,949 | | | | 2,079,106 | |
| | | | | | | | |
Total Investment Company
(cost of $1,340,905) | | | | 2,079,106 | |
|
Short-Term Obligation – 0.5% | |
| | | Par ($) | | | | |
Repurchase agreement with Fixed Income Clearing Corp., dated 03/31/11, due 04/01/11 at 0.040%, collateralized by a U.S. Treasury obligation maturing 08/15/39, market value $277,915 (repurchase proceeds $269,000) | | | 269,000 | | | | 269,000 | |
| |
Total Short-Term Obligation
(cost of $269,000) | | | | 269,000 | |
| | | | | | | | |
Total Investments – 99.3%
(cost of $39,862,108) (c) | | | | 53,359,313 | |
| | | | | | | | |
Other Assets & Liabilities, Net – 0.7% | | | | 360,149 | |
| | | | | | | | |
Net Assets – 100.0% | | | | 53,719,462 | |
Notes to Investment Portfolio:
| (a) | Non-income producing security. |
| (b) | Investments in affiliates during the year ended March 31, 2011: |
| | | | | | | | | | | | | | | | | | | | |
Affiliate | | Value,
beginning of
period | | | Purchases | | | Sales
Proceeds | | | Dividend
Income | | | Value,
end of
period | |
Columbia Emerging Markets Fund, Class Z | | $ | 1,784,042 | | | $ | 750,000 | | | $ | 533,600 | | | $ | 23,542 | | | $ | 2,079,106 | |
Columbia Convertible Securities Fund, Class Z | | | — | | | | 1,518,600 | | | | 1,739,720 | | | | 33,871 | | | | — | |
Columbia Greater China Fund, Class Z | | | 807,295 | | | | — | | | | 770,694 | | | | — | | | | — | |
| | | | | | | | | | | | | | | | | | | | |
Total | | $ | 2,591,337 | | | $ | 2,268,600 | | | $ | 3,044,014 | | | $ | 57,413 | | | $ | 2,079,106 | |
| | | | | | | | | | | | | | | | | | | | |
(c) Cost for federal income tax purposes is $39,930,315.
Generally accepted accounting principles (GAAP) require disclosure regarding the inputs and valuation techniques used to measure fair value and any changes in valuation inputs or techniques. In addition, investments shall be disclosed by major category.
The Fund categorizes its fair value measurements according to a three-level hierarchy that maximizes the use of observable inputs and minimizes the use of unobservable inputs by prioritizing that the most observable input be used when available. Observable inputs are those that market participants would use in pricing an investment based on market data obtained from sources independent of the reporting entity. Unobservable inputs are those that reflect the Fund’s assumptions about the information market participants would use in pricing an investment. An investment’s level within the fair value hierarchy is based on the lowest level of any input that is deemed significant to the asset or liability’s fair value measurement. The input levels are not necessarily an indication of the risk or liquidity associated with investments at that level. For example, certain U.S. government securities are generally high quality and liquid, however, they are reflected as Level 2 because the inputs used to determine fair value may not always be quoted prices in an active market.
See Accompanying Notes to Financial Statements.
10
Columbia World Equity Fund
March 31, 2011
Fair value inputs are summarized in the three broad levels listed below:
| • | | Level 1 — Valuations based on quoted prices for investments in active markets that the Fund has the ability to access at the measurement date (including NAV for open-end mutual funds). Valuation adjustments are not applied to Level 1 investments. |
| • | | Level 2 — Valuations based on other significant observable inputs (including quoted prices for similar securities, interest rates, prepayment speeds, credit risks, etc.). |
| • | | Level 3 — Valuations based on significant unobservable inputs (including the Fund’s own assumptions and judgment in determining the fair value of investments). |
Inputs that are used in determining fair value of an investment may include price information, credit data, volatility statistics, and other factors. These inputs can be either observable or unobservable. The availability of observable inputs can vary between investments, and is affected by various factors such as the type of investment, and the volume and level of activity for that investment or similar investments in the marketplace. The inputs will be considered by the Investment Manager, along with any other relevant factors in the calculation of an investment’s fair value. The Fund uses prices and inputs that are current as of the measurement date, which may include periods of market dislocations. During these periods, the availability of prices and inputs may be reduced for many investments. This condition could cause an investment to be reclassified between the various levels within the hierarchy. Non-U.S. equity securities actively traded in foreign markets may be reflected in Level 2 despite the availability of closing prices, because the Fund evaluates and determines whether those closing prices reflect fair value at the close of the New York Stock Exchange (NYSE) or require adjustment, as described in Note 2 to the financial statements — Security Valuation.
Investments falling into the Level 3 category are primarily supported by quoted prices from brokers and dealers participating in the market for those investments. However, these may be classified as Level 3 investments due to lack of market transparency and corroboration to support these quoted prices. Additionally, valuation models may be used as the pricing source for any remaining investments classified as Level 3. These models rely on one or more significant unobservable inputs and/or significant assumptions by the Investment Manager. Inputs used in valuations may include, but are not limited to, financial statement analysis, capital account balances, discount rates and estimated cash flows, and comparable company data.
The following table is a summary of the inputs used to value the Fund’s investments as of March 31, 2011:
| | | | | | | | | | | | | | | | |
Description | | Quoted
Prices
(Level 1) | | | Other
Significant
Observable
Inputs
(Level 2) | | | Significant
Unobservable
Inputs
(Level 3) | | | Total | |
Common Stocks | | | | | | | | | | | | | | | | |
Consumer Discretionary | | $ | 3,466,647 | | | $ | 2,956,267 | | | $ | — | | | $ | 6,422,914 | |
Consumer Staples | | | 1,039,290 | | | | 387,858 | | | | — | | | | 1,427,148 | |
Energy | | | 4,134,036 | | | | 2,154,364 | | | | — | | | | 6,288,400 | |
Financials | | | 2,767,837 | | | | 3,842,049 | | | | — | | | | 6,609,886 | |
Health Care | | | 4,596,258 | | | | 2,470,768 | | | | — | | | | 7,067,026 | |
Industrials | | | 3,830,592 | | | | 1,517,231 | | | | — | | | | 5,347,823 | |
Information Technology | | | 6,964,102 | | | | 1,508,138 | | | | — | | | | 8,472,240 | |
Materials | | | 2,759,910 | | | | 1,322,283 | | | | — | | | | 4,082,193 | |
Telecommunication Services | | | 2,188,472 | | | | 1,172,522 | | | | — | | | | 3,360,994 | |
Utilities | | | 574,980 | | | | 881,798 | | | | — | | | | 1,456,778 | |
| | | | | | | | | | | | | | | | |
Total Common Stocks | | | 32,322,124 | | | | 18,213,278 | | | | — | | | | 50,535,402 | |
| | | | | | | | | | | | | | | | |
Total Preferred Stock | | | — | | | | 475,805 | | | | — | | | | 475,805 | |
| | | | | | | | | | | | | | | | |
Total Investment Company | | | 2,079,106 | | | | — | | | | — | | | | 2,079,106 | |
| | | | | | | | | | | | | | | | |
Total Short-Term Obligation | | | — | | | | 269,000 | | | | — | | | | 269,000 | |
| | | | | | | | | | | | | | | | |
Total Investments | | | 34,401,230 | | | | 18,958,083 | | | | — | | | | 53,359,313 | |
| | | | | | | | | | | | | | | | |
Unrealized Appreciation on Forward Foreign Currency Exchange Contracts | | | — | | | | 274,725 | | | | — | | | | 274,725 | |
| | | | | | | | | | | | | | | | |
Unrealized Depreciation on Forward Foreign Currency Exchange Contracts | | | — | | | | (148,735 | ) | | | — | | | | (148,735 | ) |
| | | | | | | | | | | | | | | | |
Total | | $ | 34,401,230 | | | $ | 19,084,073 | | | $ | — | | | $ | 53,485,303 | |
| | | | | | | | | | | | | | | | |
The Fund’s assets assigned to the Level 2 input category are generally valued using the market approach, in which a security’s value is determined through its correlation to prices and information from market transactions for similar or identical assets. These assets include certain foreign securities for which a third party statistical pricing service may be employed for purposes of fair market valuation. The models utilized by the third party statistical pricing service take into account a security’s correlation to available market data including, but not limited to, intraday index, ADR, and ETF movements.
Certain short-term obligations may be valued using amortized cost, an income approach which converts future cash flows to a present value based upon the premium or discount at purchase.
There were no significant transfers of financial assets between Levels 1 and 2 during the period.
See Accompanying Notes to Financial Statements.
11
Columbia World Equity Fund
March 31, 2011
Forward foreign currency exchange contracts outstanding on March 31, 2011 are:
Foreign Exchange Rate Risk
| | | | | | | | | | | | | | | | | | | | |
Counterparty | | Forward
Foreign
Currency
Exchange
Contracts
to Buy | | | Value | | | Aggregate
Face
Value | | | Settlement
Date | | | Unrealized
Appreciation
(Depreciation) | |
Morgan Stanley Capital Services, Inc. | | | AUD | | | $ | 1,735,664 | | | $ | 1,684,851 | | | | 04/28/11 | | | $ | 50,813 | |
Morgan Stanley Capital Services, Inc. | | | CAD | | | | 2,117,400 | | | | 2,073,478 | | | | 04/28/11 | | | | 43,922 | |
Morgan Stanley Capital Services, Inc. | | | CHF | | | | 751,336 | | | | 750,128 | | | | 04/28/11 | | | | 1,208 | |
Morgan Stanley Capital Services, Inc. | | | EUR | | | | 3,624,996 | | | | 3,489,868 | | | | 04/28/11 | | | | 135,128 | |
Morgan Stanley Capital Services, Inc. | | | GBP | | | | 2,333,493 | | | | 2,349,838 | | | | 04/28/11 | | | | (16,345 | ) |
Morgan Stanley Capital Services, Inc. | | | JPY | | | | 2,365,831 | | | | 2,399,601 | | | | 04/28/11 | | | | (33,770 | ) |
Morgan Stanley Capital Services, Inc. | | | KRW | | | | 528,240 | | | | 528,692 | | | | 04/28/11 | | | | (452 | ) |
Morgan Stanley Capital Services, Inc. | | | NOK | | | | 212,204 | | | | 212,318 | | | | 04/28/11 | | | | (114 | ) |
| | | | | | | | | | | | | | | | | | | | |
| | | | | | | | | | | | | | | | | | $ | 180,390 | |
| | | | | | | | | | | | | | | | | | | | |
| | | | | |
Counterparty | | Forward
Foreign
Currency
Exchange
Contracts
to Sell | | | Value | | | Aggregate
Face
Value | | | Settlement
Date | | | Unrealized
Appreciation
(Depreciation) | |
Morgan Stanley Capital Services, Inc. | | | BRL | | | $ | 435,941 | | | $ | 419,109 | | | | 04/28/11 | | | $ | (16,832 | ) |
Morgan Stanley Capital Services, Inc. | | | DKK | | | | 863,360 | | | | 830,379 | | | | 04/28/11 | | | | (32,981 | ) |
Morgan Stanley Capital Services, Inc. | | | EUR | | | | 287,563 | | | | 279,857 | | | | 04/28/11 | | | | (7,706 | ) |
Morgan Stanley Capital Services, Inc. | | | GBP | | | | 1,129,058 | | | | 1,138,270 | | | | 04/28/11 | | | | 9,212 | |
Morgan Stanley Capital Services, Inc. | | | JPY | | | | 310,871 | | | | 328,654 | | | | 04/28/11 | | | | 17,783 | |
Morgan Stanley Capital Services, Inc. | | | KRW | | | | 1,697,727 | | | | 1,677,358 | | | | 04/28/11 | | | | (20,369 | ) |
Morgan Stanley Capital Services, Inc. | | | NOK | | | | 348,557 | | | | 334,448 | | | | 04/28/11 | | | | (14,109 | ) |
Morgan Stanley Capital Services, Inc. | | | SGD | | | | 565,667 | | | | 559,610 | | | | 04/28/11 | | | | (6,057 | ) |
Morgan Stanley Capital Services, Inc. | | | TWD | | | | 656,775 | | | | 673,434 | | | | 04/28/11 | | | | 16,659 | |
| | | | | | | | | | | | | | | | | | | | |
| | | | | | | | | | | | | | | | | | $ | (54,400 | ) |
| | | | | | | | | | | | | | | | | | | | |
For the year ended March 31, 2011, transactions in written option contracts were as follows:
| | | | | | | | |
| | | Number of
contracts | | | Premium
received | |
Options outstanding at March 31, 2010 | | | — | | | $ | — | |
Options written | | | 1,314 | | | | 54,098 | |
Options terminated in closing purchase transactions | | | (5 | ) | | | (3,010 | ) |
Options exercised | | | (564 | ) | | | (19,088 | ) |
Options expired | | | (745 | ) | | | (32,000 | ) |
| | | | | | | | |
Options outstanding at March 31, 2011 | | | — | | | $ | — | |
| | | | | | | | |
The Fund was invested in the following countries at March 31, 2011:
| | | | | | | | |
Summary of Securities
by Country | | Value | | | % of Total Investments | |
| | |
United States* | | $ | 31,560,568 | | | | 59.1 | |
United Kingdom | | | 4,096,288 | | | | 7.7 | |
Japan | | | 2,581,470 | | | | 4.8 | |
Germany | | | 1,939,843 | | | | 3.6 | |
Republic of Korea | | | 1,220,141 | | | | 2.3 | |
Switzerland | | | 1,145,861 | | | | 2.1 | |
China | | | 1,045,256 | | | | 2.0 | |
Brazil | | | 1,049,093 | | | | 2.0 | |
Singapore | | | 1,032,730 | | | | 1.9 | |
Denmark | | | 888,377 | | | | 1.7 | |
Canada | | | 909,104 | | | | 1.7 | |
Spain | | | 839,659 | | | | 1.6 | |
Finland | | | 830,924 | | | | 1.6 | |
Sweden | | | 808,935 | | | | 1.5 | |
Ireland | | | 667,886 | | | | 1.2 | |
France | | | 514,441 | | | | 1.0 | |
Australia | | | 508,599 | | | | 1.0 | |
Netherlands | | | 483,578 | | | | 0.9 | |
Taiwan | | | 405,811 | | | | 0.8 | |
Norway | | | 442,891 | | | | 0.8 | |
Hong Kong | | | 387,858 | | | | 0.7 | |
| | | | | | | | |
| | $ | 53,359,313 | | | | 100.0 | |
| | | | | | | | |
* Includes short-term obligation and investment company.
Certain securities are listed by country of underlying exposure but may trade predominantly on another exchange.
| | |
Acronym | | Name |
| ADR | | American Depositary Receipt |
| AUD | | Australian Dollar |
| BRL | | Brazilian Real |
| CAD | | Canadian Dollar |
| CHF | | Swiss Franc |
| DKK | | Danish Krone |
| EUR | | Euro |
| GBP | | Pound Sterling |
| JPY | | Japanese Yen |
| KRW | | South Korean Won |
| NOK | | Norwegian Krone |
| SGD | | Singapore Dollar |
| TWD | | New Taiwan Dollar |
See Accompanying Notes to Financial Statements.
12
Statement of Assets and Liabilities – Columbia World Equity Fund
March 31, 2011
| | | | | | |
| | | | | ($) | |
| Assets | | Unaffiliated investments, at cost | | | 38,521,203 | |
| | Affiliated investments, at cost | | | 1,340,905 | |
| | | | | | |
| | Total investments, at cost | | | 39,862,108 | |
| | |
| | Unaffiliated investments, at value | | | 51,280,207 | |
| | Affiliated investments, at value | | | 2,079,106 | |
| | | | | | |
| | Total investments, at value | | | 53,359,313 | |
| | Cash | | | 19 | |
| | Foreign currency (cost of $213,398) | | | 213,771 | |
| | Unrealized appreciation on forward foreign currency exchange contracts | | | 274,725 | |
| | Receivable for: | | | | |
| | Investments sold | | | 531,487 | |
| | Fund shares sold | | | 2,092 | |
| | Dividends | | | 129,497 | |
| | Foreign tax reclaims | | | 18,039 | |
| | |
| | Expense reimbursement due from Investment Manager | | | 9,769 | |
| | Trustees’ deferred compensation plan | | | 32,544 | |
| | Prepaid expenses | | | 83 | |
| | | | | | |
| | Total Assets | | | 54,571,339 | |
| | |
| Liabilities | | Unrealized depreciation on forward foreign currency exchange contracts | | | 148,735 | |
| | Payable for: | | | | |
| | Investments purchased | | | 531,258 | |
| | Fund shares repurchased | | | 22,941 | |
| | Investment advisory fee | | | 17,287 | |
| | Administration fee | | | 10,832 | |
| | Pricing and bookkeeping fees | | | 5,773 | |
| | Transfer agent fee | | | 11,169 | |
| | Trustees’ fees | | | 31 | |
| | Audit fee | | | 30,850 | |
| | Custody fee | | | 4,201 | |
| | Distribution and service fees | | | 12,491 | |
| | Reports to shareholders | | | 11,776 | |
| | Chief compliance officer expenses | | | 209 | |
| | Interest expense | | | 267 | |
| | Trustees’ deferred compensation plan | | | 32,544 | |
| | Merger costs | | | 6,774 | |
| | Other liabilities | | | 4,739 | |
| | | | | | |
| | Total Liabilities | | | 851,877 | |
| | |
| | | | | | |
| | Net Assets | | | 53,719,462 | |
| | |
| Net Assets Consist of | | Paid-in capital | | | 53,834,943 | |
| | Undistributed net investment income | | | 13,862 | |
| | Accumulated net realized loss | | | (13,755,385 | ) |
| | Net unrealized appreciation (depreciation) on: | | | | |
| | Investments | | | 13,497,205 | |
| | Foreign currency translations | | | 128,837 | |
| | | | | | |
| | Net Assets | | | 53,719,462 | |
See Accompanying Notes to Financial Statements.
13
Statement of Assets and Liabilities (continued) – Columbia World Equity Fund
March 31, 2011
| | | | | | |
| | | | | | |
| Class A | | Net assets | | $ | 52,197,330 | |
| | Shares outstanding | | | 4,046,770 | |
| | Net asset value per share | | $ | 12.90 | (a) |
| | Maximum sales charge | | | 5.75 | % |
| | Maximum offering price per share ($12.90/0.9425) | | $ | 13.69 | (b) |
| | |
| Class B | | Net assets | | $ | 659,749 | |
| | Shares outstanding | | | 54,072 | |
| | Net asset value and offering price per share | | $ | 12.20 | (a) |
| | |
| Class C | | Net assets | | $ | 862,383 | |
| | Shares outstanding | | | 70,797 | |
| | Net asset value and offering price per share | | $ | 12.18 | (a) |
| (a) | Redemption price per share is equal to net asset value less any applicable contingent deferred sales charge. |
| (b) | On sales of $50,000 or more the offering price is reduced. |
See Accompanying Notes to Financial Statements.
14
Statement of Operations – Columbia World Equity Fund
For the Year Ended March 31, 2011
| | | | | | |
| | | | | ($) | |
| Investment Income | | Dividends | | | 1,185,923 | |
| | Dividends from affiliates | | | 57,413 | |
| | Interest | | | 4,308 | |
| | Foreign taxes withheld | | | (58,523 | ) |
| | | | | | |
| | Total Investment Income | | | 1,189,121 | |
| | |
| Expenses | | Investment advisory fee | | | 212,846 | |
| | Administration fee | | | 133,029 | |
| | Distribution fee: | | | | |
| | Class B | | | 5,583 | |
| | Class C | | | 6,074 | |
| | Service fee: | | | | |
| | Class A | | | 129,040 | |
| | Class B | | | 1,861 | |
| | Class C | | | 2,025 | |
| | Transfer agent fee | | | 119,877 | |
| | Pricing and bookkeeping fees | | | 58,294 | |
| | Trustees’ fees | | | 16,761 | |
| | Custody fee | | | 24,260 | |
| | Reports to shareholders | | | 61,262 | |
| | Chief compliance officer expenses | | | 1,023 | |
| | Merger costs | | | 21,880 | |
| | Other expenses | | | 99,518 | |
| | | | | | |
| | Expenses before interest expense | | | 893,333 | |
| | Interest expense | | | 267 | |
| | | | | | |
| | Total Expenses | | | 893,600 | |
| | |
| | Fees waived or expenses reimbursed by Investment Manager | | | (115,066 | ) |
| | Expense reductions | | | (6 | ) |
| | | | | | |
| | Net Expenses | | | 778,528 | |
| | |
| | | | | | |
| | Net Investment Income | | | 410,593 | |
| | |
| Net Realized and Unrealized Gain (Loss) on Investments, Capital Gains Distributions Received, Foreign Currency and Written Options | | Net realized gain on: | | | | |
| | Investments | | | 1,577,642 | |
| | Affiliated investments | | | 372,322 | |
| | Capital gains distributions received from affiliated investments | | | 301,508 | |
| | Foreign currency transactions and forward foreign currency exchange contracts | | | 212,601 | |
| | Written options | | | 34,460 | |
| | | | | | |
| | Net realized gain | | | 2,498,533 | |
| | |
| | Net change in unrealized appreciation (depreciation) on: | | | | |
| | Investments | | | 4,531,146 | |
| | Foreign currency translations and forward foreign currency exchange contracts | | | 257,797 | |
| | | | | | |
| | Net change in unrealized appreciation (depreciation) | | | 4,788,943 | |
| | | | | | |
| | Net Gain | | | 7,287,476 | |
| | |
| | | | | | |
| | Net Increase Resulting from Operations | | | 7,698,069 | |
See Accompanying Notes to Financial Statements.
15
Statement of Changes in Net Assets – Columbia World Equity Fund
| | | | | | | | | | |
| | | | | Year Ended March 31, | |
| Increase (Decrease) in Net Assets | | | | 2011 ($) | | | 2010 ($) | |
| Operations | | Net investment income | | | 410,593 | | | | 226,808 | |
| | Net realized gain (loss) on investments, capital gains distributions received from affiliated investments, foreign currency transactions, forward foreign currency exchange contracts and written options | | | 2,498,533 | | | | (460,291 | ) |
| | Net change in unrealized appreciation (depreciation) on investments, foreign currency translations, forward foreign currency exchange contracts and written options | | | 4,788,943 | | | | 19,796,222 | |
| | | | | | | | | | |
| | Net increase resulting from operations | | | 7,698,069 | | | | 19,562,739 | |
| | | |
| Distributions to Shareholders | | From net investment income: | | | | | | | | |
| | Class A | | | (250,394 | ) | | | (1,016,070 | ) |
| | Class B | | | — | | | | (14,307 | ) |
| | Class C | | | — | | | | (10,909 | ) |
| | | | | | | | | | |
| | Total distributions to shareholders | | | (250,394 | ) | | | (1,041,286 | ) |
| | | |
| | Net Capital Stock Transactions | | | (6,641,099 | ) | | | (3,984,478 | ) |
| | | |
| | Redemption fees | | | — | | | | 723 | |
| | | |
| | Increase from regulatory settlements | | | — | | | | 81,783 | |
| | | | | | | | | | |
| | Total increase in net assets | | | 806,576 | | | | 14,619,481 | |
| | | |
| Net Assets | | Beginning of period | | | 52,912,886 | | | | 38,293,405 | |
| | End of period | | | 53,719,462 | | | | 52,912,886 | |
| | Undistributed (overdistributed) net investment income at end of period | | | 13,862 | | | | (358,938 | ) |
See Accompanying Notes to Financial Statements.
16
Statement of Changes in Net Assets (continued) – Columbia World Equity Fund
| | | | | | | | | | | | | | | | |
| | | Capital Stock Activity | |
| | | Year Ended
March 31, 2011 | | | Year Ended
March 31, 2010 | |
| | | Shares | | | Dollars ($) | | | Shares | | | Dollars ($) | |
Class A | | | | | | | | | | | | | | | | |
Subscriptions | | | 366,866 | | | | 4,208,374 | | | | 119,814 | | | | 1,226,499 | |
Distributions reinvested | | | 17,744 | | | | 213,811 | | | | 90,419 | | | | 941,091 | |
Redemptions | | | (900,834 | ) | | | (10,553,441 | ) | | | (556,858 | ) | | | (5,636,645 | ) |
| | | | | | | | | | | | | | | | |
Net decrease | | | (516,224 | ) | | | (6,131,256 | ) | | | (346,625 | ) | | | (3,469,055 | ) |
| | | | |
Class B | | | | | | | | | | | | | | | | |
Subscriptions | | | 3,683 | | | | 41,636 | | | | 7,060 | | | | 70,882 | |
Distributions reinvested | | | — | | | | — | | | | 1,315 | | | | 13,337 | |
Redemptions | | | (39,598 | ) | | | (428,847 | ) | | | (69,600 | ) | | | (655,436 | ) |
| | | | | | | | | | | | | | | | |
Net decrease | | | (35,915 | ) | | | (387,211 | ) | | | (61,225 | ) | | | (571,217 | ) |
| | | | |
Class C | | | | | | | | | | | | | | | | |
Subscriptions | | | 13,651 | | | | 150,633 | | | | 15,213 | | | | 147,197 | |
Distributions reinvested | | | — | | | | — | | | | 919 | | | | 9,318 | |
Redemptions | | | (26,267 | ) | | | (273,265 | ) | | | (10,481 | ) | | | (100,721 | ) |
| | | | | | | | | | | | | | | | |
Net increase (decrease) | | | (12,616 | ) | | | (122,632 | ) | | | 5,651 | | | | 55,794 | |
See Accompanying Notes to Financial Statements.
17
Financial Highlights – Columbia World Equity Fund
Selected data for a share outstanding throughout each period is as follows:
| | | | | | | | | | | | | | | | | | | | |
| | | Year Ended March 31, | |
| Class A Shares | | 2011 | | | 2010 | | | 2009 | | | 2008 | | | 2007 | |
Net Asset Value, Beginning of Period | | $ | 11.19 | | | $ | 7.47 | | | $ | 13.16 | | | $ | 15.48 | | | $ | 14.14 | |
| | | | | |
Income from Investment Operations: | | | | | | | | | | | | | | | | | | | | |
Net investment income (a) | | | 0.09 | | | | 0.05 | | | | 0.10 | | | | 0.14 | | | | 0.12 | |
Net realized and unrealized gain (loss) on capital gain distributions received from affiliated investments, investments, foreign currency and written options | | | 1.68 | | | | 3.87 | | | | (5.69 | ) | | | (0.81 | ) | | | 1.97 | |
| | | | | | | | | | | | | | | | | | | | |
Total from investment operations | | | 1.77 | | | | 3.92 | | | | (5.59 | ) | | | (0.67 | ) | | | 2.09 | |
| | | | | |
Less Distributions to Shareholders: | | | | | | | | | | | | | | | | | | | | |
From net investment income | | | (0.06 | ) | | | (0.22 | ) | | | — | | | | (0.22 | ) | | | (0.18 | ) |
From net realized gains | | | — | | | | — | | | | (0.11 | ) | | | (1.43 | ) | | | (0.57 | ) |
| | | | | | | | | | | | | | | | | | | | |
Total distributions to shareholders | | | (0.06 | ) | | | (0.22 | ) | | | (0.11 | ) | | | (1.65 | ) | | | (0.75 | ) |
| | | | | |
Redemption Fees: | | | | | | | | | | | | | | | | | | | | |
Redemption fees added to paid-in-capital | | | — | | | | — | (b) | | | — | (b) | | | — | (b) | | | — | (b) |
| | | | | |
Increase from regulatory settlements | | | — | | | | 0.02 | | | | 0.01 | | | | — | | | | — | |
| | | | | |
Net Asset Value, End of Period | | $ | 12.90 | | | $ | 11.19 | | | $ | 7.47 | | | $ | 13.16 | | | $ | 15.48 | |
Total return (c) | | | 15.82 | %(d) | | | 52.96 | %(d) | | | (42.79 | )%(d) | | | (5.47 | )%(e) | | | 15.11 | % |
| | | | | |
Ratios to Average Net Assets/Supplemental Data: | | | | | | | | | | | | | | | | | | | | |
Net expenses before interest expense | | | 1.44 | %(f) | | | 1.40 | %(f) | | | 1.58 | %(g) | | | 1.40 | %(f) | | | 1.47 | %(f) |
Interest expense | | | — | %(h) | | | — | | | | — | | | | — | | | | — | |
Net expenses | | | 1.44 | %(f) | | | 1.40 | %(f) | | | 1.58 | %(g) | | | 1.40 | %(f) | | | 1.47 | %(f) |
Waiver/Reimbursement | | | 0.22 | % | | | 0.36 | % | | | 0.06 | % | | | — | | | | — | |
Net investment income | | | 0.79 | %(f) | | | 0.49 | %(f) | | | 0.91 | %(g) | | | 0.94 | %(f) | | | 0.80 | %(f) |
Portfolio turnover rate | | | 75 | % | | | 90 | % | | | 154 | % | | | 69 | % | | | 85 | % |
Net assets, end of period (000s) | | $ | 52,197 | | | $ | 51,073 | | | $ | 36,672 | | | $ | 74,106 | | | $ | 86,237 | |
| (a) | Per share data was calculated using the average shares outstanding during the period. |
| (b) | Rounds to less than $0.01 per share. |
| (c) | Total return at net asset value assuming all distributions reinvested and no initial sales charge or contingent deferred sales charge. |
| (d) | Had the Investment Manager and/or any of its affiliates not waived fees or reimbursed a portion of expenses, total return would have been reduced. |
| (e) | Total return includes a voluntary reimbursement by the Investment Manager for a realized investment loss due to a trading error. This reimbursement had an impact of less than 0.01% on total return. |
| (f) | The benefits derived from expense reductions had an impact of less than 0.01%. |
| (g) | The benefits derived from expense reductions had an impact of 0.02%. |
| (h) | Rounds to less than 0.01%. |
See Accompanying Notes to Financial Statements.
18
Financial Highlights – Columbia World Equity Fund
Selected data for a share outstanding throughout each period is as follows:
| | | | | | | | | | | | | | | | | | | | |
| | | Year Ended March 31, | |
| Class B Shares | | 2011 | | | 2010 | | | 2009 | | | 2008 | | | 2007 | |
Net Asset Value, Beginning of Period | | $ | 10.62 | | | $ | 7.08 | | | $ | 12.58 | | | $ | 14.86 | | | $ | 13.58 | |
| | | | | |
Income from Investment Operations: | | | | | | | | | | | | | | | | | | | | |
Net investment income (loss) (a) | | | 0.01 | | | | (0.02 | ) | | | 0.03 | | | | 0.03 | | | | 0.02 | |
Net realized and unrealized gain (loss) on capital gain distributions received from affiliated investments, investments, foreign currency and written options | | | 1.57 | | | | 3.67 | | | | (5.43 | ) | | | (0.77 | ) | | | 1.87 | |
| | | | | | | | | | | | | | | | | | | | |
Total from investment operations | | | 1.58 | | | | 3.65 | | | | (5.40 | ) | | | (0.74 | ) | | | 1.89 | |
| | | | | |
Less Distributions to Shareholders: | | | | | | | | | | | | | | | | | | | | |
From net investment income | | | — | | | | (0.13 | ) | | | — | | | | (0.11 | ) | | | (0.04 | ) |
From net realized gains | | | — | | | | — | | | | (0.11 | ) | | | (1.43 | ) | | | (0.57 | ) |
| | | | | | | | | | | | | | | | | | | | |
Total distributions to shareholders | | | — | | | | (0.13 | ) | | | (0.11 | ) | | | (1.54 | ) | | | (0.61 | ) |
| | | | | |
Redemption Fees: | | | | | | | | | | | | | | | | | | | | |
Redemption fees added to paid-in-capital | | | — | | | | — | (b) | | | — | (b) | | | — | (b) | | | — | (b) |
| | | | | |
Increase from regulatory settlements | | | — | | | | 0.02 | | | | 0.01 | | | | — | | | | — | |
| | | | | |
Net Asset Value, End of Period | | $ | 12.20 | | | $ | 10.62 | | | $ | 7.08 | | | $ | 12.58 | | | $ | 14.86 | |
Total return (c) | | | 14.88 | %(d) | | | 51.99 | %(d) | | | (43.26 | )%(d) | | | (6.12 | )%(e) | | | 14.17 | % |
| | | | | |
Ratios to Average Net Assets/Supplemental Data: | | | | | | | | | | | | | | | | | | | | |
Net expenses before interest expense | | | 2.19 | %(f) | | | 2.15 | %(f) | | | 2.33 | %(g) | | | 2.15 | %(f) | | | 2.22 | %(f) |
Interest expense | | | — | %(h) | | | — | | | | — | | | | — | | | | — | |
Net expenses | | | 2.19 | %(f) | | | 2.15 | %(f) | | | 2.33 | %(g) | | | 2.15 | %(f) | | | 2.22 | %(f) |
Waiver/Reimbursement | | | 0.22 | % | | | 0.36 | % | | | 0.06 | % | | | — | | | | — | |
Net investment income (loss) | | | 0.07 | %(f) | | | (0.21 | )%(f) | | | 0.25 | %(g) | | | 0.23 | %(f) | | | 0.11 | %(f) |
Portfolio turnover rate | | | 75 | % | | | 90 | % | | | 154 | % | | | 69 | % | | | 85 | % |
Net assets, end of period (000s) | | $ | 660 | | | $ | 955 | | | $ | 1,071 | | | $ | 3,654 | | | $ | 8,445 | |
| (a) | Per share data was calculated using the average shares outstanding during the period. |
| (b) | Rounds to less than $0.01 per share. |
| (c) | Total return at net asset value assuming all distributions reinvested and no contingent deferred sales charge. |
| (d) | Had the Investment Manager and/or any of its affiliates not waived fees or reimbursed a portion of expenses, total return would have been reduced. |
| (e) | Total return includes a voluntary reimbursement by the Investment Manager for a realized investment loss due to a trading error. This reimbursement had an impact of less than 0.01% on total return. |
| (f) | The benefits derived from expense reductions had an impact of less than 0.01%. |
| (g) | The benefits derived from expense reductions had an impact of 0.02%. |
| (h) | Rounds to less than 0.01%. |
See Accompanying Notes to Financial Statements.
19
Financial Highlights – Columbia World Equity Fund
Selected data for a share outstanding throughout each period is as follows:
| | | | | | | | | | | | | | | | | | | | |
| | | Year Ended March 31, | |
| Class C Shares | | 2011 | | | 2010 | | | 2009 | | | 2008 | | | 2007 | |
Net Asset Value, Beginning of Period | | $ | 10.60 | | | $ | 7.07 | | | $ | 12.56 | | | $ | 14.84 | | | $ | 13.56 | |
| | | | | |
Income from Investment Operations: | | | | | | | | | | | | | | | | | | | | |
Net investment income (loss) (a) | | | 0.01 | | | | (0.03 | ) | | | 0.02 | | | | 0.03 | | | | — | (b) |
Net realized and unrealized gain (loss) on capital gain distributions received from affiliated investments, investments, foreign currency and written options | | | 1.57 | | | | 3.67 | | | | (5.41 | ) | | | (0.77 | ) | | | 1.89 | |
| | | | | | | | | | | | | | | | | | | | |
Total from investment operations | | | 1.58 | | | | 3.64 | | | | (5.39 | ) | | | (0.74 | ) | | | 1.89 | |
| | | | | |
Less Distributions to Shareholders: | | | | | | | | | | | | | | | | | | | | |
From net investment income | | | — | | | | (0.13 | ) | | | — | | | | (0.11 | ) | | | (0.04 | ) |
From net realized gains | | | — | | | | — | | | | (0.11 | ) | | | (1.43 | ) | | | (0.57 | ) |
| | | | | | | | | | | | | | | | | | | | |
Total distributions to shareholders | | | — | | | | (0.13 | ) | | | (0.11 | ) | | | (1.54 | ) | | | (0.61 | ) |
| | | | | |
Redemption Fees: | | | | | | | | | | | | | | | | | | | | |
Redemption fees added to paid-in-capital | | | — | | | | — | (b) | | | — | (b) | | | — | (b) | | | — | (b) |
| | | | | |
Increase from regulatory settlements | | | — | | | | 0.02 | | | | 0.01 | | | | — | | | | — | |
| | | | | |
Net Asset Value, End of Period | | $ | 12.18 | | | $ | 10.60 | | | $ | 7.07 | | | $ | 12.56 | | | $ | 14.84 | |
Total return (c) | | | 14.91 | %(d) | | | 51.92 | %(d) | | | (43.25 | )%(d) | | | (6.12 | )%(e) | | | 14.19 | % |
| | | | | |
Ratios to Average Net Assets/Supplemental Data: | | | | | | | | | | | | | | | | | | | | |
Net expenses before interest expense | | | 2.19 | %(f) | | | 2.15 | %(f) | | | 2.33 | %(g) | | | 2.15 | %(f) | | | 2.22 | %(f) |
Interest expense | | | — | %(h) | | | — | | | | — | | | | — | | | | — | |
Net expenses | | | 2.19 | %(f) | | | 2.15 | %(f) | | | 2.33 | %(g) | | | 2.15 | %(f) | | | 2.22 | %(f) |
Waiver/Reimbursement | | | 0.22 | % | | | 0.36 | % | | | 0.06 | % | | | — | | | | — | |
Net investment income (loss) | | | 0.08 | %(f) | | | (0.29 | )%(f) | | | 0.15 | %(g) | | | 0.21 | %(f) | | | 0.02 | %(f) |
Portfolio turnover rate | | | 75 | % | | | 90 | % | | | 154 | % | | | 69 | % | | | 85 | % |
Net assets, end of period (000s) | | $ | 862 | | | $ | 884 | | | $ | 550 | | | $ | 987 | | | $ | 1,144 | |
| (a) | Per share data was calculated using the average shares outstanding during the period. |
| (b) | Rounds to less than $0.01 per share. |
| (c) | Total return at net asset value assuming all distributions reinvested and no contingent deferred sales charge. |
| (d) | Had the Investment Manager and/or any of its affiliates not waived fees or reimbursed a portion of expenses, total return would have been reduced. |
| (e) | Total return includes a voluntary reimbursement by the Investment Manager for a realized investment loss due to a trading error. This reimbursement had an impact of less than 0.01% on total return. |
| (f) | The benefits derived from expense reductions had an impact of less than 0.01%. |
| (g) | The benefits derived from expense reductions had an impact of 0.02%. |
| (h) | Rounds to less than 0.01%. |
See Accompanying Notes to Financial Statements.
20
Notes To Financial Statements – Columbia World Equity Fund
March 31, 2011
Note 1. Organization
Columbia World Equity Fund (the Fund), a series of Columbia Funds Series Trust I (the Trust), is a diversified fund. The Trust is registered under the Investment Company Act of 1940, as amended (the 1940 Act), as an open-end management investment company organized as a Massachusetts business trust.
After the close of business on April 30, 2010, Ameriprise Financial, Inc. (Ameriprise Financial) acquired a portion of the asset management business of Columbia Management Group, LLC (the Transaction), including the business of managing the Fund. In connection with the closing of the Transaction (the Closing), RiverSource Investments, LLC, a wholly owned subsidiary of Ameriprise Financial, became the investment manager of the Fund and changed its name to Columbia Management Investment Advisers, LLC (the Investment Manager).
Investment Objective
The Fund seeks long-term capital appreciation.
Fund Shares
The Trust has unlimited authorized shares of beneficial interest. The Fund offers Class A, Class B and Class C shares. All share classes have identical voting, dividend and liquidation rights. Each share class has its own expense structure and sales charges, as applicable.
Class A shares are subject to a maximum front-end sales charge of 5.75% based on the initial investment amount. Class A shares purchased without an initial sales charge in accounts aggregating $1 million to $50 million at the time of purchase are subject to a 1.00% contingent deferred sales charge (CDSC) if the shares are sold within 18 months of purchase, charged as follows: 1.00% CDSC if redeemed within 12 months of purchase, and 0.50% CDSC if redeemed more than 12, but less than 18 months after purchase.
The Fund no longer accepts investments by new or existing investors in the Fund’s Class B shares, except in connection with the reinvestment of any dividend and/or capital gain distributions in Class B shares of the Fund and exchanges by existing Class B shareholders of other funds within the Columbia Family of Funds. Class B shares are subject to a maximum CDSC of 5.00% based upon the holding period after purchase. Class B shares will generally convert to Class A shares eight years after purchase.
Class C shares are subject to a 1.00% CDSC on shares redeemed within one year of purchase.
Note 2. Summary of Significant Accounting Policies
The preparation of financial statements in accordance with U.S. generally accepted accounting principles (GAAP) requires management to make certain estimates and assumptions that affect the reported amounts of assets and liabilities, the disclosure of contingent assets and liabilities at the date of the financial statements and the reported amounts of revenue and expenses during the reporting period. Actual results could differ from those estimates.
The following is a summary of significant accounting policies consistently followed by the Fund in the preparation of its financial statements.
Security Valuation
Equity securities and securities of certain investment companies are valued at the last sale price on the principal exchange on which they trade, except for securities traded on the NASDAQ, which are valued at the NASDAQ official close price. Unlisted securities or listed securities for which there were no sales during the day are valued at the closing bid price on such exchanges or over-the-counter markets.
Short-term investments maturing in 60 days or less are valued at amortized cost, which approximates market value.
Investments in other open-end investment companies are valued at net asset value.
Written options are valued at the last reported sale price, or in the absence of a sale, at the last quoted ask price.
Forward foreign currency exchange contracts are valued at the prevailing forward exchange rate of the underlying currencies.
Foreign securities are generally valued at the last sale price on the foreign exchange or market on which they trade. If any foreign share prices are not readily available as a result of limited share activity, the securities are valued at the last sale price of the local shares in the principal market in which such securities are normally traded.
Generally, trading in foreign securities is substantially completed each day at various times prior to the close of the New York Stock Exchange (NYSE). The values of such securities used in computing the net asset value of the Fund’s shares are determined as of such times. Foreign currency exchange rates are generally determined at 4:00 p.m. Eastern (U.S.) time. Occasionally, events affecting the values of such foreign securities and such exchange rates may occur between the times at which they are determined and the close of the
21
Columbia World Equity Fund
March 31, 2011
customary trading session of the NYSE, which would not be reflected in the computation of the Fund’s net asset value. If events materially affecting the values of such foreign securities occur and it is determined that market quotations are not reliable, then these foreign securities will be valued at their fair value using procedures approved by the Board of Trustees.
The Fund may use a systematic fair valuation model provided by an independent third party to value securities principally traded in foreign markets. The third party pricing service takes into account multiple factors, including, but not limited to, movements in the U.S. securities markets, certain depositary receipts, futures contracts and foreign exchange rates that have occurred subsequent to the close of the foreign exchange, to determine a good faith estimate that reasonably reflects the current market conditions as of the close of the NYSE. The fair value of a security is likely to be different from the quoted or published price, if available.
Investments for which market quotations are not readily available, or that have quotations which management believes are not reliable, are valued at fair value as determined in good faith under consistently applied procedures established by and under the general supervision of the Board of Trustees. If a security is valued at fair value, such value is likely to be different from the last quoted market price for the security. The determination of fair value often requires significant judgment. To determine fair value, management may use assumptions including but not limited to future cash flows and estimated risk premiums. Multiple inputs from various sources may be used to determine value.
Foreign Currency Transactions and Translations
The values of all assets and liabilities quoted in foreign currencies are translated into U.S. dollars at that day’s exchange rates. Net realized and unrealized gains (losses) on foreign currency transactions and translations include gains (losses) arising from the fluctuation in exchange rates between trade and settlement dates on securities transactions, gains (losses) arising from the disposition of foreign currency and currency gains (losses) between the accrual and payment dates on dividends, interest income and foreign withholding taxes.
For financial statement purposes, the Fund does not distinguish that portion of gains (losses) on investments which is due to changes in foreign exchange rates from that which is due to changes in market prices of the investments. Such fluctuations are included with the net realized and unrealized gains (losses) on investments on the Statement of Operations.
Derivative Instruments
The Fund may use derivative instruments including written options and forward foreign currency exchange contracts in order to meet its investment objectives. The Fund employs strategies in differing combinations to permit it to increase, decrease or change the level of exposure to market risk factors. The achievement of any strategy relating to derivatives depends on an analysis of various risk factors, and if the strategies for the use of derivatives do not work as intended, the Fund may not achieve its investment objectives.
In pursuit of its investment objectives, the Fund is exposed to the following market risks among others:
Equity Risk: Equity risk relates to change in value of equity securities such as common stocks due to general market conditions such as real or perceived adverse economic conditions, changes in the general outlook for corporate earnings, or adverse investor sentiment. Equity securities generally have greater price volatility than fixed income securities.
Foreign Exchange Rate Risk: Foreign exchange rate risk relates to the change in the U.S. dollar value of a security held that is denominated in a foreign currency. The U.S. dollar value of a foreign-currency-denominated security will decrease as the dollar appreciates against the currency, while the U.S. dollar value will increase as the dollar depreciates against the currency.
The following notes provide more detailed information about each derivative type held by the Fund:
Forward Foreign Currency Exchange Contracts — The Fund entered into forward foreign currency exchange contracts to shift its investment exposure from one currency to another.
Forward foreign currency exchange contracts are agreements to exchange one currency for another at a future date at a specified price. These contracts are used to minimize the exposure to foreign exchange rate fluctuations during the period between the trade and settlement dates of the contract. Contracts to buy generally are used to acquire exposure to foreign currencies, while contracts to sell are generally used to reduce the exposure to foreign exchange rate fluctuations. Forward foreign currency exchange contracts are valued daily at the current exchange rate of the underlying currency, resulting in unrealized gains (losses) which become realized at the time the forward foreign currency exchange contracts are closed or mature. Realized and unrealized gains (losses) arising from such transactions are included in net realized and unrealized gains (losses) on foreign currency transactions. The use of forward foreign currency exchange contracts does not eliminate fluctuations in the
22
Columbia World Equity Fund
March 31, 2011
prices of the Fund’s portfolio securities. While the maximum potential loss from such contracts is the aggregate face value in U.S. dollars at the time the contract was opened, exposure is typically limited to the change in value of the contract (in U.S. dollars) over the period it remains open. The Fund could also be exposed to risk that counterparties of the contracts may be unable to fulfill the terms of the contracts.
During the year ended March 31, 2011, the Fund entered into 210 forward foreign currency exchange contracts.
Options — The Fund had written covered call options to decrease the Fund’s exposure to equity risk and to increase return on instruments. Written covered call options become more valuable as the price of the underlying instruments depreciates relative to the strike price.
Writing put options tends to increase the Fund’s exposure to the underlying instrument. When the Fund writes a call or put option, an amount equal to the premium received is recorded as a liability and subsequently marked-to-market to reflect the current value of the option written. Premiums received from writing options which expire are treated as realized gains. Premiums received from writing options which are exercised or closed are added to the proceeds or offset against the amounts paid on the underlying security transaction to determine the realized gain or loss. The Fund, as a writer of an option, has no control over whether the underlying security may be sold (call) or purchased (put) and as a result bears the market risk of an unfavorable change in the price of the security underlying the written option. There is the risk that the Fund may not be able to enter into a closing transaction because of an illiquid market. The Fund identifies within its portfolio of investments cash or liquid portfolio securities equal to the amount of the written options contract commitment.
The Fund may also purchase put and call options. Purchasing call options tends to increase the Fund’s exposure to the underlying instrument. Purchasing put options tends to decrease the Fund’s exposure to the underlying instrument. The Fund may pay a premium, which is included in the Fund’s Statement of Assets and Liabilities as an investment and subsequently marked-to-market to reflect the current value of the option. The risk associated with purchasing put and call options is limited to the premium paid. Premiums paid for purchasing options which expire are treated as realized losses. Premiums paid for purchasing options which are exercised are added to the amounts paid (call) or offset against the proceeds (put) on the underlying security to determine the realized gain or loss. If the Fund enters into a closing transaction, the Fund will realize a gain or loss, depending on whether the proceeds from the closing transaction are greater or less than the cost of the option.
During the year ended March 31, 2011, the Fund entered into 1,314 written options contracts.
Effects of Derivative Transactions in the Financial Statements
The following table is a summary of the value of the Fund’s derivative instruments as of March 31, 2011:
| | | | | | |
| Fair Value of Derivative Instruments |
| Statement of Assets and Liabilities |
| Asset | | Fair Value | | Liability | | Fair Value |
Unrealized
Appreciation
on Forward
Foreign
Currency
Exchange
Contracts | | $274,725 | | Unrealized
Depreciation
on Forward
Foreign
Currency
Exchange
Contracts | | $148,735 |
The effect of derivative instruments on the Fund’s Statement of Operations for the year ended March 31, 2011:
| | | | | | | | | | |
| | | | | | | | | |
| | | Amount of Realized Gain or (Loss) and
Change in Unrealized Appreciation
(Depreciation) on Derivatives | |
| | | Risk
Exposure | | Net
Realized
Gain
(Loss) | | | Change
in Unrealized
Appreciation
(Depreciation) | |
| Forward Foreign Currency Exchange Contracts | | Foreign
Exchange
Rate Risk | | $ | 221,123 | | | $ | 255,570 | |
| Written Options | | Equity
Risk | | | 34,460 | | | | — | |
Repurchase Agreements
The Fund may engage in repurchase agreement transactions with institutions that the Investment Manager has determined are creditworthy. The Fund, through the custodian, receives delivery of the underlying securities collateralizing a repurchase agreement. The Investment Manager is responsible for determining that the collateral is at least equal, at all times, to the value of the repurchase obligation including interest. A repurchase agreement transaction involves certain risks in the event of default or insolvency of the counterparty. These risks include possible delays in or restrictions on the Fund’s
23
Columbia World Equity Fund
March 31, 2011
ability to dispose of the underlying securities and a possible decline in the value of the underlying securities during the period while the Fund seeks to assert its rights.
Security Transactions
Security transactions are accounted for on the trade date. Cost is determined and gains (losses) are based upon the specific identification method for both financial statement and federal income tax purposes.
Income Recognition
Interest income is recorded on the accrual basis.
Corporate actions and dividend income are recorded net of any non-reclaimable tax withholdings, on the ex-dividend date or upon receipt of ex-dividend notification in the case of certain foreign securities.
Expenses
General expenses of the Trust are allocated to the Fund and other series of the Trust based upon relative net assets or other expense allocation methodologies determined by the nature of the expense. Expenses directly attributable to a specific class of shares are charged to that share class. Expenses directly attributable to the Fund are charged to the Fund.
Determination of Class Net Asset Value
All income, expenses (other than class-specific expenses which are charged directly to a share class, as shown in the Statement of Operations) and realized and unrealized gains (losses) are allocated to each class of the Fund on a daily basis, based on the relative net assets of each class, for purposes of determining the net asset value of each class.
Federal Income Tax Status
The Fund intends to qualify each year as a “regulated investment company” under Subchapter M of the Internal Revenue Code, as amended, and will distribute substantially all of its taxable income, if any, for its tax year, and as such will not be subject to federal income taxes. In addition, the Fund intends to distribute in each calendar year substantially all of its net investment income, capital gains and certain other amounts, if any, such that the Fund should not be subject to federal excise tax. Therefore, no federal income or excise tax provision is recorded.
Distributions to Shareholders
Distributions from net investment income, if any, are declared and paid semi-annually. Net realized capital gains, if any, are distributed at least annually. Income distributions and capital gain distributions are determined in accordance with federal income tax regulations which differ from GAAP.
Indemnifications
Under the Trust’s organizational documents and, in some cases, by contract, its officers and directors are indemnified against certain liabilities arising out of the performance of their duties to the Fund. In addition, certain of the Fund’s contracts with its service providers contain general indemnification clauses. The Fund’s maximum exposure under these arrangements is unknown since the amount of any future claims that may be made against the Fund cannot be determined and the Fund has no historical basis for predicting the likelihood of any such claims.
Note 3. Fees and Compensation Paid to Affiliates
Investment Management Fee
Under an Investment Management Services Agreement (IMSA), the Investment Manager determines which securities will be purchased, held or sold. The management fee is equal to a percentage of the Fund’s average daily net assets that declines from 0.40% to 0.35% as the Fund’s net assets increase.
The Investment Manager has voluntarily agreed to waive the investment management fee charged to the Fund on its assets that are invested in Columbia Convertible Securities Fund, Columbia Greater China Fund and Columbia Emerging Markets Fund. For the year ended March 31, 2011, investment management fees of $13,734 were waived for the Fund. The Investment Manager, in its discretion, may revise or discontinue this arrangement at any time.
Prior to the Closing, Columbia Management Advisors, LLC (Columbia), an indirect, wholly owned subsidiary of Bank of America Corporation (BOA), provided investment management services to the Fund under the same fee structure. For the year ended March 31, 2011, the annualized effective management fee rate, net of fee waivers, was 0.37% of the Fund’s average daily net assets.
Administration Fee
Effective upon the Closing, the Investment Manager provides administration and accounting services to the Fund under an
24
Columbia World Equity Fund
March 31, 2011
Administrative Services Agreement, including services previously performed under the Pricing and Bookkeeping Oversight and Services Agreement (the Services Agreement) as discussed in the Pricing and Bookkeeping Fees note below. The Fund pays an annual administration fee equal to 0.25% of the Fund’s average daily net assets. The Investment Manager has voluntarily agreed to waive the administration fee charged to the Fund on its assets that are invested in Columbia Convertible Securities Fund, Columbia Greater China Fund and Columbia Emerging Markets Fund. The Investment Manager, in its discretion, may revise or discontinue this arrangement at any time.
Prior to the Closing, Columbia provided administrative services to the Fund at the same fee rates. For the year ended March 31, 2011, administration fees of $8,555 were waived for the Fund and the annualized effective administration fee rate, net of fee waivers, was 0.23% of the Fund’s average daily net assets.
Pricing and Bookkeeping Fees
Prior to the Closing, the Fund entered into a Financial Reporting Services Agreement (the Financial Reporting Services Agreement) with State Street Bank and Trust Company (State Street) and Columbia pursuant to which State Street provides financial reporting services to the Fund. The Fund also entered into an Accounting Services Agreement (collectively with the Financial Reporting Services Agreement, the State Street Agreements) with State Street and Columbia pursuant to which State Street provides accounting services to the Fund. Upon the Closing, Columbia assigned and delegated its rights and obligations under the State Street Agreements to the Investment Manager. Under the State Street Agreements, the Fund pays State Street an annual fee of $38,000 paid monthly plus an additional monthly fee based on an annualized percentage rate of average daily net assets of the Fund for the month. The aggregate fee will not exceed $140,000 per year (exclusive of out-of-pocket expenses and charges). The Fund also reimburses State Street for certain out-of-pocket expenses and charges.
Also prior to the Closing, the Fund entered into the Services Agreement with Columbia. Under the Services Agreement, Columbia provided services related to Fund expenses and the requirements of the Sarbanes-Oxley Act of 2002, and provided oversight of the accounting and financial reporting services provided by State Street. Under the Services Agreement, the Fund reimbursed Columbia for out-of-pocket expenses and charges, including fees payable to third parties, such as for pricing the Fund’s portfolio securities, incurred by Columbia in the performance of services under the Services Agreement. The Services Agreement was terminated upon the Closing. These services are now provided under the Administrative Services Agreement discussed above.
Transfer Agent Fee
In connection with the Closing, RiverSource Service Corporation, a wholly owned subsidiary of Ameriprise Financial, provides transfer agency services to the Fund under a Transfer Agency Agreement and changed its name to Columbia Management Investment Services Corp. (the Transfer Agent). The Transfer Agent has contracted with Boston Financial Data Services (BFDS) to serve as sub-transfer agent.
The Transfer Agent receives monthly account-based service fees based on the number of open accounts and is reimbursed by the Fund for the fees and expenses the Transfer Agent pays to financial intermediaries that maintain omnibus accounts with the Fund that is a percentage of the average aggregate value of the Fund’s shares maintained in each such omnibus account (other than omnibus accounts for which American Enterprise Investment Services Inc. is the broker of record or accounts where the beneficial shareholder is a customer of Ameriprise Financial Services, Inc., which are paid a per account fee). The Transfer Agent pays the fees of BFDS for services as sub-transfer agent and, is not entitled to reimbursement for such fees from the Fund (with the exception of out-of pocket fees). The Transfer Agent also receives compensation from fees for various shareholder services and reimbursements for certain out-of- pocket expenses.
Prior to the Closing, Columbia Management Services, Inc., an affiliate of Columbia and an indirect, wholly owned subsidiary of BOA, provided transfer agency services to the Fund and contracted with BFDS to serve as sub-transfer agent, under the same fee structure.
For the year ended March 31, 2011, the Fund’s effective transfer agent fee rate for each class was 0.23% of the Fund’s average daily net assets.
An annual minimum account balance fee of $20 may apply to certain accounts with a value below the Fund’s initial minimum investment requirements to reduce the impact of small accounts on transfer agent fees. These minimum account balance fees are recorded as part of expense reductions on the Statement of Operations. For the year ended March 31, 2011, no minimum account balance fees were charged by the Fund.
25
Columbia World Equity Fund
March 31, 2011
Underwriting Discounts, Service and Distribution Fees
In connection with the Closing, RiverSource Fund Distributors, Inc., an indirect wholly owned subsidiary of Ameriprise Financial, provides distribution and shareholder services to the Fund and changed its name to Columbia Management Investment Distributors, Inc. (the Distributor). Pursuant to Rule 12b-1 under the 1940 Act, the Board of Trustees has approved, and the Fund has adopted, distribution and shareholder service plans (the Plans) which set the distribution and service fees for the Fund. These fees are calculated daily and are intended to compensate the Distributor and/or eligible selling and/or servicing agents for selling shares of the Fund and providing services to investors.
The Plans require the payment of a monthly service fee to the Distributor at the maximum annual rate of 0.25% of the average daily net assets attributable to Class A, Class B and Class C shares of the Fund. The Plans also require the payment of a monthly distribution fee to the Distributor at the maximum annual rate of 0.75% of the average daily net assets attributable to Class B and Class C shares only.
Prior to the Closing, Columbia Management Distributors, Inc., an affiliate of Columbia and an indirect, wholly owned subsidiary of BOA, was the principal underwriter of the Fund’s shares. There were no changes to the underwriting discount structure of the Fund or the service or distribution fee rates paid by the Fund as a result of the Transaction.
Sales Charges
Sales charges, including front-end and CDSC’s, received by the Distributor for distributing Fund shares were $2,116 for Class A, $465 for Class B and $311 for Class C shares for the year ended March 31, 2010.
Fee Waivers and Expense Reimbursements
The Investment Manager has voluntarily agreed to bear a portion of the Fund’s expenses so that the Fund’s ordinary operating expenses (excluding any distribution and service fees, brokerage commissions, interest, taxes and extraordinary expenses, but including custodian charges relating to overdrafts, if any), after giving effect to any balance credits from the Fund’s custodian, do not exceed 1.15% of the Fund’s average daily net assets on an annualized basis. The Investment Manager, in its discretion, may revise or discontinue this arrangement at any time. Merger costs are treated as extraordinary expenses and therefore not subject to the Fund’s expense limits. Prior to May 1, 2010, Columbia voluntarily reimbursed a portion of the Fund’s expenses in the same manner.
Fees Paid to Officers and Trustees
In connection with the Closing, all officers of the Fund are employees of the Investment Manager or its affiliates and, with the exception of the Fund’s Chief Compliance Officer, receive no compensation from the Fund. The Board of Trustees has appointed a Chief Compliance Officer to the Fund in accordance with federal securities regulations. The Fund, along with other affiliated funds, pays its pro-rata share of the expenses associated with the Chief Compliance Officer. The Fund’s expenses for the Chief Compliance Officer will not exceed $15,000 per year. Prior to the Closing, all officers of the Fund were employees of Columbia or its affiliates and the Fund paid its pro-rata share of the expenses for the Chief Compliance Officer under the same fee structure.
Trustees are compensated for their services to the Fund, as set forth on the Statement of Operations. The Trust’s eligible Trustees may participate in a deferred compensation plan which may be terminated at any time. Obligations of the plan will be paid solely out of the Fund’s assets.
Note 4. Custody Credits
The Fund has an agreement with its custodian bank under which custody fees may be reduced by balance credits. These credits are recorded as part of expense reductions on the Statement of Operations. The Fund could have invested a portion of the assets utilized in connection with the expense offset arrangement in an income-producing asset if it had not entered into such an agreement. For the year ended March 31, 2011, these custody credits reduced total expenses by $6 for the Fund.
Note 5. Portfolio Information
The cost of purchases and proceeds from sales of securities, excluding short-term obligations, aggregated $38,689,408 and $44,051,584, respectively, for the year ended March 31, 2011.
Note 6. Redemption Fees
Effective March 1, 2010, the Fund no longer assesses a 2.00% redemption fee on the proceeds from Fund shares that are redeemed within 60 days of purchase. The redemption fee was designed to offset brokerage commissions and other costs associated with short term trading of fund shares. The redemption fees, which were retained by the Fund, were accounted for as an addition to paid-in
26
Columbia World Equity Fund
March 31, 2011
capital and were allocated to each class based on the relative net assets at the time of the redemption. For the year ended March 31, 2010, the Portfolio received redemption fees for Class A, Class B and Class C of the Portfolio amounted to $696, $16 and $11, respectively.
Note 7. Regulatory Settlements
During the year ended March 31, 2010, the Fund received payments totaling $81,783 resulting from certain regulatory settlements with third parties in which the Fund had participated. The payments have been included in “Increase from regulatory settlements” in the Statement of Changes in Net Assets.
Note 8. Line of Credit
Prior to March 28, 2011, the Fund and other affiliated funds participated in a $280,000,000 committed, unsecured revolving line of credit provided by State Street. Effective March 28, 2011, the commitment was reduced to $225,000,000. The maximum amount that may be borrowed by any fund is limited to the lesser of $200,000,000 and the Fund’s borrowing limit set forth in the Fund’s registration statement. Borrowings are available for short-term liquidity or temporary or emergency purposes.
Effective October 14, 2010, interest is charged to each participating fund based on the fund’s borrowings at a rate per annum equal to the greater of the Federal Funds Rate plus 1.25% or the overnight LIBOR Rate plus 1.25%. In addition, a commitment fee of 0.125% per annum was accrued and apportioned among the participating funds pro rata based on their relative net assets.
Prior to October 14, 2010, interest was charged to each participating fund at the same rates. In addition, a commitment fee of 0.15% per annum was accrued and apportioned among the participating funds pro rata based on their relative net assets.
For the year ended March 31, 2011, the average daily loan balance outstanding on days where borrowing existed was $1,320,000 at a weighted average interest rate of 1.455%.
Note 9. Federal Tax Information
The timing and character of income and capital gain distributions are determined in accordance with income tax regulations, which may differ from GAAP. Reclassifications are made to the Fund’s capital accounts for permanent tax differences to reflect income and gains available for distribution (or available capital loss carryforwards) under income tax regulations.
For the year ended March 31, 2011, permanent book and tax basis differences resulting primarily from differing treatments for distribution reclasses, foreign currency transactions and proceeds from litigation settlements were identified and reclassified among the components of the Fund’s net assets as follows:
| | | | |
| | | |
Overdistributed Net Investment
Income | | Accumulated Net Realized
Loss | | Paid-In
Capital |
| $212,601 | | $(212,601) | | $— |
Net investment income and net realized gains (losses), as disclosed on the Statement of Operations, and net assets were not affected by this reclassification.
The tax character of distributions paid during the years ended March 31, 2011 and March 31, 2010 was as follows:
| | | | |
| | | March 31,
2011 | | March 31,
2010 |
| Distributions paid from: | | |
| Ordinary Income* | | $250,394 | | $1,041,286 |
| * | For tax purposes short-term capital gain distributions, if any, are considered ordinary income distributions. |
As of March 31, 2011, the components of distributable earnings on a tax basis were as follows:
| | | | |
| | | | | |
Undistributed
Ordinary Income | | Undistributed Long-Term Capital Gains | | Net Unrealized Appreciation* |
| $197,428 | | $— | | $13,428,998 |
| * | The differences between book-basis and tax-basis net unrealized appreciation are primarily due to deferral of losses from wash sales. |
Unrealized appreciation and depreciation at March 31, 2011, based on cost of investments for federal income tax purposes were:
| | | | |
| | | | |
Unrealized appreciation | | $ | 13,726,501 | |
Unrealized depreciation | | | (297,503 | ) |
| | | | |
Net unrealized appreciation | | $ | 13,428,998 | |
27
Columbia World Equity Fund
March 31, 2011
The following capital loss carryforwards may be available to reduce taxable income arising from future net realized gains on investments, if any, to the extent permitted by the Internal Revenue Code:
| | | | |
| Year of Expiration | | Capital Loss Carryforwards | |
| 2017 | | $ | 5,412,288 | |
| 2018 | | | 8,274,890 | |
| | | | |
| | $ | 13,687,178 | |
Capital loss carryforwards of $2,285,932 were utilized during the year ended March 31, 2011.
Management of the Fund has concluded that there are no significant uncertain tax positions that would require recognition in the financial statements. However, management’s conclusion may be subject to review and adjustment at a later date based on factors including, but not limited to, new tax laws, regulations, and administrative interpretations (including relevant court decisions). The Fund’s federal tax returns for the prior three fiscal years remain subject to examination by the Internal Revenue Service.
Note 10. Significant Risks and Contingencies
Foreign Securities Risk
Investing in foreign securities may include certain risks and considerations not typically associated with investing in U.S. securities, such as fluctuating currency values and changing local and regional economic, political and social conditions, which may result in greater market volatility. In addition, certain foreign securities may not be as liquid as U.S. securities. Investing in emerging markets may accentuate these risks.
Investments in emerging market countries are subject to additional risk. The risk of foreign investments is typically increased in less developed countries. These countries are also more likely to experience high levels of inflation, deflation or currency devaluation which could hurt their economies and securities markets.
Note 11. Subsequent Events
Management has evaluated the events and transactions that have occurred through the date the financial statements were issued. Other than as noted below, there were no items requiring adjustment of the financial statements or additional disclosure.
Effective May 16, 2011, the line of credit commitment with State Street was reduced to $150,000,000, and the maximum amount that may be borrowed by any fund was limited to the lesser of $120,000,000 and the Fund’s borrowing limit set forth in the Fund’s registration statement.
In August 2010, the Board of Trustees approved a proposal to merge the Fund into Columbia Global Equity Fund (formerly known as Threadneedle Global Equity Fund). The merger is expected to be a tax-free reorganization for U.S. federal income tax purposes. The proposal was approved at a special meeting of shareholders held on February 15, 2011, and the merger is expected to take place before the end of the second quarter 2011.
Note 12. Information Regarding Pending and Settled Legal Proceedings
In June 2004, an action captioned John E. Gallus et al. v. American Express Financial Corp. and American Express Financial Advisors Inc. was filed in the United States District Court for the District of Arizona. The plaintiffs allege that they are investors in several American Express Company (now known as RiverSource) mutual funds and they purport to bring the action derivatively on behalf of those funds under the Investment Company Act of 1940. The plaintiffs allege that fees allegedly paid to the defendants by the funds for investment advisory and administrative services are excessive. The plaintiffs seek remedies including restitution and rescission of investment advisory and distribution agreements. The plaintiffs voluntarily agreed to transfer this case to the United States District Court for the District of Minnesota (the District Court). In response to defendants’ motion to dismiss the complaint, the District Court dismissed one of plaintiffs’ four claims and granted plaintiffs limited discovery. Defendants moved for summary judgment in April 2007. Summary judgment was granted in the defendants’ favor on July 9, 2007. The plaintiffs filed a notice of appeal with the Eighth Circuit Court of Appeals (the Eighth Circuit) on August 8, 2007. On April 8, 2009, the Eighth Circuit reversed summary judgment and remanded to the District Court for further proceedings. On August 6, 2009, defendants filed a writ of certiorari with the U.S. Supreme Court (the Supreme Court), asking the Supreme Court to stay the District Court proceedings while the Supreme Court considers and rules in a case captioned Jones v. Harris Associates, which involves issues of law similar to those presented in the Gallus case. On March 30, 2010, the Supreme Court issued its ruling in Jones v. Harris Associates, and on April 5, 2010, the Supreme Court vacated the Eighth Circuit’s decision in the Gallus case and remanded the case to the Eighth Circuit for further consideration in light of the Supreme Court’s decision in Jones v. Harris Associates. On June 4, 2010, the Eighth Circuit remanded the Gallus case to the
28
Columbia World Equity Fund
March 31, 2011
District Court for further consideration in light of the Supreme Court’s decision in Jones v. Harris Associates. On December 9, 2010, the District Court reinstated its July 9, 2007 summary judgment order in favor of the defendants. On January 10, 2011, plaintiffs filed a notice of appeal with the Eighth Circuit.
In December 2005, without admitting or denying the allegations, American Express Financial Corporation (AEFC, which is now known as Ameriprise Financial, Inc. (Ameriprise Financial)), entered into settlement agreements with the Securities and Exchange Commission (SEC) and Minnesota Department of Commerce (MDOC) related to market timing activities. As a result, AEFC was censured and ordered to cease and desist from committing or causing any violations of certain provisions of the Investment Advisers Act of 1940, the Investment Company Act of 1940, and various Minnesota laws. AEFC agreed to pay disgorgement of $10 million and civil money penalties of $7 million. AEFC also agreed to retain an independent distribution consultant to assist in developing a plan for distribution of all disgorgement and civil penalties ordered by the SEC in accordance with various undertakings detailed at http://www.sec.gov/litigation/admin/ia-2451.pdf. Ameriprise Financial and its affiliates have cooperated with the SEC and the MDOC in these legal proceedings, and have made regular reports to the funds’ Boards of Directors/Trustees.
Ameriprise Financial and certain of its affiliates have historically been involved in a number of legal, arbitration and regulatory proceedings, including routine litigation, class actions, and governmental actions, concerning matters arising in connection with the conduct of their business activities. Ameriprise Financial believes that the Funds are not currently the subject of, and that neither Ameriprise Financial nor any of its affiliates are the subject of, any pending legal, arbitration or regulatory proceedings that are likely to have a material adverse effect on the Funds or the ability of Ameriprise Financial or its affiliates to perform under their contracts with the Funds. Ameriprise Financial is required to make 10-Q, 10-K and, as necessary, 8-K filings with the Securities and Exchange Commission on legal and regulatory matters that relate to Ameriprise Financial and its affiliates. Copies of these filings may be obtained by accessing the SEC website at www.sec.gov.
There can be no assurance that these matters, or the adverse publicity associated with them, will not result in increased fund redemptions, reduced sale of fund shares or other adverse consequences to the Funds. Further, although we believe proceedings are not likely to have a material adverse effect on the Funds or the ability of Ameriprise Financial or its affiliates to perform under their contracts with the Funds, these proceedings are subject to uncertainties and, as such, we are unable to estimate the possible loss or range of loss that may result. An adverse outcome in one or more of these proceedings could result in adverse judgments, settlements, fines, penalties or other relief that could have a material adverse effect on the consolidated financial condition or results of operations of Ameriprise Financial.
29
Report of Independent Registered Public Accounting Firm
To the Trustees of Columbia Funds Series Trust I and the Shareholders of Columbia World Equity Fund
In our opinion, the accompanying statement of assets and liabilities, including the investment portfolio, and the related statements of operations and of changes in net assets and the financial highlights present fairly, in all material respects, the financial position of Columbia World Equity Fund (the “Fund”) (a series of Columbia Funds Series Trust I) at March 31, 2011, and the results of its operations, the changes in its net assets, and the financial highlights for the periods indicated, in conformity with accounting principles generally accepted in the United States of America. These financial statements and financial highlights (hereafter referred to as “financial statements”) are the responsibility of the Fund’s management. Our responsibility is to express an opinion on these financial statements based on our audits. We conducted our audits of these financial statements in accordance with the standards of the Public Company Accounting Oversight Board (United States). Those standards require that we plan and perform the audit to obtain reasonable assurance about whether the financial statements are free of material misstatement. An audit includes examining, on a test basis, evidence supporting the amounts and disclosures in the financial statements, assessing the accounting principles used and significant estimates made by management, and evaluating the overall financial statement presentation. We believe that our audits, which included confirmation of securities at March 31, 2011 by correspondence with the transfer agents of the underlying funds, custodian and brokers, provide a reasonable basis for our opinion.
PricewaterhouseCoopers LLP
Boston, Massachusetts
May 20, 2011
30
Federal Income Tax Information (Unaudited) – Columbia World Equity Fund
61.52% of the ordinary income distributed by the Fund for the fiscal year ended March 31, 2011, qualifies for the corporate dividends received deduction.
For non-corporate shareholders 100.00%, or the maximum amount allowable under the Jobs and Growth Tax Relief Reconciliation Act of 2003, of ordinary income distributed by the Fund for the fiscal year ended March 31, 2011 may represent qualified dividend income.
The Fund will notify shareholders in January 2012 of amounts for use in preparing 2011 income tax returns.
31
Fund Governance
The Trustees serve terms of indefinite duration. The names, addresses and birth years of the Trustees and Officers of the Funds in the Columbia Funds Series Trust I, the year each was first elected or appointed to office, their principal business occupations during at least the last five years, the number of Funds overseen by each Trustee and other directorships they hold are shown below. Each officer listed below serves as an officer of each Fund in the Columbia Funds Series Trust I.
Independent Trustees
| | |
Name, Address and Year of Birth,
Position with Funds, Year First
Elected or Appointed to Office | | Principal Occupation(s) During Past Five Years, Number of Funds in Columbia Funds
Complex Overseen by Trustee, Other Directorships Held |
| |
| John D. Collins (born 1938) | | |
c/o Columbia Management Investment Advisers, LLC 225 Franklin Street Boston, MA 02110 Trustee (since 2005) | | Retired. Consultant, KPMG, LLP (accounting and tax firm) from July 1999 to June 2000; Partner, KPMG, LLP from March 1962 to June 1999. Oversees 46; Mrs. Fields Original Cookies, Inc. (consumer products); Suburban Propane Partners, L.P.; and Montpelier Re (insurance underwriting firm) |
| |
| Rodman L. Drake (born 1943) | | |
c/o Columbia Management Investment Advisers, LLC 225 Franklin Street Boston, MA 02110 Trustee (since 1994) and Chairman of the Board (since 2009) | | Independent consultant since 2010; Co-Founder of Baringo Capital LLC (private equity) from 1997 to 2008; CEO of Crystal River Capital, Inc. (real estate investment trust) from 2003 to 2010; Oversees 46; Jackson Hewitt Tax Service Inc. (tax preparation services); Celgene Corporation (global biotechnology company); Student Loan Corporation (student loan provider); Crystal River Capital, Inc. from 2005 to 2010; Parsons Brinckerhoff from 1995 to 2008; the Helios Funds (closed-end funds); and Apex Silver Mines Ltd. from 2007 to 2009 |
| |
| Douglas A. Hacker (born 1955) | | |
c/o Columbia Management Investment Advisers, LLC 225 Franklin Street Boston, MA 02110 Trustee (since 1996) | | Independent business executive since May 2006; Executive Vice President–Strategy of United Airlines (airline) from December 2002 to May 2006; President of UAL Loyalty Services (airline marketing company) from September 2001 to December 2002; Executive Vice President and Chief Financial Officer of United Airlines from July 1999 to September 2001. Oversees 46; Nash Finch Company (food distributor); Aircastle Limited (aircraft leasing); and SeaCube Container Leasing Ltd (container leasing) |
|
| Janet Langford Kelly (born 1957) |
c/o Columbia Management Investment Advisers, LLC 225 Franklin Street Boston, MA 02110 Trustee (since 1996) | | Senior Vice President, General Counsel and Corporate Secretary, ConocoPhillips (integrated energy company) since September 2007; Deputy General Counsel–Corporate Legal Services, ConocoPhillips from August 2006 to August 2007; Partner, Zelle, Hofmann, Voelbel, Mason & Gette LLP (law firm) from March 2005 to July 2006; Adjunct Professor of Law, Northwestern University, from September 2004 to June 2006; Director, UAL Corporation (airline) from February 2006 to July 2006; Oversees 46; None |
| |
| William E. Mayer (born 1940) | | |
c/o Columbia Management Investment Advisers, LLC 225 Franklin Street Boston, MA 02110 Trustee (since 1994) | | Partner, Park Avenue Equity Partners (private equity) since February 1999; Dean and Professor, College of Business and Management, University of Maryland from 1992 to 1996. Oversees 46; DynaVox Inc. (software developer); Lee Enterprises (print media), WR Hambrecht + Co. (financial service provider); BlackRock Kelso Capital Corporation (investment company) |
32
Fund Governance (continued)
Independent Trustees (continued)
| | |
Name, Address and Year of Birth,
Position with Funds, Year First
Elected or Appointed to Office | | Principal Occupation(s) During Past Five Years, Number of Funds in Columbia Funds
Complex Overseen by Trustee, Other Directorships Held |
| |
| David M. Moffett (born 1952) | | |
c/o Columbia Management Investment Advisers, LLC 225 Franklin Street Boston, MA 02110 Trustee (since 2011) | | Retired. Chief Executive Officer, Federal Home Loan Mortgage Corporation, from 2008 to 2009; Senior Adviser, Global Financial Services Group, Carlyle Group, Inc., from 2007 to 2008; Vice Chairman and Chief Financial Officer, U.S. Bancorp, from 1993 to 2007. Oversees 46; CIT Group Inc. (commercial and consumer finance), eBay Inc. (online trading community), MBIA Corp (financial service provider), E.W. Scripps Co. (print and television media), Building Materials Holding Corp. (building materials and construction services), and University of Oklahoma Foundation. |
| |
| Charles R. Nelson (born 1942) | | |
c/o Columbia Management Investment Advisers, LLC 225 Franklin Street Boston, MA 02110 Trustee (since 1981) | | Professor of Economics, University of Washington, since January 1976; Ford and Louisa Van Voorhis Professor of Political Economy, University of Washington, since September 1993; Adjunct Professor of Statistics, University of Washington, since September 1980; Associate Editor, Journal of Money Credit and Banking, 1993-2008; Consultant on econometric and statistical matters. Oversees 46; None |
| |
| John J. Neuhauser (born 1943) | | |
c/o Columbia Management Investment Advisers, LLC 225 Franklin Street Boston, MA 02110 Trustee (since 1984) | | President, Saint Michael’s College, since August 2007; Director or Trustee of several non-profit organization, including Fletcher Allen Health Care, Inc.; University Professor, Boston College from November 2005 to August 2007; Academic Vice President and Dean of Faculties, Boston College from August 1999 to October 2005. Oversees 46; Liberty All-Star Equity Fund and Liberty All-Star Growth Fund, Inc. (closed-end funds) |
| |
| Jonathan Piel (born 1938) | | |
c/o Columbia Management Investment Advisers, LLC 225 Franklin Street Boston, MA 02110 Trustee (since 1994) | | Cable television producer and website designer; The Editor, Scientific American from 1984 to 1994; Vice President, Scientific American, Inc., from 1984 to 1994; Member, Advisory Board, Stone Age Institute, Bloomington, Indiana (research institute that explores the effect of technology on human evolution); Member, Board of Directors of the National Institute of Social Sciences, New York City; Member, Board of Trustees of the William Alanson White Institute, New York City (institution for training psychoanalysts); and Member, Advisory Board, Mount Sinai Children’s Environmental Health Center, New York. Oversees 46; None |
| |
| Patrick J. Simpson (born 1944) | | |
c/o Columbia Management Investment Advisers, LLC 225 Franklin Street Boston, MA 02110 Trustee (since 2000) | | Partner, Perkins Coie LLP (law firm). Oversees 46; None |
| |
| Anne-Lee Verville (born 1945) | | |
c/o Columbia Management Investment Advisers, LLC 225 Franklin Street Boston, MA 02110 Trustee (since 1998) | | Retired since 1997 (formerly General Manager–Global Education Industry from 1994 to 1997, President–Application Systems Division from 1991 to 1994, Chief Financial Officer–US Marketing & Services from 1988 to 1991, and Chief Information Officer from 1987 to 1988, IBM Corporation (computer and technology)). Oversees 46; Enesco Group, Inc. (producer of giftware and home and garden decor products) from 2001 to 2006 |
33
Fund Governance (continued)
Interested Trustee
| | |
Name, Address and Year of Birth,
Position with Funds, Year First
Elected or Appointed to Office | | Principal Occupation(s) During Past Five Years, Number of Funds in Columbia Funds
Complex Overseen by Trustee, Other Directorships Held |
| |
| Michael A. Jones (born 1959) | | |
c/o Columbia Management Investment Advisers, LLC 225 Franklin Street Boston, MA 02110 Trustee (since 2011) Senior Vice President (since 2010) | | President and Director, Columbia Management Investment Advisers, LLC since May 2010; President and Director, Columbia Management Investment Distributors, Inc. since May 2010; Manager, Chairman, Chief Executive Officer and President, Columbia Management Advisors, LLC from 2007 to April 2010; Chief Executive Officer, President and Director, Columbia Management Distributors, Inc. from November 2006 to April 2010; previously, co-president and senior managing director at Robeco Investment Management. Oversees 46; None |
The Statement of Additional Information includes additional information about the Trustees of the Funds and is available, without charge, upon request by calling 1-800-345-6611.
34
Fund Governance (continued)
Officers
| | |
| Name, Year of Birth and Address | | Principal Occupation(s) During the Past Five Years |
|
| J. Kevin Connaughton (born 1964) |
225 Franklin Street Boston, MA 02110 President (since 2009) | | Senior Vice President and General Manager–Mutual Fund Products, Columbia Management Investment Advisers, LLC since May 2010; President, Columbia Funds, since 2009, and RiverSource Funds, since May 2010 (previously Senior Vice President and Chief Financial Officer, Columbia Funds, from June 2008 to January 2009, Treasurer, Columbia Funds, from October 2003 to May 2008, and senior officer of various other affiliated funds since 2000); Managing Director, Columbia Management Advisors, LLC from December 2004 to April 2010. |
| |
| Michael G. Clarke (born 1969) | | |
225 Franklin Street Boston, MA 02110 Treasurer (since 2011) and
Chief Financial Officer (since 2009) | | Vice President, Columbia Management Investment Advisers, LLC since May 2010; Managing Director of Fund Administration, Columbia Management Advisors, LLC, from September 2004 to April 2010; senior officer of Columbia Funds and affiliated funds since 2002. |
| |
| Scott R. Plummer (born 1959) | | |
5228 Ameriprise Financial Center Minneapolis, MN 55474 Senior Vice President, Secretary and Chief Legal Officer (since 2010) | | Chief Legal Officer and Assistant Secretary, Columbia Management Investment Advisers, LLC since June 2005; Vice President and Lead Chief Counsel–Asset Management, Ameriprise Financial, Inc. since May 2010 (previously Vice President and Chief Counsel–Asset Management, from 2005 to April 2010, and Vice President–Asset Management Compliance from 2004 to 2005); Vice President, Chief Counsel and Assistant Secretary, Columbia Management Investment Distributors, Inc. since 2008; Vice President, General Counsel and Secretary, Ameriprise Certificate Company since 2005; Chief Counsel, RiverSource Distributors, Inc. since 2006; Vice President, General Counsel and Secretary, RiverSource Funds, since December 2006; Senior Vice President, Secretary and Chief Legal Officer, Columbia Funds, since May 2010. |
| |
| Linda J. Wondrack (born 1964) | | |
225 Franklin Street Boston, MA 02110 Senior Vice President and Chief Compliance Officer (since 2007) | | Vice President and Chief Compliance Officer, Columbia Management Investment Advisers, LLC since May 2010; Chief Compliance Officer, Columbia Funds, since 2007, and RiverSource Funds, since May 2010; Director (Columbia Management Group, LLC and Investment Product Group Compliance), Bank of America, from June 2005 to April 2010; Director of Corporate Compliance and Conflicts Officer of MFS Investment Management (investment management) from August 2004 to May 2005. |
| |
| William F. Truscott (born 1960) | | |
53600 Ameriprise Financial Center Minneapolis, MN 55474 Senior Vice President (since 2010) | | Chairman of the Board, Columbia Management Investment Advisers, LLC since May 2010 (previously President, Chairman of the Board and Chief Investment Officer, from 2001 to April 2010); Chief Executive Officer, U.S. Asset Management & President, Annuities, Ameriprise Financial, Inc. since May 2010 (previously President–U.S. Asset Management and Chief Investment Officer from 2005 to April 2010, and Senior Vice President–Chief Investment Officer, from 2001 to 2005); Director, President and Chief Executive Officer, Ameriprise Certificate Company since 2006; Director, Columbia Management Investment Distributors, Inc. since May 2010 (previously Chairman of the Board and Chief Executive Officer from 2008 to April 2010); Chairman of the Board and Chief Executive Officer, RiverSource Distributors, Inc. since 2006. |
35
Fund Governance (continued)
Officers (continued)
| | |
| Name, Year of Birth and Address | | Principal Occupation(s) During the Past Five Years |
|
| Colin Moore (born 1958) |
225 Franklin Street Boston, MA 02110 Senior Vice President (since 2010) | | Director and Chief Investment Officer, Columbia Management Investment Advisers, LLC since May 2010; Manager, Managing Director and Chief Investment Officer of Columbia Management Advisors, LLC from 2007 to April 2010; Head of Equities, Columbia Management Advisors, LLC from 2002 to 2007. |
| |
| Amy Johnson (born 1965) | | |
5228 Ameriprise Financial Center Minneapolis, MN 55474 Vice President (since 2010) | | Senior Vice President and Chief Operating Officer, Columbia Management Investment Advisers, LLC since May 2010 (previously Chief Administrative Officer, from 2009 until April 2010, Vice President–Asset Management and Trust Company Services, from 2006 to 2009, and Vice President–Operations and Compliance from 2004 to 2006). |
| |
| Joseph F. DiMaria (born 1968) | | |
225 Franklin Street Boston, MA 02110 Vice President (since 2011) and
Chief Accounting Officer (since 2008) | | Vice President, Mutual Fund Administration, Columbia Management Investment Advisers, LLC, since May 2010; Director of Fund Administration, Columbia Management Advisors, LLC from January 2006 to April 2010; Head of Tax/Compliance and Assistant Treasurer, Columbia Management Advisors, LLC, from November 2004 to December 2005. |
| |
| Paul D. Pearson (born 1956) | | |
5228 Ameriprise Financial Center Minneapolis, MN 55474 Vice President and Assistant
Treasurer (since 2011) | | Vice President, Investment Accounting, Columbia Management Investment Advisers, LLC, since May 2010; Vice President, Managed Assets, Investment Accounting, Ameriprise Financial Corporation. |
| |
| Paul B. Goucher (born 1968) | | |
5228 Ameriprise Financial Center Minneapolis, MN 55474 Vice President and Assistant
Treasurer (since 2010) | | Vice President and Chief Counsel of Ameriprise Financial since January 2010 (formerly Vice President and Group Counsel from November 2008 to January 2010); Director, Managing Director and General Counsel of J. & W. Seligman & Co. Incorporated (Seligman) from July 2008 to November 2008 and Managing Director and Associate General Counsel of Seligman from January 2005 to July 2008. |
| |
| Christopher O. Petersen (born 1970) | | |
5228 Ameriprise Financial Center Minneapolis, MN 55474
Vice President and Assistant
Treasurer (since 2010) | | Vice President and Chief Counsel, Ameriprise Financial since January 2010 (formerly Vice President and Group Counsel or Counsel from April 2004 to January 2010); Assistant Secretary of RiverSource Funds since January 2007. |
| |
| Michael E. DeFao (born 1968) | | |
5228 Ameriprise Financial Center Minneapolis, MN 55474
Vice President and Assistant
Treasurer (since 2011) | | Vice President and Chief Counsel, Ameriprise Financial since May 2010; Associate General Counsel Bank of America from June 2005 to April 2010 |
| |
| Stephen T. Welsh (born 1957) | | |
225 Franklin Street Boston, MA 02110 Vice President (since 2006) | | President and Director, Columbia Management Investment Services Corp. since May 2010; President and Director, Columbia Management Services, Inc. from July 2004 to April 2010; Managing Director, Columbia Management Distributors, Inc. from August 2007 to April 2010. |
36
Shareholder Meeting Results
At a Joint Special Meeting of Shareholders held on February 15, 2011, shareholders of the Fund considered a proposal to approve an Agreement and Plan of Reorganization pursuant to which the Fund will transfer its assets to Columbia Global Equity Fund (the “Buying Fund”) in exchange for shares of the Buying Fund and the assumption by the Buying Fund of all of the liabilities of the Fund. The proposal was approved as follows:
| | | | | | |
| | | | | | | |
| Votes For | | Votes Against | | Abstentions | | Broker Non-Votes |
| 29,529,406 | | 1,100,544 | | 1,262,299 | | 0 |
37
[THIS PAGE INTENTIONALLY LEFT BLANK]
38
[THIS PAGE INTENTIONALLY LEFT BLANK]
39
[THIS PAGE INTENTIONALLY LEFT BLANK]
40
Important Information About This Report
The fund mails one shareholder report to each shareholder address. If you would like more than one report, please call shareholder services at 1-800-345-6611 and additional reports will be sent to you. This report has been prepared for shareholders of Columbia World Equity Fund.
A description of the policies and procedures that the fund uses to determine how to vote proxies and a copy of the fund’s voting records are available (i) at www.columbiamanagement.com, (ii) on the Securities and Exchange Commission’s website at www.sec.gov, and (iii) without charge, upon request, by calling 1-800-368-0346. Information regarding how the fund voted proxies relating to portfolio securities during the 12-month period ended June 30 is available from the SEC’s website. Information regarding how the fund voted proxies relating to portfolio securities is also available from the fund’s website, www.columbiamanagement.com.
The fund files a complete schedule of portfolio holdings with the SEC for the first and third quarters of each fiscal year on Form N-Q. The fund’s Form N-Q is available on the SEC’s website at www.sec.gov and may be reviewed and copied at the SEC’s Public Reference Room in Washington, D.C. Information on the operation of the Public Reference Room may be obtained by calling
1-800-SEC-0330.
Transfer Agent
Columbia Management Investment Services Corp.
P.O. Box 8081
Boston, MA 02266-8081
1-800-345-6611
Distributor
Columbia Management Investment
Distributors, Inc.
225 Franklin Street
Boston, MA 02110
Investment Manager
Columbia Management Investment Advisers, LLC
225 Franklin Street
Boston, MA 02110
41

Columbia World Equity Fund
P.O. Box 8081
Boston, MA 02266-8081
columbiamanagement.com
This information is for use with concurrent or prior delivery of a fund prospectus. Investors should consider the investment objectives, risks, charges and expenses of a mutual fund carefully before investing. For a free prospectus, which contains this and other important information about the funds, visit columbiamanagement.com. Read the prospectus carefully before investing. The Fund is distributed by Columbia Management Investment Distributors, Inc., member FINRA, and managed by Columbia Management Investment Advisers, LLC.
©2011 Columbia Management Investment Advisers, LLC. All rights reserved.
C-1206 A (05/11)

Columbia Bond Fund
Annual Report for the Period Ended March 31, 2011
Table of Contents
The views expressed in this report reflect the current views of the respective parties. These views are not guarantees of future performance and involve certain risks, uncertainties and assumptions that are difficult to predict, so actual outcomes and results may differ significantly from the views expressed. These views are subject to change at any time based upon economic, market or other conditions and the respective parties disclaim any responsibility to update such views. These views may not be relied on as investment advice and, because investment decisions for a Columbia Fund are based on numerous factors, may not be relied on as an indication of trading intent on behalf of any particular Columbia Fund. References to specific securities should not be construed as a recommendation or investment advice.
President’s Message

Dear Shareholder:
The Columbia Management story began over 100 years ago, and today, we are one of the nation’s largest dedicated asset managers. The recent acquisition by Ameriprise Financial, Inc. brings together the talents, resources and capabilities of Columbia Management with those of RiverSource Investments, Threadneedle (acquired by Ameriprise in 2003) and Seligman Investments (acquired by Ameriprise in 2008) to build a best-in-class asset management business that we believe is truly greater than its parts.
RiverSource Investments traces its roots to 1894 when its then newly-founded predecessor, Investors Syndicate, offered a face-amount savings certificate that gave small investors the opportunity to build a safe and secure fund for retirement, education or other special needs. A mutual fund pioneer, Investors Syndicate launched Investors Mutual Fund in 1940. In the decades that followed, its mutual fund products and services lineup grew to include a full spectrum of styles and specialties. More than 110 years later, RiverSource continues to be a trusted financial products leader.
Threadneedle, a leader in global asset management and one of Europe’s largest asset managers, offers sophisticated international experience from a dedicated U.K. management team. Headquartered in London, it is named for Threadneedle Street in the heart of the city’s financial district, where British investors pioneered international and global investing. Threadneedle was acquired in 2003 and today operates as an affiliate of Columbia Management.
Seligman Investments’ beginnings date back to the establishment of the investment firm J. & W. Seligman & Co. in 1864. In the years that followed, Seligman played a major role in the geographical expansion and industrial development of the United States. In 1874, President Ulysses S. Grant named Seligman as fiscal agent for the U.S. Navy — an appointment that would last through World War I. Seligman helped finance the westward path of the railroads and the building of the Panama Canal. The firm organized its first investment company in 1929 and began managing its first mutual fund in 1930. In 2008, J. & W. Seligman & Co. Incorporated was acquired and Seligman Investments became an offering brand of RiverSource Investments, LLC.
We are proud of the rich and distinctive history of these firms, the strength and breadth of products and services they offer, and the combined cultures of pioneering spirit and forward thinking. Together we are committed to providing more for our shareholders than ever before.
| n | | A singular focus on our shareholders. Our business is asset management, so investors are our first priority. We dedicate our resources to identifying timely investment opportunities and provide a comprehensive choice of equity, fixed-income and alternative investments to help meet your individual needs. |
| n | | First-class research and thought leadership. We are dedicated to helping you take advantage of today’s opportunities and anticipate tomorrow’s. We stay abreast of the latest investment trends and ideas, using our collective insight to evaluate events and transform them into solutions you can use. |
| n | | A disciplined investment approach. We aren’t distracted by passing fads. Our teams adhere to a rigorous investment process that helps ensure the integrity of our products and enables you and your financial advisor to match our solutions to your objectives with confidence. |
When you choose Columbia Management, you can be confident that we will take the time to understand your needs and help you and your financial advisor identify the solutions that are right for you. Because at Columbia Management, we don’t consider ourselves successful unless you are.
Sincerely,

J. Kevin Connaughton
President, Columbia Funds
Investors should consider the investment objectives, risks, charges and expenses of a mutual fund carefully before investing. For a free prospectus, which contains this and other important information about the funds, visit www.columbiamanagement.com. The prospectus should be read carefully before investing.
Columbia Funds are distributed by Columbia Management Investment Distributors, Inc., member FINRA, and managed by Columbia Management Investment Advisers, LLC.
© 2011 Columbia Management Investment Advisers, LLC. All rights reserved.
Fund Profile – Columbia Bond Fund
Summary
| n | | For the 12-month period that ended March 31, 2011, the fund’s Class A shares returned 4.83% without sales charge. |
| n | | The fund underperformed its benchmark, the Barclays Capital Aggregate Bond Index1, and underperformed the average return of the funds in its peer group, the Lipper Corporate Debt Funds A Rated Classification.2 |
| n | | The fund’s conservative investment style placed it at a slight disadvantage during a period when riskier assets tended to outperform. |
Portfolio Management
Alexander D. Powers, lead manager, has co-managed the fund since 2008 and has been associated with the fund’s adviser or the fund’s previous adviser or its predecessors since 1996.
Michael Zazzarino has co-managed the fund since 2008 and has been associated with the fund’s adviser or the fund’s previous adviser or its predecessors since 2005.
Carl Pappo has co-managed the fund since 2010 and has been associated with the fund’s adviser or the fund’s previous adviser or its predecessors since 1993.
| 1 | The Barclays Capital Aggregate Bond Index is a market value-weighted index that tracks the daily price, coupon, pay-downs and total return performance of fixed-rate, publicly placed, dollar-denominated and non-convertible investment grade debt issues with at least $250 million par amount outstanding and with at least one year to final maturity. |
| 2 | Lipper Inc., a widely respected data provider in the industry, calculates an average total return (assuming reinvestment of distributions) for mutual funds with investment objectives similar to those of the fund. Lipper makes no adjustment for the effect of sales loads. |
Indices are not available for investment, are not professionally managed and do not reflect sales charges, fees, brokerage commissions, taxes or other expenses of investing. Securities in the fund may not match those in an index.
Performance data quoted represents past performance and current performance may be lower or higher. Past performance is no guarantee of future results. The investment return and principal value will fluctuate so that shares, when redeemed, may be worth more or less than the original cost. Please visit www.columbiamanagement.com for daily and most recent month-end performance updates.
Summary
1-year return as of 03/31/11
| | |
| |
 | | +4.83% Class A Shares (without sales charge) |
| |
| | +5.12% Barclays Capital Aggregate Bond Index |
1
Economic Update – Columbia Bond Fund
The U.S. economy continued to expand at a solid but uneven pace over the past 12 months, as measured by gross domestic product (GDP). Although lackluster second quarter 2010 GDP growth raised fears that the economy was losing steam and might lapse back into recession, the pace picked up in the third quarter of 2010, inspiring confidence among consumers, businesses and investors. GDP expanded by 2.6% in the third quarter and 3.1% in the fourth quarter. With the Federal Reserve Board (the Fed) providing additional monetary stimulus to shore up economic growth and the extension of key tax cuts for the next two years, expectations are for continued growth in 2011. However, early estimates of first quarter 2011 growth place it just under 2.0%, a disappointment after two strong quarters and a pick-up in employment.
Consumer spending on cars, clothing and other goods generally trended higher during the 12-month period, accelerating in the fourth quarter. Holiday spending rose 5.5% between November 5, 2010 and December 24, 2010, in all retail categories, excluding automobiles, compared with the same period in 2009, according to MasterCard Advisors’ SpendingPulse, which tracks spending on all transactions including cash. Personal income surged in January 2011 as payroll tax cuts kicked in. The personal savings rate edged higher, ending February 2011, the last month for which data was available, at 5.8%.
News on the job front was increasingly positive. A good portion of the jobs added in March, April and May of 2010 were temporary, government-sponsored census positions, which began to unwind in June, July and August of 2010. However, private sector payroll employment began to trend higher in the third quarter, massive layoffs declined and job growth turned solidly positive, with the addition of 444,000 new jobs in the first quarter of 2011.
Despite some glimmers of improvement early in 2010, the housing market remained troublesome throughout the period. Both new and existing home sales fell after a federal tax credit for new and repeat homebuyers expired. Distressed properties pressured prices and foreclosures continued — another drag on prices. The inventory of unsold homes ended the period higher than it started, at 8.9 and 8.6 months for both new and existing homes, respectively, according to the National Association of Realtors and a joint release from the U.S. Census Bureau and the U.S. Department of Housing and Urban Development. The new year brought more disappointing news: Existing home sales fell in January 2011 after three months of sustained improvement. Tight credit and weak appraisals were cited as possible reasons for the decline.
Reports from the business side of the economy were generally positive. A key measure of the nation’s manufacturing situation — the Institute for Supply Management’s Index — took a somewhat surprising turn higher in the final months of the period. Technology spending rose 12% in 2010, according to the NPD Group, a national marketing research firm. Purchases of computers, networking and software returned to prerecession levels. Industrial production rose over the period, and manufacturing capacity utilized, per the report issued by the Fed — a key measure of the health of the manufacturing sector — also edged higher.
Summary
For the 12-month period that ended March 31, 2011
| | n | | Strengthening economic growth and rising interest rates kept a lid on most bond market sectors. The Barclays Capital Aggregate Bond Index delivered modest results. However, high-yield bonds were strong performers, as measured by the JPMorgan Developed BB High Yield Index. | |
| | |
| Barclays Aggregate Index | | JPMorgan Index |
| |

| |
|
5.12% | | 13.04% |
| | n | | The U.S. stock market, as measured by the S&P 500 Index, delivered solid returns, despite a summer 2010 correction. Foreign stock market returns were also positive, as measured by the MSCI EAFE Index (Net). | |
| | |
| S&P Index | | MSCI Index |
| |
| |
|
15.65% | | 10.42% |
2
Economic Update (continued) – Columbia Bond Fund
Bonds delivered modest returns
As the economy strengthened and interest rates edged higher, most bond sectors delivered modest returns. The Barclays Capital Aggregate Bond Index1 returned 5.12%. High-yield bonds led the fixed-income markets. For the 12 months covered by this report, the JPMorgan Developed BB High Yield Index2 returned 13.04% as default fears abated and investors grew more comfortable with risk. Despite rising yields in the second half of the period, the Treasury market was also positive. The Barclays Capital U.S. Treasury Index3 returned 4.53%. However, municipal bonds struggled in the second half of the period, as interest rates inched higher and issue supply surged ahead of the year-end expiration of the Build America Bonds program. The Barclays Capital Municipal Bond Index4 gained 1.63% for the period. Despite positive economic activity, the Fed kept a key short-term interest rate — the federal funds rate — close to zero, reflecting ongoing concerns about employment and the housing market.
Stocks moved higher despite summer 2010 decline
Against a strengthening economic backdrop, stock prices continued to rally despite a summer 2010 setback linked to a debt crisis brewing in Europe, which raised concerns among U.S. investors. These fears were short-lived and stocks regained their footing. In this environment, the S&P 500 Index5 returned 15.65% for the 12 months through March 31, 2011. Outside the United States, stock markets also delivered solid gains. The MSCI EAFE Index (Net)6, a broad gauge of stock market performance in foreign developed markets, returned 10.42% (in U.S. dollars) for the 12-month period, as concerns about the impact of a bailout for weak euro zone economies eased yet continued to restrain market performance. Emerging stock markets were strong. The MSCI Emerging Markets Index (Net)7 returned 18.46% (in U.S. dollars) for the 12-month period.
Past performance is no guarantee of future results.
| 1 | The Barclays Capital Aggregate Bond Index is a market value-weighted index that tracks the daily price, coupon, pay-downs and total return performance of fixed-rate, publicly placed, dollar-denominated and non-convertible investment grade debt issues with at least $250 million par amount outstanding and with at least one year to final maturity. |
| 2 | The JPMorgan Developed BB High Yield Index is an unmanaged index designed to mirror the investable universe of the U.S. dollar developed, BB-rated, high yield corporate debt market. |
| 3 | The Barclays Capital U.S. Treasury Index includes public obligations of the U.S. Treasury. Treasury bills are excluded by the maturity constraint. In addition, certain special issues, such as state and local government series bonds (SLGs), as well as U.S. Treasury TIPS, are excluded. STRIPS are excluded from the index because their inclusion would result in double-counting. |
| 4 | The Barclays Capital Municipal Bond Index is considered representative of the broad market for investment-grade, tax-exempt bonds with a maturity of at least one year |
| 5 | The Standard & Poor’s (S&P) 500 Index tracks the performance of 500 widely held, large-capitalization U.S. stocks. |
| 6 | The Morgan Stanley Capital International Europe, Australasia, Far East (MSCI EAFE) Index (Net) is a free float-adjusted market capitalization index that is designed to measure the equity market performance of developed markets, excluding the U.S. & Canada. As of December 31, 2010, the MSCI EAFE Index (Net) consisted of the following 22 developed market country indices: Australia, Austria, Belgium, Denmark, Finland, France, Germany, Greece, Hong Kong, Ireland, Israel, Italy, Japan, the Netherlands, New Zealand, Norway, Portugal, Singapore, Spain, Sweden, Switzerland and the United Kingdom. |
| 7 | The Morgan Stanley Capital International Emerging Markets (MSCI EM) Index (Net) is a free float-adjusted market capitalization index that is designed to measure equity market performance of emerging markets. As of December 31, 2010, the MSCI EM Index (Net) consisted of the following 21 emerging market country indices: Brazil, Chile, China, Colombia, Czech Republic, Egypt, Hungary, India, Indonesia, Korea, Malaysia, Mexico, Morocco, Peru, Philippines, Poland, Russia, South Africa, Taiwan, Thailand and Turkey. |
Indices are not available for investment, are not professionally managed and do not reflect sales charges, fees, brokerage commissions, taxes or other expenses of investing. Securities in the fund may not match those in an index.
3
Performance Information – Columbia Bond Fund
Performance data quoted represents past performance and current performance may be lower or higher. Past performance is no guarantee of future results. The investment return and principal value will fluctuate so that shares, when redeemed, may be worth more or less than the original cost. Please visit www.columbiamanagement.com for daily and most recent month-end performance updates.
| | | | |
| Net asset value per share | |
| |
as of 03/31/11 ($) | | | | |
Class A | | | 9.24 | |
Class B | | | 9.24 | |
Class C | | | 9.24 | |
Class I | | | 9.25 | |
Class T | | | 9.23 | |
Class W | | | 9.24 | |
Class Y | | | 9.25 | |
Class Z | | | 9.24 | |
| | | | |
| Distributions declared per share | |
| |
04/01/10 – 03/31/11 ($) | | | | |
Class A | | | 0.48 | |
Class B | | | 0.01 | |
Class C | | | 0.41 | |
Class I | | | 0.29 | |
Class T | | | 0.02 | |
Class W | | | 0.27 | |
Class Y | | | 0.51 | |
Class Z | | | 0.51 | |
|
| Performance of a $10,000 investment 04/01/01 – 03/31/11 |

The chart above shows the change in value of a hypothetical $10,000 investment in Class A shares of Columbia Bond Fund during the stated time period, and does not reflect the deduction of taxes that a shareholder may pay on fund distributions or on the redemption of fund shares.
| | | | | | | | |
| Performance of a $10,000 investment 04/01/01 – 03/31/11 ($) | |
| | |
| Sales charge | | without | | | with | |
Class A | | | 16,648 | | | | 15,864 | |
Class B | | | n/a | | | | n/a | |
Class C | | | 16,285 | | | | 16,285 | |
Class I | | | n/a | | | | n/a | |
Class T | | | n/a | | | | n/a | |
Class W | | | n/a | | | | n/a | |
Class Y | | | 16,810 | | | | n/a | |
Class Z | | | 16,786 | | | | n/a | |
| | | | | | | | | | | | | | | | | | | | | | | | | | | | | | | | | | | | | | | | | | | | |
| Average annual total return as of 03/31/11 (%) | |
| | | | | | | | |
| Share class | | A | | | B | | | C | | | I | | | T | | | W | | | Y | | | Z | |
| Inception | | 3/31/08 | | | 03/07/11 | | | 03/31/08 | | | 09/27/10 | | | 03/07/11 | | | 09/27/10 | | | 07/15/09 | | | 01/09/86 | |
| Sales charge | | without | | | with | | | without | | | with | | | without | | | with | | | without | | | without | | | without | | | without | | | without | |
1-year | | | 4.83 | | | | –0.12 | | | | n/a | | | | n/a | | | | 3.94 | | | | 2.94 | | | | n/a | | | | n/a | | | | n/a | | | | 5.01 | | | | 4.98 | |
5-year | | | 5.57 | | | | 4.55 | | | | n/a | | | | n/a | | | | 5.11 | | | | 5.11 | | | | n/a | | | | n/a | | | | n/a | | | | 5.78 | | | | 5.75 | |
10-year/Life | | | 5.23 | | | | 4.72 | | | | 0.15 | | | | 0.15 | | | | 5.00 | | | | 5.00 | | | | –0.44 | | | | 0.21 | | | | –0.60 | | | | 5.33 | | | | 5.32 | |
The “with sales charge” returns include the maximum initial sales charge of 4.75% for Class A shares and the applicable contingent deferred sales charge of 1.00% for Class C shares for the first year only. The “without sales charge” returns do not include the effect of sales charges. If they had, returns would be lower.
Performance results reflect any fee waivers or reimbursements of fund expenses by the investment advisor and/or any of its affiliates. Absent these fee waivers or expense reimbursement arrangements, performance results would have been lower.
All results shown assume reinvestment of distributions.
4
Performance Information (continued) – Columbia Bond Fund
The Fund commenced operations on March 31, 2008. Class A, Class C, and Class Z share performance information includes the performance of Shares class shares of Core Bond Fund, the predecessor to the Fund and a series of Excelsior Funds, Inc. (the “Predecessor Fund”), for periods prior to March 31, 2008. These returns reflect any differences in sales charges, but have not been restated to reflect any differences in expenses between the Predecessor Fund share class and the newer share classes. If differences in expenses had been reflected, the returns shown for periods prior to March 31, 2008 would be lower for Class A and Class C shares, since these newer classes of shares are subject to higher distribution and service (Rule 12b-1) fees.
The returns for Class Y shares include the returns for Class Z shares prior to July 15, 2009, the date on which Class Y shares were initially offered by the fund. The returns shown have not been adjusted to reflect any differences in expenses between Class Y shares and Class Z shares. If differences in expenses had been reflected, the returns shown would be lower.
All results shown assume reinvestment of distributions. Class I, Class Y and Class Z shares are sold at net asset value with no distribution and service (Rule 12b-1) fees. Class T shares and Class W shares are sold at net asset value with a service (Rule 12b-1) fee. Class B shares are sold at net asset value with distribution and service (Rule 12b-1) fees. Class I, Class T, Class W, Class Y and Class Z shares have limited eligibility and the investment minimum requirements may vary. Please see the fund’s prospectus for details.
Performance for different share classes will vary based on differences in sales charges and fees associated with each class. The tables do not reflect the deduction of taxes that a shareholder may pay on fund distributions or on the redemption of fund shares.
Class I and Class W shares were initially offered on September 27, 2010, and Class B and Class T were shares were initially offered on March 7, 2011.
The tables do not reflect the deduction of taxes that a shareholder may pay on fund distributions or on the redemption of fund shares.
5
Understanding Your Expenses – Columbia Bond Fund
Estimating your actual expenses
To estimate the expenses that you paid over the period, first you will need your account balance at the end of the period:
| | n | | For shareholders who receive their account statements from Columbia Management Investment Services Corp., your account balance is available online at www.columbiamanagement.com or by calling Shareholder Services at 800.345.6611. | |
| | n | | For shareholders who receive their account statements from their financial intermediary, contact your financial intermediary to obtain your account balance. | |
| | 1. | Divide your ending account balance by $1,000. For example, if an account balance was $8,600 at the end of the period, the result would be 8.6. | |
| | 2. | In the section of the table below titled “Expenses paid during the period,” locate the amount for your share class. You will find this number in the column labeled “Actual.” Multiply this number by the result from step 1. Your answer is an estimate of the expenses you paid on your account during the period. | |
If the value of your account falls below the minimum initial investment requirement applicable to you, your account may be subject to a $20 annual fee. This fee is not included in the accompanying table. If you are subject to the fee, keep it in mind when you are estimating the ongoing expenses of investing in the fund and when comparing the expenses of this fund with other funds.
As a fund shareholder, you incur two types of costs. There are transaction costs, which generally include sales charges on purchases and may include redemption fees or exchange fees. There are also ongoing costs, which generally include investment advisory fees, distribution and service (Rule 12b-1) fees and other fund expenses. The information on this page is intended to help you understand the ongoing costs of investing in the fund and to compare these costs with the ongoing costs of investing in other mutual funds.
Analyzing your fund’s expenses by share class
To illustrate these ongoing costs, we have provided an example and calculated the expenses paid by investors in each share class during the period. The information in the following table is based on an initial investment of $1,000, which is invested at the beginning of the period and held for the entire period. Expense information is calculated two ways and each method provides you with different information. The amount listed in the “Actual” column is calculated using the fund’s actual operating expenses and total return for the period. The amount listed in the “Hypothetical” column for each share class assumes that the return each year is 5% before expenses and is calculated based on the fund’s actual operating expenses. You should not use the hypothetical account values and expenses to estimate either your actual account balance at the end of the period or the expenses you paid during this period.
Compare with other funds
Since all mutual funds are required to include the same hypothetical calculations about expenses in shareholder reports, you can use this information to compare the ongoing costs of investing in the fund with other funds. To do so, compare the 5% hypothetical example with the 5% hypothetical examples that appear in the shareholder reports of other funds. As you compare hypothetical examples of other funds, it is important to note that hypothetical examples are meant to highlight the ongoing costs of investing in a fund and do not reflect any transaction costs, such as sales charges, redemption fees or exchange fees.
| | | | | | | | | | | | | | | | | | | | | | | | | | | | |
| 10/01/10 – 3/31/11 | | | | | | | | | | | | | | | | |
| | | Account value at the
beginning of the period ($) | | | Account value at the
end of the period ($) | | | Expenses paid
during the period ($) | | | Fund’s annualized
expense ratio (%) | |
| | | Actual | | | Hypothetical | | | Actual | | | Hypothetical | | | Actual | | | Hypothetical | | | Actual | |
Class A | | | 1,000.00 | | | | 1,000.00 | | | | 993.80 | | | | 1,020.94 | | | | 3.98 | | | | 4.03 | | | | 0.80 | |
Class B | | | 1,000.00 | | | | 1,000.00 | | | | 1,001.50 | * | | | 1,017.19 | | | | 1.06 | * | | | 7.81 | | | | 1.55 | |
Class C | | | 1,000.00 | | | | 1,000.00 | | | | 989.10 | | | | 1,017.50 | | | | 7.39 | | | | 7.49 | | | | 1.49 | |
Class I | | | 1,000.00 | | | | 1,000.00 | | | | 995.30 | | | | 1,022.24 | | | | 2.69 | | | | 2.72 | | | | 0.54 | |
Class T | | | 1,000.00 | | | | 1,000.00 | | | | 1,002.10 | * | | | 1,021.46 | | | | 0.48 | * | | | 3.51 | | | | 0.70 | |
Class W | | | 1,000.00 | | | | 1,000.00 | | | | 993.70 | | | | 1,021.04 | | | | 3.88 | | | | 3.93 | | | | 0.78 | |
Class Y | | | 1,000.00 | | | | 1,000.00 | | | | 994.30 | | | | 1,022.44 | | | | 2.49 | | | | 2.52 | | | | 0.50 | |
Class Z | | | 1,000.00 | | | | 1,000.00 | | | | 994.00 | | | | 1,022.19 | | | | 2.73 | | | | 2.77 | | | | 0.55 | |
Expenses paid during the period are equal to the annualized expense ratio for the share class, multiplied by the average account value over the period, then multiplied by the number of days in the fund’s most recent fiscal half-year and divided by 365.
Had the Investment Manager and/or any of its affiliates not waived fees or reimbursed a portion of expenses, account value at the end of the period would have been reduced.
It is important to note that the expense amounts shown in the table are meant to highlight only ongoing costs of investing in the fund and do not reflect any transaction costs, such as sales charges, redemption fees or exchange fees. Therefore, the hypothetical examples provided may not help you determine the relative total costs of owning shares of different funds. If these transaction costs were included, your costs would have been higher.
| * | For the period March 7, 2011 through March 31, 2011. Class B shares and Class T shares commenced operations on March 7, 2011. |
6
Portfolio Managers’ Report – Columbia Bond Fund
For the 12-month period that ended March 31, 2011, the fund’s Class A shares returned 4.83% without sales charge. The fund’s benchmark, the Barclays Capital Aggregate Bond Index, returned 5.12% for the same period. The fund underperformed the 5.99% average return of the funds in its peer group, the Lipper Corporate Debt Funds A Rated Classification. The fund’s relative performance was hurt by its conservative orientation as well as by a rise in interest rates during the second half of the period.
Fed purchases drove rates higher
The beginning of the period was characterized by worries about the sustainability of the economic recovery and persistently high levels of unemployment, during which time rates dropped sharply. The environment changed in November of 2010 as the Federal Reserve Board (the Fed) announced that it would commence a second round of purchases of Treasury securities — some $600 billion of intermediate and long-term Treasuries. This initiative, dubbed “QE2” (quantitative easing), had two negative effects on the fund’s relative performance. One was that long-term interest rates moved higher, counter to the fund’s duration and yield curve positioning. (Duration is a measure of interest rate sensitivity. The yield curve plots yields from short to long.) The second was that the major beneficiary of QE2 was the high-yield sector, in which the fund does not participate. The high-yield rally hurt the fund’s performance vis-à-vis its peer group.
Mortgages, corporates aided performance
On the positive side, the fund benefited from its emphasis on commercial mortgage-backed securities (CMBS). The fund’s holdings in this sector continued to be at the very highest end of the quality spectrum. The same is true of the fund’s long-term corporate bonds, despite an overweight in the financial sector. We were comfortable with an overweight in financials because of the government’s commitment to that area of the market, which we believe improved its risk/reward dynamic.
The fund’s corporate bond holdings were also additive to performance during the period, although these positions were reduced when they became less attractive on a price basis relative to other fixed-income sectors. We made corresponding additions to the fund’s commitment to mortgages, which began the period as an underweight but moved to a neutral position by the summer of 2010. For the year as a whole, Treasury securities were the worst performer in the fixed-income market, so any diversification away from the Treasury sector was helpful.
Performance data quoted represents past performance and current performance may be lower or higher. Past performance is no guarantee of future results. The investment return and principal value will fluctuate so that shares, when redeemed, may be worth more or less than the original cost. Please visit www.columbiamanagement.com for daily and most recent month-end performance updates.
| | | | |
| 30-day SEC yields | | | |
| |
as of 03/31/11 ($) | | | | |
Class A | | | 2.96 | |
Class B | | | — | |
Class C | | | 2.15 | |
Class I | | | 3.48 | |
Class T | | | — | |
Class W | | | 3.97 | |
Class Y | | | 3.93 | |
Class Z | | | 3.34 | |
The 30-day SEC yields reflect the fund’s earning power, net of expenses, expressed as an annualized percentage of the public offering price at the end of the period.
Had the Investment Manager and/or any of its affiliates not waived fees or reimbursed a portion of expenses, the 30-day SEC yields would have been lower.
| | | | |
| Portfolio structure | | | |
| |
as of 03/31/11 (%) | | | | |
Mortgage-Backed Securities | | | 32.4 | |
Corporate Fixed-Income Bonds & Notes | | | 28.4 | |
Government & Agency Obligations | | | 22.0 | |
Commercial Mortgage-Backed Securities | | | 19.2 | |
Asset-Backed Securities | | | 3.0 | |
Municipal Bonds | | | 1.4 | |
Collateralized Mortgage Obligations | | | 0.0 | * |
Preferred Stock | | | 0.2 | |
Short-Term Obligation | | | 0.6 | |
Other Assets & Liabilities, Net | | | (7.2 | ) |
| | * | Rounds to less than 0.1% of net assets. |
7
Portfolio Managers’ Report (continued) – Columbia Bond Fund
| | | | |
| Maturity breakdown | | | |
| |
as of 03/31/11 (%) | | | | |
0-1 year | | | 3.0 | |
1-5 years | | | 42.4 | |
5-10 years | | | 43.1 | |
10-20 years | | | 2.5 | |
20-30 years | | | 8.2 | |
30 years and over | | | 0.8 | |
| | | | |
| Quality breakdown | | | |
| |
as of 03/31/11 (%) | | | | |
Treasury | | | 11.5 | |
Agency | | | 34.3 | |
AAA | | | 23.2 | |
AA | | | 4.8 | |
A | | | 10.3 | |
BBB | | | 15.3 | |
BB | | | 0.2 | |
CCC | | | 0.1 | |
CC | | | 0.1 | |
C | | | 0.2 | |
Non-Rated | | | 0.1 | |
Portfolio structure is calculated as a percentage of net assets.
Quality and maturity breakdowns are calculated as a percentage of total investments.
Ratings shown in the quality breakdown are assigned to individual bonds by taking the lower of the ratings available from one of the following nationally recognized rating agencies: Standard & Poor’s or Moody’s Investor Services. If a security is rated by only one of the two agencies, that rating is used. If a security is not rated by either of the two agencies, it is designated as Non-Rated. Ratings are relative and subjective and are not absolute standards of quality. The credit quality of the fund’s investments does not remove market risk.
The fund is actively managed and the composition of its portfolio will change over time.
Looking ahead
When the Fed curtails its current Treasury purchases, interest rates could begin to rise, especially among intermediate maturities. As a result, we have reduced the fund’s average duration as a defensive measure. Most indicators suggest that the economy will be relatively healthy in the months ahead, but there are several areas of potential concern, notably the housing market, the financial health of state and local governments, and the risk of continued high oil prices. As a result, the fund will maintain its bias toward higher quality investments. Although this bias arguably created an opportunity cost during the past 12 months, a longer-term view reminds us that the fund’s high quality orientation has bolstered results during more difficult market environments and remains a viable strategy when measured across the full spectrum of market cycles.
Portfolio characteristics and holdings are subject to change periodically and may not be representative of current characteristics and holdings. The outlook for the fund may differ from that presented for other Columbia Funds.
Investing in fixed-income securities may involve certain risks, including the credit quality of individual issuers, possible prepayments, market or economic developments and yields and share price fluctuations due to changes in interest rates. When interest rates go up, bond prices typically drop, and vice versa.
8
Investment Portfolio – Columbia Bond Fund
March 31, 2011
Mortgage-Backed Securities – 32.4%
| | | | | | | | |
| | | Par ($) | | | Value ($) | |
| Federal Home Loan Mortgage Corporation | | | | | |
4.000% 12/01/40 | | | 49,958,124 | | | | 49,124,264 | |
5.000% 03/01/21 | | | 42,756 | | | | 45,625 | |
5.429% 05/01/39 (04/01/11) (a)(b) | | | 3,146,631 | | | | 3,354,228 | |
5.500% 06/01/40 | | | 21,071,323 | | | | 22,496,543 | |
5.586% 08/01/37 (04/01/11) (a)(b) | | | 6,142,418 | | | | 6,543,976 | |
5.618% 06/01/37 (04/01/11) (a)(b) | | | 4,774,750 | | | | 5,082,313 | |
6.000% 02/01/39 | | | 4,622,095 | | | | 5,027,166 | |
7.000% 12/01/14 | | | 18,985 | | | | 20,360 | |
7.000% 11/01/25 | | | 3,554 | | | | 4,072 | |
7.000% 03/01/27 | | | 2,376 | | | | 2,727 | |
7.000% 10/01/31 | | | 21,759 | | | | 25,051 | |
7.000% 12/01/35 | | | 784,246 | | | | 897,633 | |
7.500% 09/01/25 | | | 1,261 | | | | 1,456 | |
7.500% 10/01/29 | | | 77,819 | | | | 90,131 | |
8.000% 06/01/26 | | | 1,576 | | | | 1,861 | |
9.500% 09/01/16 | | | 499 | | | | 573 | |
| | |
| TBA, | | | | | | | | |
5.500% 04/01/41 (c) | | | 144,450,000 | | | | 154,064,881 | |
| |
| Federal National Mortgage Association | | | | | |
2.574% 08/01/36 (04/01/11) (a)(b) | | | 118,971 | | | | 120,491 | |
4.000% 12/01/40 | | | 26,947,145 | | | | 26,553,092 | |
4.000% 02/01/41 | | | 23,057,160 | | | | 22,719,992 | |
4.500% 04/01/40 | | | 8,330,910 | | | | 8,513,378 | |
4.500% 05/01/40 | | | 13,465,978 | | | | 13,820,565 | |
4.500% 06/01/40 | | | 25,012,081 | | | | 25,536,460 | |
4.500% 07/01/40 | | | 13,891,108 | | | | 14,182,336 | |
4.680% 12/01/12 | | | 1,182,952 | | | | 1,231,654 | |
4.760% 09/01/19 | | | 5,842,760 | | | | 6,127,554 | |
4.770% 06/01/19 | | | 6,013,879 | | | | 6,327,158 | |
4.826% 04/01/38 (04/01/11) (a)(b) | | | 4,218,186 | | | | 4,456,265 | |
4.900% 04/01/38 (04/01/11) (a)(b) | | | 5,573,420 | | | | 5,885,067 | |
5.000% 07/01/40 | | | 80,724,227 | | | | 85,155,708 | |
5.000% 09/01/40 (c) | | | 7,000,000 | | | | 7,331,857 | |
5.500% 06/01/35 | | | 341,182 | | | | 366,645 | |
5.500% 08/01/37 | | | 26,690,559 | | | | 28,707,560 | |
5.500% 01/01/40 | | | 13,000,028 | | | | 13,917,438 | |
5.500% 08/01/40 | | | 2,023,605 | | | | 2,166,411 | |
5.771% 09/01/37 (04/01/11) (a)(b) | | | 3,661,654 | | | | 3,930,258 | |
6.000% 05/01/37 | | | 13,785,106 | | | | 15,019,051 | |
6.000% 05/01/38 | | | 18,880,946 | | | | 20,571,034 | |
6.000% 07/01/38 | | | 50,556,327 | | | | 55,081,769 | |
6.000% 08/01/38 | | | 34,851,171 | | | | 37,959,909 | |
6.000% 09/01/38 (c) | | | 13,131,327 | | | | 14,306,750 | |
6.000% 12/01/38 | | | 10,423,160 | | | | 11,378,968 | |
6.000% 04/01/40 (c) | | | 6,868,884 | | | | 7,491,679 | |
6.500% 02/01/13 | | | 30,099 | | | | 31,330 | |
7.000% 06/01/32 | | | 12,155 | | | | 14,000 | |
7.500% 10/01/15 | | | 12,951 | | | | 14,338 | |
7.500% 10/01/29 | | | 41,991 | | | | 48,715 | |
| | | | | | | | |
| | | Par ($) | | | Value ($) | |
7.500% 01/01/30 | | | 11,641 | | | | 13,505 | |
7.785% 02/01/19 | | | 1,507,569 | | | | 1,654,284 | |
8.000% 12/01/29 | | | 202,187 | | | | 235,993 | |
8.000% 02/01/30 | | | 17,588 | | | | 20,561 | |
8.000% 03/01/30 | | | 32,180 | | | | 37,630 | |
8.000% 04/01/30 | | | 46,482 | | | | 54,353 | |
8.000% 05/01/30 | | | 10,742 | | | | 12,561 | |
8.500% 08/01/17 | | | 779 | | | | 865 | |
10.000% 10/01/20 | | | 50,880 | | | | 56,336 | |
10.000% 12/01/20 | | | 117,332 | | | | 132,018 | |
| |
| TBA: | | | | | |
4.500% 04/01/41 (c) | | | 8,500,000 | | | | 8,650,076 | |
5.000% 04/01/41 (c) | | | 24,000,000 | | | | 25,110,000 | |
| |
| Government National Mortgage Association | | | | | |
2.625% 07/20/21 (04/01/11) (a)(b) | | | 33,480 | | | | 34,569 | |
2.625% 07/20/22 (04/01/11) (a)(b) | | | 42,616 | | | | 44,003 | |
3.375% 04/20/22 (04/01/11) (a)(b) | | | 178,761 | | | | 185,904 | |
3.375% 04/20/28 (04/01/11) (a)(b) | | | 8,458 | | | | 8,796 | |
3.375% 06/20/28 (04/01/11) (a)(b) | | | 69,070 | | | | 71,829 | |
4.500% 06/15/39 | | | 28,904,417 | | | | 29,872,413 | |
4.500% 09/15/40 | | | 53,436,479 | | | | 55,226,040 | |
4.500% 03/15/41 (c) | | | 11,553,570 | | | | 11,940,499 | |
6.000% 03/20/28 | | | 143,080 | | | | 157,174 | |
6.500% 05/15/23 | | | 1,314 | | | | 1,490 | |
6.500% 05/15/28 | | | 80,016 | | | | 90,618 | |
6.500% 06/15/28 | | | 35,272 | | | | 39,946 | |
6.500% 12/15/31 | | | 65,065 | | | | 73,686 | |
6.500% 04/15/32 | | | 21,246 | | | | 24,062 | |
7.000% 05/15/12 | | | 5,697 | | | | 5,903 | |
7.000% 09/15/13 | | | 9,857 | | | | 10,413 | |
7.000% 11/15/22 | | | 38,245 | | | | 43,594 | |
7.000% 10/15/23 | | | 7,884 | | | | 9,057 | |
7.000% 06/15/26 | | | 117,600 | | | | 135,599 | |
7.000% 10/15/27 | | | 13,477 | | | | 15,559 | |
7.000% 05/15/28 | | | 26,724 | | | | 30,882 | |
7.000% 06/15/28 | | | 6,176 | | | | 7,138 | |
7.000% 12/15/28 | | | 35,894 | | | | 41,480 | |
7.000% 05/15/29 | | | 100,820 | | | | 116,590 | |
7.000% 08/15/29 | | | 19,545 | | | | 22,602 | |
7.000% 02/15/30 | | | 4,311 | | | | 4,988 | |
7.000% 05/15/32 | | | 79,368 | | | | 91,753 | |
7.500% 04/15/26 | | | 85,639 | | | | 99,352 | |
7.500% 02/15/27 | | | 12,479 | | | | 14,494 | |
7.500% 03/15/28 | | | 42,486 | | | | 49,396 | |
7.500% 09/15/29 | | | 252,392 | | | | 293,705 | |
7.500% 03/15/30 | | | 76,554 | | | | 89,165 | |
8.000% 05/15/23 | | | 1,181 | | | | 1,382 | |
8.000% 06/15/25 | | | 2,922 | | | | 3,429 | |
8.000% 10/15/25 | | | 16,590 | | | | 19,495 | |
8.000% 01/15/26 | | | 5,510 | | | | 6,466 | |
See Accompanying Notes to Financial Statements.
9
Columbia Bond Fund
March 31, 2011
Mortgage-Backed Securities (continued)
| | | | | | | | |
| | | Par ($) | | | Value ($) | |
8.000% 02/15/26 | | | 1,955 | | | | 2,295 | |
8.000% 06/15/26 | | | 7,866 | | | | 9,234 | |
8.000% 03/15/27 | | | 11,773 | | | | 13,823 | |
8.000% 01/15/30 | | | 163,119 | | | | 192,204 | |
8.500% 01/15/17 | | | 3,617 | | | | 3,657 | |
8.500% 04/15/17 | | | 4,466 | | | | 4,542 | |
8.500% 06/15/17 | | | 156,743 | | | | 179,470 | |
8.500% 11/15/17 | | | 64,610 | | | | 72,947 | |
8.500% 12/15/17 | | | 312,206 | | | | 352,494 | |
9.000% 11/15/17 | | | 25,727 | | | | 29,098 | |
9.000% 12/15/17 | | | 269,019 | | | | 304,243 | |
9.000% 06/15/30 | | | 26,640 | | | | 32,151 | |
9.500% 11/15/17 | | | 265,057 | | | | 305,467 | |
9.500% 08/15/20 | | | 1,649 | | | | 1,958 | |
9.500% 12/15/20 | | | 1,039 | | | | 1,234 | |
10.000% 05/15/16 | | | 2,201 | | | | 2,214 | |
10.000% 07/15/17 | | | 12,294 | | | | 13,741 | |
11.500% 06/15/13 | | | 9,422 | | | | 9,485 | |
| | | | | | | | |
Total Mortgage-Backed Securities
(cost of $826,126,347) | | | | 822,142,202 | |
|
Corporate Fixed-Income Bonds & Notes – 28.4% | |
| | | | | | | | |
| Basic Materials – 1.4% | | | | | | | | |
| Chemicals – 0.8% | | | | | | | | |
| Dow Chemical Co. | | | | | | | | |
4.250% 11/15/20 | | | 2,730,000 | | | | 2,607,240 | |
5.700% 05/15/18 | | | 2,485,000 | | | | 2,677,839 | |
5.900% 02/15/15 | | | 3,365,000 | | | | 3,729,628 | |
8.550% 05/15/19 | | | 4,027,000 | | | | 5,090,305 | |
9.400% 05/15/39 | | | 200,000 | | | | 296,973 | |
| | |
| Lubrizol Corp. | | | | | | | | |
8.875% 02/01/19 | | | 4,855,000 | | | | 6,239,869 | |
| | | | | | | | |
Chemicals Total | | | | | | | 20,641,854 | |
| | |
| Iron/Steel – 0.5% | | | | | | | | |
| ArcelorMittal | | | | | | | | |
6.750% 03/01/41 | | | 1,485,000 | | | | 1,455,361 | |
7.000% 10/15/39 | | | 3,845,000 | | | | 3,855,289 | |
| Nucor Corp. | | | | | | | | |
5.000% 06/01/13 | | | 2,255,000 | | | | 2,425,818 | |
5.850% 06/01/18 | | | 4,050,000 | | | | 4,617,292 | |
| | | | | | | | |
Iron/Steel Total | | | | | | | 12,353,760 | |
| | |
| Metals & Mining – 0.1% | | | | | | | | |
| Vale Overseas Ltd. | | | | | | | | |
6.875% 11/21/36 | | | 3,370,000 | | | | 3,588,582 | |
| | | | | | | | |
Metals & Mining Total | | | | | | | 3,588,582 | |
| | | | | | | | |
Basic Materials Total | | | | | | | 36,584,196 | |
| | | | | | | | |
| | | | | | | | |
| | | Par ($) | | | Value ($) | |
| Communications – 5.3% | | | | | | | | |
| Media ��� 2.6% | | | | | | | | |
| Comcast Corp. | | | | | | | | |
5.150% 03/01/20 | | | 2,175,000 | | | | 2,264,090 | |
5.850% 11/15/15 | | | 7,410,000 | | | | 8,251,724 | |
6.950% 08/15/37 | | | 730,000 | | | | 794,739 | |
| | |
| DirecTV Holdings LLC | | | | | | | | |
3.125% 02/15/16 | | | 3,170,000 | | | | 3,124,029 | |
6.375% 06/15/15 | | | 1,290,000 | | | | 1,333,538 | |
| | |
| NBC Universal, Inc. | | | | | | | | |
2.875% 04/01/16 (d) | | | 21,495,000 | | | | 20,998,616 | |
| | |
| News America, Inc. | | | | | | | | |
6.150% 02/15/41 (d) | | | 6,450,000 | | | | 6,396,104 | |
6.400% 12/15/35 | | | 4,335,000 | | | | 4,460,060 | |
6.550% 03/15/33 | | | 1,295,000 | | | | 1,360,109 | |
| | |
| Time Warner Cable, Inc. | | | | | | | | |
3.500% 02/01/15 | | | 3,105,000 | | | | 3,181,933 | |
5.850% 05/01/17 | | | 4,465,000 | | | | 4,883,366 | |
5.875% 11/15/40 | | | 4,000,000 | | | | 3,758,596 | |
7.300% 07/01/38 | | | 1,855,000 | | | | 2,053,765 | |
| | |
| Time Warner Companies., Inc. | | | | | | | | |
7.250% 10/15/17 | | | 593,000 | | | | 697,874 | |
| | |
| Time Warner, Inc. | | | | | | | | |
6.500% 11/15/36 | | | 3,885,000 | | | | 3,993,834 | |
| | | | | | | | |
Media Total | | | | | | | 67,552,377 | |
| |
| Telecommunication Services – 2.7% | | | | | |
| AT&T, Inc. | | | | | | | | |
5.500% 02/01/18 | | | 3,600,000 | | | | 3,929,742 | |
5.625% 06/15/16 | | | 2,275,000 | | | | 2,544,947 | |
6.550% 02/15/39 | | | 3,555,000 | | | | 3,705,156 | |
| | |
| BellSouth Corp. | | | | | | | | |
5.200% 09/15/14 | | | 7,990,000 | | | | 8,736,058 | |
|
| British Telecommunications PLC | |
5.150% 01/15/13 | | | 4,285,000 | | | | 4,558,653 | |
5.950% 01/15/18 | | | 8,970,000 | | | | 9,895,821 | |
|
| Cellco Partnership/Verizon Wireless Capital LLC | |
5.550% 02/01/14 | | | 3,150,000 | | | | 3,458,826 | |
8.500% 11/15/18 | | | 2,105,000 | | | | 2,704,533 | |
| |
| Telefonica Emisiones SAU | | | | | |
5.134% 04/27/20 | | | 4,135,000 | | | | 4,114,151 | |
6.221% 07/03/17 | | | 1,105,000 | | | | 1,205,489 | |
6.421% 06/20/16 | | | 4,975,000 | | | | 5,528,210 | |
See Accompanying Notes to Financial Statements.
10
Columbia Bond Fund
March 31, 2011
Corporate Fixed-Income Bonds & Notes (continued)
| | | | | | | | |
| | | Par ($) | | | Value ($) | |
| Communications (continued) | | | | | | | | |
| Verizon Communications, Inc. | | | | | |
3.000% 04/01/16 | | | 16,245,000 | | | | 16,162,232 | |
4.600% 04/01/21 | | | 1,140,000 | | | | 1,135,120 | |
| | | | | | | | |
Telecommunication Services Total | | | | 67,678,938 | |
| | | | | | | | |
Communications Total | | | | 135,231,315 | |
| | | | | | | | |
| Consumer Cyclical – 0.5% | | | | | |
| Airlines – 0.0% | | | | | | | | |
| Continental Airlines, Inc. | | | | | | | | |
7.461% 10/01/16 | | | 464,456 | | | | 469,101 | |
| | | | | | | | |
Airlines Total | | | | | | | 469,101 | |
| | |
| Home Builders – 0.0% | | | | | | | | |
| D.R. Horton, Inc. | | | | | | | | |
5.625% 09/15/14 | | | 365,000 | | | | 381,425 | |
| | | | | | | | |
Home Builders Total | | | | | | | 381,425 | |
| | |
| Retail – 0.5% | | | | | | | | |
| CVS Pass-Through Trust | | | | | | | | |
5.298% 01/11/27 (d) | | | 639,385 | | | | 646,084 | |
8.353% 07/10/31 (d) | | | 4,487,534 | | | | 5,362,199 | |
| | |
| Macy’s Retail Holdings, Inc. | | | | | | | | |
5.350% 03/15/12 | | | 455,000 | | | | 468,650 | |
| | |
| McDonald’s Corp. | | | | | | | | |
4.875% 07/15/40 | | | 2,945,000 | | | | 2,780,548 | |
5.000% 02/01/19 | | | 200,000 | | | | 218,136 | |
5.700% 02/01/39 | | | 2,245,000 | | | | 2,381,498 | |
| | | | | | | | |
Retail Total | | | | | | | 11,857,115 | |
| | | | | | | | |
Consumer Cyclical Total | | | | | | | 12,707,641 | |
| | | | | | | | |
| Consumer Non-cyclical – 2.7% | | | | | |
| Beverages – 0.6% | | | | | | | | |
| Anheuser-Busch InBev Worldwide, Inc. | | | | | |
3.625% 04/15/15 | | | 10,350,000 | | | | 10,709,000 | |
7.200% 01/15/14 | | | 625,000 | | | | 710,042 | |
7.750% 01/15/19 | | | 2,180,000 | | | | 2,682,072 | |
| | |
| PepsiCo, Inc. | | | | | | | | |
4.500% 01/15/20 | | | 1,995,000 | | | | 2,081,509 | |
| | | | | | | | |
Beverages Total | | | | | | | 16,182,623 | |
| | |
| Commercial Services – 0.2% | | | | | | | | |
| President and Fellows of Harvard College | | | | | |
4.875% 10/15/40 | | | 3,490,000 | | | | 3,334,905 | |
6.500% 01/15/39 (d) | | | 1,160,000 | | | | 1,395,770 | |
| | | | | | | | |
Commercial Services Total | | | | | | | 4,730,675 | |
| | | | | | | | |
| | | Par ($) | | | Value ($) | |
| Food – 1.4% | | | | | | | | |
| ConAgra Foods, Inc. | | | | | | | | |
7.000% 10/01/28 | | | 3,850,000 | | | | 4,137,410 | |
| | |
| General Mills, Inc. | | | | | | | | |
5.200% 03/17/15 | | | 9,080,000 | | | | 9,972,728 | |
| | |
| Kraft Foods, Inc. | | | | | | | | |
4.125% 02/09/16 | | | 9,595,000 | | | | 9,955,100 | |
| | |
| Kroger Co. | | | | | | | | |
3.900% 10/01/15 | | | 10,560,000 | | | | 10,960,847 | |
| | | | | | | | |
Food Total | | | | | | | 35,026,085 | |
| | |
| Healthcare Services – 0.1% | | | | | | | | |
| UnitedHealth Group, Inc. | | | | | | | | |
6.000% 02/15/18 | | | 2,260,000 | | | | 2,513,662 | |
| | | | | | | | |
Healthcare Services Total | | | | | | | 2,513,662 | |
| | |
| Pharmaceuticals – 0.4% | | | | | | | | |
| Novartis Securities Investment Ltd. | | | | | |
5.125% 02/10/19 | | | 6,940,000 | | | | 7,512,536 | |
| | |
| Wyeth | | | | | | | | |
5.500% 02/15/16 | | | 1,755,000 | | | | 1,963,812 | |
| | | | | | | | |
Pharmaceuticals Total | | | | | | | 9,476,348 | |
| | | | | | | | |
Consumer Non-cyclical Total | | | | 67,929,393 | |
| | | | | | | | |
| Energy – 2.3% | | | | | | | | |
| Oil & Gas – 1.1% | | | | | | | | |
| Canadian Natural Resources Ltd. | | | | | | | | |
6.250% 03/15/38 | | | 5,425,000 | | | | 5,842,513 | |
| | |
| Devon Energy Corp. | | | | | | | | |
6.300% 01/15/19 | | | 1,510,000 | | | | 1,769,672 | |
| | |
| Nexen, Inc. | | | | | | | | |
5.875% 03/10/35 | | | 1,260,000 | | | | 1,195,983 | |
7.500% 07/30/39 | | | 2,180,000 | | | | 2,454,730 | |
| | |
| Qatar Petroleum | | | | | | | | |
5.579% 05/30/11 (d) | | | 310,804 | | | | 312,424 | |
| | |
| Ras Laffan Liquefied Natural Gas Co., Ltd. III | | | | | | | | |
5.832% 09/30/16 (d) | | | 1,790,265 | | | | 1,919,164 | |
| | |
| Shell International Finance BV | | | | | | | | |
5.500% 03/25/40 | | | 5,205,000 | | | | 5,274,575 | |
| | |
| Talisman Energy, Inc. | | | | | | | | |
5.850% 02/01/37 | | | 2,685,000 | | | | 2,667,760 | |
7.750% 06/01/19 | | | 5,404,000 | | | | 6,593,885 | |
| | | | | | | | |
Oil & Gas Total | | | | | | | 28,030,706 | |
See Accompanying Notes to Financial Statements.
11
Columbia Bond Fund
March 31, 2011
Corporate Fixed-Income Bonds & Notes (continued)
��
| | | | | | | | |
| | | Par ($) | | | Value ($) | |
| Energy (continued) | | | | | | | | |
| Oil & Gas Services – 0.4% | | | | | | | | |
| Halliburton Co. | | | | | | | | |
5.900% 09/15/18 | | | 1,495,000 | | | | 1,696,444 | |
| | |
| Hess Corp. | | | | | | | | |
5.600% 02/15/41 | | | 2,205,000 | | | | 2,106,507 | |
7.300% 08/15/31 | | | 2,870,000 | | | | 3,364,966 | |
| |
| Weatherford International Ltd./Bermuda | | | | | |
5.125% 09/15/20 | | | 1,070,000 | | | | 1,062,462 | |
5.150% 03/15/13 | | | 106,000 | | | | 112,195 | |
7.000% 03/15/38 | | | 1,035,000 | | | | 1,096,248 | |
| | | | | | | | |
Oil & Gas Services Total | | | | | | | 9,438,822 | |
| | |
| Pipelines – 0.8% | | | | | | | | |
| Energy Transfer Partners LP | | | | | | | | |
6.000% 07/01/13 | | | 230,000 | | | | 249,872 | |
| | |
| Kinder Morgan Energy Partners LP | | | | | | | | |
5.625% 02/15/15 | | | 1,210,000 | | | | 1,335,100 | |
6.500% 09/01/39 | | | 465,000 | | | | 476,568 | |
6.950% 01/15/38 | | | 2,600,000 | | | | 2,802,782 | |
| |
| Plains All American Pipeline LP/PAA Finance Corp. | | | | | |
5.750% 01/15/20 | | | 640,000 | | | | 684,976 | |
6.500% 05/01/18 | | | 1,420,000 | | | | 1,596,253 | |
8.750% 05/01/19 | | | 3,125,000 | | | | 3,909,531 | |
| | |
| Southern Natural Gas Co. | | | | | | | | |
8.000% 03/01/32 | | | 3,015,000 | | | | 3,679,063 | |
| | |
| TransCanada Pipelines Ltd. | | | | | | | | |
6.350% 05/15/67 (05/15/15) (a)(b) | | | 7,240,000 | | | | 7,269,510 | |
| | | | | | | | |
Pipelines Total | | | | | | | 22,003,655 | |
| | | | | | | | |
Energy Total | | | | | | | 59,473,183 | |
| | | | | | | | |
| Financials – 10.5% | | | | | | | | |
Banks – 7.0% | | | | | | | | |
Bank of New York Mellon Corp. | | | | | | | | |
5.450% 05/15/19 | | | 4,385,000 | | | | 4,810,021 | |
| | |
| Barclays Bank PLC | | | | | | | | |
3.900% 04/07/15 | | | 3,065,000 | | | | 3,170,543 | |
5.000% 09/22/16 | | | 2,305,000 | | | | 2,443,717 | |
| | |
| Capital One Capital IV | | | | | | | | |
6.745% 02/17/37 (02/17/32) (a)(b) | | | 5,875,000 | | | | 5,897,031 | |
| | |
| Capital One Capital V | | | | | | | | |
10.250% 08/15/39 | | | 4,490,000 | | | | 4,871,650 | |
| | |
| Capital One Financial Corp. | | | | | | | | |
5.700% 09/15/11 | | | 4,720,000 | | | | 4,824,572 | |
7.375% 05/23/14 | | | 1,115,000 | | | | 1,279,789 | |
| | | | | | | | |
| | | Par ($) | | | Value ($) | |
| Citigroup, Inc. | | | | | | | | |
5.625% 08/27/12 | | | 17,055,000 | | | | 17,928,335 | |
| | |
| Comerica Bank | | | | | | | | |
5.200% 08/22/17 | | | 2,570,000 | | | | 2,724,418 | |
| | |
| Discover Bank/Greenwood DE | | | | | | | | |
8.700% 11/18/19 | | | 8,420,000 | | | | 10,087,690 | |
| | |
| Discover Financial Services | | | | | | | | |
10.250% 07/15/19 | | | 1,490,000 | | | | 1,916,837 | |
| | |
| Fifth Third Bancorp | | | | | | | | |
3.625% 01/25/16 | | | 5,075,000 | | | | 5,070,529 | |
| | |
| Goldman Sachs Group, Inc. | | | | | | | | |
3.250% 06/15/12 | | | 2,505,000 | | | | 2,587,895 | |
| | |
| HSBC USA, Inc. | | | | | | | | |
9.500% 04/15/14 | | | 2,700,000 | | | | 3,111,342 | |
| | |
| ING Bank NV | | | | | | | | |
4.000% 03/15/16 (d) | | | 5,340,000 | | | | 5,332,540 | |
| | |
| JPMorgan Chase & Co. | | | | | | | | |
5.150% 10/01/15 | | | 4,030,000 | | | | 4,316,960 | |
7.900% 04/29/49 (04/30/18) (a)(b) | | | 1,780,000 | | | | 1,947,516 | |
| | |
| JPMorgan Chase Capital XVIII | | | | | | | | |
6.950% 08/17/36 | | | 380,000 | | | | 386,891 | |
| | |
| JPMorgan Chase Capital XX | | | | | | | | |
6.550% 09/15/66 | | | 1,045,000 | | | | 1,062,132 | |
| | |
| JPMorgan Chase Capital XXII | | | | | | | | |
6.450% 02/02/37 | | | 290,000 | | | | 291,856 | |
| | |
| JPMorgan Chase Capital XXIII | | | | | | | | |
1.313% 05/15/77 (05/16/11) (a)(b) | | | 1,065,000 | | | | 881,506 | |
| | |
| KeyCorp | | | | | | | | |
5.100% 03/24/21 | | | 15,260,000 | | | | 15,165,800 | |
| | |
| Kreditanstalt Fuer Weideraufbau | | | | | | | | |
1.875% 01/14/13 | | | 1,705,000 | | | | 1,735,866 | |
| | |
| Lloyds TSB Bank PLC | | | | | | | | |
4.375% 01/12/15 (d) | | | 7,550,000 | | | | 7,689,849 | |
| | |
| Marshall & IIsley Bank | | | | | | | | |
5.300% 09/08/11 | | | 1,076,000 | | | | 1,081,663 | |
| | |
| Merrill Lynch & Co., Inc. | | | | | | | | |
5.000% 02/03/14 | | | 7,365,000 | | | | 7,840,286 | |
5.700% 05/02/17 | | | 2,515,000 | | | | 2,610,024 | |
6.150% 04/25/13 | | | 1,400,000 | | | | 1,508,107 | |
| | |
| National City Bank | | | | | | | | |
6.200% 12/15/11 | | | 715,000 | | | | 741,953 | |
See Accompanying Notes to Financial Statements.
12
Columbia Bond Fund
March 31, 2011
Corporate Fixed-Income Bonds & Notes (continued)
| | | | | | | | |
| | | Par ($) | | | Value ($) | |
| Financials (continued) | | | | | | | | |
| National City Corp. | | | | | | | | |
4.900% 01/15/15 | | | 2,490,000 | | | | 2,676,740 | |
6.875% 05/15/19 | | | 1,765,000 | | | | 2,014,919 | |
| | |
| Northern Trust Co. | | | | | | | | |
6.500% 08/15/18 | | | 275,000 | | | | 316,733 | |
| | |
| Northern Trust Corp. | | | | | | | | |
5.500% 08/15/13 | | | 3,565,000 | | | | 3,903,187 | |
| | |
| PNC Funding Corp. | | | | | | | | |
3.625% 02/08/15 | | | 3,570,000 | | | | 3,690,834 | |
5.125% 02/08/20 | | | 4,635,000 | | | | 4,878,671 | |
| |
| Santander U.S. Debt SA Unipersonal | | | | | |
3.724% 01/20/15 (d) | | | 2,725,000 | | | | 2,635,211 | |
3.781% 10/07/15 (d) | | | 9,485,000 | | | | 9,114,500 | |
| |
| Scotland International Finance No. 2 BV | | | | | |
4.250% 05/23/13 (d) | | | 1,700,000 | | | | 1,675,593 | |
| | |
| State Street Corp. | | | | | | | | |
2.875% 03/07/16 | | | 2,425,000 | | | | 2,408,995 | |
4.956% 03/15/18 | | | 3,590,000 | | | | 3,699,351 | |
| | |
| Wells Fargo & Co. | | | | | | | | |
3.676% 06/15/16 | | | 17,405,000 | | | | 17,507,864 | |
| | | | | | | | |
Banks Total | | | | | | | 177,839,916 | |
| |
| Diversified Financial Services – 0.7% | | | | | |
| Eaton Vance Corp. | | | | | | | | |
6.500% 10/02/17 | | | 1,465,000 | | | | 1,659,375 | |
| | |
| ERAC USA Finance LLC | | | | | | | | |
2.750% 07/01/13 (d) | | | 4,655,000 | | | | 4,730,290 | |
5.250% 10/01/20 (d) | | | 4,285,000 | | | | 4,413,557 | |
| | |
| General Electric Capital Corp. | | | | | | | | |
4.375% 09/16/20 | | | 3,970,000 | | | | 3,858,046 | |
| | |
| Lehman Brothers Holdings, Inc. | | | | | | | | |
5.625% 01/24/13 (e) | | | 5,395,000 | | | | 1,402,700 | |
6.875% 05/02/18 (e) | | | 505,000 | | | | 132,562 | |
| | | | | | | | |
Diversified Financial Services Total | | | | | | | 16,196,530 | |
| | |
| Insurance – 2.1% | | | | | | | | |
| CNA Financial Corp. | | | | | | | | |
5.750% 08/15/21 | | | 1,270,000 | | | | 1,300,246 | |
5.850% 12/15/14 | | | 1,595,000 | | | | 1,719,668 | |
7.350% 11/15/19 | | | 4,780,000 | | | | 5,398,460 | |
| | |
| ING Groep NV | | | | | | | | |
5.775% 12/29/49 (12/08/15) (a)(b) | | | 6,365,000 | | | | 5,887,625 | |
| | | | | | | | |
| | | Par ($) | | | Value ($) | |
| Liberty Mutual Group, Inc. | | | | | | | | |
7.500% 08/15/36 (d) | | | 5,785,000 | | | | 6,189,950 | |
10.750% 06/15/58 (a)(d) | | | 1,310,000 | | | | 1,703,000 | |
| | |
| Lincoln National Corp. | | | | | | | | |
8.750% 07/01/19 | | | 4,575,000 | | | | 5,793,140 | |
| | |
| MetLife Capital Trust X | | | | | | | | |
9.250% 04/08/38 (a)(d) | | | 1,470,000 | | | | 1,775,025 | |
| | |
| MetLife, Inc. | | | | | | | | |
10.750% 08/01/69 | | | 4,070,000 | | | | 5,616,600 | |
| | |
| Prudential Financial, Inc. | | | | | | | | |
7.375% 06/15/19 | | | 4,840,000 | | | | 5,682,722 | |
8.875% 06/15/38 (06/15/18) (a)(b) | | | 2,280,000 | | | | 2,690,400 | |
| | |
| Transatlantic Holdings, Inc. | | | | | | | | |
8.000% 11/30/39 | | | 5,745,000 | | | | 6,032,997 | |
| | |
| Unum Group | | | | | | | | |
7.125% 09/30/16 | | | 3,845,000 | | | | 4,334,599 | |
| | | | | | | | |
Insurance Total | | | | | | | 54,124,432 | |
| | |
| Real Estate Investment Trusts (REITs) – 0.7% | | | | | | | | |
| Brandywine Operating Partnership LP | | | | | |
7.500% 05/15/15 | | | 4,560,000 | | | | 5,151,883 | |
| | |
| Duke Realty LP | | | | | | | | |
7.375% 02/15/15 | | | 755,000 | | | | 856,961 | |
8.250% 08/15/19 | | | 8,537,600 | | | | 10,252,958 | |
| | |
| Highwoods Properties, Inc. | | | | | | | | |
5.850% 03/15/17 | | | 945,000 | | | | 1,005,732 | |
| | | | | | | | |
Real Estate Investment Trusts (REITs) Total | | | | | | | 17,267,534 | |
| | | | | | | | |
Financials Total | | | | | | | 265,428,412 | |
| | | | | | | | |
| Industrials – 1.8% | | | | | | | | |
| Aerospace & Defense – 0.5% | | | | | | | | |
| Embraer Overseas Ltd. | | | | | | | | |
6.375% 01/15/20 | | | 4,025,000 | | | | 4,326,875 | |
| | |
| L-3 Communications Corp. | | | | | | | | |
4.950% 02/15/21 | | | 6,005,000 | | | | 6,040,039 | |
| | |
| Raytheon Co. | | | | | | | | |
7.200% 08/15/27 | | | 2,115,000 | | | | 2,624,838 | |
| | | | | | | | |
Aerospace & Defense Total | | | | | | | 12,991,752 | |
| |
| Miscellaneous Manufacturing – 0.4% | | | | | |
| Ingersoll-Rand Global Holding Co., Ltd. | �� | | | | |
9.500% 04/15/14 | | | 5,145,000 | | | | 6,174,941 | |
See Accompanying Notes to Financial Statements.
13
Columbia Bond Fund
March 31, 2011
Corporate Fixed-Income Bonds & Notes (continued)
| | | | | | | | |
| | | Par ($) | | | Value ($) | |
| Industrials (continued) | | | | | | | | |
| Tyco International Ltd./Tyco International Finance SA | | | | | | | | |
6.875% 01/15/21 | | | 3,250,000 | | | | 3,882,177 | |
| | | | | | | | |
Miscellaneous Manufacturing Total | | | | | | | 10,057,118 | |
| | |
| Transportation – 0.9% | | | | | | | | |
| BNSF Funding Trust I | | | | | | | | |
6.613% 12/15/55 (01/15/26) (a)(b) | | | 5,970,000 | | | | 6,201,337 | |
| | |
| Burlington Northern Santa Fe Corp. | | | | | | | | |
6.750% 07/15/11 | | | 805,000 | | | | 819,715 | |
7.950% 08/15/30 | | | 1,200,000 | | | | 1,523,923 | |
| |
| CSX Corp. | | | | | |
6.250% 04/01/15 | | | 7,215,000 | | | | 8,156,998 | |
| |
| Union Pacific Corp. | | | | | |
5.700% 08/15/18 | | | 1,335,000 | | | | 1,494,734 | |
7.875% 01/15/19 | | | 2,725,000 | | | | 3,401,604 | |
| | | | | | | | |
Transportation Total | | | | | | | 21,598,311 | |
| | | | | | | | |
Industrials Total | | | | | | | 44,647,181 | |
| | | | | | | | |
| Technology – 0.5% | | | | | | | | |
| Networking Products – 0.1% | | | | | | | | |
| Cisco Systems, Inc. | | | | | | | | |
5.500% 01/15/40 | | | 175,000 | | | | 171,760 | |
5.900% 02/15/39 | | | 2,455,000 | | | | 2,547,468 | |
| | | | | | | | |
Networking Products Total | | | | | | | 2,719,228 | |
| |
| Office/Business Equipment – 0.1% | | | | | |
| Xerox Corp. | | | | | |
6.400% 03/15/16 | | | 1,440,000 | | | | 1,632,181 | |
| | | | | | | | |
Office/Business Equipment Total | | | | | | | 1,632,181 | |
| | |
| Software – 0.3% | | | | | | | | |
| Oracle Corp. | | | | | |
5.375% 07/15/40 (d) | | | 2,590,000 | | | | 2,517,192 | |
6.500% 04/15/38 | | | 4,670,000 | | | | 5,237,648 | |
| | | | | | | | |
Software Total | | | | | | | 7,754,840 | |
| | | | | | | | |
Technology Total | | | | | | | 12,106,249 | |
| | | | | | | | |
| Utilities – 3.4% | | | | | | | | |
| Electric – 2.9% | | | | | | | | |
| American Electric Power Co., Inc. | | | | | |
5.250% 06/01/15 | | | 5,060,000 | | | | 5,484,812 | |
| | |
| Carolina Power & Light Co. | | | | | | | | |
5.125% 09/15/13 | | | 2,545,000 | | | | 2,762,073 | |
| Columbus Southern Power Co. | | | | | | | | |
0.709% 03/16/12 (06/16/11) (a)(b) | | | 1,895,000 | | | | 1,899,631 | |
| | | | | | | | |
| | | Par ($) | | | Value ($) | |
| Commonwealth Edison Co. | | | | | | | | |
4.000% 08/01/20 | | | 5,425,000 | | | | 5,238,494 | |
5.900% 03/15/36 | | | 750,000 | | | | 763,976 | |
5.950% 08/15/16 | | | 3,685,000 | | | | 4,135,860 | |
6.150% 09/15/17 | | | 1,975,000 | | | | 2,210,387 | |
6.950% 07/15/18 | | | 1,495,000 | | | | 1,651,305 | |
| |
| Consolidated Edison Co. of New York, Inc. | | | | | |
6.750% 04/01/38 | | | 180,000 | | | | 212,360 | |
| | |
| Detroit Edison Co. | | | | | | | | |
3.450% 10/01/20 | | | 6,650,000 | | | | 6,265,936 | |
| | |
| Dominion Resources, Inc. | | | | | | | | |
5.200% 08/15/19 | | | 335,000 | | | | 357,084 | |
| | |
| Duke Energy Carolinas LLC | | | | | | | | |
5.100% 04/15/18 | | | 1,000,000 | | | | 1,092,138 | |
5.250% 01/15/18 | | | 1,485,000 | | | | 1,630,745 | |
5.300% 10/01/15 | | | 355,000 | | | | 395,665 | |
| | |
| Exelon Generation Co., LLC | | | | | | | | |
6.200% 10/01/17 | | | 925,000 | | | | 1,024,640 | |
| | |
| FPL Energy National Wind LLC | | | | | | | | |
5.608% 03/10/24 (d) | | | 635,690 | | | | 633,179 | |
| | |
| Georgia Power Co. | | | | | | | | |
4.750% 09/01/40 | | | 5,805,000 | | | | 5,198,482 | |
5.700% 06/01/17 | | | 1,185,000 | | | | 1,329,507 | |
| | |
| Hydro Quebec | | | | | | | | |
8.500% 12/01/29 | | | 1,195,000 | | | | 1,706,194 | |
| | |
| MidAmerican Energy Holdings Co. | | | | | | | | |
5.875% 10/01/12 | | | 1,655,000 | | | | 1,767,432 | |
| | |
| Nevada Power Co. | | | | | | | | |
5.375% 09/15/40 | | | 8,845,000 | | | | 8,473,025 | |
| | |
| Niagara Mohawk Power Corp. | | | | | | | | |
4.881% 08/15/19 (d) | | | 2,140,000 | | | | 2,248,843 | |
| | |
| Nisource Finance Corp. | | | | | | | | |
5.250% 09/15/17 | | | 685,000 | | | | 729,450 | |
| | |
| Oncor Electric Delivery Co., LLC | | | | | | | | |
5.950% 09/01/13 | | | 915,000 | | | | 998,210 | |
| | |
| Peco Energy Co. | | | | | | | | |
5.350% 03/01/18 | | | 2,175,000 | | | | 2,384,361 | |
| | |
| Southern California Edison Co. | | | | | | | | |
4.500% 09/01/40 | | | 3,230,000 | | | | 2,821,873 | |
5.000% 01/15/16 | | | 2,500,000 | | | | 2,734,770 | |
| | |
| Southern Co. | | | | | | | | |
5.300% 01/15/12 | | | 2,050,000 | | | | 2,122,863 | |
| | |
| Virginia Electric & Power Co. | | | | | | | | |
5.100% 11/30/12 | | | 3,140,000 | | | | 3,339,494 | |
See Accompanying Notes to Financial Statements.
14
Columbia Bond Fund
March 31, 2011
Corporate Fixed-Income Bonds & Notes (continued)
| | | | | | | | |
| | | Par ($) | | | Value ($) | |
| Utilities (continued) | | | | | | | | |
| Xcel Energy, Inc. | | | | | | | | |
4.700% 05/15/20 | | | 2,005,000 | | | | 2,064,236 | |
| | | | | | | | |
Electric Total | | | | | | | 73,677,025 | |
| | |
| Gas – 0.5% | | | | | | | | |
| Atmos Energy Corp. | | | | | | | | |
6.350% 06/15/17 | | | 2,825,000 | | | | 3,147,996 | |
8.500% 03/15/19 | | | 2,760,000 | | | | 3,447,720 | |
| | |
| Nakilat, Inc. | | | | | | | | |
6.067% 12/31/33 (d) | | | 4,075,000 | | | | 4,054,625 | |
| | |
| Sempra Energy | | | | | | | | |
6.500% 06/01/16 | | | 2,390,000 | | | | 2,727,705 | |
| | | | | | | | |
Gas Total | | | | | | | 13,378,046 | |
| | | | | | | | |
Utilities Total | | | | | | | 87,055,071 | |
| | | | | | | | |
Total Corporate Fixed-Income
Bonds & Notes
(cost of $692,905,050) | | | | 721,162,641 | |
| |
Government & Agency Obligations – 22.0% | | | | | |
| | | | | | | | |
| Foreign Government Obligations – 1.1% | |
| European Investment Bank | | | | | | | | |
3.000% 04/08/14 | | | 6,700,000 | | | | 6,982,258 | |
5.125% 05/30/17 | | | 2,985,000 | | | | 3,349,358 | |
| | |
| Export-Import Bank of Korea | | | | | | | | |
5.500% 10/17/12 | | | 700,000 | | | | 736,755 | |
| |
| Pemex Project Funding Master Trust | | | | | |
5.750% 03/01/18 | | | 3,885,000 | | | | 4,110,322 | |
| | |
| Province of Quebec | | | | | | | | |
4.625% 05/14/18 | | | 9,030,000 | | | | 9,710,600 | |
| |
| Republic of Italy | | | | | |
5.375% 06/12/17 | | | 1,935,000 | | | | 2,057,503 | |
| | | | | | | | |
Foreign Government Obligations Total | | | | 26,946,796 | |
| | | | | | | | |
| U.S. Government Agencies – 1.3% | | | | | |
| Resolution Funding Corp., STRIPS | | | | | |
(f) 10/15/20 | | | 14,620,000 | | | | 10,106,602 | |
(f) 01/15/21 | | | 26,765,000 | | | | 18,249,501 | |
(f) 01/15/30 | | | 14,000,000 | | | | 5,687,626 | |
| | | | | | | | |
U.S. Government Agencies Total | | | | 34,043,729 | |
| | | | | | | | |
| U.S. Government Obligations – 19.6% | | | | | |
| U.S. Treasury Bills | | | | | |
(f) 04/14/11 | | | 197,000,000 | | | | 196,995,934 | |
(f) 08/25/11 (g) | | | 11,340,000 | | | | 11,333,570 | |
| | | | | | | | |
| | | Par ($) | | | Value ($) | |
| U.S. Treasury Bonds | | | | | |
2.625% 11/15/20 | | | 31,985,000 | | | | 29,846,003 | |
3.875% 08/15/40 | | | 31,494,000 | | | | 28,182,217 | |
4.250% 11/15/40 | | | 15,065,000 | | | | 14,408,256 | |
4.375% 11/15/39 | | | 4,000 | | | | 3,913 | |
4.500% 02/15/36 | | | 4,145,000 | | | | 4,185,157 | |
| |
| U.S. Treasury Inflation Indexed Bonds | | | | | |
2.375% 01/15/27 | | | 4,252,795 | | | | 4,735,555 | |
| |
| U.S. Treasury Inflation Indexed Notes | | | | | |
1.625% 01/15/18 | | | 29,224,167 | | | | 31,598,631 | |
3.000% 07/15/12 | | | 3,153,422 | | | | 3,377,612 | |
| |
| U.S. Treasury Notes | | | | | |
0.750% 12/15/13 | | | 350,000 | | | | 346,445 | |
0.875% 01/31/12 | | | 1,720,000 | | | | 1,728,533 | |
1.250% 03/15/14 | | | 1,605,000 | | | | 1,604,502 | |
1.875% 09/30/17 | | | 1,110,000 | | | | 1,049,991 | |
2.125% 02/29/16 | | | 19,075,000 | | | | 19,015,391 | |
2.625% 08/15/20 (g) | | | 29,491,100 | | | | 27,666,338 | |
2.750% 02/28/18 | | | 1,370,000 | | | | 1,359,618 | |
3.625% 02/15/21 | | | 7,300,000 | | | | 7,403,799 | |
| |
| U.S. Treasury STRIPS | | | | | |
(f) 08/15/20 | | | 113,500,000 | | | | 80,859,102 | |
(f) 02/15/22 | | | 48,715,000 | | | | 31,782,251 | |
| | | | | | | | |
U.S. Government Obligations Total | | | | 497,482,818 | |
| | | | | | | | |
Total Government & Agency Obligations (cost of $559,657,788) | | | | 558,473,343 | |
|
Commercial Mortgage-Backed Securities – 19.2% | |
| Bear Stearns Commercial Mortgage Securities | |
4.740% 03/13/40 | | | 15,784,000 | | | | 16,492,304 | |
4.830% 08/15/38 | | | 3,200,000 | | | | 3,312,836 | |
5.200% 01/12/41 (04/01/11) (a)(b) | | | 11,705,000 | | | | 12,481,539 | |
5.201% 12/11/38 | | | 3,310,000 | | | | 3,490,575 | |
5.471% 01/12/45 (04/01/11) (a)(b) | | | 10,070,000 | | | | 10,807,549 | |
5.537% 10/12/41 | | | 14,928,000 | | | | 16,031,004 | |
5.700% 06/13/50 | | | 17,455,000 | | | | 18,605,895 | |
5.718% 06/11/40 (04/01/11) (a)(b) | | | 3,000,000 | | | | 3,234,893 | |
5.742% 09/11/42 (04/01/11) (a)(b) | | | 3,500,000 | | | | 3,800,102 | |
| |
| Citigroup Commercial Mortgage Trust | | | | | |
4.733% 10/15/41 | | | 7,265,000 | | | | 7,657,996 | |
|
| Citigroup/Deutsche Bank Commercial Mortgage Trust | |
5.322% 12/11/49 | | | 17,605,000 | | | | 18,156,468 | |
5.886% 11/15/44 (04/01/11) (a)(b) | | | 4,450,000 | | | | 4,814,439 | |
| |
| Commercial Mortgage Asset Trust | | | | | |
7.230% 01/17/32 (a) | | | 2,000,000 | | | | 2,192,002 | |
7.800% 11/17/32 (04/11/11) (a)(b) | | | 3,556,000 | | | | 3,882,961 | |
See Accompanying Notes to Financial Statements.
15
Columbia Bond Fund
March 31, 2011
Commercial Mortgage-Backed Securities (continued)
| | | | | | | | |
| | | Par ($) | | | Value ($) | |
| Commercial Mortgage Pass Through Certificates | | | | | |
5.311% 07/10/37 (04/01/11) (a)(b) | | | 8,490,000 | | | | 9,111,608 | |
| |
| Credit Suisse First Boston Mortgage Securities Corp. | | | | | |
4.801% 03/15/36 | | | 3,490,000 | | | | 3,643,673 | |
6.387% 08/15/36 | | | 1,629,234 | | | | 1,650,555 | |
| |
| Credit Suisse Mortgage Capital Certificates | | | | | |
5.825% 06/15/38 (04/01/11) (a)(b) | | | 9,060,000 | | | | 9,804,269 | |
| |
| GMAC Commercial Mortgage Securities, Inc. | | | | | |
5.472% 05/10/40 (04/01/11) (a)(b) | | | 1,060,000 | | | | 1,132,697 | |
| |
| Greenwich Capital Commercial Funding Corp. | | | | | |
4.799% 08/10/42 (04/01/11) (a)(b) | | | 5,755,000 | | | | 6,071,363 | |
5.317% 06/10/36 (04/01/11) (a)(b) | | | 4,590,000 | | | | 4,913,839 | |
5.444% 03/10/39 | | | 15,960,000 | | | | 16,893,074 | |
5.890% 07/10/38 (04/01/11) (a)(b) | | | 2,600,000 | | | | 2,844,390 | |
| |
| GS Mortgage Securities Corp. II | | | | | |
4.751% 07/10/39 | | | 3,575,000 | | | | 3,761,532 | |
4.753% 03/10/44 | | | 8,926,000 | | | | 8,988,868 | |
| |
| JPMorgan Chase Commercial Mortgage Securities Corp. | | | | | |
4.717% 02/15/46 (d) | | | 2,434,000 | | | | 2,442,532 | |
4.879% 01/12/38 (04/01/11) (a)(b) | | | 4,102,000 | | | | 4,327,313 | |
4.985% 01/12/37 | | | 1,765,000 | | | | 1,854,364 | |
5.202% 12/15/44 (04/01/11) (a)(b) | | | 14,825,000 | | | | 15,871,967 | |
5.255% 07/12/37 (a) | | | 3,875,000 | | | | 4,108,984 | |
5.440% 06/12/47 | | | 10,370,000 | | | | 10,935,002 | |
5.552% 05/12/45 | | | 11,700,000 | | | | 12,524,185 | |
5.790% 06/12/43 (04/01/11) (a)(b) | | | 2,501,000 | | | | 2,665,746 | |
5.857% 10/12/35 | | | 274,958 | | | | 277,012 | |
6.162% 05/12/34 | | | 1,855,000 | | | | 1,910,199 | |
| | |
| LB-UBS Commercial Mortgage Trust | | | | | | | | |
4.166% 05/15/32 | | | 3,525,000 | | | | 3,657,941 | |
5.020% 08/15/29 (04/11/11) (a)(b) | | | 10,265,000 | | | | 10,917,703 | |
5.124% 11/15/32 (04/11/11) (a)(b) | | | 6,865,000 | | | | 7,312,089 | |
5.430% 02/15/40 | | | 14,830,000 | | | | 15,626,671 | |
5.866% 09/15/45 (04/11/11) (a)(b) | | | 9,130,000 | | | | 9,792,459 | |
| |
| Merrill Lynch Mortgage Investors, Inc. | | | | | |
I.O., | | | | | | | | |
0.276% 12/15/30 (04/01/11) (a)(b) | | | 2,900,290 | | | | 35,860 | |
| | |
| Merrill Lynch Mortgage Trust | | | | | | | | |
4.747% 06/12/43 (04/01/11) (a)(b) | | | 10,000,000 | | | | 10,590,349 | |
| | | | | | | | |
| | | Par ($) | | | Value ($) | |
| Morgan Stanley Capital I | | | | | | | | |
4.660% 09/13/45 | | | 6,224,000 | | | | 6,568,795 | |
4.970% 12/15/41 | | | 12,337,000 | | | | 13,095,014 | |
5.033% 09/15/47 (04/01/11) (a)(b)(d) | | | 3,815,000 | | | | 3,954,305 | |
5.150% 06/13/41 | | | 16,740,000 | | | | 17,719,270 | |
5.646% 06/11/42 (04/01/11) (a)(b) | | | 3,500,000 | | | | 3,843,746 | |
| |
| Morgan Stanley Dean Witter Capital I | | | | | |
4.740% 11/13/36 | | | 4,330,000 | | | | 4,500,647 | |
4.920% 03/12/35 | | | 16,360,000 | | | | 17,184,770 | |
5.080% 09/15/37 | | | 10,950,000 | | | | 11,393,999 | |
5.980% 01/15/39 | | | 5,108,266 | | | | 5,282,396 | |
6.390% 07/15/33 | | | 485,392 | | | | 486,849 | |
7.500% 10/15/33 (a) | | | 310,889 | | | | 311,720 | |
| | |
| Nomura Asset Securities Corp. | | | | | | | | |
7.133% 03/15/30 (04/11/11) (a)(b) | | | 4,025,000 | | | | 4,407,681 | |
| | |
| Salomon Brothers Mortgage Securities VII | | | | | | | | |
4.865% 03/18/36 | | | 3,320,000 | | | | 3,426,835 | |
| | |
| Wachovia Bank Commercial Mortgage Trust | | | | | | | | |
5.001% 07/15/41 | | | 669,346 | | | | 670,543 | |
5.012% 12/15/35 (a) | | | 13,380,000 | | | | 14,193,404 | |
5.037% 03/15/42 | | | 7,058,899 | | | | 7,352,340 | |
5.087% 07/15/42 (04/01/11) (a)(b) | | | 4,267,000 | | | | 4,324,066 | |
5.209% 10/15/44 (04/01/11) (a)(b) | | | 15,530,000 | | | | 16,696,020 | |
5.230% 07/15/41 (04/01/11) (a)(b) | | | 8,680,000 | | | | 8,818,293 | |
5.270% 12/15/44 (04/01/11) (a)(b) | | | 9,795,000 | | | | 10,534,675 | |
5.997% 06/15/45 | | | 3,530,000 | | | | 3,767,346 | |
6.287% 04/15/34 | | | 2,150,000 | | | | 2,216,264 | |
| | |
| Wells Fargo Commercial Mortgage Trust | | | | | | | | |
4.393% 11/15/43 (d) | | | 14,590,000 | | | | 14,451,624 | |
| |
| WF-RBS Commercial Mortgage Trust | | | | | |
4.869% 02/15/44 (a)(d) | | | 4,090,000 | | | | 4,184,104 | |
| | | | | | | | |
Total Commercial Mortgage-Backed Securities
(cost of $472,254,611) | | | | 488,011,513 | |
| | |
Asset-Backed Securities – 3.0% | | | | | | | | |
| Ally Auto Receivables Trust | | | | | | | | |
1.450% 05/15/14 | | | 2,500,000 | | | | 2,519,484 | |
| | |
| Bay View Auto Trust | | | | | | | | |
5.310% 06/25/14 | | | 1,018,573 | | | | 1,021,569 | |
| | |
| BMW Vehicle Lease Trust | | | | | | | | |
0.820% 04/15/13 | | | 5,870,000 | | | | 5,872,107 | |
See Accompanying Notes to Financial Statements.
16
Columbia Bond Fund
March 31, 2011
Asset-Backed Securities (continued)
| | | | | | | | |
| | | Par ($) | | | Value ($) | |
| Bombardier Capital Mortgage Securitization Corp. | | | | | | | | |
6.230% 04/15/28 | | | 1,668 | | | | 1,616 | |
| | |
| Capital Auto Receivables Asset Trust | | | | | | | | |
4.460% 07/15/14 | | | 4,690,000 | | | | 4,825,961 | |
5.210% 03/17/14 | | | 1,911,343 | | | | 1,945,983 | |
| | |
| Chrysler Financial Auto Securitization Trust | | | | | | | | |
6.250% 05/08/14 (d) | | | 5,470,000 | | | | 5,683,938 | |
| | |
| Citibank Credit Card Issuance Trust | | | | | | | | |
6.300% 06/20/14 | | | 455,000 | | | | 480,742 | |
6.950% 02/18/14 | | | 1,585,000 | | | | 1,659,946 | |
| | |
| CitiFinancial Auto Issuance Trust | | | | | | | | |
1.830% 11/15/12 (d) | | | 1,693,226 | | | | 1,696,975 | |
| | |
| Citigroup Mortgage Loan Trust, Inc. | | | | | | | | |
5.517% 08/25/35 (04/01/11) (a)(b) | | | 2,800,000 | | | | 277,897 | |
5.666% 08/25/35 (04/01/11) (a)(b) | | | 1,885,000 | | | | 54,859 | |
| | |
| CNH Equipment Trust | | | | | | | | |
1.170% 05/15/15 | | | 5,667,000 | | | | 5,635,197 | |
| | |
| Daimler Chrysler Auto Trust | | | | | | | | |
4.480% 08/08/14 | | | 920 | | | | 936 | |
| | |
| Equity One ABS, Inc. | | | | | | | | |
0.590% 07/25/34 (04/25/11) (a)(b) | | | 365,527 | | | | 292,579 | |
| | |
| Ford Credit Auto Lease Trust | | | | | | | | |
0.910% 07/15/13 (d) | | | 3,470,000 | | | | 3,467,145 | |
| | |
| Ford Credit Auto Owner Trust | | | | | | | | |
1.320% 06/15/14 | | | 7,110,000 | | | | 7,154,077 | |
| | |
| Franklin Auto Trust | | | | | | | | |
5.360% 05/20/16 | | | 8,254,459 | | | | 8,394,858 | |
7.160% 05/20/16 (d) | | | 3,425,000 | | | | 3,645,185 | |
| | |
| Green Tree Financial Corp. | | | | | | | | |
8.250% 07/15/27 (04/15/11) (a)(b) | | | 233,167 | | | | 240,073 | |
| | |
| GSAA Trust | | | | | | | | |
4.316% 11/25/34 (04/01/11) (a)(b) | | | 215,039 | | | | 215,880 | |
| | |
| Harley-Davidson Motorcycle Trust | | | | | | | | |
5.230% 03/15/14 | | | 1,500,000 | | | | 1,559,030 | |
| | |
| Honda Auto Receivables Owner Trust | | | | | | | | |
0.700% 04/21/14 | | | 1,135,000 | | | | 1,132,331 | |
| | |
| Nissan Auto Lease Trust | | | | | | | | |
1.120% 12/15/13 | | | 5,155,000 | | | | 5,158,049 | |
| | |
| USAA Auto Owner Trust | | | | | | | | |
5.070% 06/15/13 | | | 1,269,541 | | | | 1,276,208 | |
| | | | | | | | |
| | | Par ($) | | | Value ($) | |
| Volkswagen Auto Lease Trust | | | | | | | | |
0.770% 01/22/13 | | | 5,650,000 | | | | 5,652,282 | |
| |
| Volkswagen Auto Loan Enhanced Trust | | | | | |
5.470% 03/20/13 | | | 2,494,115 | | | | 2,533,183 | |
| | |
| Wachovia Auto Loan Owner Trust | | | | | | | | |
5.650% 02/20/13 | | | 5,000,000 | | | | 5,022,537 | |
| | | | | | | | |
Total Asset-Backed Securities (cost of $81,540,474) | | | | | | | 77,420,627 | |
| | |
Municipal Bonds – 1.4% | | | | | | | | |
| | | | | | | | |
| California – 0.7% | | | | | | | | |
| CA Educational Facilities Authority | | | | | |
University of Southern California, | | | | | | | | |
Series 2009 A, | | | | | | | | |
5.250% 10/01/38 | | | 2,900,000 | | | | 2,926,825 | |
| |
| CA Los Angeles Unified School District | | | | | |
Series 2009, | | | | | | | | |
5.750% 07/01/34 | | | 3,310,000 | | | | 3,125,534 | |
| |
| CA State | | | | | |
Series 2009: | | | | | | | | |
5.250% 04/01/14 | | | 305,000 | | | | 321,854 | |
7.550% 04/01/39 | | | 3,805,000 | | | | 4,155,060 | |
Series 2010, | | | | | | | | |
3.950% 11/01/15 | | | 6,925,000 | | | | 6,917,937 | |
| | | | | | | | |
California Total | | | | | | | 17,447,210 | |
| | | | | | | | |
| Illinois – 0.0% | | | | | | | | |
| IL Chicago | | | | | | | | |
Series 2010 B, | | | | | | | | |
6.742% 11/01/40 | | | 1,010,000 | | | | 1,032,462 | |
| | | | | | | | |
Illinois Total | | | | | | | 1,032,462 | |
| | | | | | | | |
| Kentucky – 0.2% | | | | | | | | |
| KY Asset Liability Commission | | | | | | | | |
Series 2010, | | | | | | | | |
3.165% 04/01/18 | | | 4,620,000 | | | | 4,483,109 | |
| | | | | | | | |
Kentucky Total | | | | | | | 4,483,109 | |
| | | | | | | | |
| Massachusetts – 0.4% | | | | | | | | |
| MA State | | | | | | | | |
Series 2010: | | | | | | | | |
5.631% 06/01/30 | | | 3,660,000 | | | | 3,808,889 | |
5.731% 06/01/40 | | | 4,880,000 | | | | 5,013,663 | |
| | | | | | | | |
Massachusetts Total | | | | | | | 8,822,552 | |
See Accompanying Notes to Financial Statements.
17
Columbia Bond Fund
March 31, 2011
Municipal Bonds (continued)
| | | | | | | | |
| | | Par ($) | | | Value ($) | |
| New York – 0.1% | | | | | | | | |
| NY New York City Municipal Water Finance Authority | | | | | | | | |
Series 2005 D, | | | | | | | | |
5.000% 06/15/39 | | | 3,600,000 | | | | 3,468,024 | |
| | | | | | | | |
New York Total | | | | | | | 3,468,024 | |
| | | | | | | | |
Total Municipal Bonds
(cost of $34,711,475) | | | | | | | 35,253,357 | |
| | | | | | | | |
| |
Collateralized Mortgage Obligations – 0.0% | | | | | |
| | | | | | | | |
| Agency – 0.0% | | | | | | | | |
| Federal National Mortgage Association | | | | | | | | |
5.500% 09/25/35 | | | 374,087 | | | | 376,442 | |
| | |
| Vendee Mortgage Trust | | | | | | | | |
I.O.: | | | | | | | | |
0.282% 03/15/29 (04/01/11) (a)(b) | | | 6,156,052 | | | | 46,657 | |
0.432% 03/15/28 (04/01/11) (a)(b) | | | 4,607,814 | | | | 61,456 | |
| | | | | | | | |
Agency Total | | | | | | | 484,555 | |
| | | | | | | | |
| Non-Agency – 0.0% | | | | | | | | |
| American Mortgage Trust | | | | | | | | |
8.445% 09/27/22 (h) | | | 10,837 | | | | 6,571 | |
| | |
| Countrywide Alternative Loan Trust | | | | | | | | |
5.500% 09/25/35 | | | 4,442,453 | | | | 36,264 | |
| | | | | | | | |
Non-agency Total | | | | | | | 42,835 | |
| | | | | | | | |
Total Collateralized Mortgage Obligations
(cost of $4,912,724) | | | | | | | 527,390 | |
| | |
Preferred Stock – 0.2% | | | | | | | | |
| | | Shares | | | | |
| | | | | | | | |
| Financials – 0.2% | | | | | | | | |
| Diversified Financial Services – 0.2% | | | | | |
Citigroup Capital XIII | | | | | | | | |
7.875% | | | 180,190 | | | | 4,937,206 | |
| | | | | | | | |
Diversified Financial Services Total | | | | | | | 4,937,206 | |
| | | | | | | | |
Financials Total | | | | | | | 4,937,206 | |
| | | | | | | | |
Total Preferred Stock (cost of $4,870,536) | | | | 4,937,206 | |
Short-Term Obligation – 0.6%
| | | | | | | | |
| | | Par ($) | | | Value ($) | |
Repurchase agreement with Fixed Income Clearing Corp., dated 03/31/11, due 04/01/11 at 0.070%, collateralized by a U.S. Government Agency obligation maturing 07/28/15, market value $15,888,688 (repurchase proceeds $15,575,030) | | | 15,575,000 | | | | 15,575,000 | |
| | | | | | | | |
Total Short-Term Obligation
(cost of $15,575,000) | | | | 15,575,000 | |
| | | | | | | | |
Total Investments – 107.2%
(cost of $2,692,554,005) (i) | | | | 2,723,503,279 | |
| | | | | | | | |
Other Assets & Liabilities, Net – (7.2)% | | | | (182,924,244 | ) |
| | | | | | | | |
Net Assets – 100.0% | | | | | | | 2,540,579,035 | |
Notes to Investment Portfolio:
| (a) | The interest rate shown on floating rate or variable rate securities reflects the rate at March 31, 2011. |
| (b) | Parenthetical date represents the next interest rate reset date for the security. |
| (c) | Security purchased on a delayed delivery basis. |
| (d) | Security exempt from registration pursuant to Rule 144A under the Securities Act of 1933. These securities may be resold in transactions exempt from registration, normally to qualified institutional buyers. At March 31, 2011, these securities, which are not illiquid, amounted to $131,269,523, which represents 5.2% of net assets. |
| (e) | The issuer has filed for bankruptcy protection under Chapter 11 and is in default of certain debt covenants. Income is not being accrued. At March 31, 2011, the value of these securities amounted to $1,535,262 which represents 0.1% of net assets. |
| (g) | A portion of these securities with a market value of $3,936,424 are pledged as collateral for open futures contracts. |
| (h) | Represents fair value as determined in good faith under procedures approved by the Board of Trustees. At March 31, 2011, the value of this security amounted to $6,571, which represents less than 0.01% of net assets. |
| (i) | Cost for federal income tax purposes is $2,690,900,394. |
Generally accepted accounting principles (GAAP) require disclosure regarding the inputs and valuation techniques used to measure fair value and any changes in valuation inputs or techniques. In addition, investments shall be disclosed by major category.
The Fund categorizes its fair value measurements according to a three-level hierarchy that maximizes the use of observable inputs and minimizes the use of unobservable inputs by prioritizing that the most observable input be used when available. Observable inputs are those that market participants would use in pricing an investment based on market data obtained from sources independent of the reporting entity. Unobservable inputs are those that reflect the Fund’s assumptions about the information market participants would use in pricing an investment. An investment’s level within the fair value hierarchy is based on the lowest level of any input that is deemed significant to the asset or liability’s fair value measurement. The input levels are not necessarily an indication of the risk or liquidity associated with investments at that level. For example, certain U.S. government securities are generally high quality and liquid, however, they are reflected as Level 2 because the inputs used to determine fair value may not always be quoted prices in an active market.
Fair value inputs are summarized in the three broad levels listed below:
| • | | Level 1 — Valuations based on quoted prices for investments in active markets that the Fund has the ability to access at the measurement date (including NAV for open-end mutual funds). Valuation adjustments are not applied to Level 1 investments. |
See Accompanying Notes to Financial Statements.
18
Columbia Bond Fund
March 31, 2011
| • | | Level 2 — Valuations based on other significant observable inputs (including quoted prices for similar securities, interest rates, prepayment speeds, credit risks, etc.). |
| • | | Level 3 — Valuations based on significant unobservable inputs (including the Fund’s own assumptions and judgment in determining the fair value of investments). |
Inputs that are used in determining fair value of an investment may include price information, credit data, volatility statistics, and other factors. These inputs can be either observable or unobservable. The availability of observable inputs can vary between investments, and is affected by various factors such as the type of investment, and the volume and level of activity for that investment or similar investments in the marketplace. The inputs will be considered by the Investment Manager, along with any other relevant factors in the calculation of an investment’s fair value. The Fund uses prices and inputs that are current as of the measurement date, which may include periods of market dislocations. During these periods, the availability of prices and inputs may be reduced for many investments. This condition could cause an investment to be reclassified between the various levels within the hierarchy. Non-U.S. equity securities actively traded in foreign markets may be reflected in Level 2 despite the availability of closing prices, because the Fund evaluates and determines whether those closing prices reflect fair value at the close of the New York Stock Exchange (NYSE) or require adjustment, as described in Note 2 to the financial statements — Security Valuation.
Investments falling into the Level 3 category are primarily supported by quoted prices from brokers and dealers participating in the market for those investments. However, these may be classified as Level 3 investments due to lack of market transparency and corroboration to support these quoted prices. Additionally, valuation models may be used as the pricing source for any remaining investments classified as Level 3. These models rely on one or more significant unobservable inputs and/or significant assumptions by the Investment Manager. Inputs used in valuations may include, but are not limited to, financial statement analysis, capital account balances, discount rates and estimated cash flows, and comparable company data.
The following table summarizes the inputs used, as of March 31, 2011, in valuing the Fund’s assets:
| | | | | | | | | | | | | | | | |
Description | | Quoted
Prices
(Level 1) | | | Other
Significant
Observable
Inputs
(Level 2) | | | Significant
Unobservable
Inputs
(Level 3) | | | Total | |
Total Mortgage-Backed Securities | | $ | — | | | $ | 822,142,202 | | | $ | — | | | $ | 822,142,202 | |
| | | | | | | | | | | | | | | | |
Corporate Fixed-Income Bonds & Notes | | | | | | | , | | | | | | | | | |
Basic Materials | | | — | | | | 36,584,196 | | | | — | | | | 36,584,196 | |
Communications | | | — | | | | 135,231,315 | | | | — | | | | 135,231,315 | |
Consumer Cyclical | | | — | | | | 12,238,540 | | | | 469,101 | | | | 12,707,641 | |
Consumer Non-Cyclical | | | — | | | | 67,929,393 | | | | — | | | | 67,929,393 | |
Energy | | | — | | | | 59,473,183 | | | | — | | | | 59,473,183 | |
Financials | | | — | | | | 265,428,412 | | | | — | | | | 265,428,412 | |
Industrials | | | — | | | | 44,647,181 | | | | — | | | | 44,647,181 | |
Technology | | | — | | | | 12,106,249 | | | | — | | | | 12,106,249 | |
Utilities | | | — | | | | 87,055,071 | | | | — | | | | 87,055,071 | |
| | | | | | | | | | | | | | | | |
Total Corporate Fixed-Income Bonds & Notes | | | — | | | | 720,693,540 | | | | 469,101 | | | | 721,162,641 | |
| | | | | | | | | | | | | | | | |
Government & Agency Obligations | | | | | | | | | | | | | | | | |
Foreign Government Obligations | | | — | | | | 26,946,796 | | | | — | | | | 26,946,796 | |
U.S. Government Agencies | | | 28,356,103 | | | | 5,687,626 | | | | — | | | | 34,043,729 | |
U.S. Government Obligations | | | 288,806,869 | | | | 208,675,949 | | | | — | | | | 497,482,818 | |
| | | | | | | | | | | | | | | | |
| | | | | | | | | | | | | | | | |
Description | | Quoted
Prices
(Level 1) | | | Other
Significant
Observable
Inputs
(Level 2) | | | Significant
Unobservable
Inputs
(Level 3) | | | Total | |
Total Government & Agency Obligations | | | 317,162,972 | | | | 241,310,371 | | | | — | | | | 558,473,343 | |
| | | | | | | | | | | | | | | | |
Total Commercial Mortgage-Backed Securities | | | — | | | | 488,011,513 | | | | — | | | | 488,011,513 | |
| | | | | | | | | | | | | | | | |
Total Asset-Backed Securities | | | — | | | | 77,420,627 | | | | — | | | | 77,420,627 | |
| | | | | | | | | | | | | | | | |
Total Municipal Bonds | | | — | | | | 35,253,357 | | | | — | | | | 35,253,357 | |
| | | | | | | | | | | | | | | | |
Total Collateralized Mortgage Obligations | | | — | | | | 520,819 | | | | 6,571 | | | | 527,390 | |
| | | | | | | | | | | | | | | | |
Total Preferred Stock | | | — | | | | 4,937,206 | | | | — | | | | 4,937,206 | |
| | | | | | | | | | | | | | | | |
Total Short-Term Obligation | | | — | | | | 15,575,000 | | | | — | | | | 15,575,000 | |
| | | | | | | | | | | | | | | | |
Total Investments | | | 317,162,972 | | | | 2,405,864,635 | | | | 475,672 | | | | 2,723,503,279 | |
| | | | | | | | | | | | | | | | |
Unrealized Appreciation on Credit Default Swap Contracts | | | — | | | | 47,664 | | | | — | | | | 47,664 | |
| | | | | | | | | | | | | | | | |
Unrealized Depreciation on Credit Default Swap Contracts | | | — | | | | (29,892 | ) | | | — | | | | (29,892 | ) |
| | | | | | | | | | | | | | | | |
Unrealized Appreciation on Futures Contracts | | | 1,095,332 | | | | — | | | | — | | | | 1,095,332 | |
| | | | | | | | | | | | | | | | |
Unrealized Depreciation on Futures Contracts | | | (234,935 | ) | | | — | | | | — | | | | (234,935 | ) |
| | | | | | | | | | | | | | | | |
Total | | $ | 318,023,369 | | | $ | 2,405,882,407 | | | $ | 475,672 | | | $ | 2,724,381,448 | |
| | | | | | | | | | | | | | | | |
The Fund’s assets assigned to the Level 2 input category are generally valued using the market approach, in which a security’s value is determined through its correlation to prices and information from market transactions for similar or identical assets.
Certain short-term obligations may be valued using amortized cost, an income approach which converts future cash flows to a present value based upon the discount or premium at purchase.
Certain Corporate Fixed-Income Bonds & Notes classified as Level 3 securities are valued using the market approach. To determine fair value for these securities, management considered various factors which may have included, but were not limited to, estimated cash flows of the securities and observed yields on securities management deemed comparable.
Certain Collateralized Mortgage Obligations classified as Level 3 securities are valued using market approach and utilize single market quotations from broker dealers.
There were no significant transfers of financial assets between Levels 1 and 2 during the period.
See Accompanying Notes to Financial Statements.
19
Columbia Bond Fund
March 31, 2011
The following table reconciles asset balances for the year ending March 31, 2011, in which significant unobservable inputs (Level 3) were used in determining value:
| | | | | | | | | | | | | | | | | | | | | | | | | | | | | | | | | | | | |
Investments in Securities | | Balance
as of
March 31,
2010 | | | Accrued
Discounts/
Premiums | | | Realized
Gain/
(Loss) | | | Change in
Unrealized
Appreciation
(Depreciation) | | | Purchases | | | Sales | | | Transfers
into
Level 3 | | | Transfers
out of
Level 3 | | | Balance
as of
March 31,
2011 | |
Corporate Fixed-Income Bonds & Notes | | | | | | | | | | | | | | | | | | | | | | | | | | | | | | | | | | | | |
Consumer Cyclical | | $ | — | | | $ | — | | | $ | — | | | $ | 35,693 | | | $ | 433,408 | | | $ | — | | | $ | — | | | $ | — | | | $ | 469,101 | |
Collateralized Mortgage Obligations | | | | | | | | | | | | | | | | | | | | | | | | | | | | | | | | | | | | |
Non-Agency | | | — | | | | — | | | | 29 | | | | 14 | | | | 6,601 | | | | (73 | ) | | | — | | | | — | | | | 6,571 | |
| | | | | | | | | | | | | | | | | | | | | | | | | | | | | | | | | | | | |
| | $ | — | | | $ | — | | | $ | 29 | | | $ | 35,707 | | | $ | 440,009 | | | $ | (73 | ) | | $ | — | | | $ | — | | | $ | 475,672 | |
| | | | | | | | | | | | | | | | | | | | | | | | | | | | | | | | | | | | |
The information in the above reconciliation represents fiscal year to date activity for any securities identified as using Level 3 inputs at either the beginning or the end of the current fiscal period.
The change in unrealized appreciation attributable to securities owned at March 31, 2011, which were valued using significant unobservable inputs (Level 3) amounted to $35,707. This amount is included in net change in unrealized appreciation on the Statement of Changes in Net Assets.
At March 31, 2011, the Fund has entered into the following credit default swap contracts:
| | | | | | | | | | | | | | | | | | | | | | | | | | |
Credit Risk | | | | | | | | | | | | | | | | | | | | |
Swap Counterparty | | Referenced Obligation | | Receive
Buy/Sell
Protection | | | Fixed
Rate | | | Expiration
Date | | | Notional
Amount | | | Upfront
Premium
Paid
(Received) | | | Value of
Contract | |
Barclays Capital | | D.R. Horton, Inc. | | | Buy | | | | 1.000 | % | | | 06/20/16 | | | $ | 12,400,000 | | | $ | 684,681 | | | $ | (344 | ) |
Barclays Capital | | The Home Depot, Inc. | | | Buy | | | | 1.000 | % | | | 06/20/16 | | | | 13,815,000 | | | | (258,360 | ) | | | (1,844 | ) |
Barclays Capital | | Toll Brothers, Inc. | | | Buy | | | | 1.000 | % | | | 06/20/16 | | | | 15,500,000 | | | | 649,596 | | | | 34,548 | |
JPMorgan Chase | | D.R. Horton, Inc. | | | Buy | | | | 1.000 | % | | | 03/20/15 | | | | 5,500,000 | | | | 240,020 | | | | (27,487 | ) |
JPMorgan Chase | | Macy’s, Inc. | | | Buy | | | | 1.000 | % | | | 06/20/16 | | | | 7,800,000 | | | | 166,656 | | | | (217 | ) |
Morgan Stanley | | Limited Brands, Inc. | | | Buy | | | | 1.000 | % | | | 06/20/16 | | | | 7,600,000 | | | | 292,672 | | | | 13,116 | |
| | | | | | | | | | | | | | | | | | | | | | | | | | |
| | | | | | | | | | | | | | | | | | | | | | | | $ | 17,772 | |
| | | | | | | | | | | | | | | | | | | | | | | | | | |
At March 31, 2011, the Fund held the following open long futures contracts:
| | | | | | | | | | | | | | | | | | | | |
Risk
Exposure/
Type | | Number of
Contracts | | | Value | | | Aggregate
Face Value | | | Expiration
Date | | | Unrealized
Depreciation | |
Interest Rate Risk | | | | | | | | | | | | | | | | | |
10 Year U.S. Treasury Notes | | | 145 | | | $ | 17,259,531 | | | $ | 17,354,687 | | | | Jun-2011 | | | $ | (95,156 | ) |
| | | | | | | | | | | | | | | | | | | | |
At March 31, 2011, the Fund held the following open short futures contracts:
| | | | | | | | | | | | | | | | | | | | |
Risk
Exposure/
Type | | Number of
Contracts | | | Value | | | Aggregate
Face Value | | | Expiration
Date | | | Unrealized
Appreciation
(Depreciation) | |
Interest Rate Risk | | | | | | | | | | | | | | | | | |
5 Year U.S. Treasury Notes | | | 353 | | | $ | 41,226,539 | | | $ | 41,295,852 | | | | Jun-2011 | | | $ | 69,313 | |
10 Year U.S. Treasury Notes | | | 1,910 | | | | 227,349,688 | | | | 228,375,707 | | | | Jun-2011 | | | | 1,026,019 | |
Ultra Long Term U.S. Treasury Bond | | | 150 | | | | 18,534,375 | | | | 18,394,596 | | | | Jun-2011 | | | | (139,779 | ) |
| | | | | | | | | | | | | | | | | | | | |
| | | | | | | | | | | | | | | | | | $ | 955,553 | |
| | | | | | | | | | | | | | | | | | | | |
At March 31, 2011, the asset allocation of the Fund is as follows:
| | | | |
Asset Allocation (Unaudited) | | % of
Net Assets | |
Mortgage-Backed Securities | | | 32.4 | |
Corporate Fixed-Income Bonds & Notes | | | 28.4 | |
Government & Agency Obligations | | | 22.0 | |
Commercial Mortgage-Backed Securities | | | 19.2 | |
Asset-Backed Securities | | | 3.0 | |
Municipal Bonds | | | 1.4 | |
Collateralized Mortgage Obligations | | | 0.0 | * |
Preferred Stock | | | 0.2 | |
| | | | |
| | | 106.6 | |
Short-Term Obligation | | | 0.6 | |
Other Assets & Liabilities, Net | | | (7.2 | ) |
| | | | |
| | | 100.0 | |
| | | | |
* Rounds to less than 0.01%.
| | |
Acronym | | Name |
| I.O. | | Interest Only |
| STRIPS | | Separate Trading of Registered Interest and Principal of Securities |
| TBA | | To Be Announced |
See Accompanying Notes to Financial Statements.
20
Statement of Assets and Liabilities – Columbia Bond Fund
March 31, 2011
| | | | | | |
| | | | | ($) | |
| Assets | | Investments, at identified cost | | | 2,692,554,005 | |
| | | | | | |
| | Investments, at value | | | 2,723,503,279 | |
| | Cash | | | 559 | |
| | Open credit default swap contracts | | | 47,664 | |
| | Credit default swap contracts premiums paid | | | 1,980,460 | |
| | Receivable for: | | | | |
| | Investments sold | | | 176,448,688 | |
| | Fund shares sold | | | 4,184,509 | |
| | Interest | | | 16,715,884 | |
| | Futures variation margin | | | 125,766 | |
| | Foreign tax reclaims | | | 21,971 | |
| | Expense reimbursement due from Investment Manager | | | 670,991 | |
| | Trustees’ deferred compensation plan | | | 183,168 | |
| | Prepaid expenses | | | 30,664 | |
| | Other assets | | | 5,380 | |
| | | | | | |
| | Total Assets | | | 2,923,918,983 | |
| | |
| Liabilities | | Open credit default swap contracts | | | 29,892 | |
| | Credit default swap contracts premiums received | | | 257,955 | |
| | Payable for: | | | | |
| | Investments purchased | | | 146,510,593 | |
| | Investments purchased on a delayed delivery basis | | | 229,234,751 | |
| | Fund shares repurchased | | | 2,374,498 | |
| | Distributions | | | 2,877,250 | |
| | Investment advisory fee | | | 941,251 | |
| | Administration fee | | | 133,053 | |
| | Pricing and bookkeeping fees | | | 31,697 | |
| | Transfer agent fee | | | 564,254 | |
| | Trustees’ fees | | | 73,868 | |
| | Custody fee | | | 6,800 | |
| | Distribution and service fees | | | 31,941 | |
| | Chief compliance officer expenses | | | 1,250 | |
| | Trustees’ deferred compensation plan | | | 183,168 | |
| | Other liabilities | | | 87,727 | |
| | | | | | |
| | Total Liabilities | | | 383,339,948 | |
| | |
| | | | | | |
| | Net Assets | | | 2,540,579,035 | |
| | |
| Net Assets Consist of | | Paid-in capital | | | 2,504,901,444 | |
| | Undistributed net investment income | | | 986,530 | |
| | Accumulated net realized gain | | | 2,870,465 | |
| | Net unrealized appreciation (depreciation) on: | | | | |
| | Investments | | | 30,949,274 | |
| | Credit default swap contracts | | | 10,925 | |
| | Futures contracts | | | 860,397 | |
| | | | | | |
| | Net Assets | | | 2,540,579,035 | |
See Accompanying Notes to Financial Statements.
21
Statement of Assets and Liabilities (continued) – Columbia Bond Fund
March 31, 2011
| | | | | | |
| | | | | | |
| Class A | | Net assets | | $ | 75,770,216 | |
| | Shares outstanding | | | 8,201,264 | |
| | Net asset value per share | | $ | 9.24 | (a) |
| | Maximum sales charge | | | 4.75 | % |
| | Maximum offering price per share ($9.24/0.9525) | | $ | 9.70 | (b) |
| | |
| Class B (c) | | Net assets | | $ | 5,346,742 | |
| | Shares outstanding | | | 578,756 | |
| | Net asset value and offering price per share | | $ | 9.24 | (a) |
| | |
| Class C | | Net assets | | $ | 13,397,889 | |
| | Shares outstanding | | | 1,449,945 | |
| | Net asset value and offering price per share | | $ | 9.24 | (a) |
| | |
| Class I (d) | | Net assets | | $ | 284,142,835 | |
| | Shares outstanding | | | 30,713,480 | |
| | Net asset value, offering and redemption price per share | | $ | 9.25 | |
| | |
| Class T (c) | | Net assets | | $ | 16,250,889 | |
| | Shares outstanding | | | 1,761,103 | |
| | Net asset value, offering and redemption price per share | | $ | 9.23 | |
| | |
| Class W (d) | | Net assets | | $ | 2,434 | |
| | Shares outstanding | | | 263 | |
| | Net asset value, offering and redemption price per share | | $ | 9.24 | (e) |
| | |
| Class Y | | Net assets | | $ | 24,717,189 | |
| | Shares outstanding | | | 2,671,388 | |
| | Net asset value, offering and redemption price per share | | $ | 9.25 | |
| | |
| Class Z | | Net assets | | $ | 2,120,950,841 | |
| | Shares outstanding | | | 229,526,998 | |
| | Net asset value, offering and redemption price per share | | $ | 9.24 | |
| (a) | Redemption price per share is equal to net asset value less any applicable contingent deferred sales charge. |
| (b) | On sales of $50,000 or more the offering price is reduced. |
| (c) | Class B and Class T shares commenced operations on March 7, 2011. |
| (d) | Class I and Class W shares commenced operations on September 27, 2010. |
| (e) | Net asset value per share rounds to this amount due to fractional shares outstanding. |
See Accompanying Notes to Financial Statements.
22
Statement of Operations – Columbia Bond Fund
For the Year Ended March 31, 2011
| | | | | | |
| | | | | ($) (a)(b)(c)(d) | |
| Investment Income | | Dividends | | | 31,530 | |
| | Interest | | | 29,939,777 | |
| | Foreign taxes withheld | | | (24,428 | ) |
| | | | | | |
| | Total Investment Income | | | 29,946,879 | |
| | |
| Expenses | | Investment advisory fee | | | 4,317,620 | |
| | Administration fee | | | 928,952 | |
| | Distribution fee: | | | | |
| | Class B | | | 2,009 | |
| | Class C | | | 21,819 | |
| | Service fee: | | | | |
| | Class A | | | 46,971 | |
| | Class B | | | 675 | |
| | Class C | | | 7,290 | |
| | Class T | | | 1,200 | |
| | Class W | | | 3 | |
| | Transfer agent fee: | | | | |
| | Class A, Class B, Class C, Class T, Class W and Class Z | | | 816,480 | |
| | Class Y | | | 40 | |
| | Pricing and bookkeeping fees | | | 165,521 | |
| | Trustees’ fees | | | 40,771 | |
| | Custody fee | | | 26,770 | |
| | Chief compliance officer expenses | | | 1,517 | |
| | Other expenses | | | 361,417 | |
| | | | | | |
| | Total Expenses | | | 6,739,055 | |
| | |
| | Fees waived or expenses reimbursed by Investment Manager | | | (2,246,174 | ) |
| | Fees waived by distributor – Class C | | | (1,070 | ) |
| | Expense reductions | | | (298 | ) |
| | | | | | |
| | Net Expenses | | | 4,491,513 | |
| | |
| | | | | | |
| | Net Investment Income | | | 25,455,366 | |
| | |
| Net Realized and Unrealized Gain (Loss) on Investments, Futures Contracts and Credit Default Swap Contracts | | Net realized gain (loss) on: | | | | |
| | Investments | | | 22,369,790 | |
| | Futures contracts | | | (3,495,503 | ) |
| | Credit default swap contracts | | | (1,340,715 | ) |
| | | | | | |
| | Net realized gain | | | 17,533,572 | |
| | |
| | Net change in unrealized appreciation (depreciation) on: | | | | |
| | Investments | | | (14,859,308 | ) |
| | Futures contracts | | | 1,175,287 | |
| | Credit default swap contracts | | | 174,759 | |
| | | | | | |
| | Net change in unrealized appreciation (depreciation) | | | (13,509,262 | ) |
| | | | | | |
| | Net Gain | | | (4,024,310 | ) |
| | |
| | | | | | |
| | Net Increase Resulting from Operations | | | 29,479,676 | |
| (a) | Class B and Class T shares commenced operations on March 7, 2011. |
| (b) | Class B and Class T shares reflect activity for the period March 7, 2011 through March 31, 2011. |
| (c) | Class W shares commenced operations on September 27, 2010. |
| (d) | Class W shares reflect activity for the period September 27, 2010 through March 31, 2011. |
See Accompanying Notes to Financial Statements.
23
Statement of Changes in Net Assets – Columbia Bond Fund
| | | | | | | | | | |
| | | | | Year Ended March 31, | |
| Increase (Decrease) in Net Assets | | 2011 ($) (a)(b)(c)(d) | | | 2010 ($) (e)(f) | |
| Operations | | Net investment income | | | 25,455,366 | | | | 21,790,632 | |
| | Net realized gain on investments, futures contracts and credit default swap contracts | | | 17,533,572 | | | | 9,909,283 | |
| | Net change in unrealized appreciation (depreciation) on investments, futures contracts and credit default swap contracts | | | (13,509,262 | ) | | | 26,881,768 | |
| | | | | | | | | | |
| | Net increase resulting from operations | | | 29,479,676 | | | | 58,581,683 | |
| | | |
| Distributions to Shareholders | | From net investment income: | | | | | | | | |
| | Class A | | | (582,015 | ) | | | (420,354 | ) |
| | Class B | | | (6,643 | ) | | | — | |
| | Class C | | | (69,531 | ) | | | (49,892 | ) |
| | Class I | | | (432,741 | ) | | | — | |
| | Class T | | | (27,533 | ) | | | — | |
| | Class W | | | (38 | ) | | | — | |
| | Class Y | | | (667,568 | ) | | | (340,472 | ) |
| | Class Z | | | (25,311,264 | ) | | | (21,832,594 | ) |
| | From net realized gains: | | | | | | | | |
| | Class A | | | (319,407 | ) | | | (71,583 | ) |
| | Class C | | | (47,886 | ) | | | (13,438 | ) |
| | Class I | | | (194,191 | ) | | | — | |
| | Class W | | | (34 | ) | | | — | |
| | Class Y | | | (417,810 | ) | | | — | |
| | Class Z | | | (13,371,222 | ) | | | (4,489,921 | ) |
| | | | | | | | | | |
| | Total distributions to shareholders | | | (41,447,883 | ) | | | (27,218,254 | ) |
| | | |
| | Net Capital Stock Transactions | | | 1,938,449,927 | | | | 83,239,343 | |
| | | |
| | Increase from regulatory settlements | | | — | | | | 4,011 | |
| | | | | | | | | | |
| | Total increase in net assets | | | 1,926,481,720 | | | | 114,606,783 | |
| | | |
| Net Assets | | Beginning of period | | | 614,097,315 | | | | 499,490,532 | |
| | End of period | | | 2,540,579,035 | | | | 614,097,315 | |
| | Undistributed (overdistributed) net investment income at end of period | | | 986,530 | | | | (288,554 | ) |
| (a) | Class B and Class T shares commenced operations on March 7, 2011. |
| (b) | Class B and Class T shares reflect activity for the period March 7, 2011 through March 31, 2011. |
| (c) | Class I and Class W shares commenced operations on September 27, 2010. |
| (d) | Class I and Class W shares reflect activity for the period September 27, 2010 through March 31, 2011. |
| (e) | Class Y shares commenced operations on July 15, 2009. |
| (f) | Class Y shares reflect activity for the period July 15, 2009 through March 31, 2010. |
See Accompanying Notes to Financial Statements.
24
Statement of Changes in Net Assets (continued) – Columbia Bond Fund
| | | | | | | | | | | | | | | | |
| | | Capital Stock Activity | |
| | | Year Ended
March 31, 2011 (a)(b)(c)(d) | | | Year Ended
March 31, 2010 (e)(f) | |
| | | Shares | | | Dollars ($) | | | Shares | | | Dollars ($) | |
Class A | | | | | | | | | | | | | | | | |
Subscriptions | | | 896,716 | | | | 8,412,184 | | | | 1,312,247 | | | | 11,886,554 | |
Proceeds received in connection with merger | | | 6,825,239 | | | | 63,256,049 | | | | — | | | | — | |
Distributions reinvested | | | 79,020 | | | | 739,266 | | | | 50,645 | | | | 461,703 | |
Redemptions | | | (1,254,255 | ) | | | (11,731,528 | ) | | | (311,338 | ) | | | (2,857,410 | ) |
| | | | | | | | | | | | | | | | |
Net increase | | | 6,546,720 | | | | 60,675,971 | | | | 1,051,554 | | | | 9,490,847 | |
| | | | |
Class B | | | | | | | | | | | | | | | | |
Subscriptions | | | 1,557 | | | | 14,456 | | | | — | | | | — | |
Proceeds received in connection with merger | | | 605,596 | | | | 5,612,182 | | | | — | | | | — | |
Distributions reinvested | | | 354 | | | | 3,268 | | | | — | | | | — | |
Redemptions | | | (28,751 | ) | | | (266,349 | ) | | | — | | | | — | |
| | | | | | | | | | | | | | | | |
Net increase | | | 578,756 | | | | 5,363,551 | | | | — | | | | — | |
| | | | |
Class C | | | | | | | | | | | | | | | | |
Subscriptions | | | 94,835 | | | | 891,262 | | | | 158,653 | | | | 1,448,076 | |
Proceeds received in connection with merger | | | 1,214,993 | | | | 11,259,417 | | | | — | | | | — | |
Distributions reinvested | | | 8,923 | | | | 83,423 | | | | 4,529 | | | | 40,979 | |
Redemptions | | | (108,374 | ) | | | (1,010,438 | ) | | | (73,362 | ) | | | (670,217 | ) |
| | | | | | | | | | | | | | | | |
Net increase | | | 1,210,377 | | | | 11,223,664 | | | | 89,820 | | | | 818,838 | |
| | | | |
Class I | | | | | | | | | | | | | | | | |
Subscriptions | | | 39,675,596 | | | | 368,286,257 | | | | — | | | | — | |
Distributions reinvested | | | 68,979 | | | | 640,243 | | | | — | | | | — | |
Redemptions | | | (9,031,095 | ) | | | (83,363,670 | ) | | | — | | | | — | |
| | | | | | | | | | | | | | | | |
Net increase | | | 30,713,480 | | | | 285,562,830 | | | | — | | | | — | |
| | | | |
Class T | | | | | | | | | | | | | | | | |
Subscriptions | | | 3,625 | | | | 33,404 | | | | — | | | | — | |
Proceeds received in connection with merger | | | 1,776,589 | | | | 16,446,074 | | | | — | | | | — | |
Distributions reinvested | | | 1,865 | | | | 17,212 | | | | — | | | | — | |
Redemptions | | | (20,976 | ) | | | (193,415 | ) | | | — | | | | — | |
| | | | | | | | | | | | | | | | |
Net increase | | | 1,761,103 | | | | 16,303,275 | | | | — | | | | — | |
| | | | |
Class W | | | | | | | | | | | | | | | | |
Subscriptions | | | 277 | | | | 2,650 | | | | — | | | | — | |
Distributions reinvested | | | 2 | | | | 20 | | | | — | | | | — | |
Redemptions | | | (16 | ) | | | (150 | ) | | | — | | | | — | |
| | | | | | | | | | | | | | | | |
Net increase | | | 263 | | | | 2,520 | | | | — | | | | — | |
| | | | |
Class Y | | | | | | | | | | | | | | | | |
Subscriptions | | | 1,013,824 | | | | 9,640,583 | | | | 1,644,970 | | | | 14,869,097 | |
Distributions reinvested | | | 77,435 | | | | 725,037 | | | | 23,425 | | | | 216,849 | |
Redemptions | | | (23,119 | ) | | | (217,000 | ) | | | (65,147 | ) | | | (600,000 | ) |
| | | | | | | | | | | | | | | | |
Net increase | | | 1,068,140 | | | | 10,148,620 | | | | 1,603,248 | | | | 14,485,946 | |
| | | | |
Class Z | | | | | | | | | | | | | | | | |
Subscriptions | | | 29,389,647 | | | | 275,915,737 | | | | 29,383,305 | | | | 267,207,145 | |
Proceeds received in connection with merger | | | 196,357,315 | | | | 1,819,865,791 | | | | — | | | | — | |
Distributions reinvested | | | 1,457,494 | | | | 13,654,791 | | | | 1,229,550 | | | | 11,169,190 | |
Redemptions | | | (60,261,713 | ) | | | (560,266,829 | ) | | | (24,062,158 | ) | | | (219,932,623 | ) |
| | | | | | | | | | | | | | | | |
Net increase | | | 166,942,743 | | | | 1,549,169,490 | | | | 6,550,697 | | | | 58,443,712 | |
| (a) | Class B and Class T shares commenced operations on March 7, 2011. |
| (b) | Class B and Class T shares reflect activity for the period March 7, 2011 through March 31, 2011. |
| (c) | Class I and Class W shares commenced operations on September 27, 2010. |
| (d) | Class I and Class W shares reflect activity for the period September 27, 2010 through March 31, 2011. |
| (e) | Class Y shares commenced operations on July 15, 2009. |
| (f) | Class Y shares reflect activity for the period July 15, 2009 through March 31, 2010. |
See Accompanying Notes to Financial Statements.
25
Financial Highlights – Columbia Bond Fund
Selected data for a share outstanding throughout each period is as follows:
| | | | | | | | | | | | | | | | |
| | | Year Ended March 31, | | | Period Ended
March 31, | |
| Class A Shares | | 2011 | | | 2010 | | | 2009 | | | 2008 (a) | |
Net Asset Value, Beginning of Period | | $ | 9.28 | | | $ | 8.79 | | | $ | 9.09 | | | $ | 9.09 | |
| | | | |
Income from Investment Operations: | | | | | | | | | | | | | | | | |
Net investment income (b) | | | 0.27 | | | | 0.31 | | | | 0.35 | | | | — | (c) |
Net realized and unrealized gain (loss) on investments,
futures contracts and credit default swap contracts | | | 0.17 | | | | 0.59 | | | | (0.26 | ) | | | — | (c) |
| | | | | | | | | | | | | | | | |
Total from investment operations | | | 0.44 | | | | 0.90 | | | | 0.09 | | | | — | (c) |
| | | | |
Less Distributions to Shareholders: | | | | | | | | | | | | | | | | |
From net investment income | | | (0.29 | ) | | | (0.33 | ) | | | (0.38 | ) | | | — | (c) |
From net realized gains | | | (0.19 | ) | | | (0.08 | ) | | | (0.01 | ) | | | — | |
| | | | | | | | | | | | | | | | |
Total distributions to shareholders | | | (0.48 | ) | | | (0.41 | ) | | | (0.39 | ) | | | — | (c) |
| | | | |
Increase from regulatory settlements | | | — | | | | — | (c) | | | — | | | | — | |
| | | | |
Net Asset Value, End of Period | | $ | 9.24 | | | $ | 9.28 | | | $ | 8.79 | | | $ | 9.09 | |
Total return (d)(e) | | | 4.83 | % | | | 10.39 | %(f) | | | 1.04 | % | | | 0.01 | %(g) |
| | | | |
Ratios to Average Net Assets/Supplemental Data: | | | | | | | | | | | | | | | | |
Net expenses before interest expense (h) | | | 0.80 | % | | | 0.82 | % | | | 0.91 | % | | | 0.91 | %(i) |
Interest expense | | | — | | | | — | | | | — | %(j) | | | — | |
Net expenses (h) | | | 0.80 | % | | | 0.82 | % | | | 0.91 | % | | | 0.91 | %(i) |
Waiver/Reimbursement | | | 0.29 | % | | | 0.30 | % | | | 0.22 | % | | | 0.14 | %(i) |
Net investment income (h) | | | 2.97 | % | | | 3.43 | % | | | 3.99 | % | | | 4.16 | %(i) |
Portfolio turnover rate | | | 178 | % | | | 256 | % | | | 209 | % | | | 49 | %(g) |
Net assets, end of period (000s) | | $ | 75,770 | | | $ | 15,362 | | | $ | 5,299 | | | $ | 10 | |
| (a) | Class A shares commenced operations on March 31, 2008. Per share data and total return reflect activity from that date. |
| (b) | Per share data was calculated using the average shares outstanding during the period. |
| (c) | Rounds to less than $0.01 per share. |
| (d) | Had the Investment Manager and/or any of its affiliates not waived fees or reimbursed a portion of expenses, total return would have been reduced. |
| (e) | Total return at net asset value assuming all distributions reinvested and no initial sales charge or contingent deferred sales charge. |
| (f) | Total return includes a reimbursement of loss experienced by the Fund due to a compliance violation. The reimbursement had an impact of less than 0.01% on total return. |
| (h) | The benefits derived from expense reductions had an impact of less than 0.01%. |
| (j) | Rounds to less than 0.01%. |
See Accompanying Notes to Financial Statements.
26
Financial Highlights – Columbia Bond Fund
Selected data for a share outstanding throughout the period is as follows:
| | | | |
| Class B Shares | | Period Ended
March 31,
2011 (a) | |
Net Asset Value, Beginning of Period | | $ | 9.24 | |
| |
Income from Investment Operations: | | | | |
Net investment loss (b)(c) | | | — | |
Net realized and unrealized gain on investments, futures contracts and credit default swap contracts | | | 0.01 | |
| | | | |
Total from investment operations | | | 0.01 | |
| |
Less Distributions to Shareholders: | | | | |
From net investment income | | | (0.01 | ) |
| | | | |
| |
Net Asset Value, End of Period | | $ | 9.24 | |
Total return (d)(e)(f) | | | 0.15 | % |
| |
Ratios to Average Net Assets/Supplemental Data: | | | | |
Net expenses (g)(h) | | | 1.55 | % |
Waiver/Reimbursement (h) | | | 0.31 | % |
Net investment income (g)(h) | | | (0.95 | )% |
Portfolio turnover rate (e) | | | 178 | % |
Net assets, end of period (000s) | | $ | 5,347 | |
| (a) | Class B shares commenced operations on March 7, 2011. Per share data and total return reflect activity from that date. |
| (b) | Per share data was calculated using the average shares outstanding during the period. |
| (c) | Rounds to less than $0.01 per share. |
| (d) | Total return at net asset value assuming all distributions reinvested and no contingent deferred sales charge. |
| (f) | Had the Investment Manager and/or any of its affiliates not waived fees or reimbursed a portion of expenses, total return would have been reduced. |
| (g) | The benefits derived from expense reductions had an impact of less than 0.01%. |
See Accompanying Notes to Financial Statements.
27
Financial Highlights – Columbia Bond Fund
Selected data for a share outstanding throughout each period is as follows:
| | | | | | | | | | | | | | | | |
| | | Year Ended March 31, | | | Period Ended
March 31, | |
| Class C Shares | | 2011 | | | 2010 | | | 2009 | | | 2008 (a) | |
Net Asset Value, Beginning of Period | | $ | 9.29 | | | $ | 8.80 | | | $ | 9.09 | | | $ | 9.09 | |
| | | | |
Income from Investment Operations: | | | | | | | | | | | | | | | | |
Net investment income (b) | | | 0.21 | | | | 0.25 | | | | 0.29 | | | | — | (c) |
Net realized and unrealized gain (loss) on investments,
futures contracts and credit default swap contracts | | | 0.15 | | | | 0.58 | | | | (0.26 | ) | | | — | (c) |
| | | | | | | | | | | | | | | | |
Total from investment operations | | | 0.36 | | | | 0.83 | | | | 0.03 | | | | — | (c) |
| | | | |
Less Distributions to Shareholders: | | | | | | | | | | | | | | | | |
From net investment income | | | (0.22 | ) | | | (0.26 | ) | | | (0.31 | ) | | | — | (c) |
From net realized gains | | | (0.19 | ) | | | (0.08 | ) | | | (0.01 | ) | | | — | |
| | | | | | | | | | | | | | | | |
Total distributions to shareholders | | | (0.41 | ) | | | (0.34 | ) | | | (0.32 | ) | | | — | (c) |
| | | | |
Increase from regulatory settlements | | | — | | | | — | (c) | | | — | | | | — | |
| | | | |
Net Asset Value, End of Period | | $ | 9.24 | | | $ | 9.29 | | | $ | 8.80 | | | $ | 9.09 | |
Total return (d)(e) | | | 3.94 | % | | | 9.56 | %(f) | | | 0.44 | % | | | 0.01 | %(g) |
| | | | |
Ratios to Average Net Assets/Supplemental Data: | | | | | | | | | | | | | | | | |
Net expenses before interest expense (h) | | | 1.51 | % | | | 1.57 | % | | | 1.66 | % | | | 1.66 | %(i) |
Interest expense | | | — | | | | — | | | | — | %(j) | | | — | |
Net expenses (h) | | | 1.51 | % | | | 1.57 | % | | | 1.66 | % | | | 1.66 | %(i) |
Waiver/Reimbursement | | | 0.33 | % | | | 0.30 | % | | | 0.22 | % | | | 0.14 | %(i) |
Net investment income (h) | | | 2.26 | % | | | 2.71 | % | | | 3.32 | % | | | 3.41 | %(i) |
Portfolio turnover rate | | | 178 | % | | | 256 | % | | | 209 | % | | | 49 | %(g) |
Net assets, end of period (000s) | | $ | 13,398 | | | $ | 2,226 | | | $ | 1,317 | | | $ | 10 | |
| (a) | Class C shares commenced operations on March 31, 2008. Per share data and total return reflect activity from that date. |
| (b) | Per share data was calculated using the average shares outstanding during the period. |
| (c) | Rounds to less than $0.01 per share. |
| (d) | Had the Investment Manager and/or any of its affiliates not waived fees or reimbursed a portion of expenses, total return would have been reduced. |
| (e) | Total return at net asset value assuming all distributions reinvested and no contingent deferred sales charge. |
| (f) | Total return includes a reimbursement of loss experienced by the Fund due to a compliance violation. The reimbursement had an impact of less than 0.01% on total return. |
| (h) | The benefits derived from expense reductions had an impact of less than 0.01%. |
| (j) | Rounds to less than 0.01%. |
See Accompanying Notes to Financial Statements.
28
Financial Highlights – Columbia Bond Fund
Selected data for a share outstanding throughout the period is as follows:
| | | | |
| Class I Shares | | Period Ended
March 31,
2011 (a) | |
Net Asset Value, Beginning of Period | | $ | 9.58 | |
| |
Income from Investment Operations: | | | | |
Net investment income (b) | | | 0.14 | |
Net realized and unrealized loss on investments, futures contracts and credit default swap contracts | | | (0.18 | ) |
| | | | |
Total from investment operations | | | (0.04 | ) |
| |
Less Distributions to Shareholders: | | | | |
From net investment income | | | (0.16 | ) |
From net realized gains | | | (0.13 | ) |
| | | | |
Total distributions to shareholders | | | (0.29 | ) |
| |
Net Asset Value, End of Period | | $ | 9.25 | |
Total return (c)(d)(e) | | | (0.44 | )% |
| |
Ratios to Average Net Assets/Supplemental Data: | | | | |
Net expenses (f)(g) | | | 0.51 | % |
Waiver/Reimbursement (g) | | | 0.11 | % |
Net investment income (f)(g) | | | 2.89 | % |
Portfolio turnover rate (d) | | | 178 | % |
Net assets, end of period (000s) | | $ | 284,143 | |
| (a) | Class I shares commenced operations on September 27, 2010. Per share data and total return reflect activity from that date. |
| (b) | Per share data was calculated using the average shares outstanding during the period. |
| (c) | Total return at net asset value assuming all distributions reinvested. |
| (e) | Had the Investment Manager and/or any of its affiliates not waived fees or reimbursed a portion of expenses, total return would have been reduced. |
| (f) | The benefits derived from expense reductions had an impact of less than 0.01%. |
See Accompanying Notes to Financial Statements.
29
Financial Highlights – Columbia Bond Fund
Selected data for a share outstanding throughout the period is as follows:
| | | | |
| Class T Shares | | Period Ended
March 31,
2011 (a) | |
Net Asset Value, Beginning of Period | | $ | 9.23 | |
| |
Income from Investment Operations: | | | | |
Net investment loss (b)(c) | | | — | |
Net realized and unrealized gain on investments, futures contracts and credit default swap contracts | | | 0.02 | |
| | | | |
Total from investment operations | | | 0.02 | |
| |
Less Distributions to Shareholders: | | | | |
From net investment income | | | (0.02 | ) |
| | | | |
| |
Net Asset Value, End of Period | | $ | 9.23 | |
Total return (d)(e)(f) | | | 0.21 | % |
| |
Ratios to Average Net Assets/Supplemental Data: | | | | |
Net expenses (g)(h) | | | 0.70 | % |
Waiver/Reimbursement (h) | | | 0.31 | % |
Net investment loss (g)(h) | | | (0.07 | )% |
Portfolio turnover rate (e) | | | 178 | % |
Net assets, end of period (000s) | | $ | 16,251 | |
| (a) | Class T shares commenced operations on March 7, 2011. Per share data and total return reflect activity from that date. |
| (b) | Per share data was calculated using the average shares outstanding during the period. |
| (c) | Rounds to less than $0.01 per share |
| (d) | Total return at net asset value assuming all distributions reinvested. |
| (f) | Had the Investment Manager and/or any of its affiliates not waived fees or reimbursed a portion of expenses, total return would have been reduced. |
| (g) | The benefits derived from expense reductions had an impact of less than 0.01%. |
See Accompanying Notes to Financial Statements.
30
Financial Highlights – Columbia Bond Fund
Selected data for a share outstanding throughout the period is as follows:
| | | | |
| Class W Shares | | Period Ended
March 31,
2011 (a) | |
Net Asset Value, Beginning of Period | | $ | 9.57 | |
| |
Income from Investment Operations: | | | | |
Net investment income (b) | | | 0.12 | |
Net realized and unrealized loss on investments, futures contracts and credit default swap contracts | | | (0.18 | ) |
| | | | |
Total from investment operations | | | (0.06 | ) |
| |
Less Distributions to Shareholders: | | | | |
From net investment income | | | (0.14 | ) |
From net realized gains | | | (0.13 | ) |
| | | | |
Total distributions to shareholders | | | (0.27 | ) |
| |
Net Asset Value, End of Period | | $ | 9.24 | |
Total return (c)(d)(e) | | | (0.60 | )% |
| |
Ratios to Average Net Assets/Supplemental Data: | | | | |
Net expenses (f)(g) | | | 0.80 | % |
Waiver/Reimbursement (g) | | | 0.28 | % |
Net investment income (f)(g) | | | 2.63 | % |
Portfolio turnover rate (d) | | | 178 | % |
Net assets, end of period (000s) | | $ | 2 | |
| (a) | Class W shares commenced operations on September 27, 2010. Per share data and total return reflect activity from that date. |
| (b) | Per share data was calculated using the average shares outstanding during the period. |
| (c) | Total return at net asset value assuming all distributions reinvested. |
| (e) | Had the Investment Manager and/or any of its affiliates not waived fees or reimbursed a portion of expenses, total return would have been reduced. |
| (f) | The benefits derived from expense reductions had an impact of less than 0.01%. |
See Accompanying Notes to Financial Statements.
31
Financial Highlights – Columbia Bond Fund
Selected data for a share outstanding throughout each period is as follows:
| | | | | | | | |
| Class Y Shares | | Year Ended
March 31,
2011 | | | Period Ended
March 31,
2010 (a) | |
Net Asset Value, Beginning of Period | | $ | 9.30 | | | $ | 8.93 | |
| | |
Income from Investment Operations: | | | | | | | | |
Net investment income (b) | | | 0.30 | | | | 0.24 | |
Net realized and unrealized gain on investments, futures contracts and credit default swap contracts | | | 0.16 | | | | 0.38 | |
| | | | | | | | |
Total from investment operations | | | 0.46 | | | | 0.62 | |
| | |
Less Distributions to Shareholders: | | | | | | | | |
From net investment income | | | (0.32 | ) | | | (0.25 | ) |
From net realized gains | | | (0.19 | ) | | | — | |
| | | | | | | | |
Total distributions to shareholders | | | (0.51 | ) | | | (0.25 | ) |
| | |
Net Asset Value, End of Period | | $ | 9.25 | | | $ | 9.30 | |
Total return (c)(d) | | | 5.01 | % | | | 7.00 | %(e) |
| | |
Ratios to Average Net Assets/Supplemental Data: | | | | | | | | |
Net expenses (f) | | | 0.53 | % | | | 0.55 | %(g) |
Waiver/Reimbursement | | | 0.23 | % | | | 0.26 | %(g) |
Net investment income (f) | | | 3.21 | % | | | 3.58 | %(g) |
Portfolio turnover rate | | | 178 | % | | | 256 | %(e) |
Net assets, end of period (000s) | | $ | 24,717 | | | $ | 14,913 | |
| (a) | Class Y shares commenced operations on July 15, 2009. Per share data and total return reflect activity from that date. |
| (b) | Per share data was calculated using the average shares outstanding during the period. |
| (c) | Had the Investment Manager and/or any of its affiliates not waived fees or reimbursed a portion of expenses, total return would have been reduced. |
| (d) | Total return at net asset value assuming all distributions reinvested. |
| (f) | The benefits derived from expense reductions had an impact of less than 0.01%. |
See Accompanying Notes to Financial Statements.
32
Financial Highlights – Columbia Bond Fund
Selected data for a share outstanding throughout each period is as follows:
| | | | | | | | | | | | | | | | | | | | |
| | | Year Ended March 31, | |
| Class Z Shares | | 2011 | | | 2010 | | | 2009 | | | 2008 (a)(b) | | | 2007 | |
Net Asset Value, Beginning of Period | | $ | 9.29 | | | $ | 8.80 | | | $ | 9.09 | | | $ | 8.98 | | | $ | 8.84 | |
| | | | | |
Income from Investment Operations: | | | | | | | | | | | | | | | | | | | | |
Net investment income (c) | | | 0.29 | | | | 0.34 | | | | 0.41 | | | | 0.40 | | | | 0.39 | |
Net realized and unrealized gain (loss) on investments, futures contracts and credit default swap contracts | | | 0.17 | | | | 0.58 | | | | (0.28 | ) | | | 0.10 | | | | 0.14 | |
| | | | | | | | | | | | | | | | | | | | |
Total from investment operations | | | 0.46 | | | | 0.92 | | | | 0.13 | | | | 0.50 | | | | 0.53 | |
| | | | | |
Less Distributions to Shareholders: | | | | | | | | | | | | | | | | | | | | |
From net investment income | | | (0.32 | ) | | | (0.35 | ) | | | (0.41 | ) | | | (0.39 | ) | | | (0.39 | ) |
From net realized gains | | | (0.19 | ) | | | (0.08 | ) | | | (0.01 | ) | | | — | | | | — | |
| | | | | | | | | | | | | | | | | | | | |
Total distributions to shareholders | | | (0.51 | ) | | | (0.43 | ) | | | (0.42 | ) | | | (0.39 | ) | | | (0.39 | ) |
| | | | | |
Increase from regulatory settlements | | | — | | | | — | (d) | | | — | | | | — | | | | — | |
| | | | | |
Net Asset Value, End of Period | | $ | 9.24 | | | $ | 9.29 | | | $ | 8.80 | | | $ | 9.09 | | | $ | 8.98 | |
Total return (e)(f) | | | 4.98 | % | | | 10.66 | %(g) | | | 1.49 | % | | | 5.75 | % | | | 6.08 | % |
| | | | | |
Ratios to Average Net Assets/Supplemental Data: | | | | | | | | | | | | | | | | | | | | |
Net expenses before interest expense (h) | | | 0.55 | % | | | 0.57 | % | | | 0.66 | % | | | 0.90 | % | | | 0.90 | % |
Interest expense | | | — | | | | — | | | | — | %(i) | | | — | | | | — | |
Net expenses (h) | | | 0.55 | % | | | 0.57 | % | | | 0.66 | % | | | 0.90 | % | | | 0.90 | % |
Waiver/Reimbursement | | | 0.29 | % | | | 0.30 | % | | | 0.22 | % | | | 0.22 | % | | | 0.30 | % |
Net investment income (h) | | | 3.21 | % | | | 3.72 | % | | | 4.62 | % | | | 4.45 | % | | | 4.36 | % |
Portfolio turnover rate | | | 178 | % | | | 256 | % | | | 209 | % | | | 49 | % | | | 49 | % |
Net assets, end of period (000s) | | $ | 2,120,951 | | | $ | 581,596 | | | $ | 492,874 | | | $ | 546,781 | | | $ | 313,967 | |
| (a) | On March 31, 2008, Shares class of Core Bond Fund, a series of Excelsior Funds, Inc., was reorganized into the Fund’s Class Z shares. The financial information of the Fund’s Class Z shares includes the financial information of Core Bond Fund’s Shares class. |
| (b) | On March 31, 2008, Core Bond Fund’s Institutional Shares class were exchanged for Class Z shares of the Fund. |
| (c) | Per share data was calculated using the average shares outstanding during the period. |
| (d) | Rounds to less than $0.01 per share. |
| (e) | Had the Investment Manager and/or any of its affiliates not waived fees or reimbursed a portion of expenses, total return would have been reduced. |
| (f) | Total return at net asset value assuming all distributions reinvested. |
| (g) | Total return includes a reimbursement of loss experienced by the Fund due to a compliance violation. The reimbursement had an impact of less than 0.01% on total return. |
| (h) | The benefits derived from expense reductions had an impact of less than 0.01%. |
| (i) | Rounds to less than 0.01%. |
See Accompanying Notes to Financial Statements.
33
Notes to Financial Statements – Columbia Bond Fund
March 31, 2011
Note 1. Organization
Columbia Bond Fund (the Fund), a series of Columbia Funds Series Trust I (the Trust), is a diversified fund. The Trust is registered under the Investment Company Act of 1940, as amended (the 1940 Act), as an open-end management investment company organized as a Massachusetts business trust.
After the close of business on April 30, 2010, Ameriprise Financial, Inc. (Ameriprise Financial) acquired a portion of the asset management business of Columbia Management Group, LLC (the Transaction), including the business of managing the Fund. In connection with the closing of the Transaction (the Closing), RiverSource Investments, LLC, a wholly owned subsidiary of Ameriprise Financial, became the investment manager of the Fund and changed its name to Columbia Management Investment Advisers, LLC (the Investment Manager).
Investment Objective
The Fund seeks high current income, consistent with minimal fluctuation of principal.
Fund Shares
The Trust has unlimited authorized shares of beneficial interest. The Fund offers Class A, Class B, Class C, Class I, Class T, Class W, Class Y and Class Z shares. On March 23, 2011, the Investment Manager exchanged Class Z shares of the Fund valued at $351,425,701 for Class I shares of the Fund. All share classes have identical voting, dividend and liquidation rights. All share classes have identical voting, dividend and liquidation rights. Each share class has its own expense structure and sales charges, as applicable.
Class A shares are subject to a maximum front-end sales charge of 4.75% based on the initial investment amount. Class A shares purchased without an initial sales charge in accounts aggregating $1 million to $50 million at the time of purchase are subject to a 1.00% contingent deferred sales charge (CDSC) if the shares are sold within 18 months of purchase, charged as follows: 1.00% CDSC if redeemed within 12 months of purchase, and 0.50% CDSC if redeemed more than 12, but less than 18 months after purchase.
The Fund does not accept investments by new or existing investors in the Fund’s Class B shares, except in connection with the reinvestment of any dividend and/or capital gain distributions in Class B shares of the Fund and exchanges by existing Class B shareholders of other funds within the Columbia Family of Funds. Class B shares are not subject to sales charges. Class B shares commenced operations on March 7, 2011.
Class C shares are subject to a 1.00% CDSC on shares redeemed within one year of purchase.
Class I shares are not subject to sales charges and are available only to the Columbia Family of Funds. Class I shares commenced operations on September 27, 2010.
Class T shares are subject to a maximum front-end sales charge of 5.75% based on the investment amount. Class T shares purchased without an initial sales charge in accounts aggregating $1 million to $50 million at the time of purchase are subject to a 1.00% contingent deferred sales charge (CDSC) if the shares are sold within 18 months of purchase, charged as follows: 1.00% CDSC if redeemed within 12 months of purchase, and 0.50% CDSC if redeemed more than 12, but less than 18 months after purchase. Class T shares are available only to certain investors, as described in the Fund’s prospectus. Class T shares commenced operations on March 7, 2011.
Class W shares are not subject to sales charges and are available only to investors purchasing through authorized investment programs managed by investment professionals, including discretionary managed account programs. Class W shares commenced operations on September 27, 2010.
Class Y shares are not subject to sales charges and are available only to certain investors, as described in the Fund’s prospectus.
Class Z shares are not subject to sales charges and are available only to certain investors, as described in the Fund’s prospectus.
Note 2. Summary of Significant Accounting Policies
The preparation of financial statements in accordance with U.S. generally accepted accounting principles (GAAP) requires the Investment Manager to make certain estimates and assumptions that affect the reported amounts of assets and liabilities, the disclosure of contingent assets and liabilities at the date of the financial statements and the reported amounts of revenue and expenses during the reporting period. Actual results could differ from those estimates.
The following is a summary of significant accounting policies consistently followed by the Fund in the preparation of its financial statements.
Security Valuation
Debt securities generally are valued by pricing services approved by the Trust’s Board of Trustees, based upon market transactions for normal, institutional-size trading units of similar securities. The
34
Columbia Bond Fund
March 31, 2011
services may use various pricing techniques which take into account appropriate factors such as yield, quality, coupon rate, maturity, type of issue, trading characteristics and other data, as well as broker quotes. Debt securities for which quotations are readily available may also be valued based upon an over-the-counter or exchange bid quotation.
Certain debt securities, which tend to be more thinly traded and of lesser quality, are priced based on fundamental analysis of the financial condition of the issuer and the estimated value of any collateral. Valuations developed through pricing techniques may vary from the actual amounts realized upon sale of the securities, and the potential variation may be greater for those securities valued using fundamental analysis.
Asset-backed and mortgage-backed securities are generally valued by pricing services, which utilize pricing models that incorporate the securities’ cash flow and loan performance data. These models also take into account available market data, including trades, market quotations, and benchmark yield curves for identical or similar securities. Factors used to identify similar securities may include, but are not limited to, issuer, collateral type, vintage, prepayment speeds, collateral performance, credit ratings, credit enhancement and expected life. Asset-backed and mortgage-backed securities for which quotations are readily available may also be valued based upon an over-the-counter or exchange bid quotation.
Short-term investments maturing in 60 days or less are valued at amortized cost, which approximates market value.
Futures contracts are valued at the settlement price established each day by the board of trade or exchange on which they are traded.
Credit default swap contracts are marked to market daily based upon spread quotations from market makers.
Investments for which market quotations are not readily available, or that have quotations which the Investment Manager believes are not reliable, are valued at fair value as determined in good faith under consistently applied procedures established by and under the general supervision of the Board of Trustees. If a security is valued at fair value, such value is likely to be different from the last quoted market price for the security. The determination of fair value often requires significant judgment. To determine fair value, the Investment Manager may use assumptions including but not limited to future cash flows and estimated risk premiums. Multiple inputs from various sources may be used to determine value.
Derivative Instruments
The Fund may use derivative instruments including futures contracts and credit default swap contracts in order to meet its investment objectives. The Fund employs strategies in differing combinations to permit it to increase, decrease or change the level of exposure to market risk factors. The achievement of any strategy relating to derivatives depends on an analysis of various risk factors, and if the strategies for the use of derivatives do not work as intended, the Fund may not achieve its investment objectives.
In pursuit of its investment objectives, the Fund is exposed to the following market risks among others:
Credit Risk: Credit risk relates to the ability of the issuer or guarantor of a fixed income security, or counterparty to a derivative contract to make timely principal and /or interest payments, or to otherwise honor its obligations. Securities are subject to varying degrees of credit risk, which are often reflected in credit ratings. Generally, lower-yield higher-quality bonds are subject to credit risk to a lesser extent than lower-grade higher-yield bonds.
Interest Rate Risk: Interest rate risk relates to the fluctuation in value of fixed income securities because of the inverse relationship of price and yield. Fixed income securities generally will decline in value upon an increase in general interest rates and their value generally will increase upon a decline in general interest rates. Fixed income securities with longer durations tend to be more sensitive to changes in interest rates, usually making them more volatile than securities with shorter durations.
The following provides more detailed information about each derivative type held by the Fund:
Futures Contracts — The Fund entered into interest rate futures contracts to manage the duration and yield curve exposure of the Fund versus the benchmark.
The use of futures contracts involves certain risks, which include, among others: (1) imperfect correlation between the price movement of the instruments and the underlying securities, (2) inability to close out positions due to differing trading hours, or the temporary absence of a liquid market, for either the instruments or the underlying securities, and (3) an inaccurate prediction of the future direction of interest rates by the Fund’s Investment Manager.
Upon entering into a futures contract, the Fund identifies within its portfolio of investments cash or securities in an amount sufficient to meet the initial margin requirement. Subsequent payments are made
35
Columbia Bond Fund
March 31, 2011
or received by the Fund equal to the daily change in the contract value and are recorded as variation margin receivable or payable and offset in unrealized gains or losses. The Fund recognizes a realized gain or loss when the contract is closed or expires.
Futures contracts involve, to varying degrees, risk of loss in excess of the variation margin disclosed on the Statement of Assets and Liabilities.
During the year ended March 31, 2011, the Fund entered into 4,829 futures contracts.
Credit Default Swaps — The Fund entered into credit default swap transactions as a protection buyer to reduce overall credit exposure.
Credit default swaps are agreements in which one party pays fixed periodic payments to a counterparty in consideration for a guarantee from the counterparty to make a specific payment should a negative credit event take place. The Fund may receive or make an upfront payment as the protection buyer or seller. Credit default swaps are marked to market daily based on quotations from market makers and any change is recorded as unrealized appreciation/depreciation on the Statement of Assets and Liabilities. Periodic payments received or made are recorded as a realized gain or loss and premiums received or made are amortized on the Statement of Operations.
If the Fund is a buyer of protection and a credit event occurs, as defined under the terms of that particular swap agreement, the Fund will either (i) receive from the seller of protection an amount equal to the notional amount of the swap and deliver the referenced obligation or underlying securities comprising the referenced index or (ii) receive a net settlement amount in the form of cash or securities equal to the notional amount of the swap less the recovery value of the referenced obligation or underlying securities comprising the referenced index.
If the Fund is a seller of protection and a credit event occurs, as defined under the terms of that particular swap agreement, the Fund will either (i) pay to the buyer of protection an amount equal to the notional amount of the swap and take delivery of the referenced obligation or underlying securities comprising the referenced index or (ii) pay a net settlement amount in the form of cash or securities equal to the notional amount of the swap less the recovery value of the referenced obligation or underlying securities comprising the referenced index.
Credit default swap agreements involve greater risks than if the Fund had invested in the reference obligation directly since, in addition to general market risks, credit default swaps are subject to illiquidity risk, counterparty risk and credit risk.
During the year ended March 31, 2011, the Fund purchased credit default swaps with a notional amount of $134,020,000.
The following table is a summary of the value of the Fund’s derivative instruments as of March 31, 2011:
| | | | | | | | |
| Fair Value of Derivative Instruments | |
| Statement of Assets and Liabilities | |
| Assets | | Fair Value | | Liabilities | | Fair Value | |
Futures
Variation
Margin | | $125,766* | | Futures
Variation
Margin | | | — | |
Open Credit
Default
Swaps/
Premiums | | 2,028,124 | | Open Credit
Default
Swaps/
Premiums | | $ | 287,847 | |
| * | Includes only current day’s variation margin. |
The effect of derivative instruments on the Fund’s Statement of Operations for the year ended March 31, 2011:
| | | | | | | | | | |
| | | | | | | | | |
| | | Amount of Realized Gain or (Loss) and
Change in Unrealized Appreciation or
(Depreciation) on Derivatives | |
| | | Risk
Exposure | | Net
Realized Gain
(Loss) | | | Change in Unrealized Appreciation (Depreciation) | |
| Futures Contracts | | Interest
Rate | | $ | (3,495,503 | ) | | $ | 1,175,287 | |
| Credit Default Swap Contracts | | Credit | | | (1,340,715) | | | | 174,759 | |
Repurchase Agreements
The Fund may engage in repurchase agreement transactions with institutions that the Investment Manager has determined are creditworthy. The Fund, through the custodian, receives delivery of the underlying securities collateralizing a repurchase agreement. The Investment Manager is responsible for determining that the collateral is at least equal, at all times, to the value of the repurchase obligation including interest. A repurchase agreement transaction involves certain risks in the event of default or insolvency of the counterparty. These risks include possible delays in or restrictions on the Fund’s ability to dispose of the underlying securities and a possible decline in the value of the underlying securities during the period while the Fund seeks to assert its rights.
36
Columbia Bond Fund
March 31, 2011
Delayed Delivery Securities
The Fund may trade securities on other than normal settlement terms, including securities purchased or sold on a “when-issued” basis. This may increase the risk if the other party to the transaction fails to deliver and causes the Fund to subsequently invest at less advantageous prices. The Fund identifies within its portfolio of investments cash or liquid securities in an amount equal to the delayed delivery commitment.
Treasury Inflation Protected Securities
The Fund may invest in treasury inflation protected securities (TIPS). The principal amount of TIPS is adjusted periodically and is increased for inflation or decreased for deflation based on a monthly published index. Interest payments are based on the adjusted principal at the time the interest is paid. These adjustments are recorded as interest income in the Statement of Operations.
Security Transactions
Security transactions are accounted for on the trade date. Cost is determined and gains (losses) are based upon the specific identification method for both financial statement and federal income tax purposes.
Income Recognition
Interest income is recorded on the accrual basis. Market premium and discount are amortized and accreted, respectively, on all debt securities, unless otherwise noted. Original issue discount is accreted to interest income over the life of the security with a corresponding increase in the cost basis, if any.
Expenses
General expenses of the Trust are allocated to the Fund and other series of the Trust based upon relative net assets or other expense allocation methodologies determined by the nature of the expense. Expenses directly attributable to a specific class of shares are charged to that share class. Expenses directly attributable to the Fund are charged to the Fund.
Determination of Class Net Asset Value
All income, expenses (other than class-specific expenses which are charged directly to a share class, as shown in the Statement of Operations) and realized and unrealized gains (losses) are allocated to each class of the Fund on a daily basis for purposes of determining the net asset value of each class. Income and expenses are allocated to each class based on the settled shares method, while realized and unrealized gains (losses) are allocated based on the relative net assets of each class.
Federal Income Tax Status
The Fund intends to qualify each year as a regulated investment company under Subchapter M of the Internal Revenue Code, as amended, and will distribute substantially all of its tax exempt or taxable income, if any, for its tax year, and as such will not be subject to federal income taxes. In addition, the Fund intends to distribute in each calendar year substantially all of its net investment income, capital gains and certain other amounts, if any, such that the Fund should not be subject to federal excise tax. Therefore, no federal income or excise tax provision is recorded.
Distributions to Shareholders
Distributions from net investment income are declared daily and paid monthly. Net realized capital gains, if any, are distributed at least annually. Income distributions and capital gain distributions are determined in accordance with federal income tax regulations which may differ from GAAP.
Indemnifications
Under the Trust’s organizational documents and, in some cases, by contract, its officers and directors are indemnified against certain liabilities arising out of the performance of their duties to the Fund. In addition, certain of the Fund’s contracts with its service providers contain general indemnification clauses. The Fund’s maximum exposure under these arrangements is unknown since the amount of any future claims that may be made against the Fund cannot be determined and the Fund has no historical basis for predicting the likelihood of any such claims.
Note 3. Fees and Compensation Paid to Affiliates
Investment Management Fee
Under an Investment Management Services Agreement (IMSA), the Investment Manager determines which securities will be purchased, held or sold. In September 2010, the Board of Trustees approved an amended IMSA that includes an annual management fee rate that declines from 0.43% to 0.30% as the Fund’s net assets increase and would increase the management fees payable to the Investment Manager at certain asset levels. The amended IMSA was approved by the Fund’s shareholders at a meeting held on February 15, 2011. The amended IMSA was effective on March 1, 2011.
37
Columbia Bond Fund
March 31, 2011
For the period from the Closing through February 28, 2011, the management fee was equal to a percentage of the Fund’s average daily net assets that declined from 0.65% to 0.27% as the Fund’s net assets increased. Prior to the Closing, Columbia Management Advisors, LLC (Columbia), an indirect, wholly owned subsidiary of Bank of America Corporation (BOA), provided investment management services to the Fund under the same fee structure. The effective management fee rate for the year ended March 31, 2011, was 0.54% of the Fund’s average daily net assets.
Administration Fee
Effective upon the Closing, the Investment Manager provides administration and accounting services to the Fund under an Administrative Services Agreement, including services previously performed under the Pricing and Bookkeeping Oversight and Services Agreement (the Services Agreement) as discussed in the Pricing and Bookkeeping Fees note below. In September 2010, the Board of Trustees approved an amended Administrative Services Agreement that includes an annual administration fee rate that declines from 0.07% to 0.04% as the Fund’s net assets increase and would decrease the administration fees payable to the Investment Manager at all asset levels. The amended Administrative Services Agreement was effective on March 1, 2011.
For the period from the Closing through February 28, 2011, the administration fee was equal to 0.15% of the Fund’s average daily net assets less fees payable by the Fund as described under the Pricing and Bookkeeping Fees note below. Prior to the Closing, Columbia provided administrative services to the Fund at the same fee rates. The effective administration fee rate for the year ended March 31, 2011, was 0.13% of the Fund’s average daily net assets.
Pricing and Bookkeeping Fees
Prior to the Closing, the Fund entered into a Financial Reporting Services Agreement (the Financial Reporting Services Agreement) with State Street Bank and Trust Company (State Street) and Columbia pursuant to which State Street provides financial reporting services to the Fund. The Fund also entered into an Accounting Services Agreement (collectively with the Financial Reporting Services Agreement, the State Street Agreements) with State Street and Columbia pursuant to which State Street provides accounting services to the Fund. Upon the Closing, Columbia assigned and delegated its rights and obligations under the State Street Agreements to the Investment Manager. Under the State Street Agreements, the Fund pays State Street an annual fee of $38,000 paid monthly plus an additional monthly fee based on an annualized percentage rate of average daily net assets of the Fund for the month. The aggregate fee will not exceed $140,000 per year (exclusive of out-of-pocket expenses and charges). The Fund also reimburses State Street for certain out-of-pocket expenses and charges.
Also prior to the Closing, the Fund entered into the Services Agreement with Columbia. Under the Services Agreement, Columbia provided services related to Fund expenses and the requirements of the Sarbanes-Oxley Act of 2002, and provided oversight of the accounting and financial reporting services provided by State Street. Under the Services Agreement, the Fund reimbursed Columbia for out-of-pocket expenses and charges, including fees payable to third parties, such as for pricing the Fund’s portfolio securities, incurred by Columbia in the performance of services under the Services Agreement. The Services Agreement was terminated upon the Closing. These services are now provided under the Administrative Services Agreement discussed above.
Transfer Agent Fee
In connection with the Closing, RiverSource Service Corporation, a wholly owned subsidiary of Ameriprise Financial, provides transfer agency services to the Fund under a Transfer Agency Agreement and changed its name to Columbia Management Investment Services Corp. (the Transfer Agent). The Transfer Agent has contracted with Boston Financial Data Services (BFDS) to serve as sub-transfer agent.
The Transfer Agent receives monthly account-based service fees based on the number of open accounts and is reimbursed by the Fund for the fees and expenses the Transfer Agent pays to financial intermediaries that maintain omnibus accounts with the Fund that is a percentage of the average aggregate value of the Fund’s shares maintained in each such omnibus account (other than omnibus accounts for which American Enterprise Investment Services Inc. is the broker of record or accounts where the beneficial shareholder is a customer of Ameriprise Financial Services, Inc., which are paid a per account fee). The Transfer Agent pays the fees of BFDS for services as sub-transfer agent and, is not entitled to reimbursement for such fees from the Fund (with the exception of out-of pocket fees). The Transfer Agent also receives compensation from fees for various shareholder services and reimbursements for certain out-of-pocket expenses.
Prior to the Closing, Columbia Management Services, Inc., an affiliate of Columbia and an indirect, wholly owned subsidiary of BOA, provided transfer agency services to the Fund and contracted with BFDS to serve as sub-transfer agent, under the same fee structure.
38
Columbia Bond Fund
March 31, 2011
Class I shares do not pay transfer agent fees. For the year ended March 31, 2011, the Fund’s effective transfer agent fee rate for each class, with the exception of Class I shares, as a percentage of each class’ average daily net assets was as follows:
| | | | | | | | | | | | |
| | | | | | | |
| Class A | | Class B | | Class C | | Class T | | Class W | | Class Y | | Class Z |
| 0.11% | | 0.34% | | 0.11% | | 0.34% | | 0.08% | | 0.00%* | | 0.11% |
| * | Rounds to less than 0.01%. |
An annual minimum account balance fee of $20 may apply to certain accounts with a value below the Fund’s initial minimum investment requirements to reduce the impact of small accounts on transfer agent fees. These minimum account balance fees are recorded as part of expense reductions on the Statement of Operations. For the year ended March 31, 2011, no minimum account balance fees were charged by the Fund.
Underwriting Discounts, Service and Distribution Fees
In connection with the Closing, RiverSource Fund Distributors, Inc., an indirect wholly owned subsidiary of Ameriprise Financial, provides distribution and shareholder services to the Fund and changed its name to Columbia Management Investment Distributors, Inc. (the Distributor). Pursuant to Rule 12b-1 under the 1940 Act, the Board of Trustees has approved, and the Fund has adopted, distribution and shareholder service plans (the Plans) which set the distribution and service fees for the Fund. These fees are calculated daily and are intended to compensate the Distributor and/or eligible selling and/or servicing agents for selling shares of the Fund and providing services to investors.
The Plans require the payment of a monthly service fee to the Distributor at the maximum annual rate of 0.25% of the average daily net assets attributable to Class A, Class B, Class C and Class W shares of the Fund. The Plans also require the payment of a monthly distribution fee to the Distributor at the maximum annual rates of 0.75% of the average daily net assets attributable to Class B and Class C shares and 0.25% of the average daily net assets attributable to Class W shares.
The Fund may pay a distribution fee of up to 0.25% of the Fund’s average daily net assets attributable to Class W shares and a service fee of up to 0.25% of the Fund’s average daily net assets attributable to Class W shares, provided, however, that the aggregate fee shall not exceed 0.25% of the Fund’s average daily net assets attributable to Class W shares.
Effective March 11, 2011, the Distributor has voluntarily agreed to waive a portion of the distribution and service fees for Class C shares so that the combined fee will not exceed 0.85% annually of Class C average daily net assets. These arrangements may be modified or terminated by the Distributor at any time.
Prior to the Closing, Columbia Management Distributors, Inc., an affiliate of Columbia and an indirect, wholly owned subsidiary of BOA, was the principal underwriter of the Fund’s shares. There were no changes to the underwriting discount structure of the Fund or the service or distribution fee rates paid by the Fund as a result of the Transaction.
Shareholder Services Fees
The Fund has adopted a shareholder services plan that permits it to pay for certain services provided to Class T shareholders by their selling and/or servicing agents. The Fund may pay shareholder servicing fees up to an aggregate annual rate of 0.40% of the Fund’s average daily net assets attributable to Class T shares (comprised of up to 0.20% for shareholder liaison services and up to 0.20% for administrative support services). These fees are currently limited to an aggregate annual rate of not more than 0.15% of the Fund’s average daily net assets attributable to Class T shares. In addition, the shareholder servicing fee shall be waived by the selling and/or servicing agents to the extent necessary to prevent net investment income from falling below 0.00% on a daily basis. For the year ended March 31, 2011, the shareholder services fee was 0.15% of the Fund’s average daily net assets attributable to Class T shares.
Sales charges, including front-end and CDSC’s, received by the Distributor for distributing Portfolio shares were $9,358 for Class A and $1,122 for Class C shares for the year ended March 31, 2011.
Fee Waivers and Expense Reimbursements
Effective September 27, 2010, the Investment Manager and certain of its affiliates have contractually agreed to waive fees or reimburse expenses, through September 30, 2011, so that the Fund’s ordinary operating expenses (excluding certain expenses described below), after giving effect to any balance credits or overdraft charges from the Fund’s custodian, do not exceed the annual rates of 0.80%, 1.55%, 1.55%, 0.51%, 0.70%, 0.80%, 0.55% and 0.55% of the Fund’s average daily net assets attributable to Class A, Class B, Class C, Class I, Class T, Class W, Class Y and Class Z shares, respectively. The following expenses are excluded from the Fund’s ordinary operating expenses when calculating the cap, and therefore will be paid by the Fund: taxes (including foreign transaction taxes), expenses associated with investment in other pooled investment vehicles
39
Columbia Bond Fund
March 31, 2011
(including exchange traded funds and other affiliated and unaffiliated mutual funds), transaction costs and brokerage commissions, costs related to any securities lending program, dividend expenses associated with securities sold short, inverse floater program fees and expenses, transaction charges and interest on borrowed money, interest, extraordinary expenses and any other expenses the exclusion of which is specifically approved by the Fund’s Board. Effective March 1, 2011, the Investment Manager and certain affiliates have contractually extended this expense reimbursement agreement through July 31, 2012 at the same rates. This agreement may be modified or amended only with approval from all parties.
For the period May 1, 2010 through September 26, 2010, the Investment Manager voluntarily agreed to bear a portion of the Fund’s expenses so that the Fund’s ordinary operating expenses (excluding any distribution and service fees, brokerage commissions, interest, taxes and extraordinary expenses, but including custodian charges relating to overdrafts, if any), after giving effect to any balance credits from the Fund’s custodian, did not exceed 0.55% of the Fund’s average daily net assets on an annualized basis. Prior to May 1, 2010, Columbia voluntarily reimbursed a portion of the Fund’s expenses in the same manner.
Fees Paid to Officers and Trustees
In connection with the Closing, all officers of the Fund are employees of the Investment Manager or its affiliates and, with the exception of the Fund’s Chief Compliance Officer, receive no compensation from the Fund. The Board of Trustees has appointed a Chief Compliance Officer to the Fund in accordance with federal securities regulations. The Fund, along with other affiliated funds, pays its pro-rata share of the expenses associated with the Chief Compliance Officer. The Fund’s expenses for the Chief Compliance Officer will not exceed $15,000 per year. Prior to the Closing, all officers of the Fund were employees of Columbia or its affiliates and the Fund paid its pro-rata share of the expenses for the Chief Compliance Officer under the same fee structure.
Trustees are compensated for their services to the Fund, as set forth on the Statement of Operations. The Trust’s eligible Trustees may participate in a deferred compensation plan which may be terminated at any time. Obligations of the plan will be paid solely out of the Fund’s assets.
Note 4. Custody Credits
The Fund has an agreement with its custodian bank under which custody fees may be reduced by balance credits. These credits are recorded as part of expense reductions on the Statement of Operations. The Fund could have invested a portion of the assets utilized in connection with the expense offset arrangement in an income-producing asset if it had not entered into such an agreement. For the year ended March 31, 2011, these custody credits reduced total expenses by $298 for the Fund.
Note 5. Portfolio Information
The cost of purchases and proceeds from sales of securities, excluding short-term obligations, aggregated $3,277,717,953 and $1,433,157,906, respectively, for the year ended March 31, 2011, of which $1,767,792,935 and $1,032,998,269, respectively, were U.S. Government securities. The cost of purchases and proceeds from sales of securities, $26,560,485 and $72,335,006, respectively, to realign the Fund’s portfolio following the merger are excluded for purposes of calculating the Fund’s portfolio turnover rate.
Note 6. Regulatory Settlements
During the year ended March 31, 2010, the Fund received payments totaling $4,011 resulting from certain regulatory settlements with third parties in which the Fund had participated. The payments have been included in “Increase from regulatory settlements” in the Statement of Changes in Net Assets.
Note 7. Shareholder Concentration
As of March 31, 2011, one shareholder account owned 69.0% of the outstanding shares of the Fund. Purchase and redemption activity of this account may have a significant effect on the operations of the Fund.
Note 8. Line of Credit
Prior to March 28, 2011, the Fund and other affiliated funds participated in a $280,000,000 committed, unsecured revolving line of credit provided by State Street. Effective March 28, 2011, the commitment was reduced to $225,000,000. The maximum amount that may be borrowed by any fund is limited to the lesser of $200,000,000 and the Fund’s borrowing limit set forth in the Fund’s registration statement. Borrowings are available for short-term liquidity or temporary or emergency purposes.
Effective October 14, 2010, interest is charged to each participating fund based on the fund’s borrowings at a rate per annum equal to the greater of the Federal Funds Rate plus 1.25% or the overnight LIBOR Rate plus 1.25%. In addition, a commitment fee of 0.125% per annum is accrued and apportioned among the participating funds pro rata based on their relative net assets.
Prior to October 14, 2010, interest was charged to each participating fund at the same rates. In addition, a commitment fee of 0.15% per
40
Columbia Bond Fund
March 31, 2011
annum was accrued and apportioned among the participating funds pro rata based on their relative net assets.
For the year ended March 31, 2011, the Fund did not borrow under these arrangements.
Note 9. Federal Tax Information
The timing and character of income and capital gain distributions are determined in accordance with income tax regulations, which may differ from GAAP. Reclassifications are made to the Fund’s capital accounts for permanent tax differences to reflect income and gains available for distribution (or available capital loss carryforwards) under income tax regulations.
For the year ended March 31, 2011, permanent book and tax basis differences resulting primarily from differing treatments for distribution reclass and merger related items were identified and reclassified among the components of the Fund’s net assets as follows:
| | | | |
| | | | | |
Undistributed Net Investment
Income | | Accumulated Net Realized
Gain | | Paid-In
Capital |
| $2,917,051 | | $(4,801,465) | | $1,884,414 |
Net investment income and net realized gains (losses), as disclosed on the Statement of Operations, and net assets were not affected by this reclassification.
The tax character of distributions paid during the years ended March 31, 2011 and March 31, 2010 was as follows:
| | | | | | | | |
| | | March 31,
2011 | | | March 31,
2010 | |
| Distributions paid from: | | | | |
| Ordinary Income* | | $ | 39,613,973 | | | $ | 26,334,036 | |
| Long-Term Capital Gains | | | 1,833,910 | | | | 884,218 | |
| * | For tax purposes short-term capital gain distributions, if any, are considered ordinary income distributions. |
As of March 31, 2011, the components of distributable earnings on a tax basis were as follows:
| | | | |
| | | | | |
Undistributed
Ordinary
Income | | Undistributed Long-Term Capital Gains | | Net Unrealized Appreciation* |
| $1,243,525 | | $8,836,047 | | $32,602,885 |
| * | The differences between book-basis and tax-basis net unrealized appreciation are primarily due to deferral of losses from wash sales. |
Unrealized appreciation and depreciation at March 31, 2011, based on cost of investments for federal income tax purposes were:
| | | | |
| | | | |
| Unrealized appreciation | | $ | 71,912,582 | |
| Unrealized depreciation | | | (39,309,697 | ) |
| | | | |
| Net unrealized appreciation | | $ | 32,602,885 | |
Of the capital loss carryforwards attributable to the Fund, $3,196,862, will expire on March 31, 2016, was acquired from the merger with Columbia Core Bond Fund and Columbia Short Intermediate Bond Fund.
Capital loss carryforwards of $942,873 were utilized during the year ended March 31, 2011. Any capital loss carryforwards acquired as part of a merger that are permanently lost due to provisions under the Internal Revenue Code are included as being expired.
Management of the Fund has concluded that there are no significant
uncertain tax positions that would require recognition in the financial statements. However, management’s conclusion may be subject to review and adjustment at a later date based on factors including, but not limited to, new tax laws, regulations, and administrative interpretations (including relevant court decisions). The Fund’s federal tax returns for the prior three fiscal years remain subject to examination by the Internal Revenue Service.
Note 10. Significant Risks and Contingencies
Asset-Backed Securities Risk
The value of asset-backed securities may be affected by, among other factors, changes in interest rates, the market’s assessment of the quality of underlying assets, the creditworthiness of the servicer for the underlying assets, factors concerning the interests in and structure of the issuer or the originator of the underlying assets, or the creditworthiness or rating of the entities that provide any supporting letters of credit, surety bonds, derivative instruments, or other credit enhancement. The value of asset-backed securities also will be affected by the exhaustion, termination or expiration of any credit enhancement. Most asset-backed securities are subject to prepayment risk, which is the possibility that the underlying debt may be refinanced or prepaid prior to maturity during periods of declining or low interest rates, causing the Fund to have to reinvest the money received in securities that have lower yields. In addition, the impact of prepayments on the value of asset-backed securities may be difficult to predict and may result in greater volatility.
41
Columbia Bond Fund
March 31, 2011
Mortgage-Backed Securities Risk
The value of mortgage-backed securities may be affected by, among other things, changes in interest rates, factors concerning the interests in and structure of the issuer or the originator of the mortgages, the creditworthiness of the entities that provide any supporting letters of credit, surety bonds or other credit enhancements or the quality of underlying assets or the market’s assessment thereof. Mortgage-backed securities are subject to prepayment risk, which is the possibility that the underlying mortgage may be refinanced or prepaid prior to maturity during periods of declining or low interest rates, causing the Fund to have to reinvest the money received in securities that have lower yields. In addition, the impact of prepayments on the value of mortgage-backed securities may be difficult to predict and may result in greater volatility.
Note 11. Subsequent Events
Management has evaluated the events and transactions that have occurred through the date the financial statements were issued. Other than as noted below, there were no items requiring adjustment of the financial statements or additional disclosure.
Effective May 16, 2011, the line of credit commitment with State Street was reduced to $150,000,000, and the maximum amount that may be borrowed by any fund was limited to the lesser of $120,000,000 and the Fund’s borrowing limit set forth in the Fund’s registration statement.
Note 12. Information Regarding Pending and Settled Legal Proceedings
In June 2004, an action captioned John E. Gallus et al. v. American Express Financial Corp. and American Express Financial Advisors Inc. was filed in the United States District Court for the District of Arizona. The plaintiffs allege that they are investors in several American Express Company (now known as RiverSource) mutual funds and they purport to bring the action derivatively on behalf of those funds under the Investment Company Act of 1940. The plaintiffs allege that fees allegedly paid to the defendants by the funds for investment advisory and administrative services are excessive. The plaintiffs seek remedies including restitution and rescission of investment advisory and distribution agreements. The plaintiffs voluntarily agreed to transfer this case to the United States District Court for the District of Minnesota (the District Court). In response to defendants’ motion to dismiss the complaint, the District Court dismissed one of plaintiffs’ four claims and granted plaintiffs limited discovery. Defendants moved for summary judgment in April 2007. Summary judgment was granted in the defendants’ favor on July 9, 2007. The plaintiffs filed a notice of appeal with the Eighth Circuit Court of Appeals (the Eighth Circuit) on August 8, 2007. On April 8, 2009, the Eighth Circuit reversed summary judgment and remanded to the District Court for further proceedings. On August 6, 2009, defendants filed a writ of certiorari with the U.S. Supreme Court (the Supreme Court), asking the Supreme Court to stay the District Court proceedings while the Supreme Court considers and rules in a case captioned Jones v. Harris Associates, which involves issues of law similar to those presented in the Gallus case. On March 30, 2010, the Supreme Court issued its ruling in Jones v. Harris Associates, and on April 5, 2010, the Supreme Court vacated the Eighth Circuit’s decision in the Gallus case and remanded the case to the Eighth Circuit for further consideration in light of the Supreme Court’s decision in Jones v. Harris Associates. On June 4, 2010, the Eighth Circuit remanded the Gallus case to the District Court for further consideration in light of the Supreme Court’s decision in Jones v. Harris Associates. On December 9, 2010, the District Court reinstated its July 9, 2007 summary judgment order in favor of the defendants. On January 10, 2011 plaintiffs filed a notice of appeal with the Eighth Circuit.
In December 2005, without admitting or denying the allegations, American Express Financial Corporation (AEFC, which is now known as Ameriprise Financial, Inc. (Ameriprise Financial)), entered into settlement agreements with the Securities and Exchange Commission (SEC) and Minnesota Department of Commerce (MDOC) related to market timing activities. As a result, AEFC was censured and ordered to cease and desist from committing or causing any violations of certain provisions of the Investment Advisers Act of 1940, the Investment Company Act of 1940, and various Minnesota laws. AEFC agreed to pay disgorgement of $10 million and civil money penalties of $7 million. AEFC also agreed to retain an independent distribution consultant to assist in developing a plan for distribution of all disgorgement and civil penalties ordered by the SEC in accordance with various undertakings detailed at http://www.sec.gov/litigation/admin/ia-2451.pdf. Ameriprise Financial and its affiliates have cooperated with the SEC and the MDOC in these legal proceedings, and have made regular reports to the RiverSource, Seligman and Threadneedle funds’ Boards of Directors/Trustees.
Ameriprise Financial and certain of its affiliates have historically been involved in a number of legal, arbitration and regulatory proceedings, including routine litigation, class actions, and governmental actions, concerning matters arising in connection with the conduct of their business activities. Ameriprise Financial
42
Columbia Bond Fund
March 31, 2011
believes that the Funds are not currently the subject of, and that neither Ameriprise Financial nor any of its affiliates are the subject of, any pending legal, arbitration or regulatory proceedings that are likely to have a material adverse effect on the Funds or the ability of Ameriprise Financial or its affiliates to perform under their contracts with the Funds. Ameriprise Financial is required to make 10-Q, 10-K and, as necessary, 8-K filings with the Securities and Exchange Commission on legal and regulatory matters that relate to Ameriprise Financial and its affiliates. Copies of these filings may be obtained by accessing the SEC website at www.sec.gov.
There can be no assurance that these matters, or the adverse publicity associated with them, will not result in increased fund redemptions, reduced sale of fund shares or other adverse consequences to the Funds. Further, although we believe proceedings are not likely to have a material adverse effect on the Funds or the ability of Ameriprise Financial or its affiliates to perform under their contracts with the Funds, these proceedings are subject to uncertainties and, as such, we are unable to estimate the possible loss or range of loss that may result. An adverse outcome in one or more of these proceedings could result in adverse judgments, settlements, fines, penalties or other relief that could have a material adverse effect on the consolidated financial condition or results of operations of Ameriprise Financial.
In June 2004, an action captioned John E. Gallus et al. v. American Express Financial Corp. and American Express Financial Advisors Inc. was filed in the United States District Court for the District of Arizona. The plaintiffs allege that they are investors in several American Express Company (now known as RiverSource) mutual funds and they purport to bring the action derivatively on behalf of those funds under the Investment Company Act of 1940. The plaintiffs allege that fees allegedly paid to the defendants by the funds for investment advisory and administrative services are excessive. The plaintiffs seek remedies including restitution and rescission of investment advisory and distribution agreements. The plaintiffs voluntarily agreed to transfer this case to the United States District Court for the District of Minnesota (the District Court). In response to defendants’ motion to dismiss the complaint, the District Court dismissed one of plaintiffs’ four claims and granted plaintiffs limited discovery. Defendants moved for summary judgment in April 2007. Summary judgment was granted in the defendants’ favor on July 9, 2007. The plaintiffs filed a notice of appeal with the Eighth Circuit Court of Appeals (the Eighth Circuit) on August 8, 2007. On April 8, 2009, the Eighth Circuit reversed summary judgment and remanded to the District Court for further proceedings. On August 6, 2009, defendants filed a writ of certiorari with the U.S. Supreme Court (the Supreme Court), asking the Supreme Court to stay the District Court proceedings while the Supreme Court considers and rules in a case captioned Jones v. Harris Associates, which involves issues of law similar to those presented in the Gallus case. On March 30, 2010, the Supreme Court issued its ruling in Jones v. Harris Associates, and on April 5, 2010, the Supreme Court vacated the Eighth Circuit’s decision in the Gallus case and remanded the case to the Eighth Circuit for further consideration in light of the Supreme Court’s decision in Jones v. Harris Associates. On June 4, 2010, the Eighth Circuit remanded the Gallus case to the District Court for further consideration in light of the Supreme Court’s decision in Jones v. Harris Associates. On December 9, 2010, the District Court reinstated its July 9, 2007 summary judgment order in favor of the defendants. On January 10, 2011, plaintiffs filed a notice of appeal with the Eighth Circuit.
In December 2005, without admitting or denying the allegations, American Express Financial Corporation (AEFC, which is now known as Ameriprise Financial, Inc. (Ameriprise Financial), entered into settlement agreements with the Securities and Exchange Commission (SEC) and Minnesota Department of Commerce (MDOC) related to market timing activities. As a result, AEFC was censured and ordered to cease and desist from committing or causing any violations of certain provisions of the Investment Advisers Act of 1940, the Investment Company Act of 1940, and various Minnesota laws. AEFC agreed to pay disgorgement of $10 million and civil money penalties of $7 million. AEFC also agreed to retain an independent distribution consultant to assist in developing a plan for distribution of all disgorgement and civil penalties ordered by the SEC in accordance with various undertakings detailed at http://www.sec.gov/litigation/admin/ia-2451.pdf. Ameriprise Financial and its affiliates have cooperated with the SEC and the MDOC in these legal proceedings, and have made regular reports to the RiverSource, Seligman and Threadneedle funds’ Boards of Directors/Trustees.
Ameriprise Financial and certain of its affiliates have historically been involved in a number of legal, arbitration and regulatory proceedings, including routine litigation, class actions, and governmental actions, concerning matters arising in connection with the conduct of their business activities. Ameriprise Financial believes that the Funds are not currently the subject of, and that neither Ameriprise Financial nor any of its affiliates are the subject of, any pending legal, arbitration or regulatory proceedings that are likely to have a material adverse effect on the Funds or the ability of Ameriprise Financial or its affiliates to perform under their contracts with the Funds. Ameriprise Financial is required to make 10-Q,
43
Columbia Bond Fund
March 31, 2011
10-K and, as necessary, 8-K filings with the Securities and Exchange Commission on legal and regulatory matters that relate to Ameriprise Financial and its affiliates. Copies of these filings may be obtained by accessing the SEC website at www.sec.gov.
There can be no assurance that these matters, or the adverse publicity associated with them, will not result in increased fund redemptions, reduced sale of fund shares or other adverse consequences to the Funds. Further, although we believe proceedings are not likely to have a material adverse effect on the Funds or the ability of Ameriprise Financial or its affiliates to perform under their contracts with the Funds, these proceedings are subject to uncertainties and, as such, we are unable to estimate the possible loss or range of loss that may result. An adverse outcome in one or more of these proceedings could result in adverse judgments, settlements, fines, penalties or other relief that could have a material adverse effect on the consolidated financial condition or results of operations of Ameriprise Financial.
Note 13. Fund Merger
At the close of business on March 11, 2011, Columbia Bond Fund acquired the assets and assumed the identified liabilities of Columbia Core Bond Fund and Columbia Short-Intermediate Bond Fund. The reorganization was completed after shareholders approved the plan on February 15, 2011. The purpose of the transaction was to combine two funds managed by the Investment Manager with comparable investment objectives and strategies.
The aggregate net assets of Columbia Bond Fund immediately before the acquisition were $737,515,241 and the combined net assets immediately after the acquisition was $2,654,074,590.
The merger was accomplished by a tax-free exchange of 146,676,981 shares and 41,410,121 shares of Columbia Core Bond Fund and Columbia Short-Intermediate Bond Fund valued at $1,609,982,935 and $306,576,914, respectively.
In exchange for Columbia Core Bond Fund and Columbia Short- Intermediate Bond Fund shares and net assets, Columbia Bond Fund issued the following number of shares:
| | | | |
| | | | |
| | | Shares | |
Class A | | | 6,825,239 | |
Class B | | | 605,596 | |
Class C | | | 1,214,993 | |
Class T | | | 1,776,589 | |
Class Z | | | 196,357,315 | |
For financial reporting purposes, net assets received and shares issued by Columbia Bond Fund were recorded at fair value; however, Columbia Core Bond Fund and Columbia Short- Intermediate Bond Fund’s cost of investments was carried forward to align ongoing reporting of Columbia Bond Fund’s realized and unrealized gains and losses with amounts distributable to shareholders for tax purposes.
The financial statements reflect the operations of Columbia Bond Fund for the period prior to the merger and the combined fund for the period subsequent to the merger. Because the combined investment portfolios have been managed as a single integrated portfolio since the merger was completed, it is not practicable to separate the amounts of revenue and earnings of Columbia Core Bond Fund and Columbia Short-Intermediate Bond Fund that have been included in the combined Fund’s Statement of Operations since the merger was completed.
Assuming the merger had been completed on April 1, 2010, the Fund’s pro-forma net investment income (loss), net gain (loss) on investments, net change in unrealized appreciation (depreciation) and net increase in net assets from operations for the year ended March 31, 2011 would have been approximately $92.6 million, $55.0 million, ($21.8 million) and $125.8 million, respectively.
44
Report of Independent Registered Public Accounting Firm
To the Trustees of Columbia Funds Series Trust I and the Shareholders of Columbia Bond Fund
In our opinion, the accompanying statement of assets and liabilities, including the investment portfolio, and the related statements of operations and of changes in net assets and the financial highlights present fairly, in all material respects, the financial position of Columbia Bond Fund (the “Fund”) (a series of Columbia Funds Series Trust I) at March 31, 2011, the results of its operations for the year then ended, the changes in its net assets for each of the two years in the period then ended, and the financial highlights for the periods indicated, in conformity with accounting principles generally accepted in the United States of America. These financial statements and financial highlights (hereafter referred to as “financial statements”) are the responsibility of the Fund’s management; our responsibility is to express an opinion on these financial statements based on our audits. We conducted our audits of these financial statements in accordance with the standards of the Public Company Accounting Oversight Board (United States). Those standards require that we plan and perform the audit to obtain reasonable assurance about whether the financial statements are free of material misstatement. An audit includes examining, on a test basis, evidence supporting the amounts and disclosures in the financial statements, assessing the accounting principles used and significant estimates made by management, and evaluating the overall financial statement presentation. We believe that our audits, which included confirmation of securities at March 31, 2011 by correspondence with the custodian and brokers, provide a reasonable basis for our opinion.
PricewaterhouseCoopers LLP
Boston, Massachusetts
May 20, 2011
45
Federal Income Tax Information (Unaudited) – Columbia Bond Fund
The Fund hereby designates as a capital gain dividend with respect to the fiscal year ended March 31, 2011, $11,203,452, or, if subsequently determined to be different, the net capital gain of such year.
46
Fund Governance
The Trustees serve terms of indefinite duration. The names, addresses and birth years of the Trustees and Officers of the Funds in the Columbia Funds Series Trust I, the year each was first elected or appointed to office, their principal business occupations during at least the last five years, the number of Funds overseen by each Trustee and other directorships they hold are shown below. Each officer listed below serves as an officer of each Fund in the Columbia Funds Series Trust I.
Independent Trustees
| | |
Name, Address and Year of Birth,
Position with Funds, Year First
Elected or Appointed to Office | | Principal Occupation(s) During Past Five Years, Number of Funds in Columbia Funds
Complex Overseen by Trustee, Other Directorships Held |
| |
| John D. Collins (born 1938) | | |
c/o Columbia Management Investment Advisers, LLC 225 Franklin Street Boston, MA 02110 Trustee (since 2005) | | Retired. Consultant, KPMG, LLP (accounting and tax firm) from July 1999 to June 2000; Partner, KPMG, LLP from March 1962 to June 1999. Oversees 46; Mrs. Fields Original Cookies, Inc. (consumer products); Suburban Propane Partners, L.P.; and Montpelier Re (insurance underwriting firm) |
| |
| Rodman L. Drake (born 1943) | | |
c/o Columbia Management Investment Advisers, LLC 225 Franklin Street Boston, MA 02110 Trustee (since 1994) and Chairman of the Board (since 2009) | | Independent consultant since 2010; Co-Founder of Baringo Capital LLC (private equity) from 1997 to 2008; CEO of Crystal River Capital, Inc. (real estate investment trust) from 2003 to 2010; Oversees 46; Jackson Hewitt Tax Service Inc. (tax preparation services); Celgene Corporation (global biotechnology company); Student Loan Corporation (student loan provider); Crystal River Capital, Inc. from 2005 to 2010; Parsons Brinckerhoff from 1995 to 2008; the Helios Funds (closed-end funds); and Apex Silver Mines Ltd. from 2007 to 2009 |
| |
| Douglas A. Hacker (born 1955) | | |
c/o Columbia Management Investment Advisers, LLC 225 Franklin Street Boston, MA 02110 Trustee (since 1996) | | Independent business executive since May 2006; Executive Vice President–Strategy of United Airlines (airline) from December 2002 to May 2006; President of UAL Loyalty Services (airline marketing company) from September 2001 to December 2002; Executive Vice President and Chief Financial Officer of United Airlines from July 1999 to September 2001. Oversees 46; Nash Finch Company (food distributor); Aircastle Limited (aircraft leasing); and SeaCube Container Leasing Ltd (container leasing) |
|
| Janet Langford Kelly (born 1957) |
c/o Columbia Management Investment Advisers, LLC 225 Franklin Street Boston, MA 02110 Trustee (since 1996) | | Senior Vice President, General Counsel and Corporate Secretary, ConocoPhillips (integrated energy company) since September 2007; Deputy General Counsel–Corporate Legal Services, ConocoPhillips from August 2006 to August 2007; Partner, Zelle, Hofmann, Voelbel, Mason & Gette LLP (law firm) from March 2005 to July 2006; Adjunct Professor of Law, Northwestern University, from September 2004 to June 2006; Director, UAL Corporation (airline) from February 2006 to July 2006; Oversees 46; None |
| |
| William E. Mayer (born 1940) | | |
c/o Columbia Management Investment Advisers, LLC 225 Franklin Street Boston, MA 02110 Trustee (since 1994) | | Partner, Park Avenue Equity Partners (private equity) since February 1999; Dean and Professor, College of Business and Management, University of Maryland from 1992 to 1996. Oversees 46; DynaVox Inc. (software developer); Lee Enterprises (print media), WR Hambrecht + Co. (financial service provider); BlackRock Kelso Capital Corporation (investment company) |
47
Fund Governance (continued)
Independent Trustees (continued)
| | |
Name, Address and Year of Birth,
Position with Funds, Year First
Elected or Appointed to Office | | Principal Occupation(s) During Past Five Years, Number of Funds in Columbia Funds
Complex Overseen by Trustee, Other Directorships Held |
| |
| David M. Moffett (born 1952) | | |
c/o Columbia Management Investment Advisers, LLC 225 Franklin Street Boston, MA 02110 Trustee (since 2011) | | Retired. Chief Executive Officer, Federal Home Loan Mortgage Corporation, from 2008 to 2009; Senior Adviser, Global Financial Services Group, Carlyle Group, Inc., from 2007 to 2008; Vice Chairman and Chief Financial Officer, U.S. Bancorp, from 1993 to 2007. Oversees 46; CIT Group Inc. (commercial and consumer finance), eBay Inc. (online trading community), MBIA Corp (financial service provider), E.W. Scripps Co. (print and television media), Building Materials Holding Corp. (building materials and construction services), and University of Oklahoma Foundation. |
| |
| Charles R. Nelson (born 1942) | | |
c/o Columbia Management Investment Advisers, LLC 225 Franklin Street Boston, MA 02110 Trustee (since 1981) | | Professor of Economics, University of Washington, since January 1976; Ford and Louisa Van Voorhis Professor of Political Economy, University of Washington, since September 1993; Adjunct Professor of Statistics, University of Washington, since September 1980; Associate Editor, Journal of Money Credit and Banking, 1993-2008; Consultant on econometric and statistical matters. Oversees 46; None |
| |
| John J. Neuhauser (born 1943) | | |
c/o Columbia Management Investment Advisers, LLC 225 Franklin Street Boston, MA 02110 Trustee (since 1984) | | President, Saint Michael’s College, since August 2007; Director or Trustee of several non-profit organization, including Fletcher Allen Health Care, Inc.; University Professor, Boston College from November 2005 to August 2007; Academic Vice President and Dean of Faculties, Boston College from August 1999 to October 2005. Oversees 46; Liberty All-Star Equity Fund and Liberty All-Star Growth Fund, Inc. (closed-end funds) |
| |
| Jonathan Piel (born 1938) | | |
c/o Columbia Management Investment Advisers, LLC 225 Franklin Street Boston, MA 02110 Trustee (since 1994) | | Cable television producer and website designer; The Editor, Scientific American from 1984 to 1994; Vice President, Scientific American, Inc., from 1984 to 1994; Member, Advisory Board, Stone Age Institute, Bloomington, Indiana (research institute that explores the effect of technology on human evolution); Member, Board of Directors of the National Institute of Social Sciences, New York City; Member, Board of Trustees of the William Alanson White Institute, New York City (institution for training psychoanalysts); and Member, Advisory Board, Mount Sinai Children’s Environmental Health Center, New York. Oversees 46; None |
| |
| Patrick J. Simpson (born 1944) | | |
c/o Columbia Management Investment Advisers, LLC 225 Franklin Street Boston, MA 02110 Trustee (since 2000) | | Partner, Perkins Coie LLP (law firm). Oversees 46; None |
| |
| Anne-Lee Verville (born 1945) | | |
c/o Columbia Management Investment Advisers, LLC 225 Franklin Street Boston, MA 02110 Trustee (since 1998) | | Retired since 1997 (formerly General Manager–Global Education Industry from 1994 to 1997, President–Application Systems Division from 1991 to 1994, Chief Financial Officer–US Marketing & Services from 1988 to 1991, and Chief Information Officer from 1987 to 1988, IBM Corporation (computer and technology)). Oversees 46; Enesco Group, Inc. (producer of giftware and home and garden decor products) from 2001 to 2006 |
48
Fund Governance (continued)
Interested Trustee
| | |
Name, Address and Year of Birth,
Position with Funds, Year First
Elected or Appointed to Office | | Principal Occupation(s) During Past Five Years, Number of Funds in Columbia Funds
Complex Overseen by Trustee, Other Directorships Held |
| |
| Michael A. Jones (born 1959) | | |
c/o Columbia Management Investment Advisers, LLC 225 Franklin Street Boston, MA 02110 Trustee (since 2011) Senior Vice President (since 2010) | | President and Director, Columbia Management Investment Advisers, LLC since May 2010; President and Director, Columbia Management Investment Distributors, Inc. since May 2010; Manager, Chairman, Chief Executive Officer and President, Columbia Management Advisors, LLC from 2007 to April 2010; Chief Executive Officer, President and Director, Columbia Management Distributors, Inc. from November 2006 to April 2010; previously, co-president and senior managing director at Robeco Investment Management. Oversees 46; None |
The Statement of Additional Information includes additional information about the Trustees of the Funds and is available, without charge, upon request by calling 1-800-345-6611.
49
Fund Governance (continued)
Officers
| | |
| Name, Year of Birth and Address | | Principal Occupation(s) During the Past Five Years |
|
| J. Kevin Connaughton (born 1964) |
225 Franklin Street Boston, MA 02110 President (since 2009) | | Senior Vice President and General Manager–Mutual Fund Products, Columbia Management Investment Advisers, LLC since May 2010; President, Columbia Funds, since 2009, and RiverSource Funds, since May 2010 (previously Senior Vice President and Chief Financial Officer, Columbia Funds, from June 2008 to January 2009, Treasurer, Columbia Funds, from October 2003 to May 2008, and senior officer of various other affiliated funds since 2000); Managing Director, Columbia Management Advisors, LLC from December 2004 to April 2010. |
| |
| Michael G. Clarke (born 1969) | | |
225 Franklin Street Boston, MA 02110 Treasurer (since 2011) and Chief Financial Officer (since 2009) | | Vice President, Columbia Management Investment Advisers, LLC since May 2010; Managing Director of Fund Administration, Columbia Management Advisors, LLC, from September 2004 to April 2010; senior officer of Columbia Funds and affiliated funds since 2002. |
| |
| Scott R. Plummer (born 1959) | | |
5228 Ameriprise Financial Center Minneapolis, MN 55474 Senior Vice President, Secretary and Chief Legal Officer (since 2010) | | Chief Legal Officer and Assistant Secretary, Columbia Management Investment Advisers, LLC since June 2005; Vice President and Lead Chief Counsel–Asset Management, Ameriprise Financial, Inc. since May 2010 (previously Vice President and Chief Counsel–Asset Management, from 2005 to April 2010, and Vice President–Asset Management Compliance from 2004 to 2005); Vice President, Chief Counsel and Assistant Secretary, Columbia Management Investment Distributors, Inc. since 2008; Vice President, General Counsel and Secretary, Ameriprise Certificate Company since 2005; Chief Counsel, RiverSource Distributors, Inc. since 2006; Vice President, General Counsel and Secretary, RiverSource Funds, since December 2006; Senior Vice President, Secretary and Chief Legal Officer, Columbia Funds, since May 2010. |
| |
| Linda J. Wondrack (born 1964) | | |
225 Franklin Street Boston, MA 02110 Senior Vice President and Chief Compliance Officer (since 2007) | | Vice President and Chief Compliance Officer, Columbia Management Investment Advisers, LLC since May 2010; Chief Compliance Officer, Columbia Funds, since 2007, and RiverSource Funds, since May 2010; Director (Columbia Management Group, LLC and Investment Product Group Compliance), Bank of America, from June 2005 to April 2010; Director of Corporate Compliance and Conflicts Officer of MFS Investment Management (investment management) from August 2004 to May 2005. |
| |
| William F. Truscott (born 1960) | | |
53600 Ameriprise Financial Center Minneapolis, MN 55474 Senior Vice President (since 2010) | | Chairman of the Board, Columbia Management Investment Advisers, LLC since May 2010 (previously President, Chairman of the Board and Chief Investment Officer, from 2001 to April 2010); Chief Executive Officer, U.S. Asset Management & President, Annuities, Ameriprise Financial, Inc. since May 2010 (previously President–U.S. Asset Management and Chief Investment Officer from 2005 to April 2010, and Senior Vice President–Chief Investment Officer, from 2001 to 2005); Director, President and Chief Executive Officer, Ameriprise Certificate Company since 2006; Director, Columbia Management Investment Distributors, Inc. since May 2010 (previously Chairman of the Board and Chief Executive Officer from 2008 to April 2010); Chairman of the Board and Chief Executive Officer, RiverSource Distributors, Inc. since 2006. |
50
Fund Governance (continued)
Officers (continued)
| | |
| Name, Year of Birth and Address | | Principal Occupation(s) During the Past Five Years |
|
| Colin Moore (born 1958) |
225 Franklin Street Boston, MA 02110 Senior Vice President (since 2010) | | Director and Chief Investment Officer, Columbia Management Investment Advisers, LLC since May 2010; Manager, Managing Director and Chief Investment Officer of Columbia Management Advisors, LLC from 2007 to April 2010; Head of Equities, Columbia Management Advisors, LLC from 2002 to 2007. |
| |
| Amy Johnson (born 1965) | | |
5228 Ameriprise Financial Center Minneapolis, MN 55474 Vice President (since 2010) | | Senior Vice President and Chief Operating Officer, Columbia Management Investment Advisers, LLC since May 2010 (previously Chief Administrative Officer, from 2009 until April 2010, Vice President–Asset Management and Trust Company Services, from 2006 to 2009, and Vice President–Operations and Compliance from 2004 to 2006). |
| |
| Joseph F. DiMaria (born 1968) | | |
225 Franklin Street Boston, MA 02110 Vice President (since 2011) and Chief Accounting Officer (since 2008) | | Vice President, Mutual Fund Administration, Columbia Management Investment Advisers, LLC, since May 2010; Director of Fund Administration, Columbia Management Advisors, LLC from January 2006 to April 2010; Head of Tax/Compliance and Assistant Treasurer, Columbia Management Advisors, LLC, from November 2004 to December 2005. |
| |
| Paul D. Pearson (born 1956) | | |
5228 Ameriprise Financial Center Minneapolis, MN 55474 Vice President and Assistant Treasurer (since 2011) | | Vice President, Investment Accounting, Columbia Management Investment Advisers, LLC, since May 2010; Vice President, Managed Assets, Investment Accounting, Ameriprise Financial Corporation. |
| |
| Paul B. Goucher (born 1968) | | |
5228 Ameriprise Financial Center Minneapolis, MN 55474 Vice President and Assistant Treasurer (since 2010) | | Vice President and Chief Counsel of Ameriprise Financial since January 2010 (formerly Vice President and Group Counsel from November 2008 to January 2010); Director, Managing Director and General Counsel of J. & W. Seligman & Co. Incorporated (Seligman) from July 2008 to November 2008 and Managing Director and Associate General Counsel of Seligman from January 2005 to July 2008. |
| |
| Christopher O. Petersen (born 1970) | | |
5228 Ameriprise Financial Center Minneapolis, MN 55474 Vice President and Assistant Treasurer (since 2010) | | Vice President and Chief Counsel, Ameriprise Financial since January 2010 (formerly Vice President and Group Counsel or Counsel from April 2004 to January 2010); Assistant Secretary of RiverSource Funds since January 2007. |
| |
| Michael E. DeFao (born 1968) | | |
5228 Ameriprise Financial Center Minneapolis, MN 55474 Vice President and Assistant Treasurer (since 2011) | | Vice President and Chief Counsel, Ameriprise Financial since May 2010; Associate General Counsel Bank of America from June 2005 to April 2010 |
| |
| Stephen T. Welsh (born 1957) | | |
225 Franklin Street Boston, MA 02110 Vice President (since 2006) | | President and Director, Columbia Management Investment Services Corp. since May 2010; President and Director, Columbia Management Services, Inc. from July 2004 to April 2010; Managing Director, Columbia Management Distributors, Inc. from August 2007 to April 2010. |
51
Shareholder Meeting Results
At a Joint Special Meeting of Shareholders held on February 15, 2011, shareholders of the Fund considered a proposal to approve a proposed amendment to the Investment Management Services Agreement with Columbia Management Investment Advisers, LLC. The proposal was approved as follows:
| | | | | | |
| | | | | | | |
| Votes For | | Votes Against | | Abstentions | | Broker Non-Votes |
| 580,304,573 | | 2,412,630 | | 2,209,594 | | 0 |
52
Important Information About This Report
The fund mails one shareholder report to each shareholder address. If you would like more than one report, please call shareholder services at 1-800-345-6611 and additional reports will be sent to you. This report has been prepared for shareholders of Columbia Bond Fund.
A description of the policies and procedures that the fund uses to determine how to vote proxies and a copy of the fund’s voting records are available (i) at www.columbiamanagement.com, (ii) on the Securities and Exchange Commission’s website at www.sec.gov, and (iii) without charge, upon request, by calling 1-800-368-0346. Information regarding how the fund voted proxies relating to portfolio securities during the 12-month period ended June 30 is available from the SEC’s website. Information regarding how the fund voted proxies relating to portfolio securities is also available from the fund’s website, www.columbiamanagement.com.
The fund files a complete schedule of portfolio holdings with the SEC for the first and third quarters of each fiscal year on Form N-Q. The fund’s Form N-Q is available on the SEC’s website at www.sec.gov and may be reviewed and copied at the SEC’s Public Reference Room in Washington, D.C. Information on the operation of the Public Reference Room may be obtained by calling
1-800-SEC-0330.
Transfer Agent
Columbia Management Investment Services Corp.
P.O. Box 8081
Boston, MA 02266-8081
1-800-345-6611
Distributor
Columbia Management Investment
Distributors, Inc.
225 Franklin Street
Boston, MA 02110
Investment Manager
Columbia Management Investment Advisers, LLC
225 Franklin Street
Boston, MA 02110
53

Columbia Bond Fund
P.O. Box 8081
Boston, MA 02266-8081
columbiamanagement.com
This information is for use with concurrent or prior delivery of a fund prospectus. Investors should consider the investment objectives, risks, charges and expenses of a mutual fund carefully before investing. For a free prospectus, which contains this and other important information about the funds, visit columbiamanagement.com. Read the prospectus carefully before investing. The Fund is distributed by Columbia Management Investment Distributors, Inc., member FINRA, and managed by Columbia Management Investment Advisers, LLC.
©2011 Columbia Management Investment Advisers, LLC. All rights reserved.
C-1176 A (05/11)

Columbia Emerging Markets Fund
Annual Report for the Period Ended March 31, 2011
Table of contents
The views expressed in this report reflect the current views of the respective parties. These views are not guarantees of future performance and involve certain risks, uncertainties and assumptions that are difficult to predict, so actual outcomes and results may differ significantly from the views expressed. These views are subject to change at any time based upon economic, market or other conditions and the respective parties disclaim any responsibility to update such views. These views may not be relied on as investment advice and, because investment decisions for a Columbia Fund are based on numerous factors, may not be relied on as an indication of trading intent on behalf of any particular Columbia Fund. References to specific securities should not be construed as a recommendation or investment advice.
President’s Message

Dear Shareholder:
The Columbia Management story began over 100 years ago, and today, we are one of the nation’s largest dedicated asset managers. The recent acquisition by Ameriprise Financial, Inc. brings together the talents, resources and capabilities of Columbia Management with those of RiverSource Investments, Threadneedle (acquired by Ameriprise in 2003) and Seligman Investments (acquired by Ameriprise in 2008) to build a best-in-class asset management business that we believe is truly greater than its parts.
RiverSource Investments traces its roots to 1894 when its then newly-founded predecessor, Investors Syndicate, offered a face-amount savings certificate that gave small investors the opportunity to build a safe and secure fund for retirement, education or other special needs. A mutual fund pioneer, Investors Syndicate launched Investors Mutual Fund in 1940. In the decades that followed, its mutual fund products and services lineup grew to include a full spectrum of styles and specialties. More than 110 years later, RiverSource continues to be a trusted financial products leader.
Threadneedle, a leader in global asset management and one of Europe’s largest asset managers, offers sophisticated international experience from a dedicated U.K. management team. Headquartered in London, it is named for Threadneedle Street in the heart of the city’s financial district, where British investors pioneered international and global investing. Threadneedle was acquired in 2003 and today operates as an affiliate of Columbia Management.
Seligman Investments’ beginnings date back to the establishment of the investment firm J. & W. Seligman & Co. in 1864. In the years that followed, Seligman played a major role in the geographical expansion and industrial development of the United States. In 1874, President Ulysses S. Grant named Seligman as fiscal agent for the U.S. Navy — an appointment that would last through World War I. Seligman helped finance the westward path of the railroads and the building of the Panama Canal. The firm organized its first investment company in 1929 and began managing its first mutual fund in 1930. In 2008, J. & W. Seligman & Co. Incorporated was acquired and Seligman Investments became an offering brand of RiverSource Investments, LLC.
We are proud of the rich and distinctive history of these firms, the strength and breadth of products and services they offer, and the combined cultures of pioneering spirit and forward thinking. Together we are committed to providing more for our shareholders than ever before.
| n | | A singular focus on our shareholders. Our business is asset management, so investors are our first priority. We dedicate our resources to identifying timely investment opportunities and provide a comprehensive choice of equity, fixed-income and alternative investments to help meet your individual needs. |
| n | | First-class research and thought leadership. We are dedicated to helping you take advantage of today’s opportunities and anticipate tomorrow’s. We stay abreast of the latest investment trends and ideas, using our collective insight to evaluate events and transform them into solutions you can use. |
| n | | A disciplined investment approach. We aren’t distracted by passing fads. Our teams adhere to a rigorous investment process that helps ensure the integrity of our products and enables you and your financial advisor to match our solutions to your objectives with confidence. |
When you choose Columbia Management, you can be confident that we will take the time to understand your needs and help you and your financial advisor identify the solutions that are right for you. Because at Columbia Management, we don’t consider ourselves successful unless you are.
Sincerely,

J. Kevin Connaughton
President, Columbia Funds
Investors should consider the investment objectives, risks, charges and expenses of a mutual fund carefully before investing. For a free prospectus, which contains this and other important information about the funds, visit www.columbiamanagement.com. The prospectus should be read carefully before investing.
Columbia Funds are distributed by Columbia Management Investment Distributors, Inc., member FINRA, and managed by Columbia Management Investment Advisers, LLC.
© 2011 Columbia Management Investment Advisers, LLC. All rights reserved.
Fund Profile – Columbia Emerging Markets Fund
Summary
| n | | For the 12-month period that ended March 31, 2011, the fund’s Class A shares returned 16.74% without sales charge. |
| n | | The fund’s results lagged the return of the MSCI Emerging Markets Index (Net),1 while substantially outpacing the return of the MSCI EAFE Index (Net).2 The fund’s return was slightly higher than the average return of funds in the Lipper Emerging Markets Funds Classification.3 |
| n | | The fund had less exposure than the MSCI Emerging Markets Index (Net) to the export nations of Taiwan and South Korea, which hampered relative return. Good security selection in China and Southeast Asia, as well as in health care stocks, aided performance. |
Portfolio Management
Dara J. White, lead manager, has co-managed the fund since 2008 and has been associated with the fund’s adviser or the fund’s previous adviser or its predecessors since 2006.
Jasmine (Weili) Huang has co-managed the fund since 2008 and has been associated with the fund’s adviser or the fund’s previous adviser or its predecessors since 2003.
Robert B. Cameron has co-managed the fund since 2008 and has been associated with the fund’s adviser or the fund’s previous adviser or its predecessors since 2008.
| 1 | The Morgan Stanley Capital International Emerging Markets (MSCI EM) Index (Net) is a free float-adjusted market capitalization index that is designed to measure equity market performance of emerging markets. As of December 31, 2010, the MSCI EM Index (Net) consisted of the following 21 emerging market country indices: Brazil, Chile, China, Colombia, Czech Republic, Egypt, Hungary, India, Indonesia, Korea, Malaysia, Mexico, Morocco, Peru, Philippines, Poland, Russia, South Africa, Taiwan, Thailand and Turkey. |
| 2 | The Morgan Stanley Capital International Europe, Australasia, Far East (MSCI EAFE) Index (Net) is a free float-adjusted market capitalization index that is designed to measure the equity market performance of developed markets, excluding the U.S. & Canada. As of December 31, 2010, the MSCI EAFE Index (Net) consisted of the following 22 developed market country indices: Australia, Austria, Belgium, Denmark, Finland, France, Germany, Greece, Hong Kong, Ireland, Israel, Italy, Japan, the Netherlands, New Zealand, Norway, Portugal, Singapore, Spain, Sweden, Switzerland and the United Kingdom. |
| 3 | Lipper Inc., a widely respected data provider in the industry, calculates an average total return (assuming reinvestment of distributions) for mutual funds with investment objectives similar to those of the fund. Lipper makes no adjustment for the effect of sales loads. |
Indices are not available for investment, are not professionally managed and do not reflect sales charges, fees, brokerage commissions, taxes or other expenses of investing. Securities in the fund may not match those in an index.
Performance data quoted represents past performance and current performance may be lower or higher. Past performance is no guarantee of future results. The investment return and principal value will fluctuate so that shares, when redeemed, may be worth more or less than the original cost. Please visit www.columbiamanagement.com for daily and most recent month-end performance updates.
Summary
1-year return as of 03/31/11
| | |
| |
 | | +16.74% Class A shares (without sales charge) |
| |
| | +18.46% MSCI Emerging Markets Index (Net) |
| |
| | +10.42% MSCI EAFE Index (Net) |
|
Morningstar Style BoxTM |
|
Equity Style |

|
The Morningstar Style BoxTM is based on the fund’s portfolio holdings. For equity funds, the vertical axis shows the market capitalization of the stocks owned, and the horizontal axis shows investment style (value, blend, or growth). Information shown is based on the most recent data provided by Morningstar.
© 2011 Morningstar, Inc. All rights reserved. The Morningstar information contained herein: (1) is proprietary to Morningstar and/or its content providers; (2) may not be copied or distributed; and (3) is not warranted to be accurate, complete or timely. Neither Morningstar nor its content providers are responsible for any damages or losses arising from any use of this information.
1
Economic Update – Columbia Emerging Markets Fund
As the world shed concerns that key economies might lapse back into recession, the World Bank reported that global gross domestic product (GDP) rose 3.9% in 2010. The improvement over 2009 was more notable in high-income developed economies than in emerging-market countries, which had less ground to make up. Emerging market countries expanded by an estimated 7%, contributing nearly half of all global growth in 2010. This two-speed global recovery is likely to result in slower growth in 2011, but global growth should remain solid at 3.3% to 3.6%.1
Robust expansion continues
Emerging markets led the global economy in 2010 and that robust expansion continues into 2011, led by China and India. Labor markets are healthy, income is rising and confidence runs high across most emerging markets. Higher oil prices pose a downside risk to the current expansion in oil-importing emerging economies, because it could erode demand for exports and increase the risk of inflation. However, if growth exceeds expectations in the United States or Europe, the picture gets even better for most emerging markets.
Inflation a growing worry
As demand picked up and commodity prices began to rise across the globe, inflation has become a growing worry in both fast-growing emerging markets and slower-growth developed countries. In developed market economies, inflation is generally an external force, resulting from higher commodity prices, especially for food and energy. In emerging markets, excess demand is driving inflation concerns and policymakers have begun to shift their focus from stimulating growth to taming inflation. However, rising food prices are also a problem in emerging market economies since food accounts for a greater percentage of household budgets than it does in more developed areas of the world.
Developing economies around the world are battling inflation with higher interest rates. The People’s Bank of China has raised the official cost of credit, including mortgage rates, three times over the past six months. Rates are also on the rise in Brazil, Russia and India.
Stocks stall, then pick up steam
Despite a period of volatility in the summer of 2010, as the world sought to digest a mounting debt crisis within euro zone countries, and a late March 2011 setback in the aftermath of Japan’s catastrophes, it was a decent year for stock markets around the world. The U.S. stock market returned 15.65% for the 12-month period, as measured by the S&P 500 Index.2 The MSCI EAFE Index (Net),3 a broad gauge of stock market performance in foreign developed markets, gained 10.42% (net of dividends, in U.S. dollars) for the period. Although the European Union took steps early in the year to rein in debt problems in Greece, Ireland and Spain, recent revelations that Portugal may also need a bailout hampered returns from European markets. The impact of the earthquake, tsunami and nuclear power plant debacle took a significant bite out of Japan’s returns in March, and Japan is a major component of the index. Emerging markets remained resilient, despite mounting fears about rising inflation. The MSCI Emerging Markets Index (Net)4 returned 18.46% (in U.S. dollars), led by strong performances from Eastern European markets.
Past performance is no guarantee of future results.
| 1 | World Bank estimates, January 12, 2011. |
| 2 | The Standard & Poor’s (S&P) 500 Index tracks the performance of 500 widely held, large-capitalization U.S. stocks. |
| 3 | The Morgan Stanley Capital International Europe, Australasia, Far East (MSCI EAFE) Index (Net) is a free float-adjusted market capitalization index that is designed to measure the equity market performance of developed markets, excluding the U.S. & Canada. As of December 31, 2010, the MSCI EAFE Index (Net) consisted of the following 22 developed market country indices: Australia, Austria, Belgium, Denmark, Finland, France, Germany, Greece, Hong Kong, Ireland, Israel, Italy, Japan, the Netherlands, New Zealand, Norway, Portugal, Singapore, Spain, Sweden, Switzerland and the United Kingdom. |
| 4 | The Morgan Stanley Capital International Emerging Markets (MSCI EM) Index (Net) is a free float-adjusted market capitalization index that is designed to measure equity market performance of emerging markets. As of December 31, 2010, the MSCI EM Index (Net) consisted of the following 21 emerging market country indices: Brazil, Chile, China, Colombia, Czech Republic, Egypt, Hungary, India, Indonesia, Korea, Malaysia, Mexico, Morocco, Peru, Philippines, Poland, Russia, South Africa, Taiwan, Thailand and Turkey. |
Indices are not available for investment, are not professionally managed and do not reflect sales charges, fees, brokerage commissions, taxes or other expenses of investing. Securities in the fund may not match those in an index.
Summary
For the 12-month period that ended March 31, 2011
| | n | | Despite intermittent volatility, stock markets around the world gained ground, as measured by the MSCI EAFE Index (Net) and the MSCI Emerging Markets Index (Net). | |
| | |
| MSCI EAFE Index | | MSCI EM Index |
| |

| |
|
10.42% | | 18.46% |
2
Performance Information – Columbia Emerging Markets Fund
|
| Performance of a $10,000 investment 04/01/01 – 03/31/11 |
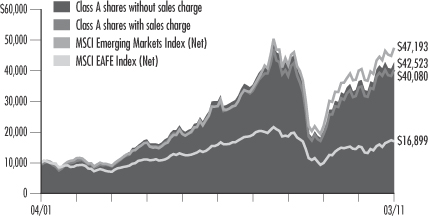
The chart above shows the change in value of a hypothetical $10,000 investment in Class A shares of Columbia Emerging Markets Fund during the stated time period, and does not reflect the deduction of taxes that a shareholder may pay on fund distributions or on the redemption of fund shares.
| | | | | | | | |
| Performance of a $10,000 investment 04/01/01 – 03/31/11 ($) | |
| | |
| Sales charge | | without | | | with | |
Class A | | | 42,523 | | | | 40,080 | |
Class C | | | 41,426 | | | | 41,426 | |
Class I | | | n/a | | | | n/a | |
Class R | | | n/a | | | | n/a | |
Class W | | | n/a | | | | n/a | |
Class Z | | | 42,851 | | | | n/a | |
| | | | | | | | | | | | | | | | | | | | | | | | | | | | | | | | |
| Average annual total return as of 03/31/11 (%) | |
| | | | | | |
| Share class | | A | | | C | | | I | | | R | | | W | | | Z | |
| Inception | | 10/01/07 | | | 10/01/07 | | | 09/27/10 | | | 09/27/10 | | | 09/27/10 | | | 01/02/98 | |
| Sales charge | | without | | | with | | | without | | | with | | | without | | | without | | | without | | | without | |
1-year | | | 16.74 | | | | 10.01 | | | | 15.92 | | | | 14.92 | | | | n/a | | | | n/a | | | | n/a | | | | 17.16 | |
5-year | | | 7.26 | | | | 5.99 | | | | 6.70 | | | | 6.70 | | | | n/a | | | | n/a | | | | n/a | | | | 7.42 | |
10-year/Life | | | 15.57 | | | | 14.89 | | | | 15.27 | | | | 15.27 | | | | 7.75 | | | | 7.50 | | | | 7.61 | | | | 15.66 | |
Performance data quoted represents past performance and current performance may be lower or higher. Past performance is no guarantee of future results. The investment return and principal value will fluctuate so that shares, when redeemed, may be worth more or less than the original cost. Please visit www.columbiamanagement.com for daily and most recent month-end performance updates.
| | | | |
| Net asset value per share | |
| |
as of 03/31/11 ($) | | | | |
Class A | | | 11.48 | |
Class C | | | 11.39 | |
Class I | | | 11.48 | |
Class R | | | 11.49 | |
Class W | | | 11.48 | |
Class Z | | | 11.49 | |
| | | | |
| Distributions declared per share | |
| |
04/01/10 – 03/31/11 ($) | | | | |
Class A | | | 1.55 | |
Class C | | | 1.48 | |
Class I | | | 1.10 | |
Class R | | | 1.06 | |
Class W | | | 1.08 | |
Class Z | | | 1.57 | |
The “with sales charge” returns include the maximum initial sales charge of 5.75% for Class A shares and the applicable contingent deferred sales charge of 1.00% for Class C shares for the first year only. The “without sales charge” returns do not include the effect of sales charges. If they had, returns would be lower.
The Fund commenced operations on March 31, 2008. The returns of the Class A and Class C shares shown for periods prior to March 31, 2008 include the returns of Class A shares or Class C shares, as applicable, of Emerging Markets Fund, the predecessor to the Fund and a series of Excelsior Funds, Inc. (the “Predecessor Fund”), for periods after September 27, 2007, and include the returns of Shares class shares of the Predecessor Fund for periods prior to September 28, 2007. The returns shown reflect applicable sales charges, but have not been adjusted to reflect differences in expenses. If differences in expenses were reflected, the returns shown for the periods prior to September 28, 2007 would be lower. The returns of the Class Z shares shown for periods prior to March 31, 2008 are those of the Shares class shares of the Predecessor Fund. The returns shown reflect that Class Z shares are sold without sales charges, but have not been adjusted to reflect differences in expenses. The inception of the Predecessor Fund is January 2, 1998.
Class I, Class R and Class W shares were initially offered by the fund on September 27, 2010.
Inception date refers to the date on which the Predecessor Fund share class commenced operations for Class A, Class C and Class Z shares and the date on which the fund share class commenced operations for Class I, Class R and Class W shares.
Performance results reflect any fee waivers or reimbursements of fund expenses by the Investment Manager and/or any of its affiliates. Absent these fee waivers or expense reimbursement arrangements, performance results would have been lower.
All results shown assume reinvestment of distributions. Class I and Class Z shares are sold at net asset value with no distribution and service (Rule 12b-1) fees. Class R shares are sold at net asset value with a distribution (Rule 12b-1) fee. Class W shares are sold at net asset value with a service (Rule 12b-1) fee. Class I, Class R, Class W and Class Z shares have limited eligibility and the investment minimum requirements may vary. Please see the fund’s prospectus for details. Performance for different share classes will vary based on differences in sales charges and fees associated with each class.
The table does not reflect the deduction of taxes that a shareholder may pay on fund distributions or on the redemption of fund shares.
3
Understanding Your Expenses – Columbia Emerging Markets Fund
As a fund shareholder, you incur two types of costs. There are transaction costs and ongoing costs, which generally include investment advisory fees, distribution and service (Rule 12b-1) fees and other fund expenses. The information on this page is intended to help you understand the ongoing costs of investing in the fund and to compare these costs with the ongoing costs of investing in other mutual funds.
Analyzing your fund’s expenses by share class
To illustrate these ongoing costs, we have provided an example and calculated the expenses paid by investors in each share class during the period. The information in the following table is based on an initial investment of $1,000, which is invested at the beginning of the period and held for the entire period. Expense information is calculated two ways and each method provides you with different information. The amount listed in the “Actual” column is calculated using the fund’s actual operating expenses and total return for the period. The amount listed in the “Hypothetical” column for each share class assumes that the return each year is 5% before expenses and is calculated based on the fund’s actual operating expenses. You should not use the hypothetical account values and expenses to estimate either your actual account balance at the end of the period or the expenses you paid during this period.
Compare with other funds
Since all mutual funds are required to include the same hypothetical calculations about expenses in shareholder reports, you can use this information to compare the ongoing costs of investing in the fund with other funds. To do so, compare the 5% hypothetical example with the 5% hypothetical examples that appear in the shareholder reports of other funds. As you compare hypothetical examples of other funds, it is important to note that hypothetical examples are meant to highlight the ongoing costs of investing in a fund and do not reflect any transaction costs, such as sales charges, redemption fees or exchange fees.
Estimating your actual expenses
To estimate the expenses that you paid over the period, first you will need your account balance at the end of the period:
| | n | | For shareholders who receive their account statements from Columbia Management Investment Services Corp., your account balance is available online at www.columbiamanagement.com or by calling Shareholder Services at 800.345.6611. | |
| | n | | For shareholders who receive their account statements from their financial intermediary, contact your financial intermediary to obtain your account balance. | |
| | 1. | Divide your ending account balance by $1,000. For example, if an account balance was $8,600 at the end of the period, the result would be 8.6. | |
| | 2. | In the section of the table below titled “Expenses paid during the period,” locate the amount for your share class. You will find this number in the column labeled “Actual.” Multiply this number by the result from step 1. Your answer is an estimate of the expenses you paid on your account during the period. | |
If the value of your account falls below the minimum initial investment requirement applicable to you, your account may be subject to a $20 annual fee. This fee is not included in the accompanying table. If you are subject to the fee, keep it in mind when you are estimating the ongoing expenses of investing in the fund and when comparing the expenses of this fund with other funds.
| | | | | | | | | | | | | | | | | | | | | | | | | | | | |
| 10/01/10 – 03/31/11 | | | | |
| | | | |
| | | Account value at the
beginning of the period ($) | | | Account value at the
end of the period ($) | | | Expenses paid
during the period ($) | | | Fund’s annualized
expense ratio (%) | |
| | | Actual | | | Hypothetical | | | Actual | | | Hypothetical | | | Actual | | | Hypothetical | | | Actual | |
Class A | | | 1,000.00 | | | | 1,000.00 | | | | 1,057.10 | | | | 1,016.70 | | | | 8.46 | | | | 8.30 | | | | 1.65 | |
Class C | | | 1,000.00 | | | | 1,000.00 | | | | 1,053.50 | | | | 1,012.96 | | | | 12.29 | | | | 12.04 | | | | 2.40 | |
Class I | | | 1,000.00 | | | | 1,000.00 | | | | 1,058.50 | | | | 1,018.35 | | | | 6.77 | | | | 6.64 | | | | 1.32 | |
Class R | | | 1,000.00 | | | | 1,000.00 | | | | 1,056.10 | | | | 1,015.46 | | | | 9.74 | | | | 9.55 | | | | 1.90 | |
Class W | | | 1,000.00 | | | | 1,000.00 | | | | 1,057.10 | | | | 1,016.70 | | | | 8.46 | | | | 8.30 | | | | 1.65 | |
Class Z | | | 1,000.00 | | | | 1,000.00 | | | | 1,059.10 | | | | 1,017.95 | | | | 7.19 | | | | 7.04 | | | | 1.40 | |
Expenses paid during the period are equal to the annualized expense ratio for the share class, multiplied by the average account value over the period, then multiplied by the number of days in the fund’s most recent fiscal half-year and divided by 365.
Had the Investment Manager and/or any of its affiliates not waived fees or reimbursed a portion of expenses, account value at the end of the period would have been reduced.
It is important to note that the expense amounts shown in the table are meant to highlight only ongoing costs of investing in the fund and do not reflect any transaction costs, such as sales charges, redemption fees or exchange fees. Therefore, the hypothetical examples provided may not help you determine the relative total costs of owning shares of different funds. If these transaction costs were included, your costs would have been higher.
4
Portfolio Managers’ Report – Columbia Emerging Markets Fund
For the 12-month period that ended March 31, 2011, the fund’s Class A shares returned 16.74% without sales charge. The fund’s benchmarks, the MSCI Emerging Markets Index (Net) and the MSCI EAFE Index (Net), returned 18.46% and 10.42%, respectively. The average return of funds in its peer group, the Lipper Emerging Markets Funds Classification, was 16.34% for the 12-month period. The fund’s modest shortfall relative to the MSCI Emerging Markets Index was primarily the result of an underweight and stock selection in the nations of Taiwan and South Korea. Good stock selection, especially in China and Southeast Asia and in the health care sector, made a positive contribution to the fund’s relative return, as did overall sector allocation.
Global recovery drove emerging markets growth
Propelled by a recovery in the world economy, emerging markets equities continued to outperform stocks in more developed nations. As major developing economies such as China, India and Brazil entered a more mature phase of their economic growth cycle, their central banks became more cautious about inflationary threats by adopting less accommodative monetary policies and removing stimulus applied during the 2008 crisis. Despite this policy shift, robust economic growth persisted. Meanwhile, recoveries in the United States and Europe appeared to strengthen, helping to lift the economies of export-dependent nations.
Focus on emerging middle classes and developing industrial bases
We think the most significant long-term opportunities in emerging markets are likely to come from the growth of middle classes and the expansion of the industrial bases in those countries whose middle classes are expanding. Throughout the 12 months covered by this report, we positioned the fund to benefit from these two themes. However, this emphasis led to underweights in the export-dependent nations of Taiwan and South Korea, both of which outperformed. In addition, stock selection in Taiwan and South Korea produced disappointing results. We sold several underachieving holdings, including semiconductor producer MediaTek and touch-screen manufacturer Young Fast, both of Taiwan, and Seoul Semiconductor of Korea. Other notably disappointing investments included Brazilian oil giant Petroleo Brasileiro (3.5% of net assets), and Sterlite Industries of India, a materials company that we sold.
Sector emphasis, stock-selection supported results
The fund had more exposure than the MSCI Emerging Markets Index (Net) to consumer discretionary and consumer staples stocks, which benefit from growing consumption in emerging markets, and aided the fund’s performance. Emphasizing energy stocks also helped as oil and other commodity prices moved up sharply. Underweights relative to the index in more defensive areas, including telecommunication services and utilities companies, also supported results. An overweight and good stock selection in health care was an additional plus. In health care, top performers included Odontoprev, a Brazilian dental HMO, and Indonesian pharmaceutical company PT Kalbe Farma (0.5% and 0.5% of net assets, respectively). Consumer discretionary investments that generated solid returns included: women’s retailer Belle International Holdings in China, household products retailers PT Ace Hardware of Indonesia, Home Product Center in Thailand and drugstore chain Clicks Group in South Africa (0.9%, 0.5%, 0.5%, and 0.9% of net assets, respectively). Other consumer-related stocks that outperformed included Hankook Tire and Hyundai Mobis (0.6% and 0.9% of net assets, respectively), both based in Korea. Stock-picking also helped in China, where outperformers
Performance data quoted represents past performance and current performance may be lower or higher. Past performance is no guarantee of future results. The investment return and principal value will fluctuate so that shares, when redeemed, may be worth more or less than the original cost. Please visit www.columbiamanagement.com for daily and most recent month-end performance updates.
| | | | |
| Top 10 holdings | | | |
| |
as of 03/31/11 (%) | | | | |
Vale SA | | | 3.5 | |
Petroleo Brasileiro | | | 3.5 | |
Samsung Electronics | | | 3.3 | |
Gazprom | | | 2.1 | |
Itau Unibanco Holdings SA | | | 2.1 | |
Sberbank | | | 1.9 | |
Industrial & Commercial Bank of China | | | 1.9 | |
Baidu | | | 1.5 | |
Hon Hai Precision Industry | | | 1.4 | |
LUKOIL | | | 1.4 | |
| | | | |
| Top 5 countries | | | |
| |
as of 03/31/11 (%) | | | | |
China | | | 18.7 | |
Brazil | | | 16.6 | |
Republic of Korea | | | 11.9 | |
Russia | | | 9.4 | |
India | | | 8.3 | |
The fund is actively managed and the composition of its portfolio will change over time.
Information provided is calculated as a percentage of net assets.
5
Portfolio Managers’ Report (continued) – Columbia Emerging Markets Fund
included Internet search firm Baidu and rail car component manufacturer Zhuzhou CSR Times Electric (1.5% and 0.6% of net assets, respectively). As emerging economies expanded, demand for new loans also grew, helping lift bank holdings such as Indonesia’s PT Bank Central Asia and Thailand’s Bangkok Bank (0.6% and 1.1% of net assets, respectively).
Persistent growth, reasonable values signal opportunity
We continue to find companies with strong prospects in the emerging markets, where stock valuations remain discounted compared to prices in developed markets. The outlook for a period of sustained economic growth looks good. Given this view, we have maintained our belief that superior opportunities should come from finding good companies benefiting from the growth of middle classes and the expansion of industrial bases in emerging markets.
Portfolio characteristics and holdings are subject to change periodically and may not be representative of current characteristics and holdings. The outlook for the fund may differ from that presented for other Columbia Funds.
Equity securities are affected by stock market fluctuations that occur in response to economic and business developments.
International investing involves special risks, including foreign taxation, currency risks, risks associated with possible differences in financial standards and other risks associated with future political and economic developments.
Investing in emerging markets may involve greater risks than investing in more developed countries. In addition, concentration of investments in a single region may result in greater volatility.
6
Investment Portfolio – Columbia Emerging Markets Fund
March 31, 2011
Common Stocks – 95.4%
| | | | | | | | |
| | | Shares | | | Value ($) | |
| Consumer Discretionary – 11.0% | | | | | | | | |
| Auto Components – 1.8% | | | | | | | | |
Hankook Tire Co. Ltd. | | | 89,030 | | | | 2,904,434 | |
Hyundai Mobis | | | 15,790 | | | | 4,707,778 | |
Nokian Renkaat Oyj | | | 31,961 | | | | 1,360,212 | |
| |
Auto Components Total | | | | | | | 8,972,424 | |
| | |
| Automobiles – 0.6% | | | | | | | | |
Hyundai Motor Co. | | | 16,877 | | | | 3,119,108 | |
| |
Automobiles Total | | | | | | | 3,119,108 | |
| | |
| Distributors – 0.6% | | | | | | | | |
Li & Fung Ltd. | | | 566,000 | | | | 2,890,886 | |
| |
Distributors Total | | | | | | | 2,890,886 | |
| |
| Hotels, Restaurants & Leisure – 0.4% | | | | | |
Ctrip.com International Ltd., ADR (a) | | | 53,052 | | | | 2,201,128 | |
| |
Hotels, Restaurants & Leisure Total | | | | | | | 2,201,128 | |
| | |
| Household Durables – 0.8% | | | | | | | | |
LG Electronics, Inc. | | | 31,055 | | | | 2,969,524 | |
MRV Engenharia e Participações SA | | | 146,200 | | | | 1,169,493 | |
| |
Household Durables Total | | | | | | | 4,139,017 | |
| | |
| Internet & Catalog Retail – 0.5% | | | | | | | | |
GS Home Shopping, Inc. | | | 19,359 | | | | 2,410,127 | |
| |
Internet & Catalog Retail Total | | | | | | | 2,410,127 | |
| |
| Leisure Equipment & Products – 0.5% | | | | | |
Giant Manufacturing Co., Ltd. | | | 603,800 | | | | 2,452,336 | |
| |
Leisure Equipment & Products Total | | | | | | | 2,452,336 | |
| | |
| Media – 0.6% | | | | | | | | |
Naspers Ltd., Class N | | | 50,411 | | | | 2,712,432 | |
| |
Media Total | | | | | | | 2,712,432 | |
| | |
| Multiline Retail – 1.4% | | | | | | | | |
Clicks Group Ltd. | | | 733,681 | | | | 4,615,737 | |
Golden Eagle Retail Group Ltd. | | | 982,000 | | | | 2,132,284 | |
| |
Multiline Retail Total | | | | | | | 6,748,021 | |
| | |
| Specialty Retail – 2.1% | | | | | | | | |
Belle International Holdings Ltd. | | | 2,427,000 | | | | 4,482,704 | |
Home Product Center PCL, Foreign Registered Shares | | | 8,170,850 | | | | 2,471,922 | |
Mr. Price Group Ltd. | | | 140,500 | | | | 1,272,081 | |
PT Ace Hardware Indonesia Tbk | | | 8,251,500 | | | | 2,417,107 | |
| |
Specialty Retail Total | | | | | | | 10,643,814 | |
| |
| Textiles, Apparel & Luxury Goods – 1.7% | | | | | |
China Lilang Ltd. | | | 2,015,000 | | | | 2,664,502 | |
Titan Industries Ltd. | | | 34,720 | | | | 2,972,420 | |
Trinity Ltd. | | | 3,114,000 | | | | 2,888,470 | |
| |
Textiles, Apparel & Luxury Goods Total | | | | | | | 8,525,392 | |
| |
Consumer Discretionary Total | | | | | | | 54,814,685 | |
| | | | | | | | |
| | | Shares | | | Value ($) | |
| Consumer Staples – 7.2% | | | | | | | | |
| Beverages – 0.5% | | | | | | | | |
Cia de Bebidas das Americas, ADR | | | 86,880 | | | | 2,459,573 | |
| |
Beverages Total | | | | | | | 2,459,573 | |
| | |
| Food & Staples Retailing – 3.2% | | | | | | | | |
CP ALL PCL | | | 2,126,900 | | | | 2,815,294 | |
CP ALL PCL, Foreign Registered Shares | | | 292,600 | | | | 386,973 | |
Drogasil SA | | | 447,900 | | | | 3,500,569 | |
Eurocash SA | | | 164,181 | | | | 1,803,354 | |
Grupo Comercial Chedraui SA de CV (a) | | | 590,400 | | | | 1,906,045 | |
President Chain Store Corp. | | | 742,000 | | | | 3,293,970 | |
X5 Retail Group NV, GDR (a)(b)(c) | | | 51,660 | | | | 2,177,469 | |
| |
Food & Staples Retailing Total | | | | | | | 15,883,674 | |
| | |
| Food Products – 1.1% | | | | | | | | |
Charoen Pokphand Foods PCL, Foreign Registered Shares | | | 2,932,800 | | | | 2,496,928 | |
PT Nippon Indosari Corpindo Tbk (a) | | | 5,189,500 | | | | 1,680,520 | |
Want Want China Holdings Ltd. | | | 1,849,000 | | | | 1,450,564 | |
| |
Food Products Total | | | | | | | 5,628,012 | |
| | |
| Household Products – 0.5% | | | | | | | | |
LG Household & Health Care Ltd. | | | 6,624 | | | | 2,484,361 | |
| |
Household Products Total | | | | | | | 2,484,361 | |
| | |
| Personal Products – 0.5% | | | | | | | | |
Dabur India Ltd. | | | 1,126,800 | | | | 2,436,257 | |
| |
Personal Products Total | | | | | | | 2,436,257 | |
| | |
| Tobacco – 1.4% | | | | | | | | |
ITC Ltd. | | | 764,675 | | | | 3,133,423 | |
PT Gudang Garam Tbk | | | 765,000 | | | | 3,674,178 | |
| |
Tobacco Total | | | | | | | 6,807,601 | |
| |
Consumer Staples Total | | | | | | | 35,699,478 | |
| | | | | | | | |
| Energy – 11.7% | | | | | | | | |
| Energy Equipment & Services – 0.5% | | | | | |
Eurasia Drilling Co. Ltd., GDR (b)(c) | | | 70,880 | | | | 2,409,920 | |
| |
Energy Equipment & Services Total | | | | | | | 2,409,920 | |
|
| Oil, Gas & Consumable Fuels – 11.2% | |
Banpu PCL, Foreign Registered Shares | | | 56,700 | | | | 1,427,874 | |
China Shenhua Energy Co., Ltd., Class H | | | 1,077,000 | | | | 5,076,097 | |
CNOOC Ltd. | | | 2,019,000 | | | | 5,112,469 | |
Gazprom OAO, ADR | | | 326,041 | | | | 10,553,947 | |
LUKOIL OAO, ADR | | | 94,085 | | | | 6,716,728 | |
OGX Petroleo e Gas Participacoes SA (a) | | | 415,500 | | | | 5,000,812 | |
See Accompanying Notes to Financial Statements.
7
Columbia Emerging Markets Fund
March 31, 2011
Common Stocks (continued)
| | | | | | | | |
| | | Shares | | | Value ($) | |
| Energy (continued) | | | | | | | | |
Petrominerales Ltd. | | | 31,000 | | | | 1,174,771 | |
PT Tambang Batubara Bukit Asam Tbk | | | 1,053,000 | | | | 2,536,429 | |
Reliance Industries Ltd. | | | 218,571 | | | | 5,158,929 | |
Rosneft Oil Co., GDR | | | 387,347 | | | | 3,538,415 | |
Sasol Ltd. | | | 61,400 | | | | 3,553,213 | |
SK Innovation Co. Ltd. | | | 8,050 | | | | 1,547,361 | |
Yanzhou Coal Mining Co., Ltd., Class H | | | 1,206,000 | | | | 4,349,477 | |
| |
Oil, Gas & Consumable Fuels Total | | | | | | | 55,746,522 | |
| |
Energy Total | | | | | | | 58,156,442 | |
| | | | | | | | |
| Financials – 22.4% | | | | | | | | |
| Commercial Banks – 17.2% | | | | | | | | |
Banco Bradesco SA, ADR | | | 178,694 | | | | 3,707,900 | |
Banco Santander Chile, ADR | | | 19,044 | | | | 1,652,067 | |
Bangkok Bank PCL, Foreign Registered Shares | | | 964,600 | | | | 5,479,886 | |
Bank of China Ltd., Class H | | | 8,746,000 | | | | 4,863,534 | |
China Construction Bank Corp., Class H | | | 6,377,000 | | | | 5,970,053 | |
CIMB Group Holdings Bhd | | | 1,265,700 | | | | 3,424,396 | |
Credicorp Ltd. | | | 34,510 | | | | 3,621,134 | |
HDFC Bank Ltd., ADR | | | 18,490 | | | | 3,142,191 | |
ICICI Bank Ltd., ADR | | | 108,000 | | | | 5,381,640 | |
Industrial & Commercial Bank of China, Class H | | | 11,338,000 | | | | 9,399,982 | |
Itau Unibanco Holding SA, ADR | | | 429,352 | | | | 10,325,916 | |
Kasikornbank PCL, Foreign Registered Shares | | | 943,100 | | | | 3,957,138 | |
Metropolitan Bank & Trust (a) | | | 1,394,745 | | | | 2,065,309 | |
PT Bank Central Asia Tbk | | | 3,491,500 | | | | 2,782,320 | |
PT Bank Tabungan Pensiunan Nasional Tbk (a) | | | 2,899,000 | | | | 831,661 | |
Punjab National Bank | | | 98,570 | | | | 2,692,407 | |
Sberbank | | | 2,528,106 | | | | 9,500,622 | |
Turkiye Garanti Bankasi AS | | | 828,535 | | | | 3,874,242 | |
Turkiye Halk Bankasi AS | | | 339,645 | | | | 2,628,644 | |
| |
Commercial Banks Total | | | | | | | 85,301,042 | |
| | |
| Consumer Finance – 0.5% | | | | | | | | |
Shriram Transport Finance Co. Ltd. | | | 134,660 | | | | 2,417,176 | |
| |
Consumer Finance Total | | | | | | | 2,417,176 | |
| |
| Diversified Financial Services – 2.5% | | | | | |
AMMB Holdings Bhd | | | 1,852,900 | | | | 3,967,969 | |
BM&F BOVESPA SA | | | 444,500 | | | | 3,226,243 | |
Bolsa Mexicana de Valores SA de CV | | | 922,600 | | | | 1,942,242 | |
| | | | | | | | |
| | | Shares | | | Value ($) | |
Fubon Financial Holding Co. Ltd. | | | 2,480,000 | | | | 3,289,007 | |
| | | | | | | | |
Diversified Financial Services Total | | | | | | | 12,425,461 | |
| | |
| Insurance – 0.5% | | | | | | | | |
China Life Insurance Co., Ltd., Class H | | | 747,000 | | | | 2,796,345 | |
| |
Insurance Total | | | | | | | 2,796,345 | |
|
| Real Estate Management & Development – 1.7% | |
China Overseas Land & Investment Ltd. | | | 890,000 | | | | 1,818,411 | |
China Vanke Co., Ltd., Class B (c) | | | 1,712,780 | | | | 2,245,966 | |
Huaku Development Co., Ltd. | | | 684,000 | | | | 1,915,200 | |
KWG Property Holding Ltd. | | | 1,573,965 | | | | 1,273,329 | |
SM Prime Holdings, Inc. | | | 4,361,100 | | | | 1,125,595 | |
| |
Real Estate Management & Development Total | | | | 8,378,501 | |
| |
Financials Total | | | | | | | 111,318,525 | |
| | | | | | | | |
| Health Care – 3.0% | | | | | | | | |
| Health Care Equipment & Supplies – 0.9% | | | | | |
Hartalega Holdings Bhd | | | 706,000 | | | | 1,270,293 | |
St. Shine Optical Co., Ltd. | | | 258,000 | | | | 3,172,701 | |
| |
Health Care Equipment & Supplies Total | | | | 4,442,994 | |
| |
| Health Care Providers & Services – 1.6% | | | | | |
Amil Participações SA | | | 171,000 | | | | 2,009,916 | |
Fleury SA | | | 122,100 | | | | 1,813,570 | |
Life Healthcare Group Holdings Ltd. | | | 752,800 | | | | 1,768,218 | |
Odontoprev SA | | | 148,000 | | | | 2,418,546 | |
| |
Health Care Providers & Services Total | | | | 8,010,250 | |
| | |
| Pharmaceuticals – 0.5% | | | | | | | | |
PT Kalbe Farma Tbk | | | 6,639,500 | | | | 2,589,578 | |
| |
Pharmaceuticals Total | | | | | | | 2,589,578 | |
| |
Health Care Total | | | | | | | 15,042,822 | |
| | | | | | | | |
| Industrials – 6.0% | | | | | | | | |
| Airlines – 0.5% | | | | | | | | |
Copa Holdings SA, Class A | | | 47,106 | | | | 2,487,197 | |
| |
Airlines Total | | | | | | | 2,487,197 | |
| |
| Construction & Engineering – 0.5% | | | | | |
China Communications Construction Co., Ltd., Class H | | | 2,562,000 | | | | 2,441,830 | |
| |
Construction & Engineering Total | | | | | | | 2,441,830 | |
| | |
| Electrical Equipment – 1.1% | | | | | | | | |
LS Corp. | | | 21,579 | | | | 2,162,162 | |
Zhuzhou CSR Times Electric Co., Ltd., Class H | | | 828,000 | | | | 3,155,589 | |
| |
Electrical Equipment Total | | | | | | | 5,317,751 | |
See Accompanying Notes to Financial Statements.
8
Columbia Emerging Markets Fund
March 31, 2011
Common Stocks (continued)
| | | | | | | | |
| | | Shares | | | Value ($) | |
| Industrials (continued) | | | | | | | | |
| Machinery – 0.6% | | | | | | | | |
Sany Heavy Equipment International Holdings Co., Ltd. | | | 1,940,000 | | | | 3,189,908 | |
| |
Machinery Total | | | | | | | 3,189,908 | |
| | |
| Road & Rail – 2.1% | | | | | | | | |
Globaltrans Investment PLC, GDR (b)(c) | | | 206,660 | | | | 3,800,478 | |
Julio Simoes Logistica SA (a) | | | 290,500 | | | | 1,759,743 | |
Localiza Rent a Car SA | | | 292,700 | | | | 4,697,112 | |
| |
Road & Rail Total | | | | | | | 10,257,333 | |
| |
| Trading Companies & Distributors – 0.9% | | | | | |
Barloworld Ltd. | | | 229,744 | | | | 2,536,863 | |
Mills Estruturas e Serviços de Engenharia SA | | | 176,800 | | | | 1,943,809 | |
| |
Trading Companies & Distributors Total | | | | 4,480,672 | |
| |
| Transportation Infrastructure – 0.3% | | | | | |
China Merchants Holdings International Co., Ltd. | | | 334,000 | | | | 1,410,846 | |
| |
Transportation Infrastructure Total | | | | 1,410,846 | |
| |
Industrials Total | | | | | | | 29,585,537 | |
| | | | | | | | |
| Information Technology – 13.9% | | | | | | | | |
| Communications Equipment – 0.6% | | | | | |
O-Net Communications Group Ltd. (a) | | | 4,542,000 | | | | 3,003,269 | |
| |
Communications Equipment Total | | | | | | | 3,003,269 | |
| | |
| Computers & Peripherals – 0.6% | | | | | | | | |
Wistron Corp. | | | 1,754,015 | | | | 2,775,718 | |
| |
Computers & Peripherals Total | | | | | | | 2,775,718 | |
|
| Electronic Equipment, Instruments & Components – 2.9% | |
China High Precision Automation Group Ltd. | | | 2,515,000 | | | | 1,826,046 | |
Hon Hai Precision Industry Co., Ltd. | | | 2,031,270 | | | | 7,107,381 | |
SFA Engineering Corp. | | | 40,918 | | | | 2,547,465 | |
WPG Holdings Co., Ltd. | | | 1,628,288 | | | | 2,740,461 | |
| |
Electronic Equipment, Instruments & Components Total | | | | 14,221,353 | |
|
| Internet Software & Services – 2.9% | |
Baidu, Inc., ADR (a) | | | 52,921 | | | | 7,293,043 | |
Mail.ru Group Ltd., GDR (a)(b)(c) | | | 36,849 | | | | 1,103,628 | |
NHN Corp. (a) | | | 16,420 | | | | 2,864,858 | |
Tencent Holdings Ltd. | | | 124,400 | | | | 3,031,112 | |
| |
Internet Software & Services Total | | | | | | | 14,292,641 | |
| | | | | | | | |
| | | Shares | | | Value ($) | |
| IT Services – 1.0% | |
Infosys Technologies Ltd. | | | 20,955 | | | | 1,521,005 | |
Infosys Technologies Ltd., ADR | | | 51,805 | | | | 3,714,419 | |
| |
IT Services Total | | | | | | | 5,235,424 | |
|
| Semiconductors & Semiconductor Equipment – 5.0% | |
Duksan Hi-Metal Co. Ltd. (a) | | | 79,415 | | | | 1,827,552 | |
Samsung Electronics Co., Ltd. | | | 19,502 | | | | 16,537,012 | |
Taiwan Semiconductor Manufacturing Co., Ltd. | | | 1,698,190 | | | | 4,069,310 | |
Taiwan Semiconductor Manufacturing Co., Ltd., ADR | | | 208,649 | | | | 2,541,345 | |
| |
Semiconductors & Semiconductor Equipment Total | | | | | | | 24,975,219 | |
|
| Software – 0.9% | |
Kingdee International Software Group Co., Ltd. | | | 2,784,000 | | | | 1,747,704 | |
Totvs SA | | | 87,500 | | | | 1,680,167 | |
VanceInfo Technologies, Inc., ADR (a) | | | 31,650 | | | | 994,126 | |
| |
Software Total | | | | | | | 4,421,997 | |
| |
Information Technology Total | | | | 68,925,621 | |
| | | | | | | | |
| Materials – 14.4% | | | | | | | | |
| Chemicals – 4.1% | |
Asian Paints Ltd. | | | 38,007 | | | | 2,163,539 | |
Capro Corp. | | | 77,640 | | | | 1,962,159 | |
Cheil Industries, Inc. | | | 22,005 | | | | 2,333,663 | |
Formosa Plastics Corp. | | | 673,000 | | | | 2,366,318 | |
Huabao International Holdings Ltd. | | | 1,939,000 | | | | 2,991,261 | |
LG Chem Ltd. | | | 13,953 | | | | 5,838,084 | |
Petronas Chemicals Group Bhd (a) | | | 1,049,600 | | | | 2,508,990 | |
| |
Chemicals Total | | | | | | | 20,164,014 | |
| | |
| Construction Materials – 1.3% | | | | | | | | |
PT Indocement Tunggal Prakarsa Tbk | | | 3,452,700 | | | | 6,480,759 | |
| |
Construction Materials Total | | | | | | | 6,480,759 | |
| | |
| Metals & Mining – 9.0% | | | | | | | | |
Anglo Platinum Ltd. | | | 22,100 | | | | 2,276,970 | |
Cia de Minas Buenaventura SA, ADR | | | 62,495 | | | | 2,685,410 | |
Eastern Platinum Ltd. (a) | | | 1,659,600 | | | | 2,225,353 | |
Eurasian Natural Resources Corp. PLC | | | 164,388 | | | | 2,469,654 | |
Freeport-McMoRan Copper & Gold, Inc. | | | 17,395 | | | | 966,292 | |
Gold Fields Ltd., ADR | | | 114,971 | | | | 2,007,394 | |
JSW Steel Ltd. | | | 120,714 | | | | 2,490,258 | |
Mechel, ADR | | | 85,275 | | | | 2,625,617 | |
POSCO | | | 6,719 | | | | 3,082,837 | |
Southern Copper Corp. | | | 64,048 | | | | 2,579,213 | |
See Accompanying Notes to Financial Statements.
9
Columbia Emerging Markets Fund
March 31, 2011
Common Stocks (continued)
| | | | | | | | |
| | | Shares | | | Value ($) | |
| Materials (continued) | | | | | | | | |
Tata Steel Ltd. | | | 301,776 | | | | 4,210,482 | |
Vale SA | | | 529,300 | | | | 17,295,903 | |
| |
Metals & Mining Total | | | | | | | 44,915,383 | |
| |
Materials Total | | | | | | | 71,560,156 | |
| | | | | | | | |
| Telecommunication Services – 3.7% | |
| Diversified Telecommunication Services – 0.9% | |
Chunghwa Telecom Co. Ltd., ADR | | | 146,030 | | | | 4,550,295 | |
| |
Diversified Telecommunication Services Total | | | | 4,550,295 | |
|
| Wireless Telecommunication Services – 2.8% | |
America Movil SAB de CV,
Series L, ADR | | | 37,456 | | | | 2,176,193 | |
China Mobile Ltd. | | | 215,000 | | | | 1,984,664 | |
Millicom International Cellular SA | | | 21,822 | | | | 2,098,622 | |
Mobile TeleSystems OJSC, ADR | | | 205,753 | | | | 4,368,136 | |
MTN Group Ltd. | | | 148,109 | | | | 2,989,985 | |
| |
Wireless Telecommunication Services Total | | | | 13,617,600 | |
| |
Telecommunication Services Total | | | | 18,167,895 | |
| | | | | | | | |
| Utilities – 2.1% | | | | | | | | |
| Gas Utilities – 1.2% | | | | | | | | |
ENN Energy Holdings Ltd. | | | 1,236,000 | | | | 3,832,074 | |
PT Perusahaan Gas Negara Tbk | | | 2,557,000 | | | | 1,143,908 | |
Towngas China Co. Ltd. | | | 1,884,000 | | | | 980,374 | |
| |
Gas Utilities Total | | | | | | | 5,956,356 | |
|
| Independent Power Producers & Energy Traders – 0.9% | |
Aboitiz Power Corp. | | | 3,169,300 | | | | 2,191,529 | |
Energy Development Corp. | | | 15,270,200 | | | | 2,113,743 | |
| |
Independent Power Producers & Energy Traders Total | | | | 4,305,272 | |
| |
Utilities Total | | | | | | | 10,261,628 | |
| |
Total Common Stocks
(cost of $320,145,334) | | | | | | | 473,532,789 | |
| | |
Preferred Stocks – 3.9% | | | | | | | | |
| | | | | | | | |
| Energy – 3.5% | | | | | | | | |
| Oil, Gas & Consumable Fuels – 3.5% | | | | | |
Petroleo Brasileiro SA | | | 982,800 | | | | 17,162,054 | |
| |
Oil, Gas & Consumable Fuels Total | | | | 17,162,054 | |
| |
Energy Total | | | | | | | 17,162,054 | |
| | | | | | | | |
| | | Shares | | | Value ($) | |
| Materials – 0.4% | | | | | | | | |
| Metals & Mining – 0.4% | | | | | | | | |
Gerdau SA | | | 171,200 | | | | 2,117,128 | |
| |
Metals & Mining Total | | | | | | | 2,117,128 | |
| |
Materials Total | | | | | | | 2,117,128 | |
| |
Total Preferred Stocks
(cost of $7,190,983) | | | | | | | 19,279,182 | |
| | |
Short-Term Obligation – 0.9% | | | | | | | | |
| | | Par ($) | | | | |
Repurchase agreement with Fixed Income Clearing Corp., dated 03/31/11, due 04/01/11 at 0.070%, collateralized by a U.S. Government Agency obligation maturing 06/23/15, market value $4,616,563 (repurchase proceeds $4,523,009) | | | 4,523,000 | | | | 4,523,000 | |
| | | | | | | | |
Total Short-Term Obligation
(cost of $4,523,000) | | | | | | | 4,523,000 | |
| |
Total Investments – 100.2%
(cost of $331,859,317) (d) | | | | | | | 497,334,971 | |
| |
Other Assets & Liabilities, Net – (0.2)% | | | | (951,688 | ) |
| |
Net Assets – 100.0% | | | | | | | 496,383,283 | |
Notes to Investment Portfolio:
| (a) | Non-income producing security. |
| (b) | Security exempt from registration pursuant to Rule 144A under the Securities Act of 1933. These securities may be resold in transactions exempt from registration, normally to qualified institutional buyers. At March 31, 2011, these securities, which are not illiquid, amounted to $9,491,495, which represents 1.9% of net assets. |
| (c) | Represents fair value as determined in good faith under procedures approved by the Board of Trustees. At March 31, 2011, the value of these securities amounted to $11,737,461, which represents 2.4% of net assets. |
| (d) | Cost for federal income tax purposes is $334,983,643. |
Generally accepted accounting principles (GAAP) require disclosure regarding the inputs and valuation techniques used to measure fair value and any changes in valuation inputs or techniques. In addition, investments shall be disclosed by major category.
The Fund categorizes its fair value measurements according to a three-level hierarchy that maximizes the use of observable inputs and minimizes the use of unobservable inputs by prioritizing that the most observable input be used when available. Observable inputs are those that market participants would use in pricing an investment based on market data obtained from sources independent of the reporting entity. Unobservable inputs are those that reflect the Fund’s assumptions about the information market participants would use in pricing an investment. An investment’s level within the fair value hierarchy is based on the lowest level of any input that is deemed significant to the asset or liability’s fair value measurement. The input levels are not necessarily an indication of the risk or liquidity associated with investments at that level. For example, certain U.S. government securities are generally high quality and liquid, however, they are reflected as Level 2 because the inputs used to determine fair value may not always be quoted prices in an active market.
See Accompanying Notes to Financial Statements.
10
Columbia Emerging Markets Fund
March 31, 2011
Fair value inputs are summarized in the three broad levels listed below:
| • | | Level 1 — Valuations based on quoted prices for investments in active markets that the Fund has the ability to access at the measurement date (including NAV for open-end mutual funds). Valuation adjustments are not applied to Level 1 investments. |
| • | | Level 2 — Valuations based on other significant observable inputs (including quoted prices for similar securities, interest rates, prepayment speeds, credit risks, etc.). |
| • | | Level 3 — Valuations based on significant unobservable inputs (including the Fund’s own assumptions and judgment in determining the fair value of investments). |
Inputs that are used in determining fair value of an investment may include price information, credit data, volatility statistics, and other factors. These inputs can be either observable or unobservable. The availability of observable inputs can vary between investments, and is affected by various factors such as the type of investment, and the volume and level of activity for that investment or similar investments in the marketplace. The inputs will be considered by the Investment Manager, along with any other relevant factors in the calculation of an investment’s fair value. The Fund uses prices and inputs that are current as of the measurement date, which may include periods of market dislocations. During these periods, the availability of prices and inputs may be reduced for many investments. This condition could cause an investment to be reclassified between the various levels within the hierarchy. Non-U.S. equity securities actively traded in foreign markets may be reflected in Level 2 despite the availability of closing prices, because the Fund evaluates and determines whether those closing prices reflect fair value at the close of the New York Stock Exchange (NYSE) or require adjustment, as described in Note 2 to the financial statements-Security Valuation.
Investments falling into the Level 3 category are primarily supported by quoted prices from brokers and dealers participating in the market for those investments. However, these may be classified as Level 3 investments due to lack of market transparency and corroboration to support these quoted prices. Additionally, valuation models may be used as the pricing source for any remaining investments classified as Level 3. These models rely on one or more significant unobservable inputs and/or significant assumptions by the Investment Manager. Inputs used in valuations may include, but are not limited to, financial statement analysis, capital account balances, discount rates and estimated cash flows, and comparable company data.
The following table summarizes the inputs used, as of March 31, 2011, in valuing the Fund’s assets:
| | | | | | | | | | | | | | | | |
Description | | Quoted Prices
(Level 1) | | | Other
Significant
Observable
Inputs
(Level 2) | | | Significant
Unobservable
Inputs
(Level 3) | | | Total | |
Common Stocks | | | | | | | | | | | | | | | | |
Consumer Discretionary | | $ | 3,370,621 | | | $ | 51,444,064 | | | $ | — | | | $ | 54,814,685 | |
Consumer Staples | | | 7,866,187 | | | | 27,833,291 | | | | — | | | | 35,699,478 | |
Energy | | | 26,984,673 | | | | 31,171,769 | | | | — | | | | 58,156,442 | |
Financials | | | 32,999,333 | | | | 78,319,192 | | | | — | | | | 111,318,525 | |
Health Care | | | 6,242,032 | | | | 8,800,790 | | | | — | | | | 15,042,822 | |
Industrials | | | 10,887,861 | | | | 18,697,676 | | | | — | | | | 29,585,537 | |
Information Technology | | | 16,223,100 | | | | 52,702,521 | | | | — | | | | 68,925,621 | |
Materials | | | 30,385,182 | | | | 41,174,974 | | | | — | | | | 71,560,156 | |
Telecommunication Services | | | 13,193,246 | | | | 4,974,649 | | | | — | | | | 18,167,895 | |
Utilities | | | — | | | | 10,261,628 | | | | — | | | | 10,261,628 | |
| | | | | | | | | | | | | | | | |
Total Common Stocks | | | 148,152,235 | | | | 325,380,554 | | | | — | | | | 473,532,789 | |
| | | | | | | | | | | | | | | | |
Total Preferred Stocks | | | 19,279,182 | | | | — | | | | — | | | | 19,279,182 | |
| | | | | | | | | | | | | | | | |
Total Short-Term Obligation | | | — | | | | 4,523,000 | | | | — | | | | 4,523,000 | |
| | | | | | | | | | | | | | | | |
Total Investments | | $ | 167,431,417 | | | $ | 329,903,554 | | | $ | — | | | $ | 497,334,971 | |
| | | | | | | | | | | | | | | | |
The Fund’s assets assigned to the Level 2 input category are generally valued using the market approach, in which a security’s value is determined through reference to prices and information from market transactions for similar or identical assets. These assets include certain foreign securities for which a third party statistical pricing service may be employed for purposes of fair market valuation. The models utilized by the third party statistical pricing service take into account a security’s correlation to available market data including, but not limited to, intraday index, ADR, and ETF movements.
There were no significant transfers of financial assets between Levels 1 and 2 during the period.
The Fund was invested in the following countries at March 31, 2011:
| | | | | | | | |
Summary of Securities by Country (Unaudited) | | Value | | | % of Total Investments | |
China | | | 92,738,316 | | | | 18.7 | |
Brazil | | | 82,288,453 | | | | 16.5 | |
Republic of Korea | | | 59,298,486 | | | | 11.9 | |
Russia | | | 46,794,960 | | | | 9.4 | |
India | | | 41,434,144 | | | | 8.3 | |
Taiwan | | | 40,274,043 | | | | 8.1 | |
Indonesia | | | 24,136,460 | | | | 4.9 | |
South Africa | | | 23,732,892 | | | | 4.8 | |
Thailand | | | 19,036,015 | | | | 3.8 | |
Malaysia | | | 11,171,648 | | | | 2.2 | |
Peru | | | 8,885,758 | | | | 1.8 | |
Philippines | | | 7,496,176 | | | | 1.5 | |
Hong Kong | | | 6,759,730 | | | | 1.4 | |
Turkey | | | 6,502,886 | | | | 1.3 | |
Mexico | | | 6,024,481 | | | | 1.2 | |
United States* | | | 5,489,292 | | | | 1.1 | |
Panama | | | 2,487,197 | | | | 0.5 | |
United Kingdom | | | 2,469,654 | | | | 0.5 | |
Canada | | | 2,225,353 | | | | 0.5 | |
Sweden | | | 2,098,622 | | | | 0.4 | |
Poland | | | 1,803,355 | | | | 0.4 | |
Chile | | | 1,652,067 | | | | 0.3 | |
Finland | | | 1,360,212 | | | | 0.3 | |
Columbia | | | 1,174,771 | | | | 0.2 | |
| | | | | | | | |
| | $ | 497,334,971 | | | | 100.0 | |
| | | | | | | | |
* Includes short-term obligation.
Certain securities are listed by country of underlying exposure but may trade predominantly on another exchange.
| | |
Acronym | | Name |
| ADR | | American Depositary Receipt |
| GDR | | Global Depositary Receipt |
See Accompanying Notes to Financial Statements.
11
Statement of Assets and Liabilities – Columbia Emerging Markets Fund
March 31, 2011
| | | | | | |
| | | | | ($) | |
| Assets | | Investments, at cost | | | 331,859,317 | |
| | | | | | |
| | Investments, at value | | | 497,334,971 | |
| | Cash | | | 27 | |
| | Foreign currency (cost of $327,348) | | | 330,127 | |
| | Receivable for: | | | | |
| | Fund shares sold | | | 661,031 | |
| | Dividends | | | 587,193 | |
| | Interest | | | 9 | |
| | Expense reimbursement due from Investment Manager | | | 155,105 | |
| | Trustees’ deferred compensation plan | | | 19,625 | |
| | Prepaid expenses | | | 30,213 | |
| | | | | | |
| | Total Assets | | | 499,118,301 | |
| | |
| Liabilities | | Payable for: | | | | |
| | Investments purchased | | | 2,061 | |
| | Fund shares repurchased | | | 561,021 | |
| | Foreign capital gains taxes deferred | | | 1,407,998 | |
| | Investment advisory fee | | | 462,714 | |
| | Administration fee | | | 73,233 | |
| | Pricing and bookkeeping fees | | | 11,162 | |
| | Transfer agent fee | | | 28,168 | |
| | Trustees’ fees | | | 3,039 | |
| | Custody fee | | | 59,177 | |
| | Distribution and service fees | | | 14,237 | |
| | Chief compliance officer expenses | | | 290 | |
| | Interest payable | | | 53 | |
| | Trustees’ deferred compensation plan | | | 19,625 | |
| | Other liabilities | | | 92,240 | |
| | | | | | |
| | Total Liabilities | | | 2,735,018 | |
| | |
| | | | | | |
| | Net Assets | | | 496,383,283 | |
| | |
| Net Assets Consist of | | Paid-in capital | | | 314,102,237 | |
| | Overdistributed net investment income | | | (4,144,560 | ) |
| | Accumulated net realized gain | | | 22,339,881 | |
| | Net unrealized appreciation (depreciation) on: | | | | |
| | Investments | | | 165,475,654 | |
| | Foreign currency translations | | | 18,069 | |
| | Foreign capital gains tax | | | (1,407,998 | ) |
| | | | | | |
| | Net Assets | | | 496,383,283 | |
See Accompanying Notes to Financial Statements.
12
Statement of Assets and Liabilities (continued) – Columbia Emerging Markets Fund
March 31, 2011
| | | | | | |
| | | | | | |
| Class A | | Net assets | | $ | 12,388,025 | |
| | Shares outstanding | | | 1,078,700 | |
| | Net asset value per share | | $ | 11.48 | (a) |
| | Maximum sales charge | | | 5.75 | % |
| | Maximum offering price per share ($11.48/0.9425) | | $ | 12.18 | (b) |
| | |
| Class C | | Net assets | | $ | 2,099,514 | |
| | Shares outstanding | | | 184,313 | |
| | Net asset value and offering price per share | | $ | 11.39 | (a) |
| | |
| Class I (c) | | Net assets | | $ | 104,595,364 | |
| | Shares outstanding | | | 9,109,348 | |
| | Net asset value, offering and redemption price per share | | $ | 11.48 | |
| | |
| Class R (c) | | Net assets | | $ | 2,454 | |
| | Shares outstanding | | | 214 | |
| | Net asset value, offering and redemption price per share | | $ | 11.49 | (d) |
| | |
| Class W (c) | | Net assets | | $ | 50,623,412 | |
| | Shares outstanding | | | 4,407,966 | |
| | Net asset value, offering and redemption price per share | | $ | 11.48 | |
| | |
| Class Z | | Net assets | | $ | 326,674,514 | |
| | Shares outstanding | | | 28,439,062 | |
| | Net asset value, offering and redemption price per share | | $ | 11.49 | |
| (a) | Redemption price per share is equal to net asset value less any applicable contingent deferred sales charge. |
| (b) | On sales of $50,000 or more the offering price is reduced. |
| (c) | Class I, Class R and Class W shares commenced operations on September 27, 2010. |
| (d) | Net asset value rounds to $11.49 per share due to fractional shares outstanding. |
See Accompanying Notes to Financial Statements.
13
Statement of Operations – Columbia Emerging Markets Fund
For the Year Ended March 31, 2011
| | | | | | |
| | | | | ($) | |
| Investment Income | | Dividends | | | 8,646,533 | |
| | Interest | | | 2,287 | |
| | Foreign taxes withheld | | | (1,019,170 | ) |
| | | | | | |
| | Total Investment Income | | | 7,629,650 | |
| | |
| Expenses | | Investment advisory fee | | | 4,726,989 | |
| | Administration fee | | | 722,394 | |
| | Distribution fee: | | | | |
| | Class C | | | 13,727 | |
| | Class R | | | 6 | |
| | Service fee: | | | | |
| | Class A | | | 20,920 | |
| | Class C | | | 4,576 | |
| | Class W | | | 40,795 | |
| | Transfer agent fee – Class A, Class C, Class R, Class W and Class Z | | | 393,659 | |
| | Pricing and bookkeeping fees | | | 112,330 | |
| | Trustees’ fees | | | 31,381 | |
| | Custody fee | | | 776,418 | |
| | Chief compliance officer expenses | | | 1,333 | |
| | Other expenses | | | 256,511 | |
| | | | | | |
| | Expenses before interest expense | | | 7,101,039 | |
| | Interest expense | | | 6,351 | |
| | | | | | |
| | Total Expenses | | | 7,107,390 | |
| | |
| | Fees waived or expenses reimbursed by Investment Manager | | | (1,262,039 | ) |
| | Expense reductions | | | (25 | ) |
| | | | | | |
| | Net Expenses | | | 5,845,326 | |
| | |
| | | | | | |
| | Net Investment Income | | | 1,784,324 | |
| | |
| Net Realized and Unrealized Gain (Loss) on Investments, Foreign Currency and Foreign Capital Gains Tax | | Net realized gain (loss) on: | | | | |
| | Investments | | | 61,519,580 | |
| | Foreign currency transactions | | | (1,045,380 | ) |
| | | | | | |
| | Net realized gain | | | 60,474,200 | |
| | |
| | Net change in unrealized appreciation (depreciation) on: | | | | |
| | Investments | | | 2,097,110 | |
| | Foreign currency translations | | | 4,993 | |
| | Foreign capital gains tax | | | (338,906 | ) |
| | | | | | |
| | Net change in unrealized appreciation (depreciation) | | | 1,763,197 | |
| | | | | | |
| | Net Gain | | | 62,237,397 | |
| | |
| | | | | | |
| | Net Increase Resulting from Operations | | | 64,021,721 | |
See Accompanying Notes to Financial Statements.
14
Statement of Changes in Net Assets – Columbia Emerging Markets Fund
| | | | | | | | | | |
| | | | | Year Ended March 31, | |
| Increase (Decrease) in Net Assets | | 2011 ($) (a)(b) | | | 2010 ($) | |
| Operations | | Net investment income | | | 1,784,324 | | | | 1,639,236 | |
| | Net realized gain on investments and foreign currency transactions | | | 60,474,200 | | | | 50,333,386 | |
| | Net change in unrealized appreciation (depreciation) on investments, foreign currency translations and foreign capital gains tax | | | 1,763,197 | | | | 133,710,612 | |
| | | | | | | | | | |
| | Net increase resulting from operations | | | 64,021,721 | | | | 185,683,234 | |
| | | |
Distributions
to Shareholders | | From net investment income: | | | | | | | | |
| | Class A | | | (68,895 | ) | | | (66,797 | ) |
| | Class C | | | (3,022 | ) | | | (3,149 | ) |
| | Class I | | | (128,973 | ) | | | — | |
| | Class R | | | (13 | ) | | | — | |
| | Class W | | | (325,283 | ) | | | — | |
| | Class Z | | | (3,264,227 | ) | | | (6,656,120 | ) |
| | | |
| | From net realized gains: | | | | | | | | |
| | Class A | | | (1,107,014 | ) | | | — | |
| | Class C | | | (240,371 | ) | | | — | |
| | Class I | | | (1,196,541 | ) | | | — | |
| | Class R | | | (212 | ) | | | — | |
| | Class W | | | (3,971,955 | ) | | | — | |
| | Class Z | | | (47,203,700 | ) | | | — | |
| | | | | | | | | | |
| | Total distributions to shareholders | | | (57,510,206 | ) | | | (6,726,066 | ) |
| | | |
| | Net Capital Stock Transactions | | | 85,121,466 | | | | (12,813,894 | ) |
| | Redemption fees | | | — | | | | 36,026 | |
| | | | | | | | | | |
| | Total increase in net assets | | | 91,632,981 | | | | 166,179,300 | |
| | | |
| Net Assets | | Beginning of period | | | 404,750,302 | | | | 238,571,002 | |
| | End of period | | | 496,383,283 | | | | 404,750,302 | |
| | Overdistributed net investment income at end of period | | | (4,144,560 | ) | | | (1,604,394 | ) |
| (a) | Class I, Class R and Class W shares commenced operations on September 27, 2010. |
| (b) | Class I, Class R and Class W shares reflect activity for the period September 27, 2010 through March 31, 2011. |
See Accompanying Notes to Financial Statements.
15
Statement of Changes in Net Assets (continued) – Columbia Emerging Markets Fund
| | | | | | | | | | | | | | | | |
| | | Capital Stock Activity | |
| | | Year Ended
March 31, 2011 | | | Year Ended
March 31, 2010 | |
| | | Shares | | | Dollars ($) | | | Shares | | | Dollars ($) | |
Class A | | | | | | | | | | | | | | | | |
Subscriptions | | | 672,498 | | | | 7,777,389 | | | | 683,278 | | | | 6,604,736 | |
Distributions reinvested | | | 83,830 | | | | 916,965 | | | | 6,065 | | | | 59,173 | |
Redemptions | | | (242,231 | ) | | | (2,684,532 | ) | | | (267,582 | ) | | | (2,808,253 | ) |
| | | | | | | | | | | | | | | | |
Net increase | | | 514,097 | | | | 6,009,822 | | | | 421,761 | | | | 3,855,656 | |
| | | | |
Class C | | | | | | | | | | | | | | | | |
Subscriptions | | | 128,365 | | | | 1,474,873 | | | | 141,536 | | | | 1,377,969 | |
Distributions reinvested | | | 16,139 | | | | 175,594 | | | | 246 | | | | 2,597 | |
Redemptions | | | (97,589 | ) | | | (1,085,763 | ) | | | (42,524 | ) | | | (433,673 | ) |
| | | | | | | | | | | | | | | | |
Net increase | | | 46,915 | | | | 564,704 | | | | 99,258 | | | | 946,893 | |
| | | | |
Class I (a)(b) | | | | | | | | | | | | | | | | |
Subscriptions | | | 9,609,286 | | | | 109,335,486 | | | | — | | | | — | |
Distributions reinvested | | | 118,966 | | | | 1,325,278 | | | | — | | | | — | |
Redemptions | | | (618,904 | ) | | | (6,965,764 | ) | | | — | | | | — | |
| | | | | | | | | | | | | | | | |
Net increase | | | 9,109,348 | | | | 103,695,000 | | | | — | | | | — | |
| | | | |
Class R (a)(b) | | | | | | | | | | | | | | | | |
Subscriptions | | | 214 | | | | 2,500 | | | | — | | | | — | |
| | | | | | | | | | | | | | | | |
Net increase | | | 214 | | | | 2,500 | | | | — | | | | — | |
| | | | |
Class W (a)(b) | | | | | | | | | | | | | | | | |
Subscriptions | | | 4,507,710 | | | | 53,729,837 | | | | — | | | | — | |
Distributions reinvested | | | 385,382 | | | | 4,297,007 | | | | — | | | | — | |
Redemptions | | | (485,126 | ) | | | (5,442,289 | ) | | | — | | | | — | |
| | | | | | | | | | | | | | | | |
Net increase | | | 4,407,966 | | | | 52,584,555 | | | | — | | | | — | |
| | | | |
Class Z | | | | | | | | | | | | | | | | |
Subscriptions | | | 3,901,409 | | | | 43,768,237 | | | | 9,329,329 | | | | 86,421,767 | |
Distributions reinvested | | | 3,577,654 | | | | 38,965,258 | | | | 554,261 | | | | 5,072,709 | |
Redemptions | | | (14,276,666 | ) | | | (160,468,610 | ) | | | (11,606,492 | ) | | | (109,110,919 | ) |
| | | | | | | | | | | | | | | | |
Net decrease | | | (6,797,603 | ) | | | (77,735,115 | ) | | | (1,722,902 | ) | | | (17,616,443 | ) |
| (a) | Class I, Class R and Class W shares commenced operations on September 27, 2010. |
| (b) | Class I, Class R and Class W shares reflect activity for the period September 27, 2010 through March 31, 2011. |
See Accompanying Notes to Financial Statements.
16
Financial Highlights – Columbia Emerging Markets Fund
Selected data for a share outstanding throughout each period is as follows:
| | | | | | | | | | | | | | | | |
| | | Year Ended March 31, | | | Period Ended
March 31, | |
| Class A Shares | | 2011 | | | 2010 | | | 2009 | | | 2008 (a) | |
Net Asset Value, Beginning of Period | | $ | 11.27 | | | $ | 6.42 | | | $ | 14.96 | | | $ | 17.77 | |
| | | | |
Income from Investment Operations: | | | | | | | | | | | | | | | | |
Net investment income (loss) (b) | | | 0.01 | | | | (0.01 | ) | | | 0.07 | | | | 0.04 | (c) |
Net realized and unrealized gain (loss) on investments, foreign currency
and foreign capital gains tax | | | 1.75 | | | | 5.00 | | | | (6.36 | ) | | | (1.63 | ) |
| | | | | | | | | | | | | | | | |
Total from investment operations | | | 1.76 | | | | 4.99 | | | | (6.29 | ) | | | (1.59 | ) |
| | | | |
Less Distributions to Shareholders: | | | | | | | | | | | | | | | | |
From net investment income | | | (0.09 | ) | | | (0.14 | ) | | | — | | | | (0.06 | ) |
From net realized gains | | | (1.46 | ) | | | — | | | | (2.26 | ) | | | (1.16 | ) |
| | | | | | | | | | | | | | | | |
Total distributions to shareholders | | | (1.55 | ) | | | (0.14 | ) | | | (2.26 | ) | | | (1.22 | ) |
| | | | |
Redemption Fees: | | | | | | | | | | | | | | | | |
Redemption fees added to paid-in-capital | | | — | | | | — | (b)(d) | | | 0.01 | (b) | | | — | (b)(d) |
| | | | |
Net Asset Value, End of Period | | $ | 11.48 | | | $ | 11.27 | | | $ | 6.42 | | | $ | 14.96 | |
Total return (e)(f) | | | 16.74 | % | | | 78.17 | % | | | (49.44 | )% | | | (9.80 | )%(g) |
| | | | |
Ratios to Average Net Assets/Supplemental Data: | | | | | | | | | | | | | | | | |
Net expenses before interest expense (h) | | | 1.65 | % | | | 1.74 | % | | | 1.95 | % | | | 1.85 | %(i) |
Interest expense | | | — | %(j) | | | — | %(j) | | | 0.01 | % | | | — | %(i)(j) |
Net expenses (h) | | | 1.65 | % | | | 1.74 | % | | | 1.96 | % | | | 1.85 | %(i) |
Waiver/Reimbursement | | | 0.31 | % | | | 0.03 | % | | | 0.18 | % | | | 0.05 | %(i) |
Net investment income (loss) (h) | | | 0.07 | % | | | (0.12 | )% | | | 0.71 | % | | | 0.46 | %(i) |
Portfolio turnover rate | | | 78 | % | | | 74 | % | | | 82 | % | | | 29 | %(g) |
Net assets, end of period (000s) | | $ | 12,388 | | | $ | 6,362 | | | $ | 917 | | | $ | 1,231 | |
| (a) | The Predecessor Fund’s Class A shares commenced operations on September 28, 2007. Per share data and total return reflect activity from that date. |
| (b) | Per share data was calculated using the average shares outstanding during the period. |
| (c) | Net investment income per share reflects a special dividend. The effect of this dividend amounted to $0.03 per share. |
| (d) | Rounds to less than $0.01 per share. |
| (e) | Total return at net asset value assuming all distributions reinvested and no initial sales charge or contingent deferred sales charge. |
| (f) | Had the Investment Manager and/or any of its affiliates not waived fees or reimbursed a portion of expenses, total return would have been reduced. |
| (h) | The benefits derived from expense reduction had an impact of less than 0.01%. |
| (j) | Rounds to less than 0.01%. |
See Accompanying Notes to Financial Statements.
17
Financial Highlights – Columbia Emerging Markets Fund
Selected data for a share outstanding throughout each period is as follows:
| | | | | | | | | | | | | | | | |
| | | Year Ended March 31, | | | Period Ended
March 31, | |
| Class C Shares | | 2011 | | | 2010 | | | 2009 | | | 2008 (a) | |
Net Asset Value, Beginning of Period | | $ | 11.21 | | | $ | 6.36 | | | $ | 14.94 | | | $ | 17.77 | |
| | | | |
Income from Investment Operations: | | | | | | | | | | | | | | | | |
Net investment income (loss) (b) | | | (0.07 | ) | | | (0.09 | ) | | | — | (c) | | | (0.04 | )(d) |
Net realized and unrealized gain (loss) on investments, foreign currency
and foreign capital gains tax | | | 1.73 | | | | 4.97 | | | | (6.33 | ) | | | (1.61 | ) |
| | | | | | | | | | | | | | | | |
Total from investment operations | | | 1.66 | | | | 4.88 | | | | (6.33 | ) | | | (1.65 | ) |
| | | | |
Less Distributions to Shareholders: | | | | | | | | | | | | | | | | |
From net investment income | | | (0.02 | ) | | | (0.03 | ) | | | — | | | | (0.02 | ) |
From net realized gains | | | (1.46 | ) | | | — | | | | (2.26 | ) | | | (1.16 | ) |
| | | | | | | | | | | | | | | | |
Total distributions to shareholders | | | (1.48 | ) | | | (0.03 | ) | | | (2.26 | ) | | | (1.18 | ) |
| | | | |
Redemption Fees: | | | | | | | | | | | | | | | | |
Redemption fees added to paid-in-capital | | | — | | | | — | (b)(c) | | | 0.01 | (b) | | | — | (b)(c) |
| | | | |
Net Asset Value, End of Period | | $ | 11.39 | | | $ | 11.21 | | | $ | 6.36 | | | $ | 14.94 | |
Total return (e)(f) | | | 15.92 | % | | | 76.73 | % | | | (49.82 | )% | | | (10.11 | )%(g) |
| | | | |
Ratios to Average Net Assets/Supplemental Data: | | | | | | | | | | | | | | | | |
Net expenses before interest expense (h) | | | 2.40 | % | | | 2.49 | % | | | 2.70 | % | | | 2.60 | %(i) |
Interest expense | | | — | %(j) | | | — | %(j) | | | 0.01 | % | | | — | %(i)(j) |
Net expenses (h) | | | 2.40 | % | | | 2.49 | % | | | 2.71 | % | | | 2.60 | %(i) |
Waiver/Reimbursement | | | 0.31 | % | | | 0.03 | % | | | 0.18 | % | | | 0.05 | %(i) |
Net investment loss (h) | | | (0.62 | )% | | | (0.86 | )% | | | (0.01 | )% | | | (0.44 | )%(i) |
Portfolio turnover rate | | | 78 | % | | | 74 | % | | | 82 | % | | | 29 | %(g) |
Net assets, end of period (000s) | | $ | 2,100 | | | $ | 1,540 | | | $ | 242 | | | $ | 458 | |
| (a) | The Predecessor Fund’s Class C shares commenced operations on September 28, 2007. Per share data and total return reflect activity from that date. |
| (b) | Per share data was calculated using the average shares outstanding during the period. |
| (c) | Rounds to less than $0.01 per share. |
| (d) | Net investment income per share reflects a special dividend. The effect of this dividend amounted to $0.03 per share. |
| (e) | Had the Investment Manager and/or any of its affiliates not waived fees or reimbursed a portion of expenses, total return would have been reduced. |
| (f) | Total return at net asset value assuming all distributions reinvested and no contingent deferred sales charge. |
| (h) | The benefits derived from expense reduction had an impact of less than 0.01%. |
| (j) | Rounds to less than 0.01%. |
See Accompanying Notes to Financial Statements.
18
Financial Highlights – Columbia Emerging Markets Fund
Selected data for a share outstanding throughout the period is as follows:
| | | | |
| Class I Shares | | Period Ended
March 31,
2011 (a) | |
Net Asset Value, Beginning of Period | | $ | 11.71 | |
| |
Income from Investment Operations: | | | | |
Net investment loss (b) | | | (0.01 | ) |
Net realized and unrealized gain on investments, foreign currency
and foreign capital gains tax | | | 0.88 | |
| | | | |
Total from investment operations | | | 0.87 | |
| |
Less Distributions to Shareholders: | | | | |
From net investment income | | | (0.10 | ) |
From net realized gains | | | (1.00 | ) |
| | | | |
Total distributions to shareholders | | | (1.10 | ) |
| |
Net Asset Value, End of Period | | $ | 11.48 | |
Total return (c)(d)(e) | | | 7.75 | % |
| |
Ratios to Average Net Assets/Supplemental Data: | | | | |
Net expenses before interest expense (f)(g) | | | 1.33 | % |
Interest expense (g)(h) | | | — | % |
Net expenses (f)(g) | | | 1.33 | % |
Waiver/Reimbursement (g) | | | 0.26 | % |
Net investment loss (f)(g) | | | (0.09 | )% |
Portfolio turnover rate (e) | | | 78 | % |
Net assets, end of period (000s) | | $ | 104,595 | |
| (a) | Class I shares commenced operations on September 27, 2010. Per share data and total return reflect activity from that date. |
| (b) | Per share data was calculated using the average shares outstanding during the period. |
| (c) | Total return at net asset value. |
| (d) | Had the Investment Manager and/or any of its affiliates not waived fees or reimbursed a portion of expenses, total return would have been reduced. |
| (f) | The benefits derived from expense reduction had an impact of less than 0.01%. |
| (h) | Rounds to less than 0.01%. |
See Accompanying Notes to Financial Statements.
19
Financial Highlights – Columbia Emerging Markets Fund
Selected data for a share outstanding throughout the period is as follows:
| | | | |
| Class R Shares | | Period Ended
March 31,
2011 (a) | |
Net Asset Value, Beginning of Period | | $ | 11.70 | |
| |
Income from Investment Operations: | | | | |
Net investment loss (b) | | | (0.06 | ) |
Net realized and unrealized gain on investments, foreign currency
and foreign capital gains tax | | | 0.91 | |
| | | | |
Total from investment operations | | | 0.85 | |
| |
Less Distributions to Shareholders: | | | | |
From net investment income | | | (0.06 | ) |
From net realized gains | | | (1.00 | ) |
| | | | |
Total distributions to shareholders | | | (1.06 | ) |
| |
Net Asset Value, End of Period | | $ | 11.49 | |
Total return (c)(d)(e) | | | 7.50 | % |
| |
Ratios to Average Net Assets/Supplemental Data: | | | | |
Net expenses before interest expense (f)(g) | | | 1.91 | % |
Interest expense (g)(h) | | | — | % |
Net expenses (f)(g) | | | 1.91 | % |
Waiver/Reimbursement (g) | | | 0.30 | % |
Net investment loss (f)(g) | | | (0.97 | )% |
Portfolio turnover rate (e) | | | 78 | % |
Net assets, end of period (000s) | | $ | 2 | |
| (a) | Class R shares commenced operations on September 27, 2010. Per share data and total return reflect activity from that date. |
| (b) | Per share data was calculated using the average shares outstanding during the period. |
| (c) | Total return at net asset value. |
| (d) | Had the Investment Manager and/or any of its affiliates not waived fees or reimbursed a portion of expenses, total return would have been reduced. |
| (f) | The benefits derived from expense reduction had an impact of less than 0.01%. |
| (h) | Rounds to less than 0.01%. |
See Accompanying Notes to Financial Statements.
20
Financial Highlights – Columbia Emerging Markets Fund
Selected data for a share outstanding throughout the period is as follows:
| | | | |
| Class W Shares | | Period Ended
March 31,
2011 (a) | |
Net Asset Value, Beginning of Period | | $ | 11.70 | |
| |
Income from Investment Operations: | | | | |
Net investment loss (b) | | | (0.02 | ) |
Net realized and unrealized gain on investments, foreign currency
and foreign capital gains tax | | | 0.88 | |
| | | | |
Total from investment operations | | | 0.86 | |
| |
Less Distributions to Shareholders: | | | | |
From net investment income | | | (0.08 | ) |
From net realized gains | | | (1.00 | ) |
| | | | |
Total distributions to shareholders | | | (1.08 | ) |
| |
Net Asset Value, End of Period | | | 11.48 | |
Total Return (c)(d)(e) | | | 7.61 | % |
| |
Ratios to Average Net Assets/Supplemental Data: | | | | |
Net expenses before interest expense (f)(g) | | | 1.65 | % |
Interest expense (g)(h) | | | — | % |
Net expenses (f)(g) | | | 1.65 | % |
Waiver/Reimbursement (g) | | | 0.30 | % |
Net investment loss (f)(g) | | | (0.41 | )% |
Portfolio turnover rate (e) | | | 78 | % |
Net assets, end of period (000s) | | $ | 50,623 | |
| (a) | Class W shares commenced operations on September 27, 2010. Per share data and total return reflect activity from that date. |
| (b) | Per share data was calculated using the average shares outstanding during the period. |
| (c) | Total return at net asset value. |
| (d) | Had the Investment Manager and/or any of its affiliates not waived fees or reimbursed a portion of expenses, total return would have been reduced. |
| (f) | The benefits derived from expense reduction had an impact of less than 0.01%. |
| (h) | Rounds to less than 0.01%. |
See Accompanying Notes to Financial Statements.
21
Financial Highlights – Columbia Emerging Markets Fund
Selected data for a share outstanding throughout each period is as follows:
| | | | | | | | | | | | | | | | | | | | |
| | | Year Ended March 31, | |
| Class Z Shares | | 2011 | | | 2010 | | | 2009 | | | 2008 (a)(b) | | | 2007 | |
Net Asset Value, Beginning of Period | | $ | 11.26 | | | $ | 6.42 | | | $ | 14.94 | | | $ | 14.06 | | | $ | 12.60 | |
| | | | | |
Income from Investment Operations: | | | | | | | | | | | | | | | | | | | | |
Net investment income (c) | | | 0.06 | | | | 0.05 | | | | 0.11 | | | | 0.12 | (d) | | | 0.07 | |
Net realized and unrealized gain (loss) on investments, foreign currency and foreign capital gains tax | | | 1.74 | | | | 4.97 | | | | (6.38 | ) | | | 2.04 | | | | 2.16 | |
| | | | | | | | | | | | | | | | | | | | |
Total from investment operations | | | 1.80 | | | | 5.02 | | | | (6.27 | ) | | | 2.16 | | | | 2.23 | |
| | | | | |
Less Distributions to Shareholders: | | | | | | | | | | | | | | | | | | | | |
From net investment income | | | (0.11 | ) | | | (0.18 | ) | | | — | | | | (0.12 | ) | | | (0.08 | ) |
From net realized gains | | | (1.46 | ) | | | — | | | | (2.26 | ) | | | (1.16 | ) | | | (0.69 | ) |
| | | | | | | | | | | | | | | | | | | | |
Total distributions to shareholders | | | (1.57 | ) | | | (0.18 | ) | | | (2.26 | ) | | | (1.28 | ) | | | (0.77 | ) |
| | | | | |
Redemption Fees: | | | | | | | | | | | | | | | | | | | | |
Redemption fees added to paid-in-capital | | | — | | | | — | (c)(e) | | | 0.01 | (c) | | | — | (c)(e) | | | — | (c)(e) |
Net Asset Value, End of Period | | $ | 11.49 | | | $ | 11.26 | | | $ | 6.42 | | | $ | 14.94 | | | $ | 14.06 | |
Total return (f)(g) | | | 17.16 | % | | | 78.84 | % | | | (49.37 | )% | | | 14.31 | % | | | 17.98 | % |
| | | | | |
Ratios to Average Net Assets/Supplemental Data: | | | | | | | | | | | | | | | | | | | | |
Net expenses before interest expense (h) | | | 1.40 | % | | | 1.49 | % | | | 1.70 | % | | | 1.85 | % | | | 1.85 | % |
Interest expense | | | — | %(i) | | | — | %(i) | | | 0.01 | % | | | — | %(i) | | | — | |
Net expenses (h) | | | 1.40 | % | | | 1.49 | % | | | 1.71 | % | | | 1.85 | % | | | 1.85 | % |
Waiver/Reimbursement | | | 0.31 | % | | | 0.03 | % | | | 0.18 | % | | | 0.04 | % | | | 0.05 | % |
Net investment income (h) | | | 0.52 | % | | | 0.47 | % | | | 1.01 | % | | | 0.73 | % | | | 0.50 | % |
Portfolio turnover rate | | | 78 | % | | | 74 | % | | | 82 | % | | | 29 | % | | | 16 | % |
Net assets, end of period (000s) | | $ | 326,675 | | | $ | 396,849 | | | $ | 237,412 | | | $ | 1,014,715 | | | $ | 1,092,481 | |
| (a) | On March 31, 2008, Shares class of Emerging Markets Fund, a series of Excelsior Funds, Inc., was reorganized into Class Z. The financial information of Class Z includes the financial information of Emerging Markets Fund’s Shares class. |
| (b) | On March 31, 2008, Emerging Markets Fund’s Institutional Shares class was reorganized into the Fund’s Class Z. |
| (c) | Per share data was calculated using the average shares outstanding during the period. |
| (d) | Net investment income per share reflects a special dividend. The effect of this dividend amounted to $0.03 per share. |
| (e) | Rounds to less than $0.01 per share. |
| (f) | Had the Investment Manager and/or any of its affiliates not waived fees or reimbursed a portion of expenses, total return would have been reduced. |
| (g) | Total return at net asset value assuming all distributions reinvested. |
| (h) | The benefits derived from expense reduction had an impact of less than 0.01%. |
| (i) | Rounds to less than 0.01%. |
See Accompanying Notes to Financial Statements.
22
Notes to Financial Statements – Columbia Emerging Markets Fund
March 31, 2011
Note 1. Organization
Columbia Emerging Markets Fund (the Fund), a series of Columbia Funds Series Trust I (the Trust), is a diversified fund. The Trust is registered under the Investment Company Act of 1940, as amended (the 1940 Act), as an open-end management investment company organized as a Massachusetts business trust.
After the close of business on April 30, 2010, Ameriprise Financial, Inc. (Ameriprise Financial) acquired a portion of the asset management business of Columbia Management Group, LLC (the Transaction), including the business of managing the Fund. In connection with the closing of the Transaction (the Closing), RiverSource Investments, LLC, a wholly owned subsidiary of Ameriprise Financial, became the investment manager of the Fund and changed its name to Columbia Management Investment Advisers, LLC (the Investment Manager).
Investment Objective
The Fund seeks long-term capital appreciation.
Fund Shares
The Trust has unlimited authorized shares of beneficial interest. The Fund offers Class A, Class C, Class I, Class R, Class W and Class Z shares. On December 28, 2010, the Investment Manager exchanged Class Z shares of the Fund valued at $54,696,984 for Class I shares of the Fund. All share classes have identical voting, dividend and liquidation rights. Each share class has its own expense structure and sales charges, as applicable.
Class A shares are subject to a maximum front-end sales charge of 5.75% based on the initial investment amount. Class A shares purchased without an initial sales charge in accounts aggregating $1 million to $50 million at the time of purchase are subject to a 1.00% contingent deferred sales charge (CDSC) if the shares are sold within 18 months of purchase, charged as follows: 1.00% CDSC if redeemed within 12 months of purchase, and 0.50% CDSC if redeemed more than 12, but less than 18 months after purchase.
Class C shares are subject to a 1.00% CDSC on shares redeemed within one year of purchase.
Class I shares are not subject to sales charges and are available only to the Columbia Family of Funds. Class I shares commenced operations on September 27, 2010.
Class R shares are not subject to sales charges and are available only to qualifying institutional investors. Class R shares commenced operations on September 27, 2010.
Class W shares are not subject to sales charges and are available only to investors purchasing through authorized investment programs managed by investment professionals, including discretionary managed account programs. Class W shares commenced operations on September 27, 2010.
Class Z shares are not subject to sales charges and are available only to certain investors, as described in the Fund’s prospectus.
Note 2. Summary of Significant Accounting Policies
The preparation of financial statements in accordance with U.S. generally accepted accounting principles (GAAP) requires management to make certain estimates and assumptions that affect the reported amounts of assets and liabilities, the disclosure of contingent assets and liabilities at the date of the financial statements and the reported amounts of revenue and expenses during the reporting period. Actual results could differ from those estimates.
The following is a summary of significant accounting policies consistently followed by the Fund in the preparation of its financial statements.
Security Valuation
Equity securities are valued at the last sale price on the principal exchange on which they trade, except for securities traded on the NASDAQ, which are valued at the NASDAQ official close price. Unlisted securities or listed securities for which there were no sales during the day are valued at the closing bid price on such exchanges or over-the-counter markets.
Short-term investments maturing in 60 days or less are valued at amortized cost, which approximates market value.
Foreign securities are generally valued at the last sale price on the foreign exchange or market on which they trade. If any foreign share prices are not readily available as a result of limited share activity, the securities are valued at the last sale price of the local shares in the principal market in which such securities are normally traded.
Generally, trading in foreign securities is substantially completed each day at various times prior to the close of the New York Stock Exchange (NYSE). The values of such securities used in computing the net asset value of the Fund’s shares are determined as of such times. Foreign currency exchange rates are generally determined at 4:00 p.m. Eastern (U.S.) time. Occasionally, events affecting the values of such foreign securities and such exchange rates may occur between the times at which they are determined and the close of the
23
Columbia Emerging Markets Fund
March 31, 2011
customary trading session of the NYSE, which would not be reflected in the computation of the Fund’s net asset value. If events materially affecting the values of such foreign securities occur and it is determined that market quotations are not reliable, then these foreign securities will be valued at their fair value using procedures approved by the Board of Trustees.
The Fund may use a systematic fair valuation model provided by an independent third party to value securities principally traded in foreign markets. The third party pricing service takes into account multiple factors, including, but not limited to, movements in the U.S. securities markets, certain depositary receipts, futures contracts and foreign exchange rates that have occurred subsequent to the close of the foreign exchange, to determine a good faith estimate that reasonably reflects the current market conditions as of the close of the NYSE. The fair value of a security is likely to be different from the quoted or published price, if available.
Investments for which market quotations are not readily available, or that have quotations which management believes are not reliable, are valued at fair value as determined in good faith under consistently applied procedures established by and under the general supervision of the Board of Trustees. If a security is valued at fair value, such value is likely to be different from the last quoted market price for the security. The determination of fair value often requires significant judgment. To determine fair value, management may use assumptions including but not limited to future cash flows and estimated risk premiums. Multiple inputs from various sources may be used to determine value.
Foreign Currency Transactions and Translations
The values of all assets and liabilities quoted in foreign currencies are translated into U.S. dollars at that day’s exchange rates. Net realized and unrealized gains (losses) on foreign currency transactions and translations include gains (losses) arising from the fluctuation in exchange rates between trade and settlement dates on securities transactions, gains (losses) arising from the disposition of foreign currency and currency gains (losses) between the accrual and payment dates on dividends, interest income and foreign withholding taxes.
For financial statement purposes, the Fund does not distinguish that portion of gains (losses) on investments which is due to changes in foreign exchange rates from that which is due to changes in market prices of the investments. Such fluctuations are included with the net realized and unrealized gains (losses) on investments on the Statement of Operations.
Repurchase Agreements
The Fund may engage in repurchase agreement transactions with institutions that the Investment Manager has determined are creditworthy. The Fund, through the custodian, receives delivery of the underlying securities collateralizing a repurchase agreement. The Investment Manager is responsible for determining that the collateral is at least equal, at all times, to the value of the repurchase obligation including interest. A repurchase agreement transaction involves certain risks in the event of default or insolvency of the counterparty. These risks include possible delays in or restrictions on the Fund’s ability to dispose of the underlying securities and a possible decline in the value of the underlying securities during the period while the Fund seeks to assert its rights.
Security Transactions
Security transactions are accounted for on the trade date. Cost is determined and gains (losses) are based upon the specific identification method for both financial statement and federal income tax purposes.
Income Recognition
Interest income is recorded on the accrual basis.
Corporate actions and dividend income are recorded net of any non-reclaimable tax withholdings, on the ex-dividend date or upon receipt of ex-dividend notification in the case of certain foreign securities.
Awards from class action litigation are recorded as a reduction of cost if the Fund still owns the applicable securities on the payment date. If the Fund no longer owns the applicable securities, the proceeds are recorded as realized gains.
Expenses
General expenses of the Trust are allocated to the Fund and other series of the Trust based upon relative net assets or other expense allocation methodologies determined by the nature of the expense. Expenses directly attributable to a specific class of shares are charged to that share class. Expenses directly attributable to the Fund are charged to the Fund.
Determination of Class Net Asset Value
All income, expenses (other than class-specific expenses which are charged directly to a share class, as shown in the Statement of Operations) and realized and unrealized gains (losses) are allocated to each class of the Fund on a daily basis, based on the relative net assets of each class, for purposes of determining the net asset value of each class.
24
Columbia Emerging Markets Fund
March 31, 2011
Federal Income Tax Status
The Fund intends to qualify each year as a regulated investment company under Subchapter M of the Internal Revenue Code, as amended, and will distribute substantially all of its taxable income, if any, for its tax year, and as such will not be subject to federal income taxes. In addition, the Fund intends to distribute in each calendar year substantially all of its net investment income, capital gains and certain other amounts, if any, such that the Fund should not be subject to federal excise tax. Therefore, no federal income or excise tax provision is recorded.
Foreign Taxes
The Fund may be subject to foreign taxes on income and/or gains on investments or currency repatriation, a portion of which may be recoverable. The Fund will accrue such taxes and recoveries as applicable, based upon its current interpretation of tax rules and regulations that exist in the markets in which it invests.
Realized gains in certain countries may be subject to foreign taxes at the Fund level, at rates ranging from approximately 10% to 15%. The Fund accrues for such foreign taxes on net realized and unrealized gains at the appropriate rate for each jurisdiction.
Distributions to Shareholders
Distributions from net investment income, if any, are declared and paid semi-annually. Net realized capital gains, if any, are distributed at least annually. Income distributions and capital gain distributions are determined in accordance with federal income tax regulations which differ from GAAP.
Indemnifications
Under the Trust’s organizational documents and, in some cases, by contract, its officers and directors are indemnified against certain liabilities arising out of the performance of their duties to the Fund. In addition, certain of the Fund’s contracts with its service providers contain general indemnification clauses. The Fund’s maximum exposure under these arrangements is unknown since the amount of any future claims that may be made against the Fund cannot be determined and the Fund has no historical basis for predicting the likelihood of any such claims.
Note 3. Fees and Compensation Paid to Affiliates
Investment Management Fee
Under an Investment Management Services Agreement (IMSA), the Investment Manager determines which securities will be purchased, held or sold. The management fee is equal to a percentage of the Fund’s average daily net assets that declines from 1.15% to 0.52% as the Fund’s net assets increase.
Prior to the Closing, Columbia Management Advisors, LLC (Columbia), an indirect, wholly owned subsidiary of Bank of America Corporation (BOA), provided investment management services to the Fund under the same fee structure. The effective management fee rate for the year ended March 31, 2011, was 1.15% of the Fund’s average daily net assets.
Administration Fee
Effective upon the Closing, the Investment Manager provides administration and accounting services to the Fund under an Administrative Services Agreement, including services previously performed under the Pricing and Bookkeeping Oversight and Services Agreement (the Services Agreement) as discussed in the Pricing and Bookkeeping Fees note below. The Fund pays an annual administration fee equal to 0.20% of the Fund’s average daily net assets less the fees payable by the Fund as described under the Pricing and Bookkeeping Fees note below. Prior to the Closing, Columbia provided administrative services to the Fund at the same fee rates.
Pricing and Bookkeeping Fees
Prior to the Closing, the Fund entered into a Financial Reporting Services Agreement (the Financial Reporting Services Agreement) with State Street Bank and Trust Company (State Street) and Columbia pursuant to which State Street provides financial reporting services to the Fund. The Fund also entered into an Accounting Services Agreement (collectively with the Financial Reporting Services Agreement, the State Street Agreements) with State Street and Columbia pursuant to which State Street provides accounting services to the Fund. Upon the Closing, Columbia assigned and delegated its rights and obligations under the State Street Agreements to the Investment Manager. Under the State Street Agreements, the Fund pays State Street an annual fee of $38,000 paid monthly plus an additional monthly fee based on an annualized percentage rate of average daily net assets of the Fund for the month. The aggregate fee will not exceed $140,000 per year (exclusive of out-of-pocket expenses and charges). The Fund also reimburses State Street for certain out-of-pocket expenses and charges.
Also prior to the Closing, the Fund entered into the Services Agreement with Columbia. Under the Services Agreement, Columbia provided services related to Fund expenses and the requirements of the Sarbanes-Oxley Act of 2002, and provided
25
Columbia Emerging Markets Fund
March 31, 2011
oversight of the accounting and financial reporting services provided by State Street. Under the Services Agreement, the Fund reimbursed Columbia for out-of-pocket expenses and charges, including fees payable to third parties, such as for pricing the Fund’s portfolio securities, incurred by Columbia in the performance of services under the Services Agreement. The Services Agreement was terminated upon the Closing. These services are now provided under the Administrative Services Agreement discussed above.
Transfer Agent Fee
In connection with the Closing, RiverSource Service Corporation, a wholly owned subsidiary of Ameriprise Financial, provides transfer agency services to the Fund under a Transfer Agency Agreement and changed its name to Columbia Management Investment Services Corp. (the Transfer Agent). The Transfer Agent has contracted with Boston Financial Data Services (BFDS) to serve as sub-transfer agent.
The Transfer Agent receives monthly account-based service fees based on the number of open accounts and is reimbursed by the Fund for the fees and expenses the Transfer Agent pays to financial intermediaries that maintain omnibus accounts with the Fund that is a percentage of the average aggregate value of the Fund’s shares maintained in each such omnibus account (other than omnibus accounts for which American Enterprise Investment Services Inc. is the broker of record or accounts where the beneficial shareholder is a customer of Ameriprise Financial Services, Inc., which are paid a per account fee). The Transfer Agent pays the fees of BFDS for services as sub-transfer agent and, is not entitled to reimbursement for such fees from the Fund (with the exception of out-of-pocket fees). The Transfer Agent also receives compensation from fees for various shareholder services and reimbursements for certain out-of -pocket expenses. Class I shares do not pay any transfer agency fees.
Prior to the Closing, Columbia Management Services, Inc., an affiliate of Columbia and an indirect, wholly owned subsidiary of BOA, provided transfer agency services to the Fund and contracted with BFDS to serve as sub-transfer agent, under the same fee structure.
For the year ended March 31, 2011, the Fund’s effective transfer agent fee rate for each class, with the exception of Class I shares, as a percentage of each class’ average daily net assets was as follows:
| | | | | | | | |
| | | | | | | |
| Class A | | Class C | | Class R | | Class W | | Class Z |
| 0.10% | | 0.10% | | 0.11% | | 0.11% | | 0.10% |
An annual minimum account balance fee of $20 may apply to certain accounts with a value below the Fund’s initial minimum investment requirements to reduce the impact of small accounts on transfer agent fees. These minimum account balance fees are recorded as part of expense reductions on the Statement of Operations. For the year ended March 31, 2011, no minimum account balance fees were charged by the Fund.
Underwriting Discounts, Service and Distribution Fees
In connection with the Closing, RiverSource Fund Distributors, Inc., an indirect wholly owned subsidiary of Ameriprise Financial, provides distribution and shareholder services to the Fund and changed its name to Columbia Management Investment Distributors, Inc. (the Distributor). Pursuant to Rule 12b-1 under the 1940 Act, the Board of Trustees has approved, and the Fund has adopted, distribution and shareholder service plans (the Plans) which set the distribution and service fees for the Fund. These fees are calculated daily and are intended to compensate the Distributor and/or eligible selling and/or servicing agents for selling shares of the Fund and providing services to investors.
The Plans require the payment of a monthly service fee to the Distributor at the maximum annual rate of 0.25% of the average daily net assets attributable to Class A, Class C and Class W shares of the Fund. The Plans also require the payment of a monthly distribution fee to the Distributor at the maximum annual rates of 0.75% of the average daily net assets attributable to Class C shares, 0.50% of the average daily net assets attributable to Class R shares and 0.25% of the average daily net assets attributable to Class W shares.
The Fund may pay a distribution fee of up to 0.25% of the Fund’s average daily net assets attributable to Class W shares and a service fee of up to 0.25% of the Fund’s average daily net assets attributable to Class W shares, provided, however, that the aggregate fee shall not exceed 0.25% of the Fund’s average daily net assets attributable to Class W shares.
Prior to the Closing, Columbia Management Distributors, Inc., an affiliate of Columbia and an indirect, wholly owned subsidiary of BOA, was the principal underwriter of the Fund’s shares. There were no changes to the underwriting discount structure of the Fund or the service or distribution fee rates paid by the Fund as a result of the Transaction.
Sales Charges
Sales charges, including front-end and CDSC’s, received by the Distributor for distributing Fund shares were $9,653 for Class A and $1,767 for Class C shares for the year ended March 31, 2011.
26
Columbia Emerging Markets Fund
March 31, 2011
Fee Waivers and Expense Reimbursements
The Investment Manager has voluntarily agreed to bear a portion of the Fund’s expenses so that the Fund’s ordinary operating expenses (excluding any brokerage commissions, interest, taxes and extraordinary expenses, but including custodian charges relating to overdrafts, if any), after giving effect to any balance credits from the Fund’s custodian, do not exceed the annual rates of 1.65%, 2.40%, 1.33%, 1.90%, 1.65% and 1.40% of the Fund’s average daily net assets attributable to Class A, Class C, Class I, Class R, Class W and Class Z shares, respectively. The Investment Manager, in its discretion, may revise or discontinue this arrangement at any time. Prior to May 1, 2010, Columbia voluntarily reimbursed a portion of the Fund’s expenses so that the Fund’s ordinary operating expenses (excluding any distribution and service fees, brokerage commissions, interest, taxes and extraordinary expenses, but including custodian charges relating to overdrafts, if any), after giving effect to any balance credits from the Fund’s custodian, did not exceed 1.40% of the Fund’s average daily net assets on an annualized basis.
Fees Paid to Officers and Trustees
In connection with the Closing, all officers of the Fund are employees of the Investment Manager or its affiliates and, with the exception of the Fund’s Chief Compliance Officer, receive no compensation from the Fund. The Board of Trustees has appointed a Chief Compliance Officer to the Fund in accordance with federal securities regulations. The Fund, along with other affiliated funds, pays its pro-rata share of the expenses associated with the Chief Compliance Officer. The Fund’s expenses for the Chief Compliance Officer will not exceed $15,000 per year. Prior to the Closing, all officers of the Fund were employees of Columbia or its affiliates and the Fund paid its pro-rata share of the expenses for the Chief Compliance Officer under the same fee structure.
Trustees are compensated for their services to the Fund, as set forth on the Statement of Operations. The Trust’s eligible Trustees may participate in a deferred compensation plan which may be terminated at any time. Obligations of the plan will be paid solely out of the Fund’s assets.
Note 4. Custody Credits
The Fund has an agreement with its custodian bank under which custody fees may be reduced by balance credits. These credits are recorded as part of expense reductions on the Statement of Operations. The Fund could have invested a portion of the assets utilized in connection with the expense offset arrangement in an income-producing asset if it had not entered into such an agreement. For the year ended March 31, 2011, these custody credits reduced total expenses by $25 for the Fund.
Note 5. Portfolio Information
The cost of purchases and proceeds from sales of securities, excluding short-term obligations, aggregated $345,444,927 and $320,006,233, respectively, for the year ended March 31, 2011.
Note 6. Shareholder Concentration
As of March 31, 2011, four shareholder accounts owned 70.1% of the outstanding shares of the Fund. Purchase and redemption activity of these accounts may have a significant effect on the operations of the Fund.
Note 7. Line of Credit
Prior to March 28, 2011, the Fund and other affiliated funds participated in a $280,000,000 committed, unsecured revolving line of credit provided by State Street. Effective March 28, 2011, the commitment was reduced to $225,000,000. The maximum amount that may be borrowed by any fund is limited to the lesser of $200,000,000 and the Fund’s borrowing limit set forth in the Fund’s registration statement. Borrowings are available for short-term liquidity or temporary or emergency purposes.
Effective October 14, 2010, interest is charged to each participating fund based on the fund’s borrowings at a rate per annum equal to the greater of the Federal Funds Rate plus 1.25% or the overnight LIBOR Rate plus 1.25%. In addition, a commitment fee of 0.125% per annum is accrued and apportioned among the participating funds pro rata based on their relative net assets.
For the year ended March 31, 2011, the average daily loan balance outstanding on days where borrowing existed was $2,310,000 at a weighted average interest rate of 1.504%.
Note 8. Federal Tax Information
The timing and character of income and capital gain distributions are determined in accordance with income tax regulations, which may differ from GAAP. Reclassifications are made to the Fund’s capital accounts for permanent tax differences to reflect income and gains available for distribution (or available capital loss carryforwards) under income tax regulations.
For the year ended March 31, 2011, permanent book and tax basis differences resulting primarily from differing treatments for foreign
27
Columbia Emerging Markets Fund
March 31, 2011
currency transactions, passive foreign investment company (“PFIC”) adjustments, distribution reclassifications, foreign capital gains tax and proceeds from litigation settlements were identified and reclassified among the components of the Fund’s net assets as follows:
| | | | |
| | | | | |
Overdistributed
Net Investment
Income | | Accumulated Net Realized
Gain | | Paid-In Capital |
| $(534,077) | | $534,077 | | $— |
Net investment income and net realized gains (losses), as disclosed on the Statement of Operations, and net assets were not affected by this reclassification.
The tax character of distributions paid during the years ended March 31, 2011 and March 31, 2010 was as follows:
| | | | | | | | |
| | | March 31, 2011 | | | March 31, 2010 | |
Ordinary Income* | | $ | 3,268,726 | | | $ | 5,987,918 | |
Long-Term Capital Gains | | | 54,241,480 | | | | 738,148 | |
| * | For tax purposes short-term capital gain distributions, if any, are considered ordinary income distributions. |
As of March 31, 2011, the components of distributable earnings on a tax basis were as follows:
| | | | |
| | | | | |
Undistributed
Ordinary
Income | | Undistributed Long-Term Capital Gains | | Net
Unrealized Appreciation* |
| $— | | $22,893,199 | | $162,351,328 |
| * | The differences between book-basis and tax-basis net unrealized appreciation are primarily due to deferral of losses from wash sales. |
Unrealized appreciation and depreciation at March 31, 2011, based on cost of investments for federal income tax purposes were:
| | | | |
| | |
Unrealized appreciation | | $ | 165,334,093 | |
Unrealized depreciation | | | (2,982,765 | ) |
| | | | |
Net unrealized appreciation | | $ | 162,351,328 | |
The following capital loss carryforwards may be available to reduce taxable income arising from future net realized gains on investments, if any, to the extent permitted by the Internal Revenue Code:
| | | | |
| | |
| Year of Expiration | | Capital Loss Carryforwards | |
| 2012 | | $ | 249,452 | |
| 2014 | | | 36,739 | |
| | | | |
| | $ | 286,191 | |
Capital loss carryforwards of $249,452 were utilized during the year ended March 31, 2011.
Under current tax rules, certain currency and capital losses realized after October 31 may be deferred and treated as occurring on the first day of the following fiscal year. As of March 31, 2011, post-October currency losses of $1,269,242 attributed to security transactions were deferred to April 1, 2011.
Management of the Fund has concluded that there are no significant uncertain tax positions that would require recognition in the financial statements. However, management’s conclusion may be subject to review and adjustment at a later date based on factors including, but not limited to, new tax laws, regulations, and administrative interpretations (including relevant court decisions). The Fund’s federal tax returns for the prior three fiscal years remain subject to examination by the Internal Revenue Service.
Note 9. Significant Risks and Contingencies
Foreign Securities Risk
Investing in foreign securities may include certain risks and considerations not typically associated with investing in U.S. securities, such as fluctuating currency values and changing local and regional economic, political and social conditions, which may result in greater market volatility. In addition, certain foreign securities may not be as liquid as U.S. securities. Investing in emerging markets may accentuate these risks.
Investments in emerging market countries are subject to additional risk. The risk of foreign investments is typically increased in less developed countries. These countries are also more likely to experience high levels of inflation, deflation or currency devaluation which could hurt their economies and securities markets.
Note 10. Subsequent Events
The Investment Manager has evaluated the events and transactions that have occurred through the date the financial statements were issued. Other than as noted below there were no items requiring adjustment of the financial statements or additional disclosure.
28
Columbia Emerging Markets Fund
March 31, 2011
Effective May 16, 2011, the line of credit commitment with State Street was reduced to $150,000,000, and the maximum amount that may be borrowed by any fund was limited to the lesser of $120,000,000 and the Fund’s borrowing limit set forth in the Fund’s registration statement.
Note 11. Information Regarding Pending and Settled Legal Proceedings
In June 2004, an action captioned John E. Gallus et al. v. American Express Financial Corp. and American Express Financial Advisors Inc. was filed in the United States District Court for the District of Arizona. The plaintiffs allege that they are investors in several American Express Company (now known as RiverSource) mutual funds and they purport to bring the action derivatively on behalf of those funds under the Investment Company Act of 1940. The plaintiffs allege that fees allegedly paid to the defendants by the funds for investment advisory and administrative services are excessive. The plaintiffs seek remedies including restitution and rescission of investment advisory and distribution agreements. The plaintiffs voluntarily agreed to transfer this case to the United States District Court for the District of Minnesota (the District Court). In response to defendants’ motion to dismiss the complaint, the District Court dismissed one of plaintiffs’ four claims and granted plaintiffs limited discovery. Defendants moved for summary judgment in April 2007. Summary judgment was granted in the defendants’ favor on July 9, 2007. The plaintiffs filed a notice of appeal with the Eighth Circuit Court of Appeals (the Eighth Circuit) on August 8, 2007. On April 8, 2009, the Eighth Circuit reversed summary judgment and remanded to the District Court for further proceedings. On August 6, 2009, defendants filed a writ of certiorari with the U.S. Supreme Court (the Supreme Court), asking the Supreme Court to stay the District Court proceedings while the Supreme Court considers and rules in a case captioned Jones v. Harris Associates, which involves issues of law similar to those presented in the Gallus case. On March 30, 2010, the Supreme Court issued its ruling in Jones v. Harris Associates, and on April 5, 2010, the Supreme Court vacated the Eighth Circuit’s decision in the Gallus case and remanded the case to the Eighth Circuit for further consideration in light of the Supreme Court’s decision in Jones v. Harris Associates. On June 4, 2010, the Eighth Circuit remanded the Gallus case to the District Court for further consideration in light of the Supreme Court’s decision in Jones v. Harris Associates. On December 9, 2010, the District Court reinstated its July 9, 2007 summary judgment order in favor of the defendants. On January 10, 2011, plaintiffs filed a notice of appeal with the Eighth Circuit.
In December 2005, without admitting or denying the allegations, American Express Financial Corporation (AEFC, which is now known as Ameriprise Financial, Inc. (Ameriprise Financial)), entered into settlement agreements with the Securities and Exchange Commission (SEC) and Minnesota Department of Commerce (MDOC) related to market timing activities. As a result, AEFC was censured and ordered to cease and desist from committing or causing any violations of certain provisions of the Investment Advisers Act of 1940, the Investment Company Act of 1940, and various Minnesota laws. AEFC agreed to pay disgorgement of $10 million and civil money penalties of $7 million. AEFC also agreed to retain an independent distribution consultant to assist in developing a plan for distribution of all disgorgement and civil penalties ordered by the SEC in accordance with various undertakings detailed at http://www.sec.gov/litigation/admin/ia-2451.pdf. Ameriprise Financial and its affiliates have cooperated with the SEC and the MDOC in these legal proceedings, and have made regular reports to the funds’ Boards of Directors/Trustees.
Ameriprise Financial and certain of its affiliates have historically been involved in a number of legal, arbitration and regulatory proceedings, including routine litigation, class actions, and governmental actions, concerning matters arising in connection with the conduct of their business activities. Ameriprise Financial believes that the Funds are not currently the subject of, and that neither Ameriprise Financial nor any of its affiliates are the subject of, any pending legal, arbitration or regulatory proceedings that are likely to have a material adverse effect on the Funds or the ability of Ameriprise Financial or its affiliates to perform under their contracts with the Funds. Ameriprise Financial is required to make 10-Q, 10-K and, as necessary, 8-K filings with the Securities and Exchange Commission on legal and regulatory matters that relate to Ameriprise Financial and its affiliates. Copies of these filings may be obtained by accessing the SEC website at www.sec.gov.
There can be no assurance that these matters, or the adverse publicity associated with them, will not result in increased fund redemptions, reduced sale of fund shares or other adverse consequences to the Funds. Further, although we believe proceedings are not likely to have a material adverse effect on the Funds or the ability of Ameriprise Financial or its affiliates to perform under their contracts with the Funds, these proceedings are subject to uncertainties and, as such, we are unable to estimate the possible loss or range of loss that may result. An adverse outcome in one or more of these proceedings could result in adverse judgments, settlements, fines, penalties or other relief that could have a material adverse effect on the consolidated financial condition or results of operations of Ameriprise Financial.
29
Report of Independent Registered Public Accounting Firm
To the Trustees of Columbia Funds Series Trust I and the Shareholders of Columbia Emerging Markets Fund
In our opinion, the accompanying statement of assets and liabilities, including the investment portfolio, and the related statements of operations and of changes in net assets and the financial highlights present fairly, in all material respects, the financial position of Columbia Emerging Markets Fund (the “Fund”) (a series of Columbia Funds Series Trust I) at March 31, 2011, the results of its operations for the year then ended, the changes in its net assets for each of the two years in the period then ended, and the financial highlights for the periods indicated, in conformity with accounting principles generally accepted in the United States of America. These financial statements and financial highlights (hereafter referred to as “financial statements”) are the responsibility of the Fund’s management. Our responsibility is to express an opinion on these financial statements based on our audits. We conducted our audits of these financial statements in accordance with the standards of the Public Company Accounting Oversight Board (United States). Those standards require that we plan and perform the audit to obtain reasonable assurance about whether the financial statements are free of material misstatement. An audit includes examining, on a test basis, evidence supporting the amounts and disclosures in the financial statements, assessing the accounting principles used and significant estimates made by management, and evaluating the overall financial statement presentation. We believe that our audits, which included confirmation of securities at March 31, 2011 by correspondence with the custodian and brokers, provide a reasonable basis for our opinion.
PricewaterhouseCoopers LLP
Boston, Massachusetts
May 20, 2011
30
Federal Income Tax Information (Unaudited) – Columbia Emerging Markets Fund
The Fund hereby designates as a capital gain dividend with respect to the fiscal year ended March 31, 2011, $64,332,465, or, if subsequently determined to be different, the net capital gain of such year.
Foreign taxes paid during the fiscal year ended March 31, 2011, of $1,309,280 are being passed through to shareholders. This represents $0.03 per share. Eligible shareholders may claim this amount as a foreign tax credit.
Gross income derived from sources within foreign countries was $8,495,886 ($0.20 per share) for the fiscal year ended March 31, 2011.
1.50% of the ordinary income distributed by the Fund for the fiscal year ended March 31, 2011, qualifies for the corporate dividends received deduction.
For non-corporate shareholders 100.00%, or the maximum amount allowable under the Jobs and Growth Tax Relief Reconciliation Act of 2003, of ordinary income distributed by the Fund for the fiscal year ended March 31, 2011 may represent qualified dividend income.
The Fund will notify shareholders in January 2012 of amounts for use in preparing 2011 income tax returns.
31
Fund Governance
The Trustees serve terms of indefinite duration. The names, addresses and birth years of the Trustees and Officers of the Funds in Columbia Funds Series Trust I, the year each was first elected or appointed to office, their principal business occupations during at least the last five years, the number of Funds overseen by each Trustee and other directorships they hold are shown below, as of May 2, 2011. Each officer listed below serves as an officer of each Fund in Columbia Funds Series Trust I.
Independent Trustees
| | |
Name, Address and Year of Birth,
Position with Funds, Year First
Elected or Appointed to Office | | Principal Occupation(s) During Past Five Years, Number of Funds in Columbia Funds
Complex Overseen by Trustee, Other Directorships Held |
| |
| John D. Collins (born 1938) | | |
c/o Columbia Management
Investment Advisers, LLC 225 Franklin Street Boston, MA 02110 Trustee (since 2005) | | Retired. Consultant, KPMG, LLP (accounting and tax firm) from July 1999 to June 2000; Partner, KPMG, LLP from March 1962 to June 1999. Oversees 46; Mrs. Fields Original Cookies, Inc. (consumer products); Suburban Propane Partners, L.P.; and Montpelier Re (insurance underwriting firm) |
| |
| Rodman L. Drake (born 1943) | | |
c/o Columbia Management
Investment Advisers, LLC 225 Franklin Street Boston, MA 02110 Trustee (since 1994) and Chairman of the Board (since 2009) | | Independent consultant since 2010; Co-Founder of Baringo Capital LLC (private equity) from 1997 to 2008; CEO of Crystal River Capital, Inc. (real estate investment trust) from 2003 to 2010; Oversees 46; Jackson Hewitt Tax Service Inc. (tax preparation services); Celgene Corporation (global biotechnology company); Student Loan Corporation (student loan provider); Crystal River Capital, Inc. from 2005 to 2010; Parsons Brinckerhoff from 1995 to 2008; the Helios Funds (closed-end funds); and Apex Silver Mines Ltd. from 2007 to 2009 |
| |
| Douglas A. Hacker (born 1955) | | |
c/o Columbia Management Investment Advisers, LLC 225 Franklin Street Boston, MA 02110 Trustee (since 1996) | | Independent business executive since May 2006; Executive Vice President–Strategy of United Airlines (airline) from December 2002 to May 2006; President of UAL Loyalty Services (airline marketing company) from September 2001 to December 2002; Executive Vice President and Chief Financial Officer of United Airlines from July 1999 to September 2001. Oversees 46; Nash Finch Company (food distributor); Aircastle Limited (aircraft leasing); and SeaCube Container Leasing Ltd (container leasing) |
|
| Janet Langford Kelly (born 1957) |
c/o Columbia Management Investment Advisers, LLC 225 Franklin Street Boston, MA 02110 Trustee (since 1996) | | Senior Vice President, General Counsel and Corporate Secretary, ConocoPhillips (integrated energy company) since September 2007; Deputy General Counsel–Corporate Legal Services, ConocoPhillips from August 2006 to August 2007; Partner, Zelle, Hofmann, Voelbel, Mason & Gette LLP (law firm) from March 2005 to July 2006; Adjunct Professor of Law, Northwestern University, from September 2004 to June 2006; Director, UAL Corporation (airline) from February 2006 to July 2006; Oversees 46; None |
| |
| William E. Mayer (born 1940) | | |
c/o Columbia Management Investment Advisers, LLC 225 Franklin Street Boston, MA 02110 Trustee (since 1994) | | Partner, Park Avenue Equity Partners (private equity) since February 1999; Dean and Professor, College of Business and Management, University of Maryland from 1992 to 1996. Oversees 46; DynaVox Inc. (software developer); Lee Enterprises (print media), WR Hambrecht + Co. (financial service provider); BlackRock Kelso Capital Corporation (investment company) |
32
Fund Governance (continued)
Independent Trustees (continued)
| | |
Name, Address and Year of Birth,
Position with Funds, Year First
Elected or Appointed to Office | | Principal Occupation(s) During Past Five Years, Number of Funds in Columbia Funds
Complex Overseen by Trustee, Other Directorships Held |
| |
| David M. Moffett (born 1952) | | |
c/o Columbia Management Investment Advisers, LLC 225 Franklin Street Boston, MA 02110 Trustee (since 2011) | | Retired. Chief Executive Officer, Federal Home Loan Mortgage Corporation, from 2008 to 2009; Senior Adviser, Global Financial Services Group, Carlyle Group, Inc., from 2007 to 2008; Vice Chairman and Chief Financial Officer, U.S. Bancorp, from 1993 to 2007. Oversees 46; CIT Group Inc. (commercial and consumer finance), eBay Inc. (online trading community), MBIA Corp (financial service provider), E.W. Scripps Co. (print and television media), Building Materials Holding Corp. (building materials and construction services), and University of Oklahoma Foundation. |
| |
| Charles R. Nelson (born 1942) | | |
c/o Columbia Management Investment Advisers, LLC 225 Franklin Street Boston, MA 02110 Trustee (since 1981) | | Professor of Economics, University of Washington, since January 1976; Ford and Louisa Van Voorhis Professor of Political Economy, University of Washington, since September 1993; Adjunct Professor of Statistics, University of Washington, since September 1980; Associate Editor, Journal of Money Credit and Banking, 1993-2008; Consultant on econometric and statistical matters. Oversees 46; None |
| |
| John J. Neuhauser (born 1943) | | |
c/o Columbia Management Investment Advisers, LLC 225 Franklin Street Boston, MA 02110 Trustee (since 1984) | | President, Saint Michael’s College, since August 2007; Director or Trustee of several non-profit organization, including Fletcher Allen Health Care, Inc.; University Professor, Boston College from November 2005 to August 2007; Academic Vice President and Dean of Faculties, Boston College from August 1999 to October 2005. Oversees 46; Liberty All-Star Equity Fund and Liberty All-Star Growth Fund, Inc. (closed-end funds) |
| |
| Jonathan Piel (born 1938) | | |
c/o Columbia Management Investment Advisers, LLC 225 Franklin Street Boston, MA 02110 Trustee (since 1994) | | Cable television producer and website designer; The Editor, Scientific American from 1984 to 1994; Vice President, Scientific American, Inc., from 1984 to 1994; Member, Advisory Board, Stone Age Institute, Bloomington, Indiana (research institute that explores the effect of technology on human evolution); Member, Board of Directors of the National Institute of Social Sciences, New York City; Member, Board of Trustees of the William Alanson White Institute, New York City (institution for training psychoanalysts); and Member, Advisory Board, Mount Sinai Children’s Environmental Health Center, New York. Oversees 46; None |
| |
| Patrick J. Simpson (born 1944) | | |
c/o Columbia Management Investment Advisers, LLC 225 Franklin Street Boston, MA 02110 Trustee (since 2000) | | Partner, Perkins Coie LLP (law firm). Oversees 46; None |
| |
| Anne-Lee Verville (born 1945) | | |
c/o Columbia Management Investment Advisers, LLC 225 Franklin Street Boston, MA 02110 Trustee (since 1998) | | Retired since 1997 (formerly General Manager–Global Education Industry from 1994 to 1997, President–Application Systems Division from 1991 to 1994, Chief Financial Officer–US Marketing & Services from 1988 to 1991, and Chief Information Officer from 1987 to 1988, IBM Corporation (computer and technology)). Oversees 46; Enesco Group, Inc. (producer of giftware and home and garden decor products) from 2001 to 2006 |
33
Fund Governance (continued)
Interested Trustee
| | |
Name, Address and Year of Birth,
Position with Funds, Year First
Elected or Appointed to Office | | Principal Occupation(s) During Past Five Years, Number of Funds in Columbia Funds
Complex Overseen by Trustee, Other Directorships Held |
| |
| Michael A. Jones (born 1959) | | |
c/o Columbia Management
Investment Advisers, LLC 225 Franklin Street Boston, MA 02110 Trustee (since 2011) Senior Vice President (since 2010) | | President and Director, Columbia Management Investment Advisers, LLC since May 2010; President and Director, Columbia Management Investment Distributors, Inc. since May 2010; Manager, Chairman, Chief Executive Officer and President, Columbia Management Advisors, LLC from 2007 to April 2010; Chief Executive Officer, President and Director, Columbia Management Distributors, Inc. from November 2006 to April 2010; previously, co-president and senior managing director at Robeco Investment Management. Oversees 46; None |
The Statement of Additional Information includes additional information about the Trustees of the Funds and is available, without charge, upon request by calling 1-800-345-6611.
34
Fund Governance (continued)
Officers
| | |
| Name, Year of Birth and Address | | Principal Occupation(s) During the Past Five Years |
|
| J. Kevin Connaughton (born 1964) |
225 Franklin Street Boston, MA 02110 President (since 2009) | | Senior Vice President and General Manager–Mutual Fund Products, Columbia Management Investment Advisers, LLC since May 2010; President, Columbia Funds, since 2009, and RiverSource Funds, since May 2010 (previously Senior Vice President and Chief Financial Officer, Columbia Funds, from June 2008 to January 2009, Treasurer, Columbia Funds, from October 2003 to May 2008, and senior officer of various other affiliated funds since 2000); Managing Director, Columbia Management Advisors, LLC from December 2004 to April 2010. |
| |
| Michael G. Clarke (born 1969) | | |
225 Franklin Street Boston, MA 02110 Treasurer (since 2011) and Chief Financial Officer (since 2009) | | Vice President, Columbia Management Investment Advisers, LLC since May 2010; Managing Director of Fund Administration, Columbia Management Advisors, LLC, from September 2004 to April 2010; senior officer of Columbia Funds and affiliated funds since 2002. |
| |
| Scott R. Plummer (born 1959) | | |
5228 Ameriprise Financial Center Minneapolis, MN 55474 Senior Vice President, Secretary and Chief Legal Officer (since 2010) | | Chief Legal Officer and Assistant Secretary, Columbia Management Investment Advisers, LLC since June 2005; Vice President and Lead Chief Counsel–Asset Management, Ameriprise Financial, Inc. since May 2010 (previously Vice President and Chief Counsel–Asset Management, from 2005 to April 2010, and Vice President–Asset Management Compliance from 2004 to 2005); Vice President, Chief Counsel and Assistant Secretary, Columbia Management Investment Distributors, Inc. since 2008; Vice President, General Counsel and Secretary, Ameriprise Certificate Company since 2005; Chief Counsel, RiverSource Distributors, Inc. since 2006; Vice President, General Counsel and Secretary, RiverSource Funds, since December 2006; Senior Vice President, Secretary and Chief Legal Officer, Columbia Funds, since May 2010. |
| |
| Linda J. Wondrack (born 1964) | | |
225 Franklin Street Boston, MA 02110 Senior Vice President and Chief Compliance Officer (since 2007) | | Vice President and Chief Compliance Officer, Columbia Management Investment Advisers, LLC since May 2010; Chief Compliance Officer, Columbia Funds, since 2007, and RiverSource Funds, since May 2010; Director (Columbia Management Group, LLC and Investment Product Group Compliance), Bank of America, from June 2005 to April 2010; Director of Corporate Compliance and Conflicts Officer of MFS Investment Management (investment management) from August 2004 to May 2005. |
| |
| William F. Truscott (born 1960) | | |
53600 Ameriprise Financial Center Minneapolis, MN 55474 Senior Vice President (since 2010) | | Chairman of the Board, Columbia Management Investment Advisers, LLC since May 2010 (previously President, Chairman of the Board and Chief Investment Officer, from 2001 to April 2010); Chief Executive Officer, U.S. Asset Management & President, Annuities, Ameriprise Financial, Inc. since May 2010 (previously President–U.S. Asset Management and Chief Investment Officer from 2005 to April 2010, and Senior Vice President–Chief Investment Officer, from 2001 to 2005); Director, President and Chief Executive Officer, Ameriprise Certificate Company since 2006; Director, Columbia Management Investment Distributors, Inc. since May 2010 (previously Chairman of the Board and Chief Executive Officer from 2008 to April 2010); Chairman of the Board and Chief Executive Officer, RiverSource Distributors, Inc. since 2006. |
35
Fund Governance (continued)
Officers (continued)
| | |
| Name, Year of Birth and Address | | Principal Occupation(s) During the Past Five Years |
|
| Colin Moore (born 1958) |
225 Franklin Street Boston, MA 02110 Senior Vice President (since 2010) | | Director and Chief Investment Officer, Columbia Management Investment Advisers, LLC since May 2010; Manager, Managing Director and Chief Investment Officer of Columbia Management Advisors, LLC from 2007 to April 2010; Head of Equities, Columbia Management Advisors, LLC from 2002 to 2007. |
| |
| Amy Johnson (born 1965) | | |
5228 Ameriprise Financial Center Minneapolis, MN 55474 Vice President (since 2010) | | Senior Vice President and Chief Operating Officer, Columbia Management Investment Advisers, LLC since May 2010 (previously Chief Administrative Officer, from 2009 until April 2010, Vice President–Asset Management and Trust Company Services, from 2006 to 2009, and Vice President–Operations and Compliance from 2004 to 2006). |
| |
| Joseph F. DiMaria (born 1968) | | |
225 Franklin Street Boston, MA 02110 Vice President (since 2011) and Chief Accounting Officer (since 2008) | | Vice President, Mutual Fund Administration, Columbia Management Investment Advisers, LLC, since May 2010; Director of Fund Administration, Columbia Management Advisors, LLC from January 2006 to April 2010; Head of Tax/Compliance and Assistant Treasurer, Columbia Management Advisors, LLC, from November 2004 to December 2005. |
| |
| Stephen T. Welsh (born 1957) | | |
225 Franklin Street Boston, MA 02110 Vice President (since 2006) | | President and Director, Columbia Management Investment Services Corp. since May 2010; President and Director, Columbia Management Services, Inc. from July 2004 to April 2010; Managing Director, Columbia Management Distributors, Inc. from August 2007 to April 2010. |
| |
| Paul D. Pearson (born 1956) | | |
5228 Ameriprise Financial Center Minneapolis, MN 55474 Vice President and Assistant Treasurer (since 2011) | | Vice President, Investment Accounting, Columbia Management Investment Advisers, LLC, since May 2010; Vice President, Managed Assets, Investment Accounting, Ameriprise Financial Corporation. |
| |
| Paul B. Goucher (born 1968) | | |
5228 Ameriprise Financial Center Minneapolis, MN 55474 Vice President and Assistant Treasurer (since 2010) | | Vice President and Chief Counsel of Ameriprise Financial since January 2010 (formerly Vice President and Group Counsel from November 2008 to January 2010); Director, Managing Director and General Counsel of J. & W. Seligman & Co. Incorporated (Seligman) from July 2008 to November 2008 and Managing Director and Associate General Counsel of Seligman from January 2005 to July 2008. |
| |
| Christopher O. Petersen (born 1970) | | |
5228 Ameriprise Financial Center Minneapolis, MN 55474 Vice President and Assistant Treasurer (since 2010) | | Vice President and Chief Counsel, Ameriprise Financial since January 2010 (formerly Vice President and Group Counsel or Counsel from April 2004 to January 2010); Assistant Secretary of RiverSource Funds since January 2007. |
| |
| Michael E. DeFao (born 1968) | | |
5228 Ameriprise Financial Center Minneapolis, MN 55474 Vice President and Assistant Treasurer (since 2011) | | Vice President and Chief Counsel, Ameriprise Financial since May 2010; Associate General Counsel Bank of America from June 2005 to April 2010. |
36
Shareholder Meeting Results
At a Joint Special Meeting of Shareholders held on February 15, 2011, shareholders of the Fund considered a proposal to approve a proposed amendment to the Investment Management Services Agreement with Columbia Management Investment Advisers, LLC. The proposal was approved as follows:
| | | | | | |
| | | | | | | |
| Votes For | | Votes Against | | Abstentions | | Broker Non-Votes |
| 253,384,921 | | 8,642,723 | | 4,285,787 | | 0 |
37
[THIS PAGE INTENTIONALLY LEFT BLANK]
38
[THIS PAGE INTENTIONALLY LEFT BLANK]
39
[THIS PAGE INTENTIONALLY LEFT BLANK]
40
Important Information About This Report
The fund mails one shareholder report to each shareholder address. If you would like more than one report, please call shareholder services at 1-800-345-6611 and additional reports will be sent to you. This report has been prepared for shareholders of Columbia Emerging Markets Fund.
A description of the policies and procedures that the fund uses to determine how to vote proxies and a copy of the fund’s voting records are available (i) at www.columbiamanagement.com, (ii) on the Securities and Exchange Commission’s website at www.sec.gov, and (iii) without charge, upon request, by calling 1-800-368-0346. Information regarding how the fund voted proxies relating to portfolio securities during the 12-month period ended June 30 is available from the SEC’s website. Information regarding how the fund voted proxies relating to portfolio securities is also available from the fund’s website, www.columbiamanagement.com.
The fund files a complete schedule of portfolio holdings with the SEC for the first and third quarters of each fiscal year on Form N-Q. The fund’s Form N-Q is available on the SEC’s website at www.sec.gov and may be reviewed and copied at the SEC’s Public Reference Room in Washington, D.C. Information on the operation of the Public Reference Room may be obtained by calling
1-800-SEC-0330.
Transfer Agent
Columbia Management Investment Services Corp.
P.O. Box 8081
Boston, MA 02266-8081
1-800-345-6611
Distributor
Columbia Management Investment
Distributors, Inc.
225 Franklin Street
Boston, MA 02110
Investment Manager
Columbia Management Investment Advisers, LLC
225 Franklin Street
Boston, MA 02110
41

Columbia Emerging Markets Fund
P.O. Box 8081
Boston, MA 02266-8081
columbiamanagement.com
This information is for use with concurrent or prior delivery of a fund prospectus. Investors should consider the investment objectives, risks, charges and expenses of a mutual fund carefully before investing. For a free prospectus, which contains this and other important information about the funds, visit columbiamanagement.com. Read the prospectus carefully before investing. The Fund is distributed by Columbia Management Investment Distributors, Inc., member FINRA, and managed by Columbia Management Investment Advisers, LLC.
©2011 Columbia Management Investment Advisers, LLC. All rights reserved.
C-1136 A (05/11)

Columbia Energy and Natural Resources Fund
Annual Report for the Period Ended March 31, 2011
Table of Contents
The views expressed in this report reflect the current views of the respective parties. These views are not guarantees of future performance and involve certain risks, uncertainties and assumptions that are difficult to predict, so actual outcomes and results may differ significantly from the views expressed. These views are subject to change at any time based upon economic, market or other conditions and the respective parties disclaim any responsibility to update such views. These views may not be relied on as investment advice and, because investment decisions for a Columbia Fund are based on numerous factors, may not be relied on as an indication of trading intent on behalf of any particular Columbia Fund. References to specific securities should not be construed as a recommendation or investment advice.
President’s Message

Dear Shareholder:
The Columbia Management story began over 100 years ago, and today, we are one of the nation’s largest dedicated asset managers. The recent acquisition by Ameriprise Financial, Inc. brings together the talents, resources and capabilities of Columbia Management with those of RiverSource Investments, Threadneedle (acquired by Ameriprise in 2003) and Seligman Investments (acquired by Ameriprise in 2008) to build a best-in-class asset management business that we believe is truly greater than its parts.
RiverSource Investments traces its roots to 1894 when its then newly-founded predecessor, Investors Syndicate, offered a face-amount savings certificate that gave small investors the opportunity to build a safe and secure fund for retirement, education or other special needs. A mutual fund pioneer, Investors Syndicate launched Investors Mutual Fund in 1940. In the decades that followed, its mutual fund products and services lineup grew to include a full spectrum of styles and specialties. More than 110 years later, RiverSource continues to be a trusted financial products leader.
Threadneedle, a leader in global asset management and one of Europe’s largest asset managers, offers sophisticated international experience from a dedicated U.K. management team. Headquartered in London, it is named for Threadneedle Street in the heart of the city’s financial district, where British investors pioneered international and global investing. Threadneedle was acquired in 2003 and today operates as an affiliate of Columbia Management.
Seligman Investments’ beginnings date back to the establishment of the investment firm J. & W. Seligman & Co. in 1864. In the years that followed, Seligman played a major role in the geographical expansion and industrial development of the United States. In 1874, President Ulysses S. Grant named Seligman as fiscal agent for the U.S. Navy — an appointment that would last through World War I. Seligman helped finance the westward path of the railroads and the building of the Panama Canal. The firm organized its first investment company in 1929 and began managing its first mutual fund in 1930. In 2008, J. & W. Seligman & Co. Incorporated was acquired and Seligman Investments became an offering brand of RiverSource Investments, LLC.
We are proud of the rich and distinctive history of these firms, the strength and breadth of products and services they offer, and the combined cultures of pioneering spirit and forward thinking. Together we are committed to providing more for our shareholders than ever before.
| n | | A singular focus on our shareholders. Our business is asset management, so investors are our first priority. We dedicate our resources to identifying timely investment opportunities and provide a comprehensive choice of equity, fixed-income and alternative investments to help meet your individual needs. |
| n | | First-class research and thought leadership. We are dedicated to helping you take advantage of today’s opportunities and anticipate tomorrow’s. We stay abreast of the latest investment trends and ideas, using our collective insight to evaluate events and transform them into solutions you can use. |
| n | | A disciplined investment approach. We aren’t distracted by passing fads. Our teams adhere to a rigorous investment process that helps ensure the integrity of our products and enables you and your financial advisor to match our solutions to your objectives with confidence. |
When you choose Columbia Management, you can be confident that we will take the time to understand your needs and help you and your financial advisor identify the solutions that are right for you. Because at Columbia Management, we don’t consider ourselves successful unless you are.
Sincerely,

J. Kevin Connaughton
President, Columbia Funds
Investors should consider the investment objectives, risks, charges and expenses of a mutual fund carefully before investing. For a free prospectus, which contains this and other important information about the funds, visit www.columbiamanagement.com. The prospectus should be read carefully before investing.
Columbia Funds are distributed by Columbia Management Investment Distributors, Inc., member FINRA, and managed by Columbia Management Investment Advisers, LLC.
© 2011 Columbia Management Investment Advisers, LLC. All rights reserved.
Fund Profile – Columbia Energy and Natural Resources Fund
Performance data quoted represents past performance and current performance may be lower or higher. Past performance is no guarantee of future results. The investment return and principal value will fluctuate so that shares, when redeemed, may be worth more or less than the original cost. Please visit www.columbiamanagement.com for daily and most recent month-end performance updates.
Summary
1-year return as of 03/31/11
| | |
| |
 | | +27.20% Class A shares
(without sales charge) |
| |
| | +39.02% S&P North American Natural Resources Sector Index |
|
Morningstar Style BoxTM |
|
Equity Style |
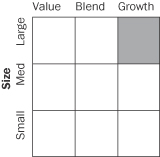
|
The Morningstar Style BoxTM is based on the fund’s portfolio holdings. For equity funds, the vertical axis shows the market capitalization of the stocks owned, and the horizontal axis shows investment style (value, blend, or growth). Information shown is based on the most recent data provided by Morningstar.
© 2011 Morningstar, Inc. All rights reserved. The Morningstar information contained herein: (1) is proprietary to Morningstar and/or its content providers; (2) may not be copied or distributed; and (3) is not warranted to be accurate, complete or timely. Neither Morningstar nor its content providers are responsible for any damages or losses arising from any use of this information.
Summary
| n | | For the 12-month period that ended March 31, 2011, the fund’s Class A shares returned 27.20% without sales charge. |
| n | | The S&P North American Natural Resources Sector Index1 returned 39.02%. The average return of funds in its peer group, the Lipper Natural Resources Funds Classification2, was 36.30%. |
| n | | The fund shared in the strong returns generated by a booming energy sector. An overweight in natural resources stocks early in the period detracted from the fund’s overall return. |
Portfolio Management
Michael E. Hoover has managed the fund since 2010. From 1989 until joining the Investment Manager in May 2010, Mr. Hoover was associated with the fund’s previous investment adviser as an investment professional.
| 1 | The Standard & Poor’s (S&P) North American Natural Resources Sector Index is a modified market capitalization-weighted equity index designed as a benchmark for U.S. traded securities in the natural resources sector. The index includes companies involved in the following categories: extractive industries, energy companies, owners and operators of timber tracts, forestry services, producers of pulp and paper and owners of plantations. |
| 2 | Lipper Inc., a widely respected data provider in the industry, calculates an average total return (assuming reinvestment of distributions) for mutual funds with investment objectives similar to those of the fund. Lipper makes no adjustment for the effect of sales loads. |
Indices are not available for investment, are not professionally managed and do not reflect sales charges, fees, brokerage commissions, taxes or other expenses of investing. Securities in the fund may not match those in an index.
1
Economic Update – Columbia Energy and Natural Resources Fund
Summary
For the 12-month period that ended March 31, 2011
| | n | | The U.S. stock market, as measured by the S&P 500 Index, delivered solid returns, despite a summer 2010 correction. Foreign stock market returns were also positive, as measured by the MSCI EAFE Index (Net). | |
| | |
| S&P Index | | MSCI Index |
| |

| |
|
15.65% | | 10.42% |
| | n | | Strengthening economic growth and rising interest rates kept a lid on most bond market sectors. The Barclays Capital Aggregate Bond Index delivered modest results. However, high-yield bonds were strong performers, as measured by the JPMorgan Developed BB High Yield Index. | |
| | |
| Barclays Aggregate Index | | JPMorgan Index |
| |
| |
|
5.12% | | 13.04% |
The U.S. economy continued to expand at a solid but uneven pace over the past 12 months, as measured by gross domestic product (GDP). Although lackluster second quarter 2010 GDP growth raised fears that the economy was losing steam and might lapse back into recession, the pace picked up in the third quarter of 2010, inspiring confidence among consumers, businesses and investors. GDP expanded by 2.6% in the third quarter and 3.1% in the fourth quarter. With the Federal Reserve Board (the Fed) providing additional monetary stimulus to shore up economic growth and the extension of key tax cuts for the next two years, expectations are for continued growth in 2011. However, early estimates of first quarter 2011 growth place it just under 2.0%, a disappointment after two strong quarters and a pick-up in employment.
Consumer spending on cars, clothing and other goods generally trended higher during the 12-month period, accelerating in the fourth quarter of 2010. Holiday spending rose 5.5% between November 5, 2010 and December 24, 2010, in all retail categories, excluding automobiles, compared with the same period in 2009, according to MasterCard Advisors’ SpendingPulse, which tracks spending on all transactions including cash. Personal income surged in January 2011, as payroll tax cuts kicked in. The personal savings rate edged higher, ending February 2011, the last month for which data was available, at 5.8%.
News on the job front was increasingly positive. A good portion of the jobs added in March, April and May of 2010 were temporary, government-sponsored census positions, which began to unwind in June, July and August 2010. However, private sector payroll employment began to trend higher in the third quarter, massive layoffs declined and job growth turned solidly positive, with the addition of 444,000 new jobs in the first quarter of 2011.
Despite some glimmers of improvement early in 2010, the housing market remained troublesome throughout the period. Both new and existing home sales fell after a federal tax credit for new and repeat homebuyers expired. Distressed properties pressured prices and foreclosures continued — another drag on prices. The inventory of unsold homes ended the period higher than it started, at 8.9 and 8.6 months for new and existing homes, respectively, according to the National Association of Realtors and a joint release from the U.S. Census Bureau and the U.S. Department of Housing and Urban Development. The new year brought more disappointing news: Existing home sales fell in January 2011 after three months of sustained improvement. Tight credit and weak appraisals were cited as possible reasons for the decline.
Reports from the business side of the economy were generally positive. A key measure of the nation’s manufacturing situation — the Institute for Supply Management’s Index — took a somewhat surprising turn higher in the final months of the period. Technology spending rose 12% in 2010, according to the NPD Group, a national marketing research firm. Purchases of computers, networking and software returned to prerecession levels. Industrial production rose over the period, and manufacturing capacity utilized, per the report issued by the Fed — a key measure of the health of the manufacturing sector — edged higher.
2
Economic Update (continued) – Columbia Energy and Natural Resources Fund
Stocks moved higher despite summer 2010 decline
Against a strengthening economic backdrop, stock prices continued to rally despite a summer 2010 setback linked to a debt crisis brewing in Europe, which raised concerns among U.S. investors. These fears were short-lived and stocks regained their footing. In this environment, the S&P 500 Index1 returned 15.65% for the 12 months through March 31, 2011. Outside the United States, stock markets also delivered solid gains. The MSCI EAFE Index (Net)2, a broad gauge of stock market performance in foreign developed markets, returned 10.42% (in U.S. dollars) for the 12-month period, as concerns about the impact of a bailout for weak euro zone economies eased yet continued to restrain market performance. Emerging stock markets were strong. The MSCI Emerging Markets Index (Net)3 returned 18.46% (in U.S. dollars) for the 12-month period.
Bonds delivered modest returns
As the economy strengthened and interest rates edged higher, most bond sectors delivered modest returns. The Barclays Capital Aggregate Bond Index4 returned 5.12%. High-yield bonds led the fixed-income markets. For the 12 months covered by this report, the JPMorgan Developed BB High Yield Index5 returned 13.04% as default fears abated and investors grew more comfortable with risk. Despite rising yields in the second half of the period, the Treasury market was also positive. The Barclays Capital U.S. Treasury Index6 returned 4.53%. However, municipal bonds struggled in the second half of the period, as interest rates inched higher and issue supply surged ahead of the year-end expiration of the Build America Bonds program. The Barclays Capital Municipal Bond Index7 gained 1.63% for the period. Despite positive economic activity, the Fed kept a key short-term interest rate — the federal funds rate — close to zero, reflecting ongoing concerns about employment and the housing market.
Past performance is no guarantee of future results.
| 1 | The Standard & Poor’s (S&P) 500 Index tracks the performance of 500 widely held, large-capitalization U.S. stocks. |
| 2 | The Morgan Stanley Capital International Europe, Australasia, Far East (MSCI EAFE) Index (Net) is a free float- adjusted market capitalization index that is designed to measure the equity market performance of developed markets, excluding the U.S. & Canada. As of December 31, 2010, the MSCI EAFE Index (Net) consisted of the following 22 developed market country indices: Australia, Austria, Belgium, Denmark, Finland, France, Germany, Greece, Hong Kong, Ireland, Israel, Italy, Japan, the Netherlands, New Zealand, Norway, Portugal, Singapore, Spain, Sweden, Switzerland and the United Kingdom. |
| 3 | The Morgan Stanley Capital International Emerging Markets (MSCI EM) Index (Net) is a free float-adjusted market capitalization index that is designed to measure equity market performance of emerging markets. As of December 31, 2010, the MSCI EM Index (Net) consisted of the following 21 emerging market country indices: Brazil, Chile, China, Colombia, Czech Republic, Egypt, Hungary, India, Indonesia, Korea, Malaysia, Mexico, Morocco, Peru, Philippines, Poland, Russia, South Africa, Taiwan, Thailand and Turkey. |
| 4 | The Barclays Capital Aggregate Bond Index is a market value-weighted index that tracks the daily price, coupon, pay-downs and total return performance of fixed-rate, publicly placed, dollar-denominated and non-convertible investment grade debt issues with at least $250 million par amount outstanding and with at least one year to final maturity. |
| 5 | The JPMorgan Developed BB High Yield Index is an unmanaged index designed to mirror the investable universe of the U.S. dollar developed, BB-rated, high yield corporate debt market. |
| 6 | The Barclays Capital U.S. Treasury Index includes public obligations of the U.S. Treasury. Treasury bills are excluded by the maturity constraint. In addition, certain special issues, such as state and local government series bonds (SLGs), as well as U.S. Treasury TIPS, are excluded. STRIPS are excluded from the index because their inclusion would result in double-counting. |
| 7 | The Barclays Capital Municipal Bond Index is considered representative of the broad market for investment-grade, tax-exempt bonds with a maturity of at least one year. |
Indices are not available for investment, are not professionally managed and do not reflect sales charges, fees, brokerage commissions, taxes or other expenses of investing. Securities in the fund may not match those in an index.
3
Performance Information – Columbia Energy and Natural Resources Fund
Performance data quoted represents past performance and current performance may be lower or higher. Past performance is no guarantee of future results. The investment return and principal value will fluctuate so that shares, when redeemed, may be worth more or less than the original cost. Please visit www.columbiamanagement.com for daily and most recent month-end performance updates.
| | | | |
| Net asset value per share | |
| |
as of 03/31/11 ($) | | | | |
Class A | | | 25.57 | |
Class B | | | 24.96 | |
Class C | | | 24.96 | |
Class I | | | 25.70 | |
Class R | | | 25.56 | |
Class R4 | | | 25.67 | |
Class Z | | | 25.67 | |
| | | | |
| Distributions declared per share | |
| |
04/01/10 – 03/31/11 ($) | | | | |
Class A | | | 0.01 | |
Class I | | | 0.03 | |
Class R4 | | | 0.02 | |
Class Z | | | 0.04 | |
|
| Performance of a $10,000 investment 04/01/01 – 03/31/11 |
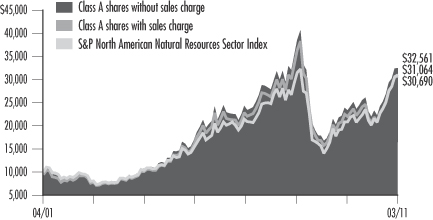
The chart above shows the change in value of a hypothetical $10,000 investment in Class A shares of Columbia Energy and Natural Resources Fund during the stated time period, and does not reflect the deduction of taxes that a shareholder may pay on fund distributions or on the redemption of fund shares.
| | | | | | | | |
| Performance of a $10,000 investment 04/01/01 – 03/31/11 ($) | |
| Sales charge | | without | | | with | |
Class A | | | 32,561 | | | | 30,690 | |
Class B | | | n/a | | | | n/a | |
Class C | | | 31,756 | | | | 31,756 | |
Class I | | | n/a | | | | n/a | |
Class R | | | n/a | | | | n/a | |
Class R4 | | | n/a | | | | n/a | |
Class Z | | | 32,805 | | | | n/a | |
| | | | | | | | | | | | | | | | | | | | | | | | | | | | | | | | | | | | |
| Average annual total return as of 03/31/11 (%) | |
| Share class | | A | | | B | | | C | | | I | | | R | | | R4 | | | Z | |
| Inception | | 09/28/07 | | | 03/07/11 | | | 09/28/07 | | | 09/27/10 | | | 09/27/10 | | | 03/07/11 | | | 12/31/92 | |
| Sales charge | | without | | | with | | | without | | | without | | | with | | | without | | | without | | | without | | | without | |
1-year | | | 27.20 | | | | 19.86 | | | | n/a | | | | 26.19 | | | | 25.19 | | | | n/a | | | | n/a | | | | n/a | | | | 27.47 | |
5-year | | | 7.41 | | | | 6.14 | | | | n/a | | | | 6.87 | | | | 6.87 | | | | n/a | | | | n/a | | | | n/a | | | | 7.57 | |
10-year/Life | | | 12.53 | | | | 11.87 | | | | 0.77 | | | | 12.25 | | | | 12.25 | | | | 36.74 | | | | 36.25 | | | | 0.82 | | | | 12.61 | |
The “with sales charge” returns include the maximum initial sales charge of 5.75% for Class A shares and the applicable contingent deferred sales charge of 1.00% for Class C shares for the first year only. The “without sales charge” returns do not include the effect of sales charges. If they had, returns would be lower.
The Fund commenced operations on March 31, 2008. The returns of the Class A and Class C shares shown for periods prior to March 31, 2008 include the returns of Class A shares or Class C shares, as applicable, of Energy and Natural Resources Fund, the predecessor to the Fund and a series of Excelsior Funds, Inc. (the “Predecessor Fund”), for periods after September 27, 2007, and include the returns of Shares class shares of the Predecessor Fund for periods prior to September 28, 2007. The returns shown reflect applicable sales charges, but have not been adjusted to reflect differences in expenses. If differences in expenses were reflected, the returns shown for the periods prior to September 28, 2007 would be lower. The returns of the Class Z shares shown for periods prior to March 31, 2008 are those of Shares class shares of the Predecessor Fund. The returns of Class Z shares shown have not been adjusted to reflect differences in expenses.
Class I and Class R shares were initially offered by the fund on September 27, 2010.
Class B and Class R4 shares were initially offered by the fund on March 7, 2011.
Inception date refers to the date on which the Predecessor Fund class commenced operations for Class A, Class C and Class Z shares and the date on which the fund class commenced operations for Class B, Class I, Class R and Class R4 shares.
Performance results reflect any fee waivers or reimbursements of fund expenses by the Investment Manager and/or any of its affiliates. Absent these fee waivers or expense reimbursement arrangements, performance results would have been lower.
All results shown assume the reinvestment of distributions. Class I, Class R4 and Class Z shares are sold at net asset value with no distribution and service (Rule 12b-1) fees. Class R shares are sold at net asset value with a distribution (Rule 12b-1) fee. Class I, Class R, Class R4 and Class Z shares have limited eligibility and the investment minimum requirements may vary. Please see the fund’s prospectus for details. Performance for different share classes will vary based on differences in sales charges and fees associated with each class.
The tables do not reflect the deduction of taxes that a shareholder may pay on fund distributions or on the redemption of fund shares.
4
Understanding Your Expenses – Columbia Energy and Natural Resources Fund
As a fund shareholder, you incur two types of costs. There are transaction costs and ongoing costs, which generally include investment advisory fees, distribution and service (Rule 12b-1) fees and other fund expenses. The information on this page is intended to help you understand the ongoing costs of investing in the fund and to compare these costs with the ongoing costs of investing in other mutual funds.
Analyzing your fund’s expenses by share class
To illustrate these ongoing costs, we have provided an example and calculated the expenses paid by investors in each share class during the period. The information in the following table is based on an initial investment of $1,000, which is invested at the beginning of the period and held for the entire period. Expense information is calculated two ways and each method provides you with different information. The amount listed in the “Actual” column is calculated using the fund’s actual operating expenses and total return for the period. The amount listed in the “Hypothetical” column for each share class assumes that the return each year is 5% before expenses and is calculated based on the fund’s actual operating expenses. You should not use the hypothetical account values and expenses to estimate either your actual account balance at the end of the period or the expenses you paid during this period.
Compare with other funds
Since all mutual funds are required to include the same hypothetical calculations about expenses in shareholder reports, you can use this information to compare the ongoing costs of investing in the fund with other funds. To do so, compare the 5% hypothetical example with the 5% hypothetical examples that appear in the shareholder reports of other funds. As you compare hypothetical examples of other funds, it is important to note that hypothetical examples are meant to highlight the ongoing costs of investing in a fund and do not reflect any transaction costs, such as sales charges, redemption fees or exchange fees.
Estimating your actual expenses
To estimate the expenses that you paid over the period, first you will need your account balance at the end of the period:
| | n | | For shareholders who receive their account statements from Columbia Management Investment Services Corp., your account balance is available online at www.columbiamanagement.com or by calling Shareholder Services at 800.345.6611. | |
| | n | | For shareholders who receive their account statements from their financial intermediary, contact your financial intermediary to obtain your account balance. | |
| | 1. | Divide your ending account balance by $1,000. For example, if an account balance was $8,600 at the end of the period, the result would be 8.6. | |
| | 2. | In the section of the table below titled “Expenses paid during the period,” locate the amount for your share class. You will find this number in the column labeled “Actual.” Multiply this number by the result from step 1. Your answer is an estimate of the expenses you paid on your account during the period. | |
If the value of your account falls below the minimum initial investment requirement applicable to you, your account may be subject to a $20 annual fee. This fee is not included in the accompanying table. If you are subject to the fee, keep it in mind when you are estimating the ongoing expenses of investing in the fund and when comparing the expenses of this fund with other funds.
| | | | | | | | | | | | | | | | | | | | | | | | | | | | |
10/01/10 – 03/31/11 | | | | | | | | | | | | | | | | |
| | | Account value at the
beginning of the period ($) | | | Account value at the end of the period ($) | | | Expenses paid
during the period ($) | | | Fund’s annualized
expense ratio (%) | |
| | | Actual | | | Hypothetical | | | Actual | | | Hypothetical | | | Actual | | | Hypothetical | | | Actual | |
Class A | | | 1,000.00 | | | | 1,000.00 | | | | 1,343.40 | | | | 1,018.45 | | | | 7.60 | | | | 6.54 | | | | 1.30 | |
Class B | | | 1,000.00 | | | | 1,000.00 | | | | 1,008.10 | * | | | 1,013.96 | | | | 1.51 | * | | | 11.05 | | | | 2.20 | |
Class C | | | 1,000.00 | | | | 1,000.00 | | | | 1,338.30 | | | | 1,014.86 | | | | 11.78 | | | | 10.15 | | | | 2.02 | |
Class I | | | 1,000.00 | | | | 1,000.00 | | | | 1,346.70 | | | | 1,020.69 | | | | 4.97 | | | | 4.28 | | | | 0.85 | |
Class R | | | 1,000.00 | | | | 1,000.00 | | | | 1,341.70 | | | | 1,016.95 | | | | 9.34 | | | | 8.05 | | | | 1.60 | |
Class R4 | | | 1,000.00 | | | | 1,000.00 | | | | 1,008.50 | * | | | 1,018.65 | | | | 0.87 | * | | | 6.34 | | | | 1.26 | |
Class Z | | | 1,000.00 | | | | 1,000.00 | | | | 1,344.50 | | | | 1,019.70 | | | | 6.14 | | | | 5.29 | | | | 1.05 | |
Expenses paid during the period are equal to the annualized expense ratio for the share class, multiplied by the average account value over the period, then multiplied by the number of days in the fund’s most recent fiscal half-year and divided by 365.
It is important to note that the expense amounts shown in the table are meant to highlight only ongoing costs of investing in the fund and do not reflect any transaction costs, such as sales charges, redemption fees or exchange fees. Therefore, the hypothetical examples provided may not help you determine the relative total costs of owning shares of different funds. If these transaction costs were included, your costs would have been higher.
| * | For the period March 7, 2011 through March 31, 2011. Class B and Class R4 shares commenced operations on March 7, 2011. |
5
Portfolio Manager’s Report – Columbia Energy and Natural Resources Fund
Performance data quoted represents past performance and current performance may be lower or higher. Past performance is no guarantee of future results. The investment return and principal value will fluctuate so that shares, when redeemed, may be worth more or less than the original cost. Please visit www.columbiamanagement.com for daily and most recent month-end performance updates.
| | | | |
| Top 10 holdings | | | |
| |
as of 03/31/11 (%) | | | | |
Chevron | | | 8.2 | |
ConocoPhillips | | | 6.1 | |
Exxon Mobil | | | 4.6 | |
Schlumberger | | | 4.1 | |
Suncor Energy | | | 4.1 | |
Barrick Gold | | | 2.8 | |
Canadian Natural Resources | | | 2.4 | |
Halliburton | | | 2.2 | |
Freeport-McMoRan Copper & Gold | | | 2.0 | |
Anadarko Petroleum | | | 1.8 | |
| | | | |
| Top sectors | | | |
| |
as of 03/31/11 (%) | | | | |
Energy | | | 76.2 | |
Materials | | | 21.7 | |
Industrials | | | 0.9 | |
Financials | | | 0.3 | |
This fund is actively managed and the composition of its portfolio will change over time. Information provided is calculated as a percentage of net assets.
For the 12-month period that ended March 31, 2011, the fund’s Class A shares returned 27.20% without sales charge. The S&P North American Natural Resources Sector Index returned 39.02% for the same period. The average return of funds in its peer group, the Lipper Natural Resources Funds Classification, was 36.30% for the 12-month period. While the fund generated a substantial return for the period, it trailed its benchmark because it had more exposure to natural resources stocks early in the period, and their returns did not match the returns of other industry groups in the benchmark.
Early positioning held back results
The fund had more exposure to natural resources stocks early in the period when the group struggled because of concerns that tighter monetary policies in China might choke off demand for copper, iron ore and other metals. While resource-related equities went on to post solid results, the early emphasis hurt the fund’s relative performance for the 12 months. A decision to establish a position in Transocean (1.3% of net assets), the drilling company that operated the well that exploded in the Gulf of Mexico — and not included in the fund’s benchmark — also detracted from returns. We thought the company was a bargain, but Transocean’s share price continued to decline because of uncertainties about the future of offshore drilling. We sold the stock and bought it back after it was added to the S&P benchmark early in 2011. However, we missed much of its subsequent rebound.
Oil-related stocks surged
Most oil-related stocks produced very strong results as world oil prices shot up by 30% over the period, propelled both by rising global demand and by supply uncertainties arising from political turmoil in the Middle East and North Africa. Natural gas-related stocks lagged oil-related stocks as growth in supply outstripped demand and natural gas prices remained well below previous highs. In this environment, the fund’s investments in smaller integrated oil companies helped boost fund performance. We owned more of Murphy Oil, Hess and Imperial Oil (1.0%, 1.5% and 0.6% of net assets, respectively) than the benchmark, which aided performance. However, the positive impact of these stocks was somewhat offset because we had less exposure than the index to several major integrated oil companies, including Exxon Mobil and Chevron (4.6% and 8.2% of net assets, respectively), which did well during the period. The fund’s overweights in small-cap oil producers helped results relative to the benchmark, with notable contributions from Brigham Exploration, Concho Resources, Whiting Petroleum and Northern Oil and Gas (0.8%, 1.1%, 1.3% and 0.4% of net assets, respectively). Results were hampered by lack of exposure to a gas producer that was included in the index and whose shares gained after it re-focused on oil.
Portfolio repositioned as period progressed
After sector positioning detracted from performance early, we adjusted the fund’s sector weights to be in more in line with the S&P benchmark and to help preserve capital during volatile periods. We raised exposure to major oil companies from 12% to 27% of net assets, while reducing natural resources from 41% of net assets to 26% and cutting investments in independent oil and gas producers from 28% to 24% of net assets.
6
Portfolio Manager’s Report (continued) – Columbia Energy and Natural Resources Fund
Strong prospects for energy and natural resources
We have positioned the fund to take advantage of long-term global growth trends while hedging against potential risks. We believe energy and natural resources should perform well over the next five years as demand rises from urbanization in China, India and Brazil. In addition, healthy company balance sheets in the groups, combined with limited access to scarce resources, should spur additional merger-and-acquisition activity and help lift stocks. To guard against uncertainties, however, we also have established a modest overweight in gold and silver producers.
Portfolio characteristics and holdings are subject to change periodically and may not be representative of current characteristics and holdings. The outlook for the fund may differ from that presented for other Columbia Funds.
Equity securities are affected by stock market fluctuations that occur in response to economic and business developments.
International investing involves special risks, including foreign taxation, currency risks, risks associated with possible differences in financial standards and other risks associated with future political and economic developments.
Energy and natural resources stocks have been volatile. They may be affected by rising interest rates and inflation and can also be affected by factors such as natural events (for example, earthquakes or fires) and international politics.
The fund is non-diversified, which generally means that it may invest a greater percentage of its total assets in the securities of fewer issuers than a “diversified” fund. This increases the risk that a change in the value of any one investment held by the fund could affect the overall value of the fund more than it would affect that of a diversified fund holding a greater number of investments. Accordingly, the fund’s value will likely be more volatile than the value of more diversified funds.
7
Investment Portfolio – Columbia Energy and Natural Resources Fund
March 31, 2011
Common Stocks – 99.1%
| | | | | | | | |
| | | Shares | | | Value ($) | |
| Energy – 76.2% | | | | | | | | |
| Energy Equipment & Services – 17.8% | | | | | |
Baker Hughes, Inc. | | | 220,000 | | | | 16,154,600 | |
Cameron International Corp. (a) | | | 160,000 | | | | 9,136,000 | |
Complete Production Services, Inc. (a) | | | 145,000 | | | | 4,612,450 | |
Core Laboratories NV | | | 30,000 | | | | 3,065,100 | |
Dril-Quip, Inc. (a) | | | 90,000 | | | | 7,112,700 | |
Ensco PLC, ADR | | | 150,000 | | | | 8,676,000 | |
FMC Technologies, Inc. (a) | | | 50,000 | | | | 4,724,000 | |
Halliburton Co. | | | 400,000 | | | | 19,936,000 | |
Hercules Offshore, Inc. (a) | | | 350,000 | | | | 2,313,500 | |
National Oilwell Varco, Inc. | | | 185,000 | | | | 14,664,950 | |
Oil States International, Inc. (a) | | | 65,000 | | | | 4,949,100 | |
Patterson-UTI Energy, Inc. | | | 150,000 | | | | 4,408,500 | |
Rowan Companies, Inc. (a) | | | 90,000 | | | | 3,976,200 | |
Schlumberger Ltd. | | | 400,000 | | | | 37,304,000 | |
Superior Energy Services, Inc. (a) | | | 75,000 | | | | 3,075,000 | |
Transocean Ltd. (a) | | | 150,000 | | | | 11,692,500 | |
Vantage Drilling Co. (a) | | | 1,600,000 | | | | 2,880,000 | |
Weatherford International Ltd. (a) | | | 200,000 | | | | 4,520,000 | |
| | | | | | | | |
Energy Equipment & Services Total | | | | | | | 163,200,600 | |
| |
| Oil, Gas & Consumable Fuels – 58.4% | | | | | |
Alpha Natural Resources, Inc. (a) | | | 100,000 | | | | 5,937,000 | |
Anadarko Petroleum Corp. | | | 200,000 | | | | 16,384,000 | |
Arch Coal, Inc. | | | 70,000 | | | | 2,522,800 | |
Brigham Exploration Co. (a) | | | 200,000 | | | | 7,436,000 | |
Cabot Oil & Gas Corp. | | | 100,000 | | | | 5,297,000 | |
Callon Petroleum Co. (a) | | | 315,582 | | | | 2,452,072 | |
Cameco Corp. | | | 125,000 | | | | 3,755,000 | |
Canadian Natural Resources Ltd. | | | 450,000 | | | | 22,243,500 | |
Cenovus Energy, Inc. | | | 277,523 | | | | 10,928,856 | |
Chesapeake Energy Corp. | | | 225,000 | | | | 7,542,000 | |
Chevron Corp. | | | 700,000 | | | | 75,201,000 | |
Cimarex Energy Co. | | | 65,000 | | | | 7,490,600 | |
Clayton Williams Energy, Inc. (a) | | | 44,904 | | | | 4,746,353 | |
Concho Resources, Inc. (a) | | | 90,000 | | | | 9,657,000 | |
ConocoPhillips | | | 700,000 | | | | 55,902,000 | |
Consol Energy, Inc. | | | 100,000 | | | | 5,363,000 | |
Continental Resources, Inc. (a) | | | 75,000 | | | | 5,360,250 | |
Denbury Resources, Inc. (a) | | | 100,000 | | | | 2,440,000 | |
Devon Energy Corp. | | | 175,000 | | | | 16,059,750 | |
EOG Resources, Inc. | | | 50,000 | | | | 5,925,500 | |
Exxon Mobil Corp. | | | 500,000 | | | | 42,065,000 | |
Forest Oil Corp. (a) | | | 175,000 | | | | 6,620,250 | |
Hess Corp. | | | 160,000 | | | | 13,633,600 | |
Hyperdynamics Corp. (a) | | | 400,000 | | | | 1,848,000 | |
Imperial Oil Ltd. | | | 100,000 | | | | 5,107,000 | |
Magnum Hunter Resources Corp. (a) | | | 300,000 | | | | 2,571,000 | |
Marathon Oil Corp. | | | 150,000 | | | | 7,996,500 | |
| | | | | | | | |
| | | Shares | | | Value ($) | |
MEG Energy Corp. (a) | | | 100,000 | | | | 5,060,340 | |
Miller Petroleum, Inc. (a) | | | 256,376 | | | | 1,281,880 | |
Murphy Oil Corp. | | | 120,000 | | | | 8,810,400 | |
Newfield Exploration Co. (a) | | | 70,000 | | | | 5,320,700 | |
Noble Energy, Inc. | | | 50,000 | | | | 4,832,500 | |
Northern Oil & Gas, Inc. (a) | | | 150,000 | | | | 4,005,000 | |
Oasis Petroleum, Inc. (a) | | | 260,000 | | | | 8,221,200 | |
Occidental Petroleum Corp. | | | 200,000 | | | | 20,898,000 | |
Overseas Shipholding Group, Inc. | | | 75,000 | | | | 2,410,500 | |
Pacific Rubiales Energy Corp. | | | 190,500 | | | | 5,281,022 | |
Peabody Energy Corp. | | | 150,000 | | | | 10,794,000 | |
PetroHawk Energy Corp. (a) | | | 150,000 | | | | 3,681,000 | |
Petroleo Brasileiro SA, ADR | | | 250,000 | | | | 10,107,500 | |
Pioneer Natural Resources Co. | | | 75,000 | | | | 7,644,000 | |
Plains Exploration & Production Co. (a) | | | 100,000 | | | | 3,623,000 | |
Southwestern Energy Co. (a) | | | 100,000 | | | | 4,297,000 | |
Suncor Energy, Inc. | | | 828,771 | | | | 37,162,092 | |
Talisman Energy, Inc. | | | 300,000 | | | | 7,410,000 | |
Tesoro Corp. (a) | | | 75,000 | | | | 2,012,250 | |
Valero Energy Corp. | | | 250,000 | | | | 7,455,000 | |
Voyager Oil & Gas, Inc. (a) | | | 400,000 | | | | 1,760,000 | |
Western Refining, Inc. (a) | | | 504,957 | | | | 8,559,021 | |
Whiting Petroleum Corp. (a) | | | 160,000 | | | | 11,752,000 | |
| | | | | | | | |
Oil, Gas & Consumable Fuels Total | | | | | | | 534,863,436 | |
| | | | | | | | |
Energy Total | | | | | | | 698,064,036 | |
| | | | | | | | |
| Financials – 0.3% | | | | | | | | |
| Diversified Financial Services – 0.3% | | | | | |
IntercontinentalExchange, Inc. (a) | | | 25,000 | | | | 3,088,500 | |
| | | | | | | | |
Diversified Financial Services Total | | | | | | | 3,088,500 | |
| | | | | | | | |
Financials Total | | | | | | | 3,088,500 | |
| | | | | | | | |
| Industrials – 0.9% | | | | | | | | |
| Machinery – 0.9% | | | | | | | | |
AGCO Corp. (a) | | | 150,000 | | | | 8,245,500 | |
| | | | | | | | |
Machinery Total | | | | | | | 8,245,500 | |
| | | | | | | | |
Industrials Total | | | | | | | 8,245,500 | |
| | | | | | | | |
| Materials – 21.7% | | | | | | | | |
| Chemicals – 1.1% | | | | | | | | |
CF Industries Holdings, Inc. | | | 30,000 | | | | 4,103,700 | |
LyondellBasell Industries NV, Class A (a) | | | 150,000 | | | | 5,932,500 | |
| | | | | | | | |
Chemicals Total | | | | | | | 10,036,200 | |
| | |
Containers & Packaging – 0.5% | | | | | | | | |
Crown Holdings, Inc. (a) | | | 125,000 | | | | 4,822,500 | |
| | | | | | | | |
Containers & Packaging Total | | | | | | | 4,822,500 | |
See Accompanying Notes to Financial Statements.
8
Columbia Energy and Natural Resources Fund
March 31, 2011
Common Stocks (continued)
| | | | | | | | |
| | | Shares | | | Value ($) | |
| Materials (continued) | | | | | | | | |
| Metals & Mining – 20.1% | | | | | | | | |
Agnico-Eagle Mines Ltd. | | | 150,000 | | | | 9,952,500 | |
Allied Nevada Gold Corp. (a) | | | 25,000 | | | | 887,000 | |
Anglo American PLC, ADR | | | 100,000 | | | | 2,582,000 | |
Barrick Gold Corp. | | | 500,000 | | | | 25,955,000 | |
Centerra Gold, Inc. | | | 100,000 | | | | 1,794,740 | |
Coeur d’Alene Mines Corp. (a) | | | 115,000 | | | | 3,999,700 | |
Copper Mountain Mining Corp. (a) | | | 300,000 | | | | 2,302,218 | |
Detour Gold Corp. (a) | | | 170,000 | | | | 5,376,173 | |
Eldorado Gold Corp. | | | 150,000 | | | | 2,439,000 | |
Fortescue Metals Group Ltd. | | | 400,000 | | | | 2,650,412 | |
Freeport-McMoRan Copper & Gold, Inc. | | | 325,000 | | | | 18,053,750 | |
Goldcorp, Inc. | | | 260,000 | | | | 12,948,000 | |
Hecla Mining Co. (a) | | | 200,000 | | | | 1,816,000 | |
IAMGOLD Corp. | | | 225,000 | | | | 4,954,500 | |
Ivanhoe Mines Ltd. (a) | | | 220,000 | | | | 6,041,200 | |
Kinross Gold Corp. | | | 300,000 | | | | 4,725,000 | |
New Gold, Inc. (a) | | | 200,000 | | | | 2,342,000 | |
Newmont Mining Corp. | | | 150,000 | | | | 8,187,000 | |
Novagold Resources, Inc. (a) | | | 300,000 | | | | 3,900,000 | |
Osisko Mining Corp. (a) | | | 50,000 | | | | 719,625 | |
Pan American Silver Corp. | | | 100,000 | | | | 3,713,000 | |
Rio Tinto PLC, ADR | | | 130,000 | | | | 9,245,600 | |
Royal Gold, Inc. | | | 60,000 | | | | 3,144,000 | |
Seabridge Gold, Inc. (a) | | | 65,000 | | | | 2,068,300 | |
Silver Standard Resources, Inc. (a) | | | 50,000 | | | | 1,569,000 | |
Silver Wheaton Corp. | | | 220,000 | | | | 9,539,200 | |
Teck Resources Ltd., Class B | | | 200,000 | | | | 10,604,000 | |
Thompson Creek Metals Co., Inc. (a) | | | 125,000 | | | | 1,567,500 | |
U.S. Gold Corp. (a) | | | 100,000 | | | | 883,000 | |
US Energy Corp. Wyoming (a) | | | 200,000 | | | | 1,252,000 | |
Vale SA, ADR | | | 100,000 | | | | 3,335,000 | |
Vista Gold Corp. (a) | | | 300,000 | | | | 1,200,000 | |
Walter Energy, Inc. | | | 80,000 | | | | 10,834,400 | |
Yamana Gold, Inc. | | | 250,000 | | | | 3,077,500 | |
| | | | | | | | |
Metals & Mining Total | | | | | | | 183,658,318 | |
| | | | | | | | |
Materials Total | | | | | | | 198,517,018 | |
| | | | | | | | |
Total Common Stocks
(cost of $715,518,751) | | | | | | | 907,915,054 | |
| | | | | | | | |
Short-Term Obligation – 2.8%
| | | | | | | | |
| | | Par ($) | | | Value ($) | |
Repurchase agreement with Fixed Income Clearing Corp., dated 03/31/11, due 04/01/11 at 0.070%, collateralized by a U.S. Government Agency obligation maturing 06/23/15, market value $25,749,063 (repurchase proceeds $25,241,049) | | | 25,241,000 | | | | 25,241,000 | |
| | | | | | | | |
Total Short-Term Obligation
(cost of $25,241,000) | | | | | | | 25,241,000 | |
| | | | | | | | |
Total Investments – 101.9%
(cost of $740,759,751) (b) | | | | | | | 933,156,054 | |
| | | | | | | | |
Other Assets & Liabilities, Net – (1.9)% | | | | (16,971,914 | ) |
| | | | | | | | |
Net Assets – 100.0% | | | | | | | 916,184,140 | |
Notes to Investment Portfolio:
| (a) | Non-income producing security. |
| (b) | Cost for federal income tax purposes is $752,372,262. |
Generally accepted accounting principles (GAAP) require disclosure regarding the inputs and valuation techniques used to measure fair value and any changes in valuation inputs or techniques. In addition, investments shall be disclosed by major category.
The Fund categorizes its fair value measurements according to a three-level hierarchy that maximizes the use of observable inputs and minimizes the use of unobservable inputs by prioritizing that the most observable input be used when available. Observable inputs are those that market participants would use in pricing an investment based on market data obtained from sources independent of the reporting entity. Unobservable inputs are those that reflect the Fund’s assumptions about the information market participants would use in pricing an investment. An investment’s level within the fair value hierarchy is based on the lowest level of any input that is deemed significant to the asset or liability’s fair value measurement. The input levels are not necessarily an indication of the risk or liquidity associated with investments at that level. For example, certain U.S. government securities are generally high quality and liquid, however, they are reflected as Level 2 because the inputs used to determine fair value may not always be quoted prices in an active market.
Fair value inputs are summarized in the three broad levels listed below:
| • | | Level 1 — Valuations based on quoted prices for investments in active markets that the Fund has the ability to access at the measurement date (including NAV for open-end mutual funds). Valuation adjustments are not applied to Level 1 investments. |
| • | | Level 2 — Valuations based on other significant observable inputs (including quoted prices for similar securities, interest rates, prepayment speeds, credit risks, etc.). |
| • | | Level 3 — Valuations based on significant unobservable inputs (including the Fund’s own assumptions and judgment in determining the fair value of investments). |
Inputs that are used in determining fair value of an investment may include price information, credit data, volatility statistics, and other factors. These inputs can be either observable or unobservable. The availability of observable inputs can vary between investments, and is affected by various factors such as the type of investment, and the volume and level of activity for that investment or similar investments in the marketplace. The inputs will be considered by the Investment Manager, along with any other relevant factors in the calculation of an investment’s fair value. The Fund uses prices and inputs that are current as of the measurement date, which may include periods of market dislocations. During these periods, the availability of prices and inputs may be reduced for many investments. This condition could cause an investment to be reclassified between the various levels
See Accompanying Notes to Financial Statements.
9
Columbia Energy and Natural Resources Fund
March 31, 2011
within the hierarchy. Non-U.S. equity securities actively traded in foreign markets may be reflected in Level 2 despite the availability of closing prices, because the Fund evaluates and determines whether those closing prices reflect fair value at the close of the New York Stock Exchange (NYSE) or require adjustment, as described in Note 2 to the financial statements — Security Valuation.
Investments falling into the Level 3 category are primarily supported by quoted prices from brokers and dealers participating in the market for those investments. However, these may be classified as Level 3 investments due to lack of market transparency and corroboration to support these quoted prices. Additionally, valuation models may be used as the pricing source for any remaining investments classified as Level 3. These models rely on one or more significant unobservable inputs and/or significant assumptions by the Investment Manager. Inputs used in valuations may include, but are not limited to, financial statement analysis, capital account balances, discount rates and estimated cash flows, and comparable company data.
The following table is a summary of the inputs used to value the Fund’s investments as of March 31, 2011:
| | | | | | | | | | | | | | | | |
Description | | Quoted
Prices
(Level 1) | | | Other
Significant
Observable
Inputs
(Level 2) | | | Significant
Unobservable
Inputs
(Level 3) | | | Total | |
Common Stocks | | | | | | | | | | | | | | | | |
Energy | | $ | 698,064,036 | | | $ | — | | | $ | — | | | $ | 698,064,036 | |
Financials | | | 3,088,500 | | | | — | | | | — | | | | 3,088,500 | |
Industrials | | | 8,245,500 | | | | — | | | | — | | | | 8,245,500 | |
Materials | | | 195,866,606 | | | | 2,650,412 | | | | — | | | | 198,517,018 | |
| | | | | | | | | | | | | | | | |
Total Common Stocks | | | 905,264,642 | | | | 2,650,412 | | | | — | | | | 907,915,054 | |
| | | | | | | | | | | | | | | | |
Total Short-Term Obligation | | | — | | | | 25,241,000 | | | | — | | | | 25,241,000 | |
| | | | | | | | | | | | | | | | |
Total Investments | | $ | 905,264,642 | | | $ | 27,891,412 | | | $ | — | | | $ | 933,156,054 | |
| | | | | | | | | | | | | | | | |
The Fund’s assets assigned to the Level 2 input category are generally valued using the market approach, in which a security’s value is determined through its correlation to prices and information from market transactions for similar or identical assets. These assets include certain foreign securities for which a third party statistical pricing service may be employed for purposes of fair valuation. The models utilized by the third party statistical pricing service take into account a security’s correlation to available market data including, but not limited to, intraday index, ADR, and ETF movements.
Certain short-term obligations may be valued using amortized cost, an income approach which converts future cash flows to a present value based upon the discount or premium at purchase.
There were no significant transfers of financial assets between Levels 1 and 2 during the period.
At March 31, 2011, the Fund held investments in the following sectors:
| | | | |
Sector (Unaudited) | | % of
Net Assets | |
Energy | | | 76.2 | |
Materials | | | 21.7 | |
Industrials | | | 0.9 | |
Financials | | | 0.3 | |
| | | | |
| | | 99.1 | |
Short-Term Obligation | | | 2.8 | |
Other Assets & Liabilities, Net | | | (1.9 | ) |
| | | | |
| | | 100.0 | |
| | | | |
| | |
Acronym | | Name |
| ADR | | American Depositary Receipt |
See Accompanying Notes to Financial Statements.
10
Statement of Assets and Liabilities – Columbia Energy and Natural Resources Fund
March 31, 2011
| | | | | | |
| | | | | ($) | |
| Assets | | Investments, at identified cost | | | 740,759,751 | |
| | | | | | |
| | Investments, at value | | | 933,156,054 | |
| | Cash | | | 34,627 | |
| | Foreign currency (cost of $10,534) | | | 10,551 | |
| | Receivable for: | | | | |
| | Investments sold | | | 4,417,915 | |
| | Fund shares sold | | | 1,792,815 | |
| | Dividends | | | 417,474 | |
| | Interest | | | 49 | |
| | Trustees’ deferred compensation plan | | | 21,433 | |
| | Prepaid expenses | | | 18,600 | |
| | | | | | |
| | Total Assets | | | 939,869,518 | |
| | |
| Liabilities | | Payable for: | | | | |
| | Investments purchased | | | 21,686,022 | |
| | Fund shares repurchased | | | 1,035,443 | |
| | Investment advisory fee | | | 437,406 | |
| | Administration fee | | | 97,812 | |
| | Pricing and bookkeeping fees | | | 11,817 | |
| | Transfer agent fee | | | 307,968 | |
| | Trustees’ fees | | | 747 | |
| | Custody fee | | | 5,272 | |
| | Distribution and service fees | | | 33,756 | |
| | Chief compliance officer expenses | | | 363 | |
| | Interest payable | | | 153 | |
| | Trustees’ deferred compensation plan | | | 21,433 | |
| | Other liabilities | | | 47,186 | |
| | | | | | |
| | Total Liabilities | | | 23,685,378 | |
| | |
| | | | | | |
| | Net Assets | | | 916,184,140 | |
| | |
| Net Assets Consist of | | Paid-in capital | | | 743,908,410 | |
| | Undistributed net investment income | | | 63,935 | |
| | Accumulated net realized loss | | | (20,185,438 | ) |
| | Net unrealized appreciation on: | | | | |
| | Investments | | | 192,396,303 | |
| | Foreign currency translations | | | 930 | |
| | | | | | |
| | Net Assets | | | 916,184,140 | |
See Accompanying Notes to Financial Statements.
11
Statement of Assets and Liabilities (continued) – Columbia Energy and Natural Resources Fund
March 31, 2011
| | | | | | |
| | | | | | |
| Class A | | Net assets | | $ | 69,937,926 | |
| | Shares outstanding | | | 2,735,139 | |
| | Net asset value per share | | $ | 25.57 | (a) |
| | Maximum sales charge | | | 5.75 | % |
| | Maximum offering price per share ($25.57/0.9425) | | $ | 27.13 | (b) |
| | |
| Class B (c) | | Net assets | | $ | 57,569 | |
| | Shares outstanding | | | 2,306 | |
| | Net asset value and offering price per share | | $ | 24.96 | (a) |
| | |
| Class C | | Net assets | | $ | 25,494,179 | |
| | Shares outstanding | | | 1,021,376 | |
| | Net asset value and offering price per share | | $ | 24.96 | (a) |
| | |
| Class I (d) | | Net assets | | $ | 115,952,560 | |
| | Shares outstanding | | | 4,512,650 | |
| | Net asset value, offering and redemption price per share | | $ | 25.70 | |
| | |
| Class R (d) | | Net assets | | $ | 54,561 | |
| | Shares outstanding | | | 2,135 | |
| | Net asset value, offering and redemption price per share | | $ | 25.56 | |
| | |
| Class R4 (c) | | Net assets | | $ | 2,519 | |
| | Shares outstanding | | | 98 | |
| | Net asset value, offering and redemption price per share | | $ | 25.67 | (e) |
| | |
| Class Z | | Net assets | | $ | 704,684,826 | |
| | Shares outstanding | | | 27,454,137 | |
| | Net asset value, offering and redemption price per share | | $ | 25.67 | |
| (a) | Redemption price per share is equal to net asset value less any applicable contingent deferred sales charge. |
| (b) | On sales of $50,000 or more the offering price is reduced. |
| (c) | Class B and Class R4 shares commenced operations on March 7, 2011. |
| (d) | Class I and Class R shares commenced operations on September 27, 2010. |
| (e) | Net asset value per share rounds to this amount due to fractional shares outstanding. |
See Accompanying Notes to Financial Statements.
12
Statement of Operations – Columbia Energy and Natural Resources Fund
For the Year Ended March 31, 2011
| | | | | | |
| | | | | ($) (a)(b) | |
| Investment Income | | Dividends | | | 8,910,974 | |
| | Interest | | | 47,216 | |
| | Foreign taxes withheld | | | (227,234 | ) |
| | | | | | |
| | Total Investment Income | | | 8,730,956 | |
| | |
| Expenses | | Investment advisory fee | | | 4,436,667 | |
| | Administration fee | | | 970,041 | |
| | Distribution fee: | | | | |
| | Class B | | | 9 | |
| | Class C | | | 134,728 | |
| | Class R | | | 54 | |
| | Service fee: | | | | |
| | Class A | | | 131,913 | |
| | Class B | | | 3 | |
| | Class C | | | 44,959 | |
| | Plan administration services fee – Class R4 | | | — | * |
| | Transfer agent fee:
Class A, Class B, Class C, Class R, Class R4 and Class Z | | | 1,363,896 | |
| | Pricing and bookkeeping fees | | | 140,428 | |
| | Trustees’ fees | | | 40,100 | |
| | Custody fee | | | 32,881 | |
| | Chief compliance officer expenses | | | 1,648 | |
| | Other expenses | | | 439,226 | |
| | | | | | |
| | Expenses before interest expense | | | 7,736,553 | |
| | Interest expense | | | 2,575 | |
| | | | | | |
| | Total Expenses | | | 7,739,128 | |
| | | | | | |
| | Expense reductions | | | (314 | ) |
| | | | | | |
| | Net Expenses | | | 7,738,814 | |
| | |
| | | | | | |
| | Net Investment Income | | | 992,142 | |
| | |
| Net Realized and Unrealized Gain (Loss) on Investments and Foreign Currency | | Net realized gain on: | | | | |
| | Investments | | | 97,515,680 | |
| | Foreign currency transactions | | | 1,917 | |
| | | | | | |
| | Net realized gain | | | 97,517,597 | |
| | | | | | |
| | Net change in unrealized appreciation (depreciation) on: | | | | |
| | Investments | | | 93,212,497 | |
| | Foreign currency translations | | | 774 | |
| | | | | | |
| | Net change in unrealized appreciation (depreciation) | | | 93,213,271 | |
| | | | | | |
| | Net Gain | | | 190,730,868 | |
| | |
| | | | | | |
| | Net Increase Resulting from Operations | | | 191,723,010 | |
| (a) | Class B and Class R4 shares commenced operations on March 7, 2011. |
| (b) | Class I and Class R shares commenced operations on September 27, 2010. |
| * | Rounds to less than $1.00. |
See Accompanying Notes to Financial Statements.
13
Statement of Changes in Net Assets – Columbia Energy and Natural Resources Fund
| | | | | | | | | | |
| | | | | Year Ended March 31, | |
| Increase (Decrease) in Net Assets | | | | 2011 ($)(a)(b) | | | 2010 ($) | |
| Operations | | Net investment income | | | 992,142 | | | | 930,618 | |
| | Net realized gain on investments and foreign currency transactions | | | 97,517,597 | | | | 84,724,104 | |
| | Net change in unrealized appreciation (depreciation) on investments and foreign currency translations | | | 93,213,271 | | | | 109,032,700 | |
| | | | | | | | | | |
| | Net increase resulting from operations | | | 191,723,010 | | | | 194,687,422 | |
| |
| Distributions to Shareholders | | From net investment income: | |
| | Class A | | | (23,329 | ) | | | (29,443 | ) |
| | Class I | | | (144,793 | ) | | | — | |
| | Class R4 | | | (2 | ) | | | — | |
| | Class Z | | | (1,011,631 | ) | | | (1,492,249 | ) |
| | | | | | | | | | |
| | Total distributions to shareholders | | | (1,179,755 | ) | | | (1,521,692 | ) |
| | | |
| | Net Capital Stock Transactions | | | 35,938,716 | | | | 135,524,840 | |
| | | |
| | Increase from regulatory settlements | | | — | | | | 35,194 | |
| | | | | | | | | | |
| | Total increase in net assets | | | 226,481,971 | | | | 328,725,764 | |
| | | |
| Net Assets | | Beginning of period | | | 689,702,169 | | | | 360,976,405 | |
| | End of period | | | 916,184,140 | | | | 689,702,169 | |
| | Undistributed net investment income at end of period | | | 63,935 | | | | 337,918 | |
| (a) | Class B and Class R4 shares commenced operations on March 7, 2011. |
| (b) | Class I and Class R shares commenced operations on September 27, 2010. |
See Accompanying Notes to Financial Statements.
14
Statement of Changes in Net Assets (continued) — Columbia Energy and Natural Resources Fund
| | | | | | | | | | | | | | | | |
| | | Capital Stock Activity | |
| | | Year Ended
March 31,
2011 (a)(b)(c)(d) | | | Year Ended
March 31, 2010 | |
| | | Shares | | | Dollars ($) | | | Shares | | | Dollars ($) | |
Class A | | | | | | | | | | | | | | | | |
Subscriptions | | | 1,150,892 | | | | 24,796,839 | | | | 2,143,325 | | | | 38,526,042 | |
Distributions reinvested | | | 760 | | | | 18,884 | | | | 1,416 | | | | 27,178 | |
Redemptions | | | (942,663 | ) | | | (19,293,252 | ) | | | (854,735 | ) | | | (15,782,330 | ) |
| | | | | | | | | | | | | | | | |
Net increase | | | 208,989 | | | | 5,522,471 | | | | 1,290,006 | | | | 22,770,890 | |
| | | | |
Class B | | | | | | | | | | | | | | | | |
Subscriptions | | | 2,306 | | | | 56,527 | | | | — | | | | — | |
| | | | | | | | | | | | | | | | |
Net increase | | | 2,306 | | | | 56,527 | | | | — | | | | — | |
| | | | |
Class C | | | | | | | | | | | | | | | | |
Subscriptions | | | 415,857 | | | | 8,714,881 | | | | 567,011 | | | | 9,991,562 | |
Redemptions | | | (224,761 | ) | | | (4,538,662 | ) | | | (170,392 | ) | | | (3,063,346 | ) |
| | | | | | | | | | | | | | | | |
Net increase | | | 191,096 | | | | 4,176,219 | | | | 396,619 | | | | 6,928,216 | |
| | | | |
Class I | | | | | | | | | | | | | | | | |
Subscriptions | | | 5,239,281 | | | | 117,720,570 | | | | — | | | | — | |
Distributions reinvested | | | 5,730 | | | | 144,788 | | | | — | | | | — | |
Redemptions | | | (732,361 | ) | | | (17,654,089 | ) | | | — | | | | — | |
| | | | | | | | | | | | | | | | |
Net increase | | | 4,512,650 | | | | 100,211,269 | | | | — | | | | — | |
| | | | |
Class R | | | | | | | | | | | | | | | | |
Subscriptions | | | 2,135 | | | | 48,370 | | | | — | | | | — | |
| | | | | | | | | | | | | | | | |
Net increase | | | 2,135 | | | | 48,370 | | | | — | | | | — | |
| | | | |
Class R4 | | | | | | | | | | | | | | | | |
Subscriptions | | | 98 | | | | 2,500 | | | | — | | | | — | |
| | | | | | | | | | | | | | | | |
Net increase | | | 98 | | | | 2,500 | | | | — | | | | — | |
| | | | |
Class Z | | | | | | | | | | | | | | | | |
Subscriptions | | | 10,793,305 | | | | 227,525,290 | | | | 13,600,915 | | | | 243,040,391 | |
Distributions reinvested | | | 33,019 | | | | 733,178 | | | | 66,461 | | | | 1,134,656 | |
Redemptions | | | (14,236,411 | ) | | | (302,337,108 | ) | | | (7,573,801 | ) | | | (138,349,313 | ) |
| | | | | | | | | | | | | | | | |
Net increase (decrease) | | | (3,410,087 | ) | | | (74,078,640 | ) | | | 6,093,575 | | | | 105,825,734 | |
| (a) | Class B and Class R4 shares commenced operations on March 7, 2011. |
| (b) | Class B and Class R4 shares reflect activity for the period March 7, 2011 through March 31, 2011. |
| (c) | Class I and Class R shares commenced operations on September 27, 2010. |
| (d) | Class I and Class R shares reflect activity for the period September 27, 2010 through March 31, 2011. |
See Accompanying Notes to Financial Statements.
15
Financial Highlights – Columbia Energy and Natural Resources Fund
Selected data for a share outstanding throughout each period is as follows:
| | | | | | | | | | | | | | | | |
| | | Year Ended March 31, | | | Period Ended
March 31, | |
| Class A Shares | | 2011 | | | 2010 | | | 2009 | | | 2008 (a) | |
Net Asset Value, Beginning of Period | | $ | 20.11 | | | $ | 13.62 | | | $ | 25.49 | | | $ | 27.64 | |
| | | | |
Income from Investment Operations: | | | | | | | | | | | | | | | | |
Net investment loss (b) | | | (0.02 | ) | | | (0.02 | ) | | | (0.01 | ) | | | — | (c) |
Net realized and unrealized gain (loss) on investments and foreign currency | | | 5.49 | | | | 6.52 | | | | (11.46 | ) | | | 1.72 | |
| | | | | | | | | | | | | | | | |
Total from investment operations | | | 5.47 | | | | 6.50 | | | | (11.47 | ) | | | 1.72 | |
| | | | |
Less Distributions to Shareholders: | | | | | | | | | | | | | | | | |
From net investment income | | | (0.01 | ) | | | (0.01 | ) | | | — | | | | — | |
From net realized gains | | | — | | | | — | | | | (0.40 | ) | | | (3.87 | ) |
| | | | | | | | | | | | | | | | |
Total distributions to shareholders | | | (0.01 | ) | | | (0.01 | ) | | | (0.40 | ) | | | (3.87 | ) |
| | | | |
Increase from regulatory settlements | | | — | | | | — | (c) | | | — | | | | — | |
| | | | |
Net Asset Value, End of Period | | $ | 25.57 | | | $ | 20.11 | | | $ | 13.62 | | | $ | 25.49 | |
Total return (d) | | | 27.20 | % | | | 47.76 | % | | | (45.88 | )%(f) | | | 6.82 | %(e)(f) |
| | | | |
Ratios to Average Net Assets/Supplemental Data: | | | | | | | | | | | | | | | | |
Net expenses before interest expense (g) | | | 1.26 | % | | | 1.21 | % | | | 1.24 | % | | | 1.07 | %(h) |
Interest expense | | | — | %(i) | | | — | %(i) | | | — | | | | — | %(h)(i) |
Net expenses (g) | | | 1.26 | % | | | 1.21 | % | | | 1.24 | % | | | 1.07 | %(h) |
Waiver/Reimbursement | | | — | | | | — | | | | 0.04 | % | | | 0.05 | %(h) |
Net investment loss (g) | | | (0.08 | )% | | | (0.10 | )% | | | (0.03 | )% | | | (0.02 | )%(h) |
Portfolio turnover rate | | | 551 | % | | | 523 | % | | | 484 | % | | | 198 | %(e) |
Net assets, end of period (000s) | | $ | 69,938 | | | $ | 50,812 | | | $ | 16,842 | | | $ | 5,328 | |
| (a) | The Predecessor Fund’s Class A shares commenced operations on September 28, 2007. Per share data and total return reflect activity from that date. |
| (b) | Per share data was calculated using the average shares outstanding during the period. |
| (c) | Rounds to less than $0.01 per share. |
| (d) | Total return at net asset value assuming all distributions reinvested and no initial sales charge or contingent deferred sales charge. |
| (f) | Had the Investment Manager and/or any of its affiliates not waived fees or reimbursed a portion of expenses, total return would have been reduced. |
| (g) | The benefits derived from expense reductions had an impact of less than 0.01%. |
| (i) | Rounds to less than 0.01%. |
See Accompanying Notes to Financial Statements.
16
Financial Highlights – Columbia Energy and Natural Resources Fund
Selected data for a share outstanding throughout the period is as follows:
| | | | |
| Class B Shares | | Period Ended
March 31,
2011 (a) | |
Net Asset Value, Beginning of Period | | $ | 24.77 | |
| |
Income from Investment Operations: | | | | |
Net investment loss (b) | | | (0.03 | ) |
Net realized and unrealized gain on investments and foreign currency | | | 0.22 | |
| | | | |
Total from investment operations | | | 0.19 | |
| |
Net Asset Value, End of Period | | $ | 24.96 | |
Total return (c)(d) | | | 0.77 | % |
| |
Ratios to Average Net Assets/Supplemental Data: | | | | |
Net expenses before interest expense (e)(f) | | | 2.20 | % |
Interest expense (e)(g) | | | — | % |
Net expenses (e)(f) | | | 2.20 | % |
Net investment loss (e)(f) | | | (2.14 | )% |
Portfolio turnover rate (c) | | | 551 | % |
Net assets, end of period (000s) | | $ | 58 | |
| (a) | Class B shares commenced operations on March 7, 2011. Per share data and total return reflect activity from that date. |
| (b) | Per share data was calculated using the average shares outstanding during the period. |
| (d) | Total return at net asset value. |
| (f) | The benefits derived from expense reductions had an impact of less than 0.01%. |
| (g) | Rounds to less than 0.01%. |
See Accompanying Notes to Financial Statements.
17
Financial Highlights – Columbia Energy and Natural Resources Fund
Selected data for a share outstanding throughout each period is as follows:
| | | | | | | | | | | | | | | | |
Class C Shares | | Year Ended March 31, | | | Period Ended
March 31, | |
| | 2011 | | | 2010 | | | 2009 | | | 2008 (a) | |
Net Asset Value, Beginning of Period | | $ | 19.78 | | | $ | 13.47 | | | $ | 25.40 | | | $ | 27.64 | |
| | | | |
Income from Investment Operations: | | | | | | | | | | | | | | | | |
Net investment loss (b) | | | (0.17 | ) | | | (0.15 | ) | | | (0.13 | ) | | | (0.10 | ) |
Net realized and unrealized gain (loss) on investments and foreign currency | | | 5.35 | | | | 6.46 | | | | (11.40 | ) | | | 1.73 | |
| | | | | | | | | | | | | | | | |
Total from investment operations | | | 5.18 | | | | 6.31 | | | | (11.53 | ) | | | 1.63 | |
| | | | |
Less Distributions to Shareholders: | | | | | | | | | | | | | | | | |
From net realized gains | | | — | | | | — | | | | (0.40 | ) | | | (3.87 | ) |
| | | | |
Increase from regulatory settlements | | | — | | | | — | (c) | | | — | | | | — | |
| | | | |
Net Asset Value, End of Period | | $ | 24.96 | | | $ | 19.78 | | | $ | 13.47 | | | $ | 25.40 | |
Total return (d) | | | 26.19 | % | | | 46.84 | % | | | (46.29 | )%(f) | | | 6.45 | %(e)(f) |
| | | | |
Ratios to Average Net Assets/Supplemental Data: | | | | | | | | | | | | | | | | |
Net expenses before interest expense (g) | | | 2.01 | % | | | 1.96 | % | | | 1.99 | % | | | 1.82 | %(h) |
Interest expense | | | — | %(i) | | | — | %(i) | | | — | | | | — | %(h)(i) |
Net expenses (g) | | | 2.01 | % | | | 1.96 | % | | | 1.99 | % | | | 1.82 | %(h) |
Waiver/Reimbursement | | | — | | | | — | | | | 0.04 | % | | | 0.05 | %(h) |
Net investment loss (g) | | | (0.83 | )% | | | (0.84 | )% | | | (0.73 | )% | | | (0.78 | )%(h) |
Portfolio turnover rate | | | 551 | % | | | 523 | % | | | 484 | % | | | 198 | %(e) |
Net assets, end of period (000s) | | $ | 25,494 | | | $ | 16,420 | | | $ | 5,843 | | | $ | 1,433 | |
| (a) | The Predecessor Fund’s Class C shares commenced operations on September 28, 2007. Per share data and total return reflect activity from that date. |
| (b) | Per share data was calculated using the average shares outstanding during the period. |
| (c) | Rounds to less than $0.01 per share. |
| (d) | Total return at net asset value assuming all distributions reinvested and no contingent deferred sales charge. |
| (f) | Had the Investment Manager and/or any of its affiliates not waived fees or reimbursed a portion of expenses, total return would have been reduced. |
| (g) | The benefits derived from expense reductions had an impact of less than 0.01%. |
| (i) | Rounds to less than 0.01%. |
See Accompanying Notes to Financial Statements.
18
Financial Highlights – Columbia Energy and Natural Resources Fund
Selected data for a share outstanding throughout the period is as follows:
| | | | |
| Class I Shares | | Period Ended
March 31,
2011 (a) | |
Net Asset Value, Beginning of Period | | $ | 18.82 | |
| |
Income from Investment Operations: | | | | |
Net investment income (b) | | | 0.05 | |
Net realized and unrealized gain on investments and foreign currency | | | 6.86 | |
| | | | |
Total from investment operations | | | 6.91 | |
| |
Less Distributions to Shareholders: | | | | |
From net investment income | | | (0.03 | ) |
| |
Net Asset Value, End of Period | | $ | 25.70 | |
Total return (c)(d) | | | 36.74 | % |
| |
Ratios to Average Net Assets/Supplemental Data: | | | | |
Net expenses before interest expense (e)(f) | | | 0.85 | % |
Interest expense (f)(g) | | | — | % |
Net expenses (e)(f) | | | 0.85 | % |
Net investment income (e)(f) | | | 0.38 | % |
Portfolio turnover rate (d) | | | 551 | % |
Net assets, end of period (000s) | | $ | 115,953 | |
| (a) | Class I shares commenced operations on September 27, 2010. Per share data and total return reflect activity from that date. |
| (b) | Per share data was calculated using the average shares outstanding during the period. |
| (c) | Total return at net asset value assuming all distributions reinvested. |
| (e) | The benefits derived from expense reductions had an impact of less than 0.01%. |
| (g) | Rounds to less than 0.01%. |
See Accompanying Notes to Financial Statements.
19
Financial Highlights – Columbia Energy and Natural Resources Fund
Selected data for a share outstanding throughout the period is as follows:
| | | | |
| Class R Shares | | Period Ended
March 31,
2011 (a) | |
Net Asset Value, Beginning of Period | | $ | 18.76 | |
| |
Income from Investment Operations: | | | | |
Net investment loss (b) | | | (0.02 | ) |
Net realized and unrealized gain on investments and foreign currency | | | 6.82 | |
| | | | |
Total from investment operations | | | 6.80 | |
| |
Net Asset Value, End of Period | | $ | 25.56 | |
Total return (d)(e) | | | 36.25 | % |
| |
Ratios to Average Net Assets/Supplemental Data: | | | | |
Net expenses before interest expense (f)(g) | | | 1.60 | % |
Interest expense (g)(h) | | | — | % |
Net expenses (f)(g) | | | 1.60 | % |
Net investment loss (f)(g) | | | (0.13 | )% |
Portfolio turnover rate (e) | | | 551 | % |
Net assets, end of period (000s) | | $ | 55 | |
| (a) | Class R shares commenced operations on September 27, 2010. Per share data and total return reflect activity from that date. |
| (b) | Per share data was calculated using the average shares outstanding during the period. |
| (d) | Total return at net asset value. |
| (f) | The benefits derived from expense reductions had an impact of less than 0.01%. |
| (h) | Rounds to less than 0.01%. |
See Accompanying Notes to Financial Statements.
20
Financial Highlights – Columbia Energy and Natural Resources Fund
Selected data for a share outstanding throughout the period is as follows:
| | | | |
| Class R4 Shares | | Period Ended
March 31,
2011 (a) | |
Net Asset Value, Beginning of Period | | $ | 25.48 | |
| |
Income from Investment Operations: | | | | |
Net investment loss (b) | | | (0.01 | ) |
Net realized and unrealized gain on investments and foreign currency | | | 0.22 | |
| | | | |
Total from investment operations | | | 0.21 | |
| |
Less Distributions to Shareholders: | | | | |
From net investment income | | | (0.02 | ) |
| |
Net Asset Value, End of Period | | $ | 25.67 | |
Total return (c)(d) | | | 0.82 | % |
| |
Ratios to Average Net Assets/Supplemental Data: | | | | |
Net expenses before interest expense (e)(f) | | | 1.26 | % |
Interest expense (e)(g) | | | — | % |
Net expenses (e)(f) | | | 1.26 | % |
Net investment loss (e)(f) | | | (0.57 | )% |
Portfolio turnover rate (c) | | | 551 | % |
Net assets, end of period (000s) | | $ | 3 | |
| | | | |
| (a) | Class R4 shares commenced operations on March 7, 2011. Per share data and total return reflect activity from that date. |
| (b) | Per share data was calculated using the average shares outstanding during the period. |
| (d) | Total return at net asset value assuming all distributions reinvested. |
| (f) | The benefits derived from expense reductions had an impact of less than 0.01%. |
| (g) | Rounds to less than 0.01%. |
See Accompanying Notes to Financial Statements.
21
Financial Highlights – Columbia Energy and Natural Resources Fund
Selected data for a share outstanding throughout each period is as follows:
| | | | | | | | | | | | | | | | | | | | |
Class Z Shares | | Year Ended March 31, | |
| | 2011 | | | 2010 | | | 2009 | | | 2008 (a) | | | 2007 | |
Net Asset Value, Beginning of Period | | $ | 20.17 | | | $ | 13.66 | | | $ | 25.49 | | | $ | 23.30 | | | $ | 25.99 | |
| | | | | |
Income from Investment Operations: | | | | | | | | | | | | | | | | | | | | |
Net investment income (b) | | | 0.03 | | | | 0.04 | | | | 0.02 | | | | 0.01 | | | | 0.06 | |
Net realized and unrealized gain (loss) on investments and foreign currency | | | 5.51 | | | | 6.52 | | | | (11.45 | ) | | | 6.08 | | | | 2.50 | |
| | | | | | | | | | | | | | | | | | | | |
Total from investment operations | | | 5.54 | | | | 6.56 | | | | (11.43 | ) | | | 6.09 | | | | 2.56 | |
| | | | | |
Less Distributions to Shareholders: | | | | | | | | | | | | | | | | | | | | |
From net investment income | | | (0.04 | ) | | | (0.05 | ) | | | — | | | | (0.03 | ) | | | (0.06 | ) |
From net realized gains | | | — | | | | — | | | | (0.40 | ) | | | (3.87 | ) | | | (5.19 | ) |
| | | | | | | | | | | | | | | | | | | | |
Total distributions to shareholders | | | (0.04 | ) | | | (0.05 | ) | | | (0.40 | ) | | | (3.90 | ) | | | (5.25 | ) |
| | | | | |
Increase from regulatory settlements | | | — | | | | — | (c) | | | — | | | | — | | | | — | |
| | | | | |
Net Asset Value, End of Period | | $ | 25.67 | | | $ | 20.17 | | | $ | 13.66 | | | $ | 25.49 | | | $ | 23.30 | |
Total return (d) | | | 27.47 | % | | | 48.12 | % | | | (45.72 | )%(e) | | | 26.84 | %(e) | | | 10.84 | %(e) |
| | | | |
Ratios to Average Net Assets/Supplemental Data: | | | | | | | | | | | | | | | | | |
Net expenses before interest expense (f) | | | 1.01 | % | | | 0.96 | % | | | 0.99 | % | | | 1.07 | % | | | 1.12 | % |
Interest expense | | | — | %(g) | | | — | %(g) | | | — | | | | — | %(g) | | | — | |
Net expenses (f) | | | 1.01 | % | | | 0.96 | % | | | 0.99 | % | | | 1.07 | % | | | 1.12 | % |
Waiver/Reimbursement | | | — | | | | — | | | | 0.04 | % | | | 0.04 | % | | | 0.01 | % |
Net investment income (f) | | | 0.17 | % | | | 0.21 | % | | | 0.11 | % | | | 0.05 | % | | | 0.25 | % |
Portfolio turnover rate | | | 551 | % | | | 523 | % | | | 484 | % | | | 198 | % | | | 279 | % |
Net assets, end of period (000s) | | $ | 704,685 | | | $ | 622,471 | | | $ | 338,292 | | | $ | 712,080 | | | $ | 497,676 | |
| (a) | On March 31, 2008, Shares class of Energy and Natural Resources Fund, a series of Excelsior Funds, Inc., was reorganized into Class Z. The financial information of Class Z includes the financial information of Energy and Natural Resources Fund’s Shares class. |
| (b) | Per share data was calculated using the average shares outstanding during the period. |
| (c) | Rounds to less than $0.01 per share. |
| (d) | Total return at net asset value assuming all distributions reinvested. |
| (e) | Had the Investment Manager and/or any of its affiliates not waived fees or reimbursed a portion of expenses, total return would have been reduced. |
| (f) | The benefits derived from expense reductions had an impact of less than 0.01%, except for the year ended March 31, 2007, which had an impact of 0.01%. |
| (g) | Rounds to less than 0.01%. |
See Accompanying Notes to Financial Statements.
22
Notes to Financial Statements – Columbia Energy and Natural Resources Fund
March 31, 2011
Note 1. Organization
Columbia Energy and Natural Resources Fund (the Fund), a series of Columbia Funds Series Trust I (the Trust), is a non-diversified fund. The Trust is registered under the Investment Company Act of 1940, as amended (the 1940 Act), as an open-end management investment company organized as a Massachusetts business trust.
After the close of business on April 30, 2010, Ameriprise Financial, Inc. (Ameriprise Financial) acquired a portion of the asset management business of Columbia Management Group, LLC (the Transaction), including the business of managing the Fund. In connection with the closing of the Transaction (the Closing), RiverSource Investments, LLC, a wholly owned subsidiary of Ameriprise Financial, became the investment manager of the Fund and changed its name to Columbia Management Investment Advisers, LLC (the Investment Manager).
Investment Objective
The Fund seeks long-term capital appreciation.
Fund Shares
The Trust has unlimited authorized shares of beneficial interest. The Fund offers Class A, Class B, Class C, Class I, Class R, Class R4 and Class Z shares. On December 10, 2010, the Investment Manager exchanged Class Z shares of the Fund valued at $81,951,778 for Class I shares of the Fund. All share classes have identical voting, dividend and liquidation rights. All share classes have identical voting, dividend and liquidation rights. Each share class has its own expense structure and sales charges, as applicable.
Class A shares are subject to a maximum front-end sales charge of 5.75% based on the initial investment amount. Class A shares purchased without an initial sales charge in accounts aggregating $1 million to $50 million at the time of purchase are subject to a 1.00% contingent deferred sales charge (CDSC) if the shares are sold within 18 months of purchase, charged as follows: 1.00% CDSC if redeemed within 12 months of purchase, and 0.50% CDSC if redeemed more than 12, but less than 18 months after purchase.
The Fund does not accept investments by new or existing investors in the Fund’s Class B shares, except in connection with the reinvestment of any dividend and/or capital gain distributions in Class B shares of the Fund and exchanges by existing Class B shareholders of other funds within the Columbia Family of Funds. Class B shares are not subject to sales charges. Class B shares commenced operations on March 7, 2011.
Class C shares are subject to a 1.00% CDSC on shares redeemed within one year of purchase.
Class I shares are not subject to sales charges and are available only to the Columbia Family of Funds. Class I shares commenced operations on September 27, 2010.
Class R shares are not subject to sales charges and are available only to qualifying institutional investors. Class R shares commenced operations on September 27, 2010.
The Fund is also authorized to issue Class R4 shares, which would not be subject to sales charges, however this share class is closed to new investors and new accounts. Class R4 shares commenced operations on March 7, 2011.
Class Z shares are not subject to sales charges and are available only to certain investors, as described in the Fund’s prospectus.
Note 2. Summary of Significant Accounting Policies
The preparation of financial statements in accordance with U.S. generally accepted accounting principles (GAAP) requires management to make certain estimates and assumptions that affect the reported amounts of assets and liabilities, the disclosure of contingent assets and liabilities at the date of the financial statements and the reported amounts of revenue and expenses during the reporting period. Actual results could differ from those estimates.
The following is a summary of significant accounting policies consistently followed by the Fund in the preparation of its financial statements.
Security Valuation
Equity securities are valued at the last sale price on the principal exchange on which they trade, except for securities traded on the NASDAQ, which are valued at the NASDAQ official close price. Unlisted securities or listed securities for which there were no sales during the day are valued at the closing bid price on such exchanges or over-the-counter markets.
Short-term investments maturing in 60 days or less are valued at amortized cost, which approximates market value.
Investments for which market quotations are not readily available, or that have quotations which the Investment Manager believes are not reliable, are valued at fair value as determined in good faith under consistently applied procedures established by and under the general supervision of the Board of Trustees. If a security is valued at fair value, such value is likely to be different from the last quoted market
23
Columbia Energy and Natural Resources Fund
March 31, 2011
price for the security. The determination of fair value often requires significant judgment. To determine fair value, the Investment Manager may use assumptions including but not limited to future cash flows and estimated risk premiums. Multiple inputs from various sources may be used to determine value.
Foreign Currency Transactions and Translations
The values of all assets and liabilities quoted in foreign currencies are translated into U.S. dollars at that day’s exchange rates. Net realized and unrealized gains (losses) on foreign currency transactions and translations include gains (losses) arising from the fluctuation in exchange rates between trade and settlement dates on securities transactions, gains (losses) arising from the disposition of foreign currency and currency gains (losses) between the accrual and payment dates on dividends, interest income and foreign withholding taxes.
For financial statement purposes, the Fund does not distinguish that portion of gains (losses) on investments which is due to changes in foreign exchange rates from that which is due to changes in market prices of the investments. Such fluctuations are included with the net realized and unrealized gains (losses) on investments on the Statement of Operations.
Repurchase Agreements
The Fund may engage in repurchase agreement transactions with institutions that the Investment Manager has determined are creditworthy. The Fund, through the custodian, receives delivery of the underlying securities collateralizing a repurchase agreement. The Investment Manager is responsible for determining that the collateral is at least equal, at all times, to the value of the repurchase obligation including interest. A repurchase agreement transaction involves certain risks in the event of default or insolvency of the counterparty. These risks include possible delays in or restrictions on the Fund’s ability to dispose of the underlying securities and a possible decline in the value of the underlying securities during the period while the Fund seeks to assert its rights.
Security Transactions
Security transactions are accounted for on the trade date. Cost is determined and gains (losses) are based upon the specific identification method for both financial statement and federal income tax purposes.
Income Recognition
Interest income is recorded on the accrual basis.
Corporate actions and dividend income, net of foreign tax withholding are recorded on the ex-date.
Awards from class action litigation are recorded as a reduction of cost if the Fund still owns the applicable securities on the payment date. If the Fund no longer owns the applicable securities, the proceeds are recorded as realized gains.
Expenses
General expenses of the Trust are allocated to the Fund and other series of the Trust based upon relative net assets or other expense allocation methodologies determined by the nature of the expense. Expenses directly attributable to a specific class of shares are charged to that share class. Expenses directly attributable to the Fund are charged to the Fund.
Determination of Class Net Asset Value
All income, expenses (other than class-specific expenses which are charged directly to a share class, as shown in the Statement of Operations) and realized and unrealized gains (losses) are allocated to each class of the Fund on a daily basis, based on the relative net assets of each class, for purposes of determining the net asset value of each class.
Federal Income Tax Status
The Fund intends to qualify each year as a regulated investment company under Subchapter M of the Internal Revenue Code, as amended, and will distribute substantially all of its tax exempt or taxable income, if any, for its tax year, and as such will not be subject to federal income taxes. In addition, the Fund intends to distribute in each calendar year substantially all of its net investment income, capital gains and certain other amounts, if any, such that the Fund should not be subject to federal excise tax. Therefore, no federal income or excise tax provision is recorded.
Distributions to Shareholders
Distributions from net investment income are declared and paid quarterly. Net realized capital gains, if any, are distributed at least annually. Income distributions and capital gain distributions are determined in accordance with federal income tax regulations which may differ from GAAP.
24
Columbia Energy and Natural Resources Fund
March 31, 2011
Indemnifications
Under the Trust’s organizational documents and, in some cases, by contract, its officers and directors are indemnified against certain liabilities arising out of the performance of their duties to the Fund. In addition, certain of the Fund’s contracts with its service providers contain general indemnification clauses. The Fund’s maximum exposure under these arrangements is unknown since the amount of any future claims that may be made against the Fund cannot be determined and the Fund has no historical basis for predicting the likelihood of any such claims.
Note 3. Fees and Compensation Paid to Affiliates
Investment Management Fee
Under an Investment Management Services Agreement (IMSA), the Investment Manager determines which securities will be purchased, held or sold. The management fee is equal to a percentage of the Fund’s average daily net assets that declines from 0.60% to 0.43% as the Fund’s net assets increase.
Prior to the Closing, Columbia Management Advisors, LLC (Columbia), an indirect, wholly owned subsidiary of Bank of America Corporation (BOA), provided investment management services to the Fund under the same fee structure. The effective management fee rate for the year ended March 31, 2011, was 0.60% of the Fund’s average daily net assets.
In September 2010, the Board of Trustees approved an amended IMSA that includes an annual management fee rate that declines from 0.69% to 0.54% as the Fund’s net assets increase and would increase the management fees payable to the Investment Manager at certain asset levels. The amended IMSA was approved by the Fund’s shareholders at a meeting held on February 15, 2011. The amended IMSA was effective on May 1, 2011.
Administration Fee
Effective upon the Closing, the Investment Manager provides administration and accounting services to the Fund under an Administrative Services Agreement, including services previously performed under the Pricing and Bookkeeping Oversight and Services Agreement (the Services Agreement) as discussed in the Pricing and Bookkeeping Fees note below. The Fund pays an annual administration fee equal to 0.15% of the Fund’s average daily net assets less the fees payable by the Fund as described under the Pricing and Bookkeeping Fees note below. Prior to the Closing, Columbia provided administrative services to the Fund at the same fee rates.
In September 2010, the Board of Trustees approved an amended Administrative Services Agreement that includes an annual administration fee rate that declines from 0.06% to 0.04% as the Fund’s net assets increase and would decrease the administration fees payable to the Investment Manager at all asset levels. The amended Administrative Services Agreement was effective on May 1, 2011.
Pricing and Bookkeeping Fees
Prior to the Closing, the Fund entered into a Financial Reporting Services Agreement (the Financial Reporting Services Agreement) with State Street Bank and Trust Company (State Street) and Columbia pursuant to which State Street provides financial reporting services to the Fund. The Fund also entered into an Accounting Services Agreement (collectively with the Financial Reporting Services Agreement, the State Street Agreements) with State Street and Columbia pursuant to which State Street provides accounting services to the Fund. Upon the Closing, Columbia assigned and delegated its rights and obligations under the State Street Agreements to the Investment Manager. Under the State Street Agreements, the Fund pays State Street an annual fee of $38,000 paid monthly plus an additional monthly fee based on an annualized percentage rate of average daily net assets of the Fund for the month. The aggregate fee will not exceed $140,000 per year (exclusive of out-of-pocket expenses and charges). The Fund also reimburses State Street for certain out-of-pocket expenses and charges.
Also prior to the Closing, the Fund entered into the Services Agreement with Columbia. Under the Services Agreement, Columbia provided services related to Fund expenses and the requirements of the Sarbanes-Oxley Act of 2002, and provided oversight of the accounting and financial reporting services provided by State Street. Under the Services Agreement, the Fund reimbursed Columbia for out-of-pocket expenses and charges, including fees payable to third parties, such as for pricing the Fund’s portfolio securities, incurred by Columbia in the performance of services under the Services Agreement. The Services Agreement was terminated upon the Closing. These services are now provided under the Administrative Services Agreement discussed above.
Transfer Agent Fee
In connection with the Closing, RiverSource Service Corporation, a wholly owned subsidiary of Ameriprise Financial, provides transfer agency services to the Fund under a Transfer Agency Agreement and changed its name to Columbia Management Investment Services
25
Columbia Energy and Natural Resources Fund
March 31, 2011
Corp. (the Transfer Agent). The Transfer Agent has contracted with Boston Financial Data Services (BFDS) to serve as sub-transfer agent.
The Transfer Agent receives monthly account-based service fees that vary by class and are based on the number of open accounts, and is reimbursed by the Fund for the fees and expenses the Transfer Agent pays to financial intermediaries that maintain omnibus accounts with the Fund that is a percentage of the average aggregate value of the Fund’s shares maintained in each such omnibus account (other than omnibus accounts for which American Enterprise Investment Services Inc. is the broker of record or accounts where the beneficial shareholder is a customer of Ameriprise Financial Services, Inc., which are paid a per account fee). The Transfer Agent pays the fees of BFDS for services as sub-transfer agent and, is not entitled to reimbursement for such fees from the Fund (with the exception of out-of pocket fees). The Transfer Agent also receives compensation from fees for various shareholder services and reimbursements for certain out-of -pocket expenses. Class I shares do not pay any transfer agency fees. Total transfer agent fees for Class R4 shares are subject to an annual limitation of not more than 0.05% of the average daily net assets attributable to the Class R4 shares.
Prior to the Closing, Columbia Management Services, Inc., an affiliate of Columbia and an indirect, wholly owned subsidiary of BOA, provided transfer agency services to the Fund and contracted with BFDS to serve as sub-transfer agent, under the same fee structure.
For the year ended March 31, 2011, the Fund’s effective transfer agent fee rate for each class, with the exception of Class I shares, as a percentage of the average daily net assets was as follows:
| | | | | | | | | | |
| | | | | | | | | | | |
| Class A | | Class B | | Class C | | Class R | | Class R4 | | Class Z |
| 0.19% | | 0.24% | | 0.19% | | 0.23% | | 0.05% | | 0.19% |
An annual minimum account balance fee of $20 may apply to certain accounts with a value below the Fund’s initial minimum investment requirements to reduce the impact of small accounts on transfer agent fees. These minimum account balance fees are recorded as part of expense reductions on the Statement of Operations. For the year ended March 31, 2011, no minimum account balance fees were charged by the Fund.
Plan Administration Fee
Under a Plan Administration Services Agreement with the Transfer Agent, the Fund pays an annual fee at a rate of 0.25% of the Fund’s average daily net assets attributable to Class R4 shares for the provision of various administrative, recordkeeping, communication and educational services.
Underwriting Discounts, Service and Distribution Fees
In connection with the Closing, RiverSource Fund Distributors, Inc., an indirect wholly owned subsidiary of Ameriprise Financial, provides distribution and shareholder services to the Fund and changed its name to Columbia Management Investment Distributors, Inc. (the Distributor). Pursuant to Rule 12b-1 under the 1940 Act, the Board of Trustees has approved, and the Fund has adopted, distribution and shareholder service plans (the Plans) which set the distribution and service fees for the Fund. These fees are calculated daily and are intended to compensate the Distributor and/or eligible selling and/or servicing agents for selling shares of the Fund and providing services to investors.
The Plans require the payment of a monthly service fee to the Distributor at the maximum annual rate of 0.25% of the average daily net assets attributable to Class A, Class B and Class C shares of the Fund. The Plans also require the payment of a monthly distribution fee to the Distributor at the maximum annual rates of 0.75% of the average daily net assets attributable to Class B and Class C shares and 0.50% of the average daily net assets attributable to Class R shares. These fees are intended to compensate the Distributor and/or eligible selling and/or servicing agents for selling shares of the Fund and providing services to investors.
Prior to the Closing, Columbia Management Distributors, Inc., an affiliate of Columbia and an indirect, wholly owned subsidiary of BOA, was the principal underwriter of the Fund’s shares. There were no changes to the underwriting discount structure of the Fund or the service or distribution fee rates paid by the Fund as a result of the Transaction.
Sales Charges
Sales charges, including front-end and CDSC’s, received by the Distributor for distributing Fund shares were $31,630 for Class A and $5,798 for Class C shares for the year ended March 31, 2011.
Fee Waivers and Expense Reimbursements
The Investment Manager has voluntarily agreed to bear a portion of the Fund’s expenses so that the Fund’s ordinary operating expenses (excluding brokerage commissions, interest, taxes and extraordinary expenses, but including custodian charges relating to overdrafts, if any), after giving effect to any balance credits from the Fund’s
26
Columbia Energy and Natural Resources Fund
March 31, 2011
custodian, do not exceed the annual rates of 1.45%, 2.20%, 2.20%, 1.06%, 1.70%, 1.36% and 1.20% of the Fund’s average daily net assets attributable to Class A, Class B, Class C, Class I, Class R, Class R4 and Class Z shares, respectively. The Investment Manager, in its discretion, may revise or discontinue this arrangement at any time. Prior to May 1, 2010, Columbia voluntarily reimbursed a portion of the Fund’s expenses in the same manner.
Effective May 1, 2011, the Investment Manager and certain of its affiliates have contractually agreed to waive fees or reimburse expenses, through July 31, 2012, so that the Fund’s ordinary operating expenses (excluding certain expenses described below), after giving effect to any balance credits or overdraft charges from the Fund’s custodian, do not exceed the annual rates of 1.45%, 2.20%, 2.20%, 1.07%, 1.70%, 1.37% and 1.20% of the Fund’s average daily net assets attributable to Class A, Class B, Class C, Class I, Class R, Class R4 and Class Z shares, respectively. The following expenses are excluded from the Fund’s ordinary operating expenses when calculating the cap, and therefore will be paid by the Fund: taxes (including foreign transaction taxes), expenses associated with investment in other pooled investment vehicles (including exchange traded funds and other affiliated and unaffiliated mutual funds), transaction costs and brokerage commissions, costs related to any securities lending program, dividend expenses associated with securities sold short, inverse floater program fees and expenses, transaction charges and interest on borrowed money, interest, extraordinary expenses and any other expenses the exclusion of which is specifically approved by the Fund’s Board of Trustees. This agreement may be modified or amended only with approval from all parties.
Fees Paid to Officers and Trustees
In connection with the Closing, all officers of the Fund are employees of the Investment Manager or its affiliates and, with the exception of the Fund’s Chief Compliance Officer, receive no compensation from the Fund. The Board of Trustees has appointed a Chief Compliance Officer to the Fund in accordance with federal securities regulations. The Fund, along with other affiliated funds, pays its pro-rata share of the expenses associated with the Chief Compliance Officer. The Fund’s expenses for the Chief Compliance Officer will not exceed $15,000 per year. Prior to the Closing, all officers of the Fund were employees of Columbia or its affiliates and the Fund paid its pro-rata share of the expenses for the Chief Compliance Officer under the same fee structure.
Trustees are compensated for their services to the Fund, as set forth on the Statement of Operations. The Trust’s eligible Trustees may participate in a deferred compensation plan which may be terminated at any time. Obligations of the plan will be paid solely out of the Fund’s assets.
Note 4. Custody Credits
The Fund has an agreement with its custodian bank under which custody fees may be reduced by balance credits. These credits are recorded as part of expense reductions on the Statement of Operations. The Fund could have invested a portion of the assets utilized in connection with the expense offset arrangement in an income-producing asset if it had not entered into such an agreement. For the year ended March 31, 2011, these custody credits reduced total expenses by $314 for the Fund.
Note 5. Portfolio Information
The cost of purchases and proceeds from sales of securities, excluding short-term obligations, aggregated $3,989,674,712 and $3,946,966,452, respectively, for the year ended March 31, 2011.
Note 6. Regulatory Settlements
During the year ended March 31, 2010, the Fund received payments totaling $35,194 resulting from certain regulatory settlements with third parties in which the Fund had participated. The payments have been included in “Increase from regulatory settlements” in the Statement of Changes in Net Assets.
Note 7. Shareholder Concentration
As of March 31, 2011, two shareholder accounts owned 33.4% of the outstanding shares of the Fund. Purchase and redemption activity of these accounts may have a significant effect on the operations of the Fund.
Note 8. Line of Credit
Prior to March 28, 2011, the Fund and other affiliated funds participated in a $280,000,000 committed, unsecured revolving line of credit provided by State Street. Effective March 28, 2011, the commitment was reduced to $225,000,000. The maximum amount that may be borrowed by any fund is limited to the lesser of $200,000,000 and the Fund’s borrowing limit set forth in the Fund’s registration statement. Borrowings are available for short-term liquidity or temporary or emergency purposes.
Effective October 14, 2010, interest is charged to each participating fund based on the fund’s borrowings at a rate per annum equal to the greater of the Federal Funds Rate plus 1.25% or the overnight LIBOR Rate plus 1.25%. In addition, a commitment fee of 0.125%
27
Columbia Energy and Natural Resources Fund
March 31, 2011
per annum is accrued and apportioned among the participating funds pro rata based on their relative net assets.
Prior to October 14, 2010, interest was charged to each participating fund at the same rates. In addition, a commitment fee of 0.15% per annum was accrued and apportioned among the participating funds pro rata based on their relative net assets.
For the year ended March 31, 2011, the average daily loan balance outstanding on days where borrowing existed was $3,530,769 at a weighted average interest rate of 1.48%.
Note 9. Federal Tax Information
The timing and character of income and capital gain distributions are determined in accordance with income tax regulations, which may differ from GAAP. Reclassifications are made to the Fund’s capital accounts for permanent tax differences to reflect income and gains available for distribution (or available capital loss carryforwards) under income tax regulations.
For the year ended March 31, 2011, permanent book and tax basis differences resulting primarily from differing treatments for foreign currency transactions and passive foreign investment company (“PFIC”) adjustments were identified and reclassified among the components of the Fund’s net assets as follows:
| | | | |
| | | | | |
Undistributed Net Investment
Income | | Accumulated Net Realized
Loss | | Paid-In
Capital |
| $(86,370) | | $153,555 | | $(67,185) |
Net investment income and net realized gains (losses), as disclosed on the Statement of Operations, and net assets were not affected by this reclassification.
The tax character of distributions paid during the years ended March 31, 2011 and March 31, 2010 was as follows:
| | | | |
| | | March 31,
2011 | | March 31,
2010 |
| Distributions paid from: | | | | |
| Ordinary Income* | | $1,179,755 | | $1,521,692 |
| * | For tax purposes short-term capital gain distributions, if any, are considered ordinary income distributions. |
As of March 31, 2011, the components of distributable earnings on a tax basis were as follows:
| | | | |
| | | | | |
Undistributed
Ordinary Income | | Undistributed Long-Term Capital Gains | | Net
Unrealized Appreciation* |
| $1,419,653 | | $— | | $180,783,792 |
| * | The differences between book-basis and tax-basis net unrealized appreciation are primarily due to deferral of losses from wash sales. |
Unrealized appreciation and depreciation at March 31, 2011, based on cost of investments for federal income tax purposes were:
| | | | |
| | | | |
Unrealized appreciation | | $ | 187,981,156 | |
Unrealized depreciation | | | (7,197,364 | ) |
| | | | |
Net unrealized appreciation | | $ | 180,783,792 | |
The following capital loss carryforwards may be available to reduce taxable income arising from future net realized gains on investments, if any, to the extent permitted by the Internal Revenue Code:
| | |
| | | |
| Year of Expiration | | Capital Loss Carryforwards |
| 2018 | | $9,909,297 |
Capital loss carryforwards of $94,578,081 were utilized during
the year ended March 31, 2011.
Management of the Fund has concluded that there are no significant uncertain tax positions that would require recognition in the financial statements. However, management’s conclusion may be subject to review and adjustment at a later date based on factors including, but not limited to, new tax laws, regulations, and administrative interpretations (including relevant court decisions). The Fund’s federal tax returns for the prior three fiscal years remain subject to examination by the Internal Revenue Service.
Note 10. Significant Risks and Contingencies
Non-Diversification Risk
A non-diversified fund is permitted to invest a greater percentage of its total assets in fewer companies than a diversified fund. The Fund may, therefore, have a greater risk of loss from a few issuers than a similar fund that invests more broadly.
Note 11. Subsequent Events
Management has evaluated the events and transactions that have occurred through the date the financial statements were issued. Other
28
Columbia Energy and Natural Resources Fund
March 31, 2011
than as noted below and in Note 3 above, there were no items requiring adjustment of the financial statements or additional disclosure.
Effective May 16, 2011, the line of credit commitment with State Street was reduced to $150,000,000, and the maximum amount that may be borrowed by any fund was limited to the lesser of $120,000,000 and the Fund’s borrowing limit set forth in the Fund’s registration statement.
Note 12. Information Regarding Pending and Settled Legal Proceedings
In June 2004, an action captioned John E. Gallus et al. v. American Express Financial Corp. and American Express Financial Advisors Inc. was filed in the United States District Court for the District of Arizona. The plaintiffs allege that they are investors in several American Express Company (now known as RiverSource) mutual funds and they purport to bring the action derivatively on behalf of those funds under the Investment Company Act of 1940. The plaintiffs allege that fees allegedly paid to the defendants by the funds for investment advisory and administrative services are excessive. The plaintiffs seek remedies including restitution and rescission of investment advisory and distribution agreements. The plaintiffs voluntarily agreed to transfer this case to the United States District Court for the District of Minnesota (the District Court). In response to defendants’ motion to dismiss the complaint, the District Court dismissed one of plaintiffs’ four claims and granted plaintiffs limited discovery. Defendants moved for summary judgment in April 2007. Summary judgment was granted in the defendants’ favor on July 9, 2007. The plaintiffs filed a notice of appeal with the Eighth Circuit Court of Appeals (the Eighth Circuit) on August 8, 2007. On April 8, 2009, the Eighth Circuit reversed summary judgment and remanded to the District Court for further proceedings. On August 6, 2009, defendants filed a writ of certiorari with the U.S. Supreme Court (the Supreme Court), asking the Supreme Court to stay the District Court proceedings while the Supreme Court considers and rules in a case captioned Jones v. Harris Associates, which involves issues of law similar to those presented in the Gallus case. On March 30, 2010, the Supreme Court issued its ruling in Jones v. Harris Associates, and on April 5, 2010, the Supreme Court vacated the Eighth Circuit’s decision in the Gallus case and remanded the case to the Eighth Circuit for further consideration in light of the Supreme Court’s decision in Jones v. Harris Associates. On June 4, 2010, the Eighth Circuit remanded the Gallus case to the District Court for further consideration in light of the Supreme Court’s decision in Jones v. Harris Associates. On December 9, 2010, the District Court reinstated its July 9, 2007 summary judgment order in favor of the defendants. On January 10, 2011, plaintiffs filed a notice of appeal with the Eighth Circuit.
In December 2005, without admitting or denying the allegations, American Express Financial Corporation (AEFC, which is now known as Ameriprise Financial, Inc. (Ameriprise Financial)), entered into settlement agreements with the Securities and Exchange Commission (SEC) and Minnesota Department of Commerce (MDOC) related to market timing activities. As a result, AEFC was censured and ordered to cease and desist from committing or causing any violations of certain provisions of the Investment Advisers Act of 1940, the Investment Company Act of 1940, and various Minnesota laws. AEFC agreed to pay disgorgement of $10 million and civil money penalties of $7 million. AEFC also agreed to retain an independent distribution consultant to assist in developing a plan for distribution of all disgorgement and civil penalties ordered by the SEC in accordance with various undertakings detailed at http://www.sec.gov/litigation/admin/ia-2451.pdf. Ameriprise Financial and its affiliates have cooperated with the SEC and the MDOC in these legal proceedings, and have made regular reports to the funds’ Boards of Directors/Trustees.
Ameriprise Financial and certain of its affiliates have historically been involved in a number of legal, arbitration and regulatory proceedings, including routine litigation, class actions, and governmental actions, concerning matters arising in connection with the conduct of their business activities. Ameriprise Financial believes that the Funds are not currently the subject of, and that neither Ameriprise Financial nor any of its affiliates are the subject of, any pending legal, arbitration or regulatory proceedings that are likely to have a material adverse effect on the Funds or the ability of Ameriprise Financial or its affiliates to perform under their contracts with the Funds. Ameriprise Financial is required to make 10-Q, 10-K and, as necessary, 8-K filings with the Securities and Exchange Commission on legal and regulatory matters that relate to Ameriprise Financial and its affiliates. Copies of these filings may be obtained by accessing the SEC website at www.sec.gov.
There can be no assurance that these matters, or the adverse publicity associated with them, will not result in increased fund redemptions, reduced sale of fund shares or other adverse consequences to the Funds. Further, although we believe proceedings are not likely to have a material adverse effect on the Funds or the ability of Ameriprise Financial or its affiliates to perform under their contracts with the Funds, these proceedings are subject to uncertainties and, as such, we are unable to estimate the possible loss or range of loss that may result. An adverse outcome in one or more of these proceedings could result in adverse judgments, settlements, fines, penalties or other relief that could have a material adverse effect on the consolidated financial condition or results of operations of Ameriprise Financial.
29
Report of Independent Registered Public Accounting Firm
To the Trustees of Columbia Funds Series Trust I and the Shareholders of Columbia Energy and Natural Resources Fund
In our opinion, the accompanying statement of assets and liabilities, including the investment portfolio, and the related statements of operations and of changes in net assets and the financial highlights present fairly, in all material respects, the financial position of Columbia Energy and Natural Resources Fund (the “Fund”) (a series of Columbia Funds Series Trust I) at March 31, 2011, the results of its operations for the year then ended, the changes in its net assets for each of the two years in the period then ended, and the financial highlights for the periods indicated, in conformity with accounting principles generally accepted in the United States of America. These financial statements and financial highlights (hereafter referred to as “financial statements”) are the responsibility of the Fund’s management; our responsibility is to express an opinion on these financial statements based on our audits. We conducted our audits of these financial statements in accordance with the standards of the Public Company Accounting Oversight Board (United States). Those standards require that we plan and perform the audit to obtain reasonable assurance about whether the financial statements are free of material misstatement. An audit includes examining, on a test basis, evidence supporting the amounts and disclosures in the financial statements, assessing the accounting principles used and significant estimates made by management, and evaluating the overall financial statement presentation. We believe that our audits, which included confirmation of securities at March 31, 2011 by correspondence with the custodian and brokers, provide a reasonable basis for our opinion.
PricewaterhouseCoopers LLP
Boston, Massachusetts
May 20, 2011
30
Federal Income Tax Information (Unaudited) – Columbia Energy and Natural Resources Fund
100.00% of the ordinary income distributed by the Fund for the fiscal year ended March 31, 2011, qualifies for the corporate dividends received deduction.
For non-corporate shareholders 100.00%, or the maximum amount allowable under the Jobs and Growth Tax Relief Reconciliation Act of 2003, of ordinary income distributed by the Fund for the fiscal year ended March 31, 2011 may represent qualified dividend income.
The Fund will notify shareholders in January 2012 of amounts for use in preparing 2011 income tax returns.
31
Fund Governance
The Trustees serve terms of indefinite duration. The names, addresses and birth years of the Trustees and Officers of the Funds in Columbia Funds Series Trust I, the year each was first elected or appointed to office, their principal business occupations during at least the last five years, the number of Funds overseen by each Trustee and other directorships they hold are shown below, as of May 2, 2011. Each officer listed below serves as an officer of each Fund in Columbia Funds Series Trust I.
Independent Trustees
| | |
Name, Address and Year of Birth,
Position with Funds, Year First
Elected or Appointed to Office | | Principal Occupation(s) During Past Five Years, Number of Funds in Columbia Funds
Complex Overseen by Trustee, Other Directorships Held |
| |
| John D. Collins (born 1938) | | |
c/o Columbia Management Investment Advisers, LLC 225 Franklin Street Boston, MA 02110 Trustee (since 2005) | | Retired. Consultant, KPMG, LLP (accounting and tax firm) from July 1999 to June 2000; Partner, KPMG, LLP from March 1962 to June 1999. Oversees 46; Mrs. Fields Original Cookies, Inc. (consumer products); Suburban Propane Partners, L.P.; and Montpelier Re (insurance underwriting firm) |
| |
| Rodman L. Drake (born 1943) | | |
c/o Columbia Management Investment Advisers, LLC 225 Franklin Street Boston, MA 02110 Trustee (since 1994) and Chairman of the Board (since 2009) | | Independent consultant since 2010; Co-Founder of Baringo Capital LLC (private equity) from 1997 to 2008; CEO of Crystal River Capital, Inc. (real estate investment trust) from 2003 to 2010; Oversees 46; Jackson Hewitt Tax Service Inc. (tax preparation services); Celgene Corporation (global biotechnology company); Student Loan Corporation (student loan provider); Crystal River Capital, Inc. from 2005 to 2010; Parsons Brinckerhoff from 1995 to 2008; the Helios Funds (closed-end funds); and Apex Silver Mines Ltd. from 2007 to 2009 |
| |
| Douglas A. Hacker (born 1955) | | |
c/o Columbia Management Investment Advisers, LLC 225 Franklin Street Boston, MA 02110 Trustee (since 1996) | | Independent business executive since May 2006; Executive Vice President–Strategy of United Airlines (airline) from December 2002 to May 2006; President of UAL Loyalty Services (airline marketing company) from September 2001 to December 2002; Executive Vice President and Chief Financial Officer of United Airlines from July 1999 to September 2001. Oversees 46; Nash Finch Company (food distributor); Aircastle Limited (aircraft leasing); and SeaCube Container Leasing Ltd (container leasing) |
|
| Janet Langford Kelly (born 1957) |
c/o Columbia Management Investment Advisers, LLC 225 Franklin Street Boston, MA 02110 Trustee (since 1996) | | Senior Vice President, General Counsel and Corporate Secretary, ConocoPhillips (integrated energy company) since September 2007; Deputy General Counsel–Corporate Legal Services, ConocoPhillips from August 2006 to August 2007; Partner, Zelle, Hofmann, Voelbel, Mason & Gette LLP (law firm) from March 2005 to July 2006; Adjunct Professor of Law, Northwestern University, from September 2004 to June 2006; Director, UAL Corporation (airline) from February 2006 to July 2006; Oversees 46; None |
| |
| William E. Mayer (born 1940) | | |
c/o Columbia Management Investment Advisers, LLC 225 Franklin Street Boston, MA 02110 Trustee (since 1994) | | Partner, Park Avenue Equity Partners (private equity) since February 1999; Dean and Professor, College of Business and Management, University of Maryland from 1992 to 1996. Oversees 46; DynaVox Inc. (software developer); Lee Enterprises (print media), WR Hambrecht + Co. (financial service provider); BlackRock Kelso Capital Corporation (investment company) |
32
Fund Governance (continued)
Independent Trustees (continued)
| | |
Name, Address and Year of Birth,
Position with Funds, Year First
Elected or Appointed to Office | | Principal Occupation(s) During Past Five Years, Number of Funds in Columbia Funds
Complex Overseen by Trustee, Other Directorships Held |
| |
| David M. Moffett (born 1952) | | |
c/o Columbia Management Investment Advisers, LLC 225 Franklin Street Boston, MA 02110 Trustee (since 2011) | | Retired. Chief Executive Officer, Federal Home Loan Mortgage Corporation, from 2008 to 2009; Senior Adviser, Global Financial Services Group, Carlyle Group, Inc., from 2007 to 2008; Vice Chairman and Chief Financial Officer, U.S. Bancorp, from 1993 to 2007. Oversees 46; CIT Group Inc. (commercial and consumer finance), eBay Inc. (online trading community), MBIA Corp (financial service provider), E.W. Scripps Co. (print and television media), Building Materials Holding Corp. (building materials and construction services), and University of Oklahoma Foundation. |
| |
| Charles R. Nelson (born 1942) | | |
c/o Columbia Management Investment Advisers, LLC 225 Franklin Street Boston, MA 02110 Trustee (since 1981) | | Professor of Economics, University of Washington, since January 1976; Ford and Louisa Van Voorhis Professor of Political Economy, University of Washington, since September 1993; Adjunct Professor of Statistics, University of Washington, since September 1980; Associate Editor, Journal of Money Credit and Banking, 1993-2008; Consultant on econometric and statistical matters. Oversees 46; None |
| |
| John J. Neuhauser (born 1943) | | |
c/o Columbia Management Investment Advisers, LLC 225 Franklin Street Boston, MA 02110 Trustee (since 1984) | | President, Saint Michael’s College, since August 2007; Director or Trustee of several non-profit organization, including Fletcher Allen Health Care, Inc.; University Professor, Boston College from November 2005 to August 2007; Academic Vice President and Dean of Faculties, Boston College from August 1999 to October 2005. Oversees 46; Liberty All-Star Equity Fund and Liberty All-Star Growth Fund, Inc. (closed-end funds) |
| |
| Jonathan Piel (born 1938) | | |
c/o Columbia Management Investment Advisers, LLC 225 Franklin Street Boston, MA 02110 Trustee (since 1994) | | Cable television producer and website designer; The Editor, Scientific American from 1984 to 1994; Vice President, Scientific American, Inc., from 1984 to 1994; Member, Advisory Board, Stone Age Institute, Bloomington, Indiana (research institute that explores the effect of technology on human evolution); Member, Board of Directors of the National Institute of Social Sciences, New York City; Member, Board of Trustees of the William Alanson White Institute, New York City (institution for training psychoanalysts); and Member, Advisory Board, Mount Sinai Children’s Environmental Health Center, New York. Oversees 46; None |
| |
| Patrick J. Simpson (born 1944) | | |
c/o Columbia Management Investment Advisers, LLC 225 Franklin Street Boston, MA 02110 Trustee (since 2000) | | Partner, Perkins Coie LLP (law firm). Oversees 46; None |
| |
| Anne-Lee Verville (born 1945) | | |
c/o Columbia Management Investment Advisers, LLC 225 Franklin Street Boston, MA 02110 Trustee (since 1998) | | Retired since 1997 (formerly General Manager–Global Education Industry from 1994 to 1997, President–Application Systems Division from 1991 to 1994, Chief Financial Officer–US Marketing & Services from 1988 to 1991, and Chief Information Officer from 1987 to 1988, IBM Corporation (computer and technology)). Oversees 46; Enesco Group, Inc. (producer of giftware and home and garden decor products) from 2001 to 2006 |
33
Fund Governance (continued)
Interested Trustee
| | |
Name, Address and Year of Birth,
Position with Funds, Year First
Elected or Appointed to Office | | Principal Occupation(s) During Past Five Years, Number of Funds in Columbia Funds
Complex Overseen by Trustee, Other Directorships Held |
| |
| Michael A. Jones (born 1959) | | |
c/o Columbia Management Investment Advisers, LLC 225 Franklin Street Boston, MA 02110 Trustee (since 2011) Senior Vice President (since 2010) | | President and Director, Columbia Management Investment Advisers, LLC since May 2010; President and Director, Columbia Management Investment Distributors, Inc. since May 2010; Manager, Chairman, Chief Executive Officer and President, Columbia Management Advisors, LLC from 2007 to April 2010; Chief Executive Officer, President and Director, Columbia Management Distributors, Inc. from November 2006 to April 2010; previously, co-president and senior managing director at Robeco Investment Management. Oversees 46; None |
The Statement of Additional Information includes additional information about the Trustees of the Funds and is available, without charge, upon request by calling 1-800-345-6611.
34
Fund Governance (continued)
Officers
| | |
| Name, Year of Birth and Address | | Principal Occupation(s) During the Past Five Years |
|
| J. Kevin Connaughton (born 1964) |
225 Franklin Street Boston, MA 02110 President (since 2009) | | Senior Vice President and General Manager–Mutual Fund Products, Columbia Management Investment Advisers, LLC since May 2010; President, Columbia Funds, since 2009, and RiverSource Funds, since May 2010 (previously Senior Vice President and Chief Financial Officer, Columbia Funds, from June 2008 to January 2009, Treasurer, Columbia Funds, from October 2003 to May 2008, and senior officer of various other affiliated funds since 2000); Managing Director, Columbia Management Advisors, LLC from December 2004 to April 2010. |
| |
| Michael G. Clarke (born 1969) | | |
225 Franklin Street Boston, MA 02110 Treasurer (since 2011) and Chief Financial Officer (since 2009) | | Vice President, Columbia Management Investment Advisers, LLC since May 2010; Managing Director of Fund Administration, Columbia Management Advisors, LLC, from September 2004 to April 2010; senior officer of Columbia Funds and affiliated funds since 2002. |
| |
| Scott R. Plummer (born 1959) | | |
5228 Ameriprise Financial Center Minneapolis, MN 55474 Senior Vice President, Secretary and Chief Legal Officer (since 2010) | | Chief Legal Officer and Assistant Secretary, Columbia Management Investment Advisers, LLC since June 2005; Vice President and Lead Chief Counsel–Asset Management, Ameriprise Financial, Inc. since May 2010 (previously Vice President and Chief Counsel–Asset Management, from 2005 to April 2010, and Vice President–Asset Management Compliance from 2004 to 2005); Vice President, Chief Counsel and Assistant Secretary, Columbia Management Investment Distributors, Inc. since 2008; Vice President, General Counsel and Secretary, Ameriprise Certificate Company since 2005; Chief Counsel, RiverSource Distributors, Inc. since 2006; Vice President, General Counsel and Secretary, RiverSource Funds, since December 2006; Senior Vice President, Secretary and Chief Legal Officer, Columbia Funds, since May 2010. |
| |
| Linda J. Wondrack (born 1964) | | |
225 Franklin Street Boston, MA 02110 Senior Vice President and Chief Compliance Officer (since 2007) | | Vice President and Chief Compliance Officer, Columbia Management Investment Advisers, LLC since May 2010; Chief Compliance Officer, Columbia Funds, since 2007, and RiverSource Funds, since May 2010; Director (Columbia Management Group, LLC and Investment Product Group Compliance), Bank of America, from June 2005 to April 2010; Director of Corporate Compliance and Conflicts Officer of MFS Investment Management (investment management) from August 2004 to May 2005. |
| |
| William F. Truscott (born 1960) | | |
53600 Ameriprise Financial Center Minneapolis, MN 55474 Senior Vice President (since 2010) | | Chairman of the Board, Columbia Management Investment Advisers, LLC since May 2010 (previously President, Chairman of the Board and Chief Investment Officer, from 2001 to April 2010); Chief Executive Officer, U.S. Asset Management & President, Annuities, Ameriprise Financial, Inc. since May 2010 (previously President–U.S. Asset Management and Chief Investment Officer from 2005 to April 2010, and Senior Vice President–Chief Investment Officer, from 2001 to 2005); Director, President and Chief Executive Officer, Ameriprise Certificate Company since 2006; Director, Columbia Management Investment Distributors, Inc. since May 2010 (previously Chairman of the Board and Chief Executive Officer from 2008 to April 2010); Chairman of the Board and Chief Executive Officer, RiverSource Distributors, Inc. since 2006. |
35
Fund Governance (continued)
Officers (continued)
| | |
| Name, Year of Birth and Address | | Principal Occupation(s) During the Past Five Years |
|
| Colin Moore (born 1958) |
225 Franklin Street Boston, MA 02110 Senior Vice President (since 2010) | | Director and Chief Investment Officer, Columbia Management Investment Advisers, LLC since May 2010; Manager, Managing Director and Chief Investment Officer of Columbia Management Advisors, LLC from 2007 to April 2010; Head of Equities, Columbia Management Advisors, LLC from 2002 to 2007. |
| |
| Amy Johnson (born 1965) | | |
5228 Ameriprise Financial Center Minneapolis, MN 55474 Vice President (since 2010) | | Senior Vice President and Chief Operating Officer, Columbia Management Investment Advisers, LLC since May 2010 (previously Chief Administrative Officer, from 2009 until April 2010, Vice President–Asset Management and Trust Company Services, from 2006 to 2009, and Vice President–Operations and Compliance from 2004 to 2006). |
| |
| Joseph F. DiMaria (born 1968) | | |
225 Franklin Street Boston, MA 02110 Vice President (since 2011) and Chief Accounting Officer (since 2008) | | Vice President, Mutual Fund Administration, Columbia Management Investment Advisers, LLC, since May 2010; Director of Fund Administration, Columbia Management Advisors, LLC from January 2006 to April 2010; Head of Tax/Compliance and Assistant Treasurer, Columbia Management Advisors, LLC, from November 2004 to December 2005. |
| |
| Stephen T. Welsh (born 1957) | | |
225 Franklin Street Boston, MA 02110 Vice President (since 2006) | | President and Director, Columbia Management Investment Services Corp. since May 2010; President and Director, Columbia Management Services, Inc. from July 2004 to April 2010; Managing Director, Columbia Management Distributors, Inc. from August 2007 to April 2010. |
| |
| Paul D. Pearson (born 1956) | | |
5228 Ameriprise Financial Center Minneapolis, MN 55474
Vice President and Assistant Treasurer (since 2011) | | Vice President, Investment Accounting, Columbia Management Investment Advisers, LLC, since May 2010; Vice President, Managed Assets, Investment Accounting, Ameriprise Financial Corporation. |
| |
| Paul B. Goucher (born 1968) | | |
5228 Ameriprise Financial Center Minneapolis, MN 55474
Vice President and Assistant Treasurer (since 2010) | | Vice President and Chief Counsel of Ameriprise Financial since January 2010 (formerly Vice President and Group Counsel from November 2008 to January 2010); Director, Managing Director and General Counsel of J. & W. Seligman & Co. Incorporated (Seligman) from July 2008 to November 2008 and Managing Director and Associate General Counsel of Seligman from January 2005 to July 2008. |
| |
| Christopher O. Petersen (born 1970) | | |
5228 Ameriprise Financial Center Minneapolis, MN 55474
Vice President and Assistant Treasurer (since 2010) | | Vice President and Chief Counsel, Ameriprise Financial since January 2010 (formerly Vice President and Group Counsel or Counsel from April 2004 to January 2010); Assistant Secretary of RiverSource Funds since January 2007. |
| |
| Michael E. DeFao (born 1968) | | |
5228 Ameriprise Financial Center Minneapolis, MN 55474
Vice President and Assistant Treasurer (since 2011) | | Vice President and Chief Counsel, Ameriprise Financial since May 2010; Associate General Counsel Bank of America from June 2005 to April 2010 |
36
Shareholder Meeting Results
At a Joint Special Meeting of Shareholders held on February 15, 2011, shareholders of the Fund considered a proposal to approve a proposed amendment to the Investment Management Services Agreement with Columbia Management Investment Advisers, LLC. The proposal was approved as follows:
| | | | | | |
| | | | | | | |
| Votes For | | Votes Against | | Abstentions | | Broker Non-Votes |
| 415,705,167 | | 19,918,940 | | 11,008,276 | | 0 |
37
[THIS PAGE INTENTIONALLY LEFT BLANK]
38
[THIS PAGE INTENTIONALLY LEFT BLANK]
39
[THIS PAGE INTENTIONALLY LEFT BLANK]
40
Important Information About This Report
The fund mails one shareholder report to each shareholder address. If you would like more than one report, please call shareholder services at 1-800-345-6611 and additional reports will be sent to you. This report has been prepared for shareholders of Columbia Energy and Natural Resources Fund.
A description of the policies and procedures that the fund uses to determine how to vote proxies and a copy of the fund’s voting records are available (i) at www.columbiamanagement.com, (ii) on the Securities and Exchange Commission’s website at www.sec.gov, and (iii) without charge, upon request, by calling 1-800-368-0346. Information regarding how the fund voted proxies relating to portfolio securities during the 12-month period ended June 30 is available from the SEC’s website. Information regarding how the fund voted proxies relating to portfolio securities is also available from the fund’s website, www.columbiamanagement.com.
The fund files a complete schedule of portfolio holdings with the SEC for the first and third quarters of each fiscal year on Form N-Q. The fund’s Form N-Q is available on the SEC’s website at www.sec.gov and may be reviewed and copied at the SEC’s Public Reference Room in Washington, D.C. Information on the operation of the Public Reference Room may be obtained by calling
1-800-SEC-0330.
Transfer Agent
Columbia Management Investment Services Corp.
P.O. Box 8081
Boston, MA 02266-8081
1-800-345-6611
Distributor
Columbia Management Investment
Distributors, Inc.
225 Franklin Street
Boston, MA 02110
Investment Manager
Columbia Management Investment Advisers, LLC
225 Franklin Street
Boston, MA 02110
41

Columbia Energy and Natural Resources Fund
P.O. Box 8081
Boston, MA 02266-8081
columbiamanagement.com
This information is for use with concurrent or prior delivery of a fund prospectus. Investors should consider the investment objectives, risks, charges and expenses of a mutual fund carefully before investing. For a free prospectus, which contains this and other important information about the funds, visit columbiamanagement.com. Read the prospectus carefully before investing. The Fund is distributed by Columbia Management Investment Distributors, Inc., member FINRA, and managed by Columbia Management Investment Advisers, LLC.
©2011 Columbia Management Investment Advisers, LLC. All rights reserved.
C-1141 A (05/11)

Columbia International Growth Fund
Annual Report for the Period Ended March 31, 2011
Table of contents
The views expressed in this report reflect the current views of the respective parties. These views are not guarantees of future performance and involve certain risks, uncertainties and assumptions that are difficult to predict, so actual outcomes and results may differ significantly from the views expressed. These views are subject to change at any time based upon economic, market or other conditions and the respective parties disclaim any responsibility to update such views. These views may not be relied on as investment advice and, because investment decisions for a Columbia Fund are based on numerous factors, may not be relied on as an indication of trading intent on behalf of any particular Columbia Fund. References to specific securities should not be construed as a recommendation or investment advice.
President’s Message

Dear Shareholder:
The Columbia Management story began over 100 years ago, and today, we are one of the nation’s largest dedicated asset managers. The recent acquisition by Ameriprise Financial, Inc. brings together the talents, resources and capabilities of Columbia Management with those of RiverSource Investments, Threadneedle (acquired by Ameriprise in 2003) and Seligman Investments (acquired by Ameriprise in 2008) to build a best-in-class asset management business that we believe is truly greater than its parts.
RiverSource Investments traces its roots to 1894 when its then newly-founded predecessor, Investors Syndicate, offered a face-amount savings certificate that gave small investors the opportunity to build a safe and secure fund for retirement, education or other special needs. A mutual fund pioneer, Investors Syndicate launched Investors Mutual Fund in 1940. In the decades that followed, its mutual fund products and services lineup grew to include a full spectrum of styles and specialties. More than 110 years later, RiverSource continues to be a trusted financial products leader.
Threadneedle, a leader in global asset management and one of Europe’s largest asset managers, offers sophisticated international experience from a dedicated U.K. management team. Headquartered in London, it is named for Threadneedle Street in the heart of the city’s financial district, where British investors pioneered international and global investing. Threadneedle was acquired in 2003 and today operates as an affiliate of Columbia Management.
Seligman Investments’ beginnings date back to the establishment of the investment firm J. & W. Seligman & Co. in 1864. In the years that followed, Seligman played a major role in the geographical expansion and industrial development of the United States. In 1874, President Ulysses S. Grant named Seligman as fiscal agent for the U.S. Navy — an appointment that would last through World War I. Seligman helped finance the westward path of the railroads and the building of the Panama Canal. The firm organized its first investment company in 1929 and began managing its first mutual fund in 1930. In 2008, J. & W. Seligman & Co. Incorporated was acquired and Seligman Investments became an offering brand of RiverSource Investments, LLC.
We are proud of the rich and distinctive history of these firms, the strength and breadth of products and services they offer, and the combined cultures of pioneering spirit and forward thinking. Together we are committed to providing more for our shareholders than ever before.
| n | | A singular focus on our shareholders. Our business is asset management, so investors are our first priority. We dedicate our resources to identifying timely investment opportunities and provide a comprehensive choice of equity, fixed-income and alternative investments to help meet your individual needs. |
| n | | First-class research and thought leadership. We are dedicated to helping you take advantage of today’s opportunities and anticipate tomorrow’s. We stay abreast of the latest investment trends and ideas, using our collective insight to evaluate events and transform them into solutions you can use. |
| n | | A disciplined investment approach. We aren’t distracted by passing fads. Our teams adhere to a rigorous investment process that helps ensure the integrity of our products and enables you and your financial advisor to match our solutions to your objectives with confidence. |
When you choose Columbia Management, you can be confident that we will take the time to understand your needs and help you and your financial advisor identify the solutions that are right for you. Because at Columbia Management, we don’t consider ourselves successful unless you are.
Sincerely,

J. Kevin Connaughton
President, Columbia Funds
Investors should consider the investment objectives, risks, charges and expenses of a mutual fund carefully before investing. For a free prospectus, which contains this and other important information about the funds, visit www.columbiamanagement.com. The prospectus should be read carefully before investing.
Columbia Funds are distributed by Columbia Management Investment Distributors, Inc., member FINRA, and managed by Columbia Management Investment Advisers, LLC.
© 2011 Columbia Management Investment Advisers, LLC. All rights reserved.
Fund Profile – Columbia International Growth Fund
Summary
| n | | For the 12-month period that ended March 31, 2011, the fund’s Class A shares returned 12.20% without sales charge. |
| n | | The MSCI EAFE Growth Index (Net)1 returned 12.55%. The average fund in the Lipper International Large-Cap Growth Funds Classification2 returned 13.64%. |
| n | | Disappointing performance from certain Japan-based consumer discretionary stocks accounted for the fund’s modest shortfall against its benchmark. |
Portfolio Management
Fred Copper has managed or co-managed the fund since 2007 and has been associated with the fund’s adviser or the fund’s previous adviser or its predecessors since 2005.
| 1 | The Morgan Stanley Capital International Europe, Australasia, Far East (MSCI EAFE) Growth Index (Net) is a subset of the MSCI EAFE Index (Net), and constituents of the index include securities from Europe, Australasia and the Far East. The index generally represents approximately 50% of the free float-adjusted market capitalization of the MSCI EAFE Index (Net), and consists of those securities classified by Morgan Stanley Capital International (MSCI) as most representing the growth style, such as higher forecasted growth rates, lower book value-to-price ratios, lower forward earnings-to-price ratios and lower dividend yields than securities representing the value style. |
| 2 | Lipper Inc., a widely respected data provider in the industry, calculates an average total return (assuming reinvestment of distributions) for mutual funds with investment objectives similar to those of the fund. Lipper makes no adjustment for the effect of sales loads. |
Indices are not available for investment, are not professionally managed and do not reflect sales charges, fees, brokerage commissions, taxes or other expenses of investing. Securities in the fund may not match those in an index.
Performance data quoted represents past performance and current performance may be lower or higher. Past performance is no guarantee of future results. The investment return and principal value will fluctuate so that shares, when redeemed, may be worth more or less than the original cost. Please visit www.columbiamanagement.com for daily and most recent month-end performance updates.
Summary
1-year return as of 03/31/11
| | |
| |
 | | +12.20% Class A shares (without sales charge) |
| |
| | +12.55% MSCI EAFE Growth Index (Net) |
|
Morningstar Style BoxTM |
|
Equity Style |

|
The Morningstar Style BoxTM is based on the fund’s portfolio holdings. For equity funds, the vertical axis shows the market capitalization of the stocks owned, and the horizontal axis shows investment style (value, blend, or growth). Information shown is based on the most recent data provided by Morningstar.
© 2011 Morningstar, Inc. All rights reserved. The Morningstar information contained herein: (1) is proprietary to Morningstar and/or its content providers; (2) may not be copied or distributed; and (3) is not warranted to be accurate, complete or timely. Neither Morningstar nor its content providers are responsible for any damages or losses arising from any use of this information.
1
Economic Update – Columbia International Growth Fund
As the world shed concerns that key economies might lapse back into recession, the World Bank reported that global gross domestic product (GDP) rose 3.9% in 2010. The improvement over 2009 was more notable in high-income developed economies than in emerging-market countries, which had less ground to make up. Emerging market countries expanded by an estimated 7%, contributing nearly half of all global growth in 2010. This two-speed global recovery is likely to result in slower growth in 2011, but global growth should remain solid at 3.3% to 3.6%1 — higher in emerging market economies, led by China and India.
Robust expansion in the Asia Pacific region
Asian Pacific economies led the global economy in 2010 and are poised to continue in that role. Exports from markets such as Singapore and South Korea have been solid and domestic demand continues to strengthen. Labor markets are healthy, income is rising and confidence runs high across the region. Higher oil prices pose a downside risk to the current expansion, because it could erode demand for Asian exports and increase the risk of inflation. However, if growth exceeds expectations in the United States or Europe, the picture gets even better for Asia.
Austerity measures weigh on Europe
Growth in the developed world was hampered by a debt crisis in Europe’s weakest nations. However, the European Union took steps to manage debt restructuring in an orderly fashion and fear subsided — at least for now. In addition, austerity measures were introduced in Greece, Ireland, Portugal and Spain. Public employment and government spending were cut back sharply. Layoffs and pay cuts have been met with resistance, but their necessity is hard to dispute.
Inflation a growing worry
As demand picked up and commodity prices began to rise across the globe, inflation has become a growing worry in both fast-growing emerging markets and slower-growth developed countries. In developed market economies, inflation is generally an external force, resulting from higher commodity prices, especially for food and energy. In emerging markets, excess demand is driving inflation concerns and policymakers have begun to shift their focus from stimulating growth to taming inflation. However, rising food prices are also a problem in Asia since food accounts for a greater percentage of household budgets than it does in more developed areas of the world.
| 1 | World Bank estimate, January 12, 2011. |
Summary
For the 12-month period that ended March 31, 2011
| | n | | Despite intermittent volatility, stock markets around the world gained ground, as measured by the S&P 500 Index, the MSCI EAFE Index (Net) and the MSCI Emerging Markets Index (Net). | |
| | |
| S&P Index | | MSCI EAFE Index |
| |

| |
|
15.65% | | 10.42% |
| MSCI EM Index | | |
| |
| | |
18.46% | | |
2
Economic Update (continued) – Columbia International Growth Fund
Stocks stall, then pick up steam
Despite a period of volatility in the summer of 2010, as the world sought to digest a mounting debt crisis within euro zone countries, it was a good year for stock markets around the world. The U.S. stock market returned 15.65% for the 12-month period, as measured by the S&P 500 Index.2 Outside the U.S., stock market returns were also positive. The MSCI EAFE Index (Net),3 a broad gauge of stock market performance in foreign developed markets, gained 10.42% (in U.S. dollars) for the period. Although the European Union took steps early in the year to rein in debt problems in Greece, Ireland and Spain, recent revelations that Portugal may also need a bailout hampered returns from European markets. The impact of an earthquake, tsunami and a nuclear power plant debacle took a significant bite out of Japan’s returns in March, and Japan is a major component of the index. Emerging markets remained resilient, despite mounting fears about rising inflation. The MSCI Emerging Markets Index (Net)4 returned 18.46% (in U.S. dollars), led by strong performances from Eastern European markets.
Past performance is no guarantee of future results.
| 2 | The Standard & Poor’s (S&P) 500 Index tracks the performance of 500 widely held, large-capitalization U.S. stocks. |
| 3 | The Morgan Stanley Capital International Europe, Australasia, Far East (MSCI EAFE) Index (Net) is a free float- adjusted market capitalization index that is designed to measure the equity market performance of developed markets, excluding the U.S. & Canada. As of December 31, 2010, the MSCI EAFE Index (Net) consisted of the following 22 developed market country indices: Australia, Austria, Belgium, Denmark, Finland, France, Germany, Greece, Hong Kong, Ireland, Israel, Italy, Japan, the Netherlands, New Zealand, Norway, Portugal, Singapore, Spain, Sweden, Switzerland and the United Kingdom. |
| 4 | The Morgan Stanley Capital International Emerging Markets (MSCI EM) Index (Net) is a free float-adjusted market capitalization index that is designed to measure equity market performance of emerging markets. As of December 31, 2010, the MSCI EM Index (Net) consisted of the following 21 emerging market country indices: Brazil, Chile, China, Colombia, Czech Republic, Egypt, Hungary, India, Indonesia, Korea, Malaysia, Mexico, Morocco, Peru, Philippines, Poland, Russia, South Africa, Taiwan, Thailand and Turkey. |
Indices are not available for investment, are not professionally managed and do not reflect sales charges, fees, brokerage commissions, taxes or other expenses of investing. Securities in the fund may not match those in an index.
3
Performance Information – Columbia International Growth Fund
Performance data quoted represents past performance and current performance may be lower or higher. Past performance is no guarantee of future results. The investment return and principal value will fluctuate so that shares, when redeemed, may be worth more or less than the original cost. Please visit www.columbiamanagement.com for daily and most recent month-end performance updates.
| | | | |
| Net asset value per share | |
| |
As of 03/31/11 ($) | | | | |
Class A | | | 14.63 | |
Class C | | | 14.53 | |
Class Z | | | 14.68 | |
| | | | |
| Distributions declared per share | |
| |
04/01/10 – 03/31/11 ($) | | | | |
Class A | | | 0.26 | |
Class C | | | 0.17 | |
Class Z | | | 0.29 | |
|
| Performance of a $10,000 investment 04/01/01 – 03/31/11 |
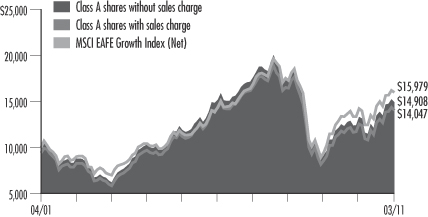
The chart above shows the change in value of a hypothetical $10,000 investment in Class A shares of Columbia International Growth Fund during the stated time period, and does not reflect the deduction of taxes that a shareholder may pay on fund distributions or on the redemption of fund shares.
| | | | | | | | |
| Performance of a $10,000 investment 04/01/01 – 03/31/11 ($) | |
| | |
| Sales charge | | without | | | with | |
Class A | | | 14,908 | | | | 14,047 | |
Class C | | | 14,578 | | | | 14,578 | |
Class Z | | | 15,043 | | | | n/a | |
| | | | | | | | | | | | | | | | | | | | |
| Average annual total return as of 03/31/11 (%) | |
| | | |
| Share class | | A | | | C | | | Z | |
| Inception | | 03/31/08 | | | 03/31/08 | | | 07/21/87 | |
| Sales charge | | without | | | with | | | without | | | with | | | without | |
1-year | | | 12.20 | | | | 5.77 | | | | 11.37 | | | | 10.37 | | | | 12.43 | |
5-year | | | –0.35 | | | | –1.53 | | | | –0.80 | | | | –0.80 | | | | –0.17 | |
10-year | | | 4.07 | | | | 3.46 | | | | 3.84 | | | | 3.84 | | | | 4.17 | |
The “with sales charge” returns include the maximum initial sales charge of 5.75% for Class A shares and the applicable contingent deferred sales charge of 1.00% for Class C shares for the first year only. The “without sales charge” returns do not include the effect of sales charges. If they had, returns would be lower.
The Fund commenced operations on March 31, 2008. The returns of the Class A and Class C shares shown for periods prior to March 31, 2008 are those of the Shares class shares of International Fund, the predecessor to the Fund and a series of Excelsior Funds, Inc. (the “Predecessor Fund”). The returns shown reflect applicable sales charges, but have not been adjusted to reflect differences in expenses. If differences in expenses were reflected, the returns shown for the periods prior to March 31, 2008 would be lower. The returns of Class Z shares shown for periods prior to March 31, 2008 are those of Shares class shares of the Predecessor Fund. The returns of Class Z shares shown have not been adjusted to reflect differences in expenses.
Inception date refers to the date on which the Fund class commenced operations for Class A and Class C shares and the date on which the Predecessor Fund class commenced operations for Class Z shares.
Performance results reflect any fee waivers or reimbursements of fund expenses by the Investment Manager and/or any of its affiliates. Absent these fee waivers or expense reimbursement arrangements, performance results would have been lower.
All results shown assume the reinvestment of distributions. Class Z shares are sold at net asset value with no distribution and service (Rule 12b-1) fees. Class Z shares have limited eligibility and the investment minimum requirements may vary. Please see the fund’s prospectus for details. Performance for different share classes will vary based on differences in sales charges and fees associated with each class.
The tables do not reflect the deduction of taxes that a shareholder may pay on fund distributions or on the redemption of fund shares.
4
Understanding Your Expenses – Columbia International Growth Fund
As a fund shareholder, you incur two types of costs. There are transaction costs and ongoing costs, which generally include investment advisory fees, distribution and service (Rule 12b-1) fees and other fund expenses. The information on this page is intended to help you understand the ongoing costs of investing in the fund and to compare these costs with the ongoing costs of investing in other mutual funds.
Analyzing your fund’s expenses by share class
To illustrate these ongoing costs, we have provided an example and calculated the expenses paid by investors in each share class during the period. The information in the following table is based on an initial investment of $1,000, which is invested at the beginning of the period and held for the entire period. Expense information is calculated two ways and each method provides you with different information. The amount listed in the “Actual” column is calculated using the fund’s actual operating expenses and total return for the period. The amount listed in the “Hypothetical” column for each share class assumes that the return each year is 5% before expenses and is calculated based on the fund’s actual operating expenses. You should not use the hypothetical account values and expenses to estimate either your actual account balance at the end of the period or the expenses you paid during this period.
Compare with other funds
Since all mutual funds are required to include the same hypothetical calculations about expenses in shareholder reports, you can use this information to compare the ongoing costs of investing in the fund with other funds. To do so, compare the 5% hypothetical example with the 5% hypothetical examples that appear in the shareholder reports of other funds. As you compare hypothetical examples of other funds, it is important to note that hypothetical examples are meant to highlight the ongoing costs of investing in a fund and do not reflect any transaction costs, such as sales charges, redemption fees or exchange fees.
Estimating your actual expenses
To estimate the expenses that you paid over the period, first you will need your account balance at the end of the period:
| | n | | For shareholders who receive their account statements from Columbia Management Investment Services Corp., your account balance is available online at www.columbiamanagement.com or by calling Shareholder Services at 800.345.6611. | |
| | n | | For shareholders who receive their account statements from their financial intermediary, contact your financial intermediary to obtain your account balance. | |
| | 1. | Divide your ending account balance by $1,000. For example, if an account balance was $8,600 at the end of the period, the result would be 8.6. | |
| | 2. | In the section of the table below titled “Expenses paid during the period,” locate the amount for your share class. You will find this number in the column labeled “Actual.” Multiply this number by the result from step 1. Your answer is an estimate of the expenses you paid on your account during the period. | |
If the value of your account falls below the minimum initial investment requirement applicable to you, your account may be subject to a $20 annual fee. This fee is not included in the accompanying table. If you are subject to the fee, keep it in mind when you are estimating the ongoing expenses of investing in the fund and when comparing the expenses of this fund with other funds.
| | | | | | | | | | | | | | | | | | | | | | | | | | | | |
| 10/01/10 – 03/31/11 | | | | | | | | | | | | | | | | |
| | | | |
| | | Account value at the
beginning of the period ($) | | | Account value at the
end of the period ($) | | | Expenses paid
during the period ($) | | | Fund’s annualized
expense ratio (%) | |
| | | Actual | | | Hypothetical | | | Actual | | | Hypothetical | | | Actual | | | Hypothetical | | | Actual | |
Class A | | | 1,000.00 | | | | 1,000.00 | | | | 1,107.50 | | | | 1,017.80 | | | | 7.51 | | | | 7.19 | | | | 1.43 | |
Class C | | | 1,000.00 | | | | 1,000.00 | | | | 1,102.40 | | | | 1,014.06 | | | | 11.43 | | | | 10.95 | | | | 2.18 | |
Class Z | | | 1,000.00 | | | | 1,000.00 | | | | 1,107.90 | | | | 1,019.05 | | | | 6.20 | | | | 5.94 | | | | 1.18 | |
Expenses paid during the period are equal to the annualized expense ratio for the share class, multiplied by the average account value over the period, then multiplied by the number of days in the fund’s most recent fiscal half-year and divided by 365.
Had the Investment Manager and/or any of its affiliates not waived fees or reimbursed a portion of expenses, account value at the end of the period would have been reduced.
It is important to note that the expense amounts shown in the table are meant to highlight only ongoing costs of investing in the fund and do not reflect any transaction costs, such as sales charges, redemption fees or exchange fees. Therefore, the hypothetical examples provided may not help you determine the relative total costs of owning shares of different funds. If these transaction costs were included, your costs would have been higher.
5
Portfolio Manager’s Report – Columbia International Growth Fund
Performance data quoted represents past performance and current performance may be lower or higher. Past performance is no guarantee of future results. The investment return and principal value will fluctuate so that shares, when redeemed, may be worth more or less than the original cost. Please visit www.columbiamanagement.com for daily and most recent month-end performance updates.
| | | | |
| Top 10 holdings | | | |
| |
as of 03/31/11 (%) | | | | |
BHP Billiton | | | 4.1 | |
Rio Tinto | | | 3.2 | |
Nestle SA | | | 2.5 | |
HSBC Holdings | | | 2.3 | |
Novo-Nordisk | | | 1.8 | |
Koninklijke Ahold NV | | | 1.6 | |
Roche Holdings | | | 1.6 | |
Henkel AG | | | 1.5 | |
Koninklijke Philips Electronics NV | | | 1.5 | |
Anglo American | | | 1.4 | |
| | | | |
| Top 5 countries | | | |
| |
as of 03/31/11 (%) | | | | |
Japan | | | 22.6 | |
United Kingdom | | | 20.3 | |
Germany | | | 6.3 | |
United States | | | 5.8 | |
Netherlands | | | 5.6 | |
This fund is actively managed and the composition of its portfolio will change over time. Information provided is calculated as a percentage of net assets.
For the 12-month period that ended March 31, 2011, the fund’s Class A shares returned 12.20% without sales charge. The fund’s return fell short of its benchmark, the MSCI EAFE Growth Index (Net), which was 12.55% for the same period. The average return of funds in its peer group, the Lipper International Large-Cap Growth Classification, was 13.64%. U.S dollar weakness was the biggest contributor to return. Certain Japan-based consumer discretionary stocks were disappointing. Stock selection in financials, health care, industrials and materials benefited results as did a declining U.S. dollar. With a weak dollar, earnings valued in foreign currencies were worth more when converted to U.S. dollars.
Stock selection was the main driver of return
Among financial stocks, we underweighted European banks — a good move for the fund, because the group did poorly for the year — and overweighted certain Asian real estate companies, including Hongkong Land Holdings and Huaku Development in Taiwan (0.9% and 0.8% of net assets, respectively). Both companies were buoyed by a robust property market in Asia. In health care, the fund’s biggest contributor to positive performance was Novo-Nordisk (1.8% of net assets), which has a strong diabetes franchise. Within industrials, Bekaert (1.1% of net assets), a wire and steel cable business in Belgium, did well. A significant amount of Bekaert’s business is in China and Latin America where infrastructure development is a big part of the economy, and Bekaert’s products are in high demand. Smurfit Kappa (1.0% of net assets) in the materials sector was a notable performer. The paper products company benefited from internal restructuring as well as a rise in paper prices.
Out-of-index positions in the United States and Canada helped bolster return
Because of a sovereign debt crisis, we underweighted investments in Europe relative to the index and established positions in U.S. and Canadian stocks, which are not included in the fund’s benchmark. The United States was attractive because of its stimulative monetary policy. Core Laboratories (1.4% of net assets), an energy service company, was one of the companies that aided results. We favored Canada because its economy is oriented toward raw materials for which there is strong global demand. Canada-based Teck Resources, a mining company, helped boost return. We took profits and sold the stock.
Disappointments in Japan
The portfolio held several Japanese companies that had done well early in the period but that were hit hard in the aftermath of the March 2011 earthquake and tsunami. Examples are: Yamada Denki, one of the biggest retailers in Japan; Japan Tobacco; and Foster Electric (0.8% of net assets), which makes headphones for Apple. We sold Yamada Denki and Japan Tobacco.
Looking ahead
The dislocation in Japan could have a significant impact on businesses around the world, should Japanese manufacturers be unable to produce and export products. Unrest in the Mideast could also affect global markets. While oil prices have risen, the reaction of world stock markets to the Mideast turmoil has been muted. This situation could change if key countries, such as Bahrain and Saudi Arabia, become involved. Continuation of a sovereign debt crisis in Europe could also affect the financial markets. Ireland and Greece have been bailed out by the European
6
Portfolio Manager’s Report (continued) – Columbia International Growth Fund
Union and the International Monetary Fund; however, other countries may also seek help. So far there has been sufficient funding for bailouts, but this may not be the case if larger economies request support.
In the United States, the Federal Reserve Board’s program to purchase long-term Treasury securities will end in June. Known as “quantitative easing,” the central bank’s policy was aimed at pumping money into a sluggish economy. In an environment in which yields on long-term Treasuries are relatively low, market participants may be reluctant to purchase Treasuries unless the Federal Reserve raises short-term interest rates. Higher interest rates could dampen corporate profits and, ultimately, stock prices. Given these concerns, the fund has a slightly defensive positioning. Its investment approach will continue to be based on individual stock selection.
Portfolio characteristics and holdings are subject to change periodically and may not be representative of current characteristics and holdings. The outlook for the fund may differ from that presented for other Columbia Funds.
Equity securities are affected by stock market fluctuations that occur in response to economic and business developments.
International investing involves special risks, including foreign taxation, currency risks, risks associated with possible differences in financial standards and other risks associated with future political and economic developments.
Investing in emerging markets may involve greater risks than investing in more developed countries. In addition, concentration of investments in a single region may result in greater volatility.
7
Investment Portfolio – Columbia International Growth Fund
March 31, 2011
Common Stocks – 94.9%
| | | | | | | | |
| | | Shares | | | Value ($) | |
| Consumer Discretionary – 12.0% | | | | | | | | |
| Auto Components – 1.7% | | | | | | | | |
Autoliv, Inc. | | | 15,479 | | | | 1,149,006 | |
NHK Spring Co., Ltd. | | | 117,000 | | | | 1,159,240 | |
| |
Auto Components Total | | | | | | | 2,308,246 | |
| | |
| Automobiles – 2.1% | | | | | | | | |
Fuji Heavy Industries Ltd. | | | 116,000 | | | | 749,511 | |
Honda Motor Co., Ltd. | | | 32,500 | | | | 1,207,492 | |
Nissan Motor Co., Ltd. | | | 110,400 | | | | 980,686 | |
| |
Automobiles Total | | | | | | | 2,937,689 | |
| |
| Hotels, Restaurants & Leisure – 1.4% | | | | | |
Compass Group PLC | | | 111,478 | | | | 1,002,358 | |
Ohsho Food Service Corp. | | | 36,300 | | | | 865,033 | |
| |
Hotels, Restaurants & Leisure Total | | | | | | | 1,867,391 | |
| | |
| Household Durables – 3.1% | | | | | | | | |
Arnest One Corp. | | | 70,300 | | | | 702,014 | |
Foster Electric Co., Ltd. | | | 50,200 | | | | 1,146,325 | |
Persimmon PLC | | | 123,963 | | | | 884,933 | |
SEB SA | | | 15,801 | | | | 1,556,773 | |
| |
Household Durables Total | | | | | | | 4,290,045 | |
| | |
| Internet & Catalog Retail – 0.6% | | | | | | | | |
DeNA Co., Ltd. | | | 22,100 | | | | 799,807 | |
| |
Internet & Catalog Retail Total | | | | | | | 799,807 | |
| | |
| Specialty Retail – 1.4% | | | | | | | | |
Game Group PLC | | | 462,489 | | | | 419,188 | |
Halfords Group PLC | | | 106,935 | | | | 597,320 | |
Kingfisher PLC | | | 232,019 | | | | 915,251 | |
| |
Specialty Retail Total | | | | | | | 1,931,759 | |
| |
| Textiles, Apparel & Luxury Goods – 1.7% | | | | | |
Adidas AG | | | 25,012 | | | | 1,575,796 | |
Hugo Boss AG | | | 9,699 | | | | 745,964 | |
| |
Textiles, Apparel & Luxury Goods Total | | | | 2,321,760 | |
| | | | | | | | |
Consumer Discretionary Total | | | | 16,456,697 | |
| | | | | | | | |
| Consumer Staples – 14.2% | | | | | | | | |
| Beverages – 1.1% | | | | | | | | |
Carlsberg A/S, Class B | | | 14,000 | | | | 1,507,451 | |
| |
Beverages Total | | | | | | | 1,507,451 | |
| | |
| Food & Staples Retailing – 5.2% | | | | | | | | |
George Weston Ltd. | | | 19,800 | | | | 1,349,137 | |
Koninklijke Ahold NV | | | 163,404 | | | | 2,192,562 | |
Seven & I Holdings Co., Ltd. | | | 61,300 | | | | 1,561,528 | |
Tesco PLC | | | 154,548 | | | | 944,597 | |
Woolworths Ltd. | | | 40,718 | | | | 1,131,688 | |
| |
Food & Staples Retailing Total | | | | | | | 7,179,512 | |
| | | | | | | | |
| | | Shares | | | Value ($) | |
| Food Products – 5.1% | | | | | | | | |
Balrampur Chini Mills Ltd. (a) | | | 136,834 | | | | 215,225 | |
Marine Harvest ASA | | | 1,295,728 | | | | 1,609,629 | |
Nestle SA, Registered Shares | | | 60,860 | | | | 3,488,600 | |
Unilever NV | | | 50,772 | | | | 1,591,983 | |
| |
Food Products Total | | | | | | | 6,905,437 | |
| | |
| Household Products – 1.2% | | | | | | | | |
Reckitt Benckiser Group PLC | | | 32,498 | | | | 1,669,307 | |
| |
Household Products Total | | | | | | | 1,669,307 | |
| | |
| Personal Products – 1.1% | | | | | | | | |
Dr. Ci:Labo Co., Ltd. | | | 411 | | | | 1,523,630 | |
| |
Personal Products Total | | | | | | | 1,523,630 | |
| | |
| Tobacco – 0.5% | | | | | | | | |
British American Tobacco PLC | | | 17,436 | | | | 699,830 | |
| |
Tobacco Total | | | | | | | 699,830 | |
| | | | | | | | |
Consumer Staples Total | | | | | | | 19,485,167 | |
| | | | | | | | |
| Energy – 4.9% | | | | | | | | |
| Energy Equipment & Services – 3.3% | | | | | |
Core Laboratories NV | | | 18,369 | | | | 1,876,761 | |
Shinko Plantech Co., Ltd. | | | 117,400 | | | | 1,356,200 | |
Tecnicas Reunidas SA | | | 22,099 | | | | 1,328,539 | |
| |
Energy Equipment & Services Total | | | | | | | 4,561,500 | |
| |
| Oil, Gas & Consumable Fuels – 1.6% | | | | | |
BG Group PLC | | | 27,648 | | | | 687,913 | |
Rosneft Oil Co., GDR | | | 169,170 | | | | 1,545,368 | |
| |
Oil, Gas & Consumable Fuels Total | | | | | | | 2,233,281 | |
| | | | | | | | |
Energy Total | | | | | | | 6,794,781 | |
| | | | | | | | |
| Financials – 11.7% | | | | | | | | |
| Capital Markets – 1.4% | | | | | | | | |
ICAP PLC | | | 104,362 | | | | 883,964 | |
Investec PLC | | | 136,253 | | | | 1,044,142 | |
| |
Capital Markets Total | | | | | | | 1,928,106 | |
| | |
| Commercial Banks – 5.7% | | | | | | | | |
Banco Santander SA | | | 93,476 | | | | 1,085,228 | |
BNP Paribas | | | 26,413 | | | | 1,931,891 | |
HSBC Holdings PLC | | | 313,355 | | | | 3,222,203 | |
Standard Chartered PLC | | | 28,317 | | | | 734,540 | |
Turkiye Is Bankasi, Class C | | | 248,112 | | | | 793,804 | |
| |
Commercial Banks Total | | | | | | | 7,767,666 | |
| | |
| Insurance – 2.1% | | | | | | | | |
Mapfre SA | | | 320,670 | | | | 1,208,392 | |
Zurich Financial Services AG, Registered Shares | | | 5,785 | | | | 1,619,296 | |
| |
Insurance Total | | | | | | | 2,827,688 | |
See Accompanying Notes to Financial Statements.
8
Columbia International Growth Fund
March 31, 2011
Common Stocks (continued)
| | | | | | | | |
| | | Shares | | | Value ($) | |
| Financials (continued) | | | | | | | | |
| Real Estate Investment Trusts (REITs) – 0.8% | |
Japan Retail Fund Investment Corp. | | | 705 | | | | 1,105,465 | |
| |
Real Estate Investment Trusts (REITs) Total | | | | 1,105,465 | |
|
| Real Estate Management & Development – 1.7% | |
Hongkong Land Holdings Ltd. | | | 182,000 | | | | 1,274,744 | |
Huaku Development Co., Ltd. | | | 402,614 | | | | 1,127,319 | |
| |
Real Estate Management & Development Total | | | | 2,402,063 | |
| | | | | | | | |
Financials Total | | | | 16,030,988 | |
| | | | | | | | |
| Health Care – 6.9% | | | | | | | | |
| Biotechnology – 1.1% | | | | | | | | |
Amgen, Inc. (a) | | | 16,285 | | | | 870,433 | |
CSL Ltd. | | | 18,675 | | | | 689,696 | |
| |
Biotechnology Total | | | | | | | 1,560,129 | |
| |
| Health Care Providers & Services – 0.9% | | | | | |
Miraca Holdings, Inc. | | | 33,700 | | | | 1,289,832 | |
| |
Health Care Providers & Services Total | | | | | | | 1,289,832 | |
| | |
| Pharmaceuticals – 4.9% | | | | | | | | |
AstraZeneca PLC | | | 15,209 | | | | 698,522 | |
Novo-Nordisk A/S, Class B | | | 19,315 | | | | 2,426,674 | |
Roche Holding AG, Genusschein Shares | | | 15,728 | | | | 2,246,612 | |
Santen Pharmaceutical Co., Ltd. | | | 33,100 | | | | 1,322,004 | |
| |
Pharmaceuticals Total | | | | | | | 6,693,812 | |
| | | | | | | | |
Health Care Total | | | | | | | 9,543,773 | |
| | | | | | | | |
| Industrials – 18.3% | | | | | | | | |
| Aerospace & Defense – 1.0% | | | | | | | | |
Saab AB, Class B | | | 60,098 | | | | 1,310,142 | |
| |
Aerospace & Defense Total | | | | | | | 1,310,142 | |
| | |
| Building Products – 1.0% | | | | | | | | |
Asahi Glass Co., Ltd. | | | 113,000 | | | | 1,421,691 | |
| |
Building Products Total | | | | | | | 1,421,691 | |
| |
| Commercial Services & Supplies – 0.7% | | | | | |
Toppan Printing Co., Ltd. | | | 129,000 | | | | 1,017,743 | |
| |
Commercial Services & Supplies Total | | | | 1,017,743 | |
| | |
| Construction & Engineering – 1.9% | | | | | | | | |
Bouygues SA | | | 24,466 | | | | 1,174,901 | |
Macmahon Holdings Ltd. | | | 2,462,388 | | | | 1,438,799 | |
| |
Construction & Engineering Total | | | | | | | 2,613,700 | |
| | | | | | | | |
| | | Shares | | | Value ($) | |
| Electrical Equipment – 4.6% | | | | | | | | |
Bekaert NV | | | 13,646 | | | | 1,556,604 | |
Mitsubishi Electric Corp. | | | 163,000 | | | | 1,918,277 | |
Schneider Electric SA | | | 9,759 | | | | 1,667,952 | |
Sumitomo Electric Industries Ltd. | | | 87,600 | | | | 1,213,185 | |
| |
Electrical Equipment Total | | | | | | | 6,356,018 | |
| | |
| Industrial Conglomerates – 3.7% | | | | | | | | |
DCC PLC | | | 43,666 | | | | 1,390,521 | |
Koninklijke Philips Electronics NV (a) | | | 64,594 | | | | 2,064,743 | |
Siemens AG, Registered Shares | | | 11,785 | | | | 1,615,221 | |
| |
Industrial Conglomerates Total | | | | | | | 5,070,485 | |
| | |
| Machinery – 2.9% | | | | | | | | |
MAN SE | | | 12,908 | | | | 1,609,802 | |
Scania AB, Class B | | | 57,730 | | | | 1,338,091 | |
Wartsila Oyj | | | 24,851 | | | | 970,279 | |
| |
Machinery Total | | | | | | | 3,918,172 | |
| | |
| Professional Services – 0.6% | | | | | | | | |
Atkins WS PLC | | | 72,610 | | | | 816,531 | |
| |
Professional Services Total | | | | | | | 816,531 | |
| |
| Trading Companies & Distributors – 1.5% | | | | | |
ITOCHU Corp. | | | 104,200 | | | | 1,090,438 | |
Kloeckner & Co., SE (a) | | | 30,294 | | | | 1,009,776 | |
| |
Trading Companies & Distributors Total | | | | 2,100,214 | |
| |
| Transportation Infrastructure – 0.4% | | | | | |
Zhejiang Expressway Co., Ltd., Class H | | | 566,000 | | | �� | 517,177 | |
| |
Transportation Infrastructure Total | | | | | | | 517,177 | |
| | | | | | | | |
Industrials Total | | | | | | | 25,141,873 | |
| | | | | | | | |
| Information Technology – 5.8% | | | | | | | | |
| Communications Equipment – 0.4% | | | | | |
O-Net Communications Group Ltd. (a) | | | 854,000 | | | | 564,683 | |
| |
Communications Equipment Total | | | | | | | 564,683 | |
|
| Electronic Equipment, Instruments & Components – 2.7% | |
FUJIFILM Holdings Corp. | | | 42,800 | | | | 1,326,597 | |
Halma PLC | | | 95,427 | | | | 536,559 | |
Murata Manufacturing Co., Ltd. | | | 24,800 | | | | 1,793,359 | |
| |
Electronic Equipment, Instruments & Components Total | | | | 3,656,515 | |
| | |
| Internet Software & Services – 1.2% | | | | | | | | |
Tencent Holdings Ltd. | | | 69,400 | | | | 1,690,990 | |
| |
Internet Software & Services Total | | | | | | | 1,690,990 | |
| | |
| Office Electronics – 0.4% | | | | | | | | |
Canon, Inc. | | | 13,500 | | | | 580,632 | |
| |
Office Electronics Total | | | | | | | 580,632 | |
See Accompanying Notes to Financial Statements.
9
Columbia International Growth Fund
March 31, 2011
Common Stocks (continued)
| | | | | | | | |
| | | Shares | | | Value ($) | |
| Information Technology (continued) | | | | | | | | |
| Semiconductors & Semiconductor Equipment – 0.5% | |
Shinko Electric Industries Co., Ltd. | | | 69,600 | | | | 713,969 | |
| |
Semiconductors & Semiconductor Equipment Total | | | | 713,969 | |
| | |
| Software – 0.6% | | | | | | | | |
Autonomy Corp. PLC (a) | | | 33,113 | | | | 844,074 | |
| |
Software Total | | | | | | | 844,074 | |
| | | | | | | | |
Information Technology Total | | | | | | | 8,050,863 | |
| | | | | | | | |
| Materials – 15.8% | | | | | | | | |
| Chemicals – 3.2% | | | | | | | | |
Hitachi Chemical Co., Ltd. | | | 56,600 | | | | 1,152,910 | |
Kemira OYJ | | | 92,687 | | | | 1,496,144 | |
Nitto Denko Corp. | | | 31,800 | | | | 1,685,016 | |
| |
Chemicals Total | | | | | | | 4,334,070 | |
| | |
| Construction Materials – 0.7% | | | | | | | | |
PT Indocement Tunggal Prakarsa Tbk | | | 515,500 | | | | 967,600 | |
| |
Construction Materials Total | | | | | | | 967,600 | |
| | |
| Containers & Packaging – 1.0% | | | | | | | | |
Smurfit Kappa Group PLC (a) | | | 111,281 | | | | 1,411,481 | |
| |
Containers & Packaging Total | | | | | | | 1,411,481 | |
| | |
| Metals & Mining – 10.9% | | | | | | | | |
Anglo American PLC | | | 38,733 | | | | 1,992,684 | |
BHP Billiton PLC | | | 142,803 | | | | 5,635,477 | |
Eastern Platinum Ltd. (a) | | | 505,100 | | | | 677,287 | |
Eurasian Natural Resources Corp. PLC | | | 71,021 | | | | 1,066,972 | |
Freeport-McMoRan Copper & Gold, Inc. | | | 22,798 | | | | 1,266,429 | |
Rio Tinto Ltd. | | | 49,767 | | | | 4,362,012 | |
| |
Metals & Mining Total | | | | | | | 15,000,861 | |
| | | | | | | | |
Materials Total | | | | | | | 21,714,012 | |
| | | | | | | | |
| Telecommunication Services – 2.8% | |
| Diversified Telecommunication Services – 1.2% | |
Tele2 AB, Class B | | | 69,333 | | | | 1,601,539 | |
| |
Diversified Telecommunication Services Total | | | | 1,601,539 | |
|
| Wireless Telecommunication Services – 1.6% | |
Advanced Info Service PCL, Foreign Registered Shares | | | 257,400 | | | | 765,945 | |
Softbank Corp. | | | 36,500 | | | | 1,454,317 | |
| |
Wireless Telecommunication Services Total | | | | 2,220,262 | |
| | | | | | | | |
Telecommunication Services Total | | | | 3,821,801 | |
| | | | | | | | |
| | | Shares | | | Value ($) | |
| Utilities – 2.5% | |
| Gas Utilities – 0.6% | |
PT Perusahaan Gas Negara Tbk | | | 1,785,000 | | | | 798,544 | |
| |
Gas Utilities Total | | | | 798,544 | |
|
| Independent Power Producers & Energy Traders – 0.9% | |
International Power PLC | | | 263,281 | | | | 1,300,854 | |
| |
Independent Power Producers & Energy Traders Total | | | | 1,300,854 | |
|
| Multi-Utilities – 1.0% | |
Centrica PLC | | | 263,357 | | | | 1,374,318 | |
| |
Multi-Utilities Total | | | | 1,374,318 | |
| | | | | | | | |
Utilities Total | | | | 3,473,716 | |
| | | | | | | | |
Total Common Stocks
(cost of $99,919,882) | | | | 130,513,671 | |
|
Preferred Stock – 1.5% | |
| | | | | | | | |
| Consumer Staples – 1.5% | |
| Household Products – 1.5% | |
Henkel AG & Co., KGaA | | | 33,782 | | | | 2,092,653 | |
| |
Household Products Total | | | | 2,092,653 | |
| | | | | | | | |
Consumer Staples Total | | | | 2,092,653 | |
| | | | | | | | |
Total Preferred Stock
(cost of $1,707,943) | | | | 2,092,653 | |
|
Investment Company – 3.5% | |
iShares MSCI EAFE Index Fund | | | 78,658 | | | | 4,726,559 | |
| |
Total Investment Company
(cost of $4,775,272) | | | | 4,726,559 | |
| | | | | | | | |
Total Investments – 99.9%
(cost of $106,403,097) (b) | | | | 137,332,883 | |
| | | | | | | | |
Other Assets & Liabilities, Net – 0.1% | | | | 154,890 | |
| | | | | | | | |
Net Assets – 100.0% | | | | 137,487,773 | |
| (a) | Non-income producing security. |
| (b) | Cost for federal income tax purposes is $107,709,239. |
Generally accepted accounting principles (GAAP) require disclosure regarding the inputs and valuation techniques used to measure fair value and any changes in valuation inputs or techniques. In addition, investments shall be disclosed by major category.
The Fund categorizes its fair value measurements according to a three-level hierarchy that maximizes the use of observable inputs and minimizes the use of unobservable inputs by prioritizing that the most observable input be used when
See Accompanying Notes to Financial Statements.
10
Columbia International Growth Fund
March 31, 2011
available. Observable inputs are those that market participants would use in pricing an investment based on market data obtained from sources independent of the reporting entity. Unobservable inputs are those that reflect the Fund’s assumptions about the information market participants would use in pricing an investment. An investment’s level within the fair value hierarchy is based on the lowest level of any input that is deemed significant to the asset or liability’s fair value measurement. The input levels are not necessarily an indication of the risk or liquidity associated with investments at that level. For example, certain U.S. government securities are generally high quality and liquid, however, they are reflected as Level 2 because the inputs used to determine fair value may not always be quoted prices in an active market.
Fair value inputs are summarized in the three broad levels listed below:
| • | | Level 1 — Valuations based on quoted prices for investments in active markets that the Fund has the ability to access at the measurement date (including NAV for open-end mutual funds). Valuation adjustments are not applied to Level 1 investments. |
| • | | Level 2 — Valuations based on other significant observable inputs (including quoted prices for similar securities, interest rates, prepayment speeds, credit risks, etc.). |
| • | | Level 3 — Valuations based on significant unobservable inputs (including the Fund’s own assumptions and judgment in determining the fair value of investments). |
Inputs that are used in determining fair value of an investment may include price information, credit data, volatility statistics, and other factors. These inputs can be either observable or unobservable. The availability of observable inputs can vary between investments, and is affected by various factors such as the type of investment, and the volume and level of activity for that investment or similar investments in the marketplace. The inputs will be considered by the Investment Manager, along with any other relevant factors in the calculation of an investment’s fair value. The Fund uses prices and inputs that are current as of the measurement date, which may include periods of market dislocations. During these periods, the availability of prices and inputs may be reduced for many investments. This condition could cause an investment to be reclassified between the various levels within the hierarchy. Non-U.S. equity securities actively traded in foreign markets may be reflected in Level 2 despite the availability of closing prices, because the Fund evaluates and determines whether those closing prices reflect fair value at the close of the New York Stock Exchange (NYSE) or require adjustment, as described in Note 2 to the financial statements-Security Valuation.
Investments falling into the Level 3 category are primarily supported by quoted prices from brokers and dealers participating in the market for those investments. However, these may be classified as Level 3 investments due to lack of market transparency and corroboration to support these quoted prices. Additionally, valuation models may be used as the pricing source for any remaining investments classified as Level 3. These models rely on one or more significant unobservable inputs and/or significant assumptions by the Investment Manger. Inputs used in valuations may include, but are not limited to, financial statement analysis, capital account balances, discount rates and estimated cash flows, and comparable company data.
The following table summarizes the inputs used, as of March 31, 2011, in valuing the Fund’s assets:
| | | | | | | | | | | | | | | | |
Description | | Quoted
Prices
(Level 1) | | | Other
Significant
Observable
Inputs
(Level 2) | | | Significant
Unobservable
Inputs
(Level 3) | | | Total | |
Common Stocks | | | | | | | | | | | | | |
Consumer Discretionary | | $ | 1,149,006 | | | $ | 15,307,691 | | | $ | — | | | $ | 16,456,697 | |
Consumer Staples | | | 1,349,137 | | | | 18,136,030 | | | | — | | | | 19,485,167 | |
Energy | | | 3,422,129 | | | | 3,372,652 | | | | — | | | | 6,794,781 | |
Financials | | | — | | | | 16,030,988 | | | | — | | | | 16,030,988 | |
Health Care | | | 870,433 | | | | 8,673,340 | | | | — | | | | 9,543,773 | |
Industrials | | | — | | | | 25,141,873 | | | | — | | | | 25,141,873 | |
Information Technology | | | — | | | | 8,050,863 | | | | — | | | | 8,050,863 | |
Materials | | | 1,943,716 | | | | 19,770,296 | | | | — | | | | 21,714,012 | |
Telecommunication Services | | | — | | | | 3,821,801 | | | | — | | | | 3,821,801 | |
Utilities | | | — | | | | 3,473,716 | | | | — | | | | 3,473,716 | |
| | | | | | | | | | | | | | | | |
Total Common Stocks | | | 8,734,421 | | | | 121,779,250 | | | | — | | | | 130,513,671 | |
| | | | | | | | | | | | | | | | |
Total Preferred Stock | | | — | | | | 2,092,653 | | | | — | | | | 2,092,653 | |
| | | | | | | | | | | | | | | | |
Investment Company | | | 4,726,559 | | | | — | | | | — | | | | 4,726,559 | |
| | | | | | | | | | | | | | | | |
Total Investments | | | 13,460,980 | | | | 123,871,903 | | | | — | | | | 137,332,883 | |
| | | | | | | | | | | | | | | | |
Unrealized Appreciation on Forward Foreign Currency Exchange Contracts | | | — | | | | 526,910 | | | | — | | | | 526,910 | |
Unrealized Depreciation on Forward Foreign Currency Exchange Contracts | | | — | | | | (279,129 | ) | | | — | | | | (279,129 | ) |
| | | | | | | | | | | | | | | | |
Total | | $ | 13,460,980 | | | $ | 124,119,684 | | | $ | — | | | $ | 137,580,664 | |
| | | | | | | | | | | | | | | | |
The Fund’s assets assigned to the Level 2 input category are generally valued using the market approach, in which a security’s value is determined through its correlation to prices and information from market transactions for similar or identical assets. These assets include certain foreign securities for which a third party statistical pricing service may be employed for purposes of fair market valuation. The models utilized by the third party statistical pricing service take into account a security’s correlation to available market data including, but not limited to, intraday index, ADR, and ETF movements.
Certain short-term obligations may be valued using amortized cost, an income approach which converts future cash flows to a present value based upon the discount or premium at purchase.
The following table shows transfers between Level 1 and Level 2 of the fair value hierarchy:
| | | | | | |
Transfers In | | Transfers Out |
Level 1 | | Level 2 | | Level 1 | | Level 2 |
$— | | $1,414,530 | | $1,414,530 | | $— |
Financial assets were transferred from Level 1 to Level 2 as it was determined that the application of factors received from third party statistical services resulted in a price which was more representative of fair value for these securities as of period end.
See Accompanying Notes to Financial Statements.
11
Columbia International Growth Fund
March 31, 2011
For the year ended March 31, 2011, transactions in written option contracts were as follows:
| | | | | | | | |
| | | Number of
Contracts | | | Premium
Received | |
Options outstanding at March 31, 2010 | | | 409 | | | $ | 12,441 | |
Options written | | | 5,706 | | | | 237,028 | |
Options terminated in closing purchase transactions | | | (2,242 | ) | | | (123,052 | ) |
Options exercised | | | (1,735 | ) | | | (12,269 | ) |
Options expired | | | (2,138 | ) | | | (114,148 | ) |
| | | | | | | | |
Options outstanding at March 31, 2011 | | | — | | | $ | — | |
| | | | | | | | |
Forward foreign currency exchange contracts outstanding on March 31, 2011 are:
Foreign Exchange Rate Risk
| | | | | | | | | | | | | | | | | | | | |
Counterparty | | Forward
Foreign
Currency
Exchange
Contracts
to Buy | | | Value | | | Aggregate
Face
Value | | | Settlement
Date | | | Unrealized
Appreciation
(Depreciation) | |
Morgan Stanley Capital Services, Inc. | | | AUD | | | $ | 4,449,158 | | | $ | 4,307,733 | | | | 04/07/11 | | | $ | 141,425 | |
Morgan Stanley Capital Services, Inc. | | | CAD | | | | 2,194,665 | | | | 2,190,551 | | | | 04/07/11 | | | | 4,114 | |
Morgan Stanley Capital Services, Inc. | | | CHF | | | | 6,449,765 | | | | 6,234,326 | | | | 04/07/11 | | | | 215,439 | |
Morgan Stanley Capital Services, Inc. | | | DKK | | | | 2,354,676 | | | | 2,355,542 | | | | 04/07/11 | | | | (866 | ) |
Morgan Stanley Capital Services, Inc. | | | EUR | | | | 1,137,948 | | | | 1,138,332 | | | | 04/07/11 | | | | (384 | ) |
Morgan Stanley Capital Services, Inc. | | | GBP | | | | 4,263,820 | | | | 4,290,700 | | | | 04/07/11 | | | | (26,880 | ) |
Morgan Stanley Capital Services, Inc. | | | JPY | | | | 5,052,689 | | | | 5,111,949 | | | | 04/07/11 | | | | (59,260 | ) |
Morgan Stanley Capital Services, Inc. | | | SGD | | | | 2,313,377 | | | | 2,288,671 | | | | 04/07/11 | | | | 24,706 | |
Morgan Stanley Capital Services, Inc. | | | TWD | | | | 979,231 | | | | 985,421 | | | | 04/07/11 | | | | (6,190 | ) |
| | | | | | | | | | | | | | | | | | | | |
| | | | | | | | | | | | | | | | | | $ | 292,104 | |
| | | | | | | | | | | | | | | | | | | | |
| | | | | | | | | | | | | | | | | | |
Counterparty | | Forward
Foreign
Currency
Exchange
Contracts
to Sell | | Value | | | Aggregate
Face
Value | | | Settlement
Date | | | Unrealized
Appreciation
(Depreciation) | |
Morgan Stanley Capital Services, Inc. | | AUD | | $ | 4,449,158 | | | $ | 4,438,295 | | | | 04/07/11 | | | $ | (10,863 | ) |
Morgan Stanley Capital Services, Inc. | | CAD | | | 2,194,665 | | | | 2,148,180 | | | | 04/07/11 | | | | (46,485 | ) |
Morgan Stanley Capital Services, Inc. | | CHF | | | 6,449,766 | | | | 6,484,838 | | | | 04/07/11 | | | | 35,072 | |
Morgan Stanley Capital Services, Inc. | | DKK | | | 2,354,676 | | | | 2,263,989 | | | | 04/07/11 | | | | (90,687 | ) |
| | | | | | | | | | | | | | | | | | | | |
Counterparty | | Forward
Foreign
Currency
Exchange
Contracts
to Sell | | | Value | | | Aggregate
Face
Value | | | Settlement
Date | | | Unrealized
Appreciation
(Depreciation) | |
Morgan Stanley Capital Services, Inc. | | | EUR | | | $ | 1,137,948 | | | $ | 1,100,608 | | | | 04/07/11 | | | $ | (37,340 | ) |
Morgan Stanley Capital Services, Inc. | | | GBP | | | | 4,263,820 | | | | 4,264,641 | | | | 04/07/11 | | | | 821 | |
Morgan Stanley Capital Services, Inc. | | | JPY | | | | 5,052,689 | | | | 5,132,753 | | | | 04/07/11 | | | | 80,064 | |
Morgan Stanley Capital Services, Inc. | | | SGD | | | | 2,313,377 | | | | 2,313,203 | | | | 04/07/11 | | | | (174 | ) |
Morgan Stanley Capital Services, Inc. | | | TWD | | | | 979,231 | | | | 1,004,500 | | | | 04/07/11 | | | | 25,269 | |
| | | | | | | | | | | | | | | | | | | | |
| | | | | | | | | | | | | | | | | | $ | (44,323 | ) |
| | | | | | | | | | | | | | | | | | | | |
At March 31, 2011, the Fund was invested in the following countries:
| | | | | | | | |
Summary of Securities
by Country (unaudited) | | Value | | | % of Total Investments | |
Japan | | $ | 31,136,900 | | | | 22.7 | |
United Kingdom | | | 27,971,539 | | | | 20.4 | |
Germany | | | 8,649,211 | | | | 6.3 | |
United States* | | | 8,012,429 | | | | 5.8 | |
Netherlands | | | 7,726,049 | | | | 5.6 | |
Australia | | | 7,622,195 | | | | 5.5 | |
Switzerland | | | 7,354,509 | | | | 5.4 | |
France | | | 6,331,517 | | | | 4.6 | |
Sweden | | | 4,249,772 | | | | 3.1 | |
Denmark | | | 3,934,124 | | | | 2.9 | |
Spain | | | 3,622,158 | | | | 2.6 | |
Ireland | | | 2,802,002 | | | | 2.0 | |
China | | | 2,772,850 | | | | 2.0 | |
Finland | | | 2,466,423 | | | | 1.8 | |
Canada | | | 2,026,424 | | | | 1.5 | |
Indonesia | | | 1,766,143 | | | | 1.3 | |
Norway | | | 1,609,629 | | | | 1.2 | |
Belgium | | | 1,556,604 | | | | 1.1 | |
Russia | | | 1,545,368 | | | | 1.1 | |
Hong Kong | | | 1,274,744 | | | | 0.9 | |
Taiwan | | | 1,127,319 | | | | 0.8 | |
Turkey | | | 793,804 | | | | 0.6 | |
Thailand | | | 765,945 | | | | 0.6 | |
India | | | 215,225 | | | | 0.2 | |
| | | | | | | | |
| | $ | 137,332,883 | | | | 100.0 | |
| | | | | | | | |
* Includes investment companies.
Certain securities are listed by country of underlying exposure but may trade predominantly on another exchange.
| | |
Acronym | | Name |
| AUD | | Australian Dollar |
| CAD | | Canadian Dollar |
| CHF | | Swiss Franc |
| DKK | | Danish Krone |
| EUR | | Euro |
| GBP | | Pound Sterling |
| GDR | | Global Depositary Receipt |
| JPY | | Japanese Yen |
| SGD | | Singapore Dollar |
| TWD | | New Taiwan Dollar |
See Accompanying Notes to Financial Statements.
12
Statement of Assets and Liabilities – Columbia International Growth Fund
March 31, 2011
| | | | | | |
| | | | | ($) | |
| Assets | | Investments, at cost | | | 106,403,097 | |
| | | | | | |
| | Investments, at value | | | 137,332,883 | |
| | Foreign currency (cost of $248,771) | | | 247,802 | |
| | Unrealized appreciation on forward foreign currency exchange contracts | | | 526,910 | |
| | Receivable for: | | | | |
| | Investments sold | | | 105,750 | |
| | Fund shares sold | | | 107,400 | |
| | Dividends | | | 619,039 | |
| | Foreign tax reclaims | | | 191,695 | |
| | Expense reimbursement due from Investment Manager | | | 46,273 | |
| | Trustees’ deferred compensation plan | | | 13,465 | |
| | Prepaid expenses | | | 18,406 | |
| | | | | | |
| | Total Assets | | | 139,209,623 | |
| | |
| Liabilities | | Payable to custodian bank | | | 251,802 | |
| | Unrealized depreciation on forward foreign currency exchange contracts | | | 279,129 | |
| | Payable for: | | | | |
| | Fund shares repurchased | | | 885,793 | |
| | Foreign capital gains taxes deferred | | | 1,039 | |
| | Investment advisory fee | | | 111,377 | |
| | Administration fee | | | 18,526 | |
| | Pricing and bookkeeping fees | | | 7,308 | |
| | Transfer agent fee | | | 33,277 | |
| | Trustees’ fees | | | 1,519 | |
| | Audit fee | | | 28,894 | |
| | Custody fee | | | 8,808 | |
| | Distribution and service fees | | | 347 | |
| | Chief compliance officer expenses | | | 235 | |
| | Reports to shareholders | | | 35,594 | |
| | Merger costs | | | 31,694 | |
| | Trustees’ deferred compensation plan | | | 13,465 | |
| | Other liabilities | | | 13,043 | |
| | | | | | |
| | Total Liabilities | | | 1,721,850 | |
| | |
| | | | | | |
| | Net Assets | | | 137,487,773 | |
| | |
| Net Assets Consist of | | Paid-in capital | | | 235,636,054 | |
| | Undistributed net investment income | | | 2,618,447 | |
| | Accumulated net realized loss | | | (131,956,628 | ) |
| | Net unrealized appreciation (depreciation) on: | | | | |
| | Investments | | | 30,929,786 | |
| | Foreign currency translations | | | 261,153 | |
| | Foreign capital gains tax | | | (1,039 | ) |
| | | | | | |
| | Net Assets | | | 137,487,773 | |
See Accompanying Notes to Financial Statements.
13
Statement of Assets and Liabilities (continued) – Columbia International Growth Fund
March 31, 2011
| | | | | | |
| | | | | | |
| Class A | | Net assets | | $ | 455,127 | |
| | Shares outstanding | | | 31,116 | |
| | Net asset value per share | | $ | 14.63 | (a) |
| | Maximum sales charge | | | 5.75 | % |
| | Maximum offering price per share ($14.63/0.9425) | | $ | 15.52 | (b) |
| | |
| Class C | | Net assets | | $ | 322,178 | |
| | Shares outstanding | | | 22,172 | |
| | Net asset value and offering price per share | | $ | 14.53 | (a) |
| | |
| Class Z | | Net assets | | $ | 136,710,468 | |
| | Shares outstanding | | | 9,312,907 | |
| | Net asset value, offering and redemption price per share | | $ | 14.68 | |
| (a) | Redemption price per share is equal to net asset value less any applicable contingent deferred sales charge. |
| (b) | On sales of $50,000 or more the offering price is reduced. |
See Accompanying Notes to Financial Statements.
14
Statement of Operations – Columbia International Growth Fund
For the Year Ended March 31, 2011
| | | | | | |
| | | | | ($) | |
| Investment Income | | Dividends | | | 4,493,531 | |
| | Interest | | | 465 | |
| | Foreign taxes withheld | | | (375,378 | ) |
| | | | | | |
| | Total Investment Income | | | 4,118,618 | |
| | |
| Expenses | | Investment advisory fee | | | 1,395,293 | |
| | Administration fee | | | 233,740 | |
| | Distribution fee – Class C | | | 1,936 | |
| | Service fee: | | | | |
| | Class A | | | 1,030 | |
| | Class C | | | 646 | |
| | Transfer agent fee | | | 83,874 | |
| | Pricing and bookkeeping fees | | | 72,762 | |
| | Trustees’ fees | | | 21,040 | |
| | Custody fee | | | 98,864 | |
| | Chief compliance officer expenses | | | 1,087 | |
| | Merger costs | | | 46,800 | |
| | Other expenses | | | 143,609 | |
| | | | | | |
| | Expenses before interest expense | | | 2,100,681 | |
| | Interest expense | | | 3,775 | |
| | | | | | |
| | Total Expenses | | | 2,104,456 | |
| | |
| | Fees waived or expenses reimbursed by Investment Manager | | | (361,231 | ) |
| | | | | | |
| | Net Expenses | | | 1,743,225 | |
| | |
| | | | | | |
| | Net Investment Income | | | 2,375,393 | |
| | |
| Net Realized and Unrealized Gain (Loss) on Investments, Futures Contracts, Written Options, Foreign Currency and Foreign Capital Gains Tax | | Net realized gain (loss) on: | | | | |
| | Investments | | | 10,849,259 | |
| | Foreign currency transactions and forward foreign currency exchange contracts | | | 470,847 | |
| | Futures contracts | | | 2,751 | |
| | Written options | | | 103,358 | |
| | | | | | |
| | Net realized gain | | | 11,426,215 | |
| | |
| | Net change in unrealized appreciation (depreciation) on: | | | | |
| | Investments | | | 1,597,516 | |
| | Foreign currency translations and forward foreign currency exchange contracts | | | 52,875 | |
| | Written options | | | (4,009 | ) |
| | Foreign capital gains tax | | | (1,039 | ) |
| | | | | | |
| | Net change in unrealized appreciation (depreciation) | | | 1,645,343 | |
| | | | | | |
| | Net Gain | | | 13,071,558 | |
| | |
| | | | | | |
| | Net Increase Resulting from Operations | | | 15,446,951 | |
See Accompanying Notes to Financial Statements.
15
Statement of Changes in Net Assets – Columbia International Growth Fund
| | | | | | | | | | |
| | | | | Year Ended March 31, | |
| Increase (Decrease) in Net Assets | | | | 2011 ($) | | | 2010 ($) | |
| Operations | | Net investment income | | | 2,375,393 | | | | 2,843,979 | |
| | Net realized gain (loss) on investments, futures contracts, written options, foreign currency transactions and forward foreign currency exchange contracts | | | 11,426,215 | | | | (3,944,362 | ) |
| | Net change in unrealized appreciation (depreciation) on investments, written options, foreign currency translations and forward foreign currency exchange contracts | | | 1,645,343 | | | | 70,620,059 | |
| | | | | | | | | | |
| | Net increase resulting from operations | | | 15,446,951 | | | | 69,519,676 | |
| | | |
| Distributions to Shareholders | | From net investment income: | | | | | | | | |
| | Class A | | | (7,668 | ) | | | (2,219 | ) |
| | Class C | | | (3,239 | ) | | | — | |
| | Class Z | | | (3,415,086 | ) | | | (2,044,589 | ) |
| | | | | | | | | | |
| | Total distributions to shareholders | | | (3,425,993 | ) | | | (2,046,808 | ) |
| | | |
| | Net Capital Stock Transactions | | | (46,403,972 | ) | | | (61,841,910 | ) |
| | Redemption fees | | | — | | | | 4,246 | |
| | Increase from regulatory settlements | | | — | | | | 6,592 | |
| | | | | | | | | | |
| | Total increase (decrease) in net assets | | | (34,383,014 | ) | | | 5,641,796 | |
| | | |
| Net Assets | | Beginning of period | | | 171,870,787 | | | | 166,228,991 | |
| | End of period | | | 137,487,773 | | | | 171,870,787 | |
| | Undistributed net investment income at end of period | | | 2,618,447 | | | | 2,960,574 | |
See Accompanying Notes to Financial Statements.
16
Statement of Changes in Net Assets (continued) – Columbia International Growth Fund
| | | | | | | | | | | | | | | | |
| | | Capital Stock Activity | |
| | | Year Ended
March 31, 2011 | | | Year Ended
March 31, 2010 | |
| | | Shares | | | Dollars ($) | | | Shares | | | Dollars ($) | |
Class A | | | | | | | | | | | | | | | | |
Subscriptions | | | 8,530 | | | | 112,422 | | | | 10,263 | | | | 126,227 | |
Distributions reinvested | | | 598 | | | | 7,151 | | | | 207 | | | | 2,196 | |
Redemptions | | | (7,738 | ) | | | (101,996 | ) | | | (5,308 | ) | | | (66,084 | ) |
| | | | | | | | | | | | | | | | |
Net increase | | | 1,390 | | | | 17,577 | | | | 5,162 | | | | 62,339 | |
| | | | |
Class C | | | | | | | | | | | | | | | | |
Subscriptions | | | 3,944 | | | | 56,352 | | | | 5,127 | | | | 57,880 | |
Distributions reinvested | | | 271 | | | | 3,239 | | | | — | | | | — | |
Redemptions | | | (919 | ) | | | (12,128 | ) | | | (3,501 | ) | | | (41,240 | ) |
| | | | | | | | | | | | | | | | |
Net increase | | | 3,296 | | | | 47,463 | | | | 1,626 | | | | 16,640 | |
| | | | |
Class Z | | | | | | | | | | | | | | | | |
Subscriptions | | | 432,371 | | | | 5,853,901 | | | | 1,580,348 | | | | 19,065,399 | |
Distributions reinvested | | | 70,246 | | | | 840,844 | | | | 51,661 | | | | 548,127 | |
Redemptions | | | (4,000,044 | ) | | | (53,163,757 | ) | | | (6,840,170 | ) | | | (81,534,415 | ) |
| | | | | | | | | | | | | | | | |
Net decrease | | | (3,497,427 | ) | | | (46,469,012 | ) | | | (5,208,161 | ) | | | (61,920,889 | ) |
See Accompanying Notes to Financial Statements.
17
Financial Highlights – Columbia International Growth Fund
Selected data for a share outstanding throughout each period is as follows:
| | | | | | | | | | | | | | | | |
| | | Year Ended March 31, | | | Period Ended
March 31, | |
| Class A Shares | | 2011 | | | 2010 | | | 2009 | | | 2008 (a) | |
Net Asset Value, Beginning of Period | | $ | 13.32 | | | $ | 9.18 | | | $ | 18.80 | | | $ | 18.80 | |
| | | | |
Income from Investment Operations: | | | | | | | | | | | | | | | | |
Net investment income (b) | | | 0.19 | | | | 0.13 | | | | 0.13 | | | | — | (c) |
Net realized and unrealized gain (loss) on investments, foreign currency, written options and foreign capital gains tax | | | 1.38 | | | | 4.10 | | | | (8.58 | ) | | | — | (c) |
| | | | | | | | | | | | | | | | |
Total from investment operations | | | 1.57 | | | | 4.23 | | | | (8.45 | ) | | | — | (c) |
| | | | |
Less Distributions to Shareholders: | | | | | | | | | | | | | | | | |
From net investment income | | | (0.26 | ) | | | (0.09 | ) | | | (0.04 | ) | | | — | |
From net realized gains | | | — | | | | — | | | | (1.13 | ) | | | — | |
| | | | | | | | | | | | | | | | |
Total distributions to shareholders | | | (0.26 | ) | | | (0.09 | ) | | | (1.17 | ) | | | — | |
| | | | |
Redemption Fees: | | | | | | | | | | | | | | | | |
Redemption fees added to paid-in-capital | | | — | | | | — | (b)(c) | | | — | (b)(c) | | | — | (b)(c) |
| | | | |
Increase from regulatory settlements | | | — | | | | — | (c) | | | — | (c) | | | — | |
| | | | |
Net Asset Value, End of Period | | $ | 14.63 | | | $ | 13.32 | | | $ | 9.18 | | | $ | 18.80 | |
Total return (d)(e) | | | 12.20 | % | | | 46.30 | % | | | (47.91 | )% | | | 0.00 | %(f) |
| | | | |
Ratios to Average Net Assets/Supplemental Data: | | | | | | | | | | | | | | | | |
Net expenses before interest expense | | | 1.43 | % | | | 1.51 | % | | | 1.68 | %(g) | | | 1.75 | %(g)(h) |
Interest expense | | | — | %(i) | | | — | %(i) | | | 0.01 | % | | | — | %(h)(i) |
Net expenses | | | 1.43 | % | | | 1.51 | % | | | 1.69 | %(g) | | | 1.75 | %(g)(h) |
Waiver/Reimbursement | | | 0.25 | % | | | 0.09 | % | | | 0.04 | % | | | 0.06 | %(h) |
Net investment income (loss) | | | 1.40 | % | | | 1.08 | % | | | 1.21 | %(g) | | | (1.75 | )%(g)(h) |
Portfolio turnover rate | | | 71 | % | | | 111 | % | | | 133 | % | | | 68 | %(f) |
Net assets, end of period (000s) | | $ | 455 | | | $ | 396 | | | $ | 226 | | | $ | 10 | |
| (a) | Class A shares commenced operations on March 31, 2008. Per share data and total return reflect activity from that date. |
| (b) | Per share data was calculated using the average shares outstanding during the period. |
| (c) | Rounds to less than $0.01 per share. |
| (d) | Had the Investment Manager and/or any of its affiliates not waived fees or reimbursed a portion of expenses, total return would have been reduced. |
| (e) | Total return at net asset value assuming all distributions reinvested and no initial sales charge or contingent deferred sales charge. |
| (g) | The benefits derived from custody credits had an impact of less than 0.01%. |
| (i) | Rounds to less than 0.01%. |
See Accompanying Notes to Financial Statements.
18
Financial Highlights – Columbia International Growth Fund
Selected data for a share outstanding throughout each period is as follows:
| | | | | | | | | | | | | | | | |
| | | Year Ended March 31, | | | Period Ended
March 31, | |
| Class C Shares | | 2011 | | | 2010 | | | 2009 | | | 2008 (a) | |
Net Asset Value, Beginning of Period | | $ | 13.23 | | | $ | 9.11 | | | $ | 18.80 | | | $ | 18.80 | |
| | | | |
Income from Investment Operations: | | | | | | | | | | | | | | | | |
Net investment income (b) | | | 0.09 | | | | 0.05 | | | | 0.12 | | | | — | (c) |
Net realized and unrealized gain (loss) on investments, foreign currency, written options and foreign capital gains tax | | | 1.38 | | | | 4.07 | | | | (8.64 | ) | | | — | (c) |
| | | | | | | | | | | | | | | | |
Total from investment operations | | | 1.47 | | | | 4.12 | | | | (8.52 | ) | | | — | (c) |
| | | | |
Less Distributions to Shareholders: | | | | | | | | | | | | | | | | |
From net investment income | | | (0.17 | ) | | | — | | | | (0.04 | ) | | | — | |
From net realized gains | | | — | | | | — | | | | (1.13 | ) | | | — | |
| | | | | | | | | | | | | | | | |
Total distributions to shareholders | | | (0.17 | ) | | | — | | | | (1.17 | ) | | | — | |
| | | | |
Redemption Fees: | | | | | | | | | | | | | | | | |
Redemption fees added to paid-in-capital | | | — | | | | — | (b)(c) | | | — | (b)(c) | | | — | (b)(c) |
| | | | |
Increase from regulatory settlements | | | — | | | | — | (c) | | | — | (c) | | | — | |
| | | | |
Net Asset Value, End of Period | | $ | 14.53 | | | $ | 13.23 | | | $ | 9.11 | | | $ | 18.80 | |
Total return (d)(e) | | | 11.37 | % | | | 45.23 | % | | | (48.31 | )% | | | 0.00 | %(f) |
| | | | |
Ratios to Average Net Assets/Supplemental Data: | | | | | | | | | | | | | | | | |
Net expenses before interest expense | | | 2.18 | % | | | 2.26 | % | | | 2.43 | %(g) | | | 2.50 | %(g)(h) |
Interest expense | | | — | %(i) | | | — | %(i) | | | 0.01 | % | | | — | %(h)(i) |
Net expenses | | | 2.18 | % | | | 2.26 | % | | | 2.44 | %(g) | | | 2.50 | %(g)(h) |
Waiver/Reimbursement | | | 0.25 | % | | | 0.09 | % | | | 0.04 | % | | | 0.06 | %(h) |
Net investment income (loss) | | | 0.70 | % | | | 0.38 | % | | | 1.16 | %(g) | | | (2.50 | )%(g)(h) |
Portfolio turnover rate | | | 71 | % | | | 111 | % | | | 133 | % | | | 68 | %(f) |
Net assets, end of period (000s) | | $ | 322 | | | $ | 250 | | | $ | 157 | | | $ | 10 | |
| (a) | Class C shares commenced operations on March 31, 2008. Per share data and total return reflect activity from that date. |
| (b) | Per share data was calculated using the average shares outstanding during the period. |
| (c) | Rounds to less than $0.01 per share. |
| (d) | Had the Investment Manager and/or any of its affiliates not waived fees or reimbursed a portion of expenses, total return would have been reduced. |
| (e) | Total return at net asset value assuming all distributions reinvested and no contingent deferred sales charge. |
| (g) | The benefits derived from custody credits had an impact of less than 0.01%. |
| (i) | Rounds to less than 0.01%. |
See Accompanying Notes to Financial Statements.
19
Financial Highlights – Columbia International Growth Fund
Selected data for a share outstanding throughout each period is as follows:
| | | | | | | | | | | | | | | | | | | | |
| | | Year Ended March 31, | |
| Class Z Shares | | 2011 | | | 2010 | | | 2009 | | | 2008 (a) | | | 2007 | |
Net Asset Value, Beginning of Period | | $ | 13.37 | | | $ | 9.20 | | | $ | 18.80 | | | $ | 19.06 | | | $ | 16.51 | |
| | | | | |
Income from Investment Operations: | | | | | | | | | | | | | | | | | | | | |
Net investment income (b) | | | 0.21 | | | | 0.19 | | | | 0.26 | | | | 0.12 | (c) | | | 0.09 | |
Net realized and unrealized gain (loss) on investments, foreign currency, written options and foreign capital gains tax | | | 1.39 | | | | 4.10 | | | | (8.69 | ) | | | (0.30 | ) | | | 2.54 | |
| | | | | | | | | | | | | | | | | | | | |
Total from investment operations | | | 1.60 | | | | 4.29 | | | | (8.43 | ) | | | (0.18 | ) | | | 2.63 | |
| | | | | |
Less Distributions to Shareholders: | | | | | | | | | | | | | | | | | | | | |
From net investment income | | | (0.29 | ) | | | (0.12 | ) | | | (0.04 | ) | | | (0.08 | ) | | | (0.08 | ) |
From net realized gains | | | — | | | | — | | | | (1.13 | ) | | | — | | | | — | |
| | | | | | | | | | | | | | | | | | | | |
Total distributions to shareholders | | | (0.29 | ) | | | (0.12 | ) | | | (1.17 | ) | | | (0.08 | ) | | | (0.08 | ) |
| | | | | |
Redemption Fees: | | | | | | | | | | | | | | | | | | | | |
Redemption fees added to paid-in-capital | | | — | | | | — | (b)(d) | | | — | (b)(d) | | | — | (b)(d) | | | — | (b)(d) |
| | | | | |
Increase from regulatory settlements | | | — | | | | — | (d) | | | — | (d) | | | — | | | | — | |
| | | | | |
Net Asset Value, End of Period | | $ | 14.68 | | | $ | 13.37 | | | $ | 9.20 | | | $ | 18.80 | | | $ | 19.06 | |
Total return (e)(f) | | | 12.43 | % | | | 47.00 | % | | | (47.80 | )% | | | (0.95 | )% | | | 16.03 | % |
| | | | | |
Ratios to Average Net Assets/Supplemental Data: | | | | | | | | | | | | | | | | | | | | |
Net expenses before interest expense | | | 1.18 | % | | | 1.26 | % | | | 1.43 | %(g) | | | 1.50 | %(g) | | | 1.50 | %(g) |
Interest expense | | | — | %(h) | | | — | %(h) | | | 0.01 | % | | | — | %(h) | | | — | |
Net expenses | | | 1.18 | % | | | 1.26 | % | | | 1.44 | %(g) | | | 1.50 | %(g) | | | 1.50 | %(g) |
Waiver/Reimbursement | | | 0.25 | % | | | 0.09 | % | | | 0.04 | % | | | 0.04 | % | | | 0.06 | % |
Net investment income | | | 1.62 | % | | | 1.56 | % | | | 1.81 | %(g) | | | 0.59 | %(g) | | | 0.49 | %(g) |
Portfolio turnover rate | | | 71 | % | | | 111 | % | | | 133 | % | | | 68 | % | | | 28 | % |
Net assets, end of period (000s) | | $ | 136,710 | | | $ | 171,225 | | | $ | 165,846 | | | $ | 636,030 | | | $ | 636,941 | |
| (a) | On March 31, 2008, Shares class of International Fund, a series of Excelsior Funds, Inc., was reorganized into the Fund’s Class Z. The financial information of the Fund’s Class Z includes the financial information of International Fund’s Shares class. |
| (b) | Per share data was calculated using the average shares outstanding during the period. |
| (c) | Net investment income per share reflects a special dividend. The effect of this dividend amounted to $0.04 per share. |
| (d) | Rounds to less than $0.01 per share. |
| (e) | Had the Investment Manager and/or any of its affiliates not waived fees or reimbursed a portion of expenses, total return would have been reduced. |
| (f) | Total return at net asset value assuming all distributions reinvested. |
| (g) | The benefits derived from expense reductions had an impact of less than 0.01%. |
| (h) | Rounds to less than 0.01%. |
See Accompanying Notes to Financial Statements.
20
Notes to Financial Statements – Columbia International Growth Fund
March 31, 2011
Note 1. Organization
Columbia International Growth Fund (the Fund), a series of Columbia Funds Series Trust I (the Trust), is a diversified fund. The Trust is registered under the Investment Company Act of 1940, as amended (the 1940 Act), as an open-end management investment company organized as a Massachusetts business trust.
After the close of business on April 30, 2010, Ameriprise Financial, Inc. (Ameriprise Financial) acquired a portion of the asset management business of Columbia Management Group, LLC (the Transaction), including the business of managing the Fund. In connection with the closing of the Transaction (the Closing), RiverSource Investments, LLC, a wholly owned subsidiary of Ameriprise Financial, became the investment manager of the Fund and changed its name to Columbia Management Investment Advisers, LLC (the Investment Manager).
Investment Objective
The Fund seeks long-term capital appreciation.
Fund Shares
The Trust has unlimited authorized shares of beneficial interest. The Fund offers Class A, Class C and Class Z shares. All share classes have identical voting, dividend and liquidation rights. Each share class has its own expense structure and sales charges, as applicable.
Class A shares are subject to a maximum front-end sales charge of 5.75% based on the initial investment amount. Class A shares purchased without an initial sales charge in accounts aggregating $1 million to $50 million at the time of purchase are subject to a 1.00% contingent deferred sales charge (CDSC) if the shares are sold within 18 months of purchase, charged as follows: 1.00% CDSC if redeemed within 12 months of purchase, and 0.50% CDSC if redeemed more than 12, but less than 18 months after purchase.
Class C shares are subject to a 1.00% CDSC on shares redeemed within one year of purchase.
Class Z shares are not subject to sales charges and are available only to certain investors, as described in the Fund’s prospectus.
Note 2. Summary of Significant Accounting Policies
The preparation of financial statements in accordance with U.S. generally accepted accounting principles (GAAP) requires management to make certain estimates and assumptions that affect the reported amounts of assets and liabilities, the disclosure of contingent assets and liabilities at the date of the financial statements and the reported amounts of revenue and expenses during the reporting period. Actual results could differ from those estimates.
The following is a summary of significant accounting policies consistently followed by the Fund in the preparation of its financial statements.
Security Valuation
Equity securities and exchange-traded funds are valued at the last sale price on the principal exchange on which they trade, except for securities traded on the NASDAQ, which are valued at the NASDAQ official close price. Unlisted securities or listed securities for which there were no sales during the day are valued at the closing bid price on such exchanges or over-the-counter markets.
Short-term investments maturing in 60 days or less are valued at amortized cost, which approximates market value.
Investments in other open-end investment companies are valued at net asset value.
Futures contracts are valued at the settlement price established each day by the board of trade or exchange on which they are traded.
Purchased options are valued at the last reported sale price, or in the absence of a sale, at the last quoted bid price.
Written options are valued at the last reported sale price, or in the absence of a sale, at the last quoted ask price.
Forward foreign currency exchange contracts are valued at the prevailing forward exchange rate of the underlying currencies.
Foreign securities are generally valued at the last sale price on the foreign exchange or market on which they trade. If any foreign share prices are not readily available as a result of limited share activity, the securities are valued at the last sale price of the local shares in the principal market in which such securities are normally traded.
Generally, trading in foreign securities is substantially completed each day at various times prior to the close of the New York Stock Exchange (NYSE). The values of such securities used in computing the net asset value of the Fund’s shares are determined as of such times. Foreign currency exchange rates are generally determined at 4:00 p.m. Eastern (U.S.) time. Occasionally, events affecting the values of such foreign securities and such exchange rates may occur between the times at which they are determined and the close of the customary trading session of the NYSE, which would not be reflected in the computation of the Fund’s net asset value. If events
21
Columbia International Growth Fund
March 31, 2011
materially affecting the values of such foreign securities occur and it is determined that market quotations are not reliable, then these foreign securities will be valued at their fair value using procedures approved by the Board of Trustees.
The Fund may use a systematic fair valuation model provided by an independent third party to value securities principally traded in foreign markets. The third party pricing service takes into account multiple factors, including, but not limited to, movements in the U.S. securities markets, certain depositary receipts, futures contracts and foreign exchange rates that have occurred subsequent to the close of the foreign exchange, to determine a good faith estimate that reasonably reflects the current market conditions as of the close of the NYSE. The fair value of a security is likely to be different from the quoted or published price, if available.
Investments for which market quotations are not readily available, or that have quotations which management believes are not reliable, are valued at fair value as determined in good faith under consistently applied procedures established by and under the general supervision of the Board of Trustees. If a security is valued at fair value, such value is likely to be different from the last quoted market price for the security. The determination of fair value often requires significant judgment. To determine fair value, management may use assumptions including but not limited to future cash flows and estimated risk premiums. Multiple inputs from various sources may be used to determine value.
Foreign Currency Transactions and Translations
The values of all assets and liabilities quoted in foreign currencies are translated into U.S. dollars at that day’s exchange rates. Net realized and unrealized gains (losses) on foreign currency transactions and translations include gains (losses) arising from the fluctuation in exchange rates between trade and settlement dates on securities transactions, gains (losses) arising from the disposition of foreign currency and currency gains (losses) between the accrual and payment dates on dividends, interest income and foreign withholding taxes.
For financial statement purposes, the Fund does not distinguish that portion of gains (losses) on investments which is due to changes in foreign exchange rates from that which is due to changes in market prices of the investments. Such fluctuations are included with the net realized and unrealized gains (losses) on investments on the Statement of Operations.
Derivative Instruments
The Fund may use derivative instruments including futures contracts, options and forward foreign currency exchange contracts in order to meet its investment objectives. The Fund employs strategies in differing combinations to permit it to increase, decrease or change the level of exposure to market risk factors. The achievement of any strategy relating to derivatives depends on an analysis of various risk factors, and if the strategies for the use of derivatives do not work as intended, the Fund may not achieve its investment objectives.
In pursuit of its investment objectives, the Fund is exposed to the following market risks among others:
Equity Risk: Equity risk relates to change in value of equity securities such as common stocks due to general market conditions such as real or perceived adverse economic conditions, changes in the general outlook for corporate earnings, or adverse investor sentiment. Equity securities generally have greater price volatility than fixed income securities.
Foreign Exchange Rate Risk: Foreign exchange rate risk relates to the change in the U.S. dollar value of a security held that is denominated in a foreign currency. The U.S. dollar value of a foreign-currency-denominated security will decrease as the dollar appreciates against the currency, while the U.S. dollar value will increase as the dollar depreciates against the currency.
The following provides more detailed information about each derivative type held by the Fund:
Forward Foreign Currency Exchange Contracts — The Fund entered into forward foreign currency exchange contracts to shift its investment exposure from one currency to another, and to shift foreign currency exposure back to U.S. dollars. The Fund also used forward contracts to achieve a representative weighted mix of major currencies in its benchmark and/or to recover an underweight country exposure in its portfolio.
Forward foreign currency exchange contracts are agreements to exchange one currency for another at a future date at a specified price. These contracts are used to minimize the exposure to foreign exchange rate fluctuations during the period between the trade and settlement dates of the contract. Contracts to buy generally are used to acquire exposure to foreign currencies, while contracts to sell are generally used to reduce the exposure to foreign exchange rate fluctuations. Forward foreign currency exchange contracts are valued daily at the current exchange rate of the underlying currency,
22
Columbia International Growth Fund
March 31, 2011
resulting in unrealized gains (losses) which become realized at the time the forward foreign currency exchange contracts are closed or mature. Realized and unrealized gains (losses) arising from such transactions are included in net realized and unrealized gains (losses) on foreign currency transactions. The use of forward foreign currency exchange contracts does not eliminate fluctuations in the prices of the Fund’s portfolio securities. While the maximum potential loss from such contracts is the aggregate face value in U.S. dollars at the time the contract was opened, exposure is typically limited to the change in value of the contract (in U.S. dollars) over the period it remains open. The Fund could also be exposed to risk that counterparties of the contracts may be unable to fulfill the terms of the contracts.
During the year ended March 31, 2011, the Fund entered into 218 forward foreign currency exchange contracts.
Futures Contracts — The Fund entered into equity index futures contracts to equitize cash in order to maintain appropriate equity market exposure while keeping sufficient cash to accommodate daily redemptions.
The use of futures contracts involves certain risks, which include, among others: (1) imperfect correlation between the price movement of the instruments and the underlying securities, (2) inability to close out positions due to differing trading hours, or the temporary absence of a liquid market, for either the instruments or the underlying securities, and (3) an inaccurate prediction of the future direction of interest rates by the Fund’s Investment Manager.
Upon entering into a futures contract, the Fund identifies within its portfolio of investments cash or securities in an amount sufficient to meet the initial margin requirement. Subsequent payments are made or received by the Fund equal to the daily change in the contract value and are recorded as variation margin receivable or payable and offset in unrealized gains or losses. The Fund recognizes a realized gain or loss when the contract is closed or expires.
Futures contracts involve, to varying degrees, risk of loss in excess of the variation margin disclosed on the Statement of Assets and Liabilities.
During the year ended March 31, 2011, the Fund entered into 13 futures contracts.
Options — The Fund had written covered call and purchased put options to decrease the Fund’s exposure to equity risk and to increase return on instruments. Written covered call and purchased put options become more valuable as the price of the underlying instruments depreciates relative to the strike price.
Writing put options tends to increase the Fund’s exposure to the underlying instrument. When the Fund writes a call or put option, an amount equal to the premium received is recorded as a liability and subsequently marked-to-market to reflect the current value of the option written. Premiums received from writing options which expire are treated as realized gains. Premiums received from writing options which are exercised or closed are added to the proceeds or offset against the amounts paid on the underlying security transaction to determine the realized gain or loss. The Fund, as a writer of an option, has no control over whether the underlying security may be sold (call) or purchased (put) and as a result bears the market risk of an unfavorable change in the price of the security underlying the written option. There is the risk that the Fund may not be able to enter into a closing transaction because of an illiquid market. The Fund identifies within its portfolio of investments cash or liquid portfolio securities equal to the amount of the written options contract commitment.
The Fund may also purchase put and call options. Purchasing call options tends to increase the Fund’s exposure to the underlying instrument. Purchasing put options tends to decrease the Fund’s exposure to the underlying instrument. The Fund may pay a premium, which is included in the Fund’s Statement of Assets and Liabilities as an investment and subsequently marked-to-market to reflect the current value of the option. The risk associated with purchasing put and call options is limited to the premium paid. Premiums paid for purchasing options which expire are treated as realized losses. Premiums paid for purchasing options which are exercised are added to the amounts paid (call) or offset against the proceeds (put) on the underlying security to determine the realized gain or loss. If the Fund enters into a closing transaction, the Fund will realize a gain or loss, depending on whether the proceeds from the closing transaction are greater or less than the cost of the option.
During the year ended March 31, 2011, the Fund entered into 5,706 written options contracts.
During the year ended March 31, 2011, the Fund entered into 831 purchased put options contracts.
23
Columbia International Growth Fund
March 31, 2011
Effects of Derivative Transactions in the Financial Statements
The following table is a summary of the value of the Fund’s derivative instruments as of March 31, 2011.
| | | | | | |
| Fair Value of Derivative Instruments |
| Statement of Assets and Liabilities |
| Assets | | Fair Value | | Liabilities | | Fair Value |
Unrealized
Appreciation
on Forward
Foreign
Currency
Exchange
Contracts | | $526,910 | | Unrealized
Depreciation
on Forward
Foreign
Currency
Exchange
Contracts | | $279,129 |
The effect of derivative instruments on the Fund’s Statement of Operations for the year ended March 31, 2011:
| | | | | | | | | | |
| | |
| | | Risk
Exposure | | Amount
of Realized
Gain or (Loss)
on Derivatives | | | Change
in Unrealized
Appreciation
(Depreciation)
on Derivatives | |
| Futures Contracts | | Equity
Risk | | $ | 2,751 | | | $ | — | |
| Written Options | | Equity
Risk | | | 103,358 | | | | 4,009 | |
| Forward Foreign Currency Exchange Contracts | | Foreign
Exchange
Rate Risk | | | 538,483 | | | | 44,865 | |
Repurchase Agreements
The Fund may engage in repurchase agreement transactions with institutions that the Investment Manager has determined are creditworthy. The Fund, through the custodian, receives delivery of the underlying securities collateralizing a repurchase agreement. The Investment Manager is responsible for determining that the collateral is at least equal, at all times, to the value of the repurchase obligation including interest. A repurchase agreement transaction involves certain risks in the event of default or insolvency of the counterparty. These risks include possible delays in or restrictions on the Fund’s ability to dispose of the underlying securities and a possible decline in the value of the underlying securities during the period while the Fund seeks to assert its rights.
Security Transactions
Security transactions are accounted for on the trade date. Cost is determined and gains (losses) are based upon the specific identification method for both financial statement and federal income tax purposes.
Income Recognition
Interest income is recorded on the accrual basis.
Corporate actions and dividend income are recorded net of any non-reclaimable tax withholdings, on the ex-dividend date or upon receipt of ex-dividend notification in the case of certain foreign securities.
Expenses
General expenses of the Trust are allocated to the Fund and other series of the Trust based upon relative net assets or other expense allocation methodologies determined by the nature of the expense. Expenses directly attributable to a specific class of shares are charged to that share class. Expenses directly attributable to the Fund are charged to the Fund.
Determination of Class Net Asset Value
All income, expenses (other than class-specific expenses which are charged directly to a share class, as shown in the Statement of Operations) and realized and unrealized gains (losses) are allocated to each class of the Fund on a daily basis, based on the relative net assets of each class, for purposes of determining the net asset value of each class.
Federal Income Tax Status
The Fund intends to qualify each year as a “regulated investment company” under Subchapter M of the Internal Revenue Code, as amended, and will distribute substantially all of its taxable income, if any, for its tax year, and as such will not be subject to federal income taxes. In addition, the Fund intends to distribute in each calendar year substantially all of its net investment income, capital gains and certain other amounts, if any, such that the Fund should not be subject to federal excise tax. Therefore, no federal income or excise tax provision is recorded.
Foreign Taxes
The Fund may be subject to foreign taxes on income and/or gains on investments or currency repatriation, a portion of which may be recoverable. The Fund will accrue such taxes and recoveries as
24
Columbia International Growth Fund
March 31, 2011
applicable, based upon its current interpretation of tax rules and regulations that exist in the markets in which it invests.
Realized gains in certain countries may be subject to foreign taxes at the Fund level, at rates ranging from approximately 10% to 15%. The Fund accrues for such foreign taxes on net realized and unrealized gains at the appropriate rate for each jurisdiction.
Distributions to Shareholders
Distributions from net investment income, if any, are declared and paid semi-annually. Net realized capital gains, if any, are distributed at least annually. Income distributions and capital gain distributions are determined in accordance with federal income tax regulations which differ from GAAP.
Indemnifications
Under the Trust’s organizational documents and, in some cases, by contract, its officers and directors are indemnified against certain liabilities arising out of the performance of their duties to the Fund. In addition, certain of the Fund’s contracts with its service providers contain general indemnification clauses. The Fund’s maximum exposure under these arrangements is unknown since the amount of any future claims that may be made against the Fund cannot be determined and the Fund has no historical basis for predicting the likelihood of any such claims.
Note 3. Fees and Compensation Paid to Affiliates
Investment Management Fee
Under an Investment Management Services Agreement (IMSA), the Investment Manager determines which securities will be purchased, held or sold. The management fee is equal to a percentage of the Fund’s average daily net assets that declines from 0.95% to 0.48% as the Fund’s net assets increase.
Prior to the Closing, Columbia Management Advisors, LLC (Columbia), an indirect, wholly owned subsidiary of Bank of America Corporation (BOA), provided investment management services to the Fund under the same fee structure. The effective management fee rate for the year ended March 31, 2011, was 0.95% of the Fund’s average daily net assets.
Administration Fee
Effective upon the Closing, the Investment Manager provides administration and accounting services to the Fund under an Administrative Services Agreement, including services previously performed under the Pricing and Bookkeeping Oversight and Services Agreement (the Services Agreement) as discussed in the Pricing and Bookkeeping Fees note below. The Fund pays an annual administration fee equal to 0.20% of the Fund’s average daily net assets less the fees payable by the Fund as described under the Pricing and Bookkeeping Fees note below. Prior to the Closing, Columbia provided administrative services to the Fund at the same fee rates.
Pricing and Bookkeeping Fees
Prior to the Closing, the Fund entered into a Financial Reporting Services Agreement (the Financial Reporting Services Agreement) with State Street Bank and Trust Company (State Street) and Columbia pursuant to which State Street provides financial reporting services to the Fund. The Fund also entered into an Accounting Services Agreement (collectively with the Financial Reporting Services Agreement, the State Street Agreements) with State Street and Columbia pursuant to which State Street provides accounting services to the Fund. Upon the Closing, Columbia assigned and delegated its rights and obligations under the State Street Agreements to the Investment Manager. Under the State Street Agreements, the Fund pays State Street an annual fee of $38,000 paid monthly plus an additional monthly fee based on an annualized percentage rate of average daily net assets of the Fund for the month. The aggregate fee will not exceed $140,000 per year (exclusive of out-of-pocket expenses and charges). The Fund also reimburses State Street for certain out-of-pocket expenses and charges.
Also prior to the Closing, the Fund entered into the Services Agreement with Columbia. Under the Services Agreement, Columbia provided services related to Fund expenses and the requirements of the Sarbanes-Oxley Act of 2002, and provided oversight of the accounting and financial reporting services provided by State Street. Under the Services Agreement, the Fund reimbursed Columbia for out-of-pocket expenses and charges, including fees payable to third parties, such as for pricing the Fund’s portfolio securities, incurred by Columbia in the performance of services under the Services Agreement. The Services Agreement was terminated upon the Closing. These services are now provided under the Administrative Services Agreement discussed above.
Transfer Agent Fee
In connection with the Closing, RiverSource Service Corporation, a wholly owned subsidiary of Ameriprise Financial, provides transfer agency services to the Fund under a Transfer Agency Agreement and changed its name to Columbia Management Investment Services
25
Columbia International Growth Fund
March 31, 2011
Corp. (the Transfer Agent). The Transfer Agent has contracted with Boston Financial Data Services (BFDS) to serve as sub-transfer agent.
The Transfer Agent receives monthly account-based service fees based on the number of open accounts and is reimbursed by the Fund for the fees and expenses the Transfer Agent pays to financial intermediaries that maintain omnibus accounts with the Fund that is a percentage of the average aggregate value of the Fund’s shares maintained in each such omnibus account (other than omnibus accounts for which American Enterprise Investment Services Inc. is the broker of record or accounts where the beneficial shareholder is a customer of Ameriprise Financial Services, Inc., which are paid a per account fee). The Transfer Agent pays the fees of BFDS for services as sub-transfer agent and, is not entitled to reimbursement for such fees from the Fund (with the exception of out-of pocket fees). The Transfer Agent also receives compensation from fees for various shareholder services and reimbursements for certain out-of-pocket expenses.
Prior to the Closing, Columbia Management Services, Inc., an affiliate of Columbia and an indirect, wholly owned subsidiary of BOA, provided transfer agency services to the Fund and contracted with BFDS to serve as sub-transfer agent, under the same fee structure.
For the year ended March 31, 2011, the Fund’s effective transfer agent fee rate for each class was 0.06% of the Fund’s average daily net assets.
An annual minimum account balance fee of $20 may apply to certain accounts with a value below the Fund’s initial minimum investment requirements to reduce the impact of small accounts on transfer agent fees. These minimum account balance fees are recorded as part of expense reductions on the Statement of Operations. For the year ended March 31, 2011, no minimum account balance fees were charged by the Fund.
Underwriting Discounts, Service and Distribution Fees
In connection with the Closing, RiverSource Fund Distributors, Inc., an indirect wholly owned subsidiary of Ameriprise Financial, provides distribution and shareholder services to the Fund and changed its name to Columbia Management Investment Distributors, Inc. (the Distributor). Pursuant to Rule 12b-1 under the 1940 Act, the Board of Trustees has approved, and the Fund has adopted, distribution and shareholder service plans (the Plans) which set the distribution and service fees for the Fund. These fees are calculated daily and are intended to compensate the Distributor and/or eligible selling and/or servicing agents for selling shares of the Fund and providing services to investors.
The Plans require the payment of a monthly service fee to the Distributor at the maximum annual rate of 0.25% of the average daily net assets attributable to Class A and Class C shares of the Fund. The Plans also require the payment of a monthly distribution fee to the Distributor at the maximum annual rates of 0.75% of the average daily net assets attributable to Class C shares of the Fund.
Prior to the Closing, Columbia Management Distributors, Inc., an affiliate of Columbia and an indirect, wholly owned subsidiary of BOA, was the principal underwriter of the Fund’s shares. There were no changes to the underwriting discount structure of the Fund or the service or distribution fee rates paid by the Fund as a result of the Transaction.
Sales Charges
Sales charges, including front-end and CDSCs, received by the Distributor for distributing Fund shares were $99 for Class A and $47 for Class C shares for the year ended March 31, 2011.
Fee Waivers and Expense Reimbursements
The Investment Manager has voluntarily agreed to bear a portion of the Fund’s expenses so that the Fund’s ordinary operating expenses (excluding any distribution and service fees, brokerage commissions, interest, taxes and extraordinary expenses, but including custodian charges relating to overdrafts, if any), after giving effect to any balance credits from the Fund’s custodian, do not exceed 1.15% of the Fund’s average daily net assets on an annualized basis. The Investment Manager, in its discretion, may revise or discontinue this arrangement at any time. Merger costs are treated as extraordinary expenses and therefore not subject to the Fund’s expense limits. Prior to May 1, 2010, Columbia voluntarily reimbursed a portion of the Fund’s expenses in the same manner.
Fees Paid to Officers and Trustees
In connection with the Closing, all officers of the Fund are employees of the Investment Manager or its affiliates and, with the exception of the Fund’s Chief Compliance Officer, receive no compensation from the Fund. The Board of Trustees has appointed a Chief Compliance Officer to the Fund in accordance with federal securities regulations. The Fund, along with other affiliated funds, pays its pro-rata share of the expenses associated with the Chief
26
Columbia International Growth Fund
March 31, 2011
Compliance Officer. The Fund’s expenses for the Chief Compliance Officer will not exceed $15,000 per year. Prior to the Closing, all officers of the Fund were employees of Columbia or its affiliates and the Fund paid its pro-rata share of the expenses for the Chief Compliance Officer under the same fee structure.
Trustees are compensated for their services to the Fund, as set forth on the Statement of Operations. The Trust’s eligible Trustees may participate in a deferred compensation plan which may be terminated at any time. Obligations of the plan will be paid solely out of the Fund’s assets.
Note 4. Custody Credits
The Fund has an agreement with its custodian bank under which custody fees may be reduced by balance credits. These credits are recorded as part of expense reductions on the Statement of Operations. The Fund could have invested a portion of the assets utilized in connection with the expense offset arrangement in an income-producing asset if it had not entered into such an agreement.
Note 5. Portfolio Information
The cost of purchases and proceeds from sales of securities, excluding short-term obligations, aggregated $102,529,376 and $148,436,352, respectively, for the year ended March 31, 2011.
Note 6. Regulatory Settlements
During the year ended March 31, 2010, the Fund received payments totaling $6,592 resulting from certain regulatory settlements with third parties in which the Fund had participated. The payments have been included in “Increase from regulatory settlements” in the Statement of Changes in Net Assets.
Note 7. Shareholder Concentration
As of March 31, 2011, two shareholder accounts owned 86.5% of the outstanding shares of the Fund. Purchase and redemption activity of these accounts may have a significant effect on the operations of the Fund.
Note 8. Line of Credit
Prior to March 28, 2011, the Fund and other affiliated funds participated in a $280,000,000 committed, unsecured revolving line of credit provided by State Street. Effective March 28, 2011, the commitment was reduced to $225,000,000. The maximum amount that may be borrowed by any fund is limited to the lesser of $200,000,000 and the Fund’s borrowing limit set forth in the Fund’s registration statement. Borrowings are available for short-term liquidity or temporary or emergency purposes.
Effective October 14, 2010, interest is charged to each participating fund based on the fund’s borrowings at a rate per annum equal to the greater of the Federal Funds Rate plus 1.25% or the overnight LIBOR Rate plus 1.25%. In addition, a commitment fee of 0.125% per annum is accrued and apportioned among the participating funds pro rata based on their relative net assets.
For the year ended March 31, 2011, the average daily loan balance outstanding on days where borrowing existed was $3,148,148 at a weighted average interest rate of 1.526%.
Note 9. Federal Tax Information
The timing and character of income and capital gain distributions are determined in accordance with income tax regulations, which may differ from GAAP. Reclassifications are made to the Fund’s capital accounts for permanent tax differences to reflect income and gains available for distribution (or available capital loss carryforwards) under income tax regulations.
For the year ended March 31, 2011, permanent book and tax basis differences resulting primarily from differing treatments for Section 988 adjustments, passive foreign investment company (PFIC) adjustments and non-deductible merger fees were identified and reclassified among the components of the Fund’s net assets as follows:
| | | | |
| |
Undistributed Net Investment
Income | | Accumulated Net Realized
Loss | | Paid-In Capital |
| $708,473 | | $(661,675) | | $(46,798) |
Net investment income and net realized gains (losses), as disclosed on the Statement of Operations, and net assets were not affected by this reclassification.
The tax character of distributions paid during the years ended March 31, 2011 and March 31, 2010 was as follows:
| | | | | | |
| | | March 31, 2011 | | March 31, 2010 | |
| Ordinary Income* | | $3,425,993 | | $ | 2,046,808 | |
| * | For tax purposes short-term capital gain distributions, if any, are considered ordinary income distributions. |
27
Columbia International Growth Fund
March 31, 2011
As of March 31, 2011, the components of distributable earnings on a tax basis were as follows:
| | | | |
| |
Undistributed
Ordinary Income | | Undistributed Long-Term Capital Gains | | Net
Unrealized Appreciation* |
| $3,261,028 | | $ — | | $29,623,644 |
| * | The differences between book-basis and tax-basis net unrealized appreciation are primarily due to PFIC adjustments and deferral of losses from wash sales. |
Unrealized appreciation and depreciation at March 31, 2011, based on cost of investments for federal income tax purposes were:
| | | | |
| | |
Unrealized appreciation | | $ | 31,828,632 | |
Unrealized depreciation | | | (2,204,988 | ) |
| | | | |
Net unrealized appreciation | | $ | 29,623,644 | |
The following capital loss carryforwards may be available to reduce taxable income arising from future net realized gains on investments, if any, to the extent permitted by the Internal Revenue Code:
| | | | |
| | |
| Year of Expiration | | Capital Loss Carryforwards | |
2017 | | $ | 17,494,458 | |
2018 | | | 113,489,589 | |
| | | | |
| | $ | 130,984,047 | |
Capital loss carryforwards of $9,900,348 were utilized during the year ended March 31, 2011. Any capital loss carryforwards acquired as part of a merger that are permanently lost due to provisions under the Internal Revenue Code are included as being expired.
Management of the Fund has concluded that there are no significant uncertain tax positions that would require recognition in the financial statements. However, management’s conclusion may be subject to review and adjustment at a later date based on factors including, but not limited to, new tax laws, regulations, and administrative interpretations (including relevant court decisions). The Fund’s federal tax returns for the prior three fiscal years remain subject to examination by the Internal Revenue Service.
Note 10. Significant Risks and Contingencies
Foreign Securities Risk
Investing in foreign securities may include certain risks and considerations not typically associated with investing in U.S. securities, such as fluctuating currency values and changing local and regional economic, political and social conditions, which may result in greater market volatility. In addition, certain foreign securities may not be as liquid as U.S. securities. Investing in emerging markets may accentuate these risks.
Investments in emerging market countries are subject to additional risk. The risk of foreign investments is typically increased in less developed countries. These countries are also more likely to experience high levels of inflation, deflation or currency devaluation which could hurt their economies and securities markets.
Note 11. Subsequent Events
Management has evaluated the events and transactions that have occurred through the date the financial statements were issued. Other than as noted below, there were no items requiring adjustment of the financial statements or additional disclosure.
In August 2010, the Board of Trustees approved a proposal to merge the Fund into Columbia Multi-Advisor International Equity Fund. The proposal was approved at a special meeting of shareholders held on February 15, 2011. The merger, which was a tax-free reorganization for U.S. federal income tax purposes, was effective April 11, 2011.
Effective May 16, 2011, the line of credit commitment with State Street was reduced to $150,000,000, and the maximum amount that may be borrowed by any fund was limited to the lesser of $120,000,000 and the Fund’s borrowing limit set forth in the Fund’s registration statement.
Note 12. Information Regarding Pending and Settled Legal Proceedings
In June 2004, an action captioned John E. Gallus et al. v. American Express Financial Corp. and American Express Financial Advisors Inc. was filed in the United States District Court for the District of Arizona. The plaintiffs allege that they are investors in several American Express Company (now known as RiverSource) mutual funds and they purport to bring the action derivatively on behalf of those funds under the Investment Company Act of 1940. The plaintiffs allege that fees allegedly paid to the defendants by the funds for investment advisory and administrative services are excessive. The plaintiffs seek remedies including restitution and rescission of investment advisory and distribution agreements. The plaintiffs voluntarily agreed to transfer this case to the United States District Court for the District of Minnesota (the District Court). In response to defendants’ motion to dismiss the complaint, the District Court dismissed one of plaintiffs’ four claims and granted plaintiffs
28
Columbia International Growth Fund
March 31, 2011
limited discovery. Defendants moved for summary judgment in April 2007. Summary judgment was granted in the defendants’ favor on July 9, 2007. The plaintiffs filed a notice of appeal with the Eighth Circuit Court of Appeals (the Eighth Circuit) on August 8, 2007. On April 8, 2009, the Eighth Circuit reversed summary judgment and remanded to the District Court for further proceedings. On August 6, 2009, defendants filed a writ of certiorari with the U.S. Supreme Court (the Supreme Court), asking the Supreme Court to stay the District Court proceedings while the Supreme Court considers and rules in a case captioned Jones v. Harris Associates, which involves issues of law similar to those presented in the Gallus case. On March 30, 2010, the Supreme Court issued its ruling in Jones v. Harris Associates, and on April 5, 2010, the Supreme Court vacated the Eighth Circuit’s decision in the Gallus case and remanded the case to the Eighth Circuit for further consideration in light of the Supreme Court’s decision in Jones v. Harris Associates. On June 4, 2010, the Eighth Circuit remanded the Gallus case to the District Court for further consideration in light of the Supreme Court’s decision in Jones v. Harris Associates. On December 9, 2010, the District Court reinstated its July 9, 2007 summary judgment order in favor of the defendants. On January 10, 2011, plaintiffs filed a notice of appeal with the Eighth Circuit.
In December 2005, without admitting or denying the allegations, American Express Financial Corporation (AEFC, which is now known as Ameriprise Financial, Inc. (Ameriprise Financial)), entered into settlement agreements with the Securities and Exchange Commission (SEC) and Minnesota Department of Commerce (MDOC) related to market timing activities. As a result, AEFC was censured and ordered to cease and desist from committing or causing any violations of certain provisions of the Investment Advisers Act of 1940, the Investment Company Act of 1940, and various Minnesota laws. AEFC agreed to pay disgorgement of $10 million and civil money penalties of $7 million. AEFC also agreed to retain an independent distribution consultant to assist in developing a plan
for distribution of all disgorgement and civil penalties ordered by the SEC in accordance with various undertakings detailed at http://www.sec.gov/litigation/admin/ia-2451.pdf. Ameriprise Financial and its affiliates have cooperated with the SEC and the MDOC in these legal proceedings, and have made regular reports to the funds’ Boards of Directors/Trustees.
Ameriprise Financial and certain of its affiliates have historically been involved in a number of legal, arbitration and regulatory proceedings, including routine litigation, class actions, and governmental actions, concerning matters arising in connection with the conduct of their business activities. Ameriprise Financial believes that the Funds are not currently the subject of, and that neither Ameriprise Financial nor any of its affiliates are the subject of, any pending legal, arbitration or regulatory proceedings that are likely to have a material adverse effect on the Funds or the ability of Ameriprise Financial or its affiliates to perform under their contracts with the Funds. Ameriprise Financial is required to make 10-Q, 10-K and, as necessary, 8-K filings with the Securities and Exchange Commission on legal and regulatory matters that relate to Ameriprise Financial and its affiliates. Copies of these filings may be obtained by accessing the SEC website at www.sec.gov.
There can be no assurance that these matters, or the adverse publicity associated with them, will not result in increased fund redemptions, reduced sale of fund shares or other adverse consequences to the Funds. Further, although we believe proceedings are not likely to have a material adverse effect on the Funds or the ability of Ameriprise Financial or its affiliates to perform under their contracts with the Funds, these proceedings are subject to uncertainties and, as such, we are unable to estimate the possible loss or range of loss that may result. An adverse outcome in one or more of these proceedings could result in adverse judgments, settlements, fines, penalties or other relief that could have a material adverse effect on the consolidated financial condition or results of operations of Ameriprise Financial.
29
Report of Independent Registered Public Accounting Firm
To the Trustees of Columbia Funds Series Trust I and the Shareholders of Columbia International Growth Fund
In our opinion, the accompanying statement of assets and liabilities, including the investment portfolio, and the related statements of operations and of changes in net assets and the financial highlights present fairly, in all material respects, the financial position of Columbia International Growth Fund (the “Fund”) (a series of Columbia Funds Series Trust I) at March 31, 2011, the results of its operations for the year then ended, the changes in its net assets for each of the two years in the period then ended, and the financial highlights for the periods indicated, in conformity with accounting principles generally accepted in the United States of America. These financial statements and financial highlights (hereafter referred to as “financial statements”) are the responsibility of the Fund’s management. Our responsibility is to express an opinion on these financial statements based on our audits. We conducted our audits of these financial statements in accordance with the standards of the Public Company Accounting Oversight Board (United States). Those standards require that we plan and perform the audit to obtain reasonable assurance about whether the financial statements are free of material misstatement. An audit includes examining, on a test basis, evidence supporting the amounts and disclosures in the financial statements, assessing the accounting principles used and significant estimates made by management, and evaluating the overall financial statement presentation. We believe that our audits, which included confirmation of securities at March 31, 2011 by correspondence with the custodian and brokers, provide a reasonable basis for our opinion.
As disclosed in Note 11, the Fund was merged into the Columbia Multi-Advisor International Equity Fund on April 11, 2011.
PricewaterhouseCoopers LLP
Boston, Massachusetts
May 20, 2011
30
Federal Income Tax Information (Unaudited) – Columbia International Growth Fund
Foreign taxes paid during the fiscal year ended March 31, 2011, of $375,378 are being passed through to shareholders. This represents $0.04 per share. Eligible shareholders may claim this amount as a foreign tax credit.
Gross income derived from sources within foreign countries was $4,377,825 ($0.47 per share) for the fiscal year ended March 31, 2011.
2.39% of the ordinary income distributed by the Fund for the fiscal year ended March 31, 2011, qualifies for the corporate dividends received deduction.
For non-corporate shareholders 100.00%, or the maximum amount allowable under the Jobs and Growth Tax Relief Reconciliation Act of 2003, of ordinary income distributed by the Fund for the fiscal year ended March 31, 2011 may represent qualified dividend income.
The Fund will notify shareholders in January 2012 of amounts for use in preparing 2011 income tax returns.
31
Fund Governance
The Trustees serve terms of indefinite duration. The names, addresses and birth years of the Trustees and Officers of the Funds in Columbia Funds Series Trust I, the year each was first elected or appointed to office, their principal business occupations during at least the last five years, the number of Funds overseen by each Trustee and other directorships they hold are shown below, as of May 2, 2011. Each officer listed below serves as an officer of each Fund in Columbia Funds Series Trust I.
Independent Trustees
| | |
Name, address and year of birth,
Position with funds, Year first
elected or appointed to office | | Principal occupation(s) during past five years, Number of funds in Columbia Funds
Complex overseen by trustee, Other directorships held |
| |
| John D. Collins (born 1938) | | |
c/o Columbia Management Investment Advisers, LLC 225 Franklin Street Boston, MA 02110 Trustee (since 2005) | | Retired. Consultant, KPMG, LLP (accounting and tax firm) from July 1999 to June 2000; Partner, KPMG, LLP from March 1962 to June 1999. Oversees 46; Mrs. Fields Original Cookies, Inc. (consumer products); Suburban Propane Partners, L.P.; and Montpelier Re (insurance underwriting firm) |
| |
| Rodman L. Drake (born 1943) | | |
c/o Columbia Management Investment Advisers, LLC 225 Franklin Street Boston, MA 02110 Trustee (since 1994) and Chairman of the Board (since 2009) | | Independent consultant since 2010; Co-Founder of Baringo Capital LLC (private equity) from 1997 to 2008; CEO of Crystal River Capital, Inc. (real estate investment trust) from 2003 to 2010; Oversees 46; Jackson Hewitt Tax Service Inc. (tax preparation services); Celgene Corporation (global biotechnology company); Student Loan Corporation (student loan provider); Crystal River Capital, Inc. from 2005 to 2010; Parsons Brinckerhoff from 1995 to 2008; the Helios Funds (closed-end funds); and Apex Silver Mines Ltd. from 2007 to 2009 |
| |
| Douglas A. Hacker (born 1955) | | |
c/o Columbia Management Investment Advisers, LLC 225 Franklin Street Boston, MA 02110 Trustee (since 1996) | | Independent business executive since May 2006; Executive Vice President–Strategy of United Airlines (airline) from December 2002 to May 2006; President of UAL Loyalty Services (airline marketing company) from September 2001 to December 2002; Executive Vice President and Chief Financial Officer of United Airlines from July 1999 to September 2001. Oversees 46; Nash Finch Company (food distributor); Aircastle Limited (aircraft leasing); and SeaCube Container Leasing Ltd (container leasing) |
|
| Janet Langford Kelly (born 1957) |
c/o Columbia Management Investment Advisers, LLC 225 Franklin Street Boston, MA 02110 Trustee (since 1996) | | Senior Vice President, General Counsel and Corporate Secretary, ConocoPhillips (integrated energy company) since September 2007; Deputy General Counsel–Corporate Legal Services, ConocoPhillips from August 2006 to August 2007; Partner, Zelle, Hofmann, Voelbel, Mason & Gette LLP (law firm) from March 2005 to July 2006; Adjunct Professor of Law, Northwestern University, from September 2004 to June 2006; Director, UAL Corporation (airline) from February 2006 to July 2006; Oversees 46; None |
| |
| William E. Mayer (born 1940) | | |
c/o Columbia Management Investment Advisers, LLC 225 Franklin Street Boston, MA 02110 Trustee (since 1994) | | Partner, Park Avenue Equity Partners (private equity) since February 1999; Dean and Professor, College of Business and Management, University of Maryland from 1992 to 1996. Oversees 46; DynaVox Inc. (software developer); Lee Enterprises (print media), WR Hambrecht + Co. (financial service provider); BlackRock Kelso Capital Corporation (investment company) |
32
Fund Governance (continued)
Independent Trustees (continued)
| | |
Name, address and year of birth,
Position with funds, Year first
elected or appointed to office | | Principal occupation(s) during past five years, Number of funds in Columbia Funds
Complex overseen by trustee, Other directorships held |
| |
| David M. Moffett (born 1952) | | |
c/o Columbia Management Investment Advisers, LLC 225 Franklin Street Boston, MA 02110 Trustee (since 2011) | | Retired. Chief Executive Officer, Federal Home Loan Mortgage Corporation, from 2008 to 2009; Senior Adviser, Global Financial Services Group, Carlyle Group, Inc., from 2007 to 2008; Vice Chairman and Chief Financial Officer, U.S. Bancorp, from 1993 to 2007. Oversees 46; CIT Group Inc. (commercial and consumer finance), eBay Inc. (online trading community), MBIA Corp (financial service provider), E.W. Scripps Co. (print and television media), Building Materials Holding Corp. (building materials and construction services), and University of Oklahoma Foundation. |
| |
| Charles R. Nelson (born 1942) | | |
c/o Columbia Management Investment Advisers, LLC 225 Franklin Street Boston, MA 02110 Trustee (since 1981) | | Professor of Economics, University of Washington, since January 1976; Ford and Louisa Van Voorhis Professor of Political Economy, University of Washington, since September 1993; Adjunct Professor of Statistics, University of Washington, since September 1980; Associate Editor, Journal of Money Credit and Banking, 1993-2008; Consultant on econometric and statistical matters. Oversees 46; None |
| |
| John J. Neuhauser (born 1943) | | |
c/o Columbia Management Investment Advisers, LLC 225 Franklin Street Boston, MA 02110 Trustee (since 1984) | | President, Saint Michael’s College, since August 2007; Director or Trustee of several non-profit organization, including Fletcher Allen Health Care, Inc.; University Professor, Boston College from November 2005 to August 2007; Academic Vice President and Dean of Faculties, Boston College from August 1999 to October 2005. Oversees 46; Liberty All-Star Equity Fund and Liberty All-Star Growth Fund, Inc. (closed-end funds) |
| |
| Jonathan Piel (born 1938) | | |
c/o Columbia Management Investment Advisers, LLC 225 Franklin Street Boston, MA 02110 Trustee (since 1994) | | Cable television producer and website designer; The Editor, Scientific American from 1984 to 1994; Vice President, Scientific American, Inc., from 1984 to 1994; Member, Advisory Board, Stone Age Institute, Bloomington, Indiana (research institute that explores the effect of technology on human evolution); Member, Board of Directors of the National Institute of Social Sciences, New York City; Member, Board of Trustees of the William Alanson White Institute, New York City (institution for training psychoanalysts); and Member, Advisory Board, Mount Sinai Children’s Environmental Health Center, New York. Oversees 46; None |
| |
| Patrick J. Simpson (born 1944) | | |
c/o Columbia Management Investment Advisers, LLC 225 Franklin Street Boston, MA 02110 Trustee (since 2000) | | Partner, Perkins Coie LLP (law firm). Oversees 46; None |
| |
| Anne-Lee Verville (born 1945) | | |
c/o Columbia Management Investment Advisers, LLC 225 Franklin Street Boston, MA 02110 Trustee (since 1998) | | Retired since 1997 (formerly General Manager–Global Education Industry from 1994 to 1997, President–Application Systems Division from 1991 to 1994, Chief Financial Officer–US Marketing & Services from 1988 to 1991, and Chief Information Officer from 1987 to 1988, IBM Corporation (computer and technology)). Oversees 46; Enesco Group, Inc. (producer of giftware and home and garden decor products) from 2001 to 2006 |
33
Fund Governance (continued)
Interested Trustee
| | |
Name, address and year of birth,
Position with funds, Year first
elected or appointed to office | | Principal occupation(s) during past five years, Number of funds in Columbia Funds
Complex overseen by trustee, Other directorships held |
| |
| Michael A. Jones (born 1959) | | |
c/o Columbia Management Investment Advisers, LLC 225 Franklin Street Boston, MA 02110 Trustee (since 2011) Senior Vice President (since 2010) | | President and Director, Columbia Management Investment Advisers, LLC since May 2010; President and Director, Columbia Management Investment Distributors, Inc. since May 2010; Manager, Chairman, Chief Executive Officer and President, Columbia Management Advisors, LLC from 2007 to April 2010; Chief Executive Officer, President and Director, Columbia Management Distributors, Inc. from November 2006 to April 2010; previously, co-president and senior managing director at Robeco Investment Management. Oversees 46; None |
The Statement of Additional Information includes additional information about the Trustees of the Funds and is available, without charge, upon request by calling 1-800-345-6611.
34
Fund Governance (continued)
Officers
| | |
| Name, year of birth and address | | Principal occupation(s) during the past five years |
|
| J. Kevin Connaughton (born 1964) |
225 Franklin Street Boston, MA 02110 President (since 2009) | | Senior Vice President and General Manager–Mutual Fund Products, Columbia Management Investment Advisers, LLC since May 2010; President, Columbia Funds, since 2009, and RiverSource Funds, since May 2010 (previously Senior Vice President and Chief Financial Officer, Columbia Funds, from June 2008 to January 2009, Treasurer, Columbia Funds, from October 2003 to May 2008, and senior officer of various other affiliated funds since 2000); Managing Director, Columbia Management Advisors, LLC from December 2004 to April 2010. |
| |
| Michael G. Clarke (born 1969) | | |
225 Franklin Street Boston, MA 02110 Treasurer (since 2011) and Chief Financial Officer (since 2009) | | Vice President, Columbia Management Investment Advisers, LLC since May 2010; Managing Director of Fund Administration, Columbia Management Advisors, LLC, from September 2004 to April 2010; senior officer of Columbia Funds and affiliated funds since 2002. |
| |
| Scott R. Plummer (born 1959) | | |
5228 Ameriprise Financial Center Minneapolis, MN 55474 Senior Vice President, Secretary and Chief Legal Officer (since 2010) | | Chief Legal Officer and Assistant Secretary, Columbia Management Investment Advisers, LLC since June 2005; Vice President and Lead Chief Counsel–Asset Management, Ameriprise Financial, Inc. since May 2010 (previously Vice President and Chief Counsel–Asset Management, from 2005 to April 2010, and Vice President–Asset Management Compliance from 2004 to 2005); Vice President, Chief Counsel and Assistant Secretary, Columbia Management Investment Distributors, Inc. since 2008; Vice President, General Counsel and Secretary, Ameriprise Certificate Company since 2005; Chief Counsel, RiverSource Distributors, Inc. since 2006; Vice President, General Counsel and Secretary, RiverSource Funds, since December 2006; Senior Vice President, Secretary and Chief Legal Officer, Columbia Funds, since May 2010. |
| |
| Linda J. Wondrack (born 1964) | | |
225 Franklin Street Boston, MA 02110 Senior Vice President and Chief Compliance Officer (since 2007) | | Vice President and Chief Compliance Officer, Columbia Management Investment Advisers, LLC since May 2010; Chief Compliance Officer, Columbia Funds, since 2007, and RiverSource Funds, since May 2010; Director (Columbia Management Group, LLC and Investment Product Group Compliance), Bank of America, from June 2005 to April 2010; Director of Corporate Compliance and Conflicts Officer of MFS Investment Management (investment management) from August 2004 to May 2005. |
| |
| William F. Truscott (born 1960) | | |
53600 Ameriprise Financial Center Minneapolis, MN 55474 Senior Vice President (since 2010) | | Chairman of the Board, Columbia Management Investment Advisers, LLC since May 2010 (previously President, Chairman of the Board and Chief Investment Officer, from 2001 to April 2010); Chief Executive Officer, U.S. Asset Management & President, Annuities, Ameriprise Financial, Inc. since May 2010 (previously President–U.S. Asset Management and Chief Investment Officer from 2005 to April 2010, and Senior Vice President–Chief Investment Officer, from 2001 to 2005); Director, President and Chief Executive Officer, Ameriprise Certificate Company since 2006; Director, Columbia Management Investment Distributors, Inc. since May 2010 (previously Chairman of the Board and Chief Executive Officer from 2008 to April 2010); Chairman of the Board and Chief Executive Officer, RiverSource Distributors, Inc. since 2006. |
35
Fund Governance (continued)
Officers (continued)
| | |
| Name, year of birth and address | | Principal occupation(s) during the past five years |
| |
| Colin Moore (born 1958) | | |
225 Franklin Street Boston, MA 02110 Senior Vice President (since 2010) | | Director and Chief Investment Officer, Columbia Management Investment Advisers, LLC since May 2010; Manager, Managing Director and Chief Investment Officer of Columbia Management Advisors, LLC from 2007 to April 2010; Head of Equities, Columbia Management Advisors, LLC from 2002 to 2007. |
| |
| Amy Johnson (born 1965) | | |
5228 Ameriprise Financial Center Minneapolis, MN 55474 Vice President (since 2010) | | Senior Vice President and Chief Operating Officer, Columbia Management Investment Advisers, LLC since May 2010 (previously Chief Administrative Officer, from 2009 until April 2010, Vice President–Asset Management and Trust Company Services, from 2006 to 2009, and Vice President–Operations and Compliance from 2004 to 2006). |
| |
| Joseph F. DiMaria (born 1968) | | |
225 Franklin Street Boston, MA 02110 Vice President (since 2011) and Chief Accounting Officer (since 2008) | | Vice President, Mutual Fund Administration, Columbia Management Investment Advisers, LLC, since May 2010; Director of Fund Administration, Columbia Management Advisors, LLC from January 2006 to April 2010; Head of Tax/Compliance and Assistant Treasurer, Columbia Management Advisors, LLC, from November 2004 to December 2005. |
| |
| Stephen T. Welsh (born 1957) | | |
225 Franklin Street Boston, MA 02110 Vice President (since 2006) | | President and Director, Columbia Management Investment Services Corp. since May 2010; President and Director, Columbia Management Services, Inc. from July 2004 to April 2010; Managing Director, Columbia Management Distributors, Inc. from August 2007 to April 2010. |
| |
| Paul D. Pearson (born 1956) | | |
5228 Ameriprise Financial Center Minneapolis, MN 55474 Vice President and Assistant Treasurer (since 2011) | | Vice President, Investment Accounting, Columbia Management Investment Advisers, LLC, since May 2010; Vice President, Managed Assets, Investment Accounting, Ameriprise Financial Corporation. |
| |
| Paul B. Goucher (born 1968) | | |
5228 Ameriprise Financial Center Minneapolis, MN 55474 Vice President and Assistant Treasurer (since 2010) | | Vice President and Chief Counsel of Ameriprise Financial since January 2010 (formerly Vice President and Group Counsel from November 2008 to January 2010); Director, Managing Director and General Counsel of J. & W. Seligman & Co. Incorporated (Seligman) from July 2008 to November 2008 and Managing Director and Associate General Counsel of Seligman from January 2005 to July 2008. |
|
| Christopher O. Petersen (born 1970) |
5228 Ameriprise Financial Center Minneapolis, MN 55474 Vice President and Assistant Treasurer (since 2010) | | Vice President and Chief Counsel, Ameriprise Financial since January 2010 (formerly Vice President and Group Counsel or Counsel from April 2004 to January 2010); Assistant Secretary of RiverSource Funds since January 2007. |
| |
| Michael E. DeFao (born 1968) | | |
5228 Ameriprise Financial Center Minneapolis, MN 55474 Vice President and Assistant Treasurer (since 2011) | | Vice President and Chief Counsel, Ameriprise Financial since May 2010; Associate General Counsel Bank of America from June 2005 to April 2010. |
36
Shareholder Meeting Results
Columbia International Growth Fund
At a Joint Special Meeting of Shareholders held on February 15, 2011, shareholders of the Fund considered a proposal to approve an Agreement and Plan of Reorganization pursuant to which the Fund will transfer its assets to Columbia Multi-Advisor International Equity Fund (the “Buying Fund”) in exchange for shares of the Buying Fund and the assumption by the Buying Fund of all of the liabilities of the Fund (the “Reorganization”). The proposal was approved as follows:
| | | | | | |
| |
| Votes For | | Votes Against | | Abstentions | | Broker Non-Votes |
| 97,154,122 | | 676,237 | | 292,915 | | 0 |
The Reorganization was effective on April 11, 2011
37
[THIS PAGE INTENTIONALLY LEFT BLANK]
38
[THIS PAGE INTENTIONALLY LEFT BLANK]
39
[THIS PAGE INTENTIONALLY LEFT BLANK]
40
Important Information About This Report
The fund mails one shareholder report to each shareholder address. If you would like more than one report, please call shareholder services at 1-800-345-6611 and additional reports will be sent to you. This report has been prepared for shareholders of Columbia International Growth Fund.
A description of the policies and procedures that the fund uses to determine how to vote proxies and a copy of the fund’s voting records are available (i) at www.columbiamanagement.com, (ii) on the Securities and Exchange Commission’s website at www.sec.gov, and (iii) without charge, upon request, by calling 1-800-368-0346. Information regarding how the fund voted proxies relating to portfolio securities during the 12-month period ended June 30 is available from the SEC’s website. Information regarding how the fund voted proxies relating to portfolio securities is also available from the fund’s website, www.columbiamanagement.com.
The fund files a complete schedule of portfolio holdings with the SEC for the first and third quarters of each fiscal year on Form N-Q. The fund’s Form N-Q is available on the SEC’s website at www.sec.gov and may be reviewed and copied at the SEC’s Public Reference Room in Washington, D.C. Information on the operation of the Public Reference Room may be obtained by calling
1-800-SEC-0330.
Transfer Agent
Columbia Management Investment Services Corp.
P.O. Box 8081
Boston, MA 02266-8081
1-800-345-6611
Distributor
Columbia Management Investment
Distributors, Inc.
225 Franklin Street
Boston, MA 02110
Investment Manager
Columbia Management Investment Advisers, LLC
225 Franklin Street
Boston, MA 02110
41

Columbia International Growth Fund
P.O. Box 8081
Boston, MA 02266-8081
columbiamanagement.com
This information is for use with concurrent or prior delivery of a fund prospectus. Investors should consider the investment objectives, risks, charges and expenses of a mutual fund carefully before investing. For a free prospectus, which contains this and other important information about the funds, visit columbiamanagement.com. Read the prospectus carefully before investing. The Fund is distributed by Columbia Management Investment Distributors, Inc., member FINRA, and managed by Columbia Management Investment Advisers, LLC.
©2011 Columbia Management Investment Advisers, LLC. All rights reserved.
C-1146 A (05/11)

Columbia Pacific/Asia Fund
Annual Report for the Period Ended March 31, 2011
Table of contents
The views expressed in this report reflect the current views of the respective parties. These views are not guarantees of future performance and involve certain risks, uncertainties and assumptions that are difficult to predict, so actual outcomes and results may differ significantly from the views expressed. These views are subject to change at any time based upon economic, market or other conditions and the respective parties disclaim any responsibility to update such views. These views may not be relied on as investment advice and, because investment decisions for a Columbia Fund are based on numerous factors, may not be relied on as an indication of trading intent on behalf of any particular Columbia Fund. References to specific securities should not be construed as a recommendation or investment advice.
President’s Message

Dear Shareholder:
The Columbia Management story began over 100 years ago, and today, we are one of the nation’s largest dedicated asset managers. The recent acquisition by Ameriprise Financial, Inc. brings together the talents, resources and capabilities of Columbia Management with those of RiverSource Investments, Threadneedle (acquired by Ameriprise in 2003) and Seligman Investments (acquired by Ameriprise in 2008) to build a best-in-class asset management business that we believe is truly greater than its parts.
RiverSource Investments traces its roots to 1894 when its then newly-founded predecessor, Investors Syndicate, offered a face-amount savings certificate that gave small investors the opportunity to build a safe and secure fund for retirement, education or other special needs. A mutual fund pioneer, Investors Syndicate launched Investors Mutual Fund in 1940. In the decades that followed, its mutual fund products and services lineup grew to include a full spectrum of styles and specialties. More than 110 years later, RiverSource continues to be a trusted financial products leader.
Threadneedle, a leader in global asset management and one of Europe’s largest asset managers, offers sophisticated international experience from a dedicated U.K. management team. Headquartered in London, it is named for Threadneedle Street in the heart of the city’s financial district, where British investors pioneered international and global investing. Threadneedle was acquired in 2003 and today operates as an affiliate of Columbia Management.
Seligman Investments’ beginnings date back to the establishment of the investment firm J. & W. Seligman & Co. in 1864. In the years that followed, Seligman played a major role in the geographical expansion and industrial development of the United States. In 1874, President Ulysses S. Grant named Seligman as fiscal agent for the U.S. Navy — an appointment that would last through World War I. Seligman helped finance the westward path of the railroads and the building of the Panama Canal. The firm organized its first investment company in 1929 and began managing its first mutual fund in 1930. In 2008, J. & W. Seligman & Co. Incorporated was acquired and Seligman Investments became an offering brand of RiverSource Investments, LLC.
We are proud of the rich and distinctive history of these firms, the strength and breadth of products and services they offer, and the combined cultures of pioneering spirit and forward thinking. Together we are committed to providing more for our shareholders than ever before.
| n | | A singular focus on our shareholders. Our business is asset management, so investors are our first priority. We dedicate our resources to identifying timely investment opportunities and provide a comprehensive choice of equity, fixed-income and alternative investments to help meet your individual needs. |
| n | | First-class research and thought leadership. We are dedicated to helping you take advantage of today’s opportunities and anticipate tomorrow’s. We stay abreast of the latest investment trends and ideas, using our collective insight to evaluate events and transform them into solutions you can use. |
| n | | A disciplined investment approach. We aren’t distracted by passing fads. Our teams adhere to a rigorous investment process that helps ensure the integrity of our products and enables you and your financial advisor to match our solutions to your objectives with confidence. |
When you choose Columbia Management, you can be confident that we will take the time to understand your needs and help you and your financial advisor identify the solutions that are right for you. Because at Columbia Management, we don’t consider ourselves successful unless you are.
Sincerely,

J. Kevin Connaughton
President, Columbia Funds
Investors should consider the investment objectives, risks, charges and expenses of a mutual fund carefully before investing. For a free prospectus, which contains this and other important information about the funds, visit www.columbiamanagement.com. The prospectus should be read carefully before investing.
Columbia Funds are distributed by Columbia Management Investment Distributors, Inc., member FINRA, and managed by Columbia Management Investment Advisers, LLC.
© 2011 Columbia Management Investment Advisers, LLC. All rights reserved.
Fund Profile – Columbia Pacific/Asia Fund
Summary
| n | | For the 12-month period that ended March 31, 2011, the fund’s Class A shares returned 14.26% without sales charge. |
| n | | The fund outperformed its benchmarks, the MSCI All Country Asia Pacific Index (Net) 1, which returned 11.14%, and the MSCI EAFE Index (Net)2, which returned 10.42%. It also outperformed the average return of the fund’s peer group, the Lipper Pacific Region Funds Classification3, which was 10.60%. |
| n | | Superior stock selection in China and Japan as well as in the financials sector helped drive the fund’s outperformance. |
Portfolio Management
Daisuke Nomoto has co-managed the fund since 2008 and has been associated with the fund’s adviser or the fund’s previous adviser or its predecessors since April 2005.
Jasmine (Weili) Huang has co-managed the fund since 2008 and has been associated with the fund’s adviser or the fund’s previous adviser or its predecessors since 2003.
| 1 | The Morgan Stanley Capital International Europe, Australasia, Far East (MSCI) All Country (AC) Pacific Index (Net) is a free float-adjusted market capitalization weighted index that is designed to measure the equity market performance of the developed and emerging markets in the Pacific region. As of December 31, 2010, the MSCI AC Pacific Index (Net) consisted of the following 12 developed and emerging market countries: Australia, China, Hong Kong, Indonesia, Japan, Korea, Malaysia, New Zealand, Philippines, Singapore, Taiwan and Thailand. |
| 2 | The Morgan Stanley Capital International Europe, Australasia, Far East (MSCI EAFE) Index (Net) is a free float-adjusted market capitalization index that is designed to measure the equity market performance of developed markets, excluding the U.S. & Canada. As of December 31, 2010, the MSCI EAFE Index (Net) consisted of the following 22 developed market country indices: Australia, Austria, Belgium, Denmark, Finland, France, Germany, Greece, Hong Kong, Ireland, Israel, Italy, Japan, the Netherlands, New Zealand, Norway, Portugal, Singapore, Spain, Sweden, Switzerland and the United Kingdom. |
| 3 | Lipper Inc., a widely respected data provider in the industry, calculates an average total return (assuming reinvestment of distributions) for mutual funds with investment objectives similar to those of the fund. Lipper makes no adjustment for the effect of sales loads. |
Indices are not available for investment, are not professionally managed and do not reflect sales charges, fees, brokerage commissions, taxes or other expenses of investing. Securities in the fund may not match those in an index.
Performance data quoted represents past performance and current performance may be lower or higher. Past performance is no guarantee of future results. The investment return and principal value will fluctuate so that shares, when redeemed, may be worth more or less than the original cost. Please visit www.columbiamanagement.com for daily and most recent month-end performance updates.
Summary
1-year return as of 03/31/11
| | |
| |
 | | +14.26% Class A shares
(without sales charge) |
| |
| | +11.14% MSCI All Country Asia Pacific Index (Net) |
| |
| | +10.42% MSCI EAFE Index (Net) |
|
Morningstar Style BoxTM |
|
Equity Style |
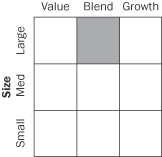
|
The Morningstar Style BoxTM is based on the fund’s portfolio holdings. For equity funds, the vertical axis shows the market capitalization of the stocks owned, and the horizontal axis shows investment style (value, blend, or growth). Information shown is based on the most recent data provided by Morningstar.
© 2011 Morningstar, Inc. All rights reserved. The Morningstar information contained herein: (1) is proprietary to Morningstar and/or its content providers; (2) may not be copied or distributed; and (3) is not warranted to be accurate, complete or timely. Neither Morningstar nor its content providers are responsible for any damages or losses arising from any use of this information.
1
Economic Update – Columbia Pacific/Asia Fund
Summary
For the 12-month period that ended March 31, 2011
| | n | | Despite intermittent volatility, stock markets around the world gained ground, as measured by the MSCI World Index (Net). The MSCI All Country Asia Pacific Index (Net) returned 11.14%, weighed down by Japan at the end of the period. | |
| | |
MSCI World
Index (Net) | | MSCI All Country Asia Pacific
Index (Net) |
| |

| |
|
13.45% | | 11.14% |
As the world shed concerns that key economies might lapse back into recession, the World Bank reported that global gross domestic product (GDP) rose 3.9% in 2010. The improvement over 2009 was more notable in high-income developed economies than in emerging-market countries, which had less ground to make up. Emerging-market countries expanded by an estimated 7%, contributing nearly half of all global growth in 2010. This two-speed global recovery is likely to result in slower growth in 2011, but global growth should remain solid at 3.3% to 3.6%.1
A devastating period for Japan
In March, Japan was dealt a series of devastating blows: a major earthquake, followed by a destructive tsunami and damage to a major nuclear power plant. In addition to unspeakable loss of life and property devastation, the catastrophe sent investors scrambling and created uncertainty about the near-term outlook for Japan’s economy, which is certain to contract in the second quarter. The damage is expected to create supply disruptions in markets around the world. However, reconstruction efforts are likely to lift activity in the third quarter and the impact on global growth is likely to be small. Disruption to the financial markets has already been felt as Japan’s stock market declined sharply in the aftermath of the disaster.
Robust expansion in the Asia-Pacific region outside of Japan
Asia-Pacific economies outside of Japan led the global economy in 2010 and are poised to continue in that role. Labor markets are healthy, income is rising and confidence runs high across the region. Strong agricultural commodity prices are benefiting farmers and rising home prices are expanding household wealth. Exports from markets such as Singapore and South Korea have been solid and domestic demand continues to strengthen. The Asia-Pacific region expanded at an estimated rate of 7% in 2010. Growth is forecasted at 5% for 2011, led by China and India. Higher oil prices pose a downside risk to the current expansion, because it could erode demand for Asian exports and increase the risk of inflation. However, if growth exceeds expectations in the United States or Europe, the picture gets even better for Asia.
Inflation a growing worry
As demand picked up and commodity prices began to rise across the globe, inflation has become a growing worry in both slower-growth developed countries and fast-growing Asia-Pacific markets. In developed market economies, inflation is generally an external force, resulting from higher commodity prices, especially for food and energy. In the Asia-Pacific region, excess demand is driving inflation concerns and policymakers have begun to shift their focus from stimulating growth to taming inflation. However, rising food prices are also a problem in Asia, since food accounts for a greater percentage of household budgets than it does in more developed areas of the world. Food prices have been driven higher by a combination of rising demand and lower supply. Bad weather over the past year cut the supply of grains and other crops in China, India and Southeast Asia. If supply improves, it will take some of the pressure off prices. Government measures to control prices also have the potential to keep rising food prices from weighing too heavily on growth. China has imposed price controls on certain food staples and is considering lowering import taxes, a step that Indonesia and South Korea have already taken.
| 1 | World Bank estimate, January 12, 2011. |
2
Economic Update (continued) – Columbia Pacific/Asia Fund
Stocks stall, then pick up steam
Despite a period of volatility in the summer of 2010, as the world sought to digest a mounting debt crisis within euro zone countries and the impact of the recent devastating events in Japan, it was a decent year for stock markets around the world. The U.S. stock market returned 15.65% for the 12-month period, as measured by the S&P 500 Index.2 The MSCI World Index (Net),3 a broad gauge of global stock market performance, gained 13.45% (in U.S. dollars) for the period. The MSCI All Country Asia Pacific Index (Net)4 (in U.S. dollars) returned 11.14%, led by the smaller markets of Thailand, Korea and Indonesia. The stock markets of China and India underperformed, with gains of 6.95% and 8.04% respectively.5 Japan’s stock market return was negative for the year as investors retreated after the March disasters.
Past performance is no guarantee of future results.
| 2 | The Standard & Poor’s (S&P) 500 Index tracks the performance of 500 widely held, large-capitalization U.S. stocks. |
| 3 | The Morgan Stanley Capital International (MSCI) World Index (Net) tracks the performance of global stocks. |
| 4 | The Morgan Stanley Capital International Europe, Australasia, Far East (MSCI) All Country (AC) Pacific Index (Net) is a free float-adjusted market capitalization weighted index that is designed to measure the equity market performance of the developed and emerging markets in the Pacific region. As of December 31, 2010, the MSCI AC Pacific Index (Net) consisted of the following 12 developed and emerging market countries: Australia, China, Hong Kong, Indonesia, Japan, Korea, Malaysia, New Zealand, Philippines, Singapore, Taiwan and Thailand. |
| 5 | Performance is based on Morgan Stanley Capital International country returns. |
Indices are not available for investment, are not professionally managed and do not reflect sales charges, fees, brokerage commissions, taxes or other expenses of investing. Securities in the fund may not match those in an index.
3
Performance Information – Columbia Pacific/Asia Fund
Performance data quoted represents past performance and current performance may be lower or higher. Past performance is no guarantee of future results. The investment return and principal value will fluctuate so that shares, when redeemed, may be worth more or less than the original cost. Please visit www.columbiamanagement.com for daily and most recent month-end performance updates.
| | | | |
| Net asset value per share | | | |
| |
As of 03/31/11 ($) | | | | |
Class A | | | 8.56 | |
Class C | | | 8.47 | |
Class I | | | 8.61 | |
Class Z | | | 8.61 | |
| | | | |
| Distributions declared per share | |
| |
04/01/10 – 03/31/11 ($) | | | | |
Class A | | | 0.14 | |
Class C | | | 0.09 | |
Class Z | | | 0.16 | |
|
| Performance of a $10,000 investment 04/01/01 – 03/31/11 |
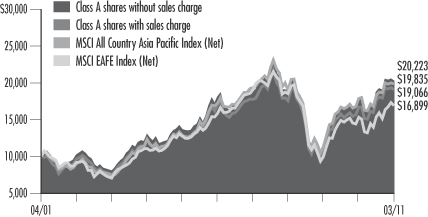
The chart above shows the change in value of a hypothetical $10,000 investment in Class A shares of Columbia Pacific/Asia Fund during the stated time period, and does not reflect the deduction of taxes that a shareholder may pay on fund distributions or on the redemption of fund shares.
| | | | | | | | |
| Performance of a $10,000 investment 04/01/01 – 03/31/11 ($) | |
| | |
| Sales charge | | without | | | with | |
Class A | | | 20,223 | | | | 19,066 | |
Class C | | | 19,807 | | | | 19,807 | |
Class I | | | n/a | | | | n/a | |
Class Z | | | 20,440 | | | | n/a | |
| | | | | | | | | | | | | | | | | | | | | | | | |
| Average annual total return as of 03/31/11 (%) | |
| | | | |
| Share class | | A | | | C | | | I | | | Z | |
| Inception | | 03/31/08 | | | 03/31/08 | | | 09/27/10 | | | 12/31/92 | |
| Sales charge | | without | | | with | | | without | | | with | | | without | | | without | |
1-year | | | 14.26 | | | | 7.64 | | | | 13.46 | | | | 12.46 | | | | n/a | | | | 14.44 | |
5-year | | | 2.33 | | | | 1.12 | | | | 1.90 | | | | 1.90 | | | | n/a | | | | 2.55 | |
10-year/Life | | | 7.30 | | | | 6.67 | | | | 7.07 | | | | 7.07 | | | | 9.13 | | | | 7.41 | |
The “with sales charge” returns include the maximum initial sales charge of 5.75% for Class A shares and the applicable contingent deferred sales charge of 1.00% for Class C shares for the first year only. The “without sales charge” returns do not include the effect of sales charges. If they had, returns would be lower.
The Fund commenced operations on March 31, 2008. The returns of the Class A and Class C shares shown for periods prior to March 31, 2008 are those of the Shares class shares of Pacific/Asia Fund, the predecessor to the Fund and a series of Excelsior Funds, Inc. (the “Predecessor Fund”). The returns shown reflect applicable sales charges, but have not been adjusted to reflect differences in expenses. If differences in expenses were reflected, the returns shown for the periods prior to March 31, 2008 would be lower. The returns of the Class Z shares shown for periods prior to March 31, 2008 are those of the Shares class shares of the Predecessor Fund. The returns shown reflect that Class Z shares are sold without sales charges, but have not been adjusted to reflect differences in expenses. The inception of the predecessor fund is December 31, 1992.
Inception date refers to the date on which the Fund class commenced operations for Classes A and C and the date on which the Predecessor Fund class commenced operations for Class Z.
Performance results reflect any fee waivers or reimbursements of fund expenses by the Investment Manager and/or any of its affiliates. Absent these fee waivers or expense reimbursement arrangements, performance results would have been lower.
All results shown assume reinvestment of distributions. Class I and Class Z shares are sold at net asset value with no distribution and service (Rule 12b-1) fees. Class I and Class Z shares have limited eligibility and the investment minimum requirements may vary. Please see the fund’s prospectus for details. Performance for different share classes will vary based on differences in sales charges and fees associated with each class.
The tables do not reflect the deduction of taxes that a shareholder may pay on fund distributions or on the redemption of fund shares.
4
Understanding Your Expenses – Columbia Pacific/Asia Fund
As a fund shareholder, you incur two types of costs. There are transaction costs and ongoing costs, which generally include investment advisory fees, distribution and service (Rule 12b-1) fees and other fund expenses. The information on this page is intended to help you understand the ongoing costs of investing in the fund and to compare these costs with the ongoing costs of investing in other mutual funds.
Analyzing your fund’s expenses by share class
To illustrate these ongoing costs, we have provided an example and calculated the expenses paid by investors in each share class during the period. The information in the following table is based on an initial investment of $1,000, which is invested at the beginning of the period and held for the entire period. Expense information is calculated two ways and each method provides you with different information. The amount listed in the “Actual” column is calculated using the fund’s actual operating expenses and total return for the period. The amount listed in the “Hypothetical” column for each share class assumes that the return each year is 5% before expenses and is calculated based on the fund’s actual operating expenses. You should not use the hypothetical account values and expenses to estimate either your actual account balance at the end of the period or the expenses you paid during this period.
Compare with other funds
Since all mutual funds are required to include the same hypothetical calculations about expenses in shareholder reports, you can use this information to compare the ongoing costs of investing in the fund with other funds. To do so, compare the 5% hypothetical example with the 5% hypothetical examples that appear in the shareholder reports of other funds. As you compare hypothetical examples of other funds, it is important to note that hypothetical examples are meant to highlight the ongoing costs of investing in a fund and do not reflect any transaction costs, such as sales charges, redemption fees or exchange fees.
Estimating your actual expenses
To estimate the expenses that you paid over the period, first you will need your account balance at the end of the period:
| | n | | For shareholders who receive their account statements from Columbia Management Investment Services Corp., your account balance is available online at www.columbiamanagement.com or by calling Shareholder Services at 800.345.6611. | |
| | n | | For shareholders who receive their account statements from their financial intermediary, contact your financial intermediary to obtain your account balance. | |
| | 1. | Divide your ending account balance by $1,000. For example, if an account balance was $8,600 at the end of the period, the result would be 8.6. | |
| | 2. | In the section of the table below titled “Expenses paid during the period,” locate the amount for your share class. You will find this number in the column labeled “Actual.” Multiply this number by the result from step 1. Your answer is an estimate of the expenses you paid on your account during the period. | |
If the value of your account falls below the minimum initial investment requirement applicable to you, your account may be subject to a $20 annual fee. This fee is not included in the accompanying table. If you are subject to the fee, keep it in mind when you are estimating the ongoing expenses of investing in the fund and when comparing the expenses of this fund with other funds.
| | | | | | | | | | | | | | | | | | | | | | | | | | | | |
10/01/10 – 03/31/11 | | | | | | | | | | | | | | | | |
| | | | |
| | | Account value at the
beginning of the period ($) | | | Account value at the
end of the period ($) | | | Expenses paid
during the period ($) | | | Fund’s annualized
expense ratio (%) | |
| | | Actual | | | Hypothetical | | | Actual | | | Hypothetical | | | Actual | | | Hypothetical | | | Actual | |
Class A | | | 1,000.00 | | | | 1,000.00 | | | | 1,082.10 | | | | 1,016.65 | | | | 8.62 | | | | 8.35 | | | | 1.66 | |
Class C | | | 1,000.00 | | | | 1,000.00 | | | | 1,079.00 | | | | 1,012.91 | | | | 12.49 | | | | 12.09 | | | | 2.41 | |
Class I | | | 1,000.00 | | | | 1,000.00 | | | | 1,083.00 | | | | 1,018.55 | | | | 6.65 | | | | 6.44 | | | | 1.28 | |
Class Z | | | 1,000.00 | | | | 1,000.00 | | | | 1,084.30 | | | | 1,017.90 | | | | 7.33 | | | | 7.09 | | | | 1.41 | |
Expenses paid during the period are equal to the annualized expense ratio for the share class, multiplied by the average account value over the period, then multiplied by the number of days in the fund’s most recent fiscal half-year and divided by 365.
Had the Investment Manager and/or any of its affiliates not waived fees or reimbursed a portion of expenses, account value at the end of the period would have been reduced.
It is important to note that the expense amounts shown in the table are meant to highlight only ongoing costs of investing in the fund and do not reflect any transaction costs, such as sales charges, redemption fees or exchange fees. Therefore, the hypothetical examples provided may not help you determine the relative total costs of owning shares of different funds. If these transaction costs were included, your costs would have been higher.
5
Portfolio Managers’ Report – Columbia Pacific/Asia Fund
Performance data quoted represents past performance and current performance may be lower or higher. Past performance is no guarantee of future results. The investment return and principal value will fluctuate so that shares, when redeemed, may be worth more or less than the original cost. Please visit www.columbiamanagement.com for daily and most recent month-end performance updates.
| | | | |
| Top 10 holdings | | | |
| |
as of 03/31/11 (%) | | | | |
Samsung Electronics | | | 3.1 | |
BHP Billiton | | | 2.9 | |
iShares MSCI Japan Index Fund | | | 1.9 | |
Sumitomo Mitsui Financial Group | | | 1.7 | |
Westpac Banking | | | 1.6 | |
Commonwealth Bank of Australia | | | 1.6 | |
NTT DoCoMo | | | 1.6 | |
Bank of Baroda | | | 1.5 | |
ITOCHU | | | 1.5 | |
Industrial & Commercial Bank of China | | | 1.5 | |
| | | | |
| Top 5 countries | | | |
| |
as of 03/31/11 (%) | | | | |
Japan | | | 35.9 | |
China | | | 14.5 | |
Australia | | | 11.0 | |
Republic of Korea | | | 8.6 | |
Taiwan | | | 7.6 | |
The fund is actively managed and the composition of its portfolio will change over time. Information provided is calculated as a percentage of net assets.
For the 12-month period that ended March 31, 2011, the fund’s Class A shares returned 14.26% without sales charge. The fund outpaced both the MSCI All Country Asia Pacific Index (Net), which returned 11.14%, and the MSCI EAFE Index (Net), which returned 10.42%, for the same period. The fund also outperformed the average return of funds in its peer group, the Lipper Pacific Region Funds Classification, which was 10.60%.
Stock selection lifted returns
We concentrated on individual stock selection, believing opportunities for outperformance would come from finding fundamentally sound companies selling at discounts to their intrinsic values. In India we found several significantly undervalued banks. One especially, Bank of Baroda (1.5% of net assets), became one of the top performers as the Indian economy strengthened and investors recognized the bank’s earnings potential.
Investments in Japan, China supported results
Selections in Japan and China were particularly successful. One of the best decisions in Japan was avoiding the owner of the nuclear plant complex that was severely damaged by an earthquake and resulting tsunami in March 2011. The company is a major component in the MSCI All Country Asia Pacific Index (Net). Performance in Japan also received a boost from the position in Softbank, a wireless communication services provider (1.4% of net assets). We invested because of its solid management team and strong cash flow. In China, two standouts were Internet search firm Baidu and coal mining operator Yanzhou Coal (1.0% and 1.0% of net assets, respectively). Baidu benefited from robust increases in web-based advertising at the same time that competitor Google withdrew from the Mainland China search business. Yanzhou, meanwhile, enjoyed rising profits as demand for coal increased. In Korea, Capro (1.1% of net assets), a major producer of a key ingredient in nylon, gained 170% as demand increased.
Disappointments
A few decisions produced disappointing results. We did not invest in a major wireless phone manufacturer in Taiwan because of concerns about the intensifying global competition in the smartphone industry. However, the shares of this company appreciated as its smartphone sales increased significantly, to the disadvantage of the fund’s relative performance. One holding that was a major detractor was AWE, an Australian oil exploration-and-production company that fell behind competitors. We sold the position.
Reasonable stock prices, persistent growth
We remain cautiously optimistic about opportunities in Asia, which should have a favorable investment environment because of continued economic expansion and attractive stock valuations. Nevertheless, several challenges must be overcome. First, inflationary pressures in Asia have risen. Second, the recent disasters in Japan have disrupted the production supply chain in the global automotive and electronics industries. Third, energy costs have climbed because of political turmoil in north Africa and the Middle East.
Three areas within the region deserve mention. We like opportunities in South East Asia, particularly Thailand and Indonesia, where demographic trends are favorable and corporate and
6
Portfolio Managers’ Report (continued) – Columbia Pacific/Asia Fund
household finances are healthy. We also are looking more favorably at China, where stock performance was modest in the past year. We think that monetary tightening policies in China are in their final stages, which should lighten investor uncertainty. Meanwhile, Chinese stock valuations appear reasonable relative to growth prospects. In Japan, the situation is complicated by the recent disasters. We think the Japanese economy will contract in the near term as power supply shortages will affect its corporate activities as well as domestic consumption. However, we anticipate a more robust expansion beginning late in 2011 as a result of government stimulus programs, supply chain normalization and healthy growth in Asian markets that trade with Japan. We think investors eventually will recognize the bargains in Japanese stocks.
Portfolio characteristics and holdings are subject to change periodically and may not be representative of current characteristics and holdings. The outlook for the fund may differ from that presented for other Columbia Funds.
Equity securities are affected by stock market fluctuations that occur in response to economic and business developments.
International investing involves special risks, including foreign taxation, currency risks, risks associated with possible differences in financial standards and other risks associated with future political and economic developments.
Investing in emerging markets may involve greater risks than investing in more developed countries. In addition, concentration of investments in a single region may result in greater volatility.
7
Investment Portfolio – Columbia Pacific/Asia Fund
March 31, 2011
Common Stocks – 95.2%
| | | | | | | | |
| | | Shares | | | Value ($) | |
| Consumer Discretionary – 11.0% | | | | | | | | |
| Auto Components – 1.8% | | | | | | | | |
Exedy Corp. | | | 27,700 | | | | 832,780 | |
Hyundai Mobis | | | 3,466 | | | | 1,033,386 | |
| | | | | | | | |
Auto Components Total | | | | | | | 1,866,166 | |
| | |
| Automobiles – 3.0% | | | | | | | | |
Fuji Heavy Industries Ltd. | | | 37,000 | | | | 239,068 | |
Honda Motor Co., Ltd. | | | 37,300 | | �� | | 1,385,830 | |
Nissan Motor Co., Ltd. | | | 35,000 | | | | 310,906 | |
Toyota Motor Corp. | | | 27,100 | | | | 1,075,443 | |
| | | | | | | | |
Automobiles Total | | | | | | | 3,011,247 | |
| | |
| Distributors – 0.6% | | | | | | | | |
Li & Fung Ltd. | | | 128,000 | | | | 653,769 | |
| | | | | | | | |
Distributors Total | | | | | | | 653,769 | |
| | |
| Household Durables – 1.0% | | | | | | | | |
Arnest One Corp. | | | 66,000 | | | | 659,075 | |
Foster Electric Co., Ltd. | | | 16,900 | | | | 385,914 | |
| | | | | | | | |
Household Durables Total | | | | | | | 1,044,989 | |
| | |
| Internet & Catalog Retail – 1.0% | | | | | | | | |
GS Home Shopping, Inc. | | | 8,211 | | | | 1,022,241 | |
| | | | | | | | |
Internet & Catalog Retail Total | | | | | | | 1,022,241 | |
| | |
| Media – 1.2% | | | | | | | | |
Daiichikosho Co., Ltd. | | | 68,800 | | | | 1,169,664 | |
| | | | | | | | |
Media Total | | | | | | | 1,169,664 | |
| | |
| Specialty Retail – 1.4% | | | | | | | | |
Autobacs Seven Co., Ltd. | | | 15,800 | | | | 601,757 | |
Belle International Holdings Ltd. | | | 414,000 | | | | 764,664 | |
| | | | | | | | |
Specialty Retail Total | | | | | | | 1,366,421 | |
|
| Textiles, Apparel & Luxury Goods – 1.0% | |
Trinity Ltd. | | | 415,603 | | | | 385,503 | |
Weiqiao Textile Co., Ltd., Class H | | | 619,072 | | | | 614,849 | |
| | | | | | | | |
Textiles, Apparel & Luxury Goods Total | | | | | | | 1,000,352 | |
| | | | | | | | |
Consumer Discretionary Total | | | | 11,134,849 | |
| | | | | | | | |
| Consumer Staples – 1.7% | | | | | | | | |
| Food & Staples Retailing – 0.6% | | | | | | | | |
Lianhua Supermarket Holdings Co., Ltd., Class H | | | 153,017 | | | | 614,073 | |
| | | | | | | | |
Food & Staples Retailing Total | | | | | | | 614,073 | |
| | |
| Food Products – 0.5% | | | | | | | | |
Charoen Pokphand Foods PCL, Foreign Registered Shares | | | 593,000 | | | | 504,869 | |
| | | | | | | | |
Food Products Total | | | | | | | 504,869 | |
| | | | | | | | |
| | | Shares | | | Value ($) | |
| Personal Products – 0.3% | | | | | | | | |
Dr. Ci:Labo Co., Ltd. | | | 94 | | | | 348,470 | |
| | | | | | | | |
Personal Products Total | | | | | | | 348,470 | |
| | |
| Tobacco – 0.3% | | | | | | | | |
Japan Tobacco, Inc. | | | 74 | | | | 267,538 | |
| | | | | | | | |
Tobacco Total | | | | | | | 267,538 | |
| | | | | | | | |
Consumer Staples Total | | | | | | | 1,734,950 | |
| | | | | | | | |
| Energy – 6.2% | | | | | | | | |
| Energy Equipment & Services – 1.2% | | | | | |
Shinko Plantech Co., Ltd. | | | 108,000 | | | | 1,247,612 | |
| | | | | | | | |
Energy Equipment & Services Total | | | | | | | 1,247,612 | |
| |
| Oil, Gas & Consumable Fuels – 5.0% | | | | | |
China Shenhua Energy Co., Ltd., Class H | | | 60,000 | | | | 282,791 | |
CNOOC Ltd. | | | 517,000 | | | | 1,309,137 | |
JX Holdings, Inc. | | | 96,900 | | | | 651,030 | |
Oil & Natural Gas Corp., Ltd. | | | 136,219 | | | | 885,937 | |
PTT Public Co., Ltd. | | | 73,930 | | | | 865,307 | |
Yanzhou Coal Mining Co., Ltd., Class H | | | 288,000 | | | | 1,038,681 | |
| | | | | | | | |
Oil, Gas & Consumable Fuels Total | | | | | | | 5,032,883 | |
| | | | | | | | |
Energy Total | | | | | | | 6,280,495 | |
| | | | | | | | |
| Financials – 25.3% | | | | | | | | |
| Commercial Banks – 15.9% | | | | | | | | |
Australia & New Zealand Banking Group Ltd. | | | 43,650 | | | | 1,074,452 | |
Bangkok Bank PCL, Foreign Registered Shares | | | 251,000 | | | | 1,425,929 | |
Bank of Baroda | | | 69,228 | | | | 1,496,867 | |
Bank of China Ltd., Class H | | | 2,395,000 | | | | 1,331,828 | |
Commonwealth Bank of Australia | | | 30,100 | | | | 1,630,883 | |
Industrial & Commercial Bank of China, Class H | | | 1,779,100 | | | | 1,474,996 | |
Mitsubishi UFJ Financial Group, Inc. | | | 179,700 | | | | 827,996 | |
Oversea-Chinese Banking Corp., Ltd. | | | 129,000 | | | | 980,388 | |
PT Bank Rakyat Indonesia Persero Tbk | | | 1,139,000 | | | | 751,137 | |
Siam Commercial Bank PCL, Foreign Registered Shares | | | 225,000 | | | | 803,439 | |
Sumitomo Mitsui Financial Group, Inc. | | | 56,800 | | | | 1,762,236 | |
Union Bank of India | | | 118,370 | | | | 927,508 | |
Westpac Banking Corp. | | | 64,920 | | | | 1,633,473 | |
| | | | | | | | |
Commercial Banks Total | | | | | | | 16,121,132 | |
See Accompanying Notes to Financial Statements.
8
Columbia Pacific/Asia Fund
March 31, 2011
Common Stocks (continued)
| | | | | | | | |
| | | Shares | | | Value ($) | |
| Financials (continued) | | | | | | | | |
| Diversified Financial Services – 2.3% | | | | | |
Challenger Ltd. | | | 175,381 | | | | 894,209 | |
Fuyo General Lease Co., Ltd. | | | 18,200 | | | | 542,219 | |
ORIX Corp. | | | 9,190 | | | | 861,409 | |
| | | | | | | | |
Diversified Financial Services Total | | | | | | | 2,297,837 | |
| | |
| Insurance – 2.3% | | | | | | | | |
Dongbu Insurance Co., Ltd. | | | 25,190 | | | | 1,148,885 | |
QBE Insurance Group Ltd. | | | 36,680 | | | | 670,916 | |
Tokio Marine Holdings, Inc. | | | 17,400 | | | | 464,570 | |
| | | | | | | | |
Insurance Total | | | | | | | 2,284,371 | |
|
| Real Estate Investment Trusts (REITs) – 1.1% | |
Advance Residence Investment Corp. | | | 262 | | | | 515,906 | |
Japan Retail Fund Investment Corp. | | | 396 | | | | 620,942 | |
| | | | | | | | |
Real Estate Investment Trusts (REITs) Total | | | | 1,136,848 | |
|
| Real Estate Management & Development – 3.7% | |
China Vanke Co., Ltd., Class B | | | 375,900 | | | | 492,917 | |
Ho Bee Investment Ltd. | | | 403,000 | | | | 453,501 | |
Hongkong Land Holdings Ltd. | | | 128,000 | | | | 896,523 | |
Huaku Development Co., Ltd. | | | 246,644 | | | | 690,603 | |
Swire Pacific Ltd., Class A | | | 80,200 | | | | 1,176,689 | |
| | | | | | | | |
Real Estate Management & Development Total | | | | 3,710,233 | |
| | | | | | | | |
Financials Total | | | | | | | 25,550,421 | |
| | | | | | | | |
| Health Care – 3.3% | |
| Health Care Equipment & Supplies – 1.7% | |
Hartalega Holdings Bhd | | | 156,600 | | | | 281,768 | |
St. Shine Optical Co., Ltd. | | | 73,000 | | | | 897,702 | |
Sysmex Corp. | | | 15,600 | | | | 551,711 | |
| | | | | | | | |
Health Care Equipment & Supplies Total | | | | 1,731,181 | |
|
| Health Care Providers & Services – 1.0% | |
Miraca Holdings, Inc. | | | 27,300 | | | | 1,044,879 | |
| | | | | | | | |
Health Care Providers & Services Total | | | | 1,044,879 | |
| | |
| Pharmaceuticals – 0.6% | | | | | | | | |
PT Kalbe Farma Tbk | | | 1,557,000 | | | | 607,270 | |
| | | | | | | | |
Pharmaceuticals Total | | | | | | | 607,270 | |
| | | | | | | | |
Health Care Total | | | | | | | 3,383,330 | |
| | | | | | | | |
| Industrials – 12.2% | | | | | | | | |
| Building Products – 0.8% | |
Asahi Glass Co., Ltd. | | | 62,000 | | | | 780,043 | |
| | | | | | | | |
Building Products Total | | | | 780,043 | |
| | | | | | | | |
| | | Shares | | | Value ($) | |
| Commercial Services & Supplies – 0.7% | |
Aeon Delight Co., Ltd. | | | 40,800 | | | | 682,406 | |
| | | | | | | | |
Commercial Services & Supplies Total | | | | 682,406 | |
|
| Construction & Engineering – 2.0% | |
China Communications Construction Co., Ltd., Class H | | | 474,000 | | | | 451,767 | |
CTCI Corp. | | | 525,000 | | | | 598,202 | |
Macmahon Holdings Ltd. | | | 795,790 | | | | 464,988 | |
Monadelphous Group Ltd. | | | 21,461 | | | | 474,807 | |
| | | | | | | | |
Construction & Engineering Total | | | | 1,989,764 | |
|
| Industrial Conglomerates – 1.8% | |
Fraser & Neave Ltd. | | | 192,000 | | | | 915,519 | |
Jardine Matheson Holdings Ltd. | | | 19,879 | | | | 885,262 | |
| | | | | | | | |
Industrial Conglomerates Total | | | | 1,800,781 | |
|
| Machinery – 3.4% | |
FANCU Corp. | | | 7,700 | | | | 1,163,908 | |
Fuji Machine Manufacturing Co. Ltd. | | | 32,000 | | | | 720,144 | |
Komatsu Ltd. | | | 29,200 | | | | 990,629 | |
Sintokogio Ltd. | | | 57,300 | | | | 602,348 | |
| | | | | | | | |
Machinery Total | | | | 3,477,029 | |
|
| Road & Rail – 0.3% | |
Transport International Holdings Ltd. | | | 96,521 | | | | 297,998 | |
| | | | | | | | |
Road & Rail Total | | | | 297,998 | |
|
| Trading Companies & Distributors – 3.0% | |
ITOCHU Corp. | | | 141,200 | | | | 1,477,638 | |
Mitsubishi Corp. | | | 45,300 | | | | 1,256,097 | |
Mitsui & Co., Ltd. | | | 17,100 | | | | 306,156 | |
| | | | | | | | |
Trading Companies & Distributors Total | | | | 3,039,891 | |
| |
| Transportation Infrastructure – 0.2% | | | | | |
Sichuan Expressway Co., Ltd., Class H | | | 390,000 | | | | 254,161 | |
| | | | | | | | |
Transportation Infrastructure Total | | | | | | | 254,161 | |
| | | | | | | | |
Industrials Total | | | | | | | 12,322,073 | |
| | | | | | | | |
| Information Technology – 15.5% | | | | | | | | |
| Communications Equipment – 0.6% | | | | | |
O-Net Communications Group Ltd. (a) | | | 947,000 | | | | 626,177 | |
| | | | | | | | |
Communications Equipment Total | | | | | | | 626,177 | |
| | |
| Computers & Peripherals – 0.6% | | | | | | | | |
Wistron Corp. | | | 390,422 | | | | 617,840 | |
| | | | | | | | |
Computers & Peripherals Total | | | | | | | 617,840 | |
|
| Electronic Equipment, Instruments & Components – 3.4% | |
FUJIFILM Holdings Corp. | | | 26,900 | | | | 833,772 | |
Hitachi Ltd. | | | 233,000 | | | | 1,212,900 | |
See Accompanying Notes to Financial Statements.
9
Columbia Pacific/Asia Fund
March 31, 2011
Common Stocks (continued)
| | | | | | | | |
| | | Shares | | | Value ($) | |
| Information Technology (continued) | |
Hon Hai Precision Industry Co., Ltd. | | | 127,154 | | | | 444,910 | |
Venture Corp., Ltd. | | | 118,000 | | | | 899,574 | |
| | | | | | | | |
Electronic Equipment, Instruments & Components Total | | | | 3,391,156 | |
| |
| Internet Software & Services – 2.1% | | | | | |
Baidu, Inc., ADR (a) | | | 7,190 | | | | 990,854 | |
Tencent Holdings Ltd. | | | 46,000 | | | | 1,120,829 | |
| | | | | | | | |
Internet Software & Services Total | | | | | | | 2,111,683 | |
| | |
| Office Electronics – 1.4% | | | | | | | | |
Canon, Inc. | | | 32,200 | | | | 1,384,914 | |
| | | | | | | | |
Office Electronics Total | | | | | | | 1,384,914 | |
|
| Semiconductors & Semiconductor Equipment – 5.8% | |
Duksan Hi-Metal Co., Ltd. (a) | | | 13,533 | | | | 311,430 | |
Macronix International | | | 1,554,000 | | | | 1,030,366 | |
Samsung Electronics Co., Ltd. | | | 3,713 | | | | 3,148,494 | |
Taiwan Semiconductor Manufacturing Co., Ltd., ADR | | | 111,645 | | | | 1,359,836 | |
| | | | | | | | |
Semiconductors & Semiconductor Equipment Total | | | | | | | 5,850,126 | |
| | |
| Software – 1.6% | | | | | | | | |
Kingdee International Software Group Co., Ltd. | | | 880,000 | | | | 552,435 | |
Nintendo Co., Ltd. | | | 2,700 | | | | 734,156 | |
VanceInfo Technologies, Inc., ADR (a) | | | 12,140 | | | | 381,318 | |
| | | | | | | | |
Software Total | | | | | | | 1,667,909 | |
| | | | | | | | |
Information Technology Total | | | | | | | 15,649,805 | |
| | | | | | | | |
| Materials – 11.3% | | | | | | | | |
| Chemicals – 3.5% | | | | | | | | |
Capro Corp. | | | 42,630 | | | | 1,077,368 | |
Huabao International Holdings Ltd. | | | 304,000 | | | | 468,975 | |
Kansai Paint Co., Ltd. | | | 120,000 | | | | 1,040,023 | |
Nitto Denko Corp. | | | 18,500 | | | | 980,276 | |
| | | | | | | | |
Chemicals Total | | | | | | | 3,566,642 | |
| | |
| Construction Materials – 0.6% | | | | | | | | |
PT Indocement Tunggal Prakarsa Tbk | | | 340,000 | | | | 638,184 | |
| | | | | | | | |
Construction Materials Total | | | | | | | 638,184 | |
| | |
| Containers & Packaging – 0.9% | | | | | | | | |
Cheng Loong Corp. | | | 1,840,000 | | | | 869,615 | |
| | | | | | | | |
Containers & Packaging Total | | | | | | | 869,615 | |
| | | | | | | | |
| | | Shares | | | Value ($) | |
| Metals & Mining – 6.3% | | | | | | | | |
BHP Billiton Ltd. | | | 60,717 | | | | 2,914,262 | |
Eurasian Natural Resources Corp. PLC | | | 36,108 | | | | 542,462 | |
Freeport-McMoRan Copper & Gold, Inc. | | | 13,215 | | | | 734,093 | |
Kobe Steel Ltd. | | | 317,000 | | | | 820,737 | |
Newcrest Mining Ltd. | | | 22,611 | | | | 931,446 | |
Rio Tinto Ltd. | | | 4,876 | | | | 427,375 | |
| | | | | | | | |
Metals & Mining Total | | | | | | | 6,370,375 | |
| | | | | | | | |
Materials Total | | | | | | | 11,444,816 | |
| | | | | | | | |
| Telecommunication Services – 5.3% | |
| Diversified Telecommunication Services – 1.1% | |
Chunghwa Telecom Co., Ltd., ADR | | | 37,575 | | | | 1,170,837 | |
| | | | | | | | |
Diversified Telecommunication Services Total | | | | | | | 1,170,837 | |
|
| Wireless Telecommunication Services – 4.2% | |
China Mobile Ltd., ADR | | | 9,565 | | | | 442,286 | |
NTT DoCoMo, Inc. | | | 918 | | | | 1,602,593 | |
Softbank Corp. | | | 35,800 | | | | 1,426,426 | |
Total Access Communication PCL | | | 463,125 | | | | 735,301 | |
| | | | | | | | |
Wireless Telecommunication Services Total | | | | 4,206,606 | |
| | | | | | | | |
Telecommunication Services Total | | | | 5,377,443 | |
| | | | | | | | |
| Utilities – 3.4% | | | | | | | | |
| Gas Utilities – 1.6% | | | | | | | | |
ENN Energy Holdings Ltd. | | | 224,000 | | | | 694,486 | |
PT Perusahaan Gas Negara Tbk | | | 2,061,500 | | | | 922,240 | |
| | | | | | | | |
Gas Utilities Total | | | | | | | 1,616,726 | |
|
| Independent Power Producers & Energy Traders – 1.1% | |
Aboitiz Power Corp. | | | 830,700 | | | | 574,418 | |
Energy Development Corp. | | | 3,547,000 | | | | 490,985 | |
| | | | | | | | |
Independent Power Producers & Energy Traders Total | | | | | | | 1,065,403 | |
| | |
| Water Utilities – 0.7% | | | | | | | | |
Guangdong Investment Ltd. | | | 1,454,000 | | | | 735,016 | |
| | | | | | | | |
Water Utilities Total | | | | | | | 735,016 | |
| | | | | | | | |
Utilities Total | | | | | | | 3,417,145 | |
| | | | | | | | |
Total Common Stocks
(cost of $87,047,032) | | | | | | | 96,295,327 | |
See Accompanying Notes to Financial Statements.
10
Columbia Pacific/Asia Fund
March 31, 2011
Preferred Stock – 1.0%
| | | | | | | | |
| | | Shares | | | Value ($) | |
| Consumer Discretionary – 1.0% | |
| Automobiles – 1.0% | | | | | | | | |
Hyundai Motor Co. | | | 14,654 | | | | 950,219 | |
| | | | | | | | |
Automobiles Total | | | | | | | 950,219 | |
| | | | | | | | |
Consumer Discretionary Total | | | | | | | 950,219 | |
| | | | | | | | |
Total Preferred Stock (cost of $901,178) | | | | | | | 950,219 | |
| |
Investment Companies – 2.9% | | | | | |
iShares MSCI Emerging Markets Index Fund | | | 10,686 | | | | 520,301 | |
iShares MSCI Japan Index Fund | | | 185,627 | | | | 1,913,815 | |
iShares MSCI Pacific ex-Japan Index Fund | | | 10,832 | | | | 523,402 | |
| | | | | | | | |
Total Investment Companies (Cost of $2,963,769) | | | | | | | 2,957,518 | |
| | |
Short-Term Obligation – 1.3% | | | | | | | | |
Repurchase agreement with Fixed Income Clearing Corp., dated 03/31/11, due 04/01/11 at 0.070%, collateralized by a U.S. Government Agency obligation maturing 06/23/15, market value $1,298,563 (repurchase proceeds $1,273,002) | | | 1,273,000 | | | | 1,273,000 | |
| | | | | | | | |
Total Short-Term Obligation (cost of $1,273,000) | | | | | | | 1,273,000 | |
| | | | | | | | |
Total Investments – 100.4% (cost of $92,184,979) (b) | | | | | | | 101,476,064 | |
| | | | | | | | |
Other Assets & Liabilities, Net – (0.4)% | | | | (382,565 | ) |
| | | | | | | | |
Net Assets – 100.0% | | | | | | | 101,093,499 | |
Notes to Investment Portfolio:
| (a) | Non-income producing security. |
| (b) | Cost for federal income tax purposes is $93,291,911. |
Generally accepted accounting principles (GAAP) require disclosure regarding the inputs and valuation techniques used to measure fair value and any changes in valuation inputs or techniques. In addition, investments shall be disclosed by major category.
The Fund categorizes its fair value measurements according to a three-level hierarchy that maximizes the use of observable inputs and minimizes the use of unobservable inputs by prioritizing that the most observable input be used when available. Observable inputs are those that market participants would use in pricing an investment based on market data obtained from sources independent of the reporting entity. Unobservable inputs are those that reflect the Fund’s assumptions about the information market participants would use in pricing an investment. An investment’s level within the fair value hierarchy is based on the lowest level of any input that is deemed significant to the asset or liability’s fair value measurement. The input levels are not necessarily an indication of the risk or liquidity associated with investments at that level. For example, certain U.S. government securities are generally high quality and liquid, however, they are reflected as Level 2 because the inputs used to determine fair value may not always be quoted prices in an active market.
Fair value inputs are summarized in the three broad levels listed below:
| • | | Level 1 — Valuations based on quoted prices for investments in active markets that the Fund has the ability to access at the measurement date (including NAV for open-end mutual funds). Valuation adjustments are not applied to Level 1 investments. |
| • | | Level 2 — Valuations based on other significant observable inputs (including quoted prices for similar securities, interest rates, prepayment speeds, credit risks, etc.). |
| • | | Level 3 — Valuations based on significant unobservable inputs (including the Fund’s own assumptions and judgment in determining the fair value of investments). |
Inputs that are used in determining fair value of an investment may include price information, credit data, volatility statistics, and other factors. These inputs can be either observable or unobservable. The availability of observable inputs can vary between investments, and is affected by various factors such as the type of investment, and the volume and level of activity for that investment or similar investments in the marketplace. The inputs will be considered by the Investment Manager, along with any other relevant factors in the calculation of an investment’s fair value. The Fund uses prices and inputs that are current as of the measurement date, which may include periods of market dislocations. During these periods, the availability of prices and inputs may be reduced for many investments. This condition could cause an investment to be reclassified between the various levels within the hierarchy. Non-U.S. equity securities actively traded in foreign markets may be reflected in Level 2 despite the availability of closing prices, because the Fund evaluates and determines whether those closing prices reflect fair value at the close of the New York Stock Exchange (NYSE) or require adjustment, as described in Note 2 to the financial statements — Security Valuation.
Investments falling into the Level 3 category are primarily supported by quoted prices from brokers and dealers participating in the market for those investments. However, these may be classified as Level 3 investments due to lack of market transparency and corroboration to support these quoted prices. Additionally, valuation models may be used as the pricing source for any remaining investments classified as Level 3. These models rely on one or more significant unobservable inputs and/or significant assumptions by the Investment Manager. Inputs used in valuations may include, but are not limited to, financial statement analysis, capital account balances, discount rates and estimated cash flows, and comparable company data.
The following table is a summary of the inputs used to value the Fund’s investments as of March 31, 2011:
| | | | | | | | | | | | | | | | |
Description | | Quoted
Prices
(Level 1) | | | Other
Significant
Observable
Inputs
(Level 2) | | | Significant
Unobservable
Inputs
(Level 3) | | | Total | |
Common Stocks | | | | | | | | | | | | | | | | |
Consumer Discretionary | | $ | — | | | $ | 11,134,849 | | | $ | — | | | $ | 11,134,849 | |
Consumer Staples | | | — | | | | 1,734,950 | | | | — | | | | 1,734,950 | |
Energy | | | — | | | | 6,280,495 | | | | — | | | | 6,280,495 | |
Financials | | | — | | | | 25,550,421 | | | | — | | | | 25,550,421 | |
Health Care | | | — | | | | 3,383,330 | | | | — | | | | 3,383,330 | |
Industrials | | | — | | | | 12,322,073 | | | | — | | | | 12,322,073 | |
Information Technology | | | 2,732,008 | | | | 12,917,797 | | | | — | | | | 15,649,805 | |
Materials | | | 734,093 | | | | 10,710,723 | | | | — | | | | 11,444,816 | |
Telecommunication Services | | | 1,613,123 | | | | 3,764,320 | | | | — | | | | 5,377,443 | |
Utilities | | | — | | | | 3,417,145 | | | | — | | | | 3,417,145 | |
| | | | | | | | | | | | | | | | |
Total Common Stocks | | | 5,079,224 | | | | 91,216,103 | | | | — | | | | 96,295,327 | |
| | | | | | | | | | | | | | | | |
Total Preferred Stock | | | — | | | | 950,219 | | | | — | | | | 950,219 | |
| | | | | | | | | | | | | | | | |
Total Investment Companies | | | 2,957,518 | | | | — | | | | — | | | | 2,957,518 | |
| | | | | | | | | | | | | | | | |
Total Short-Term Obligation | | | — | | | | 1,273,000 | | | | — | | | | 1,273,000 | |
| | | | | | | | | | | | | | | | |
Total Investments | | $ | 8,036,742 | | | $ | 93,439,322 | | | $ | — | | | $ | 101,476,064 | |
| | | | | | | | | | | | | | | | |
See Accompanying Notes to Financial Statements.
11
Columbia Pacific/Asia Fund
March 31, 2011
| | | | | | | | | | | | | | | | |
Description | | Quoted
Prices
(Level 1) | | | Other
Significant
Observable
Inputs
(Level 2) | | | Significant
Unobservable
Inputs
(Level 3) | | | Total | |
Unrealized Appreciation on Forward Foreign Currency Exchange Contracts | | $ | — | | | $ | 274,652 | | | $ | — | | | $ | 274,652 | |
Unrealized Depreciation on Forward Foreign Currency Exchange Contracts | | | — | | | | (236,383 | ) | | | — | | | | (236,383 | ) |
| | | | | | | | | | | | | | | | |
Total | | $ | 8,036,742 | | | $ | 93,477,591 | | | $ | — | | | $ | 101,514,333 | |
| | | | | | | | | | | | | | | | |
The Fund’s assets assigned to the Level 2 input category are generally valued using the market approach, in which a security’s value is determined through its correlation to prices and information from market transactions for similar or identical assets. These assets include certain foreign securities for which a third party statistical pricing service may be employed for purposes of fair valuation. The models utilized by the third party statistical pricing service take into account a security’s correlation to available market data including, but not limited to, intraday index, ADR, and ETF movements.
Certain short-term obligations may be valued using amortized cost, an income approach which converts future cash flows to a present value based upon the discount or premium at purchase.
The following table shows transfers between Level 1 and Level 2 of the fair value hierarchy:
| | | | | | |
Transfers In | | Transfers Out |
Level 1 | | Level 2 | | Level 1 | | Level 2 |
$— | | $304,200 | | $304,200 | | $— |
Financial assets were transferred from Level 1 to Level 2 as it was determined that the application of factors received from third party statistical services resulted in a price which was more representative of fair value for these securities as of period end.
The following table reconciles asset balances for the year ending March 31, 2011, in which significant unobservable inputs (Level 3) were used in determining value:
| | | | | | | | | | | | | | | | | | | | | | | | | | | | | | | | |
Investments in Securities | | Balance
as of
March 31,
2010 | | | Realized
Gain/
(Loss) | | | Change in
Unrealized
Appreciation
(Depreciation) | | | Purchases | | | Sales | | | Transfers
into
Level 3 | | | Transfers
out of
Level 3 | | | Balance as of
March 31,
2011 | |
Common Stocks | | | | | | | | | | | | | | | | | | | | | | | | | | | | | | | | |
Consumer Staples | | $ | 76,557 | | | $ | (126,219 | ) | | $ | 68,351 | | | $ | — | | | $ | (18,689 | ) | | $ | — | | | $ | — | | | $ | — | |
Financials | | | 79,153 | | | | 1,331 | | | | (1,719 | ) | | | 22,796 | | | | (101,561 | ) | | | — | | | | — | | | | — | |
| | | | | | | | | | | | | | | | | | | | | | | | | | | | | | | | |
| | $ | 155,710 | | | $ | (124,888 | ) | | $ | 66,632 | | | $ | 22,796 | | | $ | (120,250 | ) | | $ | — | | | $ | — | | | $ | — | |
| | | | | | | | | | | | | | | | | | | | | | | | | | | | | | | | |
The information in the above reconciliation represents fiscal year to date activity for any securities identified as using Level 3 inputs at either the beginning or the end of the current fiscal period.
For the year ended March 31, 2011, transactions in written option contracts were as follows:
| | | | | | | | |
| | | Number of
Contracts | | | Premium
Received | |
Options outstanding at March 31, 2010 | | | 13 | | | $ | 195 | |
Options written | | | 26 | | | | 1,417 | |
Options terminated in closing purchase transactions | | | (26 | ) | | | (1,430 | ) |
Options exercised | | | — | | | | — | |
Options expired | | | (13 | ) | | | (182 | ) |
| | | | | | | | |
Options outstanding at March 31, 2011 | | | — | | | $ | — | |
| | | | | | | | |
Forward foreign currency exchange contracts outstanding on March 31, 2011 are:
Foreign Exchange Rate Risk
| | | | | | | | | | | | | | | | | | | | |
Counterparty | | Forward
Foreign
Currency
Exchange
Contracts
to Buy | | | Value | | | Aggregate
Face
Value | | | Settlement
Date | | | Unrealized
Appreciation
(Depreciation) | |
Morgan Stanley Capital Services, Inc. | | | AUD | | | $ | 5,215,241 | | | $ | 5,069,483 | | | | 04/28/11 | | | $ | 145,758 | |
Morgan Stanley Capital Services, Inc. | | | INR | | | | 1,686,457 | | | | 1,640,073 | | | | 04/28/11 | | | | 46,384 | |
Morgan Stanley Capital Services, Inc. | | | JPY | | | | 3,339,626 | | | | 3,479,340 | | | | 04/28/11 | | | | (139,714 | ) |
Morgan Stanley Capital Services, Inc. | | | KRW | | | | 1,017,740 | | | | 1,005,529 | | | | 04/28/11 | | | | 12,211 | |
Morgan Stanley Capital Services, Inc. | | | MYR | | | | 1,402,647 | | | | 1,398,291 | | | | 04/28/11 | | | | 4,356 | |
Morgan Stanley Capital Services, Inc. | | | NZD | | | | 205,692 | | | | 199,403 | | | | 04/28/11 | | | | 6,289 | |
Morgan Stanley Capital Services, Inc. | | | SGD | | | | 470,463 | | | | 464,231 | | | | 04/28/11 | | | | 6,232 | |
Morgan Stanley Capital Services, Inc. | | | TWD | | | | 859,788 | | | | 861,602 | | | | 04/28/11 | | | | (1,814 | ) |
| | | | | | | | | | | | | | | | | | | | |
| | | | | | | | | | | | | | | | | | $ | 79,702 | |
| | | | | | | | | | | | | | | | | | | | |
See Accompanying Notes to Financial Statements.
12
Columbia Pacific/Asia Fund
March 31, 2011
| | | | | | | | | | | | | | | | | | | | |
Counterparty | | Forward
Foreign
Currency
Exchange
Contracts
to Sell | | | Value | | | Aggregate
Face
Value | | | Settlement
Date | | | Unrealized
Appreciation
(Depreciation) | |
Morgan Stanley Capital Services, Inc. | | | AUD | | | $ | 468,206 | | | $ | 444,402 | | | | 04/28/11 | | | | $ (23,804 | ) |
Morgan Stanley Capital Services, Inc. | | | GBP | | | | 694,435 | | | | 698,222 | | | | 04/28/11 | | | | 3,787 | |
Morgan Stanley Capital Services, Inc. | | | IDR | | | | 1,030,189 | | | | 1,028,622 | | | | 04/28/11 | | | | (1,567 | ) |
Morgan Stanley Capital Services, Inc. | | | JPY | | | | 1,404,578 | | | | 1,421,705 | | | | 04/28/11 | | | | 17,127 | |
Morgan Stanley Capital Services, Inc. | | | KRW | | | | 368,214 | | | | 355,906 | | | | 04/28/11 | | | | (12,308 | ) |
Morgan Stanley Capital Services, Inc. | | | PHP | | | | 550,467 | | | | 542,896 | | | | 04/28/11 | | | | (7,571 | ) |
Morgan Stanley Capital Services, Inc. | | | SGD | | | | 782,254 | | | | 773,878 | | | | 04/28/11 | | | | (8,376 | ) |
Morgan Stanley Capital Services, Inc. | | | THB | | | | 2,938,146 | | | | 2,896,917 | | | | 04/28/11 | | | | (41,229 | ) |
Morgan Stanley Capital Services, Inc. | | | TWD | | | | 1,581,616 | | | | 1,614,124 | | | | 04/28/11 | | | | 32,508 | |
| | | | | | | | | | | | | | | | | | | | |
| | | | | | | | | | | | | | | | | | | $ (41,433 | ) |
| | | | | | | | | | | | | | | | | | | | |
The Fund was invested in the following countries at March 31, 2011:
| | | | | | | | |
Summary of Securities
by Country (Unaudited) | | Value | | | % of Total Investments | |
Japan | | $ | 36,295,936 | | | | 35.8 | |
China | | | 14,642,239 | | | | 14.4 | |
Australia | | | 11,116,811 | | | | 10.9 | |
Republic of Korea | | | 8,692,022 | | | | 8.6 | |
Taiwan | | | 7,679,911 | | | | 7.6 | |
Thailand | | | 4,334,845 | | | | 4.3 | |
Hong Kong | | | 4,295,744 | | | | 4.2 | |
India | | | 3,310,313 | | | | 3.3 | |
Singapore | | | 3,248,982 | | | | 3.2 | |
United States* | | | 3,050,797 | | | | 3.0 | |
Indonesia | | | 2,918,831 | | | | 2.9 | |
Philippines | | | 1,065,404 | | | | 1.0 | |
United Kingdom | | | 542,462 | | | | 0.5 | |
Malaysia | | | 281,767 | | | | 0.3 | |
| | | | | | | | |
| | $ | 101,476,064 | | | | 100.0 | |
| | | | | | | | |
* Includes investment companies.
Certain securities are listed by country of underlying exposure but may trade predominantly on another exchange.
| | |
Acronym | | Name |
| ADR | | American Depositary Receipt |
| AUD | | Australian Dollar |
| GBP | | Pound Sterling |
| IDR | | Indonesian Rupiah |
| INR | | Indian Rupees |
| JPY | | Japanese Yen |
| KRW | | South Korean Won |
| MYR | | Malaysian Ringgit |
| NZD | | New Zealand Dollar |
| PHP | | Philippine Pesos |
| SGD | | Singapore Dollar |
| THB | | Thailand Baht |
| TWD | | New Taiwan Dollar |
See Accompanying Notes to Financial Statements.
13
Statement of Assets and Liabilities – Columbia Pacific/Asia Fund
March 31, 2011
| | | | | | |
| | | | | ($) | |
| Assets | | Investments, at identified cost | | | 92,184,979 | |
| | | | | | |
| | Investments, at value | | | 101,476,064 | |
| | Cash | | | 349 | |
| | Foreign currency (cost of $605,215) | | | 608,033 | |
| | Unrealized appreciation on forward foreign currency exchange contracts | | | 274,652 | |
| | Receivable for: | | | | |
| | Investments sold | | | 426,577 | |
| | Fund shares sold | | | 101,033 | |
| | Dividends | | | 558,761 | |
| | Interest | | | 3 | |
| | Expense reimbursement due from Investment Manager | | | 13,714 | |
| | Trustees’ deferred compensation plan | | | 8,332 | |
| | Prepaid expenses | | | 4,405 | |
| | Other assets | | | 50 | |
| | | | | | |
| | Total Assets | | | 103,471,973 | |
| | |
| Liabilities | | Unrealized depreciation on forward foreign currency exchange contracts | | | 236,383 | |
| | Payable for: | | | | |
| | Investments purchased | | | 1,485,213 | |
| | Fund shares repurchased | | | 401,909 | |
| | Foreign capital gains taxes deferred | | | 107,275 | |
| | Investment advisory fee | | | 62,204 | |
| | Administration fee | | | 12,553 | |
| | Pricing and bookkeeping fees | | | 6,344 | |
| | Transfer agent fee | | | 8,792 | |
| | Trustees’ fees | | | 1,511 | |
| | Audit fee | | | 25,378 | |
| | Custody fee | | | 582 | |
| | Distribution and service fees | | | 296 | |
| | Chief compliance officer expenses | | | 205 | |
| | Reports to shareholders | | | 15,000 | |
| | Trustees’ deferred compensation plan | | | 8,332 | |
| | Other liabilities | | | 6,497 | |
| | | | | | |
| | Total Liabilities | | | 2,378,474 | |
| | |
| | | | | | |
| | Net Assets | | | 101,093,499 | |
| | |
| Net Assets Consist of | | Paid-in capital | | | 114,360,831 | |
| | Undistributed net investment income | | | 784,369 | |
| | Accumulated net realized loss | | | (23,273,680 | ) |
| | Net unrealized appreciation (depreciation) on: | | | | |
| | Investments | | | 9,291,085 | |
| | Foreign currency translations | | | 38,169 | |
| | Foreign capital gains tax | | | (107,275 | ) |
| | | | | | |
| | Net Assets | | | 101,093,499 | |
See Accompanying Notes to Financial Statements.
14
Statement of Assets and Liabilities (continued) – Columbia Pacific/Asia Fund
March 31, 2011
| | | | | | |
| | | | | | |
| Class A | | Net assets | | $ | 1,393,749 | |
| | Shares outstanding | | | 162,736 | |
| | Net asset value per share | | $ | 8.56 | (a) |
| | Maximum sales charge | | | 5.75 | % |
| | Maximum offering price per share ($8.56/0.9425) | | $ | 9.08 | (b) |
| | |
| Class C | | Net assets | | $ | 97,392 | |
| | Shares outstanding | | | 11,499 | |
| | Net asset value and offering price per share | | $ | 8.47 | (a) |
| | |
| Class I (c) | | Net assets | | $ | 80,448,552 | |
| | Shares outstanding | | | 9,341,574 | |
| | Net asset value, offering and redemption price per share | | $ | 8.61 | |
| | |
| Class Z | | Net assets | | $ | 19,153,806 | |
| | Shares outstanding | | | 2,224,411 | |
| | Net asset value, offering and redemption price per share | | $ | 8.61 | |
| (a) | Redemption price per share is equal to net asset value less any applicable contingent deferred sales charge. |
| (b) | On sales of $50,000 or more the offering price is reduced. |
| (c) | Class I shares commenced operations on September 27, 2010. |
See Accompanying Notes to Financial Statements.
15
Statement of Operations – Columbia Pacific/Asia Fund
For the Year Ended March 31, 2011
| | | | | | |
| | | | | ($) (a) | |
| Investment Income | | Dividends | | | 1,476,330 | |
| | Interest | | | 697 | |
| | Foreign taxes withheld | | | (115,729 | ) |
| | | | | | |
| | Total Investment Income | | | 1,361,298 | |
| | |
| Expenses | | Investment advisory fee | | | 366,433 | |
| | Administration fee | | | 52,360 | |
| | Distribution fee: | | | | |
| | Class C | | | 656 | |
| | Service fee: | | | | |
| | Class A | | | 2,374 | |
| | Class C | | | 218 | |
| | Transfer agent fee – Class A, Class C and Class Z | | | 30,218 | |
| | Pricing and bookkeeping fees | | | 57,651 | |
| | Trustees’ fees | | | 16,717 | |
| | Custody fee | | | 100,870 | |
| | Registration fees | | | 44,200 | |
| | Audit fee | | | 46,154 | |
| | Reports to shareholders | | | 40,000 | |
| | Chief compliance officer expenses | | | 984 | |
| | Other expenses | | | 16,437 | |
| | | | | | |
| | Expenses before interest expense | | | 775,272 | |
| | Interest expense | | | 268 | |
| | | | | | |
| | Total Expenses | | | 775,540 | |
| | |
| | Fees waived or expenses reimbursed by Investment Manager | | | (95,695 | ) |
| | | | | | |
| | Net Expenses | | | 679,845 | |
| | |
| | | | | | |
| | Net Investment Income | | | 681,453 | |
| | |
Net Realized and Unrealized Gain (Loss) on Investments, Futures Contracts, Written Options, Foreign Currency and Foreign Capital
Gains Tax | | Net realized gain (loss) on: | | | | |
| | Investments | | | (749,534 | ) |
| | Foreign currency transactions and forward foreign currency exchange contracts | | | 237,102 | |
| | Futures contracts | | | (9,416 | ) |
| | Written options | | | 1,508 | |
| | | | | | |
| | Net realized loss | | | (520,340 | ) |
| | |
| | Net change in unrealized appreciation (depreciation) on: | | | | |
| | Investments | | | 4,226,186 | |
| | Foreign currency translations and forward foreign currency exchange contracts | | | 11,701 | |
| | Foreign capital gains tax | | | (61,135 | ) |
| | | | | | |
| | Net change in unrealized appreciation (depreciation) | | | 4,176,752 | |
| | | | | | |
| | Net Gain | | | 3,656,412 | |
| | |
| | | | | | |
| | Net Increase Resulting from Operations | | | 4,337,865 | |
| (a) | Class I shares commenced operations on September 27, 2010. |
See Accompanying Notes to Financial Statements.
16
Statement of Changes in Net Assets – Columbia Pacific/Asia Fund
| | | | | | | | | | |
| | | | �� | Year Ended March 31, | |
| Increase (Decrease) in Net Assets | | | | 2011 ($) | | | 2010 ($) | |
| Operations | | Net investment income | | | 681,453 | | | | 291,264 | |
| | Net realized loss on investments, futures contracts, written options, foreign currency transactions and forward foreign currency exchange contracts | | | (520,340 | ) | | | (23,918 | ) |
| | Net change in unrealized appreciation (depreciation) on investments, foreign capital gains tax, foreign currency translations and forward foreign currency exchange contracts | | | 4,176,752 | | | | 13,353,848 | |
| | | | | | | | | | |
| | Net increase resulting from operations | | | 4,337,865 | | | | 13,621,194 | |
| | | |
| Distributions to Shareholders | | From net investment income: | | | | | | | | |
| | Class A | | | (16,019 | ) | | | (1,477 | ) |
| | Class C | | | (1,053 | ) | | | — | |
| | Class Z | | | (788,608 | ) | | | (176,814 | ) |
| | | | | | | | | | |
| | Total distributions to shareholders | | | (805,680 | ) | | | (178,291 | ) |
| | | |
| | Net Capital Stock Transactions | | | 65,859,360 | | | | (6,755,455 | ) |
| | Redemption fees | | | — | | | | 1,523 | |
| | Increase from regulatory settlements | | | — | | | | 79,506 | |
| | | | | | | | | | |
| | Total increase in net assets | | | 69,391,545 | | | | 6,768,477 | |
| | | |
| Net Assets | | Beginning of period | | | 31,701,954 | | | | 24,933,477 | |
| | End of period | | | 101,093,499 | | | | 31,701,954 | |
| | Undistributed net investment income at end of period | | | 784,369 | | | | 661,843 | |
See Accompanying Notes to Financial Statements.
17
Statement of Changes in Net Assets (continued) – Columbia Pacific/Asia Fund
| | | | | | | | | | | | | | | | |
| | | Capital Stock Activity | |
| | | Year Ended
March 31, 2011 | | | Year Ended
March 31, 2010 | |
| | | Shares | | | Dollars ($) | | | Shares | | | Dollars ($) | |
Class A | | | | | | | | | | | | | | | | |
Subscriptions | | | 103,020 | | | | 845,413 | | | | 113,811 | | | | 757,471 | |
Distributions reinvested | | | 2,104 | | | | 14,873 | | | | 237 | | | | 1,440 | |
Redemptions | | | (48,823 | ) | | | (391,641 | ) | | | (43,812 | ) | | | (312,482 | ) |
| | | | | | | | | | | | | | | | |
Net increase | | | 56,301 | | | | 468,645 | | | | 70,236 | | | | 446,429 | |
| | | | |
Class C | | | | | | | | | | | | | | | | |
Subscriptions | | | 7,372 | | | | 59,350 | | | | 13,194 | | | | 88,659 | |
Distributions reinvested | | | 150 | | | | 1,052 | | | | — | | | | — | |
Redemptions | | | (43,553 | ) | | | (330,581 | ) | | | (15,406 | ) | | | (111,862 | ) |
| | | | | | | | | | | | | | | | |
Net decrease | | | (36,031 | ) | | | (270,179 | ) | | | (2,212 | ) | | | (23,203 | ) |
| | | | |
Class I (a)(b) | | | | | | | | | | | | | | | | |
Subscriptions | | | 9,752,365 | | | | 84,252,982 | | | | — | | | | — | |
Redemptions | | | (410,791 | ) | | | (3,519,304 | ) | | | — | | | | — | |
| | | | | | | | | | | | | | | | |
Net increase | | | 9,341,574 | | | | 80,733,678 | | | | — | | | | — | |
| | | | |
Class Z | | | | | | | | | | | | | | | | |
Subscriptions | | | 1,419,644 | | | | 11,149,482 | | | | 908,889 | | | | 6,376,656 | |
Distributions reinvested | | | 78,825 | | | | 559,654 | | | | 13,143 | | | | 79,780 | |
Redemptions | | | (3,245,820 | ) | | | (26,781,920 | ) | | | (2,025,223 | ) | | | (13,635,117 | ) |
| | | | | | | | | | | | | | | | |
Net decrease | | | (1,747,351 | ) | | | (15,072,784 | ) | | | (1,103,191 | ) | | | (7,178,681 | ) |
| (a) | Class I shares commenced operations on September 27, 2010. |
| (b) | Class I shares reflect activity for the period September 27, 2010 through March 31, 2011. |
See Accompanying Notes to Financial Statements.
18
Financial Highlights – Columbia Pacific/Asia Fund
Selected data for a share outstanding throughout each period is as follows:
| | | | | | | | | | | | | | | | |
| | | Year Ended March 31, | | | Period Ended
March 31, | |
| Class A Shares | | 2011 | | | 2010 | | | 2009 | | | 2008 (a) | |
Net Asset Value, Beginning of Period | | $ | 7.64 | | | $ | 4.82 | | | $ | 9.42 | | | $ | 9.42 | |
| | | | |
Income from Investment Operations: | | | | | | | | | | | | | | | | |
Net investment income (b) | | | 0.08 | | | | 0.04 | | | | 0.11 | | | | — | (c) |
Net realized and unrealized gain (loss) on investments, futures contracts, foreign currency, foreign capital gains tax and written options | | | 0.98 | | | | 2.78 | | | | (3.35 | ) | | | — | (c) |
| | | | | | | | | | | | | | | | |
Total from investment operations | | | 1.06 | | | | 2.82 | | | | (3.24 | ) | | | — | (c) |
| | | | |
Less Distributions to Shareholders: | | | | | | | | | | | | | | | | |
From net investment income | | | (0.14 | ) | | | (0.02 | ) | | | (0.04 | ) | | | — | |
From net realized gains | | | — | | | | — | | | | (1.32 | ) | | | — | |
| | | | | | | | | | | | | | | | |
Total distributions to shareholders | | | (0.14 | ) | | | (0.02 | ) | | | (1.36 | ) | | | — | |
| | | | |
Redemption Fees: | | | | | | | | | | | | | | | | |
Redemption fees added to paid-in-capital | | | — | | | | — | (b)(c) | | | — | (b)(c) | | | — | (b)(c) |
| | | | |
Increase from regulatory settlements | | | — | | | | 0.02 | | | | — | | | | — | |
| | | | |
Net Asset Value, End of Period | | $ | 8.56 | | | $ | 7.64 | | | $ | 4.82 | | | $ | 9.42 | |
Total return (d)(e) | | | 14.26 | % | | | 59.07 | % | | | (40.21 | )% | | | 0.00 | %(f) |
| | | | |
Ratios to Average Net Assets/Supplemental Data: | | | | | | | | | | | | | | | | |
Net expenses before interest expense | | | 1.65 | % | | | 1.73 | % | | | 1.90 | %(g) | | | 1.82 | %(g)(h) |
Interest expense | | | — | %(i) | | | — | | | | 0.01 | % | | | — | %(h)(i) |
Net expenses | | | 1.65 | % | | | 1.73 | % | | | 1.91 | %(g) | | | 1.82 | %(g)(h) |
Waiver/Reimbursement | | | 0.23 | % | | | 0.45 | % | | | 0.11 | % | | | 0.05 | %(h) |
Net investment income (loss) | | | 1.01 | % | | | 0.64 | % | | | 1.94 | %(g) | | | (0.80 | )%(g)(h) |
Portfolio turnover rate | | | 63 | % | | | 98 | % | | | 111 | % | | | 68 | %(f) |
Net assets, end of period (000s) | | $ | 1,394 | | | $ | 814 | | | $ | 175 | | | $ | 10 | |
| (a) | The Fund’s Class A shares commenced operations on March 31, 2008. Per share data and total return reflect activity from that date. |
| (b) | Per share data was calculated using the average shares outstanding during the period. |
| (c) | Rounds to less than $0.01 per share. |
| (d) | Had the Investment Manager and/or any of its affiliates not waived fees or reimbursed a portion of expenses, total return would have been reduced. |
| (e) | Total return at net asset value assuming all distributions reinvested and no initial sales charge or contingent deferred sales charge. |
| (g) | The benefits derived from expense reductions had an impact of less than 0.01%. |
| (i) | Rounds to less than 0.01%. |
See Accompanying Notes to Financial Statements.
19
Financial Highlights – Columbia Pacific/Asia Fund
Selected data for a share outstanding throughout each period is as follows:
| | | | | | | | | | | | | | | | |
| | | Year Ended March 31, | | | Period Ended
March 31, | |
| Class C Shares | | 2011 | | | 2010 | | | 2009 | | | 2008 (a) | |
Net Asset Value, Beginning of Period | | $ | 7.56 | | | $ | 4.78 | | | $ | 9.42 | | | $ | 9.42 | |
| | | | |
Income from Investment Operations: | | | | | | | | | | | | | | | | |
Net investment income (loss) (b) | | | — | (c) | | | (0.01 | ) | | | 0.04 | | | | — | (c) |
Net realized and unrealized gain (loss) on investments, futures contracts, foreign currency, foreign capital gains tax and written options | | | 1.00 | | | | 2.77 | | | | (3.32 | ) | | | — | (c) |
| | | | | | | | | | | | | | | | |
Total from investment operations | | | 1.00 | | | | 2.76 | | | | (3.28 | ) | | | — | (c) |
| | | | |
Less Distributions to Shareholders: | | | | | | | | | | | | | | | | |
From net investment income | | | (0.09 | ) | | | — | | | | (0.04 | ) | | | — | |
From return of capital | | | — | | | | — | | | | (1.32 | ) | | | — | |
| | | | | | | | | | | | | | | | |
Total distributions to shareholders | | | (0.09 | ) | | | — | | | | (1.36 | ) | | | — | |
| | | | |
Redemption Fees: | | | | | | | | | | | | | | | | |
Redemption fees added to paid-in-capital | | | — | | | | — | (b)(c) | | | — | (b)(c) | | | — | (b)(c) |
| | | | |
Increase from regulatory settlements | | | — | | | | 0.02 | | | | — | | | | — | |
| | | | |
Net Asset Value, End of Period | | $ | 8.47 | | | $ | 7.56 | | | $ | 4.78 | | | $ | 9.42 | |
Total return (d)(e) | | | 13.46 | % | | | 58.16 | % | | | (40.69 | )% | | | 0.00 | %(f) |
| | | | |
Ratios to Average Net Assets/Supplemental Data: | | | | | | | | | | | | | | | | |
Net expenses before interest expense | | | 2.40 | % | | | 2.48 | % | | | 2.65 | %(g) | | | 2.57 | %(g)(h) |
Interest expense | | | — | %(i) | | | — | | | | 0.01 | % | | | — | %(h)(i) |
Net expenses | | | 2.40 | % | | | 2.48 | % | | | 2.66 | %(g) | | | 2.57 | %(g)(h) |
Waiver/Reimbursement | | | 0.29 | % | | | 0.45 | % | | | 0.11 | % | | | 0.05 | %(h) |
Net investment income (loss) | | | (0.01 | )% | | | (0.09 | )% | | | 0.87 | %(g) | | | (1.55 | )%(g)(h) |
Portfolio turnover rate | | | 63 | % | | | 98 | % | | | 111 | % | | | 68 | %(f) |
Net assets, end of period (000s) | | $ | 97 | | | $ | 359 | | | $ | 238 | | | $ | 10 | |
| (a) | The Fund’s Class C shares commenced operations on March 31, 2008. Per share data and total return reflect activity from that date. |
| (b) | Per share data was calculated using the average shares outstanding during the period. |
| (c) | Rounds to less than $0.01 per share. |
| (d) | Had the Investment Manager and/or any of its affiliates not waived fees or reimbursed a portion of expenses, total return would have been reduced. |
| (e) | Total return at net asset value assuming all distributions reinvested and no contingent deferred sales charge. |
| (g) | The benefits derived from expense reductions had an impact of less than 0.01%. |
| (i) | Rounds to less than 0.01%. |
See Accompanying Notes to Financial Statements.
20
Financial Highlights – Columbia Pacific/Asia Fund
Selected data for a share outstanding throughout the period is as follows:
| | | | |
| | | Period Ended
March 31, | |
| Class I Shares | | 2011 (a) | |
Net Asset Value, Beginning of Period | | $ | 7.89 | |
| |
Income from Investment Operations: | | | | |
Net investment income (b) | | | 0.08 | |
Net realized and unrealized gain (loss) on investments, futures contracts, foreign currency, foreign capital gains tax and written options | | | 0.64 | |
| | | | |
Total from investment operations | | | 0.72 | |
| |
Net Asset Value, End of Period | | $ | 8.61 | |
Total return (c)(d)(e) | | | 9.13 | % |
| |
Ratios to Average Net Assets/Supplemental Data: | | | | |
Net expenses before interest expense (f) | | | 1.34 | % |
Interest expense (f)(g) | | | — | % |
Net expenses (f) | | | 1.34 | % |
Waiver/Reimbursement (f) | | | 0.05 | % |
Net investment income (f) | | | 1.76 | % |
Portfolio turnover rate (e) | | | 63 | % |
Net assets, end of period (000s) | | $ | 80,449 | |
| (a) | Class I shares commenced operations on September 27, 2010. Per share data and total return reflect activity from that date. |
| (b) | Per share data was calculated using the average shares outstanding during the period. |
| (c) | Total return at net asset value. |
| (d) | Had the Investment Manager and/or any of its affiliates not waived fees or reimbursed a portion of expenses, total return would have been reduced. |
| (g) | Rounds to less than 0.01%. |
See Accompanying Notes to Financial Statements.
21
Financial Highlights – Columbia Pacific/Asia Fund
Selected data for a share outstanding throughout each period is as follows:
| | | | | | | | | | | | | | | | | | | | |
| | | Year Ended March 31, | |
| Class Z Shares | | 2011 | | | 2010 | | | 2009 | | | 2008 (a) | | | 2007 | |
Net Asset Value, Beginning of Period | | $ | 7.69 | | | $ | 4.83 | | | $ | 9.42 | | | $ | 11.72 | | | $ | 11.61 | |
| | | | | |
Income from Investment Operations: | | | | | | | | | | | | | | | | | | | | |
Net investment income (b) | | | 0.09 | | | | 0.07 | | | | 0.10 | | | | 0.05 | | | | — | (c) |
Net realized and unrealized gain (loss) on investments, futures contracts, foreign currency, foreign capital gains tax and written options | | | 0.99 | | | | 2.81 | | | | (3.33 | ) | | | 0.11 | | | | 0.50 | |
| | | | | | | | | | | | | | | | | | | | |
Total from investment operations | | | 1.08 | | | | 2.88 | | | | (3.23 | ) | | | 0.16 | | | | 0.50 | |
| | | | | |
Less Distributions to Shareholders: | | | | | | | | | | | | | | | | | | | | |
From net investment income | | | (0.16 | ) | | | (0.04 | ) | | | (0.04 | ) | | | (0.08 | ) | | | — | |
From net realized gains | | | — | | | | — | | | | (1.32 | ) | | | (2.38 | ) | | | (0.39 | ) |
| | | | | | | | | | | | | | | | | | | | |
Total distributions to shareholders | | | (0.16 | ) | | | (0.04 | ) | | | (1.36 | ) | | | (2.46 | ) | | | (0.39 | ) |
| | | | | |
Redemption Fees: | | | | | | | | | | | | | | | | | | | | |
Redemption fees added to paid-in-capital | | | — | | | | — | (b)(c) | | | — | (b)(c) | | | — | (b)(c) | | | — | (b)(c) |
| | | | | |
Increase from regulatory settlements | | | — | | | | 0.02 | | | | — | | | | — | | | | — | |
| | | | | |
Net Asset Value, End of Period | | $ | 8.61 | | | $ | 7.69 | | | $ | 4.83 | | | $ | 9.42 | | | $ | 11.72 | |
Total return (d) | | | 14.44 | %(e) | | | 60.22 | %(e) | | | (40.10 | )%(e) | | | (1.11 | )%(e)(f) | | | 4.40 | % |
| | | | | |
Ratios to Average Net Assets/Supplemental Data: | | | | | | | | | | | | | | | | | | | | |
Net expenses before interest expense | | | 1.40 | % | | | 1.48 | % | | | 1.65 | %(g) | | | 1.57 | %(g) | | | 1.61 | %(g) |
Interest expense | | | — | %(h) | | | — | | | | 0.01 | % | | | — | %(h) | | | — | |
Net expenses | | | 1.40 | % | | | 1.48 | % | | | 1.66 | %(g) | | | 1.57 | %(g) | | | 1.61 | %(g) |
Waiver/Reimbursement | | | 0.26 | % | | | 0.45 | % | | | 0.11 | % | | | 0.04 | % | | | — | |
Net investment income (loss) | | | 1.22 | % | | | 1.02 | % | | | 1.33 | %(g) | | | 0.39 | %(g) | | | (0.04 | )%(g) |
Portfolio turnover rate | | | 63 | % | | | 98 | % | | | 111 | % | | | 68 | % | | | 92 | % |
Net assets, end of period (000s) | | $ | 19,154 | | | $ | 30,529 | | | $ | 24,521 | | | $ | 117,835 | | | $ | 213,132 | |
| (a) | On March 31, 2008, Shares class of Pacific/Asia Fund, a series of Excelsior Funds, Inc., was reorganized into the Fund’s Class Z. The financial information of the Fund’s Class Z includes the financial information of Pacific/Asia Fund’s Shares class. |
| (b) | Per share data was calculated using the average shares outstanding during the period. |
| (c) | Rounds to less than $0.01 per share. |
| (d) | Total return at net asset value assuming all distributions reinvested. |
| (e) | Had the Investment Manager and/or any of its affiliates not waived fees or reimbursed a portion of expenses, total return would have been reduced. |
| (f) | Total return includes a voluntary reimbursement by the Investment Manager for a realized investment loss due to a trading error. This reimbursement increased total return and net asset value per share by less than 0.01% and $0.01, respectively. |
| (g) | The benefits derived from expense reductions had an impact of less than 0.01%. |
| (h) | Rounds to less than 0.01%. |
See Accompanying Notes to Financial Statements.
22
Notes to Financial Statements – Columbia Pacific/Asia Fund
March 31, 2011
Note 1. Organization
Columbia Pacific/Asia Fund (the Fund), a series of Columbia Funds Series Trust I (the Trust), is a diversified fund. The Trust is registered under the Investment Company Act of 1940, as amended (the 1940 Act), as an open-end management investment company organized as a Massachusetts business trust.
After the close of business on April 30, 2010, Ameriprise Financial, Inc. (Ameriprise Financial) acquired a portion of the asset management business of Columbia Management Group, LLC (the Transaction), including the business of managing the Fund. In connection with the closing of the Transaction (the Closing), RiverSource Investments, LLC, a wholly owned subsidiary of Ameriprise Financial, became the investment manager of the Fund and changed its name to Columbia Management Investment Advisers, LLC (the Investment Manager).
Investment Objective
The Fund seeks long-term capital appreciation.
Fund Shares
The Trust has unlimited authorized shares of beneficial interest. The Fund offers Class A, Class C, Class I and Class Z shares. On December 28, 2010, the Investment Manager exchanged Class Z shares of the Fund valued at $15,362,322 for Class I shares of the Fund. All share classes have identical voting, dividend and liquidation rights. Each share class has its own expense structure and sales charges, as applicable.
Class A shares are subject to a maximum front-end sales charge of 5.75% based on the initial investment amount. Class A shares purchased without an initial sales charge in accounts aggregating $1 million to $50 million at the time of purchase are subject to a 1.00% contingent deferred sales charge (CDSC) if the shares are sold within 18 months of purchase, charged as follows: 1.00% CDSC if redeemed within 12 months of purchase, and 0.50% CDSC if redeemed more than 12, but less than 18 months after purchase.
Class C shares are subject to a 1.00% CDSC on shares redeemed within one year of purchase.
Class I shares are not subject to sales charges and are available only to the Columbia Family of Funds. Class I shares commenced operations on September 27, 2010.
Class Z shares are not subject to sales charges and are available only to certain investors, as described in the Fund’s prospectus.
Note 2. Summary of Significant Accounting Policies
The preparation of financial statements in accordance with U.S. generally accepted accounting principles (GAAP) requires management to make certain estimates and assumptions that affect the reported amounts of assets and liabilities, the disclosure of contingent assets and liabilities at the date of the financial statements and the reported amounts of revenue and expenses during the reporting period. Actual results could differ from those estimates.
The following is a summary of significant accounting policies consistently followed by the Fund in the preparation of its financial statements.
Security Valuation
Equity securities and exchange-traded funds are valued at the last sale price on the principal exchange on which they trade, except for securities traded on the NASDAQ, which are valued at the NASDAQ official close price. Unlisted securities or listed securities for which there were no sales during the day are valued at the closing bid price on such exchanges or over-the-counter markets.
Short-term investments maturing in 60 days or less are valued at amortized cost which approximates market value.
Futures contracts are valued at the settlement price established each day by the board of trade or exchange on which they are traded.
Written options are valued at the last reported sale price, or in the absence of a sale, at the last quoted ask price.
Forward foreign currency exchange contracts are valued at the prevailing forward exchange rate of the underlying currencies.
Foreign securities are generally valued at the last sale price on the foreign exchange or market on which they trade. If any foreign share prices are not readily available as a result of limited share activity, the securities are valued at the last sale price of the local shares in the principal market in which such securities are normally traded.
Generally, trading in foreign securities is substantially completed each day at various times prior to the close of the New York Stock Exchange (NYSE). The values of such securities used in computing the net asset value of the Fund’s shares are determined as of such times. Foreign currency exchange rates are generally determined at 4:00 p.m. Eastern (U.S.) time. Occasionally, events affecting the values of such foreign securities may occur between the times at which they are determined and the close of the customary trading session of the NYSE, which would not be reflected in the
23
Columbia Pacific/Asia Fund
March 31, 2011
computation of the Fund’s net asset value. If events materially affecting the values of such foreign securities occur and it is determined that market quotations are not reliable, then these foreign securities will be valued at their fair value using procedures approved by the Board of Trustees.
The Fund may use a systematic fair valuation model provided by an independent third party to value securities principally traded in foreign markets. The third party pricing service takes into account multiple factors, including, but not limited to, movements in the U.S. securities markets, certain depositary receipts, futures contracts and foreign exchange rates that have occurred subsequent to the close of the foreign exchange, to determine a good faith estimate that reasonably reflects the current market conditions as of the close of the NYSE. The fair value of a security is likely to be different from the quoted or published price, if available.
Investments for which market quotations are not readily available, or that have quotations which management believes are not reliable, are valued at fair value as determined in good faith under consistently applied procedures established by and under the general supervision of the Board of Trustees. If a security is valued at fair value, such value is likely to be different from the last quoted market price for the security. The determination of fair value often requires significant judgment. To determine fair value, management may use assumptions including but not limited to future cash flows and estimated risk premiums. Multiple inputs from various sources may be used to determine value.
Foreign Currency Transactions and Translations
The values of all assets and liabilities quoted in foreign currencies are translated into U.S. dollars at that day’s exchange rates. Net realized and unrealized gains (losses) on foreign currency transactions and translations include gains (losses) arising from the fluctuation in exchange rates between trade and settlement dates on securities transactions, gains (losses) arising from the disposition of foreign currency and currency gains (losses) between the accrual and payment dates on dividends, interest income and foreign withholding taxes.
For financial statement purposes, the Fund does not distinguish that portion of gains (losses) on investments which is due to changes in foreign exchange rates from that which is due to changes in market prices of the investments. Such fluctuations are included with the net realized and unrealized gains (losses) on investments on the Statement of Operations.
Derivative Instruments
The Fund may use derivative instruments including futures contracts, options and forward foreign currency exchange contracts in order to meet its investment objectives. The Fund employs strategies in differing combinations to permit it to increase, decrease or change the level of exposure to market risk factors. The achievement of any strategy relating to derivatives depends on an analysis of various risk factors, and if the strategies for the use of derivatives do not work as intended, the Fund may not achieve its investment objectives.
In pursuit of its investment objectives, the Fund is exposed to the following market risks among others:
Equity Risk: Equity risk relates to change in value of equity securities such as common stocks due to general market conditions such as real or perceived adverse economic conditions, changes in the general outlook for corporate earnings, or adverse investor sentiment. Equity securities generally have greater price volatility than fixed income securities.
Foreign Exchange Rate Risk: Foreign exchange rate risk relates to the change in the U.S. dollar value of a security held that is denominated in a foreign currency. The U.S. dollar value of a foreign-currency-denominated security will decrease as the dollar appreciates against the currency, while the U.S. dollar value will increase as the dollar depreciates against the currency.
The following provides more detailed information about each derivative type held by the Fund:
Forward Foreign Currency Exchange Contracts — The Fund entered into forward foreign currency exchange contracts to shift its investment exposure from one currency to another, and to shift foreign currency exposure back to U.S. dollars. The Fund also used forward contracts to achieve a representative weighted mix of major currencies in its benchmark and/or to recover an underweight country exposure in its portfolio.
Forward foreign currency exchange contracts are agreements to exchange one currency for another at a future date at a specified price. These contracts are used to minimize the exposure to foreign exchange rate fluctuations during the period between the trade and settlement dates of the contract. Contracts to buy generally are used to acquire exposure to foreign currencies, while contracts to sell are generally used to reduce the exposure to foreign exchange rate fluctuations. Forward foreign currency exchange contracts are valued daily at the current exchange rate of the underlying currency, resulting in unrealized gains (losses) which become realized at the time the forward foreign currency exchange contracts are closed or mature. Realized and unrealized gains (losses) arising from such
24
Columbia Pacific/Asia Fund
March 31, 2011
transactions are included in net realized and unrealized gains (losses) on foreign currency transactions. The use of forward foreign currency exchange contracts does not eliminate fluctuations in the prices of the Fund’s portfolio securities. While the maximum potential loss from such contracts is the aggregate face value in U.S. dollars at the time the contract was opened, exposure is typically limited to the change in value of the contract (in U.S. dollars) over the period it remains open. The Fund could also be exposed to risk that counterparties of the contracts may be unable to fulfill the terms of the contracts.
During the year ended March 31, 2011, the Fund entered into 202 forward foreign currency exchange contracts.
Futures Contracts — The Fund entered into equity index futures contracts to equitize cash in order to maintain appropriate equity market exposure while keeping sufficient cash to accommodate daily redemptions.
The use of futures contracts involves certain risks, which include, among others: (1) imperfect correlation between the price movement of the instruments and the underlying securities, (2) inability to close out positions due to differing trading hours, or the temporary absence of a liquid market, for either the instruments or the underlying securities, and (3) an inaccurate prediction of the future direction of interest rates by the Fund’s Investment Manager. In addition, upon entering into index futures contracts, the Fund bears risks which may include securities prices moving unexpectedly, in which case, the Fund may not achieve the anticipated benefits of the futures contracts and may realize a loss.
Upon entering into a futures contract, the Fund identifies within its portfolio of investments cash or securities in an amount sufficient to meet the initial margin requirement. Subsequent payments are made or received by the Fund equal to the daily change in the contract value and are recorded as variation margin receivable or payable and offset in unrealized gains or losses. The Fund recognizes a realized gain or loss when the contract is closed or expires.
Futures contracts involve, to varying degrees, risk of loss in excess of the variation margin disclosed on the Statement of Assets and Liabilities.
During the year ended March 31, 2011, the Fund entered into 2 futures contracts.
Options — The Fund had written covered call and purchased put options to decrease the Fund’s exposure to equity risk and to increase return on instruments. Written covered call and purchased put options become more valuable as the price of the underlying instruments depreciates relative to the strike price.
Writing put options tends to increase the Fund’s exposure to the underlying instrument. When the Fund writes a call or put option, an amount equal to the premium received is recorded as a liability and subsequently marked-to-market to reflect the current value of the option written. Premiums received from writing options which expire are treated as realized gains. Premiums received from writing options which are exercised or closed are added to the proceeds or offset against the amounts paid on the underlying security transaction to determine the realized gain or loss. The Fund, as a writer of an option, has no control over whether the underlying security may be sold (call) or purchased (put) and as a result bears the market risk of an unfavorable change in the price of the security underlying the written option. There is the risk that the Fund may not be able to enter into a closing transaction because of an illiquid market. The Fund identifies within its portfolio of investments cash or liquid portfolio securities equal to the amount of the written options contract commitment.
The Fund may also purchase put and call options. Purchasing call options tends to increase the Fund’s exposure to the underlying instrument. Purchasing put options tends to decrease the Fund’s exposure to the underlying instrument. The Fund may pay a premium, which is included in the Fund’s Statement of Assets and Liabilities as an investment and subsequently marked-to-market to reflect the current value of the option. The risk associated with purchasing put and call options is limited to the premium paid. Premiums paid for purchasing options which expire are treated as realized losses. Premiums paid for purchasing options which are exercised are added to the amounts paid (call) or offset against the proceeds (put) on the underlying security to determine the realized gain or loss. If the Fund enters into a closing transaction, the Fund will realize a gain or loss, depending on whether the proceeds from the closing transaction are greater or less than the cost of the option.
During the year ended March 31, 2011, the Fund entered into 26 written options contracts.
Effects of Derivative Transactions in the Financial Statements
The following table is a summary of the value of the Fund’s derivative instruments as of March 31, 2011:
| | | | | | |
| Fair Value of Derivative Instruments |
| Statement of Assets and Liabilities |
| Assets | | Fair Value | | Liabilities | | Fair Value |
Unrealized
Appreciation
on Forward
Foreign
Currency
Exchange
Contracts | | $274,652 | | Unrealized
Depreciation
on Forward
Foreign
Currency
Exchange
Contracts | | $236,383 |
25
Columbia Pacific/Asia Fund
March 31, 2011
The effect of derivative instruments on the Fund’s Statement of Operations for the year ended March 31, 2011:
| | | | | | | | | | |
| | | | | | | | | |
| | | Risk
Exposure | | Amount of
Realized
Gain or
(Loss) on
Derivatives | | | Change in
Unrealized
Appreciation
(Depreciation)
on Derivatives | |
| Futures Contracts | | Equity
Risk | | $ | (9,416 | ) | | $ | — | |
| Written Options | | Equity
Risk | | | 1,508 | | | | — | |
| Forward Foreign Currency Exchange Contracts | | Foreign
Exchange
Rate Risk | | | 281,873 | | | | 10,173 | |
Repurchase Agreements
The Fund may engage in repurchase agreement transactions with institutions that the Investment Manager has determined are creditworthy. The Fund, through the custodian, receives delivery of the underlying securities collateralizing a repurchase agreement. The Investment Manager is responsible for determining that the collateral is at least equal, at all times, to the value of the repurchase obligation including interest. A repurchase agreement transaction involves certain risks in the event of default or insolvency of the counterparty. These risks include possible delays in or restrictions on the Fund’s ability to dispose of the underlying securities and a possible decline in the value of the underlying securities during the period while the Fund seeks to assert its rights.
Security Transactions
Security transactions are accounted for on the trade date. Cost is determined and gains (losses) are based upon the specific identification method for both financial statement and federal income tax purposes.
Income Recognition
Interest income is recorded on the accrual basis.
Corporate actions and dividend income are recorded net of any non-reclaimable tax withholdings, on the ex-dividend date or upon receipt of ex-dividend notification in the case of certain foreign securities.
Awards from class action litigation are recorded as a reduction of cost if the Fund still owns the applicable securities on the payment date. If the Fund no longer owns the applicable securities, the proceeds are recorded as realized gains.
Expenses
General expenses of the Trust are allocated to the Fund and other series of the Trust based upon relative net assets or other expense allocation methodologies determined by the nature of the expense. Expenses directly attributable to a specific class of shares are charged to that share class. Expenses directly attributable to the Fund are charged to the Fund.
Determination of Class Net Asset Value
All income, expenses (other than class-specific expenses which are charged directly to a share class, as shown in the Statement of Operations) and realized and unrealized gains (losses) are allocated to each class of the Fund on a daily basis, based on the relative net assets of each class, for purposes of determining the net asset value of each class.
Federal Income Tax Status
The Fund intends to qualify each year as a regulated investment company under Subchapter M of the Internal Revenue Code, as amended, and will distribute substantially all of its tax exempt or taxable income, if any, for its tax year, and as such will not be subject to federal income taxes. In addition, the Fund intends to distribute in each calendar year substantially all of its net investment income, capital gains and certain other amounts, if any, such that the Fund should not be subject to federal excise tax. Therefore, no federal income or excise tax provision is recorded.
Foreign Taxes
The Fund may be subject to foreign taxes on income and/or gains on investments or currency repatriation, a portion of which may be recoverable. The Fund will accrue such taxes and recoveries as applicable, based upon its current interpretation of tax rules and regulations that exist in the markets in which it invests.
Realized gains in certain countries may be subject to foreign taxes at the Fund level, at rates ranging from approximately 10% to 15%. The Fund accrues for such foreign taxes on net realized and unrealized gains at the appropriate rate for each jurisdiction.
Distributions to Shareholders
Distributions from net investment income, if any, are declared and paid semi-annually. Net realized capital gains, if any, are distributed
26
Columbia Pacific/Asia Fund
March 31, 2011
at least annually. Income distributions and capital gain distributions are determined in accordance with federal income tax regulations which differ from GAAP.
Indemnifications
Under the Trust’s organizational documents and, in some cases, by contract, its officers and directors are indemnified against certain liabilities arising out of the performance of their duties to the Fund. In addition, certain of the Fund’s contracts with its service providers contain general indemnification clauses. The Fund’s maximum exposure under these arrangements is unknown since the amount of any future claims that may be made against the Fund cannot be determined and the Fund has no historical basis for predicting the likelihood of any such claims.
Note 3. Fees and Compensation Paid to Affiliates
Investment Management Fee
Under an Investment Management Services Agreement (IMSA), the Investment Manager determines which securities will be purchased, held or sold. The management fee is equal to a percentage of the Fund’s average daily net assets that declines from 0.75% to 0.52% as the Fund’s net assets increase.
Prior to the Closing, Columbia Management Advisors, LLC (Columbia), an indirect, wholly owned subsidiary of Bank of America Corporation (BOA), provided investment management services to the Fund under the same fee structure. The effective management fee rate for the year ended March 31, 2011, was 0.75% of the Fund’s average daily net assets.
Administration Fee
Effective upon the Closing, the Investment Manager provides administration and accounting services to the Fund under an Administrative Services Agreement, including services previously performed under the Pricing and Bookkeeping Oversight and Services Agreement (the Services Agreement) as discussed in the Pricing and Bookkeeping Fees note below. The Fund pays an annual administration fee equal to 0.20% of the Fund’s average daily net assets less the fees payable by the Fund as described under the Pricing and Bookkeeping Fees note below. Prior to the Closing, Columbia provided administrative services to the Fund at the same fee rates.
Pricing and Bookkeeping Fees
Prior to the Closing, the Fund entered into a Financial Reporting Services Agreement (the Financial Reporting Services Agreement) with State Street Bank and Trust Company (State Street) and Columbia pursuant to which State Street provides financial reporting services to the Fund. The Fund also entered into an Accounting Services Agreement (collectively with the Financial Reporting Services Agreement, the State Street Agreements) with State Street and Columbia pursuant to which State Street provides accounting services to the Fund. Upon the Closing, Columbia assigned and delegated its rights and obligations under the State Street Agreements to the Investment Manager. Under the State Street Agreements, the Fund pays State Street an annual fee of $38,000 paid monthly plus an additional monthly fee based on an annualized percentage rate of average daily net assets of the Fund for the month. The aggregate fee will not exceed $140,000 per year (exclusive of out-of-pocket expenses and charges). The Fund also reimburses State Street for certain out-of-pocket expenses and charges.
Also prior to the Closing, the Fund entered into the Services Agreement with Columbia. Under the Services Agreement, Columbia provided services related to Fund expenses and the requirements of the Sarbanes-Oxley Act of 2002, and provided oversight of the accounting and financial reporting services provided by State Street. Under the Services Agreement, the Fund reimbursed Columbia for out-of-pocket expenses and charges, including fees payable to third parties, such as for pricing the Fund’s portfolio securities, incurred by Columbia in the performance of services under the Services Agreement. The Services Agreement was terminated upon the Closing. These services are now provided under the Administrative Services Agreement discussed above.
Transfer Agent Fee
In connection with the Closing, RiverSource Service Corporation, a wholly owned subsidiary of Ameriprise Financial, provides transfer agency services to the Fund under a Transfer Agency Agreement and changed its name to Columbia Management Investment Services Corp. (the Transfer Agent). The Transfer Agent has contracted with Boston Financial Data Services (BFDS) to serve as sub-transfer agent.
The Transfer Agent receives monthly account-based service fees based on the number of open accounts and is reimbursed by the Fund for the fees and expenses the Transfer Agent pays to financial intermediaries that maintain omnibus accounts with the Fund that is a percentage of the average aggregate value of the Fund’s shares maintained in each such omnibus account (other than omnibus
27
Columbia Pacific/Asia Fund
March 31, 2011
accounts for which American Enterprise Investment Services Inc. is the broker of record or accounts where the beneficial shareholder is a customer of Ameriprise Financial Services, Inc., which are paid a per account fee). The Transfer Agent pays the fees of BFDS for services as sub-transfer agent and, is not entitled to reimbursement for such fees from the Fund (with the exception of out-of pocket fees). The Transfer Agent also receives compensation from fees for various shareholder services and reimbursements for certain out-of-pocket expenses. Class I shares do not pay any transfer agency fees.
Prior to the Closing, Columbia Management Services, Inc., an affiliate of Columbia and an indirect, wholly owned subsidiary of BOA, provided transfer agency services to the Fund and contracted with BFDS to serve as sub-transfer agent, under the same fee structure.
Class I shares do not pay transfer agent fees. For the year ended March 31, 2011, the Fund’s effective transfer agent fee rate for each class, with the exception of Class I shares, was 0.09% of the Fund’s average daily net assets.
An annual minimum account balance fee of $20 may apply to certain accounts with a value below the Fund’s initial minimum investment requirements to reduce the impact of small accounts on transfer agent fees. These minimum account balance fees are recorded as part of expense reductions on the Statement of Operations. For the year ended March 31, 2011, no minimum account balance fees were charged by the Fund.
Underwriting Discounts, Service and Distribution Fees
In connection with the Closing, RiverSource Fund Distributors, Inc., an indirect wholly owned subsidiary of Ameriprise Financial, provides distribution and shareholder services to the Fund and changed its name to Columbia Management Investment Distributors, Inc. (the Distributor). Pursuant to Rule 12b-1 under the 1940 Act, the Board of Trustees has approved, and the Fund has adopted, distribution and shareholder service plans (the Plans) which set the distribution and service fees for the Fund. These fees are calculated daily and are intended to compensate the Distributor and/or eligible selling and/or servicing agents for selling shares of the Fund and providing services to investors.
The Plans require the payment of a monthly service fee to the Distributor at the maximum annual rate of 0.25% of the average daily net assets attributable to Class A and Class C shares of the Fund. The Plans also require the payment of a monthly distribution fee to the Distributor at the maximum annual rates of 0.75% of the average daily net assets attributable to Class C shares of the Fund.
Prior to the Closing, Columbia Management Distributors, Inc., an affiliate of Columbia and an indirect, wholly owned subsidiary of BOA, was the principal underwriter of the Fund’s shares. There were no changes to the underwriting discount structure of the Fund or the service or distribution fee rates paid by the Fund as a result of the Transaction.
Sales Charges
Sales charges, including front-end and CDSC’s, received by the Distributor for distributing Fund shares were $1,425 for Class A for the year ended March 31, 2011.
Fee Waivers and Expense Reimbursements
The Investment Manager has voluntarily agreed to bear a portion of the Fund’s expenses so that the Fund’s ordinary operating expenses (excluding any brokerage commissions, interest, taxes and extraordinary expenses, but including custodian charges relating to overdrafts, if any), after giving effect to any balance credits from the Fund’s custodian, do not exceed the annual rates of 1.65%, 2.40%, 1.34% and 1.40% of the Fund’s average daily net assets attributable to Class A, Class C, Class I and Class Z shares, respectively. The Investment Manager, in its discretion, may revise or discontinue this arrangement at any time. Prior to May 1, 2010, Columbia voluntarily reimbursed a portion of the Fund’s expenses so that the Fund’s ordinary operating expenses (excluding any distribution and service fees, brokerage commissions, interest, taxes and extraordinary expenses, but including custodian charges relating to overdrafts, if any), after giving effect to any balance credits from the Fund’s custodian, did not exceed 1.40% of the Fund’s average daily net assets on an annualized basis.
Fees Paid to Officers and Trustees
In connection with the Closing, all officers of the Fund are employees of the Investment Manager or its affiliates and, with the exception of the Fund’s Chief Compliance Officer, receive no compensation from the Fund. The Board of Trustees has appointed a Chief Compliance Officer to the Fund in accordance with federal securities regulations. The Fund, along with other affiliated funds, pays its pro-rata share of the expenses associated with the Chief Compliance Officer. The Fund’s expenses for the Chief Compliance Officer will not exceed $15,000 per year. Prior to the Closing, all officers of the Fund were employees of Columbia or its affiliates and
28
Columbia Pacific/Asia Fund
March 31, 2011
the Fund paid its pro-rata share of the expenses for the Chief Compliance Officer under the same fee structure.
Trustees are compensated for their services to the Fund, as set forth on the Statement of Operations. The Trust’s eligible Trustees may participate in a deferred compensation plan which may be terminated at any time. Obligations of the plan will be paid solely out of the Fund’s assets.
Note 4. Custody Credits
The Fund has an agreement with its custodian bank under which custody fees may be reduced by balance credits. These credits are recorded as part of expense reductions on the Statement of Operations. The Fund could have invested a portion of the assets utilized in connection with the expense offset arrangement in an income-producing asset if it had not entered into such an agreement.
Note 5. Portfolio Information
The cost of purchases and proceeds from sales of securities, excluding short-term obligations, aggregated $96,868,765 and $31,552,361, respectively, for the year ended March 31, 2011.
Note 6. Regulatory Settlements
During the year ended March 31, 2010, the Fund received payments totaling $79,506 resulting from certain regulatory settlements with third parties in which the Fund had participated. The payments have been included in “Increase from regulatory settlements” in the Statement of Changes in Net Assets.
Note 7. Shareholder Concentration
As of March 31, 2011, three shareholder accounts owned 61.0% of the outstanding shares of the Fund. Purchase and redemption activity of these accounts may have a significant effect on the operations of the Fund.
Note 8. Line of Credit
Prior to March 28, 2011, the Fund and other affiliated funds participated in a $280,000,000 committed, unsecured revolving line of credit provided by State Street. Effective March 28, 2011, the commitment was reduced to $225,000,000. The maximum amount that may be borrowed by any fund is limited to the lesser of $200,000,000 and the Fund’s borrowing limit set forth in the Fund’s registration statement. Borrowings are available for short-term liquidity or temporary or emergency purposes.
Effective October 14, 2010, interest is charged to each participating fund based on the fund’s borrowings at a rate per annum equal to the greater of the Federal Funds Rate plus 1.25% or the overnight LIBOR Rate plus 1.25%. In addition, a commitment fee of 0.125% per annum is accrued and apportioned among the participating funds pro rata based on their relative net assets.
Prior to October 14, 2010, interest was charged to each participating fund at the same rates. In addition, a commitment fee of 0.15% per annum was accrued and apportioned among the participating funds pro rata based on their relative net assets.
For the year ended March 31, 2011, the average daily loan balance outstanding on days where borrowing existed was $1,066,667 at a weighted average interest rate of 1.50%.
Note 9. Federal Tax Information
The timing and character of income and capital gain distributions are determined in accordance with income tax regulations, which may differ from GAAP. Reclassifications are made to the Fund’s capital accounts for permanent tax differences to reflect income and gains available for distribution (or available capital loss carryforwards) under income tax regulations.
For the year ended March 31, 2011, permanent book and tax basis differences resulting primarily from differing treatments for net operating losses, foreign currency transactions, passive foreign investment company (“PFIC”) adjustments, and foreign capital gain tax reclass were identified and reclassified among the components of the Fund’s net assets as follows:
| | | | |
| | | | | |
Undistributed Net Investment Income | | Accumulated Net Realized
Loss | | Paid-In Capital |
| $246,753 | | $1,510,890 | | $(1,757,643) |
Net investment income and net realized gains (losses), as disclosed on the Statement of Operations, and net assets were not affected by this reclassification.
The tax character of distributions paid during the years ended March 31, 2011 and March 31, 2010 was as follows:
| | | | | | | | |
| | | March 31, 2011 | | | March 31, 2010 | |
| Distributions paid from: | | | | | | |
Ordinary Income* | | $ | 805,680 | | | $ | 178,291 | |
Long-Term Capital Gains | | | — | | | | — | |
| * | For tax purposes short-term capital gain distributions, if any, are considered ordinary income distributions. |
29
Columbia Pacific/Asia Fund
March 31, 2011
As of March 31, 2011, the components of distributable earnings on a tax basis were as follows:
| | | | |
| | | | | |
Undistributed
Ordinary Income | | Undistributed Long-Term Capital Gains | | Net
Unrealized
Appreciation* |
| $1,157,670 | | $— | | $8,184,153 |
| * | The differences between book-basis and tax-basis net unrealized appreciation are primarily due to deferral of losses from wash sales. |
Unrealized appreciation and depreciation at March 31, 2011, based on cost of investments for federal income tax purposes, and excluding any unrealized appreciation and depreciation from changes in the value of other assets and liabilities resulting from changes in exchange rates, were:
| | | | |
| | | | |
Unrealized appreciation | | $ | 11,057,591 | |
Unrealized depreciation | | | (2,873,438 | ) |
| | | | |
Net unrealized appreciation | | $ | 8,184,153 | |
The following capital loss carryforwards may be available to reduce taxable income arising from future net realized gains on investments, if any, to the extent permitted by the Internal Revenue Code:
| | | | |
| | | | |
| Year of Expiration | | Capital Loss Carryforwards | |
| 2017 | | $ | 9,165,902 | |
| 2018 | | | 12,566,247 | |
| 2019 | | | 790,415 | |
| | | | |
| Total | | $ | 22,522,564 | |
Capital loss carryforwards of $1,757,643 were utilized during the year ended March 31, 2011 for the Fund.
Management of the Fund has concluded that there are no significant uncertain tax positions that would require recognition in the financial statements. However, management’s conclusion may be subject to review and adjustment at a later date based on factors including, but not limited to, new tax laws, regulations, and administrative interpretations (including relevant court decisions). The Fund’s federal tax returns for the prior three fiscal years remain subject to examination by the Internal Revenue Service.
Note 10. Significant Risks and Contingencies
Foreign Securities Risk
Investing in foreign securities may include certain risks and considerations not typically associated with investing in U.S. securities, such as fluctuating currency values and changing local and regional economic, political and social conditions, which may result in greater market volatility. In addition, certain foreign securities may not be as liquid as U.S. securities. Investing in emerging markets may accentuate these risks.
Investments in emerging market countries are subject to additional risk. The risk of foreign investments is typically increased in less developed countries. These countries are also more likely to experience high levels of inflation, deflation or currency devaluation which could hurt their economies and securities markets.
Geographic Concentration Risk
Because the Fund’s investments are concentrated in the Asia/Pacific region, events within the region will have a greater effect on the Fund than if the Fund were more geographically diversified. In addition, events in any one country within the region may impact the other countries or the region as a whole. Markets in the region can experience significant volatility due to social, regulatory and political uncertainties.
Note 11. Subsequent Events
Management has evaluated the events and transactions that have occurred through the date the financial statements were issued. Other than as noted below, there were no items requiring adjustment of the financial statements or additional disclosure.
Effective May 16, 2011, the line of credit commitment with State Street was reduced to $150,000,000, and the maximum amount that may be borrowed by any fund will be limited to the lesser of $120,000,000 and the Fund’s borrowing limit set forth in the Fund’s registration statement.
Note 12. Information Regarding Pending and Settled Legal Proceedings
In June 2004, an action captioned John E. Gallus et al. v. American Express Financial Corp. and American Express Financial Advisors Inc. was filed in the United States District Court for the District of Arizona. The plaintiffs allege that they are investors in several American Express Company (now known as RiverSource) mutual funds and they purport to bring the action derivatively on behalf of those funds under the Investment Company Act of 1940. The plaintiffs allege that fees allegedly paid to the defendants by the funds for investment advisory and administrative services are excessive. The plaintiffs seek remedies including restitution and rescission of investment advisory and distribution agreements. The plaintiffs voluntarily agreed to transfer this case to the United States
30
Columbia Pacific/Asia Fund
March 31, 2011
District Court for the District of Minnesota (the District Court). In response to defendants’ motion to dismiss the complaint, the District Court dismissed one of plaintiffs’ four claims and granted plaintiffs limited discovery. Defendants moved for summary judgment in April 2007. Summary judgment was granted in the defendants’ favor on July 9, 2007. The plaintiffs filed a notice of appeal with the Eighth Circuit Court of Appeals (the Eighth Circuit) on August 8, 2007. On April 8, 2009, the Eighth Circuit reversed summary judgment and remanded to the District Court for further proceedings. On August 6, 2009, defendants filed a writ of certiorari with the U.S. Supreme Court (the Supreme Court), asking the Supreme Court to stay the District Court proceedings while the Supreme Court considers and rules in a case captioned Jones v. Harris Associates, which involves issues of law similar to those presented in the Gallus case. On March 30, 2010, the Supreme Court issued its ruling in Jones v. Harris Associates, and on April 5, 2010, the Supreme Court vacated the Eighth Circuit’s decision in the Gallus case and remanded the case to the Eighth Circuit for further consideration in light of the Supreme Court’s decision in Jones v. Harris Associates. On June 4, 2010, the Eighth Circuit remanded the Gallus case to the District Court for further consideration in light of the Supreme Court’s decision in Jones v. Harris Associates. On December 9, 2010, the District Court reinstated its July 9, 2007 summary judgment order in favor of the defendants. On January 10, 2011, plaintiffs filed a notice of appeal with the Eighth Circuit.
In December 2005, without admitting or denying the allegations, American Express Financial Corporation (AEFC, which is now known as Ameriprise Financial, Inc. (Ameriprise Financial)), entered into settlement agreements with the Securities and Exchange Commission (SEC) and Minnesota Department of Commerce (MDOC) related to market timing activities. As a result, AEFC was censured and ordered to cease and desist from committing or causing any violations of certain provisions of the Investment Advisers Act of 1940, the Investment Company Act of 1940, and various Minnesota laws. AEFC agreed to pay disgorgement of $10 million and civil money penalties of $7 million. AEFC also agreed to retain an independent distribution consultant to assist in developing a plan for distribution of all disgorgement and civil penalties ordered by the SEC in accordance with various undertakings detailed at http://www.sec.gov/litigation/admin/ia-2451.pdf. Ameriprise Financial and its affiliates have cooperated with the SEC and the MDOC in these legal proceedings, and have made regular reports to the funds’ Boards of Directors/Trustees.
Ameriprise Financial and certain of its affiliates have historically been involved in a number of legal, arbitration and regulatory proceedings, including routine litigation, class actions, and governmental actions, concerning matters arising in connection with the conduct of their business activities. Ameriprise Financial believes that the Funds are not currently the subject of, and that neither Ameriprise Financial nor any of its affiliates are the subject of, any pending legal, arbitration or regulatory proceedings that are likely to have a material adverse effect on the Funds or the ability of Ameriprise Financial or its affiliates to perform under their contracts with the Funds. Ameriprise Financial is required to make 10-Q, 10-K and, as necessary, 8-K filings with the Securities and Exchange Commission on legal and regulatory matters that relate to Ameriprise Financial and its affiliates. Copies of these filings may be obtained by accessing the SEC website at www.sec.gov.
There can be no assurance that these matters, or the adverse publicity associated with them, will not result in increased fund redemptions, reduced sale of fund shares or other adverse consequences to the Funds. Further, although we believe proceedings are not likely to have a material adverse effect on the Funds or the ability of Ameriprise Financial or its affiliates to perform under their contracts with the Funds, these proceedings are subject to uncertainties and, as such, we are unable to estimate the possible loss or range of loss that may result. An adverse outcome in one or more of these proceedings could result in adverse judgments, settlements, fines, penalties or other relief that could have a material adverse effect on the consolidated financial condition or results of operations of Ameriprise Financial.
31
Report of Independent Registered Public Accounting Firm
To the Trustees of Columbia Funds Series Trust I and the Shareholders of Columbia Pacific/Asia Fund
In our opinion, the accompanying statement of assets and liabilities, including the investment portfolio, and the related statements of operations and of changes in net assets and the financial highlights present fairly, in all material respects, the financial position of Columbia Pacific/Asia Fund (the “Fund”) (a series of Columbia Funds Series Trust I) at March 31, 2011, the results of its operations for the year then ended, the changes in its net assets for each of the two years in the period then ended, and the financial highlights for each of the periods indicated, in conformity with accounting principles generally accepted in the United States of America. These financial statements and financial highlights (hereafter referred to as “financial statements”) are the responsibility of the Fund’s management. Our responsibility is to express an opinion on these financial statements based on our audits. We conducted our audits of these financial statements in accordance with the standards of the Public Company Accounting Oversight Board (United States). Those standards require that we plan and perform the audit to obtain reasonable assurance about whether the financial statements are free of material misstatement. An audit includes examining, on a test basis, evidence supporting the amounts and disclosures in the financial statements, assessing the accounting principles used and significant estimates made by management, and evaluating the overall financial statement presentation. We believe that our audits, which included confirmation of securities at March 31, 2011 by correspondence with the custodian and brokers, provide a reasonable basis for our opinion.
PricewaterhouseCoopers LLP
Boston, Massachusetts
May 20, 2011
32
Federal Income Tax Information (Unaudited) – Columbia Pacific/Asia Fund
Foreign taxes paid during the fiscal year ended March 31, 2011, of $126,598 are being passed through to shareholders. This represents $0.01 per share. Eligible shareholders may claim this amount as a foreign tax credit.
Gross income derived from sources within foreign countries was $1,330,113 ($0.11 per share) for the fiscal year ended March 31, 2011.
For non-corporate shareholders 66.45%, or the maximum amount allowable under the Jobs and Growth Tax Relief Reconciliation Act of 2003, of ordinary income distributed by the Fund for the fiscal year ended March 31, 2011 may represent qualified dividend income.
The Fund will notify shareholders in January 2012 of amounts for use in preparing 2011 income tax returns.
33
Fund Governance
The Trustees serve terms of indefinite duration. The names, addresses and birth years of the Trustees and Officers of the Funds in Columbia Funds Series Trust I, the year each was first elected or appointed to office, their principal business occupations during at least the last five years, the number of Funds overseen by each Trustee and other directorships they hold are shown below, as of May 2, 2011. Each officer listed below serves as an officer of each Fund in Columbia Funds Series Trust I.
Independent Trustees
| | |
Name, address and year of birth,
Position with funds, Year first
elected or appointed to office | | Principal occupation(s) during past five years, Number of funds in Columbia Funds
Complex overseen by trustee, Other directorships held |
| |
| John D. Collins (born 1938) | | |
c/o Columbia Management Investment Advisers, LLC 225 Franklin Street Boston, MA 02110 Trustee (since 2005) | | Retired. Consultant, KPMG, LLP (accounting and tax firm) from July 1999 to June 2000; Partner, KPMG, LLP from March 1962 to June 1999. Oversees 46; Mrs. Fields Original Cookies, Inc. (consumer products); Suburban Propane Partners, L.P.; and Montpelier Re (insurance underwriting firm) |
| |
| Rodman L. Drake (born 1943) | | |
c/o Columbia Management Investment Advisers, LLC 225 Franklin Street Boston, MA 02110 Trustee (since 1994) and Chairman of the Board (since 2009) | | Independent consultant since 2010; Co-Founder of Baringo Capital LLC (private equity) from 1997 to 2008; CEO of Crystal River Capital, Inc. (real estate investment trust) from 2003 to 2010; Oversees 46; Jackson Hewitt Tax Service Inc. (tax preparation services); Celgene Corporation (global biotechnology company); Student Loan Corporation (student loan provider); Crystal River Capital, Inc. from 2005 to 2010; Parsons Brinckerhoff from 1995 to 2008; the Helios Funds (closed-end funds); and Apex Silver Mines Ltd. from 2007 to 2009 |
| |
| Douglas A. Hacker (born 1955) | | |
c/o Columbia Management Investment Advisers, LLC 225 Franklin Street Boston, MA 02110 Trustee (since 1996) | | Independent business executive since May 2006; Executive Vice President–Strategy of United Airlines (airline) from December 2002 to May 2006; President of UAL Loyalty Services (airline marketing company) from September 2001 to December 2002; Executive Vice President and Chief Financial Officer of United Airlines from July 1999 to September 2001. Oversees 46; Nash Finch Company (food distributor); Aircastle Limited (aircraft leasing); and SeaCube Container Leasing Ltd (container leasing) |
|
| Janet Langford Kelly (born 1957) |
c/o Columbia Management Investment Advisers, LLC 225 Franklin Street Boston, MA 02110 Trustee (since 1996) | | Senior Vice President, General Counsel and Corporate Secretary, ConocoPhillips (integrated energy company) since September 2007; Deputy General Counsel–Corporate Legal Services, ConocoPhillips from August 2006 to August 2007; Partner, Zelle, Hofmann, Voelbel, Mason & Gette LLP (law firm) from March 2005 to July 2006; Adjunct Professor of Law, Northwestern University, from September 2004 to June 2006; Director, UAL Corporation (airline) from February 2006 to July 2006; Oversees 46; None |
| |
| William E. Mayer (born 1940) | | |
c/o Columbia Management Investment Advisers, LLC 225 Franklin Street Boston, MA 02110 Trustee (since 1994) | | Partner, Park Avenue Equity Partners (private equity) since February 1999; Dean and Professor, College of Business and Management, University of Maryland from 1992 to 1996. Oversees 46; DynaVox Inc. (software developer); Lee Enterprises (print media), WR Hambrecht + Co. (financial service provider); BlackRock Kelso Capital Corporation (investment company) |
34
Fund Governance (continued)
Independent Trustees (continued)
| | |
Name, address and year of birth,
Position with funds, Year first
elected or appointed to office | | Principal occupation(s) during past five years, Number of funds in Columbia Funds
Complex overseen by trustee, Other directorships held |
| |
| David M. Moffett (born 1952) | | |
c/o Columbia Management Investment Advisers, LLC 225 Franklin Street Boston, MA 02110 Trustee (since 2011) | | Retired. Chief Executive Officer, Federal Home Loan Mortgage Corporation, from 2008 to 2009; Senior Adviser, Global Financial Services Group, Carlyle Group, Inc., from 2007 to 2008; Vice Chairman and Chief Financial Officer, U.S. Bancorp, from 1993 to 2007. Oversees 46; CIT Group Inc. (commercial and consumer finance), eBay Inc. (online trading community), MBIA Corp (financial service provider), E.W. Scripps Co. (print and television media), Building Materials Holding Corp. (building materials and construction services), and University of Oklahoma Foundation. |
| |
| Charles R. Nelson (born 1942) | | |
c/o Columbia Management Investment Advisers, LLC 225 Franklin Street Boston, MA 02110 Trustee (since 1981) | | Professor of Economics, University of Washington, since January 1976; Ford and Louisa Van Voorhis Professor of Political Economy, University of Washington, since September 1993; Adjunct Professor of Statistics, University of Washington, since September 1980; Associate Editor, Journal of Money Credit and Banking, 1993-2008; Consultant on econometric and statistical matters. Oversees 46; None |
| |
| John J. Neuhauser (born 1943) | | |
c/o Columbia Management Investment Advisers, LLC 225 Franklin Street Boston, MA 02110 Trustee (since 1984) | | President, Saint Michael’s College, since August 2007; Director or Trustee of several non-profit organization, including Fletcher Allen Health Care, Inc.; University Professor, Boston College from November 2005 to August 2007; Academic Vice President and Dean of Faculties, Boston College from August 1999 to October 2005. Oversees 46; Liberty All-Star Equity Fund and Liberty All-Star Growth Fund, Inc. (closed-end funds) |
| |
| Jonathan Piel (born 1938) | | |
c/o Columbia Management Investment Advisers, LLC 225 Franklin Street Boston, MA 02110 Trustee (since 1994) | | Cable television producer and website designer; The Editor, Scientific American from 1984 to 1994; Vice President, Scientific American, Inc., from 1984 to 1994; Member, Advisory Board, Stone Age Institute, Bloomington, Indiana (research institute that explores the effect of technology on human evolution); Member, Board of Directors of the National Institute of Social Sciences, New York City; Member, Board of Trustees of the William Alanson White Institute, New York City (institution for training psychoanalysts); and Member, Advisory Board, Mount Sinai Children’s Environmental Health Center, New York. Oversees 46; None |
| |
| Patrick J. Simpson (born 1944) | | |
c/o Columbia Management Investment Advisers, LLC 225 Franklin Street Boston, MA 02110 Trustee (since 2000) | | Partner, Perkins Coie LLP (law firm). Oversees 46; None |
| |
| Anne-Lee Verville (born 1945) | | |
c/o Columbia Management Investment Advisers, LLC 225 Franklin Street Boston, MA 02110 Trustee (since 1998) | | Retired since 1997 (formerly General Manager–Global Education Industry from 1994 to 1997, President–Application Systems Division from 1991 to 1994, Chief Financial Officer–US Marketing & Services from 1988 to 1991, and Chief Information Officer from 1987 to 1988, IBM Corporation (computer and technology)). Oversees 46; Enesco Group, Inc. (producer of giftware and home and garden decor products) from 2001 to 2006 |
35
Fund Governance (continued)
Interested Trustee
| | |
Name, address and year of birth,
Position with funds, Year first
elected or appointed to office | | Principal occupation(s) during past five years, Number of funds in Columbia Funds
Complex overseen by trustee, Other directorships held |
| |
| Michael A. Jones (born 1959) | | |
c/o Columbia Management Investment Advisers, LLC 225 Franklin Street Boston, MA 02110 Trustee (since 2011) Senior Vice President (since 2010) | | President and Director, Columbia Management Investment Advisers, LLC since May 2010; President and Director, Columbia Management Investment Distributors, Inc. since May 2010; Manager, Chairman, Chief Executive Officer and President, Columbia Management Advisors, LLC from 2007 to April 2010; Chief Executive Officer, President and Director, Columbia Management Distributors, Inc. from November 2006 to April 2010; previously, co-president and senior managing director at Robeco Investment Management. Oversees 46; None |
The Statement of Additional Information includes additional information about the Trustees of the Funds and is available, without charge, upon request by calling 1-800-345-6611.
36
Fund Governance (continued)
Officers
| | |
| Name, year of birth and address | | Principal occupation(s) during the past five years |
|
| J. Kevin Connaughton (born 1964) |
225 Franklin Street Boston, MA 02110 President (since 2009) | | Senior Vice President and General Manager–Mutual Fund Products, Columbia Management Investment Advisers, LLC since May 2010; President, Columbia Funds, since 2009, and RiverSource Funds, since May 2010 (previously Senior Vice President and Chief Financial Officer, Columbia Funds, from June 2008 to January 2009, Treasurer, Columbia Funds, from October 2003 to May 2008, and senior officer of various other affiliated funds since 2000); Managing Director, Columbia Management Advisors, LLC from December 2004 to April 2010. |
| |
| Michael G. Clarke (born 1969) | | |
225 Franklin Street Boston, MA 02110 Treasurer (since 2011) and Chief Financial Officer (since 2009) | | Vice President, Columbia Management Investment Advisers, LLC since May 2010; Managing Director of Fund Administration, Columbia Management Advisors, LLC, from September 2004 to April 2010; senior officer of Columbia Funds and affiliated funds since 2002. |
| |
| Scott R. Plummer (born 1959) | | |
5228 Ameriprise Financial Center Minneapolis, MN 55474 Senior Vice President, Secretary and Chief Legal Officer (since 2010) | | Chief Legal Officer and Assistant Secretary, Columbia Management Investment Advisers, LLC since June 2005; Vice President and Lead Chief Counsel–Asset Management, Ameriprise Financial, Inc. since May 2010 (previously Vice President and Chief Counsel–Asset Management, from 2005 to April 2010, and Vice President–Asset Management Compliance from 2004 to 2005); Vice President, Chief Counsel and Assistant Secretary, Columbia Management Investment Distributors, Inc. since 2008; Vice President, General Counsel and Secretary, Ameriprise Certificate Company since 2005; Chief Counsel, RiverSource Distributors, Inc. since 2006; Vice President, General Counsel and Secretary, RiverSource Funds, since December 2006; Senior Vice President, Secretary and Chief Legal Officer, Columbia Funds, since May 2010. |
| |
| Linda J. Wondrack (born 1964) | | |
225 Franklin Street Boston, MA 02110 Senior Vice President and Chief Compliance Officer (since 2007) | | Vice President and Chief Compliance Officer, Columbia Management Investment Advisers, LLC since May 2010; Chief Compliance Officer, Columbia Funds, since 2007, and RiverSource Funds, since May 2010; Director (Columbia Management Group, LLC and Investment Product Group Compliance), Bank of America, from June 2005 to April 2010; Director of Corporate Compliance and Conflicts Officer of MFS Investment Management (investment management) from August 2004 to May 2005. |
| |
| William F. Truscott (born 1960) | | |
53600 Ameriprise Financial Center Minneapolis, MN 55474 Senior Vice President (since 2010) | | Chairman of the Board, Columbia Management Investment Advisers, LLC since May 2010 (previously President, Chairman of the Board and Chief Investment Officer, from 2001 to April 2010); Chief Executive Officer, U.S. Asset Management & President, Annuities, Ameriprise Financial, Inc. since May 2010 (previously President–U.S. Asset Management and Chief Investment Officer from 2005 to April 2010, and Senior Vice President–Chief Investment Officer, from 2001 to 2005); Director, President and Chief Executive Officer, Ameriprise Certificate Company since 2006; Director, Columbia Management Investment Distributors, Inc. since May 2010 (previously Chairman of the Board and Chief Executive Officer from 2008 to April 2010); Chairman of the Board and Chief Executive Officer, RiverSource Distributors, Inc. since 2006. |
37
Fund Governance (continued)
Officers (continued)
| | |
| Name, year of birth and address | | Principal occupation(s) during the past five years |
|
| Colin Moore (born 1958) |
225 Franklin Street Boston, MA 02110 Senior Vice President (since 2010) | | Director and Chief Investment Officer, Columbia Management Investment Advisers, LLC since May 2010; Manager, Managing Director and Chief Investment Officer of Columbia Management Advisors, LLC from 2007 to April 2010; Head of Equities, Columbia Management Advisors, LLC from 2002 to 2007. |
| |
| Amy Johnson (born 1965) | | |
5228 Ameriprise Financial Center Minneapolis, MN 55474 Vice President (since 2010) | | Senior Vice President and Chief Operating Officer, Columbia Management Investment Advisers, LLC since May 2010 (previously Chief Administrative Officer, from 2009 until April 2010, Vice President–Asset Management and Trust Company Services, from 2006 to 2009, and Vice President–Operations and Compliance from 2004 to 2006). |
| |
| Joseph F. DiMaria (born 1968) | | |
225 Franklin Street Boston, MA 02110 Vice President (since 2011) and Chief Accounting Officer (since 2008) | | Vice President, Mutual Fund Administration, Columbia Management Investment Advisers, LLC, since May 2010; Director of Fund Administration, Columbia Management Advisors, LLC from January 2006 to April 2010; Head of Tax/Compliance and Assistant Treasurer, Columbia Management Advisors, LLC, from November 2004 to December 2005. |
| |
| Stephen T. Welsh (born 1957) | | |
225 Franklin Street Boston, MA 02110 Vice President (since 2006) | | President and Director, Columbia Management Investment Services Corp. since May 2010; President and Director, Columbia Management Services, Inc. from July 2004 to April 2010; Managing Director, Columbia Management Distributors, Inc. from August 2007 to April 2010. |
| |
| Paul D. Pearson (born 1956) | | |
5228 Ameriprise Financial Center Minneapolis, MN 55474 Vice President and Assistant
Treasurer (since 2011) | | Vice President, Investment Accounting, Columbia Management Investment Advisers, LLC, since May 2010; Vice President, Managed Assets, Investment Accounting, Ameriprise Financial Corporation. |
| |
| Paul B. Goucher (born 1968) | | |
5228 Ameriprise Financial Center Minneapolis, MN 55474 Vice President and Assistant
Treasurer (since 2010) | | Vice President and Chief Counsel of Ameriprise Financial since January 2010 (formerly Vice President and Group Counsel from November 2008 to January 2010); Director, Managing Director and General Counsel of J. & W. Seligman & Co. Incorporated (Seligman) from July 2008 to November 2008 and Managing Director and Associate General Counsel of Seligman from January 2005 to July 2008. |
| |
| Christopher O. Petersen (born 1970) | | |
5228 Ameriprise Financial Center Minneapolis, MN 55474 Vice President and Assistant
Treasurer (since 2010) | | Vice President and Chief Counsel, Ameriprise Financial since January 2010 (formerly Vice President and Group Counsel or Counsel from April 2004 to January 2010); Assistant Secretary of RiverSource Funds since January 2007. |
| |
| Michael E. DeFao (born 1968) | | |
5228 Ameriprise Financial Center Minneapolis, MN 55474 Vice President and Assistant
Treasurer (since 2011) | | Vice President and Chief Counsel, Ameriprise Financial since May 2010; Associate General Counsel Bank of America from June 2005 to April 2010. |
38
Shareholder Meeting Results
At a Joint Special Meeting of Shareholders held on February 15, 2011, shareholders of the Fund considered a proposal to approve a proposed amendment to the Investment Management Services Agreement with Columbia Management Investment Advisers, LLC. The proposal was approved as follows:
| | | | | | |
| | | | | | | |
| Votes For | | Votes Against | | Abstentions | | Broker Non-Votes |
| 30,994,030 | | 1,257,626 | | 398,387 | | 0 |
39
[THIS PAGE INTENTIONALLY LEFT BLANK]
40
Important Information About This Report
The fund mails one shareholder report to each shareholder address. If you would like more than one report, please call shareholder services at 1-800-345-6611 and additional reports will be sent to you. This report has been prepared for shareholders of Columbia Pacific/Asia Fund.
A description of the policies and procedures that the fund uses to determine how to vote proxies and a copy of the fund’s voting records are available (i) at www.columbiamanagement.com, (ii) on the Securities and Exchange Commission’s website at www.sec.gov, and (iii) without charge, upon request, by calling 1-800-368-0346. Information regarding how the fund voted proxies relating to portfolio securities during the 12-month period ended June 30 is available from the SEC’s website. Information regarding how the fund voted proxies relating to portfolio securities is also available from the fund’s website, www.columbiamanagement.com.
The fund files a complete schedule of portfolio holdings with the SEC for the first and third quarters of each fiscal year on Form N-Q. The fund’s Form N-Q is available on the SEC’s website at www.sec.gov and may be reviewed and copied at the SEC’s Public Reference Room in Washington, D.C. Information on the operation of the Public Reference Room may be obtained by calling
1-800-SEC-0330.
Transfer Agent
Columbia Management Investment Services Corp.
P.O. Box 8081
Boston, MA 02266-8081
1-800-345-6611
Distributor
Columbia Management Investment
Distributors, Inc.
225 Franklin Street
Boston, MA 02110
Investment Manager
Columbia Management Investment Advisers, LLC
225 Franklin Street
Boston, MA 02110
41

Columbia Pacific/Asia Fund
P.O. Box 8081
Boston, MA 02266-8081
columbiamanagement.com
This information is for use with concurrent or prior delivery of a fund prospectus. Investors should consider the investment objectives, risks, charges and expenses of a mutual fund carefully before investing. For a free prospectus, which contains this and other important information about the funds, visit columbiamanagement.com. Read the prospectus carefully before investing. The Fund is distributed by Columbia Management Investment Distributors, Inc., member FINRA, and managed by Columbia Management Investment Advisers, LLC.
©2011 Columbia Management Investment Advisers, LLC. All rights reserved.
C-1156 A (05/11)

Columbia Select Large Cap Growth Fund
Annual Report for the Period Ended March 31, 2011
Table of Contents
The views expressed in this report reflect the current views of the respective parties. These views are not guarantees of future performance and involve certain risks, uncertainties and assumptions that are difficult to predict, so actual outcomes and results may differ significantly from the views expressed. These views are subject to change at any time based upon economic, market or other conditions and the respective parties disclaim any responsibility to update such views. These views may not be relied on as investment advice and, because investment decisions for a Columbia Fund are based on numerous factors, may not be relied on as an indication of trading intent on behalf of any particular Columbia Fund. References to specific securities should not be construed as a recommendation or investment advice.
President’s Message

Dear Shareholder:
The Columbia Management story began over 100 years ago, and today, we are one of the nation’s largest dedicated asset managers. The recent acquisition by Ameriprise Financial, Inc. brings together the talents, resources and capabilities of Columbia Management with those of RiverSource Investments, Threadneedle (acquired by Ameriprise in 2003) and Seligman Investments (acquired by Ameriprise in 2008) to build a best-in-class asset management business that we believe is truly greater than its parts.
RiverSource Investments traces its roots to 1894 when its then newly-founded predecessor, Investors Syndicate, offered a face-amount savings certificate that gave small investors the opportunity to build a safe and secure fund for retirement, education or other special needs. A mutual fund pioneer, Investors Syndicate launched Investors Mutual Fund in 1940. In the decades that followed, its mutual fund products and services lineup grew to include a full spectrum of styles and specialties. More than 110 years later, RiverSource continues to be a trusted financial products leader.
Threadneedle, a leader in global asset management and one of Europe’s largest asset managers, offers sophisticated international experience from a dedicated U.K. management team. Headquartered in London, it is named for Threadneedle Street in the heart of the city’s financial district, where British investors pioneered international and global investing. Threadneedle was acquired in 2003 and today operates as an affiliate of Columbia Management.
Seligman Investments’ beginnings date back to the establishment of the investment firm J. & W. Seligman & Co. in 1864. In the years that followed, Seligman played a major role in the geographical expansion and industrial development of the United States. In 1874, President Ulysses S. Grant named Seligman as fiscal agent for the U.S. Navy — an appointment that would last through World War I. Seligman helped finance the westward path of the railroads and the building of the Panama Canal. The firm organized its first investment company in 1929 and began managing its first mutual fund in 1930. In 2008, J. & W. Seligman & Co. Incorporated was acquired and Seligman Investments became an offering brand of RiverSource Investments, LLC.
We are proud of the rich and distinctive history of these firms, the strength and breadth of products and services they offer, and the combined cultures of pioneering spirit and forward thinking. Together we are committed to providing more for our shareholders than ever before.
| n | | A singular focus on our shareholders. Our business is asset management, so investors are our first priority. We dedicate our resources to identifying timely investment opportunities and provide a comprehensive choice of equity, fixed-income and alternative investments to help meet your individual needs. |
| n | | First-class research and thought leadership. We are dedicated to helping you take advantage of today’s opportunities and anticipate tomorrow’s. We stay abreast of the latest investment trends and ideas, using our collective insight to evaluate events and transform them into solutions you can use. |
| n | | A disciplined investment approach. We aren’t distracted by passing fads. Our teams adhere to a rigorous investment process that helps ensure the integrity of our products and enables you and your financial advisor to match our solutions to your objectives with confidence. |
When you choose Columbia Management, you can be confident that we will take the time to understand your needs and help you and your financial advisor identify the solutions that are right for you. Because at Columbia Management, we don’t consider ourselves successful unless you are.
Sincerely,

J. Kevin Connaughton
President, Columbia Funds
Investors should consider the investment objectives, risks, charges and expenses of a mutual fund carefully before investing. For a free prospectus, which contains this and other important information about the funds, visit www.columbiamanagement.com. The prospectus should be read carefully before investing.
Columbia Funds are distributed by Columbia Management Investment Distributors, Inc., member FINRA, and managed by Columbia Management Investment Advisers, LLC.
© 2011 Columbia Management Investment Advisers, LLC. All rights reserved.
Fund Profile – Columbia Select Large Cap Growth Fund
Summary
| n | | For the 12-month period that ended March 31, 2011, the fund’s Class A shares returned 28.58% without sales charge. |
| n | | The fund solidly outperformed both the 18.26% return of its benchmark, the Russell 1000 Growth Index1, and the 16.06% average return of its peer group, the Lipper Large-Cap Growth Funds Classification.2 |
| n | | Positive stock selection in the information technology and consumer discretionary sectors was the main driver of the fund’s strong return. Meanwhile, the fund’s holdings in energy and financials tempered results, as did an overweight in health care and an underweight in industrials. |
Portfolio Management
Thomas Galvin, lead manager, has managed or co-managed the fund since 2008 and the predecessor fund since 2003. He has been associated with the fund’s adviser or the fund’s previous adviser or its predecessors since 2003.
Richard A. Carter has co-managed the fund since 2009 and has been associated with the fund’s adviser or the fund’s previous adviser or its predecessors since 2003.
Todd D. Herget has co-managed the fund since 2009 and has been associated with the fund’s adviser or the fund’s previous adviser or its predecessors since 1998.
| 1 | The Russell 1000 Growth Index measures the performance of those Russell 1000 Index companies with higher price-to-book ratios and higher forecasted growth values. |
| 2 | Lipper Inc., a widely respected data provider in the industry, calculates an average total return (assuming reinvestment of distributions) for mutual funds with investment objectives similar to those of the fund. Lipper makes no adjustment for the effect of sales loads. |
Indices are not available for investment, are not professionally managed and do not reflect sales charges, fees, brokerage commissions, taxes or other expenses of investing. Securities in the fund may not match those in an index.
Performance data quoted represents past performance and current performance may be lower or higher. Past performance is no guarantee of future results. The investment return and principal value will fluctuate so that shares, when redeemed, may be worth more or less than the original cost. Please visit www.columbiamanagement.com for daily and most recent month-end performance updates.
Summary
1-year return as of 03/31/11
| | |
| |
 | | +28.58% Class A shares (without sales charge) |
| |
| | +18.26% Russell 1000 Growth Index |
|
Morningstar Style BoxTM |
|
Equity Style |
|
The Morningstar Style BoxTM is based on the fund’s portfolio holdings. For equity funds, the vertical axis shows the market capitalization of the stocks owned, and the horizontal axis shows investment style (value, blend, or growth). Information shown is based on the most recent data provided by Morningstar.
© 2011 Morningstar, Inc. All rights reserved. The Morningstar information contained herein: (1) is proprietary to Morningstar and/or its content providers; (2) may not be copied or distributed; and (3) is not warranted to be accurate, complete or timely. Neither Morningstar nor its content providers are responsible for any damages or losses arising from any use of this information.
1
Economic Update – Columbia Select Large Cap Growth Fund
Summary
For the 12-month period that ended March 31, 2011
| | n | | The U.S. stock market, as measured by the S&P 500 Index, delivered solid returns, despite a summer 2010 correction. Foreign stock market returns were also positive, as measured by the MSCI EAFE Index (Net). | |
| | |
| S&P Index | | MSCI Index |
| |

| |
|
15.65% | | 10.42% |
| | n | | Strengthening economic growth and rising interest rates kept a lid on most bond market sectors. The Barclays Capital Aggregate Bond Index delivered modest results. However, high-yield bonds were strong performers, as measured by the JPMorgan Developed BB High Yield Index. | |
| | |
| Barclays Aggregate Index | | JPMorgan Index |
| |
| |
|
5.12% | | 13.04% |
The U.S. economy continued to expand at a solid but uneven pace over the past 12 months, as measured by gross domestic product (GDP). Although lackluster second quarter 2010 GDP growth raised fears that the economy was losing steam and might lapse back into recession, the pace picked up in the third quarter of 2010, inspiring confidence among consumers, businesses and investors. GDP expanded by 2.6% in the third quarter and 3.1% in the fourth quarter. With the Federal Reserve Board (the Fed) providing additional monetary stimulus to shore up economic growth and the extension of key tax cuts for the next two years, expectations are for continued growth in 2011. However, early estimates of first quarter 2011 growth place it just under 2.0%, a disappointment after two strong quarters and a pick-up in employment.
Consumer spending on cars, clothing and other goods generally trended higher during the 12-month period, accelerating in the fourth quarter of 2010. Holiday spending rose 5.5% between November 5, 2010 and December 24, 2010, in all retail categories, excluding automobiles, compared with the same period in 2009, according to MasterCard Advisors’ SpendingPulse, which tracks spending on all transactions including cash. Personal income surged in January 2011 as payroll tax cuts kicked in. The personal savings rate edged higher, ending February, the last month for which data was available, at 5.8%.
News on the job front was increasingly positive. A good portion of the jobs added in March, April and May of 2010 were temporary, government-sponsored census positions, which began to unwind in June, July and August 2010. However, private sector payroll employment began to trend higher in the third quarter, massive layoffs declined and job growth turned solidly positive, with the addition of 444,000 new jobs in the first quarter of 2011.
Despite some glimmers of improvement early in 2010, the housing market remained troublesome throughout the period. Both new and existing home sales fell after a federal tax credit for new and repeat homebuyers expired. Distressed properties pressured prices and foreclosures continued — another drag on prices. The inventory of unsold homes ended the period higher than it started, at 8.9 and 8.6 months for new and existing homes, respectively, according to the National Association of Realtors and a joint release from the U.S. Census Bureau and the U.S. Department of Housing and Urban Development. The new year brought more disappointing news: Existing home sales fell in January 2011 after three months of sustained improvement. Tight credit and weak appraisals were cited as possible reasons for the decline.
Reports from the business side of the economy were generally positive. A key measure of the nation’s manufacturing situation — the Institute for Supply Management’s Index — took a somewhat surprising turn higher in the final months of the period. Technology spending rose 12% in 2010, according to the NPD Group, a national marketing research firm. Purchases of computers, networking and software returned to prerecession levels. Industrial production rose over the period, and manufacturing capacity utilized, per the report issued by the Fed — a key measure of the health of the manufacturing sector — edged higher.
2
Economic Update (continued) – Columbia Select Large Cap Growth Fund
Stocks moved higher despite summer 2010 decline
Against a strengthening economic backdrop, stock prices continued to rally despite a summer 2010 setback linked to a debt crisis brewing in Europe, which raised concerns among U.S. investors. These fears were short-lived and stocks regained their footing. In this environment, the S&P 500 Index1 returned 15.65% for the 12 months through March 31, 2011. Outside the United States, stock markets also delivered solid gains. The MSCI EAFE Index (Net),2 a broad gauge of stock market performance in foreign developed markets, returned 10.42% (in U.S. dollars) for the 12-month period, as concerns about the impact of a bailout for weak euro zone economies eased yet continued to restrain market performance. Emerging stock markets were strong. The MSCI Emerging Markets Index (Net)3 returned 18.46% (in U.S. dollars) for the 12-month period.
Bonds delivered modest returns
As the economy strengthened and interest rates edged higher, most bond sectors delivered modest returns. The Barclays Capital Aggregate Bond Index4 returned 5.12%. High-yield bonds led the fixed-income markets. For the 12 months covered by this report, the JPMorgan Developed BB High Yield Index5 returned 13.04% as default fears abated and investors grew more comfortable with risk. Despite rising yields in the second half of the period, the Treasury market was also positive. The Barclays Capital U.S. Treasury Index6 returned 4.53%. However, municipal bonds struggled in the second half of the period, as interest rates inched higher and issue supply surged ahead of the year-end expiration of the Build America Bonds program. The Barclays Capital Municipal Bond Index7 gained 1.63% for the period. Despite positive economic activity, the Fed kept a key short-term interest rate — the federal funds rate — close to zero, reflecting ongoing concerns about employment and the housing market.
Past performance is no guarantee of future results.
| 1 | The Standard & Poor’s (S&P) 500 Index tracks the performance of 500 widely held, large-capitalization U.S. stocks. |
| 2 | The Morgan Stanley Capital International Europe, Australasia, Far East (MSCI EAFE) Index (Net) is a free float- adjusted market capitalization index that is designed to measure the equity market performance of developed markets, excluding the U.S. & Canada. As of December 31, 2010, the MSCI EAFE Index (Net) consisted of the following 22 developed market country indices: Australia, Austria, Belgium, Denmark, Finland, France, Germany, Greece, Hong Kong, Ireland, Israel, Italy, Japan, the Netherlands, New Zealand, Norway, Portugal, Singapore, Spain, Sweden, Switzerland and the United Kingdom. |
| 3 | The Morgan Stanley Capital International Emerging Markets (MSCI EM) Index (Net) is a free float-adjusted market capitalization index that is designed to measure equity market performance of emerging markets. As of December 31, 2010, the MSCI EM Index (Net) consisted of the following 21 emerging market country indices: Brazil, Chile, China, Colombia, Czech Republic, Egypt, Hungary, India, Indonesia, Korea, Malaysia, Mexico, Morocco, Peru, Philippines, Poland, Russia, South Africa, Taiwan, Thailand and Turkey. |
| 4 | The Barclays Capital Aggregate Bond Index is a market value-weighted index that tracks the daily price, coupon, pay-downs and total return performance of fixed-rate, publicly placed, dollar-denominated and non-convertible investment grade debt issues with at least $250 million par amount outstanding and with at least one year to final maturity. |
| 5 | The JPMorgan Developed BB High Yield Index is an unmanaged index designed to mirror the investable universe of the U.S. dollar developed, BB-rated, high yield corporate debt market. |
| 6 | The Barclays Capital U.S. Treasury Index includes public obligations of the U.S. Treasury. Treasury bills are excluded by the maturity constraint. In addition, certain special issues, such as state and local government series bonds (SLGs), as well as U.S.Treasury TIPS, are excluded. STRIPS are excluded from the index because their inclusion would result in double-counting. |
| 7 | The Barclays Capital Municipal Bond Index is considered representative of the broad market for investment-grade, tax-exempt bonds with a maturity of at least one year. |
Indices are not available for investment, are not professionally managed and do not reflect sales charges, fees, brokerage commissions, taxes or other expenses of investing. Securities in the fund may not match those in an index.
3
Performance Information – Columbia Select Large Cap Growth Fund
Performance data quoted represents past performance and current performance may be lower or higher. Past performance is no guarantee of future results. The investment return and principal value will fluctuate so that shares, when redeemed, may be worth more or less than the original cost. Please visit www.columbiamanagement.com for daily and most recent month-end performance updates.
| | | | |
| Net asset value per share | |
| |
as of 03/31/11 ($) | | | | |
Class A | | | 13.63 | |
Class C | | | 13.28 | |
Class I | | | 13.75 | |
Class R | | | 13.28 | |
Class W | | | 13.63 | |
Class Z | | | 13.74 | |
|
| Performance of a $10,000 investment 04/01/01 – 03/31/11 |
The chart above shows the change in value of a hypothetical $10,000 investment in Class A shares of Columbia Select Large Cap Growth Fund during the stated time period, and does not reflect the deduction of taxes that a shareholder may pay on fund distributions or on the redemption of fund shares.
| | | | | | | | |
| Performance of a $10,000 investment 04/01/01 – 03/31/11 ($) | |
| | |
| Sales charge | | without | | | with | |
Class A | | | 13,549 | | | | 12,774 | |
Class C | | | 13,201 | | | | 13,201 | |
Class I | | | n/a | | | | n/a | |
Class R | | | 13,201 | | | | n/a | |
Class W | | | n/a | | | | n/a | |
Class Z | | | 13,658 | | | | n/a | |
| | | | | | | | | | | | | | | | | | | | | | | | | | | | | | | | |
| Average annual total return as of 03/31/11 (%) | |
| | | | | | |
| Share class | | A | | | C | | | I | | | R | | | W | | | Z | |
| Inception | | 09/28/07 | | | 09/28/07 | | | 09/27/10 | | | 12/31/04 | | | 09/27/10 | | | 10/01/97 | |
| Sales charge | | without | | | with | | | without | | | with | | | without | | | without | | | without | | | without | |
1-year | | | 28.58 | | | | 21.16 | | | | 27.69 | | | | 26.69 | | | | n/a | | | | 28.31 | | | | n/a | | | | 29.01 | |
5-year | | | 6.58 | | | | 5.34 | | | | 6.03 | | | | 6.03 | | | | n/a | | | | 6.22 | | | | n/a | | | | 6.75 | |
10-year/Life | | | 3.08 | | | | 2.48 | | | | 2.82 | | | | 2.82 | | | | 22.44 | | | | 2.82 | | | | 22.13 | | | | 3.17 | |
The “with sales charge” returns include the maximum initial sales charge of 5.75% for Class A shares and the applicable contingent deferred sales charge of 1.00% for Class C shares for the first year only. The “without sales charge” returns do not include the effect of sales charges. If they had, returns would be lower.
The Fund commenced operations on March 31, 2008. The returns of Class A and Class C shares shown for periods prior to March 31, 2008 include the returns of Class A shares or Class C shares, as applicable, of Large Cap Growth Fund, the predecessor to the Fund and a series of Excelsior Funds, Inc. (the “Predecessor Fund”), for periods after September 27, 2007, and also include the returns of Shares class shares of the Predecessor Fund for periods prior to September 28, 2007. The returns shown reflect applicable sales charges, but have not been adjusted to reflect differences in expenses. If differences in expenses had been reflected, the returns shown for the periods prior to September 28, 2007 would have been lower. The returns of the Class R shares shown for periods prior to March 31, 2008 include the returns of Retirement Shares class shares of the Predecessor Fund for periods after December 30, 2004, and include the returns of Shares class shares of the Predecessor Fund for periods prior to December 31, 2004. The returns shown reflect that Class R shares are sold without sales charges, but have not been adjusted to reflect differences in expenses. If differences in expenses had been reflected, the returns shown for periods prior to March 31, 2008 would have been lower. The returns of Class Z shares shown for periods prior to March 31, 2008 are those of the Shares class shares of the Predecessor Fund. The returns of Class Z shares shown have not been adjusted to reflect differences in expenses.
Performance results reflect any fee waivers or reimbursements of fund expenses by the Investment Manager and/or any of its affiliates. Absent these fee waivers or expense reimbursement arrangements, performance results would have been lower.
All results shown assume reinvestment of distributions. Class I and Class Z shares are sold at net asset value with no distribution and service (Rule 12b-1) fees. Class R shares are sold at net asset value with a distribution (Rule 12b-1) fee. Class W shares are sold at net asset value with a service (Rule 12b-1) fee. Class I, Class R, Class W and Class Z shares have limited eligibility and the investment minimum requirements may vary. Please see the fund’s prospectuses for details. Performance for different share classes will vary based on differences in sales charges and fees associated with each class.
Class I and Class W shares were initially offered on September 27, 2010.
The tables do not reflect the deduction of taxes that a shareholder may pay on fund distributions or on the redemption of fund shares.
4
Understanding Your Expenses – Columbia Select Large Cap Growth Fund
Estimating your actual expenses
To estimate the expenses that you paid over the period, first you will need your account balance at the end of the period:
| | n | | For shareholders who receive their account statements from Columbia Management Investment Services Corp., your account balance is available online at www.columbiamanagement.com or by calling Shareholder Services at 800.345.6611. | |
| | n | | For shareholders who receive their account statements from their financial intermediary, contact your financial intermediary to obtain your account balance. | |
| | 1. | Divide your ending account balance by $1,000. For example, if an account balance was $8,600 at the end of the period, the result would be 8.6. | |
| | 2. | In the section of the table below titled “Expenses paid during the period,” locate the amount for your share class. You will find this number in the column labeled “Actual.” Multiply this number by the result from step 1. Your answer is an estimate of the expenses you paid on your account during the period. | |
If the value of your account falls below the minimum initial investment requirement applicable to you, your account may be subject to a $20 annual fee. This fee is not included in the accompanying table. If you are subject to the fee, keep it in mind when you are estimating the ongoing expenses of investing in the fund and when comparing the expenses of this fund with other funds.
As a fund shareholder, you incur two types of costs. There are transaction costs and ongoing costs, which generally include investment advisory fees, distribution and service (Rule 12b-1) fees and other fund expenses. The information on this page is intended to help you understand the ongoing costs of investing in the fund and to compare these costs with the ongoing costs of investing in other mutual funds.
Analyzing your fund’s expenses by share class
To illustrate these ongoing costs, we have provided an example and calculated the expenses paid by investors in each share class during the period. The information in the following table is based on an initial investment of $1,000, which is invested at the beginning of the period and held for the entire period. Expense information is calculated two ways and each method provides you with different information. The amount listed in the “Actual” column is calculated using the fund’s actual operating expenses and total return for the period. The amount listed in the “Hypothetical” column for each share class assumes that the return each year is 5% before expenses and is calculated based on the fund’s actual operating expenses. You should not use the hypothetical account values and expenses to estimate either your actual account balance at the end of the period or the expenses you paid during this period.
Compare with other funds
Since all mutual funds are required to include the same hypothetical calculations about expenses in shareholder reports, you can use this information to compare the ongoing costs of investing in the fund with other funds. To do so, compare the 5% hypothetical example with the 5% hypothetical examples that appear in the shareholder reports of other funds. As you compare hypothetical examples of other funds, it is important to note that hypothetical examples are meant to highlight the ongoing costs of investing in a fund and do not reflect any transaction costs, such as sales charges, redemption fees or exchange fees.
| | | | | | | | | | | | | | | | | | | | | | | | | | | | |
| 10/01/10 – 03/31/11 | | | | | | | | | | | | | | | | |
| | | Account value at the
beginning of the period ($) | | | Account value at the
end of the period ($) | | | Expenses paid
during the period ($) | | | Fund’s annualized
expense ratio (%) | |
| | | Actual | | | Hypothetical | | | Actual | | | Hypothetical | | | Actual | | | Hypothetical | | | Actual | |
Class A | | | 1,000.00 | | | | 1,000.00 | | | | 1,220.20 | | | | 1,018.70 | | | | 6.92 | | | | 6.29 | | | | 1.25 | |
Class C | | | 1,000.00 | | | | 1,000.00 | | | | 1,217.20 | | | | 1,014.96 | | | | 11.06 | | | | 10.05 | | | | 2.00 | |
Class I | | | 1,000.00 | | | | 1,000.00 | | | | 1,223.30 | | | | 1,019.79 | | | | 5.72 | | | | 5.20 | | | | 1.03 | |
Class R | | | 1,000.00 | | | | 1,000.00 | | | | 1,219.50 | | | | 1,017.45 | | | | 8.30 | | | | 7.54 | | | | 1.50 | |
Class W | | | 1,000.00 | | | | 1,000.00 | | | | 1,220.20 | | | | 1,018.34 | | | | 7.32 | | | | 6.66 | | | | 1.32 | |
Class Z | | | 1,000.00 | | | | 1,000.00 | | | | 1,222.40 | | | | 1,019.95 | | | | 5.54 | | | | 5.04 | | | | 1.00 | |
Expenses paid during the period are equal to the annualized expense ratio for the share class, multiplied by the average account value over the period, then multiplied by the number of days in the fund’s most recent fiscal half-year and divided by 365.
It is important to note that the expense amounts shown in the table are meant to highlight only ongoing costs of investing in the fund and do not reflect any transaction costs, such as sales charges, redemption fees or exchange fees. Therefore, the hypothetical examples provided may not help you determine the relative total costs of owning shares of different funds. If these transaction costs were included, your costs would have been higher.
5
Portfolio Managers’ Report – Columbia Select Large Cap Growth Fund
For the 12-month period that ended March 31, 2011, the fund’s Class A shares returned 28.58% without sales charge. The fund solidly outperformed both its benchmark, the Russell 1000 Growth Index, which returned 18.26%, and the 16.06% average return of the funds in its peer group, the Lipper Large-Cap Growth Funds Classification.
Stock selection in technology and consumer discretionary drove results
Stock selection in the information technology and consumer discretionary sectors buoyed the fund’s results relative to the benchmark. In technology, the Chinese-language Internet search engine Baidu (4.7% of net assets) rose solidly, as it continued to link the growing middle class of Chinese consumers to thousands of businesses, essentially providing a window to China’s economy. Data storage provider EMC (4.0% of net assets) also contributed to the sector’s strong returns, with a growing number of companies transitioning to cloud computing, which requires a substantial IT infrastructure. Akamai Technologies, which is best known for accelerating web content delivery, was a strong contributor as well. Akamai Technologies benefited from the increased consumption of online videos, which requires a significant amount of bandwidth for viewing. The position was sold by period end due to concerns about the company’s potential need to increase capital spending to keep pace with network traffic growth, as well as pricing pressure from competitors.
Several stocks in the consumer discretionary sector also proved advantageous. Priceline.com (3.6% of net assets) gained as the online travel company reported solid earnings and a favorable outlook, driven by strong international reservations. NetFlix (4.4% of net assets), the Internet subscription service that offers on-demand, Internet-streaming video and video rentals, also surged. The company increased its market share through its key partnerships with video-game consoles and mobile devices, which made NetFlix’s service more readily available to its customers. Finally, Amazon.com (4.8% of net assets) benefited from an upswing in e-commerce, which continued to gain market share as a percentage of total retail sales. Amazon.com also solidly executed its business plan and took market share from its e-commerce competitors.
Stock picks in energy and financials temper performance
Stock selection in energy and financials detracted from relative performance. An overweight in health care and an underweight in industrials also held back the fund’s returns. In energy, natural gas and oil producer EOG Resources (3.0% of net assets) suffered as it lowered its projected production volumes and natural gas prices remained depressed. The fund maintained its position in the stock, as we believe the company will eventually benefit from its plan to shift its focus from natural gas to oil, even though the transition is occurring at a slower pace than the company expected.
Futures and options exchange operator CME Group was the top detractor among the fund’s financials holdings. Due to increased concerns about competition and regulation resulting from industry consolidation, as well as muted trading volume growth, this stock was sold during the period. Asset manager T. Rowe Price Group also detracted from returns. We sold the stock to fund a position in another asset manager, Franklin Resources (4.1% of net assets), which we believe oversees a more diverse asset mix and maintains a broader international presence.
Performance data quoted represents past performance and current performance may be lower or higher. Past performance is no guarantee of future results. The investment return and principal value will fluctuate so that shares, when redeemed, may be worth more or less than the original cost. Please visit www.columbiamanagement.com for daily and most recent month-end performance updates.
| | | | |
| Top 10 Holdings | |
| |
as of 03/31/11 (%) | | | | |
Amazon.com | | | 4.8 | |
Baidu | | | 4.7 | |
NetFlix | | | 4.4 | |
Cognizant Technology Solutions | | | 4.4 | |
Salesforce.com | | | 4.3 | |
Franklin Resources | | | 4.1 | |
Chipotle Mexican Grill | | | 4.1 | |
QUALCOMM | | | 4.0 | |
EMC | | | 4.0 | |
Precision Castparts | | | 3.9 | |
| | | | |
| Top 5 Sectors | |
| |
as of 03/31/11 (%) | | | | |
Information Technology | | | 31.9 | |
Health Care | | | 21.1 | |
Consumer Discretionary | | | 19.0 | |
Industrials | | | 9.1 | |
Energy | | | 6.6 | |
The fund is actively managed and the composition of its portfolio will change over time. Information provided is calculated as a percentage of net assets.
6
Portfolio Managers’ Report (continued) – Columbia Select Large Cap Growth Fund
Looking ahead
After the recent economic downturn, companies cut costs to improve their earnings. This strategy was initially effective for many companies. However, they must now find new ways to generate earnings. While the investment environment remains challenging in light of sluggish growth and higher costs, we do believe there are solid investment opportunities to be had.
We believe that innovative companies with high levels of research and development that drive product cycles and invest in sales and distribution channels should be able to gain a competitive advantage. While there may not be hundreds of such companies, we believe there are enough to amplify the portfolio. Specifically, we are focusing our research efforts in technology, which should benefit from companies looking to increase productivity. Health care is also an area of interest, as the baby boomer generation ages and health care costs rise.
Portfolio characteristics and holdings are subject to change periodically and may not be representative of current holdings and characteristics. The outlook for the fund may differ from that presented for other Columbia Funds.
Equity securities are affected by stock market fluctuations that occur in response to economic and business developments.
Investing in growth stocks incurs the possibility of losses because their prices are sensitive to changes in current or expected earnings.
7
Investment Portfolio – Columbia Select Large Cap Growth Fund
March 31, 2011
Common Stocks – 97.9%
| | | | | | | | |
| | | Shares | | | Value ($) | |
| Consumer Discretionary – 19.0% | | | | | | | | |
| Hotels, Restaurants & Leisure – 4.1% | |
Chipotle Mexican Grill, Inc. (a) | | | 712,290 | | | | 194,006,427 | |
| | | | | | | | |
Hotels, Restaurants & Leisure Total | | | | | | | 194,006,427 | |
| | |
| Internet & Catalog Retail – 12.8% | | | | | | | | |
Amazon.com, Inc. (a) | | | 1,263,855 | | | | 227,658,201 | |
NetFlix, Inc. (a) | | | 884,610 | | | | 209,944,492 | |
priceline.com, Inc. (a) | | | 342,575 | | | | 173,493,683 | |
| | | | | | | | |
Internet & Catalog Retail Total | | | | | | | 611,096,376 | |
| |
| Textiles, Apparel & Luxury Goods – 2.1% | | | | | |
Lululemon Athletica, Inc. (a) | | | 1,146,636 | | | | 102,107,936 | |
| | | | | | | | |
Textiles, Apparel & Luxury Goods Total | | | | 102,107,936 | |
| | | | | | | | |
Consumer Discretionary Total | | | | | | | 907,210,739 | |
| | | | | | | | |
| Consumer Staples – 2.9% | | | | | | | | |
| Personal Products – 2.9% | | | | | | | | |
Estée Lauder Companies, Inc., Class A | | | 1,450,300 | | | | 139,750,908 | |
| | | | | | | | |
Personal Products Total | | | | | | | 139,750,908 | |
| | | | | | | | |
Consumer Staples Total | | | | | | | 139,750,908 | |
| | | | | | | | |
| Energy – 6.6% | | | | | | | | |
| Energy Equipment & Services – 3.6% | | | | | |
FMC Technologies, Inc. (a) | | | 1,826,689 | | | | 172,585,577 | |
| | | | | | | | |
Energy Equipment & Services Total | | | | | | | 172,585,577 | |
| |
| Oil, Gas & Consumable Fuels – 3.0% | | | | | |
EOG Resources, Inc. | | | 1,212,030 | | | | 143,637,675 | |
| | | | | | | | |
Oil, Gas & Consumable Fuels Total | | | | | | | 143,637,675 | |
| | | | | | | | |
Energy Total | | | | | | | 316,223,252 | |
| | | | | | | | |
| Financials – 4.1% | | | | | | | | |
| Capital Markets – 4.1% | | | | | | | | |
Franklin Resources, Inc. | | | 1,576,200 | | | | 197,151,096 | |
| | | | | | | | |
Capital Markets Total | | | | | | | 197,151,096 | |
| | | | | | | | |
Financials Total | | | | | | | 197,151,096 | |
| | | | | | | | |
| Health Care – 21.1% | | | | | | | | |
| Biotechnology – 5.8% | | | | | | | | |
Alexion Pharmaceuticals, Inc. (a) | | | 1,116,630 | | | | 110,189,049 | |
Celgene Corp. (a) | | | 2,931,540 | | | | 168,651,496 | |
| | | | | | | | |
Biotechnology Total | | | | | | | 278,840,545 | |
| | | | | | | | |
| | | Shares | | | Value ($) | |
| Health Care Equipment & Supplies – 3.0% | |
St. Jude Medical, Inc. | | | 2,820,540 | | | | 144,580,880 | |
| | | | | | | | |
Health Care Equipment & Supplies Total | | | | 144,580,880 | |
|
| Health Care Providers & Services – 2.9% | |
Medco Health Solutions, Inc. (a) | | | 2,444,101 | | | | 137,260,712 | |
| | | | | | | | |
Health Care Providers & Services Total | | | | 137,260,712 | |
|
| Life Sciences Tools & Services – 2.0% | |
QIAGEN N.V. (a) | | | 4,763,791 | | | | 95,514,009 | |
| | | | | | | | |
Life Sciences Tools & Services Total | | | | 95,514,009 | |
| | |
| Pharmaceuticals – 7.4% | | | | | | | | |
Allergan, Inc. | | | 2,544,330 | | | | 180,698,317 | |
Novo Nordisk A/S, ADR | | | 1,394,057 | | | | 174,577,758 | |
| | | | | | | | |
Pharmaceuticals Total | | | | | | | 355,276,075 | |
| | | | | | | | |
Health Care Total | | | | | | | 1,011,472,221 | |
| | | | | | | | |
| Industrials – 9.1% | | | | | | | | |
| Aerospace & Defense – 3.9% | | | | | |
Precision Castparts Corp. | | | 1,265,220 | | | | 186,215,079 | |
| | | | | | | | |
Aerospace & Defense Total | | | | | | | 186,215,079 | |
| |
| Air Freight & Logistics – 5.2% | | | | | |
C.H. Robinson Worldwide, Inc. | | | 1,513,960 | | | | 112,229,855 | |
Expeditors International of Washington, Inc. | | | 2,708,513 | | | | 135,804,842 | |
| | | | | | | | |
Air Freight & Logistics Total | | | | | | | 248,034,697 | |
| | | | | | | | |
Industrials Total | | | | | | | 434,249,776 | |
| | | | | | | | |
| Information Technology – 31.9% | | | | | |
| Communications Equipment – 10.8% | | | | | |
F5 Networks, Inc. (a) | | | 1,775,849 | | | | 182,148,832 | |
Juniper Networks, Inc. (a) | | | 3,348,685 | | | | 140,912,665 | |
QUALCOMM, Inc. | | | 3,503,850 | | | | 192,116,095 | |
| | | | | | | | |
Communications Equipment Total | | | | | | | 515,177,592 | |
| |
| Computers & Peripherals – 4.0% | | | | | |
EMC Corp. (a) | | | 7,138,380 | | | | 189,523,989 | |
| | | | | | | | |
Computers & Peripherals Total | | | | | | | 189,523,989 | |
| |
| Internet Software & Services – 8.4% | | | | | |
Baidu, Inc., ADR (a) | | | 1,632,650 | | | | 224,995,497 | |
Google, Inc., Class A (a) | | | 304,149 | | | | 178,295,185 | |
| | | | | | | | |
Internet Software & Services Total | | | | | | | 403,290,682 | |
See Accompanying Notes to Financial Statements.
8
Columbia Select Large Cap Growth Fund
March 31, 2011
Common Stocks (continued)
| | | | | | | | |
| | | Shares | | | Value ($) | |
| Information Technology (continued) | |
| IT Services – 4.4% | | | | | | | | |
Cognizant Technology Solutions Corp., Class A (a) | | | 2,571,730 | | | | 209,338,822 | |
| | | | | | | | |
IT Services Total | | | | | | | 209,338,822 | |
| | |
| Software – 4.3% | | | | | | | | |
Salesforce.com, Inc. (a) | | | 1,551,600 | | | | 207,262,728 | |
| |
Software Total | | | | | | | 207,262,728 | |
| |
Information Technology Total | | | | 1,524,593,813 | |
| | | | | | | | |
| Materials – 3.2% | | | | | | | | |
| Chemicals – 3.2% | | | | | | | | |
Praxair, Inc. | | | 1,483,763 | | | | 150,750,321 | |
| |
Chemicals Total | | | | | | | 150,750,321 | |
| |
Materials Total | | | | | | | 150,750,321 | |
| |
Total Common Stocks
(cost of $3,690,942,264) | | | | 4,681,402,126 | |
| |
Short-Term Obligation – 3.7% | | | | | |
| | | Par ($) | | | | |
Repurchase agreement with Fixed Income Clearing Corp., dated 03/31/11, due 04/01/11 at 0.070%, collateralized by a U.S. Government Agency obligation maturing 10/15/14, market value $182,606,775 (repurchase proceeds $179,026,348) | | | 179,026,000 | | | | 179,026,000 | |
| |
Total Short-Term Obligation
(cost of $179,026,000) | | | | 179,026,000 | |
| |
Total Investments – 101.6%
(cost of $3,869,968,264) (b) | | | | 4,860,428,126 | |
| |
Other Assets & Liabilities, Net – (1.6)% | | | | (78,604,096 | ) |
| |
Net Assets – 100.0% | | | | | | | 4,781,824,030 | |
Notes to Investment Portfolio:
| (a) | Non-income producing security. |
| (b) | Cost for federal income tax purposes is $3,875,561,122. |
Generally accepted accounting principles (GAAP) require disclosure regarding the inputs and valuation techniques used to measure fair value and any changes in valuation inputs or techniques. In addition, investments shall be disclosed by major category.
The Fund categorizes its fair value measurements according to a three-level hierarchy that maximizes the use of observable inputs and minimizes the use of unobservable inputs by prioritizing that the most observable input be used when available. Observable inputs are those that market participants would use in pricing an investment based on market data obtained from sources independent of the reporting entity. Unobservable inputs are those that reflect the Fund’s assumptions about the information market participants would use in pricing an investment. An investment’s level within the fair value hierarchy is based on the lowest level of any input that is deemed significant to the asset or liability’s fair value measurement. The input levels are not necessarily an indication of the risk or liquidity associated with investments at that level. For example, certain U.S. government securities are generally high quality and liquid, however, they are reflected as Level 2 because the inputs used to determine fair value may not always be quoted prices in an active market.
Fair value inputs are summarized in the three broad levels listed below:
| • | | Level 1 — Valuations based on quoted prices for investments in active markets that the Fund has the ability to access at the measurement date (including NAV for open-end mutual funds). Valuation adjustments are not applied to Level 1 investments. |
| • | | Level 2 — Valuations based on other significant observable inputs (including quoted prices for similar securities, interest rates, prepayment speeds, credit risks, etc.). |
| • | | Level 3 — Valuations based on significant unobservable inputs (including the Fund’s own assumptions and judgment in determining the fair value of investments). |
Inputs that are used in determining fair value of an investment may include price information, credit data, volatility statistics, and other factors. These inputs can be either observable or unobservable. The availability of observable inputs can vary between investments, and is affected by various factors such as the type of investment, and the volume and level of activity for that investment or similar investments in the marketplace. The inputs will be considered by the Investment Manager, along with any other relevant factors in the calculation of an investment’s fair value. The Fund uses prices and inputs that are current as of the measurement date, which may include periods of market dislocations. During these periods, the availability of prices and inputs may be reduced for many investments. This condition could cause an investment to be reclassified between the various levels within the hierarchy. Non-U.S. equity securities actively traded in foreign markets may be reflected in Level 2 despite the availability of closing prices, because the Fund evaluates and determines whether those closing prices reflect fair value at the close of the New York Stock Exchange (NYSE) or require adjustment, as described in Note 2 to the financial statements — Security Valuation.
Investments falling into the Level 3 category are primarily supported by quoted prices from brokers and dealers participating in the market for those investments. However, these may be classified as Level 3 investments due to lack of market transparency and corroboration to support these quoted prices. Additionally, valuation models may be used as the pricing source for any remaining investments classified as Level 3. These models rely on one or more significant unobservable inputs and/or significant assumptions by the Investment Manager. Inputs used in valuations may include, but are not limited to, financial statement analysis, capital account balances, discount rates and estimated cash flows, and comparable company data.
The following table is a summary of the inputs used to value the Fund’s investments as of March 31, 2011:
| | | | | | | | | | | | | | | | |
Description | | Quoted
Prices
(Level 1) | | | Other
Significant
Observable
Inputs
(Level 2) | | | Significant
Unobservable
Inputs
(Level 3) | | | Total | |
Total Common
Stocks | | $ | 4,681,402,126 | | | $ | — | | | $ | — | | | $ | 4,681,402,126 | |
| | | | | | | | | | | | | | | | |
Total Short-Term Obligation | | | — | | | | 179,026,000 | | | | — | | | | 179,026,000 | |
| | | | | | | | | | | | | | | | |
Total Investments | | $ | 4,681,402,126 | | | $ | 179,026,000 | | | $ | — | | | $ | 4,860,428,126 | |
| | | | | | | | | | | | | | | | |
The Fund’s assets assigned to the Level 2 input category represent certain short-term obligations which are valued using amortized cost, an income approach which
See Accompanying Notes to Financial Statements.
9
Columbia Select Large Cap Growth Fund
March 31, 2011
converts future cash flows to a present value based upon the discount or premium at purchase.
There were no significant transfers of financial assets between Levels 1 and 2 during the period.
At March 31, 2011, the Fund held investments in the following sectors:
| | | | |
Sector (Unaudited) | | % of
Net Assets | |
Information Technology | | | 31.9 | |
Health Care | | | 21.1 | |
Consumer Discretionary | | | 19.0 | |
Industrials | | | 9.1 | |
Energy | | | 6.6 | |
Financials | | | 4.1 | |
Materials | | | 3.2 | |
Consumer Staples | | | 2.9 | |
| | | | |
| | | 97.9 | |
Short-Term Obligation | | | 3.7 | |
Other Assets & Liabilities, Net | | | (1.6 | ) |
| | | | |
| | | 100.0 | |
| | | | |
| | |
Acronym | | Name |
| ADR | | American Depositary Receipt |
See Accompanying Notes to Financial Statements.
10
Statement of Assets and Liabilities – Columbia Select Large Cap Growth Fund
March 31, 2011
| | | | | | |
| | | | | ($) | |
| Assets | | Total investments, at identified cost | | | 3,869,968,264 | |
| | | | | | |
| | Total investments, at value | | | 4,860,428,126 | |
| | Cash | | | 924 | |
| | Receivable for: | | | | |
| | Investments sold | | | 24,935,856 | |
| | Fund shares sold | | | 15,337,651 | |
| | Dividends | | | 3,356,360 | |
| | Interest | | | 348 | |
| | Foreign tax reclaims | | | 694,608 | |
| | Trustees’ deferred compensation plan | | | 38,888 | |
| | Prepaid expenses | | | 24,390 | |
| | | | | | |
| | Total Assets | | | 4,904,817,151 | |
| | |
| Liabilities | | Expense reimbursement due to Investment Manager | | | 7,313 | |
| | Payable for: | | | | |
| | Investments purchased | | | 103,269,997 | |
| | Fund shares repurchased | | | 15,428,019 | |
| | Investment advisory fee | | | 2,001,805 | |
| | Administration fee | | | 554,461 | |
| | Pricing and bookkeeping fees | | | 11,747 | |
| | Transfer agent fee | | | 1,084,955 | |
| | Trustees’ fees | | | 1,237 | |
| | Custody fee | | | 10,087 | |
| | Distribution and service fees | | | 265,916 | |
| | Chief compliance officer expenses | | | 796 | |
| | Trustees’ deferred compensation plan | | | 38,888 | |
| | Other liabilities | | | 317,900 | |
| | | | | | |
| | Total Liabilities | | | 122,993,121 | |
| | |
| | | | | | |
| | Net Assets | | | 4,781,824,030 | |
| | |
| Net Assets Consist of | | Paid-in capital | | | 3,717,436,462 | |
| | Accumulated net investment loss | | | (34,097 | ) |
| | Accumulated net realized gain | | | 73,961,803 | |
| | Net unrealized appreciation (depreciation) on investments | | | 990,459,862 | |
| | | | | | |
| | Net Assets | | | 4,781,824,030 | |
See Accompanying Notes to Financial Statements.
11
Statement of Assets and Liabilities (continued) – Columbia Select Large Cap Growth Fund
March 31, 2011
| | | | | | |
| | | | | | |
| Class A | | Net assets | | $ | 1,242,210,588 | |
| | Shares outstanding | | | 91,149,297 | |
| | Net asset value per share | | $ | 13.63 | (a) |
| | Maximum sales charge | | | 5.75 | % |
| | Maximum offering price per share ($13.63/0.9425) | | $ | 14.46 | (b) |
| | |
Class C | | Net assets | | $ | 14,523,004 | |
| | Shares outstanding | | | 1,093,896 | |
| | Net asset value and offering price per share (a) | | $ | 13.28 | |
| | |
Class I (c) | | Net assets | | $ | 126,813,475 | |
| | Shares outstanding | | | 9,221,144 | |
| | Net asset value, offering and redemption price per share | | $ | 13.75 | |
| | |
Class R | | Net assets | | $ | 2,925,645 | |
| | Shares outstanding | | | 220,315 | |
| | Net asset value, offering and redemption price per share | | $ | 13.28 | |
| | |
Class W (c) | | Net assets | | $ | 41,767,991 | |
| | Shares outstanding | | | 3,064,299 | |
| | Net asset value, offering and redemption price per share | | $ | 13.63 | |
| | |
Class Z | | Net assets | | $ | 3,353,583,327 | |
| | Shares outstanding | | | 244,163,037 | |
| | Net asset value, offering and redemption price per share | | $ | 13.74 | |
| (a) | Redemption price per share is equal to net asset value less any applicable contingent deferred sales charge. |
| (b) | On sales of $50,000 or more the offering price is reduced. |
| (c) | Class I and Class W shares commenced operations on September 27, 2010. |
See Accompanying Notes to Financial Statements.
12
Statement of Operations – Columbia Select Large Cap Growth Fund
For the Year Ended March 31, 2011
| | | | | | |
| | | | | ($) (a) | |
| Investment Income | | Dividends | | | 14,749,561 | |
| | Interest | | | 110,720 | |
| | Foreign taxes withheld | | | (412,820 | ) |
| | | | | | |
| | Total Investment Income | | | 14,447,461 | |
| | |
| Expenses | | Investment advisory fee | | | 18,091,873 | |
| | Administration fee | | | 4,688,759 | |
| | Distribution fee: | | | | |
| | Class C | | | 39,111 | |
| | Class R | | | 7,066 | |
| | Service fee: | | | | |
| | Class A | | | 2,038,896 | |
| | Class C | | | 12,954 | |
| | Class W | | | 26,872 | |
| | Transfer agent fee – Class A, Class C, Class R, Class W and Class Z | | | 7,265,787 | |
| | Pricing and bookkeeping fees | | | 140,717 | |
| | Trustees’ fees | | | 99,294 | |
| | Custody fee | | | 96,351 | |
| | Chief compliance officer expenses | | | 3,797 | |
| | Other expenses | | | 1,355,028 | |
| | | | | | |
| | Total Expenses | | | 33,866,505 | |
| | |
| | Expense reductions | | | (384 | ) |
| | | | | | |
| | Net Expenses | | | 33,866,121 | |
| | |
| | | | | | |
| | Net Investment Loss | | | (19,418,660 | ) |
| | |
Net Realized and Unrealized Gain (Loss) on Investments | | Net realized gain on investments | | | 351,743,043 | |
| | Net change in unrealized appreciation (depreciation) on investments | | | 605,481,661 | |
| | | | | | |
| | Net Gain | | | 957,224,704 | |
| | |
| | | | | | |
| | Net Increase Resulting from Operations | | | 937,806,044 | |
| (a) | Class I and Class W shares commenced operations on September 27, 2010. |
See Accompanying Notes to Financial Statements.
13
Statement of Changes in Net Assets – Columbia Select Large Cap Growth Fund
| | | | | | | | | | |
| | | | | Year Ended March 31, | |
| Increase (Decrease) in Net Assets | | | | 2011 ($)(a)(b) | | | 2010 ($) | |
| Operations | | Net investment loss | | | (19,418,660 | ) | | | (5,153,386 | ) |
| | Net realized gain (loss) on investments | | | 351,743,043 | | | | (19,265,914 | ) |
| | Net change in unrealized appreciation (depreciation) on investments | | | 605,481,661 | | | | 567,509,777 | |
| | | | | | | | | | |
| | Net increase resulting from operations | | | 937,806,044 | | | | 543,090,477 | |
| | | |
| | Net Capital Stock Transactions | | | 1,565,789,704 | | | | 917,467,650 | |
| | | | | | | | | | |
| | Total increase in net assets | | | 2,503,595,748 | | | | 1,460,558,127 | |
| | | |
| Net Assets | | Beginning of period | | | 2,278,228,282 | | | | 817,670,155 | |
| | End of period | | | 4,781,824,030 | | | | 2,278,228,282 | |
| | Accumulated net investment loss at end of period | | | (34,097 | ) | | | (17,961 | ) |
| (a) | Class I and Class W shares commenced operations on September 27, 2010. |
| (b) | Class I and Class W shares reflect activity for the period September 27, 2010 through March 31, 2011. |
See Accompanying Notes to Financial Statements.
14
Statement of Changes in Net Assets (continued) – Columbia Select Large Cap Growth Fund
| | | | | | | | | | | | | | | | |
| | | Capital Stock Activity | |
| | | Year Ended
March 31, 2011 | | | Year Ended
March 31, 2010 | |
| | | Shares | | | Dollars ($) | | | Shares | | | Dollars ($) | |
Class A | | | | | | | | | | | | | | | | |
Subscriptions | | | 51,875,646 | | | | 606,878,992 | | | | 47,897,150 | | | | 443,726,537 | |
Redemptions | | | (15,170,970 | ) | | | (176,280,576 | ) | | | (5,418,094 | ) | | | (51,525,015 | ) |
| | | | | | | | | | | | | | | | |
Net increase | | | 36,704,676 | | | | 430,598,416 | | | | 42,479,056 | | | | 392,201,522 | |
| | | | |
Class C | | | | | | | | | | | | | | | | |
Subscriptions | | | 887,774 | | | | 11,066,341 | | | | 261,762 | | | | 2,379,863 | |
Redemptions | | | (104,918 | ) | | | (1,200,978 | ) | | | (60,010 | ) | | | (552,119 | ) |
| | | | | | | | | | | | | | | | |
Net increase | | | 782,856 | | | | 9,865,363 | | | | 201,752 | | | | 1,827,744 | |
| | | | |
Class I (a)(b) | | | | | | | | | | | | | | | | |
Subscriptions | | | 10,005,144 | | | | 131,694,928 | | | | — | | | | — | |
Redemptions | | | (784,000 | ) | | | (10,141,541 | ) | | | — | | | | — | |
| | | | | | | | | | | | | | | | |
Net increase | | | 9,221,144 | | | | 121,553,387 | | | | — | | | | — | |
| | | | |
Class R | | | | | | | | | | | | | | | | |
Subscriptions | | | 244,885 | | | | 2,682,857 | | | | 46,478 | | | | 447,608 | |
Redemptions | | | (63,966 | ) | | | (707,930 | ) | | | (10,458 | ) | | | (104,160 | ) |
| | | | | | | | | | | | | | | | |
Net increase | | | 180,919 | | | | 1,974,927 | | | | 36,020 | | | | 343,448 | |
| | | | |
Class W (a)(b) | | | | | | | | | | | | | | | | |
Subscriptions | | | 3,271,632 | | | | 41,579,863 | | | | — | | | | — | |
Redemptions | | | (207,333 | ) | | | (2,701,188 | ) | | | — | | | | — | |
| | | | | | | | | | | | | | | | |
Net increase | | | 3,064,299 | | | | 38,878,675 | | | | — | | | | — | |
| | | | |
Class Z | | | | | | | | | | | | | | | | |
Subscriptions | | | 123,894,850 | | | | 1,424,613,465 | | | | 83,327,961 | | | | 776,672,199 | |
Redemptions | | | (39,124,601 | ) | | | (461,694,529 | ) | | | (27,391,554 | ) | | | (253,577,263 | ) |
| | | | | | | | | | | | | | | | |
Net increase | | | 84,770,249 | | | | 962,918,936 | | | | 55,936,407 | | | | 523,094,936 | |
| (a) | Class I and Class W shares commenced operations on September 27, 2010. |
| (b) | Class I and Class W shares reflect activity for the period September 27, 2010 through March 31, 2011. |
See Accompanying Notes to Financial Statements.
15
Financial Highlights – Columbia Select Large Cap Growth Fund
Selected data for a share outstanding throughout each period is as follows:
| | | | | | | | | | | | | | | | |
| | | Year Ended March 31, | | | Period Ended
March 31, | |
| Class A Shares | | 2011 | | | 2010 | | | 2009 | | | 2008 (a) | |
Net Asset Value, Beginning of Period | | $ | 10.60 | | | $ | 7.06 | | | $ | 11.30 | | | $ | 12.18 | |
| | | | |
Income from Investment Operations: | | | | | | | | | | | | | | | | |
Net investment loss (b) | | | (0.09 | ) | | | (0.05 | ) | | | (0.06 | ) | | | (0.05 | ) |
Net realized and unrealized gain (loss) on investments | | | 3.12 | | | | 3.59 | | | | (4.18 | ) | | | (0.83 | ) |
| | | | | | | | | | | | | | | | |
Total from investment operations | | | 3.03 | | | | 3.54 | | | | (4.24 | ) | | | (0.88 | ) |
| | | | |
Increase from regulatory settlements | | | — | | | | — | | | | — | (c) | | | — | |
| | | | |
Net Asset Value, End of Period | | $ | 13.63 | | | $ | 10.60 | | | $ | 7.06 | | | $ | 11.30 | |
Total return (d) | | | 28.58 | % | | | 50.14 | % | | | (37.52 | )%(e) | | | (7.22 | )%(e)(f) |
| | | | |
Ratios to Average Net Assets/Supplemental Data: | | | | | | | | | | | | | | | | |
Net expenses before interest expense (g) | | | 1.24 | % | | | 1.26 | % | | | 1.28 | % | | | 1.16 | %(h) |
Interest expense | | | — | | | | — | | | | — | %(i) | | | — | |
Net expenses (g) | | | 1.24 | % | | | 1.26 | % | | | 1.28 | % | | | 1.16 | %(h) |
Waiver/Reimbursement | | | — | | | | — | | | | 0.05 | % | | | 0.05 | %(h) |
Net investment loss (g) | | | (0.79 | )% | | | (0.53 | )% | | | (0.77 | )% | | | (0.92 | )%(h) |
Portfolio turnover rate | | | 71 | % | | | 27 | % | | | 58 | % | | | 39 | %(f) |
Net assets, end of period (000s) | | $ | 1,242,211 | | | $ | 576,956 | | | $ | 84,493 | | | $ | 2,141 | |
| (a) | The Predecessor Fund’s Class A shares commenced operations on September 28, 2007. Per share data and total return reflect activity from that date. |
| (b) | Per share data was calculated using the average shares outstanding during the period. |
| (c) | Rounds to less than $0.01 per share. |
| (d) | Total return at net asset value assuming all distributions reinvested and no initial sales charge or contingent deferred sales charge. |
| (e) | Had the Investment Manager and/or any of its affiliates not waived fees or reimbursed a portion of expenses, total return would have been reduced. |
| (g) | The benefits derived from expense reductions had an impact of less than 0.01%. |
| (i) | Rounds to less than 0.01%. |
See Accompanying Notes to Financial Statements.
16
Financial Highlights – Columbia Select Large Cap Growth Fund
Selected data for a share outstanding throughout each period is as follows:
| | | | | | | | | | | | | | | | |
| | | Year Ended March 31, | | | Period Ended
March 31, | |
| Class C Shares | | 2011 | | | 2010 | | | 2009 | | | 2008 (a) | |
Net Asset Value, Beginning of Period | | $ | 10.40 | | | $ | 6.98 | | | $ | 11.26 | | | $ | 12.18 | |
| | | | |
Income from Investment Operations: | | | | | | | | | | | | | | | | |
Net investment loss (b) | | | (0.17 | ) | | | (0.12 | ) | | | (0.12 | ) | | | (0.09 | ) |
Net realized and unrealized gain (loss) on investments | | | 3.05 | | | | 3.54 | | | | (4.16 | ) | | | (0.83 | ) |
| | | | | | | | | | | | | | | | |
Total from investment operations | | | 2.88 | | | | 3.42 | | | | (4.28 | ) | | | (0.92 | ) |
| | | | |
Increase from regulatory settlements | | | — | | | | — | | | | — | (c) | | | — | |
| | | | |
Net Asset Value, End of Period | | $ | 13.28 | | | $ | 10.40 | | | $ | 6.98 | | | $ | 11.26 | |
Total return (d) | | | 27.69 | % | | | 49.00 | % | | | (38.01 | )%(e) | | | (7.55 | )%(e)(f) |
| | | | |
Ratios to Average Net Assets/Supplemental Data: | | | | | | | | | | | | | | | | |
Net expenses before interest expense (g) | | | 1.99 | % | | | 2.01 | % | | | 2.03 | % | | | 1.91 | %(h) |
Interest expense | | | — | | | | — | | | | — | %(i) | | | — | |
Net expenses (g) | | | 1.99 | % | | | 2.01 | % | | | 2.03 | % | | | 1.91 | %(h) |
Waiver/Reimbursement | | | — | | | | — | | | | 0.05 | % | | | 0.05 | %(h) |
Net investment loss (g) | | | (1.49 | )% | | | (1.27 | )% | | | (1.37 | )% | | | (1.59 | )%(h) |
Portfolio turnover rate | | | 71 | % | | | 27 | % | | | 58 | % | | | 39 | %(f) |
Net assets, end of period (000s) | | $ | 14,523 | | | $ | 3,234 | | | $ | 763 | | | $ | 238 | |
| (a) | The Predecessor Fund’s Class C shares commenced operations on September 28, 2007. Per share data and total return reflect activity from that date. |
| (b) | Per share data was calculated using the average shares outstanding during the period. |
| (c) | Rounds to less than $0.01 per share. |
| (d) | Total return at net asset value assuming all distributions reinvested and no contingent deferred sales charge. |
| (e) | Had the Investment Manager and/or any of its affiliates not waived fees or reimbursed a portion of expenses, total return would have been reduced. |
| (g) | The benefits derived from expense reductions had an impact of less than 0.01%. |
| (i) | Rounds to less than 0.01%. |
See Accompanying Notes to Financial Statements.
17
Financial Highlights – Columbia Select Large Cap Growth Fund
Selected data for a share outstanding throughout the period is as follows:
| | | | |
| Class I Shares | | Period Ended
March 31,
2011 (a) | |
Net Asset Value, Beginning of Period | | $ | 11.23 | |
| |
Income from Investment Operations: | | | | |
Net investment loss (b) | | | (0.01 | ) |
Net realized and unrealized gain on investments | | | 2.53 | |
| | | | |
Total from investment operations | | | 2.52 | |
| |
Net Asset Value, End of Period | | $ | 13.75 | |
Total return (c)(d) | | | 22.44 | % |
| |
Ratios to Average Net Assets/Supplemental Data: | | | | |
Net expenses (e)(f) | | | 0.76 | % |
Net investment loss (e)(f) | | | (0.18 | )% |
Portfolio turnover rate (d) | | | 71 | % |
Net assets, end of period (000s) | | $ | 126,813 | |
| (a) | Class I shares commenced operations on September 27, 2010. Per share data and total return reflect activity from that date. |
| (b) | Per share data was calculated using the average shares outstanding during the period. |
| (c) | Total return at net asset value. |
| (e) | The benefits derived from expense reductions had an impact of less than 0.01%. |
| (g) | Rounds to less than 0.01%. |
See Accompanying Notes to Financial Statements.
18
Financial Highlights – Columbia Select Large Cap Growth Fund
Selected data for a share outstanding throughout each period is as follows:
| | | | | | | | | | | | | | | | | | | | |
| | | Year Ended March 31, | |
| Class R Shares | | 2011 | | | 2010 | | | 2009 | | | 2008 (a) | | | 2007 | |
Net Asset Value, Beginning of Period | | $ | 10.35 | | | $ | 6.91 | | | $ | 11.09 | | | $ | 10.45 | | | $ | 9.82 | |
| | | | | |
Income from Investment Operations: | | | | | | | | | | | | | | | | | | | | |
Net investment loss (b) | | | (0.12 | ) | | | (0.07 | ) | | | (0.07 | ) | | | (0.14 | ) | | | (0.12 | ) |
Net realized and unrealized gain (loss) on investments | | | 3.05 | | | | 3.51 | | | | (4.11 | ) | | | 0.78 | | | | 0.75 | |
| | | | | | | | | | | | | | | | | | | | |
Total from investment operations | | | 2.93 | | | | 3.44 | | | | (4.18 | ) | | | 0.64 | | | | 0.63 | |
| | | | | |
Increase from regulatory settlements | | | — | | | | — | | | | — | (c) | | | — | | | | — | |
| | | | | |
Net Asset Value, End of Period | | $ | 13.28 | | | $ | 10.35 | | | $ | 6.91 | | | $ | 11.09 | | | $ | 10.45 | |
Total return (d) | | | 28.31 | % | | | 49.78 | % | | | (37.69 | )%(e) | | | 6.12 | %(e) | | | 6.42 | %(e) |
| | | | | |
Ratios to Average Net Assets/Supplemental Data: | | | | | | | | | | | | | | | | | | | | |
Net expenses before interest expense (f) | | | 1.49 | % | | | 1.51 | % | | | 1.53 | % | | | 1.66 | % | | | 1.69 | % |
Interest expense | | | — | | | | — | | | | — | %(g) | | | — | | | | — | |
Net expenses (f) | | | 1.49 | % | | | 1.51 | % | | | 1.53 | % | | | 1.66 | % | | | 1.69 | % |
Waiver/Reimbursement | | | — | | | | — | | | | 0.05 | % | | | 0.04 | % | | | 0.01 | % |
Net investment loss (f) | | | (1.03 | )% | | | (0.71 | )% | | | (0.80 | )% | | | (1.22 | )% | | | (1.18 | )% |
Portfolio turnover rate | | | 71 | % | | | 27 | % | | | 58 | % | | | 39 | % | | | 33 | % |
Net assets, end of period (000s) | | $ | 2,926 | | | $ | 408 | | | $ | 23 | | | $ | 22 | | | $ | 3 | |
| (a) | On March 31, 2008, Retirement Shares class of Large Cap Growth Fund, a series of Excelsior Funds, Inc., was reorganized into the Fund’s Class R shares. The financial information of the Fund’s Class R shares includes the financial information of Large Cap Growth Fund’s Retirement Shares class. |
| (b) | Per share data was calculated using the average shares outstanding during the period. |
| (c) | Rounds to less than $0.01 per share. |
| (d) | Total return at net asset value assuming all distributions reinvested. |
| (e) | Had the Investment Manager and/or any of its affiliates not waived fees or reimbursed a portion of expenses, total return would have been reduced. |
| (f) | The benefits derived from expense reductions had an impact of less than 0.01%. |
| (g) | Rounds to less than 0.01%. |
See Accompanying Notes to Financial Statements.
19
Financial Highlights – Columbia Select Large Cap Growth Fund
Selected data for a share outstanding throughout the period is as follows:
| | | | |
| Class W Shares | | Period Ended
March 31,
2011 (a) | |
Net Asset Value, Beginning of Period | | $ | 11.16 | |
| |
Income from Investment Operations: | | | | |
Net investment loss (b) | | | (0.05 | ) |
Net realized and unrealized gain on investments | | | 2.52 | |
| | | | |
Total from investment operations | | | 2.47 | |
| |
Net Asset Value, End of Period | | $ | 13.63 | |
Total Return (c)(d) | | | 22.13 | % |
| |
Ratios to Average Net Assets/Supplemental Data: | | | | |
Net expenses (e)(f) | | | 1.25 | % |
Net investment loss (e)(f) | | | (0.78 | )% |
Portfolio turnover rate (d) | | | 71 | % |
Net assets, end of period (000s) | | $ | 41,768 | |
| (a) | Class W shares commenced operations on September 27, 2010. Per share data and total return reflect activity from that date. |
| (b) | Per share data was calculated using the average shares outstanding during the period. |
| (c) | Total return at net asset value. |
| (e) | The benefits derived from expense reductions had an impact of less than 0.01%. |
See Accompanying Notes to Financial Statements.
20
Financial Highlights – Columbia Select Large Cap Growth Fund
Selected data for a share outstanding throughout each period is as follows:
| | | | | | | | | | | | | | | | | | | | |
| | | Year Ended March 31, | |
| Class Z Shares | | 2011 | | | 2010 | | | 2009 | | | 2008 (a)(b) | | | 2007 | |
Net Asset Value, Beginning of Period | | $ | 10.65 | | | $ | 7.08 | | | $ | 11.30 | | | $ | 10.60 | | | $ | 9.91 | |
| | | | | |
Income from Investment Operations: | | | | | | | | | | | | | | | | | | | | |
Net investment loss (c) | | | (0.06 | ) | | | (0.03 | ) | | | (0.03 | ) | | | (0.08 | ) | | | (0.07 | ) |
Net realized and unrealized gain (loss) on investments | | | 3.15 | | | | 3.60 | | | | (4.19 | ) | | | 0.78 | | | | 0.76 | |
| | | | | | | | | | | | | | | | | | | | |
Total from investment operations | | | 3.09 | | | | 3.57 | | | | (4.22 | ) | | | 0.70 | | | | 0.69 | |
| | | | | |
Increase from regulatory settlements | | | — | | | | — | | | | — | (d) | | | — | | | | — | |
| | | | | |
Net Asset Value, End of Period | | $ | 13.74 | | | $ | 10.65 | | | $ | 7.08 | | | $ | 11.30 | | | $ | 10.60 | |
Total return (e) | | | 29.01 | % | | | 50.42 | % | | | (37.35 | )%(f) | | | 6.60 | %(f) | | | 6.96 | % |
| | | | | |
Ratios to Average Net Assets/Supplemental Data: | | | | | | | | | | | | | | | | | | | | |
Net expenses before interest expense (g) | | | 0.99 | % | | | 1.01 | % | | | 1.03 | % | | | 1.16 | % | | | 1.20 | % |
Interest expense | | | — | | | | — | | | | — | %(h) | | | — | | | | — | |
Net expenses (g) | | | 0.99 | % | | | 1.01 | % | | | 1.03 | % | | | 1.16 | % | | | 1.20 | % |
Waiver/Reimbursement | | | — | | | | — | | | | 0.05 | % | | | 0.04 | % | | | — | |
Net investment loss (g) | | | (0.54 | )% | | | (0.29 | )% | | | (0.38 | )% | | | (0.69 | )% | | | (0.68 | )% |
Portfolio turnover rate | | | 71 | % | | | 27 | % | | | 58 | % | | | 39 | % | | | 33 | % |
Net assets, end of period (000s) | | $ | 3,353,583 | | | $ | 1,697,630 | | | $ | 732,391 | | | $ | 938,734 | | | $ | 718,424 | |
| (a) | On March 31, 2008, Shares class of Large Cap Growth Fund, a series of Excelsior Funds, Inc., was reorganized into the Fund’s Class Z. The financial information of the Fund’s Class Z includes the financial information of Large Cap Growth Fund’s Shares class. |
| (b) | On March 31, 2008, Large Cap Growth Fund’s Institutional Shares class was reorganized into the Fund’s Class Z. |
| (c) | Per share data was calculated using the average shares outstanding during the period. |
| (d) | Rounds to less than $0.01 per share. |
| (e) | Total return at net asset value assuming all distributions reinvested. |
| (f) | Had the Investment Manager and/or any of its affiliates not waived fees or reimbursed a portion of expenses, total return would have been reduced. |
| (g) | The benefits derived from expense reductions had an impact of less than 0.01%. |
| (h) | Rounds to less than 0.01%. |
See Accompanying Notes to Financial Statements.
21
Notes to Financial Statements – Columbia Select Large Cap Growth Fund
March 31, 2011
Note 1. Organization
Columbia Select Large Cap Growth Fund (the Fund), a series of Columbia Funds Series Trust I (the Trust), is a diversified fund. The Trust is registered under the Investment Company Act of 1940, as amended (the 1940 Act), as an open-end management investment company organized as a Massachusetts business trust.
After the close of business on April 30, 2010, Ameriprise Financial, Inc. (Ameriprise Financial) acquired a portion of the asset management business of Columbia Management Group, LLC (the Transaction), including the business of managing the Fund. In connection with the closing of the Transaction (the Closing), RiverSource Investments, LLC, a wholly owned subsidiary of Ameriprise Financial, became the investment manager of the Fund and changed its name to Columbia Management Investment Advisers, LLC (the Investment Manager).
Investment Objective
The Fund seeks long-term capital appreciation.
Fund Shares
The Trust has unlimited authorized shares of beneficial interest. The Fund offers Class A, Class C, Class I, Class R, Class W and Class Z shares. On December 10, 2010, the Investment Manager exchanged Class Z shares of the Fund valued at $38,353,291 for Class I shares of the Fund. All share classes have identical voting, dividend and liquidation rights. Each share class has its own expense structure and sales charges, as applicable.
Class A shares are subject to a maximum front-end sales charge of 5.75% based on the initial investment amount. Class A shares purchased without an initial sales charge in accounts aggregating $1 million to $50 million at the time of purchase are subject to a 1.00% contingent deferred sales charge (CDSC) if the shares are sold within 18 months of purchase, charged as follows: 1.00% CDSC if redeemed within 12 months of purchase, and 0.50% CDSC if redeemed more than 12, but less than 18 months after purchase.
Class C shares are subject to a 1.00% CDSC on shares redeemed within one year of purchase.
Class I shares are not subject to sales charges and are available only to the Columbia Family of Funds. Class I shares commenced operations on September 27, 2010.
Class R shares are not subject to sales charges and are available only to qualifying institutional investors.
Class W shares are not subject to sales charges and are available only to investors purchasing through authorized investment programs managed by investment professionals, including discretionary managed account programs. Class W shares commenced operations on September 27, 2010.
Class Z shares are not subject to sales charges and are available only to certain investors, as described in the Fund’s prospectus.
Note 2. Summary of Significant Accounting Policies
The preparation of financial statements in accordance with U.S. generally accepted accounting principles (GAAP) requires management to make certain estimates and assumptions that affect the reported amounts of assets and liabilities, the disclosure of contingent assets and liabilities at the date of the financial statements and the reported amounts of revenue and expenses during the reporting period. Actual results could differ from those estimates.
The following is a summary of significant accounting policies consistently followed by the Fund in the preparation of its financial statements.
Security Valuation
Equity securities are valued at the last sale price on the principal exchange on which they trade, except for securities traded on the NASDAQ, which are valued at the NASDAQ official close price. Unlisted securities or listed securities for which there were no sales during the day are valued at the closing bid price on such exchanges or over-the-counter markets.
Short-term investments maturing in 60 days or less are valued at amortized cost, which approximates market value.
Investments for which market quotations are not readily available, or that have quotations which management believes are not reliable, are valued at fair value as determined in good faith under consistently applied procedures established by and under the general supervision of the Board of Trustees. If a security is valued at fair value, such value is likely to be different from the last quoted market price for the security. The determination of fair value often requires significant judgment. To determine fair value, management may use assumptions including but not limited to future cash flows and estimated risk premiums. Multiple inputs from various sources may be used to determine value.
22
Columbia Select Large Cap Growth Fund
March 31, 2011
Repurchase Agreements
The Fund may engage in repurchase agreement transactions with institutions that the Investment Manager has determined are creditworthy. The Fund, through the custodian, receives delivery of the underlying securities collateralizing a repurchase agreement. The Investment Manager is responsible for determining that the collateral is at least equal, at all times, to the value of the repurchase obligation including interest. A repurchase agreement transaction involves certain risks in the event of default or insolvency of the counterparty. These risks include possible delays in or restrictions on the Fund’s ability to dispose of the underlying securities and a possible decline in the value of the underlying securities during the period while the Fund seeks to assert its rights.
Security Transactions
Security transactions are accounted for on the trade date. Cost is determined and gains (losses) are based upon the specific identification method for both financial statement and federal income tax purposes.
Income Recognition
Interest income is recorded on the accrual basis.
Corporate actions and dividend income are recorded on the ex-date.
Expenses
General expenses of the Trust are allocated to the Fund and other series of the Trust based upon relative net assets or other expense allocation methodologies determined by the nature of the expense. Expenses directly attributable to a specific class of shares are charged to that share class. Expenses directly attributable to the Fund are charged to the Fund.
Determination of Class Net Asset Value
All income, expenses (other than class-specific expenses which are charged directly to a share class, as shown in the Statement of Operations) and realized and unrealized gains (losses) are allocated to each class of the Fund on a daily basis, based on the relative net assets of each class, for purposes of determining the net asset value of each class.
Federal Income Tax Status
The Fund intends to qualify each year as a “regulated investment company” under Subchapter M of the Internal Revenue Code, as amended, and will distribute substantially all of its taxable income, if any, for its tax year, and as such will not be subject to federal income taxes. In addition, the Fund intends to distribute in each calendar year substantially all of its net investment income, capital gains and certain other amounts, if any, such that the Fund should not be subject to federal excise tax. Therefore, no federal income or excise tax provision is recorded.
Distributions to Shareholders
Distributions from net investment income, if any, are declared and paid quarterly. Net realized capital gains, if any, are distributed at least annually. Income distributions and capital gain distributions are determined in accordance with federal income tax regulations which may differ from GAAP.
Indemnifications
Under the Trust’s organizational documents and, in some cases, by contract, its officers and directors are indemnified against certain liabilities arising out of the performance of their duties to the Fund. In addition, certain of the Fund’s contracts with its service providers contain general indemnification clauses. The Fund’s maximum exposure under these arrangements is unknown since the amount of any future claims that may be made against the Fund cannot be determined and the Fund has no historical basis for predicting the likelihood of any such claims.
Note 3. Fees and Compensation Paid to Affiliates
Investment Management Fee
Under an Investment Management Services Agreement (IMSA), the Investment Manager determines which securities will be purchased, held or sold. The management fee is equal to a percentage of the Fund’s average daily net assets that declines from 0.75% to 0.43% as the Fund’s net assets increase.
Prior to the Closing, Columbia Management Advisors, LLC (Columbia), an indirect, wholly owned subsidiary of Bank of America Corporation (BOA), provided investment management services to the Fund under the same fee structure. The effective management fee rate for the year ended March 31, 2011, was 0.56% of the Fund’s average daily net assets.
Administration Fee
Effective upon the Closing, the Investment Manager provides administration and accounting services to the Fund under an
23
Columbia Select Large Cap Growth Fund
March 31, 2011
Administrative Services Agreement, including services previously performed under the Pricing and Bookkeeping Oversight and Services Agreement (the Services Agreement) as discussed in the Pricing and Bookkeeping Fees note below. The Fund pays an annual administration fee equal to 0.15% of the Fund’s average daily net assets less the fees payable by the Fund as described under the Pricing and Bookkeeping Fees note below. Prior to the Closing, Columbia provided administrative services to the Fund at the same fee rates.
Pricing and Bookkeeping Fees
Prior to the Closing, the Fund entered into a Financial Reporting Services Agreement (the Financial Reporting Services Agreement) with State Street Bank and Trust Company (State Street) and Columbia pursuant to which State Street provides financial reporting services to the Fund. The Fund also entered into an Accounting Services Agreement (collectively with the Financial Reporting Services Agreement, the State Street Agreements) with State Street and Columbia pursuant to which State Street provides accounting services to the Fund. Upon the Closing, Columbia assigned and delegated its rights and obligations under the State Street Agreements to the Investment Manager. Under the State Street Agreements, the Fund pays State Street an annual fee of $38,000 paid monthly plus an additional monthly fee based on an annualized percentage rate of average daily net assets of the Fund for the month. The aggregate fee will not exceed $140,000 per year (exclusive of out-of-pocket expenses and charges). The Fund also reimburses State Street for certain out-of-pocket expenses and charges.
Also prior to the Closing, the Fund entered into the Services Agreement with Columbia. Under the Services Agreement, Columbia provided services related to Fund expenses and the requirements of the Sarbanes-Oxley Act of 2002, and provided oversight of the accounting and financial reporting services provided by State Street. Under the Services Agreement, the Fund reimbursed Columbia for out-of-pocket expenses and charges, including fees payable to third parties, such as for pricing the Fund’s portfolio securities, incurred by Columbia in the performance of services under the Services Agreement. The Services Agreement was terminated upon the Closing. These services are now provided under the Administrative Services Agreement discussed above.
Transfer Agent Fee
In connection with the Closing, RiverSource Service Corporation, a wholly owned subsidiary of Ameriprise Financial, provides transfer agency services to the Fund under a Transfer Agency Agreement and changed its name to Columbia Management Investment Services Corp. (the Transfer Agent). The Transfer Agent has contracted with Boston Financial Data Services (BFDS) to serve as sub-transfer agent.
The Transfer Agent receives monthly account-based service fees based on the number of open accounts and is reimbursed by the Fund for the fees and expenses the Transfer Agent pays to financial intermediaries that maintain omnibus accounts with the Fund that is a percentage of the average aggregate value of the Fund’s shares maintained in each such omnibus account (other than omnibus accounts for which American Enterprise Investment Services Inc. is the broker of record or accounts where the beneficial shareholder is a customer of Ameriprise Financial Services, Inc., which are paid a per account fee). The Transfer Agent pays the fees of BFDS for services as sub-transfer agent and is not entitled to reimbursement for such fees from the Fund (with the exception of out-of pocket fees). The Transfer Agent also receives compensation from fees for various shareholder services and reimbursements for certain out-of-pocket expenses. Class I shares do not pay transfer agent fees.
Prior to the Closing, Columbia Management Services, Inc., an affiliate of Columbia and an indirect, wholly owned subsidiary of BOA, provided transfer agency services to the Fund and contracted with BFDS to serve as sub-transfer agent, under the same fee structure.
For the year ended March 31, 2011, the Fund’s effective transfer agent fee rate for each class, with the exception of Class I shares, as a percentage of each class’ average daily net assets were as follows:
| | | | | | | | |
| | | | | | | |
| Class A | | Class C | | Class R | | Class W | | Class Z |
| 0.23% | | 0.23% | | 0.23% | | 0.25% | | 0.23% |
An annual minimum account balance fee of $20 may apply to certain accounts with a value below the Fund’s initial minimum investment requirements to reduce the impact of small accounts on transfer agent fees. These minimum account balance fees are recorded as part of expense reductions on the Statement of Operations. For the year ended March 31, 2011, no minimum account balance fees were charged by the Fund.
24
Columbia Select Large Cap Growth Fund
March 31, 2011
Underwriting Discounts, Service and Distribution Fees
In connection with the Closing, RiverSource Fund Distributors, Inc., an indirect wholly owned subsidiary of Ameriprise Financial, provides distribution and shareholder services to the Fund and changed its name to Columbia Management Investment Distributors, Inc. (the Distributor). Pursuant to Rule 12b-1 under the 1940 Act, the Board of Trustees has approved, and the Fund has adopted, distribution and shareholder service plans (the Plans) which set the distribution and service fees for the Fund. These fees are calculated daily and are intended to compensate the Distributor and/or eligible selling and/or servicing agents for selling shares of the Fund and providing services to investors.
The Plans require the payment of a monthly service fee to the Distributor at the maximum annual rate of 0.25% of the average daily net assets attributable to Class A, Class C and Class W shares of the Fund. The Plans also require the payment of a monthly distribution fee to the Distributor at the maximum annual rates of 0.75% of the average daily net assets attributable to Class C shares, 0.50% of the average daily net assets attributable to Class R shares and 0.25% of the average daily net assets attributable to Class W shares.
The Fund may pay a distribution fee of up to 0.25% of the Fund’s average daily net assets attributable to Class W shares and a service fee of up to 0.25% of the Fund’s average daily net assets attributable to Class W shares, provided, however, that the aggregate fee shall not exceed 0.25% of the Fund’s average daily net assets attributable to Class W shares.
Prior to the Closing, Columbia Management Distributors, Inc., an affiliate of Columbia and an indirect, wholly owned subsidiary of BOA, was the principal underwriter of the Fund’s shares. There were no changes to the underwriting discount structure of the Fund or the service or distribution fee rates paid by the Fund as a result of the Transaction.
Sales Charges
Sales charges, including front-end and CDSC’s, received by the Distributor for distributing Fund shares were $31,070 for Class A and $1,148 for Class C shares for the year ended March 31, 2011.
Fee Waivers and Expense Reimbursements
The Investment Manager has voluntarily agreed to bear a portion of the Fund’s expenses so that the Fund’s ordinary operating expenses (excluding brokerage commissions, interest, taxes and extraordinary expenses, but including custodian charges relating to overdrafts, if any), after giving effect to any balance credits from the Fund’s custodian, do not exceed the annual rates of 1.25%, 2.00%, 0.89%, 1.50%, 1.25% and 1.00% of the Fund’s average daily net assets attributable to Class A, Class C, Class I, Class R, Class W and Class Z shares, respectively. The Investment Manager, in its discretion, may revise or discontinue this arrangement at any time. Prior to May 1, 2010, Columbia voluntarily reimbursed a portion of the Fund’s expenses in the same manner.
Fees Paid to Officers and Trustees
In connection with the Closing, all officers of the Fund are employees of the Investment Manager or its affiliates and, with the exception of the Fund’s Chief Compliance Officer, receive no compensation from the Fund. The Board of Trustees has appointed a Chief Compliance Officer to the Fund in accordance with federal securities regulations. The Fund, along with other affiliated funds, pays its pro-rata share of the expenses associated with the Chief Compliance Officer. The Fund’s expenses for the Chief Compliance Officer will not exceed $15,000 per year. Prior to the Closing, all officers of the Fund were employees of Columbia or its affiliates and the Fund paid its pro-rata share of the expenses for the Chief Compliance Officer under the same fee structure.
Trustees are compensated for their services to the Fund, as set forth on the Statement of Operations. The Trust’s eligible Trustees may participate in a deferred compensation plan which may be terminated at any time. Obligations of the plan will be paid solely out of the Fund’s assets.
Note 4. Custody Credits
The Fund has an agreement with its custodian bank under which custody fees may be reduced by balance credits. These credits are recorded as part of expense reductions on the Statement of Operations. The Fund could have invested a portion of the assets utilized in connection with the expense offset arrangement in an income-producing asset if it had not entered into such an agreement. For the year ended March 31, 2011, these custody credits reduced total expenses by $384 for the Fund.
Note 5. Portfolio Information
The cost of purchases and proceeds from sales of securities, excluding short-term obligations, aggregated $3,757,815,140 and $2,235,901,990, respectively, for the year ended March 31, 2011.
25
Columbia Select Large Cap Growth Fund
March 31, 2011
Note 6. Shareholder Concentration
As of March 31, 2011, one shareholder account owned 59.6% of the outstanding shares of the Fund. Purchase and redemption activity of this account may have a significant effect on the operations of the Fund.
Note 7. Line of Credit
Prior to March 28, 2011, the Fund and other affiliated funds participated in a $280,000,000 committed, unsecured revolving line of credit provided by State Street. Effective March 28, 2011, the commitment was reduced to $225,000,000. The maximum amount that may be borrowed by any fund is limited to the lesser of $200,000,000 and the Fund’s borrowing limit set forth in the Fund’s registration statement. Borrowings are available for short-term liquidity or temporary or emergency purposes.
Effective October 14, 2010, interest is charged to each participating fund based on the fund’s borrowings at a rate per annum equal to the greater of the Federal Funds Rate plus 1.25% or the overnight LIBOR Rate plus 1.25%. In addition, a commitment fee of 0.125% per annum is accrued and apportioned among the participating funds pro rata based on their relative net assets.
For the year ended March 31, 2011, the Fund did not borrow under these arrangements.
Note 8. Federal Tax Information
The timing and character of income and capital gain distributions are determined in accordance with income tax regulations, which may differ from GAAP. Reclassifications are made to the Fund’s capital accounts for permanent tax differences to reflect income and gains available for distribution (or available capital loss carryforwards) under income tax regulations.
For the year ended March 31, 2011, permanent book and tax basis differences resulting primarily from differing treatments for net operating losses were identified and reclassified among the components of the Fund’s net assets as follows:
| | | | |
| |
Accumulated
Net Investment
Loss | | Accumulated Net Realized Gain | | Paid-In Capital |
| $19,402,524 | | $(1) | | $(19,402,523) |
Net investment loss and net realized gains (losses), as disclosed on the Statement of Operations, and net assets were not affected by this reclassification.
As of March 31, 2011, the components of distributable earnings on a tax basis were as follows:
| | | | |
| |
Undistributed
Ordinary Income | | Undistributed Long-Term Capital Gains | | Net Unrealized Appreciation* |
| $— | | $79,554,661 | | $984,867,004 |
| * | The differences between book-basis and tax-basis net unrealized appreciation are primarily due to deferral of losses from wash sales. |
Unrealized appreciation and depreciation at March 31, 2011, based on cost of investments for federal income tax purposes were:
| | | | |
| | |
Unrealized appreciation | | $ | 1,009,094,850 | |
Unrealized depreciation | | | (24,227,846 | ) |
| | | | |
Net unrealized appreciation | | $ | 984,867,004 | |
Capital loss carry forwards of $266,763,785 were utilized during the year ended March 31, 2011.
Management of the Fund has concluded that there are no significant uncertain tax positions that would require recognition in the financial statements. However, management’s conclusion may be subject to review and adjustment at a later date based on factors including, but not limited to, new tax laws, regulations, and administrative interpretations (including relevant court decisions). The Fund’s federal tax returns for the prior three fiscal years remain subject to examination by the Internal Revenue Service.
Note 9. Subsequent Events
Management has evaluated the events and transactions that have occurred through the date the financial statements were issued. Other than as noted below, there were no items requiring adjustment of the financial statements or additional disclosure.
Effective May 16, 2011, the line of credit commitment with State Street was reduced to $150,000,000, and the maximum amount that may be borrowed by any fund was limited to the lesser of $120,000,000 and the Fund’s borrowing limit set forth in the Fund’s registration statement.
Note 10. Information Regarding Pending and Settled Legal Proceedings
In June 2004, an action captioned John E. Gallus et al. v. American Express Financial Corp. and American Express Financial Advisors Inc. was filed in the United States District Court for the District of
26
Columbia Select Large Cap Growth Fund
March 31, 2011
Arizona. The plaintiffs allege that they are investors in several American Express Company (now known as RiverSource) mutual funds and they purport to bring the action derivatively on behalf of those funds under the Investment Company Act of 1940. The plaintiffs allege that fees allegedly paid to the defendants by the funds for investment advisory and administrative services are excessive. The plaintiffs seek remedies including restitution and rescission of investment advisory and distribution agreements. The plaintiffs voluntarily agreed to transfer this case to the United States District Court for the District of Minnesota (the District Court). In response to defendants’ motion to dismiss the complaint, the District Court dismissed one of plaintiffs’ four claims and granted plaintiffs limited discovery. Defendants moved for summary judgment in April 2007. Summary judgment was granted in the defendants’ favor on July 9, 2007. The plaintiffs filed a notice of appeal with the Eighth Circuit Court of Appeals (the Eighth Circuit) on August 8, 2007. On April 8, 2009, the Eighth Circuit reversed summary judgment and remanded to the District Court for further proceedings. On August 6, 2009, defendants filed a writ of certiorari with the U.S. Supreme Court (the Supreme Court), asking the Supreme Court to stay the District Court proceedings while the Supreme Court considers and rules in a case captioned Jones v. Harris Associates, which involves issues of law similar to those presented in the Gallus case. On March 30, 2010, the Supreme Court issued its ruling in Jones v. Harris Associates, and on April 5, 2010, the Supreme Court vacated the Eighth Circuit’s decision in the Gallus case and remanded the case to the Eighth Circuit for further consideration in light of the Supreme Court’s decision in Jones v. Harris Associates. On June 4, 2010, the Eighth Circuit remanded the Gallus case to the District Court for further consideration in light of the Supreme Court’s decision in Jones v. Harris Associates. On December 9, 2010, the District Court reinstated its July 9, 2007 summary judgment order in favor of the defendants. On January 10, 2011, plaintiffs filed a notice of appeal with the Eighth Circuit.
In December 2005, without admitting or denying the allegations, American Express Financial Corporation (AEFC, which is now known as Ameriprise Financial, Inc. (Ameriprise Financial)), entered into settlement agreements with the Securities and Exchange Commission (SEC) and Minnesota Department of Commerce (MDOC) related to market timing activities. As a result, AEFC was censured and ordered to cease and desist from committing or causing any violations of certain provisions of the Investment Advisers Act of 1940, the Investment Company Act of 1940, and various Minnesota laws. AEFC agreed to pay disgorgement of $10 million and civil money penalties of $7 million. AEFC also agreed to retain an independent distribution consultant to assist in developing a plan for distribution of all disgorgement and civil penalties ordered by the SEC in accordance with various undertakings detailed at http://www.sec.gov/litigation/admin/ia-2451.pdf. Ameriprise Financial and its affiliates have cooperated with the SEC and the MDOC in these legal proceedings, and have made regular reports to the funds’ Boards of Directors/Trustees.
Ameriprise Financial and certain of its affiliates have historically been involved in a number of legal, arbitration and regulatory proceedings, including routine litigation, class actions, and governmental actions, concerning matters arising in connection with the conduct of their business activities. Ameriprise Financial believes that the Funds are not currently the subject of, and that neither Ameriprise Financial nor any of its affiliates are the subject of, any pending legal, arbitration or regulatory proceedings that are likely to have a material adverse effect on the Funds or the ability of Ameriprise Financial or its affiliates to perform under their contracts with the Funds. Ameriprise Financial is required to make 10-Q, 10-K and, as necessary, 8-K filings with the Securities and Exchange Commission on legal and regulatory matters that relate to Ameriprise Financial and its affiliates. Copies of these filings may be obtained by accessing the SEC website at www.sec.gov.
There can be no assurance that these matters, or the adverse publicity associated with them, will not result in increased fund redemptions, reduced sale of fund shares or other adverse consequences to the Funds. Further, although we believe proceedings are not likely to have a material adverse effect on the Funds or the ability of Ameriprise Financial or its affiliates to perform under their contracts with the Funds, these proceedings are subject to uncertainties and, as such, we are unable to estimate the possible loss or range of loss that may result. An adverse outcome in one or more of these proceedings could result in adverse judgments, settlements, fines, penalties or other relief that could have a material adverse effect on the consolidated financial condition or results of operations of Ameriprise Financial.
27
Report of Independent Registered Public Accounting Firm
To the Trustees of Columbia Funds Series Trust I and the Shareholders of Columbia Select Large Cap Growth Fund
In our opinion, the accompanying statement of assets and liabilities, including the investment portfolio, and the related statements of operations and of changes in net assets and the financial highlights present fairly, in all material respects, the financial position of Columbia Select Large Cap Growth Fund (the “Fund”) (a series of Columbia Funds Series Trust I) at March 31, 2011, the results of its operations for the year then ended, the changes in its net assets for each of the two years in the period then ended, and the financial highlights for the periods indicated, in conformity with accounting principles generally accepted in the United States of America. These financial statements and financial highlights (hereafter referred to as “financial statements”) are the responsibility of the Fund’s management; our responsibility is to express an opinion on these financial statements based on our audits. We conducted our audits of these financial statements in accordance with the standards of the Public Company Accounting Oversight Board (United States). Those standards require that we plan and perform the audit to obtain reasonable assurance about whether the financial statements are free of material misstatement. An audit includes examining, on a test basis, evidence supporting the amounts and disclosures in the financial statements, assessing the accounting principles used and significant estimates made by management, and evaluating the overall financial statement presentation. We believe that our audits, which included confirmation of securities at March 31, 2011 by correspondence with the custodian and brokers, provide a reasonable basis for our opinion.
PricewaterhouseCoopers LLP
Boston, Massachusetts
May 20, 2011
28
Federal Income Tax Information (Unaudited) – Columbia Select Large Cap Growth Fund
The Fund hereby designates as a capital gain dividend with respect to the fiscal year ended March 31, 2011, $83,532,394, or, if subsequently determined to be different, the net capital gain of such year.
The Fund will notify shareholders in January 2012 of amounts for use in preparing 2011 income tax returns.
29
Fund Governance
The Trustees serve terms of indefinite duration. The names, addresses and birth years of the Trustees and Officers of the Funds in Columbia Funds Series Trust I, the year each was first elected or appointed to office, their principal business occupations during at least the last five years, the number of Funds overseen by each Trustee and other directorships they hold are shown below, as of May 2, 2011. Each officer listed below serves as an officer of each Fund in Columbia Funds Series Trust I.
Independent Trustees
| | |
Name, Address and Year of Birth,
Position with Funds, Year First
Elected or Appointed to Office | | Principal Occupation(s) During Past Five Years, Number of Funds in Columbia Funds
Complex Overseen by Trustee, Other Directorships Held |
| |
| John D. Collins (born 1938) | | |
c/o Columbia Management Investment Advisers, LLC 225 Franklin Street Boston, MA 02110 Trustee (since 2005) | | Retired. Consultant, KPMG, LLP (accounting and tax firm) from July 1999 to June 2000; Partner, KPMG, LLP from March 1962 to June 1999. Oversees 46; Mrs. Fields Original Cookies, Inc. (consumer products); Suburban Propane Partners, L.P.; and Montpelier Re (insurance underwriting firm) |
| |
| Rodman L. Drake (born 1943) | | |
c/o Columbia Management Investment Advisers, LLC 225 Franklin Street Boston, MA 02110 Trustee (since 1994) and Chairman of the Board (since 2009) | | Independent consultant since 2010; Co-Founder of Baringo Capital LLC (private equity) from 1997 to 2008; CEO of Crystal River Capital, Inc. (real estate investment trust) from 2003 to 2010; Oversees 46; Jackson Hewitt Tax Service Inc. (tax preparation services); Celgene Corporation (global biotechnology company); Student Loan Corporation (student loan provider); Crystal River Capital, Inc. from 2005 to 2010; Parsons Brinckerhoff from 1995 to 2008; the Helios Funds (closed-end funds); and Apex Silver Mines Ltd. from 2007 to 2009 |
| |
| Douglas A. Hacker (born 1955) | | |
c/o Columbia Management Investment Advisers, LLC 225 Franklin Street Boston, MA 02110 Trustee (since 1996) | | Independent business executive since May 2006; Executive Vice President–Strategy of United Airlines (airline) from December 2002 to May 2006; President of UAL Loyalty Services (airline marketing company) from September 2001 to December 2002; Executive Vice President and Chief Financial Officer of United Airlines from July 1999 to September 2001. Oversees 46; Nash Finch Company (food distributor); Aircastle Limited (aircraft leasing); and SeaCube Container Leasing Ltd (container leasing) |
|
| Janet Langford Kelly (born 1957) |
c/o Columbia Management Investment Advisers, LLC 225 Franklin Street Boston, MA 02110 Trustee (since 1996) | | Senior Vice President, General Counsel and Corporate Secretary, ConocoPhillips (integrated energy company) since September 2007; Deputy General Counsel–Corporate Legal Services, ConocoPhillips from August 2006 to August 2007; Partner, Zelle, Hofmann, Voelbel, Mason & Gette LLP (law firm) from March 2005 to July 2006; Adjunct Professor of Law, Northwestern University, from September 2004 to June 2006; Director, UAL Corporation (airline) from February 2006 to July 2006; Oversees 46; None |
| |
| William E. Mayer (born 1940) | | |
c/o Columbia Management Investment Advisers, LLC 225 Franklin Street Boston, MA 02110 Trustee (since 1994) | | Partner, Park Avenue Equity Partners (private equity) since February 1999; Dean and Professor, College of Business and Management, University of Maryland from 1992 to 1996. Oversees 46; DynaVox Inc. (software developer); Lee Enterprises (print media), WR Hambrecht + Co. (financial service provider); BlackRock Kelso Capital Corporation (investment company) |
30
Fund Governance (continued)
Independent Trustees (continued)
| | |
Name, Address and Year of Birth,
Position with Funds, Year First
Elected or Appointed to Office | | Principal Occupation(s) During Past Five Years, Number of Funds in Columbia Funds
Complex Overseen by Trustee, Other Directorships Held |
| |
| David M. Moffett (born 1952) | | |
c/o Columbia Management Investment Advisers, LLC 225 Franklin Street Boston, MA 02110 Trustee (since 2011) | | Retired. Chief Executive Officer, Federal Home Loan Mortgage Corporation, from 2008 to 2009; Senior Adviser, Global Financial Services Group, Carlyle Group, Inc., from 2007 to 2008; Vice Chairman and Chief Financial Officer, U.S. Bancorp, from 1993 to 2007. Oversees 46; CIT Group Inc. (commercial and consumer finance), eBay Inc. (online trading community), MBIA Corp (financial service provider), E.W. Scripps Co. (print and television media), Building Materials Holding Corp. (building materials and construction services), and University of Oklahoma Foundation. |
| |
| Charles R. Nelson (born 1942) | | |
c/o Columbia Management Investment Advisers, LLC 225 Franklin Street Boston, MA 02110 Trustee (since 1981) | | Professor of Economics, University of Washington, since January 1976; Ford and Louisa Van Voorhis Professor of Political Economy, University of Washington, since September 1993; Adjunct Professor of Statistics, University of Washington, since September 1980; Associate Editor, Journal of Money Credit and Banking, 1993-2008; Consultant on econometric and statistical matters. Oversees 46; None |
| |
| John J. Neuhauser (born 1943) | | |
c/o Columbia Management Investment Advisers, LLC 225 Franklin Street Boston, MA 02110 Trustee (since 1984) | | President, Saint Michael’s College, since August 2007; Director or Trustee of several non-profit organization, including Fletcher Allen Health Care, Inc.; University Professor, Boston College from November 2005 to August 2007; Academic Vice President and Dean of Faculties, Boston College from August 1999 to October 2005. Oversees 46; Liberty All-Star Equity Fund and Liberty All-Star Growth Fund, Inc. (closed-end funds) |
| |
| Jonathan Piel (born 1938) | | |
c/o Columbia Management Investment Advisers, LLC 225 Franklin Street Boston, MA 02110 Trustee (since 1994) | | Cable television producer and website designer; The Editor, Scientific American from 1984 to 1994; Vice President, Scientific American, Inc., from 1984 to 1994; Member, Advisory Board, Stone Age Institute, Bloomington, Indiana (research institute that explores the effect of technology on human evolution); Member, Board of Directors of the National Institute of Social Sciences, New York City; Member, Board of Trustees of the William Alanson White Institute, New York City (institution for training psychoanalysts); and Member, Advisory Board, Mount Sinai Children’s Environmental Health Center, New York. Oversees 46; None |
| |
| Patrick J. Simpson (born 1944) | | |
c/o Columbia Management Investment Advisers, LLC 225 Franklin Street Boston, MA 02110 Trustee (since 2000) | | Partner, Perkins Coie LLP (law firm). Oversees 46; None |
| |
| Anne-Lee Verville (born 1945) | | |
c/o Columbia Management Investment Advisers, LLC 225 Franklin Street Boston, MA 02110 Trustee (since 1998) | | Retired since 1997 (formerly General Manager–Global Education Industry from 1994 to 1997, President–Application Systems Division from 1991 to 1994, Chief Financial Officer–US Marketing & Services from 1988 to 1991, and Chief Information Officer from 1987 to 1988, IBM Corporation (computer and technology)). Oversees 46; Enesco Group, Inc. (producer of giftware and home and garden decor products) from 2001 to 2006 |
31
Fund Governance (continued)
Interested Trustee
| | |
Name, Address and Year of Birth,
Position with Funds, Year First
Elected or Appointed to Office | | Principal Occupation(s) During Past Five Years, Number of Funds in Columbia Funds
Complex Overseen by Trustee, Other Directorships Held |
| |
| Michael A. Jones (born 1959) | | |
c/o Columbia Management Investment Advisers, LLC 225 Franklin Street Boston, MA 02110 Trustee (since 2011) Senior Vice President (since 2010) | | President and Director, Columbia Management Investment Advisers, LLC since May 2010; President and Director, Columbia Management Investment Distributors, Inc. since May 2010; Manager, Chairman, Chief Executive Officer and President, Columbia Management Advisors, LLC from 2007 to April 2010; Chief Executive Officer, President and Director, Columbia Management Distributors, Inc. from November 2006 to April 2010; previously, co-president and senior managing director at Robeco Investment Management. Oversees 46; None |
The Statement of Additional Information includes additional information about the Trustees of the Funds and is available, without charge, upon request by calling 1-800-345-6611.
32
Fund Governance (continued)
Officers
| | |
| Name, Year of Birth and Address | | Principal Occupation(s) During the Past Five Years |
|
| J. Kevin Connaughton (born 1964) |
225 Franklin Street Boston, MA 02110 President (since 2009) | | Senior Vice President and General Manager–Mutual Fund Products, Columbia Management Investment Advisers, LLC since May 2010; President, Columbia Funds, since 2009, and RiverSource Funds, since May 2010 (previously Senior Vice President and Chief Financial Officer, Columbia Funds, from June 2008 to January 2009, Treasurer, Columbia Funds, from October 2003 to May 2008, and senior officer of various other affiliated funds since 2000); Managing Director, Columbia Management Advisors, LLC from December 2004 to April 2010. |
| |
| Michael G. Clarke (born 1969) | | |
225 Franklin Street Boston, MA 02110 Treasurer (since 2011) and Chief Financial Officer (since 2009) | | Vice President, Columbia Management Investment Advisers, LLC since May 2010; Managing Director of Fund Administration, Columbia Management Advisors, LLC, from September 2004 to April 2010; senior officer of Columbia Funds and affiliated funds since 2002. |
| |
| Scott R. Plummer (born 1959) | | |
5228 Ameriprise Financial Center Minneapolis, MN 55474 Senior Vice President, Secretary and Chief Legal Officer (since 2010) | | Chief Legal Officer and Assistant Secretary, Columbia Management Investment Advisers, LLC since June 2005; Vice President and Lead Chief Counsel–Asset Management, Ameriprise Financial, Inc. since May 2010 (previously Vice President and Chief Counsel–Asset Management, from 2005 to April 2010, and Vice President–Asset Management Compliance from 2004 to 2005); Vice President, Chief Counsel and Assistant Secretary, Columbia Management Investment Distributors, Inc. since 2008; Vice President, General Counsel and Secretary, Ameriprise Certificate Company since 2005; Chief Counsel, RiverSource Distributors, Inc. since 2006; Vice President, General Counsel and Secretary, RiverSource Funds, since December 2006; Senior Vice President, Secretary and Chief Legal Officer, Columbia Funds, since May 2010. |
| |
| Linda J. Wondrack (born 1964) | | |
225 Franklin Street Boston, MA 02110 Senior Vice President and Chief Compliance Officer (since 2007) | | Vice President and Chief Compliance Officer, Columbia Management Investment Advisers, LLC since May 2010; Chief Compliance Officer, Columbia Funds, since 2007, and RiverSource Funds, since May 2010; Director (Columbia Management Group, LLC and Investment Product Group Compliance), Bank of America, from June 2005 to April 2010; Director of Corporate Compliance and Conflicts Officer of MFS Investment Management (investment management) from August 2004 to May 2005. |
| |
| William F. Truscott (born 1960) | | |
53600 Ameriprise Financial Center Minneapolis, MN 55474 Senior Vice President (since 2010) | | Chairman of the Board, Columbia Management Investment Advisers, LLC since May 2010 (previously President, Chairman of the Board and Chief Investment Officer, from 2001 to April 2010); Chief Executive Officer, U.S. Asset Management & President, Annuities, Ameriprise Financial, Inc. since May 2010 (previously President–U.S. Asset Management and Chief Investment Officer from 2005 to April 2010, and Senior Vice President–Chief Investment Officer, from 2001 to 2005); Director, President and Chief Executive Officer, Ameriprise Certificate Company since 2006; Director, Columbia Management Investment Distributors, Inc. since May 2010 (previously Chairman of the Board and Chief Executive Officer from 2008 to April 2010); Chairman of the Board and Chief Executive Officer, RiverSource Distributors, Inc. since 2006. |
33
Fund Governance (continued)
Officers (continued)
| | |
| Name, Year of Birth and Address | | Principal Occupation(s) During the Past Five Years |
|
| Colin Moore (born 1958) |
225 Franklin Street Boston, MA 02110 Senior Vice President (since 2010) | | Director and Chief Investment Officer, Columbia Management Investment Advisers, LLC since May 2010; Manager, Managing Director and Chief Investment Officer of Columbia Management Advisors, LLC from 2007 to April 2010; Head of Equities, Columbia Management Advisors, LLC from 2002 to 2007. |
| |
| Amy Johnson (born 1965) | | |
5228 Ameriprise Financial Center Minneapolis, MN 55474 Vice President (since 2010) | | Senior Vice President and Chief Operating Officer, Columbia Management Investment Advisers, LLC since May 2010 (previously Chief Administrative Officer, from 2009 until April 2010, Vice President–Asset Management and Trust Company Services, from 2006 to 2009, and Vice President–Operations and Compliance from 2004 to 2006). |
| |
| Joseph F. DiMaria (born 1968) | | |
225 Franklin Street Boston, MA 02110 Vice President (since 2011) and Chief Accounting Officer (since 2008) | | Vice President, Mutual Fund Administration, Columbia Management Investment Advisers, LLC, since May 2010; Director of Fund Administration, Columbia Management Advisors, LLC from January 2006 to April 2010; Head of Tax/Compliance and Assistant Treasurer, Columbia Management Advisors, LLC, from November 2004 to December 2005. |
| |
| Stephen T. Welsh (born 1957) | | |
225 Franklin Street Boston, MA 02110 Vice President (since 2006) | | President and Director, Columbia Management Investment Services Corp. since May 2010; President and Director, Columbia Management Services, Inc. from July 2004 to April 2010; Managing Director, Columbia Management Distributors, Inc. from August 2007 to April 2010. |
| |
| Paul D. Pearson (born 1956) | | |
5228 Ameriprise Financial Center Minneapolis, MN 55474 Vice President and Assistant Treasurer (since 2011) | | Vice President, Investment Accounting, Columbia Management Investment Advisers, LLC, since May 2010; Vice President, Managed Assets, Investment Accounting, Ameriprise Financial Corporation. |
| |
| Paul B. Goucher (born 1968) | | |
5228 Ameriprise Financial Center Minneapolis, MN 55474 Vice President and Assistant Treasurer (since 2010) | | Vice President and Chief Counsel of Ameriprise Financial since January 2010 (formerly Vice President and Group Counsel from November 2008 to January 2010); Director, Managing Director and General Counsel of J. & W. Seligman & Co. Incorporated (Seligman) from July 2008 to November 2008 and Managing Director and Associate General Counsel of Seligman from January 2005 to July 2008. |
| |
| Christopher O. Petersen (born 1970) | | |
5228 Ameriprise Financial Center Minneapolis, MN 55474 Vice President and Assistant Treasurer (since 2010) | | Vice President and Chief Counsel, Ameriprise Financial since January 2010 (formerly Vice President and Group Counsel or Counsel from April 2004 to January 2010); Assistant Secretary of RiverSource Funds since January 2007. |
| |
| Michael E. DeFao (born 1968) | | |
5228 Ameriprise Financial Center Minneapolis, MN 55474 Vice President and Assistant Treasurer (since 2011) | | Vice President and Chief Counsel, Ameriprise Financial since May 2010; Associate General Counsel Bank of America from June 2005 to April 2010. |
34
Shareholder Meeting Results
Columbia Select Large Cap Growth Fund
At a Joint Special Meeting of Shareholders held on February 15, 2011, shareholders of the Fund considered a proposal to approve a proposed amendment to the Investment Management Services Agreement with Columbia Management Investment Advisers, LLC. The proposal was approved as follows:
| | | | | | |
| | | | | | | |
| Votes For | | Votes Against | | Abstentions | | Broker Non-Votes |
| 2,900,175,555 | | 17,174,093 | | 14,147,069 | | 0 |
35
[THIS PAGE INTENTIONALLY LEFT BLANK]
36
Important Information About This Report
The fund mails one shareholder report to each shareholder address. If you would like more than one report, please call shareholder services at 1-800-345-6611 and additional reports will be sent to you. This report has been prepared for shareholders of Columbia Select Large Cap Growth Fund.
A description of the policies and procedures that the fund uses to determine how to vote proxies and a copy of the fund’s voting records are available (i) at www.columbiamanagement.com, (ii) on the Securities and Exchange Commission’s website at www.sec.gov, and (iii) without charge, upon request, by calling 1-800-368-0346. Information regarding how the fund voted proxies relating to portfolio securities during the 12-month period ended June 30 is available from the SEC’s website. Information regarding how the fund voted proxies relating to portfolio securities is also available from the fund’s website, www.columbiamanagement.com.
The fund files a complete schedule of portfolio holdings with the SEC for the first and third quarters of each fiscal year on Form N-Q. The fund’s Form N-Q is available on the SEC’s website at www.sec.gov and may be reviewed and copied at the SEC’s Public Reference Room in Washington, D.C. Information on the operation of the Public Reference Room may be obtained by calling
1-800-SEC-0330.
Transfer Agent
Columbia Management Investment Services Corp.
P.O. Box 8081
Boston, MA 02266-8081
1-800-345-6611
Distributor
Columbia Management Investment
Distributors, Inc.
225 Franklin Street
Boston, MA 02110
Investment Manager
Columbia Management Investment Advisers, LLC
225 Franklin Street
Boston, MA 02110
37

Columbia Select Large Cap Growth Fund
P.O. Box 8081
Boston, MA 02266-8081
columbiamanagement.com
This information is for use with concurrent or prior delivery of a fund prospectus. Investors should consider the investment objectives, risks, charges and expenses of a mutual fund carefully before investing. For a free prospectus, which contains this and other important information about the funds, visit columbiamanagement.com. Read the prospectus carefully before investing. The Fund is distributed by Columbia Management Investment Distributors, Inc., member FINRA, and managed by Columbia Management Investment Advisers, LLC.
©2011 Columbia Management Investment Advisers, LLC. All rights reserved.
C-1161 A (05/11)

Columbia Select Small Cap Fund
Annual Report for the Period Ended March 31, 2011
Table of contents
The views expressed in this report reflect the current views of the respective parties. These views are not guarantees of future performance and involve certain risks, uncertainties and assumptions that are difficult to predict, so actual outcomes and results may differ significantly from the views expressed. These views are subject to change at any time based upon economic, market or other conditions and the respective parties disclaim any responsibility to update such views. These views may not be relied on as investment advice and, because investment decisions for a Columbia Fund are based on numerous factors, may not be relied on as an indication of trading intent on behalf of any particular Columbia Fund. References to specific securities should not be construed as a recommendation or investment advice.
President’s Message

Dear Shareholder:
The Columbia Management story began over 100 years ago, and today, we are one of the nation’s largest dedicated asset managers. The recent acquisition by Ameriprise Financial, Inc. brings together the talents, resources and capabilities of Columbia Management with those of RiverSource Investments, Threadneedle (acquired by Ameriprise in 2003) and Seligman Investments (acquired by Ameriprise in 2008) to build a best-in-class asset management business that we believe is truly greater than its parts.
RiverSource Investments traces its roots to 1894 when its then newly-founded predecessor, Investors Syndicate, offered a face-amount savings certificate that gave small investors the opportunity to build a safe and secure fund for retirement, education or other special needs. A mutual fund pioneer, Investors Syndicate launched Investors Mutual Fund in 1940. In the decades that followed, its mutual fund products and services lineup grew to include a full spectrum of styles and specialties. More than 110 years later, RiverSource continues to be a trusted financial products leader.
Threadneedle, a leader in global asset management and one of Europe’s largest asset managers, offers sophisticated international experience from a dedicated U.K. management team. Headquartered in London, it is named for Threadneedle Street in the heart of the city’s financial district, where British investors pioneered international and global investing. Threadneedle was acquired in 2003 and today operates as an affiliate of Columbia Management.
Seligman Investments’ beginnings date back to the establishment of the investment firm J. & W. Seligman & Co. in 1864. In the years that followed, Seligman played a major role in the geographical expansion and industrial development of the United States. In 1874, President Ulysses S. Grant named Seligman as fiscal agent for the U.S. Navy — an appointment that would last through World War I. Seligman helped finance the westward path of the railroads and the building of the Panama Canal. The firm organized its first investment company in 1929 and began managing its first mutual fund in 1930. In 2008, J. & W. Seligman & Co. Incorporated was acquired and Seligman Investments became an offering brand of RiverSource Investments, LLC.
We are proud of the rich and distinctive history of these firms, the strength and breadth of products and services they offer, and the combined cultures of pioneering spirit and forward thinking. Together we are committed to providing more for our shareholders than ever before.
| n | | A singular focus on our shareholders. Our business is asset management, so investors are our first priority. We dedicate our resources to identifying timely investment opportunities and provide a comprehensive choice of equity, fixed-income and alternative investments to help meet your individual needs. |
| n | | First-class research and thought leadership. We are dedicated to helping you take advantage of today’s opportunities and anticipate tomorrow’s. We stay abreast of the latest investment trends and ideas, using our collective insight to evaluate events and transform them into solutions you can use. |
| n | | A disciplined investment approach. We aren’t distracted by passing fads. Our teams adhere to a rigorous investment process that helps ensure the integrity of our products and enables you and your financial advisor to match our solutions to your objectives with confidence. |
When you choose Columbia Management, you can be confident that we will take the time to understand your needs and help you and your financial advisor identify the solutions that are right for you. Because at Columbia Management, we don’t consider ourselves successful unless you are.
Sincerely,

J. Kevin Connaughton
President, Columbia Funds
Investors should consider the investment objectives, risks, charges and expenses of a mutual fund carefully before investing. For a free prospectus, which contains this and other important information about the funds, visit www.columbiamanagement.com. The prospectus should be read carefully before investing.
Columbia Funds are distributed by Columbia Management Investment Distributors, Inc., member FINRA, and managed by Columbia Management Investment Advisers, LLC.
© 2011 Columbia Management Investment Advisers, LLC. All rights reserved.
Fund Profile – Columbia Select Small Cap Fund
Summary
| n | | For the 12-month period that ended March 31, 2011, the fund’s Class A shares returned 25.85% without sales charge. |
| n | | The fund outperformed its benchmark, the Russell 2000 Index1, as well as with the average return of its peer group, the Lipper Small-Cap Core Funds Classification.2 |
| n | | Merger and acquisition activity boosted the fund’s returns. Overweights in the energy, consumer discretionary and information technology sectors buoyed the fund’s performance versus its benchmark, as did an underweight in health care. On the downside, underweights in consumer staples and financials held back results. |
Portfolio Management
Douglas H. Pyle has managed the fund since 2008 and has been associated with the fund’s adviser or the fund’s previous adviser or its predecessors since 1999.
| 1 | The Russell 2000 Index measures the performance of the 2,000 smallest of the 3,000 largest US companies, based on market capitalization. |
| 2 | Lipper Inc., a widely respected data provider in the industry, calculates an average total return (assuming reinvestment of distributions) for mutual funds with investment objectives similar to those of the fund. Lipper makes no adjustment for the effect of sales loads. |
Indices are not available for investment, are not professionally managed and do not reflect sales charges, fees, brokerage commissions, taxes or other expenses of investing. Securities in the fund may not match those in an index.
Performance data quoted represents past performance and current performance may be lower or higher. Past performance is no guarantee of future results. The investment return and principal value will fluctuate so that shares, when redeemed, may be worth more or less than the original cost. Please visit www.columbiamanagement.com for daily and most recent month-end performance updates.
Summary
1-year return as of 03/31/11
| | |
| |
 | | +25.85% Class A shares (without sales charge) |
| |
| | +25.79% Russell 2000 Index |
|
Morningstar Style BoxTM |
|
Equity Style |
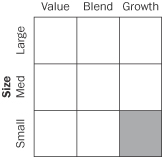 |
The Morningstar Style BoxTM is based on the fund’s portfolio holdings. For equity funds, the vertical axis shows the market capitalization of the stocks owned, and the horizontal axis shows investment style (value, blend, or growth). Information shown is based on the most recent data provided by Morningstar.
© 2011 Morningstar, Inc. All rights reserved. The Morningstar information contained herein: (1) is proprietary to Morningstar and/or its content providers; (2) may not be copied or distributed; and (3) is not warranted to be accurate, complete or timely. Neither Morningstar nor its content providers are responsible for any damages or losses arising from any use of this information.
1
Economic Update – Columbia Select Small Cap Fund
The U.S. economy continued to expand at a solid but uneven pace over the past 12 months, as measured by gross domestic product (GDP). Although lackluster second quarter 2010 GDP growth raised fears that the economy was losing steam and might lapse back into recession, the pace picked up in the third quarter of 2010, inspiring confidence among consumers, businesses and investors. GDP expanded by 2.6% in the third quarter and 3.1% in the fourth quarter. With the Federal Reserve Board (the Fed) providing additional monetary stimulus to shore up economic growth and the extension of key tax cuts for the next two years, expectations are for continued growth in 2011. However, early estimates of first quarter 2011 growth place it just under 2.0%, a disappointment after two strong quarters and a pick-up in employment.
Consumer spending on cars, clothing and other goods generally trended higher during the 12-month period, accelerating in the fourth quarter of 2010. Holiday spending rose 5.5% between November 5, 2010 and December 24, 2010, in all retail categories, excluding automobiles, compared with the same period in 2009, according to MasterCard Advisors’ SpendingPulse, which tracks spending on all transactions including cash. Personal income surged in January 2011 as payroll tax cuts kicked in. The personal savings rate edged higher, ending February, the last month for which data was available, at 5.8%.
News on the job front was increasingly positive. A good portion of the jobs added in March, April and May of 2010 were temporary, government-sponsored census positions, which began to unwind in June, July and August 2010. However, private sector payroll employment began to trend higher in the third quarter, massive layoffs declined and job growth turned solidly positive, with the addition of 444,000 new jobs in the first quarter of 2011.
Despite some glimmers of improvement early in 2010, the housing market remained troublesome throughout the period. Both new and existing home sales fell after a federal tax credit for new and repeat homebuyers expired. Distressed properties pressured prices and foreclosures continued — another drag on prices. The inventory of unsold homes ended the period higher than it started, at 8.9 and 8.6 months for new and existing homes, respectively, according to the National Association of Realtors and a joint release from the U.S. Census Bureau and the U.S. Department of Housing and Urban Development. The new year brought more disappointing news: Existing home sales fell in January 2011 after three months of sustained improvement. Tight credit and weak appraisals were cited as possible reasons for the decline.
Reports from the business side of the economy were generally positive. A key measure of the nation’s manufacturing situation — the Institute for Supply Management’s Index — took a somewhat surprising turn higher in the final months of the period. Technology spending rose 12% in 2010, according to the NPD Group, a national marketing research firm. Purchases of computers, networking and software returned to prerecession levels. Industrial production rose over the period, and manufacturing capacity utilized, per the report issued by the Fed — a key measure of the health of the manufacturing sector — edged higher.
Summary
For the 12-month period that ended March 31, 2011
| | n | | The U.S. stock market, as measured by the S&P 500 Index, delivered solid returns, despite a summer 2010 correction. Foreign stock market returns were also positive, as measured by the MSCI EAFE Index (Net). | |
| | |
| S&P Index | | MSCI Index |
| |

| |
|
15.65% | | 10.42% |
| | n | | Strengthening economic growth and rising interest rates kept a lid on most bond market sectors. The Barclays Capital Aggregate Bond Index delivered modest results. However, high-yield bonds were strong performers, as measured by the JPMorgan Developed BB High Yield Index. | |
| | |
| Barclays Aggregate Index | | JPMorgan Index |
| |
| |
|
5.12% | | 13.04% |
2
Economic Update (continued) – Columbia Select Small Cap Fund
Stocks moved higher despite summer 2010 decline
Against a strengthening economic backdrop, stock prices continued to rally despite a summer 2010 setback linked to a debt crisis brewing in Europe, which raised concerns among U.S. investors. These fears were short-lived and stocks regained their footing. In this environment, the S&P 500 Index1 returned 15.65% for the 12 months through March 31, 2011. Outside the United States, stock markets also delivered solid gains. The MSCI EAFE Index (Net),2 a broad gauge of stock market performance in foreign developed markets, returned 10.42% (in U.S. dollars) for the 12-month period, as concerns about the impact of a bailout for weak euro zone economies eased yet continued to restrain market performance. Emerging stock markets were strong. The MSCI Emerging Markets Index (Net)3 returned 18.46% (in U.S. dollars) for the 12-month period.
Bonds delivered modest returns
As the economy strengthened and interest rates edged higher, most bond sectors delivered modest returns. The Barclays Capital Aggregate Bond Index4 returned 5.12%. High-yield bonds led the fixed-income markets. For the 12 months covered by this report, the JPMorgan Developed BB High Yield Index5 returned 13.04% as default fears abated and investors grew more comfortable with risk. Despite rising yields in the second half of the period, the Treasury market was also positive. The Barclays Capital U.S. Treasury Index6 returned 4.53%. However, municipal bonds struggled in the second half of the period, as interest rates inched higher and issue supply surged ahead of the year-end expiration of the Build America Bonds program. The Barclays Capital Municipal Bond Index7 gained 1.63% for the period. Despite positive economic activity, the Fed kept a key short-term interest rate — the federal funds rate — close to zero, reflecting ongoing concerns about employment and the housing market.
Past performance is no guarantee of future results.
| 1 | The Standard & Poor’s (S&P) 500 Index tracks the performance of 500 widely held, large-capitalization U.S. stocks. |
| 2 | The Morgan Stanley Capital International Europe, Australasia, Far East (MSCI EAFE) Index (Net) is a free float-adjusted market capitalization index that is designed to measure the equity market performance of developed markets, excluding the U.S. & Canada. As of December 31, 2010, the MSCI EAFE Index (Net) consisted of the following 22 developed market country indices: Australia, Austria, Belgium, Denmark, Finland, France, Germany, Greece, Hong Kong, Ireland, Israel, Italy, Japan, the Netherlands, New Zealand, Norway, Portugal, Singapore, Spain, Sweden, Switzerland and the United Kingdom. |
| 3 | The Morgan Stanley Capital International Emerging Markets (MSCI EM) Index (Net) is a free float-adjusted market capitalization index that is designed to measure equity market performance of emerging markets. As of December 31, 2010, the MSCI EM Index (Net) consisted of the following 21 emerging market country indices: Brazil, Chile, China, Colombia, Czech Republic, Egypt, Hungary, India, Indonesia, Korea, Malaysia, Mexico, Morocco, Peru, Philippines, Poland, Russia, South Africa, Taiwan, Thailand and Turkey. |
| 4 | The Barclays Capital Aggregate Bond Index is a market value-weighted index that tracks the daily price, coupon, pay-downs and total return performance of fixed-rate, publicly placed, dollar-denominated and non-convertible investment grade debt issues with at least $250 million par amount outstanding and with at least one year to final maturity. |
| 5 | The JPMorgan Developed BB High Yield Index is an unmanaged index designed to mirror the investable universe of the U.S. dollar developed, BB-rated, high yield corporate debt market. |
| 6 | The Barclays Capital U.S. Treasury Index includes public obligations of the U.S. Treasury. Treasury bills are excluded by the maturity constraint. In addition, certain special issues, such as state and local government series bonds (SLGs), as well as U.S.Treasury TIPS, are excluded. STRIPS are excluded from the index because their inclusion would result in double-counting. |
| 7 | The Barclays Capital Municipal Bond Index is considered representative of the broad market for investment-grade, tax-exempt bonds with a maturity of at least one year. |
Indices are not available for investment, are not professionally managed and do not reflect sales charges, fees, brokerage commissions, taxes or other expenses of investing. Securities in the fund may not match those in an index.
3
Performance Information – Columbia Select Small Cap Fund
Performance data quoted represents past performance and current performance may be lower or higher. Past performance is no guarantee of future results. The investment return and principal value will fluctuate so that shares, when redeemed, may be worth more or less than the original cost. Please visit www.columbiamanagement.com for daily and most recent month-end performance updates.
| | | | |
| Net asset value per share | |
| |
as of 03/31/11 ($) | | | | |
Class A | | | 18.55 | |
Class C | | | 18.07 | |
Class R | | | 18.06 | |
Class Z | | | 18.69 | |
|
| Performance of a $10,000 investment 04/01/01 – 03/31/11 |
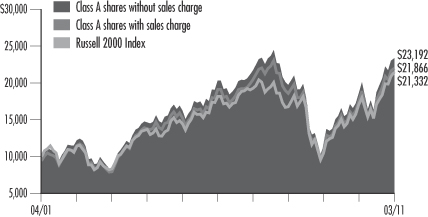
The chart above shows the change in value of a hypothetical $10,000 investment in Class A shares of Columbia Select Small Cap Fund during the stated time period, and does not reflect the deduction of taxes that a shareholder may pay on fund distributions or on the redemption of fund shares.
| | | | | | | | |
| Performance of a $10,000 investment 04/01/01 – 03/31/11 ($) | |
| | |
| Sales charge | | without | | | with | |
Class A | | | 23,192 | | | | 21,866 | |
Class C | | | 22,597 | | | | 22,597 | |
Class R | | | 22,627 | | | | n/a | |
Class Z | | | 23,366 | | | | n/a | |
| | | | | | | | | | | | | | | | | | | | | | | | |
| Average annual total return as of 03/31/11 (%) | |
| | | | |
| Share class | | A | | | C | | | R | | | Z | |
| Inception | | 09/28/07 | | | 09/28/07 | | | 12/31/04 | | | 12/31/92 | |
| Sales charge | | without | | | with | | | without | | | with | | | without | | | without | |
1-year | | | 25.85 | | | | 18.61 | | | | 24.97 | | | | 23.97 | | | | 25.59 | | | | 26.20 | |
5-year | | | 2.81 | | | | 1.61 | | | | 2.28 | | | | 2.28 | | | | 2.43 | | | | 2.97 | |
10-year | | | 8.78 | | | | 8.14 | | | | 8.49 | | | | 8.49 | | | | 8.51 | | | | 8.86 | |
The “with sales charge” returns include the maximum initial sales charge of 5.75% for Class A shares and the applicable contingent deferred sales charge of 1.00% for Class C shares for the first year only. The “without sales charge” returns do not include the effect of sales charges. If they had, returns would be lower.
The Fund commenced operations on March 31, 2008. The returns of the Class A and Class C shares shown for periods prior to March 31, 2008 include the returns of Class A shares or Class C shares, as applicable, of Small Cap Fund, the predecessor to the Fund and a series of Excelsior Funds, Inc. (the “Predecessor Fund”), for periods after September 27, 2007, and include the returns of Shares class shares of the Predecessor Fund for periods prior to September 28, 2007. The returns shown reflect applicable sales charges, but have not been adjusted to reflect differences in expenses. If differences in expenses were reflected, the returns shown for the periods prior to September 28, 2007 would be lower. The returns of the Class R shares shown for periods prior to March 31, 2008 include the returns of Retirement Shares class shares of the Predecessor Fund for periods after December 30, 2004, and include the returns of Shares class shares of the Predecessor Fund for periods prior to December 31, 2004. The returns shown reflect that Class R shares are sold without sales charges, but have not been adjusted to reflect differences in expenses. If differences in expenses were reflected, the returns shown for periods prior to March 31, 2008 would be lower. The returns of the Class Z shares shown for periods prior to March 31, 2008 are those of the Shares class shares of the Predecessor Fund. The returns of Class Z shares shown have not been adjusted to reflect differences in expenses.
Inception date refers to the date on which the Predecessor Fund class commenced operations.
Performance results reflect any fee waivers or reimbursements of fund expenses by the investment advisor and/or any of its affiliates. Absent these fee waivers or expense reimbursement arrangements, performance results would have been lower.
All results shown assume reinvestment of distributions. Class Z shares are sold at net asset value with no distribution and service (Rule 12b-1) fees. Class R shares are sold at net asset value with distribution (Rule 12b-1) fees. Class R and Class Z shares have limited eligibility and the investment minimum requirements may vary. Please see the fund’s prospectus for details. Performance for different share classes will vary based on differences in sales charges and fees associated with each class.
The tables do not reflect the deduction of taxes that a shareholder may pay on fund distributions or on the redemption of fund shares.
4
Understanding Your Expenses – Columbia Select Small Cap Fund
As a fund shareholder, you incur two types of costs. There are transaction costs and ongoing costs, which generally include investment advisory fees, distribution and service (Rule 12b-1) fees and other fund expenses. The information on this page is intended to help you understand the ongoing costs of investing in the fund and to compare these costs with the ongoing costs of investing in other mutual funds.
Analyzing your fund’s expenses by share class
To illustrate these ongoing costs, we have provided an example and calculated the expenses paid by investors in each share class during the period. The information in the following table is based on an initial investment of $1,000, which is invested at the beginning of the period and held for the entire period. Expense information is calculated two ways and each method provides you with different information. The amount listed in the “Actual” column is calculated using the fund’s actual operating expenses and total return for the period. The amount listed in the “Hypothetical” column for each share class assumes that the return each year is 5% before expenses and is calculated based on the fund’s actual operating expenses. You should not use the hypothetical account values and expenses to estimate either your actual account balance at the end of the period or the expenses you paid during this period.
Compare with other funds
Since all mutual funds are required to include the same hypothetical calculations about expenses in shareholder reports, you can use this information to compare the ongoing costs of investing in the fund with other funds. To do so, compare the 5% hypothetical example with the 5% hypothetical examples that appear in the shareholder reports of other funds. As you compare hypothetical examples of other funds, it is important to note that hypothetical examples are meant to highlight the ongoing costs of investing in a fund and do not reflect any transaction costs, such as sales charges, redemption fees or exchange fees.
Estimating your actual expenses
To estimate the expenses that you paid over the period, first you will need your account balance at the end of the period:
| | n | | For shareholders who receive their account statements from Columbia Management Investment Services Corp., your account balance is available online at www.columbiamanagement.com or by calling Shareholder Services at 800.345.6611. | |
| | n | | For shareholders who receive their account statements from their financial intermediary, contact your financial intermediary to obtain your account balance. | |
| | 1. | Divide your ending account balance by $1,000. For example, if an account balance was $8,600 at the end of the period, the result would be 8.6. | |
| | 2. | In the section of the table below titled “Expenses paid during the period,” locate the amount for your share class. You will find this number in the column labeled “Actual.” Multiply this number by the result from step 1. Your answer is an estimate of the expenses you paid on your account during the period. | |
If the value of your account falls below the minimum initial investment requirement applicable to you, your account may be subject to a $20 annual fee. This fee is not included in the accompanying table. If you are subject to the fee, keep it in mind when you are estimating the ongoing expenses of investing in the fund and when comparing the expenses of this fund with other funds.
| | | | | | | | | | | | | | | | | | | | | | | | | | | | |
| 10/01/10 – 03/31/11 | | | | | | | | | | | | | | | | |
| | | Account value at the
beginning of the period ($) | | | Account value at the
end of the period ($) | | | Expenses paid
during the period ($) | | | Fund’s annualized
expense ratio (%) | |
| | | Actual | | | Hypothetical | | | Actual | | | Hypothetical | | | Actual | | | Hypothetical | | | Actual | |
Class A | | | 1,000.00 | | | | 1,000.00 | | | | 1,245.80 | | | | 1,018.20 | | | | 7.56 | | | | 6.79 | | | | 1.35 | |
Class C | | | 1,000.00 | | | | 1,000.00 | | | | 1,241.90 | | | | 1,014.46 | | | | 11.74 | | | | 10.55 | | | | 2.10 | |
Class R | | | 1,000.00 | | | | 1,000.00 | | | | 1,243.80 | | | | 1,016.95 | | | | 8.95 | | | | 8.05 | | | | 1.60 | |
Class Z | | | 1,000.00 | | | | 1,000.00 | | | | 1,247.70 | | | | 1,019.45 | | | | 6.16 | | | | 5.54 | | | | 1.10 | |
Expenses paid during the period are equal to the annualized expense ratio for the share class, multiplied by the average account value over the period, then multiplied by the number of days in the fund’s most recent fiscal half-year and divided by 365.
Had the Investment Manager and/or any of its affiliates not waived fees or reimbursed a portion of expenses, account value at the end of the period would have been reduced.
It is important to note that the expense amounts shown in the table are meant to highlight only ongoing costs of investing in the fund and do not reflect any transaction costs, such as sales charges, redemption fees or exchange fees. Therefore, the hypothetical examples provided may not help you determine the relative total costs of owning shares of different funds. If these transaction costs were included, your costs would have been higher.
5
Portfolio Manager’s Report – Columbia Select Small Cap Fund
Performance data quoted represents past performance and current performance may be lower or higher. Past performance is no guarantee of future results. The investment return and principal value will fluctuate so that shares, when redeemed, may be worth more or less than the original cost. Please visit www.columbiamanagement.com for daily and most recent month-end performance updates.
| | | | |
| Top 10 holdings | | | |
| |
as of 03/31/11 (%) | | | | |
Endo Pharmaceuticals | | | 3.2 | |
SM Energy | | | 3.1 | |
Helmerich & Payne | | | 3.1 | |
Athenahealth | | | 3.1 | |
Legg Mason | | | 3.0 | |
Chicago Bridge & Iron | | | 2.9 | |
Fair Isaac | | | 2.9 | |
Kansas City Southern | | | 2.8 | |
STEC | | | 2.8 | |
Power Integrations | | | 2.7 | |
| | | | |
| Top 5 sectors | | | |
| |
as of 03/31/11 (%) | | | | |
Information Technology | | | 28.4 | |
Industrials | | | 18.2 | |
Consumer Discretionary | | | 16.4 | |
Financials | | | 12.9 | |
Health Care | | | 8.6 | |
The fund is actively managed and the composition of its portfolio will change over time. Information provided is calculated as a percentage of net assets.
For the 12-month period that ended March 31, 2011, the fund’s Class A shares returned 25.85% without sales charge. The fund’s benchmark, the Russell 2000 Index, returned 25.79% for the same period. The fund’s return edged out the average return of the funds in its peer group, the Lipper Small-Cap Core Funds Classification, which was 25.20% for the 12-month period. Merger and acquisition (M&A) activity proved especially beneficial to the fund’s return. Overweights in the energy, consumer discretionary and information technology sectors also buoyed the fund’s performance versus its benchmark, as did an underweight in health care. On the downside, underweights in consumer staples and financials held back results.
M&A activity, sector weights boost performance
During the past year, we witnessed an uptick in M&A activity. The fund benefited from this trend, as three of its holdings were acquired by larger companies: Bucyrus International by Caterpillar, the world’s largest construction and mining equipment manufacturer; Hewitt Associates by Aon Corporation, an insurance brokerage company; and CommScope by Carlyle Group, a leveraged buyout firm.
Overweights in energy, consumer discretionary and information technology also were beneficial, as was an underweight in health care. F5 Networks, a technology company that provides software and hardware for interconnectivity systems, was the fund’s top relative contributor. As mobile communications soared, the demand for F5 Networks’ products increased exponentially. We believed F5 Networks had experienced a solid run during the period and sold the stock to benefit from those gains. Turning to the energy sector, SM Energy and Helmerich & Payne (each 3.1% of net assets) rose with improving conditions in the energy market. SM Energy, a natural gas company, gained steadily as oil prices pushed higher, creating stronger demand for natural gas, which is considered an alternative to oil. Helmerich & Payne, an oil and gas driller, also benefited from higher prices and demand. In consumer discretionary, home goods retailer Williams-Sonoma (2.1% of net assets) was a solid performer, as its Internet sales grew when consumers began spending amid the economic recovery. International art auctioneer Sotheby’s (2.2% of net assets) also bolstered returns. As emerging-market economies have continued to acquire wealth, consumers from China, India and Russia are buying artwork native to their home countries, creating strong demand for Sotheby’s services.
Financials, homebuilding stocks detract
The fund had less exposure than the index to financials, which tempered the fund’s relative performance. In financials, independent investment bank Greenhill (1.7% of net assets) held back results. While M&A activity showed some improvement, it was not enough to lift Greenhill’s stock. We continued to believe this company would benefit from the improving economy and consolidation in several sectors, so we maintained the fund’s position in the stock. Turning to consumer discretionary, a sector that generally did well for the fund, owning homebuilder Ryland Group (1.8% of net assets) proved detrimental. We believe homebuilding and the housing market have reached a bottom and held on to Ryland Group, as we maintain conviction that the company will benefit from improving economic conditions.
6
Portfolio Manager’s Report (continued) – Columbia Select Small Cap Fund
Looking ahead
We believe that the economy is shifting from slow growth to moderate improvement. There is an increased potential for inflation, as well as the possibility of a lower unemployment rate. However, we are cautious about predicting the future, as it does not affect the fund’s positioning. We aim to uncover stocks that represent low risk with a high potential for return over the long term, concentrating the fund’s assets in those stocks in which we have a high conviction. As such, we have reduced the fund’s positions in several stocks that have recently experienced strong gains, such as F5 Networks, Sotheby’s and Williams-Sonoma. We have used the proceeds to establish or increase positions in companies where we believe there are greater growth opportunities, such as regional banks and homebuilders. We also added to the fund’s health care weight, building larger positions in Endo Pharmaceuticals Holdings (3.2% of net assets) and Charles River Laboratories (1.2% of net assets).
Portfolio characteristics and holdings are subject to change periodically and may not be representative of current characteristics and holdings. The outlook for the fund may differ from that presented for other Columbia Funds.
Equity securities are affected by stock market fluctuations that occur in response to economic and business developments.
Stocks of small-cap companies pose special risks, including possible illiquidity and greater price volatility than stocks of larger, more established companies.
7
Investment Portfolio – Columbia Select Small Cap Fund
March 31, 2011
Common Stocks – 99.6%
| | | | | | | | |
| | | Shares | | | Value ($) | |
| Consumer Discretionary – 16.4% | | | | | | | | |
| Diversified Consumer Services – 4.4% | | | | | |
Coinstar, Inc. (a) | | | 300,000 | | | | 13,776,000 | |
Sotheby’s | | | 260,000 | | | | 13,676,000 | |
| |
Diversified Consumer Services Total | | | | | | | 27,452,000 | |
|
Hotels, Restaurants & Leisure – 2.0% | |
P.F. Chang’s China Bistro, Inc. | | | 260,000 | | | | 12,009,400 | |
| |
Hotels, Restaurants & Leisure Total | | | | | | | 12,009,400 | |
|
Household Durables – 6.0% | |
Harman International Industries, Inc. | | | 280,000 | | | | 13,109,600 | |
Meritage Home Corp. (a) | | | 540,000 | | | | 13,030,200 | |
Ryland Group, Inc. | | | 700,000 | | | | 11,130,000 | |
| |
Household Durables Total | | | | | | | 37,269,800 | |
|
Specialty Retail – 2.1% | |
Williams-Sonoma, Inc. | | | 320,000 | | | | 12,960,000 | |
| |
Specialty Retail Total | | | | | | | 12,960,000 | |
|
Textiles, Apparel & Luxury Goods – 1.9% | |
Timberland Co., Class A (a) | | | 280,000 | | | | 11,561,200 | |
| |
Textiles, Apparel & Luxury Goods Total | | | | 11,561,200 | |
| | | | | | | | |
Consumer Discretionary Total | | | | 101,252,400 | |
| | | | | | | | |
| Consumer Staples – 1.0% | |
| Food Products – 1.0% | |
Dean Foods Co. (a) | | | 600,000 | | | | 6,000,000 | |
| |
Food Products Total | | | | 6,000,000 | |
| | | | | | | | |
Consumer Staples Total | | | | 6,000,000 | |
| | | | | | | | |
| Energy – 7.3% | |
| Energy Equipment & Services – 3.1% | |
Helmerich & Payne, Inc. | | | 280,000 | | | | 19,233,200 | |
| |
Energy Equipment & Services Total | | | | | | | 19,233,200 | |
|
Oil, Gas & Consumable Fuels – 4.2% | |
Comstock Resources, Inc. (a) | | | 120,000 | | | | 3,712,800 | |
James River Coal Co. (a) | | | 120,000 | | | | 2,900,400 | |
SM Energy Co. | | | 260,000 | | | | 19,289,400 | |
| |
Oil, Gas & Consumable Fuels Total | | | | 25,902,600 | |
| | | | | | | | |
Energy Total | | | | 45,135,800 | |
| | | | | | | | |
| Financials – 12.9% | |
| Capital Markets – 6.2% | |
Greenhill & Co., Inc. | | | 160,000 | | | | 10,526,400 | |
KBW, Inc. | | | 360,000 | | | | 9,428,400 | |
Legg Mason, Inc. | | | 510,000 | | | | 18,405,900 | |
| |
Capital Markets Total | | | | | | | 38,360,700 | |
| | | | | | | | |
| | | Shares | | | Value ($) | |
| Commercial Banks – 6.7% | |
City National Corp. | | | 220,000 | | | | 12,551,000 | |
Wintrust Financial Corp. | | | 400,000 | | | | 14,700,000 | |
Zions Bancorporation | | | 620,000 | | | | 14,297,200 | |
| |
Commercial Banks Total | | | | 41,548,200 | |
| | | | | | | | |
Financials Total | | | | 79,908,900 | |
| | | | | | | | |
| Health Care – 8.6% | |
| Health Care Equipment & Supplies – 1.1% | |
Cooper Companies, Inc. | | | 100,000 | | | | 6,945,000 | |
| |
Health Care Equipment & Supplies Total | | | | | | | 6,945,000 | |
|
Health Care Technology – 3.1% | |
athenahealth, Inc. (a) | | | 420,000 | | | | 18,954,600 | |
| |
Health Care Technology Total | | | | | | | 18,954,600 | |
|
Life Sciences Tools & Services – 1.2% | |
Charles River Laboratories International, Inc. (a) | | | 200,000 | | | | 7,676,000 | |
| |
Life Sciences Tools & Services Total | | | | | | | 7,676,000 | |
|
Pharmaceuticals – 3.2% | |
Endo Pharmaceuticals Holdings, Inc. (a) | | | 520,000 | | | | 19,843,200 | |
| |
Pharmaceuticals Total | | | | 19,843,200 | |
| | | | | | | | |
Health Care Total | | | | 53,418,800 | |
| | | | | | | | |
| Industrials – 18.2% | |
| Building Products – 3.9% | |
Quanex Building Products Corp. | | | 620,000 | | | | 12,170,600 | |
Simpson Manufacturing Co., Inc. | | | 400,000 | | | | 11,784,000 | |
| |
Building Products Total | | | | | | | 23,954,600 | |
|
Construction & Engineering – 7.6% | |
Chicago Bridge & Iron Co., NV, N.Y. Registered Shares | | | 440,000 | | | | 17,890,400 | |
Granite Construction, Inc. | | | 420,000 | | | | 11,802,000 | |
Layne Christensen Co. (a) | | | 200,000 | | | | 6,900,000 | |
Shaw Group, Inc. (a) | | | 300,000 | | | | 10,623,000 | |
| |
Construction & Engineering Total | | | | | | | 47,215,400 | |
|
Machinery – 2.7% | |
AGCO Corp. (a) | | | 300,000 | | | | 16,491,000 | |
| |
Machinery Total | | | | | | | 16,491,000 | |
|
Professional Services – 1.2% | |
FTI Consulting, Inc. (a) | | | 200,000 | | | | 7,666,000 | |
| |
Professional Services Total | | | | | | | 7,666,000 | |
See Accompanying Notes to Financial Statements.
8
Columbia Select Small Cap Fund
March 31, 2011
Common Stocks (continued)
| | | | | | | | |
| | | Shares | | | Value ($) | |
| Industrials (continued) | |
| Road & Rail – 2.8% | |
Kansas City Southern (a) | | | 320,000 | | | | 17,424,000 | |
| |
Road & Rail Total | | | | 17,424,000 | |
| | | | | | | | |
Industrials Total | | | | 112,751,000 | |
| | | | | | | | |
| Information Technology – 28.4% | |
| Communications Equipment – 5.0% | |
InterDigital, Inc. | | | 320,000 | | | | 15,267,200 | |
Plantronics, Inc. | | | 420,000 | | | | 15,380,400 | |
| |
Communications Equipment Total | | | | | | | 30,647,600 | |
|
Computers & Peripherals – 2.8% | |
STEC, Inc. (a) | | | 860,000 | | | | 17,277,400 | |
| |
Computers & Peripherals Total | | | | | | | 17,277,400 | |
|
Electronic Equipment, Instruments & Components – 1.2% | |
Molex, Inc. | | | 300,000 | | | | 7,536,000 | |
| |
Electronic Equipment, Instruments & Components Total | | | | | | | 7,536,000 | |
|
Internet Software & Services – 2.7% | |
Digital River, Inc. (a) | | | 220,000 | | | | 8,234,600 | |
j2 Global Communications, Inc. (a) | | | 280,000 | | | | 8,262,800 | |
| |
Internet Software & Services Total | | | | | | | 16,497,400 | |
|
IT Services – 5.6% | |
CACI International, Inc., Class A (a) | | | 220,000 | | | | 13,490,400 | |
Forrester Research, Inc. (a) | | | 380,000 | | | | 14,550,200 | |
VeriFone Systems, Inc. (a) | | | 120,000 | | | | 6,594,000 | |
| |
IT Services Total | | | | | | | 34,634,600 | |
|
Semiconductors & Semiconductor Equipment – 2.7% | |
Power Integrations, Inc. | | | 440,000 | | | | 16,865,200 | |
| |
Semiconductors & Semiconductor Equipment Total | | | | | | | 16,865,200 | |
|
Software – 8.4% | |
Fair Isaac Corp. | | | 560,000 | | | | 17,701,600 | |
Kenexa Corp. (a) | | | 380,000 | | | | 10,484,200 | |
Manhattan Associates, Inc. (a) | | | 480,000 | | | | 15,705,600 | |
Websense, Inc. (a) | | | 360,000 | | | | 8,269,200 | |
| |
Software Total | | | | 52,160,600 | |
| | | | | | | | |
Information Technology Total | | | | 175,618,800 | |
| | | | | | | | |
| Materials – 5.9% | |
| Chemicals – 4.0% | |
Intrepid Potash, Inc. (a) | | | 360,000 | | | | 12,535,200 | |
OM Group, Inc. (a) | | | 340,000 | | | | 12,423,600 | |
| |
Chemicals Total | | | | | | | 24,958,800 | |
| | | | | | | | |
| | | Shares | | | Value ($) | |
| Metals & Mining – 1.9% | |
Materion Corp (a) | | | 280,000 | | | | 11,424,000 | |
| |
Metals & Mining Total | | | | 11,424,000 | |
| | | | | | | | |
Materials Total | | | | 36,382,800 | |
| | | | | | | | |
| Telecommunication Services – 0.9% | |
| Diversified Telecommunication Services – 0.9% | |
Iridium Communications, Inc. (a) | | | 700,000 | | | | 5,579,000 | |
| |
Diversified Telecommunication Services Total | | | | | | | 5,579,000 | |
| | | | | | | | |
Telecommunication Services Total | | | | 5,579,000 | |
| | | | | | | | |
Total Common Stocks
(cost of $424,549,361) | | | | | | | 616,047,500 | |
| | |
Short-Term Obligation – 0.8% | | | | | | | | |
| | | Par ($) | | | | |
Repurchase agreement with Fixed Income Clearing Corp., dated 03/31/11, due 04/01/11 at 0.070%, collateralized by a U.S. Government Agency obligation maturing 06/23/15, market value $4,754,813 (repurchase proceeds $4,660,009) | | | 4,660,000 | | | | 4,660,000 | |
| | | | | | | | |
Total Short-Term Obligation
(cost of $4,660,000) | | | | 4,660,000 | |
| | | | | | | | |
Total Investments – 100.4%
(cost of $429,209,361) (b) | | | | 620,707,500 | |
| | | | | | | | |
Other Assets & Liabilities, Net – (0.4)% | | | | (2,421,264 | ) |
| | | | | | | | |
Net Assets – 100.0% | | | | 618,286,236 | |
Notes to Investment Portfolio:
| (a) | Non-income producing security. |
| (b) | Cost for federal income tax purposes is $429,680,411. |
Generally accepted accounting principles (GAAP) require disclosure regarding the inputs and valuation techniques used to measure fair value and any changes in valuation inputs or techniques. In addition, investments shall be disclosed by major category.
The Fund categorizes its fair value measurements according to a three-level hierarchy that maximizes the use of observable inputs and minimizes the use of unobservable inputs by prioritizing that the most observable input be used when available. Observable inputs are those that market participants would use in pricing an investment based on market data obtained from sources independent of the reporting entity. Unobservable inputs are those that reflect the Fund’s assumptions about the information market participants would use in pricing an investment. An investment’s level within the fair value hierarchy is based on the lowest level of any input that is deemed significant to the asset or liability’s fair value measurement. The input levels are not necessarily an indication of the risk or liquidity associated with investments at that level. For example, certain U.S. government securities are generally high quality and liquid, however, they are reflected as Level 2 because the inputs used to determine fair value may not always be quoted prices in an active market.
See Accompanying Notes to Financial Statements.
9
Columbia Select Small Cap Fund
March 31, 2011
Fair value inputs are summarized in the three broad levels listed below:
| • | | Level 1 — Valuations based on quoted prices for investments in active markets that the Fund has the ability to access at the measurement date (including NAV for open-end mutual funds). Valuation adjustments are not applied to Level 1 investments. |
| • | | Level 2 — Valuations based on other significant observable inputs (including quoted prices for similar securities, interest rates, prepayment speeds, credit risks, etc.). |
| • | | Level 3 — Valuations based on significant unobservable inputs (including the Fund’s own assumptions and judgment in determining the fair value of investments). |
Inputs that are used in determining fair value of an investment may include price information, credit data, volatility statistics, and other factors. These inputs can be either observable or unobservable. The availability of observable inputs can vary between investments, and is affected by various factors such as the type of investment, and the volume and level of activity for that investment or similar investments in the marketplace. The inputs will be considered by the Investment Manager, along with any other relevant factors in the calculation of an investment’s fair value. The Fund uses prices and inputs that are current as of the measurement date, which may include periods of market dislocations. During these periods, the availability of prices and inputs may be reduced for many investments. This condition could cause an investment to be reclassified between the various levels within the hierarchy. Non-U.S. equity securities actively traded in foreign markets may be reflected in Level 2 despite the availability of closing prices, because the Fund evaluates and determines whether those closing prices reflect fair value at the close of the New York Stock Exchange (NYSE) or require adjustment, as described in Note 2 to the financial statements — Security Valuation.
Investments falling into the Level 3 category are primarily supported by quoted prices from brokers and dealers participating in the market for those investments. However, these may be classified as Level 3 investments due to lack of market transparency and corroboration to support these quoted prices. Additionally, valuation models may be used as the pricing source for any remaining investments classified as Level 3. These models rely on one or more significant unobservable inputs and/or significant assumptions by the Investment Manager. Inputs used in valuations may include, but are not limited to, financial statement analysis, capital account balances, discount rates and estimated cash flows, and comparable company data.
The following table is a summary of the inputs used to value the Fund’s investments as of March 31, 2011:
| | | | | | | | | | | | | | | | |
Description | | Quoted
Prices
(Level 1) | | | Other
Significant
Observable
Inputs
(Level 2) | | | Significant
Unobservable
Inputs
(Level 3) | | | Total | |
Total Common Stocks | | $ | 616,047,500 | | | $ | — | | | $ | — | | | $ | 616,047,500 | |
| | | | | | | | | | | | | | | | |
Total Short-Term Obligation | | | — | | | | 4,660,000 | | | | — | | | | 4,660,000 | |
| | | | | | | | | | | | | | | | |
Total Investments | | $ | 616,047,500 | | | $ | 4,660,000 | | | $ | — | | | $ | 620,707,500 | |
| | | | | | | | | | | | | | | | |
The Fund’s assets assigned to the Level 2 input category represent certain short-term obligations which are valued using amortized cost, an income approach which converts future cash flows to a present value based upon the discount or premium at purchase.
There were no significant transfers of financial assets between Levels 1 and 2 during the period.
At March 31, 2011, the Fund held investments in the following sectors:
| | | | |
Sector | | % of
Net Assets | |
Information Technology | | | 28.4 | |
Industrials | | | 18.2 | |
Consumer Discretionary | | | 16.4 | |
Financials | | | 12.9 | |
Health Care | | | 8.6 | |
Energy | | | 7.3 | |
Materials | | | 5.9 | |
Consumer Staples | | | 1.0 | |
Telecommunication Services | | | 0.9 | |
| | | | |
| | | 99.6 | |
Short-Term Obligation | | | 0.8 | |
Other Assets & Liabilities, Net | | | (0.4 | ) |
| | | | |
| | | 100.0 | |
| | | | |
See Accompanying Notes to Financial Statements.
10
Statement of Assets and Liabilities – Columbia Select Small Cap Fund
March 31, 2011
| | | | | | |
| | | | | ($) | |
| Assets | | Total investments, at identified cost | | | 429,209,361 | |
| | | | | | |
| | Total investments, at value | | | 620,707,500 | |
| | Cash | | | 345 | |
| | Receivable for: | | | | |
| | Investments sold | | | 795,201 | |
| | Fund shares sold | | | 133,972 | |
| | Dividends | | | 162,450 | |
| | Interest | | | 9 | |
| | Expense reimbursement due from the Investment Manager | | | 1,987 | |
| | Trustees’ deferred compensation plan | | | 20,223 | |
| | Prepaid expenses | | | 19,825 | |
| | | | | | |
| | Total Assets | | | 621,841,512 | |
| | |
| Liabilities | | Payable for: | | | | |
| | Investments purchased | | | 1,860,760 | |
| | Fund shares repurchased | | | 1,047,950 | |
| | Investment advisory fee | | | 384,062 | |
| | Administration fee | | | 65,996 | |
| | Pricing and bookkeeping fees | | | 10,928 | |
| | Transfer agent fee | | | 82,084 | |
| | Trustees’ fees | | | 1,141 | |
| | Custody fee | | | 6,194 | |
| | Distribution and service fees | | | 9,239 | |
| | Chief compliance officer expenses | | | 326 | |
| | Interest | | | 48 | |
| | Trustees’ deferred compensation plan | | | 20,223 | |
| | Other liabilities | | | 66,325 | |
| | | | | | |
| | Total Liabilities | | | 3,555,276 | |
| | |
| | | | | | |
| | Net Assets | | | 618,286,236 | |
| | |
| Net Assets Consist of | | Paid-in capital | | | 465,391,074 | |
| | Accumulated net investment loss | | | (18,162 | ) |
| | Accumulated net realized loss | | | (38,584,815 | ) |
| | Net unrealized appreciation on investments | | | 191,498,139 | |
| | |
| | | | | | |
| | Net Assets | | | 618,286,236 | |
See Accompanying Notes to Financial Statements.
11
Statement of Assets and Liabilities (continued) – Columbia Select Small Cap Fund
March 31, 2011
| | | | | | |
| | | | | | |
| Class A | | Net assets | | $ | 18,020,157 | |
| | Shares outstanding | | | 971,212 | |
| | Net asset value per share | | $ | 18.55 | (a) |
| | Maximum sales charge | | | 5.75 | % |
| | Maximum offering price per share ($18.55/0.9425) | | $ | 19.68 | (b) |
| | |
| Class C | | Net assets | | $ | 1,300,931 | |
| | Shares outstanding | | | 72,007 | |
| | Net asset value and offering price per share | | $ | 18.07 | (a) |
| | |
| Class R | | Net assets | | $ | 10,617,872 | |
| | Shares outstanding | | | 587,811 | |
| | Net asset value, offering and redemption price per share | | $ | 18.06 | |
| | |
| Class Z | | Net assets | | $ | 588,347,276 | |
| | Shares outstanding | | | 31,480,531 | |
| | Net asset value, offering and redemption price per share | | $ | 18.69 | |
| (a) | Redemption price per share is equal to net asset value less any applicable contingent deferred sales charge. |
| (b) | On sales of $50,000 or more the offering price is reduced. |
See Accompanying Notes to Financial Statements.
12
Statement of Operations – Columbia Select Small Cap Fund
For the Year Ended March 31, 2011
| | | | | | |
| | | | | ($) | |
| Investment Income | | Dividends | | | 4,462,700 | |
| | Interest | | | 2,969 | |
| | Foreign taxes withheld | | | (3,750 | ) |
| | | | | | |
| | Total Investment Income | | | 4,461,919 | |
| | |
| Expenses | | Investment advisory fee | | | 4,232,065 | |
| | Administration fee | | | 723,809 | |
| | Distribution fee: | | | | |
| | Class C | | | 9,455 | |
| | Class R | | | 47,504 | |
| | Service fee: | | | | |
| | Class A | | | 39,834 | |
| | Class C | | | 3,152 | |
| | Transfer agent fee | | | 802,839 | |
| | Pricing and bookkeeping fees | | | 123,468 | |
| | Trustees’ fees | | | 36,081 | |
| | Custody fee | | | 26,378 | |
| | Chief compliance officer expenses | | | 1,496 | |
| | Other expenses | | | 259,698 | |
| | | | | | |
| | Expenses before interest expense | | | 6,305,779 | |
| | Interest expense | | | 7,932 | |
| | | | | | |
| | Total Expenses | | | 6,313,711 | |
| | |
| | Fees waived or expenses reimbursed by Investment Manager | | | (7,285 | ) |
| | Expense reductions | | | — | * |
| | | | | | |
| | Net Expenses | | | 6,306,426 | |
| | |
| | | | | | |
| | Net Investment Loss | | | (1,844,507 | ) |
| | |
| Net Realized and Unrealized Gain (Loss) on Investments | | Net realized gain on investments | | | 95,064,234 | |
| | Net change in unrealized appreciation (depreciation) on investments | | | 38,993,847 | |
| | | | | | |
| | Net Gain | | | 134,058,081 | |
| | |
| | | | | | |
| | Net Increase Resulting from Operations | | | 132,213,574 | |
See Accompanying Notes to Financial Statements.
13
Statement of Changes in Net Assets – Columbia Select Small Cap Fund
| | | | | | | | | | |
| | | | | Year Ended March 31, | |
| Increase (Decrease) in Net Assets | | | | 2011 ($) | | | 2010 ($) | |
| Operations | | Net investment loss | | | (1,844,507 | ) | | | (1,924,947 | ) |
| | Net realized gain (loss) on investments | | | 95,064,234 | | | | (9,941,861 | ) |
| | Net change in unrealized appreciation (depreciation) on investments | | | 38,993,847 | | | | 239,917,915 | |
| | | | | | | | | | |
| | Net increase resulting from operations | | | 132,213,574 | | | | 228,051,107 | |
| | | |
| | Net Capital Stock Transactions | | | (137,897,113 | ) | | | 60,662,968 | |
| | | |
| | Increase from regulatory settlements | | | — | | | | 18,764 | |
| | | | | | | | | | |
| | Total increase (decrease) in net assets | | | (5,683,539 | ) | | | 288,732,839 | |
| | | |
| Net Assets | | Beginning of period | | | 623,969,775 | | | | 335,236,936 | |
| | End of period | | | 618,286,236 | | | | 623,969,775 | |
| | Accumulated net investment loss at end of period | | | (18,162 | ) | | | (11,483 | ) |
See Accompanying Notes to Financial Statements.
14
Statement of Changes in Net Assets (continued) – Columbia Select Small Cap Fund
| | | | | | | | | | | | | | | | |
| | | Capital Stock Activity | |
| | | Year Ended
March 31, 2011 | | | Year Ended
March 31, 2010 | |
| | | Shares | | | Dollars ($) | | | Shares | | | Dollars ($) | |
Class A | | | | | | | | | | | | | | | | |
Subscriptions | | | 286,895 | | | | 4,572,176 | | | | 542,155 | | | | 6,373,440 | |
Redemptions | | | (352,721 | ) | | | (5,529,175 | ) | | | (240,143 | ) | | | (2,988,481 | ) |
| | | | | | | | | | | | | | | | |
Net increase (decrease) | | | (65,826 | ) | | | (956,999 | ) | | | 302,012 | | | | 3,384,959 | |
| | | | |
Class C | | | | | | | | | | | | | | | | |
Subscriptions | | | 24,259 | | | | 382,496 | | | | 32,444 | | | | 420,347 | |
Redemptions | | | (27,673 | ) | | | (453,745 | ) | | | (75,455 | ) | | | (827,092 | ) |
| | | | | | | | | | | | | | | | |
Net decrease | | | (3,414 | ) | | | (71,249 | ) | | | (43,011 | ) | | | (406,745 | ) |
| | | | |
Class R | | | | | | | | | | | | | | | | |
Subscriptions | | | 213,182 | | | | 3,317,215 | | | | 202,194 | | | | 2,483,997 | |
Redemptions | | | (306,421 | ) | | | (4,597,584 | ) | | | (176,360 | ) | | | (2,158,391 | ) |
| | | | | | | | | | | | | | | | |
Net increase (decrease) | | | (93,239 | ) | | | (1,280,369 | ) | | | 25,834 | | | | 325,606 | |
| | | | |
Class Z | | | | | | | | | | | | | | | | |
Subscriptions | | | 5,218,684 | | | | 82,865,441 | | | | 15,743,435 | | | | 191,856,210 | |
Redemptions | | | (14,115,146 | ) | | | (218,453,937 | ) | | | (10,726,335 | ) | | | (134,497,062 | ) |
| | | | | | | | | | | | | | | | |
Net increase (decrease) | | | (8,896,462 | ) | | | (135,588,496 | ) | | | 5,017,100 | | | | 57,359,148 | |
See Accompanying Notes to Financial Statements.
15
Financial Highlights – Columbia Select Small Cap Fund
Selected data for a share outstanding throughout each period is as follows:
| | | | | | | | | | | | | | | | |
| | | Year Ended March 31, | | | Period Ended
March 31, | |
| Class A Shares | | 2011 | | | 2010 | | | 2009 | | | 2008 (a) | |
Net Asset Value, Beginning of Period | | $ | 14.74 | | | $ | 9.08 | | | $ | 16.15 | | | $ | 21.11 | |
| | | | |
Income from Investment Operations: | | | | | | | | | | | | | | | | |
Net investment loss (b) | | | (0.09 | )(c) | | | (0.08 | ) | | | (0.06 | ) | | | (0.05 | ) |
Net realized and unrealized gain (loss) on investments | | | 3.90 | | | | 5.74 | | | | (6.53 | ) | | | (3.43 | ) |
| | | | | | | | | | | | | | | | |
Total from investment operations | | | 3.81 | | | | 5.66 | | | | (6.59 | ) | | | (3.48 | ) |
| | | | |
Less Distributions to Shareholders: | | | | | | | | | | | | | | | | |
From net realized gains | | | — | | | | — | | | | (0.48 | ) | | | (1.48 | ) |
| | | | |
Increase from regulatory settlements | | | — | | | | — | (d) | | | — | (d) | | | — | |
| | | | |
Net Asset Value, End of Period | | $ | 18.55 | | | $ | 14.74 | | | $ | 9.08 | | | $ | 16.15 | |
Total return (e) | | | 25.85 | %(f) | | | 62.33 | % | | | (42.02 | )%(f) | | | (17.38 | )%(f)(g)(h) |
| | | | |
Ratios to Average Net Assets/Supplemental Data: | | | | | | | | | | | | | | | | |
Net expenses before interest expense (i) | | | 1.35 | % | | | 1.36 | % | | | 1.36 | % | | | 1.20 | %(j) |
Interest expense (k) | | | — | % | | | — | % | | | — | % | | | — | %(j) |
Net expenses (i) | | | 1.35 | % | | | 1.36 | % | | | 1.36 | % | | | 1.20 | %(j) |
Waiver/Reimbursement | | | — | %(k) | | | — | | | | 0.04 | % | | | 0.05 | %(j) |
Net investment loss (i) | | | (0.55 | )% | | | (0.63 | )% | | | (0.47 | )% | | | (0.67 | )%(j) |
Portfolio turnover rate | | | 71 | % | | | 73 | % | | | 67 | % | | | 73 | %(g) |
Net assets, end of period (000s) | | $ | 18,020 | | | $ | 15,281 | | | $ | 6,671 | | | $ | 3,436 | |
| (a) | The Predecessor Fund’s Class A shares commenced operations on September 28, 2007. Per share data and total return reflect activity from that date. |
| (b) | Per share data was calculated using the average shares outstanding during the period. |
| (c) | Net investment loss per share reflects a special dividend. The effect of this dividend amounted to $0.03 per share. |
| (d) | Rounds to less than $0.01 per share. |
| (e) | Total return at net asset value assuming all distributions reinvested and no initial sales charge or contingent deferred sales charge. |
| (f) | Had the Investment Manager and/or any of its affiliates not waived fees or reimbursed a portion of expenses, total return would have been reduced. |
| (h) | Total return includes a voluntary reimbursement by the Investment Manager for a realized investment loss due to a trading error. This reimbursement increased total return and net asset value per share by less than 0.01% and less than $0.01, respectively. |
| (i) | The benefits derived from expense reductions had an impact of less than 0.01%. |
| (k) | Rounds to less than 0.01%. |
See Accompanying Notes to Financial Statements.
16
Financial Highlights – Columbia Select Small Cap Fund
Selected data for a share outstanding throughout each period is as follows:
| | | | | | | | | | | | | | | | |
| | | Year Ended March 31, | | | Period Ended
March 31, | |
| Class C Shares | | 2011 | | | 2010 | | | 2009 | | | 2008 (a) | |
Net Asset Value, Beginning of Period | | $ | 14.46 | | | $ | 8.97 | | | $ | 16.10 | | | $ | 21.11 | |
| | | | |
Income from Investment Operations: | | | | | | | | | | | | | | | | |
Net investment loss (b) | | | (0.20 | )(c) | | | (0.16 | ) | | | (0.17 | ) | | | (0.12 | ) |
Net realized and unrealized gain (loss) on investments | | | 3.81 | | | | 5.65 | | | | (6.48 | ) | | | (3.41 | ) |
| | | | | | | | | | | | | | | | |
Total from investment operations | | | 3.61 | | | | 5.49 | | | | (6.65 | ) | | | (3.53 | ) |
| | | | |
Less Distributions to Shareholders: | | | | | | | | | | | | | | | | |
From net realized gains | | | — | | | | — | | | | (0.48 | ) | | | (1.48 | ) |
| | | | |
Increase from regulatory settlements | | | — | | | | — | (d) | | | — | (d) | | | — | |
| | | | |
Net Asset Value, End of Period | | $ | 18.07 | | | $ | 14.46 | | | $ | 8.97 | | | $ | 16.10 | |
Total return (e) | | | 24.97 | %(f) | | | 61.20 | % | | | (42.53 | )%(f) | | | (17.63 | )%(f)(g)(h) |
| | | | |
Ratios to Average Net Assets/Supplemental Data: | | | | | | | | | | | | | | | | |
Net expenses before interest expense (i) | | | 2.10 | % | | | 2.11 | % | | | 2.11 | % | | | 1.95 | %(j) |
Interest expense (k) | | | — | % | | | — | % | | | — | % | | | — | %(j) |
Net expenses (i) | | | 2.10 | % | | | 2.11 | % | | | 2.11 | % | | | 1.95 | %(j) |
Waiver/Reimbursement | | | — | %(k) | | | — | | | | 0.04 | % | | | 0.05 | %(j) |
Net investment loss (i) | | | (1.30 | )% | | | (1.34 | )% | | | (1.31 | )% | | | (1.42 | )%(j) |
Portfolio turnover rate | | | 71 | % | | | 73 | % | | | 67 | % | | | 73 | %(g) |
Net assets, end of period (000s) | | $ | 1,301 | | | $ | 1,090 | | | $ | 1,063 | | | $ | 2,101 | |
| (a) | The Predecessor Fund’s Class C shares commenced operations on September 28, 2007. Per share data and total return reflect activity from that date. |
| (b) | Per share data was calculated using the average shares outstanding during the period. |
| (c) | Net investment loss per share reflects a special dividend. The effect of this dividend amounted to $0.03 per share. |
| (d) | Rounds to less than $0.01 per share. |
| (e) | Total return at net asset value assuming all distributions reinvested and no contingent deferred sales charge. |
| (f) | Had the Investment Manager and/or any of its affiliates not waived fees or reimbursed a portion of expenses, total return would have been reduced. |
| (h) | Total return includes a voluntary reimbursement by the Investment Manager for a realized investment loss due to a trading error. This reimbursement increased total return and net asset value per share by less than 0.01% and less than $0.01, respectively. |
| (i) | The benefits derived from expense reductions had an impact of less than 0.01%. |
| (k) | Rounds to less than 0.01%. |
See Accompanying Notes to Financial Statements.
17
Financial Highlights – Columbia Select Small Cap Fund
Selected data for a share outstanding throughout each period is as follows:
| | | | | | | | | | | | | | | | | | | | |
| | | Year Ended March 31, | |
| Class R Shares | | 2011 | | | 2010 | | | 2009 | | | 2008 (a) | | | 2007 | |
Net Asset Value, Beginning of Period | | $ | 14.38 | | | $ | 8.88 | | | $ | 15.86 | | | $ | 18.98 | | | $ | 19.12 | |
| | | | | |
Income from Investment Operations: | | | | | | | | | | | | | | | | | | | | |
Net investment loss (b) | | | (0.12 | )(c) | | | (0.10 | ) | | | (0.10 | ) | | | (0.21 | ) | | | (0.22 | ) |
Net realized and unrealized gain (loss) on investments | | | 3.80 | | | | 5.60 | | | | (6.40 | ) | | | (1.43 | ) | | | 1.34 | |
| | | | | | | | | | | | | | | | | | | | |
Total from investment operations | | | 3.68 | | | | 5.50 | | | | (6.50 | ) | | | (1.64 | ) | | | 1.12 | |
| | | | | |
Less Distributions to Shareholders: | | | | | | | | | | | | | | | | | | | | |
From net realized gains | | | — | | | | — | | | | (0.48 | ) | | | (1.48 | ) | | | (1.26 | ) |
| | | | | |
Increase from regulatory settlements | | | — | | | | — | (d) | | | — | (d) | | | — | | | | — | |
| | | | | |
Net Asset Value, End of Period | | $ | 18.06 | | | $ | 14.38 | | | $ | 8.88 | | | $ | 15.86 | | | $ | 18.98 | |
Total return (e) | | | 25.59 | %(f) | | | 61.94 | % | | | (42.22 | )%(f) | | | (9.66 | )%(f)(g) | | | 6.23 | % |
| | | | | |
Ratios to Average Net Assets/Supplemental Data: | | | | | | | | | | | | | | | | | | | | |
Net expenses before interest expense (h) | | | 1.60 | % | | | 1.61 | % | | | 1.61 | % | | | 1.70 | % | | | 1.74 | % |
Interest expense | | | — | %(i) | | | — | %(i) | | | — | %(i) | | | — | %(i) | | | — | |
Net expenses (h) | | | 1.60 | % | | | 1.61 | % | | | 1.61 | % | | | 1.70 | % | | | 1.74 | % |
Waiver/Reimbursement | | | — | %(i) | | | — | | | | 0.04 | % | | | 0.04 | % | | | — | |
Net investment loss (h) | | | (0.82 | )% | | | (0.85 | )% | | | (0.80 | )% | | | (1.13 | )% | | | (1.21 | )% |
Portfolio turnover rate | | | 71 | % | | | 73 | % | | | 67 | % | | | 73 | % | | | 52 | % |
Net assets, end of period (000s) | | $ | 10,618 | | | $ | 9,795 | | | $ | 5,819 | | | $ | 6,881 | | | $ | 1,827 | |
| (a) | On March 31, 2008, Retirement Shares class of Small Cap Fund, a series of Excelsior Funds, Inc., was reorganized into the Fund’s Class R. The financial information of the Fund’s Class R includes the financial information of Small Cap Fund’s Retirement Shares class. |
| (b) | Per share data was calculated using the average shares outstanding during the period. |
| (c) | Net investment loss per share reflects a special dividend. The effect of this dividend amounted to $0.03 per share. |
| (d) | Rounds to less than $0.01 per share. |
| (e) | Total return at net asset value assuming all distributions reinvested. |
| (f) | Had the Investment Manager and/or any of its affiliates not waived fees or reimbursed a portion of expenses, total return would have been reduced. |
| (g) | Total return includes a voluntary reimbursement by the Investment Manager for a realized investment loss due to a trading error. This reimbursement increased total return and net asset value per share by less than 0.01% and less than $0.01, respectively. |
| (h) | The benefits derived from expense reductions had an impact of less than 0.01%. |
| (i) | Rounds to less than 0.01%. |
See Accompanying Notes to Financial Statements.
18
Financial Highlights – Columbia Select Small Cap Fund
Selected data for a share outstanding throughout each period is as follows:
| | | | | | | | | | | | | | | | | | | | |
| | | Year Ended March 31, | |
| Class Z Shares | | 2011 | | | 2010 | | | 2009 | | | 2008 (a) | | | 2007 | |
Net Asset Value, Beginning of Period | | $ | 14.81 | | | $ | 9.10 | | | $ | 16.15 | | | $ | 19.21 | | | $ | 19.23 | |
| | | | | |
Income from Investment Operations: | | | | | | | | | | | | | | | | | | | | |
Net investment loss (b) | | | (0.05 | )(c) | | | (0.05 | ) | | | (0.04 | ) | | | (0.12 | ) | | | (0.12 | ) |
Net realized and unrealized gain (loss) on investments | | | 3.93 | | | | 5.76 | | | | (6.53 | ) | | | (1.46 | ) | | | 1.36 | |
| | | | | | | | | | | | | | | | | | | | |
Total from investment operations | | | 3.88 | | | | 5.71 | | | | (6.57 | ) | | | (1.58 | ) | | | 1.24 | |
| | | | | |
Less Distributions to Shareholders: | | | | | | | | | | | | | | | | | | | | |
From net realized gains | | | — | | | | — | | | | (0.48 | ) | | | (1.48 | ) | | | (1.26 | ) |
| | | | | |
Increase from regulatory settlements | | | — | | | | — | (d) | | | — | (d) | | | — | | | | — | |
| | | | | |
Net Asset Value, End of Period | | $ | 18.69 | | | $ | 14.81 | | | $ | 9.10 | | | $ | 16.15 | | | $ | 19.21 | |
Total return (e) | | | 26.20 | %(f) | | | 62.75 | % | | | (41.89 | )%(f) | | | (9.22 | )%(f)(g) | | | 6.83 | % |
| | | | | |
Ratios to Average Net Assets/Supplemental Data: | | | | | | | | | | | | | | | | | | | | |
Net expenses before interest expense (h) | | | 1.10 | % | | | 1.11 | % | | | 1.11 | % | | | 1.20 | % | | | 1.22 | % |
Interest expense | | | — | %(i) | | | — | %(i) | | | — | %(i) | | | — | %(i) | | | — | |
Net expenses (h) | | | 1.10 | % | | | 1.11 | % | | | 1.11 | % | | | 1.20 | % | | | 1.22 | % |
Waiver/Reimbursement | | | — | %(i) | | | — | | | | 0.04 | % | | | 0.04 | % | | | — | |
Net investment loss (h) | | | (0.31 | )% | | | (0.36 | )% | | | (0.31 | )% | | | (0.63 | )% | | | (0.66 | )% |
Portfolio turnover rate | | | 71 | % | | | 73 | % | | | 67 | % | | | 73 | % | | | 52 | % |
Net assets, end of period (000s) | | $ | 588,347 | | | $ | 597,804 | | | $ | 321,684 | | | $ | 676,616 | | | $ | 694,765 | |
| (a) | On March 31, 2008, Shares class of Small Cap Fund, a series of Excelsior Funds, Inc., was reorganized into the Fund’s Class Z. The financial information of the Fund’s Class Z includes the financial information of Small Cap Fund’s Shares class. |
| (b) | Per share data was calculated using the average shares outstanding during the period. |
| (c) | Net investment loss per share reflects a special dividend. The effect of this dividend amounted to $0.03 per share. |
| (d) | Rounds to less than $0.01 per share. |
| (e) | Total return at net asset value assuming all distributions reinvested. |
| (f) | Had the Investment Manager and/or any of its affiliates not waived fees or reimbursed a portion of expenses, total return would have been reduced. |
| (g) | Total return includes a voluntary reimbursement by the Investment Manager for a realized investment loss due to a trading error. This reimbursement increased total return and net asset value per share by less than 0.01% and less than $0.01, respectively. |
| (h) | The benefits derived from expense reductions had an impact of less than 0.01%. |
| (i) | Rounds to less than 0.01%. |
See Accompanying Notes to Financial Statements.
19
Notes to Financial Statements – Columbia Select Small Cap Fund
March 31, 2011
Note 1. Organization
Columbia Select Small Cap Fund (the Fund), a series of Columbia Funds Series Trust I (the Trust), is a diversified fund. The Trust is registered under the Investment Company Act of 1940, as amended (the 1940 Act), as an open-end management investment company organized as a Massachusetts business trust.
After the close of business on April 30, 2010, Ameriprise Financial, Inc. (Ameriprise Financial) acquired a portion of the asset management business of Columbia Management Group, LLC (the Transaction), including the business of managing the Fund. In connection with the closing of the Transaction (the Closing), RiverSource Investments, LLC, a wholly owned subsidiary of Ameriprise Financial, became the investment manager of the Fund and changed its name to Columbia Management Investment Advisers, LLC (the Investment Manager).
Investment Objective
The Fund seeks long-term capital appreciation.
Fund Shares
The Trust has unlimited authorized shares of beneficial interest. The Fund offers Class A, Class C, Class R and Class Z shares. All share classes have identical voting, dividend and liquidation rights. Each share class has its own expense structure and sales charges, as applicable.
Class A shares are subject to a maximum front-end sales charge of 5.75% based on the initial investment amount. Class A shares purchased without an initial sales charge in accounts aggregating $1 million to $50 million at the time of purchase are subject to a 1.00% contingent deferred sales charge (CDSC) if the shares are sold within 18 months of purchase, charged as follows: 1.00% CDSC if redeemed within 12 months of purchase, and 0.50% CDSC if redeemed more than 12, but less than 18 months after purchase.
Class C shares are subject to a 1.00% CDSC on shares redeemed within one year of purchase.
Class R shares are not subject to sales charges and are available only to qualifying institutional investors.
Class Z shares are not subject to sales charges and are available only to certain investors, as described in the Fund’s prospectus.
Note 2. Summary of Significant Accounting Policies
The preparation of financial statements in accordance with U.S. generally accepted accounting principles (GAAP) requires management to make certain estimates and assumptions that affect the reported amounts of assets and liabilities, the disclosure of contingent assets and liabilities at the date of the financial statements and the reported amounts of revenue and expenses during the reporting period. Actual results could differ from those estimates.
The following is a summary of significant accounting policies consistently followed by the Fund in the preparation of its financial statements.
Security Valuation
Equity securities are valued at the last sale price on the principal exchange on which they trade, except for securities traded on the NASDAQ, which are valued at the NASDAQ official close price. Unlisted securities or listed securities for which there were no sales during the day are valued at the closing bid price on such exchanges or over-the-counter markets.
Short-term investments maturing in 60 days or less are valued at amortized cost, which approximates market value.
Investments for which market quotations are not readily available, or that have quotations which management believes are not reliable, are valued at fair value as determined in good faith under consistently applied procedures established by and under the general supervision of the Board of Trustees. If a security is valued at fair value, such value is likely to be different from the last quoted market price for the security. The determination of fair value often requires significant judgment. To determine fair value, management may use assumptions including but not limited to future cash flows and estimated risk premiums. Multiple inputs from various sources may be used to determine value.
Repurchase Agreements
The Fund may engage in repurchase agreement transactions with institutions that the Investment Manager has determined are creditworthy. The Fund, through the custodian, receives delivery of the underlying securities collateralizing a repurchase agreement. The Investment Manager is responsible for determining that the collateral is at least equal, at all times, to the value of the repurchase obligation including interest. A repurchase agreement transaction involves certain risks in the event of default or insolvency of the counterparty. These risks include possible delays in or restrictions on the Fund’s ability to dispose of the underlying securities and a possible decline in the value of the underlying securities during the period while the Fund seeks to assert its rights.
20
Columbia Select Small Cap Fund
March 31, 2011
Security Transactions
Security transactions are accounted for on the trade date. Cost is determined and gains (losses) are based upon the specific identification method for both financial statement and federal income tax purposes.
Income Recognition
Interest income is recorded on the accrual basis.
Corporate actions and dividend income are recorded on the ex-date.
Awards from class action litigation are recorded as a reduction of cost if the Fund still owns the applicable securities on the payment date. If the Fund no longer owns the applicable securities, the proceeds are recorded as realized gains.
Expenses
General expenses of the Trust are allocated to the Fund and other series of the Trust based upon relative net assets or other expense allocation methodologies determined by the nature of the expense. Expenses directly attributable to a specific class of shares are charged to that share class. Expenses directly attributable to the Fund are charged to the Fund.
Determination of Class Net Asset Value
All income, expenses (other than class-specific expenses which are charged directly to a share class, as shown in the Statement of Operations) and realized and unrealized gains (losses) are allocated to each class of the Fund on a daily basis, based on the relative net assets of each class, for purposes of determining the net asset value of each class.
Federal Income Tax Status
The Fund intends to qualify each year as a regulated investment company under Subchapter M of the Internal Revenue Code, as amended, and will distribute substantially all of its taxable income, if any, for its tax year, and as such will not be subject to federal income taxes. In addition, the Fund intends to distribute in each calendar year substantially all of its net investment income, capital gains and certain other amounts, if any, such that the Fund should not be subject to federal excise tax. Therefore, no federal income or excise tax provision is recorded.
Distributions to Shareholders
Distributions from net investment income are declared and paid quarterly. Net realized capital gains, if any, are distributed at least annually. Income distributions and capital gain distributions are determined in accordance with federal income tax regulations which may differ from GAAP.
Indemnifications
Under the Trust’s organizational documents and, in some cases, by contract, its officers and directors are indemnified against certain liabilities arising out of the performance of their duties to the Fund. In addition, certain of the Fund’s contracts with its service providers contain general indemnification clauses. The Fund’s maximum exposure under these arrangements is unknown since the amount of any future claims that may be made against the Fund cannot be determined and the Fund has no historical basis for predicting the likelihood of any such claims.
Note 3. Fees and Compensation Paid to Affiliates
Investment Management Fee
Under an Investment Management Services Agreement (IMSA), the Investment Manager determines which securities will be purchased, held or sold. The management fee is equal to a percentage of the Fund’s average daily net assets that declines from 0.75% to 0.62% as the Fund’s net assets increase.
Prior to the Closing, Columbia Management Advisors, LLC (Columbia), an indirect, wholly owned subsidiary of Bank of America Corporation (BOA), provided investment management services to the Fund under the same fee structure.
The effective management fee rate for the year ended March 31, 2011, was 0.75% of the Fund’s average daily net assets.
Administration Fee
Effective upon the Closing, the Investment Manager provides administration and accounting services to the Fund under an Administrative Services Agreement, including services previously performed under the Pricing and Bookkeeping Oversight and Services Agreement (the Services Agreement) as discussed in the Pricing and Bookkeeping Fees note below. The Fund pays an annual administration fee equal to 0.15% of the Fund’s average daily net assets less the fees payable by the Fund as described under the Pricing and Bookkeeping Fees note below. Prior to the Closing, Columbia provided administrative services to the Fund at the same fee rates.
21
Columbia Select Small Cap Fund
March 31, 2011
Pricing and Bookkeeping Fees
Prior to the Closing, the Fund entered into a Financial Reporting Services Agreement (the Financial Reporting Services Agreement) with State Street Bank and Trust Company (State Street) and Columbia pursuant to which State Street provides financial reporting services to the Fund. The Fund also entered into an Accounting Services Agreement (collectively with the Financial Reporting Services Agreement, the State Street Agreements) with State Street and Columbia pursuant to which State Street provides accounting services to the Fund. Upon the Closing, Columbia assigned and delegated its rights and obligations under the State Street Agreements to the Investment Manager. Under the State Street Agreements, the Fund pays State Street an annual fee of $38,000 paid monthly plus an additional monthly fee based on an annualized percentage rate of average daily net assets of the Fund for the month. The aggregate fee will not exceed $140,000 per year (exclusive of out-of-pocket expenses and charges). The Fund also reimburses State Street for certain out-of-pocket expenses and charges.
Also prior to the Closing, the Fund entered into the Services Agreement with Columbia. Under the Services Agreement, Columbia provided services related to Fund expenses and the requirements of the Sarbanes-Oxley Act of 2002, and provided oversight of the accounting and financial reporting services provided by State Street. Under the Services Agreement, the Fund reimbursed Columbia for out-of-pocket expenses and charges, including fees payable to third parties, such as for pricing the Fund’s portfolio securities, incurred by Columbia in the performance of services under the Services Agreement. The Services Agreement was terminated upon the Closing. These services are now provided under the Administrative Services Agreement discussed above.
Transfer Agent Fee
In connection with the Closing, RiverSource Service Corporation, a wholly owned subsidiary of Ameriprise Financial, provides transfer agency services to the Fund under a Transfer Agency Agreement and changed its name to Columbia Management Investment Services Corp. (the Transfer Agent). The Transfer Agent has contracted with Boston Financial Data Services (BFDS) to serve as sub-transfer agent.
The Transfer Agent receives monthly account-based service fees based on the number of open accounts and is reimbursed by the Fund for the fees and expenses the Transfer Agent pays to financial intermediaries that maintain omnibus accounts with the Fund that is a percentage of the average aggregate value of the Fund’s shares maintained in each such omnibus account (other than omnibus accounts for which American Enterprise Investment Services Inc. is the broker of record or accounts where the beneficial shareholder is a customer of Ameriprise Financial Services, Inc., which are paid a per account fee). The Transfer Agent pays the fees of BFDS for services as sub-transfer agent and, is not entitled to reimbursement for such fees from the Fund (with the exception of out-of pocket fees). The Transfer Agent also receives compensation from fees for various shareholder services and reimbursements for certain out-of-pocket expenses.
Prior to the Closing, Columbia Management Services, Inc., an affiliate of Columbia and an indirect, wholly owned subsidiary of BOA, provided transfer agency services to the Fund and contracted with BFDS to serve as sub-transfer agent, under the same fee structure.
For the year ended March 31, 2011, the Fund’s effective transfer agent fee rate for each class was 0.14% of the Fund’s average daily net assets.
An annual minimum account balance fee of $20 may apply to certain accounts with a value below the Fund’s initial minimum investment requirements to reduce the impact of small accounts on transfer agent fees. These minimum account balance fees are recorded as part of expense reductions on the Statement of Operations. For the year ended March 31, 2011, no minimum account balance fees were charged by the Fund.
Underwriting Discounts, Service and Distribution Fees
In connection with the Closing, RiverSource Fund Distributors, Inc., an indirect wholly owned subsidiary of Ameriprise Financial, provides distribution and shareholder services to the Fund and changed its name to Columbia Management Investment Distributors, Inc. (the Distributor). Pursuant to Rule 12b-1 under the 1940 Act, the Board of Trustees has approved, and the Fund has adopted, distribution and shareholder service plans (the Plans) which set the distribution and service fees for the Fund. These fees are calculated daily and are intended to compensate the Distributor and/or eligible selling and/or servicing agents for selling shares of the Fund and providing services to investors.
The Plans require the payment of a monthly service fee to the Distributor at the maximum annual rate of 0.25% of the average daily net assets attributable to Class A and Class C shares of the
22
Columbia Select Small Cap Fund
March 31, 2011
Fund. The Plans also require the payment of a monthly distribution fee to the Distributor at the maximum annual rates of 0.75% of the average daily net assets attributable to Class C shares and 0.50% of the average daily net assets attributable to Class R shares. These fees are intended to compensate the Distributor and/or eligible selling and/or servicing agents for selling shares of the Fund and providing services to investors.
Prior to the Closing, Columbia Management Distributors, Inc., an affiliate of Columbia and an indirect, wholly owned subsidiary of BOA, was the principal underwriter of the Fund’s shares. There were no changes to the underwriting discount structure of the Fund or the service or distribution fee rates paid by the Fund as a result of the Transaction.
Sales Charges
Sales charges, including front-end and CDSC’s, received by the Distributor for distributing Fund shares were $915 for Class A and $328 for Class C shares for the year ended March 31, 2011.
Fee Waivers and Expense Reimbursements
The Investment Manager has voluntarily agreed to bear a portion of the Fund’s expenses so that the Fund’s ordinary operating expenses (excluding any distribution and service fees, brokerage commissions, interest, taxes and extraordinary expenses, but including custodian charges relating to overdrafts, if any), after giving effect to any balance credits from the Fund’s custodian, do not exceed 1.10% of the Fund’s average daily net assets on an annualized basis. The Investment Manager, in its discretion, may revise or discontinue this arrangement at any time. Prior to May 1, 2010, Columbia voluntarily reimbursed a portion of the Fund’s expenses in the same manner.
Fees Paid to Officers and Trustees
In connection with the Closing, all officers of the Fund are employees of the Investment Manager or its affiliates and, with the exception of the Fund’s Chief Compliance Officer, receive no compensation from the Fund. The Board of Trustees has appointed a Chief Compliance Officer to the Fund in accordance with federal securities regulations. The Fund, along with other affiliated funds, pays its pro-rata share of the expenses associated with the Chief Compliance Officer. The Fund’s expenses for the Chief Compliance Officer will not exceed $15,000 per year. Prior to the Closing, all officers of the Fund were employees of Columbia or its affiliates and the Fund paid its pro-rata share of the expenses for the Chief Compliance Officer under the same fee structure.
Trustees are compensated for their services to the Fund, as set forth on the Statement of Operations. The Trust’s eligible Trustees may participate in a deferred compensation plan which may be terminated at any time. Obligations of the plan will be paid solely out of the Fund’s assets.
Note 4. Custody Credits
The Fund has an agreement with its custodian bank under which custody fees may be reduced by balance credits. These credits are recorded as part of expense reductions on the Statement of Operations. The Fund could have invested a portion of the assets utilized in connection with the expense offset arrangement in an income-producing asset if it had not entered into such an agreement. For the year ended March 31, 2011, there were no custody credits for the Fund.
Note 5. Portfolio Information
The cost of purchases and proceeds from sales of securities, excluding short-term obligations, aggregated $396,167,823 and $536,820,938 respectively, for the year ended March 31, 2011.
Note 6. Regulatory Settlements
During the year ended March 31, 2010, the Fund received payments totaling $18,764 resulting from certain regulatory settlements with third parties in which the Fund had participated. The payments have been included in “Increase from regulatory settlements” in the Statement of Changes in Net Assets.
Note 7. Shareholder Concentration
As of March 31, 2011, one shareholder account owned 59.3% of the outstanding shares of the Fund. Purchase and redemption activity of this account may have a significant effect on the operations of the Fund.
Note 8. Line of Credit
Prior to March 28, 2011, the Fund and other affiliated funds participated in a $280,000,000 committed, unsecured revolving line of credit provided by State Street. Effective March 28, 2011, the commitment was reduced to $225,000,000. The maximum amount that may be borrowed by any fund is limited to the lesser of $200,000,000 and the Fund’s borrowing limit set forth in the Fund’s registration statement. Borrowings are available for short-term liquidity or temporary or emergency purposes.
Effective October 14, 2010, interest is charged to each participating fund based on the fund’s borrowings at a rate per annum equal to the
23
Columbia Select Small Cap Fund
March 31, 2011
greater of the Federal Funds Rate plus 1.25% or the overnight LIBOR Rate plus 1.25%. In addition, a commitment fee of 0.125% per annum is accrued and apportioned among the participating funds pro rata based on their relative net assets.
For the year ended March 31, 2011, the average daily loan balance outstanding on days where borrowing existed was $2,876,190 at a weighted average interest rate of 1.502%.
Note 9. Federal Tax Information
The timing and character of income and capital gain distributions are determined in accordance with income tax regulations, which may differ from GAAP. Reclassifications are made to the Fund’s capital accounts for permanent tax differences to reflect income and gains available for distribution (or available capital loss carryforwards) under income tax regulations.
For the year ended March 31, 2011, permanent book and tax basis differences resulting primarily from differing treatments for net operating losses were identified and reclassified among the components of the Fund’s net assets as follows:
| | | | |
| | | | | |
Accumulated Net Investment
loss | | Accumulated Net Realized
Loss | | Paid-In
Capital |
| $1,837,828 | | $— | | $(1,837,828) |
Net investment loss and net realized gains (losses), as disclosed on the Statement of Operations, and net assets were not affected by this reclassification.
As of March 31, 2011, the components of distributable earnings on a tax basis were as follows:
| | | | |
| | | | | |
Undistributed
Ordinary Income | | Undistributed Long-Term Capital Gains | | Net
Unrealized Appreciation* |
| $— | | $— | | $191,027,089 |
| * | The differences between book-basis and tax-basis net unrealized appreciation are primarily due to deferral of losses from wash sales. |
Unrealized appreciation and depreciation at March 31, 2011, based on cost of investments for federal income tax purposes were:
| | | | |
| | | | |
Unrealized appreciation | | $ | 195,268,679 | |
Unrealized depreciation | | | (4,241,590 | ) |
| | | | |
Net unrealized appreciation | | $ | 191,027,089 | |
The following capital loss carryforwards may be available to reduce taxable income arising from future net realized gains on investments, if any, to the extent permitted by the Internal Revenue Code:
| | | | |
| | | | |
| Year of Expiration | | Capital Loss Carryforwards | |
| 2018 | | $ | 38,113,765 | |
Capital loss carryforwards of $91,410,918 were utilized during the year ended March 31, 2011.
Management of the Fund has concluded that there are no significant uncertain tax positions that would require recognition in the financial statements. However, management’s conclusion may be subject to review and adjustment at a later date based on factors including, but not limited to, new tax laws, regulations, and administrative interpretations (including relevant court decisions). The Fund’s federal tax returns for the prior three fiscal years remain subject to examination by the Internal Revenue Service.
Note 10. Subsequent Events
The Investment Manager has evaluated the events and transactions that have occurred through the date the financial statements were issued. Other than as noted below, there were no items requiring adjustment of the financial statements or additional disclosure.
Effective May 16, 2011, the line of credit commitment with State Street was reduced to $150,000,000, and the maximum amount that may be borrowed by any fund was limited to the lesser of $120,000,000 and the Fund’s borrowing limit set forth in the Fund’s registration statement.
Note 11. Information Regarding Pending and Settled Legal Proceedings
In June 2004, an action captioned John E. Gallus et al. v. American Express Financial Corp. and American Express Financial Advisors Inc. was filed in the United States District Court for the District of Arizona. The plaintiffs allege that they are investors in several American Express Company (now known as RiverSource) mutual funds and they purport to bring the action derivatively on behalf of those funds under the Investment Company Act of 1940. The plaintiffs allege that fees allegedly paid to the defendants by the funds for investment advisory and administrative services are excessive. The plaintiffs seek remedies including restitution and rescission of investment advisory and distribution agreements. The plaintiffs voluntarily agreed to transfer this case to the United States District Court for the District of Minnesota (the District Court). In response to defendants’ motion to dismiss the complaint, the District
24
Columbia Select Small Cap Fund
March 31, 2011
Court dismissed one of plaintiffs’ four claims and granted plaintiffs limited discovery. Defendants moved for summary judgment in April 2007. Summary judgment was granted in the defendants’ favor on July 9, 2007. The plaintiffs filed a notice of appeal with the Eighth Circuit Court of Appeals (the Eighth Circuit) on August 8, 2007. On April 8, 2009, the Eighth Circuit reversed summary judgment and remanded to the District Court for further proceedings. On August 6, 2009, defendants filed a writ of certiorari with the U.S. Supreme Court (the Supreme Court), asking the Supreme Court to stay the District Court proceedings while the Supreme Court considers and rules in a case captioned Jones v. Harris Associates, which involves issues of law similar to those presented in the Gallus case. On March 30, 2010, the Supreme Court issued its ruling in Jones v. Harris Associates, and on April 5, 2010, the Supreme Court vacated the Eighth Circuit’s decision in the Gallus case and remanded the case to the Eighth Circuit for further consideration in light of the Supreme Court’s decision in Jones v. Harris Associates. On June 4, 2010, the Eighth Circuit remanded the Gallus case to the District Court for further consideration in light of the Supreme Court’s decision in Jones v. Harris Associates. On December 9, 2010, the District Court reinstated its July 9, 2007 summary judgment order in favor of the defendants. On January 10, 2011 plaintiffs filed a notice of appeal with the Eighth Circuit.
In December 2005, without admitting or denying the allegations, American Express Financial Corporation (AEFC, which is now known as Ameriprise Financial, Inc. (Ameriprise Financial)), entered into settlement agreements with the Securities and Exchange Commission (SEC) and Minnesota Department of Commerce (MDOC) related to market timing activities. As a result, AEFC was censured and ordered to cease and desist from committing or causing any violations of certain provisions of the Investment Advisers Act of 1940, the Investment Company Act of 1940, and various Minnesota laws. AEFC agreed to pay disgorgement of $10 million and civil money penalties of $7 million. AEFC also agreed to retain an independent distribution consultant to assist in developing a plan for distribution of all disgorgement and civil penalties ordered by the SEC in accordance with various undertakings detailed at http://www.sec.gov/litigation/admin/ia-2451.pdf. Ameriprise Financial and its affiliates have cooperated with the SEC and the MDOC in these legal proceedings, and have made regular reports to the funds’ Boards of Directors/Trustees.
Ameriprise Financial and certain of its affiliates have historically been involved in a number of legal, arbitration and regulatory proceedings, including routine litigation, class actions, and governmental actions, concerning matters arising in connection with the conduct of their business activities. Ameriprise Financial believes that the Funds are not currently the subject of, and that neither Ameriprise Financial nor any of its affiliates are the subject of, any pending legal, arbitration or regulatory proceedings that are likely to have a material adverse effect on the Funds or the ability of Ameriprise Financial or its affiliates to perform under their contracts with the Funds. Ameriprise Financial is required to make 10-Q, 10-K and, as necessary, 8-K filings with the Securities and Exchange Commission on legal and regulatory matters that relate to Ameriprise Financial and its affiliates. Copies of these filings may be obtained by accessing the SEC website at www.sec.gov.
There can be no assurance that these matters, or the adverse publicity associated with them, will not result in increased fund redemptions, reduced sale of fund shares or other adverse consequences to the Funds. Further, although we believe proceedings are not likely to have a material adverse effect on the Funds or the ability of Ameriprise Financial or its affiliates to perform under their contracts with the Funds, these proceedings are subject to uncertainties and, as such, we are unable to estimate the possible loss or range of loss that may result. An adverse outcome in one or more of these proceedings could result in adverse judgments, settlements, fines, penalties or other relief that could have a material adverse effect on the consolidated financial condition or results of operations of Ameriprise Financial.
25
Report of Independent Registered Public Accounting Firm
To the Trustees of Columbia Funds Series Trust I and the Shareholders of Columbia Select Small Cap Fund
In our opinion, the accompanying statement of assets and liabilities, including the investment portfolio, and the related statements of operations and of changes in net assets and the financial highlights present fairly, in all material respects, the financial position of Columbia Select Small Cap Fund (the “Fund”) (a series of Columbia Funds Series Trust I) at March 31, 2011, the results of its operations for the year then ended, the changes in its net assets for each of the two years in the period then ended, and the financial highlights for the periods indicated, in conformity with accounting principles generally accepted in the United States of America. These financial statements and financial highlights (hereafter referred to as “financial statements”) are the responsibility of the Fund’s management. Our responsibility is to express an opinion on these financial statements based on our audits. We conducted our audits of these financial statements in accordance with the standards of the Public Company Accounting Oversight Board (United States). Those standards require that we plan and perform the audit to obtain reasonable assurance about whether the financial statements are free of material misstatement. An audit includes examining, on a test basis, evidence supporting the amounts and disclosures in the financial statements, assessing the accounting principles used and significant estimates made by management, and evaluating the overall financial statement presentation. We believe that our audits, which included confirmation of securities at March 31, 2011 by correspondence with the custodian and brokers, provide a reasonable basis for our opinion.
PricewaterhouseCoopers LLP
Boston, Massachusetts
May 20, 2011
26
Fund Governance
The Trustees serve terms of indefinite duration. The names, addresses and birth years of the Trustees and Officers of the Funds in Columbia Funds Series Trust I, the year each was first elected or appointed to office, their principal business occupations during at least the last five years, the number of Funds overseen by each Trustee and other directorships they hold are shown below, as of May 2, 2011. Each officer listed below serves as an officer of each Fund in Columbia Funds Series Trust I.
Independent Trustees
| | |
Name, address and year of birth,
Position with funds, Year first
elected or appointed to office | | Principal occupation(s) during past five years, Number of funds in Columbia Funds
Complex overseen by trustee, Other directorships held |
| |
| John D. Collins (born 1938) | | |
c/o Columbia Management
Investment Advisers, LLC 225 Franklin Street Boston, MA 02110 Trustee (since 2005) | | Retired. Consultant, KPMG, LLP (accounting and tax firm) from July 1999 to June 2000; Partner, KPMG, LLP from March 1962 to June 1999. Oversees 46; Mrs. Fields Original Cookies, Inc. (consumer products); Suburban Propane Partners, L.P.; and Montpelier Re (insurance underwriting firm) |
| |
| Rodman L. Drake (born 1943) | | |
c/o Columbia Management
Investment Advisers, LLC 225 Franklin Street Boston, MA 02110 Trustee (since 1994) and Chairman of the Board (since 2009) | | Independent consultant since 2010; Co-Founder of Baringo Capital LLC (private equity) from 1997 to 2008; CEO of Crystal River Capital, Inc. (real estate investment trust) from 2003 to 2010; Oversees 46; Jackson Hewitt Tax Service Inc. (tax preparation services); Celgene Corporation (global biotechnology company); Student Loan Corporation (student loan provider); Crystal River Capital, Inc. from 2005 to 2010; Parsons Brinckerhoff from 1995 to 2008; the Helios Funds (closed-end funds); and Apex Silver Mines Ltd. from 2007 to 2009 |
| |
| Douglas A. Hacker (born 1955) | | |
c/o Columbia Management Investment Advisers, LLC 225 Franklin Street Boston, MA 02110 Trustee (since 1996) | | Independent business executive since May 2006; Executive Vice President–Strategy of United Airlines (airline) from December 2002 to May 2006; President of UAL Loyalty Services (airline marketing company) from September 2001 to December 2002; Executive Vice President and Chief Financial Officer of United Airlines from July 1999 to September 2001. Oversees 46; Nash Finch Company (food distributor); Aircastle Limited (aircraft leasing); and SeaCube Container Leasing Ltd (container leasing) |
|
| Janet Langford Kelly (born 1957) |
c/o Columbia Management Investment Advisers, LLC 225 Franklin Street Boston, MA 02110 Trustee (since 1996) | | Senior Vice President, General Counsel and Corporate Secretary, ConocoPhillips (integrated energy company) since September 2007; Deputy General Counsel–Corporate Legal Services, ConocoPhillips from August 2006 to August 2007; Partner, Zelle, Hofmann, Voelbel, Mason & Gette LLP (law firm) from March 2005 to July 2006; Adjunct Professor of Law, Northwestern University, from September 2004 to June 2006; Director, UAL Corporation (airline) from February 2006 to July 2006; Oversees 46; None |
| |
| William E. Mayer (born 1940) | | |
c/o Columbia Management Investment Advisers, LLC 225 Franklin Street Boston, MA 02110 Trustee (since 1994) | | Partner, Park Avenue Equity Partners (private equity) since February 1999; Dean and Professor, College of Business and Management, University of Maryland from 1992 to 1996. Oversees 46; DynaVox Inc. (software developer); Lee Enterprises (print media), WR Hambrecht + Co. (financial service provider); BlackRock Kelso Capital Corporation (investment company) |
27
Fund Governance (continued)
Independent Trustees (continued)
| | |
Name, address and year of birth,
Position with funds, Year first
elected or appointed to office | | Principal occupation(s) during past five years, Number of funds in Columbia Funds
Complex overseen by trustee, Other directorships held |
| |
| David M. Moffett (born 1952) | | |
c/o Columbia Management Investment Advisers, LLC 225 Franklin Street Boston, MA 02110 Trustee (since 2011) | | Retired. Chief Executive Officer, Federal Home Loan Mortgage Corporation, from 2008 to 2009; Senior Adviser, Global Financial Services Group, Carlyle Group, Inc., from 2007 to 2008; Vice Chairman and Chief Financial Officer, U.S. Bancorp, from 1993 to 2007. Oversees 46; CIT Group Inc. (commercial and consumer finance), eBay Inc. (online trading community), MBIA Corp (financial service provider), E.W. Scripps Co. (print and television media), Building Materials Holding Corp. (building materials and construction services), and University of Oklahoma Foundation. |
| |
| Charles R. Nelson (born 1942) | | |
c/o Columbia Management Investment Advisers, LLC 225 Franklin Street Boston, MA 02110 Trustee (since 1981) | | Professor of Economics, University of Washington, since January 1976; Ford and Louisa Van Voorhis Professor of Political Economy, University of Washington, since September 1993; Adjunct Professor of Statistics, University of Washington, since September 1980; Associate Editor, Journal of Money Credit and Banking, 1993-2008; Consultant on econometric and statistical matters. Oversees 46; None |
| |
| John J. Neuhauser (born 1943) | | |
c/o Columbia Management Investment Advisers, LLC 225 Franklin Street Boston, MA 02110 Trustee (since 1984) | | President, Saint Michael’s College, since August 2007; Director or Trustee of several non-profit organization, including Fletcher Allen Health Care, Inc.; University Professor, Boston College from November 2005 to August 2007; Academic Vice President and Dean of Faculties, Boston College from August 1999 to October 2005. Oversees 46; Liberty All-Star Equity Fund and Liberty All-Star Growth Fund, Inc. (closed-end funds) |
| |
| Jonathan Piel (born 1938) | | |
c/o Columbia Management Investment Advisers, LLC 225 Franklin Street Boston, MA 02110 Trustee (since 1994) | | Cable television producer and website designer; The Editor, Scientific American from 1984 to 1994; Vice President, Scientific American, Inc., from 1984 to 1994; Member, Advisory Board, Stone Age Institute, Bloomington, Indiana (research institute that explores the effect of technology on human evolution); Member, Board of Directors of the National Institute of Social Sciences, New York City; Member, Board of Trustees of the William Alanson White Institute, New York City (institution for training psychoanalysts); and Member, Advisory Board, Mount Sinai Children’s Environmental Health Center, New York. Oversees 46; None |
| |
| Patrick J. Simpson (born 1944) | | |
c/o Columbia Management Investment Advisers, LLC 225 Franklin Street Boston, MA 02110 Trustee (since 2000) | | Partner, Perkins Coie LLP (law firm). Oversees 46; None |
| |
| Anne-Lee Verville (born 1945) | | |
c/o Columbia Management Investment Advisers, LLC 225 Franklin Street Boston, MA 02110 Trustee (since 1998) | | Retired since 1997 (formerly General Manager–Global Education Industry from 1994 to 1997, President–Application Systems Division from 1991 to 1994, Chief Financial Officer–US Marketing & Services from 1988 to 1991, and Chief Information Officer from 1987 to 1988, IBM Corporation (computer and technology)). Oversees 46; Enesco Group, Inc. (producer of giftware and home and garden decor products) from 2001 to 2006 |
28
Fund Governance (continued)
Interested Trustee
| | |
Name, address and year of birth,
Position with funds, Year first
elected or appointed to office | | Principal occupation(s) during past five years, Number of funds in Columbia Funds
Complex overseen by trustee, Other directorships held |
| |
| Michael A. Jones (born 1959) | | |
c/o Columbia Management Investment Advisers, LLC 225 Franklin Street Boston, MA 02110 Trustee (since 2011) Senior Vice President (since 2010) | | President and Director, Columbia Management Investment Advisers, LLC since May 2010; President and Director, Columbia Management Investment Distributors, Inc. since May 2010; Manager, Chairman, Chief Executive Officer and President, Columbia Management Advisors, LLC from 2007 to April 2010; Chief Executive Officer, President and Director, Columbia Management Distributors, Inc. from November 2006 to April 2010; previously, co-president and senior managing director at Robeco Investment Management. Oversees 46; None |
The Statement of Additional Information includes additional information about the Trustees of the Funds and is available, without charge, upon request by calling 1-800-345-6611.
29
Fund Governance (continued)
Officers
| | |
| Name, year of birth and address | | Principal occupation(s) during the past five years |
|
| J. Kevin Connaughton (born 1964) |
225 Franklin Street Boston, MA 02110 President (since 2009) | | Senior Vice President and General Manager–Mutual Fund Products, Columbia Management Investment Advisers, LLC since May 2010; President, Columbia Funds, since 2009, and RiverSource Funds, since May 2010 (previously Senior Vice President and Chief Financial Officer, Columbia Funds, from June 2008 to January 2009, Treasurer, Columbia Funds, from October 2003 to May 2008, and senior officer of various other affiliated funds since 2000); Managing Director, Columbia Management Advisors, LLC from December 2004 to April 2010. |
| |
| Michael G. Clarke (born 1969) | | |
225 Franklin Street Boston, MA 02110 Treasurer (since 2011) and Chief Financial Officer (since 2009) | | Vice President, Columbia Management Investment Advisers, LLC since May 2010; Managing Director of Fund Administration, Columbia Management Advisors, LLC, from September 2004 to April 2010; senior officer of Columbia Funds and affiliated funds since 2002. |
| |
| Scott R. Plummer (born 1959) | | |
5228 Ameriprise Financial Center Minneapolis, MN 55474 Senior Vice President, Secretary and Chief Legal Officer (since 2010) | | Chief Legal Officer and Assistant Secretary, Columbia Management Investment Advisers, LLC since June 2005; Vice President and Lead Chief Counsel–Asset Management, Ameriprise Financial, Inc. since May 2010 (previously Vice President and Chief Counsel–Asset Management, from 2005 to April 2010, and Vice President–Asset Management Compliance from 2004 to 2005); Vice President, Chief Counsel and Assistant Secretary, Columbia Management Investment Distributors, Inc. since 2008; Vice President, General Counsel and Secretary, Ameriprise Certificate Company since 2005; Chief Counsel, RiverSource Distributors, Inc. since 2006; Vice President, General Counsel and Secretary, RiverSource Funds, since December 2006; Senior Vice President, Secretary and Chief Legal Officer, Columbia Funds, since May 2010. |
| |
| Linda J. Wondrack (born 1964) | | |
225 Franklin Street Boston, MA 02110 Senior Vice President and Chief Compliance Officer (since 2007) | | Vice President and Chief Compliance Officer, Columbia Management Investment Advisers, LLC since May 2010; Chief Compliance Officer, Columbia Funds, since 2007, and RiverSource Funds, since May 2010; Director (Columbia Management Group, LLC and Investment Product Group Compliance), Bank of America, from June 2005 to April 2010; Director of Corporate Compliance and Conflicts Officer of MFS Investment Management (investment management) from August 2004 to May 2005. |
| |
| William F. Truscott (born 1960) | | |
53600 Ameriprise Financial Center Minneapolis, MN 55474 Senior Vice President (since 2010) | | Chairman of the Board, Columbia Management Investment Advisers, LLC since May 2010 (previously President, Chairman of the Board and Chief Investment Officer, from 2001 to April 2010); Chief Executive Officer, U.S. Asset Management & President, Annuities, Ameriprise Financial, Inc. since May 2010 (previously President–U.S. Asset Management and Chief Investment Officer from 2005 to April 2010, and Senior Vice President–Chief Investment Officer, from 2001 to 2005); Director, President and Chief Executive Officer, Ameriprise Certificate Company since 2006; Director, Columbia Management Investment Distributors, Inc. since May 2010 (previously Chairman of the Board and Chief Executive Officer from 2008 to April 2010); Chairman of the Board and Chief Executive Officer, RiverSource Distributors, Inc. since 2006. |
30
Fund Governance (continued)
Officers (continued)
| | |
| Name, year of birth and address | | Principal occupation(s) during the past five years |
|
| Colin Moore (born 1958) |
225 Franklin Street Boston, MA 02110 Senior Vice President (since 2010) | | Director and Chief Investment Officer, Columbia Management Investment Advisers, LLC since May 2010; Manager, Managing Director and Chief Investment Officer of Columbia Management Advisors, LLC from 2007 to April 2010; Head of Equities, Columbia Management Advisors, LLC from 2002 to 2007. |
| |
| Amy Johnson (born 1965) | | |
5228 Ameriprise Financial Center Minneapolis, MN 55474 Vice President (since 2010) | | Senior Vice President and Chief Operating Officer, Columbia Management Investment Advisers, LLC since May 2010 (previously Chief Administrative Officer, from 2009 until April 2010, Vice President–Asset Management and Trust Company Services, from 2006 to 2009, and Vice President–Operations and Compliance from 2004 to 2006). |
| |
| Joseph F. DiMaria (born 1968) | | |
225 Franklin Street Boston, MA 02110 Vice President (since 2011) and Chief Accounting Officer (since 2008) | | Vice President, Mutual Fund Administration, Columbia Management Investment Advisers, LLC, since May 2010; Director of Fund Administration, Columbia Management Advisors, LLC from January 2006 to April 2010; Head of Tax/Compliance and Assistant Treasurer, Columbia Management Advisors, LLC, from November 2004 to December 2005. |
| |
| Stephen T. Welsh (born 1957) | | |
225 Franklin Street Boston, MA 02110 Vice President (since 2006) | | President and Director, Columbia Management Investment Services Corp. since May 2010; President and Director, Columbia Management Services, Inc. from July 2004 to April 2010; Managing Director, Columbia Management Distributors, Inc. from August 2007 to April 2010. |
| |
| Paul D. Pearson (born 1956) | | |
5228 Ameriprise Financial Center Minneapolis, MN 55474 Vice President and Assistant Treasurer (since 2011) | | Vice President, Investment Accounting, Columbia Management Investment Advisers, LLC, since May 2010; Vice President, Managed Assets, Investment Accounting, Ameriprise Financial Corporation. |
| |
| Paul B. Goucher (born 1968) | | |
5228 Ameriprise Financial Center Minneapolis, MN 55474 Vice President and Assistant Treasurer (since 2010) | | Vice President and Chief Counsel of Ameriprise Financial since January 2010 (formerly Vice President and Group Counsel from November 2008 to January 2010); Director, Managing Director and General Counsel of J. & W. Seligman & Co. Incorporated (Seligman) from July 2008 to November 2008 and Managing Director and Associate General Counsel of Seligman from January 2005 to July 2008. |
| |
| Christopher O. Petersen (born 1970) | | |
5228 Ameriprise Financial Center Minneapolis, MN 55474 Vice President and Assistant Treasurer (since 2010) | | Vice President and Chief Counsel, Ameriprise Financial since January 2010 (formerly Vice President and Group Counsel or Counsel from April 2004 to January 2010); Assistant Secretary of RiverSource Funds since January 2007. |
| |
| Michael E. DeFao (born 1968) | | |
5228 Ameriprise Financial Center Minneapolis, MN 55474 Vice President and Assistant Treasurer (since 2011) | | Vice President and Chief Counsel, Ameriprise Financial since May 2010; Associate General Counsel Bank of America from June 2005 to April 2010. |
31
Shareholder Meeting Results
Columbia Select Small Cap Fund
At a Joint Special Meeting of Shareholders held on February 15, 2011, shareholders of the Fund considered a proposal to approve a proposed amendment to the Investment Management Services Agreement with Columbia Management Investment Advisers, LLC. The proposal was approved as follows:
| | | | | | |
| | | | | | | |
| Votes For | | Votes Against | | Abstentions | | Broker Non-Votes |
| 374,436,085 | | 8,435,282 | | 1,392,243 | | 0 |
32
Important Information About This Report
The fund mails one shareholder report to each shareholder address. If you would like more than one report, please call shareholder services at 1-800-345-6611 and additional reports will be sent to you. This report has been prepared for shareholders of Columbia Select Small Cap Fund.
A description of the policies and procedures that the fund uses to determine how to vote proxies and a copy of the fund’s voting records are available (i) at www.columbiamanagement.com, (ii) on the Securities and Exchange Commission’s website at www.sec.gov, and (iii) without charge, upon request, by calling 1-800-368-0346. Information regarding how the fund voted proxies relating to portfolio securities during the 12-month period ended June 30 is available from the SEC’s website. Information regarding how the fund voted proxies relating to portfolio securities is also available from the fund’s website, www.columbiamanagement.com.
The fund files a complete schedule of portfolio holdings with the SEC for the first and third quarters of each fiscal year on Form N-Q. The fund’s Form N-Q is available on the SEC’s website at www.sec.gov and may be reviewed and copied at the SEC’s Public Reference Room in Washington, D.C. Information on the operation of the Public Reference Room may be obtained by calling
1-800-SEC-0330.
Transfer Agent
Columbia Management Investment Services Corp.
P.O. Box 8081
Boston, MA 02266-8081
1-800-345-6611
Distributor
Columbia Management Investment
Distributors, Inc.
225 Franklin Street
Boston, MA 02110
Investment Manager
Columbia Management Investment Advisers, LLC
225 Franklin Street
Boston, MA 02110
33

Columbia Select Small Cap Fund
P.O. Box 8081
Boston, MA 02266-8081
columbiamanagement.com
This information is for use with concurrent or prior delivery of a fund prospectus. Investors should consider the investment objectives, risks, charges and expenses of a mutual fund carefully before investing. For a free prospectus, which contains this and other important information about the funds, visit columbiamanagement.com. Read the prospectus carefully before investing. The Fund is distributed by Columbia Management Investment Distributors, Inc., member FINRA, and managed by Columbia Management Investment Advisers, LLC.
©2011 Columbia Management Investment Advisers, LLC. All rights reserved.
C-1171 A (05/11)

Columbia Value and Restructuring Fund
Annual Report for the Period Ended March 31, 2011
Table of contents
The views expressed in this report reflect the current views of the respective parties. These views are not guarantees of future performance and involve certain risks, uncertainties and assumptions that are difficult to predict, so actual outcomes and results may differ significantly from the views expressed. These views are subject to change at any time based upon economic, market or other conditions and the respective parties disclaim any responsibility to update such views. These views may not be relied on as investment advice and, because investment decisions for a Columbia Fund are based on numerous factors, may not be relied on as an indication of trading intent on behalf of any particular Columbia Fund. References to specific securities should not be construed as a recommendation or investment advice.
President’s Message

Dear Shareholder:
The Columbia Management story began over 100 years ago, and today, we are one of the nation’s largest dedicated asset managers. The recent acquisition by Ameriprise Financial, Inc. brings together the talents, resources and capabilities of Columbia Management with those of RiverSource Investments, Threadneedle (acquired by Ameriprise in 2003) and Seligman Investments (acquired by Ameriprise in 2008) to build a best-in-class asset management business that we believe is truly greater than its parts.
RiverSource Investments traces its roots to 1894 when its then newly-founded predecessor, Investors Syndicate, offered a face-amount savings certificate that gave small investors the opportunity to build a safe and secure fund for retirement, education or other special needs. A mutual fund pioneer, Investors Syndicate launched Investors Mutual Fund in 1940. In the decades that followed, its mutual fund products and services lineup grew to include a full spectrum of styles and specialties. More than 110 years later, RiverSource continues to be a trusted financial products leader.
Threadneedle, a leader in global asset management and one of Europe’s largest asset managers, offers sophisticated international experience from a dedicated U.K. management team. Headquartered in London, it is named for Threadneedle Street in the heart of the city’s financial district, where British investors pioneered international and global investing. Threadneedle was acquired in 2003 and today operates as an affiliate of Columbia Management.
Seligman Investments’ beginnings date back to the establishment of the investment firm J. & W. Seligman & Co. in 1864. In the years that followed, Seligman played a major role in the geographical expansion and industrial development of the United States. In 1874, President Ulysses S. Grant named Seligman as fiscal agent for the U.S. Navy — an appointment that would last through World War I. Seligman helped finance the westward path of the railroads and the building of the Panama Canal. The firm organized its first investment company in 1929 and began managing its first mutual fund in 1930. In 2008, J. & W. Seligman & Co. Incorporated was acquired and Seligman Investments became an offering brand of RiverSource Investments, LLC.
We are proud of the rich and distinctive history of these firms, the strength and breadth of products and services they offer, and the combined cultures of pioneering spirit and forward thinking. Together we are committed to providing more for our shareholders than ever before.
| n | | A singular focus on our shareholders. Our business is asset management, so investors are our first priority. We dedicate our resources to identifying timely investment opportunities and provide a comprehensive choice of equity, fixed-income and alternative investments to help meet your individual needs. |
| n | | First-class research and thought leadership. We are dedicated to helping you take advantage of today���s opportunities and anticipate tomorrow’s. We stay abreast of the latest investment trends and ideas, using our collective insight to evaluate events and transform them into solutions you can use. |
| n | | A disciplined investment approach. We aren’t distracted by passing fads. Our teams adhere to a rigorous investment process that helps ensure the integrity of our products and enables you and your financial advisor to match our solutions to your objectives with confidence. |
When you choose Columbia Management, you can be confident that we will take the time to understand your needs and help you and your financial advisor identify the solutions that are right for you. Because at Columbia Management, we don’t consider ourselves successful unless you are.
Sincerely,

J. Kevin Connaughton
President, Columbia Funds
Investors should consider the investment objectives, risks, charges and expenses of a mutual fund carefully before investing. For a free prospectus, which contains this and other important information about the funds, visit www.columbiamanagement.com. The prospectus should be read carefully before investing.
Columbia Funds are distributed by Columbia Management Investment Distributors, Inc., member FINRA, and managed by Columbia Management Investment Advisers, LLC.
© 2011 Columbia Management Investment Advisers, LLC. All rights reserved.
Fund Profile – Columbia Value and Restructuring Fund
Performance data quoted represents past performance and current performance may be lower or higher. Past performance is no guarantee of future results. The investment return and principal value will fluctuate so that shares, when redeemed, may be worth more or less than the original cost. Please visit www.columbiamanagement.com for daily and most recent month-end performance updates.
Summary
1-year return as of 03/31/11
| | |
| |
 | | +20.17% Class A shares
(without sales charge) |
| |
| | +15.15% Russell 1000 Value Index |
| |
| | +15.65% S&P 500 Index |
|
Morningstar Style BoxTM |
|
Equity Style |
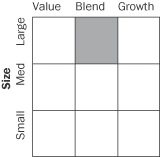
|
The Morningstar Style BoxTM is based on the fund’s portfolio holdings. For equity funds, the vertical axis shows the market capitalization of the stocks owned, and the horizontal axis shows investment style (value, blend, or growth). Information shown is based on the most recent data provided by Morningstar.
© 2011 Morningstar, Inc. All rights reserved. The Morningstar information contained herein: (1) is proprietary to Morningstar and/or its content providers; (2) may not be copied or distributed; and (3) is not warranted to be accurate, complete or timely. Neither Morningstar nor its content providers are responsible for any damages or losses arising from any use of this information.
Summary
| n | | For the 12-month period that ended March 31, 2011, Columbia Value and Restructuring Fund’s Class A shares returned 20.17% without sales charge. |
| n | | The fund outpaced its benchmarks, the Russell 1000 Value Index1 and the S&P 500 Index2, which returned 15.15% and 15.65%, respectively. The fund also outperformed the 16.02% average return of funds in its peer group, the Lipper Multi-Cap Value Funds Classification3. |
| n | | The fund’s tilt in favor of companies that benefited from major growth trends in emerging markets, especially those in the industrials and energy sectors, was a significant factor in its outperformance. |
Portfolio Management
David J. Williams co-managed the fund since 2008 and the predecessor fund since 1993 and has been associated with the fund’s advisers or the fund’s previous adviser or its predecessors since 1987.
Guy W. Pope has co-managed the fund since 2009 and has been associated with the fund’s advisers or the fund’s previous adviser or its predecessors since 1993.
J. Nicholas Smith has co-managed the fund since 2009 and has been associated with the fund’s advisers or the fund’s previous adviser or its predecessors since 2005.
| 1 | The Russell 1000 Value Index measures the performance of those Russell 1000 Index companies with lower price-to-book ratios and lower forecasted growth values. |
| 2 | The Standard & Poor’s (S&P) 500 Index tracks the performance of 500 widely held, large-capitalization U.S. stocks. |
| 3 | Lipper Inc., a widely respected data provider in the industry, calculates an average total return (assuming reinvestment of distributions) for mutual funds with investment objectives similar to those of the fund. Lipper makes no adjustment for the effect of sales loads. |
Indices are not available for investment, are not professionally managed and do not reflect sales charges, fees, brokerage commissions, taxes or other expenses of investing. Securities in the fund may not match those in an index.
1
Economic Update – Columbia Value and Restructuring Fund
The U.S. economy continued to expand at a solid but uneven pace over the past 12 months, as measured by gross domestic product (GDP). Although lackluster second quarter 2010 GDP growth raised fears that the economy was losing steam and might lapse back into recession, the pace picked up in the third quarter of 2010, inspiring confidence among consumers, businesses and investors. GDP expanded by 2.6% in the third quarter and 3.1% in the fourth quarter. With the Federal Reserve Board (the Fed) providing additional monetary stimulus to shore up economic growth and the extension of key tax cuts for the next two years, expectations are for continued growth in 2011. However, early estimates of first quarter 2011 growth place it just under 2.0%, a disappointment after two strong quarters and a pick-up in employment.
Consumer spending on cars, clothing and other goods generally trended higher during the 12-month period, accelerating in the fourth quarter of 2010. Holiday spending rose 5.5% between November 5, 2010 and December 24, 2010, in all retail categories, excluding automobiles, compared with the same period in 2009, according to MasterCard Advisors’ SpendingPulse, which tracks spending on all transactions including cash. Personal income surged in January 2011 as payroll tax cuts kicked in. The personal savings rate edged higher, ending February, the last month for which data was available, at 5.8%.
News on the job front was increasingly positive. A good portion of the jobs added in March, April and May of 2010 were temporary, government-sponsored census positions, which began to unwind in June, July and August, 2010. However, private sector payroll employment began to trend higher in the third quarter, massive layoffs declined and job growth turned solidly positive, with the addition of 444,000 new jobs in the first quarter of 2011.
Despite some glimmers of improvement early in 2010, the housing market remained troublesome throughout the period. Both new and existing home sales fell after a federal tax credit for new and repeat homebuyers expired. Distressed properties pressured prices and foreclosures continued — another drag on prices. The inventory of unsold homes ended the period higher than it started, at 8.9 and 8.6 months for new and existing homes, respectively, according to the National Association of Realtors and a joint release from the U.S. Census Bureau and the U.S. Department of Housing and Urban Development. The new year brought more disappointing news: Existing home sales fell in January 2011 after three months of sustained improvement. Tight credit and weak appraisals were cited as possible reasons for the decline.
Reports from the business side of the economy were generally positive. A key measure of the nation’s manufacturing situation — the Institute for Supply Management’s Index — took a somewhat surprising turn higher in the final months of the period. Technology spending rose 12% in 2010, according to the NPD Group, a national marketing research firm. Purchases of computers, networking and software returned to prerecession levels. Industrial production rose over the period, and manufacturing capacity utilized, per the report issued by the Fed — a key measure of the health of the manufacturing sector — edged higher.
Summary
For the 12-month period that ended March 31, 2011
| | n | | The U.S. stock market, as measured by the S&P 500 Index, delivered solid returns, despite a summer 2010 correction. Foreign stock market returns were also positive, as measured by the MSCI EAFE Index (Net). | |
| | |
| S&P Index | | MSCI Index |
| |

| |
|
15.65% | | 10.42% |
| | n | | Strengthening economic growth and rising interest rates kept a lid on most bond market sectors. The Barclays Capital Aggregate Bond Index delivered modest results. However, high-yield bonds were strong performers, as measured by the JPMorgan Developed BB High Yield Index. | |
| | |
| Barclays Aggregate Index | | JPMorgan Index |
| |
| |
|
5.12% | | 13.04% |
2
Economic Update (continued) – Columbia Value and Restructuring Fund
Stocks moved higher despite summer 2010 decline
Against a strengthening economic backdrop, stock prices continued to rally despite a summer 2010 setback linked to a debt crisis brewing in Europe, which raised concerns among U.S. investors. These fears were short-lived and stocks regained their footing. In this environment, the S&P 500 Index1 returned 15.65% for the 12 months through March 31, 2011. Outside the United States, stock markets also delivered solid gains. The MSCI EAFE Index (Net)2 a broad gauge of stock market performance in foreign developed markets, returned 10.42% (in U.S. dollars) for the 12-month period, as concerns about the impact of a bailout for weak euro zone economies eased yet continued to restrain market performance. Emerging stock markets were strong. The MSCI Emerging Markets Index (Net)3 returned 18.46% (in U.S. dollars) for the 12-month period.
Bonds delivered modest returns
As the economy strengthened and interest rates edged higher, most bond sectors delivered modest returns. The Barclays Capital Aggregate Bond Index4 returned 5.12%. High-yield bonds led the fixed-income markets. For the 12 months covered by this report, the JPMorgan Developed BB High Yield Index5 returned 13.04% as default fears abated and investors grew more comfortable with risk. Despite rising yields in the second half of the period, the Treasury market was also positive. The Barclays Capital U.S. Treasury Index6 returned 4.53%. However, municipal bonds struggled in the second half of the period, as interest rates inched higher and issue supply surged ahead of the year-end expiration of the Build America Bonds program. The Barclays Capital Municipal Bond Index7 gained 1.63% for the period. Despite positive economic activity, the Fed kept a key short-term interest rate — the federal funds rate — close to zero, reflecting ongoing concerns about employment and the housing market.
Past performance is no guarantee of future results.
| 1 | The Standard & Poor’s (S&P) 500 Index tracks the performance of 500 widely held, large-capitalization U.S. stocks. |
| 2 | The Morgan Stanley Capital International Europe, Australasia, Far East (MSCI EAFE) Index (Net) is a free float-adjusted market capitalization index that is designed to measure the equity market performance of developed markets, excluding the U.S. & Canada. As of December 31, 2010, the MSCI EAFE Index (Net) consisted of the following 22 developed market country indices: Australia, Austria, Belgium, Denmark, Finland, France, Germany, Greece, Hong Kong, Ireland, Israel, Italy, Japan, the Netherlands, New Zealand, Norway, Portugal, Singapore, Spain, Sweden, Switzerland and the United Kingdom. |
| 3 | The Morgan Stanley Capital International Emerging Markets (MSCI EM) Index (Net) is a free float-adjusted market capitalization index that is designed to measure equity market performance of emerging markets. As of December 31, 2010, the MSCI EM Index (Net) consisted of the following 21 emerging market country indices: Brazil, Chile, China, Colombia, Czech Republic, Egypt, Hungary, India, Indonesia, Korea, Malaysia, Mexico, Morocco, Peru, Philippines, Poland, Russia, South Africa, Taiwan, Thailand and Turkey. |
| 4 | The Barclays Capital Aggregate Bond Index is a market value-weighted index that tracks the daily price, coupon, pay-downs and total return performance of fixed-rate, publicly placed, dollar-denominated and non-convertible investment grade debt issues with at least $250 million par amount outstanding and with at least one year to final maturity. |
| 5 | The JPMorgan Developed BB High Yield Index is an unmanaged index designed to mirror the investable universe of the U.S. dollar developed, BB-rated, high yield corporate debt market. |
| 6 | The Barclays Capital U.S. Treasury Index includes public obligations of the U.S. Treasury. Treasury bills are excluded by the maturity constraint. In addition, certain special issues, such as state and local government series bonds (SLGs), as well as U.S.Treasury TIPS, are excluded. STRIPS are excluded from the index because their inclusion would result in double-counting. |
| 7 | The Barclays Capital Municipal Bond Index is considered representative of the broad market for investment-grade, tax-exempt bonds with a maturity of at least one year. |
Indices are not available for investment, are not professionally managed and do not reflect sales charges, fees, brokerage commissions, taxes or other expenses of investing. Securities in the fund may not match those in an index.
3
Performance Information – Columbia Value and Restructuring Fund
Performance data quoted represents past performance and current performance may be lower or higher. Past performance is no guarantee of future results. The investment return and principal value will fluctuate so that shares, when redeemed, may be worth more or less than the original cost. Please visit www.columbiamanagement.com for daily and most recent month-end performance updates.
| | | | |
| Net asset value per share | |
| |
as of 03/31/11 ($) | | | | |
Class A | | | 53.03 | |
Class C | | | 52.89 | |
Class I | | | 53.03 | |
Class R | | | 52.98 | |
Class W | | | 53.04 | |
Class Z | | | 53.01 | |
| | | | |
| Distributions declared per share | |
| |
04/01/10 – 03/31/11 ($) | | | | |
Class A | | | 0.55 | |
Class C | | | 0.25 | |
Class I | | | 0.28 | |
Class R | | | 0.44 | |
Class W | | | 0.18 | |
Class Z | | | 0.66 | |
|
| Performance of a $10,000 investment 04/01/01 – 03/31/11 |
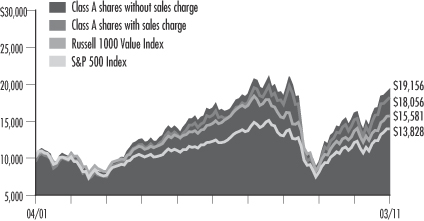
The chart above shows the change in value of a hypothetical $10,000 investment in Class A shares of Columbia Value and Restructuring Fund during the stated time period, and does not reflect the deduction of taxes that a shareholder may pay on fund distributions or on the redemption of fund shares.
| | | | | | | | |
| Performance of a $10,000 investment 04/01/01 – 03/31/11 ($) | |
| | |
| Sales charge | | without | | | with | |
Class A | | | 19,156 | | | | 18,056 | |
Class C | | | 18,669 | | | | 18,669 | |
Class I | | | n/a | | | | n/a | |
Class R | | | 18,732 | | | | n/a | |
Class W | | | n/a | | | | n/a | |
Class Z | | | 19,296 | | | | n/a | |
| | | | | | | | | | | | | | | | | | | | | | | | | | | | | | | | |
| Average annual total return as of 03/31/11 (%) | |
| | | | | | |
| Share class | | A | | | C | | | I | | | R | | | W | | | Z | |
| Inception | | 09/28/07 | | | 09/28/07 | | | 09/27/10 | | | 12/31/04 | | | 09/27/10 | | | 12/31/92 | |
Sales
charge | | without | | | with | | | without | | | with | | | without | | | without | | | without | | | without | |
1-year | | | 20.17 | | | | 13.25 | | | | 19.27 | | | | 18.27 | | | | n/a | | | | 19.86 | | | | n/a | | | | 20.46 | |
5-year | | | 2.85 | | | | 1.63 | | | | 2.32 | | | | 2.32 | | | | n/a | | | | 2.50 | | | | n/a | | | | 3.00 | |
10-year/Life | | | 6.72 | | | | 6.09 | | | | 6.44 | | | | 6.44 | | | | 22.67 | | | | 6.48 | | | | 22.41 | | | | 6.79 | |
The “with sales charge” returns include the maximum initial sales charge of 5.75% for Class A shares and the applicable contingent deferred sales charge of 1.00% for Class C shares for the first year only. The “without sales charge” returns do not include the effect of sales charges. If they had, returns would be lower.
The Fund commenced operations on March 31, 2008. The returns of the Class A and Class C shares shown include the returns of Class A shares or Class C shares, as applicable, of Value and Restructuring Fund, the predecessor to the Fund and a series of Excelsior Funds, Inc. (the “Predecessor Fund”), for periods after September 27, 2007, and include the returns of Shares class shares of the Predecessor Fund for periods prior to September 28, 2007. The returns shown reflect applicable sales charges, but have not been adjusted to reflect differences in expenses. If differences in expenses were reflected, the returns shown for the period prior to September 28, 2007 would be lower. The returns of the Class R shares shown include the returns of Retirement Shares class shares of the Predecessor Fund for periods after December 30, 2004, and include the returns of Shares class shares of the Predecessor Fund for periods prior to December 31, 2004. The returns shown reflect that Class R shares are sold without sales charges, but have not been adjusted to reflect differences in expenses. If differences in expenses were reflected, the returns shown for all periods would be lower. The returns of the Class Z shares shown for periods prior to March 31, 2008 are those of the Shares class shares of the Predecessor Fund. The returns of Class Z shares shown have not been adjusted to reflect differences in expenses. If differences in expenses were reflected, the returns shown for all periods would have been different.
Inception date refers to the date on which the Predecessor Fund class commenced operations. Class I and Class W shares were initially offered on September 27, 2010.
Performance results reflect any fee waivers or reimbursements of fund expenses by the investment advisor and/or any of its affiliates. Absent these fee waivers or expense reimbursement arrangements, performance results would have been lower.
All results shown assume the reinvestment of distributions. Class I and Class Z shares are sold at net asset value with no distribution and service (Rule 12b-1) fees. Class R shares are sold at net asset value with a distribution (Rule 12b-1) fee. Class W shares are sold at net asset value with a service (Rule 12b-1) fee. Class I, Class R, Class W and Class Z shares have limited eligibility and the investment minimum requirements may vary. Please see the fund’s prospectus for details. Performance for different share classes will vary based on differences in sales charges and fees associated with each class.
The tables do not reflect the deduction of taxes that a shareholder may pay on fund distributions or on the redemption of fund shares.
4
Understanding Your Expenses – Columbia Value and Restructuring Fund
As a fund shareholder, you incur two types of costs. There are transaction costs and ongoing costs, which generally include investment advisory fees, distribution and service (Rule 12b-1) fees and other fund expenses. The information on this page is intended to help you understand the ongoing costs of investing in the fund and to compare these costs with the ongoing costs of investing in other mutual funds.
Analyzing your fund’s expenses by share class
To illustrate these ongoing costs, we have provided an example and calculated the expenses paid by investors in each share class during the period. The information in the following table is based on an initial investment of $1,000, which is invested at the beginning of the period and held for the entire period. Expense information is calculated two ways and each method provides you with different information. The amount listed in the “Actual” column is calculated using the fund’s actual operating expenses and total return for the period. The amount listed in the “Hypothetical” column for each share class assumes that the return each year is 5% before expenses and is calculated based on the fund’s actual operating expenses. You should not use the hypothetical account values and expenses to estimate either your actual account balance at the end of the period or the expenses you paid during this period.
Compare with other funds
Since all mutual funds are required to include the same hypothetical calculations about expenses in shareholder reports, you can use this information to compare the ongoing costs of investing in the fund with other funds. To do so, compare the 5% hypothetical example with the 5% hypothetical examples that appear in the shareholder reports of other funds. As you compare hypothetical examples of other funds, it is important to note that hypothetical examples are meant to highlight the ongoing costs of investing in a fund and do not reflect any transaction costs, such as sales charges, redemption fees or exchange fees.
Estimating your actual expenses
To estimate the expenses that you paid over the period, first you will need your account balance at the end of the period:
| | n | | For shareholders who receive their account statements from Columbia Management Investment Services Corp., your account balance is available online at www.columbiamanagement.com or by calling Shareholder Services at 800.345.6611. | |
| | n | | For shareholders who receive their account statements from their financial intermediary, contact your financial intermediary to obtain your account balance. | |
| | 1. | Divide your ending account balance by $1,000. For example, if an account balance was $8,600 at the end of the period, the result would be 8.6. | |
| | 2. | In the section of the table below titled “Expenses paid during the period,” locate the amount for your share class. You will find this number in the column labeled “Actual.” Multiply this number by the result from step 1. Your answer is an estimate of the expenses you paid on your account during the period. | |
If the value of your account falls below the minimum initial investment requirement applicable to you, your account may be subject to a $20 annual fee. This fee is not included in the accompanying table. If you are subject to the fee, keep it in mind when you are estimating the ongoing expenses of investing in the fund and when comparing the expenses of this fund with other funds.
| | | | | | | | | | | | | | | | | | | | | | | | | | | | |
| 09/30/10 – 03/31/11 | | | | | | | | | | | | | | | | |
| | | | |
| | | Account value at the
beginning of the period ($) | | | Account value at the
end of the period ($) | | | Expenses paid
during the period ($) | | | Fund’s annualized
expense ratio (%) | |
| | | Actual | | | Hypothetical | | | Actual | | | Hypothetical | | | Actual | | | Hypothetical | | | Actual | |
Class A | | | 1,000.00 | | | | 1,000.00 | | | | 1,221.80 | | | | 1,018.85 | | | | 6.76 | | | | 6.14 | | | | 1.22 | |
Class C | | | 1,000.00 | | | | 1,000.00 | | | | 1,217.10 | | | | 1,015.11 | | | | 10.89 | | | | 9.90 | | | | 1.97 | |
Class I | | | 1,000.00 | | | | 1,000.00 | | | | 1,224.50 | | | | 1,020.99 | | | | 4.38 | | | | 3.98 | | | | 0.79 | |
Class R | | | 1,000.00 | | | | 1,000.00 | | | | 1,220.30 | | | | 1,017.60 | | | | 8.14 | | | | 7.39 | | | | 1.47 | |
Class W | | | 1,000.00 | | | | 1,000.00 | | | | 1,222.10 | | | | 1,020.24 | | | | 5.21 | | | | 4.73 | | | | 0.94 | |
Class Z | | | 1,000.00 | | | | 1,000.00 | | | | 1,223.20 | | | | 1,020.09 | | | | 5.38 | | | | 4.89 | | | | 0.97 | |
Expenses paid during the period are equal to the annualized expense ratio for the share class, multiplied by the average account value over the period, then multiplied by the number of days in the fund’s most recent fiscal half-year and divided by 365.
It is important to note that the expense amounts shown in the table are meant to highlight only ongoing costs of investing in the fund and do not reflect any transaction costs, such as sales charges, redemption fees or exchange fees. Therefore, the hypothetical examples provided may not help you determine the relative total costs of owning shares of different funds. If these transaction costs were included, your costs would have been higher.
5
Portfolio Managers’ Report – Columbia Value and Restructuring Fund
Performance data quoted represents past performance and current performance may be lower or higher. Past performance is no guarantee of future results. The investment return and principal value will fluctuate so that shares, when redeemed, may be worth more or less than the original cost. Please visit www.columbiamanagement.com for daily and most recent month-end performance updates.
| | | | |
| Top 10 holdings | | | |
| |
as of 03/31/11 (%) | | | | |
Union Pacific | | | 4.8 | |
Lorillard | | | 4.3 | |
Alpha Natural Resources | | | 3.9 | |
America Movil | | | 3.8 | |
Petroleo Brasileiro | | | 3.3 | |
Devon Energy | | | 3.3 | |
International Business Machines | | | 3.3 | |
Celanese | | | 3.2 | |
Consol Energy | | | 3.1 | |
ConocoPhillips | | | 3.0 | |
| | | | |
| Top 5 sectors | | | |
| |
as of 03/31/11 (%) | | | | |
Energy | | | 24.0 | |
Industrials | | | 17.1 | |
Financials | | | 15.7 | |
Materials | | | 15.0 | |
Information Technology | | | 7.6 | |
The fund is actively managed and the composition of its portfolio will change over time. Information provided is calculated as a percentage of net assets.
For the 12-month period that ended March 31, 2011, the fund’s Class A shares returned 20.17% without sales charge. The fund outperformed its benchmarks, the Russell 1000 Value Index and the S&P 500 Index, which returned 15.15% and 15.65%, respectively, and the average return of funds in its peer group, the Lipper Multi-Cap Value Funds Classification, which was 16.02% for the 12-month period. Overweighting companies in the industrials and energy groups, many of which benefited from dynamic growth in emerging markets, helped drive the fund’s performance higher than its benchmarks.
Global growth triggered industrials, energy performance
The fund was positioned throughout the 12-month period to take advantage of an expansion in the global economy, with an emphasis on investments in industrials and energy companies, especially in firms that earned significant profits from emerging markets. Leading performers in the industrials group included Union Pacific, United Technologies, Eaton and Tyco International (4.8%, 2.1%, 2.7% and 1.5% of net assets, respectively). At the same time, the growing global economy and rising oil prices — in part the result of political turmoil in the Middle East and North Africa — drove gains in the energy sector. Leading performers included integrated oil company ConocoPhillips (3.0% of net assets) and exploration and production companies Devon Energy and Noble Energy (3.3% and 2.5% of net assets, respectively). The global growth trend also helped lift positions in the materials sector. Holdings such as copper producer Southern Copper, chemical producer Celanese and mining corporation Freeport-McMoRan Copper & Gold (2.5%, 3.2%, and 2.5% of net assets, respectively) all produced solid results, as did the investment in Lanxess (1.9% of net assets), a German synthetic rubber producer.
Political worries weighed on some holdings
While the fund’s overall exposure to energy stocks helped the fund outperform the S&P 500 Index, Brazilian oil giant Petroleo Brasileiro (3.3% of net assets) was a major disappointment. The election of a leftist-leaning president in Brazil worried some investors and the company issued new equity shares that diluted the position of existing shareholders. Meanwhile, investment bank Goldman Sachs (1.5% of net assets) underperformed despite producing good earnings as the markets worried that future earnings could be eroded by potentially tighter financial regulation in the United States. We sold another position in an underperforming investment bank, Morgan Stanley, after its restructuring activities failed to improve earnings. Other disappointing performers included Panamanian airline Copa Holdings (1.5% of net assets), which underperformed despite producing good earnings, and consumer company Avon Products (0.7% of net assets), which struggled with restructured overseas operations.
Inflationary concerns finally being addressed
We have been concerned about the prospect of rising inflationary pressures in the United States, fed by government deficit spending and easy monetary policies. However, we think politics have shifted and the inflation threat is finally being addressed. While the dangers from rising oil prices remain, we believe the threat to the markets is less than it was in 2008, because higher inflation and capital costs already are built into current stock prices. Nevertheless, we have positioned the fund against the risk of rising prices, with about 39% of fund’s assets invested in energy and materials, two traditional hedges against inflation.
6
Portfolio Managers’ Report (continued) – Columbia Value and Restructuring Fund
Because we focus on better quality companies, we think the fund is well positioned for a period of uncertainty. The fund’s investment process emphasizes companies with lower-than-average stock price multiples, strong cash flows and potentially above-average growth rates. This has led to strong representation by corporations with significant global and emerging market exposure.
In addition to what we believe to be fundamental advantages in the portfolio, we think stocks have a technical advantage over alternative investments. The average individual investor has an estimated 40% of his or her assets invested in the stock market. That’s far below long-term averages. We expect more money to flow into the stock market in recognition of its higher-return potential compared with other investments.
Portfolio characteristics and holdings are subject to change periodically and may not be representative of current characteristics and holdings. The outlook for the fund may differ from that presented for other Columbia Funds.
Equity securities are affected by stock market fluctuations that occur in response to economic and business developments.
Value stocks are stocks of companies that may have experienced adverse business or industry developments or may be subject to special risks that have caused the stocks to be out of favor. If the manager’s assessment of a company’s prospects is wrong, the price of its stock may not approach the value the manager has placed on it.
International investing involves special risks, including foreign taxation, currency risks, risks associated with possible differences in financial standards and other risks associated with future political and economic developments.
Investing in emerging markets may involve greater risks than investing in more developed countries. In addition, concentration of investments in a single region may result in greater volatility.
7
Investment Portfolio – Columbia Value and Restructuring Fund
March 31, 2011
Common Stocks – 97.8%
| | | | | | | | |
| | | Shares | | | Value ($) | |
| Consumer Discretionary – 5.6% | | | | | | | | |
| Automobiles – 1.0% | | | | | | | | |
Ford Motor Co. (a) | | | 4,500,000 | | | | 67,095,000 | |
| | | | | | | | |
Automobiles Total | | | | | | | 67,095,000 | |
| | |
| Household Durables – 2.4% | | | | | | | | |
Newell Rubbermaid, Inc. | | | 3,600,000 | | | | 68,868,000 | |
Stanley Black & Decker, Inc. | | | 1,350,000 | | | | 103,410,000 | |
| | | | | | | | |
Household Durables Total | | | | | | | 172,278,000 | |
| | |
| Specialty Retail – 2.2% | | | | | | | | |
TJX Companies, Inc. | | | 3,050,000 | | | | 151,676,500 | |
| | | | | | | | |
Specialty Retail Total | | | | | | | 151,676,500 | |
| | | | | | | | |
Consumer Discretionary Total | | | | | | | 391,049,500 | |
| | | | | | | | |
| Consumer Staples – 5.2% | | | | | | | | |
| Food Products – 0.2% | | | | | | | | |
Dole Food Co., Inc. (a) | | | 800,000 | | | | 10,904,000 | |
| | | | | | | | |
Food Products Total | | | | | | | 10,904,000 | |
| | |
| Personal Products – 0.7% | | | | | | | | |
Avon Products, Inc. | | | 1,850,000 | | | | 50,024,000 | |
| | | | | | | | |
Personal Products Total | | | | | | | 50,024,000 | |
| | |
| Tobacco – 4.3% | | | | | | | | |
Lorillard, Inc. (b) | | | 3,200,000 | | | | 304,032,000 | |
| | | | | | | | |
Tobacco Total | | | | | | | 304,032,000 | |
| | | | | | | | |
Consumer Staples Total | | | | | | | 364,960,000 | |
| | | | | | | | |
| Energy – 23.7% | | | | | | | | |
| Oil, Gas & Consumable Fuels – 23.7% | | | | | |
Alpha Natural Resources, Inc. (a)(c) | | | 4,550,000 | | | | 270,133,500 | |
Anadarko Petroleum Corp. (b) | | | 1,850,000 | | | | 151,552,000 | |
Apache Corp. | | | 300,000 | | | | 39,276,000 | |
ConocoPhillips | | | 2,650,000 | | | | 211,629,000 | |
Consol Energy, Inc. | | | 4,100,000 | | | | 219,883,000 | |
Devon Energy Corp. | | | 2,500,000 | | | | 229,425,000 | |
Kinder Morgan, Inc. (a) | | | 1,000,000 | | | | 29,640,000 | |
Murphy Oil Corp. | | | 850,000 | | | | 62,407,000 | |
Noble Energy, Inc. | | | 1,800,000 | | | | 173,970,000 | |
PetroHawk Energy Corp. (a) | | | 1,500,000 | | | | 36,810,000 | |
Petroleo Brasileiro SA, ADR | | | 5,800,000 | | | | 234,494,000 | |
| | | | | | | | |
Oil, Gas & Consumable Fuels Total | | | | 1,659,219,500 | |
| | | | | | | | |
Energy Total | | | | | | | 1,659,219,500 | |
| | | | | | | | |
| Financials – 14.4% | | | | | | | | |
| Capital Markets – 4.3% | | | | | | | | |
Apollo Global Management LLC (a) | | | 1,300,000 | | | | 23,400,000 | |
Apollo Investment Corp. (d) | | | 4,500,000 | | | | 54,270,000 | |
| | | | | | | | |
| | | Shares | | | Value ($) | |
Goldman Sachs Group, Inc. | | | 650,000 | | | | 103,005,500 | |
Invesco Ltd. | | | 4,800,000 | | | | 122,688,000 | |
| | | | | | | | |
Capital Markets Total | | | | | | | 303,363,500 | |
| | |
| Commercial Banks – 1.2% | | | | | | | | |
PNC Financial Services Group, Inc. | | | 1,350,000 | | | | 85,036,500 | |
| | | | | | | | |
Commercial Banks Total | | | | | | | 85,036,500 | |
| |
| Diversified Financial Services – 1.8% | | | | | |
JPMorgan Chase & Co. | | | 2,700,000 | | | | 124,470,000 | |
| | | | | | | | |
Diversified Financial Services Total | | | | 124,470,000 | |
| | |
| Insurance – 6.5% | | | | | | | | |
ACE Ltd. | | | 3,100,000 | | | | 200,570,000 | |
AIA Group Ltd. (a) | | | 15,000,000 | | | | 46,174,077 | |
Loews Corp. | | | 1,900,000 | | | | 81,871,000 | |
MetLife, Inc. | | | 2,800,000 | | | | 125,244,000 | |
| | | | | | | | |
Insurance Total | | | | | | | 453,859,077 | |
|
| Real Estate Investment Trusts (REITs) – 0.6% | |
Weyerhaeuser Co. | | | 1,700,000 | | | | 41,820,000 | |
| | | | | | | | |
Real Estate Investment Trusts (REITs) Total | | | | 41,820,000 | |
| | | | | | | | |
Financials Total | | | | | | | 1,008,549,077 | |
| | | | | | | | |
| Health Care – 5.3% | | | | | | | | |
| Health Care Equipment & Supplies – 0.9% | |
Baxter International, Inc. | | | 1,200,000 | | | | 64,524,000 | |
| | | | | | | | |
Health Care Equipment & Supplies Total | | | | 64,524,000 | |
| |
| Health Care Providers & Services – 2.6% | | | | | |
AmerisourceBergen Corp. | | | 4,600,000 | | | | 181,976,000 | |
| | | | | | | | |
Health Care Providers & Services Total | | | | 181,976,000 | |
| | |
| Pharmaceuticals – 1.8% | | | | | | | | |
Pfizer, Inc. | | | 4,000,000 | | | | 81,240,000 | |
Warner Chilcott PLC, Class A | | | 2,000,000 | | | | 46,560,000 | |
| | | | | | | | |
Pharmaceuticals Total | | | | | | | 127,800,000 | |
| | | | | | | | |
Health Care Total | | | | | | | 374,300,000 | |
| | | | | | | | |
| Industrials – 16.8% | | | | | | | | |
| Aerospace & Defense – 3.6% | |
AerCap Holdings NV (a)(c) | | | 5,300,000 | | | | 66,621,000 | |
Bombardier, Inc., Class B | | | 5,300,000 | | | | 38,743,000 | |
United Technologies Corp. | | | 1,700,000 | | | | 143,905,000 | |
| | | | | | | | |
Aerospace & Defense Total | | | | | | | 249,269,000 | |
| | |
Airlines – 1.5% | | | | | | | | |
Copa Holdings SA, Class A | | | 1,950,000 | | | | 102,960,000 | |
| | | | | | | | |
Airlines Total | | | | | | | 102,960,000 | |
| |
Construction & Engineering – 0.7% | | | | | |
AECOM Technology Corp. (a) | | | 1,750,000 | | | | 48,527,500 | |
| | | | | | | | |
Construction & Engineering Total | | | | | | | 48,527,500 | |
See Accompanying Notes to Financial Statements.
8
Columbia Value and Restructuring Fund
March 31, 2011
Common Stocks (continued)
| | | | | | | | |
| | | Shares | | | Value ($) | |
| Industrials (continued) | | | | | | | | |
| Electrical Equipment – 0.1% | |
Sensata Technologies Holding NV (a) | | | 150,000 | | | | 5,209,500 | |
| | | | | | | | |
Electrical Equipment Total | | | | | | | 5,209,500 | |
| |
Industrial Conglomerates – 1.5% | | | | | |
Tyco International Ltd. (b) | | | 2,400,000 | | | | 107,448,000 | |
| | | | | | | | |
Industrial Conglomerates Total | | | | | | | 107,448,000 | |
| | |
Machinery – 4.3% | | | | | | | | |
AGCO Corp. (a) | | | 2,100,000 | | | | 115,437,000 | |
Eaton Corp. (b) | | | 3,400,000 | | | | 188,496,000 | |
| | | | | | | | |
Machinery Total | | | | | | | 303,933,000 | |
| | |
Professional Services – 0.3% | | | | | | | | |
Nielsen Holdings NV (a) | | | 900,000 | | | | 24,579,000 | |
| | | | | | | | |
Professional Services Total | | | | | | | 24,579,000 | |
| | |
Road & Rail – 4.8% | | | | | | | | |
Union Pacific Corp. | | | 3,400,000 | | | | 334,322,000 | |
| | | | | | | | |
Road & Rail Total | | | | | | | 334,322,000 | |
| | | | | | | | |
Industrials Total | | | | | | | 1,176,248,000 | |
| | | | | | | | |
| Information Technology – 7.6% | | | | | | | | |
| Communications Equipment – 2.8% | |
Harris Corp. | | | 4,000,000 | | | | 198,400,000 | |
| | | | | | | | |
Communications Equipment Total | | | | 198,400,000 | |
|
Electronic Equipment, Instruments & Components – 0.6% | |
Corning, Inc. | | | 1,900,000 | | | | 39,197,000 | |
| | | | | | | | |
Electronic Equipment, Instruments & Components Total | | | | 39,197,000 | |
| | |
IT Services – 3.7% | | | | | | | | |
International Business Machines Corp. | | | 1,400,000 | | | | 228,298,000 | |
Visa, Inc., Class A | | | 450,000 | | | | 33,129,000 | |
| | | | | | | | |
IT Services Total | | | | | | | 261,427,000 | |
| | |
Office Electronics – 0.5% | | | | | | | | |
Xerox Corp. | | | 3,500,000 | | | | 37,275,000 | |
| | | | | | | | |
Office Electronics Total | | | | | | | 37,275,000 | |
| | | | | | | | |
Information Technology Total | | | | 536,299,000 | |
| | | | | | | | |
| Materials – 15.0% | | | | | | | | |
| Chemicals – 6.3% | |
Celanese Corp., Series A | | | 5,000,000 | | | | 221,850,000 | |
Lanxess AG | | | 1,800,000 | | | | 134,639,613 | |
Methanex Corp. | | | 1,350,000 | | | | 42,160,500 | |
PPG Industries, Inc. | | | 450,000 | | | | 42,844,500 | |
| | | | | | | | |
Chemicals Total | | | | | | | 441,494,613 | |
| | | | | | | | |
| | | Shares | | | Value ($) | |
| Metals & Mining – 8.7% | |
Freeport-McMoRan Copper & Gold, Inc. | | | 3,100,000 | | | | 172,205,000 | |
Grupo Mexico SAB de CV,
Series B | | | 26,000,000 | | | | 97,490,847 | |
Schnitzer Steel Industries, Inc., Class A | | | 1,200,000 | | | | 78,012,000 | |
Southern Copper Corp. | | | 4,400,000 | | | | 177,188,000 | |
Vale SA, ADR | | | 2,600,000 | | | | 86,710,000 | |
| | | | | | | | |
Metals & Mining Total | | | | | | | 611,605,847 | |
| | | | | | | | |
Materials Total | | | | | | | 1,053,100,460 | |
| | | | | | | | |
| Telecommunication Services – 4.2% | |
| Diversified Telecommunication Services – 0.5% | |
Windstream Corp. | | | 2,600,000 | | | | 33,462,000 | |
| | | | | | | | |
Diversified Telecommunication Services Total | | | | | | | 33,462,000 | |
|
Wireless Telecommunication Services – 3.7% | |
America Movil SAB de CV, Series L, ADR | | | 4,550,000 | | | | 264,355,000 | |
| | | | | | | | |
Wireless Telecommunication Services Total | | | | | | | 264,355,000 | |
| | | | | | | | |
Telecommunication Services Total | | | | 297,817,000 | |
| | | | | | | | |
Total Common Stocks
(cost of $4,233,636,840) | | | | | | | 6,861,542,537 | |
|
Convertible Preferred Stocks – 1.8% | |
| | | | | | | | |
| Consumer Staples – 0.5% | | | | | | | | |
| Food Products – 0.5% | | | | | | | | |
Dole Food Automatic Common Exchange Security Trust,
7.000% (e) | | | 2,500,000 | | | | 31,836,000 | |
| | | | | | | | |
Food Products Total | | | | 31,836,000 | |
| | | | | | | | |
Consumer Staples Total | | | | | | | 31,836,000 | |
| | | | | | | | |
| Energy – 0.3% | | | | | | | | |
| Oil, Gas & Consumable Fuels – 0.3% | | | | | |
Apache Corp., 6.000% | | | 350,000 | | | | 24,801,000 | |
| | | | | | | | |
Oil, Gas & Consumable Fuels Total | | | | 24,801,000 | |
| | | | | | | | |
Energy Total | | | | | | | 24,801,000 | |
| | | | | | | | |
| Financials – 1.0% | | | | | | | | |
| Diversified Financial Services – 0.5% | | | | | |
Citigroup, Inc., 7.500% | | | 300,000 | | | | 37,950,000 | |
| | | | | | | | |
Diversified Financial Services Total | | | | 37,950,000 | |
See Accompanying Notes to Financial Statements.
9
Columbia Value and Restructuring Fund
March 31, 2011
Convertible Preferred Stocks (continued)
| | | | | | | | |
| | | Shares | | | Value ($) | |
| Financials (continued) | | | | | | | | |
| Insurance – 0.5% | | | | | |
Hartford Financial Services Group, Inc., 7.250% | | | 1,250,000 | | | | 32,600,000 | |
| | | | | | | | |
Insurance Total | | | | 32,600,000 | |
| | | | | | | | |
Financials Total | | | | | | | 70,550,000 | |
| | | | | | | | |
Total Convertible Preferred Stocks
(cost of $109,839,122) | | | | 127,187,000 | |
| | |
Convertible Bond – 0.3% | | | | | | | | |
| | | Par ($) | | | | |
| Financials – 0.3% | | | | | | | | |
| Investment Companies – 0.3% | | | | | |
Apollo Investment Corp.
5.750% 01/15/16 (e) | | | 16,490,000 | | | | 17,314,500 | |
| | | | | | | | |
Investment Companies Total | | | | | | | 17,314,500 | |
| | | | | | | | |
Financials Total | | | | | | | 17,314,500 | |
| | | | | | | | |
Total Convertible Bond
(cost of $16,250,548) | | | | 17,314,500 | |
| | |
Warrants – 0.3% | | | | | | | | |
| | | Units | | | | |
| Industrials – 0.3% | | | | | | | | |
Hartford Financial Services Group, Inc. Wts. Expiring 06/19/26 (a) | | | 1,200,000 | | | | 22,008,000 | |
| | | | | | | | |
Industrials Total | | | | 22,008,000 | |
| | | | | | | | |
Total Warrants
(cost of $17,226,860) | | | | | | | 22,008,000 | |
| | |
Short-Term Obligation – 0.1% | | | | | | | | |
| | | Par ($) | | | | |
Repurchase agreement with Fixed Income Clearing Corp., dated 03/31/11, due 04/01/11 at 0.070%, collateralized by a U.S. Government Agency obligation maturing 06/23/15, market value $7,850,625 (repurchase proceeds $7,693,015) | | | 7,693,000 | | | | 7,693,000 | |
| | | | | | | | |
Total Short-Term Obligation
(cost of $7,693,000) | | | | 7,693,000 | |
| | | | | | | | |
Total Investments – 100.3%
(cost of $4,384,646,370) (f) | | | | 7,035,745,037 | |
| | | | | | | | |
Other Assets & Liabilities, Net – (0.3)% | | | | (20,871,559 | ) |
| | | | | | | | |
Net Assets – 100.0% | | | | | | | 7,014,873,478 | |
Notes to Investment Portfolio:
| (a) | Non-income producing security. |
| (b) | All or a portion of this security is pledged as collateral for open written options contracts. |
| (c) | An affiliate may include any company in which the Fund owns five percent or more of its outstanding voting shares. Transactions with companies which are or were affiliates during the year ended March 31, 2011, are as follows: |
| | | | | | | | | | | | | | | | | | | | |
Affiliate | | Value,
Beginning of
Period | | | Purchases | | | Sales
Proceeds | | | Dividend
Income | | | Value,
End of
Period | |
AerCap Holdings NV | | $ | 62,208,000 | | | $ | — | | | $ | 2,380,220 | | | $ | — | | | $ | — | |
Alpha Natural Resources, Inc. | | | 294,351,000 | | | | — | | | | 29,019,299 | | | | — | | | | — | |
| | | | | | | | | | | | | | | | | | | | |
Total | | $ | 356,559,000 | | | $ | — | | | $ | 31,399,519 | | | $ | — | | | $ | — | |
| | | | | | | | | | | | | | | | | | | | |
| (d) | Closed-end Management Investment Company. |
| (e) | Security exempt from registration pursuant to Rule 144A under the Securities Act of 1933. These securities may be resold in transactions exempt from registration, normally to qualified institutional buyers. At March 31, 2011, these securities, which are not illiquid, amounted to $49,150,500, which represents 0.7% of net assets. |
| (f) | Cost for federal income tax purposes is $4,409,253,187. |
Generally accepted accounting principles (GAAP) require disclosure regarding the inputs and valuation techniques used to measure fair value and any changes in valuation inputs or techniques. In addition, investments shall be disclosed by major category.
The Fund categorizes its fair value measurements according to a three-level hierarchy that maximizes the use of observable inputs and minimizes the use of unobservable inputs by prioritizing that the most observable input be used when available. Observable inputs are those that market participants would use in pricing an investment based on market data obtained from sources independent of the reporting entity. Unobservable inputs are those that reflect the Fund’s assumptions about the information market participants would use in pricing an investment. An investment’s level within the fair value hierarchy is based on the lowest level of any input that is deemed significant to the asset or liability’s fair value measurement. The input levels are not necessarily an indication of the risk or liquidity associated with investments at that level. For example, certain U.S. government securities are generally high quality and liquid, however, they are reflected as Level 2 because the inputs used to determine fair value may not always be quoted prices in an active market.
Fair value inputs are summarized in the three broad levels listed below:
| • | | Level 1 — Valuations based on quoted prices for investments in active markets that the Fund has the ability to access at the measurement date (including NAV for open-end mutual funds). Valuation adjustments are not applied to Level 1 investments. |
| • | | Level 2 — Valuations based on other significant observable inputs (including quoted prices for similar securities, interest rates, prepayment speeds, credit risks, etc.). |
| • | | Level 3 — Valuations based on significant unobservable inputs (including the Fund’s own assumptions and judgment in determining the fair value of investments). |
Inputs that are used in determining fair value of an investment may include price information, credit data, volatility statistics, and other factors. These inputs can be either observable or unobservable. The availability of observable inputs can vary between investments, and is affected by various factors such as the type of investment, and the volume and level of activity for that investment or similar investments in the marketplace. The inputs will be considered by the Investment Manager, along with any other relevant factors in the calculation of an investment’s fair value. The Fund uses prices and inputs that are current as of the measurement date, which may include periods of market dislocations. During these periods, the availability of prices and inputs may be reduced for many investments. This condition could cause an investment to be reclassified between the various levels
See Accompanying Notes to Financial Statements.
10
Columbia Value and Restructuring Fund
March 31, 2011
within the hierarchy. Non-U.S. equity securities actively traded in foreign markets may be reflected in Level 2 despite the availability of closing prices, because the Fund evaluates and determines whether those closing prices reflect fair value at the close of the New York Stock Exchange (NYSE) or require adjustment, as described in Note 2 to the financial statements — Security Valuation.
Investments falling into the Level 3 category are primarily supported by quoted prices from brokers and dealers participating in the market for those investments. However, these may be classified as Level 3 investments due to lack of market transparency and corroboration to support these quoted prices. Additionally, valuation models may be used as the pricing source for any remaining investments classified as Level 3. These models rely on one or more significant unobservable inputs and/or significant assumptions by the Investment Manager. Inputs used in valuations may include, but are not limited to, financial statement analysis, capital account balances, discount rates and estimated cash flows, and comparable company data.
The following table is a summary of the inputs used to value the Fund’s investments as of March 31, 2011:
| | | | | | | | | | | | | | | | |
Description | | Quoted
Prices
(Level 1) | | | Other
Significant
Observable
Inputs
(Level 2) | | | Significant
Unobservable
Inputs
(Level 3) | | | Total | |
Common Stocks | | | | | | | | | | | | | | | | |
Consumer Discretionary | | $ | 391,049,500 | | | $ | — | | | $ | — | | | $ | 391,049,500 | |
Consumer Staples | | | 364,960,000 | | | | — | | | | — | | | | 364,960,000 | |
Energy | | | 1,659,219,500 | | | | — | | | | — | | | | 1,659,219,500 | |
Financials | | | 962,375,000 | | | | 46,174,077 | | | | — | | | | 1,008,549,077 | |
Health Care | | | 374,300,000 | | | | — | | | | — | | | | 374,300,000 | |
Industrials | | | 1,176,248,000 | | | | — | | | | — | | | | 1,176,248,000 | |
Information Technology | | | 536,299,000 | | | | — | | | | — | | | | 536,299,000 | |
Materials | | | 918,460,847 | | | | 134,639,613 | | | | — | | | | 1,053,100,460 | |
Telecommunication Services | | | 297,817,000 | | | | — | | | | — | | | | 297,817,000 | |
| | | | | | | | | | | | | | | | |
Total Common Stocks | | | 6,680,728,847 | | | | 180,813,690 | | | | — | | | | 6,861,542,537 | |
| | | | | | | | | | | | | | | | |
Total Convertible Preferred Stocks | | | 95,351,000 | | | | 31,836,000 | | | | — | | | | 127,187,000 | |
| | | | | | | | | | | | | | | | |
Total Convertible Bond | | | — | | | | 17,314,500 | | | | — | | | | 17,314,500 | |
| | | | | | | | | | | | | | | | |
Total Warrants | | | 22,008,000 | | | | — | | | | — | | | | 22,008,000 | |
| | | | | | | | | | | | | | | | |
Total Short-Term Obligation | | | — | | | | 7,693,000 | | | | — | | | | 7,693,000 | |
| | | | | | | | | | | | | | | | |
Total Investments | | | 6,798,087,847 | | | | 237,657,190 | | | | — | | | | 7,035,745,037 | |
| | | | | | | | | | | | | | | | |
Value of Written Call Option Contracts | | | (2,780,000 | ) | | | — | | | | — | | | | (2,780,000 | ) |
| | | | | | | | | | | | | | | | |
Total | | $ | 6,795,307,847 | | | $ | 237,657,190 | | | $ | — | | | $ | 7,032,965,037 | |
| | | | | | | | | | | | | | | | |
The Fund’s assets assigned to the Level 2 input category represent certain short-term obligations which are valued using amortized cost, an income approach which converts future cash flows to a present value based upon the discount or premium at purchase.
There were no significant transfers of financial assets between Levels 1 and 2 during the period.
For the year ended March 31, 2011, transactions in written option contracts were as follows:
| | | | | | | | |
| | | Number of
Contracts | | | Premium
Received | |
Options outstanding at March 31, 2010 | | | 9,000 | | | $ | 557,720 | |
Options written | | | 315,950 | | | | 40,506,736 | |
Options terminated in closing purchase transactions | | | (124,484 | ) | | | (19,647,441 | ) |
Options exercised | | | (38,956 | ) | | | (7,115,986 | ) |
Options expired | | | (156,510 | ) | | | (12,850,575 | ) |
| | | | | | | | |
Options outstanding at March 31, 2011 | | | 5,000 | | | $ | 1,450,454 | |
| | | | | | | | |
At March 31, 2011, the Fund held the following written call option contracts:
| | | | | | | | | | | | | | | | | | | | |
Name of Issuer | | Strike
Price | | | Number of
Contracts | | | Expiration
Date | | | Premium | | | Value | |
Anadarko Petroleum Corp. | | $ | 85.0 | | | | 1,000 | | | | 05/21/11 | | | $ | 309,534 | | | $ | (290,000 | ) |
Eaton Corp. | | | 50.0 | | | | 2,000 | | | | 04/16/11 | | | | 621,880 | | | | (1,120,000 | ) |
Lorillard, Inc. | | | 85.0 | | | | 1,000 | | | | 04/16/11 | | | | 297,994 | | | | (1,075,000 | ) |
Tyco International Ltd. | | | 42.0 | | | | 1,000 | | | | 04/16/11 | | | | 221,046 | | | | (295,000 | ) |
| | | | | | | | | | | | | | | | | | | | |
Total written call options: (proceeds $1,450,454) | | | $ | (2,780,000 | ) |
| | | | | | | | | | | | | | | | | | | | |
At March 31, 2011, the Fund held investments in the following sectors:
| | | | |
Sector (Unaudited) | | % of Net Assets | |
Energy | | | 24.0 | |
Industrials | | | 17.1 | |
Financials | | | 15.7 | |
Materials | | | 15.0 | |
Information Technology | | | 7.6 | |
Consumer Staples | | | 5.7 | |
Consumer Discretionary | | | 5.6 | |
Health Care | | | 5.3 | |
Telecommunication Services | | | 4.2 | |
| | | | |
| | | 100.2 | |
Short Term Obligation | | | 0.1 | |
Other Assets & Liabilities, Net | | | (0.3 | ) |
| | | | |
| | | 100.0 | |
| | | | |
| | |
Acronym | | Name |
| ADR | | American Depositary Receipt |
See Accompanying Notes to Financial Statements.
11
Statement of Assets and Liabilities – Columbia Value and Restructuring Fund
March 31, 2011
| | | | | | |
| | | | | ($) | |
| Assets | | Total investments, at identified cost | | | 4,384,646,370 | |
| | | | | | |
| | Total investments, at value | | | 7,035,745,037 | |
| | Cash | | | 138 | |
| | Receivable for: | | | | |
| | Investments sold | | | 17,701,308 | |
| | Fund shares sold | | | 4,474,272 | |
| | Dividends | | | 6,324,602 | |
| | Interest | | | 173,847 | |
| | Foreign tax reclaims | | | 186,946 | |
| | Trustees’ deferred compensation plan | | | 180,225 | |
| | Prepaid expenses | | | 241,264 | |
| | | | | | |
| | Total Assets | | | 7,065,027,639 | |
| | |
| Liabilities | | Written options, at value (premium of $1,450,454) | | | 2,780,000 | |
| | Payable for: | | | | |
| | Investments purchased | | | 26,862,725 | |
| | Fund shares repurchased | | | 13,314,933 | |
| | Investment advisory fee | | | 3,421,110 | |
| | Administration fee | | | 844,475 | |
| | Pricing and bookkeeping fees | | | 11,949 | |
| | Transfer agent fee | | | 2,439,203 | |
| | Trustees’ fees | | | 11,974 | |
| | Custody fee | | | 41,514 | |
| | Distribution and service fees | | | 143,283 | |
| | Chief compliance officer expenses | | | 1,890 | |
| | Trustees’ deferred compensation plan | | | 180,225 | |
| | Other liabilities | | | 100,880 | |
| | | | | | |
| | Total Liabilities | | | 50,154,161 | |
| | |
| | | | | | |
| | Net Assets | | | 7,014,873,478 | |
| | |
| Net Assets Consist of | | Paid-in capital | | | 5,733,670,729 | |
| | Undistributed net investment income | | | 40,742 | |
| | Accumulated net realized loss | | | (1,368,601,192 | ) |
| | Net unrealized appreciation (depreciation) on: | | | | |
| | Investments | | | 2,651,098,667 | |
| | Foreign currency translations | | | (5,922 | ) |
| | Written options | | | (1,329,546 | ) |
| | | | | | |
| | Net Assets | | | 7,014,873,478 | |
See Accompanying Notes to Financial Statements.
12
Statement of Assets and Liabilities (continued) – Columbia Value and Restructuring Fund
March 31, 2011
| | | | | | |
| | | | | | |
| Class A | | Net assets | | $ | 268,123,883 | |
| | Shares outstanding | | | 5,055,860 | |
| | Net asset value per share | | $ | 53.03 | (a) |
| | Maximum sales charge | | | 5.75 | % |
| | Maximum offering price per share ($53.03/0.9425) | | $ | 56.27 | (b) |
| | |
| Class C | | Net assets | | $ | 71,083,397 | |
| | Shares outstanding | | | 1,343,945 | |
| | Net asset value and offering price per share | | $ | 52.89 | (a) |
| | |
| Class I (c) | | Net assets | | $ | 26,651,631 | |
| | Shares outstanding | | | 502,570 | |
| | Net asset value, offering and redemption price per share | | $ | 53.03 | |
| | |
| Class R | | Net assets | | $ | 65,321,443 | |
| | Shares outstanding | | | 1,232,925 | |
| | Net asset value, offering and redemption price per share | | $ | 52.98 | |
| | |
| Class W (c) | | Net assets | | $ | 3,049 | |
| | Shares outstanding | | | 58 | |
| | Net asset value, offering and redemption price per share | | $ | 53.04 | (d) |
| | |
| Class Z | | Net assets | | $ | 6,583,690,075 | |
| | Shares outstanding | | | 124,203,226 | |
| | Net asset value, offering and redemption price per share | | $ | 53.01 | |
| (a) | Redemption price per share is equal to net asset value less any applicable contingent deferred sales charge. |
| (b) | On sales of $50,000 or more the offering price is reduced. |
| (c) | Class I and Class W shares commenced operations on September 27, 2010. |
| (d) | Net asset value per share rounds to this amount due to fractional shares outstanding. |
See Accompanying Notes to Financial Statements.
13
Statement of Operations – Columbia Value and Restructuring Fund
For the Year Ended March 31, 2011
| | | | | | |
| | | | | ($) (a) | |
| Investment Income | | Dividends | | | 151,163,581 | |
| | Interest | | | 1,490,839 | |
| | Foreign taxes withheld | | | (1,557,406 | ) |
| | | | | | |
| | Total Investment Income | | | 151,097,014 | |
| | |
| Expenses | | Investment advisory fee | | | 38,529,807 | |
| | Administration fee | | | 9,492,452 | |
| | Distribution fee: | | | | |
| | Class C | | | 505,329 | |
| | Class R | | | 292,553 | |
| | Service fee: | | | | |
| | Class A | | | 662,915 | |
| | Class C | | | 168,443 | |
| | Class W | | | 4 | |
| | Transfer agent fee – Class A, Class C, Class R, Class W and Class Z | | | 10,687,142 | |
| | Pricing and bookkeeping fees | | | 144,761 | |
| | Trustees’ fees | | | 278,135 | |
| | Custody fee | | | 273,086 | |
| | Chief compliance officer expenses | | | 7,456 | |
| | Other expenses | | | 1,836,951 | |
| | | | | | |
| | Expenses before interest expense | | | 62,879,034 | |
| | Interest expense | | | 57,869 | |
| | | | | | |
| | Total Expenses | | | 62,936,903 | |
| | |
| | Expense reductions | | | (60 | ) |
| | | | | | |
| | Net Expenses | | | 62,936,843 | |
| | |
| | | | | | |
| | Net Investment Income | | | 88,160,171 | |
| | |
| Net Realized and Unrealized Gain (Loss) on Investments, Written Options and Foreign Currency | | Net realized gain (loss) on: | | | | |
| | Unaffiliated investments | | | 295,570,803 | |
| | Affiliated investments | | | (1,422,567 | ) |
| | Foreign currency transactions | | | (167,353 | ) |
| | Written options | | | (12,965,801 | ) |
| | | | | | |
| | Net realized gain | | | 281,015,082 | |
| | |
| | Net change in unrealized appreciation (depreciation) on: | | | | |
| | Investments | | | 777,608,690 | |
| | Foreign currency translations | | | 9,941 | |
| | Written options | | | (1,294,266 | ) |
| | | | | | |
| | Net change in unrealized appreciation (depreciation) | | | 776,324,365 | |
| | | | | | |
| | Net Gain | | | 1,057,339,447 | |
| | |
| | | | | | |
| | Net Increase Resulting from Operations | | | 1,145,499,618 | |
| (a) | Class I and Class W shares commenced operations on September 27, 2010. |
See Accompanying Notes to Financial Statements.
14
Statement of Changes in Net Assets – Columbia Value and Restructuring Fund
| | | | | | | | | | |
| | | | | Year Ended March 31, | |
| Increase (Decrease) in Net Assets | | | | 2011 ($) (a)(b) | | | 2010 ($) | |
| Operations | | Net investment income | | | 88,160,171 | | | | 79,863,157 | |
| | Net realized gain (loss) on investments, written options and foreign currency transactions | | | 281,015,082 | | | | (324,092,562 | ) |
| | Net change in unrealized appreciation (depreciation) on investments, written options and foreign currency translations | | | 776,324,365 | | | | 3,334,282,112 | |
| | | | | | | | | | |
| | Net increase resulting from operations | | | 1,145,499,618 | | | | 3,090,052,707 | |
| | | |
| Distributions to Shareholders | | From net investment income: | | | | | | | | |
| | Class A | | | (3,204,542 | ) | | | (2,386,455 | ) |
| | Class C | | | (365,279 | ) | | | (271,834 | ) |
| | Class I | | | (54,138 | ) | | | — | |
| | Class R | | | (566,586 | ) | | | (411,525 | ) |
| | Class W | | | (11 | ) | | | — | |
| | Class Z | | | (87,200,668 | ) | | | (73,975,594 | ) |
| | | | | | | | | | |
| | Total distributions to shareholders | | | (91,391,224 | ) | | | (77,045,408 | ) |
| | | |
| | Net Capital Stock Transactions | | | (1,229,234,628 | ) | | | (416,549,708 | ) |
| | | |
| | Increase from regulatory settlements | | | — | | | | 11,049 | |
| | | | | | | | | | |
| | Total increase (decrease) in net assets | | | (175,126,234 | ) | | | 2,596,468,640 | |
| | | |
| Net Assets | | Beginning of period | | | 7,189,999,712 | | | | 4,593,531,072 | |
| | End of period | | | 7,014,873,478 | | | | 7,189,999,712 | |
| | Undistributed net investment income at end of period | | | 40,742 | | | | 3,439,148 | |
| (a) | Class I and Class W shares commenced operations on September 27, 2010. |
| (b) | Class I and Class W shares reflect activity for the period September 27, 2010 through March 31, 2011. |
See Accompanying Notes to Financial Statements.
15
Statement of Changes in Net Assets (continued) – Columbia Value and Restructuring Fund
| | | | | | | | | | | | | | | | |
| | | Capital Stock Activity | |
| | | Year Ended
March 31, 2011 (a)(b) | | | Year Ended
March 31, 2010 | |
| | | Shares | | | Dollars ($) | | | Shares | | | Dollars ($) | |
Class A | | | | | | | | | | | | | | | | |
Subscriptions | | | 1,122,585 | | | | 51,295,242 | | | | 2,661,138 | | | | 101,139,997 | |
Distributions reinvested | | | 59,362 | | | | 2,627,179 | | | | 60,817 | | | | 2,269,822 | |
Redemptions | | | (2,653,210 | ) | | | (119,919,348 | ) | | | (2,356,033 | ) | | | (88,374,983 | ) |
| | | | | | | | | | | | | | | | |
Net increase (decrease) | | | (1,471,263 | ) | | | (65,996,927 | ) | | | 365,922 | | | | 15,034,836 | |
| | | | |
Class C | | | | | | | | | | | | | | | | |
Subscriptions | | | 187,589 | | | | 8,712,920 | | | | 517,607 | | | | 19,769,519 | |
Distributions reinvested | | | 6,299 | | | | 273,618 | | | | 6,100 | | | | 222,574 | |
Redemptions | | | (528,877 | ) | | | (23,533,078 | ) | | | (367,782 | ) | | | (14,441,139 | ) |
| | | | | | | | | | | | | | | | |
Net increase (decrease) | | | (334,989 | ) | | | (14,546,540 | ) | | | 155,925 | | | | 5,550,954 | |
| | | | |
Class I | | | | | | | | | | | | | | | | |
Subscriptions | | | 535,411 | | | | 26,380,052 | | | | — | | | | — | |
Distributions reinvested | | | 1,051 | | | | 54,122 | | | | — | | | | — | |
Redemptions | | | (33,892 | ) | | | (1,723,811 | ) | | | — | | | | — | |
| | | | | | | | | | | | | | | | |
Net increase | | | 502,570 | | | | 24,710,363 | | | | — | | | | — | |
| | | | |
Class R | | | | | | | | | | | | | | | | |
Subscriptions | | | 278,727 | | | | 12,289,558 | | | | 309,097 | | | | 11,611,135 | |
Distributions reinvested | | | 12,868 | | | | 566,555 | | | | 11,147 | | | | 411,512 | |
Redemptions | | | (360,742 | ) | | | (16,451,024 | ) | | | (438,362 | ) | | | (16,452,188 | ) |
| | | | | | | | | | | | | | | | |
Net decrease | | | (69,147 | ) | | | (3,594,911 | ) | | | (118,118 | ) | | | (4,429,541 | ) |
| | | | |
Class W | | | | | | | | | | | | | | | | |
Subscriptions | | | 61 | | | | 2,651 | | | | — | | | | — | |
Redemptions | | | (3 | ) | | | (154 | ) | | | — | | | | — | |
| | | | | | | | | | | | | | | | |
Net increase | | | 58 | | | | 2,497 | | | | — | | | | — | |
| | | | |
Class Z | | | | | | | | | | | | | | | | |
Subscriptions | | | 30,084,448 | | | | 1,382,808,276 | | | | 36,044,433 | | | | 1,406,943,530 | |
Distributions reinvested | | | 1,314,238 | | | | 58,505,520 | | | | 1,469,656 | | | | 55,115,638 | |
Redemptions | | | (58,696,759 | ) | | | (2,611,122,906 | ) | | | (50,294,212 | ) | | | (1,894,765,125 | ) |
| | | | | | | | | | | | | | | | |
Net decrease | | | (27,298,073 | ) | | | (1,169,809,110 | ) | | | (12,780,123 | ) | | | (432,705,957 | ) |
| (a) | Class I and Class W shares commenced operations on September 27, 2010. |
| (b) | Class I and Class W shares reflect activity for the period September 27, 2010 through March 31, 2011. |
See Accompanying Notes to Financial Statements.
16
Financial Highlights – Columbia Value and Restructuring Fund
Selected data for a share outstanding throughout each period is as follows:
| | | | | | | | | | | | | | | | |
| | | Year Ended March 31, | | | Period Ended
March 31, | |
| Class A Shares | | 2011 | | | 2010 | | | 2009 | | | 2008 (a) | |
Net Asset Value, Beginning of Period | | $ | 44.68 | | | $ | 26.51 | | | $ | 52.25 | | | $ | 58.58 | |
| | | | |
Income from Investment Operations: | | | | | | | | | | | | | | | | |
Net investment income (b) | | | 0.53 | (c) | | | 0.39 | (c) | | | 0.51 | | | | 0.24 | |
Net realized and unrealized gain (loss) on investments, foreign currency and
written options | | | 8.37 | | | | 18.16 | | | | (25.72 | ) | | | (5.70 | ) |
| | | | | | | | | | | | | | | | |
Total from investment operations | | | 8.90 | | | | 18.55 | | | | (25.21 | ) | | | (5.46 | ) |
| | | | |
Less Distributions to Shareholders: | | | | | | | | | | | | | | | | |
From net investment income | | | (0.55 | ) | | | (0.38 | ) | | | (0.51 | ) | | | (0.36 | ) |
From net realized gains | | | — | | | | — | | | | (0.02 | ) | | | (0.51 | ) |
| | | | | | | | | | | | | | | | |
Total distributions to shareholders | | | (0.55 | ) | | | (0.38 | ) | | | (0.53 | ) | | | (0.87 | ) |
| | | | |
Increase from regulatory settlements | | | — | | | | — | (d) | | | — | (d) | | | — | |
| | | | |
Net Asset Value, End of Period | | $ | 53.03 | | | $ | 44.68 | | | $ | 26.51 | | | $ | 52.25 | |
Total return (e) | | | 20.17 | % | | | 70.25 | % | | | (48.51 | )%(f) | | | (9.41 | )%(f)(g) |
| | | | |
Ratios to Average Net Assets/Supplemental Data: | | | | | | | | | | | | | | | | |
Net expenses before interest expense (h) | | | 1.20 | % | | | 1.14 | % | | | 1.14 | % | | | 1.02 | %(i) |
Interest expense | | | — | %(j) | | | — | %(j) | | | — | %(j) | | | — | |
Net expenses (h) | | | 1.20 | % | | | 1.14 | % | | | 1.14 | % | | | 1.02 | %(i) |
Waiver/Reimbursement | | | — | | | | — | | | | 0.04 | % | | | 0.05 | %(i) |
Net investment income (h) | | | 1.16 | % | | | 1.01 | % | | | 1.35 | % | | | 0.83 | %(i) |
Portfolio turnover rate | | | 12 | % | | | 6 | % | | | 12 | % | | | 11 | %(g) |
Net assets, end of period (000s) | | $ | 268,124 | | | $ | 291,655 | | | $ | 163,338 | | | $ | 77,209 | |
| (a) | The Predecessor Fund’s Class A shares commenced operations on September 28, 2007. Per share data and total return reflect activity from that date. |
| (b) | Per share data was calculated using the average shares outstanding during the period. |
| (c) | Net investment income per share reflects special dividends. The effect of these dividends amounted to $0.18 and $0.04 per share, respectively. |
| (d) | Rounds to less than $0.01 per share. |
| (e) | Total return at net asset value assuming all distributions reinvested and no initial sales charge or contingent deferred sales charge. |
(f) Had the Investment Manager and/or any of its affiliates not waived fees or reimbursed a portion of expenses, total return would have been reduced.
| (h) | The benefits derived from expense reductions had an impact of less than 0.01%. |
| (j) | Rounds to less than 0.01%. |
See Accompanying Notes to Financial Statements.
17
Financial Highlights – Columbia Value and Restructuring Fund
Selected data for a share outstanding throughout each period is as follows:
| | | | | | | | | | | | | | | | |
| | | Year Ended March 31, | | | Period Ended
March 31, | |
| Class C Shares | | 2011 | | | 2010 | | | 2009 | | | 2008 (a) | |
Net Asset Value, Beginning of Period | | $ | 44.60 | | | $ | 26.51 | | | $ | 52.23 | | | $ | 58.58 | |
| | | | |
Income from Investment Operations: | | | | | | | | | | | | | | | | |
Net investment income (b) | | | 0.18 | (c) | | | 0.10 | (c) | | | 0.23 | | | | 0.04 | |
Net realized and unrealized gain (loss) on investments, foreign currency and
written options | | | 8.36 | | | | 18.16 | | | | (25.73 | ) | | | (5.68 | ) |
| | | | | | | | | | | | | | | | |
Total from investment operations | | | 8.54 | | | | 18.26 | | | | (25.50 | ) | | | (5.64 | ) |
| | | | |
Less Distributions to Shareholders: | | | | | | | | | | | | | | | | |
From net investment income | | | (0.25 | ) | | | (0.17 | ) | | | (0.20 | ) | | | (0.20 | ) |
From net realized gains | | | — | | | | — | | | | (0.02 | ) | | | (0.51 | ) |
| | | | | | | | | | | | | | | | |
Total distributions to shareholders | | | (0.25 | ) | | | (0.17 | ) | | | (0.22 | ) | | | (0.71 | ) |
| | | | |
Increase from regulatory settlements | | | — | | | | — | (d) | | | — | (d) | | | — | |
| | | | |
Net Asset Value, End of Period | | $ | 52.89 | | | $ | 44.60 | | | $ | 26.51 | | | $ | 52.23 | |
Total return (e) | | | 19.27 | % | | | 69.00 | % | | | (48.89 | )%(f) | | | (9.72 | )%(f)(g) |
| | | | |
Ratios to Average Net Assets/Supplemental Data: | | | | | | | | | | | | | | | | |
Net expenses before interest expense (h) | | | 1.95 | % | | | 1.89 | % | | | 1.89 | % | | | 1.77 | %(i) |
Interest expense | | | — | %(j) | | | — | %(j) | | | — | %(j) | | | — | |
Net expenses (h) | | | 1.95 | % | | | 1.89 | % | | | 1.89 | % | | | 1.77 | %(i) |
Waiver/Reimbursement | | | — | | | | — | | | | 0.04 | % | | | 0.05 | %(i) |
Net investment income (h) | | | 0.40 | % | | | 0.26 | % | | | 0.63 | % | | | 0.07 | %(i) |
Portfolio turnover rate | | | 12 | % | | | 6 | % | | | 12 | % | | | 11 | %(g) |
Net assets, end of period (000s) | | $ | 71,083 | | | $ | 74,880 | | | $ | 40,380 | | | $ | 13,665 | |
| (a) | The Predecessor Fund’s Class C shares commenced operations on September 28, 2007. Per share data and total return reflect activity from that date. |
| (b) | Per share data was calculated using the average shares outstanding during the period. |
| (c) | Net investment income per share reflects special dividends. The effect of these dividends amounted to $0.18 and $0.04 per share, respectively. |
| (d) | Rounds to less than $0.01 per share. |
| (e) | Total return at net asset value assuming all distributions reinvested and no contingent deferred sales charge. |
| (f) | Had the Investment Manager and/or any of its affiliates not waived fees or reimbursed a portion of expenses, total return would have been reduced. |
| (h) | The benefits derived from expense reductions had an impact of less than 0.01%. |
| (j) | Rounds to less than 0.01%. |
See Accompanying Notes to Financial Statements.
18
Financial Highlights – Columbia Value and Restructuring Fund
Selected data for a share outstanding throughout the period is as follows:
| | | | |
| | | Period Ended
March 31, | |
| Class I Shares | | 2011 (a) | |
Net Asset Value, Beginning of Period | | $ | 43.47 | |
| |
Income from Investment Operations: | | | | |
Net investment income (b) | | | 0.27 | |
Net realized and unrealized gain on investments, foreign currency and written options | | | 9.57 | |
| | | | |
Total from investment operations | | | 9.84 | |
| |
Less Distributions to Shareholders: | | | | |
From net investment income | | | (0.28 | ) |
| |
Net Asset Value, End of Period | | $ | 53.03 | |
Total return (c)(d) | | | 22.67 | % |
| |
Ratios to Average Net Assets/Supplemental Data: | | | | |
Net expenses before interest expense (e)(f) | | | 0.79 | % |
Interest expense (f)(g) | | | — | % |
Net expenses (e)(f) | | | 0.79 | % |
Net investment income (e)(f) | | | 1.05 | % |
Portfolio turnover rate (d) | | | 12 | % |
Net assets, end of period (000s) | | $ | 26,652 | |
| (a) | Class I shares commenced operations on September 27, 2010. Per share data and total return reflect activity from that date. |
| (b) | Per share data was calculated using the average shares outstanding during the period. |
| (c) | Total return at net asset value assuming all distributions reinvested. |
| (e) | The benefits derived from expense reductions had an impact of 0.01%. |
| (g) | Rounds to less than 0.01%. |
See Accompanying Notes to Financial Statements.
19
Financial Highlights – Columbia Value and Restructuring Fund
Selected data for a share outstanding throughout each period is as follows:
| | | | | | | | | | | | | | | | | | | | |
| | | Year Ended March 31, | |
| Class R Shares | | 2011 | | | 2010 | | | 2009 | | | 2008 (a) | | | 2007 | |
Net Asset Value, Beginning of Period | | $ | 44.64 | | | $ | 26.50 | | | $ | 52.23 | | | $ | 54.30 | | | $ | 49.35 | |
| | | | | |
Income from Investment Operations: | | | | | | | | | | | | | | | | | | | | |
Net investment income (b) | | | 0.41 | (c) | | | 0.30 | (c) | | | 0.41 | | | | 0.33 | | | | 0.22 | |
Net realized and unrealized gain (loss) on investments, foreign currency and written options | | | 8.37 | | | | 18.14 | | | | (25.72 | ) | | | (1.41 | ) | | | 4.98 | |
| | | | | | | | | | | | | | | | | | | | |
Total from investment operations | | | 8.78 | | | | 18.44 | | | | (25.31 | ) | | | (1.08 | ) | | | 5.20 | |
| | | | | |
Less Distributions to Shareholders: | | | | | | | | | | | | | | | | | | | | |
From net investment income | | | (0.44 | ) | | | (0.30 | ) | | | (0.40 | ) | | | (0.48 | ) | | | (0.25 | ) |
From net realized gains | | | — | | | | — | | | | (0.02 | ) | | | (0.51 | ) | | | — | |
| | | | | | | | | | | | | | | | | | | | |
Total distributions to shareholders | | | (0.44 | ) | | | (0.30 | ) | | | (0.42 | ) | | | (0.99 | ) | | | (0.25 | ) |
| | | | | |
Increase from regulatory settlements | | | — | | | | — | (d) | | | — | (d) | | | — | | | | — | |
| | | | | |
Net Asset Value, End of Period | | $ | 52.98 | | | $ | 44.64 | | | $ | 26.50 | | | $ | 52.23 | | | $ | 54.30 | |
Total return (e) | | | 19.86 | % | | | 69.84 | % | | | (48.65 | )%(f) | | | (2.11 | )%(f) | | | 10.58 | % |
| | | | | |
Ratios to Average Net Assets/Supplemental Data: | | | | | | | | | | | | | | | | | | | | |
Net expenses before interest expense (g) | | | 1.45 | % | | | 1.39 | % | | | 1.39 | % | | | 1.35 | % | | | 1.55 | % |
Interest expense | | | — | %(h) | | | — | %(h) | | | — | %(h) | | | — | | | | — | |
Net expenses (g) | | | 1.45 | % | | | 1.39 | % | | | 1.39 | % | | | 1.35 | % | | | 1.55 | % |
Waiver/Reimbursement | | | — | | | | — | | | | 0.04 | % | | | 0.04 | % | | | — | |
Net investment income (g) | | | 0.91 | % | | | 0.78 | % | | | 1.05 | % | | | 0.60 | % | | | 0.43 | % |
Portfolio turnover rate | | | 12 | % | | | 6 | % | | | 12 | % | | | 11 | % | | | 13 | % |
Net assets, end of period (000s) | | $ | 65,321 | | | $ | 58,120 | | | $ | 37,637 | | | $ | 33,826 | | | $ | 2,926 | |
| (a) | On March 31, 2008, Retirement Shares class of Value and Restructuring Fund, a series of Excelsior Funds, Inc., was reorganized into the Fund’s Class R shares. The financial information of the Fund’s Class R shares includes the financial information of Value and Restructuring Fund’s Retirement Shares class. |
| (b) | Per share data was calculated using the average shares outstanding during the period. |
| (c) | Net investment income per share reflects special dividends. The effect of these dividends amounted to $0.18 and $0.04 per share, respectively. |
| (d) | Rounds to less than $0.01 per share. |
| (e) | Total return at net asset value assuming all distributions reinvested. |
| (f) | Had the Investment Manager and/or any of its affiliates not waived fees or reimbursed a portion of expenses, total return would have been reduced. |
| (g) | The benefits derived from expense reductions had an impact of less than 0.01%. |
| (h) | Rounds to less than 0.01%. |
See Accompanying Notes to Financial Statements.
20
Financial Highlights – Columbia Value and Restructuring Fund
Selected data for a share outstanding throughout the period is as follows:
| | | | |
| | | Period Ended
March 31, | |
| Class W Shares | | 2011 (a) | |
Net Asset Value, Beginning of Period | | $ | 43.49 | |
| |
Income from Investment Operations: | | | | |
Net investment income (b) | | | 0.20 | |
Net realized and unrealized gain on investments, foreign currency and written options | | | 9.53 | |
| | | | |
Total from investment operations | | | 9.73 | |
| |
Less Distributions to Shareholders: | | | | |
From net investment income | | | (0.18 | ) |
| |
Net Asset Value, End of Period | | $ | 53.04 | |
Total return (c)(d) | | | 22.41 | % |
| |
Ratios to Average Net Assets/Supplemental Data: | | | | |
Net expenses before interest expense (e)(f) | | | 1.19 | % |
Interest expense (f)(g) | | | — | % |
Net expenses (e)(f) | | | 1.19 | % |
Net investment income (e)(f) | | | 0.81 | % |
Portfolio turnover rate (d) | | | 12 | % |
Net assets, end of period (000s) | | $ | 3 | |
| (a) | Class W shares commenced operations on September 27, 2010. Per share data and total return reflect activity from that date. |
| (b) | Per share data was calculated using the average shares outstanding during the period. |
| (c) | Total return at net asset value assuming all distributions reinvested. |
| (e) | The benefits derived from expense reductions had an impact of 0.01%. |
| (g) | Rounds to less than 0.01%. |
See Accompanying Notes to Financial Statements.
21
Financial Highlights – Columbia Value and Restructuring Fund
Selected data for a share outstanding throughout each period is as follows:
| | | | | | | | | | | | | | | | | | | | |
| | | Year Ended March 31, | |
| Class Z Shares | | 2011 | | | 2010 | | | 2009 | | | 2008 (a)(b) | | | 2007 | |
Net Asset Value, Beginning of Period | | $ | 44.66 | | | $ | 26.49 | | | $ | 52.22 | | | $ | 54.33 | | | $ | 49.36 | |
| | | | | |
Income from Investment Operations: | | | | | | | | | | | | | | | | | | | | |
Net investment income (c) | | | 0.64 | (d) | | | 0.49 | (d) | | | 0.61 | | | | 0.60 | | | | 0.45 | |
Net realized and unrealized gain (loss) on investments, foreign currency and written options | | | 8.37 | | | | 18.15 | | | | (25.71 | ) | | | (1.47 | ) | | | 5.00 | |
| | | | | | | | | | | | | | | | | | | | |
Total from investment operations | | | 9.01 | | | | 18.64 | | | | (25.10 | ) | | | (0.87 | ) | | | 5.45 | |
| | | | | |
Less Distributions to Shareholders: | | | | | | | | | | | | | | | | | | | | |
From net investment income | | | (0.66 | ) | | | (0.47 | ) | | | (0.61 | ) | | | (0.73 | ) | | | (0.48 | ) |
From net realized gains | | | — | | | | — | | | | (0.02 | ) | | | (0.51 | ) | | | — | |
| | | | | | | | | | | | | | | | | | | | |
Total distributions to shareholders | | | (0.66 | ) | | | (0.47 | ) | | | (0.63 | ) | | | (1.24 | ) | | | (0.48 | ) |
| | | | | |
Increase from regulatory settlements | | | — | | | | — | (e) | | | — | (e) | | | — | | | | — | |
| | | | | |
Net Asset Value, End of Period | | $ | 53.01 | | | $ | 44.66 | | | $ | 26.49 | | | $ | 52.22 | | | $ | 54.33 | |
Total return (f) | | | 20.46 | % | | | 70.71 | % | | | (48.39 | )%(g) | | | (1.74 | )%(g) | | | 11.14 | % |
| | | | | |
Ratios to Average Net Assets/Supplemental Data: | | | | | | | | | | | | | | | | | | | | |
Net expenses before interest expense (h) | | | 0.95 | % | | | 0.89 | % | | | 0.89 | % | | | 1.02 | % | | | 1.05 | % |
Interest expense | | | — | %(i) | | | — | %(i) | | | — | %(i) | | | — | | | | — | |
Net expenses (h) | | | 0.95 | % | | | 0.89 | % | | | 0.89 | % | | | 1.02 | % | | | 1.05 | % |
Waiver/Reimbursement | | | — | | | | — | | | | 0.04 | % | | | 0.04 | % | | | — | |
Net investment income (h) | | | 1.40 | % | | | 1.28 | % | | | 1.47 | % | | | 1.07 | % | | | 0.90 | % |
Portfolio turnover rate | | | 12 | % | | | 6 | % | | | 12 | % | | | 11 | % | | | 13 | % |
Net assets, end of period (000s) | | $ | 6,583,690 | | | $ | 6,765,345 | | | $ | 4,352,176 | | | $ | 8,980,358 | | | $ | 7,767,713 | |
| (a) | On March 31, 2008, Shares class of Value and Restructuring Fund, a series of Excelsior Funds, Inc., was reorganized into the Fund’s Class Z. The financial information of the Fund’s Class Z includes the financial information of Value and Restructuring Fund’s Shares class. |
| (b) | On March 31, 2008, Value and Restructuring Fund’s Institutional Shares class was reorganized into the Fund’s Class Z. |
| (c) | Per share data was calculated using the average shares outstanding during the period. |
| (d) | Net investment income per share reflects special dividends. The effect of these dividends amounted to $0.18 and $0.04 per share, respectively. |
| (e) | Rounds to less than $0.01 per share. |
| (f) | Total return at net asset value assuming all distributions reinvested. |
| (g) | Had the Investment Manager and/or any of its affiliates not waived fees or reimbursed a portion of expenses, total return would have been reduced. |
| (h) | The benefits derived from expense reductions had an impact of less than 0.01%. |
| (i) | Rounds to less than 0.01%. |
See Accompanying Notes to Financial Statements.
22
Notes to Financial Statements – Columbia Value and Restructuring Fund
March 31, 2011
Note 1. Organization
Columbia Value and Restructuring Fund (the Fund), a series of Columbia Funds Series Trust I (the Trust), is a diversified fund. The Trust is registered under the Investment Company Act of 1940, as amended (the 1940 Act), as an open-end management investment company organized as a Massachusetts business trust.
After the close of business on April 30, 2010, Ameriprise Financial, Inc. (Ameriprise Financial) acquired a portion of the asset management business of Columbia Management Group, LLC (the Transaction), including the business of managing the Fund. In connection with the closing of the Transaction (the Closing), RiverSource Investments, LLC, a wholly owned subsidiary of Ameriprise Financial, became the investment manager of the Fund and changed its name to Columbia Management Investment Advisers, LLC (the Investment Manager).
Investment Objective
The Fund seeks long-term capital appreciation.
Fund Shares
The Trust has unlimited authorized shares of beneficial interest. The Fund offers Class A, Class C, Class I, Class R, Class W and Class Z shares. On December 10, 2010, the Investment Manager exchanged Class Z shares of the Fund valued at $18,819,258 for Class I shares of the Fund. All share classes have identical voting, dividend and liquidation rights. Each share class has its own expense structure and sales charges, as applicable.
Class A shares are subject to a maximum front-end sales charge of 5.75% based on the initial investment amount. Class A shares purchased without an initial sales charge in accounts aggregating $1 million to $50 million at the time of purchase are subject to a 1.00% contingent deferred sales charge (CDSC) if the shares are sold within 18 months of purchase, charged as follows: 1.00% CDSC if redeemed within 12 months of purchase, and 0.50% CDSC if redeemed more than 12, but less than 18 months after purchase.
Class C shares are subject to a 1.00% CDSC on shares redeemed within one year of purchase.
Class I shares are not subject to sales charges and are available only to the Columbia Family of Funds. Class I shares commenced operations on September 27, 2010.
Class R shares are not subject to sales charges and are available only to qualifying institutional investors.
Class W shares are not subject to sales charges and are available only to investors purchasing through authorized investment programs managed by investment professionals, including discretionary managed account programs. Class W shares commenced operations on September 27, 2010.
Class Z shares are not subject to sales charges and are available only to certain investors, as described in the Fund’s prospectus.
Note 2. Summary of Significant Accounting Policies
The preparation of financial statements in accordance with U.S. generally accepted accounting principles (GAAP) requires management to make certain estimates and assumptions that affect the reported amounts of assets and liabilities, the disclosure of contingent assets and liabilities at the date of the financial statements and the reported amounts of revenue and expenses during the reporting period. Actual results could differ from those estimates.
The following is a summary of significant accounting policies consistently followed by the Fund in the preparation of its financial statements.
Security Valuation
Equity securities and securities of certain investment companies are valued at the last sale price on the principal exchange on which they trade, except for securities traded on the NASDAQ, which are valued at the NASDAQ official close price. Unlisted securities or listed securities for which there were no sales during the day are valued at the closing bid price on such exchanges or over-the-counter markets.
Debt securities generally are valued by pricing services approved by the Trust’s Board of Trustees, based upon market transactions for normal, institutional-size trading units of similar securities. The services may use various pricing techniques which take into account appropriate factors such as yield, quality, coupon rate, maturity, type of issue, trading characteristics and other data, as well as broker quotes. Debt securities for which quotations are readily available may also be valued based upon an over-the-counter or exchange bid quotation.
Short-term investments maturing in 60 days or less are valued at amortized cost, which approximates market value.
Foreign securities are generally valued at the last sale price on the foreign exchange or market on which they trade. If any foreign share prices are not readily available as a result of limited share activity, the securities are valued at the last sale price of the local shares in the principal market in which such securities are normally traded.
23
Columbia Value and Restructuring Fund
March 31, 2011
Generally, trading in foreign securities is substantially completed each day at various times prior to the close of the New York Stock Exchange (NYSE). The values of such securities used in computing the net asset value of the Fund’s shares are determined as of such times. Foreign currency exchange rates are generally determined at 4:00 p.m. Eastern (U.S.) time. Occasionally, events affecting the values of such foreign securities may occur between the times at which they are determined and the close of the customary trading session of the NYSE, which would not be reflected in the computation of the Fund’s net asset value. If events materially affecting the values of such foreign securities occur and it is determined that market quotations are not reliable, then these foreign securities will be valued at their fair value using procedures approved by the Board of Trustees.
Investments for which market quotations are not readily available, or that have quotations which management believes are not reliable, are valued at fair value as determined in good faith under consistently applied procedures established by and under the general supervision of the Board of Trustees. If a security is valued at fair value, such value is likely to be different from the last quoted market price for the security. The determination of fair value often requires significant judgment. To determine fair value, management may use assumptions including but not limited to future cash flows and estimated risk premiums. Multiple inputs from various sources may be used to determine value.
Foreign Currency Transactions and Translations
The values of all assets and liabilities quoted in foreign currencies are translated into U.S. dollars at that day’s exchange rates. Net realized and unrealized gains (losses) on foreign currency transactions and translations include gains (losses) arising from the fluctuation in exchange rates between trade and settlement dates on securities transactions, gains (losses) arising from the disposition of foreign currency and currency gains (losses) between the accrual and payment dates on dividends, interest income and foreign withholding taxes.
For financial statement purposes, the Fund does not distinguish that portion of gains (losses) on investments which is due to changes in foreign exchange rates from that which is due to changes in market prices of the investments. Such fluctuations are included with the net realized and unrealized gains (losses) on investments on the Statement of Operations.
Derivative Instruments
The Fund may use derivative instruments including options in order to meet its investment objectives. The Fund employs strategies in differing combinations to permit it to increase, decrease or change the level of exposure to market risk factors. The achievement of any strategy relating to derivatives depends on an analysis of various risk factors, and if the strategies for the use of derivatives do not work as intended, the Fund may not achieve its investment objectives.
In pursuit of its investment objectives, the Fund is exposed to the following market risks among others:
Equity Risk: Equity risk relates to change in value of equity securities such as common stocks due to general market conditions such as real or perceived adverse economic conditions, changes in the general outlook for corporate earnings, or adverse investor sentiment. Equity securities generally have greater price volatility than fixed income securities.
The following notes provide more detailed information about the derivative type held by the Fund:
Options — The Fund had written covered call options to decrease the Fund’s exposure to equity risk and to increase return on instruments. Written covered call options become more valuable as the price of the underlying instruments depreciates relative to the strike price.
Writing put options tends to increase the Fund’s exposure to the underlying instrument. When the Fund writes a call or put option, an amount equal to the premium received is recorded as a liability and subsequently marked-to-market to reflect the current value of the option written. Premiums received from writing options which expire are treated as realized gains. Premiums received from writing options which are exercised or closed are added to the proceeds or offset against the amounts paid on the underlying security transaction to determine the realized gain or loss. The Fund, as a writer of an option, has no control over whether the underlying security may be sold (call) or purchased (put) and as a result bears the market risk of an unfavorable change in the price of the security underlying the written option. There is the risk that the Fund may not be able to enter into a closing transaction because of an illiquid market. The Fund identifies within its portfolio of investments cash or liquid portfolio securities equal to the amount of the written options contract commitment.
The Fund may also purchase put and call options. Purchasing call options tends to increase the Fund’s exposure to the underlying instrument. Purchasing put options tends to decrease the Fund’s exposure to the underlying instrument. The Fund may pay a
24
Columbia Value and Restructuring Fund
March 31, 2011
premium, which is included in the Fund’s Statement of Assets and Liabilities as an investment and subsequently marked-to-market to reflect the current value of the option. The risk associated with purchasing put and call options is limited to the premium paid. Premiums paid for purchasing options which expire are treated as realized losses. Premiums paid for purchasing options which are exercised are added to the amounts paid (call) or offset against the proceeds (put) on the underlying security to determine the realized gain or loss. If the Fund enters into a closing transaction, the Fund will realize a gain or loss, depending on whether the proceeds from the closing transaction are greater or less than the cost of the option.
During the year ended March 31, 2011, the Fund entered into 315,950 written options contracts.
Effects of Derivative Transactions in the Financial Statements
The following table is a summary of the value of the Fund’s derivative instruments as of March 31, 2011.
| | | | | | |
| Fair Value of Derivative Instruments |
| Statement of Assets and Liabilities |
| Asset | | Fair Value | | Liability | | Fair Value |
Written
Options | | $— | | Written
Options | | $2,780,000 |
The effect of derivative instruments on the Fund’s Statement of Operations for the year ended March 31, 2011:
| | | | | | | | | | |
| | | | | | | | | |
| | | Amount of Realized Gain or (Loss) and
Change in Unrealized Appreciation or
(Depreciation) on Derivatives | |
| | | Risk
Exposure | | Net
Realized Gain
(Loss) | | | Change in Unrealized Appreciation (Depreciation) | |
| Written Options | | Equity
Risk | | $ | (12,965,801 | ) | | $ | (1,294,266 | ) |
Repurchase Agreements
The Fund may engage in repurchase agreement transactions with institutions that the Investment Manager has determined are creditworthy. The Fund, through the custodian, receives delivery of the underlying securities collateralizing a repurchase agreement. The Investment Manager is responsible for determining that the collateral is at least equal, at all times, to the value of the repurchase obligation including interest. A repurchase agreement transaction involves certain risks in the event of default or insolvency of the counterparty. These risks include possible delays in or restrictions on the Fund’s ability to dispose of the underlying securities and a possible decline in the value of the underlying securities during the period while the Fund seeks to assert its rights.
Security Transactions
Security transactions are accounted for on the trade date. Cost is determined and gains (losses) are based upon the specific identification method for both financial statement and federal income tax purposes.
Income Recognition
Interest income is recorded on the accrual basis. Market premium and discount are amortized and accreted, respectively, on all debt securities, unless otherwise noted. Original issue discount is accreted to interest income over the life of the security with a corresponding increase in the cost basis, if any.
Corporate actions and dividend income are recorded net of any non-reclaimable tax withholdings, on the ex-dividend date or upon receipt of ex-dividend notification in the case of certain foreign securities.
The Fund receives information regarding the character of distributions received from real estate investment trusts (REITs) on an annual basis. Distributions received from REITs are allocated among dividend income, capital gain and return of capital based upon such information or based on the Investment Manager’s estimates if actual information has not yet been reported. The Investment Manager’s estimates are subsequently adjusted when the actual character of the distributions are disclosed by the REITs which could result in a proportionate increase in returns of capital to shareholders.
Awards from class action litigation are recorded as a reduction of cost if the Fund still owns the applicable securities on the payment date. If the Fund no longer owns the applicable securities, the proceeds are recorded as realized gains.
Expenses
General expenses of the Trust are allocated to the Fund and other series of the Trust based upon relative net assets or other expense allocation methodologies determined by the nature of the expense. Expenses directly attributable to a specific class of shares are charged to that share class. Expenses directly attributable to the Fund are charged to the Fund.
25
Columbia Value and Restructuring Fund
March 31, 2011
Determination of Class Net Asset Value
All income, expenses (other than class-specific expenses which are charged directly to a share class, as shown in the Statement of Operations) and realized and unrealized gains (losses) are allocated to each class of the Fund on a daily basis, based on the relative net assets of each class, for purposes of determining the net asset value of each class.
Federal Income Tax Status
The Fund intends to qualify each year as a regulated investment company under Subchapter M of the Internal Revenue Code, as amended, and will distribute substantially all of its taxable income, if any, for its tax year, and as such will not be subject to federal income taxes. In addition, the Fund intends to distribute in each calendar year substantially all of its net investment income, capital gains and certain other amounts, if any, such that the Fund should not be subject to federal excise tax. Therefore, no federal income or excise tax provision is recorded.
Distributions to Shareholders
Distributions from net investment income are declared and paid quarterly. Net realized capital gains, if any, are distributed at least annually. Income distributions and capital gain distributions are determined in accordance with federal income tax regulations which may differ from GAAP.
Indemnifications
Under the Trust’s organizational documents and, in some cases, by contract, its officers and directors are indemnified against certain liabilities arising out of the performance of their duties to the Fund. In addition, certain of the Fund’s contracts with its service providers contain general indemnification clauses. The Fund’s maximum exposure under these arrangements is unknown since the amount of any future claims that may be made against the Fund cannot be determined and the Fund has no historical basis for predicting the likelihood of any such claims.
Note 3. Fees and Compensation Paid to Affiliates
Investment Management Fee
Under an Investment Management Services Agreement (IMSA), the Investment Manager determines which securities will be purchased, held or sold. The management fee is equal to a percentage of the Fund’s average daily net assets that declines from 0.60% to 0.43% as the Fund’s net assets increase.
Prior to the Closing, Columbia Management Advisors, LLC (Columbia), an indirect, wholly owned subsidiary of Bank of America Corporation (BOA), provided investment management services to the Fund under the same fee structure.
The effective management fee rate for the year ended March 31, 2011, was 0.60% of the Fund’s average daily net assets.
Administration Fee
Effective upon the Closing, the Investment Manager provides administration and accounting services to the Fund under an Administrative Services Agreement, including services previously performed under the Pricing and Bookkeeping Oversight and Services Agreement (the Services Agreement) as discussed in the Pricing and Bookkeeping Fees note below. The Fund pays an annual administration fee equal to 0.15% of the Fund’s average daily net assets less the fees payable by the Fund as described under the Pricing and Bookkeeping Fees note below. Prior to the Closing, Columbia provided administrative services to the Fund at the same fee rates.
Pricing and Bookkeeping Fees
Prior to the Closing, the Fund entered into a Financial Reporting Services Agreement (the Financial Reporting Services Agreement) with State Street Bank and Trust Company (State Street) and Columbia pursuant to which State Street provides financial reporting services to the Fund. The Fund also entered into an Accounting Services Agreement (collectively with the Financial Reporting Services Agreement, the State Street Agreements) with State Street and Columbia pursuant to which State Street provides accounting services to the Fund. Upon the Closing, Columbia assigned and delegated its rights and obligations under the State Street Agreements to the Investment Manager. Under the State Street Agreements, the Fund pays State Street an annual fee of $38,000 paid monthly plus an additional monthly fee based on an annualized percentage rate of average daily net assets of the Fund for the month. The aggregate fee will not exceed $140,000 per year (exclusive of out-of-pocket expenses and charges). The Fund also reimburses State Street for certain out-of-pocket expenses and charges.
Also prior to the Closing, the Fund entered into the Services Agreement with Columbia. Under the Services Agreement, Columbia provided services related to Fund expenses and the requirements of the Sarbanes-Oxley Act of 2002, and provided oversight of the accounting and financial reporting services provided by State Street. Under the Services Agreement, the Fund reimbursed Columbia for out-of-pocket expenses and charges, including fees
26
Columbia Value and Restructuring Fund
March 31, 2011
payable to third parties, such as for pricing the Fund’s portfolio securities, incurred by Columbia in the performance of services under the Services Agreement. The Services Agreement was terminated upon the Closing. These services are now provided under the Administrative Services Agreement discussed above.
Transfer Agent Fee
In connection with the Closing, RiverSource Service Corporation, a wholly owned subsidiary of Ameriprise Financial, provides transfer agency services to the Fund under a Transfer Agency Agreement and changed its name to Columbia Management Investment Services Corp. (the Transfer Agent). The Transfer Agent has contracted with Boston Financial Data Services (BFDS) to serve as sub-transfer agent.
The Transfer Agent receives monthly account-based service fees based on the number of open accounts and is reimbursed by the Fund for the fees and expenses the Transfer Agent pays to financial intermediaries that maintain omnibus accounts with the Fund that is a percentage of the average aggregate value of the Fund’s shares maintained in each such omnibus account (other than omnibus accounts for which American Enterprise Investment Services Inc. is the broker of record or accounts where the beneficial shareholder is a customer of Ameriprise Financial Services, Inc., which are paid a per account fee). The Transfer Agent pays the fees of BFDS for services as sub-transfer agent and, is not entitled to reimbursement for such fees from the Fund (with the exception of out-of-pocket fees). The Transfer Agent also receives compensation from fees for various shareholder services and reimbursements for certain out-of-pocket expenses. Class I shares do not pay any transfer agency fees.
Prior to the Closing, Columbia Management Services, Inc., an affiliate of Columbia and an indirect, wholly owned subsidiary of BOA, provided transfer agency services to the Fund and contracted with BFDS to serve as sub-transfer agent, under the same fee structure.
For the year ended March 31, 2011, the Fund’s effective transfer agent fee rate for each class, with the exception of Class I shares, as a percentage of each class’ average daily net assets was as follows:
| | | | | | | | |
| | | | | | | | | |
| Class A | | Class C | | Class R | | Class W | | Class Z |
| 0.17% | | 0.17% | | 0.17% | | 0.16% | | 0.17% |
An annual minimum account balance fee of $20 may apply to certain accounts with a value below the Fund’s initial minimum investment requirements to reduce the impact of small accounts on transfer agent fees. These minimum account balance fees are recorded as part of expense reductions on the Statement of Operations. For the year ended March 31, 2011, no minimum account balance fees were charged by the Fund.
Fee Waivers and Expense Reimbursements
The Investment Manager has voluntarily agreed to bear a portion of the Fund’s expenses so that the Fund’s ordinary operating expenses (excluding any brokerage commissions, interest, taxes and extraordinary expenses, but including custodian charges relating to overdrafts, if any), after giving effect to any balance credits from the Fund’s custodian, do not exceed the annual rates of 1.25%, 2.00%, 0.88%, 1.50%, 1.25% and 1.00% of the Fund’s average daily net assets attributable to Class A, Class C, Class I, Class R, Class W and Class Z shares, respectively. The Investment Manager, in its discretion, may revise or discontinue this arrangement at any time. Prior to May 1, 2010, Columbia voluntarily reimbursed a portion of the Fund’s expenses so that the Fund’s ordinary operating expenses (excluding any distribution and service fees, brokerage commissions, interest, taxes and extraordinary expenses, but including custodian charges relating to overdrafts, if any), after giving effect to any balance credits from the Fund’s custodian, did not exceed 1.00% of the Fund’s average daily net assets on an annualized basis.
Underwriting Discounts, Service and Distribution Fees
In connection with the Closing, RiverSource Fund Distributors, Inc., an indirect wholly owned subsidiary of Ameriprise Financial, provides distribution and shareholder services to the Fund and changed its name to Columbia Management Investment Distributors, Inc. (the Distributor). Pursuant to Rule 12b-1 under the 1940 Act, the Board of Trustees has approved, and the Fund has adopted, distribution and shareholder service plans (the Plans) which set the distribution and service fees for the Fund. These fees are calculated daily and are intended to compensate the Distributor and/or eligible selling and/or servicing agents for selling shares of the Fund and providing services to investors.
The Plans require the payment of a monthly service fee to the Distributor at the maximum annual rate of 0.25% of the average daily net assets attributable to Class A, Class C and Class W shares of the Fund. The Plans also require the payment of a monthly distribution fee to the Distributor at the maximum annual rates of 0.75% of the average daily net assets attributable to Class C shares, 0.50% of the average daily net assets attributable to Class R shares and 0.25% of the average daily net assets attributable to Class W shares.
27
Columbia Value and Restructuring Fund
March 31, 2011
The Fund may pay a distribution fee of up to 0.25% of the Fund’s average daily net assets attributable to Class W shares and a service fee of up to 0.25% of the Fund’s average daily net assets attributable to Class W shares, provided, however, that the aggregate fee shall not exceed 0.25% of the Fund’s average daily net assets attributable to Class W shares.
Prior to the Closing, Columbia Management Distributors, Inc., an affiliate of Columbia and an indirect, wholly owned subsidiary of BOA, was the principal underwriter of the Fund’s shares. There were no changes to the underwriting discount structure of the Fund or the service or distribution fee rates paid by the Fund as a result of the Transaction.
Sales Charges
Sales charges, including front-end and CDSCs, received by the Distributor for distributing Fund shares were $21,306 for Class A and $15,522 for Class C shares for the year ended March 31, 2011.
Fees Paid to Officers and Trustees
In connection with the Closing, all officers of the Fund are employees of the Investment Manager or its affiliates and, with the exception of the Fund’s Chief Compliance Officer, receive no compensation from the Fund. The Board of Trustees has appointed a Chief Compliance Officer to the Fund in accordance with federal securities regulations. The Fund, along with other affiliated funds, pays its pro-rata share of the expenses associated with the Chief Compliance Officer. The Fund’s expenses for the Chief Compliance Officer will not exceed $15,000 per year. Prior to the Closing, all officers of the Fund were employees of Columbia or its affiliates and the Fund paid its pro-rata share of the expenses for the Chief Compliance Officer under the same fee structure.
Trustees are compensated for their services to the Fund, as set forth on the Statement of Operations. The Trust’s eligible Trustees may participate in a deferred compensation plan which may be terminated at any time. Obligations of the plan will be paid solely out of the Fund’s assets.
Other Related Party Transactions
Prior to the Closing, the Fund used one or more brokers that were affiliates of BOA in connection with the purchase and sale of their securities. Total brokerage commissions paid to affiliated brokers for the period prior to the Closing were $15,000.
Note 4. Custody Credits
The Fund has an agreement with its custodian bank under which custody fees may be reduced by balance credits. These credits are recorded as part of expense reductions on the Statement of Operations. The Fund could have invested a portion of the assets utilized in connection with the expense offset arrangement in an income-producing asset if it had not entered into such an agreement.
For the year ended March 31, 2011, these custody credits reduced total expenses by $60 for the Fund.
Note 5. Portfolio Information
The cost of purchases and proceeds from sales of securities, excluding short-term obligations, aggregated $784,150,924 and $2,023,538,485, respectively, for the year ended March 31, 2011.
Note 6. Regulatory Settlements
During the year ended March 31, 2010, the Fund received payments totaling $11,049 resulting from certain regulatory settlements with third parties in which the Fund had participated. The payments have been included in “Increase from regulatory settlements” in the Statement of Changes in Net Assets.
Note 7. Shareholder Concentration
As of March 31, 2011, three shareholder accounts owned 54.9% of the outstanding shares of the Fund. Purchase and redemption activity of these accounts may have a significant effect on the operations of the Fund.
Note 8. Line of Credit
Prior to March 28, 2011, the Fund and other affiliated funds participated in a $280,000,000 committed, unsecured revolving line of credit provided by State Street. Effective March 28, 2011, the commitment was reduced to $225,000,000. The maximum amount that may be borrowed by any fund is limited to the lesser of $200,000,000 and the Fund’s borrowing limit set forth in the Fund’s registration statement. Borrowings are available for short-term liquidity or temporary or emergency purposes.
Effective October 14, 2010, interest is charged to each participating fund based on the fund’s borrowings at a rate per annum equal to the greater of the Federal Funds Rate plus 1.25% or the overnight LIBOR Rate plus 1.25%. In addition, a commitment fee of 0.125% per annum is accrued and apportioned among the participating funds pro rata based on their relative net assets.
For the year ended March 31, 2011, the average daily loan balance outstanding on days where borrowing existed was $8,415,854 at a weighted average interest rate of 1.493%.
28
Columbia Value and Restructuring Fund
March 31, 2011
Note 9. Federal Tax Information
The timing and character of income and capital gain distributions are determined in accordance with income tax regulations, which may differ from GAAP. Reclassifications are made to the Fund’s capital accounts for permanent tax differences to reflect income and gains available for distribution (or available capital loss carryforwards) under income tax regulations.
For the year ended March 31, 2011, permanent book and tax basis differences resulting primarily from differing treatments for foreign currency transactions, were identified and reclassified among the components of the Fund’s net assets as follows:
| | | | |
| | | | | |
Undistributed Net Investment
Income | | Accumulated
Net Realized
Loss | | Paid-In Capital |
| $(167,353) | | $167,353 | | $— |
Net investment income and net realized gains (losses), as disclosed on the Statement of Operations, and net assets were not affected by this reclassification.
The tax character of distributions paid during the years ended March 31, 2011 and March 31, 2010 was as follows:
| | | | |
| | | March 31, 2011 | | March 31, 2010 |
| Distributions paid from: | | |
| Ordinary Income* | | $91,391,224 | | $77,045,408 |
| * | For tax purposes short-term capital gain distributions, if any, are considered ordinary income distributions. |
As of March 31, 2011, the components of distributable earnings on a tax basis were as follows:
| | | | |
| | | | | |
Undistributed
Ordinary Income | | Undistributed Long-Term Capital Gains | | Net Unrealized Appreciation* |
| $184,063 | | $— | | $2,626,491,850 |
| * | The differences between book-basis and tax-basis net unrealized depreciation are primarily due to deferral of losses from wash sales. |
Unrealized appreciation and depreciation at March 31, 2011, based on cost of investments for federal income tax purposes were:
| | | | |
| | | | |
Unrealized appreciation | | $ | 2,759,340,476 | |
Unrealized depreciation | | | (132,848,626 | ) |
| | | | |
Net unrealized appreciation | | $ | 2,626,491,850 | |
The following capital loss carryforwards may be available to reduce taxable income arising from future net realized gains on investments, if any, to the extent permitted by the Internal Revenue Code:
| | | | |
| | | | |
| Year of Expiration | | Capital Loss Carryforwards | |
| 2017 | | $ | 288,296,116 | |
| 2018 | | | 1,055,676,289 | |
| | | | |
| Total | | $ | 1,343,972,405 | |
Capital loss carryforwards of $290,711,751 were utilized during the year ended March 31, 2011. Any capital loss carryforwards acquired as part of a merger that are permanently lost due to provisions under the Internal Revenue Code are included as being expired.
Management of the Fund has concluded that there are no significant uncertain tax positions that would require recognition in the financial statements. However, management’s conclusion may be subject to review and adjustment at a later date based on factors including, but not limited to, new tax laws, regulations, and administrative interpretations (including relevant court decisions). The Fund’s federal tax returns for the prior three fiscal years remain subject to examination by the Internal Revenue Service.
Note 10. Subsequent Events
The Investment Manager has evaluated the events and transactions that have occurred through the date the financial statements were issued. Other than as noted below, there were no items requiring adjustment of the financial statements or additional disclosure.
Effective May 16, 2011, the line of credit commitment with State Street was reduced to $150,000,000, and the maximum amount that may be borrowed by any fund was limited to the lesser of $120,000,000 and the Fund’s borrowing limit set forth in the Fund’s registration statement.
Note 11. Information Regarding Pending and Settled Legal Proceedings
In June 2004, an action captioned John E. Gallus et al. v. American Express Financial Corp. and American Express Financial Advisors Inc. was filed in the United States District Court for the District of Arizona. The plaintiffs allege that they are investors in several American Express Company (now known as RiverSource) mutual funds and they purport to bring the action derivatively on behalf of those funds under the Investment Company Act of 1940. The plaintiffs allege that fees allegedly paid to the defendants by the
29
Columbia Value and Restructuring Fund
March 31, 2011
funds for investment advisory and administrative services are excessive. The plaintiffs seek remedies including restitution and rescission of investment advisory and distribution agreements. The plaintiffs voluntarily agreed to transfer this case to the United States District Court for the District of Minnesota (the District Court). In response to defendants’ motion to dismiss the complaint, the District Court dismissed one of plaintiffs’ four claims and granted plaintiffs limited discovery. Defendants moved for summary judgment in April 2007. Summary judgment was granted in the defendants’ favor on July 9, 2007. The plaintiffs filed a notice of appeal with the Eighth Circuit Court of Appeals (the Eighth Circuit) on August 8, 2007. On April 8, 2009, the Eighth Circuit reversed summary judgment and remanded to the District Court for further proceedings. On August 6, 2009, defendants filed a writ of certiorari with the U.S. Supreme Court (the Supreme Court), asking the Supreme Court to stay the District Court proceedings while the Supreme Court considers and rules in a case captioned Jones v. Harris Associates, which involves issues of law similar to those presented in the Gallus case. On March 30, 2010, the Supreme Court issued its ruling in Jones v. Harris Associates, and on April 5, 2010, the Supreme Court vacated the Eighth Circuit’s decision in the Gallus case and remanded the case to the Eighth Circuit for further consideration in light of the Supreme Court’s decision in Jones v. Harris Associates. On June 4, 2010, the Eighth Circuit remanded the Gallus case to the District Court for further consideration in light of the Supreme Court’s decision in Jones v. Harris Associates. On December 9, 2010, the District Court reinstated its July 9, 2007 summary judgment order in favor of the defendants. On January 10, 2011, plaintiffs filed a notice of appeal with the Eighth Circuit.
In December 2005, without admitting or denying the allegations, American Express Financial Corporation (AEFC, which is now known as Ameriprise Financial, Inc. (Ameriprise Financial)), entered into settlement agreements with the Securities and Exchange Commission (SEC) and Minnesota Department of Commerce (MDOC) related to market timing activities. As a result, AEFC was censured and ordered to cease and desist from committing or causing any violations of certain provisions of the Investment Advisers Act of 1940, the Investment Company Act of 1940, and various Minnesota laws. AEFC agreed to pay disgorgement of $10 million and civil money penalties of $7 million. AEFC also agreed to retain an independent distribution consultant to assist in developing a plan for distribution of all disgorgement and civil penalties ordered by the SEC in accordance with various undertakings detailed at http://www.sec.gov/litigation/admin/ia-2451.pdf. Ameriprise Financial and its affiliates have cooperated with the SEC and the MDOC in these legal proceedings, and have made regular reports to the funds’ Boards of Directors/Trustees.
Ameriprise Financial and certain of its affiliates have historically been involved in a number of legal, arbitration and regulatory proceedings, including routine litigation, class actions, and governmental actions, concerning matters arising in connection with the conduct of their business activities. Ameriprise Financial believes that the Funds are not currently the subject of, and that neither Ameriprise Financial nor any of its affiliates are the subject of, any pending legal, arbitration or regulatory proceedings that are likely to have a material adverse effect on the Funds or the ability of Ameriprise Financial or its affiliates to perform under their contracts with the Funds. Ameriprise Financial is required to make 10-Q, 10-K and, as necessary, 8-K filings with the Securities and Exchange Commission on legal and regulatory matters that relate to Ameriprise Financial and its affiliates. Copies of these filings may be obtained by accessing the SEC website at www.sec.gov.
There can be no assurance that these matters, or the adverse publicity associated with them, will not result in increased fund redemptions, reduced sale of fund shares or other adverse consequences to the Funds. Further, although we believe proceedings are not likely to have a material adverse effect on the Funds or the ability of Ameriprise Financial or its affiliates to perform under their contracts with the Funds, these proceedings are subject to uncertainties and, as such, we are unable to estimate the possible loss or range of loss that may result. An adverse outcome in one or more of these proceedings could result in adverse judgments, settlements, fines, penalties or other relief that could have a material adverse effect on the consolidated financial condition or results of operations of Ameriprise Financial.
30
Report of Independent Registered Public Accounting Firm
To the Trustees of Columbia Funds Series Trust I and the Shareholders of Columbia Value and Restructuring Fund
In our opinion, the accompanying statement of assets and liabilities, including the investment portfolio, and the related statements of operations and of changes in net assets and the financial highlights present fairly, in all material respects, the financial position of Columbia Value and Restructuring Fund (the “Fund”) (a series of Columbia Funds Series Trust I) at March 31, 2011, the results of its operations for the year then ended, the changes in its net assets for each of the two years in the period then ended, and the financial highlights for the periods indicated, in conformity with accounting principles generally accepted in the United States of America. These financial statements and financial highlights (hereafter referred to as “financial statements”) are the responsibility of the Fund’s management. Our responsibility is to express an opinion on these financial statements based on our audits. We conducted our audits of these financial statements in accordance with the standards of the Public Company Accounting Oversight Board (United States). Those standards require that we plan and perform the audit to obtain reasonable assurance about whether the financial statements are free of material misstatement. An audit includes examining, on a test basis, evidence supporting the amounts and disclosures in the financial statements, assessing the accounting principles used and significant estimates made by management, and evaluating the overall financial statement presentation. We believe that our audits, which included confirmation of securities at March 31, 2011 by correspondence with the custodian and brokers, provide a reasonable basis for our opinion.
PricewaterhouseCoopers LLP
Boston, Massachusetts
May 20, 2011
31
Federal Income Tax Information (Unaudited) – Columbia Value and Restructuring Fund
100.00% of the ordinary income distributed by the Fund for the fiscal year ended March 31, 2011, qualifies for the corporate dividends received deduction.
For non-corporate shareholders 100.00%, or the maximum amount allowable under the Jobs and Growth Tax Relief Reconciliation Act of 2003, of ordinary income distributed by the Fund for the fiscal year ended March 31, 2011 may represent qualified dividend income.
The Fund will notify shareholders in January 2012 of amounts for use in preparing 2011 income tax returns.
32
Fund Governance
The Trustees serve terms of indefinite duration. The names, addresses and birth years of the Trustees and Officers of the Funds in Columbia Funds Series Trust I, the year each was first elected or appointed to office, their principal business occupations during at least the last five years, the number of Funds overseen by each Trustee and other directorships they hold are shown below, as of May 2, 2011. Each officer listed below serves as an officer of each Fund in Columbia Funds Series Trust I.
Independent Trustees
| | |
Name, Address and Year of Birth,
Position with Funds, Year First
Elected or Appointed to Office | | Principal Occupation(s) During Past Five Years, Number of Funds in Columbia Funds
Complex Overseen by Trustee, Other Directorships Held |
| |
| David M. Moffett (born 1952) | | |
c/o Columbia Management Investment Advisers, LLC 225 Franklin Street Boston, MA 02110 Trustee (since 2011) | | Retired. Chief Executive Officer, Federal Home Loan Mortgage Corporation, from 2008 to 2009; Senior Adviser, Global Financial Services Group, Carlyle Group, Inc., from 2007 to 2008; Vice Chairman and Chief Financial Officer, U.S. Bancorp, from 1993 to 2007. Oversees 46; CIT Group Inc. (commercial and consumer finance), eBay Inc. (online trading community), MBIA Corp (financial service provider), E.W. Scripps Co. (print and television media), Building Materials Holding Corp. (building materials and construction services), and University of Oklahoma Foundation. |
| |
| John D. Collins (born 1938) | | |
c/o Columbia Management Investment Advisers, LLC 225 Franklin Street Boston, MA 02110 Trustee (since 2005) | | Retired. Consultant, KPMG, LLP (accounting and tax firm) from July 1999 to June 2000; Partner, KPMG, LLP from March 1962 to June 1999. Oversees 46; Mrs. Fields Original Cookies, Inc. (consumer products); Suburban Propane Partners, L.P.; and Montpelier Re (insurance underwriting firm) |
| |
| Rodman L. Drake (born 1943) | | |
c/o Columbia Management Investment Advisers, LLC 225 Franklin Street Boston, MA 02110 Trustee (since 1994) and Chairman of the Board (since 2009) | | Independent consultant since 2010; Co-Founder of Baringo Capital LLC (private equity) from 1997 to 2008; CEO of Crystal River Capital, Inc. (real estate investment trust) from 2003 to 2010; Oversees 46; Jackson Hewitt Tax Service Inc. (tax preparation services); Celgene Corporation (global biotechnology company); Student Loan Corporation (student loan provider); Crystal River Capital, Inc. from 2005 to 2010; Parsons Brinckerhoff from 1995 to 2008; the Helios Funds (closed-end funds); and Apex Silver Mines Ltd. from 2007 to 2009 |
| |
| Douglas A. Hacker (born 1955) | | |
c/o Columbia Management Investment Advisers, LLC 225 Franklin Street Boston, MA 02110 Trustee (since 1996) | | Independent business executive since May 2006; Executive Vice President–Strategy of United Airlines (airline) from December 2002 to May 2006; President of UAL Loyalty Services (airline marketing company) from September 2001 to December 2002; Executive Vice President and Chief Financial Officer of United Airlines from July 1999 to September 2001. Oversees 46; Nash Finch Company (food distributor); Aircastle Limited (aircraft leasing); and SeaCube Container Leasing Ltd (container leasing) |
|
| Janet Langford Kelly (born 1957) |
c/o Columbia Management Investment Advisers, LLC 225 Franklin Street Boston, MA 02110 Trustee (since 1996) | | Senior Vice President, General Counsel and Corporate Secretary, ConocoPhillips (integrated energy company) since September 2007; Deputy General Counsel–Corporate Legal Services, ConocoPhillips from August 2006 to August 2007; Partner, Zelle, Hofmann, Voelbel, Mason & Gette LLP (law firm) from March 2005 to July 2006; Adjunct Professor of Law, Northwestern University, from September 2004 to June 2006; Director, UAL Corporation (airline) from February 2006 to July 2006; Oversees 46; None |
33
Fund Governance (continued)
Independent Trustees (continued)
| | |
Name, Address and Year of Birth,
Position with Funds, Year First
Elected or Appointed to Office | | Principal Occupation(s) During Past Five Years, Number of Funds in Columbia Funds
Complex Overseen by Trustee, Other Directorships Held |
| |
| William E. Mayer (born 1940) | | |
c/o Columbia Management Investment Advisers, LLC 225 Franklin Street Boston, MA 02110 Trustee (since 1994) | | Partner, Park Avenue Equity Partners (private equity) since February 1999; Dean and Professor, College of Business and Management, University of Maryland from 1992 to 1996. Oversees 46; DynaVox Inc. (software developer); Lee Enterprises (print media), WR Hambrecht + Co. (financial service provider); BlackRock Kelso Capital Corporation (investment company) |
| |
| Charles R. Nelson (born 1942) | | |
c/o Columbia Management Investment Advisers, LLC 225 Franklin Street Boston, MA 02110 Trustee (since 1981) | | Professor of Economics, University of Washington, since January 1976; Ford and Louisa Van Voorhis Professor of Political Economy, University of Washington, since September 1993; Adjunct Professor of Statistics, University of Washington, since September 1980; Associate Editor, Journal of Money Credit and Banking, 1993-2008; Consultant on econometric and statistical matters. Oversees 46; None |
| |
| John J. Neuhauser (born 1943) | | |
c/o Columbia Management Investment Advisers, LLC 225 Franklin Street Boston, MA 02110 Trustee (since 1984) | | President, Saint Michael’s College, since August 2007; Director or Trustee of several non-profit organization, including Fletcher Allen Health Care, Inc.; University Professor, Boston College from November 2005 to August 2007; Academic Vice President and Dean of Faculties, Boston College from August 1999 to October 2005. Oversees 46; Liberty All-Star Equity Fund and Liberty All-Star Growth Fund, Inc. (closed-end funds) |
| |
| Jonathan Piel (born 1938) | | |
c/o Columbia Management Investment Advisers, LLC 225 Franklin Street Boston, MA 02110 Trustee (since 1994) | | Cable television producer and website designer; The Editor, Scientific American from 1984 to 1994; Vice President, Scientific American, Inc., from 1984 to 1994; Member, Advisory Board, Stone Age Institute, Bloomington, Indiana (research institute that explores the effect of technology on human evolution); Member, Board of Directors of the National Institute of Social Sciences, New York City; Member, Board of Trustees of the William Alanson White Institute, New York City (institution for training psychoanalysts); and Member, Advisory Board, Mount Sinai Children’s Environmental Health Center, New York. Oversees 46; None |
| |
| Patrick J. Simpson (born 1944) | | |
c/o Columbia Management Investment Advisers, LLC 225 Franklin Street Boston, MA 02110 Trustee (since 2000) | | Partner, Perkins Coie LLP (law firm). Oversees 46; None |
| |
| Anne-Lee Verville (born 1945) | | |
c/o Columbia Management Investment Advisers, LLC 225 Franklin Street Boston, MA 02110 Trustee (since 1998) | | Retired since 1997 (formerly General Manager–Global Education Industry from 1994 to 1997, President–Application Systems Division from 1991 to 1994, Chief Financial Officer–US Marketing & Services from 1988 to 1991, and Chief Information Officer from 1987 to 1988, IBM Corporation (computer and technology)). Oversees 46; Enesco Group, Inc. (producer of giftware and home and garden decor products) from 2001 to 2006 |
34
Fund Governance (continued)
Interested Trustee
| | |
Name, Address and Year of Birth,
Position with Funds, Year First
Elected or Appointed to Office | | Principal Occupation(s) During Past Five Years, Number of Funds in Columbia Funds
Complex Overseen by Trustee, Other Directorships Held |
| |
| Michael A. Jones (born 1959) | | |
c/o Columbia Management Investment Advisers, LLC 225 Franklin Street Boston, MA 02110 Trustee (since 2011) Senior Vice President (since 2010) | | President and Director, Columbia Management Investment Advisers, LLC since May 2010; President and Director, Columbia Management Investment Distributors, Inc. since May 2010; Manager, Chairman, Chief Executive Officer and President, Columbia Management Advisors, LLC from 2007 to April 2010; Chief Executive Officer, President and Director, Columbia Management Distributors, Inc. from November 2006 to April 2010; previously, co-president and senior managing director at Robeco Investment Management. Oversees 46; None |
The Statement of Additional Information includes additional information about the Trustees of the Funds and is available, without charge, upon request by calling 1-800-345-6611.
35
Fund Governance (continued)
Officers
| | |
| Name, Year of Birth and Address | | Principal Occupation(s) During the Past Five Years |
|
| J. Kevin Connaughton (born 1964) |
225 Franklin Street Boston, MA 02110 President (since 2009) | | Senior Vice President and General Manager–Mutual Fund Products, Columbia Management Investment Advisers, LLC since May 2010; President, Columbia Funds, since 2009, and RiverSource Funds, since May 2010 (previously Senior Vice President and Chief Financial Officer, Columbia Funds, from June 2008 to January 2009, Treasurer, Columbia Funds, from October 2003 to May 2008, and senior officer of various other affiliated funds since 2000); Managing Director, Columbia Management Advisors, LLC from December 2004 to April 2010. |
| |
| Michael G. Clarke (born 1969) | | |
225 Franklin Street Boston, MA 02110 Treasurer (since 2011) and Chief Financial Officer (since 2009) | | Vice President, Columbia Management Investment Advisers, LLC since May 2010; Managing Director of Fund Administration, Columbia Management Advisors, LLC, from September 2004 to April 2010; senior officer of Columbia Funds and affiliated funds since 2002. |
| |
| Scott R. Plummer (born 1959) | | |
5228 Ameriprise Financial Center Minneapolis, MN 55474 Senior Vice President, Secretary and Chief Legal Officer (since 2010) | | Chief Legal Officer and Assistant Secretary, Columbia Management Investment Advisers, LLC since June 2005; Vice President and Lead Chief Counsel–Asset Management, Ameriprise Financial, Inc. since May 2010 (previously Vice President and Chief Counsel–Asset Management, from 2005 to April 2010, and Vice President–Asset Management Compliance from 2004 to 2005); Vice President, Chief Counsel and Assistant Secretary, Columbia Management Investment Distributors, Inc. since 2008; Vice President, General Counsel and Secretary, Ameriprise Certificate Company since 2005; Chief Counsel, RiverSource Distributors, Inc. since 2006; Vice President, General Counsel and Secretary, RiverSource Funds, since December 2006; Senior Vice President, Secretary and Chief Legal Officer, Columbia Funds, since May 2010. |
| |
| Linda J. Wondrack (born 1964) | | |
225 Franklin Street Boston, MA 02110 Senior Vice President and Chief Compliance Officer (since 2007) | | Vice President and Chief Compliance Officer, Columbia Management Investment Advisers, LLC since May 2010; Chief Compliance Officer, Columbia Funds, since 2007, and RiverSource Funds, since May 2010; Director (Columbia Management Group, LLC and Investment Product Group Compliance), Bank of America, from June 2005 to April 2010; Director of Corporate Compliance and Conflicts Officer of MFS Investment Management (investment management) from August 2004 to May 2005. |
| |
| William F. Truscott (born 1960) | | |
53600 Ameriprise Financial Center Minneapolis, MN 55474 Senior Vice President (since 2010) | | Chairman of the Board, Columbia Management Investment Advisers, LLC since May 2010 (previously President, Chairman of the Board and Chief Investment Officer, from 2001 to April 2010); Chief Executive Officer, U.S. Asset Management & President, Annuities, Ameriprise Financial, Inc. since May 2010 (previously President–U.S. Asset Management and Chief Investment Officer from 2005 to April 2010, and Senior Vice President–Chief Investment Officer, from 2001 to 2005); Director, President and Chief Executive Officer, Ameriprise Certificate Company since 2006; Director, Columbia Management Investment Distributors, Inc. since May 2010 (previously Chairman of the Board and Chief Executive Officer from 2008 to April 2010); Chairman of the Board and Chief Executive Officer, RiverSource Distributors, Inc. since 2006. |
36
Fund Governance (continued)
Officers (continued)
| | |
| Name, Year of Birth and Address | | Principal Occupation(s) During the Past Five Years |
|
| Colin Moore (born 1958) |
225 Franklin Street Boston, MA 02110 Senior Vice President (since 2010) | | Director and Chief Investment Officer, Columbia Management Investment Advisers, LLC since May 2010; Manager, Managing Director and Chief Investment Officer of Columbia Management Advisors, LLC from 2007 to April 2010; Head of Equities, Columbia Management Advisors, LLC from 2002 to 2007. |
| |
| Amy Johnson (born 1965) | | |
5228 Ameriprise Financial Center Minneapolis, MN 55474 Vice President (since 2010) | | Senior Vice President and Chief Operating Officer, Columbia Management Investment Advisers, LLC since May 2010 (previously Chief Administrative Officer, from 2009 until April 2010, Vice President–Asset Management and Trust Company Services, from 2006 to 2009, and Vice President–Operations and Compliance from 2004 to 2006). |
| |
| Joseph F. DiMaria (born 1968) | | |
225 Franklin Street Boston, MA 02110 Vice President (since 2011) and Chief Accounting Officer (since 2008) | | Vice President, Mutual Fund Administration, Columbia Management Investment Advisers, LLC, since May 2010; Director of Fund Administration, Columbia Management Advisors, LLC from January 2006 to April 2010; Head of Tax/Compliance and Assistant Treasurer, Columbia Management Advisors, LLC, from November 2004 to December 2005. |
| |
| Stephen T. Welsh (born 1957) | | |
225 Franklin Street Boston, MA 02110 Vice President (since 2006) | | President and Director, Columbia Management Investment Services Corp. since May 2010; President and Director, Columbia Management Services, Inc. from July 2004 to April 2010; Managing Director, Columbia Management Distributors, Inc. from August 2007 to April 2010. |
| |
| Paul D. Pearson (born 1956) | | |
5228 Ameriprise Financial Center Minneapolis, MN 55474 Vice President and Assistant Treasurer (since 2011) | | Vice President, Investment Accounting, Columbia Management Investment Advisers, LLC, since May 2010; Vice President, Managed Assets, Investment Accounting, Ameriprise Financial Corporation. |
| |
| Paul B. Goucher (born 1968) | | |
5228 Ameriprise Financial Center Minneapolis, MN 55474 Vice President and Assistant Treasurer (since 2010) | | Vice President and Chief Counsel of Ameriprise Financial since January 2010 (formerly Vice President and Group Counsel from November 2008 to January 2010); Director, Managing Director and General Counsel of J. & W. Seligman & Co. Incorporated (Seligman) from July 2008 to November 2008 and Managing Director and Associate General Counsel of Seligman from January 2005 to July 2008. |
| |
| Christopher O. Petersen (born 1970) | | |
5228 Ameriprise Financial Center Minneapolis, MN 55474 Vice President and Assistant Treasurer (since 2010) | | Vice President and Chief Counsel, Ameriprise Financial since January 2010 (formerly Vice President and Group Counsel or Counsel from April 2004 to January 2010); Assistant Secretary of RiverSource Funds since January 2007. |
| |
| Michael E. DeFao (born 1968) | | |
5228 Ameriprise Financial Center Minneapolis, MN 55474 Vice President and Assistant Treasurer (since 2011) | | Vice President and Chief Counsel, Ameriprise Financial since May 2010; Associate General Counsel Bank of America from June 2005 to April 2010. |
37
Shareholder Meeting Results
At a Joint Special Meeting of Shareholders held on February 15, 2011, shareholders of the Fund considered a proposal to approve a proposed amendment to the Investment Management Services Agreement with Columbia Management Investment Advisers, LLC. The proposal was approved as follows:
| | | | | | |
| | | | | | | |
| Votes For | | Votes Against | | Abstentions | | Broker Non-Votes |
| 3,045,050,680 | | 169,825,850 | | 63,177,181 | | 0 |
38
[THIS PAGE INTENTIONALLY LEFT BLANK]
39
[THIS PAGE INTENTIONALLY LEFT BLANK]
40
Important Information About This Report
The fund mails one shareholder report to each shareholder address. If you would like more than one report, please call shareholder services at 1-800-345-6611 and additional reports will be sent to you. This report has been prepared for shareholders of Columbia Value and Restructuring Fund.
A description of the policies and procedures that the fund uses to determine how to vote proxies and a copy of the fund’s voting records are available (i) at www.columbiamanagement.com, (ii) on the Securities and Exchange Commission’s website at www.sec.gov, and (iii) without charge, upon request, by calling 1-800-368-0346. Information regarding how the fund voted proxies relating to portfolio securities during the 12-month period ended June 30 is available from the SEC’s website. Information regarding how the fund voted proxies relating to portfolio securities is also available from the fund’s website, www.columbiamanagement.com.
The fund files a complete schedule of portfolio holdings with the SEC for the first and third quarters of each fiscal year on Form N-Q. The fund’s Form N-Q is available on the SEC’s website at www.sec.gov and may be reviewed and copied at the SEC’s Public Reference Room in Washington, D.C. Information on the operation of the Public Reference Room may be obtained by calling
1-800-SEC-0330.
Transfer Agent
Columbia Management Investment Services Corp.
P.O. Box 8081
Boston, MA 02266-8081
1-800-345-6611
Distributor
Columbia Management Investment
Distributors, Inc.
225 Franklin Street
Boston, MA 02110
Investment Manager
Columbia Management Investment Advisers, LLC
225 Franklin Street
Boston, MA 02110
41

Columbia Value and Restructuring Fund
P.O. Box 8081
Boston, MA 02266-8081
columbiamanagement.com
This information is for use with concurrent or prior delivery of a fund prospectus. Investors should consider the investment objectives, risks, charges and expenses of a mutual fund carefully before investing. For a free prospectus, which contains this and other important information about the funds, visit columbiamanagement.com. Read the prospectus carefully before investing. The Fund is distributed by Columbia Management Investment Distributors, Inc., member FINRA, and managed by Columbia Management Investment Advisers, LLC.
©2011 Columbia Management Investment Advisers, LLC. All rights reserved.
C-1201 A (05/11)
Item 2. Code of Ethics.
| | (a) | The registrant has adopted a code of ethics that applies to the registrant’s principal executive officer, principal financial officer, principal accounting officer or controller, or persons performing similar functions, regardless of whether these individuals are employed by the registrant or a third party. |
| | (b) | During the period covered by this report, there were not any amendments to a provision of the code of ethics adopted in 2(a) above. |
| | (c) | During the period covered by this report, there were no waivers, including any implicit waivers, from a provision of the code of ethics described in 2(a) above that relates to one or more of the items set forth in paragraph (b) of this item’s instructions. |
Item 3. Audit Committee Financial Expert.
The registrant’s Board of Trustees has determined that John D. Collins, Douglas A. Hacker, Charles R. Nelson and Anne-Lee Verville, each of whom are members of the registrant’s Board of Trustees and Audit Committee, each qualify as an audit committee financial expert. Mr. Collins, Mr. Hacker, Mr. Nelson and Ms. Verville are each independent trustees, as defined in paragraph (a)(2) of this item’s instructions.
Item 4. Principal Accountant Fees and Services.
Fee information below is disclosed for the twelve series of the registrant whose report to stockholders are included in this annual filing. Fee information for fiscal year ended March 31, 2011 also includes fees for two series that merged into the registrant during the period.
(a) Audit Fees. Aggregate Audit Fees billed by the principal accountant for professional services rendered during the fiscal years ended March 31, 2011 and March 31, 2010 are approximately as follows:
| | | | | | |
| 2011 | | | 2010 | |
| $ | 335,000 | | | $ | 471,100 | |
Audit Fees include amounts related to the audit of the registrant’s annual financial statements or services that are normally provided by the accountant in connection with statutory and regulatory filings or engagements for those fiscal years. Fiscal years 2011 and 2010 also include audit fees for the review and provision of consent in connection with filing Form N-1A for new share classes.
(b) Audit-Related Fees. Aggregate Audit-Related Fees billed to the registrant by the principal accountant for professional services rendered during the fiscal years ended March 31, 2011 and March 31, 2010 are approximately as follows:
| | | | | | |
| 2011 | | | 2010 | |
| $ | 97,300 | | | $ | 73,600 | |
Audit-Related Fees include amounts for assurance and related services by the principal accountant that are reasonably related to the performance of the audit of the registrant’s financial statements and are not reported in Audit Fees above. In both fiscal years 2011 and 2010, Audit-Related Fees consist of agreed-upon procedures performed for semi-annual shareholder reports. Fiscal year 2011 also includes Audit-Related Fees for agreed- upon procedures related to fund mergers.
During the fiscal years ended March 31, 2011 and March 31, 2010, there were no Audit-Related Fees billed by the registrant’s principal accountant to the registrant’s investment adviser (not including any sub-adviser whose role is primarily portfolio management and is subcontracted with or overseen by another investment adviser) and any entity controlling, controlled by, or under common control with the adviser that provides ongoing services to the registrant for an engagement that related directly to the operations and financial reporting of the registrant.
(c) Tax Fees. Aggregate Tax Fees billed by the principal accountant to the registrant for professional services rendered during the fiscal years ended March 31, 2011 and March 31, 2010 are approximately as follows:
| | | | | | |
| 2011 | | | 2010 | |
| $ | 90,100 | | | $ | 71,200 | |
Tax Fees include amounts for the review of annual tax returns, the review of required shareholder distribution calculations and typically include amounts for professional services by the principal accountant for tax compliance, tax advice and tax planning. In fiscal year 2011, Tax Fees also include agreed-upon procedures related to fund mergers and the review of final tax returns. In fiscal year 2010, Tax Fees also include fees for foreign tax filings.
During the fiscal years ended March 31, 2011 and March 31, 2010, there were no Tax Fees billed by the registrant’s principal accountant to the registrant’s investment adviser (not including any sub-adviser whose role is primarily portfolio management and is subcontracted with or overseen by another investment adviser) and any entity controlling, controlled by, or under common control with the adviser that provides ongoing services to the registrant for an engagement that related directly to the operations and financial reporting of the registrant.
(d) All Other Fees. Aggregate All Other Fees billed by the principal accountant to the registrant for professional services rendered during the fiscal years ended March 31, 2011 and March 31, 2010 are approximately as follows:
All Other Fees include amounts for products and services provided by the principal accountant, other than the services reported in paragraphs (a) through (c) above.
Aggregate All Other Fees billed by the registrant’s principal accountant to the registrant’s investment adviser (not including any sub-adviser whose role is primarily portfolio management and is subcontracted with or overseen by another investment adviser) and any entity controlling, controlled by, or under common control with the adviser that provides ongoing services to the registrant for an engagement that related directly to the operations and financial reporting of the registrant during the fiscal years ended March 31, 2011 and March 31, 2010 are approximately as follows:
| | | | | | |
| 2011 | | | 2010 | |
| $ | 495,300 | | | $ | 1,499,400 | |
In both fiscal years 2011 and 2010, All Other Fees consist of fees billed for internal control examinations of the registrant’s transfer agent and investment advisor. Fiscal year 2010 also includes fees for agreed upon procedures related to the sale of the long-term asset management business and fees related to the review of revenue modeling schedules.
(e)(1) Audit Committee Pre-Approval Policies and Procedures
The registrant’s Audit Committee is required to pre-approve the engagement of the registrant’s independent accountants to provide audit and non-audit services to the registrant and non-audit services to its investment adviser (not including any sub-adviser whose role is primarily portfolio management and is subcontracted with or overseen by another investment adviser) or any entity controlling, controlled by or under common control with such investment adviser that provides ongoing services to the registrant (“Adviser Affiliates”), if the engagement relates directly to the operations and financial reporting of the registrant.
The Audit Committee has adopted a Policy for Engagement of Independent Accountants for Audit and Non-Audit Services (“Policy”). The Policy sets forth the understanding of the Audit Committee regarding the engagement of the registrant’s independent accountants to provide (i) audit and permissible audit-related, tax and other services to the registrant (collectively “Fund Services”); (ii) non-audit services to the registrant’s investment adviser (not including any sub-adviser whose role is primarily portfolio management and is subcontracted with or overseen by another investment adviser) and Adviser Affiliates, if the engagement relates directly to the operations or
financial reporting of a Fund (collectively “Fund-related Adviser Services”); and (iii) certain other audit and non-audit services to the registrant’s investment adviser (not including any sub-adviser whose role is primarily portfolio management and is subcontracted with or overseen by another investment adviser) and Adviser Affiliates. Unless a type of service receives general pre-approval under the Policy, it requires specific pre-approval by the Audit Committee if it is to be provided by the independent accountants. Pre-approval of non-audit services to the registrant, the registrant’s investment adviser (not including any sub-adviser whose role is primarily portfolio management and is subcontracted with or overseen by another investment adviser) and Adviser Affiliates may be waived provided that the “de minimis” requirements set forth under paragraph (c)(7)(i)(C) of Rule 2-01 of Regulation S-X are met.
Under the Policy, the Audit Committee may delegate pre-approval authority to any pre-designated member or members who are Independent Trustees/Directors. The member(s) to whom such authority is delegated must report, for informational purposes only, any pre-approval decisions to the Audit Committee at its next regular meeting. The Audit Committee’s responsibilities with respect to the pre-approval of services performed by the independent accountants may not be delegated to management.
The Policy requires the Fund Treasurer and/or Director of Board Administration to submit to the Audit Committee, on an annual basis, a schedule of the types of services that are subject to general pre-approval. The schedule(s) provide a description of each type of service that is subject to general pre-approval and, where possible, will provide estimated fee caps for each instance of providing each service. The Audit Committees will review and approve the types of services and review the projected fees for the next fiscal year and may add to, or subtract from, the list of general pre-approved services from time to time based on subsequent determinations. That approval acknowledges that the Audit Committee is in agreement with the specific types of services that the independent accountants will be permitted to perform.
The Fund Treasurer and/or Director of Board Administration shall report to the Audit Committee at each of its regular meetings regarding all Fund Services or Fund-related Adviser Services initiated since the last such report was rendered, including a general description of the services, actual billed and projected fees, and the means by which such Fund Services or Fund-related Adviser Services were pre-approved by the Audit Committee.
*****
(e)(2) The percentage of services described in paragraphs (b) through (d) of this Item approved pursuant to the “de minimis” exception under paragraph (c)(7)(i)(C) of Rule 2-01 of Regulation S-X during both fiscal years ended March 31, 2011 and March 31, 2010 was zero.
(f) Not applicable.
(g) The aggregate non-audit fees billed by the registrant’s accountant for services rendered to the registrant, and rendered to the registrant’s investment adviser (not including any sub-adviser whose role is primarily portfolio management and is subcontracted with or overseen by another investment adviser), and any entity controlling, controlled by, or under common control with the adviser that provides ongoing services to the registrant for the fiscal years ended March 31, 2011 and March 31, 2010 are approximately as follows:
| | | | | | |
| 2011 | | | 2010 | |
| $ | 682,700 | | | $ | 1,644,200 | |
(h) The registrant’s Audit Committee of the Board of Directors has considered whether the provision of non-audit services that were rendered to the registrant’s adviser (not including any sub-adviser whose role is primarily portfolio management and is subcontracted with or overseen by another investment adviser), and any entity controlling, controlled by, or under common control with the investment adviser that provides ongoing services to the registrant that were not pre-approved pursuant to paragraph (c)(7)(ii) of Rule 2-01 of Regulation S-X, is compatible with maintaining the principal accountant’s independence.
Item 5. Audit Committee of Listed Registrants.
Not applicable.
Item 6. Investments
| | (a) | The registrant’s “Schedule I – Investments in securities of unaffiliated issuers” (as set forth in 17 CFR 210.12-12) is included in Item 1 of this Form N-CSR. |
Item 7. Disclosure of Proxy Voting Policies and Procedures for Closed-End Management Investment Companies.
Not applicable.
Item 8. Portfolio Managers of Closed-End Management Investment Companies.
Not applicable.
Item 9. Purchases of Equity Securities by Closed-End Management Investment Company and Affiliated Purchasers.
Not applicable.
Item 10. Submission of Matters to a Vote of Security Holders.
There were no material changes to the procedures by which shareholders may recommend nominees to the registrant’s board of directors.
Item 11. Controls and Procedures.
| | (a) | The registrant’s principal executive officer and principal financial officers, based on their evaluation of the registrant’s disclosure controls and procedures as of a date within 90 days of the filing of this report, have concluded that such controls and procedures are adequately designed to ensure that material information required to be disclosed by the registrant in Form N-CSR is accumulated and communicated to the registrant’s management, including the principal executive officer and principal financial officer, or persons performing similar functions, as appropriate to allow timely decisions regarding required disclosure. |
| | (b) | There was no change in the registrant’s internal control over financial reporting that occurred during the registrant’s second fiscal quarter of the period covered by this report that has materially affected, or is reasonably likely to materially affect, the registrant’s internal control over financial reporting. |
Item 12. Exhibits.
(a)(1) Code of ethics required to be disclosed under Item 2 of Form N-CSR attached hereto as Exhibit 99.CODE ETH.
(a)(2) Certifications pursuant to Rule 30a-2(a) under the Investment Company Act of 1940 (17 CFR 270.30a-2(a)) attached hereto as Exhibit 99.CERT.
(a)(3) Not applicable.
(b) Certification pursuant to Rule 30a-2(b) under the Investment Company Act of 1940 (17 CFR 270.30a-2(b)) attached hereto as Exhibit 99.906CERT.
SIGNATURES
Pursuant to the requirements of the Securities Exchange Act of 1934 and the Investment Company Act of 1940, the registrant has duly caused this report to be signed on its behalf by the undersigned, thereunto duly authorized.
| | |
| (registrant) | | Columbia Funds Series Trust I |
| | |
| |
| By (Signature and Title) | | /s/ J. Kevin Connaughton |
| | J. Kevin Connaughton, President |
Pursuant to the requirements of the Securities Exchange Act of 1934 and the Investment Company Act of 1940, this report has been signed below by the following persons on behalf of the registrant and in the capacities and on the dates indicated.
| | |
| By (Signature and Title) | | /s/ J. Kevin Connaughton |
| | J. Kevin Connaughton, President |
| | |
| |
| By (Signature and Title) | | /s/ Michael G. Clarke |
| | Michael G. Clarke, Chief Financial Officer |


