UNITED STATES
SECURITIES AND EXCHANGE COMMISSION
Washington, D.C. 20549
FORM N-CSR
CERTIFIED SHAREHOLDER REPORT OF REGISTERED
MANAGEMENT INVESTMENT COMPANIES
Investment Company Act file number 811-04367
Columbia Funds Series Trust I
(Exact name of registrant as specified in charter)
225 Franklin Street, Boston, Massachusetts 02110
(Address of principal executive offices) (Zip code)
Scott R. Plummer
5228 Ameriprise Financial Center
Minneapolis, MN 55474
(Name and address of agent for service)
Registrant’s telephone number, including area code: 1-612-671-1947
Date of fiscal year end: June 30
Date of reporting period: June 30, 2011
Form N-CSR is to be used by management investment companies to file reports with the Commission not later than 10 days after the transmission to stockholders of any report that is required to be transmitted to stockholders under Rule 30e-1 under the Investment Company Act of 1940 (17 CFR 270.30e-1). The Commission may use the information provided on Form N-CSR in its regulatory, disclosure review, inspection, and policymaking roles.
A registrant is required to disclose the information specified by Form N-CSR, and the Commission will make this information public. A registrant is not required to respond to the collection of information contained in Form N-CSR unless the Form displays a currently valid Office of Management and Budget (“OMB”) control number. Please direct comments concerning the accuracy of the information collection burden estimate and any suggestions for reducing the burden to Secretary, Securities and Exchange Commission, 450 Fifth Street, NW, Washington, DC 20549-0609. The OMB has reviewed this collection of information under the clearance requirements of 44 U.S.C. § 3507.
| Item 1. | Reports to Stockholders. |

Columbia High Yield Municipal Fund
Annual Report for the Period Ended June 30, 2011
Table of Contents
The views expressed in this report reflect the current views of the respective parties. These views are not guarantees of future performance and involve certain risks, uncertainties and assumptions that are difficult to predict, so actual outcomes and results may differ significantly from the views expressed. These views are subject to change at any time based upon economic, market or other conditions and the respective parties disclaim any responsibility to update such views. These views may not be relied on as investment advice and, because investment decisions for a Columbia Fund are based on numerous factors, may not be relied on as an indication of trading intent on behalf of any particular Columbia Fund. References to specific securities should not be construed as a recommendation or investment advice.
President’s Message

Dear Shareholder:
The Columbia Management story began over 100 years ago, and today, we are one of the nation’s largest dedicated asset managers. The recent acquisition by Ameriprise Financial, Inc. brings together the talents, resources and capabilities of Columbia Management with those of RiverSource Investments, Threadneedle (acquired by Ameriprise in 2003) and Seligman Investments (acquired by Ameriprise in 2008) to build a best-in-class asset management business that we believe is truly greater than its parts.
RiverSource Investments traces its roots to 1894 when its then newly-founded predecessor, Investors Syndicate, offered a face-amount savings certificate that gave small investors the opportunity to build a safe and secure fund for retirement, education or other special needs. A mutual fund pioneer, Investors Syndicate launched Investors Mutual Fund in 1940. In the decades that followed, its mutual fund products
and services lineup grew to include a full spectrum of styles and specialties. More than 110 years later, RiverSource continues to be a trusted financial products leader.
Threadneedle, a leader in global asset management and one of Europe’s largest asset managers, offers sophisticated international experience from a dedicated U.K. management team. Headquartered in London, it is named for Threadneedle Street in the heart of the city’s financial district, where British investors pioneered international and global investing. Threadneedle was acquired in 2003 and today operates as an affiliate of Columbia Management.
Seligman Investments’ beginnings date back to the establishment of the investment firm J. & W. Seligman & Co. in 1864. In the years that followed, Seligman played a major role in the geographical expansion and industrial development of the United States. In 1874, President Ulysses S. Grant named Seligman as fiscal agent for the U.S. Navy — an appointment that would last through World War I. Seligman helped finance the westward path of the railroads and the building of the Panama Canal. The firm organized its first investment company in 1929 and began managing its first mutual fund in 1930. In 2008, J. & W. Seligman & Co. Incorporated was acquired and Seligman Investments became an offering brand of RiverSource Investments, LLC.
We are proud of the rich and distinctive history of these firms, the strength and breadth of products and services they offer, and the combined cultures of pioneering spirit and forward thinking. Together we are committed to providing more for our shareholders than ever before.
| n | | A singular focus on our shareholders. Our business is asset management, so investors are our first priority. We dedicate our resources to identifying timely investment opportunities and provide a comprehensive choice of equity, fixed-income and alternative investments to help meet your individual needs. |
| n | | First-class research and thought leadership. We are dedicated to helping you take advantage of today’s opportunities and anticipate tomorrow’s. We stay abreast of the latest investment trends and ideas, using our collective insight to evaluate events and transform them into solutions you can use. |
| n | | A disciplined investment approach. We aren’t distracted by passing fads. Our teams adhere to a rigorous investment process that helps ensure the integrity of our products and enables you and your financial advisor to match our solutions to your objectives with confidence. |
When you choose Columbia Management, you can be confident that we will take the time to understand your needs and help you and your financial advisor identify the solutions that are right for you. Because at Columbia Management, we don’t consider ourselves successful unless you are.
Sincerely,

J. Kevin Connaughton
President, Columbia Funds
Investors should consider the investment objectives, risks, charges and expenses of a mutual fund carefully before investing. For a free prospectus, which contains this and other important information about the funds, visit www.columbiamanagement.com. The prospectus should be read carefully before investing.
Columbia Funds are distributed by Columbia Management Investment Distributors, Inc., member FINRA, and managed by Columbia Management Investment Advisers, LLC.
© 2011 Columbia Management Investment Advisers, LLC. All rights reserved.
Fund Profile – Columbia High Yield Municipal Fund
Performance data quoted represents past performance and current performance may be lower or higher. Past performance is no guarantee of future results. The investment return and principal value will fluctuate so that shares, when redeemed, may be worth more or less than the original cost. Please visit www.columbiamanagement.com for daily and most recent month-end performance updates.
Summary
1-year return as of 06/30/11
| | |
| |
 | | +3.63% Class A shares
(without sales charge) |
| |
| | +5.47% Barclays Capital High Yield Municipal Bond Index |
| |
| | +4.67% Blended Benchmark |
| |
| | +3.48% Barclays Capital Municipal Bond Index |
Summary
| n | | For the 12-month period that ended June 30, 2011, the fund’s Class A shares returned 3.63% without sales charge. |
| n | | The fund’s return was lower than that of the Barclays Capital High Yield Municipal Bond Index1, and the Blended Benchmark2 (60% Barclays Capital High Yield Municipal Bond Index, 40% Barclays Capital Municipal Bond Index3). The fund beat the Barclays Capital Municipal Bond Index and the average return of its peer group, the Lipper High Yield Municipal Debt Funds Classification.4 |
| n | | The fund’s higher quality bias hampered returns versus the Barclays Capital High Yield Municipal Bond Index and the Blended Benchmark. High-yield exposure helped the fund beat the Barclays Capital Municipal Bond Index, while shorter duration and an underweight in the tobacco sector aided returns relative to its peer group. |
Portfolio Management
Chad Farrington has managed the fund since February 2009 and has been associated with the fund’s adviser or its predecessors since 2003.
| 1 | The Barclays Capital High Yield Municipal Bond Index is composed of bonds with maturities greater than one year, having a par value of at least $3 million issued as part of a transaction size greater than $20 million, and rated no higher than “BB+” or equivalent by any of the three principal rating agencies. |
| 2 | The Blended Benchmark is a custom composite established by the Adviser, consisting of a 60% weighting of the Barclays Capital High Yield Municipal Bond Index and a 40% weighting of the Barclays Capital Municipal Bond Index. |
| 3 | The Barclays Capital Municipal Bond Index is considered representative of the broad market for investment-grade, tax-exempt bonds with maturity of at least one year. |
| 4 | Lipper Inc., a widely respected data provider in the industry, calculates an average total return (assuming reinvestment of distributions) for mutual funds with investment objectives similar to those of the fund. Lipper makes no adjustment for the effect of sales loads. |
Indices are not available for investment, are not professionally managed and do not reflect sales charges, fees, brokerage commissions, taxes or other expenses of investing. Securities in the fund may not match those in an index.
1
Performance Information – Columbia High Yield Municipal Fund
Performance data quoted represents past performance and current performance may be lower or higher. Past performance is no guarantee of future results. The investment return and principal value will fluctuate so that shares, when redeemed, may be worth more or less than the original cost. Please visit www.columbiamanagement.com for daily and most recent month-end performance updates.
|
| Performance of a $10,000 investment 07/01/01 – 06/30/11 |
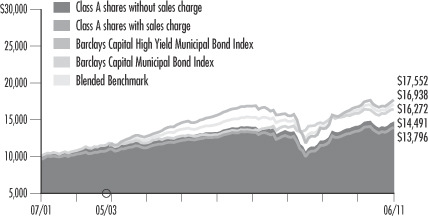
The chart above shows the change in value of a hypothetical $10,000 investment in Class A shares of Columbia High Yield Municipal Fund during the stated time period, and does not reflect the deduction of taxes that a shareholder may pay on fund distributions or on the redemption of fund shares. A $10,000 investment in the Fund since 07/01/01 appreciated to $11,397 on 05/30/03, the inception date of the Barclays Capital High Yield Municipal Bond Index and the Blended Benchmark. For comparison with these indices, we assigned them the same value as the Fund at the indices’ inception date.
| | | | | | | | |
| Performance of a $10,000 investment 07/01/01 – 06/30/11 ($) | |
| | |
| Sales charge | | without | | | with | |
Class A | | $ | 14,491 | | | $ | 13,796 | |
Class B | | $ | 13,550 | | | $ | 13,550 | |
Class C | | $ | 13,730 | | | $ | 13,730 | |
Class Z | | $ | 14,813 | | | | n/a | |
| | | | | | | | | | | | | | | | | | | | | | | | | | | | |
| Average annual total return as of 06/30/11 (%) | | | | | | | |
| | | | |
| Share class | | A | | | B | | | C | | | Z | |
| Inception | | 07/31/00 | | | 07/15/02 | | | 07/15/02 | | | 03/05/84 | |
| Sales charge | | without | | | with | | | without | | | with | | | without | | | with | | | without | |
1-year | | | 3.63 | | | | -1.32 | | | | 2.85 | | | | -2.06 | | | | 3.01 | | | | 2.03 | | | | 3.82 | |
5-year | | | 2.02 | | | | 1.03 | | | | 1.26 | | | | 0.94 | | | | 1.41 | | | | 1.41 | | | | 2.22 | |
10-year | | | 3.78 | | | | 3.27 | | | | 3.08 | | | | 3.08 | | | | 3.22 | | | | 3.22 | | | | 4.01 | |
The “with sales charge” returns include the maximum initial sales charge of 4.75% for Class A shares and the applicable contingent deferred sales charge of 5.00% in the first year, declining to 1.00% in the sixth year and eliminated thereafter for Class B shares and 1.00% for Class C shares for the first year only. The “without sales charge” returns do not include the effect of sales charges. If they had, returns would be lower.
All results shown assume reinvestment of distributions. Class Z shares are sold at net asset value with no distribution and service (Rule 12b-1) fees. Class Z shares have limited eligibility and the investment minimum requirements may vary. Please see the fund’s prospectus for details. Performance for different share classes will vary based on differences in sales charges and fees associated with each class.
Performance results reflect any fee waivers or reimbursements of fund expenses by the Investment Manager and/or any of its affiliates. Absent these fee waivers or expense reimbursement arrangements, performance results would have been lower.
The tables do not reflect the deduction of taxes that a shareholder may pay on fund distributions or on the redemption of fund shares.
Class A, Class B and Class C are newer classes of shares. Class A shares performance information includes the performance of Class Z shares (the oldest existing share class) for periods prior to its inception. Class B and Class C shares performance information includes returns of Class A shares for the period from July 31, 2000 through July 15, 2002, and the returns of Class Z shares for periods prior thereto. These returns reflect differences in sales charges, but have not been restated to reflect any differences in expenses (such as distribution and service (Rule 12b-1) fees) between Class Z shares (or Class A shares) and the newer classes of shares. If differences in expenses had been reflected, the returns shown for periods prior to the inception of the newer classes of shares would have been lower, since the newer classes of shares are subject to a distribution and service (Rule 12b-1) fees. Class A shares were initially offered on July 31, 2000, Class B and Class C shares were initially offered July 15, 2002, and Class Z shares were initially offered on March 5, 1984.
2
Understanding Your Expenses – Columbia High Yield Municipal Fund
As a fund shareholder, you incur two types of costs. There are transaction costs, which generally include sales charges on purchases and may include redemption fees or exchange fees. There are also ongoing costs, which generally include investment management fees, distribution and service (Rule 12b-1) fees and other fund expenses. The information on this page is intended to help you understand the ongoing costs of investing in the fund and to compare these costs with the ongoing costs of investing in other mutual funds.
Analyzing your fund’s expenses by share class
To illustrate these ongoing costs, we have provided an example and calculated the expenses paid by investors in each share class during the period. The information in the following table is based on an initial investment of $1,000, which is invested at the beginning of the period and held for the entire period. Expense information is calculated two ways and each method provides you with different information. The amount listed in the “Actual” column is calculated using the fund’s actual operating expenses and total return for the period. The amount listed in the “Hypothetical” column for each share class assumes that the return each year is 5% before expenses and is calculated based on the fund’s actual operating expenses. You should not use the hypothetical account values and expenses to estimate either your actual account balance at the end of the period or the expenses you paid during this period.
Compare with other funds
Since all mutual funds are required to include the same hypothetical calculations about expenses in shareholder reports, you can use this information to compare the ongoing costs of investing in the fund with other funds. To do so, compare the 5% hypothetical example with the 5% hypothetical examples that appear in the shareholder reports of other funds. As you compare hypothetical examples of other funds, it is important to note that hypothetical examples are meant to highlight the ongoing costs of investing in a fund and do not reflect any transaction costs, such as sales charges, redemption fees or exchange fees.
Estimating your actual expenses
To estimate the expenses that you paid over the period, first you will need your account balance at the end of the period:
| | n | | For shareholders who receive their account statements from Columbia Management Investment Services Corp., your account balance is available online at www.columbiamanagement.com or by calling Shareholder Services at 800.345.6611. | |
| | n | | For shareholders who receive their account statements from their financial intermediary, contact your financial intermediary firm to obtain your account balance. | |
| | 1. | Divide your ending account balance by $1,000. For example, if an account balance was $8,600 at the end of the period, the result would be 8.6. | |
| | 2. | In the section of the table below titled “Expenses paid during the period,” locate the amount for your share class. You will find this number in the column labeled “Actual.” Multiply this number by the result from step 1. Your answer is an estimate of the expenses you paid on your account during the period. | |
If the value of your account falls below the minimum initial investment requirement applicable to you, your account may be subject to a $20 annual fee. This fee is not included in the accompanying table. If you are subject to the fee, keep it in mind when you are estimating the ongoing expenses of investing in the fund and when comparing the expenses of this fund with other funds.
| | | | | | | | | | | | | | | | | | | | | | | | | | | | |
| 01/01/11 – 06/30/11 | | | | | | | | | | | | | | | | |
| | | | |
| | | Account value at the
beginning of the period ($) | | | Account value at the
end of the period ($) | | | Expenses paid
during the period ($) | | | Fund’s annualized
expense ratio (%) | |
| | | Actual | | | Hypothetical | | | Actual | | | Hypothetical | | | Actual | | | Hypothetical | | | Actual | |
Class A | | | 1,000.00 | | | | 1,000.00 | | | | 1,042.30 | | | | 1,020.53 | | | | 4.35 | | | | 4.31 | | | | 0.86 | |
Class B | | | 1,000.00 | | | | 1,000.00 | | | | 1,038.50 | | | | 1,016.81 | | | | 8.14 | | | | 8.05 | | | | 1.61 | |
Class C | | | 1,000.00 | | | | 1,000.00 | | | | 1,039.30 | | | | 1,017.55 | | | | 7.38 | | | | 7.30 | | | | 1.46 | |
Class Z | | | 1,000.00 | | | | 1,000.00 | | | | 1,043.30 | | | | 1,021.52 | | | | 3.34 | | | | 3.31 | | | | 0.66 | |
Expenses paid during the period are equal to the annualized expense ratio for the share class, multiplied by the average account value over the period, then multiplied by the number of days in the fund’s most recent fiscal half-year and divided by 365.
Had the Investment Manager and/or any of its affiliates not waived fees or reimbursed a portion of expenses, account value at the end of the period would have been reduced.
It is important to note that the expense amounts shown in the table are meant to highlight only ongoing costs of investing in the fund and do not reflect any transaction costs, such as sales charges, redemption fees or exchange fees. Therefore, the hypothetical examples provided may not help you determine the relative total costs of owning shares of different funds. If these transaction costs were included, your costs would have been higher.
3
Portfolio Manager’s Report – Columbia High Yield Municipal Fund
Performance data quoted represents past performance and current performance may be lower or higher. Past performance is no guarantee of future results. The investment return and principal value will fluctuate so that shares, when redeemed, may be worth more or less than the original cost. Please visit www.columbiamanagement.com for daily and most recent month-end performance updates.
| | | | |
| Net asset value per share | |
| |
as of 06/30/11 ($) | | | | |
Class A | | | 9.60 | |
Class B | | | 9.60 | |
Class C | | | 9.60 | |
Class Z | | | 9.60 | |
| Distributions declared per share | |
| |
07/01/10 – 06/30/11 ($) | | | | |
Class A | | | 0.51 | |
Class B | | | 0.44 | |
Class C | | | 0.45 | |
Class Z | | | 0.53 | |
A portion of the fund’s income may be subject to the alternative minimum tax. The fund may at times purchase tax-exempt securities at a discount. Some, or all of this discount may be included in the fund’s ordinary income, and is taxable when distributed.
| | | | |
| 30-day SEC yields | | | |
| |
as of 06/30/11 (%) | | | | |
Class A | | | 5.35 | |
Class B | | | 4.87 | |
Class C | | | 5.03 | |
Class Z | | | 5.84 | |
The 30-day SEC yields reflect the fund’s earning power, net of expenses, expressed as an annualized percentage of the public offering price per share at the end of the period.
| | | | |
| Taxable-equivalent SEC yields | |
| |
as of 06/30/11 (%) | | | | |
Class A | | | 8.23 | |
Class B | | | 7.49 | |
Class C | | | 7.74 | |
Class Z | | | 8.98 | |
Taxable-equivalent SEC yields are based on the maximum effective 35.0% federal income tax rate. This tax rate does not reflect the phase out of exemptions or the reduction of otherwise allowable deductions that occur when adjusted gross income exceeds certain levels.
For the 12-month period that ended June 30, 2011, the fund’s Class A shares returned 3.63% without sales charge. By comparison, the Barclays Capital High Yield Municipal Bond Index returned 5.47%, the Barclays Capital Municipal Bond Index returned 3.48% and the Blended Benchmark (60% Barclays Capital High Yield Municipal Bond Index, 40% Barclays Capital Municipal Bond Index) returned 4.67%. The fund beat the 2.96% average return of funds in its peer group, the Lipper High Yield Municipal Debt Funds Classification. The fund’s higher quality bias caused it to trail both its high yield municipal benchmark and the blended benchmark, while its high-yield exposure aided performance relative to the municipal bond benchmark. We believe the fund’s shorter duration and an underweight in the tobacco sector helped it beat the peer group.
Backdrop of a sluggish expansion
As the impact of Japan’s first-quarter natural disasters worked its way through the global supply chain and Europe scrambled, once again, to prop up debtor nations — notably Greece — the pace of economic growth slowed around the world. In the United States, unfriendly spring storms cut a swath of destruction across the Midwest, as well as southern and eastern coastal states, while Washington wrangled over the deficit and the federal debt ceiling.
Against this backdrop, the U.S. economy expanded at an estimated 1.6% over the past 12 months, as measured by gross domestic product (GDP). Growth picked up in the third and fourth quarters of 2010, but concerns emerged as the housing market continued its five-year slide and the job market disappointed with fewer-than-expected new jobs and higher unemployment at the end of the period. Even though news on the job front was positive, the number of new jobs added was significantly below expectations for this stage of an economic recovery. Disappointingly low figures for May and June and a hike in the unemployment rate were especially troubling. Yet, with corporate profits expanding at a solid pace, hope remains for a better second half showing in 2011.
Personal income surged in January as payroll tax cuts kicked in, and it continued to edge higher through the end of the period. With incomes on the rise, consumer spending on cars, clothing and other goods trended upward during the 12-month period. However, rising food and energy costs generally offset income gains and spending, in real terms, was flat to down.
On June 30, 2011, the Federal Reserve Board ended its program of large-scale Treasury purchases aimed at shoring up the economy and building confidence in the markets. Even though it did not do much to lift growth, it quelled fears of a relapse into recession, helping to push stock and commodity prices higher. GDP expanded at a mere 0.40% in the first quarter of 2011 with second quarter growth estimated at 1.3%. The yield on the 10-year U.S Treasury note was 3.20% at period end, not far from where it had started a year earlier, despite declining to 2.38% in October and rising to 3.72% in February.
Strongest returns from high yield
High yield was the best place to be in the municipal bond market this past year. The sector benefited as generally improving economic conditions led to fewer defaults and distressed situations, while continued low interest rates pushed investors toward higher-yielding securities. The broader muni bond market rallied early in the period, buoyed by expectations that demand would increase with the year-end expiration of the Bush tax cuts. Munis, however, retreated
4
Portfolio Manager’s Report (continued) – Columbia High Yield Municipal Fund
between November and January, amid growing fears of widespread defaults by stretched issuers and, later, by the extension of the Bush tax cuts. Muni bonds rallied again in the spring, buoyed by a decline in defaults, very little new issuance and declining yields.
Longer-maturity muni bonds were the year’s weakest performers, pressured by disappointing demand from mutual funds and expectations of increased supply after the expiration of the Build America Bonds (BABs) program, which gave municipalities federal subsidies for issuing taxable bonds.
Cost of higher quality, lower volatility bias
As always, the fund focused on delivering consistent, tax-exempt income for shareholders while limiting volatility. Our emphasis was on selectively adding yield through credit selection. We kept the portfolio diversified across sectors, limited exposure to below-investment-grade names and kept a small cash position to help meet redemptions and take advantage of buying opportunities. The fund’s higher quality bias hampered near-term relative performance as lower quality bonds outperformed over the year. Underweights versus the Barclays Capital High Yield Municipal Bond Index in the more volatile airline and industrial development revenue bond sectors especially hindered results, as both rallied nicely. Underweights in five- and 15-year issues — the best performing maturities in the high-yield muni bond sector — and an overweight in long-maturity bonds also hampered performance.
Lost ground from specific issues
Among the biggest individual detractors were bonds issued by three continuing care retirement centers (CCRCs) that filed for bankruptcy — Sedgebrook and Monarch Landing in Illinois and Linden Ponds in Massachusetts (less than 0.0%, less than 0.0% and 0.6% of net assets, respectively). Distressed bonds issued by special assessment districts in Florida also detracted from performance. We sold bonds issued by Sarasota National Community Development District at a significant loss, but held on to issues from Tolomato Community Development District (0.4% of net assets).
Gains from sector overweight and selected credits
Although the CCRC/hospital sector contained some of the fund’s biggest individual disappointments, these losses were partially offset by an overweight in the sector, which was a strong performer, and solid gains from certain bonds. Among top contributors were bonds issued by CCRCs Good Shepard Village in New York and Aberdeen Heights in Missouri (0.5% and 0.6% of net assets, respectively), both of which rallied as their projects neared completion. Several lower-rated1 (BBB and below) hospital bonds also boosted results, as investors grew more comfortable with the credit outlook for issuers in this segment. Being less sensitive to interest-rate changes than its peers also helped the fund as long-term yields rose. An underweight in high-yield tobacco bonds, which declined following some credit downgrades and worries that defaults could increase as more smokers kicked the habit, also benefited returns.
| 1 | The credit quality ratings represent those of Moody’s Investors Service, Inc. (“Moody’s”), Standard & Poor’s Corporation (“S&P”) or Fitch Ratings (“Fitch”) credit ratings. The ratings represent their opinions as to the quality of the securities they rate. Ratings are relative and subjective and are not absolute standards of quality. The security’s credit quality does not eliminate risk. |
| | | | |
| Top 10 issuers | | | |
| |
as of 06/30/11 (%) | | | | |
MI Tobacco Settlement Finance Authority | | | 1.22 | |
CA Housing Finance Agency | | | 1.02 | |
KS Wyandotte County-Kansas City Unified Government | | | 0.90 | |
CA Foothill-Eastern Transportation Corridor Agency | | | 0.83 | |
CA Infrastructure & Economic Development Bank | | | 0.80 | |
CO Health Facilities Authority | | | 0.80 | |
OH Buckeye Tobacco Settlement Financing Authority | | | 0.80 | |
MN St. Paul Housing & Redevelopment Authority | | | 0.76 | |
CA M-S-R Energy Authority | | | 0.75 | |
CT Harbor Point Infrastructure Improvement District | | | 0.75 | |
| | | | |
| Quality breakdown | | | |
| |
as of 06/30/11 (%) | | | | |
AAA | | | 6.9 | |
AA | | | 3.4 | |
A | | | 16.6 | |
BBB | | | 33.0 | |
BB | | | 4.8 | |
B | | | 2.7 | |
CCC | | | 0.5 | |
CC | | | 0.1 | |
Not-Rated | | | 32.0 | |
5
Portfolio Manager’s Report (continued) – Columbia High Yield Municipal Fund
| | | | |
| Maturity breakdown | |
| |
as of 06/30/11 (%) | | | | |
0-1 year | | | 0.1 | |
1-3 years | | | 1.8 | |
3-5 years | | | 2.0 | |
5-7 years | | | 2.1 | |
7-10 years | | | 7.6 | |
10-15 years | | | 9.8 | |
15-20 years | | | 12.3 | |
20-25 years | | | 17.3 | |
25 years and over | | | 42.1 | |
Cash & Equivalents | | | 4.9 | |
The Fund is actively managed and the composition of its portfolio will change over time. Top 10 issuers, quality and maturity breakdowns are calculated as a percentage of net assets.
Ratings shown in the quality breakdown are assigned to individual bonds by taking the lower of the ratings available from one of the following nationally recognized rating agencies: Standard & Poor’s or Moody’s Investor Services. If a security is rated by only one of the two agencies, that rating is used. If a security is not rated by either of the two agencies, it is designated as Non-Rated. Ratings are relative and subjective and are not absolute standards of quality. The credit quality of the fund’s investments does not remove market risk.
Cautiously optimistic outlook
Going forward, we expect to see a slow, protracted economic recovery. As economic growth picks up, we believe interest rates will start to move higher and credit spreads — the difference between yields on low and high quality bonds of similar maturities — will likely begin to narrow, especially benefiting returns on bonds with single A and lower credit ratings. In the meantime, we plan to continue looking for opportunities to add yield, while monitoring the credit quality of individual issuers and limiting the fund’s sensitivity to interest-rate changes.
Portfolio characteristics and holdings are subject to change and may not be representative of current characteristics and holdings. The outlook for the fund may differ from those presented for other Columbia Funds.
Tax-exempt investing offers current tax-exempt income, but it also involves special risks. The value of the fund will be affected by interest rate changes and the creditworthiness of issues held in the fund. When interest rates go up, bond prices generally drop and vice versa. Interest income from certain tax-exempt bonds may be subject to certain state and local taxes and, if applicable, the alternative minimum tax. Any capital gains distributed are taxable to the investor.
Investments in high-yield bonds (sometimes referred to as “junk” bonds) offer the potential for high current income and attractive total return, but involve certain risks. Changes in economic conditions or other circumstances may adversely affect a high-yield bond issuer’s ability to make principal and interest payments.
6
Portfolio of Investments – Columbia High Yield Municipal Fund
June 30, 2011
(Percentages represent value of investments compared to net assets)
| | | | | | | | | | | | |
Issue
Description | | Coupon
Rate | | | Principal
Amount | | | Value | |
Municipal Bonds 94.8% | |
ALABAMA 0.5% | |
Camden Industrial Development Board
Prerefunded 12/01/13 Revenue Bonds Weyerhaeuser Co. Series 2003B AMT(a) | |
12/01/24 | | | 6.375 | % | | | $275,000 | | | | $312,180 | |
Courtland Industrial Development Board(a) Refunding Revenue Bonds
International Paper Co. Projects
Series 2003B AMT | |
08/01/25 | | | 6.250 | % | | | 2,000,000 | | | | 2,023,380 | |
Series 2005A AMT | |
06/01/25 | | | 5.200 | % | | | 1,000,000 | | | | 945,830 | |
Total | | | | | | | | | | | 3,281,390 | |
ALASKA 0.9% | |
City & Borough of Juneau Revenue Bonds
St. Ann’s Care Center Project
Series 1999 | |
12/01/25 | | | 6.875 | % | | | 1,435,000 | | | | 1,364,513 | |
City of Koyukuk
Revenue Bonds Tanana Chiefs Conference Health Care Series 2011(b) | |
10/01/41 | | | 7.750 | % | | | 5,000,000 | | | | 4,772,850 | |
Total | | | | | | | | | | | 6,137,363 | |
ARIZONA 1.6% | |
Arizona Health Facilities Authority
Refunding Revenue Bonds Phoenix Memorial Hospital Series 1991(c)(g) | |
06/01/12 | | | 8.125 | % | | | 1,803,743 | | | | 18 | |
Maricopa County Pollution Control Corp.
Revenue Bonds El Paso Electric Co. Project Series 2009B | |
04/01/40 | | | 7.250 | % | | | 3,600,000 | | | | 3,990,492 | |
Pima County Industrial Development Authority Revenue Bonds
American Charter Schools Foundation
Series 2007A | |
07/01/38 | | | 5.625 | % | | | 3,440,000 | | | | 2,862,493 | |
Surprise Municipal Property Corp. Revenue Bonds
Series 2007 | |
04/01/32 | | | 4.900 | % | | | 2,000,000 | | | | 1,772,760 | |
Yavapai County Industrial Development Authority Revenue Bonds
Yavapai Regional Medical Center
Series 2008B | |
08/01/37 | | | 5.625 | % | | | 3,500,000 | | | | 3,149,720 | |
Total | | | | | | | | | | | 11,775,483 | |
| | | | | | | | | | | | |
Issue
Description | | Coupon
Rate | | | Principal
Amount | | | Value | |
Municipal Bonds (continued) | |
ARKANSAS —% | |
City of Camden Refunding Revenue Bonds
International Paper Co. Project
Series 2004A AMT(a) | |
11/01/18 | | | 5.000 | % | | | $250,000 | | | | $250,950 | |
CALIFORNIA 10.5% | |
Agua Caliente Band of Cahuilla Indians Revenue Bonds Series 2003(b)(d) | |
07/01/18 | | | 6.000 | % | | | 2,000,000 | | | | 1,896,780 | |
Cabazon Band Mission Indians(b)(c) Revenue Bonds
Series 2004 | |
10/01/15 | | | 8.375 | % | | | 560,000 | | | | 381,948 | |
Series 2004 | |
10/01/19 | | | 8.750 | % | | | 2,785,000 | | | | 1,800,865 | |
Series 2010 | |
10/01/20 | | | 8.375 | % | | | 1,420,000 | | | | 1,395,193 | |
Cabazon Band Mission Indians(b)(c)(d) Revenue Bonds
Series 2004 | |
10/01/11 | | | 7.358 | % | | | 405,000 | | | | 234,697 | |
California Housing Finance Agency(a) Revenue Bonds
Home Mortgage
Series 2006K AMT | |
08/01/26 | | | 4.625 | % | | | 5,000,000 | | | | 4,405,200 | |
Series 2008K AMT | |
08/01/33 | | | 5.550 | % | | | 3,000,000 | | | | 2,891,550 | |
California Infrastructure & Economic Development Bank Revenue Bonds
Broad Museum Project
Series 2011A(e) | |
06/01/21 | | | 5.000 | % | | | 5,000,000 | | | | 5,758,550 | |
California State Public Works Board Revenue Bonds
Various Capital Projects
Subordinated Series 2009I-1 | |
11/01/34 | | | 6.375 | % | | | 5,000,000 | | | | 5,266,750 | |
California Statewide Communities Development Authority Revenue Bonds
American Baptist Homes West
Series 2010 | |
10/01/39 | | | 6.250 | % | | | 2,750,000 | | | | 2,706,660 | |
Aspire Public Schools Series 2010 | |
07/01/46 | | | 6.125 | % | | | 5,000,000 | | | | 4,545,300 | |
California Statewide Communities Development Authority(c)(d) Revenue Bonds
San Francisco Art Institute
Series 2002 | |
04/01/32 | | | 7.375 | % | | | 250,000 | | | | 219,893 | |
The Accompanying Notes to Financial Statements are an integral part of this statement.
7
Columbia High Yield Municipal Fund
June 30, 2011
(Percentages represent value of investments compared to net assets)
| | | | | | | | | | | | |
Issue
Description | | Coupon
Rate | | | Principal
Amount | | | Value | |
Municipal Bonds (continued) | |
CALIFORNIA (cont.) | |
City of Carson Special Assessment Bonds
District No. 92-1
Series 1992 | |
09/02/22 | | | 7.375 | % | | | $105,000 | | | | $105,090 | |
City of Lincoln Prerefunded 09/01/13 Special Tax Bonds
Community Facilities District
Series 2004-1 | |
|
|
|
09/01/20 | | | 5.750 | % | | | 450,000 | | | | 506,160 | |
09/01/24 | | | 5.900 | % | | | 445,000 | | | | 501,969 | |
City of Upland Certificate of Participation
San Antonio Community Hospital
Series 2011 | |
01/01/41 | | | 6.500 | % | | | 5,000,000 | | | | 5,084,950 | |
County of Sacramento Revenue Bonds
Subordinated Series 2009D | |
07/01/35 | | | 6.000 | % | | | 2,500,000 | | | | 2,601,275 | |
Empire Union School District Special Tax Bonds
Communities Facilities District No. 1987-1
Series 2002A (AMBAC)(f) | |
10/01/21 | | | 0.000 | % | | | 1,665,000 | | | | 894,305 | |
Foothill-Eastern Transportation Corridor Agency
Refunding Revenue Bonds
Series 1999 | |
|
|
01/15/40 | | | 5.750 | % | | | 3,000,000 | | | | 2,591,940 | |
Foothill-Eastern Transportation Corridor Agency(f)
Refunding Revenue Bonds
Capital Appreciation
Series 1999 | |
|
|
|
01/15/30 | | | 0.000 | % | | | 11,520,000 | | | | 3,328,128 | |
Golden State Tobacco Securitization Corp. Prerefunded 06/01/13 Revenue Bonds
Series 2003A-1 | |
06/01/39 | | | 6.750 | % | | | 200,000 | | | | 223,860 | |
Huntington Beach Community Facilities District Special Tax Bonds
Grand Coast Resort No. 2000-1
Series 2001 | |
09/01/31 | | | 6.450 | % | | | 1,250,000 | | | | 1,226,387 | |
Los Angeles Department of Water & Power Revenue Bonds
Power System
Series 2011A | |
07/01/19 | | | 5.000 | % | | | 2,000,000 | | | | 2,325,340 | |
Los Angeles Regional Airports Improvement Corp. Revenue Bonds
Series 2002C AMT(a) | |
12/01/24 | | | 7.500 | % | | | 400,000 | | | | 404,484 | |
M-S-R Energy Authority Revenue Bonds
Series 2009B | |
11/01/39 | | | 6.500 | % | | | 5,000,000 | | | | 5,410,050 | |
| | | | | | | | | | | | |
Issue
Description | | Coupon
Rate | | | Principal
Amount | | | Value | |
Municipal Bonds (continued) | |
CALIFORNIA (cont.) | |
Oakdale Public Financing Authority Tax Allocation Bonds
Central City Redevelopment Project
Series 2004 | |
06/01/33 | | | 5.375 | % | | | $2,000,000 | | | | $1,623,040 | |
Palomar Pomerado Health Certificate of Participation
Series 2010 | |
11/01/41 | | | 6.000 | % | | | 4,500,000 | | | | 4,045,005 | |
Richmond Joint Powers Financing Authority Refunding Revenue Bonds
Lease-Civic Center Project
Series 2009 (AGM) | |
08/01/37 | | | 5.875 | % | | | 3,500,000 | | | | 3,612,210 | |
San Francisco City & County Redevelopment Agency Tax Allocation Bonds
Mission Bay South Redevelopment
Series 2009D | |
08/01/39 | | | 6.625 | % | | | 1,500,000 | | | | 1,497,795 | |
San Joaquin Hills Transportation Corridor Agency Revenue Bonds
Senior Lien
Series 1993 | |
01/01/33 | | | 5.000 | % | | | 5,000,000 | | | | 3,637,650 | |
Southeast Resource Recovery Facilities Authority Revenue Bonds
Series 2003B (AMBAC) AMT(a) | |
12/01/18 | | | 5.375 | % | | | 2,000,000 | | | | 2,066,200 | |
State of California Unlimited General Obligation Bonds
Various Purpose
Series 2007 | |
11/01/37 | | | 5.000 | % | | | 2,475,000 | | | | 2,390,503 | |
Total | | | | | | | | | | | 75,579,727 | |
COLORADO 2.5% | |
Anthem West Metropolitan District Limited Tax General Obligation Bonds
Series 2005 | |
12/01/35 | | | 6.250 | % | | | 1,000,000 | | | | 772,380 | |
Colorado Educational & Cultural Facilities Authority Refunding Revenue Bonds
Student Housing-Campus Village Apartment
Series 2008 | |
06/01/38 | | | 5.500 | % | | | 5,000,000 | | | | 4,869,650 | |
Colorado Health Facilities Authority Revenue Bonds
Christian Living Communities Project
Series 2006A | |
|
|
|
01/01/26 | | | 5.750 | % | | | 500,000 | | | | 461,810 | |
01/01/37 | | | 5.750 | % | | | 1,500,000 | | | | 1,283,190 | |
Covenant Retirement Communities, Inc. Series 2002B | |
|
12/01/33 | | | 6.125 | % | | | 1,000,000 | | | | 972,060 | |
Evangelical Lutheran Series 2009A | |
|
06/01/38 | | | 6.125 | % | | | 5,750,000 | | | | 5,753,450 | |
The Accompanying Notes to Financial Statements are an integral part of this statement.
8
Columbia High Yield Municipal Fund
June 30, 2011
(Percentages represent value of investments compared to net assets)
| | | | | | | | | | | | |
Issue
Description | | Coupon
Rate | | | Principal
Amount | | | Value | |
Municipal Bonds (continued) | |
COLORADO (cont.) | |
E-470 Public Highway Authority Revenue Bonds
Capital Appreciation
Senior Series 2000B (NPFGC)(f) | |
09/01/18 | | | 0.000 | % | | | $4,000,000 | | | | $2,724,800 | |
Red Sky Ranch Metropolitan District Limited General Obligation Bonds
Series 2003 | |
12/01/33 | | | 6.050 | % | | | 1,000,000 | | | | 943,830 | |
Total | | | | | | | | | | | 17,781,170 | |
CONNECTICUT 1.2% | |
Connecticut State Development Authority Revenue Bonds
Alzheimer’s Resource Center Project
Series 2007 | |
|
|
|
08/15/21 | | | 5.400 | % | | | 1,080,000 | | | | 1,001,700 | |
08/15/27 | | | 5.500 | % | | | 1,000,000 | | | | 866,720 | |
Harbor Point Infrastructure Improvement District Tax Allocation Bonds
Harbor Point Project
Series 2010A | |
04/01/39 | | | 7.875 | % | | | 5,000,000 | | | | 5,377,700 | |
Mashantucket Western Pequot Tribe Revenue Bonds
Zero Coupon Subordinated
Series 1999B(b)(f)(g) | |
09/01/15 | | | 0.000 | % | | | 2,000,000 | | | | 611,000 | |
Mohegan Tribe of Indians of Connecticut(b) Revenue Bonds
Public Improvement-Priority Distribution
Series 2001 | |
|
|
|
01/01/31 | | | 6.250 | % | | | 475,000 | | | | 378,998 | |
Series 2003 | |
01/01/33 | | | 5.250 | % | | | 1,000,000 | | | | 687,420 | |
Total | | | | | | | | | | | 8,923,538 | |
DELAWARE 0.2% | |
Centerline Equity Issuer Trust(a)(d) | |
05/15/19 | | | 6.300 | % | | | 1,000,000 | | | | 1,091,280 | |
City of Wilmington Revenue Bonds
Housing-Electra Arms Senior Associates Project
Series 1998 AMT(a)(c) | |
06/01/28 | | | 6.250 | % | | | 780,000 | | | | 671,986 | |
Total | | | | | | | | | | | 1,763,266 | |
DISTRICT OF COLUMBIA 0.1% | |
Resolution Trust Corp. Pass-Through Certificates
Series 1993A(c) | |
12/01/16 | | | 8.500 | % | | | 455,481 | | | | 434,010 | |
FLORIDA 9.9% | |
Ave Maria Stewardship Community District Special Assessment Bonds
Series 2006A | |
05/01/38 | | | 5.125 | % | | | 3,360,000 | | | | 2,517,346 | |
| | | | | | | | | | | | |
Issue
Description | | Coupon
Rate | | | Principal
Amount | | | Value | |
Municipal Bonds (continued) | |
FLORIDA (cont.) | |
Brandy Creek Community Development District Special Assessment Bonds
Series 2003A | |
05/01/34 | | | 6.350 | % | | | $935,000 | | | | $947,155 | |
Broward County Housing Finance Authority Revenue Bonds
Chaves Lake Apartments Project
Series 2000A AMT(a)(c) | |
07/01/40 | | | 7.500 | % | | | 1,500,000 | | | | 1,488,015 | |
Capital Trust Agency(a)(c) Revenue Bonds
Orlando Project
Series 2003 AMT | |
|
|
|
01/01/32 | | | 6.750 | % | | | 650,000 | | | | 584,383 | |
Capital Trust Agency(c) Revenue Bonds
Atlantic Housing Foundation
Subordinated Series 2008B | |
|
|
|
07/15/32 | | | 7.000 | % | | | 1,425,000 | | | | 689,615 | |
Celebration Community Development District Special Assessment Bonds
Series 2003A | |
05/01/34 | | | 6.400 | % | | | 910,000 | | | | 865,965 | |
Channing Park Community Development District Special Assessment Bonds
Series 2007 | |
05/01/38 | | | 5.300 | % | | | 750,000 | | | | 561,315 | |
City of Lakeland(d) | |
Refunding Revenue Bonds
1st Mortgage-Carpenters Accident Investor
Series 2008 | |
|
|
01/01/28 | | | 6.250 | % | | | 675,000 | | | | 637,234 | |
01/01/43 | | | 6.375 | % | | | 2,250,000 | | | | 2,007,247 | |
Colonial Country Club Community Development District Special Assessment Bonds
Series 2003 | |
05/01/33 | | | 6.400 | % | | | 675,000 | | | | 687,677 | |
County of Lee Revenue Bonds
Series 2006A (AMBAC)(a) | |
10/01/17 | | | 5.000 | % | | | 2,010,000 | | | | 2,117,394 | |
County of Miami-Dade Subordinated Revenue Bonds
Capital Appreciation
Series 2009B(f) | |
10/01/41 | | | 0.000 | % | | | 40,000,000 | | | | 4,932,000 | |
Double Branch Community Development District Special Assessment Bonds
Series 2002A | |
05/01/34 | | | 6.700 | % | | | 635,000 | | | | 644,550 | |
Florida Development Finance Corp. Revenue Bonds
Renaissance Charter School
Series 2010A | |
09/15/40 | | | 6.000 | % | | | 3,750,000 | | | | 3,289,800 | |
The Accompanying Notes to Financial Statements are an integral part of this statement.
9
Columbia High Yield Municipal Fund
June 30, 2011
(Percentages represent value of investments compared to net assets)
| | | | | | | | | | | | |
Issue
Description | | Coupon
Rate | | | Principal
Amount | | | Value | |
Municipal Bonds (continued) | |
FLORIDA (cont.) | |
Islands at Doral Southwest Community Development District Special Assessment Bonds
Series 2003 | |
05/01/35 | | | 6.375 | % | | | $725,000 | | | | $797,978 | |
Lee County Industrial Development Authority Refunding Revenue Bonds
Shell PT/Alliance Community Project
Series 2007 | |
11/15/29 | | | 5.000 | % | | | 4,000,000 | | | | 3,176,120 | |
Lexington Oaks Community Development District Special Assessment Bonds
Series 2002A | |
05/01/33 | | | 6.700 | % | | | 250,000 | | | | 253,970 | |
Mid-Bay Bridge Authority Revenue Bonds
Series 2011A | |
10/01/40 | | | 7.250 | % | | | 4,000,000 | | | | 4,053,000 | |
Middle Village Community Development District Special Assessment Bonds
Series 2004A | |
05/01/35 | | | 6.000 | % | | | 2,000,000 | | | | 1,775,800 | |
North Brevard County Hospital District Refunding Revenue Bonds
Parrish Medical Center Project
Series 2008 | |
10/01/38 | | | 5.750 | % | | | 5,000,000 | | | | 5,020,050 | |
Oakmont Grove Community Development District(c)(g) Special Assessment Bonds
Series 2007A | |
|
|
05/01/38 | | | 5.400 | % | | | 1,200,000 | | | | 419,160 | |
Oakmont Grove Community Development District(c)(g) Special Assessment Bonds
Series 2007B
| |
|
|
05/01/12 | | | 5.250 | % | | | 1,000,000 | | | | 349,300 | |
Orange County Health Facilities Authority Refunding Revenue Bonds
Health Care-Orlando Lutheran
Series 2005 | |
|
|
|
07/01/26 | | | 5.700 | % | | | 2,000,000 | | | | 1,742,080 | |
Revenue Bonds
1st Mortgage-Orlando Lutheran Tower
Series 2007 | |
|
|
07/01/32 | | | 5.500 | % | | | 350,000 | | | | 285,740 | |
07/01/38 | | | 5.500 | % | | | 1,750,000 | | | | 1,379,035 | |
Sarasota County Health Facilities Authority Refunding Revenue Bonds
Village on the Isle Project
Series 2007 | |
01/01/32 | | | 5.500 | % | | | 4,000,000 | | | | 3,485,120 | |
Seminole Indian Tribe of Florida Revenue Bonds
Series 2007A(b) | |
10/01/24 | | | 5.500 | % | | | 2,000,000 | | | | 1,850,680 | |
Seven Oaks Community Development District II Special Assessment Bonds
Series 2004A | |
|
|
05/01/35 | | | 5.875 | % | | | 445,000 | | | | 318,598 | |
| | | | | | | | | | | | |
Issue
Description | | Coupon
Rate | | | Principal
Amount | | | Value | |
Municipal Bonds (continued) | |
FLORIDA (cont.) | |
Series 2004B | |
05/01/16 | | | 7.500 | % | | | $3,340,000 | | | | $3,109,774 | |
South Lake County Hospital District Revenue Bonds
South Lake Hospital, Inc.
Series 2003 | |
|
|
|
10/01/28 | | | 6.375 | % | | | 750,000 | | | | 757,485 | |
10/01/34 | | | 6.375 | % | | | 500,000 | | | | 501,960 | |
Series 2010A | |
04/01/39 | | | 6.250 | % | | | 2,000,000 | | | | 1,986,720 | |
St. Johns County Industrial Development Authority Refunding Revenue Bonds
Bayview Project
Series 2007A | |
|
|
|
10/01/41 | | | 5.250 | % | | | 3,725,000 | | | | 2,604,445 | |
Vicars Landing Project Series 2007 | |
|
02/15/27 | | | 5.000 | % | | | 4,030,000 | | | | 3,685,878 | |
Revenue Bonds
Glenmoor Project | |
|
Series 2006A | |
01/01/40 | | | 5.375 | % | | | 4,275,000 | | | | 3,157,942 | |
Sweetwater Creek Community Development District Special Assessment Bonds
Series 2007A(c) | |
05/01/38 | | | 5.500 | % | | | 3,805,000 | | | | 1,712,250 | |
Tolomato Community Development District Special Assessment Bonds
Series 2007 | |
|
|
05/01/17 | | | 6.375 | % | | | 1,765,000 | | | | 1,245,666 | |
05/01/40 | | | 6.650 | % | | | 3,000,000 | | | | 1,810,050 | |
Waterset North Community Development District Special Assessment Bonds
Series 2007A | |
05/01/39 | | | 6.600 | % | | | 1,960,000 | | | | 1,113,339 | |
West Villages Improvement District Special Assessment Bonds
Unit of Development No. 3
Series 2006(c) | |
05/01/37 | | | 5.500 | % | | | 1,645,000 | | | | 733,835 | |
Westchester Community Development District No. 1 Special Assessment Bonds
Community Infrastructure
Series 2003 | |
05/01/35 | | | 6.125 | % | | | 800,000 | | | | 699,312 | |
Westridge Community Development District Special Assessment Bonds
Series 2005(c)(g) | |
05/01/37 | | | 5.800 | % | | | 2,650,000 | | | | 1,006,470 | |
Total | | | | | | | | | | | 71,001,453 | |
GEORGIA 2.8% | |
Columbus Housing Authority Revenue Bonds
Gardens at Calvary Project
Series 1999 | |
11/15/29 | | | 7.000 | % | | | 2,000,000 | | | | 1,729,880 | |
The Accompanying Notes to Financial Statements are an integral part of this statement.
10
Columbia High Yield Municipal Fund
June 30, 2011
(Percentages represent value of investments compared to net assets)
| | | | | | | | | | | | |
Issue
Description | | Coupon
Rate | | | Principal
Amount | | | Value | |
Municipal Bonds (continued) | |
GEORGIA (cont.) | |
DeKalb County Hospital Authority Revenue Bonds
DeKalb Medical Center, Inc. Project
Series 2010 | |
09/01/40 | | | 6.125 | % | | | $4,500,000 | | | | $4,314,060 | |
Fulton County Residential Care Facilities for the Elderly Authority Revenue Bonds
1st Mortgage-Lenbrook Project
Series 2006A | |
|
|
|
07/01/17 | | | 5.000 | % | | | 2,000,000 | | | | 1,784,080 | |
07/01/29 | | | 5.000 | % | | | 3,000,000 | | | | 2,052,240 | |
Canterbury Court Project Series 2004A | |
|
02/15/34 | | | 6.125 | % | | | 1,000,000 | | | | 864,020 | |
Municipal Electric Authority of Georgia Revenue Bonds
Series 1991V | |
|
|
01/01/15 | | | 6.600 | % | | | 75,000 | | | | 85,527 | |
Escrowed to Maturity | |
01/01/18 | | | 6.600 | % | | | 690,000 | | | | 823,156 | |
Rockdale County Development Authority Revenue Bonds
Visy Paper Project
Series 2007A AMT(a) | |
01/01/34 | | | 6.125 | % | | | 6,000,000 | | | | 5,344,380 | |
Savannah Economic Development Authority Revenue Bonds
1st Mortgage-Marshes of Skidaway
Series 2003A | |
|
|
|
01/01/24 | | | 7.400 | % | | | 500,000 | | | | 494,790 | |
01/01/34 | | | 7.400 | % | | | 3,000,000 | | | | 2,873,640 | |
Total | | | | | | | | | | | 20,365,773 | |
GUAM 0.7% | |
Guam Department of Education Certificate of Participation
John F. Kennedy High School
Series 2010A(b) | |
12/01/40 | | | 6.875 | % | | | 4,750,000 | | | | 4,703,450 | |
HAWAII 0.6% | |
Hawaii State Department of Budget & Finance Revenue Bonds
15 Craigside Project
Series 2009A | |
|
|
|
11/15/44 | | | 9.000 | % | | | 2,375,000 | | | | 2,594,782 | |
Hawaiian Electric Co. Subsidiary
Series 2009 | |
|
07/01/39 | | | 6.500 | % | | | 1,750,000 | | | | 1,811,478 | |
Total | | | | | | | | | | | 4,406,260 | |
ILLINOIS 8.7% | |
City of Chicago Revenue Bonds
Asphalt Operating Services- Recovery Zone Facility
Series 2010 | |
|
|
|
12/01/18 | | | 6.125 | % | | | 5,000,000 | | | | 5,083,100 | |
| | | | | | | | | | | | |
Issue
Description | | Coupon
Rate | | | Principal
Amount | | | Value | |
Municipal Bonds (continued) | |
ILLINOIS (cont.) | |
Tax Allocation Bonds
Pilsen Redevelopment
Series 2004B | |
|
|
06/01/22 | | | 6.750 | % | | | $1,225,000 | | | | $1,235,523 | |
Du Page County Special Service Area No. 31 Special Tax Bonds
Monarch Landing Project
Series 2006 | |
03/01/36 | | | 5.625 | % | | | 750,000 | | | | 575,107 | |
Illinois Finance Authority Refunding Revenue Bonds
Chicago Charter School Project
Series 2007 | |
|
|
|
12/01/36 | | | 5.000 | % | | | 1,750,000 | | | | 1,451,887 | |
Lutheran Hillside Village | | | | | | | | | |
Series 2006 | | | | | | | | | |
02/01/26 | | | 5.125 | % | | | 2,000,000 | | | | 1,811,480 | |
Revenue Bonds | | | | | | | | | |
CHF-Normal LLC-Illinois State University | | | | | |
Series 2011 | | | | | | | | | |
04/01/43 | | | 7.000 | % | | | 3,450,000 | | | | 3,537,630 | |
Columbia College | | | | | | | | | |
Series 2007 (NPFGC) | | | | | | | | | |
12/01/37 | | | 5.000 | % | | | 5,000,000 | | | | 4,335,300 | |
Hoosier Care Project | | | | | | | | | |
Series 1999A | | | | | | | | | |
06/01/34 | | | 7.125 | % | | | 1,330,000 | | | | 1,179,790 | |
Provena Health | | | | | | | | | |
Series 2009A | | | | | | | | | |
08/15/34 | | | 7.750 | % | | | 4,000,000 | | | | 4,377,320 | |
Riverside Health System | | | | | | | | | |
Series 2009 | | | | | | | | | |
11/15/35 | | | 6.250 | % | | | 3,000,000 | | | | 3,108,420 | |
Sedgebrook, Inc. Facility | | | | | | | | | |
Series 2003A | | | | | | | | | |
11/15/32 | | | 7.000 | % | | | 1,000,000 | | | | 897,310 | |
Silver Cross & Medical Centers | | | | | |
Series 2009 | | | | | | | | | |
08/15/44 | | | 7.000 | % | | | 5,000,000 | | | | 5,174,500 | |
Smith Village Project | | | | | | | | | |
Series 2005A | | | | | | | | | |
11/15/35 | | | 6.250 | % | | | 2,750,000 | | | | 2,281,400 | |
Illinois Finance Authority(a) | | | | | | | | | |
Revenue Bonds | | | | | | | | | |
People’s Gas Light & Coke Co. | | | | | |
Series 2003 (AMBAC) AMT | | | | | |
11/01/38 | | | 4.875 | % | | | 2,500,000 | | | | 2,559,700 | |
Illinois Finance Authority(c)(g) | | | | | | | | | |
Revenue Bonds | | | | | | | | | |
Leafs Hockey Club Project | | | | | |
Series 2007A | | | | | |
03/01/37 | | | 6.000 | % | | | 1,000,000 | | | | 248,750 | |
Monarch Landing, Inc. Facility | | | | | |
Series 2007A | | | | | | | | | |
12/01/27 | | | 7.000 | % | | | 1,383,250 | | | | 14 | |
The Accompanying Notes to Financial Statements are an integral part of this statement.
11
Columbia High Yield Municipal Fund
June 30, 2011
(Percentages represent value of investments compared to net assets)
| | | | | | | | | | | | |
Issue
Description | | Coupon
Rate | | | Principal
Amount | | | Value | |
Municipal Bonds (continued) | |
ILLINOIS (cont.) | | | | | | | | | |
Sedgebrook, Inc. Facility | | | | | | | | | |
Series 2007A | | | | | | | | | |
11/15/37 | | | 6.000 | % | | | $3,806,608 | | | | $85,649 | |
11/15/42 | | | 6.000 | % | | | 1,522,643 | | | | 34,259 | |
Metropolitan Pier & Exposition Authority Refunding Revenue Bonds
McCormick
Series 2010B-2 | | | | | |
06/15/50 | | | 5.000 | % | | | 5,000,000 | | | | 4,511,950 | |
Plano Special Service Area No. 4 Special Tax Bonds
Lakewood Springs Project Unit 5
Series 2005 B | | | | | |
03/01/35 | | | 6.000 | % | | | 2,922,000 | | | | 2,703,318 | |
Railsplitter Tobacco Settlement Authority Revenue Bonds
Series 2010 | | | | | |
06/01/28 | | | 6.000 | % | | | 5,000,000 | | | | 5,070,600 | |
Southwestern Illinois Development Authority | | | | | |
Revenue Bonds | | | | | | | | | |
Anderson Hospital | | | | | | | | | |
Series 1999 | | | | | | | | | |
08/15/29 | | | 5.625 | % | | | 250,000 | | | | 241,580 | |
Series 2006 | | | | | | | | | |
08/15/26 | | | 5.125 | % | | | 1,245,000 | | | | 1,155,123 | |
Village of Annawan Tax Allocation Bonds
Patriot Renewable Fuels LLC Project
Series 2007 | | | | | |
01/01/18 | | | 5.625 | % | | | 3,590,000 | | | | 2,914,111 | |
Village of Bolingbrook Sales Tax Revenue Bonds
Series 2005 | | | | | |
01/01/24 | | | 6.250 | % | | | 1,500,000 | | | | 992,385 | |
Village of Hillside Tax Allocation Bonds
Senior Lien-Mannheim Redevelopment Project
Series 2008 | | | | | |
01/01/28 | | | 7.000 | % | | | 2,500,000 | | | | 2,233,325 | |
Village of Lincolnshire Special Tax Bonds
Sedebrook Project
Series 2004 | | | | | |
03/01/34 | | | 6.250 | % | | | 750,000 | | | | 639,810 | |
Village of Rosemont Tax Allocation Bonds
River Road Hotel Parntners Project
Series 2007 | | | | | |
12/30/23 | | | 5.100 | % | | | 2,800,000 | | | | 2,188,116 | |
Volo Village Special Service Area No. 3 Special Tax Bonds
Symphony Meadows Project
Series 2006-1 | | | | | |
03/01/36 | | | 6.000 | % | | | 1,993,000 | | | | 1,550,634 | |
| | | | | | | | | | | | |
Issue
Description | | Coupon
Rate | | | Principal
Amount | | | Value | |
Municipal Bonds (continued) | |
ILLINOIS (cont.) | | | | | | | | | |
Will-Kankakee Regional Development Authority Prerefunded 12/15/11 Revenue Bonds
Flanders Corp./PrecisionAire
Series 1997 AMT(a)(c) | | | | | |
12/15/17 | | | 6.500 | % | | | $495,000 | | | | $507,236 | |
Total | | | | | | | | | | | 62,685,327 | |
INDIANA 0.9% | | | | | | | | | |
City of Petersburg Refunding Revenue Bonds
Industry Power & Light
Series 1991 | | | | | |
08/01/21 | | | 5.750 | % | | | 1,000,000 | | | | 1,012,630 | |
City of Portage Tax Allocation Bonds
Ameriplex Project
Series 2006 | | | | | |
07/15/23 | | | 5.000 | % | | | 700,000 | | | | 692,503 | |
Indiana Health & Educational Facilities Financing Authority | |
Revenue Bonds
Baptist Homes of Indiana
Series 2005 | | | | | | | | | |
11/15/35 | | | 5.250 | % | | | 2,750,000 | | | | 2,523,593 | |
Schneck Memorial Hospital Project Series 2006A | | | | | |
02/15/30 | | | 5.250 | % | | | 1,000,000 | | | | 942,140 | |
Indiana Health Facility Financing Authority | |
Revenue Bonds
Hoosier Care Project
Series 1999A | | | | | | | | | |
06/01/34 | | | 7.125 | % | | | 1,085,000 | | | | 962,460 | |
Total | | | | | | | | | | | 6,133,326 | |
IOWA 0.8% | | | | | | | | | |
City of Marion Refunding Revenue Bonds
1st Mortgage
Series 2003 | | | | | | | | | |
01/01/29 | | | 8.000 | % | | | 268,000 | | | | 261,777 | |
Iowa Finance Authority | | | | | | | | | |
Refunding Revenue Bonds | | | | | | | | | |
Care Initiatives Project Series 1996 | | | | | | | | | |
07/01/25 | | | 9.250 | % | | | 405,000 | | | | 417,239 | |
Revenue Bonds | | | | | | | | | |
Care Initiatives Project Series 1998B | | | | | | | | | |
07/01/18 | | | 5.750 | % | | | 505,000 | | | | 465,923 | |
07/01/28 | | | 5.750 | % | | | 1,475,000 | | | | 1,194,071 | |
Deerfield Retirement Community, Inc. Series 2007A | | | | | |
11/15/15 | | | 5.000 | % | | | 2,210,000 | | | | 1,953,397 | |
11/15/27 | | | 5.500 | % | | | 1,135,000 | | | | 816,235 | |
11/15/37 | | | 5.500 | % | | | 750,000 | | | | 491,678 | |
Total | | | | | | | | | | | 5,600,320 | |
The Accompanying Notes to Financial Statements are an integral part of this statement.
12
Columbia High Yield Municipal Fund
June 30, 2011
(Percentages represent value of investments compared to net assets)
| | | | | | | | | | | | |
Issue
Description | | Coupon
Rate | | | Principal
Amount | | | Value | |
Municipal Bonds (continued) | |
KANSAS 3.1% | | | | | | | | | |
City of Lenexa | | | | | | | | | |
Improvement Refunding Revenue Bonds | | | | | |
Series 2007 | | | | | | | | | |
05/15/39 | | | 5.500 | % | | | $4,250,000 | | | | $3,099,950 | |
Revenue Bonds | | | | | | | | | |
Lakeview Village, Inc. Project | | | | | |
Series 2009 | | | | | | | | | |
05/15/29 | | | 7.125 | % | | | 500,000 | | | | 466,775 | |
05/15/39 | | | 7.250 | % | | | 1,500,000 | | | | 1,387,470 | |
City of Manhattan | | | | | | | | | |
Revenue Bonds | | | | | | | | | |
Meadowlark Hills Retirement | | | | | |
Series 2007A | | | | | | | | | |
05/15/24 | | | 5.000 | % | | | 3,000,000 | | | | 2,571,390 | |
05/15/29 | | | 5.000 | % | | | 2,680,000 | | | | 2,164,153 | |
Wichita Airport Authority Special Revenue Bonds
Cessna Citation Service Center
Series 2002A AMT (a) | | | | | |
06/15/32 | | | 6.250 | % | | | 1,875,000 | | | | 1,655,944 | |
Wyandotte County-Kansas City Unified Government | | | | | |
Refunding Revenue Bonds | | | | | | | | | |
Sales Tax-2nd Lien-Area B | | | | | | | | | |
Series 2005 | | | | | | | | | |
12/01/20 | | | 5.000 | % | | | 2,595,000 | | | | 2,655,775 | |
Revenue Bonds | | | | | | | | | |
Legends Village West Project | | | | | |
Series 2006 | | | | | | | | | |
10/01/28 | | | 4.875 | % | | | 2,020,000 | | | | 1,504,132 | |
Wyandotte County-Kansas City Unified Government(f) | | | | | |
Revenue Bonds | | | | | | | | | |
Capital Appreciation Sales Tax Subordinated Lien | | | | | |
Series 2010 | | | | | | | | | |
06/01/21 | | | 0.000 | % | | | 11,475,000 | | | | 6,432,541 | |
Total | | | | | | | | | | | 21,938,130 | |
KENTUCKY 0.3% | | | | | | | | | |
Kentucky Economic Development Finance Authority | | | | | |
Refunding Revenue Bonds | | | | | | | | | |
1st Mortgage-AHF/KY-IA, Inc. Project | | | | | |
Series 2003 | | | | | | | | | |
01/01/29 | | | 8.000 | % | | | 822,000 | | | | 802,913 | |
Revenue Bonds | | | | | | | | | |
Louisville Arena | | | | | | | | | |
Subordinated Series 2008A-1 (AGM) | | | | | |
12/01/38 | | | 6.000 | % | | | 1,150,000 | | | | 1,180,671 | |
Total | | | | | | | | | | | 1,983,584 | |
LOUISIANA 3.0% | | | | | | | | | |
Louisiana Local Government Environmental Facilities & Community Development Authority
Revenue Bonds
Westlake Chemical Corp.
Series 2010A-2 | | | | | |
11/01/35 | | | 6.500 | % | | | 5,000,000 | | | | 5,175,100 | |
| | | | | | | | | | | | |
Issue
Description | | Coupon
Rate | | | Principal
Amount | | | Value | |
Municipal Bonds (continued) | |
LOUISIANA (cont.) | | | | | | | | | |
Louisiana Public Facilities Authority | | | | | |
Revenue Bonds | | | | | | | | | |
Ochsner Clinic Foundation Project | | | | | |
Series 2007A | | | | | | | | | |
05/15/38 | | | 5.250 | % | | | $5,000,000 | | | | $4,358,500 | |
Touro Infirmary Project | | | | | | | | | |
Series 1999A | | | | | | | | | |
08/15/19 | | | 5.500 | % | | | 510,000 | | | | 509,995 | |
08/15/29 | | | 5.625 | % | | | 240,000 | | | | 225,331 | |
Louisiana Public Facilities Authority(c) | | | | | |
Revenue Bonds | | | | | | | | | |
Progressive Healthcare | | | | | | | | | |
Series 1998 | | | | | | | | | |
10/01/28 | | | 6.375 | % | | | 2,000,000 | | | | 1,543,760 | |
New Orleans Aviation Board Revenue Bonds Consolidated Rental Car
Series 2009A | | | | | |
01/01/40 | | | 6.500 | % | | | 5,000,000 | | | | 5,106,900 | |
Parish of St. John the Baptist Revenue Bonds
Marathon Oil Corp.
Series 2007A | | | | | |
06/01/37 | | | 5.125 | % | | | 5,000,000 | | | | 4,766,950 | |
Total | | | | | | | | | | | 21,686,536 | |
MARYLAND 0.8% | | | | | | | | | |
City of Westminster Revenue Bonds
Carroll Lutheran Village Series 2004A | | | | | | | | | |
05/01/34 | | | 6.250 | % | | | 1,750,000 | | | | 1,486,362 | |
Maryland Economic Development Corp. | | | | | |
Refunding Revenue Bonds | | | | | | | | | |
CNX Marine Terminals, Inc. | | | | | | | | | |
Series 2010 | | | | | | | | | |
09/01/25 | | | 5.750 | % | | | 1,000,000 | | | | 977,390 | |
Revenue Bonds | | | | | | | | | |
University of Maryland-College Park Projects | | | | | |
Series 2008 | | | | | | | | | |
06/01/43 | | | 5.875 | % | | | 2,735,000 | | | | 2,725,072 | |
Munimae TE Bond Subsidiary LLC(a)(c)(d) | | | | | |
06/30/49 | | | 5.800 | % | | | 1,000,000 | | | | 680,010 | |
Total | | | | | | | | | | | 5,868,834 | |
MASSACHUSETTS 3.9% | | | | | | | | | |
Massachusetts Development Finance Agency | | | | | |
Refunding Revenue Bonds | | | | | | | | | |
1st Mortgage-VOA Concord | | | | | | | | | |
Series 2007 | | | | | | | | | |
11/01/41 | | | 5.200 | % | | | 1,000,000 | | | | 670,160 | |
Revenue Bonds | | | | | | | | | |
Boston Biomedical Research | | | | | |
Series 1999 | | | | | | | | | |
02/01/19 | | | 5.650 | % | | | 310,000 | | | | 303,890 | |
02/01/29 | | | 5.750 | % | | | 375,000 | | | | 328,838 | |
Foxborough Regional Charter School | | | | | |
Series 2010A | | | | | | | | | |
07/01/42 | | | 7.000 | % | | | 4,200,000 | | | | 4,264,302 | |
The Accompanying Notes to Financial Statements are an integral part of this statement.
13
Columbia High Yield Municipal Fund
June 30, 2011
(Percentages represent value of investments compared to net assets)
| | | | | | | | | | | | |
Issue
Description | | Coupon
Rate | | | Principal
Amount | | | Value | |
Municipal Bonds (continued) | |
MASSACHUSETTS (cont.) | | | | | | | | | |
Groves-Lincoln | | | | | | | | | |
Series 2009A | | | | | | | | | |
06/01/44 | | | 7.875 | % | | | $1,500,000 | | | | $1,502,730 | |
Series 2009B-1 | | | | | | | | | |
06/01/16 | | | 7.250 | % | | | 3,500,000 | | | | 3,500,070 | |
Massachusetts Development Finance Agency(a) | | | | | |
Revenue Bonds | | | | | | | | | |
Ogden Haverhill | | | | | | | | | |
Series 1999A-RMKT AMT | | | | | | | | | |
12/01/14 | | | 6.700 | % | | | 235,000 | | | | 235,738 | |
Massachusetts Development Finance Agency(c) | | | | | |
Revenue Bonds | | | | | | | | | |
Health Care Facility-Alliance | | | | | |
Series 1999A | | | | | | | | | |
07/01/32 | | | 7.100 | % | | | 2,035,000 | | | | 1,794,097 | |
Linden Ponds, Inc. Facility | | | | | | | | | |
Series 2007A | | | | | | | | | |
11/15/27 | | | 5.500 | % | | | 3,000,000 | | | | 1,739,400 | |
11/15/35 | | | 5.750 | % | | | 900,000 | | | | 503,820 | |
11/15/42 | | | 5.750 | % | | | 3,530,000 | | | | 1,887,844 | |
Massachusetts Educational Financing Authority Revenue Bonds
Series 2008H (AGM) AMT(a) | | | | | |
01/01/30 | | | 6.350 | % | | | 3,050,000 | | | | 3,188,439 | |
Massachusetts Health & Educational Facilities Authority | |
Prerefunded 12/15/12 Revenue Bonds | | | | | |
Civic Investments | | | | | | | | | |
Series 2002A | | | | | | | | | |
12/15/15 | | | 9.000 | % | | | 1,100,000 | | | | 1,224,080 | |
Revenue Bonds | | | | | | | | | |
Boston Medical Center Project | | | | | |
Series 2008 | | | | | | | | | |
07/01/38 | | | 5.250 | % | | | 5,000,000 | | | | 4,231,700 | |
Milford Regional Medical | | | | | | | | | |
Series 2007E | | | | | | | | | |
07/15/32 | | | 5.000 | % | | | 1,250,000 | | | | 1,068,437 | |
Massachusetts Housing Finance Agency Revenue Bonds
Housing
Series 2005E AMT(a) | | | | | |
12/01/28 | | | 5.000 | % | | | 185,000 | | | | 182,454 | |
Massachusetts Industrial Finance Agency Refunding Revenue Bonds
Ogden Haverhill Project
Series 1998A AMT(a) | | | | | |
12/01/19 | | | 5.600 | % | | | 1,000,000 | | | | 1,002,850 | |
Total | | | | | | | | | | | 27,628,849 | |
MICHIGAN 4.0% | | | | | | | | | |
County of Wayne Limited General Obligation Bonds
Building Improvement
Series 2009A | | | | | |
11/01/39 | | | 6.750 | % | | | 4,950,000 | | | �� | 5,106,519 | |
Garden City Hospital Finance Authority Refunding Revenue Bonds
Garden City Hospital Obligation
Series 2007A | | | | | |
08/15/38 | | | 5.000 | % | | | 2,250,000 | | | | 1,545,345 | |
| | | | | | | | | | | | |
Issue
Description | | Coupon
Rate | | | Principal
Amount | | | Value | |
Municipal Bonds (continued) | |
MICHIGAN (cont.) | | | | | | | | | |
Global Preparatory Academy Refunding Revenue Bonds
Series 2007 | | | | | |
11/01/26 | | | 5.000 | % | | | $2,445,000 | | | | $1,852,894 | |
Michigan State Hospital Finance Authority | | | | | |
Refunding Revenue Bonds | | | | | | | | | |
Henry Ford Health System | | | | | | | | | |
Series 2006A | | | | | | | | | |
11/15/46 | | | 5.250 | % | | | 3,000,000 | | | | 2,658,360 | |
Oakwood Obligation Group | | | | | | | | | |
Series 2007A | | | | | | | | | |
07/15/37 | | | 5.000 | % | | | 5,000,000 | | | | 4,417,000 | |
Revenue Bonds | | | | | | | | | |
McLaren Health Care | | | | | | | | | |
Series 2005C | | | | | | | | | |
08/01/35 | | | 5.000 | % | | | 2,500,000 | | | | 2,382,175 | |
Michigan Strategic Fund Refunding Revenue Bonds
Michigan Sugar Co.- Carollton
Series 1998C AMT(a)(c) | | | | | |
11/01/25 | | | 6.550 | % | | | 1,500,000 | | | | 1,275,285 | |
Michigan Tobacco Settlement Finance Authority | | | | | |
Revenue Bonds | | | | | | | | | |
Senior Series 2007A | | | | | | | | | |
06/01/34 | | | 6.000 | % | | | 1,000,000 | | | | 759,180 | |
06/01/48 | | | 6.000 | % | | | 11,000,000 | | | | 8,006,900 | |
Summit Academy North Refunding Revenue Bonds
Series 2005 | | | | | |
11/01/35 | | | 5.500 | % | | | 750,000 | | | | 548,393 | |
Total | | | | | | | | | | | 28,552,051 | |
MINNESOTA 2.1% | | | | | | | | | |
City of Columbia Heights | | | | | | | | | |
Refunding Revenue Bonds | | | | | | | | | |
Crest View Corp. Projects | | | | | | | | | |
Series 2007A | | | | | | | | | |
07/01/27 | | | 5.550 | % | | | 1,000,000 | | | | 797,630 | |
07/01/42 | | | 5.700 | % | | | 2,000,000 | | | | 1,471,620 | |
City of Eveleth Refunding Revenue Bonds
Arrowhead Senior Living Community
Series 2007 | | | | | |
10/01/27 | | | 5.200 | % | | | 2,375,000 | | | | 1,842,288 | |
City of Minneapolis Revenue Bonds
Riverton Community Housing Project
Series 2006A | | | | | |
08/01/40 | | | 5.700 | % | | | 1,600,000 | | | | 1,286,320 | |
City of Roseville Revenue Bonds
Care Institute, Inc. Project
Series 1993(c) | | | | | |
11/01/23 | | | 7.750 | % | | | 1,270,000 | | | | 996,696 | |
The Accompanying Notes to Financial Statements are an integral part of this statement.
14
Columbia High Yield Municipal Fund
June 30, 2011
(Percentages represent value of investments compared to net assets)
| | | | | | | | | | | | |
Issue
Description | | Coupon
Rate | | | Principal
Amount | | | Value | |
Municipal Bonds (continued) | |
MINNESOTA (cont.) | | | | | | | | | |
City of Sartell | | | | | | | | | |
Revenue Bonds | | | | | | | | | |
Foundation for Healthcare Project | | | | | |
Series 1999A | | | | | | | | | |
09/01/29 | | | 6.625 | % | | | $2,000,000 | | | | $1,962,940 | |
Series 2001A | | | | | | | | | |
09/01/30 | | | 8.000 | % | | | 955,000 | | | | 975,303 | |
Minneapolis & St Paul Housing & Redevelopment Authority
Revenue Bonds
HealthPartners Obligation Group Project
Series 2003 | |
12/01/29 | | | 5.875 | % | | | 400,000 | | | | 406,772 | |
Minneapolis/St Paul Housing Finance Board Revenue Bonds
Mortgage-Backed Securities Program-Cityliving
Series 2006A-2 (GNMA/FNMA) AMT(a) | | | | | |
12/01/38 | | | 5.000 | % | | | 77,292 | | | | 74,486 | |
St. Paul Housing & Redevelopment Authority | | | | | |
Revenue Bonds | | | | | | | | | |
Healtheast Project | | | | | | | | | |
Series 2005 | | | | | | | | | |
11/15/30 | | | 6.000 | % | | | 4,000,000 | | | | 3,653,840 | |
11/15/35 | | | 6.000 | % | | | 2,000,000 | | | | 1,780,280 | |
Total | | | | | | | | | | | 15,248,175 | |
MISSISSIPPI 0.6% | | | | | | | | | |
County of Lowndes | | | | | | | | | |
Refunding Revenue Bonds | | | | | | | | | |
Weyerhaeuser Co. Project | | | | | | | | | |
Series 1992A | | | | | | | | | |
04/01/22 | | | 6.800 | % | | | 1,995,000 | | | | 2,101,453 | |
Series 1992B | | | | | | | | | |
04/01/22 | | | 6.700 | % | | | 230,000 | | | | 240,552 | |
County of Warren Revenue Bonds
International Paper Co.
Series 2008A | | | | | | | | | |
09/01/32 | | | 6.500 | % | | | 2,000,000 | | | | 2,082,400 | |
Rankin County Five Lakes Utility District
Series 1994(c) | | | | | |
07/15/37 | | | 7.000 | % | | | 250,000 | | | | 216,733 | |
Total | | | | | | | | | | | 4,641,138 | |
MISSOURI 4.6% | | | | | | | | | |
Cape Girardeau County Industrial Development Authority Revenue Bonds
Southeast Missouri Hospital Association
Series 2007 | |
06/01/27 | | | 5.000 | % | | | 3,750,000 | | | | 3,426,150 | |
City of Fenton Refunding Tax Allocation Bonds
Gravois Bluffs Redevelopment Project
Series 2006 | | | | | |
04/01/21 | | | 4.500 | % | | | 245,000 | | | | 246,580 | |
| | | | | | | | | | | | |
Issue
Description | | Coupon
Rate | | | Principal
Amount | | | Value | |
Municipal Bonds (continued) | |
MISSOURI (cont.) | | | | | | | | | |
City of Kansas City | | | | | | | | | |
Tax Allocation Bonds | | | | | | | | | |
Kansas City-Maincor Project | | | | | |
Series 2007A | | | | | | | | | |
03/01/18 | | | 5.250 | % | | | $1,000,000 | | | | $973,620 | |
Shoal Creek Parkway Project | | | | | |
Series 2011 | | | | | | | | | |
06/01/25 | | | 6.500 | % | | | 3,100,000 | | | | 3,069,062 | |
City of Manchester Refunding Tax Allocation Bonds
Highway 141/Manchester Road Project
Series 2010 | | | | | |
11/01/39 | | | 6.875 | % | | | 5,000,000 | | | | 5,054,600 | |
City of Riverside Tax Allocation Bonds
L-385 Levee Project
Series 2004 | |
05/01/20 | | | 5.250 | % | | | 1,275,000 | | | | 1,310,075 | |
Grundy County Industrial Development Authority Revenue Bonds
Wright Memorial Hospital
Series 2009 | | | | | |
09/01/34 | | | 6.750 | % | | | 2,250,000 | | | | 2,241,878 | |
Kirkwood Industrial Development Authority Revenue Bonds
Aberdeen Heights
Series 2010A | | | | | |
05/15/45 | | | 8.250 | % | | | 4,500,000 | | | | 4,607,100 | |
Saline County Industrial Development Authority Revenue Bonds
John Fitzgibbon Memorial Hospital, Inc.
Series 2005 | | | | | |
12/01/35 | | | 5.625 | % | | | 5,485,000 | | | | 4,386,903 | |
St. Louis County Industrial Development Authority | | | | | |
Refunding Revenue Bonds | | | | | | | | | |
Ranken Jordan Project | | | | | | | | | |
Series 2007 | | | | | | | | | |
11/15/35 | | | 5.000 | % | | | 1,300,000 | | | | 989,261 | |
Revenue Bonds | | | | | | | | | |
St. Andrews Residence for Seniors | |
Series 2007A | | | | | | | | | |
12/01/26 | | | 6.250 | % | | | 2,000,000 | | | | 1,841,200 | |
12/01/41 | | | 6.375 | % | | | 3,000,000 | | | | 2,606,280 | |
St. Louis Industrial Development Authority Revenue Bonds
Convention Center Hotel
Series 2000 (AMBAC)(f) | | | | | |
07/15/18 | | | 0.000 | % | | | 3,000,000 | | | | 1,925,940 | |
Total | | | | | | | | | | | 32,678,649 | |
MONTANA 0.1% | | | | | | | | | |
Montana Facility Finance Authority Revenue Bonds
Senior Living-St. John’s Lutheran
Series 2006A | | | | | |
05/15/36 | | | 6.125 | % | | | 1,000,000 | | | | 850,080 | |
The Accompanying Notes to Financial Statements are an integral part of this statement.
15
Columbia High Yield Municipal Fund
June 30, 2011
(Percentages represent value of investments compared to net assets)
| | | | | | | | | | | | |
Issue
Description | | Coupon
Rate | | | Principal
Amount | | | Value | |
Municipal Bonds (continued) | |
NEVADA 0.6% | | | | | | | | | |
City of Sparks Senior Sales Tax Anticipation Revenue Bonds
Series 2008A(d) | | | | | |
06/15/28 | | | 6.750 | % | | | $5,000,000 | | | | $4,158,850 | |
NEW HAMPSHIRE —% | | | | | | | | | |
New Hampshire Business Finance Authority Revenue Bonds
Pennichuck Water Works, Inc. Project
Escrowed to Maturity Series 1988 AMT(a) | | | | | |
07/01/18 | | | 7.500 | % | | | 210,000 | | | | 246,937 | |
NEW JERSEY 2.8% | | | | | | | | | |
Middlesex County Improvement Authority(g)
Subordinated Revenue Bonds | | | | | |
Heldrich Center Hotel Series 2005B | | | | | |
01/01/25 | | | 6.125 | % | | | 2,750,000 | | | | 270,875 | |
01/01/37 | | | 6.250 | % | | | 6,450,000 | | | | 635,325 | |
Middlesex County Improvement Authority(c)(g) | | | | | |
Revenue Bonds | | | | | | | | | |
Heldrich Center Hotel | | | | | | | | | |
Series 2005C | | | | | | | | | |
01/01/37 | | | 8.750 | % | | | 1,250,000 | | | | 127,000 | |
New Jersey Economic Development Authority | | | | | |
Refunding Revenue Bonds | | | | | | | | | |
Seabrook Village, Inc. Facility | | | | | |
Series 2006 | | | | | | | | | |
11/15/36 | | | 5.250 | % | | | 2,250,000 | | | | 1,778,783 | |
Revenue Bonds | | | | | | | | | |
1st Mortgage-Seashore Gardens Project | | | | | |
Series 2006 | | | | | | | | | |
11/01/26 | | | 5.300 | % | | | 500,000 | | | | 395,605 | |
Cigarette Tax | | | | | | | | | |
Series 2004 | | | | | | | | | |
06/15/29 | | | 5.750 | % | | | 1,000,000 | | | | 942,350 | |
New Jersey Economic Development Authority(a) | | | | | |
Refunding Revenue Bonds | | | | | | | | | |
Series 2006B AMT | |
01/01/37 | | | 6.875 | % | | | 4,000,000 | | | | 3,548,960 | |
Revenue Bonds
Continental Airlines, Inc. Project
| |
Series 1999 AMT | |
09/15/19 | | | 6.250 | % | | | 1,000,000 | | | | 986,540 | |
09/15/29 | | | 6.250 | % | | | 2,500,000 | | | | 2,352,350 | |
Series 2003 AMT | |
06/01/33 | | | 9.000 | % | | | 1,000,000 | | | | 1,038,420 | |
New Jersey Health Care Facilities Financing Authority Revenue Bonds
St. Josephs Healthcare System
| |
Series 2008 | |
07/01/18 | | | 6.000 | % | | | 2,000,000 | | | | 2,165,400 | |
St. Josephs Healthcare Systems Series 2008 | |
07/01/38 | | | 6.625 | % | | | 3,000,000 | | | | 3,022,500 | |
Tobacco Settlement Financing Corp.
Prerefunded 06/01/13 Revenue Bonds
| |
Series 2003 | |
06/01/39 | | | 6.750 | % | | | 2,000,000 | | | | 2,240,940 | |
| | | | | | | | | | | | |
Issue
Description | | Coupon
Rate | | | Principal
Amount | | | Value | |
Municipal Bonds (continued) | |
NEW JERSEY (cont.) | | | | | | | | | |
Tobacco Settlement Financing Corp.(f)
Revenue Bonds
Capital Appreciation
| |
Series 2007-1C | |
06/01/41 | | | 0.000 | % | | | $7,500,000 | | | | $296,025 | |
Total | | | | | | | | | | | 19,801,073 | |
NEW YORK 4.0% | |
Broome County Industrial Development Agency Revenue Bonds
Good Shepard Village
| |
Series 2008A | |
07/01/40 | | | 6.875 | % | | | 4,000,000 | | | | 3,778,800 | |
East Rochester Housing Authority Refunding Revenue Bonds
Senior Living-Woodland Village Project
| |
Series 2006 | |
08/01/33 | | | 5.500 | % | | | 1,700,000 | | | | 1,346,451 | |
Huntington Housing Authority Revenue Bonds
Gurwin Jewish Senior Residences
| |
Series 1999A | |
05/01/19 | | | 5.875 | % | | | 1,600,000 | | | | 1,554,160 | |
05/01/29 | | | 6.000 | % | | | 625,000 | | | | 571,544 | |
Nassau County Tobacco Settlement Corp. Asset-Backed Revenue Bonds
Capital Appreciation
| |
Third Series 2006D(f) | |
06/01/60 | | | 0.000 | % | | | 25,000,000 | | | | 150,500 | |
New York City Industrial Development Agency(a) Revenue Bonds
American Airlines-JFK International Airport
| |
Series 2005 AMT | |
08/01/25 | | | 7.625 | % | | | 3,000,000 | | | | 3,087,930 | |
08/01/28 | | | 8.000 | % | | | 2,000,000 | | | | 2,069,020 | |
New York Liberty Development Corp. Revenue Bonds
National Sports Museum Project
| |
Series 2006A(c)(d)(g) | |
02/15/19 | | | 6.125 | % | | | 1,979,996 | | | | 20 | |
New York State Dormitory Authority Revenue Bonds
NYU Hospital Center
| |
Series 2007B | |
07/01/37 | | | 5.625 | % | | | 2,000,000 | | | | 2,013,640 | |
Series 2011A | |
07/01/40 | | | 6.000 | % | | | 1,000,000 | | | | 1,023,020 | |
The New School Series 2010 | |
07/01/50 | | | 6.000 | % | | | 5,000,000 | | | | 5,229,800 | |
Port Authority of New York & New Jersey Revenue Bonds
JFK International Air Terminal
| |
Series 2010 | |
12/01/42 | | | 6.000 | % | | | 1,350,000 | | | | 1,364,229 | |
The Accompanying Notes to Financial Statements are an integral part of this statement.
16
Columbia High Yield Municipal Fund
June 30, 2011
(Percentages represent value of investments compared to net assets)
| | | | | | | | | | | | |
Issue
Description | | Coupon
Rate | | | Principal
Amount | | | Value | |
Municipal Bonds (continued) | |
NEW YORK (cont.) | |
Port Authority of New York & New Jersey(a) Revenue Bonds
4th Installment-Special Project-Kiac | |
Series 1996-4 AMT | |
10/01/11 | | | 6.750 | % | | | $800,000 | | | | $798,576 | |
5th Installment-Special Project | |
Series 1996-4 AMT | |
10/01/19 | | | 6.750 | % | | | 120,000 | | | | 110,792 | |
Seneca County Industrial Development Agency Revenue Bonds
Seneca Meadows, Inc. Project | |
Series 2005 AMT(a)(h) | |
10/01/35 | | | 6.625 | % | | | 5,000,000 | | | | 5,000,250 | |
Suffolk County Industrial Development Agency Revenue Bonds
Gurwin Jewish-Phase II | |
Series 2004 | |
05/01/39 | | | 6.700 | % | | | 485,000 | | | | 462,210 | |
Total | | | | | | | | | | | 28,560,942 | |
NORTH CAROLINA 1.3% | |
Durham Housing Authority Revenue Bonds | |
Series 2005 AMT(a)(c)(d) | |
02/01/38 | | | 5.650 | % | | | 3,220,625 | | | | 2,775,857 | |
North Carolina Eastern Municipal Power Agency Revenue Bonds
Escrowed to Maturity | |
Series 1991A | |
01/01/18 | | | 6.500 | % | | | 3,320,000 | | | | 4,268,823 | |
North Carolina Medical Care Commission Revenue Bonds
Health Care Housing Arc Projects | |
Series 2004A | |
10/01/34 | | | 5.800 | % | | | 1,550,000 | | | | 1,524,580 | |
Stanly Memorial Hospital Project Series 1999 | |
10/01/29 | | | 6.375 | % | | | 1,000,000 | | | | 1,000,270 | |
Total | | | | | | | | | | | 9,569,530 | |
NORTH DAKOTA 0.4% | |
City of Fargo Revenue Bonds
Sanford | |
Series 2011 | |
11/01/31 | | | 6.250 | % | | | 2,500,000 | | | | 2,672,550 | |
OHIO 1.9% | | | | | | | | | |
Buckeye Tobacco Settlement Financing Authority Asset-Backed Revenue Bonds
Senior Turbo Series 2007A-2 | |
06/01/24 | | | 5.125 | % | | | 7,000,000 | | | | 5,739,860 | |
Cleveland-Cuyahoga County Port Authority Revenue Bonds
Fairmount Montessori Association
Series 2005B (Fifth Third Bank) | |
05/15/25 | | | 5.125 | % | | | 655,000 | | | | 556,724 | |
| | | | | | | | | | | | |
Issue
Description | | Coupon
Rate | | | Principal
Amount | | | Value | |
Municipal Bonds (continued) | |
OHIO (cont.) | |
County of Lucas Improvement Refunding Revenue Bonds
Lutheran Homes | |
Series 2010A | |
11/01/45 | | | 7.000 | % | | | $5,000,000 | | | | $5,088,350 | |
Hickory Chase Community Authority Revenue Bonds
Hickory Chase Project | |
Series 2008(c) | |
12/01/38 | | | 7.000 | % | | | 2,500,000 | | | | 1,626,875 | |
Summit County Port Authority Revenue Bonds
Seville Projects | |
Series 2005A | |
05/15/25 | | | 5.100 | % | | | 415,000 | | | | 355,713 | |
Total | | | | | | | | | | | 13,367,522 | |
OKLAHOMA 0.2% | |
Oklahoma County Finance Authority Revenue Bonds
Sail Associates LLC
| |
Series 2007-RMKT AMT (Bank of the West)(a) | |
12/01/41 | | | 5.250 | % | | | 1,475,000 | | | | 1,475,000 | |
OREGON 1.5% | |
City of Forest Grove Revenue Bonds
Campus Improvement-Pacific University Project | |
Series 2009 | |
05/01/39 | | | 6.375 | % | | | 2,000,000 | | | | 2,059,460 | |
Oak Tree Foundation Project | |
Series 2007 | |
03/01/37 | | | 5.500 | % | | | 2,900,000 | | | | 2,599,647 | |
Cow Creek Band of Umpqua Tribe of Indians
Revenue Bonds | |
Series 2006C(b)(d) | |
10/01/26 | | | 5.625 | % | | | 1,700,000 | | | | 1,345,975 | |
Warm Springs Reservation Confederated Tribe Revenue Bonds
Pelton Round Butte Tribal | |
Series 2009B(b) | |
11/01/33 | | | 6.375 | % | | | 2,410,000 | | | | 2,418,845 | |
Western Generation Agency Revenue Bonds
Wauna Cogeneration Project | |
Series 2006A | |
01/01/20 | | | 5.000 | % | | | 2,235,000 | | | | 2,000,146 | |
Total | | | | | | | | | | | 10,424,073 | |
PENNSYLVANIA 3.6% | |
Bucks County Industrial Development Authority Revenue Bonds
Ann’s Choice, Inc. Facility
| |
Series 2005A | |
01/01/35 | | | 6.250 | % | | | 1,750,000 | | | | 1,546,737 | |
Chartiers Valley Industrial & Commercial Development Authority Refunding Revenue Bonds
Asbury Health Center | |
12/01/24 | | | 6.375 | % | | | 750,000 | | | | 726,533 | |
The Accompanying Notes to Financial Statements are an integral part of this statement.
17
Columbia High Yield Municipal Fund
June 30, 2011
(Percentages represent value of investments compared to net assets)
| | | | | | | | | | | | |
Issue
Description | | Coupon
Rate | | | Principal
Amount | | | Value | |
Municipal Bonds (continued) | |
PENNSYLVANIA (cont.) | |
Chester County Industrial Development Authority
RHA/Pennsylvania Nursing Home-1st Mortgage | |
Series 2002(c) | |
05/01/32 | | | 8.500 | % | | | $360,000 | | | | $346,054 | |
Dauphin County Industrial Development Authority Revenue Bonds
Dauphin Consolidated Water Supply | |
Series 1992A AMT(a) | |
06/01/24 | | | 6.900 | % | | | 3,200,000 | | | | 3,785,472 | |
Montgomery County Industrial Development Authority Revenue Bonds
Whitemarsh Community Project | |
Series 2008 | |
02/01/36 | | | 7.000 | % | | | 2,000,000 | | | | 1,780,300 | |
Whitemarsh Continuing Care | |
Series 2005 | |
02/01/28 | | | 6.125 | % | | | 1,400,000 | | | | 1,197,644 | |
02/01/35 | | | 6.250 | % | | | 1,350,000 | | | | 1,103,436 | |
Pennsylvania Economic Development Financing Authority Revenue Bonds
Allegheny Energy Supply Co. | |
Series 2009 | |
07/15/39 | | | 7.000 | % | | | 4,000,000 | | | | 4,192,360 | |
Philadelphia Biosolids Facility | |
Series 2009 | |
01/01/32 | | | 6.250 | % | | | 3,375,000 | | | | 3,471,255 | |
Pennsylvania Higher Educational Facilities Authority Revenue Bonds
Edinboro University Foundation | |
Series 2008 | |
07/01/38 | | | 5.875 | % | | | 2,200,000 | | | | 2,109,624 | |
Series 2010 | |
07/01/30 | | | 5.800 | % | | | 2,500,000 | | | | 2,460,450 | |
Pennsylvania Industrial Development Authority Refunding Revenue Bonds
Economic Development Series 2008 | |
07/01/23 | | | 5.500 | % | | | 2,355,000 | | | | 2,577,924 | |
Philadelphia Authority for Industrial Development Revenue Bonds
Facilities Aero Philadelphia LLC | |
Series 1999 AMT(a)(c) | |
01/01/24 | | | 5.500 | % | | | 900,000 | | | | 673,029 | |
Total | | | | | | | | | | | 25,970,818 | |
PUERTO RICO 0.8% | |
Children’s Trust Fund
Asset-Backed Revenue Bonds
| |
Series 2005B(b)(f) | |
05/15/55 | | | 0.000 | % | | | 25,000,000 | | | | 426,000 | |
Puerto Rico Electric Power Authority
Revenue Bonds
| |
Series 2003NN(b) | |
07/01/20 | | | 5.500 | % | | | 1,005,000 | | | | 1,092,676 | |
| | | | | | | | | | | | |
Issue
Description | | Coupon
Rate | | | Principal
Amount | | | Value | |
Municipal Bonds (continued) | |
PUERTO RICO (cont.) | |
Puerto Rico Industrial Tourist Educational, Medical & Environmental Control Facilities Financing Authority Revenue Bonds AES Puerto Rico Project | |
Series 2000 AMT(a)(b) | |
06/01/26 | | | 6.625 | % | | | $3,820,000 | | | | $3,852,470 | |
Total | | | | | | | | | | | 5,371,146 | |
SOUTH CAROLINA 1.4% | |
Laurens County School District No. 055
Revenue Bonds | |
Series 2005 | |
12/01/30 | | | 5.250 | % | | | 1,300,000 | | | | 1,298,375 | |
South Carolina Jobs-Economic Development Authority Refunding Revenue Bonds
1st Mortgage-Lutheran Homes | |
Series 2007 | |
05/01/21 | | | 5.375 | % | | | 1,000,000 | | | | 903,230 | |
05/01/28 | | | 5.500 | % | | | 1,100,000 | | | | 910,690 | |
1st Mortgage-Wesley Commons Series 2006 | |
10/01/36 | | | 5.300 | % | | | 3,000,000 | | | | 2,269,830 | |
Revenue Bonds
Kershaw County Medical Center Project | |
Series 2008 | |
09/15/38 | | | 6.000 | % | | | 5,050,000 | | | | 4,753,565 | |
Total | | | | | | | | | | | 10,135,690 | |
SOUTH DAKOTA 0.2% | |
South Dakota Economic Development Finance Authority Revenue Bonds
Pooled Loan Program-Davis Family | |
Series 2004-4A AMT(a) | |
04/01/29 | | | 6.000 | % | | | 1,400,000 | | | | 1,420,006 | |
TENNESSEE 0.1% | |
Shelby County Health Educational & Housing Facilities Board Revenue Bonds
Germantown Village | |
Series 2003A | |
12/01/34 | | | 7.250 | % | | | 675,000 | | | | 621,399 | |
Series 2006 | |
12/01/34 | | | 6.250 | % | | | 475,000 | | | | 391,699 | |
Total | | | | | | | | | | | 1,013,098 | |
TEXAS 7.4% | |
Abilene Health Facilities Development Corp. Revenue Bonds
Sears Methodist Retirement System | |
Series 1998A | |
11/15/25 | | | 5.900 | % | | | 1,350,000 | | | | 1,058,508 | |
Series 2003A | |
11/15/33 | | | 7.000 | % | | | 800,000 | | | | 678,536 | |
Brazos River Authority Refunding Revenue Bonds
TXU Energy Co. LLC Project | |
Series 2003C AMT(a) | |
10/01/38 | | | 6.750 | % | | | 1,180,000 | | | | 436,376 | |
The Accompanying Notes to Financial Statements are an integral part of this statement.
18
Columbia High Yield Municipal Fund
June 30, 2011
(Percentages represent value of investments compared to net assets)
| | | | | | | | | | | | |
Issue
Description | | Coupon
Rate | | | Principal
Amount | | | Value | |
Municipal Bonds (continued) | |
TEXAS (cont.) | |
Capital Area Cultural Education Facilities Finance Corp. Revenue Bonds
Roman Catholic Diocese
| |
Series 2005B-RMKT | |
04/01/45 | | | 6.125 | % | | | $5,000,000 | | | | $5,011,150 | |
Central Texas Regional Mobility Authority Revenue Bonds
Subordinated Lien | |
Series 2011 | |
01/01/41 | | | 6.750 | % | | | 5,000,000 | | | | 4,844,250 | |
Dallas County Flood Control District No. 1
Unlimited General Obligation Refunding Bonds | |
Series 2002 | |
04/01/32 | | | 7.250 | % | | | 1,000,000 | | | | 1,016,720 | |
Dallas-Fort Worth International Airport Facilities Improvement Corp.
Refunding Revenue Bonds
Subordinated | |
Series 2000A-RMKT AMT(a) | |
05/01/29 | | | 9.000 | % | | | 2,250,000 | | | | 2,307,780 | |
Deaf Smith County Hospital District
Limited General Obligation Bonds
| |
Series 2010A | |
03/01/40 | | | 6.500 | % | | | 4,000,000 | | | | 3,968,680 | |
El Paso County Housing Finance Corp.(c) Subordinated Revenue Bonds
American Village Communities Projects | |
Series 2000C | |
12/01/32 | | | 8.000 | % | | | 545,000 | | | | 546,526 | |
Series 2000D | |
12/01/32 | | | 10.000 | % | | | 655,000 | | | | 659,067 | |
Gulf Coast Industrial Development Authority
Revenue Bonds Citgo Petroleum Project
| |
Series 1998 AMT(a) | |
04/01/28 | | | 8.000 | % | | | 875,000 | | | | 880,565 | |
HFDC of Central Texas, Inc. Revenue Bonds
Sears Tyler Methodist | |
Series 2009A | |
11/15/44 | | | 7.750 | % | | | 4,000,000 | | | | 3,625,840 | |
Series 2006A | |
11/01/36 | | | 5.750 | % | | | 5,000,000 | | | | 3,975,550 | |
Houston Health Facilities Development Corp. Revenue Bonds
Buckingham Senior Living Community | |
Series 2004A | |
02/15/34 | | | 7.125 | % | | | 1,000,000 | | | | 1,168,740 | |
La Vernia Higher Education Finance Corp. Revenue Bonds
Kipp, Inc. | |
Series 2009A | |
08/15/29 | | | 6.000 | % | | | 1,000,000 | | | | 1,017,910 | |
08/15/39 | | | 6.250 | % | | | 1,500,000 | | | | 1,527,570 | |
Mission Economic Development Corp Revenue Bonds
Dallas Clean Energy McCommas | |
Series 2011 AMT(a) | |
12/01/24 | | | 6.875 | % | | | 5,000,000 | | | | 5,037,550 | |
| | | | | | | | | | | | |
Issue
Description | | Coupon
Rate | | | Principal
Amount | | | Value | |
Municipal Bonds (continued) | |
TEXAS (cont.) | |
North Texas Tollway Authority Refunding Revenue Bonds
Toll 2nd Tier | |
Series 2008F | |
01/01/38 | | | 5.750 | % | | | $2,645,000 | | | | $2,645,000 | |
Revenue Bonds
1st Tier | |
Series 2009A | |
01/01/39 | | | 6.250 | % | | | 1,500,000 | | | | 1,554,420 | |
Pharr Higher Education Finance Authority Revenue Bonds
Idea Public Schools | |
Series 2009A | |
08/15/39 | | | 6.500 | % | | | 3,000,000 | | | | 2,946,510 | |
Tarrant County Cultural Education Facilities Finance Corp. Revenue Bonds
Air Force Village | |
Series 2009 | |
11/15/44 | | | 6.375 | % | | | 4,250,000 | | | | 4,206,140 | |
CC Young Memorial Home | |
Series 2009A | |
02/15/38 | | | 8.000 | % | | | 4,000,000 | | | | 3,951,680 | |
Total | | | | | | | | | | | 53,065,068 | |
VERMONT 0.1% | |
Vermont Educational & Health Buildings Financing Agency Prerefunded Revenue Bonds
Vermont Law School Project | |
Series 2003A | |
01/01/33 | | | 5.500 | % | | | 500,000 | | | | 558,775 | |
VIRGIN ISLANDS 0.7% | |
Virgin Islands Public Finance Authority Senior Secured Revenue Bonds
Hovensa Coker Project | |
Series 2002 AMT(a)(b) | |
07/01/21 | | | 6.500 | % | | | 5,000,000 | | | | 4,913,350 | |
VIRGINIA 0.8% | |
Mosaic District Community Development Authority
Special Assessment Bonds | |
Series 2011A | |
03/01/36 | | | 6.875 | % | | | 2,500,000 | | | | 2,541,125 | |
Virginia Small Business Financing Authority Revenue Bonds
Hampton Roads Proton | |
Series 2009B | |
07/01/19 | | | 8.000 | % | | | 2,895,000 | | | | 3,012,971 | |
Total | | | | | | | | | | | 5,554,096 | |
WASHINGTON 0.1% | |
Seattle Housing Authority Revenue Bonds
Capital Fund Program-High Rise Rehab | |
Series 2005I (AGM) AMT(a) | |
11/01/25 | | | 5.000 | % | | | 1,000,000 | | | | 977,920 | |
The Accompanying Notes to Financial Statements are an integral part of this statement.
19
Columbia High Yield Municipal Fund
June 30, 2011
(Percentages represent value of investments compared to net assets)
| | | | | | | | | | | | |
Issue
Description | | Coupon
Rate | | | Principal
Amount | | | Value | |
Municipal Bonds (continued) | |
WISCONSIN 2.1% | |
Wisconsin Health & Educational Facilities Authority Refunding Revenue Bonds
Clement Manor, Inc. | |
Series 1998 | |
08/15/24 | | | 5.750 | % | | | $2,152,000 | | | | $1,905,531 | |
Three Pillars Senior Communities Series 2003 | |
08/15/23 | | | 5.600 | % | | | 790,000 | | | | 796,589 | |
Revenue Bonds
Aurora Health Care, Inc. | |
Series 2003 | | | | | |
04/15/33 | | | 6.400 | % | | | 700,000 | | | | 710,416 | |
Fort Healthcare, Inc. Project Series 2004 | |
05/01/34 | | | 6.100 | % | | | 1,965,000 | | | | 1,933,894 | |
Medical College of Wisconsin Series 2008A | |
12/01/35 | | | 5.250 | % | | | 5,000,000 | | | | 4,859,050 | |
St. John’s Community, Inc. Series 2009A | |
09/15/39 | | | 7.625 | % | | | 1,750,000 | | | | 1,762,075 | |
St. Johns Communities, Inc. Series 2009C-1 | |
09/15/15 | | | 6.400 | % | | | 2,000,000 | | | | 1,980,220 | |
Three Pillars Senior Living Series 2004A | |
08/15/34 | | | 5.500 | % | | | 870,000 | | | | 789,699 | |
| | | | | | | | | | | | |
Total | | | | | | | | | | | 14,737,474 | |
WYOMING 0.4% | |
County of Campbell Pollution Control Refunding Revenue Bonds
Black Hills Power, Inc. Project | |
Series 2004 | |
10/01/24 | | | 5.350 | % | | | 3,250,000 | | | | 3,171,415 | |
Total Municipal Bonds | | | | | | | | | |
(Cost: $725,311,632) | | | | | | | | $679,064,165 | |
| | | | | | | | | | | | |
Issue
Description | | Effective
Yield | | | Amount Payable
at Maturity | | | Value | |
Floating Rate Notes 1.4% | |
CALIFORNIA 0.7% | |
California State Department of Water Resources Revenue Bonds
VRDN Series 2002C-13 (Dexia Credit Local)(h) | |
05/01/22 | | | 2.750 | % | | | $5,000,000 | | | | $5,000,000 | |
NEVADA 0.7% | |
Las Vegas Valley Water District Limited General Obligation Bonds
Water Improvement
VRDN Series 2006C (Dexia Credit Local)(h) | |
06/01/36 | | | 3.000 | % | | | 5,000,000 | | | | 5,000,000 | |
Total Floating Rate Notes | | | | | | | | | |
(Cost: $10,000,000) | | | | | | | | $10,000,000 | |
| | | | | | Shares | | | | |
Money Market Funds 2.9% | |
Dreyfus Tax-Exempt Cash Management Fund, 0.030%(i) | | | | 11,433,533 | | | | $11,433,533 | |
JPMorgan Municipal Money Market Fund, 0.000%(i) | | | | 9,367,606 | | | | 9,367,606 | |
Total Money Market Funds | | | | | | | | | |
(Cost: $20,801,139) | | | | | | | | $20,801,139 | |
Total Investments | | | | | | | | | |
(Cost: $756,112,771) | | | | | | | | $709,865,304 | |
Other Assets & Liabilities, Net | | | | 6,752,168 | |
Total Net Assets | | | | | | | | $716,617,472 | |
|
Notes to Portfolio of Investments |
| (a) | At June 30, 2011, the value of securities subject to alternative minimum tax represented 11.68% of net assets. |
| (b) | Municipal obligations include debt obligations issued by or on behalf of territories, possessions, or sovereign nations within the territorial boundaries of the United States. These securities represented 4.57% of net assets at June 30, 2011. |
| (c) | Identifies issues considered to be illiquid as to their marketability. The aggregate value of such securities at June 30, 2011 was $30,389,619, representing 4.24% of net assets. Information concerning such security holdings at June 30, 2011 was as follows: |
| | | | | | | | |
| Security Description | | Acquisition Dates | | | Cost | |
Arizona Health Facilities Authority Refunding Revenue Bonds Phoenix Memorial Hospital Series 1991 | | | | | | | | |
8.125% 06/01/12 | | | 05/23/91 | | | | $1,783,069 | |
Broward County Housing Finance Authority Revenue Bonds Chaves Lake Apartments Project Series 2000A AMT | | | | | | | | |
7.500% 07/01/40 | | | 03/07/00 – 05/21/07 | | | | 1,499,501 | |
Cabazon Band Mission Indians Revenue Bonds Series 2004 | | | | | | | | |
8.358% 10/01/11 | | | 05/14/10 | | | | 371,139 | |
The Accompanying Notes to Financial Statements are an integral part of this statement.
20
Columbia High Yield Municipal Fund
June 30, 2011
|
Notes to Portfolio of Investments (continued) |
| | | | | | | | |
| Security Description | | Acquisition Dates | | | Cost | |
Series 2004 | | | | | | | | |
8.375% 10/01/15 | | | 10/04/04 – 05/14/10 | | | | $488,250 | |
Series 2004 | | | | | | | | |
7.750% 10/01/19 | | | 10/04/04 – 05/14/10 | | | | 2,465,642 | |
Series 2004 | | | | | | | | |
8.375% 10/01/20 | | | 05/14/10 | | | | 1,420,000 | |
California Statewide Communities Development Authority Revenue Bonds San Francisco Art Institute Series 2002 | | | | | | | | |
7.375% 04/01/32 | | | 07/05/02 | | | | 250,000 | |
Capital Trust Agency Revenue Bonds Atlantic Housing Foundation Subordinated Series 2008B | | | | | | | | |
7.000% 07/15/32 | | | 07/23/08 | | | | 1,425,000 | |
Capital Trust Agency Revenue Bonds Orlando Project Series 2003 AMT | | | | | | | | |
6.750% 01/01/32 | | | 06/05/03 | | | | 630,019 | |
Chester County Industrial Development Authority RHA/Pennsylvania Nursing Home-1st Mortgage Series 2002 | | | | | | | | |
8.500% 05/01/32 | | | 05/01/02 | | | | 334,953 | |
City of Roseville Revenue Bonds Care Institute, Inc. Project Series 1993 | | | | | | | | |
7.750% 11/01/23 | | | 11/01/93 | | | | 1,270,000 | |
City of Wilmington Revenue Bonds Housing-Electra Arms Senior Associates Project Series 1998 AMT | | | | | | | | |
6.250% 06/01/28 | | | 10/08/98 | | | | 765,211 | |
Durham Housing Authority Revenue Bonds Series 2005 AMT | | | | | | | | |
5.650% 02/01/38 | | | 12/18/06 | | | | 3,220,625 | |
El Paso County Housing Finance Corp. Subordinated Revenue Bonds American Village Communities Projects Series 2000C | | | | | | | | |
8.000% 12/01/32 | | | 12/18/00 | | | | 545,000 | |
Series 2000D | | | | | | | | |
10.000% 12/01/32 | | | 12/18/00 | | | | 655,000 | |
Hickory Chase Community Authority Revenue Bonds Hickory Chase Project Series 2008 | | | | | | | | |
7.000% 12/01/38 | | | 04/23/08 | | | | 2,500,000 | |
Illinois Finance Authority Revenue Bonds Leafs Hockey Club Project Series 2007A | | | | | | | | |
6.000% 03/01/37 | | | 09/09/10 | | | | 973,271 | |
Illinois Finance Authority Revenue Bonds Monarch Landing, Inc. Facility Series 2007A | | | | | | | | |
7.000% 12/01/27 | | | 03/27/09 | | | | 872,028 | |
Illinois Finance Authority Revenue Bonds Sedgebrook, Inc. Facility Series 2007A | | | | | | | | |
6.000% 11/15/37 | | | 08/09/07 | | | | 3,814,830 | |
Series 2007A | | | | | | | | |
6.000% 11/15/42 | | | 03/26/09 | | | | 776,198 | |
Louisiana Public Facilities Authority Revenue Bonds Progressive Healthcare Series 1998 | | | | | | | | |
6.375% 10/01/28 | | | 10/16/98 | | | | 1,963,660 | |
Massachusetts Development Finance Agency Revenue Bonds Health Care Facility-Alliance Series 1999A | | | | | | | | |
7.100% 07/01/32 | | | 09/02/99 | | | | 2,023,900 | |
Massachusetts Development Finance Agency Revenue Bonds Linden Ponds, Inc. Facility Series 2007A | | | | | | | | |
5.500% 11/15/27 | | | 02/19/10 | | | | 2,238,180 | |
Series 2007A | | | | | | | | |
5.750% 11/15/35 | | | 07/01/08 – 02/18/10 | | | | 764,763 | |
Series 2007A | | | | | | | | |
5.750% 11/15/42 | | | 12/05/07 – 07/01/08 | | | | 3,058,757 | |
Michigan Strategic Fund Refunding Revenue Bonds Michigan Sugar Co. — Carollton Series 1998C AMT | | | | | | | | |
6.550% 11/01/25 | | | 11/24/98 | | | | 1,500,000 | |
Middlesex County Improvement Authority Revenue Bonds Heldrich Center Hotel Series 2005C | | | | | | | | |
8.750% 01/01/37 | | | 06/28/06 | | | | 1,228,125 | |
Munimae TE Bond Subsidiary LLC Revenue Bonds | | | | | | | | |
5.800% 06/30/49 | | | 10/14/04 | | | | 1,000,000 | |
New York Liberty Development Corp. Revenue Bonds National Sports Museum Project Series 2006A | | | | | | | | |
6.125% 02/15/19 | | | 08/07/06 – 05/28/08 | | | | 1,985,478 | |
Oakmont Grove Community Development District Special Assessment Bonds Series 2007 A | | | | | | | | |
5.400% 05/01/38 | | | 02/21/07 | | | | 1,194,000 | |
Series 2007B | | | | | | | | |
5.250% 05/01/12 | | | 02/21/07 | | | | 1,000,000 | |
Philadelphia Authority for Industrial Development Revenue Bonds Facilities Aero Philadelphia LLC Series 1999 AMT | | | | | | | | |
5.500% 01/01/24 | | | 04/14/99 | | | | 861,867 | |
Rankin County Five Lakes Utility District Series 1994 | | | | | | | | |
7.000% 07/15/37 | | | 10/02/07 | | | | 250,000 | |
Resolution Trust Corp. Pass-Through Certificates Series 1993A | | | | | | | | |
8.500% 12/01/16 | | | 11/12/93 | | | | 459,589 | |
Sweetwater Creek Community Development District Special Assessment Bonds Series 2007A | | | | | | | | |
5.500% 05/01/38 | | | 04/26/07 – 05/12/09 | | | | 2,773,947 | |
Westridge Community Development District Special Assessment Bonds Series 2005 | | | | | | | | |
5.800% 05/01/37 | | | 12/22/05 | | | | 2,650,000 | |
The Accompanying Notes to Financial Statements are an integral part of this statement.
21
Columbia High Yield Municipal Fund
June 30, 2011
|
Notes to Portfolio of Investments (continued) |
| | | | | | | | |
| Security Description | | Acquisition Dates | | | Cost | |
West Villages Improvement District Special Assessment Bonds Unit of Development No. 3 Series 2006 | | | | | | | | |
5.500% 05/01/37 | | | 04/19/06 – 05/18/06 | | | | $1,647,600 | |
Will-Kankakee Regional Development Authority Prerefunded 12/15/11 Revenue Bonds Flanders Corp./PrecisionAire Series 1997 AMT | | | | | | | | |
6.500% 12/15/17 | | | 12/30/97 | | | | 495,000 | |
| (d) | Security exempt from registration pursuant to Rule 144A under the Securities Act of 1933. This security may be resold in transactions exempt from registration, normally to qualified institutional buyers. At June 30, 2011, the value of these securities amounted to $15,047,843 or 2.10% of net assets. |
| (e) | Represents a security purchased on a when-issued or delayed delivery basis. |
| (g) | Represents securities that have defaulted on payment of interest. The Fund has stopped accruing interest on these securities. At June 30, 2011, the value of these securities amounted to $3,787,840, which represents 0.53% of net assets. |
| (h) | Interest rate varies to reflect current market conditions, rate shown is the effective rate on June 30, 2011. |
| (i) | The rate shown is the seven-day current annualized yield at June 30, 2011. |
| | |
| AGM | | Assured Guaranty Municipal Corporation |
| AMBAC | | Ambac Assurance Corporation |
| AMT | | Alternative Minimum Tax |
| FNMA | | Federal National Mortgage Association |
| GNMA | | Government National Mortgage Association |
| NPFGC | | National Public Finance Guarantee Corporation |
| VRDN | | Variable Rate Demand Note |
Generally accepted accounting principles (GAAP) require disclosure regarding the inputs and valuation techniques used to measure fair value and any changes in valuation inputs or techniques. In addition, investments shall be disclosed by major category.
The Fund categorizes its fair value measurements according to a three-level hierarchy that maximizes the use of observable inputs and minimizes the use of unobservable inputs by prioritizing that the most observable input be used when available. Observable inputs are those that market participants would use in pricing an investment based on market data obtained from sources independent of the reporting entity. Unobservable inputs are those that reflect the Fund’s assumptions about the information market participants would use in pricing an investment. An investment’s level within the fair value hierarchy is based on the lowest level of any input that is deemed significant to the asset or liability’s fair value measurement. The input levels are not necessarily an indication of the risk or liquidity associated with investments at that level. For example, certain U.S. government securities are generally high quality and liquid, however, they are reflected as Level 2 because the inputs used to determine fair value may not always be quoted prices in an active market.
Fair value inputs are summarized in the three broad levels listed below:
| | Ÿ | | Level 1 — Valuations based on quoted prices for investments in active markets that the Fund has the ability to access at the measurement date (including NAV for open-end mutual funds). Valuation adjustments are not applied to Level 1 investments. |
| | Ÿ | | Level 2 — Valuations based on other significant observable inputs (including quoted prices for similar securities, interest rates, prepayment speeds, credit risks, etc.). |
| | Ÿ | | Level 3 — Valuations based on significant unobservable inputs (including the Fund’s own assumptions and judgment in determining the fair value of investments). |
Inputs that are used in determining fair value of an investment may include price information, credit data, volatility statistics, and other factors. These inputs can be either observable or unobservable. The availability of observable inputs can vary between investments, and is affected by various factors such as the type of investment, and the volume and level of activity for that investment or similar investments in the marketplace. The inputs will be considered by the Fund Administrator, along with any other relevant factors in the calculation of an investment’s fair value. The Fund uses prices and inputs that are current as of the measurement date, which may include periods of market dislocations. During these periods, the availability of prices and inputs may be reduced for many investments. This condition could cause an investment to be reclassified between the various levels within the hierarchy.
Investments falling into the Level 3 category are primarily supported by quoted prices from brokers and dealers participating in the market for those investments. However, these may be classified as Level 3 investments due to lack of market transparency and corroboration to support these quoted prices. Additionally, valuation models may be used as the pricing source for any remaining investments classified as Level 3. These models rely on one or more significant unobservable inputs and/or significant assumptions by the Fund Administrator. Inputs used in valuations may include, but are not limited to, financial statement analysis, capital account balances, discount rates and estimated cash flows, and comparable company data.
The Accompanying Notes to Financial Statements are an integral part of this statement.
22
Columbia High Yield Municipal Fund
June 30, 2011
|
Fair Value Measurements (continued) |
The following table is a summary of the inputs used to value the Fund’s investments as of June 30, 2011:
| | | | | | | | | | | | | | | | |
| | | Fair value at June 30, 2011 | |
| Description(a) | | Level 1
quoted prices
in active
markets for
identical assets | | | Level 2
other
significant
observable
inputs(b) | | | Level 3
significant
unobservable
inputs | | | Total | |
Bonds | | | | | | | | | | | | | | | | |
Municipal Bonds | | | $— | | | | $679,064,165 | | | | $— | | | | $679,064,165 | |
Total Bonds | | | — | | | | 679,064,165 | | | | — | | | | 679,064,165 | |
Other | | | | | | | | | | | | | | | | |
Floating Rate Notes | | | — | | | | 10,000,000 | | | | — | | | | 10,000,000 | |
Unaffiliated Money Market Funds(c) | | | 20,801,139 | | | | — | | | | — | | | | 20,801,139 | |
Total Other | | | 20,801,139 | | | | 10,000,000 | | | | — | | | | 30,801,139 | |
Total | | | $20,801,139 | | | | $689,064,165 | | | | $— | | | | $709,865,304 | |
| (a) | See the Portfolio of Investments for all investment classifications not indicated in the table. |
| (b) | There were no significant transfers between Levels 1 and 2 during the period. |
| (c) | Money market fund that is a sweep investment for cash balances in the Fund at June 30, 2011. |
The following table is a reconciliation of Level 3 assets for which significant unobservable inputs were used to determine fair value.
| | | | |
| | | Municipal Bonds | |
Balance as of June 30, 2010 | | | $528,500 | |
Accrued discounts/premiums | | | — | |
Realized gain (loss) | | | (438,325 | ) |
Change in unrealized appreciation (depreciation)* | | | 226,500 | |
Sales | | | (316,675 | ) |
Purchases | | | — | |
Issuances | | | — | |
Settlements | | | — | |
Transfers into Level 3 | | | — | |
Transfers out of Level 3 | | | — | |
Balance as of June 30, 2011 | | | $— | |
| *Change | in unrealized appreciation (depreciation) relating to securities held at June 30, 2011 was $0. |
Transfers in and/or out of Level 3 are determined based on the fair value at the beginning of the period for security positions held throughout the period.
The Accompanying Notes to Financial Statements are an integral part of this statement.
23
Statement of Assets and Liabilities – Columbia High Yield Municipal Fund
June 30, 2011
| | | | |
| Assets | | | | |
Investments, at value | | | | |
(identified cost $756,112,771) | | $ | 709,865,304 | |
Receivable for: | | | | |
Capital shares sold | | | 903,153 | |
Investments sold | | | 5,191,075 | |
Interest | | | 11,330,170 | |
Expense reimbursement due from Investment Manager | | | 458 | |
Trustees’ deferred compensation plan | | | 67,953 | |
Total assets | | | 727,358,113 | |
| |
| Liabilities | | | | |
Payable for: | | | | |
Investments purchased on a delayed delivery basis | | | 5,789,350 | |
Capital shares purchased | | | 1,368,485 | |
Dividend distributions to shareholders | | | 3,326,642 | |
Investment management fees | | | 8,072 | |
Distribution fees | | | 615 | |
Transfer agent fees | | | 101,687 | |
Administration fees | | | 2,172 | |
Chief compliance officer expenses | | | 415 | |
Other expenses | | | 75,250 | |
Trustees’ deferred compensation plan | | | 67,953 | |
Total liabilities | | | 10,740,641 | |
Net assets applicable to outstanding capital stock | | $ | 716,617,472 | |
The Accompanying Notes to Financial Statements are an integral part of this statement.
24
Statement of Assets and Liabilities (continued) – Columbia High Yield Municipal Fund
June 30, 2011
| | | | |
| Represented by | | | | |
Paid-in capital | | $ | 838,412,944 | |
Undistributed net investment income | | | 3,211,890 | |
Accumulated net realized loss | | | (78,759,895 | ) |
Unrealized appreciation (depreciation) on: | | | | |
Investments | | | (46,247,467 | ) |
Total — representing net assets applicable to outstanding capital stock | | $ | 716,617,472 | |
Net assets applicable to outstanding shares | | | | |
Class A | | $ | 63,668,641 | |
Class B | | $ | 3,052,488 | |
Class C | | $ | 8,508,897 | |
Class Z | | $ | 641,387,446 | |
Shares outstanding | | | | |
Class A | | | 6,630,196 | |
Class B | | | 317,877 | |
Class C | | | 886,167 | |
Class Z | | | 66,787,103 | |
Net asset value per share | | | | |
Class A(a) | | $ | 9.60 | |
Class B | | $ | 9.60 | |
Class C | | $ | 9.60 | |
Class Z | | $ | 9.60 | |
| (a) | The maximum offering price per share for Class A is $10.08. The offering price is calculated by dividing the net asset value by 1.0 minus the maximum sales charge of 4.75%. |
The Accompanying Notes to Financial Statements are an integral part of this statement.
25
Statement of Operations – Columbia High Yield Municipal Fund
Year ended June 30, 2011
| | | | |
| Net investment income | | | | |
Income: | | | | |
Dividends | | $ | 16,779 | |
Interest | | | 47,452,058 | |
Total income | | | 47,468,837 | |
Expenses: | | | | |
Investment management fees | | | 3,084,968 | |
Distribution fees | | | | |
Class B | | | 35,374 | |
Class C | | | 69,938 | |
Service fees | | | | |
Class A | | | 142,778 | |
Class B | | | 9,433 | |
Class C | | | 18,652 | |
Transfer agent fees | | | | |
Class A | | | 81,748 | |
Class B | | | 5,058 | |
Class C | | | 11,171 | |
Class Z | | | 798,789 | |
Administration fees | | | 827,759 | |
Compensation of board members | | | 45,953 | |
Pricing and bookkeeping fees | | | 166,025 | |
Custodian fees | | | 25,453 | |
Printing and postage fees | | | 76,906 | |
Registration fees | | | 67,374 | |
Professional fees | | | 102,511 | |
Chief compliance officer expenses | | | 2,014 | |
Line of credit interest expense | | | 119 | |
Other | | | 27,970 | |
Total expenses | | | 5,599,993 | |
Fees waived or expenses reimbursed by Investment Manager and its affiliates | | | (462,061 | ) |
Interest expense reimbursement by Investment Manager | | | (119 | ) |
Expense reductions | | | (76 | ) |
Total net expenses | | | 5,137,737 | |
Net investment income | | | 42,331,100 | |
| |
| Realized and unrealized gain (loss) – net | | | | |
Net realized gain (loss) on: | | | | |
Investments | | | (7,614,866 | ) |
Net realized loss | | | (7,614,866 | ) |
Net change in unrealized appreciation (depreciation) on: | | | | |
Investments | | | (9,701,549 | ) |
Net change in unrealized depreciation | | | (9,701,549 | ) |
Net realized and unrealized loss | | | (17,316,415 | ) |
Net increase in net assets resulting from operations | | $ | 25,014,685 | |
The Accompanying Notes to Financial Statements are an integral part of this statement.
26
Statement of Changes in Net Assets – Columbia High Yield Municipal Fund
| | | | | | | | |
| Year Ended June 30, | | 2011 | | | 2010 | |
| | |
| Operations | | | | | | | | |
Net investment income | | $ | 42,331,100 | | | $ | 39,411,035 | |
Net realized loss | | | (7,614,866 | ) | | | (2,150,911 | ) |
Net change in unrealized appreciation (depreciation) | | | (9,701,549 | ) | | | 71,014,028 | |
Net increase in net assets resulting from operations | | | 25,014,685 | | | | 108,274,152 | |
Distributions to shareholders from: | | | | | | | | |
Net investment income | | | | | | | | |
Class A | | | (3,762,746 | ) | | | (3,738,375 | ) |
Class B | | | (213,473 | ) | | | (336,155 | ) |
Class C | | | (440,310 | ) | | | (429,275 | ) |
Class Z | | | (36,635,531 | ) | | | (34,347,738 | ) |
Total distributions to shareholders | | | (41,052,060 | ) | | | (38,851,543 | ) |
Increase (decrease) in net assets from share transactions | | | (32,194,792 | ) | | | 120,771,323 | |
| | | | | | | | |
Total increase (decrease) in net assets | | | (48,232,167 | ) | | | 190,193,932 | |
Net assets at beginning of year | | | 764,849,639 | | | | 574,655,707 | |
Net assets at end of year | | $ | 716,617,472 | | | $ | 764,849,639 | |
Undistributed net investment income | | $ | 3,211,890 | | | $ | 1,728,108 | |
The Accompanying Notes to Financial Statements are an integral part of this statement.
27
Statement of Changes in Net Assets (continued) – Columbia High Yield Municipal Fund
| | | | | | | | | | | | | | | | |
| Year Ended June 30, | | 2011 | | | 2010 | |
| | | Shares | | | Dollars ($) | | | Shares | | | Dollars ($) | |
| Capital stock activity | | | | | | | | | | | | | | | | |
Class A shares | | | | | | | | | | | | | | | | |
Subscriptions | | | 1,137,035 | | | | 11,028,366 | | | | 2,724,407 | | | | 25,945,561 | |
Distributions reinvested | | | 187,768 | | | | 1,805,692 | | | | 204,643 | | | | 1,945,394 | |
Redemptions | | | (2,956,583 | ) | | | (28,527,441 | ) | | | (1,403,983 | ) | | | (13,328,513 | ) |
Net increase (decrease) | | | (1,631,780 | ) | | | (15,693,383 | ) | | | 1,525,067 | | | | 14,562,442 | |
Class B shares | | | | | | | | | | | | | | | | |
Subscriptions | | | 16,363 | | | | 164,369 | | | | 21,015 | | | | 200,054 | |
Distributions reinvested | | | 8,469 | | | | 81,838 | | | | 15,765 | | | | 149,362 | |
Redemptions | | | (320,806 | ) | | | (3,058,590 | ) | | | (378,136 | ) | | | (3,574,031 | ) |
Net decrease | | | (295,974 | ) | | | (2,812,383 | ) | | | (341,356 | ) | | | (3,224,615 | ) |
Class C shares | | | | | | | | | | | | | | | | |
Subscriptions | | | 252,510 | | | | 2,460,215 | | | | 231,532 | | | | 2,197,355 | |
Distributions reinvested | | | 20,046 | | | | 193,009 | | | | 19,728 | | | | 187,674 | |
Redemptions | | | (337,433 | ) | | | (3,210,904 | ) | | | (249,583 | ) | | | (2,374,418 | ) |
Net increase (decrease) | | | (64,877 | ) | | | (557,680 | ) | | | 1,677 | | | | 10,611 | |
Class Z shares | | | | | | | | | | | | | | | | |
Subscriptions | | | 17,348,274 | | | | 168,309,034 | | | | 24,496,505 | | | | 231,051,837 | |
Distributions reinvested | | | 492,648 | | | | 4,744,603 | | | | 518,686 | | | | 4,928,209 | |
Redemptions | | | (19,542,118 | ) | | | (186,184,983 | ) | | | (13,292,723 | ) | | | (126,557,161 | ) |
Net increase (decrease) | | | (1,701,196 | ) | | | (13,131,346 | ) | | | 11,722,468 | | | | 109,422,885 | |
Total net increase (decrease) | | | (3,693,827 | ) | | | (32,194,792 | ) | | | 12,907,856 | | | | 120,771,323 | |
The Accompanying Notes to Financial Statements are an integral part of this statement.
28
Financial Highlights – Columbia High Yield Municipal Fund
The following tables are intended to help you understand the Fund’s financial performance. Certain information reflects financial results for a single share of a class held for the periods shown. Per share net investment income (loss) amounts are calculated based on average shares outstanding during the period. Total returns assume reinvestment of all dividends and distributions. Total returns do not reflect payment of sales charges, if any, and are not annualized for periods of less than one year.
| | | | | | | | | | | | | | | | | | | | |
| | | Year ended June 30, | |
| | | 2011 | | | 2010 | | | 2009 | | | 2008 | | | 2007 | |
| Class A | | | | | | | | | | | | | | | |
| Per share data | | | | | | | | | | | | | | | | | | | | |
Net asset value, beginning of period | | | $9.77 | | | | $8.79 | | | | $10.32 | | | | $11.33 | | | | $11.25 | |
Income from investment operations: | | | | | | | | | | | | | | | | | | | | |
Net investment income | | | 0.53 | | | | 0.52 | | | | 0.53 | | | | 0.52 | | | | 0.51 | |
Net realized and unrealized gain (loss) on investments | | | (0.19 | ) | | | 0.97 | | | | (1.53 | ) | | | (1.01 | ) | | | 0.08 | |
Total from investment operations | | | 0.34 | | | | 1.49 | | | | (1.00 | ) | | | (0.49 | ) | | | 0.59 | |
Less distributions to shareholders from: | | | | | | | | | | | | | | | | | | | | |
Net investment income | | | (0.51 | ) | | | (0.51 | ) | | | (0.53 | ) | | | (0.52 | ) | | | (0.51 | ) |
Net asset value, end of period | | | $9.60 | | | | $9.77 | | | | $8.79 | | | | $10.32 | | | | $11.33 | |
| Total return | | | 3.63% | | | | 17.25% | | | | (9.60% | ) | | | (4.39% | ) | | | 5.23% | |
| Ratios to average net assets(a) | | | | | | | | | | | | | | | | | | | | |
Expenses prior to fees waived or expenses reimbursed (including interest and fee expense) | | | 0.91% | | | | 0.85% | | | | 0.90% | | | | 0.95% | (b) | | | 0.95% | (b) |
Net expenses after fees waived or expenses reimbursed (including interest and fee expense)(c) | | | 0.85% | (d) | | | 0.85% | | | | 0.90% | | | | 0.95% | (b) | | | 0.95% | (b) |
Expenses prior to fees waived or expenses reimbursed (excluding interest and fee expense) | | | 0.91% | | | | 0.85% | | | | 0.90% | | | | 0.90% | | | | 0.88% | |
Net expenses after fees waiver or expenses reimbursed (excluding interest and fee expense)(c) | | | 0.85% | (d) | | | 0.85% | | | | 0.90% | | | | 0.90% | | | | 0.88% | |
Net investment income(c) | | | 5.46% | | | | 5.44% | | | | 5.90% | | | | 4.84% | | | | 4.43% | |
| Supplemental data | | | | | | | | | | | | | | | | | | | | |
Net assets, end of period (in thousands) | | | $63,669 | | | | $80,691 | | | | $59,189 | | | | $74,593 | | | | $89,977 | |
Portfolio turnover | | | 23% | | | | 18% | | | | 26% | | | | 32% | | | | 27% | |
See Accompanying Notes to Financial Highlights.
The Accompanying Notes to Financial Statements are an integral part of this statement.
29
Financial Highlights (continued) – Columbia High Yield Municipal Fund
| | | | | | | | | | | | | | | | | | | | |
| | | Year ended June 30, | |
| | | 2011 | | | 2010 | | | 2009 | | | 2008 | | | 2007 | |
| Class B | | | | | | | | | | | | | | | |
| Per share data | | | | | | | | | | | | | | | | | | | | |
Net asset value, beginning of period | | | $9.77 | | | | $8.79 | | | | $10.32 | | | | $11.33 | | | | $11.25 | |
Income from investment operations: | | | | | | | | | | | | | | | | | | | | |
Net investment income | | | 0.46 | | | | 0.45 | | | | 0.46 | | | | 0.44 | | | | 0.42 | |
Net realized and unrealized gain (loss) on investments | | | (0.19 | ) | | | 0.97 | | | | (1.53 | ) | | | (1.01 | ) | | | 0.08 | |
Total from investment operations | | | 0.27 | | | | 1.42 | | | | (1.07 | ) | | | (0.57 | ) | | | 0.50 | |
Less distributions to shareholders from: | | | | | | | | | | | | | | | | | | | | |
Net investment income | | | (0.44 | ) | | | (0.44 | ) | | | (0.46 | ) | | | (0.44 | ) | | | (0.42 | ) |
Net asset value, end of period | | | $9.60 | | | | $9.77 | | | | $8.79 | | | | $10.32 | | | | $11.33 | |
| Total return | | | 2.85% | | | | 16.39% | | | | (10.27% | ) | | | (5.10% | ) | | | 4.45% | |
| Ratios to average net assets(a) | | | | | | | | | | | | | | | | | | | | |
Expenses prior to fees waived or expenses reimbursed (including interest and fee expense) | | | 1.65% | | | | 1.60% | | | | 1.65% | | | | 1.70% | (b) | | | 1.70% | (b) |
Net expenses after fees waived or expenses reimbursed (including interest and fee expense)(c) | | | 1.60% | (d) | | | 1.60% | | | | 1.65% | | | | 1.70% | (b) | | | 1.70% | (b) |
Expenses prior to fees waived or expenses reimbursed (excluding interest and fee expense) | | | 1.65% | | | | 1.60% | | | | 1.65% | | | | 1.65% | | | | 1.63% | |
Net expenses after fees waiver or expenses reimbursed (excluding interest and fee expense)(c) | | | 1.60% | (d) | | | 1.60% | | | | 1.65% | | | | 1.65% | | | | 1.63% | |
Net investment income(c) | | | 4.69% | | | | 4.72% | | | | 5.13% | | | | 4.09% | | | | 3.68% | |
| Supplemental data | | | | | | | | | | | | | | | | | | | | |
Net assets, end of period (in thousands) | | | $3,052 | | | | $5,995 | | | | $8,392 | | | | $11,945 | | | | $17,407 | |
Portfolio turnover | | | 23% | | | | 18% | | | | 26% | | | | 32% | | | | 27% | |
See Accompanying Notes to Financial Highlights.
The Accompanying Notes to Financial Statements are an integral part of this statement.
30
Financial Highlights (continued) – Columbia High Yield Municipal Fund
| | | | | | | | | | | | | | | | | | | | |
| | | Year ended June 30, | |
| | | 2011 | | | 2010 | | | 2009 | | | 2008 | | | 2007 | |
| Class C | | | | | | | | | | | | | | | |
| Per share data | | | | | | | | | | | | | | | | | | | | |
Net asset value, beginning of period | | | $9.77 | | | | $8.79 | | | | $10.32 | | | | $11.33 | | | | $11.25 | |
Income from investment operations: | | | | | | | | | | | | | | | | | | | | |
Net investment income | | | 0.48 | | | | 0.46 | | | | 0.48 | | | | 0.46 | | | | 0.44 | |
Net realized and unrealized gain (loss) on investments | | | (0.20 | ) | | | 0.97 | | | | (1.54 | ) | | | (1.01 | ) | | | 0.08 | |
Total from investment operations | | | 0.28 | | | | 1.43 | | | | (1.06 | ) | | | (0.55 | ) | | | 0.52 | |
Less distributions to shareholders from: | | | | | | | | | | | | | | | | | | | | |
Net investment income | | | (0.45 | ) | | | (0.45 | ) | | | (0.47 | ) | | | (0.46 | ) | | | (0.44 | ) |
Net asset value, end of period | | | $9.60 | | | | $9.77 | | �� | | $8.79 | | | | $10.32 | | | | $11.33 | |
| Total return | | | 3.01% | | | | 16.55% | | | | (10.14% | ) | | | (4.96% | ) | | | 4.61% | |
| Ratios to average net assets(a) | | | | | | | | | | | | | | | | | | | | |
Expenses prior to fees waived or expenses reimbursed (including interest and fee expense) | | | 1.66% | | | | 1.60% | | | | 1.65% | | | | 1.70% | (b) | | | 1.70% | (b) |
Net expenses after fees waived or expenses reimbursed (including interest and fee expense)(c)(d) | | | 1.45% | | | | 1.45% | | | | 1.50% | | | | 1.55% | (b) | | | 1.55% | (b) |
Expenses prior to fees waived or expenses reimbursed (excluding interest and fee expense) | | | 1.66% | | | | 1.60% | | | | 1.65% | | | | 1.65% | | | | 1.63% | |
Net expenses after fees waiver or expenses reimbursed (excluding interest and fee expense)(c)(d) | | | 1.45% | | | | 1.45% | | | | 1.50% | | | | 1.50% | | | | 1.48% | |
Net investment income(c) | | | 4.88% | | | | 4.85% | | | | 5.29% | | | | 4.24% | | | | 3.82% | |
| Supplemental data | | | | | | | | | | | | | | | | | | | | |
Net assets, end of period (in thousands) | | | $8,509 | | | | $9,288 | | | | $8,341 | | | | $11,090 | | | | $14,134 | |
Portfolio turnover | | | 23% | | | | 18% | | | | 26% | | | | 32% | | | | 27% | |
See Accompanying Notes to Financial Highlights.
The Accompanying Notes to Financial Statements are an integral part of this statement.
31
Financial Highlights (continued) – Columbia High Yield Municipal Fund
| | | | | | | | | | | | | | | | | | | | |
| | | Year ended June 30, | |
| | | 2011 | | | 2010 | | | 2009 | | | 2008 | | | 2007 | |
| Class Z | | | | | | | | | | | | | | | |
| Per share data | | | | | | | | | | | | | | | | | | | | |
Net asset value, beginning of period | | | $9.77 | | | | $8.79 | | | | $10.32 | | | | $11.33 | | | | $11.25 | |
Income from investment operations: | | | | | | | | | | | | | | | | | | | | |
Net investment income | | | 0.55 | | | | 0.54 | | | | 0.55 | | | | 0.54 | | | | 0.53 | |
Net realized and unrealized gain (loss) on investments | | | (0.19 | ) | | | 0.97 | | | | (1.54 | ) | | | (1.01 | ) | | | 0.08 | |
Total from investment operations | | | 0.36 | | | | 1.51 | | | | (0.99 | ) | | | (0.47 | ) | | | 0.61 | |
Less distributions to shareholders from: | | | | | | | | | | | | | | | | | | | | |
Net investment income | | | (0.53 | ) | | | (0.53 | ) | | | (0.54 | ) | | | (0.54 | ) | | | (0.53 | ) |
Net asset value, end of period | | | $9.60 | | | | $9.77 | | | | $8.79 | | | | $10.32 | | | | $11.33 | |
| Total return | | | 3.82% | | | | 17.48% | | | | (9.42% | ) | | | (4.20% | ) | | | 5.44% | |
| Ratios to average net assets(a) | | | | | | | | | | | | | | | | | | | | |
Expenses prior to fees waived or expenses reimbursed (including interest and fee expense) | | | 0.71% | | | | 0.65% | | | | 0.70% | | | | 0.75% | (b) | | | 0.75% | (b) |
Net expenses after fees waived or expenses reimbursed (including interest and fee expense)(c) | | | 0.65% | (d) | | | 0.65% | | | | 0.70% | | | | 0.75% | (b) | | | 0.75% | (b) |
Expenses prior to fees waived or expenses reimbursed (excluding interest and fee expense) | | | 0.71% | | | | 0.65% | | | | 0.70% | | | | 0.70% | | | | 0.68% | |
Net expenses after fees waiver or expenses reimbursed (excluding interest and fee expense)(c) | | | 0.65% | (d) | | | 0.65% | | | | 0.70% | | | | 0.70% | | | | 0.68% | |
Net investment income(c) | | | 5.68% | | | | 5.64% | | | | 6.07% | | | | 5.03% | | | | 4.63% | |
| Supplemental data | | | | | | | | | | | | | | | | | | | | |
Net assets, end of period (in thousands) | | | $641,387 | | | | $668,875 | | | | $498,734 | | | | $629,219 | | | | $698,454 | |
Portfolio turnover | | | 23% | | | | 18% | | | | 26% | | | | 32% | | | | 27% | |
Notes to Financial Highlights
| (a) | In addition to the fees and expenses which the Fund bears directly, the Fund indirectly bears a pro rata share of the fees and expenses of the acquired funds in which it invests. Such indirect expenses are not included in the reported expense ratios. |
| (b) | Ratios include interest and fee expense related to the Fund’s participation in certain inverse floater programs, if any. Due to an equal increase in interest income from fixed rate municipal bonds held in trust, there is no impact on the Fund’s net assets, net asset value per share, total return or net investment income. |
| (c) | The benefits derived from expense reductions had an impact of less than 0.01%. |
| (d) | The Investment Manager and its affiliates agreed to waive/reimburse certain fees and expenses (excluding fees and expenses of acquired funds). |
The Accompanying Notes to Financial Statements are an integral part of this statement.
32
Notes to Financial Statements – Columbia High Yield Municipal Fund
June 30, 2011
Note 1. Organization
Columbia High Yield Municipal Fund (the Fund), a series of Columbia Funds Series Trust I (the Trust), is a diversified fund. The Trust is registered under the Investment Company Act of 1940, as amended (the 1940 Act), as an open-end management investment company organized as a Massachusetts business trust.
Fund Shares
The Trust may issue an unlimited number of shares (without par value). The Fund offers Class A, Class B, Class C, and Class Z shares. All share classes have identical voting, dividend and liquidation rights. Each share class has its own expense structure and sales charges, as applicable.
Class A shares are subject to a maximum front-end sales charge of 4.75% based on the initial investment amount. Class A shares purchased without an initial sales charge in accounts aggregating $1 million to $50 million at the time of purchase are subject to a contingent deferred sales charge (CDSC) if the shares are sold within 18 months of purchase, charged as follows: 1.00% CDSC if redeemed within 12 months of purchase, and 0.50% CDSC if redeemed more than 12, but less than 18, months after purchase.
Class B shares may be subject to a maximum CDSC of 5.00% based upon the holding period after purchase. Class B shares will generally convert to Class A shares eight years after purchase. The Fund no longer accepts investments by new or existing investors in the Fund’s Class B shares, except in connection with the reinvestment of any dividend and/or capital gain distributions in Class B shares of the Fund and exchanges by existing Class B shareholders of certain other funds within the Columbia Family of Funds.
Class C shares are subject to a 1.00% CDSC on shares redeemed within one year of purchase.
Class Z shares are not subject to sales charges, and are only available to certain investors, as described in the Fund’s prospectus.
Note 2. Summary of Significant Accounting Policies
Use of Estimates
The preparation of financial statements in accordance with U.S. generally accepted accounting principles (GAAP) requires management to make certain estimates and assumptions that affect the reported amounts of assets and liabilities, the disclosure of contingent assets and liabilities at the date of the financial statements and the reported amounts of revenue and expenses during the reporting period. Actual results could differ from those estimates.
The following is a summary of significant accounting policies consistently followed by the Fund in the preparation of its financial statements.
Security Valuation
All equity securities are valued at the close of business of the New York Stock Exchange (NYSE). Equity securities are valued at the last quoted sales price on the principal exchange or market on which they trade, except for securities traded on the NASDAQ Stock Market, which are valued at the NASDAQ official close price. Unlisted securities or listed securities for which there were no sales during the day are valued at the mean of the latest quoted bid and asked prices on such exchanges or markets.
Debt securities generally are valued by pricing services approved by the Board of Trustees (the Board) based upon market transactions for normal, institutional-size trading units of similar securities. The services may use various pricing techniques which take into account appropriate factors such as yield, quality, coupon rate, maturity, type of issue, trading characteristics and other data, as well as broker quotes. Debt securities for which quotations are readily available may also be valued based upon an over-the-counter or exchange bid quotation.
Certain debt securities, which tend to be more thinly traded and of lesser quality, are priced based on fundamental analysis of the financial condition of the issuer and the estimated value of any collateral. Valuations developed through pricing techniques may vary from the actual amounts realized upon sale of the securities, and the potential variation may be greater for those securities valued using fundamental analysis.
Investments in other open-end investment companies, including money market funds, are valued at net asset value.
Short-term securities purchased within 60 days to maturity are valued at amortized cost, which approximates market value. The value of short-term securities originally purchased with maturities greater than 60 days is determined based on an amortized value to par upon reaching 60 days to maturity. Short-term securities maturing in more than 60 days from the valuation date are valued at the market price or approximate market value based on current interest rates.
Investments for which market quotations are not readily available, or that have quotations which management believes are not reliable, are valued at fair value as determined in good faith under consistently applied procedures established by and under the general supervision
33
Columbia High Yield Municipal Fund
June 30, 2011
of the Board. If a security or class of securities (such as foreign securities) is valued at fair value, such value is likely to be different from the last quoted market price for the security. The determination of fair value often requires significant judgment. To determine fair value, management may use assumptions including but not limited to future cash flows and estimated risk premiums. Multiple inputs from various sources may be used to determine value.
Delayed Delivery Securities and Forward Sale Commitments
The Fund may trade securities on other than normal settlement terms, including securities purchased or sold on a “when-issued” basis. This may increase the risk if the other party to the transaction fails to deliver and causes the Fund to subsequently invest at less advantageous prices. The Fund identifies within its portfolio of investments cash or liquid securities in an amount equal to the delayed delivery commitment.
The Fund may enter into forward sale commitments to hedge its portfolio positions or to sell mortgage-backed securities it owns under delayed delivery arrangements. Proceeds of forward sale commitments are not received until the contractual settlement date. While a forward sale commitment is outstanding, equivalent deliverable securities or an offsetting forward purchase commitment deliverable on or before the sale commitment date, are used to satisfy the commitment.
Unsettled forward sale commitments are valued at the current market value of the underlying securities, generally according to the procedures described under “Security Valuation” above. The forward sale commitment is “marked-to-market” daily and the change in market value is recorded by the Fund as an unrealized gain or loss. If the forward sale commitment is closed through the acquisition of an offsetting purchase commitment, the Fund realizes a gain or loss. If the Fund delivers securities under the commitment, the Fund realizes a gain or a loss from the sale of the securities based upon the market price established at the date the commitment was entered into.
Restricted Securities
Restricted securities are securities that may only be resold upon registration under federal securities laws or in transactions exempt from registration. In some cases, the issuer of restricted securities has agreed to register such securities for resale at the issuer’s expense either upon demand by the Fund or in connection with another registered offering of the securities. Many restricted securities may be resold in the secondary market in transactions
exempt from registration. Such restricted securities may be determined to be liquid under criteria established by the Board. The Fund will not incur any registration costs upon such resale.
Security Transactions
Security transactions are accounted for on the trade date. Cost is determined and gains (losses) are based upon the specific identification method for both financial statement and federal income tax purposes.
Income Recognition
Interest income is recorded on the accrual basis. Market premium and discount are amortized and accreted, respectively, on all debt securities, unless otherwise noted. Original issue discount is accreted to interest income over the life of the security with a corresponding increase in the cost basis, if any.
Corporate actions and dividend income are recorded on the ex-dividend date.
Expenses
General expenses of the Trust are allocated to the Fund and other funds of the Trust based upon relative net assets or other expense allocation methodologies determined by the nature of the expense. Expenses directly attributable to the Fund are charged to the Fund. Expenses directly attributable to a specific class of shares are charged to that share class.
Determination of Class Net Asset Value
All income, expenses (other than class-specific expenses which are charged directly to a share class, as shown in the Statement of Operations) and realized and unrealized gains (losses) are allocated to each class of the Fund on a daily basis for purposes of determining the net asset value of each class. Income and expenses are allocated to each class based on the settled shares method, while realized and unrealized gains (losses) are allocated based on the relative net assets of each class.
Federal Income Tax Status
The Fund intends to qualify each year as a regulated investment company under Subchapter M of the Internal Revenue Code, as amended, and will distribute substantially all of its tax exempt or taxable income (including net short-term capital gains), if any, for its tax year, and as such will not be subject to federal income taxes. In addition, the Fund intends to distribute in each calendar year substantially all of its net investment income, capital gains and
34
Columbia High Yield Municipal Fund
June 30, 2011
certain other amounts, if any, such that the Fund should not be subject to federal excise tax. Therefore, no federal income or excise tax provision is recorded.
Distributions to Shareholders
Distributions from net investment income are declared daily and paid monthly. Net realized capital gains, if any, are distributed along with the income dividend. Income distributions and capital gain distributions are determined in accordance with federal income tax regulations which may differ from GAAP.
Guarantees and Indemnifications
Under the Trust’s organizational documents and, in some cases, by contract, its officers and trustees are indemnified against certain liabilities arising out of the performance of their duties to the Fund. In addition, certain of the Fund’s contracts with its service providers contain general indemnification clauses. The Fund’s maximum exposure under these arrangements is unknown since the amount of any future claims that may be made against the Fund cannot be determined, and the Fund has no historical basis for predicting the likelihood of any such claims.
Note 3. Fees and Compensation Paid to Affiliates
Investment Management Fees
Under an Investment Management Services Agreement (IMSA), Columbia Management Investment Advisers, LLC (the Investment Manager), a wholly-owned subsidiary of Ameriprise Financial, Inc. (Ameriprise Financial), determines which securities will be purchased, held or sold. The management fee is an annual fee that is equal to a percentage of the Fund’s average daily net assets that declines from 0.45% to 0.40% as the Fund’s net assets increase. The management fee for the year ended June 30, 2011 was 0.41% of the Fund’s average daily net assets.
In September 2010, the Board approved an amended IMSA that includes an annual management fee rate that declines from 0.47% to 0.30% as the Fund’s net assets increase. The new IMSA was approved by the Fund’s shareholders at a meeting held on February 15, 2011, and the fee change became effective on July 1, 2011.
Administration Fees
Under an Administrative Services Agreement, the Investment Manager serves as the Fund Administrator. The Fund pays the Fund
Administrator an annual fee for administration and accounting services equal to a percentage of the Fund’s average daily net assets that declines from 0.15% to 0.10% as the Fund’s net assets increase. The administrative fee for the year ended June 30, 2011 was 0.11% of the Fund’s average daily net assets.
In September 2010, the Board approved an amended Administrative Services Agreement that includes an annual administration fee rate that declines from 0.07% to 0.04% as the Fund’s net assets increase. The amended Administrative Services Agreement became effective on July 1, 2011.
Pricing and Bookkeeping Fees
Prior to May 16, 2011, the Fund had entered into a Financial Reporting Services Agreement (the Financial Reporting Services Agreement) with State Street Bank and Trust Company (State Street) and the Investment Manager pursuant to which State Street provided financial reporting services to the Fund. The Fund also entered into an Accounting Services Agreement (collectively with the Financial Reporting Services Agreement, the State Street Agreements) with State Street and the Investment Manager pursuant to which State Street provided accounting services to the Fund. Under the State Street Agreements, the Fund paid State Street an annual fee of $38,000 paid monthly plus an additional monthly fee based on an annualized percentage rate of average daily net assets of the Fund for the month. The aggregate fee did not exceed $140,000 per year (exclusive of out-of-pocket expenses and charges). The Fund also reimbursed State Street for certain out-of-pocket expenses and charges. Effective May 16, 2011, these services are now provided under the Administrative Services Agreement discussed above.
Compensation of Board Members
Trustees are compensated for their services to the Fund as disclosed in the Statement of Operations. The Trust’s eligible Trustees may participate in a Deferred Compensation Plan (the Plan) which may be terminated at any time. Obligation of the Plan will be paid solely out of the Fund’s assets.
Compensation of Chief Compliance Officer
The Board has appointed a Chief Compliance Officer to the Fund in accordance with federal securities regulations. The Fund, along with other affiliated funds, pays its pro-rata share of the expenses associated with the Chief Compliance Officer. The Fund’s expenses for the Chief Compliance Officer will not exceed $15,000 per year.
35
Columbia High Yield Municipal Fund
June 30, 2011
Transfer Agent Fees
Under a Transfer Agency Agreement, Columbia Management Investment Services Corp. (the Transfer Agent), an affiliate of the Investment Manager and a wholly-owned subsidiary of Ameriprise Financial, is responsible for providing transfer agency services to the Fund. The Transfer Agent has contracted with Boston Financial Data Services (BFDS) to serve as sub-transfer agent.
The Transfer Agent receives monthly account-based service fees based on the number of open accounts and is reimbursed by the Fund for the fees and expenses the Transfer Agent pays to financial intermediaries that maintain omnibus accounts with the Fund that is a percentage of the average aggregate value of the Fund’s shares maintained in each such omnibus account (other than omnibus accounts for which American Enterprise Investment Services Inc. is the broker of record or accounts where the beneficial shareholder is a customer of Ameriprise Financial Services, Inc., which are paid a per account fee). The Transfer Agent pays the fees of BFDS for services as sub-transfer agent and is not entitled to reimbursement for such fees from the Fund (with the exception of out-of-pocket fees). The Transfer Agent also receives compensation from fees for various shareholder services and reimbursements for certain out-of-pocket expenses.
For the year ended June 30, 2011, the Fund’s transfer agent fee rates as a percentage of average daily net assets of each class were as follows:
| | | | |
| | |
Class A | | | 0.12 | % |
Class B | | | 0.11 | |
Class C | | | 0.12 | |
Class Z | | | 0.12 | |
An annual minimum account balance fee of $20 may apply to certain accounts with a value below the Fund’s initial minimum investment requirements to reduce the impact of small accounts on transfer agent fees. These minimum account balance fees are recorded as part of expense reductions on the Statement of Operations. For the year ended June 30, 2011, no minimum account balance fees were charged by the Fund.
Distribution and Service Fees
The Fund has an agreement with Columbia Management Investment Distributors, Inc. (the Distributor), an affiliate of the Investment Manager and a wholly-owned subsidiary of Ameriprise Financial, for distribution and shareholder services. Pursuant to Rule 12b-1
under the 1940 Act, the Board has approved, and the Fund has adopted, distribution and shareholder service plans (the Plans) which set the distribution and service fees for the Fund. These fees are calculated daily and are intended to compensate the Distributor and/or eligible selling and/or servicing agents for selling shares of the Fund and providing services to investors.
The Plans require the payment of a monthly service fee to the Distributor at the maximum annual rate of 0.20% of the average daily net assets attributable to Class A, Class B and Class C shares of the Fund. The Plans also require the payment of a monthly distribution fee to the Distributor at the maximum annual rates of 0.75% of the average daily net assets attributable to Class B and Class C shares only.
The Distributor has voluntarily agreed to waive a portion of the distribution fee for Class C shares so that the combined distribution and service fee does not exceed 0.80% annually of the average daily net assets attributable to Class C shares. This arrangement may be modified or terminated by the Distributor at any time.
Sales Charges
Sales charges, including front-end charges and CDSCs, received by the Distributor for distributing Fund shares were $86,418 for Class A, $5,146 for Class B and $2,768 for Class C for the year ended June 30, 2011.
Expenses Waived/Reimbursed by the Investment Manager and its Affiliates
For the year ended June 30, 2011, the Investment Manager voluntarily agreed to reimburse a portion of the Fund’s expenses so that the Fund’s net operating expenses (excluding certain expenses, such as any distribution and service fees, brokerage commissions, interest, taxes, acquired fund fees and expenses and extraordinary expenses) so that the Fund’s net operating expenses, after giving effect to fees waived/expenses reimbursed and any balance credits and/or overdraft charges from the Fund’s custodian, did not exceed 0.65% of the Fund’s average daily net assets.
Effective July 1, 2011, the Investment Manager and certain of its affiliates have contractually agreed to waive fees and/or reimburse expenses (excluding certain fees and expenses described below), through October 31, 2012, unless sooner terminated at the sole discretion of the Board, so that the Fund’s net operating expenses, after giving effect to fees waived/expenses reimbursed and any balance credits and/or overdraft charges from the Fund’s custodian,
36
Columbia High Yield Municipal Fund
June 30, 2011
do not exceed the following annual rates as a percentage of each class’ average daily net assets:
| | | | |
| | |
Class A | | | 0.80 | % |
Class B | | | 1.55 | |
Class C | | | 1.55 | |
Class Z | | | 0.60 | |
Under the agreement, the following fees and expenses are excluded from the waiver/reimbursement commitment, and therefore will be paid by the Fund, if applicable: taxes (including foreign transaction taxes), expenses associated with investments in other affiliated and non-affiliated pooled investment vehicles (including mutual funds and exchange traded funds), transaction costs and brokerage commissions, costs related to any securities lending program, dividend expenses associated with securities sold short, inverse floater program fees and expenses, transaction charges and interest on borrowed money, interest, extraordinary expenses and any other expenses the exclusion of which is specifically approved by the Fund’s Board. This agreement may be modified or amended only with approval from all parties.
Note 4. Federal Tax Information
The timing and character of income and capital gain distributions are determined in accordance with income tax regulations, which may differ from GAAP. Reclassifications are made to the Fund’s capital accounts for permanent tax differences to reflect income and gains available for distribution (or available capital loss carryforwards) under income tax regulations.
For the year ended June 30, 2011, permanent and timing book to tax differences resulting primarily from differing treatments for discount accretion/premium amortization on debt securities, market discount reclasses, default bond sales and expired capital loss carryforwards were identified and permanent differences reclassed among the components of the Fund’s net assets in the Statement of Assets and Liabilities as follows:
| | | | |
| | |
Undistributed net investment income | | $ | 204,742 | |
Accumulated net realized loss | | | 493,206 | |
Paid-in capital | | | (697,948 | ) |
Net investment income and net realized gains (losses), as disclosed in the Statement of Operations, and net assets were not affected by this reclassification.
The tax character of distributions paid during the years indicated was as follows:
| | | | | | | | |
| Year ended June 30, | | 2011 | | | 2010 | |
Tax-Exempt Income | | $ | 40,757,181 | | | $ | 38,819,554 | |
Ordinary Income* | | | 294,879 | | | | 31,988 | |
| * | For tax purposes short-term capital gain distributions, if any, are considered ordinary income distributions. |
At June 30, 2011, the components of distributable earnings on a tax basis were as follows:
| | | | |
| | |
Undistributed tax-exempt income | | $ | 7,458,654 | |
Undistributed long-term gain | | | — | |
Unrealized depreciation* | | | (44,683,317 | ) |
| * | The differences between book-basis and tax-basis net unrealized depreciation are primarily due to deferral of losses from wash sales, AICPA amortization/accretion and market discount. |
At June 30, 2011, the cost of investments for federal income tax purposes was $754,548,621 and the aggregate gross unrealized appreciation and depreciation based on that cost was:
| | | | |
| | |
Unrealized appreciation | | $ | 21,242,379 | |
Unrealized depreciation | | | (65,925,696 | ) |
| | | | |
Net unrealized depreciation | | $ | (44,683,317 | ) |
The following capital loss carryforward, determined at June 30, 2011, may be available to reduce taxable income arising from future net realized gains on investments, if any, to the extent permitted by the Internal Revenue Code:
| | | | |
| | |
| Year of Expiration | | Amount | |
| 2012 | | $ | 1,587,432 | |
| 2013 | | | 5,621,572 | |
| 2014 | | | 466,991 | |
| 2015 | | | 1,471,699 | |
| 2016 | | | 5,694,295 | |
| 2017 | | | 17,741,445 | |
| 2018 | | | 35,721,468 | |
| 2019 | | | 4,244,605 | |
| | | | |
| Total | | $ | 72,549,507 | |
For the year ended June 30, 2011, $697,947 of capital loss carryforward expired unused.
37
Columbia High Yield Municipal Fund
June 30, 2011
It is unlikely the Board will authorize a distribution of any net realized capital gains until the available capital loss carryforward has been offset or expires. There is no assurance that the Fund will be able to utilize all of its capital loss carryforward before it expires.
Under current tax rules, capital losses realized after October 31 may be deferred and treated as occurring on the first day of the following fiscal year. As of June 30, 2011, post-October losses of $5,918,573 attributed to security transactions were deferred to July 1, 2011.
Management of the Fund has concluded that there are no significant uncertain tax positions that would require recognition in the financial statements. However, management’s conclusion may be subject to review and adjustment at a later date based on factors including, but not limited to, new tax laws, regulations, and administrative interpretations (including relevant court decisions). Generally, the Fund’s federal tax returns for the prior three fiscal years remain subject to examination by the Internal Revenue Service.
Note 5. Portfolio Information
The cost of purchases and proceeds from sales of securities, excluding short-term obligations, aggregated to $169,165,770 and $215,057,863, respectively, for the year ended June 30, 2011.
Note 6. Lending of Portfolio Securities
Effective May 16, 2011, the Fund has entered into a Master Securities Lending Agreement (the Agreement) with JPMorgan Chase Bank, National Association (JPMorgan). The Agreement, which replaces the previous securities lending arrangement with State Street, authorizes JPMorgan as lending agent to lend securities to authorized borrowers in order to generate additional income on behalf of the Fund. Pursuant to the Agreement, the securities loaned are secured by cash or U.S. government securities equal to at least 100% of the market value of the loaned securities. Any additional collateral required to maintain those levels due to market fluctuations of the loaned securities is delivered the following business day. Cash collateral received is invested by the lending agent on behalf of the Fund into authorized investments pursuant to the Agreement. The investments made with the cash collateral are listed in the Portfolio of Investments. The values of such investments and any uninvested cash collateral are disclosed in the Statement of Assets and Liabilities along with the related obligation to return the collateral upon the return of the securities loaned. At June 30, 2011, the Fund had no securities out on loan.
Risks of delay in recovery of securities or even loss of rights in the securities may occur should the borrower of the securities fail financially. Risks may also arise to the extent that the value of the securities loaned increases above the value of the collateral received. JPMorgan will indemnify the Fund from losses resulting from a borrower’s failure to return a loaned security when due. Such indemnification does not extend to losses associated with declines in the value of cash collateral investments. The Investment Manager is not responsible for any losses incurred by the Fund in connection with the securities lending program. Loans are subject to termination by the Fund or the borrower at any time, and are, therefore, not considered to be illiquid investments.
Pursuant to the Agreement, the Fund receives income for lending its securities either in the form of fees or by earning interest on invested cash collateral, net of negotiated rebates paid to borrowers and fees paid to the lending agent for services provided and any other securities lending expenses. Net income earned from securities lending for the year ended June 30, 2011, if any, is disclosed in the Statement of Operations. The Fund continues to earn and accrue interest and dividends on the securities loaned.
Note 7. Custody Credits
Prior to May 16, 2011 the Fund had an agreement with its custodian bank under which custody fees may have been reduced by balance credits. These credits are recorded as part of expense reductions on the Statement of Operations. The Fund could have invested a portion of the assets utilized in connection with the expense offset arrangement in an income-producing asset if they had not entered into such an agreement. Effective May 16, 2011, the Fund may invest its daily balance in an affiliated money market fund as detailed below. For the period from July 1, 2010 through May 15, 2011, these credits reduced total expenses by $76.
Note 8. Shareholder Concentration
At June 30, 2011 one shareholder account owned 77.0% of the outstanding shares of the Fund. Subscription and redemption activity of this account may have a significant effect on the operations of the Fund.
Note 9. Line of Credit
The Fund has entered into a revolving credit facility with a syndicate of banks led by JPMorgan Chase Bank, N.A. (the Administrative Agent), whereby the Fund may borrow for the temporary funding of shareholder redemptions or for other temporary or emergency
38
Columbia High Yield Municipal Fund
June 30, 2011
purposes. The credit facility became effective on May 16, 2011, replacing a prior credit facility with State Street (as discussed below). The credit facility agreement, which is a collective agreement between the Fund and certain other funds managed by the Investment Manager, severally and not jointly, permits collective borrowings up to $422.5 million. The collective borrowing amount will increase during the third quarter of 2011 to a final collective borrowing amount of $500 million. Interest is charged to each fund based on its borrowings at a rate equal to the sum of the federal funds rate plus (i) 1.25% per annum plus (ii) if one-month LIBOR exceeds the federal funds rate, the amount of such excess. Each borrowing under the credit facility matures no later than 60 days after the date of borrowing. The Fund also pays a commitment fee equal to its pro rata share of the amount of the credit facility at a rate of 0.10% per annum.
Prior to May 16, 2011, the Fund and certain other funds managed by the Investment Manager participated in a $225 million committed, unsecured revolving credit facility provided by State Street.
Prior to March 28, 2011, the collective borrowing amount of the credit facility was $280 million. Interest was charged to each fund based on its borrowings at a rate equal to the greater of the (i) federal funds rate plus 1.25% per annum or (ii) the overnight LIBOR rate plus 1.25% per annum. The Fund also paid a commitment fee equal to its pro rata share of the amount of the credit facility at a rate of 0.125% per annum.
Prior to October 14, 2010, interest was charged to each participating fund at the same rates. In addition, a commitment fee of 0.15% per annum was accrued and apportioned among the participating funds pro rata based on their relative net assets.
For the year ended June 30, 2011, the average daily loan balance outstanding on days where borrowing existed was $2,900,000 at a weighted average interest rate of 1.48%.
For the year ended June 30, 2011, the Investment Manager reimbursed the Fund $119 of interest expense.
Note 10. Significant Risks
Sector Focus Risk
The Fund may focus its investments in certain sectors, subjecting it to greater risk than a fund that invests in a wider range of industries.
High Yield Securities Risk
Investing in high-yield fixed income securities may involve greater credit risk and considerations not typically associated with investing in U.S. Government bonds and other higher quality fixed income securities. These securities are non-investment grade securities, often referred to as “junk” bonds. Economic downturns may disrupt the high yield market and impair the ability of issuers to repay principal and interest. Also, an increase in interest rates would likely have an adverse impact on the value of such obligations. Moreover, high-yield securities may be less liquid to the extent that there is no established secondary market.
Geographic Concentration Risk
The Fund had greater than 5% of its total net assets at June 30, 2011, invested in debt obligations issued by each of California (11.2%), Florida (9.9%), Illinois (8.7%) and Texas (7.4%) and their political subdivisions, agencies and public authorities. The Fund is more susceptible to economic and political factors adversely affecting issuers of these states’ or territories’ municipal securities than are municipal bond funds that are not concentrated to the same extent in these issuers.
Tax Development Risk
The Fund purchases municipal securities whose interest, in the opinion of bond counsel, is free from federal income tax. There is no assurance that the Internal Revenue Service (IRS) will agree with this opinion. In the event the IRS determines that an issuer does not comply with relevant tax requirements, interest payments from a security could become federally taxable, possibly retroactively to the date the security was issued. As a shareholder of the Fund, you may be required to file an amended tax return as a result.
Note 11. Subsequent Events
Management has evaluated the events and transactions that have occurred through the date the financial statements were issued. Other than as noted in Note 3 and Note 9 above, there were no items requiring adjustment of the financial statements or additional disclosure.
Note 12. Information Regarding Pending and Settled Legal Proceedings
In June 2004, an action captioned John E. Gallus et al. v. American Express Financial Corp. and American Express Financial Advisors Inc. was filed in the United States District Court for the District of
39
Columbia High Yield Municipal Fund
June 30, 2011
Arizona. The plaintiffs allege that they are investors in several American Express Company mutual funds (branded as Columbia or RiverSource) and they purport to bring the action derivatively on behalf of those funds under the Investment Company Act of 1940. The plaintiffs allege that fees allegedly paid to the defendants by the funds for investment advisory and administrative services are excessive. The plaintiffs seek remedies including restitution and rescission of investment advisory and distribution agreements. The plaintiffs voluntarily agreed to transfer this case to the United States District Court for the District of Minnesota (the District Court). In response to defendants’ motion to dismiss the complaint, the District Court dismissed one of plaintiffs’ four claims and granted plaintiffs limited discovery. Defendants moved for summary judgment in April 2007. Summary judgment was granted in the defendants’ favor on July 9, 2007. The plaintiffs filed a notice of appeal with the Eighth Circuit Court of Appeals (the Eighth Circuit) on August 8, 2007. On April 8, 2009, the Eighth Circuit reversed summary judgment and remanded to the District Court for further proceedings. On August 6, 2009, defendants filed a writ of certiorari with the U.S. Supreme Court (the Supreme Court), asking the Supreme Court to stay the District Court proceedings while the Supreme Court considers and rules in a case captioned Jones v. Harris Associates, which involves issues of law similar to those presented in the Gallus case. On March 30, 2010, the Supreme Court issued its ruling in Jones v. Harris Associates, and on April 5, 2010, the Supreme Court vacated the Eighth Circuit’s decision in the Gallus case and remanded the case to the Eighth Circuit for further consideration in light of the Supreme Court’s decision in Jones v. Harris Associates. On June 4, 2010, the Eighth Circuit remanded the Gallus case to the District Court for further consideration in light of the Supreme Court’s decision in Jones v. Harris Associates. On December 9, 2010, the District Court reinstated its July 9, 2007 summary judgment order in favor of the defendants. On January 10, 2011, plaintiffs filed a notice of appeal with the Eighth Circuit. In response to the plaintiffs’ opening appellate brief filed on March 18, 2011, the defendants filed a response brief on May 4, 2011 with the Eighth Circuit. The plaintiffs filed a reply brief on May 26, 2011.
In December 2005, without admitting or denying the allegations, American Express Financial Corporation (AEFC, which is now known as Ameriprise Financial, Inc. (Ameriprise Financial)), entered into settlement agreements with the Securities and Exchange Commission (SEC) and Minnesota Department of Commerce
(MDOC) related to market timing activities. As a result, AEFC was censured and ordered to cease and desist from committing or causing any violations of certain provisions of the Investment Advisers Act of 1940, the Investment Company Act of 1940, and various Minnesota laws. AEFC agreed to pay disgorgement of $10 million and civil money penalties of $7 million. AEFC also agreed to retain an independent distribution consultant to assist in developing a plan for distribution of all disgorgement and civil penalties ordered by the SEC in accordance with various undertakings detailed at www.sec.gov/litigation/admin/ia-2451.pdf. Ameriprise Financial and its affiliates have cooperated with the SEC and the MDOC in these legal proceedings, and have made regular reports to the funds’ Boards of Directors/Trustees.
Ameriprise Financial and certain of its affiliates have historically been involved in a number of legal, arbitration and regulatory proceedings, including routine litigation, class actions, and governmental actions, concerning matters arising in connection with the conduct of their business activities. Ameriprise Financial believes that the Funds are not currently the subject of, and that neither Ameriprise Financial nor any of its affiliates are the subject of, any pending legal, arbitration or regulatory proceedings that are likely to have a material adverse effect on the Funds or the ability of Ameriprise Financial or its affiliates to perform under their contracts with the Funds. Ameriprise Financial is required to make 10-Q, 10-K and, as necessary, 8-K filings with the Securities and Exchange Commission on legal and regulatory matters that relate to Ameriprise Financial and its affiliates. Copies of these filings may be obtained by accessing the SEC website at www.sec.gov.
There can be no assurance that these matters, or the adverse publicity associated with them, will not result in increased fund redemptions, reduced sale of fund shares or other adverse consequences to the Funds. Further, although we believe proceedings are not likely to have a material adverse effect on the Funds or the ability of Ameriprise Financial or its affiliates to perform under their contracts with the Funds, these proceedings are subject to uncertainties and, as such, we are unable to estimate the possible loss or range of loss that may result. An adverse outcome in one or more of these proceedings could result in adverse judgments, settlements, fines, penalties or other relief that could have a material adverse effect on the consolidated financial condition or results of operations of Ameriprise Financial.
40
Report of Independent Registered Public Accounting Firm
To the Trustees of Columbia Funds Series Trust I and the Shareholders of Columbia High Yield Municipal Fund
In our opinion, the accompanying statement of assets and liabilities, including the investment portfolio, and the related statements of operations and of changes in net assets and the financial highlights present fairly, in all material respects, the financial position of Columbia High Yield Municipal Fund (the “Fund”) (a series of Columbia Funds Series Trust I) at June 30, 2011, the results of its operations for the year then ended, the changes in its net assets for each of the two years in the period then ended, and the financial highlights for the periods indicated, in conformity with accounting principles generally accepted in the United States of America. These financial statements and financial highlights (hereafter referred to as “financial statements”) are the responsibility of the Fund’s management. Our responsibility is to express an opinion on these financial statements based on our audits. We conducted our audits of these financial statements in accordance with the standards of the Public Company Accounting Oversight Board (United States). Those standards require that we plan and perform the audit to obtain reasonable assurance about whether the financial statements are free of material misstatement. An audit includes examining, on a test basis, evidence supporting the amounts and disclosures in the financial statements, assessing the accounting principles used and significant estimates made by management, and evaluating the overall financial statement presentation. We believe that our audits, which included confirmation of securities at June 30, 2011 by correspondence with the custodian and brokers, provide a reasonable basis for our opinion.
PricewaterhouseCoopers LLP
Boston, Massachusetts
August 22, 2011
41
Federal Income Tax Information (Unaudited) – Columbia High Yield Municipal Fund
For the fiscal year ended June 30, 2011, 99.28% of the distributions from net investments income of the Fund qualified as exempt interest dividends for federal income tax purposes. A portion of income may be subject to federal alternative minimum tax.
The Fund will notify shareholders in January 2012 of amounts for use in preparing 2011 income tax returns.
42
Fund Governance
The Trustees serve terms of indefinite duration. The names, addresses and birth years of the Trustees and Officers of the Funds in Columbia Funds Series Trust I, the year each was first elected or appointed to office, their principal business occupations during at least the last five years, the number of Funds overseen by each Trustee and other directorships they hold are shown below, as of May 2, 2011. Each officer listed below serves as an officer of each Fund in Columbia Funds Series Trust I.
Independent Trustees
| | |
Name, Address and Year of Birth,
Position with Funds, Year First
Elected or Appointed to Office | | Principal Occupation(s) During Past Five Years, Number of Funds in Columbia Funds
Complex Overseen by Trustee, Other Directorships Held |
| |
| Rodman L. Drake (born 1943) | | |
c/o Columbia Management Investment Advisers, LLC 225 Franklin Street Boston, MA 02110 Trustee (since 1994) and Chairman of the Board (since 2009) | | Independent consultant since 2010; Co-Founder of Baringo Capital LLC (private equity) from 1997 to 2008; CEO of Crystal River Capital, Inc. (real estate investment trust) from 2003 to 2010; Oversees 43; Jackson Hewitt Tax Service Inc. (tax preparation services); Celgene Corporation (global biotechnology company); Student Loan Corporation (student loan provider); Celgene Corporation (global biotechnology company); the Helios Funds (exchange-traded funds); Crystal River Capital, Inc. from 2005 to 2010; Parsons Brinckerhoff from 1995 to 2008; and Apex Silver Mines Ltd. from 2007 to 2009 |
| |
| Douglas A. Hacker (born 1955) | | |
c/o Columbia Management Investment Advisers, LLC 225 Franklin Street Boston, MA 02110 Trustee (since 1996) | | Independent business executive since May 2006; Executive Vice President–Strategy of United Airlines (airline) from December 2002 to May 2006; President of UAL Loyalty Services (airline marketing company) from September 2001 to December 2002; Executive Vice President and Chief Financial Officer of United Airlines from July 1999 to September 2001. Oversees 43; Nash Finch Company (food distributor); Aircastle Limited (aircraft leasing); and SeaCube Container Leasing Ltd (container leasing) |
|
| Janet Langford Kelly (born 1957) |
c/o Columbia Management Investment Advisers, LLC 225 Franklin Street Boston, MA 02110 Trustee (since 1996) | | Senior Vice President, General Counsel and Corporate Secretary, ConocoPhillips (integrated energy company) since September 2007; Deputy General Counsel–Corporate Legal Services, ConocoPhillips from August 2006 to August 2007; Partner, Zelle, Hofmann, Voelbel, Mason & Gette LLP (law firm) from March 2005 to July 2006; Adjunct Professor of Law, Northwestern University, from September 2004 to June 2006; Director, UAL Corporation (airline) from February 2006 to July 2006; Oversees 43; None |
|
| William E. Mayer (born 1940) |
c/o Columbia Management Investment Advisers, LLC 225 Franklin Street Boston, MA 02110 Trustee (since 1994) | | Partner, Park Avenue Equity Partners (private equity) since February 1999; Dean and Professor, College of Business and Management, University of Maryland from 1992 to 1996. Oversees 43; DynaVox Inc. (software developer); Lee Enterprises (print media), WR Hambrecht + Co. (financial service provider); BlackRock Kelso Capital Corporation (investment company) |
43
Fund Governance (continued)
Independent Trustees (continued)
| | |
Name, Address and Year of Birth,
Position with Funds, Year First
Elected or Appointed to Office | | Principal Occupation(s) During Past Five Years, Number of Funds in Columbia Funds
Complex Overseen by Trustee, Other Directorships Held |
| |
| David M. Moffett (born 1952) | | |
c/o Columbia Management Investment Advisers, LLC 225 Franklin Street Boston, MA 02110 Trustee (since 2011) | | Retired. Chief Executive Officer, Federal Home Loan Mortgage Corporation, from 2008 to 2009; Senior Adviser, Global Financial Services Group, Carlyle Group, Inc., from 2007 to 2008; Vice Chairman and Chief Financial Officer, U.S. Bancorp, from 1993 to 2007. Oversees 43; CIT Group Inc. (commercial and consumer finance), eBay Inc. (online trading community), MBIA Corp (financial service provider), E.W. Scripps Co. (print and television media), Building Materials Holding Corp. (building materials and construction services), and University of Oklahoma Foundation. |
| |
| Charles R. Nelson (born 1942) | | |
c/o Columbia Management Investment Advisers, LLC 225 Franklin Street Boston, MA 02110 Trustee (since 1981) | | Professor of Economics, University of Washington, since January 1976; Ford and Louisa Van Voorhis Professor of Political Economy, University of Washington, since September 1993; Adjunct Professor of Statistics, University of Washington, since September 1980; Associate Editor, Journal of Money Credit and Banking from 1993 to 2008; consultant on econometric and statistical matters. Oversees 43; None |
| |
| John J. Neuhauser (born 1943) | | |
c/o Columbia Management Investment Advisers, LLC 225 Franklin Street Boston, MA 02110 Trustee (since 1984) | | President, Saint Michael’s College, since August 2007; Director or Trustee of several non-profit organization, including Fletcher Allen Health Care, Inc.; University Professor, Boston College from November 2005 to August 2007; Academic Vice President and Dean of Faculties, Boston College from August 1999 to October 2005. Oversees 43; Liberty All-Star Equity Fund and Liberty All-Star Growth Fund, Inc. (closed-end funds) |
| |
| Patrick J. Simpson (born 1944) | | |
c/o Columbia Management Investment Advisers, LLC 225 Franklin Street Boston, MA 02110 Trustee (since 2000) | | Partner, Perkins Coie LLP (law firm). Oversees 43; None |
| |
| Anne-Lee Verville (born 1945) | | |
c/o Columbia Management Investment Advisers, LLC 225 Franklin Street Boston, MA 02110 Trustee (since 1998) | | Retired since 1997 (formerly General Manager–Global Education Industry from 1994 to 1997, President–Application Systems Division from 1991 to 1994, Chief Financial Officer–US Marketing & Services from 1988 to 1991, and Chief Information Officer from 1987 to 1988, IBM Corporation (computer and technology)). Oversees 43; Enesco Group, Inc. (producer of giftware and home and garden decor products) from 2001 to 2006 |
44
Fund Governance (continued)
Interested Trustee
| | |
Name, Address and Year of Birth,
Position with Funds, Year First
Elected or Appointed to Office | | Principal Occupation(s) During Past Five Years, Number of Funds in Columbia Funds
Complex Overseen by Trustee, Other Directorships Held |
| |
| Michael A. Jones (born 1959) | | |
c/o Columbia Management Investment Advisers, LLC 225 Franklin Street Boston, MA 02110 Trustee (since 2011) Senior Vice President (since 2011) | | President and Director, Columbia Management Investment Advisers, LLC since May 2010; President and Director, Columbia Management Investment Distributors, Inc. since May 2010; Manager, Chairman, Chief Executive Officer and President, Columbia Management Advisors, LLC from 2007 to April 2010; Chief Executive Officer, President and Director, Columbia Management Distributors, Inc. from November 2006 to April 2010; previously, co-president and senior managing director at Robeco Investment Management. Oversees 43; None |
The Statement of Additional Information includes additional information about the Trustees of the Funds and is available, without charge, upon request by calling 1-800-345-6611.
45
Fund Governance (continued)
Officers
| | |
| Name, Year of birth and address | | Principal occupation(s) during the past five years |
|
| J. Kevin Connaughton (born 1964) |
225 Franklin Street Boston, MA 02110 President (since 2009) | | Senior Vice President and General Manager–Mutual Fund Products, Columbia Management Investment Advisers, LLC since May 2010; President, Columbia Funds, since 2009, and RiverSource Funds, since May 2010 (previously Senior Vice President and Chief Financial Officer, Columbia Funds, from June 2008 to January 2009, Treasurer, Columbia Funds, from October 2003 to May 2008, and senior officer of various other affiliated funds since 2000); Managing Director, Columbia Management Advisors, LLC from December 2004 to April 2010. |
| |
| Michael G. Clarke (born 1969) | | |
225 Franklin Street Boston, MA 02110 Treasurer (since 2011) and Chief Financial Officer (since 2009) | | Vice President, Columbia Management Investment Advisers, LLC since May 2010; Managing Director of Fund Administration, Columbia Management Advisors, LLC, from September 2004 to April 2010; senior officer of Columbia Funds and affiliated funds since 2002. |
| |
| Scott R. Plummer (born 1959) | | |
5228 Ameriprise Financial Center Minneapolis, MN 55474 Senior Vice President, Assistant Secretary and Chief Legal Officer (since 2010) | | Chief Legal Officer and Assistant Secretary, Columbia Management Investment Advisers, LLC since June 2005; Vice President and Lead Chief Counsel–Asset Management, Ameriprise Financial, Inc. since May 2010 (previously Vice President and Chief Counsel–Asset Management, from 2005 to April 2010, and Vice President–Asset Management Compliance from 2004 to 2005); Vice President, Chief Counsel and Assistant Secretary, Columbia Management Investment Distributors, Inc. since 2008; Vice President, General Counsel and Secretary, Ameriprise Certificate Company since 2005; Chief Counsel, RiverSource Distributors, Inc. since 2006; Vice President, General Counsel and Secretary, RiverSource Funds, since December 2006; Senior Vice President, Secretary and Chief Legal Officer, Columbia Funds, since May 2010. |
| |
| Linda J. Wondrack (born 1964) | | |
225 Franklin Street Boston, MA 02110 Senior Vice President and Chief Compliance Officer (since 2007) | | Vice President and Chief Compliance Officer, Columbia Management Investment Advisers, LLC since May 2010; Chief Compliance Officer, Columbia Funds, since 2007, and RiverSource Funds, since May 2010; Director (Columbia Management Group, LLC and Investment Product Group Compliance), Bank of America, from June 2005 to April 2010; Director of Corporate Compliance and Conflicts Officer of MFS Investment Management (investment management) from August 2004 to May 2005. |
| |
| William F. Truscott (born 1960) | | |
53600 Ameriprise Financial Center Minneapolis, MN 55474 Senior Vice President (since 2010) | | Chairman of the Board, Columbia Management Investment Advisers, LLC since May 2010 (previously President, Chairman of the Board and Chief Investment Officer, from 2001 to April 2010); Chief Executive Officer, U.S. Asset Management & President, Annuities, Ameriprise Financial, Inc. since May 2010 (previously President–U.S. Asset Management and Chief Investment Officer from 2005 to April 2010, and Senior Vice President–Chief Investment Officer, from 2001 to 2005); Director, President and Chief Executive Officer, Ameriprise Certificate Company since 2006; Director, Columbia Management Investment Distributors, Inc. since May 2010 (previously Chairman of the Board and Chief Executive Officer from 2008 to April 2010); Chairman of the Board and Chief Executive Officer, RiverSource Distributors, Inc. since 2006. |
46
Fund Governance (continued)
Officers (continued)
| | |
| Name, Year of birth and address | | Principal occupation(s) during the past five years |
|
| Colin Moore (born 1958) |
225 Franklin Street Boston, MA 02110 Senior Vice President (since 2010) | | Director and Chief Investment Officer, Columbia Management Investment Advisers, LLC since May 2010; Manager, Managing Director and Chief Investment Officer of Columbia Management Advisors, LLC from 2007 to April 2010; Head of Equities, Columbia Management Advisors, LLC from 2002 to 2007. |
| |
| Amy Johnson (born 1965) | | |
5228 Ameriprise Financial Center Minneapolis, MN 55474 Vice President (since 2010) | | Senior Vice President and Chief Operating Officer, Columbia Management Investment Advisers, LLC since May 2010 (previously Chief Administrative Officer, from 2009 until April 2010, Vice President–Asset Management and Trust Company Services, from 2006 to 2009, and Vice President–Operations and Compliance from 2004 to 2006). |
| |
| Joseph F. DiMaria (born 1968) | | |
225 Franklin Street Boston, MA 02110 Vice President (since 2011) and Chief Accounting Officer (since 2008) | | Vice President, Mutual Fund Administration, Columbia Management Investment Advisers, LLC, since May 2010; Director of Fund Administration, Columbia Management Advisors, LLC from January 2006 to April 2010; Head of Tax/Compliance and Assistant Treasurer, Columbia Management Advisors, LLC, from November 2004 to December 2005. |
| |
| Stephen T. Welsh (born 1957) | | |
225 Franklin Street Boston, MA 02110 Vice President (since 2006) | | President and Director, Columbia Management Investment Services Corp. since May 2010; President and Director, Columbia Management Services, Inc. from July 2004 to April 2010; Managing Director, Columbia Management Distributors, Inc. from August 2007 to April 2010. |
| |
| Paul D. Pearson (born 1956) | | |
5228 Ameriprise Financial Center Minneapolis, MN 55474 Vice President and Assistant Treasurer (since 2011) | | Vice President, Investment Accounting, Columbia Management Investment Advisers, LLC, since May 2010; Vice President, Managed Assets, Investment Accounting, Ameriprise Financial Corporation. |
| |
| Paul B. Goucher (born 1968) | | |
5228 Ameriprise Financial Center Minneapolis, MN 55474 Vice President and Assistant Secretary (since 2010) | | Vice President and Chief Counsel of Ameriprise Financial since January 2010 (formerly Vice President and Group Counsel from November 2008 to January 2010); Director, Managing Director and General Counsel of J. & W. Seligman & Co. Incorporated (Seligman) from July 2008 to November 2008 and Managing Director and Associate General Counsel of Seligman from January 2005 to July 2008. |
| |
| Christopher O. Petersen (born 1970) | | |
5228 Ameriprise Financial Center Minneapolis, MN 55474 Vice President (since 2010) and Secretary (since 2011) | | Vice President and Chief Counsel, Ameriprise Financial since January 2010 (formerly Vice President and Group Counsel or Counsel from April 2004 to January 2010); Assistant Secretary of RiverSource Funds since January 2007. |
| |
| Michael E. DeFao (born 1968) | | |
5228 Ameriprise Financial Center Minneapolis, MN 55474 Vice President and Assistant Secretary (since 2011) | | Vice President and Chief Counsel, Ameriprise Financial since May 2010; Associate General Counsel Bank of America from June 2005 to April 2010. |
47
Shareholder Meeting Results
At a Joint Special Meeting of Shareholders held on February 15, 2011, shareholders of the Fund considered a proposal to approve a proposed amendment to the Investment Management Services Agreement with Columbia Management Investment Advisers, LLC. The proposal was approved as follows:
| | | | | | |
| | | | | | | |
| Votes For | | Votes Against | | Abstentions | | Broker Non-Votes |
| 597,744,180 | | 8,967,254 | | 3,793,846 | | 0 |
48
Important Information About This Report
The fund mails one shareholder report to each shareholder address. If you would like more than one report, please call shareholder services at 1-800-345-6611 and additional reports will be sent to you. This report has been prepared for shareholders of Columbia High Yield Municipal Fund.
A description of the policies and procedures that the fund uses to determine how to vote proxies and a copy of the fund’s voting records are available (i) at www.columbiamanagement.com, (ii) on the Securities and Exchange Commission’s website at www.sec.gov, and (iii) without charge, upon request, by calling 1-800-368-0346. Information regarding how the fund voted proxies relating to portfolio securities during the 12-month period ended June 30 is available from the SEC’s website. Information regarding how the fund voted proxies relating to portfolio securities is also available from the fund’s website, www.columbiamanagement.com.
The fund files a complete schedule of portfolio holdings with the SEC for the first and third quarters of each fiscal year on Form N-Q. The fund’s Form N-Q is available on the SEC’s website at www.sec.gov and may be reviewed and copied at the SEC’s Public Reference Room in Washington, D.C. Information on the operation of the Public Reference Room may be obtained by calling
1-800-SEC-0330.
Transfer Agent
Columbia Management Investment Services Corp.
P.O. Box 8081
Boston, MA 02266-8081
1-800-345-6611
Distributor
Columbia Management Investment
Distributors, Inc.
225 Franklin Street Boston, MA 02110
Investment Manager
Columbia Management Investment Advisers, LLC
225 Franklin Street Boston, MA 02110
49

Columbia High Yield Municipal Fund
P.O. Box 8081
Boston, MA 02266-8081
columbiamanagement.com
This information is for use with concurrent or prior delivery of a fund prospectus. Investors should consider the investment objectives, risks, charges and expenses of a mutual fund carefully before investing. For a free prospectus, which contains this and other important information about the funds, visit columbiamanagement.com. Read the prospectus carefully before investing. The Fund is distributed by Columbia Management Investment Distributors, Inc., member FINRA, and managed by Columbia Management Investment Advisers, LLC.
©2011 Columbia Management Investment Advisers, LLC. All rights reserved.
C-1356 C (08/11)

Columbia Small Cap Value Fund I
Annual Report for the Period Ended June 30, 2011
Table of Contents
The views expressed in this report reflect the current views of the respective parties. These views are not guarantees of future performance and involve certain risks, uncertainties and assumptions that are difficult to predict, so actual outcomes and results may differ significantly from the views expressed. These views are subject to change at any time based upon economic, market or other conditions and the respective parties disclaim any responsibility to update such views. These views may not be relied on as investment advice and, because investment decisions for a Columbia Fund are based on numerous factors, may not be relied on as an indication of trading intent on behalf of any particular Columbia Fund. References to specific securities should not be construed as a recommendation or investment advice.
President’s Message

Dear Shareholder:
The Columbia Management story began over 100 years ago, and today, we are one of the nation’s largest dedicated asset managers. The recent acquisition by Ameriprise Financial, Inc. brings together the talents, resources and capabilities of Columbia Management with those of RiverSource Investments, Threadneedle (acquired by Ameriprise in 2003) and Seligman Investments (acquired by Ameriprise in 2008) to build a best-in-class asset management business that we believe is truly greater than its parts.
RiverSource Investments traces its roots to 1894 when its then newly-founded predecessor, Investors Syndicate, offered a face-amount savings certificate that gave small investors the opportunity to build a safe and secure fund for retirement, education or other special needs. A mutual fund pioneer, Investors Syndicate launched Investors Mutual Fund in 1940. In the decades that followed, its mutual fund products
and services lineup grew to include a full spectrum of styles and specialties. More than 110 years later, RiverSource continues to be a trusted financial products leader.
Threadneedle, a leader in global asset management and one of Europe’s largest asset managers, offers sophisticated international experience from a dedicated U.K. management team. Headquartered in London, it is named for Threadneedle Street in the heart of the city’s financial district, where British investors pioneered international and global investing. Threadneedle was acquired in 2003 and today operates as an affiliate of Columbia Management.
Seligman Investments’ beginnings date back to the establishment of the investment firm J. & W. Seligman & Co. in 1864. In the years that followed, Seligman played a major role in the geographical expansion and industrial development of the United States. In 1874, President Ulysses S. Grant named Seligman as fiscal agent for the U.S. Navy — an appointment that would last through World War I. Seligman helped finance the westward path of the railroads and the building of the Panama Canal. The firm organized its first investment company in 1929 and began managing its first mutual fund in 1930. In 2008, J. & W. Seligman & Co. Incorporated was acquired and Seligman Investments became an offering brand of RiverSource Investments, LLC.
We are proud of the rich and distinctive history of these firms, the strength and breadth of products and services they offer, and the combined cultures of pioneering spirit and forward thinking. Together we are committed to providing more for our shareholders than ever before.
| n | | A singular focus on our shareholders. Our business is asset management, so investors are our first priority. We dedicate our resources to identifying timely investment opportunities and provide a comprehensive choice of equity, fixed-income and alternative investments to help meet your individual needs. |
| n | | First-class research and thought leadership. We are dedicated to helping you take advantage of today’s opportunities and anticipate tomorrow’s. We stay abreast of the latest investment trends and ideas, using our collective insight to evaluate events and transform them into solutions you can use. |
| n | | A disciplined investment approach. We aren’t distracted by passing fads. Our teams adhere to a rigorous investment process that helps ensure the integrity of our products and enables you and your financial advisor to match our solutions to your objectives with confidence. |
When you choose Columbia Management, you can be confident that we will take the time to understand your needs and help you and your financial advisor identify the solutions that are right for you. Because at Columbia Management, we don’t consider ourselves successful unless you are.
Sincerely,

J. Kevin Connaughton
President, Columbia Funds
Investors should consider the investment objectives, risks, charges and expenses of a mutual fund carefully before investing. For a free prospectus, which contains this and other important information about the funds, visit www.columbiamanagement.com. The prospectus should be read carefully before investing.
Columbia Funds are distributed by Columbia Management Investment Distributors, Inc., member FINRA, and managed by Columbia Management Investment Advisers, LLC.
© 2011 Columbia Management Investment Advisers, LLC. All rights reserved.
Fund Profile – Columbia Small Cap Value Fund I
Performance data quoted represents past performance and current performance may be lower or higher. Past performance is no guarantee of future results. The investment return and principal value will fluctuate so that shares, when redeemed, may be worth more or less than the original cost. Please visit www.columbiamanagement.com for daily and most recent month-end performance updates.
Summary
1-year return as of 06/30/11
| | |
 | | +30.67% Class A shares (without sales charge) |
| |
| | +31.35% Russell 2000 Value Index |
|
Morningstar Style BoxTM |
|
Equity Style |
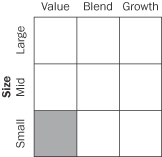
|
The Morningstar Style BoxTM is based on the fund’s portfolio holdings. For equity funds, the vertical axis shows the market capitalization of the stocks owned, and the horizontal axis shows investment style (value, blend, or growth). Information shown is based on the most recent data provided by Morningstar.
® 2011 Morningstar, Inc. All rights reserved. The Morningstar information contained herein: (1) is proprietary to Morningstar and/or its content providers; (2) may not be copied or distributed; and (3) is not warranted to be accurate, complete or timely. Neither Morningstar nor its content providers are responsible for any damages or losses arising from any use of this information.
Summary
| n | | For the 12-month period that ended June 30, 2011, the fund’s Class A shares returned 30.67% without sales charge. |
| n | | The fund’s performance was just short of the return of its benchmark, the Russell 2000 Value Index1 and the average return of competing funds in the Lipper Small-Cap Value Funds Classification.2 |
| n | | Favorable sector weights helped performance versus the Russell index, while stock selection was modestly disappointing. |
Portfolio Management
Stephen D. Barbaro has managed or co-managed the fund since 2002 and has been associated with the advisor since May 2010. Prior to joining the advisor, Mr. Barbaro was associated with the fund’s previous Investment Manager or its predecessors since 1976.
Jeremy H. Javidi has co-managed the fund since 2005 and has been associated with the advisor since May 2010. Prior to joining the advisor, Mr. Javidi was associated with the fund’s previous Investment Manager or its predecessors since 2000.
John S. Barrett has co-managed the fund since 2011 and has been associated with the advisor since May 2010. Prior to joining the advisor, Mr. Barrett was associated with the fund’s previous Investment Manager or its predecessors since 2003.
| 1 | The Russell 2000 Value Index tracks the performance of those Russell 2000 Index companies with lower price-to-book ratios and lower forecasted growth values. |
| 2 | Lipper Inc., a widely respected data provider in the industry, calculates an average total return (assuming reinvestment of distributions) for mutual funds with investment objectives similar to those of the fund. Lipper makes no adjustment for the effect of sales loads. |
Indices are not available for investment, are not professionally managed and do not reflect sales charges, fees, brokerage commissions, taxes or other expenses of investing. Securities in the fund may not match those in an index.
1
Performance Information – Columbia Small Cap Value Fund I
Performance data quoted represents past performance and current performance may be lower or higher. Past performance is no guarantee of future results. The investment return and principal value will fluctuate so that shares, when redeemed, may be worth more or less than the original cost. Please visit www.columbiamanagement.com for daily and most recent month-end performance updates.
| | | | |
| Net asset value per share | |
| |
as of 06/30/11 ($) | | | | |
| |
Class A | | | 46.21 | |
| |
Class B | | | 37.54 | |
| |
Class C | | | 39.73 | |
| |
Class I | | | 48.60 | |
| |
Class R | | | 46.23 | |
| |
Class Y | | | 48.60 | |
| |
Class Z | | | 48.53 | |
| | | | |
| Distributions declared per share | |
| |
07/01/10 – 06/30/11 ($) | | | | |
| |
Class A | | | 0.59 | |
| |
Class B | | | 0.30 | |
| |
Class C | | | 0.30 | |
| |
Class I | | | 0.76 | |
| |
Class R | | | 0.51 | |
| |
Class Y | | | 0.76 | |
| |
Class Z | | | 0.69 | |
|
| Performance of a $10,000 investment 07/01/01 – 06/30/11 |
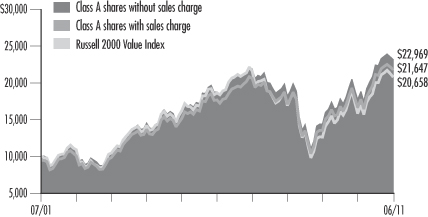
The chart above shows the change in value of a hypothetical $10,000 investment in Class A shares of Columbia Small Cap Value Fund I during the stated time period, and does not reflect the deduction of taxes that a shareholder may pay on fund distributions or on the redemption of fund shares.
| | | | | | | | |
| Performance of a $10,000 investment 07/01/01 – 06/30/11 ($) | |
| | |
| Sales charge | | without | | | with | |
Class A | | | 22,969 | | | | 21,647 | |
Class B | | | 21,314 | | | | 21,314 | |
Class C | | | 21,314 | | | | 21,314 | |
Class I | | | n/a | | | | n/a | |
Class R | | | n/a | | | | n/a | |
Class Y | | | 23,680 | | | | n/a | |
Class Z | | | 23,594 | | | | n/a | |
| | | | | | | | | | | | | | | | | | | | | | | | | | | | | | | | | | | | | | | | |
| Average annual total return as of 06/30/11 (%) | |
| | | | | | | |
| Share class | | A | | | B | | | C | | | I | | | R | | | Y | | | Z | |
| Inception | | 07/25/86 | | | 11/09/92 | | | 01/15/96 | | | 09/27/10 | | | 09/27/10 | | | 07/15/09 | | | 07/31/95 | |
Sales
charge | | without | | | with | | | without | | | with | | | without | | | with | | | without | | | without | | | without | | | without | |
1-year | | | 30.67 | | | | 23.15 | | | | 29.76 | | | | 24.76 | | | | 29.71 | | | | 28.71 | | | | n/a | | | | n/a | | | | 31.27 | | | | 31.00 | |
5-year | | | 4.29 | | | | 3.06 | | | | 3.51 | | | | 3.20 | | | | 3.51 | | | | 3.51 | | | | n/a | | | | n/a | | | | 4.63 | | | | 4.55 | |
10-year/
Life | | | 8.67 | | | | 8.03 | | | | 7.86 | | | | 7.86 | | | | 7.86 | | | | 7.86 | | | | 22.29 | | | | 21.68 | | | | 9.00 | | | | 8.96 | |
The “with sales charge” returns include the maximum initial sales charge of 5.75% for Class A shares and the applicable contingent deferred sales charge of 5.00% in the first year, declining to 1.00% in the sixth year and eliminated thereafter for Class B shares and 1.00% for Class C shares for the first year only. The “without sales charge” returns do not include the effect of sales charges. If they had, returns would be lower.
Performance results reflect any fee waivers or reimbursements of fund expenses by the Investment Manager and/or any of its affiliates. Absent these fee waivers or expense reimbursement arrangements, performance results would have been lower.
All results shown assume reinvestment of distributions. Class I, Class Y and Class Z shares are sold at net asset value with no distribution and service (Rule 12b-1) fees. Class R shares are sold at net asset value with a distribution (Rule 12b-1) fee. Class I, Class R, Class Y and Class Z shares have limited eligibility and the investment minimum requirements may vary. Please see the fund’s prospectus for details. Performance for different share classes will vary based on differences in sales charges and fees associated with each class.
The tables do not reflect the deduction of taxes that a shareholder may pay on fund distributions or on the redemption of fund shares.
The returns for Class Y shares include the returns for Class Z shares for the periods prior to July 15, 2009. The returns shown have not been adjusted to reflect any differences in expenses between Class Y shares and Class Z shares. Class Y shares commenced operations on July 15, 2009. Class I and Class R shares commenced operations on September 27, 2010.
2
Understanding Your Expenses – Columbia Small Cap Value Fund I
As a fund shareholder, you incur two types of costs. There are transaction costs, which generally include sales charges on purchases and may include redemption fees or exchange fees. There are also ongoing costs, which generally include investment advisory fees, distribution and service (Rule 12b-1) fees and other fund expenses. The information on this page is intended to help you understand the ongoing costs of investing in the fund and to compare these costs with the ongoing costs of investing in other mutual funds.
Analyzing your fund’s expenses by share class
To illustrate these ongoing costs, we have provided an example and calculated the expenses paid by investors in each share class during the period. The information in the following table is based on an initial investment of $1,000, which is invested at the beginning of the period and held for the entire period. Expense information is calculated two ways and each method provides you with different information. The amount listed in the “Actual” column is calculated using the fund’s actual operating expenses and total return for the period. The amount listed in the “Hypothetical” column for each share class assumes that the return each year is 5% before expenses and is calculated based on the fund’s actual operating expenses. You should not use the hypothetical account values and expenses to estimate either your actual account balance at the end of the period or the expenses you paid during this period.
Compare with other funds
Since all mutual funds are required to include the same hypothetical calculations about expenses in shareholder reports, you can use this information to compare the ongoing costs of investing in the fund with other funds. To do so, compare the 5% hypothetical example with the 5% hypothetical examples that appear in the shareholder reports of other funds. As you compare hypothetical examples of other funds, it is important to note that hypothetical examples are meant to highlight the ongoing costs of investing in a fund and do not reflect any transaction costs, such as sales charges, redemption fees or exchange fees.
Estimating your actual expenses
To estimate the expenses that you paid over the period, first you will need your account balance at the end of the period:
| | n | | For shareholders who receive their account statements from Columbia Management Investment Services Corp., your account balance is available online at www.columbiamanagement.com or by calling Shareholder Services at 800.345.6611. | |
| | n | | For shareholders who receive their account statements from their financial intermediary, contact your financial intermediary firm to obtain your account balance. | |
| | 1. | Divide your ending account balance by $1,000. For example, if an account balance was $8,600 at the end of the period, the result would be 8.6. | |
| | 2. | In the section of the table below titled “Expenses paid during the period,” locate the amount for your share class. You will find this number in the column labeled “Actual.” Multiply this number by the result from step 1. Your answer is an estimate of the expenses you paid on your account during the period. | |
If the value of your account falls below the minimum initial investment requirement applicable to you, your account may be subject to a $20 annual fee. This fee is not included in the accompanying table. If you are subject to the fee, keep it in mind when you are estimating the ongoing expenses of investing in the fund and when comparing the expenses of this fund with other funds.
| | | | | | | | | | | | | | | | | | | | | | | | | | | | |
| 01/01/11 – 06/30/11 | |
| | | | |
| | | Account value at the
beginning of the period ($) | | | Account value at the end of the period ($) | | | Expenses paid during the period ($) | | | Fund’s annualized
expense ratio (%) | |
| | | Actual | | | Hypothetical | | | Actual | | | Hypothetical | | | Actual | | | Hypothetical | | | Actual | |
Class A | | | 1,000.00 | | | | 1,000.00 | | | | 1,032.20 | | | | 1,018.50 | | | | 6.40 | | | | 6.36 | | | | 1.27 | |
Class B | | | 1,000.00 | | | | 1,000.00 | | | | 1,028.50 | | | | 1,014.78 | | | | 10.16 | | | | 10.09 | | | | 2.02 | |
Class C | | | 1,000.00 | | | | 1,000.00 | | | | 1,028.20 | | | | 1,014.78 | | | | 10.16 | | | | 10.09 | | | | 2.02 | |
Class I | | | 1,000.00 | | | | 1,000.00 | | | | 1,034.50 | | | | 1,020.68 | | | | 4.19 | | | | 4.16 | | | | 0.83 | |
Class R | | | 1,000.00 | | | | 1,000.00 | | | | 1,031.50 | | | | 1,017.21 | | | | 7.71 | | | | 7.65 | | | | 1.53 | |
Class Y | | | 1,000.00 | | | | 1,000.00 | | | | 1,034.50 | | | | 1,020.73 | | | | 4.14 | | | | 4.11 | | | | 0.82 | |
Class Z | | | 1,000.00 | | | | 1,000.00 | | | | 1,033.40 | | | | 1,019.74 | | | | 5.14 | | | | 5.11 | | | | 1.02 | |
Expenses paid during the period are equal to the annualized expense ratio for the share class, multiplied by the average account value over the period, then multiplied by the number of days in the fund’s most recent fiscal half-year and divided by 365.
Had the Investment Manager and/or any of its affiliates not waived fees or reimbursed a portion of expenses, account value at the end of the period would have been reduced.
It is important to note that the expense amounts shown in the table are meant to highlight only ongoing costs of investing in the fund and do not reflect any transaction costs, such as sales charges, redemption fees or exchange fees. Therefore, the hypothetical examples provided may not help you determine the relative total costs of owning shares of different funds. If these transaction costs were included, your costs would have been higher.
3
Portfolio Managers’ Report – Columbia Small Cap Value Fund I
Performance data quoted represents past performance and current performance may be lower or higher. Past performance is no guarantee of future results. The investment return and principal value will fluctuate so that shares, when redeemed, may be worth more or less than the original cost. Please visit www.columbiamanagement.com for daily and most recent month-end performance updates.
| | | | |
| Top 10 holdings | | | |
| |
As of 06/30/11 (%) | | | | |
| |
Healthspring | | | 1.2 | |
| |
OM Group | | | 1.2 | |
| |
Global Indemnity | | | 1.0 | |
| |
Cash America International | | | 0.9 | |
| |
Greif | | | 0.9 | |
| |
Rent-A-Center | | | 0.8 | |
| |
Robbins & Myers | | | 0.8 | |
| |
Stone Energy | | | 0.8 | |
| |
DiamondRock Hospitality | | | 0.7 | |
| |
Hancock Holding | | | 0.7 | |
| | | | |
| Top 5 Sectors | | | |
| |
As of 06/30/11 (%) | | | | |
| |
Financials | | | 27.8 | |
| |
Industrials | | | 17.0 | |
| |
Information Technology | | | 14.4 | |
| |
Health Care | | | 9.7 | |
| |
Consumer Discretionary | | | 9.7 | |
The fund is actively managed and the composition of its portfolio will change over time. Information provided is calculated as a percentage of net assets.
For the 12-month period that ended June 30, 2011, the fund’s Class A shares returned 30.67% without sales charge. By comparison, the fund’s benchmark, the Russell 2000 Value Index, returned 31.35%. The average return of competing funds was 32.03%, as measured by the Lipper Small-Cap Value Funds Classification. Sector allocations aided results versus the index, as the fund favored sectors that would benefit from a gradual economic recovery. Stock selection, however, nicked performance mainly due to underperformance in financials and materials. We believe our focus on high quality small-cap companies with strong balance sheets and good cash flows whose stocks were selling at a discount hindered performance versus the Lipper peer group, as many of the fund’s competitors had larger average market caps and higher exposure to lower quality stocks, both of which outperformed higher quality smaller caps. In addition, stocks whose prices were generally outperforming beat the out-of-favor types of names the fund tends to own.
Backdrop of a sluggish expansion
As the impact of Japan’s first-quarter natural disasters worked its way through the global supply chain and Europe scrambled, once again, to prop up debtor nations — notably Greece — the pace of economic growth slowed around the world. In the United States, unfriendly spring storms cut a swath of destruction across the Midwest, as well as southern and eastern coastal states, while Washington wrangled over the deficit and the federal debt ceiling.
Against this backdrop, the U.S. economy expanded at an estimated 1.6% over the past 12 months, as measured by gross domestic product (GDP). Growth picked up in the third and fourth quarters of 2010, but concerns emerged as the housing market continued its five-year slide and the job market disappointed with fewer-than-expected new jobs and higher unemployment at the end of the period. Even though news on the job front was positive, the number of new jobs added was significantly below expectations for this stage of an economic recovery. Disappointingly low figures for May and June and a hike in the unemployment rate were especially troubling. Yet, with corporate profits expanding at a solid pace, hope remained for a better second half showing in 2011.
Personal income surged in January as payroll tax cuts kicked in, and it continued to edge higher through the end of the period. With incomes on the rise, consumer spending on cars, clothing and other goods trended upward during the 12-month period. However, rising food and energy costs generally offset income gains and spending, in real terms, was flat to down.
On June 30, 2011, the Federal Reserve Board ended its program of large-scale Treasury purchases aimed at shoring up the economy and building confidence in the markets. Even though it did not do much to lift growth, it quelled fears of a relapse into recession and helped push stocks sharply higher. The buyback program also led to a strong rise in commodity prices and a reduction in interest rates. GDP expanded at a mere 0.40% in the first quarter of 2011 with second quarter growth estimated at 1.3%.
Small-cap stocks outperform large
Stocks rallied sharply for the first six months of the period, but were more volatile in the second half as weather-related events in Japan and the U.S. distorted some year-over-year comparisons. Riskier assets — including small-cap stocks — benefited once the Fed decided to pump more liquidity into the system through the Treasury purchase program. Materials and energy were among the top performing sectors in the Russell 2000 Value Index. Health care stocks also generated robust gains, as investors began realizing that health care reform was not going to be the headwind they had originally expected. Within the index, all three sectors posted returns of 50% or more for the year.
4
Portfolio Managers’ Report (continued) – Columbia Small Cap Value Fund I
Biggest gains from energy and health care
Strong security selection in the energy sector had the biggest positive impact on performance. Top contributors included International Coal, a coal producer that was taken over at a big premium, and Stone Energy (0.8% of net assets), a domestic oil and gas producer benefiting from drilling success and an acquisition that significantly improved its reserve position. International Coal was no longer held at period end. The fund also picked up ground from having an overweight in health care, where performance nearly matched that of the sector within the index. Top contributors included Healthspring (1.2% of net assets), a managed care company that recently made a big acquisition and benefited from favorable investor sentiment.
Underperformance from financials and materials
The fund lost ground versus the index in financials, where lower interest rates hurt many of its holdings. Disappointments included Bank Mutual (0.4% of net assets), a thrift in Wisconsin, and Knight Capital (0.6% of net assets), a capital markets company. Bank Mutual was hurt by increased loan delinquencies, as home prices continued to decline and the state’s economic conditions remained distressed. Knight Capital suffered as trading volumes fell. Returns from the materials sector were quite strong, but lagged those in the index. The fund, however, offset some of this underperformance by having an overweight in this leading sector and holding some strong performers. Among the latter was OM Group (1.2% of net assets), a company that supplies cobalt, which is used in rechargeable batteries. OM Group moved sharply higher, thanks to strong sales growth, driven by growing demand for rechargeable batteries. Elsewhere, detractors included office supply store OfficeMax (0.4% of net assets), which missed first-quarter earnings estimates due to weak employment trends. In industrials, Broadwind Energy (0.3% of net assets), which supplies towers and gear for wind turbines, fell short of expectations, due in part to uncertainty around the tax benefits for wind farms.
Positioned for slow improvement in economy
Going forward, we expect continued general improvement in the economy, although we think growth will be slow. The fund ended the period with modest overweights in more economically sensitive sectors, such as technology, materials, energy and industrials. Whether or not the market remains volatile in the near term, we plan to stick with our long-term focus on high quality companies with strong balance sheets, tremendous free cash flow and reasonably valued stocks. Although the market has had a strong run this past year, we continue to find attractively priced securities that meet these investment criteria.
Portfolio characteristics and holdings are subject to change periodically and may not be representative of current characteristics and holdings. The outlook for the fund may differ from that presented for other Columbia Funds.
Equity securities are subject to stock market fluctuations that occur in response to economic and business developments.
Investments in small-cap stocks may be subject to greater volatility and price fluctuations because they may be thinly traded and less liquid than investments in larger companies.
Value stocks are stocks of companies that may have experienced adverse business or industry developments or may be subject to special risks that have caused the stocks to be out of favor. If the manager’s assessment of a company’s prospects is wrong, the price of its stock may not approach the value the manager has placed on it.
5
Portfolio of Investments – Columbia Small Cap Value Fund I
June 30, 2011
(Percentages represent value of investments compared to net assets)
| | | | | | | | |
| Issuer | | Shares | | | Value | |
Common Stocks 99.9% | | | | | | | | |
Consumer Discretionary 9.7% | | | | | | | | |
Diversified Consumer Services 0.6% | | | | | | | | |
Lincoln Educational Services Corp.(a) | | | 322,883 | | | | $5,537,443 | |
Regis Corp.(a) | | | 402,196 | | | | 6,161,643 | |
| | | | | | | | |
Total | | | | | | | 11,699,086 | |
Hotels, Restaurants & Leisure 1.5% | | | | | | | | |
Benihana, Inc., Class A(b) | | | 513,250 | | | | 5,383,992 | |
Bob Evans Farms, Inc.(a) | | | 290,211 | | | | 10,148,679 | |
PF Chang’s China Bistro, Inc.(a) | | | 177,590 | | | | 7,146,222 | |
Red Robin Gourmet Burgers, Inc.(a)(b) | | | 193,221 | | | | 7,029,380 | |
| | | | | | | | |
Total | | | | | | | 29,708,273 | |
Household Durables 1.1% | | | | | | | | |
American Greetings Corp., Class A(a) | | | 305,800 | | | | 7,351,432 | |
Cavco Industries, Inc.(a)(b) | | | 159,045 | | | | 7,157,025 | |
CSS Industries, Inc. | | | 287,103 | | | | 6,009,066 | |
| | | | | | | | |
Total | | | | | | | 20,517,523 | |
Leisure Equipment & Products 0.4% | | | | | | | | |
JAKKS Pacific, Inc.(a)(b) | | | 466,597 | | | | 8,590,051 | |
Specialty Retail 5.2% | | | | | | | | |
Aaron’s, Inc.(a) | | | 307,860 | | | | 8,700,124 | |
America’s Car-Mart, Inc.(a)(b) | | | 248,695 | | | | 8,206,935 | |
Childrens Place Retail Stores, Inc.(The)(a)(b) | | | 129,990 | | | | 5,783,255 | |
Finish Line, Inc., Class A(The) | | | 486,754 | | | | 10,416,536 | |
GameStop Corp., Class A(a)(b) | | | 282,803 | | | | 7,542,356 | |
hhgregg, Inc.(a)(b) | | | 472,945 | | | | 6,337,463 | |
Men’s Wearhouse, Inc.(The)(a) | | | 342,436 | | | | 11,540,093 | |
OfficeMax, Inc.(a)(b) | | | 975,640 | | | | 7,658,774 | |
Pacific Sunwear of California, Inc.(a)(b) | | | 1,880,082 | | | | 4,907,014 | |
RadioShack Corp.(a) | | | 441,230 | | | | 5,872,771 | |
Rent-A-Center, Inc.(a) | | | 519,565 | | | | 15,877,906 | |
Shoe Carnival, Inc.(a)(b) | | | 301,140 | | | | 9,079,371 | |
| | | | | | | | |
Total | | | | | | | 101,922,598 | |
Textiles, Apparel & Luxury Goods 0.9% | | | | | | | | |
Jones Group, Inc.(The) | | | 878,340 | | | | 9,529,989 | |
Movado Group, Inc.(a) | | | 465,155 | | | | 7,958,802 | |
| | | | | | | | |
Total | | | | | | | 17,488,791 | |
Total Consumer Discrectionary | | | | | | | 189,926,322 | |
Consumer Staples 2.1% | | | | | | | | |
Food & Staples Retailing 1.4% | | | | | | | | |
Andersons, Inc.(The)(a) | | | 213,140 | | | | 9,005,165 | |
Ruddick Corp.(a) | | | 246,010 | | | | 10,711,275 | |
Spartan Stores, Inc.(a) | | | 402,456 | | | | 7,859,966 | |
| | | | | | | | |
Total | | | | | | | 27,576,406 | |
Food Products 0.7% | | | | | | | | |
Chiquita Brands International, Inc.(b) | | | 80,882 | | | | 1,053,084 | |
Fresh Del Monte Produce, Inc.(a)(d) | | | 444,627 | | | | 11,858,202 | |
| | | | | | | | |
Total | | | | | | | 12,911,286 | |
Total Consumer Staples | | | | | | | 40,487,692 | |
Energy 7.2% | | | | | | | | |
Energy Equipment & Services 2.5% | | | | | | | | |
Cal Dive International, Inc.(a)(b) | | | 1,282,730 | | | | 7,670,726 | |
| | | | | | | | |
| Issuer | | Shares | | | Value | |
Common Stocks (continued) | | | | | | | | |
Energy (cont.) | | | | | | | | |
Energy Equipment & Services (cont.) | | | | | | | | |
Gulf Island Fabrication, Inc.(a) | | | 348,690 | | | | $11,255,713 | |
Matrix Service Co.(a)(b) | | | 500,400 | | | | 6,695,352 | |
TGC Industries, Inc.(b) | | | 832,517 | | | | 5,319,784 | |
Tidewater, Inc. | | | 148,930 | | | | 8,013,923 | |
Union Drilling, Inc.(b) | | | 899,228 | | | | 9,253,056 | |
| | | | | | | | |
Total | | | | | | | 48,208,554 | |
Oil, Gas & Consumable Fuels 4.7% | | | | | | | | |
Berry Petroleum Co., Class A(a) | | | 216,880 | | | | 11,522,834 | |
Bill Barrett Corp.(a)(b) | | | 245,770 | | | | 11,391,439 | |
Cloud Peak Energy, Inc.(a)(b) | | | 381,324 | | | | 8,122,201 | |
James River Coal Co.(a)(b) | | | 449,850 | | | | 9,365,877 | |
Nordic American Tanker Shipping Ltd.(a)(d) | | | 415,190 | | | | 9,441,421 | |
Stone Energy Corp.(a)(b) | | | 487,658 | | | | 14,819,927 | |
Swift Energy Co.(a)(b) | | | 307,869 | | | | 11,474,278 | |
VAALCO Energy, Inc.(a)(b) | | | 1,052,987 | | | | 6,338,982 | |
World Fuel Services Corp.(a) | | | 295,523 | | | | 10,618,141 | |
| | | | | | | | |
Total | | | | | | | 93,095,100 | |
Total Energy | | | | | | | 141,303,654 | |
Financials 27.8% | | | | | | | | |
Capital Markets 2.4% | | | | | | | | |
GFI Group, Inc.(a) | | | 1,588,260 | | | | 7,290,113 | |
INTL FCStone, Inc.(a)(b) | | | 391,808 | | | | 9,485,672 | |
Investment Technology Group, Inc.(a)(b) | | | 548,775 | | | | 7,693,826 | |
Knight Capital Group, Inc., Class A(b) | | | 1,011,900 | | | | 11,151,138 | |
Medallion Financial Corp.(a) | | | 461,621 | | | | 4,500,805 | |
Piper Jaffray Companies(a)(b) | | | 241,130 | | | | 6,946,955 | |
| | | | | | | | |
Total | | | | | | | 47,068,509 | |
Commercial Banks 6.5% | | | | | | | | |
Ameris Bancorp(b) | | | 692,161 | | | | 6,139,468 | |
BancFirst Corp.(a) | | | 185,401 | | | | 7,156,479 | |
BancTrust Financial Group, Inc.(a)(b) | | | 472,658 | | | | 1,214,731 | |
Bryn Mawr Bank Corp. | | | 367,216 | | | | 7,436,124 | |
Chemical Financial Corp.(a) | | | 449,953 | | | | 8,441,118 | |
Columbia Banking System, Inc.(a) | | | 480,335 | | | | 8,271,369 | |
Community Trust Bancorp, Inc.(a) | | | 295,954 | | | | 8,203,845 | |
First Citizens BancShares Inc., Class A | | | 47,388 | | | | 8,871,981 | |
First Commonwealth Financial Corp.(a) | | | 1,606,314 | | | | 9,220,242 | |
First Financial Corp.(a) | | | 329,376 | | | | 10,783,770 | |
First National Bank of Alaska | | | 2,615 | | | | 4,340,900 | |
Hancock Holding Co. | | | 437,128 | | | | 13,542,226 | |
Investors Bancorp, Inc.(a)(b) | | | 495,743 | | | | 7,039,551 | |
Merchants Bancshares, Inc. | | | 293,655 | | | | 7,185,738 | |
Northfield Bancorp, Inc.(a) | | | 404,755 | | | | 5,690,855 | |
Northrim BanCorp, Inc.(c) | | | 365,461 | | | | 6,932,795 | |
West Coast Bancorp(a)(b) | | | 376,028 | | | | 6,302,229 | |
| | | | | | | | |
Total | | | | | | | 126,773,421 | |
Consumer Finance 0.9% | | | | | | | | |
Cash America International, Inc.(a) | | | 302,789 | | | | 17,522,399 | |
Diversified Financial Services 0.2% | | | | | | | | |
Pico Holdings, Inc.(a)(b) | | | 147,338 | | | | 4,272,802 | |
Insurance 7.9% | | | | | | | | |
Allied World Assurance Co. Holdings AG(d) | | | 125,940 | | | | 7,251,625 | |
The Accompanying Notes to Financial Statements are an integral part of this statement
6
Columbia Small Cap Value Fund I
June 30, 2011
(Percentages represent value of investments compared to net assets)
| | | | | | | | |
| Issuer | | Shares | | | Value | |
Common Stocks (continued) | | | | | | | | |
Financials (cont.) | | | | | | | | |
Insurance (cont.) | | | | | | | | |
American Safety Insurance Holdings Ltd.(b)(d) | | | 430,400 | | | | $8,237,856 | |
Argo Group International Holdings Ltd.(a)(d) | | | 335,070 | | | | 9,958,280 | |
Baldwin & Lyons, Inc., Class B(a) | | | 293,562 | | | | 6,801,832 | |
eHealth, Inc.(a)(b) | | | 720,380 | | | | 9,624,277 | |
EMC Insurance Group, Inc.(a) | | | 328,776 | | | | 6,279,622 | |
Endurance Specialty Holdings Ltd.(d) | | | 131,140 | | | | 5,420,016 | |
FBL Financial Group, Inc., Class A | | | 319,165 | | | | 10,261,155 | |
Global Indemnity PLC (b)(d) | | | 854,189 | | | | 18,945,912 | |
Hanover Insurance Group, Inc.(The)(a) | | | 208,433 | | | | 7,860,008 | |
Harleysville Group, Inc.(a) | | | 146,535 | | | | 4,567,496 | |
Horace Mann Educators Corp.(a) | | | 550,551 | | | | 8,594,101 | |
National Western Life Insurance Co., Class A(a) | | | 36,513 | | | | 5,822,728 | |
Navigators Group, Inc.(The)(a)(b) | | | 183,081 | | | | 8,604,807 | |
Old Republic International Corp.(a) | | | 458,380 | | | | 5,385,965 | |
Safety Insurance Group, Inc.(a) | | | 231,391 | | | | 9,727,678 | |
Stewart Information Services Corp.(a) | | | 468,697 | | | | 4,701,031 | |
Symetra Financial Corp.(a) | | | 531,422 | | | | 7,136,997 | |
United Fire & Casualty Co.(a) | | | 519,396 | | | | 9,021,909 | |
| | | | | | | | |
Total | | | | | | | 154,203,295 | |
Real Estate Investment Trusts (REITs) 5.4% | | | | | | | | |
Chesapeake Lodging Trust(a) | | | 590,492 | | | | 10,073,794 | |
Cousins Properties, Inc.(a) | | | 1,087,990 | | | | 9,291,435 | |
DiamondRock Hospitality Co.(a) | | | 1,262,999 | | | | 13,551,979 | |
Franklin Street Properties Corp.(a) | | | 524,752 | | | | 6,774,548 | |
Getty Realty Corp.(a) | | | 226,356 | | | | 5,710,962 | |
National Health Investors, Inc.(a) | | | 179,878 | | | | 7,991,980 | |
Potlatch Corp.(a) | | | 331,331 | | | | 11,686,044 | |
Starwood Property Trust, Inc. | | | 518,080 | | | | 10,625,821 | |
Sunstone Hotel Investors, Inc.(a)(b) | | | 1,213,593 | | | | 11,250,007 | |
Terreno Realty Corp.(c) | | | 500,289 | | | | 8,509,916 | |
Universal Health Realty Income Trust(a) | | | 133,883 | | | | 5,352,642 | |
Urstadt Biddle Properties, Inc., Class A(a) | | | 322,482 | | | | 5,840,149 | |
| | | | | | | | |
Total | | | | | | | 106,659,277 | |
Real Estate Management & Development 0.2% | | | | | |
Avatar Holdings, Inc.(a)(b) | | | 302,171 | | | | 4,596,021 | |
Thrifts & Mortgage Finance 4.3% | | | | | | | | |
Bank Mutual Corp.(a) | | | 1,680,153 | | | | 6,166,161 | |
BankFinancial Corp. | | | 944,791 | | | | 8,002,380 | |
Beneficial Mutual Bancorp, Inc.(a)(b) | | | 994,146 | | | | 8,166,909 | |
Brookline Bancorp, Inc.(a) | | | 1,073,265 | | | | 9,949,167 | |
Clifton Savings Bancorp, Inc.(a) | | | 541,518 | | | | 5,978,359 | |
ESSA Bancorp, Inc.(a) | | | 454,219 | | | | 5,641,400 | |
Home Federal Bancorp, Inc. | | | 747,374 | | | | 8,213,640 | |
MGIC Investment Corp.(a)(b) | | | 974,450 | | | | 5,797,977 | |
TrustCo Bank Corp.(a) | | | 948,319 | | | | 4,646,763 | |
United Financial Bancorp, Inc.(a) | | | 358,713 | | | | 5,534,942 | |
Washington Federal, Inc.(a) | | | 529,671 | | | | 8,702,495 | |
Westfield Financial, Inc.(a) | | | 904,911 | | | | 7,347,877 | |
| | | | | | | | |
Total | | | | | | | 84,148,070 | |
Total Financials | | | | | | | 545,243,794 | |
Health Care 9.7% | | | | | | | | |
Health Care Equipment & Supplies 3.1% | | | | | | | | |
Analogic Corp.(a) | | | 105,519 | | | | 5,549,244 | |
| | | | | | | | |
| Issuer | | Shares | | | Value | |
Common Stocks (continued) | | | | | | | | |
Health Care (cont.) | | | | | | | | |
Health Care Equipment & Supplies (cont.) | | | | | | | | |
Angiodynamics, Inc.(a)(b) | | | 397,449 | | | | $5,655,700 | |
Cantel Medical Corp.(a) | | | 309,043 | | | | 8,316,347 | |
ICU Medical, Inc.(a)(b) | | | 155,014 | | | | 6,774,112 | |
Kensey Nash Corp.(a)(b) | | | 261,578 | | | | 6,599,613 | |
Medical Action Industries, Inc.(a)(b) | | | 605,593 | | | | 4,935,583 | |
Orthofix International NV(a)(b)(d) | | | 148,845 | | | | 6,321,447 | |
Quidel Corp.(a)(b) | | | 446,180 | | | | 6,759,627 | |
Symmetry Medical, Inc.(a)(b) | | | 580,760 | | | | 5,209,417 | |
Young Innovations, Inc.(a) | | | 154,333 | | | | 4,401,577 | |
| | | | | | | | |
Total | | | | | | | 60,522,667 | |
Health Care Providers & Services 4.8% | | | | | | | | |
Amsurg Corp.(a)(b) | | | 362,001 | | | | 9,459,086 | |
Centene Corp.(a)(b) | | | 272,830 | | | | 9,693,650 | |
Healthspring, Inc.(a)(b) | | | 527,627 | | | | 24,328,881 | |
Kindred Healthcare, Inc.(a)(b) | | | 545,140 | | | | 11,704,156 | |
Magellan Health Services, Inc.(a)(b) | | | 195,030 | | | | 10,675,942 | |
Medcath Corp.(a)(b) | | | 588,080 | | | | 7,992,007 | |
Owens & Minor, Inc.(a) | | | 245,735 | | | | 8,475,400 | |
Triple-S Management Corp., Class B(a)(b) | | | 259,910 | | | | 5,647,845 | |
U.S. Physical Therapy, Inc.(a) | | | 261,566 | | | | 6,468,527 | |
| | | | | | | | |
Total | | | | | | | 94,445,494 | |
Pharmaceuticals 1.8% | | | | | | | | |
Impax Laboratories, Inc.(a)(b) | | | 295,910 | | | | 6,447,879 | |
Medicis Pharmaceutical Corp., Class A(a) | | | 297,120 | | | | 11,341,070 | |
Par Pharmaceutical Companies, Inc.(a)(b) | | | 213,130 | | | | 7,029,027 | |
Viropharma, Inc.(b) | | | 571,589 | | | | 10,574,397 | |
| | | | | | | | |
Total | | | | | | | 35,392,373 | |
Total Health Care | | | | | | | 190,360,534 | |
Industrials 17.0% | | | | | | | | |
Aerospace & Defense 1.4% | | | | | | | | |
AAR Corp.(a) | | | 273,708 | | | | 7,414,750 | |
Ceradyne, Inc.(a)(b) | | | 294,702 | | | | 11,490,431 | |
Curtiss-Wright Corp.(a) | | | 275,520 | | | | 8,918,582 | |
| | | | | | | | |
Total | | | | | | | 27,823,763 | |
Building Products 1.0% | | | | | | | | |
Ameron International Corp.(a) | | | 128,810 | | | | 8,460,241 | |
AO Smith Corp.(a) | | | 134,700 | | | | 5,697,810 | |
Universal Forest Products, Inc.(a) | | | 232,781 | | | | 5,577,433 | |
| | | | | | | | |
Total | | | | | | | 19,735,484 | |
Commercial Services & Supplies 2.4% | | | | | | | | |
ABM Industries, Inc.(a) | | | 369,470 | | | | 8,623,430 | |
Consolidated Graphics, Inc.(a)(b) | | | 140,104 | | | | 7,698,715 | |
Ennis, Inc.(a) | | | 323,439 | | | | 5,627,839 | |
G&K Services, Inc., Class A(a) | | | 191,456 | | | | 6,482,700 | |
Unifirst Corp.(a) | | | 148,662 | | | | 8,353,318 | |
United Stationers, Inc.(a) | | | 271,520 | | | | 9,619,953 | |
| | | | | | | | |
Total | | | | | | | 46,405,955 | |
Construction & Engineering 2.2% | | | | | | | | |
Comfort Systems U.S.A., Inc.(a) | | | 466,651 | | | | 4,951,167 | |
Dycom Industries, Inc.(a)(b) | | | 675,141 | | | | 11,031,804 | |
EMCOR Group, Inc.(a)(b) | | | 185,630 | | | | 5,440,815 | |
The Accompanying Notes to Financial Statements are an integral part of this statement
7
Columbia Small Cap Value Fund I
June 30, 2011
(Percentages represent value of investments compared to net assets)
| | | | | | | | |
| Issuer | | Shares | | | Value | |
Common Stocks (continued) | | | | | | | | |
Industrials (cont.) | | | | | | | | |
Construction & Engineering (cont.) | | | | | | | | |
KHD Humboldt Wedag International AG(b)(d) | | | 384,023 | | | | $3,397,034 | |
Layne Christensen Co.(a)(b) | | | 226,720 | | | | 6,878,685 | |
Pike Electric Corp.(a)(b) | | | 636,543 | | | | 5,627,040 | |
Sterling Construction Co., Inc.(a)(b) | | | 375,949 | | | | 5,176,818 | |
| | | | | | | | |
Total | | | | | | | 42,503,363 | |
Electrical Equipment 1.8% | | | | | | | | |
Belden, Inc.(a) | | | 205,121 | | | | 7,150,518 | |
Brady Corp., Class A(a) | | | 223,450 | | | | 7,163,807 | |
Broadwind Energy, Inc.(a)(b) | | | 4,026,014 | | | | 5,837,720 | |
GrafTech International Ltd.(a)(b) | | | 432,076 | | | | 8,758,181 | |
Powell Industries, Inc.(a)(b) | | | 163,294 | | | | 5,960,231 | |
| | | | | | | | |
Total | | | | | | | 34,870,457 | |
Machinery 4.3% | | | | | | | | |
Astec Industries, Inc.(a)(b) | | | 208,688 | | | | 7,717,282 | |
CIRCOR International, Inc.(a) | | | 192,560 | | | | 8,247,345 | |
EnPro Industries, Inc.(a)(b) | | | 250,862 | | | | 12,058,936 | |
FreightCar America, Inc.(a)(b) | | | 239,661 | | | | 6,073,010 | |
Harsco Corp.(a) | | | 216,747 | | | | 7,065,952 | |
Kadant, Inc.(a)(b) | | | 348,041 | | | | 10,966,772 | |
LB Foster Co., Class A(a) | | | 187,890 | | | | 6,183,460 | |
Mueller Industries, Inc.(a) | | | 305,160 | | | | 11,568,616 | |
Robbins & Myers, Inc.(a) | | | 287,684 | | | | 15,204,099 | |
| | | | | | | | |
Total | | | | | | | 85,085,472 | |
Marine 0.3% | | | | | | | | |
Diana Shipping, Inc.(a)(b)(d) | | | 556,790 | | | | 6,102,418 | |
Professional Services 1.3% | | | | | | | | |
CDI Corp.(a) | | | 254,665 | | | | 3,384,498 | |
FTI Consulting, Inc.(a)(b) | | | 246,750 | | | | 9,361,695 | |
Korn/Ferry International(a)(b) | | | 362,521 | | | | 7,971,837 | |
Navigant Consulting, Inc.(a)(b) | | | 555,560 | | | | 5,827,824 | |
| | | | | | | | |
Total | | | | | | | 26,545,854 | |
Road & Rail 1.4% | | | | | | | | |
Heartland Express, Inc.(a) | | | 348,964 | | | | 5,778,844 | |
Ryder System, Inc. | | | 143,399 | | | | 8,152,233 | |
Werner Enterprises, Inc.(a) | | | 517,019 | | | | 12,951,326 | |
| | | | | | | | |
Total | | | | | | | 26,882,403 | |
Trading Companies & Distributors 0.9% | | | | | | | | |
Applied Industrial Technologies, Inc.(a) | | | 234,410 | | | | 8,347,340 | |
Kaman Corp. | | | 273,622 | | | | 9,705,372 | |
| | | | | | | | |
Total | | | | | | | 18,052,712 | |
Total Industrials | | | | | | | 334,007,881 | |
Information Technology 14.4% | | | | | | | | |
Communications Equipment 2.0% | | | | | | | | |
Anaren, Inc.(a)(b) | | | 307,970 | | | | 6,544,362 | |
Bel Fuse, Inc., Class B(a) | | | 209,477 | | | | 4,543,556 | |
Black Box Corp.(a) | | | 223,103 | | | | 6,976,431 | |
Plantronics, Inc.(a) | | | 160,063 | | | | 5,847,101 | |
Symmetricom, Inc.(a)(b) | | | 820,730 | | | | 4,784,856 | |
Tekelec(a)(b) | | | 555,750 | | | | 5,073,998 | |
Tellabs, Inc. | | | 1,314,010 | | | | 6,057,586 | |
| | | | | | | | |
Total | | | | | | | 39,827,890 | |
| | | | | | | | |
| Issuer | | Shares | | | Value | |
Common Stocks (continued) | | | | | | | | |
Information Technology (cont.) | | | | | | | | |
Electronic Equipment, Instruments & Components 3.3% | | | | | |
Anixter International, Inc.(a) | | | 157,598 | | | | $10,297,453 | |
Benchmark Electronics, Inc.(a)(b) | | | 542,732 | | | | 8,955,078 | |
Brightpoint, Inc.(a)(b) | | | 753,939 | | | | 6,114,445 | |
CTS Corp.(a) | | | 415,151 | | | | 4,014,510 | |
Electro Scientific Industries, Inc.(a)(b) | | | 349,340 | | | | 6,742,262 | |
Littelfuse, Inc.(a) | | | 177,711 | | | | 10,435,190 | |
Methode Electronics, Inc.(a) | | | 410,852 | | | | 4,769,992 | |
MTS Systems Corp. | | | 170,364 | | | | 7,126,326 | |
Nam Tai Electronics, Inc.(d) | | | 1,090,940 | | | | 6,021,989 | |
| | | | | | | | |
Total | | | | | | | 64,477,245 | |
Internet Software & Services 1.3% | | | | | | | | |
InfoSpace, Inc.(a)(b) | | | 617,357 | | | | 5,630,296 | |
j2 Global Communications, Inc.(a)(b) | | | 207,423 | | | | 5,855,551 | |
United Online, Inc.(a) | | | 1,071,750 | | | | 6,462,653 | |
ValueClick, Inc.(a)(b) | | | 434,650 | | | | 7,215,190 | |
| | | | | | | | |
Total | | | | | | | 25,163,690 | |
IT Services 3.5% | | | | | | | | |
Acxiom Corp.(a)(b) | | | 392,690 | | | | 5,148,166 | |
CACI International, Inc., Class A(a)(b) | | | 188,176 | | | | 11,870,142 | |
Convergys Corp.(a)(b) | | | 639,207 | | | | 8,718,783 | |
CSG Systems International, Inc.(b) | | | 361,071 | | | | 6,672,592 | |
Global Cash Access Holdings, Inc.(a)(b) | | | 2,076,638 | | | | 6,603,709 | |
Jack Henry & Associates, Inc.(a) | | | 150,520 | | | | 4,517,105 | |
MAXIMUS, Inc.(a) | | | 102,549 | | | | 8,483,879 | |
MoneyGram International, Inc.(a)(b) | | | 1,417,234 | | | | 4,705,217 | |
TeleTech Holdings, Inc.(a)(b) | | | 559,720 | | | | 11,798,898 | |
| | | | | | | | |
Total | | | | | | | 68,518,491 | |
Semiconductors & Semiconductor Equipment 3.0% | | | | | |
Amkor Technology, Inc.(a)(b) | | | 1,102,180 | | | | 6,800,451 | |
ATMI, Inc.(a)(b) | | | 316,542 | | | | 6,466,953 | |
Cabot Microelectronics Corp.(a)(b) | | | 154,170 | | | | 7,164,280 | |
Entegris, Inc.(a)(b) | | | 945,140 | | | | 9,564,817 | |
Integrated Device Technology, Inc.(a)(b) | | | 924,810 | | | | 7,269,006 | |
MKS Instruments, Inc.(a) | | | 317,898 | | | | 8,398,865 | |
Novellus Systems, Inc.(a)(b) | | | 191,600 | | | | 6,924,424 | |
Tessera Technologies, Inc.(a)(b) | | | 344,806 | | | | 5,909,975 | |
| | | | | | | | |
Total | | | | | | | 58,498,771 | |
Software 1.3% | | | | | | | | |
Compuware Corp.(b) | | | 590,140 | | | | 5,759,766 | |
Monotype Imaging Holdings, Inc.(a)(b) | | | 498,898 | | | | 7,049,429 | |
Parametric Technology Corp.(a)(b) | | | 265,370 | | | | 6,084,934 | |
Progress Software Corp.(a)(b) | | | 326,048 | | | | 7,867,538 | |
| | | | | | | | |
Total | | | | | | | 26,761,667 | |
Total Information Technology | | | | | | | 283,247,754 | |
Materials 7.1% | | | | | | | | |
Chemicals 2.9% | | | | | | | | |
Chemtura Corp.(a)(b) | | | 434,710 | | | | 7,911,722 | |
H.B. Fuller Co.(a) | | | 525,669 | | | | 12,836,837 | |
Minerals Technologies, Inc.(a) | | | 176,736 | | | | 11,715,829 | |
OM Group, Inc.(b) | | | 574,823 | | | | 23,360,807 | |
| | | | | | | | |
Total | | | | | | | 55,825,195 | |
The Accompanying Notes to Financial Statements are an integral part of this statement
8
Columbia Small Cap Value Fund I
June 30, 2011
(Percentages represent value of investments compared to net assets)
| | | | | | | | |
| Issuer | |
Shares
| | | Value | |
Common Stocks (continued) | |
Materials (cont.) | | | | | | | | |
Containers & Packaging 1.6% | | | | | | | | |
Greif, Inc., Class A(a) | | | 127,333 | | | | $8,280,465 | |
Greif, Inc., Class B | | | 285,363 | | | | 17,193,121 | |
Packaging Corp. of America | | | 242,575 | | | | 6,789,674 | |
| | | | | | | | |
Total | | | | | | | 32,263,260 | |
Metals & Mining 2.2% | | | | | | | | |
Haynes International, Inc. | | | 151,593 | | | | 9,388,154 | |
Olympic Steel, Inc.(a) | | | 286,554 | | | | 7,888,832 | |
RTI International Metals, Inc.(a)(b) | | | 268,501 | | | | 10,302,383 | |
Terra Nova Royalty Corp.(d) | | | 639,375 | | | | 4,846,463 | |
Thompson Creek Metals Co., Inc.(b)(d) | | | 986,540 | | | | 9,845,669 | |
| | | | | | | | |
Total | | | | | | | 42,271,501 | |
Paper & Forest Products 0.4% | | | | | | | | |
Wausau Paper Corp.(a) | | | 1,178,510 | | | | 7,943,158 | |
Total Materials | | | | | | | 138,303,114 | |
Telecommunication Services 1.6% | | | | | | | | |
Diversified Telecommunication Services 0.8% | |
Cbeyond, Inc.(a)(b) | | | 701,354 | | | | 9,278,913 | |
Warwick Valley Telephone Co.(c) | | | 359,903 | | | | 5,196,999 | |
| | | | | | | | |
Total | | | | | | | 14,475,912 | |
Wireless Telecommunication Services 0.8% | | | | | | | | |
NTELOS Holdings Corp.(a) | | | 470,780 | | | | 9,613,328 | |
Shenandoah Telecommunications Co.(a) | | | 370,315 | | | | 6,302,761 | |
| | | | | | | | |
Total | | | | | | | 15,916,089 | |
Total Telecommunication Services | | | | | | | 30,392,001 | |
Utilities 3.3% | | | | | | | | |
Electric Utilities 1.5% | |
Allete, Inc.(a) | | | 282,210 | | | | 11,581,898 | |
IDACORP, Inc.(a) | | | 210,730 | | | | 8,323,835 | |
MGE Energy, Inc.(a) | | | 229,524 | | | | 9,302,608 | |
| | | | | | | | |
Total | | | | | | | 29,208,341 | |
Gas Utilities 0.4% | | | | | | | | |
Laclede Group, Inc.(The)(a) | | | 220,017 | | | | 8,323,243 | |
Multi-Utilities 1.4% | | | | | | | | |
Avista Corp.(a) | | | 502,480 | | | | 12,908,711 | |
CH Energy Group, Inc.(a) | | | 125,034 | | | | 6,659,311 | |
NorthWestern Corp.(a) | | | 251,811 | | | | 8,337,462 | |
| | | | | | | | |
Total | | | | | | | 27,905,484 | |
Total Utilities | | | | | | | 65,437,068 | |
Total Common Stocks | | | | | | | | |
(Cost: $1,588,215,214) | | | | | | | $1,958,709,814 | |
| |
Money Market Fund —% | |
Columbia Short-Term Cash Fund, 0.166%(c)(e) | | | 36,544 | | | | 36,544 | |
Total Money Market Fund | | | | | | | | |
(Cost: $36,544) | | | | | | | $36,544 | |
| | | | | | | | | | | | |
| Issuer | | Effective
Yield | | | Par/
Principal/
Shares | | | Value | |
Investments of Cash Collateral Received for Securities on Loan 20.1% | |
Asset-Backed Commercial Paper 3.0% | |
Antalis US Funding Corp. | | | | | | | | | |
08/09/11 | | | 0.230 | % | | | $9,996,167 | | | | $9,996,167 | |
Cancara Asset Securitisation LLC | | | | | | | | | |
07/13/11 | | | 0.150 | % | | | 14,998,125 | | | | 14,998,125 | |
Rhein-Main Securitisation Ltd. | |
09/06/11 | | | 0.430 | % | | | 9,989,847 | | | | 9,989,847 | |
Rheingold Securitization | |
09/12/11 | | | 0.430 | % | | | 7,991,018 | | | | 7,991,018 | |
Scaldis Capital LLC | |
07/01/11 | | | 0.200 | % | | | 14,999,916 | | | | 14,999,916 | |
| | | | | | | | | | | | |
Total | | | | | | | | | | | 57,975,073 | |
Certificates of Deposit 6.6% | |
Australia and New Zealand Bank Group Ltd. | |
07/25/11 | | | 0.190 | % | | | 15,000,000 | | | | 15,000,000 | |
Barclays Bank PLC | |
09/13/11 | | | 0.310 | % | | | 14,000,000 | | | | 14,000,000 | |
Commerzbank AG | |
07/27/11 | | | 0.180 | % | | | 15,000,000 | | | | 15,000,000 | |
Credit Industrial et Commercial | |
09/14/11 | | | 0.270 | % | | | 10,000,000 | | | | 10,000,000 | |
DZ Bank AG | |
07/12/11 | | | 0.200 | % | | | 7,000,000 | | | | 7,000,000 | |
07/27/11 | | | 0.150 | % | | | 8,000,000 | | | | 8,000,000 | |
Den Danske Bank | |
07/26/11 | | | 0.230 | % | | | 7,497,078 | | | | 7,497,078 | |
Development Bank of Singapore Ltd. | |
07/18/11 | | | 0.180 | % | | | 8,000,000 | | | | 8,000,000 | |
Erste Bank der Oesterreichischen Sparkassen AG | |
07/07/11 | | | 0.240 | % | | | 10,000,000 | | | | 10,000,000 | |
KBC Bank NV | |
07/05/11 | | | 0.300 | % | | | 5,000,000 | | | | 5,000,000 | |
07/14/11 | | | 0.280 | % | | | 5,000,000 | | | | 5,000,000 | |
07/27/11 | | | 0.280 | % | | | 5,000,000 | | | | 5,000,000 | |
La Banque Postale | |
09/13/11 | | | 0.250 | % | | | 10,000,000 | | | | 10,000,000 | |
Landesbank Hessen Thuringen | |
07/05/11 | | | 0.240 | % | | | 9,997,801 | | | | 9,997,801 | |
| | | | | | | | | | | | |
Total | | | | | | | | | | | 129,494,879 | |
Commercial Paper 1.0% | |
Danske Corp. | |
08/02/11 | | | 0.220 | % | | | 1,999,303 | | | | 1,999,303 | |
Erste Finance (Delaware) LLC | |
07/18/11 | | | 0.210 | % | | | 4,999,096 | | | | 4,999,096 | |
Suncorp Metway Ltd. | |
07/18/11 | | | 0.210 | % | | | 6,998,653 | | | | 6,998,653 | |
07/05/11 | | | 0.240 | % | | | 4,998,833 | | | | 4,998,833 | |
| | | | | | | | | | | | |
Total | | | | | | | | | | | 18,995,885 | |
The Accompanying Notes to Financial Statements are an integral part of this statement
9
Columbia Small Cap Value Fund I
June 30, 2011
(Percentages represent value of investments compared to net assets)
| | | | | | | | | | | | |
| Issuer | | Effective
Yield | | | Par/
Principal/
Shares | | | Value | |
Investments of Cash Collateral Received for Securities on Loan (continued) | |
Money Market Fund 1.5% | |
JPMorgan Prime Money Market Fund, 0.010%(e) | | | | $30,000,000 | | | | $30,000,000 | |
Repurchase Agreements 8.0% | |
Citigroup Global Markets Inc.
dated 06/30/11, matures 07/01/11,
repurchase price $6,000,005(f) | |
| | | 0.030 | % | | | 6,000,000 | | | | 6,000,000 | |
Deutsche Bank AG
dated 06/24/11, matures 07/01/11,
repurchase price $40,000,044(f) | | | | | |
| | | 0.040 | % | | | 40,000,000 | | | | 40,000,000 | |
MF Global Holdings Ltd.
dated 06/30/11, matures 07/01/11,
repurchase price $80,000,333(f) | | | | | |
| | | 0.150 | % | | | 80,000,000 | | | | 80,000,000 | |
Natixis Financial Products, Inc.
dated 06/30/11, matures 07/01/11,
repurchase price $10,000,008(f) | | | | | |
| | | 0.030 | % | | | 10,000,000 | | | | 10,000,000 | |
Nomura Securities
dated 06/30/11, matures 07/01/11,
repurchase price $5,000,014(f) | | | | | |
| | | 0.100 | % | | | 5,000,000 | | | | 5,000,000 | |
| | | | | | | | | | | | |
| Issuer | | Effective
Yield | | | Par/
Principal/
Shares | | | Value | |
Investments of Cash Collateral Received for Securities on Loan (continued) | |
Repurchase Agreements (cont.) | |
Pershing LLC
dated 06/30/11, matures 07/01/11,
repurchase price $15,000,050(f) | | | | | |
| | | 0.120 | % | | | $15,000,000 | | | | $15,000,000 | |
Royal Bank of Canada
dated 06/30/11, matures 07/01/11,
repurchase price $1,621,695(f) | | | | | |
| | | 0.050 | % | | | 1,621,693 | | | | 1,621,693 | |
| | | | | | | | | | | | |
Total | | | | | | | | | | | 157,621,693 | |
| Total Investments of Cash Collateral Received for Securities on Loan | | | | | |
(Cost: $394,087,530) | | | | $394,087,530 | |
Total Investments | | | | | |
(Cost: $1,982,339,288) | | | | $2,352,833,888 | |
Other Assets & Liabilities, Net | | | | (392,371,835 | ) |
Net Assets | | | | | | | | $1,960,462,053 | |
|
Notes to Portfolio of Investments |
| (a) | At June 30, 2011, security was partially or fully on loan. |
| (c) | Investments in affiliates during the year ended June 30, 2011: |
| | | | | | | | | | | | | | | | | | | | | | | | | | | | |
| Issuer | | Beginning Cost | | | Purchase Cost | | | Sales Cost/
Proceeds from
Sales | | | Realized
Gain/Loss | | | Ending Cost | | | Dividends or
Interest
Income | | | Value | |
Columbia Short-Term Cash Fund | | | $ — | | | | $50,830,422 | | | | $(50,793,878 | ) | | | $ — | | | | $36,544 | | | | $2,503 | | | | $36,544 | |
Northrim BanCorp, Inc. | | | 5,468,718 | | | | 393,560 | | | | (14,937 | ) | | | (264 | ) | | | 5,847,077 | | | | 172,561 | | | | 6,932,795 | |
Terreno Realty Corp. | | | 5,101,618 | | | | 3,774,409 | | | | (14,015 | ) | | | (659 | ) | | | 8,861,353 | | | | 50,029 | | | | 8,509,916 | |
Warwick Valley Telephone Co. | | | 4,299,311 | | | | 257,406 | | | | (11,815 | ) | | | (94 | ) | | | 4,544,808 | | | | 357,436 | | | | 5,196,999 | |
Total | | | $14,869,647 | | | | $55,255,797 | | | | $(50,834,645 | ) | | | $(1,017 | ) | | | $19,289,782 | | | | $582,529 | | | | $20,676,254 | |
| (d) | Represents a foreign security. At June 30, 2011, the value of foreign securities, excluding short-term securities, represented 5.49% of net assets. |
| (e) | The rate shown is the seven-day current annualized yield at June 30, 2011. |
The Accompanying Notes to Financial Statements are an integral part of this statement
10
Columbia Small Cap Value Fund I
June 30, 2011
(Percentages represent value of investments compared to net assets)
|
Notes to Portfolio of Investments (continued) |
| (f) | The table below represents securities received as collateral for repurchase agreements. This collateral, which is generally high quality short-term obligations, is deposited with the Fund’s custodian and, pursuant to the terms of the repurchase agreement, must have an aggregate market value greater than or equal to the repurchase price plus accrued interest at all times. The value of securities and/or cash held as collateral for repurchase agreements is monitored on a daily basis to ensure the existence of the proper level of collateral. |
Citigroup Global Markets, Inc. (0.030%)
| | | | |
| Security Description | | Value | |
Fannie Mae REMICS | | | $2,096,260 | |
Fannie Mae-Aces | | | 104,294 | |
Freddie Mac REMICS | | | 2,988,217 | |
Government National Mortgage Association | | | 931,229 | |
Total Market Value of Collateral Securities | | | $6,120,000 | |
| |
| Deutsche Bank AG (0.040%) | | | | |
| Security Description | | Value | |
| | | | |
Fannie Mae Pool | | | $37,977,755 | |
Freddie Mac Non Gold Pool | | | 2,822,245 | |
Total Market Value of Collateral Securities | | | $40,800,000 | |
| |
| MF Global Holdings Ltd. (0.150%) | | | | |
| Security Description | | Value | |
Fannie Mae Pool | | | $55,501,526 | |
Fannie Mae REMICS | | | 1,499,393 | |
Freddie Mac Gold Pool | | | 77,877 | |
Freddie Mac Non Gold Pool | | | 920,898 | |
Freddie Mac REMICS | | | 1,116,361 | |
Ginnie Mae I Pool | | | 8,951,295 | |
Ginnie Mae II Pool | | | 10,085,038 | |
Government National Mortgage Association | | | 3,448,102 | |
Total Market Value of Collateral Securities | | | $81,600,490 | |
| |
| Natixis Financial Products, Inc. (0.030%) | | | | |
| Security Description | | Value | |
Fannie Mae Interest Strip | | | $231,890 | |
Fannie Mae REMICS | | | 5,668,065 | |
Federal Farm Credit Bank | | | 734,690 | |
Freddie Mac REMICS | | | 1,673,355 | |
Government National Mortgage Association | | | 1,892,009 | |
Total Market Value of Collateral Securities | | | $10,200,009 | |
| |
| Nomura Securities (0.100%) | | | | |
| Security Description | | Value | |
Fannie Mae Pool | | | $3,036,745 | |
Freddie Mac Gold Pool | | | 2,063,255 | |
Total Market Value of Collateral Securities | | | $5,100,000 | |
The Accompanying Notes to Financial Statements are an integral part of this statement
11
Columbia Small Cap Value Fund I
June 30, 2011
(Percentages represent value of investments compared to net assets)
|
Notes to Portfolio of Investments (continued) |
| | | | |
| Pershing LLC (0.120%) | | | | |
| Security Description | | Value | |
Fannie Mae Pool | | | $133,165 | |
Fannie Mae REMICS | | | 3,731,417 | |
Fannie Mae Whole Loan | | | 23,746 | |
Freddie Mac Reference REMIC | | | 357,151 | |
Freddie Mac REMICS | | | 9,537,269 | |
Freddie Mac Strips | | | 151,913 | |
Government National Mortgage Association | | | 1,365,339 | |
Total Market Value of Collateral Securities | | | $15,300,000 | |
| |
| Royal Bank of Canada (0.050%) | | | | |
| Security Description | | Value | |
Fannie Mae Pool | | | $945,291 | |
Federal Home Loan Mortgage Corp | | | 39 | |
Freddie Mac Gold Pool | | | 199,111 | |
Freddie Mac Non Gold Pool | | | 5,651 | |
Freddie Mac REMICS | | | 499,952 | |
Ginnie Mae II Pool | | | 4,082 | |
Total Market Value of Collateral Securities | | | $1,654,126 | |
At June 30, 2011, the Fund held investments in the following sectors:
| | | | |
| Sector (Unaudited) | | % of Net Assets | |
Financials | | | 27.8 | % |
Industrials | | | 17.0 | |
Information Technology | | | 14.4 | |
Health Care | | | 9.7 | |
Consumer Discretionary | | | 9.7 | |
Energy | | | 7.2 | |
Materials | | | 7.1 | |
Utilities | | | 3.3 | |
Consumer Staples | | | 2.1 | |
Telecommunication Services | | | 1.6 | |
| | | 99.9 | |
Money Market Fund | | | — | * |
Investments of Cash Collateral Received for Securities on Loan | | | 20.1 | |
Other Assets & Liabilities, Net | | | (20.0 | ) |
| | | | 100.0 | |
| * | Rounds to less than 0.01% |
Generally accepted accounting principles (GAAP) require disclosure regarding the inputs and valuation techniques used to measure fair value and any changes in valuation inputs or techniques. In addition, investments shall be disclosed by major category.
The Fund categorizes its fair value measurements according to a three-level hierarchy that maximizes the use of observable inputs and minimizes the use of unobservable inputs by prioritizing that the most observable input be used when available. Observable inputs are those that market participants would use in pricing an investment based on market data obtained from sources independent of the reporting entity. Unobservable inputs are those that reflect the Fund’s assumptions about the information market participants would use in pricing an investment. An investment’s level within the fair value hierarchy is based on the lowest level of any input that is deemed significant to the asset or liability’s fair value measurement. The input levels are not necessarily an indication of the risk or liquidity associated with investments at that level. For example, certain U.S. government securities are generally high quality and liquid, however, they are reflected as Level 2 because the inputs used to determine fair value may not always be quoted prices in an active market.
The Accompanying Notes to Financial Statements are an integral part of this statement
12
Columbia Small Cap Value Fund I
June 30, 2011
(Percentages represent value of investments compared to net assets)
|
Fair Value Measurements (continued) |
Fair value inputs are summarized in the three broad levels listed below:
| | Ÿ | | Level 1 – Valuations based on quoted prices for investments in active markets that the Fund has the ability to access at the measurement date (including NAV for open-end mutual funds). Valuation adjustments are not applied to Level 1 investments. |
| | Ÿ | | Level 2 – Valuations based on other significant observable inputs (including quoted prices for similar securities, interest rates, prepayment speeds, credit risks, etc.). |
| | Ÿ | | Level 3 – Valuations based on significant unobservable inputs (including the Fund’s own assumptions and judgment in determining the fair value of investments). |
Inputs that are used in determining fair value of an investment may include price information, credit data, volatility statistics, and other factors. These inputs can be either observable or unobservable. The availability of observable inputs can vary between investments, and is affected by various factors such as the type of investment, and the volume and level of activity for that investment or similar investments in the marketplace. The inputs will be considered by the Fund Administrator, along with any other relevant factors in the calculation of an investment’s fair value. The Fund uses prices and inputs that are current as of the measurement date, which may include periods of market dislocations. During these periods, the availability of prices and inputs may be reduced for many investments. This condition could cause an investment to be reclassified between the various levels within the hierarchy.
Foreign equity securities actively traded in markets where there is a significant delay in the local close relative to the New York Stock Exchange (NYSE) are classified as Level 2. The values of these securities may include an adjustment to reflect the impact of significant market movements following the close of local trading, as described in Note 2 to the financial statements – Security Valuation.
Investments falling into the Level 3 category are primarily supported by quoted prices from brokers and dealers participating in the market for those investments. However, these may be classified as Level 3 investments due to lack of market transparency and corroboration to support these quoted prices. Additionally, valuation models may be used as the pricing source for any remaining investments classified as Level 3. These models rely on one or more significant unobservable inputs and/or significant assumptions by the Fund Administrator. Inputs used in valuations may include, but are not limited to, financial statement analysis, capital account balances, discount rates and estimated cash flows, and comparable company data.
The following table is a summary of the inputs used to value the Fund’s investments as of June 30, 2011:
| | | | | | | | | | | | | | | | |
| | | Fair value at June 30, 2011 | |
| Description(a) | | Level 1 quoted prices in active markets for
identical assets | | | Level 2 other significant
observable
inputs(b) | | | Level 3
significant
unobservable
inputs | | | Total | |
Equity Securities | | | | | | | | | | | | | | | | |
Common Stocks | | | | | | | | | | | | | | | | |
Consumer Discretionary | | | $189,926,322 | | | | $- | | | | $- | | | | $189,926,322 | |
Consumer Staples | | | 40,487,692 | | | | - | | | | - | | | | 40,487,692 | |
Energy | | | 141,303,654 | | | | - | | | | - | | | | 141,303,654 | |
Financials | | | 545,243,794 | | | | - | | | | - | | | | 545,243,794 | |
Health Care | | | 190,360,534 | | | | - | | | | - | | | | 190,360,534 | |
Industrials | | | 330,610,847 | | | | 3,397,034 | | | | - | | | | 334,007,881 | |
Information Technology | | | 283,247,754 | | | | - | | | | - | | | | 283,247,754 | |
Materials | | | 138,303,114 | | | | - | | | | - | | | | 138,303,114 | |
Telecommunication Services | | | 30,392,001 | | | | - | | | | - | | | | 30,392,001 | |
Utilities | | | 65,437,068 | | | | - | | | | - | | | | 65,437,068 | |
Total Equity Securities | | | 1,955,312,780 | | | | 3,397,034 | | | | - | | | | 1,958,709,814 | |
Other | | | | | | | | | | | | | | | | |
Affiliated Money Market Fund(c) | | | 36,544 | | | | - | | | | - | | | | 36,544 | |
Investments of Cash Collateral Received for Securities on Loan | | | 30,000,000 | | | | 364,087,530 | | | | - | | | | 394,087,530 | |
Total Other | | | 30,036,544 | | | | 364,087,530 | | | | - | | | | 394,124,074 | |
Total | | | $1,985,349,324 | | | | $367,484,564 | | | | $- | | | | $2,352,833,888 | |
| (a) | See the Portfolio of Investments for all investment classifications not indicated in the table. |
| (b) | There were no significant transfers between Levels 1 and 2 during the period. |
| (c) | Money market fund that is a sweep investment for cash balances in the Fund at June 30, 2011. |
The Accompanying Notes to Financial Statements are an integral part of this statement
13
Statement of Assets and Liabilities – Columbia Small Cap Value Fund I
June 30, 2011
| | | | |
| Assets | | | | |
Investments, at value* | | | | |
Unaffiliated issuers (identified cost $1,568,961,976) | | | $1,938,070,104 | |
Affiliated issuers (identified cost $19,289,782) | | | 20,676,254 | |
Investment of cash collateral received for securities on loan | | | | |
Short-term securities (identified cost $236,465,837) | | | 236,465,837 | |
Repurchase agreements (identified cost $157,621,693) | | | 157,621,693 | |
Total investments (identified cost $1,982,339,288) | | | 2,352,833,888 | |
Receivable for: | | | | |
Capital shares sold | | | 2,561,747 | |
Investments sold | | | 18,435,159 | |
Dividends | | | 2,024,310 | |
Interest | | | 68,735 | |
Reclaims | | | 3,326 | |
Trustees’ deferred compensation plan | | | 85,068 | |
Total assets | | | 2,376,012,233 | |
| |
| Liabilities | | | | |
Due upon return of securities on loan | | | 394,087,530 | |
Payable for: | | | | |
Investments purchased | | | 18,180,424 | |
Capital shares purchased | | | 2,306,515 | |
Investment management fees | | | 39,060 | |
Distribution fees | | | 6,678 | |
Transfer agent fees | | | 657,154 | |
Administration fees | | | 3,927 | |
Chief compliance officer expenses | | | 571 | |
Trustees’ deferred compensation plan | | | 85,068 | |
Other expenses | | | 183,253 | |
Total liabilities | | | 415,550,180 | |
Net assets applicable to outstanding capital stock | | | $1,960,462,053 | |
The Accompanying Notes to Financial Statements are an integral part of this statement
14
Statement of Assets and Liabilities (continued) – Columbia Small Cap Value Fund I
June 30, 2011
| | | | |
| Represented by | | | | |
Paid-in capital | | $ | 1,494,338,817 | |
Excess of distributions over net investment income | | | (4,947,871 | ) |
Accumulated net realized gain | | | 100,576,507 | |
Unrealized appreciation (depreciation) on: | | | | |
Investments | | | 370,494,600 | |
Total — representing net assets applicable to outstanding capital stock | | $ | 1,960,462,053 | |
*Value of securities on loan | | $ | 387,420,558 | |
Net assets applicable to outstanding shares | | | | |
Class A | | $ | 704,166,916 | |
Class B | | $ | 17,908,200 | |
Class C | | $ | 52,248,310 | |
Class I | | $ | 75,715,989 | |
Class R | | $ | 21,499 | |
Class Y | | $ | 1,322,655 | |
Class Z | | $ | 1,109,078,484 | |
Shares outstanding | | | | |
Class A | | | 15,237,111 | |
Class B | | | 477,085 | |
Class C | | | 1,315,113 | |
Class I | | | 1,558,002 | |
Class R | | | 465 | |
Class Y | | | 27,216 | |
Class Z | | | 22,851,463 | |
Net asset value per share | | | | |
Class A(a) | | $ | 46.21 | |
Class B | | $ | 37.54 | |
Class C | | $ | 39.73 | |
Class I | | $ | 48.60 | |
Class R | | $ | 46.23 | |
Class Y | | $ | 48.60 | |
Class Z | | $ | 48.53 | |
| (a) | The maximum offering price per share for Class A is $49.03. The offering price is calculated by dividing the net asset value by 1.0 minus the maximum sales charge of 5.75%. |
The Accompanying Notes to Financial Statements are an integral part of this statement
15
Statement of Operations – Columbia Small Cap Value Fund I
Year ended June 30, 2011
| | | | |
| Net investment income | | | | |
Income: | | | | |
Dividends - unaffiliated issuers | | $ | 28,015,429 | |
Dividends - affiliated issuers | | | 582,529 | |
Interest | | | 6,422 | |
Income from securities lending - net | | | 93,483 | |
Foreign taxes withheld | | | (14,931 | ) |
Total income | | | 28,682,932 | |
Expenses: | | | | |
Investment management fees | | | 13,093,445 | |
Distribution fees | | | | |
Class B | | | 157,721 | |
Class C | | | 404,763 | |
Class R | | | 23 | |
Service fees | | | | |
Class B | | | 51,999 | |
Class C | | | 134,921 | |
Distribution and service fees - Class A | | | 1,705,653 | |
Transfer agent fees | | | | |
Class A | | | 1,292,263 | |
Class B | | | 39,332 | |
Class C | | | 102,063 | |
Class R | | | 8 | |
Class Y | | | 31 | |
Class Z | | | 1,866,509 | |
Administration fees | | | 240,540 | |
Compensation of board members | | | 71,053 | |
Pricing and bookkeeping fees | | | 107,487 | |
Custodian fees | | | 61,274 | |
Printing and postage fees | | | 392,981 | |
Registration fees | | | 158,475 | |
Professional fees | | | 150,502 | |
Chief compliance officer expenses | | | 3,066 | |
Line of credit interest expense | | | 666 | |
Other | | | 58,660 | |
Total expenses | | | 20,093,435 | |
Fees waived or expenses reimbursed by Investment Manager and its affiliates | | | (10 | ) |
Earnings credits on cash balances | | | (88 | ) |
Total net expenses | | | 20,093,337 | |
Net investment income | | | 8,589,595 | |
| |
| Realized and unrealized gain (loss) - net | | | | |
Net realized gain (loss) on: | | | | |
Unaffiliated investments | | | 136,288,995 | |
Affiliated investments | | | (1,017 | ) |
Foreign currency transactions | | | (39 | ) |
Futures contracts | | | (133,350 | ) |
Net realized gain | | | 136,154,589 | |
Net change in unrealized appreciation (depreciation) on: | | | | |
Investments | | | 306,050,187 | |
Foreign currency translations | | | 39 | |
Net change in unrealized appreciation | | | 306,050,226 | |
Net realized and unrealized gain | | | 442,204,815 | |
Net increase in net assets resulting from operations | | $ | 450,794,410 | |
The Accompanying Notes to Financial Statements are an integral part of this statement
16
Statement of Changes in Net Assets – Columbia Small Cap Value Fund I
| | | | | | | | |
| Year ended June 30 | | 2011(a) | | | 2010(b) | |
| | |
| Operations | | | | | | | | |
Net investment income | | $ | 8,589,595 | | | $ | 6,418,633 | |
Net realized gain | | | 136,154,589 | | | | 52,490,466 | |
Net change in unrealized appreciation | | | 306,050,226 | | | | 146,219,296 | |
Net increase in net assets resulting from operations | | | 450,794,410 | | | | 205,128,395 | |
Distributions to shareholders from: | | | | | | | | |
Net investment income | | | | | | | | |
Class A | | | (7,017,198 | ) | | | (2,853,169 | ) |
Class B | | | (88,560 | ) | | | (69,066 | ) |
Class C | | | (213,115 | ) | | | (111,769 | ) |
Class I | | | (138,731 | ) | | | — | |
Class R | | | (23 | ) | | | — | |
Class Y | | | (17,298 | ) | | | (7,732 | ) |
Class Z | | | (11,796,161 | ) | | | (3,363,591 | ) |
Net realized gains | | | | | | | | |
Class A | | | (2,463,814 | ) | | | — | |
Class B | | | (96,216 | ) | | | — | |
Class C | | | (228,826 | ) | | | — | |
Class I | | | (28,480 | ) | | | — | |
Class R | | | (10 | ) | | | — | |
Class Y | | | (4,413 | ) | | | — | |
Class Z | | | (3,391,556 | ) | | | — | |
Total distributions to shareholders | | | (25,484,401 | ) | | | (6,405,327 | ) |
Increase in net assets from share transactions | | | 93,578,338 | | | | 362,267,219 | |
Proceeds from regulatory settlement (Note 6) | | | — | | | | 4,978 | |
Total increase in net assets | | | 518,888,347 | | | | 560,995,265 | |
Net assets at beginning of year | | | 1,441,573,706 | | | | 880,578,441 | |
Net assets at end of year | | $ | 1,960,462,053 | | | $ | 1,441,573,706 | |
Undistributed (excess of distributions over) net investment income | | $ | (4,947,871 | ) | | $ | 5,747,004 | |
| (a) | Class I and Class R are for the period from September 27, 2010 (commencement of operations) to June 30, 2011. |
| (b) | Class Y is for the period from July 15, 2009 (commencement of operations) to June 30, 2010. |
The Accompanying Notes to Financial Statements are an integral part of this statement
17
Statement of Changes in Net Assets (continued) – Columbia Small Cap Value Fund I
| | | | | | | | | | | | | | | | |
| Year ended June 30, | | | | | | |
| | | 2011(a) | | | 2010(b) | |
| | | Shares | | | Dollars($) | | | Shares | | | Dollars($) | |
| Capital stock activity | | | | | | | | | | | | | | | | |
Class A shares | | | | | | | | | | | | | | | | |
Subscriptions | | | 3,445,581 | | | | 146,347,011 | | | | 6,146,642 | | | | 221,981,390 | |
Fund merger | | | 84,483 | | | | 3,796,041 | | | | — | | | | — | |
Distributions reinvested | | | 194,540 | | | | 8,561,537 | | | | 75,419 | | | | 2,640,419 | |
Redemptions | | | (5,041,182 | ) | | | (215,635,581 | ) | | | (4,797,429 | ) | | | (173,704,231 | ) |
Net increase (decrease) | | | (1,316,578 | ) | | | (56,930,992 | ) | | | 1,424,632 | | | | 50,917,578 | |
Class B shares | | | | | | | | | | | | | | | | |
Subscriptions | | | 3,396 | | | | 125,008 | | | | 19,122 | | | | 550,695 | |
Fund merger | | | 3,912 | | | | 142,878 | | | | — | | | | — | |
Distributions reinvested | | | 4,280 | | | | 154,130 | | | | 2,192 | | | | 62,564 | |
Redemptions | | | (315,227 | ) | | | (10,766,458 | ) | | | (450,056 | ) | | | (13,437,067 | ) |
Net decrease | | | (303,639 | ) | | | (10,344,442 | ) | | | (428,742 | ) | | | (12,823,808 | ) |
Class C shares | | | | | | | | | | | | | | | | |
Subscriptions | | | 62,434 | | | | 2,292,989 | | | | 304,578 | | | | 9,288,017 | |
Fund merger | | | 3,642 | | | | 140,698 | | | | — | | | | — | |
Distributions reinvested | | | 8,504 | | | | 323,786 | | | | 2,808 | | | | 85,020 | |
Redemptions | | | (375,679 | ) | | | (13,752,828 | ) | | | (441,992 | ) | | | (13,769,158 | ) |
Net decrease | | | (301,099 | ) | | | (10,995,355 | ) | | | (134,606 | ) | | | (4,396,121 | ) |
Class I shares | | | | | | | | | | | | | | | | |
Subscriptions | | | 854,521 | | | | 39,470,130 | | | | — | | | | — | |
Fund merger | | | 817,679 | | | | 38,645,293 | | | | — | | | | — | |
Distributions reinvested | | | 3,610 | | | | 167,163 | | | | — | | | | — | |
Redemptions | | | (117,808 | ) | | | (5,633,645 | ) | | | — | | | | — | |
Net increase | | | 1,558,002 | | | | 72,648,941 | | | | — | | | | — | |
Class R shares | | | | | | | | | | | | | | | | |
Subscriptions | | | 371 | | | | 17,021 | | | | — | | | | — | |
Fund merger | | | 94 | | | | 4,223 | | | | — | | | | — | |
Net increase | | | 465 | | | | 21,244 | | | | — | | | | — | |
Class Y shares | | | | | | | | | | | | | | | | |
Subscriptions | | | 1,282 | | | | 50,000 | | | | 61,757 | | | | 2,010,000 | |
Distributions reinvested | | | 470 | | | | 21,712 | | | | 211 | | | | 7,732 | |
Redemptions | | | (4,054 | ) | | | (175,000 | ) | | | (32,450 | ) | | | (1,129,792 | ) |
Net increase (decrease) | | | (2,302 | ) | | | (103,288 | ) | | | 29,518 | | | | 887,940 | |
Class Z shares | | | | | | | | | | | | | | | | |
Subscriptions | | | 7,631,753 | | | | 339,799,924 | | | | 13,255,465 | | | | 499,789,626 | |
Distributions reinvested | | | 226,837 | | | | 10,463,621 | | | | 55,528 | | | | 2,036,209 | |
Redemptions | | | (5,609,970 | ) | | | (250,981,315 | ) | | | (4,575,482 | ) | | | (174,144,205 | ) |
Net increase | | | 2,248,620 | | | | 99,282,230 | | | | 8,735,511 | | | | 327,681,630 | |
Total net increase | | | 1,883,469 | | | | 93,578,338 | | | | 9,626,313 | | | | 362,267,219 | |
| (a) | Class I and Class R are for the period from September 27, 2010 (commencement of operations) to June 30, 2011. |
| (b) | Class Y is for the period from July 15, 2009 (commencement of operations) to June 30, 2010. |
The Accompanying Notes to Financial Statements are an integral part of this statement
18
Financial Highlights – Columbia Small Cap Value Fund I
The following tables are intended to help you understand the Fund’s financial performance. Certain information reflects financial results for a single share of a class held for the periods shown. Per share net investment income (loss) amounts are calculated based on average shares outstanding during the period. Total returns assume reinvestment of all dividends and distributions. Total returns do not reflect payment of sales charges, if any, and are not annualized for periods of less than one year.
| | | | | | | | | | | | | | | | | | | | |
| | | Year ended June 30, | |
| | | 2011 | | | 2010 | | | 2009 | | | 2008 | | | 2007 | |
| Class A | | | | | | | | | | | | | | | |
| Per share data | | | | | | | | | | | | | | | | | | | | |
Net asset value, beginning of period | | | $35.84 | | | | $29.29 | | | | $39.50 | | | | $52.16 | | | | $48.03 | |
Income from investment operations: | | | | | | | | | | | | | | | | | | | | |
Net investment income | | | 0.16 | | | | 0.15 | | | | 0.23(a | ) | | | 0.15 | | | | 0.12(b | ) |
Net realized and unrealized gain (loss) | | | 10.80 | | | | 6.58 | | | | (8.50 | ) | | | (8.46 | ) | | | 7.61 | |
Total from investment operations | | | 10.96 | | | | 6.73 | | | | (8.27 | ) | | | (8.31 | ) | | | 7.73 | |
Less distributions to shareholders from: | | | | | | | | | | | | | | | | | | | | |
Net investment income | | | (0.44 | ) | | | (0.18 | ) | | | (0.01 | ) | | | (0.14 | ) | | | (0.01 | ) |
Net realized gains | | | (0.15 | ) | | | — | | | | (1.93 | ) | | | (4.21 | ) | | | (3.59 | ) |
Total distributions to shareholders | | | (0.59 | ) | | | (0.18 | ) | | | (1.94 | ) | | | (4.35 | ) | | | (3.60 | ) |
Proceeds from regulatory settlements | | | — | | | | 0.00(c | ) | | | 0.00(c | ) | | | — | | | | — | |
Net asset value, end of period | | | $46.21 | | | | $35.84 | | | | $29.29 | | | | $39.50 | | | | $52.16 | |
| Total return | | | 30.67% | | | | 22.99% | | | | (20.73% | ) | | | (16.96% | ) | | | 16.61% | |
| Ratios to average net assets(d) | | | | | | | | | | | | | | | | | | | | |
Expenses prior to fees waived or expenses reimbursed (including interest expense) | | | 1.25% | | | | 1.27% | | | | 1.38% | | | | 1.26% | | | | 1.29% | |
Net expenses after fees waived or expenses reimbursed (including interest expense)(e) | | | 1.25% | | | | 1.27% | | | | 1.38% | | | | 1.26% | | | | 1.29% | |
Expenses prior to fees waived or expenses reimbursed (excluding interest expense) | | | 1.25% | | | | 1.27% | | | | 1.38% | | | | 1.26% | | | | 1.29% | |
Net expenses after fees waived or expenses reimbursed (excluding interest expense)(e) | | | 1.25% | | | | 1.27% | | | | 1.38% | | | | 1.26% | | | | 1.29% | |
Net investment income | | | 0.37% | | | | 0.43% | | | | 0.74% | | | | 0.29% | | | | 0.25% | |
| Supplemental data | | | | | | | | | | | | | | | | | | | | |
Net assets, end of period (in thousands) | | | $704,167 | | | | $593,209 | | | | $443,154 | | | | $513,671 | | | | $663,160 | |
Portfolio turnover | | | 31% | | | | 30% | | | | 50% | | | | 40% | | | | 39% | |
See accompanying Notes to Financial Highlights.
The Accompanying Notes to Financial Statements are an integral part of this statement
19
Financial Highlights (continued) – Columbia Small Cap Value Fund I
| | | | | | | | | | | | | | | | | | | | |
| | | Year ended June 30, | |
| | | 2011 | | | 2010 | | | 2009 | | | 2008 | | | 2007 | |
| Class B | | | | | | | | | | | | | | | |
| Per share data | | | | | | | | | | | | | | | | | | | | |
Net asset value, beginning of period | | | $29.17 | | | | $23.96 | | | | $33.00 | | | | $44.51 | | | | $41.75 | |
Income from investment operations: | | | | | | | | | | | | | | | | | | | | |
Net investment loss | | | (0.13 | ) | | | (0.10 | ) | | | (0.01 | )(a) | | | (0.21 | ) | | | (0.24 | )(b) |
Net realized and unrealized gain (loss) | | | 8.80 | | | | 5.38 | | | | (7.10 | ) | | | (7.09 | ) | | | 6.59 | |
Total from investment operations | | | 8.67 | | | | 5.28 | | | | (7.11 | ) | | | (7.30 | ) | | | 6.35 | |
Less distributions to shareholders from: | | | | | | | | | | | | | | | | | | | | |
Net investment income | | | (0.15 | ) | | | (0.07 | ) | | | — | | | | — | | | | — | |
Net realized gains | | | (0.15 | ) | | | — | | | | (1.93 | ) | | | (4.21 | ) | | | (3.59 | ) |
Total distributions to shareholders | | | (0.30 | ) | | | (0.07 | ) | | | (1.93 | ) | | | (4.21 | ) | | | (3.59 | ) |
Proceeds from regulatory settlements | | | — | | | | 0.00 | (c) | | | 0.00 | (c) | | | — | | | | — | |
Net asset value, end of period | | | $37.54 | | | | $29.17 | | | | $23.96 | | | | $33.00 | | | | $44.51 | |
| Total return | | | 29.76 | % | | | 22.02 | % | | | (21.31 | %) | | | (17.58 | %) | | | 15.74 | % |
| Ratios to average net assets(d) | | | | | | | | | | | | | | | | | | | | |
Expenses prior to fees waived or expenses reimbursed (including interest expense) | | | 2.00 | % | | | 2.02 | % | | | 2.13 | % | | | 2.01 | % | | | 2.04 | % |
Net expenses after fees waived or expenses reimbursed (including interest expense)(e) | | | 2.00 | % | | | 2.02 | % | | | 2.13 | % | | | 2.01 | % | | | 2.04 | % |
Expenses prior to fees waived or expenses reimbursed (excluding interest expense) | | | 2.00 | % | | | 2.02 | % | | | 2.13 | % | | | 2.01 | % | | | 2.04 | % |
Net expenses after fees waived or expenses reimbursed (excluding interest expense)(e) | | | 2.00 | % | | | 2.02 | % | | | 2.13 | % | | | 2.01 | % | | | 2.04 | % |
Net investment loss | | | (0.38 | %) | | | (0.33 | %) | | | (0.02 | %) | | | (0.47 | %) | | | (0.55 | %) |
| Supplemental data | | | | | | | | | | | | | | | | | | | | |
Net assets, end of period (in thousands) | | | $17,908 | | | | $22,775 | | | | $28,977 | | | | $50,784 | | | | $97,425 | |
Portfolio turnover | | | 31 | % | | | 30 | % | | | 50 | % | | | 40 | % | | | 39 | % |
See accompanying Notes to Financial Highlights.
The Accompanying Notes to Financial Statements are an integral part of this statement
20
Financial Highlights (continued) – Columbia Small Cap Value Fund I
| | | | | | | | | | | | | | | | | | | | |
| | | Year ended June 30, | |
| Class C | | 2011 | | | 2010 | | | 2009 | | | 2008 | | | 2007 | |
| Per share data | | | | | | | | | | | | | | | | | | | | |
Net asset value, beginning of period | | | $30.87 | | | | $25.35 | | | | $34.76 | | | | $46.65 | | | | $43.60 | |
Income from investment operations: | | | | | | | | | | | | | | | | | | | | |
Net investment income (loss) | | | (0.14 | ) | | | (0.10 | ) | | | 0.00 | (a)(c) | | | (0.22 | ) | | | (0.23 | )(b) |
Net realized and unrealized gain (loss) | | | 9.30 | | | | 5.69 | | | | (7.48 | ) | | | (7.46 | ) | | | 6.87 | |
Total from investment operations | | | 9.16 | | | | 5.59 | | | | (7.48 | ) | | | (7.68 | ) | | | 6.64 | |
Less distributions to shareholders from: | | | | | | | | | | | | | | | | | | | | |
Net investment income | | | (0.15 | ) | | | (0.07 | ) | | | — | | | | — | | | | — | |
Net realized gains | | | (0.15 | ) | | | — | | | | (1.93 | ) | | | (4.21 | ) | | | (3.59 | ) |
Total distributions to shareholders | | | (0.30 | ) | | | (0.07 | ) | | | (1.93 | ) | | | (4.21 | ) | | | (3.59 | ) |
Proceeds from regulatory settlements | | | — | | | | 0.00 | (c) | | | 0.00 | (c) | | | — | | | | — | |
Net asset value, end of period | | | $39.73 | | | | $30.87 | | | | $25.35 | | | | $34.76 | | | | $46.65 | |
| Total return | | | 29.71% | | | | 22.04% | | | | (21.30% | ) | | | (17.59% | ) | | | 15.74% | |
| Ratios to average net assets(d) | | | | | | | | | | | | | | | | | | | | |
Expenses prior to fees waived or expenses reimbursed (including interest expense) | | | 2.00% | | | | 2.02% | | | | 2.13% | | | | 2.01% | | | | 2.04% | |
Net expenses after fees waived or expenses reimbursed (including interest expense)(e) | | | 2.00% | | | | 2.02% | | | | 2.13% | | | | 2.01% | | | | 2.04% | |
Expenses prior to fees waived or expenses reimbursed (excluding interest expense) | | | 2.00% | | | | 2.02% | | | | 2.13% | | | | 2.01% | | | | 2.04% | |
Net expenses after fees waived or expenses reimbursed (excluding interest expense)(e) | | | 2.00% | | | | 2.02% | | | | 2.13% | | | | 2.01% | | | | 2.04% | |
Net investment loss | | | (0.38% | ) | | | (0.33% | ) | | | (0.01% | ) | | | (0.47% | ) | | | (0.51% | ) |
| Supplemental data | | | | | | | | | | | | | | | | | | | | |
Net assets, end of period (in thousands) | | | $52,248 | | | | $49,888 | | | | $44,377 | | | | $61,053 | | | | $87,642 | |
Portfolio turnover | | | 31% | | | | 30% | | | | 50% | | | | 40% | | | | 39% | |
See accompanying Notes to Financial Highlights.
The Accompanying Notes to Financial Statements are an integral part of this statement
21
Financial Highlights (continued) – Columbia Small Cap Value Fund I
| | | | |
| | | Year ended June 30, | |
| | | 2011(f) | |
| Class I | | | |
| Per share data | | | | |
Net asset value, beginning of period | | | $40.40 | |
Income from investment operations: | | | | |
Net investment income | | | 0.30 | |
Net realized and unrealized gain | | | 8.66 | |
Total from investment operations | | | 8.96 | |
Less distributions to shareholders from: | | | | |
Net investment income | | | (0.61 | ) |
Net realized gains | | | (0.15 | ) |
Total distributions to shareholders | | | (0.76 | ) |
Net asset value, end of period | | | $48.60 | |
| Total return | | | 22.29% | |
| Ratios to average net assets(d) | | | | |
Expenses prior to fees waived or expenses reimbursed (including interest expense) | | | 0.83%(g | ) |
Net expenses after fees waived or expenses reimbursed (including interest expense)(e) | | | 0.83%(g | ) |
Expenses prior to fees waived or expenses reimbursed (excluding interest expense) | | | 0.83%(g | ) |
Net expenses after fees waived or expenses reimbursed (excluding interest expense)(e) | | | 0.83%(g | ) |
Net investment income | | | 0.84%(g | ) |
| Supplemental data | | | | |
Net assets, end of period (in thousands) | | | $75,716 | |
Portfolio turnover | | | 31% | |
See accompanying Notes to Financial Highlights.
The Accompanying Notes to Financial Statements are an integral part of this statement
22
Financial Highlights (continued) – Columbia Small Cap Value Fund I
| | | | |
| | | Year ended June 30, | |
| Class R | | 2011(f) | |
| Per share data | | | | |
Net asset value, beginning of period | | | $38.43 | |
Income from investment operations: | | | | |
Net investment income | | | 0.09 | (c) |
Net realized and unrealized gain | | | 8.22 | |
Total from investment operations | | | 8.31 | |
Less distributions to shareholders from: | | | | |
Net investment income | | | (0.36 | ) |
Net realized gains | | | (0.15 | ) |
Total distributions to shareholders | | | (0.51 | ) |
Net asset value, end of period | | | $46.23 | |
| Total return | | | 21.68% | |
| Ratios to average net assets(d) | | | | |
Expenses prior to fees waived or expenses reimbursed (including interest expense) | | | 1.50% | (g) |
Net expenses after fees waived or expenses reimbursed (including interest expense)(e) | | | 1.50% | (g) |
Expenses prior to fees waived or expenses reimbursed (excluding interest expense) | | | 1.50% | (g) |
Net expenses after fees waived or expenses reimbursed (excluding interest expense)(e) | | | 1.50% | (g) |
Net investment income | | | 0.27% | (g) |
| Supplemental data | | | | |
Net assets, end of period (in thousands) | | | $21 | |
Portfolio turnover | | | 31% | |
See accompanying Notes to Financial Highlights.
The Accompanying Notes to Financial Statements are an integral part of this statement
23
Financial Highlights (continued) – Columbia Small Cap Value Fund I
| | | | | | | | |
| | | Year ended June 30, | |
| Class Y | | 2011 | | | 2010 (h) | |
| Per share data | | | | | | | | |
Net asset value, beginning of period | | | $37.63 | | | | $31.68 | |
Income from investment operations | | | | | | | | |
Net investment income | | | 0.37 | | | | 0.31 | |
Net realized and unrealized gain | | | 11.36 | | | | 5.88 | |
Total from investment operations | | | 11.73 | | | | 6.19 | |
Less distributions to shareholders from: | | | | | | | | |
Net investment income | | | (0.61 | ) | | | (0.24 | ) |
Net realized gains | | | (0.15 | ) | | | — | |
Total distributions to shareholders | | | (0.76 | ) | | | (0.24 | ) |
Proceeds from regulatory settlements | | | — | | | | 0.00 | (c) |
Net asset value, end of period | | | $48.60 | | | | $37.63 | |
| Total return | | | 31.27% | | | | 19.57% | |
| Ratios to average net assets(d) | | | | | | | | |
Expenses prior to fees waived or expenses reimbursed (including interest expense) | | | 0.81% | | | | 0.85% | (g) |
Net expenses after fees waived or expenses reimbursed (including interest expense)(e) | | | 0.81% | | | | 0.85% | (g) |
Expenses prior to fees waived or expenses reimbursed (excluding interest expense) | | | 0.81% | | | | 0.85% | (g) |
Net expenses after fees waived or expenses reimbursed (excluding interest expense)(e) | | | 0.81% | | | | 0.85% | (g) |
Net investment income | | | 0.82% | | | | 0.85% | (g) |
| Supplemental data | | | | | | | | |
Net assets, end of period (in thousands) | | | $1,323 | | | | $1,111 | |
Portfolio turnover | | | 31% | | | | 30% | |
See Accompanying Notes to Financial Highlights.
The Accompanying Notes to Financial Statements are an integral part of this statement
24
Financial Highlights (continued) – Columbia Small Cap Value Fund I
| | | | | | | | | | | | | | | | | | | | |
| | | Year ended June 30, | |
| Class Z | | 2011 | | | 2010 | | | 2009 | | | 2008 | | | 2007 | |
| Per share data | | | | | | | | | | | | | | | | | | | | |
Net asset value, beginning of period | | | $37.60 | | | | $30.68 | | | | $41.22 | | | | $54.23 | | | | $49.79 | |
Income from investment operations: | | | | | | | | | | | | | | | | | | | | |
Net investment income | | | 0.28 | | | | 0.26 | | | | 0.32(a | ) | | | 0.30 | | | | 0.26(b | ) |
Net realized and unrealized gain (loss) | | | 11.34 | | | | 6.88 | | | | (8.87 | ) | | | (8.84 | ) | | | 7.90 | |
Total from investment operations | | | 11.62 | | | | 7.14 | | | | (8.55 | ) | | | (8.54 | ) | | | 8.16 | |
Less distributions to shareholders from: | | | | | | | | | | | | | | | | | | | | |
Net investment income | | | (0.54 | ) | | | (0.22 | ) | | | (0.06 | ) | | | (0.26 | ) | | | (0.13 | ) |
Net realized gains | | | (0.15 | ) | | | — | | | | (1.93 | ) | | | (4.21 | ) | | | (3.59 | ) |
Total distributions to shareholders | | | (0.69 | ) | | | (0.22 | ) | | | (1.99 | ) | | | (4.47 | ) | | | (3.72 | ) |
Proceeds from regulatory settlements | | | — | | | | 0.00(c | ) | | | 0.00(c | ) | | | — | | | | — | |
Net asset value, end of period | | | $48.53 | | | | $37.60 | | | | $30.68 | | | | $41.22 | | | | $54.23 | |
| Total return | | | 31.00% | | | | 23.28% | | | | (20.53% | ) | | | (16.74% | ) | | | 16.91% | |
| Ratios to average net assets(d) | | | | | | | | | | | | | | | | | | | | |
Expenses prior to fees waived or expenses reimbursed (including interest expense) | | | 1.00% | | | | 1.02% | | | | 1.13% | | | | 1.01% | | | | 1.04% | |
Net expenses after fees waived or expenses reimbursed (including interest expense)(e) | | | 1.00% | | | | 1.02% | | | | 1.13% | | | | 1.01% | | | | 1.04% | |
Expenses prior to fees waived or expenses reimbursed (excluding interest expense) | | | 1.00% | | | | 1.02% | | | | 1.13% | | | | 1.01% | | | | 1.04% | |
Net expenses after fees waived or expenses reimbursed (excluding interest expense)(e) | | | 1.00% | | | | 1.02% | | | | 1.13% | | | | 1.01% | | | | 1.04% | |
Net investment income | | | 0.62% | | | | 0.69% | | | | 1.00% | | | | 0.55% | | | | 0.51% | |
| Supplemental data | | | | | | | | | | | | | | | | | | | | |
Net assets, end of period (in thousands) | | | $1,109,078 | | | | $774,590 | | | | $364,071 | | | | $235,632 | | | | $177,158 | |
Portfolio turnover | | | 31% | | | | 30% | | | | 50% | | | | 40% | | | | 39% | |
Notes to Financial Highlights
| (a) | Net investment income per share reflects special dividends. The effect of these dividends amounted to $0.03 per share. |
| (b) | Net investment income per share reflects special dividends. The effect of these dividends amounted to $0.05 per share. |
| (c) | Rounds to less than $0.01. |
| (d) | In addition to the fees and expenses which the Fund bears directly, the Fund indirectly bears a pro rata share of the fees and expenses of the acquired funds in which it invests. Such indirect expenses are not included in the reported expense ratios. |
| (e) | The Investment Manager and certain of its affiliates agreed to waive/reimburse certain fees and expenses. |
| (f) | For the period from September 27, 2010 (commencement of operations) to June 30, 2011. |
| (h) | For the period from July 15, 2009 (commencement of operations) to June 30, 2010. |
The Accompanying Notes to Financial Statements are an integral part of this statement
25
Notes to Financial Statements – Columbia Small Cap Value Fund I
June 30, 2011
Note 1. Organization
Columbia Small Cap Value Fund I (the Fund), a series of Columbia Funds Series Trust I (the Trust), is a diversified fund. The Trust is registered under the Investment Company Act of 1940, as amended (the 1940 Act), as an open-end management investment company organized as a Massachusetts business trust.
Fund Shares
The Trust may issue an unlimited number of shares (without par value). The Fund offers Class A, Class B, Class C, Class I, Class R, Class Y, and Class Z shares. On December 10, 2010, affiliated fund of funds managed by Columbia Management Investment Advisers, LLC (the Investment Manager), a wholly-owned subsidiary of Ameriprise Financial, Inc. (Ameriprise Financial), exchanged Class Z shares valued at $24,288,164 for Class I shares. All share classes have identical voting, dividend and liquidation rights. Each share class has its own expense structure and sales charges, as applicable.
Class A shares are subject to a maximum front-end sales charge of 5.75% based on the initial investment amount. Class A shares purchased without an initial sales charge in accounts aggregating $1 million to $50 million at the time of purchase are subject to a contingent deferred sales charge (CDSC) if the shares are sold within 18 months of purchase, charged as follows: 1.00% CDSC if redeemed within 12 months of purchase, and 0.50% CDSC if redeemed more than 12, but less than 18, months after purchase.
Class B shares may be subject to a maximum CDSC of 5.00% based upon the holding period after purchase. Class B shares will generally convert to Class A shares eight years after purchase. The Fund no longer accepts investments by new or existing investors in the Fund’s Class B shares, except in connection with the reinvestment of any dividend and/or capital gain distributions in Class B shares of the Fund and exchanges by existing Class B shareholders of certain other funds within the Columbia Family of Funds.
Class C shares are subject to a 1.00% CDSC on shares redeemed within one year of purchase.
Class I shares are not subject to sales charges and are only available to the Columbia Family of Funds. Class I shares commenced operations September 27, 2010.
Class R shares are not subject to sales charges and are available to qualifying institutional investors. Class R shares commenced operations September 27, 2010.
Class Y shares are not subject to sales charges and are available only to certain categories of investors which are subject to minimum initial investment requirements.
Class Z shares are not subject to sales charges, and are only available to certain investors, as described in the Fund’s prospectus.
Note 2. Summary of Significant Accounting Policies
Use of Estimates
The preparation of financial statements in accordance with U.S. generally accepted accounting principles (GAAP) requires management to make certain estimates and assumptions that affect the reported amounts of assets and liabilities, the disclosure of contingent assets and liabilities at the date of the financial statements and the reported amounts of revenue and expenses during the reporting period. Actual results could differ from those estimates.
The following is a summary of significant accounting policies consistently followed by the Fund in the preparation of its financial statements.
Security Valuation
All equity securities are valued at the close of business of the New York Stock Exchange (NYSE). Equity securities are valued at the last quoted sales price on the principal exchange or market on which they trade, except for securities traded on the NASDAQ Stock Market, which are valued at the NASDAQ official close price. Unlisted securities or listed securities for which there were no sales during the day are valued at the mean of the latest quoted bid and asked prices on such exchanges or markets.
Debt securities generally are valued by pricing services approved by the Board of Trustees (the Board) based upon market transactions for normal, institutional-size trading units of similar securities. The services may use various pricing techniques which take into account appropriate factors such as yield, quality, coupon rate, maturity, type of issue, trading characteristics and other data, as well as broker quotes. Debt securities for which quotations are readily available may also be valued based upon an over-the-counter or exchange bid quotation.
Foreign securities are valued based on quotations from the principal market in which such securities are normally traded. If any foreign share prices are not readily available as a result of limited share activity the securities are valued at the mean of the latest quoted bid and asked prices on such exchanges or markets. Foreign currency
26
Columbia Small Cap Value Fund I
June 30, 2011
exchange rates are generally determined at 4:00 p.m. Eastern (U.S.) time. However, many securities markets and exchanges outside the U.S. close prior to the close of the NYSE; therefore, the closing prices for securities in such markets or on such exchanges may not fully reflect events that occur after such close but before the close of the NYSE. In those situations, foreign securities will be fair valued pursuant to the policy adopted by the Board, including utilizing a third party pricing service to determine these fair values. The third party pricing service takes into account multiple factors, including, but not limited to, movements in the U.S. securities markets, certain depositary receipts, futures contracts and foreign exchange rates that have occurred subsequent to the close of the foreign exchange, to determine a good faith estimate that reasonably reflects the current market conditions as of the close of the NYSE. The fair value of a security is likely to be different from the quoted or published price, if available.
Investments in other open-end investment companies, including money market funds, are valued at net asset value.
Short-term securities purchased within 60 days to maturity are valued at amortized cost, which approximates market value. The value of short-term securities originally purchased with maturities greater than 60 days is determined based on an amortized value to par upon reaching 60 days to maturity. Short-term securities maturing in more than 60 days from the valuation date are valued at the market price or approximate market value based on current interest rates.
Futures contracts are valued based upon the settlement price established each day by the board of trade or exchange on which they are traded.
Investments for which market quotations are not readily available, or that have quotations which management believes are not reliable, are valued at fair value as determined in good faith under consistently applied procedures established by and under the general supervision of the Board. If a security or class of securities (such as foreign securities) is valued at fair value, such value is likely to be different from the last quoted market price for the security. The determination of fair value often requires significant judgment. To determine fair value, management may use assumptions including but not limited to future cash flows and estimated risk premiums. Multiple inputs from various sources may be used to determine value.
Foreign Currency Transactions and Translation
The values of all assets and liabilities denominated in foreign currencies are translated into U.S. dollars at that day’s exchange rates. Net realized and unrealized gains (losses) on foreign currency transactions and translations include gains (losses) arising from the fluctuation in exchange rates between trade and settlement dates on securities transactions, gains (losses) arising from the disposition of foreign currency and currency gains (losses) between the accrual and payment dates on dividends, interest income and foreign withholding taxes.
For financial statement purposes, the Fund does not distinguish that portion of gains (losses) on investments which is due to changes in foreign exchange rates from that which is due to changes in market prices of the investments. Such fluctuations are included with the net realized and unrealized gains (losses) on investments in the Statement of Operations.
Derivative Instruments
The Fund invests in certain derivative instruments as detailed below to meet its investment objectives. Derivatives are instruments whose values depend on, or are derived from, in whole or in part, the value of one or more other assets, such as securities, currencies, commodities or indices. Derivative instruments may be used to maintain cash reserves while maintaining exposure to certain other assets, to offset anticipated declines in values of investments, to facilitate trading, to reduce transaction costs and to pursue higher investment returns. The Fund may also use derivative instruments to mitigate certain investment risks, such as foreign currency exchange rate risk, interest rate risk and credit risk. Derivatives may involve various risks, including the potential inability of the counterparty to fulfill its obligation under the terms of the contract, the potential for an illiquid secondary market and the potential for market movements which may expose the Fund to gains or losses in excess of the amount shown in the Statement of Assets and Liabilities.
The Fund and any counterparty are required to maintain an agreement that requires the Fund and that counterparty to monitor (on a daily basis) the net fair value of all derivatives entered into pursuant to the agreement between the Fund and such counterparty. If the net fair value of such derivatives between the Fund and that counterparty exceeds a certain threshold (as defined in the agreement), the Fund or the counterparty (as the case may be) is required to post cash and/or securities as collateral. Fair values of derivatives presented in the financial statements are not netted with the fair value of other derivatives or with any collateral amounts posted by the Fund or any counterparty.
27
Columbia Small Cap Value Fund I
June 30, 2011
Futures Contracts
Futures contracts represent commitments for the future purchase or sale of an asset at a specified price on a specified date. The Fund bought and sold equity linked futures contracts to maintain appropriate equity market exposure while keeping sufficient cash to accommodate daily redemptions. Upon entering into futures contracts, the Fund bears risks which may include interest rates, exchange rates or securities prices moving unexpectedly, in which case, the Fund may not achieve the anticipated benefits of the futures contracts and may realize a loss. Additional risks include counterparty credit risk, the possibility of an illiquid market, and that a change in the value of the contract or option may not correlate with changes in the value of the underlying asset.
Upon entering into a futures contract, the Fund pledges cash or securities with the broker in an amount sufficient to meet the initial margin requirement. Subsequent payments (variation margin) are made or received by the Fund each day. The variation margin payments are equal to the daily change in the contract value and are recorded as variation margin receivable or payable and are offset in unrealized gains or losses. The Fund recognizes a realized gain or loss when the contract is closed or expires. Futures contracts involve, to varying degrees, risk of loss in excess of the variation margin disclosed in the Statement of Assets and Liabilities.
Effects of Derivative Transactions in the Financial Statements
The following tables are intended to provide additional information about the effect of derivatives on the financial statements of the Fund including: the fair value of derivatives by risk category and the location of those fair values in the Statement of Assets and Liabilities; the impact of derivative transactions on the Fund’s operations over the period including realized gains or losses and unrealized gains or losses. The derivative schedules following the Portfolio of Investments present additional information regarding derivative instruments outstanding at the end of the period, if any.
Effective of Derivative Instruments in the Statement of Operations for the year ended June 30, 2011
| | | | | | |
| | | | | | |
| | | Amount of Realized
Gain (Loss) on
Derivatives Recognized
in Income | |
| Risk Exposure Category | | Futures
Contracts | | Total | |
| Equity risk | | $(133,350) | | $ | (133,350 | ) |
Volume of Derivative Instruments for the year ended June 30, 2011
| | |
| | | |
| | | Contracts
Opened |
| Futures Contracts | | 129 |
Repurchase Agreements
The Fund may engage in repurchase agreement transactions with institutions that management has determined are creditworthy. The Fund, through the custodian, receives delivery of the underlying securities collateralizing a repurchase agreement. Management is responsible for determining that the collateral is at least equal, at all times, to the value of the repurchase obligation including interest. A repurchase agreement transaction involves certain risks in the event of default or insolvency of the counterparty. These risks include possible delays in or restrictions on a Fund’s ability to dispose of the underlying securities and a possible decline in the value of the underlying securities during the period while the Fund seeks to assert its rights.
Security Transactions
Security transactions are accounted for on the trade date. Cost is determined and gains (losses) are based upon the specific identification method for both financial statement and federal income tax purposes.
Income Recognition
Corporate actions and dividend income are recorded net of any non-reclaimable tax withholdings, on the ex-dividend date or upon receipt of ex-dividend notification in the case of certain foreign securities.
Interest income is recorded on the accrual basis.
The Fund receives information regarding the character of distributions received from real estate investment trusts (REITs) on an annual basis. Distributions received from REITs are allocated among dividend income, capital gain and return of capital based upon such information or based on management’s estimates if actual information has not yet been reported. Management’s estimates are subsequently adjusted when the actual character of the distributions are disclosed by the REITs which could result in a proportionate increase in returns of capital to shareholders.
Awards from class action litigation are recorded as a reduction of cost if the Fund still owns the applicable securities on the payment
28
Columbia Small Cap Value Fund I
June 30, 2011
date. If the Fund no longer owns the applicable securities, the proceeds are recorded as realized gains.
Expenses
General expenses of the Trust are allocated to the Fund and other funds of the Trust based upon relative net assets or other expense allocation methodologies determined by the nature of the expense. Expenses directly attributable to the Fund are charged to the Fund. Expenses directly attributable to a specific class of shares are charged to that share class.
Determination of Class Net Asset Value
All income, expenses (other than class-specific expenses, which are charged to that share class, as shown in the Statement of Operations) and realized and unrealized gains (losses) are allocated to each class of the Fund on a daily basis, based on the relative net assets of each class, for purposes of determining the net asset value of each class.
Federal Income Tax Status
The Fund intends to qualify each year as a regulated investment company under Subchapter M of the Internal Revenue Code, as amended, and will distribute substantially all of its taxable income, if any, for its tax year, and as such will not be subject to federal income taxes. In addition, the Fund intends to distribute in each calendar year substantially all of its net investment income, capital gains and certain other amounts, if any, such that the Fund should not be subject to federal excise tax. Therefore, no federal income or excise tax provision is recorded.
Foreign Taxes
The Fund may be subject to foreign taxes on income, gains on investments or currency repatriation, a portion of which may be recoverable. The Fund will accrue such taxes and recoveries, as applicable, based upon its current interpretation of tax rules and regulations that exist in the markets in which it invests.
Realized gains in certain countries may be subject to foreign taxes at the Fund level, based on statutory rates. The Fund accrues for such foreign taxes on net realized and unrealized gains at the appropriate rate for each jurisdiction.
Distributions to Shareholders
Distributions from net investment income are declared and paid annually. Net realized capital gains, if any, are distributed along with the income dividend. Income distributions and capital gain
distributions are determined in accordance with federal income tax regulations which may differ from GAAP.
Guarantees and Indemnifications
Under the Trust’s organizational documents and, in some cases, by contract, its officers and trustees are indemnified against certain liabilities arising out of the performance of their duties to the Fund. In addition, certain of the Fund’s contracts with its service providers contain general indemnification clauses. The Fund’s maximum exposure under these arrangements is unknown since the amount of any future claims that may be made against the Fund cannot be determined, and the Fund has no historical basis for predicting the likelihood of any such claims.
Note 3. Fees and Compensation Paid to Affiliates
Investment Management Fees
Under an Investment Management Services Agreement (IMSA), the Investment Manager determines which securities will be purchased, held or sold. In September 2010, the Board approved an amended IMSA that includes an annual management fee rate that declines from 0.79% to 0.70% as the Fund’s net assets increase. The amended IMSA became effective on April 30, 2011. Prior to April 30, 2011, the management fee was equal to a percentage of the Fund’s average daily net assets that declined from 0.80% to 0.70% as the Fund’s net assets increase. The effective management fee for the year ended June 30, 2011 was 0.74% of the Fund’s average daily net assets.
Administration Fees
Under an Administrative Services Agreement, the Investment Manager serves as the Fund Administrator. In September 2010, the Board approved an amended Administrative Services Agreement that includes an annual fee for administration and accounting services equal to a percentage of the Fund’s average daily net assets that declines from 0.08% to 0.05% as the Fund’s net assets increase. The amended Administrative Services Agreement became effective on April 30, 2011. Prior to April 30, 2011, the Fund Administrator did not receive a fee of its services under the Administrative Services Agreement. The effective administrative fee for the year ended June 30, 2011 was 0.01% of the Fund’s average daily net assets.
Pricing and Bookkeeping Fees
Prior to March 28, 2011, the Fund had entered into a Financial Reporting Services Agreement (the Financial Reporting Services
29
Columbia Small Cap Value Fund I
June 30, 2011
Agreement) with State Street Bank and Trust Company (State Street) and the Investment Manager pursuant to which State Street provided financial reporting services to the Fund. The Fund also entered into an Accounting Services Agreement (collectively with the Financial Reporting Services Agreement, the State Street Agreements) with State Street and the Investment Manager pursuant to which State Street provided accounting services to the Fund. Under the State Street Agreements, the Fund paid State Street an annual fee of $38,000 paid monthly plus an additional monthly fee based on an annualized percentage rate of average daily net assets of the Fund for the month. The aggregate fee did not exceed $140,000 per year (exclusive of out-of-pocket expenses and charges). The Fund also reimbursed State Street for certain out-of-pocket expenses and charges. Effective March 28, 2011, these services are now provided under the Administrative Services Agreement discussed above.
Compensation of Board Members
Trustees are compensated for their services to the Fund as disclosed in the Statement of Operations. The Trust’s eligible Trustees may participate in a Deferred Compensation Plan (the Plan) which may be terminated at any time. Obligation of the Plan will be paid solely out of the Fund’s assets.
Compensation of Chief Compliance Officer
The board has appointed a Chief Compliance Officer to the Fund in accordance with federal securities regulations. The Fund, along with other affiliated funds, pays its pro-rata share of the expenses associated with the Chief Compliance Officer. The Fund’s expenses for the Chief Compliance Officer will not exceed $15,000 per year.
Transfer Agent Fees
Under a Transfer Agency Agreement, Columbia Management Investment Services Corp. (the Transfer Agent), an affiliate of the Investment Manager and a wholly-owned subsidiary of Ameriprise Financial, is responsible for providing transfer agency services to the Fund. The Transfer Agent has contracted with Boston Financial Data Services (BFDS) to serve as sub-transfer agent.
The Transfer Agent receives monthly account-based service fees based on the number of open accounts and is reimbursed by the Fund for the fees and expenses the Transfer Agent pays to financial intermediaries that maintain omnibus accounts with the Fund that is a percentage of the average aggregate value of the Fund’s shares maintained in each such omnibus account (other than omnibus accounts for which American Enterprise Investment Services Inc. is
the broker of record or accounts where the beneficial shareholder is a customer of Ameriprise Financial Services, Inc., which are paid a per account fee). The Transfer Agent pays the fees of BFDS for services as sub-transfer agent and is not entitled to reimbursement for such fees from the Fund (with the exception of out-of-pocket fees). The Transfer Agent also receives compensation from fees for various shareholder services and reimbursements for certain out-of-pocket expenses. Class I shares do not pay transfer agent fees.
For the year ended June 30, 2011, the Fund’s effective transfer agent fee rates as a percentage of average daily net assets of each class were as follows:
| | |
| | | |
| Class A | | 0.19% |
| Class B | | 0.19 |
| Class C | | 0.19 |
| Class R | | 0.17 |
| Class Y | | 0.00 |
| Class Z | | 0.19 |
An annual minimum account balance fee of $20 may apply to certain accounts with a value below the Fund’s initial minimum investment requirements to reduce the impact of small accounts on transfer agent fees. These minimum account balance fees are recorded as part of expense reductions on the Statement of Operations. For the year ended June 30, 2011, no minimum account balance fees were charged by the Fund.
Distribution and Service Fees
The Fund has an agreement with Columbia Management Investment Distributors, Inc. (the Distributor), an affiliate of the Investment Manager and a wholly-owned subsidiary of Ameriprise Financial, for distribution and shareholder services. Pursuant to Rule 12b-1 under the 1940 Act, the Board of Trustees has approved, and the Fund has adopted, distribution and shareholder service plans (the Plans) which set the distribution and service fees for the Fund. These fees are calculated daily and are intended to compensate the Distributor and/or eligible selling and/or servicing agents for selling shares of the Fund and providing services to investors.
The Plans require the payment of a monthly service fee to the Distributor at the maximum annual rate of 0.25% of the average daily net assets attributable to Class A, Class B and Class C shares of the Fund. The Plans also require the payment of a monthly distribution fee to the Distributor at the maximum annual rates of 0.75% of the average daily net assets attributable to Class B and
30
Columbia Small Cap Value Fund I
June 30, 2011
Class C shares and 0.50% of the average daily net assets attributable to Class R shares.
Sales Charges
Sales charges, including front-end charges and CDSCs, received by the Distributor for distributing Fund shares were $315,838 for Class A, $19,950 for Class B and $3,509 for Class C for the year ended June 30, 2011.
Expenses Waived/Reimbursed by the Investment Manager and its Affiliates
Effective April 30, 2011, the Investment Manager and certain of its affiliates have contractually agreed to waive fees and/or reimburse expenses (excluding certain fees and expenses described below), through October 31, 2012, unless sooner terminated at the sole discretion of the Board of Trustees, so that the Fund’s net operating expenses, after giving effect to fees waived/expenses reimbursed and any balance credits and/or overdraft charges from the Fund’s custodian, do not exceed the following annual rates as a percentage of each class’ average daily net assets:
| | |
| | | |
| Class A | | 1.37% |
| Class B | | 2.12 |
| Class C | | 2.12 |
| Class I | | 0.97 |
| Class R | | 1.62 |
| Class Y | | 1.12 |
| Class Z | | 1.12 |
Under the agreement, the following fees and expenses are excluded from the waiver/reimbursement commitment, and therefore will be paid by the Fund, if applicable: taxes (including foreign transaction taxes), expenses associated with investments in other affiliated and non-affiliated pooled investment vehicles (including mutual funds and exchange traded funds), transaction costs and brokerage commissions, costs related to any securities lending program, dividend expenses associated with securities sold short, inverse floater program fees and expenses, transaction charges and interest on borrowed money, interest, extraordinary expenses and any other expenses the exclusion of which is specifically approved by the Fund’s Board of Trustees. This agreement may be modified or amended only with approval from all parties.
For the period September 27, 2010 through April 30, 2011, the Investment Manager voluntarily agreed to waive fees and/or reimburse expenses (excluding certain expenses, such as brokerage
commissions, interest, taxes, acquired fund fees and expenses, and extraordinary expenses) so that the Fund’s net operating expenses, after giving effect to fees waived/expenses reimbursed and any balance credits and/or overdraft charges from the Fund’s custodian, did not exceed the following annual rates as a percentage of each class’ average daily net assets:
| | |
| | | |
| Class A | | 1.35% |
| Class B | | 2.10 |
| Class C | | 2.10 |
| Class I | | 0.95 |
| Class R | | 1.60 |
| Class Y | | 1.10 |
| Class Z | | 1.10 |
Prior to September 27, 2010, the Investment Manager voluntarily agreed to reimburse a portion of the Fund’s expenses so that the Fund’s net operating expenses (excluding certain expenses, such as any distribution and service fees, brokerage commissions, interest, taxes and extraordinary expenses), after giving effect to fees waived/expenses reimbursed and any balance credits and/or overdraft charges from the Fund’s custodian, did not exceed 1.10% of the Fund’s average daily net assets on an annualized basis.
Note 4. Federal Tax Information
The timing and character of income and capital gain distributions are determined in accordance with income tax regulations, which may differ from GAAP. Reclassifications are made to the Fund’s capital accounts for permanent tax differences to reflect income and gains available for distribution (or available capital loss carryforwards) under income tax regulations.
For the year ended June 30, 2011, permanent and timing book to tax differences resulting primarily from differing treatments for foreign currency transactions, passive foreign investment company (PFIC) holdings, re-characterization of real estate investment trust (REIT) distributions, redemption based payments treated as eligible for the dividends paid deduction, and losses deferred due to wash sales were identified and permanent differences reclassed among the components of the Fund’s net assets in the Statement of Assets and Liabilities as follows:
| | |
| | | |
| Excess of distributions over net investment income | | $ 66,571 |
| Accumulated net realized gain | | (6,123,588) |
| Paid-in capital | | 6,057,017 |
31
Columbia Small Cap Value Fund I
June 30, 2011
Net investment income and net realized gains (losses), as disclosed in the Statement of Operations, and net assets were not affected by this reclassification.
The tax character of distributions paid during the years indicated was as follows:
| | | | |
| Year ended June 30, | | 2011 | | 2010 |
| Ordinary income* | | $19,271,086 | | $6,405,327 |
| Long-term capital gain | | 6,213,315 | | — |
| * | For tax purposes short-term capital gain distributions, if any, are considered ordinary income distributions. |
At June 30, 2011, the components of distributable earnings on a tax basis were as follows:
| | |
| | | |
| Undistributed ordinary income | | $ 26,576,390 |
| Undistributed accumulated long-term gain | | 80,920,061 |
| Unrealized appreciation* | | 360,183,059 |
| * | The difference between book-basis and tax-basis net unrealized appreciation are primarily due to deferral of losses from wash sales and PFIC adjustments. |
At June 30, 2011, the cost of investments for federal income tax purposes was $1,992,650,829 and the aggregate gross unrealized appreciation and depreciation based on that cost was:
| | |
| | | |
| Unrealized appreciation | | $457,313,754 |
| Unrealized depreciation | | (97,130,695) |
| | |
| Net unrealized appreciation | | $360,183,059 |
The following capital loss carryforward, determined at June 30, 2011, may be available to reduce taxable income arising from future net realized gains on investments, if any, to the extent permitted by the Internal Revenue Code:
| | |
| | | |
| Year of Expiration | | Amount |
| 2012 | | $1,233,446 |
| 2016 | | 238,113 |
| | |
| Total | | $1,471,559 |
For the year ended June 30, 2011, $15,289,495 of capital loss carryforward was utilized.
Columbia Small Cap Value Fund I acquired $358,925 of capital loss carryforward in connection with the RiverSource Disciplined Small Cap Value Fund’s merger (Note 12). In addition to the acquired
capital loss carryforward, the Fund also acquired unrealized capital gains as a result of the merger. The yearly utilization of the acquired capital loss carryforward may be limited by the Internal Revenue Code.
There is no assurance that the Fund will be able to utilize all of its capital loss carryforward before it expires.
Management of the Fund has concluded that there are no significant uncertain tax positions that would require recognition in the financial statements. However, management’s conclusion may be subject to review and adjustment at a later date based on factors including, but not limited to, new tax laws, regulations, and administrative interpretations (including relevant court decisions). Generally, the Fund’s federal tax returns for the prior three fiscal years remain subject to examination by the Internal Revenue Service.
Note 5. Portfolio Information
The cost of purchases and proceeds from sales of securities, excluding short-term obligations, aggregated to $613,254,808 and $539,096,660, respectively, for the year ended June 30, 2011.
Transactions to realign the Fund’s portfolio following the merger as described in Note 12 are excluded for purposes of calculating the Fund’s portfolio turnover rate. These realignment transactions amounted to cost of purchases and proceeds from sales of $29,706,370 and $32,373,811, respectively.
Note 6. Regulatory Settlements
During the year ended June 30, 2010, the Fund received payments of $4,978 resulting from certain regulatory settlements with third parties in which the Fund had participated. The payments have been included in “Increase from regulatory settlements” in the Statement of Changes in Net Assets.
Note 7. Lending of Portfolio Securities
Effective March 28, 2011, the Fund has entered into a Master Securities Lending Agreement (the Agreement) with JPMorgan Chase Bank, National Association (JPMorgan). The Agreement, which replaces the previous securities lending arrangement with State Street, authorizes JPMorgan as lending agent to lend securities to authorized borrowers in order to generate additional income on behalf of the Fund. Pursuant to the Agreement, the securities loaned are secured by cash or U.S. government securities equal to at least 100% of the market value of the loaned securities. Any additional collateral required to maintain those levels due to market fluctuations of the loaned securities is delivered the following
32
Columbia Small Cap Value Fund I
June 30, 2011
business day. Cash collateral received is invested by the lending agent on behalf of the Fund into authorized investments pursuant to the Agreement. The investments made with the cash collateral are listed in the Portfolio of Investments. The values of such investments and any uninvested cash collateral are disclosed in the Statement of Assets and Liabilities along with the related obligation to return the collateral upon the return of the securities loaned. At June 30, 2011, securities valued at $387,420,558 were on loan, secured by cash collateral of $394,087,530 partially or fully invested in short-term securities or other cash equivalents.
Risks of delay in recovery of securities or even loss of rights in the securities may occur should the borrower of the securities fail financially. Risks may also arise to the extent that the value of the securities loaned increases above the value of the collateral received. JPMorgan will indemnify the Fund from losses resulting from a borrower’s failure to return a loaned security when due. Such indemnification does not extend to losses associated with declines in the value of cash collateral investments. The Investment Manager is not responsible for any losses incurred by the Fund in connection with the securities lending program. Loans are subject to termination by the Fund or the borrower at any time, and are, therefore, not considered to be illiquid investments.
Pursuant to the Agreement, the Fund receives income for lending its securities either in the form of fees or by earning interest on invested cash collateral, net of negotiated rebates paid to borrowers and fees paid to the lending agent for services provided and any other securities lending expenses. Net income earned from securities lending for the year ended June 30, 2011 is disclosed in the Statement of Operations. The Fund continues to earn and accrue interest and dividends on the securities loaned.
Note 8. Custody Credits
Prior to March 28, 2011 the Fund had an agreement with its custodian bank under which custody fees may have been reduced by balance credits. These credits are recorded as part of expense reductions on the Statement of Operations. The Fund could have invested a portion of the assets utilized in connection with the expense offset arrangement in an income-producing asset if they had not entered into such an agreement. Effective March 28, 2011, the Fund may invest its daily balance in an affiliated money market fund as detailed below. For the period from July 1, 2010 through March 27, 2011, these credits reduced total expenses by $88.
Note 9. Affiliated Money Market Fund
Effective March 28, 2011, the Fund may invest its daily cash balances in Columbia Short-Term Cash Fund, a money market fund established for the exclusive use by the Fund and other affiliated Funds. The income earned by the Fund from such investments is included as “Dividends from affiliates” in the Statement of Operations. As an investing fund, the Fund indirectly bears its proportionate share of the expenses of Columbia Short-Term Cash Fund.
Note 10. Shareholder Concentration
At June 30, 2011 the Investment Manager and/or affiliates owned 100% of Class I shares.
As of June 30, 2011, one shareholder account owned 14.3% of the outstanding shares of the fund. Purchase and redemption activity of this account may have a significant effect on the operations of the Fund.
Note 11. Line of Credit
The Fund has entered into a revolving credit facility with a syndicate of banks led by JPMorgan Chase Bank, N.A. (the Administrative Agent), whereby the Fund may borrow for the temporary funding of shareholder redemptions or for other temporary or emergency purposes. The credit facility became effective on March 28, 2011, replacing a prior credit facility with State Street (as discussed below). The credit facility agreement, which is a collective agreement between the Fund and certain other funds managed by the Investment Manager, severally and not jointly, permits collective borrowings up to $422.5 million. The collective borrowing amount will increase during the third quarter of 2011 to a final collective borrowing amount of $500 million. Interest is charged to each fund based on its borrowings at a rate equal to the sum of the federal funds rate plus (i) 1.25% per annum plus (ii) if one-month LIBOR exceeds the federal funds rate, the amount of such excess. Each borrowing under the credit facility matures no later than 60 days after the date of borrowing. The Fund also pays a commitment fee equal to its pro rata share of the amount of the credit facility at a rate of 0.10% per annum.
Prior to March 29, 2011, the Fund and certain other funds managed by the Investment Manager participated in a $280 million committed, unsecured revolving credit facility provided by State Street. Interest was charged to each fund based on its borrowings at a rate equal to the greater of the (i) federal funds rate plus 1.25% per annum or (ii) the overnight LIBOR rate plus 1.25% per annum. The
33
Columbia Small Cap Value Fund I
June 30, 2011
Fund also paid a commitment fee equal to its pro rata share of the amount of the credit facility at a rate of 0.125% per annum.
Prior to October 14, 2010, interest was charged to each participating fund at the same rates. In addition, a commitment fee of 0.15% per annum was accrued and apportioned among the participating funds pro rata based on their relative net assets.
For the year ended June 30, 2011, the average daily loan balance outstanding on days where borrowing existed was $1,811,111 at a weighted average interest rate of 1.47%.
Note 12. Fund Merger
At the close of business on June 3, 2011, Columbia Small Cap Value Fund I acquired the assets and assumed the identified liabilities of RiverSource Disciplined Small Cap Value Fund. The reorganization was completed after shareholders approved the plan on February 15, 2011. The purpose of the transaction was to combine two funds managed by the Investment Manager with comparable investment objectives and strategies.
The aggregate net assets of Columbia Small Cap Value Fund I immediately before the acquisition were $1,873,264,948 and the combined net assets immediately after the acquisition were $1,915,994,081.
The merger was accomplished by a tax-free exchange of 4,604,408 shares of RiverSource Disciplined Small Cap Value Fund valued at $42,729,133 (including $4,256,611 of unrealized appreciation).
In exchange for RiverSource Disciplined Small Cap Value Fund shares, Columbia Small Cap Value Fund I issued the following number of shares:
| | | | |
| | | | |
| | | Shares | |
| Class A | | | 84,483 | |
| Class B | | | 3,912 | |
| Class C | | | 3,642 | |
| Class I | | | 817,679 | |
| Class R | | | 94 | |
For financial reporting purposes, net assets received and shares issued by Columbia Small Cap Value Fund I were recorded at fair value; however, RiverSource Disciplined Small Cap Value Fund’s cost of investments was carried forward to align ongoing reporting of Columbia Small Cap Value Fund I’s realized and unrealized gains and losses with amounts distributable to shareholders for tax purposes.
The financial statements reflect the operations of Columbia Small Cap Value Fund I for the period prior to the merger and the combined fund for the period subsequent to the merger. Because the combined investment portfolios have been managed as a single integrated portfolio since the merger was completed, it is not practicable to separate the amounts of revenue and earnings of RiverSource Disciplined Small Cap Value Fund that have been included in the combined Fund’s Statement of Operations since the merger was completed.
Assuming the merger had been completed on July 1, 2010 Columbia Small Cap Value Fund I’s pro-forma net investment income, net gain on investments, net change in unrealized appreciation (depreciation) and net increase in net assets from operations for the year ended June 30, 2011 would have been approximately $7.9 million, $142.1 million, $310.9 million and $460.9 million, respectively.
Note 13. Significant Risks
Sector Focus Risk
The Fund may focus its investments in certain sectors, subjecting it to greater risk than a fund that invests in a wider range of industries.
Note 14. Subsequent Events
Management has evaluated the events and transactions that have occurred through the date the financial statements were issued. Other than as noted in Note 11 above, there were no items requiring adjustment of the financial statements or additional disclosure.
Note 15. Information Regarding Pending and Settled Legal Proceedings
In June 2004, an action captioned John E. Gallus et al. v. American Express Financial Corp. and American Express Financial Advisors Inc. was filed in the United States District Court for the District of Arizona. The plaintiffs allege that they are investors in several American Express Company mutual funds (branded as Columbia or RiverSource) and they purport to bring the action derivatively on behalf of those funds under the Investment Company Act of 1940. The plaintiffs allege that fees allegedly paid to the defendants by the funds for investment advisory and administrative services are excessive. The plaintiffs seek remedies including restitution and rescission of investment advisory and distribution agreements. The plaintiffs voluntarily agreed to transfer this case to the United States District Court for the District of Minnesota (the District Court). In response to defendants’ motion to dismiss the complaint, the District
34
Columbia Small Cap Value Fund I
June 30, 2011
Court dismissed one of plaintiffs’ four claims and granted plaintiffs limited discovery. Defendants moved for summary judgment in April 2007. Summary judgment was granted in the defendants’ favor on July 9, 2007. The plaintiffs filed a notice of appeal with the Eighth Circuit Court of Appeals (the Eighth Circuit) on August 8, 2007. On April 8, 2009, the Eighth Circuit reversed summary judgment and remanded to the District Court for further proceedings. On August 6, 2009, defendants filed a writ of certiorari with the U.S. Supreme Court (the Supreme Court), asking the Supreme Court to stay the District Court proceedings while the Supreme Court considers and rules in a case captioned Jones v. Harris Associates, which involves issues of law similar to those presented in the Gallus case. On March 30, 2010, the Supreme Court issued its ruling in Jones v. Harris Associates, and on April 5, 2010, the Supreme Court vacated the Eighth Circuit’s decision in the Gallus case and remanded the case to the Eighth Circuit for further consideration in light of the Supreme Court’s decision in Jones v. Harris Associates. On June 4, 2010, the Eighth Circuit remanded the Gallus case to the District Court for further consideration in light of the Supreme Court’s decision in Jones v. Harris Associates. On December 9, 2010, the District Court reinstated its July 9, 2007 summary judgment order in favor of the defendants. On January 10, 2011, plaintiffs filed a notice of appeal with the Eighth Circuit. In response to the plaintiffs’ opening appellate brief filed on March 18, 2011, the defendants filed a response brief on May 4, 2011 with the Eighth Circuit. The plaintiffs filed a reply brief on May 26, 2011.
In December 2005, without admitting or denying the allegations, American Express Financial Corporation (AEFC, which is now known as Ameriprise Financial, Inc. (Ameriprise Financial)), entered into settlement agreements with the Securities and Exchange Commission (SEC) and Minnesota Department of Commerce (MDOC) related to market timing activities. As a result, AEFC was censured and ordered to cease and desist from committing or causing any violations of certain provisions of the Investment Advisers Act of 1940, the Investment Company Act of 1940, and various Minnesota laws. AEFC agreed to pay disgorgement of $10 million
and civil money penalties of $7 million. AEFC also agreed to retain an independent distribution consultant to assist in developing a plan for distribution of all disgorgement and civil penalties ordered by the SEC in accordance with various undertakings detailed at www.sec.gov/litigation/admin/ia-2451.pdf. Ameriprise Financial and its affiliates have cooperated with the SEC and the MDOC in these legal proceedings, and have made regular reports to the funds’ Boards of Directors/Trustees.
Ameriprise Financial and certain of its affiliates have historically been involved in a number of legal, arbitration and regulatory proceedings, including routine litigation, class actions, and governmental actions, concerning matters arising in connection with the conduct of their business activities. Ameriprise Financial believes that the Funds are not currently the subject of, and that neither Ameriprise Financial nor any of its affiliates are the subject of, any pending legal, arbitration or regulatory proceedings that are likely to have a material adverse effect on the Funds or the ability of Ameriprise Financial or its affiliates to perform under their contracts with the Funds. Ameriprise Financial is required to make 10-Q, 10-K and, as necessary, 8-K filings with the Securities and Exchange Commission on legal and regulatory matters that relate to Ameriprise Financial and its affiliates. Copies of these filings may be obtained by accessing the SEC website at www.sec.gov.
There can be no assurance that these matters, or the adverse publicity associated with them, will not result in increased fund redemptions, reduced sale of fund shares or other adverse consequences to the Funds. Further, although we believe proceedings are not likely to have a material adverse effect on the Funds or the ability of Ameriprise Financial or its affiliates to perform under their contracts with the Funds, these proceedings are subject to uncertainties and, as such, we are unable to estimate the possible loss or range of loss that may result. An adverse outcome in one or more of these proceedings could result in adverse judgments, settlements, fines, penalties or other relief that could have a material adverse effect on the consolidated financial condition or results of operations of Ameriprise Financial.
35
Report of Independent Registered Public Accounting Firm
To the Trustees of Columbia Funds Series Trust I and the Shareholders of Columbia Small Cap Value Fund I
In our opinion, the accompanying statement of assets and liabilities, including the investment portfolio, and the related statements of operations and of changes in net assets and the financial highlights present fairly, in all material respects, the financial position of Columbia Small Cap Value Fund I (the “Fund”) (a series of Columbia Funds Series Trust I) at June 30, 2011, the results of its operations for the year then ended, the changes in its net assets for each of the two years in the period then ended, and the financial highlights for the periods indicated, in conformity with accounting principles generally accepted in the United States of America. These financial statements and financial highlights (hereafter referred to as “financial statements”) are the responsibility of the Fund’s management. Our responsibility is to express an opinion on these financial statements based on our audits. We conducted our audits of these financial statements in accordance with the standards of the Public Company Accounting Oversight Board (United States). Those standards require that we plan and perform the audit to obtain reasonable assurance about whether the financial statements are free of material misstatement. An audit includes examining, on a test basis, evidence supporting the amounts and disclosures in the financial statements, assessing the accounting principles used and significant estimates made by management, and evaluating the overall financial statement presentation. We believe that our audits, which included confirmation of securities at June 30, 2011 by correspondence with the custodian and brokers, provide a reasonable basis for our opinion.
PricewaterhouseCoopers LLP
Boston, Massachusetts
August 22, 2011
36
Federal Income Tax Information (Unaudited) – Columbia Small Cap Value Fund I
The Fund hereby designates as a capital gain dividend with respect to the fiscal year ended June 30, 2011, $96,466,424, or, if subsequently determined to be different, the net capital gain of such year.
83.13% of the ordinary income distributed by the Fund, for the fiscal year ended June 30, 2011, qualifies for the corporate dividends received deduction.
For non-corporate shareholders 83.23% or the maximum amount allowable under the Jobs and Growth Tax Relief Reconciliation Act of 2003, of the ordinary income distributed by the Fund for the fiscal year ended June 30, 2011 may represent qualified dividend income.
The Fund will notify shareholders in January 2012 of amounts for use in preparing 2011 income tax returns.
37
Fund Governance
The Trustees serve terms of indefinite duration. The names, addresses and birth years of the Trustees and Officers of the Funds in Columbia Funds Series Trust I, the year each was first elected or appointed to office, their principal business occupations during at least the last five years, the number of Funds overseen by each Trustee and other directorships they hold are shown below. Each officer listed below serves as an officer of each Fund in Columbia Funds Series Trust I.
Independent Trustees
| | |
Name, Address and Year of Birth,
Position with Funds, Year First
Elected or Appointed to Office | | Principal Occupation(s) During Past Five Years, Number of Funds in Columbia Funds
Complex Overseen by Trustee, Other Directorships Held |
| |
| Rodman L. Drake (born 1943) | | |
c/o Columbia Management Investment Advisers, LLC 225 Franklin Street Boston, MA 02110 Trustee (since 1994) and Chairman of the Board (since 2009) | | Independent consultant since 2010; Co-Founder of Baringo Capital LLC (private equity) from 1997 to 2008; CEO of Crystal River Capital, Inc. (real estate investment trust) from 2003 to 2010; Oversees 43; Jackson Hewitt Tax Service Inc. (tax preparation services); Celgene Corporation (global biotechnology company); Student Loan Corporation (student loan provider); Celgene Corporation (global biotechnology company); the Helios Funds (exchange-traded funds); Crystal River Capital, Inc. from 2005 to 2010; Parsons Brinckerhoff from 1995 to 2008; and Apex Silver Mines Ltd. from 2007 to 2009 |
| |
| Douglas A. Hacker (born 1955) | | |
c/o Columbia Management Investment Advisers, LLC 225 Franklin Street Boston, MA 02110 Trustee (since 1996) | | Independent business executive since May 2006; Executive Vice President–Strategy of United Airlines (airline) from December 2002 to May 2006; President of UAL Loyalty Services (airline marketing company) from September 2001 to December 2002; Executive Vice President and Chief Financial Officer of United Airlines from July 1999 to September 2001. Oversees 43; Nash Finch Company (food distributor); Aircastle Limited (aircraft leasing); and SeaCube Container Leasing Ltd (container leasing) |
|
| Janet Langford Kelly (born 1957) |
c/o Columbia Management Investment Advisers, LLC 225 Franklin Street Boston, MA 02110 Trustee (since 1996) | | Senior Vice President, General Counsel and Corporate Secretary, ConocoPhillips (integrated energy company) since September 2007; Deputy General Counsel–Corporate Legal Services, ConocoPhillips from August 2006 to August 2007; Partner, Zelle, Hofmann, Voelbel, Mason & Gette LLP (law firm) from March 2005 to July 2006; Adjunct Professor of Law, Northwestern University, from September 2004 to June 2006; Director, UAL Corporation (airline) from February 2006 to July 2006; Oversees 43; None |
|
| William E. Mayer (born 1940) |
c/o Columbia Management Investment Advisers, LLC 225 Franklin Street Boston, MA 02110 Trustee (since 1994) | | Partner, Park Avenue Equity Partners (private equity) since February 1999; Dean and Professor, College of Business and Management, University of Maryland from 1992 to 1996. Oversees 43; DynaVox Inc. (software developer); Lee Enterprises (print media), WR Hambrecht + Co. (financial service provider); BlackRock Kelso Capital Corporation (investment company) |
38
Fund Governance (continued)
Independent Trustees (continued)
| | |
Name, Address and Year of Birth,
Position with Funds, Year First
Elected or Appointed to Office | | Principal Occupation(s) During Past Five Years, Number of Funds in Columbia Funds
Complex Overseen by Trustee, Other Directorships Held |
| |
| David M. Moffett (born 1952) | | |
c/o Columbia Management Investment Advisers, LLC 225 Franklin Street Boston, MA 02110 Trustee (since 2011) | | Retired. Chief Executive Officer, Federal Home Loan Mortgage Corporation, from 2008 to 2009; Senior Adviser, Global Financial Services Group, Carlyle Group, Inc., from 2007 to 2008; Vice Chairman and Chief Financial Officer, U.S. Bancorp, from 1993 to 2007. Oversees 43; CIT Group Inc. (commercial and consumer finance), eBay Inc. (online trading community), MBIA Corp (financial service provider), E.W. Scripps Co. (print and television media), Building Materials Holding Corp. (building materials and construction services), and University of Oklahoma Foundation |
| |
| Charles R. Nelson (born 1942) | | |
c/o Columbia Management Investment Advisers, LLC 225 Franklin Street Boston, MA 02110 Trustee (since 1981) | | Professor of Economics, University of Washington, since January 1976; Ford and Louisa Van Voorhis Professor of Political Economy, University of Washington, since September 1993; Adjunct Professor of Statistics, University of Washington, since September 1980; Associate Editor, Journal of Money Credit and Banking from 1993 to 2008; consultant on econometric and statistical matters. Oversees 43; None |
| |
| John J. Neuhauser (born 1943) | | |
c/o Columbia Management Investment Advisers, LLC 225 Franklin Street Boston, MA 02110 Trustee (since 1984) | | President, Saint Michael’s College, since August 2007; Director or Trustee of several non-profit organization, including Fletcher Allen Health Care, Inc.; University Professor, Boston College from November 2005 to August 2007; Academic Vice President and Dean of Faculties, Boston College from August 1999 to October 2005. Oversees 43; Liberty All-Star Equity Fund and Liberty All-Star Growth Fund, Inc. (closed-end funds) |
| |
| Patrick J. Simpson (born 1944) | | |
c/o Columbia Management Investment Advisers, LLC 225 Franklin Street Boston, MA 02110 Trustee (since 2000) | | Partner, Perkins Coie LLP (law firm). Oversees 43; None |
| |
| Anne-Lee Verville (born 1945) | | |
c/o Columbia Management Investment Advisers, LLC 225 Franklin Street Boston, MA 02110 Trustee (since 1998) | | Retired since 1997 (formerly General Manager–Global Education Industry from 1994 to 1997, President–Application Systems Division from 1991 to 1994, Chief Financial Officer–US Marketing & Services from 1988 to 1991, and Chief Information Officer from 1987 to 1988, IBM Corporation (computer and technology)). Oversees 43; Enesco Group, Inc. (producer of giftware and home and garden decor products) from 2001 to 2006 |
39
Fund Governance (continued)
Interested Trustee
| | |
Name, Address and Year of Birth,
Position with Funds, Year First
Elected or Appointed to Office | | Principal Occupation(s) During Past Five Years, Number of Funds in Columbia Funds
Complex Overseen by Trustee, Other Directorships Held |
| |
| Michael A. Jones (born 1959) | | |
c/o Columbia Management Investment Advisers, LLC 225 Franklin Street Boston, MA 02110 Trustee (since 2011) Senior Vice President (since 2011) | | President and Director, Columbia Management Investment Advisers, LLC since May 2010; President and Director, Columbia Management Investment Distributors, Inc. since May 2010; Manager, Chairman, Chief Executive Officer and President, Columbia Management Advisors, LLC from 2007 to April 2010; Chief Executive Officer, President and Director, Columbia Management Distributors, Inc. from November 2006 to April 2010; previously, co-president and senior managing director at Robeco Investment Management. Oversees 43; None |
The Statement of Additional Information includes additional information about the Trustees of the Funds and is available, without charge, upon request by calling 1-800-345-6611.
40
Fund Governance (continued)
Officers
| | |
| Name, Year of birth and address | | Principal occupation(s) during the past five years |
|
| J. Kevin Connaughton (born 1964) |
225 Franklin Street Boston, MA 02110 President (since 2009) | | Senior Vice President and General Manager–Mutual Fund Products, Columbia Management Investment Advisers, LLC since May 2010; President, Columbia Funds, since 2009, and RiverSource Funds, since May 2010 (previously Senior Vice President and Chief Financial Officer, Columbia Funds, from June 2008 to January 2009, Treasurer, Columbia Funds, from October 2003 to May 2008, and senior officer of various other affiliated funds since 2000); Managing Director, Columbia Management Advisors, LLC from December 2004 to April 2010. |
| |
| Michael G. Clarke (born 1969) | | |
225 Franklin Street Boston, MA 02110 Treasurer (since 2011) and Chief Financial Officer (since 2009) | | Vice President, Columbia Management Investment Advisers, LLC since May 2010; Managing Director of Fund Administration, Columbia Management Advisors, LLC, from September 2004 to April 2010; senior officer of Columbia Funds and affiliated funds since 2002. |
| |
| Scott R. Plummer (born 1959) | | |
5228 Ameriprise Financial Center Minneapolis, MN 55474 Senior Vice President, Assistant Secretary and Chief Legal Officer (since 2010) | | Chief Legal Officer and Assistant Secretary, Columbia Management Investment Advisers, LLC since June 2005; Vice President and Lead Chief Counsel–Asset Management, Ameriprise Financial, Inc. since May 2010 (previously Vice President and Chief Counsel–Asset Management, from 2005 to April 2010, and Vice President–Asset Management Compliance from 2004 to 2005); Vice President, Chief Counsel and Assistant Secretary, Columbia Management Investment Distributors, Inc. since 2008; Vice President, General Counsel and Secretary, Ameriprise Certificate Company since 2005; Chief Counsel, RiverSource Distributors, Inc. since 2006; Vice President, General Counsel and Secretary, RiverSource Funds, since December 2006; Senior Vice President, Secretary and Chief Legal Officer, Columbia Funds, since May 2010. |
| |
| Linda J. Wondrack (born 1964) | | |
225 Franklin Street Boston, MA 02110 Senior Vice President and Chief Compliance Officer (since 2007) | | Vice President and Chief Compliance Officer, Columbia Management Investment Advisers, LLC since May 2010; Chief Compliance Officer, Columbia Funds, since 2007, and RiverSource Funds, since May 2010; Director (Columbia Management Group, LLC and Investment Product Group Compliance), Bank of America, from June 2005 to April 2010; Director of Corporate Compliance and Conflicts Officer of MFS Investment Management (investment management) from August 2004 to May 2005. |
| |
| William F. Truscott (born 1960) | | |
53600 Ameriprise Financial Center Minneapolis, MN 55474 Senior Vice President (since 2010) | | Chairman of the Board, Columbia Management Investment Advisers, LLC since May 2010 (previously President, Chairman of the Board and Chief Investment Officer, from 2001 to April 2010); Chief Executive Officer, U.S. Asset Management & President, Annuities, Ameriprise Financial, Inc. since May 2010 (previously President–U.S. Asset Management and Chief Investment Officer from 2005 to April 2010, and Senior Vice President–Chief Investment Officer, from 2001 to 2005); Director, President and Chief Executive Officer, Ameriprise Certificate Company since 2006; Director, Columbia Management Investment Distributors, Inc. since May 2010 (previously Chairman of the Board and Chief Executive Officer from 2008 to April 2010); Chairman of the Board and Chief Executive Officer, RiverSource Distributors, Inc. since 2006. |
41
Fund Governance (continued)
Officers (continued)
| | |
| Name, Year of birth and address | | Principal occupation(s) during the past five years |
|
| Colin Moore (born 1958) |
225 Franklin Street Boston, MA 02110 Senior Vice President (since 2010) | | Director and Chief Investment Officer, Columbia Management Investment Advisers, LLC since May 2010; Manager, Managing Director and Chief Investment Officer of Columbia Management Advisors, LLC from 2007 to April 2010; Head of Equities, Columbia Management Advisors, LLC from 2002 to 2007. |
| |
| Amy Johnson (born 1965) | | |
5228 Ameriprise Financial Center Minneapolis, MN 55474 Vice President (since 2010) | | Senior Vice President and Chief Operating Officer, Columbia Management Investment Advisers, LLC since May 2010 (previously Chief Administrative Officer, from 2009 until April 2010, Vice President–Asset Management and Trust Company Services, from 2006 to 2009, and Vice President–Operations and Compliance from 2004 to 2006). |
| |
| Joseph F. DiMaria (born 1968) | | |
225 Franklin Street Boston, MA 02110 Vice President (since 2011) and Chief Accounting Officer (since 2008) | | Vice President, Mutual Fund Administration, Columbia Management Investment Advisers, LLC, since May 2010; Director of Fund Administration, Columbia Management Advisors, LLC from January 2006 to April 2010; Head of Tax/Compliance and Assistant Treasurer, Columbia Management Advisors, LLC, from November 2004 to December 2005. |
| |
| Stephen T. Welsh (born 1957) | | |
225 Franklin Street Boston, MA 02110 Vice President (since 2006) | | President and Director, Columbia Management Investment Services Corp. since May 2010; President and Director, Columbia Management Services, Inc. from July 2004 to April 2010; Managing Director, Columbia Management Distributors, Inc. from August 2007 to April 2010. |
| |
| Paul D. Pearson (born 1956) | | |
5228 Ameriprise Financial Center Minneapolis, MN 55474 Vice President and Assistant Treasurer (since 2011) | | Vice President, Investment Accounting, Columbia Management Investment Advisers, LLC, since May 2010; Vice President, Managed Assets, Investment Accounting, Ameriprise Financial Corporation. |
| |
| Paul B. Goucher (born 1968) | | |
5228 Ameriprise Financial Center Minneapolis, MN 55474 Vice President and Assistant Secretary (since 2010) | | Vice President and Chief Counsel of Ameriprise Financial since January 2010 (formerly Vice President and Group Counsel from November 2008 to January 2010); Director, Managing Director and General Counsel of J. & W. Seligman & Co. Incorporated (Seligman) from July 2008 to November 2008 and Managing Director and Associate General Counsel of Seligman from January 2005 to July 2008. |
| |
| Christopher O. Petersen (born 1970) | | |
5228 Ameriprise Financial Center Minneapolis, MN 55474 Vice President (since 2010) and Secretary (since 2011) | | Vice President and Chief Counsel, Ameriprise Financial since January 2010 (formerly Vice President and Group Counsel or Counsel from April 2004 to January 2010); Assistant Secretary of RiverSource Funds since January 2007. |
| |
| Michael E. DeFao (born 1968) | | |
5228 Ameriprise Financial Center Minneapolis, MN 55474 Vice President and Assistant Secretary (since 2011) | | Vice President and Chief Counsel, Ameriprise Financial since May 2010; Associate General Counsel Bank of America from June 2005 to April 2010. |
42
[THIS PAGE INTENTIONALLY LEFT BLANK]
43
[THIS PAGE INTENTIONALLY LEFT BLANK]
44
Important Information About This Report
The fund mails one shareholder report to each shareholder address. If you would like more than one report, please call shareholder services at 1-800-345-6611 and additional reports will be sent to you. This report has been prepared for shareholders of Columbia Small Cap Value Fund I.
A description of the policies and procedures that the fund uses to determine how to vote proxies and a copy of the fund’s voting records are available (i) at www.columbiamanagement.com, (ii) on the Securities and Exchange Commission’s website at www.sec.gov, and (iii) without charge, upon request, by calling 1-800-368-0346. Information regarding how the fund voted proxies relating to portfolio securities during the 12-month period ended June 30 is available from the SEC’s website. Information regarding how the fund voted proxies relating to portfolio securities is also available from the fund’s website, www.columbiamanagement.com.
The fund files a complete schedule of portfolio holdings with the SEC for the first and third quarters of each fiscal year on Form N-Q. The fund’s Form N-Q is available on the SEC’s website at www.sec.gov and may be reviewed and copied at the SEC’s Public Reference Room in Washington, D.C. Information on the operation of the Public Reference Room may be obtained by calling
1-800-SEC-0330.
Transfer Agent
Columbia Management Investment Services Corp.
P.O. Box 8081
Boston, MA 02266-8081
1-800-345-6611
Distributor
Columbia Management Investment
Distributors, Inc.
225 Franklin Street Boston, MA 02110
Investment Manager
Columbia Management Investment Advisers, LLC
225 Franklin Street Boston, MA 02110
45

Columbia Small Cap Value Fund I
P.O. Box 8081
Boston, MA 02266-8081
columbiamanagement.com
This information is for use with concurrent or prior delivery of a fund prospectus. Investors should consider the investment objectives, risks, charges and expenses of a mutual fund carefully before investing. For a free prospectus, which contains this and other important information about the funds, visit columbiamanagement.com. Read the prospectus carefully before investing. The Fund is distributed by Columbia Management Investment Distributors, Inc., member FINRA, and managed by Columbia Management Investment Advisers, LLC.
©2011 Columbia Management Investment Advisers, LLC. All rights reserved.
C-1361 C (08/11)
| | (a) | The registrant has adopted a code of ethics that applies to the registrant’s principal executive officer, principal financial officer, principal accounting officer or controller, or persons performing similar functions, regardless of whether these individuals are employed by the registrant or a third party. |
| | (b) | During the period covered by this report, there were not any amendments to a provision of the code of ethics adopted in 2(a) above. |
| | (c) | During the period covered by this report, there were no waivers, including any implicit waivers, from a provision of the code of ethics described in 2(a) above that relates to one or more of the items set forth in paragraph (b) of this item’s instructions. |
| Item 3. | Audit Committee Financial Expert. |
The registrant’s Board of Trustees has determined that Douglas A. Hacker, David M. Moffett, Charles R. Nelson and Anne-Lee Verville, each of whom are members of the registrant’s Board of Trustees and Audit Committee, each qualify as an audit committee financial expert. Mr. Hacker, Mr. Moffett, Mr. Nelson and Ms. Verville are each independent trustees, as defined in paragraph (a)(2) of this item’s instructions.
| Item 4. | Principal Accountant Fees and Services. |
Fee information below is disclosed for the two series of the registrant whose report to stockholders are included in this annual filing.
(a) Audit Fees. Aggregate Audit Fees billed by the principal accountant for professional services rendered during the fiscal years ended June 30, 2011 and June 30, 2010 are approximately as follows:
Audit Fees include amounts related to the audit of the registrant’s annual financial statements or services that are normally provided by the accountant in connection with statutory and regulatory filings or engagements for those fiscal years. Fiscal year 2011
also includes audit fees for the review and provision of consent in connection with filing Form N-1A for new share classes.
(b) Audit-Related Fees. Aggregate Audit-Related Fees billed to the registrant by the principal accountant for professional services rendered during the fiscal years ended June 30, 2011 and June 30, 2010 are approximately as follows:
Audit-Related Fees include amounts for assurance and related services by the principal accountant that are reasonably related to the performance of the audit of the registrant’s financial statements and are not reported in Audit Fees above. In both fiscal years 2011 and 2010, Audit-Related Fees consist of agreed-upon procedures performed for semi-annual shareholder reports. Fiscal year 2011 also includes Audit-Related Fees for agreed- upon procedures related to fund mergers and fund accounting and custody conversions.
During the fiscal years ended June 30, 2011 and June 30, 2010, there were no Audit-Related Fees billed by the registrant’s principal accountant to the registrant’s investment adviser (not including any sub-adviser whose role is primarily portfolio management and is subcontracted with or overseen by another investment adviser) and any entity controlling, controlled by, or under common control with the adviser that provides ongoing services to the registrant for an engagement that related directly to the operations and financial reporting of the registrant.
(c) Tax Fees. Aggregate Tax Fees billed by the principal accountant to the registrant for professional services rendered during the fiscal years ended June 30, 2011 and June 30, 2010 are approximately as follows:
Tax Fees include amounts for the review of annual tax returns, the review of required shareholder distribution calculations and typically include amounts for professional services by the principal accountant for tax compliance, tax advice and tax planning. Fiscal year 2011 also includes Tax Fees for amortization and accretion testing.
During the fiscal years ended June 30, 2011 and June 30, 2010, there were no Tax Fees billed by the registrant’s principal accountant to the registrant’s investment adviser (not including any sub-adviser whose role is primarily portfolio management and is subcontracted with or overseen by another investment adviser) and any entity controlling, controlled by, or under common control with the adviser that provides ongoing services to the registrant for an engagement that related directly to the operations and financial reporting of the registrant.
(d) All Other Fees. Aggregate All Other Fees billed by the principal accountant to the registrant for professional services rendered during the fiscal years ended June 30, 2011 and June 30, 2010 are approximately as follows:
All Other Fees include amounts for products and services provided by the principal accountant, other than the services reported in paragraphs (a) through (c) above.
Aggregate All Other Fees billed by the registrant’s principal accountant to the registrant’s investment adviser (not including any sub-adviser whose role is primarily portfolio management and is subcontracted with or overseen by another investment adviser) and any entity controlling, controlled by, or under common control with the adviser that provides ongoing services to the registrant for an engagement that related directly to the operations and financial reporting of the registrant during the fiscal years ended June 30, 2011 and June 30, 2010 are approximately as follows:
| | |
| 2011 | | 2010 |
| $495,300 | | $1,424,400 |
In both fiscal years 2011 and 2010, All Other Fees consist of fees billed for internal control examinations of the registrant’s transfer agent and investment advisor. Fiscal year 2010 also includes fees for agreed upon procedures related to the sale of the long-term asset management business and fees related to the review of revenue modeling schedules.
(e)(1) Audit Committee Pre-Approval Policies and Procedures
The registrant’s Audit Committee is required to pre-approve the engagement of the registrant’s independent accountants to provide audit and non-audit services to the registrant and non-audit services to its investment adviser (not including any sub-adviser whose role is primarily portfolio management and is subcontracted with or overseen by another investment adviser) or any entity controlling, controlled by or under common control with such investment adviser that provides ongoing services to the registrant (“Adviser Affiliates”), if the engagement relates directly to the operations and financial reporting of the registrant.
The Audit Committee has adopted a Policy for Engagement of Independent Accountants for Audit and Non-Audit Services (“Policy”). The Policy sets forth the understanding of the Audit Committee regarding the engagement of the registrant’s independent accountants to provide (i) audit and permissible audit-related, tax and other services to the registrant (collectively “Fund Services”); (ii) non-audit services to the registrant’s investment adviser (not including any sub-adviser whose role is primarily portfolio management and is subcontracted with or overseen by another investment adviser) and Adviser Affiliates, if the engagement relates directly to the operations or
financial reporting of a Fund (collectively “Fund-related Adviser Services”); and (iii) certain other audit and non-audit services to the registrant’s investment adviser (not including any sub-adviser whose role is primarily portfolio management and is subcontracted with or overseen by another investment adviser) and Adviser Affiliates. Unless a type of service receives general pre-approval under the Policy, it requires specific pre-approval by the Audit Committee if it is to be provided by the independent accountants. Pre-approval of non-audit services to the registrant, the registrant’s investment adviser (not including any sub-adviser whose role is primarily portfolio management and is subcontracted with or overseen by another investment adviser) and Adviser Affiliates may be waived provided that the “de minimis” requirements set forth under paragraph (c)(7)(i)(C) of Rule 2-01 of Regulation S-X are met.
Under the Policy, the Audit Committee may delegate pre-approval authority to any pre-designated member or members who are Independent Trustees/Directors. The member(s) to whom such authority is delegated must report, for informational purposes only, any pre-approval decisions to the Audit Committee at its next regular meeting. The Audit Committee’s responsibilities with respect to the pre-approval of services performed by the independent accountants may not be delegated to management.
The Policy requires the Fund Treasurer and/or Director of Board Administration to submit to the Audit Committee, on an annual basis, a schedule of the types of services that are subject to general pre-approval. The schedule(s) provide a description of each type of service that is subject to general pre-approval and, where possible, will provide estimated fee caps for each instance of providing each service. The Audit Committees will review and approve the types of services and review the projected fees for the next fiscal year and may add to, or subtract from, the list of general pre-approved services from time to time based on subsequent determinations. That approval acknowledges that the Audit Committee is in agreement with the specific types of services that the independent accountants will be permitted to perform.
The Fund Treasurer and/or Director of Board Administration shall report to the Audit Committee at each of its regular meetings regarding all Fund Services or Fund-related Adviser Services initiated since the last such report was rendered, including a general description of the services, actual billed and projected fees, and the means by which such Fund Services or Fund-related Adviser Services were pre-approved by the Audit Committee.
*****
(e)(2) The percentage of services described in paragraphs (b) through (d) of this Item approved pursuant to the “de minimis” exception under paragraph (c)(7)(i)(C) of Rule 2-01 of Regulation S-X during both fiscal years ended June 30, 2011 and June 30, 2010 was zero.
(f) Not applicable.
(g) The aggregate non-audit fees billed by the registrant’s accountant for services rendered to the registrant, and rendered to the registrant’s investment adviser (not including any sub-adviser whose role is primarily portfolio management and is subcontracted with or overseen by another investment adviser), and any entity controlling, controlled by, or under common control with the adviser that provides ongoing services to the registrant for the fiscal years ended June 30, 2011 and June 30, 2010 are approximately as follows:
| | |
| 2011 | | 2010 |
| $530,400 | | $1,442,000 |
(h) The registrant’s Audit Committee of the Board of Directors has considered whether the provision of non-audit services that were rendered to the registrant’s adviser (not including any sub-adviser whose role is primarily portfolio management and is subcontracted with or overseen by another investment adviser), and any entity controlling, controlled by, or under common control with the investment adviser that provides ongoing services to the registrant that were not pre-approved pursuant to paragraph (c)(7)(ii) of Rule 2-01 of Regulation S-X, is compatible with maintaining the principal accountant’s independence.
| Item 5. | Audit Committee of Listed Registrants. |
Not applicable.
| | (a) | The registrant’s “Schedule I – Investments in securities of unaffiliated issuers” (as set forth in 17 CFR 210.12-12) is included in Item 1 of this Form N-CSR. |
| Item 7. | Disclosure of Proxy Voting Policies and Procedures for Closed-End Management Investment Companies. |
Not applicable.
| Item 8. | Portfolio Managers of Closed-End Management Investment Companies. |
Not applicable.
| Item 9. | Purchases of Equity Securities by Closed-End Management Investment Company and Affiliated Purchasers. |
Not applicable.
| Item 10. | Submission of Matters to a Vote of Security Holders. |
There were no material changes to the procedures by which shareholders may recommend nominees to the registrant’s board of directors.
| Item 11. | Controls and Procedures. |
| | (a) | The registrant’s principal executive officer and principal financial officers, based on their evaluation of the registrant’s disclosure controls and procedures as of a date within 90 days of the filing of this report, have concluded that such controls and procedures are adequately designed to ensure that material information required to be disclosed by the registrant in Form N-CSR is accumulated and communicated to the registrant’s management, including the principal executive officer and principal financial officer, or persons performing similar functions, as appropriate to allow timely decisions regarding required disclosure. |
| | (b) | There was no change in the registrant’s internal control over financial reporting that occurred during the registrant’s second fiscal quarter of the period covered by this report that has materially affected, or is reasonably likely to materially affect, the registrant’s internal control over financial reporting. |
(a)(1) Code of ethics required to be disclosed under Item 2 of Form N-CSR attached hereto as Exhibit 99.CODE ETH.
(a)(2) Certifications pursuant to Rule 30a-2(a) under the Investment Company Act of 1940 (17 CFR 270.30a-2(a)) attached hereto as Exhibit 99.CERT.
(a)(3) Not applicable.
(b) Certification pursuant to Rule 30a-2(b) under the Investment Company Act of 1940 (17 CFR 270.30a-2(b)) attached hereto as Exhibit 99.906CERT.
SIGNATURES
Pursuant to the requirements of the Securities Exchange Act of 1934 and the Investment Company Act of 1940, the registrant has duly caused this report to be signed on its behalf by the undersigned, thereunto duly authorized.
| | |
| (registrant) | | Columbia Funds Series Trust I |
| | |
| |
By (Signature and Title) | | /s/ J. Kevin Connaughton |
| | J. Kevin Connaughton, President |
Pursuant to the requirements of the Securities Exchange Act of 1934 and the Investment Company Act of 1940, this report has been signed below by the following persons on behalf of the registrant and in the capacities and on the dates indicated.
| | |
| By (Signature and Title) | | /s/ J. Kevin Connaughton |
| | J. Kevin Connaughton, President |
| | |
| |
By (Signature and Title) | | /s/ Michael G. Clarke |
| | Michael G. Clarke, Chief Financial Officer |

