UNITED STATES
SECURITIES AND EXCHANGE COMMISSION
Washington, D.C. 20549
FORM N-CSR
CERTIFIED SHAREHOLDER REPORT OF REGISTERED
MANAGEMENT INVESTMENT COMPANIES
Investment Company Act file number | 811-04367 |
|
Columbia Funds Series Trust I |
(Exact name of registrant as specified in charter) |
|
One Financial Center, Boston, Massachusetts | | 02111 |
(Address of principal executive offices) | | (Zip code) |
|
Scott R. Plummer 5228 Ameriprise Financial Center Minneapolis, MN 55474 |
(Name and address of agent for service) |
|
Registrant’s telephone number, including area code: | 1-612-671-1947 | |
|
Date of fiscal year end: | September 30 | |
|
Date of reporting period: | September 30, 2010 | |
| | | | | | | | |
Form N-CSR is to be used by management investment companies to file reports with the Commission not later than 10 days after the transmission to stockholders of any report that is required to be transmitted to stockholders under Rule 30e-1 under the Investment Company Act of 1940 (17 CFR 270.30e-1). The Commission may use the information provided on Form N-CSR in its regulatory, disclosure review, inspection, and policymaking roles.
A registrant is required to disclose the information specified by Form N-CSR, and the Commission will make this information public. A registrant is not required to respond to the collection of information contained in Form N-CSR unless the Form displays a currently valid Office of Management and Budget (“OMB”) control number. Please direct comments concerning the accuracy of the information collection burden estimate and any suggestions for reducing the burden to Secretary, Securities and Exchange Commission, 450 Fifth Street, NW, Washington, DC 20549-0609. The OMB has reviewed this collection of information under the clearance requirements of 44 U.S.C. § 3507.
Item 1. Reports to Stockholders.

Stock Funds
Annual Report for the Period Ended September 30, 2010
> Columbia Asset Allocation Fund
> Columbia Large Cap Growth Fund
> Columbia Disciplined Value Fund
> Columbia Contrarian Core Fund
> Columbia Small Cap Core Fund
Not FDIC insured • No bank guarantee • May lose value
Table of Contents
| Economic Update | | | 1 | | |
|
| Columbia Asset Allocation Fund | | | 3 | | |
|
| Columbia Large Cap Growth Fund | | | 8 | | |
|
| Columbia Disciplined Value Fund | | | 13 | | |
|
| Columbia Contrarian Core Fund | | | 18 | | |
|
| Columbia Small Cap Core Fund | | | 23 | | |
|
| Investment Portfolios | | | 28 | | |
|
| Financial Statements | | | 67 | | |
|
Report of Independent
Registered Public Accounting
Firm | | | 135 | | |
|
| Federal Income Tax Information | | | 136 | | |
|
| Fund Governance | | | 137 | | |
|
Board Consideration and
Approval of Advisory Agreements | | | 142 | | |
|
Summary of Management Fee
Evaluation by Independent Fee
Consultant | | | 147 | | |
|
Important Information About
This Report | | | 153 | | |
|
The views expressed in this report reflect the current views of the respective parties. These views are not guarantees of future performance and involve certain risks, uncertainties and assumptions that are difficult to predict, so actual outcomes and results may differ significantly from the views expressed. These views are subject to change at any time based upon economic, market or other conditions and the respective parties disclaim any responsibility to update such views. These views may not be relied on as investment advice and, because investment decisions for a Columbia Fund are based on numerous factors, may not be relied on as an indication of trading intent on behalf of any particular Columbia Fund. References to specific securities should not be construed as a recommendation or investment advice.
President's Message

Dear Shareholder:
The Columbia Management story began over 100 years ago, and today, we are one of the nation's largest dedicated asset managers. The recent acquisition by Ameriprise Financial, Inc. brings together the talents, resources and capabilities of Columbia Management with those of RiverSource Investments, Threadneedle (acquired by Ameriprise in 2003) and Seligman Investments (acquired by Ameriprise in 2008) to build a best-in-class asset management business that we believe is truly greater than its parts.
RiverSource Investments traces its roots to 1894 when its then newly-founded predecessor, Investors Syndicate, offered a face-amount savings certificate that gave small investors the opportunity to build a safe and secure fund for retirement, education or other special needs. A mutual fund pioneer, Investors Syndicate launched Investors Mutual Fund in 1940. In the decades that followed, its mutual fund products and services lineup grew to include a full spectrum of styles and specialties. More than 110 years later, RiverSource continues to be a trusted financial products leader.
Threadneedle, a leader in global asset management and one of Europe's largest asset managers, offers sophisticated international experience from a dedicated U.K. management team. Headquartered in London, it is named for Threadneedle Street in the heart of the city's financial district, where British investors pioneered international and global investing. Threadneedle was acquired in 2003 and today operates as an affiliate of Columbia Management.
Seligman Investments' beginnings date back to the establishment of the investment firm J. & W. Seligman & Co. in 1864. In the years that followed, Seligman played a major role in the geographical expansion and industrial development of the United States. In 1874, President Ulysses S. Grant named Seligman as fiscal agent for the U.S. Navy—an appointment that would last through World War I. Seligman helped finance the westward path of the railroads and the building of the Panama Canal. The firm organized its first investment company in 1929 and began managing its first mutual fund in 1930. In 2008, J. & W. Seligman & Co. Incorporated was acquired and Seligman Investments became an offering brand of RiverSource Investments, LLC.
We are proud of the rich and distinctive history of these firms, the strength and breadth of products and services they offer, and the combined cultures of pioneering spirit and forward thinking. Together we are committed to providing more for our shareholders than ever before.
> A singular focus on our shareholders
Our business is asset management, so investors are our first priority. We dedicate our resources to identifying timely investment opportunities and provide a comprehensive choice of equity, fixed-income and alternative investments to help meet your individual needs.
> First-class research and thought leadership
We are dedicated to helping you take advantage of today's opportunities and anticipate tomorrow's. We stay abreast of the latest investment trends and ideas, using our collective insight to evaluate events and transform them into solutions you can use.
> A disciplined investment approach
We aren't distracted by passing fads. Our teams adhere to a rigorous investment process that helps ensure the integrity of our products and enables you and your financial advisor to match our solutions to your objectives with confidence.
When you choose Columbia Management, you can be confident that we will take the time to understand your needs and help you and your financial advisor identify the solutions that are right for you. Because at Columbia Management, we don't consider ourselves successful unless you are.
Sincerely,

J. Kevin Connaughton
President, Columbia Funds
Investors should consider the investment objectives, risks, charges and expenses of a mutual fund carefully before investing. For a free prospectus, which contains this and other important information about the funds, visit www.columbiamanagement.com. The prospectus should be read carefully before investing.
Columbia Funds are distributed by Columbia Management Investment Distributors, Inc., member FINRA, and managed by Columbia Management Investment Advisers, LLC.
© 2010 Columbia Management Investment Advisers, LLC. All rights reserved.
Economic Update – Stock Funds
Although it has been more than a year since U.S. economic growth turned positive, the economy continues to send mixed signals about the sustainability of this recovery. Economic growth, as measured by gross domestic product, was a solid 5.0% in the last quarter of 2009. However, it was 3.7% in the first quarter of 2010 and only 1.7% in the second quarter. Expectations are for continued lackluster growth through the end of the year, as government incentive programs have ended and stimulus spending winds down. Even so, it appears to be unlikely that the U.S. economy will sink back into recession, as many key indicators remain positive.
Consumer spending on cars, clothing and other goods increased throughout the year although the pace of increased spending was small. Personal income also moved higher. Consumer confidence, as measured by the Conference Board Consumer Confidence Index, gained ground in the first half of 2010. However, the index fell sharply during the summer. Consumers surveyed in the final months of the reporting period indicated they were concerned about business conditions and job prospects and generally apprehensive about the future.
The housing market—another bellwether for the consumer sector—showed a glimmer of improvement in the final months of the period. Although both new and existing home sales fell during the summer after a federal tax credit for new and repeat homebuyers expired, sales of existing homes picked up in August. Sales of new homes were flat in August 2010 and the inventory of new homes for sale fell to a 42-year low. Pending home sales, a forward-looking indicator, rose in both July 2010 and August 2010. The latest data points to rising sales in the months ahead. Distressed properties continued to pressure prices. The national median price of existing homes rose slightly over the one-year period, while the national median price of new homes declined slightly. The inventory of unsold new homes declined sharply at the end of the period.
News on the job front was mostly positive for the period, but the number of new jobs added to the economy fell short of expectations. A good portion of the jobs added in March, April and May were temporary, government-sponsored census positions, which began to unwind in June, July and August. Private sector job growth was disappointing given the stage of economic recovery. Nevertheless, private sector payroll employment trended modestly higher through the end of the period, and news of massive layoffs declined.
Reports from the business side of the economy were generally positive. A key measure of the nation's manufacturing situation—the Institute for Supply Management's Index—trended higher for 14 consecutive months before dipping downward in September. Industrial production moved higher, as did the amount of manufacturing capacity utilized—a key measure of the health of the manufacturing sector.
Stock rally regains its footing
Against a strengthening economic backdrop, a stock market rally that began early in 2009 continued into the spring of 2010. But during the early summer months, a debt crisis brewing in Europe raised concerns among U.S. investors, as did mixed signals on
Summary
For the 12-month period that ended September 30, 2010
g The U.S. stock market, as measured by the S&P 500 Index, delivered solid returns, despite a summer correction. Emerging market stocks, as measured by the MSCI Emerging Markets Index (Net), outperformed U.S. stocks as well as stock markets in developed foreign markets, as measured by the MSCI EAFE Index.
S&P Index | | MSCI Emerging
Markets Index | |
|
 | |  | |
|
g Modest economic growth and relatively low interest rates boosted bond market returns. The Barclays Capital Aggregate Bond Index delivered solid results. High-yield bonds outperformed stocks, as measured by the JPMorgan Developed BB High Yield Index.
Barclays
Aggregate Index | | JPMorgan
Index | |
|
 | |  | |
|
1
Economic Update (continued) – Stock Funds
the economy, and some of the stock market's earlier gains vanished. Then, in September, investors reversed course and bid stocks sharply higher. The S&P 500 Index1 returned 10.16% for the 12-month period. Outside the United States, stock market returns were mixed. The MSCI EAFE Index (Net),2 a broad gauge of stock market performance in foreign developed markets, returned 3.27% (in U.S. dollars) for the period, as concerns about the impact of a bailout for weak eurozone economies weighed on the markets. Emerging stock markets were more resilient. The MSCI Emerging Markets Index (Net)3 returned 20.22% (in U.S. dollars) for the 12-month period.
Bonds delivered solid returns
As the economy strengthened, bonds also delivered solid returns. The Barclays Capital Aggregate Bond Index4 returned 8.16%. The high-yield bond market outpaced stocks by a sizeable margin during the period. For the 12 months covered by this report, the JPMorgan Developed BB High Yield Index5 returned 16.19%. The Treasury market was also positive. As the yield on the 10-year U.S. Treasury, a common bellwether for the bond market, fell over the 12-month period (Bond prices and yields move in opposite directions), the Barclays Capital U.S. Treasury Index6 returned 7.32%. Despite positive economic activity, the Federal Reserve Board kept a key short-term interest rate—the federal funds rate—close to zero.
Past performance is no guarantee of future results.
1The Standard & Poor's (S&P) 500 Index tracks the performance of 500 widely held, large-capitalization U.S. stocks.
2The Morgan Stanley Capital International Europe, Australasia, Far East (MSCI EAFE) Index (Net) is a free float-adjusted market capitalization Index that is designed to measure equity market performance of developed markets, excluding the U.S. & Canada. As of May 27, 2010, the MSCI EAFE Index (Net) consisted of the following 22 developed market country indices: Australia, Austria, Belgium, Denmark, Finland, France, Germany, Greece, Hong Kong, Ireland, Israel, Italy, Japan, the Netherlands, New Zealand, Norway, Portugal, Singapore, Spain, Sweden, Switzerland and the United Kingdom.
3The Morgan Stanley Capital International Emerging Markets (MSCI EM) Index (Net) is a free float-adjusted market capitalization index that is designed to measure equity market performance of emerging markets. As of May 27, 2010, the MSCI Emerging Markets Index (Net) consisted of the following 21 emerging market country indices: Brazil, Chile, China, Colombia, Czech Republic, Egypt, Hungary, India, Indonesia, Korea, Malaysia, Mexico, Morocco, Peru, Philippines, Poland, Russia, South Africa, Taiwan, Thailand, and Turkey.
4The Barclays Capital Aggregate Bond Index is a market value-weighted index that tracks the daily price, coupon, pay-downs and total return performance of fixed-rate, publicly placed, dollar-denominated and non-convertible investment grade debt issues with at least $250 million par amount outstanding and with at least one year to final maturity.
5The JPMorgan Developed BB High Yield Index is an unmanaged index designed to mirror the investable universe of the U.S. dollar developed, BB-rated, high yield corporate debt market.
6The Barclays Capital U.S. Treasury Index includes public obligations of the U.S. Treasury. Treasury bills are excluded by the maturity constraint. In addition, certain special issues, such as state and local government series bonds (SLGs), as well as U.S. Treasury TIPS, are excluded. STRIPS are excluded from the index because their inclusion would result in double-counting.
Indices are not available for investment, are not professionally managed and do not reflect sales charges, fees, brokerage commissions, taxes or other expenses of investing. Securities in the fund may not match those in an index.
2
Fund Profile – Columbia Asset Allocation Fund
Summary
g For the 12-month period that ended September 30, 2010, the fund's Class A shares returned 8.36% without sales charge.
g The fund's return trailed the 9.26% average return of the funds in its peer group, the Lipper Mixed-Asset Target Allocation Moderate Funds Classification.1
g A slight underweight in equities overall, coupled with disappointing results from overseas and large-cap value stocks as well as commodity-related investments, hampered relative results.
Portfolio Management
Anwiti Bahuguna, PhD has co-managed the fund since 2009 and has been associated with the advisor since May 2010. Prior to joining the advisor, Ms. Bahuguna was associated with the fund's previous advisor or its predecessors since 2002.
Kent M. Bergene has co-managed the fund since May 2010 and has been associated with the advisor or its predecessors since 1981.
David M. Joy has co-managed the fund since May 2010 and has been associated with the advisor or its predecessors since 2003.
Colin Moore has co-managed the fund since February 2008 and has been associated with the advisor since May 2010. Prior to joining the advisor, Mr. Moore was associated with the fund's previous advisor or its predecessors since 2002.
Kent M. Peterson, PhD has co-managed the fund since 2009 and has been associated with the advisor since May 2010. Prior to joining the advisor, Mr. Peterson was associated with the fund's previous advisor or its predecessors since 2006.
Marie M. Schofield, CFA has co-managed the fund since February 2009 and has been associated with the advisor since May 2010. Prior to joining the advisor, Ms. Schofield was associated with the fund's previous advisor or its predecessors since 1990.
Effective as of May 1, 2010 Kent M. Bergene and David M. Joy became co-managers of the fund.
Effective May 1, 2010, RiverSource Investments, LLC, a subsidiary of Ameriprise Financial, Inc., became the investment advisor to the fund and changed its name to Columbia Management Investment Advisers, LLC. Please see the fund's prospectuses, as supplemented, for more information regarding the change in investment advisor and certain other changes.
1Lipper Inc., a widely respected data provider in the industry, calculates an average total return (assuming reinvestment of distributions) for mutual funds with investment objectives similar to those of the fund. Lipper makes no adjustment for the effect of sales loads.
2The Standard & Poor's (S&P) 500 Index tracks the performance of 500 widely held, large capitalization U.S. stocks.
3The Barclays Capital Aggregate Bond Index is a market value-weighted index that tracks the daily price, coupon, pay-downs, and total return performance of fixed-rate, publicly placed, dollar-denominated, and non-convertible investment grade debt issues with at least $250 million par amount outstanding and with at least one year to final maturity.
Indices are not available for investment, are not professionally managed and do not reflect sales charges, fees, brokerage commissions, taxes or other expenses of investing. Securities in the fund may not match those in an index.
Performance data quoted represents past performance and current performance may be lower or higher. Past performance is no guarantee of future results. The investment return and principal value will fluctuate so that shares, when redeemed, may be worth more or less than the original cost. Please visit www.columbiamanagement.com for daily and most recent month-end performance updates.
Summary
1-year return as of 09/30/10
| | +8.36% | |
|
 | | Class A shares
(without sales charge) | |
|
| | +10.16% | |
|
 | | S&P 500 Index2 | |
|
| | +8.16% | |
|
 | | Barclays Capital Aggregate
Bond Index3 | |
|
3
Performance Information – Columbia Asset Allocation Fund
Performance data quoted represents past performance and current performance may be lower or higher. Past performance is no guarantee of future results. The investment return and principal value will fluctuate so that shares, when redeemed, may be worth more or less than the original cost. Please visit www.columbiamanagement.com for daily and most recent month-end performance updates.
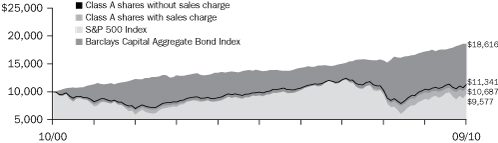
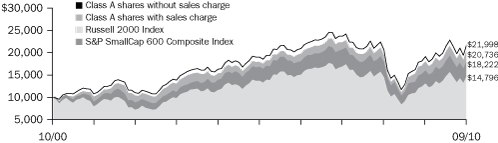
Performance of a $10,000 investment 10/01/00 – 09/30/10
The chart above shows the change in value of a hypothetical $10,000 investment in Class A shares of Columbia Asset Allocation Fund during the stated time period, and does not reflect the deduction of taxes that a shareholder may pay on fund distributions or on the redemption of fund shares.
Performance of a $10,000 investment 10/01/00 – 09/30/10 ($)
| Sales charge | | without | | with | |
| Class A | | | 11,341 | | | | 10,687 | | |
| Class B | | | 10,538 | | | | 10,538 | | |
| Class C | | | 10,538 | | | | 10,538 | | |
| Class T | | | 11,299 | | | | 10,647 | | |
| Class Z | | | 11,677 | | | | n/a | | |
Average annual total return as of 09/30/10 (%)
| Share class | | A | | B | | C | | T | | Z | |
| Inception | | 11/01/98 | | 11/01/98 | | 11/18/02 | | 12/30/91 | | 12/30/91 | |
| Sales charge | | without | | with | | without | | with | | without | | with | | without | | with | | without | |
| 1-year | | | 8.36 | | | | 2.12 | | | | 7.56 | | | | 2.56 | | | | 7.56 | | | | 6.56 | | | | 8.39 | | | | 2.15 | | | | 8.67 | | |
| 5-year | | | 2.71 | | | | 1.50 | | | | 1.93 | | | | 1.62 | | | | 1.93 | | | | 1.93 | | | | 2.65 | | | | 1.44 | | | | 3.04 | | |
| 10-year | | | 1.27 | | | | 0.67 | | | | 0.53 | | | | 0.53 | | | | 0.53 | | | | 0.53 | | | | 1.23 | | | | 0.63 | | | | 1.56 | | |
The "with sales charge" returns include the maximum initial sales charge of 5.75% for Class A shares and Class T shares and the applicable contingent deferred sales charge of 5.00% in the first year, declining to 1.00% in the sixth year, and eliminated thereafter for Class B shares and 1.00% for Class C shares for the first year only. The "without sales charge" returns do not include the effect of sales charges. If they had, returns would have been lower.
Performance results reflect any fee waivers or expense reimbursements of fund expenses by the investment advisor and/or any of its affiliates. Absent these fee waivers or expense reimbursement arrangements, performance results would have been lower.
All results shown assume reinvestment of distributions. Class Z shares are sold at net asset value with no distribution and service (Rule 12b-1) fees. Class Z shares have limited eligibility and the investment minimum requirements may vary. Please see the fund's prospectus for details. Performance for different share classes will vary based on differences in sales charges and fees associated with each class.
The tables do not reflect the deduction of taxes that a shareholder may pay on fund distributions or on the redemption of fund shares.
Class A, Class B, Class C, Class T and Class Z share performance information includes returns of Prime A shares (for Class A shares), Prime B shares (for Class B and Class C shares), Retail A shares (for Class T shares) and Trust shares (for Class Z shares) of Galaxy Asset Allocation Fund, the predecessor to the Fund and a series of the Galaxy Fund (the "Predecessor Fund"), for periods prior to November 18, 2002, the date on which Class A, Class B, Class C, Class T and Class Z shares were initially offered by the Fund. These returns shown for all share classes reflect any differences in sales charges, but have not been restated to reflect any differences in expenses between the Predecessor Fund share classes and the corresponding newer share classes.
4
Understanding Your Expenses – Columbia Asset Allocation Fund
As a fund shareholder, you incur two types of costs. There are transaction costs, which generally include sales charges on purchases and may include redemption fees or exchange fees. There are also ongoing costs, which generally include investment advisory fees, distribution and service (Rule 12b-1) fees and other fund expenses. The information on this page is intended to help you understand the ongoing costs of investing in the fund and to compare these costs with the ongoing costs of investing in other mutual funds.
Analyzing your fund's expenses by share class
To illustrate these ongoing costs, we have provided an example and calculated the expenses paid by investors in each share class during the period. The information in the following table is based on an initial investment of $1,000, which is invested at the beginning of the period and held for the entire period. Expense information is calculated two ways and each method provides you with different information. The amount listed in the "Actual" column is calculated using the fund's actual operating expenses and total return for the period. The amount listed in the "Hypothetical" column for each share class assumes that the return each year is 5% before expenses and is calculated based on the fund's actual operating expenses. You should not use the hypothetical account values and expenses to estimate either your actual account balance at the end of the period or the expenses you paid during this period.
Compare with other funds
Since all mutual funds are required to include the same hypothetical calculations about expenses in shareholder reports, you can use this information to compare the ongoing cost of investing in the fund with other funds. To do so, compare the 5% hypothetical example with the 5% hypothetical examples that appear in the shareholder reports of other funds. As you compare hypothetical examples of other funds, it is important to note that hypothetical examples are meant to highlight the ongoing costs of investing in a fund and do not reflect any transaction costs, such as sales charges, redemption fees or exchange fees.
Estimating your actual expenses
To estimate the expenses that you paid over the period, first you will need your account balance at the end of the period:
g For shareholders who receive their account statements from Columbia Management Investment Services Corp., your account balance is available online at www.columbiamanagement.com or by calling Shareholder Services at 800.345.6611.
g For shareholders who receive their account statements from their financial intermediary, contact your financial intermediary to obtain your account balance.
1. Divide your ending account balance by $1,000. For example, if an account balance was $8,600 at the end of the period, the result would be 8.6.
2. In the section of the table below titled "Expenses paid during the period," locate the amount for your share class. You will find this number in the column labeled "Actual." Multiply this number by the result from step 1. Your answer is an estimate of the expenses you paid on your account during the period.
If the value of your account falls below the minimum initial investment requirement applicable to you, your account may be subject to a $20 annual fee. This fee is not included in the accompanying table. If you are subject to the fee, keep it in mind when you are estimating the ongoing expenses of investing in the fund and when comparing the expenses of this fund with other funds.
04/01/10 – 09/30/10
| | | Account value at the
beginning of the period ($) | | Account value at the
end of the period ($) | | Expenses paid
during the period ($) | | Fund's annualized
expense ratio (%) | |
| | | Actual | | Hypothetical | | Actual | | Hypothetical | | Actual | | Hypothetical | | Actual | |
| Class A | | | 1,000.00 | | | | 1,000.00 | | | | 1,016.00 | | | | 1,019.05 | | | | 6.06 | | | | 6.07 | | | | 1.20 | | |
| Class B | | | 1,000.00 | | | | 1,000.00 | | | | 1,012.90 | | | | 1,015.29 | | | | 9.84 | | | | 9.85 | | | | 1.95 | | |
| Class C | | | 1,000.00 | | | | 1,000.00 | | | | 1,012.20 | | | | 1,015.29 | | | | 9.84 | | | | 9.85 | | | | 1.95 | | |
| Class T | | | 1,000.00 | | | | 1,000.00 | | | | 1,016.50 | | | | 1,018.80 | | | | 6.32 | | | | 6.33 | | | | 1.25 | | |
| Class Z | | | 1,000.00 | | | | 1,000.00 | | | | 1,017.90 | | | | 1,020.31 | | | | 4.81 | | | | 4.81 | | | | 0.95 | | |
Expenses paid during the period are equal to the annualized expense ratio for the share class, multiplied by the average account value over the period, then multiplied by the number of days in the fund's most recent fiscal half-year and divided by 365.
Had the investment advisor and/or any of its affiliates not waived fees or reimbursed a portion of expenses, account value at the end of the period would have been reduced.
It is important to note that the expense amounts shown in the table are meant to highlight only ongoing costs of investing in the fund and do not reflect any transaction costs, such as sales charges, redemption fees or exchange fees. Therefore, the hypothetical examples provided may not help you determine the relative total costs of owning shares of different funds. If these transaction costs were included, your costs would have been higher.
5
Portfolio Manager's Report – Columbia Asset Allocation Fund
Performance data quoted represents past performance and current performance may be lower or higher. Past performance is no guarantee of future results. The investment return and principal value will fluctuate so that shares, when redeemed, may be worth more or less than the original cost. Please visit www.columbiamanagement.com for daily and most recent month-end performance updates.
Net asset value per share
as of 09/30/10 ($)
| Class A | | | 13.39 | | |
| Class B | | | 13.38 | | |
| Class C | | | 13.38 | | |
| Class T | | | 13.40 | | |
| Class Z | | | 13.45 | | |
Distributions declared per share
10/01/09 – 09/30/10 ($)
| Class A | | | 0.27 | | |
| Class B | | | 0.17 | | |
| Class C | | | 0.17 | | |
| Class T | | | 0.26 | | |
| Class Z | | | 0.30 | | |
Top 5 equity sectors
as of 09/30/10 (%)
| Financials | | | 9.3 | | |
| Information Technology | | | 9.0 | | |
| Energy | | | 7.1 | | |
| Industrials | | | 7.0 | | |
| Consumer Discretionary | | | 6.5 | | |
The Fund is actively managed and the composition of its portfolio will change over time. Information provided is calculated as a percentage of net assets.
For the 12-month period that ended September 30, 2010, the fund's Class A shares returned 8.36% without sales charge. The average return of the fund's peer group, the Lipper Mixed-Asset Target Allocation Moderate Funds Classification, was 9.26%. The fund came out behind its equity benchmark, the S&P 500 Index, which returned 10.16%, but outperformed its fixed-income benchmark, the Barclays Capital Aggregate Bond Index, which returned 8.16%. At period end, approximately 56% of the fund's assets were invested in equities, 41% in bonds and cash and 3% in energy/natural resources securities. Allocations to, and investments in, weaker-performing equity sectors, including large-cap value stocks, overseas developed markets and energy/natural resources, hampered results.
Volatility—and a renewed market rally—in second half
Stocks rallied during the first six months of the reporting period, as businesses started spending to restock depleted inventories and government stimulus measures transferred money to unemployed workers. Starting in April, however, the stock market became much more volatile, as investors worried about the impact of the European sovereign debt crisis, the prospect of U.S. government stimulus programs coming to an end and the fragile state of the economic recovery. Stocks then rebounded sharply in September, buoyed by indications from the Federal Reserve that it would intervene to help the economy and by prospects of a shift in Congressional leadership in November elections. Bond markets benefited as interest rates stayed low, Treasury yields fell and risk-averse investors shifted into fixed-income assets. Returns on high-yield bonds were particularly strong, benefiting from investor enthusiasm for yield and a low projected defau lt rate.
Gains from mid-cap growth and fixed-income stocks
Among the fund's strongest performers were the fund's mid-cap growth stocks, which nicely outpaced the 18.27% gain of the Russell Mid Cap Growth Index, and the fund's small-cap value stocks, which edged out the 11.84% return of the Russell 2000 Value Index. However, both allocations were relatively modest. The investment-grade portfolio, approximately 34% of assets, also did quite well, outdistancing its benchmark, the Barclays Capital Aggregate Bond Index. A 4% stake in high-yield bonds and even smaller position in Treasury Inflation Protected securities (TIPs) further aided results, as both sectors outpaced the Barclays Index.
Disappointing results from large-cap and overseas portfolios
The fund's stake in large-cap value stocks, about 18% of net assets, hindered performance because the sector, as measured by the Russell 1000 Value index, lagged the S&P 500 Index. In addition, returns from the fund's large-cap value holdings lagged that of the Russell benchmark. Developed overseas markets were an additional detractor from results. We trimmed the fund's already modest stake in this sector because of concerns related to the European sovereign debt crisis. This move proved helpful, as many global markets came out behind the U.S market. The fund's overseas
6
Portfolio Manager's Report (continued) – Columbia Asset Allocation Fund
holdings, however, lagged their benchmark, the MSCI EAFE Index (Net), which gained only 3.27%. A small allocation to the energy and natural resources sector further hampered performance, as the S&P Goldman Sachs Commodity Index trailed the broader market by a sizable margin. Underperformance from investments in this sector further detracted from relative results.
Positioned for slow economic growth
By period end, economic data was confirming a loss of momentum in growth. However, we do not think we'll see the double-dip recession that many market observers have feared. Going forward, we plan to continue to favor equities, most likely increasing exposure to domestic stocks and lowering exposure to international developed markets. On the domestic side, we think higher-quality stocks that pay dividends offer particularly attractive opportunities. Within the fixed-income market, we believe much of the returns will come from income rather than price appreciation. In keeping with our outlook, we increased the fund's stakes in both investment-grade bonds and large-cap stocks.
Portfolio characteristics and holdings are subject to change periodically and may not be representative of current characteristics and holdings. The outlook for the fund may differ from those presented for other Columbia Funds.
Equity securities are subject to stock market fluctuations that occur in response to economic and business developments.
Investments in high-yield bonds (commonly known as "junk" bonds) offer the potential for high current income and attractive total return, but involve certain risks. Changes in economic conditions or other circumstances may adversely affect a junk bond issuer's ability to make principal and interest payments. Rising interest rates tend to lower the value of all bonds. High-yield bonds issued by foreign entities have greater potential risks, including less regulation, currency fluctuations, economic instability and political developments.
The fund may be subject to the same types of risks associated with direct ownership of real estate including the decline of property value due to general, local and regional economic conditions.
International investing involves special risks, including foreign taxation, currency risks, risks associated with possible differences in financial standards and other risks associated with future political and economic developments.
Top 10 equity holdings
as of 09/30/10 (%)
| Chevron Corp. | | | 1.1 | | |
| Apple, Inc. | | | 0.9 | | |
| Occidental Petroleum Corp. | | | 0.7 | | |
| JPMorgan Chase & Co. | | | 0.6 | | |
| Google, Inc., Class A | | | 0.6 | | |
| Target Corp. | | | 0.6 | | |
International Business
Machines Corp. | | | 0.6 | | |
Philip Morris
International, Inc. | | | 0.6 | | |
| Halliburton Co. | | | 0.6 | | |
| Wells Fargo & Co. | | | 0.5 | | |
Portfolio structure
as of 09/30/10 (%)
| Common Stocks | | | 55.7 | | |
Corporate Fixed-Income
Bonds & Notes | | | 14.1 | | |
| Mortgage-Backed Securities | | | 9.9 | | |
Government & Agency
Obligations | | | 8.0 | | |
Commercial Mortgage-Backed
Securities | | | 5.1 | | |
Collateralized Mortgage
Obligations | | | 1.4 | | |
| Asset-Backed Securities | | | 0.7 | | |
| Convertible Preferred Stocks | | | 0.4 | | |
| Convertible Bonds | | | 0.1 | | |
| Preferred Stock | | | 0.1 | | |
| Purchased Call Options | | | 0.0 | * | |
| Investment Company | | | 0.1 | | |
| Short-Term Obligation | | | 3.9 | | |
Other Assets &
Liabilities, Net | | | 0.5 | | |
*Rounds to less than 0.01%.
The Fund is actively managed and the composition of its portfolio will change over time. Information provided is calculated as a percentage of net assets.
7
Fund Profile – Columbia Large Cap Growth Fund
Performance data quoted represents past performance and current performance may be lower or higher. Past performance is no guarantee of future results. The investment return and principal value will fluctuate so that shares, when redeemed, may be worth more or less than the original cost. Please visit www.columbiamanagement.com for daily and most recent month-end performance updates.
Summary
1-year return as of 09/30/10
| | | +10.48% | |
|
| |  | | | Class A shares
(without sales charge) | |
|
| | | +12.65% | |
|
| |  | | | Russell 1000 Growth Index | |
|
Morningstar Style BoxTM

The Morningstar Style Box(TM) is based on the Fund's portfolio holdings. For equity funds, the vertical axis shows the market capitalization of the stocks owned, and the horizontal axis shows investment style (value, blend or growth). Information shown is based on the most recent data provided by Morningstar.
© 2010 Morningstar, Inc. All rights reserved. The information contained herein is proprietary to Morningstar and/or its content providers, may not be copied or distributed and is not warranted to be accurate, complete, or timely. Neither Morningstar nor its content providers are responsible for any damages or losses arising from any use of this information. Past performance is no guarantee of future results.
Summary
g For the 12-month period that ended September 30, 2010, the fund's Class A shares returned 10.48% without sales charge.
g The fund trailed its benchmark, the Russell 1000 Growth Index1, but came out slightly ahead of the average return of the funds in its peer group, the Lipper Large-Cap Growth Funds Classification.2
g Disappointing stock selection in the financials and materials sectors resulted in underperformance relative to the benchmark.
Portfolio Management
John T. Wilson, CFA, lead manager, has co-managed the fund since August 2005 and has been associated with the advisor since May 2010. Prior to joining the advisor, Mr. Wilson was associated with the fund's previous advisor or its predecessors since 2005.
Peter R. Deininger, CFA, CAIA, has co-managed the fund since May 2010 and has been associated with the advisor since May 2010. Prior to joining the advisor, Mr. Deininger was associated with the fund's previous advisor or its predecessors since 2002.
Effective May 1, 2010, RiverSource Investments, LLC, a subsidiary of Ameriprise Financial, Inc., became the investment advisor to the fund and changed its name to Columbia Management Investment Advisers, LLC. Please see the fund's prospectuses, as supplemented, for more information regarding the change in investment advisor and certain other changes.
1The Russell 1000 Growth Index measures the performance of those Russell 1000 Index companies with higher price-to-book ratios and higher forecasted growth values.
2Lipper, Inc. a widely respected data provider in the industry, calculates an average total return (assuming reinvestment of distributions) for mutual funds with investment objectives similar to those of the fund. Lipper makes no adjustment for the effect of sales loads.
Indices are not available for investment, are not professionally managed and do not reflect sales charges, fees, brokerage commissions, taxes or other expenses of investing. Securities in the fund may not match those in an index.
8
Performance Information – Columbia Large Cap Growth Fund
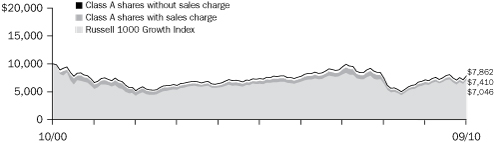
Performance of a $10,000 investment 10/01/00 – 09/30/10
The chart above shows the change in value of a hypothetical $10,000 investment in Class A shares of Columbia Large Cap Growth Fund during the stated time period, and does not reflect the deduction of taxes that a shareholder may pay on fund distributions or on the redemption of fund shares.
Performance of a $10,000 investment 10/01/00 – 09/30/10 ($)
| Sales charge | | without | | with | |
| Class A | | | 7,862 | | | | 7,410 | | |
| Class B | | | 7,273 | | | | 7,273 | | |
| Class C | | | 7,273 | | | | 7,273 | | |
| Class E | | | 7,830 | | | | 7,478 | | |
| Class F | | | 7,270 | | | | 7,270 | | |
| Class I | | | n/a | | | | n/a | | |
| Class R | | | n/a | | | | n/a | | |
| Class T | | | 7,779 | | | | 7,330 | | |
| Class W | | | n/a | | | | n/a | | |
| Class Y | | | 8,068 | | | | n/a | | |
| Class Z | | | 8,048 | | | | n/a | | |
Performance data quoted represents past performance and current performance may be lower or higher. Past performance is no guarantee of future results. The investment return and principal value will fluctuate so that shares, when redeemed, may be worth more or less than the original cost. Please visit www.columbiamanagement.com for daily and most recent month-end performance updates.
Average annual total return as of 09/30/10 (%)
| Share class | | A | | B | | C | | E | | F | |
| Inception | | 11/01/98 | | 11/01/98 | | 11/18/02 | | 09/22/06 | | 09/22/06 | |
| Sales charge | | without | | with | | without | | with | | without | | with | | without | | with | | without | | with | |
| 1-year | | | 10.48 | | | | 4.11 | | | | 9.65 | | | | 4.65 | | | | 9.65 | | | | 8.65 | | | | 10.41 | | | | 5.46 | | | | 9.66 | | | | 4.66 | | |
| 5-year | | | 1.41 | | | | 0.21 | | | | 0.65 | | | | 0.28 | | | | 0.63 | | | | 0.63 | | | | 1.33 | | | | 0.40 | | | | 0.64 | | | | 0.27 | | |
| 10-year/Life | | | –2.38 | | | | –2.95 | | | | –3.13 | | | | –3.13 | | | | –3.13 | | | | –3.13 | | | | –2.42 | | | | –2.86 | | | | –3.14 | | | | –3.14 | | |
Average annual total return as of 09/30/10 (%)
| Share class | | I | | R | | T | | W | | Y | | Z | |
| Inception | | 09/27/10 | | 09/27/10 | | 12/14/90 | | 09/27/10 | | 07/15/09 | | 12/14/90 | |
| Sales charge | | without | | without | | without | | with | | without | | without | | without | |
| 1-year | | n/a | | n/a | | | 10.40 | | | | 4.04 | | | n/a | | | 11.01 | | | | 10.74 | | |
| 5-year | | n/a | | n/a | | | 1.35 | | | | 0.16 | | | n/a | | | 1.71 | | | | 1.66 | | |
| 10-year/Life | | | –0.19 | | | | –0.19 | | | | –2.48 | | | | –3.06 | | | | –0.19 | | | | –2.12 | | | | –2.15 | | |
The "with sales charge" returns include the maximum initial sales charge of 5.75% for Class A and Class T shares, 4.50% for Class E shares, the applicable contingent deferred sales charge of 5.00% in the first year, declining to 1.00% in the sixth year and eliminated thereafter for Class B and Class F shares and 1.00% for Class C shares for the first year only. The "without sales charge" returns do not include the effect of sales charges.
Performance results reflect any fee waivers or reimbursements of fund expenses by the investment advisor and/or any of its affiliates. Absent these fee waivers or expense reimbursement arrangements, performance results would have been lower.
All results shown assume reinvestment of distributions. Class I, Class Y and Class Z shares are sold at net asset value with no distribution and service (Rule 12b-1) fees. Class R and Class W shares are sold at net asset value with a distribution (12b-1) fee. Class R, Class I, Class W, Class Y and Class Z shares have limited eligibility and the investment minimum requirements may vary. Please see the fund's prospectuses for details. Performance for different share classes will vary based on differences in sales charges and fees associated with each class.
The tables do not reflect the deduction of taxes that a shareholder may pay on fund distributions or on the redemption of fund shares.
Class A, Class B, Class C, Class T and Class Z share performance information includes returns of Prime A shares (for Class A shares), Prime B shares (for Class B and Class C shares), Retail A shares (for Class T shares) and Trust shares (for Class Z shares) of Galaxy Equity Growth Fund, the predecessor to the Fund and a series of the Galaxy Fund (the "Predecessor Fund"), for periods prior to November 18, 2002, the date on which Class A, Class B, Class C, Class T and Class Z shares were initially offered by the Fund. Class E and Class F share performance information includes returns of Class A shares (for Class E shares) and Class B shares (for Class F shares) for the period from November 18, 2002 through September 21, 2006, and the returns of Prime A shares (for Class E shares) and Prime B shares (for Class F shares) for periods prior thereto. These returns shown for all share classes reflect any differences in sales charges, bu t have not been restated to reflect any differences in expenses between the Predecessor Fund share classes and the corresponding newer share classes. The returns for Class Y shares include the returns for Class Z shares for the period from November 18, 2002 until July 15, 2009, and Trust shares of the Predecessor Fund for periods prior thereto. The returns shown have not been adjusted to reflect any differences in expenses between Class Y shares and Class Z shares. Class Y shares were initially offered on July 15, 2009. Class I, Class R and Class W shares were initially offered by the fund on September 27, 2010.
9
Understanding Your Expenses – Columbia Large Cap Growth Fund
Estimating your actual expenses
To estimate the expenses that you paid over the period, first you will need your account balance at the end of the period:
g For shareholders who receive their account statements from Columbia Management Investment Services Corp., your account balance is available online at www.columbiamanagement.com or by calling Shareholder Services at 800.345.6611.
g For shareholders who receive their account statements from their financial intermediary, contact your financial intermediary to obtain your account balance.
1. Divide your ending account balance by $1,000. For example, if an account balance was $8,600 at the end of the period, the result would be 8.6.
2. In the section of the table below titled "Expenses paid during the period," locate the amount for your share class. You will find this number in the column labeled "Actual." Multiply this number by the result from step 1. Your answer is an estimate of the expenses you paid on your account during the period.
If the value of your account falls below the minimum initial investment requirement applicable to you, your account may be subject to a $20 annual fee. This fee is not included in the accompanying table. If you are subject to the fee, keep it in mind when you are estimating the ongoing expenses of investing in the fund and when comparing the expenses of this fund with other funds.
As a fund shareholder, you incur two types of costs. There are transaction costs, which generally include sales charges on purchases and may include redemption fees or exchange fees. There are also ongoing costs, which generally include investment advisory fees, distribution and service (Rule 12b-1) fees and other fund expenses. The information on this page is intended to help you understand the ongoing costs of investing in the fund and to compare these costs with the ongoing costs of investing in other mutual funds.
Analyzing your fund's expenses by share class
To illustrate these ongoing costs, we have provided an example and calculated the expenses paid by investors in each share class during the period. The information in the following table is based on an initial investment of $1,000, which is invested at the beginning of the period and held for the entire period. Expense information is calculated two ways and each method provides you with different information. The amount listed in the "Actual" column is calculated using the fund's actual operating expenses and total return for the period. The amount listed in the "Hypothetical" column for each share class assumes that the return each year is 5% before expenses and is calculated based on the fund's actual operating expenses. You should not use the hypothetical account values and expenses to estimate either your actual account balance at the end of the period or the expenses you paid during this period.
Compare with other funds
Since all mutual funds are required to include the same hypothetical calculations about expenses in shareholder reports, you can use this information to compare the ongoing cost of investing in the fund with other funds. To do so, compare the 5% hypothetical example with the 5% hypothetical examples that appear in the shareholder reports of other funds. As you compare hypothetical examples of other funds, it is important to note that hypothetical examples are meant to highlight the ongoing costs of investing in a fund and do not reflect any transaction costs, such as sales charges, redemption fees or exchange fees.
04/01/10 – 09/30/10
| | | Account value at the
beginning of the period ($) | | Account value at the
end of the period ($) | | Expenses paid
during the period ($) | | Fund's annualized
expense ratio (%) | |
| | | Actual | | Hypothetical | | Actual | | Hypothetical | | Actual | | Hypothetical | | Actual | |
| Class A | | �� | 1,000.00 | | | | 1,000.00 | | | | 997.60 | | | | 1,019.50 | | | | 5.56 | | | | 5.62 | | | | 1.11 | | |
| Class B | | | 1,000.00 | | | | 1,000.00 | | | | 994.20 | | | | 1,015.74 | | | | 9.30 | | | | 9.40 | | | | 1.86 | | |
| Class C | | | 1,000.00 | | | | 1,000.00 | | | | 993.70 | | | | 1,015.74 | | | | 9.30 | | | | 9.40 | | | | 1.86 | | |
| Class E | | | 1,000.00 | | | | 1,000.00 | | | | 997.10 | | | | 1,019.00 | | | | 6.06 | | | | 6.12 | | | | 1.21 | | |
| Class F | | | 1,000.00 | | | | 1,000.00 | | | | 993.70 | | | | 1,015.74 | | | | 9.30 | | | | 9.40 | | | | 1.86 | | |
| Class I | | | 1,000.00 | | | | 1,000.00 | | | | 998.10 | * | | | 1,022.06 | | | | 0.05 | * | | | 3.04 | | | | 0.60 | | |
| Class R | | | 1,000.00 | | | | 1,000.00 | | | | 998.10 | * | | | 1,019.00 | | | | 0.10 | * | | | 6.12 | | | | 1.21 | | |
| Class T | | | 1,000.00 | | | | 1,000.00 | | | | 997.10 | | | | 1,019.25 | | | | 5.81 | | | | 5.87 | | | | 1.16 | | |
| Class W | | | 1,000.00 | | | | 1,000.00 | | | | 998.10 | * | | | 1,020.26 | | | | 0.08 | * | | | 4.86 | | | | 0.96 | | |
| Class Y | | | 1,000.00 | | | | 1,000.00 | | | | 1,000.00 | | | | 1,021.86 | | | | 3.21 | | | | 3.24 | | | | 0.64 | | |
| Class Z | | | 1,000.00 | | | | 1,000.00 | | | | 998.60 | | | | 1,020.76 | | | | 4.31 | | | | 4.36 | | | | 0.86 | | |
Expenses paid during the period are equal to the annualized expense ratio for the share class, multiplied by the average account value over the period, then multiplied by the number of days in the fund's most recent fiscal half-year and divided by 365.
It is important to note that the expense amounts shown in the table are meant to highlight only ongoing costs of investing in the fund and do not reflect any transaction costs, such as sales charges, redemption fees or exchange fees. Therefore, the hypothetical examples provided may not help you determine the relative total costs of owning shares of different funds. If these transaction costs were included, your costs would have been higher.
*For the period September 27, 2010 through September 30, 2010. Class I, Class R and Class W commenced operations on September 27, 2010.
10
Portfolio Manager's Report – Columbia Large Cap Growth Fund
For the 12-month period that ended September 30, 2010, the fund's Class A shares returned 10.48% without sales charge. The fund's benchmark, the Russell 1000 Growth Index, gained 12.65%. However, the fund came out slightly ahead of the 10.19% average return of the funds in its peer group, the Lipper Large-Cap Growth Funds Classification. Stock selection, particularly in the financials and materials sectors, caused the fund to lag the benchmark. Given the slow rate of U.S. economic growth, we have positioned the fund to focus more on companies with strong global exposure and the ability to increase market share organically. Within the large-cap sector, growth stocks beat their value peers by a sizable margin. Large-cap stock returns, however, lagged those for small- and mid-cap stocks.
Biggest boosts from technology, health care and energy
The fund picked up ground versus the benchmark from investments in the information technology, health care and energy sectors. In technology, Akamai and Apple (0.7% and 4.9% of net assets, respectively) were standouts. Akamai, a software company whose products help accelerate web content delivery, experienced increased demand driven by growing Internet usage of online videos that require substantial bandwidth. Apple rallied sharply, thanks to the successful launch of its new iPad tablet computer and a positive reception for an updated version of its iPhone.
Top contributors from the health care sector included Edwards LifeSciences and Alexion Pharmaceuticals (0.6% and 0.6% of net assets, respectively). Medical device manufacturer Edwards climbed after introducing a new heart valve product that uses breakthrough technology, while Alexion, which develops products to treat immune system disorders and cancers, gained from strong sales of a drug it makes called Soliris, which fights chronic destruction of red blood cells.
Within energy, the biggest boost came from the fund's exposure to coal producers. Among them was Alpha Natural Resources, which benefited from stronger-than-expected earnings, driven in part by a rebound in global steel as well as by a surge in China's metallurgic coal imports. We locked in profits and sold the position. In addition, an underweight in Exxon Mobil (1.5% of net assets), a large index component, proved helpful. Like most oil exploration and production companies, Exxon came under pressure in the wake of the Gulf oil disaster, as investors worried about the long-term outlook for offshore deep-water drilling.
Disappointments in financials and materials
Although they are a small percentage of the portfolio, financial stocks impeded results relative to the benchmark. Detractors included IntercontinentalExchange and Morgan Stanley (1.3% and 0.9% of net assets, respectively). IntercontinentalExchange, a financial clearinghouse, declined as futures trading volumes slowed. Morgan Stanley, an investment bank, was hampered by a slowdown in mergers and acquisition activity for much of the period, as well as by a decline in trading volumes. In the materials
Performance data quoted represents past performance and current performance may be lower or higher. Past performance is no guarantee of future results. The investment return and principal value will fluctuate so that shares, when redeemed, may be worth more or less than the original cost. Please visit www.columbiamanagement.com for daily and most recent month-end performance updates.
Net asset value per share
as of 09/30/10 ($)
| Class A | | | 20.64 | | |
| Class B | | | 18.97 | | |
| Class C | | | 18.98 | | |
| Class E | | | 20.60 | | |
| Class F | | | 18.96 | | |
| Class I | | | 21.14 | | |
| Class R | | | 20.64 | | |
| Class T | | | 20.49 | | |
| Class W | | | 20.64 | | |
| Class Y | | | 21.14 | | |
| Class Z | | | 21.12 | | |
Distributions declared per share
10/01/09 – 09/30/10 ($)
| Class A | | | 0.09 | | |
| Class E | | | 0.08 | | |
| Class T | | | 0.08 | | |
| Class Y | | | 0.16 | | |
| Class Z | | | 0.13 | | |
11
Portfolio Manager's Report (continued) – Columbia Large Cap Growth Fund
Top 5 sectors
as of 09/30/10 (%)
| Information Technology | | | 32.9 | | |
| Consumer Discretionary | | | 13.7 | | |
| Industrials | | | 13.0 | | |
| Health Care | | | 12.1 | | |
| Consumer Staples | | | 8.7 | | |
Top 10 holdings
as of 09/30/10 (%)
| Apple, Inc. | | | 4.9 | | |
| Google, Inc., Class A | | | 3.3 | | |
| Oracle Corp. | | | 2.6 | | |
| EMC Corp. | | | 2.1 | | |
| Cisco Systems, Inc. | | | 2.1 | | |
International Business
Machines Corp. | | | 1.9 | | |
| QUALCOMM, Inc. | | | 1.8 | | |
Philip Morris
International, Inc. | | | 1.7 | | |
| Amazon.com, Inc. | | | 1.6 | | |
| Wal-Mart Stores, Inc. | | | 1.6 | | |
The Fund is actively managed and the composition of its portfolio will change over time. Information provided is calculated as a percentage of net assets.
sector, Allegheny Technologies (0.8% of net assets), which manufactures stainless steel and other specialty steels, sank because of lower near-term demand. We continue to believe that the long-term outlook for the company is still strong and continue to hold Allegheny stock.
Looking ahead
In an environment of continued slow economic growth, we expect the best performance to come from companies that can increase earnings at a faster pace than the market overall. Typically, when the economy is slow, companies have a harder time raising prices, which can lead to fears of deflation and compressed profit margins. Our goal is to find companies with products and services that are still in high demand, enabling them to increase earnings even in a difficult economic environment. Going forward, we plan to continue to emphasize stocks of companies that we believe have strong business prospects, including revenues and earnings potential, as well as reasonable stock valuations and competitive franchises.
Portfolio characteristics and holdings are subject to change periodically and may not be representative of current characteristics and holdings. The outlook for the fund may differ from that presented for other Columbia Funds.
Equity securities are subject to stock market fluctuations that occur in response to economic and business developments.
International investing involves special risks, including foreign taxation, currency risks, risks associated with possible differences in financial standards and other risks associated with future political and economic developments.
Investing in growth stocks incurs the possibility of losses because their prices are sensitive to changes in current or expected earnings.
12
Fund Profile – Columbia Disciplined Value Fund
Summary
g For the 12-month period that ended September 30, 2010, the fund's Class A shares returned 7.36% without sales charge.
g The fund underperformed its benchmark, the Russell 1000 Value Index1, but outperformed the average return of the funds in its peer group, the Lipper Large-Cap Value Funds Classification.2
g The fund's disciplined approach, with an emphasis on quality and valuation, detracted from relative returns as optimistic investors turned to lower-quality, more volatile stocks. Consumer discretionary, information technology and industrials holdings also hurt the fund's relative returns.
Portfolio Management
Brian Condon, CFA has managed the fund since 2009 and has been associated with the advisor since May 2010. Prior to joining the advisor, Mr. Condon was associated with the fund's previous advisor or its predecessors since 1999.
Effective May 1, 2010, RiverSource Investments, LLC, a subsidiary of Ameriprise Financial, Inc., became the investment advisor to the fund and changed its name to Columbia Management Investment Advisers, LLC. Please see the fund's prospectuses, as supplemented, for more information regarding the change in investment advisor and certain other changes.
1The Russell 1000 Value Index measures the performance of those Russell 1000 Index companies with lower price-to-book ratios and lower forecasted growth values.
2Lipper Inc., a widely respected data provider in the industry, calculates an average total return (assuming reinvestment of distributions) for mutual funds with investment objectives similar to those of the fund. Lipper makes no adjustment for the effect of sales loads.
Indices are not available for investment, are not professionally managed and do not reflect sales charges, fees, brokerage commissions, taxes or other expenses of investing. Securities in the fund may not match those in an index.
Performance data quoted represents past performance and current performance may be lower or higher. Past performance is no guarantee of future results. The investment return and principal value will fluctuate so that shares, when redeemed, may be worth more or less than the original cost. Please visit www.columbiamanagement.com for daily and most recent month-end performance updates.
Summary
1-year return as of 09/30/10
| | +7.36% | |
|
| |  | | | Class A shares
(without sales charge) | |
|
| | +8.90% | |
|
| |  | | | Russell 1000 Value Index | |
|
Morningstar Style BoxTM

The Morningstar Style Box(TM) is based on the Fund's portfolio holdings. For equity funds, the vertical axis shows the market capitalization of the stocks owned, and the horizontal axis shows investment style (value, blend or growth). Information shown is based on the most recent data provided by Morningstar.
© 2010 Morningstar, Inc. All rights reserved. The information contained herein is proprietary to Morningstar and/or its content providers, may not be copied or distributed and is not warranted to be accurate, complete, or timely. Neither Morningstar nor its content providers are responsible for any damages or losses arising from any use of this information. Past performance is no guarantee of future results.
13
Performance Information – Columbia Disciplined Value Fund
Performance data quoted represents past performance and current performance may be lower or higher. Past performance is no guarantee of future results. The investment return and principal value will fluctuate so that shares, when redeemed, may be worth more or less than the original cost. Please visit www.columbiamanagement.com for daily and most recent month-end performance updates.
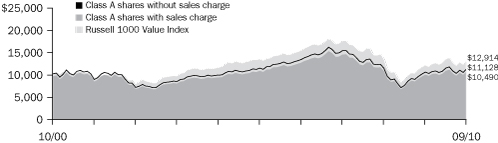
Performance of a $10,000 investment 10/01/00 – 09/30/10
The chart above shows the change in value of a hypothetical $10,000 investment in Class A shares of Columbia Disciplined Value Fund during the stated time period, and does not reflect the deduction of taxes that a shareholder may pay on fund distributions or on the redemption of fund shares.
Performance of a $10,000 investment 10/01/00 – 09/30/10 ($)
| Sales charge | | without | | with | |
| Class A | | | 11,128 | | | | 10,490 | | |
| Class B | | | 10,300 | | | | 10,300 | | |
| Class C | | | 10,265 | | | | 10,265 | | |
| Class T | | | 11,066 | | | | 10,431 | | |
| Class Z | | | 11,443 | | | | n/a | | |
Average annual total return as of 09/30/10 (%)
| Share class | | A | | B | | C | | T | | Z | |
| Inception | | 11/25/02 | | 11/25/02 | | 11/25/02 | | 09/01/88 | | 09/01/88 | |
| Sales charge | | without | | with | | without | | with | | without | | with | | without | | with | | without | |
| 1-year | | | 7.36 | | | | 1.19 | | | | 6.51 | | | | 1.51 | | | | 6.42 | | | | 5.42 | | | | 7.30 | | | | 1.14 | | | | 7.63 | | |
| 5-year | | | –0.27 | | | | –1.44 | | | | –0.98 | | | | –1.27 | | | | –1.02 | | | | –1.02 | | | | –0.32 | | | | –1.49 | | | | –0.01 | | |
| 10-year | | | 1.07 | | | | 0.48 | | | | 0.30 | | | | 0.30 | | | | 0.26 | | | | 0.26 | | | | 1.02 | | | | 0.42 | | | | 1.36 | | |
The "with sales charge" returns include the maximum initial sales charge of 5.75% for Class A and Class T shares and the applicable contingent deferred sales charge of 5.00% in the first year, declining to 1.00% in the sixth year and eliminated thereafter for Class B shares and 1.00% for Class C shares for the first year only. The "without sales charge" returns do not include the effect of sales charges.
Performance results reflect any fee waivers or reimbursements of fund expenses by the investment advisor and/or any of its affiliates. Absent these fee waivers or expense reimbursement arrangements, performance results would have been lower.
All results shown assume reinvestment of distributions. Class Z shares are sold at net asset value with no distribution and service (Rule 12b-1) fees. Class Z shares have limited eligibility and the investment minimum requirements may vary. Please see the fund's prospectuses for details. Performance for different share classes will vary based on differences in sales charges and fees associated with each class.
The tables do not reflect the deduction of taxes that a shareholder may pay on fund distributions or on the redemption of fund shares.
Class A, Class B, Class C, Class T and Class Z share performance information includes returns of Retail A shares (for Class A and Class T shares), Retail B shares (for Class B and Class C shares) and Trust shares (for Class Z shares) of Galaxy Equity Value Fund, the predecessor to the Fund and a series of the Galaxy Fund (the "Predecessor Fund"), for periods prior to November 25, 2002, the date on which Class A, Class B, Class C, Class T and Class Z shares were initially offered by the Fund. These returns shown for all share classes reflect any differences in sales charges, but have not been restated to reflect any differences in expenses between the Predecessor Fund share classes and the corresponding newer share classes. If differences in expenses were reflected, the returns shown for Class B and Class C shares for periods prior to November 25, 2002 would have been lower.
14
Understanding Your Expenses – Columbia Disciplined Value Fund
As a fund shareholder, you incur two types of costs. There are transaction costs, which generally include sales charges on purchases and may include redemption fees or exchange fees. There are also ongoing costs, which generally include investment advisory fees, distribution and service (Rule 12b-1) fees and other fund expenses. The information on this page is intended to help you understand the ongoing costs of investing in the fund and to compare these costs with the ongoing costs of investing in other mutual funds.
Analyzing your fund's expenses by share class
To illustrate these ongoing costs, we have provided an example and calculated the expenses paid by investors in each share class during the period. The information in the following table is based on an initial investment of $1,000, which is invested at the beginning of the period and held for the entire period. Expense information is calculated two ways and each method provides you with different information. The amount listed in the "Actual" column is calculated using the fund's actual operating expenses and total return for the period. The amount listed in the "Hypothetical" column for each share class assumes that the return each year is 5% before expenses and is calculated based on the fund's actual operating expenses. You should not use the hypothetical account values and expenses to estimate either your actual account balance at the end of the period or the expenses you paid during this period.
Compare with other funds
Since all mutual funds are required to include the same hypothetical calculations about expenses in shareholder reports, you can use this information to compare the ongoing cost of investing in the fund with other funds. To do so, compare the 5% hypothetical example with the 5% hypothetical examples that appear in the shareholder reports of other funds. As you compare hypothetical examples of other funds, it is important to note that hypothetical examples are meant to highlight the ongoing costs of investing in a fund and do not reflect any transaction costs, such as sales charges, redemption fees or exchange fees.
Estimating your actual expenses
To estimate the expenses that you paid over the period, first you will need your account balance at the end of the period:
g For shareholders who receive their account statements from Columbia Management Investment Services Corp., your account balance is available online at www.columbiamanagement.com or by calling Shareholder Services at 800.345.6611.
g For shareholders who receive their account statements from their financial intermediary, contact your financial intermediary to obtain your account balance.
1. Divide your ending account balance by $1,000. For example, if an account balance was $8,600 at the end of the period, the result would be 8.6.
2. In the section of the table below titled "Expenses paid during the period," locate the amount for your share class. You will find this number in the column labeled "Actual." Multiply this number by the result from step 1. Your answer is an estimate of the expenses you paid on your account during the period.
If the value of your account falls below the minimum initial investment requirement applicable to you, your account may be subject to a $20 annual fee. This fee is not included in the accompanying table. If you are subject to the fee, keep it in mind when you are estimating the ongoing expenses of investing in the fund and when comparing the expenses of this fund with other funds.
04/01/10 – 09/30/10
| | | Account value at the
beginning of the period ($) | | Account value at the
end of the period ($) | | Expenses paid
during the period ($) | | Fund's annualized
expense ratio (%) | |
| | | Actual | | Hypothetical | | Actual | | Hypothetical | | Actual | | Hypothetical | | Actual | |
| Class A | | | 1,000.00 | | | | 1,000.00 | | | | 986.20 | | | | 1,018.80 | | | | 6.22 | | | | 6.33 | | | | 1.25 | | |
| Class B | | | 1,000.00 | | | | 1,000.00 | | | | 982.40 | | | | 1,015.04 | | | | 9.94 | | | | 10.10 | | | | 2.00 | | |
| Class C | | | 1,000.00 | | | | 1,000.00 | | | | 982.30 | | | | 1,015.04 | | | | 9.94 | | | | 10.10 | | | | 2.00 | | |
| Class T | | | 1,000.00 | | | | 1,000.00 | | | | 985.90 | | | | 1,018.55 | | | | 6.47 | | | | 6.58 | | | | 1.30 | | |
| Class Z | | | 1,000.00 | | | | 1,000.00 | | | | 987.80 | | | | 1,020.05 | | | | 4.98 | | | | 5.06 | | | | 1.00 | | |
Expenses paid during the period are equal to the annualized expense ratio for the share class, multiplied by the average account value over the period, then multiplied by the number of days in the fund's most recent fiscal half-year and divided by 365.
Had the investment advisor and/or any of its affiliates not waived fees or reimbursed a portion of expenses, account value at the end of the period would have been reduced.
It is important to note that the expense amounts shown in the table are meant to highlight only ongoing costs of investing in the fund and do not reflect any transaction costs, such as sales charges, redemption fees or exchange fees. Therefore, the hypothetical examples provided may not help you determine the relative total costs of owning shares of different funds. If these transaction costs were included, your costs would have been higher.
15
Portfolio Manager's Report – Columbia Disciplined Value Fund
Performance data quoted represents past performance and current performance may be lower or higher. Past performance is no guarantee of future results. The investment return and principal value will fluctuate so that shares, when redeemed, may be worth more or less than the original cost. Please visit www.columbiamanagement.com for daily and most recent month-end performance updates.
Net asset value per share
as of 09/30/10 ($)
| Class A | | | 10.09 | | |
| Class B | | | 9.50 | | |
| Class C | | | 9.46 | | |
| Class T | | | 10.09 | | |
| Class Z | | | 10.36 | | |
Distributions declared per share
10/01/09 – 09/30/10 ($)
| Class A | | | 0.13 | | |
| Class B | | | 0.05 | | |
| Class C | | | 0.05 | | |
| Class T | | | 0.12 | | |
| Class Z | | | 0.15 | | |
Top 5 sectors
as of 09/30/10 (%)
| Financials | | | 27.8 | | |
| Health Care | | | 13.5 | | |
| Energy | | | 11.4 | | |
| Consumer Staples | | | 10.4 | | |
| Industrials | | | 9.3 | | |
Top 10 holdings
as of 09/30/10 (%)
| Chevron Corp. | | | 4.2 | | |
| JPMorgan Chase & Co. | | | 3.9 | | |
| General Electric Co. | | | 3.7 | | |
| Citigroup, Inc. | | | 3.0 | | |
| Microsoft Corp. | | | 2.6 | | |
| Verizon Communications, Inc. | | | 2.6 | | |
| UnitedHealth Group, Inc. | | | 2.5 | | |
| Wal-Mart Stores, Inc. | | | 2.3 | | |
Philip Morris
International, Inc. | | | 2.3 | | |
| Apache Corp. | | | 2.3 | | |
The Fund is actively managed and the composition of its portfolio will change over time. Information provided is calculated as a percentage of net assets.
For the 12-month period that ended September 30, 2010, the fund's Class A shares returned 7.36% without sales charge. The fund underperformed its benchmark, the Russell 1000 Value Index, which returned 8.90%. However, its return was higher than the 7.05% average return of the funds in its peer group, the Lipper Large-Cap Value Funds Classification. The fund's disciplined approach, with an emphasis on quality and valuation, detracted from relative returns as optimistic investors turned to lower quality, more volatile stocks. An uncertain economic environment also proved challenging for holdings in the consumer discretionary, information technology and industrials sectors. Relative positive performance from materials, financials, consumer staples, energy and health care holdings helped boost the fund's return.
Consumer, technology and industrials detracted from returns
The consumer discretionary sector continued to reel from weak consumer spending. Disappointments in the sector included luxury retailer Tiffany's, which experienced a sales decline and higher production costs. Likewise, QVC shopping channel owner Liberty Media Interactive disappointed. We sold both positions. In the information technology sector, management issues at Hewlett-Packard (1.2% of net assets) caused the stock to underperform. While the shake-up at the top was unsettling, we remain confident of the firm's prospects. An overweight in Microsoft (2.7% of net assets) also detracted from returns, but we remain positive on the stock, which, like Hewlett-Packard, continues to score well in our stock selection methodology. Our bias towards higher-quality stocks hurt most in the industrials sector where the fund was underexposed to some of the best performers during the period due to our stock selection methodology. In addition , poor results from R.R. Donnelley (1.5% of net assets), along with Harsco and KBR, which we subsequently sold, also detracted.
A range of sectors helped performance
Holdings in the materials sector had the fund's highest total return during the period, as these companies provided the raw materials necessary for a resurgence of post-crisis economic activity and in the wake of reflationary efforts by the world's central banks. Among the beneficiaries of renewed industrial demand was Eastman Chemical (1.2% of net assets), which posted record profits, albeit on lower sales than in pre-recession times. Increased sales also boosted specialty-chemical makers Cabot and Lubrizol (0.5% and 0.7% of net assets, respectively).
Improving financial markets and lower interest rates helped several of the fund's financial holdings gain ground. Shares of leading U.S. insurer Genworth Financial rose as its balance sheet recovered. We sold Genworth shares into strength. An improved balance sheet also helped boost retail real estate investment trust Simon Property Group (1.2% of net assets), which announced a planned acquisition of Prime Outlets. Student loan originator and servicer SLM, formerly Sallie Mae, (0.8% of net assets) also contributed positive results. During the period, consumer staples holdings provided a safe harbor when market risk was perceived to be high. Philip Morris
16
Portfolio Manager's Report (continued) – Columbia Disciplined Value Fund
International (2.3% of net assets) and Altria Group (1.0% of net assets) were among the beneficiaries of investor risk aversion.
The energy and health care sectors also produced solid returns. Overweights in both Chevron and ConocoPhillips (4.2% and 2.0% of net assets, respectively) were rewarded as both stocks outperformed the sector and the overall benchmark return. Endo Pharmaceuticals and UnitedHealth Group (0.9% and 2.5% of net assets, respectively) were both big winners in a sector characterized by much uncertainty during the period. The fund was overweight in both health care names.
Consistent approach in a challenging market environment
A low-quality stock rally that began after the market bottomed in early 2009 continued into 2010. Midway through the period, the global markets were roiled by a debt crisis that affected several European countries. As a result of the uneven market conditions, investors swung between concern about reduced economic growth prospects and euphoria over stronger-than-expected macroeconomic results. Against this backdrop, we continued to seek stocks with catalysts that have the potential to result in improved performance down the road. Our disciplined approach to stock selection emphasizes quality indicators and strict valuation metrics rather than short-term, market-led factors. We remain committed to our approach.
Portfolio characteristics and holdings are subject to change periodically and may not be representative of current characteristics and holdings. The outlook for the fund may differ from those presented for other Columbia Funds.
Equity securities are subject to stock market fluctuations that occur in response to economic and business developments.
Stocks of small- and mid-cap companies may pose special risks, including possible illiquidity and greater price volatility than stocks of larger, more established companies.
Value stocks are stocks of companies that may have experienced adverse business or industry developments or may be subject to special risks that have caused the stocks to be out of favor. If the manager's assessment of a company's prospects is wrong, the price of its stock may not approach the value the manager has placed on it.
17
Fund Profile – Columbia Contrarian Core Fund
Performance data quoted represents past performance and current performance may be lower or higher. Past performance is no guarantee of future results. The investment return and principal value will fluctuate so that shares, when redeemed, may be worth more or less than the original cost. Please visit www.columbiamanagement.com for daily and most recent month-end performance updates.
Summary
1-year return as of 09/30/10
| | +7.75% | |
|
| |  | | | Class A shares
(without sales charge) | |
|
| | +10.75% | |
|
| |  | | | Russell 1000 Index | |
|
Morningstar Style BoxTM
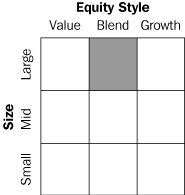
The Morningstar Style Box(TM) is based on the Fund's portfolio holdings. For equity funds, the vertical axis shows the market capitalization of the stocks owned, and the horizontal axis shows investment style (value, blend or growth). Information shown is based on the most recent data provided by Morningstar.
© 2010 Morningstar, Inc. All rights reserved. The information contained herein is proprietary to Morningstar and/or its content providers, may not be copied or distributed and is not warranted to be accurate, complete, or timely. Neither Morningstar nor its content providers are responsible for any damages or losses arising from any use of this information. Past performance is no guarantee of future results.
Summary
g For the 12-month period that ended September 30, 2010, the fund's Class A shares returned 7.75% without sales charge.
g The fund underperformed its benchmark, the Russell 1000 Index1, and performed essentially in line with the average return of the funds in its peer group, the Lipper Large-Cap Core Funds Classification.2
g Several of the fund's investments, notably in the financial sector, were hit disproportionately hard when the equity markets were weak during the early summer.
Portfolio Management
Guy W. Pope, CFA has managed the fund since March 2005 and has been associated with the advisor since May 2010. Prior to joining the advisor, Mr. Pope was associated with the fund's previous advisor or its predecessors since 1993.
Effective May 1, 2010, RiverSource Investments, LLC, a subsidiary of Ameriprise Financial, Inc., became the investment advisor to the fund and changed its name to Columbia Management Investment Advisers, LLC. Please see the fund's prospectuses, as supplemented, for more information regarding the change in investment advisor and certain other changes.
1The Russell 1000 Index tracks the performance of 1,000 of the largest U.S. companies, based on market capitalization.
2Lipper Inc., a widely respected data provider in the industry, calculates an average total return (assuming reinvestment of distributions) for mutual funds with investment objectives similar to those of the fund. Lipper makes no adjustment for the effect of sales loads.
Indices are not available for investment, are not professionally managed and do not reflect sales charges, fees, brokerage commissions, taxes or other expenses of investing. Securities in the fund may not match those in an index.
18
Performance Information – Columbia Contrarian Core Fund
Performance of a $10,000 investment 10/01/00 – 09/30/10
The chart above shows the change in value of a hypothetical $10,000 investment in Class A shares of Columbia Contrarian Core Fund during the stated time period, and does not reflect the deduction of taxes that a shareholder may pay on fund distributions or on the redemption of fund shares.
Performance of a $10,000 investment 10/01/00 – 09/30/10 ($)
| Sales charge | | without | | with | |
| Class A | | | 11,759 | | | | 11,085 | | |
| Class B | | | 10,895 | | | | 10,895 | | |
| Class C | | | 10,912 | | | | 10,912 | | |
| Class I | | | n/a | | | | n/a | | |
| Class R | | | n/a | | | | n/a | | |
| Class T | | | 11,666 | | | | 10,997 | | |
| Class W | | | n/a | | | | n/a | | |
| Class Z | | | 12,052 | | | | n/a | | |
Performance data quoted represents past performance and current performance may be lower or higher. Past performance is no guarantee of future results. The investment return and principal value will fluctuate so that shares, when redeemed, may be worth more or less than the original cost. Please visit www.columbiamanagement.com for daily and most recent month-end performance updates.
Average annual total return as of 09/30/10 (%)
| Share Class | | A | | B | | C | | I | | R | | T | | W | | Z | |
| Inception | | 11/01/98 | | 11/01/98 | | 12/09/02 | | 09/27/10 | | 09/27/10 | | 02/12/93 | | 09/27/10 | | 12/14/92 | |
| Sales charge | | without | | with | | without | | with | | without | | with | | without | | without | | without | | with | | without | | without | |
| 1-year | | | 7.75 | | | | 1.53 | | | | 6.90 | | | | 1.90 | | | | 6.98 | | | | 5.98 | | | n/a | | n/a | | | 7.68 | | | | 1.50 | | | n/a | | | 7.93 | | |
| 5-year | | | 3.55 | | | | 2.33 | | | | 2.76 | | | | 2.44 | | | | 2.78 | | | | 2.78 | | | n/a | | n/a | | | 3.48 | | | | 2.27 | | | n/a | | | 3.79 | | |
| 10-year/Life | | | 1.63 | | | | 1.04 | | | | 0.86 | | | | 0.86 | | | | 0.88 | | | | 0.88 | | | | –0.08 | | | | –0.08 | | | | 1.55 | | | | 0.95 | | | | –0.08 | | | | 1.88 | | |
The "with sales charge" returns include the maximum initial sales charge of 5.75% for Class A and Class T shares and the applicable contingent deferred sales charge of 5.00% in the first year, declining to 1.00% in the sixth year and eliminated thereafter for Class B shares and 1.00% for Class C shares for the first year only. The "without sales charge" returns do not include the effect of sales charges.
Performance results reflect any fee waivers or reimbursements of fund expenses by the investment advisor and/or any of its affiliates. Absent these fee waivers or expense reimbursement arrangements, performance results would have been lower.
All results shown assume reinvestment of distributions. Class I and Class Z shares are sold at net asset value with no distribution and service (Rule 12b-1) fees. Class R and Class W shares are sold at net asset value with a distribution (12b-1) fee. Class I, Class R, Class W and Class Z shares have limited eligibility and the investment minimum requirements may vary. Please see the fund's prospectuses for details. Performance for different share classes will vary based on differences in sales charges and fees associated with each class.
The tables do not reflect the deduction of taxes that a shareholder may pay on fund distributions or on the redemption of fund shares.
Class A, Class B, Class C, Class T and Class Z share performance information includes returns of Prime A shares (for Class A shares), Prime B shares (for Class B and Class C shares), Retail A shares (for Class T shares) and Trust shares (for Class Z shares) of Galaxy Growth & Income Fund, the predecessor to the Fund and a series of the Galaxy Fund (the "Predecessor Fund"), for periods prior to December 9, 2002, the date on which Class A, Class B, Class C, Class T and Class Z shares were initially offered by the Fund. These returns shown for all share classes reflect any differences in sales charges, but have not been restated to reflect any differences in expenses between the Predecessor Fund share classes and the corresponding newer share classes. If differences in expenses had been reflected, the returns shown for periods prior to December 9, 2002 would be lower for Class A, Class B and Class C shares.
Class I, Class R and Class W shares were initially offered by the Fund on September 27, 2010.
19
Understanding Your Expenses – Columbia Contrarian Core Fund
Estimating your actual expenses
To estimate the expenses that you paid over the period, first you will need your account balance at the end of the period:
g For shareholders who receive their account statements from Columbia Management Investment Services Corp., your account balance is available online at www.columbiamanagement.com or by calling Shareholder Services at 800.345.6611.
g For shareholders who receive their account statements from their financial intermediary, contact your financial intermediary to obtain your account balance.
1. Divide your ending account balance by $1,000. For example, if an account balance was $8,600 at the end of the period, the result would be 8.6.
2. In the section of the table below titled "Expenses paid during the period," locate the amount for your share class. You will find this number in the column labeled "Actual." Multiply this number by the result from step 1. Your answer is an estimate of the expenses you paid on your account during the period.
If the value of your account falls below the minimum initial investment requirement applicable to you, your account may be subject to a $20 annual fee. This fee is not included in the accompanying table. If you are subject to the fee, keep it in mind when you are estimating the ongoing expenses of investing in the fund and when comparing the expenses of this fund with other funds.
As a fund shareholder, you incur two types of costs. There are transaction costs, which generally include sales charges on purchases and may include redemption fees or exchange fees. There are also ongoing costs, which generally include investment advisory fees, distribution and service (Rule 12b-1) fees and other fund expenses. The information on this page is intended to help you understand the ongoing costs of investing in the fund and to compare these costs with the ongoing costs of investing in other mutual funds.
Analyzing your fund's expenses by share class
To illustrate these ongoing costs, we have provided an example and calculated the expenses paid by investors in each share class during the period. The information in the following table is based on an initial investment of $1,000, which is invested at the beginning of the period and held for the entire period. Expense information is calculated two ways and each method provides you with different information. The amount listed in the "Actual" column is calculated using the fund's actual operating expenses and total return for the period. The amount listed in the "Hypothetical" column for each share class assumes that the return each year is 5% before expenses and is calculated based on the fund's actual operating expenses. You should not use the hypothetical account values and expenses to estimate either your actual account balance at the end of the period or the expenses you paid during this period.
Compare with other funds
Since all mutual funds are required to include the same hypothetical calculations about expenses in shareholder reports, you can use this information to compare the ongoing cost of investing in the fund with other funds. To do so, compare the 5% hypothetical example with the 5% hypothetical examples that appear in the shareholder reports of other funds. As you compare hypothetical examples of other funds, it is important to note that hypothetical examples are meant to highlight the ongoing costs of investing in a fund and do not reflect any transaction costs, such as sales charges, redemption fees or exchange fees.
04/01/09 – 09/30/09
| | | Account value at the
beginning of the period ($) | | Account value at the
end of the period ($) | | Expenses paid
during the period ($) | | Fund's annualized
expense ratio (%) | |
| | | Actual | | Hypothetical | | Actual | | Hypothetical | | Actual | | Hypothetical | | Actual | |
| Class A | | | 1,000.00 | | | | 1,000.00 | | | | 967.80 | | | | 1,019.10 | | | | 5.87 | | | | 6.02 | | | | 1.19 | | |
| Class B | | | 1,000.00 | | | | 1,000.00 | | | | 964.00 | | | | 1,015.34 | | | | 9.55 | | | | 9.80 | | | | 1.94 | | |
| Class C | | | 1,000.00 | | | | 1,000.00 | | | | 964.10 | | | | 1,015.34 | | | | 9.55 | | | | 9.80 | | | | 1.94 | | |
| Class I | | | 1,000.00 | | | | 1,000.00 | | | | 999.20 | * | | | 1,020.81 | | | | 0.07 | * | | | 4.31 | | | | 0.85 | | |
| Class R | | | 1,000.00 | | | | 1,000.00 | | | | 999.20 | * | | | 1,017.85 | | | | 0.12 | * | | | 7.28 | | | | 1.44 | | |
| Class T | | | 1,000.00 | | | | 1,000.00 | | | | 966.80 | | | | 1,018.85 | | | | 6.11 | | | | 6.28 | | | | 1.24 | | |
| Class W | | | 1,000.00 | | | | 1,000.00 | | | | 999.20 | * | | | 1,019.10 | | | | 0.10 | * | | | 6.02 | | | | 1.19 | | |
| Class Z | | | 1,000.00 | | | | 1,000.00 | | | | 968.70 | | | | 1,020.36 | | | | 4.64 | | | | 4.76 | | | | 0.94 | | |
Expenses paid during the period are equal to the annualized expense ratio for the share class, multiplied by the average account value over the period, then multiplied by the number of days in the fund's most recent fiscal half-year and divided by 365.
Had the investment advisor and/or any of its affiliates not waived fees or reimbursed a portion of expenses, account value at the end of the period would have been reduced.
It is important to note that the expense amounts shown in the table are meant to highlight only ongoing costs of investing in the fund and do not reflect any transaction costs, such as sales charges, redemption fees or exchange fees. Therefore, the hypothetical examples provided may not help you determine the relative total costs of owning shares of different funds. If these transaction costs were included, your costs would have been higher.
*For the period September 27, 2010 through September 30, 2010. Class I, Class R and Class W commenced operations on September 27, 2010.
20
Portfolio Manager's Report – Columbia Contrarian Core Fund
For the 12-month period that ended September 30, 2010, the fund's Class A shares returned 7.75% without sales charge. The fund's benchmark, the Russell 1000 Index, returned 10.75%, and the average return of the funds in its peer group, the Lipper Large-Cap Core Funds Classification, was 7.93% for the same period. The fund's underperformance versus its benchmark can be traced to disappointing results from its financial and health care investments, as well as to a series of one-time events that hurt performance during the second quarter of 2010.
Stock selection and sector allocations detracted from returns
Although the fund trailed its peer group by only a thin margin for the 12-month period, it underperformed its benchmark by three percentage points on the basis of a combination of adverse stock selection and asset allocation decisions. In the consumer discretionary sector, video-game retailer GameStop (0.5% of net assets) was hurt by the maturation of the video-game cycle as well as by competition from online gaming and large discount retailers. In health care, Baxter International (0.7% of net assets) experienced pricing pressure in its main biologic product lines, and the stock sold off sharply during the spring, as earnings estimates were revised downward. Within the financial sector, Goldman Sachs (2.6% of net assets) declined sharply amidst an SEC investigation, and the sector was hurt more generally by the uncertainty of the economic recovery, margin pressure resulting from a prolonged period of low interest rates and the theoretical impact of financial reform. Within this difficult environment, JPMorgan Chase and State Street (2.5% and 1.5% of net assets, respectively) disappointed.
Rail industry and technology shares boosted performance
On the positive side of the ledger, Union Pacific (1.9% of net assets) enjoyed an increase in rail traffic, as the economy recovered and the rail industry as a group was able to retain its pricing power. In the technology sector, semiconductor manufacturer Atmel (1.3% of net assets) was up strongly, as it completed its restructuring program and also experienced a surge of orders for its maXTouch technology used in cell phones and tablets. Apple (3.7% of net assets) continued to enjoy success from its new product introductions, notably the iPad and iPhone4.
Looking ahead
During the course of the past year, the portfolio trended toward higher capitalization stocks, based on opportunities uncovered by our bottom-up investment style. As a result, the quality of the portfolio has improved and we are better positioned to withstand any market volatility. That said, we are anticipating a slow-growth recovery rather than the double-dip recession that some market observers have been predicting. Our current research focus is to identify companies that have the potential to prosper in a low-growth environment. Although the past twelve months were a disappointment
Performance data quoted represents past performance and current performance may be lower or higher. Past performance is no guarantee of future results. The investment return and principal value will fluctuate so that shares, when redeemed, may be worth more or less than the original cost. Please visit www.columbiamanagement.com for daily and most recent month-end performance updates.
Net asset value per share
as of 09/30/10 ($)
| Class A | | | 12.61 | | |
| Class B | | | 11.78 | | |
| Class C | | | 11.80 | | |
| Class I | | | 12.69 | | |
| Class R | | | 12.61 | | |
| Class T | | | 12.51 | | |
| Class W | | | 12.61 | | |
| Class Z | | | 12.68 | | |
Distributions declared per share
10/01/09 – 09/30/10 ($)
| Class A | | | 0.06 | | |
| Class T | | | 0.05 | | |
| Class Z | | | 0.08 | | |
Top 5 sectors
as of 09/30/10 (%)
| Information Technology | | | 21.6 | | |
| Financials | | | 16.0 | | |
| Energy | | | 14.1 | | |
| Industrials | | | 12.2 | | |
| Health Care | | | 11.0 | | |
Top 10 holdings
as of 09/30/10 (%)
| Apple, Inc. | | | 3.7 | | |
Philip Morris
International, Inc. | | | 3.1 | | |
| Exxon Mobil Corp. | | | 3.0 | | |
| Goldman Sachs Group, Inc. | | | 2.7 | | |
International Business
Machines Corp. | | | 2.6 | | |
| JPMorgan Chase & Co. | | | 2.5 | | |
| Abbott Laboratories | | | 2.5 | | |
| Chevron Corp. | | | 2.5 | | |
| Google, Inc., Class A | | | 2.4 | | |
| Target Corp. | | | 2.1 | | |
The Fund is actively managed and the composition of its portfolio will change over time. Information provided is calculated as a percentage of net assets.
21
Portfolio Manager's Report (continued) – Columbia Contrarian Core Fund
relative to our performance track record of the prior several years, we continue to believe that a disciplined contrarian style can be harnessed for superior long-term performance.
Portfolio characteristics and holdings are subject to change periodically and may not be representative of current characteristics and holdings. The outlook for the fund may differ from those presented for other Columbia Funds.
Equity securities are subject to stock market fluctuations that occur in response to economic and business developments.
22
Fund Profile – Columbia Small Cap Core Fund
Summary
g For the 12-month period that ended September 30, 2010, the fund's Class A shares returned 15.11% without sales charge.
g The fund outperformed its benchmarks, the Russell 2000 Index1 and the S&P SmallCap 600 Composite Index,2 and also the average return of the funds in its peer group, the Lipper Small-Cap Core Funds Classification.3
g Strong stock selection, especially in the financials and health care sectors, was the biggest driver of performance relative to the benchmark.
Portfolio Management
Richard G. D'Auteuil, lead manager, has co-managed the fund since 2005 and has been associated with the advisor since May 2010. Prior to joining the advisor, Mr. D'Auteuil was associated with the fund's previous advisor or its predecessors since 1993.
Jeffrey Hershey, CFA has co-managed the fund since August 2009 and has been associated with the advisor since May 2010. Prior to joining the advisor, Mr. Hershey was associated with the fund's previous advisor or its predecessors since 2009.
Effective May 1, 2010, RiverSource Investments, LLC, a subsidiary of Ameriprise Financial, Inc., became the investment advisor to the fund and changed its name to Columbia Management Investment Advisers, LLC. Please see the fund's prospectuses, as supplemented, for more information regarding the change in investment advisor and certain other changes.
1The Russell 2000 Index measures the performance of the 2,000 smallest companies in the Russell 3000 Index, which represents approximately 8% of the total market capitalization of the Russell 3000 Index.
2The Standard & Poor's (S&P) SmallCap 600 Composite Index tracks the performance of 600 domestic companies traded on major stock exchanges. The S&P SmallCap 600 is heavily weighted with the stocks of companies with small market capitalizations.
3Lipper Inc., a widely respected data provider in the industry, calculates an average total return (assuming reinvestment of distributions) for mutual funds with investment objectives similar to those of the fund. Lipper makes no adjustment for the effect of sales loads.
Indices are not available for investment, are not professionally managed and do not reflect sales charges, fees, brokerage commissions, taxes or other expenses of investing. Securities in the fund may not match those in an index.
Performance data quoted represents past performance and current performance may be lower or higher. Past performance is no guarantee of future results. The investment return and principal value will fluctuate so that shares, when redeemed, may be worth more or less than the original cost. Please visit www.columbiamanagement.com for daily and most recent month-end performance updates.
Summary
1-year return as of 09/30/10
| | +15.11% | |
|
| |  | | | Class A shares
(without sales charge) | |
|
| | | | | +13.35% | |
|
| |  | | | Russell 2000 Index | |
|
| | | | | +14.22% | |
|
| |  | | | S&P SmallCap 600
Composite Index | |
|
Morningstar Style BoxTM
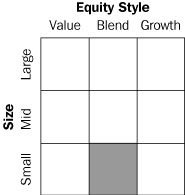
The Morningstar Style Box(TM) is based on the Fund's portfolio holdings. For equity funds, the vertical axis shows the market capitalization of the stocks owned, and the horizontal axis shows investment style (value, blend, or growth). Information shown is based on the most recent data provided by Morningstar.
© 2010 Morningstar, Inc. All rights reserved. The information contained herein is proprietary to Morningstar and/or its content providers, may not be copied or distributed and is not warranted to be accurate, complete, or timely. Neither Morningstar nor its content providers are responsible for any damages or losses arising from any use of this information. Past performance is no guarantee of future results.
23
Performance Information – Columbia Small Cap Core Fund
Performance data quoted represents past performance and current performance may be lower or higher. Past performance is no guarantee of future results. The investment return and principal value will fluctuate so that shares, when redeemed, may be worth more or less than the original cost. Please visit www.columbiamanagement.com for daily and most recent month-end performance updates.
Performance of a $10,000 investment 10/01/00 – 09/30/10
The chart above shows the change in value of a hypothetical $10,000 investment in Class A shares of Columbia Small Cap Core Fund during the stated time period, and does not reflect the deduction of taxes that a shareholder may pay on fund distributions or on the redemption of fund shares.
Performance of a $10,000 investment 10/01/00 – 09/30/10 ($)
| Sales charge | | without | | with | |
| Class A | | | 21,998 | | | | 20,736 | | |
| Class B | | | 20,338 | | | | 20,338 | | |
| Class C | | | 20,361 | | | | 20,361 | | |
| Class I | | | n/a | | | | n/a | | |
| Class T | | | 21,817 | | | | 20,560 | | |
| Class W | | | n/a | | | | n/a | | |
| Class Z | | | 22,596 | | | | n/a | | |
Average annual total return as of 09/30/10 (%)
| Share class | | A | | B | | C | | I | | T | | W | | Z | |
| Inception | | 11/01/98 | | 11/01/98 | | 11/18/02 | | 09/27/10 | | 02/12/93 | | 09/27/10 | | 12/14/92 | |
| Sales charge | | without | | with | | without | | with | | without | | with | | without | | without | | with | | without | | without | |
| 1-year | | | 15.11 | | | | 8.46 | | | | 14.20 | | | | 9.20 | | | | 14.29 | | | | 13.29 | | | n/a | | | 15.01 | | | | 8.44 | | | n/a | | | 15.33 | | |
| 5-year | | | 2.98 | | | | 1.77 | | | | 2.20 | | | | 1.96 | | | | 2.21 | | | | 2.21 | | | n/a | | | 2.92 | | | | 1.71 | | | n/a | | | 3.23 | | |
| 10-year/Life | | | 8.20 | | | | 7.57 | | | | 7.36 | | | | 7.36 | | | | 7.37 | | | | 7.37 | | | | 2.39 | | | | 8.11 | | | | 7.47 | | | | 2.38 | | | | 8.49 | | |
The "with sales charge" returns include the maximum initial sales charge of 5.75% for Class A and Class T shares and the applicable contingent deferred sales charge of 5.00% in the first year, declining to 1.00% in the sixth year and eliminated thereafter for Class B shares and 1.00% for Class C shares for the first year only. The "without sales charge" returns do not include the effect of sales charges.
Performance results reflect any fee waivers or reimbursements of fund expenses by the investment advisor and/or any of its affiliates. Absent these fee waivers or expense reimbursement arrangements, performance results would have been lower.
All results shown assume reinvestment of distributions. Class I and Class Z shares are sold at net asset value with no distribution and service (Rule 12b-1) fees. Class W shares are sold at net asset value with a distribution (12b-1) fee. Class I, Class W and Class Z shares have limited eligibility and the investment minimum requirements may vary. Please see the fund's prospectuses for details. Performance for different share classes will vary based on differences in sales charges and fees associated with each class.
The tables do not reflect the deduction of taxes that a shareholder may pay on fund distributions or on the redemption of fund shares.
Class A, Class B, Class C, Class T and Class Z share performance information includes returns of Prime A shares (for Class A shares), Prime B shares (for Class B shares), Retail A shares (for Class C and Class T shares) and Trust shares (for Class Z shares) of Galaxy Small Cap Value Fund, the predecessor to the Fund and a series of the Galaxy Fund (the "Predecessor Fund"), for periods prior to November 18, 2002, the date on which Class A, Class B, Class C, Class T and Class Z shares were initially offered by the Fund. These returns shown for all share classes reflect any differences in sales charges, but have not been restated to reflect any differences in expenses between the Predecessor Fund share classes and the corresponding newer share classes. Class I and Class W shares were initially offered by the Fund on September 27, 2010.
24
Understanding Your Expenses – Columbia Small Cap Core Fund
As a fund shareholder, you incur two types of costs. There are transaction costs, which generally include sales charges on purchases and may include redemption fees or exchange fees. There are also ongoing costs, which generally include investment advisory fees, distribution and service (Rule 12b-1) fees and other fund expenses. The information on this page is intended to help you understand the ongoing costs of investing in the fund and to compare these costs with the ongoing costs of investing in other mutual funds.
Analyzing your fund's expenses by share class
To illustrate these ongoing costs, we have provided an example and calculated the expenses paid by investors in each share class during the period. The information in the following table is based on an initial investment of $1,000, which is invested at the beginning of the period and held for the entire period. Expense information is calculated two ways and each method provides you with different information. The amount listed in the "Actual" column is calculated using the fund's actual operating expenses and total return for the period. The amount listed in the "Hypothetical" column for each share class assumes that the return each year is 5% before expenses and is calculated based on the fund's actual operating expenses. You should not use the hypothetical account values and expenses to estimate either your actual account balance at the end of the period or the expenses you paid during this period.
Compare with other funds
Since all mutual funds are required to include the same hypothetical calculations about expenses in shareholder reports, you can use this information to compare the ongoing cost of investing in the fund with other funds. To do so, compare the 5% hypothetical example with the 5% hypothetical examples that appear in the shareholder reports of other funds. As you compare hypothetical examples of other funds, it is important to note that hypothetical examples are meant to highlight the ongoing costs of investing in a fund and do not reflect any transaction costs, such as sales charges, redemption fees or exchange fees.
Estimating your actual expenses
To estimate the expenses that you paid over the period, first you will need your account balance at the end of the period:
g For shareholders who receive their account statements from Columbia Management Investment Services Corp., your account balance is available online at www.columbiamanagement.com or by calling Shareholder Services at 800.345.6611.
g For shareholders who receive their account statements from their financial intermediary, contact your financial intermediary to obtain your account balance.
1. Divide your ending account balance by $1,000. For example, if an account balance was $8,600 at the end of the period, the result would be 8.6.
2. In the section of the table below titled "Expenses paid during the period," locate the amount for your share class. You will find this number in the column labeled "Actual." Multiply this number by the result from step 1. Your answer is an estimate of the expenses you paid on your account during the period.
If the value of your account falls below the minimum initial investment requirement applicable to you, your account may be subject to a $20 annual fee. This fee is not included in the accompanying table. If you are subject to the fee, keep it in mind when you are estimating the ongoing expenses of investing in the fund and when comparing the expenses of this fund with other funds.
04/01/09 – 09/30/09
| | | Account value at the
beginning of the period ($) | | Account value at the
end of the period ($) | | Expenses paid
during the period ($) | | Fund's annualized
expense ratio (%) | |
| | | Actual | | Hypothetical | | Actual | | Hypothetical | | Actual | | Hypothetical | | Actual | |
| Class A | | | 1,000.00 | | | | 1,000.00 | | | | 1,019.90 | | | | 1,018.50 | | | | 6.63 | | | | 6.63 | | | | 1.31 | | |
| Class B | | | 1,000.00 | | | | 1,000.00 | | | | 1,015.40 | | | | 1,014.74 | | | | 10.41 | | | | 10.40 | | | | 2.06 | | |
| Class C | | | 1,000.00 | | | | 1,000.00 | | | | 1,016.20 | | | | 1,014.74 | | | | 10.41 | | | | 10.40 | | | | 2.06 | | |
| Class I | | | 1,000.00 | | | | 1,000.00 | | | | 1,023.90 | * | | | 1,020.56 | | | | 0.07 | * | | | 4.56 | | | | 0.90 | | |
| Class T | | | 1,000.00 | | | | 1,000.00 | | | | 1,019.50 | | | | 1,018.25 | | | | 6.89 | | | | 6.88 | | | | 1.36 | | |
| Class W | | | 1,000.00 | | | | 1,000.00 | | | | 1,023.80 | * | | | 1,018.35 | | | | 0.11 | * | | | 6.78 | | | | 1.34 | | |
| Class Z | | | 1,000.00 | | | | 1,000.00 | | | | 1,020.90 | | | | 1,019.75 | | | | 5.37 | | | | 5.37 | | | | 1.06 | | |
Expenses paid during the period are equal to the annualized expense ratio for the share class, multiplied by the average account value over the period, then multiplied by the number of days in the fund's most recent fiscal half-year and divided by 365.
It is important to note that the expense amounts shown in the table are meant to highlight only ongoing costs of investing in the fund and do not reflect any transaction costs, such as sales charges, redemption fees or exchange fees. Therefore, the hypothetical examples provided may not help you determine the relative total costs of owning shares of different funds. If these transaction costs were included, your costs would have been higher.
*For the period September 27, 2010 through September 30, 2010. Class I and Class W commenced operations on September 27, 2010.
25
Portfolio Manager's Report – Columbia Small Cap Core Fund
Performance data quoted represents past performance and current performance may be lower or higher. Past performance is no guarantee of future results. The investment return and principal value will fluctuate so that shares, when redeemed, may be worth more or less than the original cost. Please visit www.columbiamanagement.com for daily and most recent month-end performance updates.
Net asset value per share
as of 09/30/10 ($)
| Class A | | | 13.33 | | |
| Class B | | | 11.90 | | |
| Class C | | | 11.92 | | |
| Class I | | | 13.69 | | |
| Class T | | | 13.10 | | |
| Class W | | | 13.32 | | |
| Class Z | | | 13.69 | | |
Top 5 sectors
as of 09/30/10 (%)
| Information Technology | | | 26.0 | | |
| Industrials | | | 21.3 | | |
| Health Care | | | 14.5 | | |
| Financials | | | 12.6 | | |
| Consumer Discretionary | | | 10.4 | | |
Top 10 holdings
as of 09/30/10 (%)
| Benchmark Electronics, Inc. | | | 2.4 | | |
| Progress Software Corp. | | | 2.0 | | |
| Air Methods Corp. | | | 1.8 | | |
| Res-Care, Inc. | | | 1.7 | | |
| Keithley Instruments, Inc. | | | 1.5 | | |
| Greif, Inc., Class A | | | 1.3 | | |
| Plexus Corp. | | | 1.3 | | |
| Digital River, Inc. | | | 1.1 | | |
| H.B. Fuller Co. | | | 1.1 | | |
| EMCOR Group, Inc. | | | 1.1 | | |
The Fund is actively managed and the composition of its portfolio will change over time. Information provided is calculated as a percentage of net assets.
For the 12-month period that ended September 30, 2010, the fund's Class A shares returned 15.11% without sales charge. The fund's return was higher than the returns of its benchmarks, the Russell 2000 Index and the S&P SmallCap 600 Composite Index, which returned 13.35% and 14.22%, respectively. The fund also outpaced the average return of the funds in its peer group, the Lipper Small-Cap Core Funds Classification, which was 13.19%. Strong stock selection was the biggest contributor to outperformance, but sector allocations also helped.
Positive year for small-cap stocks
The market was volatile during the past year, rallying sharply when investors focused on earnings and sinking when legislative proposals and economic data came to the forefront. Most of the past year's gains came in September, after the Federal Reserve indicated its commitment to keeping the economic recovery on track. In this environment, small-cap stocks outpaced large-cap stocks, picking up added ground from low interest rates and increased merger-and-acquisition activity. Within the small-cap sector, the best absolute returns came from materials, consumer discretionary, technology and utilities stocks.
Biggest contributions from financials and health care
The biggest gains relative to the benchmark came from stocks we selected in the financials and health care sectors. In financials, the fund had no real home runs, but benefited from a lot of singles. Among them was Dupont Fabros Technology (0.6% of net assets), a real estate investment trust (REIT) that leases out space in data centers. The company profited from strong and growing demand for data storage and a shortage of data centers. In the health care sector, Valeant Pharmaceuticals International, a Canadian specialty pharmaceutical company, rallied sharply, as management helped the business grow organically and through a merger that pushed it to mid-cap size. We took profits and sold the stock. Air Methods (1.9% of net assets), an emergency rescue helicopter company, also climbed nicely, buoyed by improved earnings as well as news that a private competitor had been acquired at a handsome premium.
Buyouts boosted fund results in technology
During the first nine months of 2010, roughly 10% of the companies in the portfolio announced that they were being acquired or were in the process of negotiating an acquisition. The fund benefited from several buyouts that came in well above the trading price of the stock. They included Keithley Instruments (1.5% of net assets), a company that makes measurement instruments for testing. The company was the beneficiary of a pickup in business and recent cost reductions. Days before the period's end, it was bought out at a premium of roughly 75%. Other technology standouts included Cirrus Logic (0.5% of net assets), which makes semiconductors that improve audio clarity in the highly popular Apple iPhones, as well as in other mobile phones and audio equipment.
26
Portfolio Manager's Report (continued) – Columbia Small Cap Core Fund
Disappointing stock selection in materials
The one sector that was a significant detractor from relative results was materials. Spartech (0.6% of net assets), which makes specialty and commodity plastics, declined after reporting weaker than expected earnings and a management change. Metals USA (0.7% of net assets), a metals service center, suffered from mediocre results as metals pricing was weaker-than-expected following the company's initial public offering. Consumer discretionary and utilities holdings also trimmed relative results.
Outlook and positioning
We believe that stock valuations still look attractive, which was confirmed by an uptick in insider buying during August and September. We also think business is better than news reports indicate, despite continued economic and electoral uncertainty. Finally, we expect to see more of a stock picker's market going forward, with investors rewarding companies that demonstrate strong earnings growth and punishing those with more uncertain outlooks. Over the period, we eliminated some very small holdings in the portfolio, ending with about 180 names. Going forward, our focus will remain on companies with good earnings growth over time, attractive stock valuations and catalysts, such as a new product or new management.
Portfolio characteristics and holdings are subject to change periodically and may not be representative of current characteristics and holdings. The outlook for the fund may differ from that presented for other Columbia Funds.
Equity securities are subject to stock market fluctuations that occur in response to economic and business developments.
Stocks of small- and mid-cap companies may pose special risks, including possible illiquidity and greater price volatility than stocks of larger, more established companies.
Value stocks are stocks of companies that may have experienced adverse business or industry developments or may be subject to special risks that have caused the stocks to be out of favor. If the manager's assessment of a company's prospects is wrong, the price of its stock may not approach the value the manager has placed on it.
27
Investment Portfolio – Columbia Asset Allocation Fund
September 30, 2010
| Common Stocks – 55.7% | |
| | | Shares | | Value ($) | |
| Consumer Discretionary – 6.5% | |
| Auto Components – 0.5% | |
| Autoliv, Inc. | | | 7,600 | | | | 496,508 | | |
| BorgWarner, Inc. (a) | | | 3,080 | | | | 162,070 | | |
| Cooper Tire & Rubber Co. | | | 6,480 | | | | 127,202 | | |
| Dana Holding Corp. (a) | | | 8,200 | | | | 101,024 | | |
| EXEDY Corp. | | | 1,700 | | | | 51,177 | | |
| Lear Corp. (a) | | | 430 | | | | 33,940 | | |
| Auto Components Total | | | 971,921 | | |
| Automobiles – 0.3% | |
| Ford Motor Co. (a) | | | 24,700 | | | | 302,328 | | |
| Harley-Davidson, Inc. | | | 2,000 | | | | 56,880 | | |
| Nissan Motor Co., Ltd. | | | 25,000 | | | | 218,968 | | |
| Automobiles Total | | | 578,176 | | |
| Distributors – 0.2% | |
| Genuine Parts Co. | | | 8,700 | | | | 387,933 | | |
| Distributors Total | | | 387,933 | | |
| Diversified Consumer Services – 0.1% | |
| Capella Education Co. (a) | | | 470 | | | | 36,481 | | |
| DeVry, Inc. | | | 720 | | | | 35,431 | | |
| Grand Canyon Education, Inc. (a) | | | 4,007 | | | | 87,874 | | |
New Oriental Education &
Technology Group, ADR (a) | | | 420 | | | | 40,984 | | |
| Regis Corp. | | | 1,080 | | | | 20,660 | | |
| Diversified Consumer Services Total | | | 221,430 | | |
| Hotels, Restaurants & Leisure – 1.2% | |
| Bally Technologies, Inc. (a) | | | 795 | | | | 27,785 | | |
| Benihana, Inc., Class A (a) | | | 2,092 | | | | 15,878 | | |
| BJ's Restaurants, Inc. (a) | | | 1,675 | | | | 47,168 | | |
| Bob Evans Farms, Inc. | | | 760 | | | | 21,333 | | |
| California Pizza Kitchen, Inc. (a) | | | 1,155 | | | | 19,704 | | |
| Carnival Corp. | | | 8,900 | | | | 340,069 | | |
| CEC Entertainment, Inc. (a) | | | 457 | | | | 15,689 | | |
| Chipotle Mexican Grill, Inc. (a) | | | 290 | | | | 49,880 | | |
Ctrip.com International Ltd.,
ADR (a) | | | 1,360 | | | | 64,940 | | |
Home Inns & Hotels Management,
Inc., ADR (a) | | | 720 | | | | 35,597 | | |
| International Game Technology | | | 2,174 | | | | 31,414 | | |
| Jack in the Box, Inc. (a) | | | 610 | | | | 13,078 | | |
| Las Vegas Sands Corp. (a) | | | 11,830 | | | | 412,276 | | |
| McDonald's Corp. | | | 8,170 | | | | 608,747 | | |
| OPAP SA | | | 5,794 | | | | 91,460 | | |
| Panera Bread Co., Class A (a) | | | 460 | | | | 40,761 | | |
Red Robin Gourmet Burgers,
Inc. (a) | | | 690 | | | | 13,531 | | |
| Royal Caribbean Cruises Ltd. (a) | | | 3,230 | | | | 101,842 | | |
| Starbucks Corp. | | | 12,550 | | | | 321,029 | | |
| | | Shares | | Value ($) | |
Starwood Hotels & Resorts
Worldwide, Inc. | | | 4,917 | | | | 258,388 | | |
| WMS Industries, Inc. (a) | | | 1,250 | | | | 47,588 | | |
| Hotels, Restaurants & Leisure Total | | | 2,578,157 | | |
| Household Durables – 0.4% | |
| American Greetings Corp., Class A | | | 790 | | | | 14,686 | | |
| Arnest One Corp. | | | 11,800 | | | | 130,057 | | |
| Cavco Industries, Inc. (a) | | | 482 | | | | 17,308 | | |
| CSS Industries, Inc. | | | 799 | | | | 13,815 | | |
| D.R. Horton, Inc. | | | 5,400 | | | | 60,048 | | |
| Forbo Holding AG | | | 100 | | | | 54,967 | | |
| Foster Electric Co., Ltd. | | | 6,300 | | | | 159,717 | | |
| SEB SA | | | 1,715 | | | | 147,312 | | |
| Stanley Black & Decker, Inc. | | | 1,125 | | | | 68,940 | | |
| Tempur-Pedic International, Inc. (a) | | | 5,425 | | | | 168,175 | | |
| Whirlpool Corp. | | | 480 | | | | 38,861 | | |
| Household Durables Total | | | 873,886 | | |
| Internet & Catalog Retail – 0.4% | |
| Amazon.com, Inc. (a) | | | 3,825 | | | | 600,754 | | |
Liberty Media Corp., Interactive,
Series A (a) | | | 2,400 | | | | 32,904 | | |
| NetFlix, Inc. (a) | | | 230 | | | | 37,297 | | |
| priceline.com, Inc. (a) | | | 250 | | | | 87,085 | | |
| Shutterfly, Inc. (a) | | | 1,088 | | | | 28,277 | | |
| Internet & Catalog Retail Total | | | 786,317 | | |
| Leisure Equipment & Products – 0.1% | |
| Altek Corp. | | | 46,928 | | | | 69,839 | | |
| Hasbro, Inc. | | | 1,100 | | | | 48,961 | | |
| Jakks Pacific, Inc. (a) | | | 1,230 | | | | 21,697 | | |
| Mattel, Inc. | | | 1,400 | | | | 32,844 | | |
| Polaris Industries, Inc. | | | 435 | | | | 28,318 | | |
| Leisure Equipment & Products Total | | | 201,659 | | |
| Media – 0.4% | |
| CBS Corp., Class B | | | 5,670 | | | | 89,926 | | |
| DISH Network Corp., Class A | | | 2,200 | | | | 42,152 | | |
| Gannett Co., Inc. | | | 1,072 | | | | 13,111 | | |
| Imax Corp. (a) | | | 1,900 | | | | 32,034 | | |
| Knology, Inc. (a) | | | 1,362 | | | | 18,292 | | |
| Lamar Advertising Co., Class A (a) | | | 1,180 | | | | 37,548 | | |
| McGraw-Hill Companies, Inc. | | | 1,930 | | | | 63,806 | | |
| Scholastic Corp. | | | 710 | | | | 19,752 | | |
| Time Warner Cable, Inc. | | | 1,450 | | | | 78,285 | | |
| Viacom, Inc., Class B | | | 10,600 | | | | 383,614 | | |
| Media Total | | | 778,520 | | |
| Multiline Retail – 0.9% | |
| Big Lots, Inc. (a) | | | 1,460 | | | | 48,545 | | |
| Gordmans Stores, Inc. (a) | | | 2,337 | | | | 26,992 | | |
| Kohl's Corp. (a) | | | 6,000 | | | | 316,080 | | |
See Accompanying Notes to Financial Statements.
28
Columbia Asset Allocation Fund
September 30, 2010
| Common Stocks (continued) | |
| | | Shares | | Value ($) | |
| Nordstrom, Inc. | | | 9,570 | | | | 356,004 | | |
| Target Corp. | | | 23,400 | | | | 1,250,496 | | |
| Multiline Retail Total | | | 1,998,117 | | |
| Specialty Retail – 1.4% | |
| Advance Auto Parts, Inc. | | | 1,210 | | | | 71,003 | | |
| America's Car-Mart, Inc. (a) | | | 645 | | | | 16,241 | | |
| CarMax, Inc. (a) | | | 1,220 | | | | 33,989 | | |
| Christopher & Banks Corp. | | | 2,080 | | | | 16,453 | | |
| Dick's Sporting Goods, Inc. (a) | | | 7,280 | | | | 204,131 | | |
| EDION Corp. | | | 9,500 | | | | 69,766 | | |
| Finish Line, Inc., Class A | | | 1,330 | | | | 18,500 | | |
| Foot Locker, Inc. | | | 5,787 | | | | 84,085 | | |
| Game Group PLC | | | 93,145 | | | | 96,636 | | |
| GameStop Corp., Class A (a) | | | 13,450 | | | | 265,100 | | |
| Jo-Ann Stores, Inc. (a) | | | 745 | | | | 33,190 | | |
| Limited Brands, Inc. | | | 23,100 | | | | 618,618 | | |
| Lowe's Companies, Inc. | | | 7,700 | | | | 171,633 | | |
| Men's Wearhouse, Inc. | | | 884 | | | | 21,030 | | |
| O'Reilly Automotive, Inc. (a) | | | 6,165 | | | | 327,978 | | |
| OfficeMax, Inc. (a) | | | 1,290 | | | | 16,886 | | |
Pacific Sunwear of California,
Inc. (a) | | | 7,035 | | | | 36,793 | | |
| Pier 1 Imports, Inc. (a) | | | 3,675 | | | | 30,098 | | |
| Rent-A-Center, Inc. | | | 1,319 | | | | 29,519 | | |
| Shoe Carnival, Inc. (a) | | | 1,019 | | | | 20,604 | | |
| TJX Companies, Inc. | | | 13,190 | | | | 588,670 | | |
| Urban Outfitters, Inc. (a) | | | 1,820 | | | | 57,221 | | |
| USS Co., Ltd. | | | 2,150 | | | | 160,697 | | |
| Vitamin Shoppe, Inc. (a) | | | 1,000 | | | | 27,450 | | |
| Yamada Denki Co., Ltd. | | | 1,510 | | | | 93,708 | | |
| Specialty Retail Total | | | 3,109,999 | | |
| Textiles, Apparel & Luxury Goods – 0.6% | |
| Adidas AG | | | 2,813 | | | | 174,351 | | |
| Coach, Inc. | | | 880 | | | | 37,805 | | |
| CROCS, Inc. (a) | | | 4,110 | | | | 53,471 | | |
| Deckers Outdoor Corp. (a) | | | 505 | | | | 25,230 | | |
| Hanesbrands, Inc. (a) | | | 2,500 | | | | 64,650 | | |
| LG Fashion Corp. | | | 5,250 | | | | 156,847 | | |
| Lululemon Athletica, Inc. (a) | | | 7,715 | | | | 345,015 | | |
| Movado Group, Inc. (a) | | | 1,357 | | | | 14,764 | | |
| NIKE, Inc., Class B | | | 3,700 | | | | 296,518 | | |
| Warnaco Group, Inc. (a) | | | 2,355 | | | | 120,411 | | |
| Youngone Corp. | | | 10,020 | | | | 86,383 | | |
| Textiles, Apparel & Luxury Goods Total | | | 1,375,445 | | |
| Consumer Discretionary Total | | | 13,861,560 | | |
| | | Shares | | Value ($) | |
| Consumer Staples – 4.1% | |
| Beverages – 1.0% | |
| Carlsberg A/S, Class B | | | 1,959 | | | | 204,128 | | |
| Coca-Cola Co. | | | 8,200 | | | | 479,864 | | |
| Cott Corp. (a) | | | 87 | | | | 683 | | |
| Diageo PLC, ADR | | | 9,151 | | | | 631,511 | | |
| Dr Pepper Snapple Group, Inc. | | | 2,347 | | | | 83,365 | | |
| Hansen Natural Corp. (a) | | | 740 | | | | 34,499 | | |
| Molson Coors Brewing Co., Class B | | | 9,100 | | | | 429,702 | | |
| PepsiCo, Inc. | | | 5,700 | | | | 378,708 | | |
| Beverages Total | | | 2,242,460 | | |
| Food & Staples Retailing – 0.7% | |
| George Weston Ltd. | | | 1,400 | | | | 107,425 | | |
| Koninklijke Ahold NV | | | 14,119 | | | | 190,407 | | |
| Ruddick Corp. | | | 690 | | | | 23,929 | | |
| Seven & I Holdings Co., Ltd. | | | 7,800 | | | | 183,079 | | |
| Spartan Stores, Inc. | | | 987 | | | | 14,312 | | |
| Wal-Mart Stores, Inc. | | | 17,350 | | | | 928,572 | | |
| Whole Foods Market, Inc. (a) | | | 5,050 | | | | 187,405 | | |
| Food & Staples Retailing Total | | | 1,635,129 | | |
| Food Products – 1.1% | |
| Balrampur Chini Mills Ltd. | | | 43,373 | | | | 89,816 | | |
China Milk Products Group
Ltd. (a)(b) | | | 322,000 | | | | 17,139 | | |
| Fresh Del Monte Produce, Inc. (a) | | | 1,453 | | | | 31,530 | | |
| General Mills, Inc. | | | 8,800 | | | | 321,552 | | |
Green Mountain Coffee Roasters,
Inc. (a) | | | 1,000 | | | | 31,190 | | |
| H.J. Heinz Co. | | | 10,400 | | | | 492,648 | | |
| Hershey Co. | | | 5,450 | | | | 259,365 | | |
| J.M. Smucker Co. | | | 1,228 | | | | 74,331 | | |
| Kraft Foods, Inc., Class A | | | 12,400 | | | | 382,664 | | |
| Marine Harvest ASA | | | 200,961 | | | | 175,479 | | |
Mead Johnson Nutrition Co.,
Class A | | | 2,150 | | | | 122,357 | | |
| Nestle SA, Registered Shares | | | 3,580 | | | | 190,800 | | |
| Parmalat SpA | | | 58,700 | | | | 150,791 | | |
| Food Products Total | | | 2,339,662 | | |
| Household Products – 0.3% | |
| Clorox Co. | | | 1,520 | | | | 101,475 | | |
| Mcbride PLC | | | 23,898 | | | | 69,545 | | |
| Procter & Gamble Co. | | | 6,800 | | | | 407,796 | | |
| Household Products Total | | | 578,816 | | |
| Personal Products – 0.4% | |
| Avon Products, Inc. | | | 17,540 | | | | 563,209 | | |
| Elizabeth Arden, Inc. (a) | | | 1,340 | | | | 26,787 | | |
See Accompanying Notes to Financial Statements.
29
Columbia Asset Allocation Fund
September 30, 2010
| Common Stocks (continued) | |
| | | Shares | | Value ($) | |
Estée Lauder Companies, Inc.,
Class A | | | 2,925 | | | | 184,948 | | |
| Herbalife Ltd. | | | 1,100 | | | | 66,385 | | |
| Personal Products Total | | | 841,329 | | |
| Tobacco – 0.6% | |
| Philip Morris International, Inc. | | | 22,126 | | | | 1,239,499 | | |
| Tobacco Total | | | 1,239,499 | | |
| Consumer Staples Total | | | 8,876,895 | | |
| Energy – 7.1% | |
| Energy Equipment & Services – 2.0% | |
| Baker Hughes, Inc. | | | 2,649 | | | | 112,847 | | |
| Cal Dive International, Inc. (a) | | | 2,350 | | | | 12,854 | | |
| Cameron International Corp. (a) | | | 13,828 | | | | 594,051 | | |
| CARBO Ceramics, Inc. | | | 200 | | | | 16,200 | | |
Complete Production Services,
Inc. (a) | | | 3,264 | | | | 66,749 | | |
| Core Laboratories NV | | | 1,538 | | | | 135,405 | | |
| Dawson Geophysical Co. (a) | | | 550 | | | | 14,657 | | |
| Dresser-Rand Group, Inc. (a) | | | 5,656 | | | | 208,650 | | |
| Dril-Quip, Inc. (a) | | | 809 | | | | 50,247 | | |
| Ensco PLC, ADR | | | 1,100 | | | | 49,203 | | |
| FMC Technologies, Inc. (a) | | | 812 | | | | 55,451 | | |
| Gulf Island Fabrication, Inc. | | | 1,080 | | | | 19,656 | | |
| Halliburton Co. | | | 36,339 | | | | 1,201,731 | | |
| Matrix Service Co. (a) | | | 1,240 | | | | 10,850 | | |
| McDermott International, Inc. (a) | | | 4,460 | | | | 65,919 | | |
| Nabors Industries Ltd. (a) | | | 26,950 | | | | 486,717 | | |
| National Oilwell Varco, Inc. | | | 2,448 | | | | 108,863 | | |
| Noble Corp. | | | 5,860 | | | | 198,009 | | |
| Oil States International, Inc. (a) | | | 603 | | | | 28,070 | | |
| Patterson-UTI Energy, Inc. | | | 2,082 | | | | 35,561 | | |
| Pride International, Inc. (a) | | | 1,900 | | | | 55,917 | | |
| Schlumberger Ltd. | | | 3,224 | | | | 198,631 | | |
| Seadrill Ltd. | | | 1,590 | | | | 46,094 | | |
| Shinko Plantech Co., Ltd. | | | 14,700 | | | | 133,492 | | |
| T-3 Energy Services, Inc. (a) | | | 610 | | | | 15,951 | | |
| Tecnicas Reunidas SA | | | 1,569 | | | | 83,564 | | |
| Tetra Technologies, Inc. (a) | | | 2,880 | | | | 29,376 | | |
| TGC Industries, Inc. (a) | | | 2,212 | | | | 8,494 | | |
| Tidewater, Inc. | | | 450 | | | | 20,164 | | |
| Transocean Ltd. (a) | | | 807 | | | | 51,882 | | |
| Union Drilling, Inc. (a) | | | 2,495 | | | | 11,178 | | |
| Vantage Drilling Co. (a) | | | 12,518 | | | | 20,029 | | |
| Weatherford International Ltd. (a) | | | 7,867 | | | | 134,526 | | |
| Energy Equipment & Services Total | | | 4,280,988 | | |
| Oil, Gas & Consumable Fuels – 5.1% | |
| Alpha Natural Resources, Inc. (a) | | | 2,672 | | | | 109,953 | | |
| Anadarko Petroleum Corp. | | | 6,766 | | | | 386,000 | | |
| | | Shares | | Value ($) | |
| Apache Corp. | | | 8,781 | | | | 858,431 | | |
| Arch Coal, Inc. | | | 991 | | | | 26,470 | | |
| AWE Ltd. (a) | | | 85,777 | | | | 128,513 | | |
| Berry Petroleum Co., Class A | | | 590 | | | | 18,721 | | |
| Bill Barrett Corp. (a) | | | 580 | | | | 20,880 | | |
| BP PLC | | | 32,619 | | | | 222,997 | | |
| Brigham Exploration Co. (a) | | | 4,092 | | | | 76,725 | | |
| Cabot Oil & Gas Corp. | | | 2,200 | | | | 66,242 | | |
| Cenovus Energy, Inc. | | | 1,632 | | | | 46,953 | | |
| Chesapeake Energy Corp. | | | 801 | | | | 18,143 | | |
| Chevron Corp. | | | 28,505 | | | | 2,310,330 | | |
| Cimarex Energy Co. | | | 807 | | | | 53,407 | | |
| Comstock Resources, Inc. (a) | | | 418 | | | | 9,401 | | |
| Concho Resources, Inc. (a) | | | 2,709 | | | | 179,255 | | |
| ConocoPhillips | | | 6,104 | | | | 350,553 | | |
| Continental Resources, Inc. (a) | | | 5,780 | | | | 267,961 | | |
| Denbury Resources, Inc. (a) | | | 3,300 | | | | 52,437 | | |
| Energy XXI Bermuda Ltd. (a) | | | 2,055 | | | | 47,491 | | |
| EOG Resources, Inc. | | | 2,786 | | | | 259,014 | | |
| Exxon Mobil Corp. | | | 13,127 | | | | 811,117 | | |
| Forest Oil Corp. (a) | | | 2,894 | | | | 85,952 | | |
| Frontier Oil Corp. | | | 1,214 | | | | 16,268 | | |
| Frontline Ltd. | | | 1,350 | | | | 38,381 | | |
| General Maritime Corp. | | | 1,969 | | | | 9,668 | | |
| Hess Corp. | | | 1,425 | | | | 84,246 | | |
| Holly Corp. | | | 500 | | | | 14,375 | | |
| International Coal Group, Inc. (a) | | | 2,908 | | | | 15,471 | | |
| Japan Petroleum Exploration Co. | | | 2,900 | | | | 109,455 | | |
| Marathon Oil Corp. | | | 1,634 | | | | 54,085 | | |
| Miller Petroleum, Inc. (a) | | | 3,792 | | | | 20,439 | | |
| Murphy Oil Corp. | | | 7,568 | | | | 468,611 | | |
| Newfield Exploration Co. (a) | | | 1,532 | | | | 87,998 | | |
| Noble Energy, Inc. | | | 403 | | | | 30,261 | | |
| Northern Oil & Gas, Inc. (a) | | | 1,215 | | | | 20,582 | | |
| Oasis Petroleum, Inc. (a) | | | 2,414 | | | | 46,759 | | |
| Occidental Petroleum Corp. | | | 19,014 | | | | 1,488,796 | | |
| Overseas Shipholding Group, Inc. | | | 385 | | �� | | 13,213 | | |
| Peabody Energy Corp. | | | 8,719 | | | | 427,318 | | |
| PetroHawk Energy Corp. (a) | | | 820 | | | | 13,235 | | |
| Petroleo Brasileiro SA, ADR | | | 5,442 | | | | 197,381 | | |
| Pioneer Natural Resources Co. | | | 817 | | | | 53,130 | | |
| QEP Resources, Inc. | | | 311 | | | | 9,374 | | |
| Resolute Energy Corp. (a) | | | 2,120 | | | | 23,447 | | |
| Rosetta Resources, Inc. (a) | | | 1,147 | | | | 26,943 | | |
| Rosneft Oil Co., GDR (a) | | | 12,297 | | | | 82,220 | | |
| Royal Dutch Shell PLC, Class B | | | 6,407 | | | | 187,037 | | |
| SandRidge Energy, Inc. (a) | | | 3,300 | | | | 18,744 | | |
| Southwestern Energy Co. (a) | | | 1,510 | | | | 50,494 | | |
| Spectra Energy Corp. | | | 6,682 | | | | 150,679 | | |
| Stone Energy Corp. (a) | | | 1,349 | | | | 19,871 | | |
| Suncor Energy, Inc. | | | 2,439 | | | | 79,389 | | |
See Accompanying Notes to Financial Statements.
30
Columbia Asset Allocation Fund
September 30, 2010
| Common Stocks (continued) | |
| | | Shares | | Value ($) | |
| Swift Energy Co. (a) | | | 840 | | | | 23,587 | | |
| Tesoro Corp. | | | 833 | | | | 11,129 | | |
| Total SA | | | 3,652 | | | | 188,368 | | |
| Valero Energy Corp. | | | 1,636 | | | | 28,646 | | |
| Western Refining, Inc. (a) | | | 3,206 | | | | 16,799 | | |
| Whiting Petroleum Corp. (a) | | | 646 | | | | 61,699 | | |
| Williams Companies, Inc. | | | 13,600 | | | | 259,896 | | |
| World Fuel Services Corp. | | | 1,885 | | | | 49,029 | | |
Yanzhou Coal Mining Co., Ltd.,
Class H | | | 44,000 | | | | 107,314 | | |
| Oil, Gas & Consumable Fuels Total | | | 11,011,283 | | |
| Energy Total | | | 15,292,271 | | |
| Financials – 9.3% | |
| Capital Markets – 1.2% | |
| Affiliated Managers Group, Inc. (a) | | | 1,500 | | | | 117,015 | | |
Credit Suisse Group AG,
Registered Shares | | | 2,529 | | | | 108,312 | | |
Deutsche Bank AG, Registered
Shares | | | 2,177 | | | | 118,980 | | |
| Federated Investors, Inc., Class B | | | 463 | | | | 10,538 | | |
| Franklin Resources, Inc. | | | 3,900 | | | | 416,910 | | |
| GFI Group, Inc. | | | 2,995 | | | | 13,897 | | |
| Goldman Sachs Group, Inc. | | | 4,400 | | | | 636,152 | | |
| ICAP PLC | | | 15,225 | | | | 103,396 | | |
| Intermediate Capital Group PLC | | | 29,590 | | | | 139,189 | | |
International Assets Holding
Corp. (a) | | | 1,180 | | | | 21,358 | | |
Investment Technology
Group, Inc. (a) | | | 1,598 | | | | 22,723 | | |
Knight Capital Group, Inc.,
Class A (a) | | | 2,230 | | | | 27,630 | | |
| Mass Financial Corp., Class A (a) | | | 1,289 | | | | 9,603 | | |
| Morgan Stanley | | | 14,150 | | | | 349,222 | | |
| optionsXpress Holdings, Inc. (a) | | | 1,110 | | | | 17,050 | | |
| Piper Jaffray Companies, Inc. (a) | | | 658 | | | | 19,167 | | |
| Raymond James Financial, Inc. | | | 2,100 | | | | 53,193 | | |
| Stifel Financial Corp. (a) | | | 690 | | | | 31,940 | | |
| T. Rowe Price Group, Inc. | | | 5,090 | | | | 254,831 | | |
| TD Ameritrade Holding Corp. (a) | | | 4,400 | | | | 71,060 | | |
Tokai Tokyo Financial
Holdings, Inc. | | | 21,000 | | | | 69,187 | | |
| Capital Markets Total | | | 2,611,353 | | |
| Commercial Banks – 2.9% | |
| Ameris Bancorp (a) | | | 1,893 | | | | 17,699 | | |
Australia & New Zealand
Banking Group Ltd. | | | 10,964 | | | | 250,953 | | |
| BancFirst Corp. | | | 516 | | | | 20,877 | | |
Banco Bilbao Vizcaya
Argentaria SA | | | 15,617 | | | | 211,495 | | |
| | | Shares | | Value ($) | |
| Banco Santander SA | | | 25,245 | | | | 319,847 | | |
| BancTrust Financial Group, Inc. (a) | | | 1,398 | | | | 4,278 | | |
| Bank of China Ltd., Class H | | | 193,000 | | | | 101,537 | | |
| BB&T Corp. | | | 4,800 | | | | 115,584 | | |
| BNP Paribas | | | 3,294 | | | | 235,393 | | |
| Bryn Mawr Bank Corp. | | | 1,134 | | | | 19,527 | | |
| Center Financial Corp. (a) | | | 4,540 | | | | 23,109 | | |
| Chemical Financial Corp. | | | 1,270 | | | | 26,213 | | |
| CIT Group, Inc. (a) | | | 8,500 | | | | 346,970 | | |
| City National Corp. | | | 1,400 | | | | 74,298 | | |
| Columbia Banking System, Inc. | | | 1,339 | | | | 26,311 | | |
| Comerica, Inc. | | | 2,300 | | | | 85,445 | | |
| Community Trust Bancorp, Inc. | | | 818 | | | | 22,160 | | |
| Cullen/Frost Bankers, Inc. | | | 1,400 | | | | 75,418 | | |
| Fifth Third Bancorp. | | | 33,800 | | | | 406,614 | | |
First Citizens BancShares, Inc.,
Class A | | | 173 | | | | 32,052 | | |
First Commonwealth Financial
Corp. | | | 4,502 | | | | 24,536 | | |
| First Financial Corp. of Indiana | | | 899 | | | | 26,520 | | |
| First National Bank of Alaska | | | 9 | | | | 17,064 | | |
Governor & Co. of the Bank of
Ireland (a) | | | 119,993 | | | | 101,911 | | |
| Hancock Holding Co. | | | 691 | | | | 20,778 | | |
| HSBC Holdings PLC | | | 19,145 | | | | 193,882 | | |
| Huntington Bancshares, Inc. | | | 18,300 | | | | 103,761 | | |
| Investors Bancorp, Inc. (a) | | | 1,382 | | | | 16,363 | | |
| Merchants Bancshares, Inc. | | | 814 | | | | 20,301 | | |
| National Bank of Greece SA (a) | | | 7,719 | | | | 75,118 | | |
| Northfield Bancorp, Inc. | | | 1,219 | | | | 13,190 | | |
| Northrim BanCorp, Inc. | | | 984 | | | | 16,334 | | |
| PNC Financial Services Group, Inc. | | | 9,546 | | | | 495,533 | | |
| Signature Bank (a) | | | 1,370 | | | | 53,211 | | |
Sumitomo Mitsui Financial
Group, Inc. | | | 7,300 | | | | 213,016 | | |
| SunTrust Banks, Inc. | | | 8,750 | | | | 226,012 | | |
| SVB Financial Group (a) | | | 2,108 | | | | 89,211 | | |
Svenska Handelsbanken AB,
Class A | | | 4,909 | | | | 161,095 | | |
| TCF Financial Corp. | | | 3,199 | | | | 51,792 | | |
| U.S. Bancorp | | | 29,039 | | | | 627,823 | | |
| Wells Fargo & Co. | | | 45,566 | | | | 1,145,074 | | |
| West Coast Bancorp (a) | | | 5,620 | | | | 12,814 | | |
| Zions Bancorporation | | | 5,425 | | | | 115,878 | | |
| Commercial Banks Total | | | 6,236,997 | | |
| Consumer Finance – 0.7% | |
| American Express Co. | | | 27,150 | | | | 1,141,114 | | |
| Cash America International, Inc. | | | 800 | | | | 28,000 | | |
| Discover Financial Services | | | 9,389 | | | | 156,609 | | |
| Ezcorp, Inc., Class A (a) | | | 1,385 | | | | 27,755 | | |
| Consumer Finance Total | | | 1,353,478 | | |
See Accompanying Notes to Financial Statements.
31
Columbia Asset Allocation Fund
September 30, 2010
| Common Stocks (continued) | |
| | | Shares | | Value ($) | |
| Diversified Financial Services – 1.2% | |
| Citigroup, Inc. (a) | | | 93,200 | | | | 363,480 | | |
| ING Groep NV (a) | | | 17,466 | | | | 180,383 | | |
| IntercontinentalExchange, Inc. (a) | | | 5,180 | | | | 542,450 | | |
| JPMorgan Chase & Co. | | | 35,703 | | | | 1,359,213 | | |
| Medallion Financial Corp. | | | 1,334 | | | | 10,392 | | |
| Moody's Corp. | | | 1,280 | | | | 31,974 | | |
| MSCI, Inc., Class A (a) | | | 1,270 | | | | 42,177 | | |
| Pico Holdings, Inc. (a) | | | 400 | | | | 11,944 | | |
| Portfolio Recovery Associates, Inc. (a) | | | 395 | | | | 25,537 | | |
| Diversified Financial Services Total | | | 2,567,550 | | |
| Insurance – 2.1% | |
| ACE Ltd. | | | 13,420 | | | | 781,715 | | |
| Allianz SE, Registered Shares | | | 1,079 | | | | 121,810 | | |
Allied World Assurance Holdings
Ltd. | | | 320 | | | | 18,109 | | |
American Safety Insurance
Holdings Ltd. (a) | | | 1,240 | | | | 20,262 | | |
Argo Group International
Holdings Ltd. | | | 740 | | | | 25,708 | | |
| Assured Guaranty Ltd. | | | 4,300 | | | | 73,573 | | |
| Axis Capital Holdings Ltd. | | | 15,532 | | | | 511,624 | | |
| Baldwin & Lyons, Inc., Class B | | | 790 | | | | 20,105 | | |
| Brit Insurance Holdings NV (a) | | | 8,926 | | | | 143,802 | | |
| CNA Surety Corp. (a) | | | 1,480 | | | | 26,522 | | |
| eHealth, Inc. (a) | | | 2,247 | | | | 29,031 | | |
| EMC Insurance Group, Inc. | | | 881 | | | | 18,783 | | |
| FBL Financial Group, Inc., Class A | | | 972 | | | | 25,252 | | |
| First Mercury Financial Corp. | | | 1,936 | | | | 19,515 | | |
| Global Indemnity PLC (a) | | | 2,478 | | | | 39,772 | | |
| Hanover Insurance Group, Inc. | | | 340 | | | | 15,980 | | |
| Harleysville Group, Inc. | | | 440 | | | | 14,428 | | |
| Horace Mann Educators Corp. | | | 1,851 | | | | 32,911 | | |
| Lincoln National Corp. | | | 4,257 | | | | 101,827 | | |
| MetLife, Inc. | | | 19,279 | | | | 741,277 | | |
National Western Life Insurance
Co., Class A | | | 97 | | | | 13,646 | | |
| Navigators Group, Inc. (a) | | | 644 | | | | 28,742 | | |
| Prudential Financial, Inc. | | | 12,719 | | | | 689,115 | | |
| Reinsurance Group of America, Inc. | | | 1,700 | | | | 82,093 | | |
| Safety Insurance Group, Inc. | | | 690 | | | | 28,994 | | |
| Sampo OYJ, Class A | | | 7,364 | | | | 199,051 | | |
| Stewart Information Services Corp. | | | 1,210 | | | | 13,697 | | |
| United Fire & Casualty Co. | | | 1,459 | | | | 30,945 | | |
| XL Group PLC (c) | | | 18,080 | | | | 391,613 | | |
Zurich Financial Services AG,
Registered Shares | | | 848 | | | | 198,903 | | |
| Insurance Total | | | 4,458,805 | | |
| | | Shares | | Value ($) | |
| Real Estate Investment Trusts (REITs) – 0.9% | |
Alexandria Real Estate Equities,
Inc. | | | 1,000 | | | | 70,000 | | |
| Boston Properties, Inc. | | | 950 | | | | 78,964 | | |
| Chesapeake Lodging Trust | | | 268 | | | | 4,385 | | |
| DCT Industrial Trust, Inc. | | | 4,684 | | | | 22,436 | | |
| DiamondRock Hospitality Co. (a) | | | 2,858 | | | | 27,122 | | |
| Digital Realty Trust, Inc. | | | 810 | | | | 49,977 | | |
| Equity Residential Property Trust | | | 7,900 | | | | 375,803 | | |
| FelCor Lodging Trust, Inc. (a) | | | 3,962 | | | | 18,225 | | |
| Franklin Street Properties Corp. | | | 1,474 | | | | 18,307 | | |
| Getty Realty Corp. | | | 680 | | | | 18,244 | | |
| Host Hotels & Resorts, Inc. | | | 3,897 | | | | 56,429 | | |
| Japan Retail Fund Investment Corp. | | | 123 | | | | 173,339 | | |
| National Health Investors, Inc. | | | 503 | | | | 22,162 | | |
| Nationwide Health Properties, Inc. | | | 900 | | | | 34,803 | | |
| Plum Creek Timber Co., Inc. | | | 1,030 | | | | 36,359 | | |
| Potlatch Corp. | | | 799 | | | | 27,166 | | |
| ProLogis | | | 11,700 | | | | 137,826 | | |
| Rayonier, Inc. | | | 7,850 | | | | 393,442 | | |
| Starwood Property Trust, Inc. | | | 1,430 | | | | 28,414 | | |
| Sunstone Hotel Investors, Inc. (a) | | | 1,716 | | | | 15,564 | | |
| Tanger Factory Outlet Centers | | | 615 | | | | 28,991 | | |
| Taubman Centers, Inc. | | | 1,300 | | | | 57,993 | | |
| Terreno Realty Corp. (a) | | | 990 | | | | 18,038 | | |
Universal Health Realty Income
Trust | | | 550 | | | | 18,926 | | |
Urstadt Biddle Properties, Inc.,
Class A | | | 1,120 | | | | 20,250 | | |
| Vornado Realty Trust | | | 402 | | | | 34,383 | | |
| Weyerhaeuser Co. | | | 10,370 | | | | 163,431 | | |
| Real Estate Investment Trusts (REITs) Total | | | 1,950,979 | | |
| Real Estate Management & Development – 0.2% | |
| Avatar Holdings, Inc. (a) | | | 887 | | | | 16,924 | | |
CB Richard Ellis Group, Inc.,
Class A (a) | | | 2,200 | | | | 40,216 | | |
| Hongkong Land Holdings Ltd. | | | 24,000 | | | | 149,171 | | |
| Huaku Development Co., Ltd. | | | 63,875 | | | | 176,263 | | |
| Swire Pacific Ltd., Class A | | | 7,000 | | | | 96,191 | | |
| Real Estate Management & Development Total | | | 478,765 | | |
| Thrifts & Mortgage Finance – 0.1% | |
| Bank Mutual Corp. | | | 4,025 | | | | 20,890 | | |
| BankFinancial Corp. | | | 2,489 | | | | 22,824 | | |
| Beneficial Mutual Bancorp, Inc. (a) | | | 2,581 | | | | 23,152 | | |
| Brookline Bancorp, Inc. | | | 2,834 | | | | 28,283 | | |
| Clifton Savings Bancorp, Inc. | | | 1,540 | | | | 13,244 | | |
| ESSA Bancorp, Inc. | | | 1,299 | | | | 15,380 | | |
| Home Federal Bancorp, Inc. | | | 1,947 | | | | 23,695 | | |
| MGIC Investment Corp. (a) | | | 1,972 | | | | 18,202 | | |
See Accompanying Notes to Financial Statements.
32
Columbia Asset Allocation Fund
September 30, 2010
| Common Stocks (continued) | |
| | | Shares | | Value ($) | |
| People's United Financial, Inc. | | | 2,200 | | | | 28,798 | | |
| TrustCo Bank Corp. NY | | | 2,580 | | | | 14,345 | | |
| United Financial Bancorp, Inc. | | | 1,199 | | | | 16,198 | | |
| Washington Federal, Inc. | | | 1,260 | | | | 19,228 | | |
| Westfield Financial, Inc. | | | 2,623 | | | | 20,459 | | |
| Thrifts & Mortgage Finance Total | | | 264,698 | | |
| Financials Total | | | 19,922,625 | | |
| Health Care – 5.8% | |
| Biotechnology – 0.8% | |
| Acorda Therapeutics, Inc. (a) | | | 690 | | | | 22,784 | | |
| Alexion Pharmaceuticals, Inc. (a) | | | 4,798 | | | | 308,799 | | |
| Amgen, Inc. (a) | | | 12,369 | | | | 681,656 | | |
| Celgene Corp. (a) | | | 8,250 | | | | 475,282 | | |
| Cubist Pharmaceuticals, Inc. (a) | | | 1,060 | | | | 24,793 | | |
| Dendreon Corp. (a) | | | 3,940 | | | | 162,249 | | |
| Halozyme Therapeutics, Inc. (a) | | | 2,375 | | | | 18,311 | | |
| Human Genome Sciences, Inc. (a) | | | 2,098 | | | | 62,499 | | |
| Ironwood Pharmaceuticals, Inc. (a) | | | 1,705 | | | | 17,357 | | |
| Martek Biosciences Corp. (a) | | | 720 | | | | 16,294 | | |
| Momenta Pharmaceuticals, Inc. (a) | | | 115 | | | | 1,731 | | |
| Onyx Pharmaceuticals, Inc. (a) | | | 2,415 | | | | 63,708 | | |
| Biotechnology Total | | | 1,855,463 | | |
| Health Care Equipment & Supplies – 0.8% | |
| Analogic Corp. | | | 330 | | | | 14,810 | | |
| Angiodynamics, Inc. (a) | | | 940 | | | | 14,326 | | |
| Cantel Medical Corp. | | | 956 | | | | 15,487 | | |
| Cooper Companies, Inc. | | | 700 | | | | 32,354 | | |
| Cutera, Inc. (a) | | | 1,535 | | | | 12,434 | | |
| DexCom, Inc. (a) | | | 1,720 | | | | 22,738 | | |
| Edwards Lifesciences Corp. (a) | | | 3,300 | | | | 221,265 | | |
| Gen-Probe, Inc. (a) | | | 690 | | | | 33,437 | | |
| ICU Medical, Inc. (a) | | | 1,033 | | | | 38,521 | | |
| Insulet Corp. (a) | | | 1,610 | | | | 22,765 | | |
| Intuitive Surgical, Inc. (a) | | | 160 | | | | 45,399 | | |
| Kensey Nash Corp. (a) | | | 743 | | | | 21,465 | | |
| Masimo Corp. | | | 2,006 | | | | 54,784 | | |
| Medical Action Industries, Inc. (a) | | | 1,440 | | | | 13,032 | | |
| NuVasive, Inc. (a) | | | 2,731 | | | | 95,967 | | |
| St. Jude Medical, Inc. (a) | | | 10,700 | | | | 420,938 | | |
| Symmetry Medical, Inc. (a) | | | 1,710 | | | | 16,484 | | |
| Syneron Medical Ltd. (a) | | | 1,340 | | | | 13,293 | | |
| Teleflex, Inc. | | | 1,200 | | | | 68,136 | | |
| Thoratec Corp. (a) | | | 1,905 | | | | 70,447 | | |
| Varian Medical Systems, Inc. (a) | | | 4,650 | | | | 281,325 | | |
| Young Innovations, Inc. | | | 436 | | | | 12,474 | | |
| Zimmer Holdings, Inc. (a) | | | 4,300 | | | | 225,019 | | |
| Health Care Equipment & Supplies Total | | | 1,766,900 | | |
| | | Shares | | Value ($) | |
| Health Care Providers & Services – 1.4% | |
| AmSurg Corp. (a) | | | 929 | | | | 16,239 | | |
| Brookdale Senior Living, Inc. (a) | | | 3,920 | | | | 63,935 | | |
| Cardinal Health, Inc. | | | 9,750 | | | | 322,140 | | |
| Catalyst Health Solutions, Inc. (a) | | | 808 | | | | 28,450 | | |
| Centene Corp. (a) | | | 580 | | | | 13,682 | | |
| CIGNA Corp. | | | 1,700 | | | | 60,826 | | |
| Community Health Systems, Inc. (a) | | | 1,400 | | | | 43,358 | | |
| Express Scripts, Inc. (a) | | | 9,020 | | | | 439,274 | | |
| Healthspring, Inc. (a) | | | 1,484 | | | | 38,347 | | |
| HMS Holdings Corp. (a) | | | 590 | | | | 34,775 | | |
| Humana, Inc. (a) | | | 1,100 | | | | 55,264 | | |
| IPC The Hospitalist Co., Inc. (a) | | | 1,725 | | | | 47,127 | | |
| Kindred Healthcare, Inc. (a) | | | 1,500 | | | | 19,530 | | |
Laboratory Corp. of America
Holdings (a) | | | 1,100 | | | | 86,273 | | |
| LHC Group, Inc. (a) | | | 890 | | | | 20,639 | | |
| Magellan Health Services, Inc. (a) | | | 480 | | | | 22,675 | | |
| Medcath Corp. (a) | | | 1,740 | | | | 17,522 | | |
| Medco Health Solutions, Inc. (a) | | | 8,100 | | | | 421,686 | | |
| Mednax, Inc. (a) | | | 1,670 | | | | 89,011 | | |
| Miraca Holdings, Inc. | | | 4,900 | | | | 173,454 | | |
| NovaMed, Inc. (a) | | | 998 | | | | 9,671 | | |
| Owens & Minor, Inc. | | | 600 | | | | 17,076 | | |
| Patterson Companies, Inc. | | | 1,470 | | | | 42,115 | | |
| PSS World Medical, Inc. (a) | | | 1,295 | | | | 27,687 | | |
Triple-S Management Corp.,
Class B (a) | | | 820 | | | | 13,817 | | |
| U.S. Physical Therapy, Inc. (a) | | | 800 | | | | 13,376 | | |
| UnitedHealth Group, Inc. | | | 14,750 | | | | 517,872 | | |
Universal Health Services, Inc.,
Class B | | | 8,600 | | | | 334,196 | | |
| Health Care Providers & Services Total | | | 2,990,017 | | |
| Health Care Technology – 0.1% | |
| Cerner Corp. (a) | | | 490 | | | | 41,155 | | |
| Medidata Solutions, Inc. (a) | | | 1,300 | | | | 24,960 | | |
| Omnicell, Inc. (a) | | | 3,044 | | | | 39,816 | | |
| Quality Systems, Inc. | | | 455 | | | | 30,171 | | |
| Health Care Technology Total | | | 136,102 | | |
| Life Sciences Tools & Services – 0.9% | |
| ICON PLC, ADR (a) | | | 3,490 | | | | 75,454 | | |
| Illumina, Inc. (a) | | | 1,880 | | | | 92,496 | | |
| Life Technologies Corp. (a) | | | 17,930 | | | | 837,152 | | |
| Mettler-Toledo International, Inc. (a) | | | 275 | | | | 34,221 | | |
| Thermo Fisher Scientific, Inc. (a) | | | 18,433 | | | | 882,572 | | |
| Life Sciences Tools & Services Total | | | 1,921,895 | | |
| Pharmaceuticals – 1.8% | |
| Allergan, Inc. | | | 7,300 | | | | 485,669 | | |
| Ardea Biosciences, Inc. (a) | | | 1,015 | | | | 23,345 | | |
See Accompanying Notes to Financial Statements.
33
Columbia Asset Allocation Fund
September 30, 2010
| Common Stocks (continued) | |
| | | Shares | | Value ($) | |
| AstraZeneca PLC, ADR | | | 5,524 | | | | 280,067 | | |
| Auxilium Pharmaceuticals, Inc. (a) | | | 880 | | | | 21,806 | | |
| GlaxoSmithKline PLC | | | 8,456 | | | | 166,825 | | |
| GlaxoSmithKline PLC, ADR | | | 7,200 | | | | 284,544 | | |
| Impax Laboratories, Inc. (a) | | | 2,260 | | | | 44,748 | | |
| MAP Pharmaceuticals, Inc. (a) | | | 1,150 | | | | 17,595 | | |
Medicis Pharmaceutical Corp.,
Class A | | | 4,550 | | | | 134,907 | | |
| Merck & Co., Inc. | | | 10,212 | | | | 375,904 | | |
| Mylan, Inc. (a) | | | 14,950 | | | | 281,209 | | |
| Novartis AG, Registered Shares | | | 1,999 | | | | 115,190 | | |
| Pfizer, Inc. | | | 32,300 | | | | 554,591 | | |
Roche Holding AG, Genusschein
Shares | | | 1,857 | | | | 253,555 | | |
| Salix Pharmaceuticals Ltd. (a) | | | 1,205 | | | | 47,863 | | |
| Sanofi-Aventis SA | | | 4,233 | | | | 282,475 | | |
| Santen Pharmaceutical Co., Ltd. | | | 3,500 | | | | 121,276 | | |
| Watson Pharmaceuticals, Inc. (a) | | | 8,430 | | | | 356,673 | | |
| Pharmaceuticals Total | | | 3,848,242 | | |
| Health Care Total | | | 12,518,619 | | |
| Industrials – 7.0% | |
| Aerospace & Defense – 1.5% | |
| AAR Corp. (a) | | | 742 | | | | 13,846 | | |
| AerCap Holdings NV (a) | | | 4,978 | | | | 58,890 | | |
| BAE Systems PLC | | | 35,236 | | | | 189,671 | | |
| BE Aerospace, Inc. (a) | | | 1,060 | | | | 32,129 | | |
| Ceradyne, Inc. (a) | | | 865 | | | | 20,198 | | |
| Esterline Technologies Corp. (a) | | | 340 | | | | 19,458 | | |
| General Dynamics Corp. | | | 5,000 | | | | 314,050 | | |
Global Defense Technology &
Systems, Inc. (a) | | | 1,290 | | | | 17,673 | | |
| Goodrich Corp. | | | 5,250 | | | | 387,082 | | |
| Honeywell International, Inc. | | | 6,200 | | | | 272,428 | | |
| ITT Corp. | | | 630 | | | | 29,503 | | |
| L-3 Communications Holdings, Inc. | | | 400 | | | | 28,908 | | |
| Ladish Co., Inc. (a) | | | 810 | | | | 25,215 | | |
| LMI Aerospace, Inc. (a) | | | 2,095 | | | | 33,352 | | |
| MTU Aero Engines Holding AG | | | 1,961 | | | | 112,156 | | |
| Precision Castparts Corp. | | | 2,950 | | | | 375,683 | | |
Spirit Aerosystems Holdings, Inc.,
Class A (a) | | | 1,400 | | | | 27,902 | | |
| United Technologies Corp. | | | 16,030 | | | | 1,141,817 | | |
| Aerospace & Defense Total | | | 3,099,961 | | |
| Air Freight & Logistics – 0.5% | |
Atlas Air Worldwide Holdings,
Inc. (a) | | | 1,462 | | | | 73,539 | | |
| C.H. Robinson Worldwide, Inc. | | | 950 | | | | 66,424 | | |
| Forward Air Corp. | | | 995 | | | | 25,870 | | |
| | | Shares | | Value ($) | |
| Pacer International, Inc. (a) | | | 2,183 | | | | 13,185 | | |
| United Parcel Service, Inc., Class B | | | 12,150 | | | | 810,283 | | |
| Air Freight & Logistics Total | | | 989,301 | | |
| Airlines – 0.1% | |
| Alaska Air Group, Inc. (a) | | | 560 | | | | 28,577 | | |
| Delta Air Lines, Inc. (a) | | | 6,990 | | | | 81,364 | | |
| Skywest, Inc. | | | 970 | | | | 13,541 | | |
| Turk Hava Yollari A.O. (a) | | | 26,116 | | | | 106,403 | | |
| United Continental Holdings, Inc. | | | 1,530 | | | | 36,154 | | |
| Airlines Total | | | 266,039 | | |
| Building Products – 0.0% | |
| A.O. Smith Corp. | | | 320 | | | | 18,525 | | |
| Ameron International Corp. | | | 327 | | | | 22,223 | | |
| Lennox International, Inc. | | | 350 | | | | 14,591 | | |
| Universal Forest Products, Inc. | | | 490 | | | | 14,333 | | |
| Building Products Total | | | 69,672 | | |
| Commercial Services & Supplies – 0.3% | |
| ABM Industries, Inc. | | | 740 | | | | 15,977 | | |
| ACCO Brands Corp. (a) | | | 810 | | | | 4,658 | | |
| Aeon Delight Co., Ltd. | | | 6,800 | | | | 127,400 | | |
| Consolidated Graphics, Inc. (a) | | | 520 | | | | 21,554 | | |
| Ennis, Inc. | | | 943 | | | | 16,870 | | |
| G&K Services, Inc., Class A | | | 649 | | | | 14,836 | | |
| Republic Services, Inc. | | | 11,000 | | | | 335,390 | | |
| Stericycle, Inc. (a) | | | 490 | | | | 34,045 | | |
| Tetra Tech, Inc. (a) | | | 1,865 | | | | 39,109 | | |
| United Stationers, Inc. (a) | | | 410 | | | | 21,939 | | |
| Commercial Services & Supplies Total | | | 631,778 | | |
| Construction & Engineering – 0.5% | |
| Comfort Systems USA, Inc. | | | 1,362 | | | | 14,614 | | |
| CTCI Corp. | | | 113,000 | | | | 124,174 | | |
| Dycom Industries, Inc. (a) | | | 1,850 | | | | 18,482 | | |
| EMCOR Group, Inc. (a) | | | 1,070 | | | | 26,311 | | |
| Fluor Corp. | | | 6,600 | | | | 326,898 | | |
| Foster Wheeler AG (a) | | | 12,500 | | | | 305,750 | | |
| Great Lakes Dredge & Dock Corp. | | | 4,185 | | | | 24,315 | | |
| KBR, Inc. | | | 860 | | | | 21,190 | | |
KHD Humboldt Wedag
International AG | | | 899 | | | | 7,343 | | |
| Layne Christensen Co. (a) | | | 660 | | | | 17,087 | | |
| Maire Tecnimont SpA | | | 35,451 | | | | 141,268 | | |
| Pike Electric Corp. (a) | | | 2,952 | | | | 21,491 | | |
| Sterling Construction Co., Inc. (a) | | | 3,078 | | | | 38,106 | | |
| Construction & Engineering Total | | | 1,087,029 | | |
| Electrical Equipment – 0.3% | |
| AMETEK, Inc. | | | 1,310 | | | | 62,579 | | |
| Baldor Electric Co. | | | 1,485 | | | | 59,994 | | |
| Belden, Inc. | | | 730 | | | | 19,257 | | |
See Accompanying Notes to Financial Statements.
34
Columbia Asset Allocation Fund
September 30, 2010
| Common Stocks (continued) | |
| | | Shares | | Value ($) | |
| Broadwind Energy, Inc. (a) | | | 9,393 | | | | 17,565 | | |
| Cooper Industries PLC, Class A | | | 1,400 | | | | 68,502 | | |
| GrafTech International Ltd. (a) | | | 1,326 | | | | 20,725 | | |
| Mitsubishi Electric Corp. | | | 19,000 | | | | 163,879 | | |
| Schneider Electric SA | | | 1,332 | | | | 169,243 | | |
| Electrical Equipment Total | | | 581,744 | | |
| Industrial Conglomerates – 0.9% | |
| 3M Co. | | | 7,900 | | | | 685,009 | | |
| DCC PLC | | | 4,817 | | | | 137,949 | | |
| General Electric Co. | | | 39,629 | | | | 643,971 | | |
| Tyco International Ltd. | | | 10,234 | | | | 375,895 | | |
| Industrial Conglomerates Total | | | 1,842,824 | | |
| Machinery – 2.0% | |
| AGCO Corp. (a) | | | 910 | | | | 35,499 | | |
| ArvinMeritor, Inc. (a) | | | 9,535 | | | | 148,174 | | |
| Astec Industries, Inc. (a) | | | 595 | | | | 16,975 | | |
| Bucyrus International, Inc. | | | 1,480 | | | | 102,638 | | |
| CIRCOR International, Inc. | | | 490 | | | | 15,484 | | |
| Columbus McKinnon Corp. (a) | | | 1,900 | | | | 31,521 | | |
| Crane Co. | | | 900 | | | | 34,146 | | |
| Cummins, Inc. | | | 5,600 | | | | 507,248 | | |
| Deere & Co. | | | 5,600 | | | | 390,768 | | |
| Demag Cranes AG (a) | | | 2,803 | | | | 107,527 | | |
| Dover Corp. | | | 7,850 | | | | 409,848 | | |
| Eaton Corp. | | | 1,200 | | | | 98,988 | | |
| EnPro Industries, Inc. (a) | | | 700 | | | | 21,896 | | |
| Flowserve Corp. | | | 2,750 | | | | 300,905 | | |
| FreightCar America, Inc. | | | 567 | | | | 13,948 | | |
| Harsco Corp. | | | 470 | | | | 11,553 | | |
| Illinois Tool Works, Inc. | | | 8,600 | | | | 404,372 | | |
| Ingersoll-Rand PLC | | | 21,450 | | | | 765,979 | | |
| Kadant, Inc. (a) | | | 988 | | | | 18,683 | | |
| Kennametal, Inc. | | | 5,100 | | | | 157,743 | | |
| LB Foster Co., Class A (a) | | | 497 | | | | 14,383 | | |
| Lindsay Corp. | | | 480 | | | | 20,794 | | |
| Mueller Industries, Inc. | | | 800 | | | | 21,192 | | |
| Navistar International Corp. (a) | | | 4,011 | | | | 175,040 | | |
| Nordson Corp. | | | 285 | | | | 21,002 | | |
| Pall Corp. | | | 980 | | | | 40,807 | | |
| Parker Hannifin Corp. | | | 6,100 | | | | 427,366 | | |
| Robbins & Myers, Inc. | | | 1,820 | | | | 48,740 | | |
| Tennant Co. | | | 815 | | | | 25,184 | | |
| Machinery Total | | | 4,388,403 | | |
| Marine – 0.0% | |
| Diana Shipping, Inc. (a) | | | 1,070 | | | | 13,589 | | |
| Marine Total | | | 13,589 | | |
| Professional Services – 0.4% | |
| Advisory Board Co. (a) | | | 808 | | | | 35,673 | | |
| Atkins WS PLC | | | 12,910 | | | | 149,382 | | |
| | | Shares | | Value ($) | |
| CDI Corp. | | | 981 | | | | 12,675 | | |
| FTI Consulting, Inc. (a) | | | 380 | | | | 13,182 | | |
| IHS, Inc., Class A (a) | | | 590 | | | | 40,120 | | |
| Kforce, Inc. (a) | | | 889 | | | | 12,197 | | |
| Korn/Ferry International (a) | | | 3,309 | | | | 54,731 | | |
| LECG Corp. (a) | | | 1,975 | | | | 2,172 | | |
| Manpower, Inc. | | | 8,493 | | | | 443,335 | | |
| Navigant Consulting, Inc. (a) | | | 1,010 | | | | 11,746 | | |
| Professional Services Total | | | 775,213 | | |
| Road & Rail – 0.2% | |
| Canadian Pacific Railway Ltd. | | | 500 | | | | 30,465 | | |
| Con-way, Inc. | | | 921 | | | | 28,542 | | |
Dollar Thrifty Automotive Group,
Inc. (a) | | | 550 | | | | 27,577 | | |
Genesee & Wyoming, Inc.,
Class A (a) | | | 660 | | | | 28,637 | | |
| Heartland Express, Inc. | | | 970 | | | | 14,424 | | |
| Hertz Global Holdings, Inc. (a) | | | 2,900 | | | | 30,711 | | |
| Kansas City Southern (a) | | | 1,430 | | | | 53,496 | | |
| Landstar System, Inc. | | | 1,730 | | | | 66,813 | | |
| Old Dominion Freight Line, Inc. (a) | | | 2,912 | | | | 74,023 | | |
Roadrunner Transportation
Systems, Inc. (a) | | | 2,342 | | | | 25,387 | | |
| Ryder System, Inc. | | | 400 | | | | 17,108 | | |
| Union Pacific Corp. | | | 813 | | | | 66,504 | | |
| Werner Enterprises, Inc. | | | 1,320 | | | | 27,047 | | |
| Road & Rail Total | | | 490,734 | | |
| Trading Companies & Distributors – 0.3% | |
| Applied Industrial Technologies, Inc. | | | 660 | | | | 20,196 | | |
| Beacon Roofing Supply, Inc. (a) | | �� | 1,430 | | | | 20,835 | | |
| Fastenal Co. | | | 810 | | | | 43,084 | | |
| ITOCHU Corp. | | | 15,000 | | | | 137,641 | | |
| Kaman Corp. | | | 761 | | | | 19,946 | | |
| Kloeckner & Co., SE (a) | | | 4,545 | | | | 102,296 | | |
| Mitsui & Co., Ltd. | | | 9,000 | | | | 133,910 | | |
| W.W. Grainger, Inc. | | | 1,800 | | | | 214,398 | | |
| Trading Companies & Distributors Total | | | 692,306 | | |
| Industrials Total | | | 14,928,593 | | |
| Information Technology – 9.0% | |
| Communications Equipment – 0.9% | |
| Anaren, Inc. (a) | | | 952 | | | | 15,984 | | |
| Aruba Networks, Inc. (a) | | | 2,855 | | | | 60,926 | | |
| Bel Fuse, Inc., Class B | | | 549 | | | | 11,430 | | |
| Black Box Corp. | | | 597 | | | | 19,140 | | |
Brocade Communications Systems,
Inc. (a) | | | 6,200 | | | | 36,208 | | |
| Cisco Systems, Inc. (a) | | | 37,045 | | | | 811,286 | | |
| CommScope, Inc. (a) | | | 1,000 | | | | 23,740 | | |
See Accompanying Notes to Financial Statements.
35
Columbia Asset Allocation Fund
September 30, 2010
| Common Stocks (continued) | |
| | | Shares | | Value ($) | |
| F5 Networks, Inc. (a) | | | 630 | | | | 65,400 | | |
| Infinera Corp. (a) | | | 2,835 | | | | 33,084 | | |
| Plantronics, Inc. | | | 570 | | | | 19,255 | | |
| QUALCOMM, Inc. | | | 15,500 | | | | 699,360 | | |
| Symmetricom, Inc. (a) | | | 2,420 | | | | 13,842 | | |
| Tekelec (a) | | | 1,350 | | | | 17,496 | | |
| Communications Equipment Total | | | 1,827,151 | | |
| Computers & Peripherals – 1.8% | |
| Apple, Inc. (a) | | | 6,550 | | | | 1,858,562 | | |
| Diebold, Inc. | | | 2,000 | | | | 62,180 | | |
| EMC Corp. (a) | | | 49,300 | | | | 1,001,283 | | |
| Hewlett-Packard Co. | | | 20,553 | | | | 864,665 | | |
| NetApp, Inc. (a) | | | 1,320 | | | | 65,723 | | |
| SanDisk Corp. (a) | | | 2,650 | | | | 97,122 | | |
| Super Micro Computer, Inc. (a) | | | 1,435 | | | | 14,910 | | |
| Computers & Peripherals Total | | | 3,964,445 | | |
| Electronic Equipment, Instruments & Components – 0.7% | |
| Agilent Technologies, Inc. (a) | | | 3,080 | | | | 102,780 | | |
| Anixter International, Inc. (a) | | | 441 | | | | 23,810 | | |
| Arrow Electronics, Inc. (a) | | | 2,000 | | | | 53,460 | | |
| Benchmark Electronics, Inc. (a) | | | 1,501 | | | | 24,616 | | |
| Brightpoint, Inc. (a) | | | 2,156 | | | | 15,070 | | |
| Corning, Inc. | | | 15,200 | | | | 277,856 | | |
| CTS Corp. | | | 1,553 | | | | 14,940 | | |
| DTS, Inc. (a) | | | 1,185 | | | | 45,231 | | |
| Electro Scientific Industries, Inc. (a) | | | 1,080 | | | | 11,999 | | |
| FUJIFILM Holdings Corp. | | | 4,600 | | | | 152,762 | | |
| Halma PLC | | | 23,120 | | | | 115,101 | | |
| Littelfuse, Inc. (a) | | | 425 | | | | 18,572 | | |
| Methode Electronics, Inc. | | | 1,584 | | | | 14,383 | | |
| Molex, Inc. | | | 3,100 | | | | 64,883 | | |
| MTS Systems Corp. | | | 520 | | | | 16,120 | | |
| Murata Manufacturing Co., Ltd. | | | 2,700 | | | | 142,337 | | |
| NAM TAI Electronics, Inc. (a) | | | 3,051 | | | | 14,096 | | |
| Tyco Electronics Ltd. | | | 16,400 | | | | 479,208 | | |
Electronic Equipment, Instruments &
Components Total | | | 1,587,224 | | |
| Internet Software & Services – 1.0% | |
| Akamai Technologies, Inc. (a) | | | 6,660 | | | | 334,199 | | |
| Baidu, Inc., ADR (a) | | | 600 | | | | 61,572 | | |
| Google, Inc., Class A (a) | | | 2,472 | | | | 1,299,753 | | |
| GSI Commerce, Inc. (a) | | | 960 | | | | 23,712 | | |
| InfoSpace, Inc. (a) | | | 1,542 | | | | 13,353 | | |
| LogMeIn, Inc. (a) | | | 1,260 | | | | 45,335 | | |
| MercadoLibre, Inc. (a) | | | 955 | | | | 68,932 | | |
| OpenTable, Inc. (a) | | | 1,315 | | | | 89,525 | | |
| United Online, Inc. | | | 2,690 | | | | 15,387 | | |
| ValueClick, Inc. (a) | | | 1,110 | | | | 14,519 | | |
| VeriSign, Inc. (a) | | | 1,050 | | | | 33,327 | | |
| | | Shares | | Value ($) | |
| VistaPrint NV (a) | | | 2,255 | | | | 87,156 | | |
| Vocus, Inc. (a) | | | 1,647 | | | | 30,436 | | |
| Internet Software & Services Total | | | 2,117,206 | | |
| IT Services – 1.3% | |
| Acxiom Corp. (a) | | | 1,090 | | | | 17,287 | | |
| Alliance Data Systems Corp. (a) | | | 1,520 | | | | 99,195 | | |
| CACI International, Inc., Class A (a) | | | 434 | | | | 19,643 | | |
Cognizant Technology Solutions
Corp., Class A (a) | | | 8,930 | | | | 575,717 | | |
| CSG Systems International, Inc. (a) | | | 931 | | | | 16,972 | | |
| ExlService Holdings, Inc. (a) | | | 1,570 | | | | 30,537 | | |
| Gartner, Inc. (a) | | | 1,460 | | | | 42,982 | | |
International Business Machines
Corp. | | | 9,300 | | | | 1,247,502 | | |
| MAXIMUS, Inc. | | | 310 | | | | 19,090 | | |
| MoneyGram International, Inc. (a) | | | 7,386 | | | | 18,022 | | |
| TeleTech Holdings, Inc. (a) | | | 1,450 | | | | 21,518 | | |
| Teradata Corp. (a) | | | 9,300 | | | | 358,608 | | |
| VeriFone Systems, Inc. (a) | | | 3,510 | | | | 109,056 | | |
| Visa, Inc., Class A | | | 3,150 | | | | 233,919 | | |
| Wright Express Corp. (a) | | | 1,106 | | | | 39,495 | | |
| IT Services Total | | | 2,849,543 | | |
| Semiconductors & Semiconductor Equipment – 0.9% | |
| Amkor Technology, Inc. (a) | | | 2,200 | | | | 14,454 | | |
| Analog Devices, Inc. | | | 1,809 | | | | 56,767 | | |
| Atmel Corp. (a) | | | 3,400 | | | | 27,064 | | |
| ATMI, Inc. (a) | | | 850 | | | | 12,631 | | |
| Broadcom Corp., Class A | | | 6,150 | | | | 217,649 | | |
| Cavium Networks, Inc. (a) | | | 940 | | | | 27,034 | | |
| Cirrus Logic, Inc. (a) | | | 1,205 | | | | 21,497 | | |
| Cree, Inc. (a) | | | 540 | | | | 29,317 | | |
| Entropic Communications, Inc. (a) | | | 5,303 | | | | 50,909 | | |
| GT Solar International, Inc. (a) | | | 2,405 | | | | 20,130 | | |
Integrated Device Technology,
Inc. (a) | | | 2,160 | | | | 12,636 | | |
| Macronix International | | | 144,000 | | | | 89,510 | | |
| Marvell Technology Group Ltd. (a) | | | 1,890 | | | | 33,094 | | |
| MediaTek, Inc. | | | 7,013 | | | | 98,617 | | |
| MKS Instruments, Inc. (a) | | | 583 | | | | 10,482 | | |
| Netlogic Microsystems, Inc. (a) | | | 8,250 | | | | 227,535 | | |
| OmniVision Technologies, Inc. (a) | | | 3,355 | | | | 77,299 | | |
| Power Integrations, Inc. | | | 605 | | | | 19,233 | | |
| Samsung Electronics Co., Ltd. | | | 118 | | | | 80,412 | | |
| SunPower Corp., Class A (a) | | | 2,305 | | | | 33,192 | | |
| Tessera Technologies, Inc. (a) | | | 650 | | | | 12,025 | | |
| Texas Instruments, Inc. | | | 13,200 | | | | 358,248 | | |
Varian Semiconductor Equipment
Associates, Inc. (a) | | | 6,220 | | | | 179,012 | | |
| Veeco Instruments, Inc. (a) | | | 800 | | | | 27,896 | | |
| Verigy Ltd. (a) | | | 1,233 | | | | 10,024 | | |
See Accompanying Notes to Financial Statements.
36
Columbia Asset Allocation Fund
September 30, 2010
| Common Stocks (continued) | |
| | | Shares | | Value ($) | |
| Volterra Semiconductor Corp. (a) | | | 1,270 | | | | 27,330 | | |
| Xilinx, Inc. | | | 1,920 | | | | 51,091 | | |
| Zoran Corp. (a) | | | 1,605 | | | | 12,262 | | |
Semiconductors & Semiconductor
Equipment Total | | | 1,837,350 | | |
| Software – 2.4% | |
| Advent Software, Inc. (a) | | | 785 | | | | 40,969 | | |
| ANSYS, Inc. (a) | | | 820 | | | | 34,645 | | |
| Autodesk, Inc. (a) | | | 15,800 | | | | 505,126 | | |
| AutoNavi Holdings Ltd., ADR (a) | | | 641 | | | | 11,218 | | |
| Autonomy Corp. PLC (a) | | | 5,172 | | | | 147,419 | | |
| BroadSoft, Inc. (a) | | | 1,644 | | | | 14,237 | | |
| Citrix Systems, Inc. (a) | | | 1,030 | | | | 70,287 | | |
| Compuware Corp. (a) | | | 1,590 | | | | 13,563 | | |
| Concur Technologies, Inc. (a) | | | 934 | | | | 46,177 | | |
| Fortinet, Inc. (a) | | | 1,250 | | | | 31,250 | | |
| Informatica Corp. (a) | | | 1,025 | | | | 39,370 | | |
| Intuit, Inc. (a) | | | 9,510 | | | | 416,633 | | |
| Jack Henry & Associates, Inc. | | | 500 | | | | 12,750 | | |
| Microsoft Corp. | | | 22,980 | | | | 562,780 | | |
Monotype Imaging Holdings,
Inc. (a) | | | 1,398 | | | | 12,792 | | |
| Netscout Systems, Inc. (a) | | | 1,796 | | | | 36,836 | | |
| Nintendo Co., Ltd. | | | 500 | | | | 124,957 | | |
| Nintendo Co., Ltd., ADR | | | 4,603 | | | | 143,614 | | |
| Nuance Communications, Inc. (a) | | | 22,700 | | | | 355,028 | | |
| Oracle Corp. | | | 37,600 | | | | 1,009,560 | | |
| Parametric Technology Corp. (a) | | | 780 | | | | 15,241 | | |
| Pegasystems, Inc. | | | 990 | | | | 30,739 | | |
| Progress Software Corp. (a) | | | 570 | | | | 18,867 | | |
| RealPage, Inc. (a) | | | 1,016 | | | | 19,385 | | |
| Red Hat, Inc. (a) | | | 2,430 | | | | 99,630 | | |
| Rovi Corp. (a) | | | 6,801 | | | | 342,838 | | |
| Salesforce.com, Inc. (a) | | | 3,050 | | | | 340,990 | | |
| Solera Holdings, Inc. | | | 590 | | | | 26,054 | | |
| Sourcefire, Inc. (a) | | | 1,190 | | | | 34,320 | | |
| SuccessFactors, Inc. (a) | | | 12,802 | | | | 321,458 | | |
| Taleo Corp., Class A (a) | | | 1,430 | | | | 41,456 | | |
| TIBCO Software, Inc. (a) | | | 10,285 | | | | 182,456 | | |
VanceInfo Technologies, Inc.,
ADR (a) | | | 890 | | | | 28,783 | | |
| Software Total | | | 5,131,428 | | |
| Information Technology Total | | | 19,314,347 | | |
| Materials – 3.2% | |
| Chemicals – 0.8% | |
| Albemarle Corp. | | | 1,425 | | | | 66,704 | | |
| BASF SE | | | 4,569 | | | | 288,667 | | |
| Celanese Corp., Series A | | | 5,300 | | | | 170,130 | | |
| CF Industries Holdings, Inc. | | | 2,110 | | | | 201,505 | | |
| | | Shares | | Value ($) | |
| Clariant AG, Registered Shares (a) | | | 11,336 | | | | 166,280 | | |
| H.B. Fuller Co. | | | 1,450 | | | | 28,811 | | |
| Hitachi Chemical Co., Ltd. | | | 5,500 | | | | 102,886 | | |
International Flavors &
Fragrances, Inc. | | | 800 | | | | 38,816 | | |
| Minerals Technologies, Inc. | | | 390 | | | | 22,979 | | |
| OM Group, Inc. (a) | | | 1,525 | | | | 45,933 | | |
| Potash Corp. of Saskatchewan, Inc. | | | 3,000 | | | | 432,120 | | |
| PPG Industries, Inc. | | | 1,300 | | | | 94,640 | | |
| Solutia, Inc. (a) | | | 2,230 | | | | 35,725 | | |
| STR Holdings, Inc. (a) | | | 1,120 | | | | 24,125 | | |
| Chemicals Total | | | 1,719,321 | | |
| Construction Materials – 0.1% | |
| Ciments Francais SA | | | 777 | | | | 69,322 | | |
| Eagle Materials, Inc. | | | 382 | | | | 9,054 | | |
| Martin Marietta Materials, Inc. | | | 600 | | | | 46,182 | | |
| Construction Materials Total | | | 124,558 | | |
| Containers & Packaging – 0.2% | |
| Crown Holdings, Inc. (a) | | | 3,340 | | | | 95,725 | | |
| Greif, Inc., Class A | | | 335 | | | | 19,711 | | |
| Greif, Inc., Class B | | | 841 | | | | 48,273 | | |
| Packaging Corp. of America | | | 15,534 | | | | 359,923 | | |
| Silgan Holdings, Inc. | | | 1,500 | | | | 47,550 | | |
| Containers & Packaging Total | | | 571,182 | | |
| Metals & Mining – 1.9% | |
| Agnico-Eagle Mines Ltd. | | | 1,857 | | | | 131,903 | | |
| Allegheny Technologies, Inc. | | | 11,425 | | | | 530,691 | | |
| AngloGold Ashanti Ltd., ADR | | | 807 | | | | 37,316 | | |
| Aurubis AG | | | 2,801 | | | | 133,680 | | |
| Barrick Gold Corp. | | | 3,637 | | | | 168,357 | | |
| BHP Billiton PLC | | | 9,756 | | | | 311,507 | | |
| Carpenter Technology Corp. | | | 380 | | | | 12,810 | | |
| Centerra Gold, Inc. | | | 6,441 | | | | 103,917 | | |
| Cliffs Natural Resources, Inc. | | | 1,080 | | | | 69,034 | | |
| Coeur d'Alene Mines Corp. (a) | | | 990 | | | | 19,721 | | |
| Eastern Platinum Ltd. (a) | | | 72,500 | | | | 100,058 | | |
| First Quantum Minerals Ltd. | | | 968 | | | | 73,618 | | |
Freeport-McMoRan Copper &
Gold, Inc. | | | 6,302 | | | | 538,128 | | |
| Gammon Gold, Inc. (a) | | | 3,805 | | | | 26,673 | | |
| Goldcorp, Inc. | | | 2,449 | | | | 106,581 | | |
| Haynes International, Inc. | | | 587 | | | | 20,498 | | |
| IAMGOLD Corp. | | | 2,382 | | | | 42,185 | | |
| Ivanhoe Mines Ltd. (a) | | | 2,247 | | | | 52,602 | | |
| Newmont Mining Corp. | | | 7,846 | | | | 492,807 | | |
| Novagold Resources, Inc. (a) | | | 2,397 | | | | 20,950 | | |
| Olympic Steel, Inc. | | | 759 | | | | 17,449 | | |
| OneSteel Ltd. | | | 32,464 | | | | 91,943 | | |
See Accompanying Notes to Financial Statements.
37
Columbia Asset Allocation Fund
September 30, 2010
| Common Stocks (continued) | |
| | | Shares | | Value ($) | |
| RTI International Metals, Inc. (a) | | | 580 | | | | 17,760 | | |
| Silver Wheaton Corp. (a) | | | 4,480 | | | | 119,392 | | |
| Steel Dynamics, Inc. | | | 2,600 | | | | 36,686 | | |
| Stillwater Mining Co. (a) | | | 2,675 | | | | 45,047 | | |
| Teck Resources Ltd., Class B | | | 4,715 | | | | 194,069 | | |
| Terra Nova Royalty Corp. (a) | | | 950 | | | | 7,087 | | |
Thompson Creek Metals Co.,
Inc. (a) | | | 17,599 | | | | 189,703 | | |
| Titanium Metals Corp. (a) | | | 1,630 | | | | 32,535 | | |
| United States Steel Corp. | | | 6,275 | | | | 275,096 | | |
| US Gold Corp. (a) | | | 3,225 | | | | 16,028 | | |
| Vale SA, ADR | | | 2,241 | | | | 70,076 | | |
| Walter Energy, Inc. | | | 1,005 | | | | 81,696 | | |
| Metals & Mining Total | | | 4,187,603 | | |
| Paper & Forest Products – 0.2% | |
| International Paper Co. | | | 10,000 | | | | 217,500 | | |
| Svenska Cellulosa AB, Class B | | | 10,281 | | | | 156,608 | | |
| Paper & Forest Products Total | | | 374,108 | | |
| Materials Total | | | 6,976,772 | | |
| Telecommunication Services – 1.5% | |
| Diversified Telecommunication Services – 0.7% | |
| AT&T, Inc. | | | 28,752 | | | | 822,307 | | |
Bezeq Israeli Telecommunication
Corp., Ltd. | | | 49,181 | | | | 122,785 | | |
Qwest Communications
International, Inc. | | | 7,500 | | | | 47,025 | | |
| Tele2 AB, Class B | | | 8,963 | | | | 188,263 | | |
| Telefonica SA | | | 3,551 | | | | 88,093 | | |
| Telenor ASA | | | 6,928 | | | | 108,613 | | |
| Warwick Valley Telephone Co. | | | 1,048 | | | | 14,924 | | |
Diversified Telecommunication
Services Total | | | 1,392,010 | | |
| Wireless Telecommunication Services – 0.8% | |
Advanced Info Service PCL,
Foreign Registered Shares | | | 23,700 | | | | 74,185 | | |
| American Tower Corp., Class A (a) | | | 7,484 | | | | 383,630 | | |
Crown Castle International
Corp. (a) | | | 1,210 | | | | 53,422 | | |
| Freenet AG | | | 15,468 | | | | 181,883 | | |
| Millicom International Cellular SA | | | 1,632 | | | | 156,590 | | |
| NII Holdings, Inc. (a) | | | 8,095 | | | | 332,704 | | |
| NTELOS Holdings Corp. | | | 1,240 | | | | 20,981 | | |
| NTT DoCoMo, Inc. | | | 53 | | | | 88,515 | | |
SBA Communications Corp.,
Class A (a) | | | 2,615 | | | | 105,385 | | |
| Shenandoah Telecommunications Co. | | | 786 | | | | 14,282 | | |
| Softbank Corp. | | | 6,200 | | | | 203,173 | | |
| | | Shares | | Value ($) | |
| Syniverse Holdings, Inc. (a) | | | 772 | | | | 17,501 | | |
| Vivo Participacoes SA, ADR | | | 3,076 | | | | 83,575 | | |
| Vodafone Group PLC | | | 30,489 | | | | 75,474 | | |
| Wireless Telecommunication Services Total | | | 1,791,300 | | |
| Telecommunication Services Total | | | 3,183,310 | | |
| Utilities – 2.2% | |
| Electric Utilities – 0.9% | |
| ALLETE, Inc. | | | 730 | | | | 26,594 | | |
| American Electric Power Co., Inc. | | | 16,100 | | | | 583,303 | | |
| Enel SpA | | | 20,723 | | | | 110,626 | | |
| Fortum OYJ | | | 7,702 | | | | 201,743 | | |
| MGE Energy, Inc. | | | 610 | | | | 24,150 | | |
| NextEra Energy, Inc. | | | 12,500 | | | | 679,875 | | |
| Northeast Utilities | | | 8,024 | | | | 237,269 | | |
| Electric Utilities Total | | | 1,863,560 | | |
| Gas Utilities – 0.1% | |
| Laclede Group, Inc. | | | 600 | | | | 20,652 | | |
| Nicor, Inc. | | | 680 | | | | 31,157 | | |
| PT Perusahaan Gas Negara | | | 212,500 | | | | 91,855 | | |
| Gas Utilities Total | | | 143,664 | | |
| Independent Power Producers & Energy Traders – 0.1% | |
| AES Corp. (a) | | | 3,020 | | | | 34,277 | | |
| International Power PLC | | | 36,783 | | | | 224,463 | | |
Independent Power Producers &
Energy Traders Total | | | 258,740 | | |
| Multi-Utilities – 1.1% | |
| AGL Energy Ltd. | | | 10,448 | | | | 163,296 | | |
| Avista Corp. | | | 1,200 | | | | 25,056 | | |
| CenterPoint Energy, Inc. | | | 2,794 | | | | 43,922 | | |
| CH Energy Group, Inc. | | | 440 | | | | 19,430 | | |
| CMS Energy Corp. | | | 2,400 | | | | 43,248 | | |
| NorthWestern Corp. | | | 860 | | | | 24,510 | | |
| PG&E Corp. | | | 12,558 | | | | 570,384 | | |
Public Service Enterprise Group,
Inc. | | | 1,900 | | | | 62,852 | | |
| RWE AG | | | 2,776 | | | | 187,254 | | |
| Sempra Energy | | | 9,850 | | | | 529,930 | | |
| Wisconsin Energy Corp. | | | 5,214 | | | | 301,369 | | |
| Xcel Energy, Inc. | | | 21,300 | | | | 489,261 | | |
| Multi-Utilities Total | | | 2,460,512 | | |
| Utilities Total | | | 4,726,476 | | |
Total Common Stocks
(Cost of $102,661,895) | | | 119,601,468 | | |
See Accompanying Notes to Financial Statements.
38
Columbia Asset Allocation Fund
September 30, 2010
| Corporate Fixed-Income Bonds & Notes – 14.1% | |
| | | Par ($) | | Value ($) | |
| Basic Materials – 0.5% | |
| Chemicals – 0.2% | |
| Celanese U.S. Holdings LLC | |
| 6.625% 10/15/18 (d) | | | 3,000 | | | | 3,068 | | |
| CF Industries, Inc. | |
| 6.875% 05/01/18 | | | 70,000 | | | | 75,337 | | |
Hexion U.S. Finance Corp./Hexion
Nova Scotia Finance ULC | |
| 8.875% 02/01/18 | | | 115,000 | | | | 112,700 | | |
| INEOS Finance PLC | |
| 9.000% 05/15/15 (d) | | | 110,000 | | | | 114,812 | | |
| Lyondell Chemical Co. | |
| 8.000% 11/01/17 (d) | | | 72,000 | | | | 78,660 | | |
| 11.000% 05/01/18 | | | 6,000 | | | | 6,638 | | |
| Chemicals Total | | | 391,215 | | |
| Forest Products & Paper – 0.1% | |
| Cascades, Inc. | |
| 7.750% 12/15/17 | | | 15,000 | | | | 15,638 | | |
| Georgia-Pacific LLC | |
| 8.000% 01/15/24 | | | 100,000 | | | | 112,250 | | |
| Forest Products & Paper Total | | | 127,888 | | |
| Iron/Steel – 0.1% | |
| ArcelorMittal USA, Inc. | |
| 6.500% 04/15/14 | | | 200,000 | | | | 221,655 | | |
| Iron/Steel Total | | | 221,655 | | |
| Metals & Mining – 0.1% | |
| Novelis, Inc. | |
| 7.250% 02/15/15 | | | 9,000 | | | | 9,157 | | |
| Vale Overseas Ltd. | |
| 6.250% 01/23/17 | | | 200,000 | | | | 228,933 | | |
| Metals & Mining Total | | | 238,090 | | |
| Basic Materials Total | | | 978,848 | | |
| Communications – 2.6% | |
| Advertising – 0.1% | |
| Interpublic Group of Companies, Inc. | |
| 10.000% 07/15/17 | | | 55,000 | | | | 64,213 | | |
| inVentiv Health, Inc. | |
| 10.000% 08/15/18 (d) | | | 40,000 | | | | 39,750 | | |
| Visant Corp. | |
| 10.000% 10/01/17 (d) | | | 30,000 | | | | 31,350 | | |
| Advertising Total | | | 135,313 | | |
| Media – 0.9% | |
| Belo Corp. | |
| 8.000% 11/15/16 | | | 30,000 | | | | 32,062 | | |
| Cablevision Systems Corp. | |
| 8.625% 09/15/17 | | | 90,000 | | | | 99,000 | | |
| | | Par ($) | | Value ($) | |
| CCO Holdings LLC/CCO Holdings Capital Corp. | |
| 7.250% 10/30/17 (d) | | | 65,000 | | | | 65,894 | | |
| Clear Channel Worldwide Holdings, Inc. | |
| 9.250% 12/15/17 | | | 65,000 | | | | 69,387 | | |
| DIRECTV Holdings LLC | |
| 3.550% 03/15/15 | | | 200,000 | | | | 207,609 | | |
| DISH DBS Corp. | |
| 7.875% 09/01/19 | | | 115,000 | | | | 123,769 | | |
| Entravision Communications Corp. | |
| 8.750% 08/01/17 (d) | | | 45,000 | | | | 45,900 | | |
| Gannett Co., Inc. | |
| 6.375% 09/01/15 (d) | | | 15,000 | | | | 14,831 | | |
| Gray Television, Inc. | |
| 10.500% 06/29/15 | | | 40,000 | | | | 39,950 | | |
| Insight Communications Co., Inc. | |
| 9.375% 07/15/18 (d) | | | 20,000 | | | | 21,250 | | |
| Mediacom LLC/Mediacom Capital Corp. | |
| 9.125% 08/15/19 | | | 65,000 | | | | 67,275 | | |
| NBC Universal, Inc. | |
| 5.950% 04/01/41 (d)(e) | | | 230,000 | | | | 236,581 | | |
| News America, Inc. | |
| 6.550% 03/15/33 | | | 200,000 | | | | 223,229 | | |
| RR Donnelley & Sons Co. | |
| 6.125% 01/15/17 | | | 300,000 | | | | 314,095 | | |
| Salem Communications Corp. | |
| 9.625% 12/15/16 | | | 70,000 | | | | 74,375 | | |
| Sinclair Television Group, Inc. | |
| 8.375% 10/15/18 (d)(e) | | | 15,000 | | | | 15,112 | | |
| 9.250% 11/01/17 (d) | | | 74,000 | | | | 79,365 | | |
| Sirius XM Radio, Inc. | |
| 8.750% 04/01/15 (d) | | | 50,000 | | | | 53,125 | | |
| 9.750% 09/01/15 (d) | | | 20,000 | | | | 22,025 | | |
| Time Warner, Inc. | |
| 6.200% 03/15/40 | | | 185,000 | | | | 201,539 | | |
| Umbrella Acquisition, Inc. | |
PIK,
9.750% 03/15/15
(03/15/12) (d)(f)(g) | | | 10,525 | | | | 10,032 | | |
| Media Total | | | 2,016,405 | | |
| Telecommunication Services – 1.6% | |
| America Movil SAB de CV | |
| 5.625% 11/15/17 | | | 200,000 | | | | 225,643 | | |
| AT&T, Inc. | |
| 4.950% 01/15/13 | | | 250,000 | | | | 271,659 | | |
| 5.350% 09/01/40 (d) | | | 215,000 | | | | 216,013 | | |
| British Telecommunications PLC | |
| 5.150% 01/15/13 | | | 225,000 | | | | 240,448 | | |
| Cellco Partnership/Verizon Wireless Capital LLC | |
| 5.550% 02/01/14 | | | 365,000 | | | | 412,762 | | |
See Accompanying Notes to Financial Statements.
39
Columbia Asset Allocation Fund
September 30, 2010
| Corporate Fixed-Income Bonds & Notes (continued) | |
| | | Par ($) | | Value ($) | |
| Cincinnati Bell, Inc. | |
| 8.250% 10/15/17 | | | 50,000 | | | | 50,500 | | |
| Clearwire Communications LLC/Clearwire Finance, Inc. | |
| 12.000% 12/01/15 (d) | | | 62,000 | | | | 66,805 | | |
| Crown Castle International Corp. | |
| 7.125% 11/01/19 | | | 65,000 | | | | 69,225 | | |
| Frontier Communications Corp. | |
| 8.250% 04/15/17 | | | 65,000 | | | | 71,094 | | |
| Intelsat Corp. | |
| 9.250% 06/15/16 | | | 70,000 | | | | 74,638 | | |
| ITC Deltacom, Inc. | |
| 10.500% 04/01/16 | | | 115,000 | | | | 116,869 | | |
| Level 3 Financing, Inc. | |
| 8.750% 02/15/17 | | | 60,000 | | | | 53,400 | | |
| 9.250% 11/01/14 | | | 35,000 | | | | 32,900 | | |
| MetroPCS Wireless, Inc. | |
| 7.875% 09/01/18 | | | 40,000 | | | | 41,200 | | |
| Nextel Communications, Inc. | |
| 7.375% 08/01/15 | | | 195,000 | | | | 195,975 | | |
| Nielsen Finance LLC/Nielsen Finance Co. | |
| 7.750% 10/15/18 (b)(d)(e) | | | 50,000 | | | | 49,634 | | |
| PAETEC Holding Corp. | |
| 8.875% 06/30/17 | | | 75,000 | | | | 78,375 | | |
| Qwest Communications International, Inc. | |
| 7.500% 02/15/14 | | | 255,000 | | | | 260,100 | | |
| Sprint Capital Corp. | |
| 6.875% 11/15/28 | | | 30,000 | | | | 27,450 | | |
| Telecom Italia Capital SA | |
| 4.950% 09/30/14 | | | 210,000 | | | | 223,593 | | |
| Telefonica Emisiones SAU | |
0.775% 02/04/13
(11/04/10) (f)(g) | | | 250,000 | | | | 244,724 | | |
| Vodafone Group PLC | |
| 5.750% 03/15/16 | | | 175,000 | | | | 200,356 | | |
| Wind Acquisition Finance SA | |
| 11.750% 07/15/17 (d) | | | 90,000 | | | | 100,856 | | |
| Windstream Corp. | |
| 7.875% 11/01/17 | | | 65,000 | | | | 67,763 | | |
| 8.125% 09/01/18 (d) | | | 35,000 | | | | 36,225 | | |
| Telecommunication Services Total | | | 3,428,207 | | |
| Communications Total | | | 5,579,925 | | |
| Consumer Cyclical – 0.6% | |
| Auto Manufacturers – 0.0% | |
| Oshkosh Corp. | |
| 8.500% 03/01/20 | | | 2,000 | | | | 2,165 | | |
| Auto Manufacturers Total | | | 2,165 | | |
| Auto Parts & Equipment – 0.1% | |
| Accuride Corp. | |
| 9.500% 08/01/18 (d) | | | 7,000 | | | | 7,350 | | |
| | | Par ($) | | Value ($) | |
| Lear Corp. | |
| 7.875% 03/15/18 | | | 65,000 | | | | 68,900 | | |
| Tenneco, Inc. | |
| 7.750% 08/15/18 (d) | | | 5,000 | | | | 5,125 | | |
| Auto Parts & Equipment Total | | | 81,375 | | |
| Distribution/Wholesale – 0.0% | |
| McJunkin Red Man Corp. | |
| 9.500% 12/15/16 (d) | | | 52,000 | | | | 45,760 | | |
| Distribution/Wholesale Total | | | 45,760 | | |
| Entertainment – 0.1% | |
Cedar Fair LP/Canada's Wonderland Co./Magnum
Management Corp. | |
| 9.125% 08/01/18 (d) | | | 10,000 | | | | 10,500 | | |
| Pinnacle Entertainment, Inc. | |
| 8.750% 05/15/20 | | | 55,000 | | | | 54,175 | | |
| Shingle Springs Tribal Gaming Authority | |
| 9.375% 06/15/15 (d) | | | 105,000 | | | | 78,225 | | |
| Entertainment Total | | | 142,900 | | |
| Home Builders – 0.0% | |
| K. Hovnanian Enterprises, Inc. | |
| 10.625% 10/15/16 | | | 45,000 | | | | 45,056 | | |
| Home Builders Total | | | 45,056 | | |
| Home Furnishings – 0.0% | |
| Norcraft Companies LP/Norcraft Finance Corp. | |
| 10.500% 12/15/15 | | | 70,000 | | | | 73,150 | | |
| Home Furnishings Total | | | 73,150 | | |
| Housewares – 0.0% | |
| Libbey Glass, Inc. | |
| 10.000% 02/15/15 (d) | | | 65,000 | | | | 69,875 | | |
| Housewares Total | | | 69,875 | | |
| Lodging – 0.1% | |
| MGM Resorts International | |
| 9.000% 03/15/20 (d) | | | 65,000 | | | | 68,412 | | |
| 11.375% 03/01/18 | | | 40,000 | | | | 38,100 | | |
| 11.375% 03/01/18 (d) | | | 20,000 | | | | 19,050 | | |
| Wyndham Worldwide Corp. | |
| 6.000% 12/01/16 | | | 110,000 | | | | 114,755 | | |
| Lodging Total | | | 240,317 | | |
| Retail – 0.3% | |
| CVS Pass-Through Trust | |
| 7.507% 01/10/32 (d) | | | 222,549 | | | | 261,130 | | |
| Michaels Stores, Inc. | |
| 11.375% 11/01/16 | | | 10,000 | | | | 10,863 | | |
| Neiman Marcus Group, Inc. | |
PIK,
9.000% 10/15/15 | | | 39,000 | | | | 40,511 | | |
See Accompanying Notes to Financial Statements.
40
Columbia Asset Allocation Fund
September 30, 2010
| Corporate Fixed-Income Bonds & Notes (continued) | |
| | | Par ($) | | Value ($) | |
| QVC, Inc. | |
| 7.500% 10/01/19 (d) | | | 135,000 | | | | 141,075 | | |
| Rite Aid Corp. | |
| 8.000% 08/15/20 (d) | | | 10,000 | | | | 10,150 | | |
| 10.250% 10/15/19 | | | 17,000 | | | | 17,701 | | |
| Toys R Us - Delaware, Inc. | |
| 7.375% 09/01/16 (d) | | | 32,000 | | | | 32,560 | | |
| Retail Total | | | 513,990 | | |
| Consumer Cyclical Total | | | 1,214,588 | | |
| Consumer Non-Cyclical – 1.5% | |
| Beverages – 0.4% | |
| Anheuser-Busch InBev Worldwide, Inc. | |
| 2.500% 03/26/13 | | | 275,000 | | | | 282,143 | | |
| Bottling Group LLC | |
| 6.950% 03/15/14 | | | 200,000 | | | | 237,107 | | |
| Cott Beverages USA, Inc. | |
| 8.125% 09/01/18 (d) | | | 11,000 | | | | 11,646 | | |
| Cott Beverages, Inc. | |
| 8.375% 11/15/17 (d) | | | 25,000 | | | | 26,500 | | |
| Miller Brewing Co. | |
| 5.500% 08/15/13 (d) | | | 200,000 | | | | 219,939 | | |
| Beverages Total | | | 777,335 | | |
| Commercial Services – 0.1% | |
| Cardtronics, Inc. | |
| 8.250% 09/01/18 | | | 25,000 | | | | 26,312 | | |
| Garda World Security Corp. | |
| 9.750% 03/15/17 (d) | | | 20,000 | | | | 21,300 | | |
| Hertz Corp. | |
| 7.500% 10/15/18 (d) | | | 20,000 | | | | 20,000 | | |
| Interactive Data Corp. | |
| 10.250% 08/01/18 (d) | | | 40,000 | | | | 42,800 | | |
| Trans Union LLC/TransUnion Financing Corp. | |
| 11.375% 06/15/18 (d) | | | 15,000 | | | | 17,063 | | |
| United Rentals North America, Inc. | |
| 9.250% 12/15/19 | | | 20,000 | | | | 21,650 | | |
| 10.875% 06/15/16 | | | 65,000 | | | | 73,369 | | |
| Commercial Services Total | | | 222,494 | | |
| Food – 0.3% | |
| ConAgra Foods, Inc. | |
| 5.875% 04/15/14 | | | 190,000 | | | | 216,925 | | |
| Kraft Foods, Inc. | |
| 5.375% 02/10/20 | | | 225,000 | | | | 251,336 | | |
| Kroger Co. | |
| 5.400% 07/15/40 | | | 215,000 | | | | 223,457 | | |
| Michael Foods, Inc. | |
| 9.750% 07/15/18 (d) | | | 25,000 | | | | 26,750 | | |
| Pinnacle Foods Finance LLC/Pinnacle Foods Finance Corp. | |
| 9.250% 04/01/15 | | | 30,000 | | | | 31,200 | | |
| | | Par ($) | | Value ($) | |
| U.S. Foodservice | |
PIK,
10.250% 06/30/15 (d) | | | 3,000 | | | | 3,015 | | |
| Food Total | | | 752,683 | | |
| Healthcare Services – 0.4% | |
| Apria Healthcare Group, Inc. | |
| 11.250% 11/01/14 | | | 65,000 | | | | 71,500 | | |
| Capella Healthcare, Inc. | |
| 9.250% 07/01/17 (d) | | | 5,000 | | | | 5,350 | | |
| Community Health Systems, Inc. | |
| 8.875% 07/15/15 | | | 100,000 | | | | 106,250 | | |
| HCA, Inc. | |
| 7.250% 09/15/20 | | | 65,000 | | | | 69,550 | | |
PIK,
9.625% 11/15/16 | | | 100,000 | | | | 108,500 | | |
| Healthsouth Corp. | |
| 8.125% 02/15/20 | | | 6,000 | | | | 6,240 | | |
| LifePoint Hospitals, Inc. | |
| 6.625% 10/01/20 (d) | | | 15,000 | | | | 15,300 | | |
| Multiplan, Inc. | |
| 9.875% 09/01/18 (d) | | | 26,000 | | | | 27,170 | | |
| Radiation Therapy Services, Inc. | |
| 9.875% 04/15/17 (d) | | | 20,000 | | | | 19,750 | | |
| Roche Holdings, Inc. | |
| 6.000% 03/01/19 (d) | | | 200,000 | | | | 242,293 | | |
| Select Medical Corp. | |
| 7.625% 02/01/15 | | | 30,000 | | | | 29,288 | | |
| Tenet Healthcare Corp. | |
| 8.000% 08/01/20 (d) | | | 35,000 | | | | 34,912 | | |
Vanguard Health Holding Co. II, LLC/Vanguard
Holding Co. II, Inc. | |
| 8.000% 02/01/18 | | | 75,000 | | | | 76,125 | | |
| Healthcare Services Total | | | 812,228 | | |
| Household Products/Wares – 0.1% | |
| Jarden Corp. | |
| 8.000% 05/01/16 | | | 65,000 | | | | 69,225 | | |
| Spectrum Brands Holdings, Inc. | |
| 9.500% 06/15/18 (d) | | | 45,000 | | | | 48,262 | | |
| Household Products/Wares Total | | | 117,487 | | |
| Pharmaceuticals – 0.2% | |
| Express Scripts, Inc. | |
| 6.250% 06/15/14 | | | 175,000 | | | | 200,918 | | |
| NBTY, Inc. | |
| 9.000% 10/01/18 (d)(e) | | | 5,000 | | | | 5,250 | | |
| Omnicare, Inc. | |
| 6.875% 12/15/15 | | | 55,000 | | | | 55,550 | | |
| Valeant Pharmaceuticals International | |
| 6.750% 10/01/17 (d) | | | 10,000 | | | | 10,200 | | |
| 7.000% 10/01/20 (d) | | | 15,000 | | | | 15,337 | | |
See Accompanying Notes to Financial Statements.
41
Columbia Asset Allocation Fund
September 30, 2010
| Corporate Fixed-Income Bonds & Notes (continued) | |
| | | Par ($) | | Value ($) | |
| Warner Chilcott Co., LLC/Warner Chilcott Finance LLC | |
| 7.750% 09/15/18 (d) | | | 32,000 | | | | 32,880 | | |
| Wyeth | |
| 5.500% 02/01/14 | | | 180,000 | | | | 204,273 | | |
| Pharmaceuticals Total | | | 524,408 | | |
| Consumer Non-Cyclical Total | | | 3,206,635 | | |
| Energy – 1.9% | |
| Coal – 0.2% | |
| Arch Coal, Inc. | |
| 7.250% 10/01/20 | | | 3,000 | | | | 3,169 | | |
| 8.750% 08/01/16 | | | 200,000 | | | | 220,500 | | |
| Consol Energy, Inc. | |
| 8.000% 04/01/17 (d) | | | 50,000 | | | | 54,125 | | |
| 8.250% 04/01/20 (d) | | | 50,000 | | | | 54,625 | | |
| Coal Total | | | 332,419 | | |
| Oil & Gas – 1.0% | |
| Anadarko Petroleum Corp. | |
| 6.200% 03/15/40 | | | 275,000 | | | | 268,093 | | |
| Berry Petroleum Co. | |
| 8.250% 11/01/16 | | | 5,000 | | | | 5,125 | | |
| Brigham Exploration Co. | |
| 8.750% 10/01/18 (d) | | | 10,000 | | | | 10,300 | | |
| Canadian Natural Resources Ltd. | |
| 5.700% 05/15/17 | | | 200,000 | | | | 230,126 | | |
| Chesapeake Energy Corp. | |
| 6.625% 08/15/20 | | | 70,000 | | | | 73,150 | | |
| Comstock Resources, Inc. | |
| 8.375% 10/15/17 | | | 4,000 | | | | 4,125 | | |
| Concho Resources, Inc. | |
| 8.625% 10/01/17 | | | 65,000 | | | | 68,900 | | |
| Continental Resources, Inc. | |
| 7.125% 04/01/21 (d) | | | 15,000 | | | | 15,600 | | |
| Denbury Resources, Inc. | |
| 7.500% 12/15/15 | | | 65,000 | | | | 67,437 | | |
| EXCO Resources, Inc. | |
| 7.500% 09/15/18 | | | 45,000 | | | | 44,719 | | |
| Forest Oil Corp. | |
| 7.250% 06/15/19 | | | 65,000 | | | | 66,463 | | |
| Hilcorp Energy I LP/Hilcorp Finance Co. | |
| 7.750% 11/01/15 (d) | | | 80,000 | | | | 80,800 | | |
| Nexen, Inc. | |
| 5.875% 03/10/35 | | | 210,000 | | | | 214,301 | | |
| PetroHawk Energy Corp. | |
| 7.250% 08/15/18 (d) | | | 20,000 | | | | 20,400 | | |
| 7.875% 06/01/15 | | | 110,000 | | | | 115,225 | | |
| Petroleos Mexicanos | |
| 5.500% 01/21/21 (d) | | | 230,000 | | | | 244,950 | | |
| QEP Resources, Inc. | |
| 6.875% 03/01/21 | | | 30,000 | | | | 32,475 | | |
| | | Par ($) | | Value ($) | |
| Quicksilver Resources, Inc. | |
| 8.250% 08/01/15 | | | 15,000 | | | | 15,825 | | |
| 9.125% 08/15/19 | | | 65,000 | | | | 71,256 | | |
| Range Resources Corp. | |
| 6.750% 08/01/20 | | | 25,000 | | | | 26,000 | | |
| 7.500% 05/15/16 | | | 200,000 | | | | 209,000 | | |
| SandRidge Energy, Inc. | |
PIK,
8.625% 04/01/15 | | | 30,000 | | | | 30,000 | | |
| Talisman Energy, Inc. | |
| 6.250% 02/01/38 | | | 180,000 | | | | 197,922 | | |
| Oil & Gas Total | | | 2,112,192 | | |
| Oil & Gas Services – 0.2% | |
| Expro Finance Luxembourg SCA | |
| 8.500% 12/15/16 (d) | | | 50,000 | | | | 47,625 | | |
| Weatherford International Ltd. | |
| 5.150% 03/15/13 | | | 190,000 | | | | 203,435 | | |
| 6.750% 09/15/40 | | | 230,000 | | | | 239,724 | | |
| Oil & Gas Services Total | | | 490,784 | | |
| Pipelines – 0.5% | |
| El Paso Corp. | |
| 6.875% 06/15/14 | | | 195,000 | | | | 208,484 | | |
| 7.750% 01/15/32 | | | 55,000 | | | | 57,110 | | |
| Energy Transfer Equity LP | |
| 7.500% 10/15/20 | | | 45,000 | | | | 47,363 | | |
| Enterprise Products Operating LLC | |
| 4.600% 08/01/12 | | | 190,000 | | | | 200,097 | | |
Regency Energy Partners LP/Regency Energy
Finance Corp. | |
| 9.375% 06/01/16 (d) | | | 195,000 | | | | 214,987 | | |
| TransCanada Pipelines Ltd. | |
6.350% 05/15/67
(05/15/17) (f)(g) | | | 245,000 | | | | 229,075 | | |
| Williams Partners LP | |
| 7.250% 02/01/17 | | | 180,000 | | | | 214,407 | | |
| Pipelines Total | | | 1,171,523 | | |
| Energy Total | | | 4,106,918 | | |
| Financials – 5.0% | |
| Banks – 2.9% | |
| ANZ National International Ltd. | |
| 6.200% 07/19/13 (d) | | | 250,000 | | | | 277,845 | | |
| Barclays Bank PLC | |
| 6.750% 05/22/19 | | | 375,000 | | | | 445,638 | | |
| Bear Stearns Companies LLC | |
| 7.250% 02/01/18 | | | 425,000 | | | | 517,707 | | |
| Capital One Financial Corp. | |
| 5.500% 06/01/15 | | | 250,000 | | | | 275,015 | | |
See Accompanying Notes to Financial Statements.
42
Columbia Asset Allocation Fund
September 30, 2010
| Corporate Fixed-Income Bonds & Notes (continued) | |
| | | Par ($) | | Value ($) | |
| CIT Group, Inc. | |
| 7.000% 05/01/17 | | | 225,000 | | | | 220,219 | | |
| Citicorp Lease Pass-Through Trust | |
| 8.040% 12/15/19 (d) | | | 750,000 | | | | 880,791 | | |
| Citigroup Funding, Inc. | |
| 2.000% 03/30/12 (h) | | | 800,000 | | | | 816,760 | | |
| Commonwealth Bank of Australia | |
| 3.750% 10/15/14 (d) | | | 200,000 | | | | 213,743 | | |
| Credit Suisse/New York NY | |
| 6.000% 02/15/18 | | | 325,000 | | | | 358,919 | | |
| Goldman Sachs Group, Inc. | |
| 5.350% 01/15/16 | | | 215,000 | | | | 236,374 | | |
| Keycorp | |
| 6.500% 05/14/13 | | | 225,000 | | | | 246,587 | | |
| Merrill Lynch & Co., Inc. | |
| 6.875% 04/25/18 | | | 525,000 | | | | 588,890 | | |
| Morgan Stanley | |
| 6.750% 04/15/11 | | | 150,000 | | | | 154,497 | | |
| Royal Bank of Scotland PLC | |
| 3.950% 09/21/15 | | | 300,000 | | | | 303,137 | | |
| Santander U.S. Debt SA Unipersonal | |
| 2.991% 10/07/13 (d)(e) | | | 200,000 | | | | 199,640 | | |
| Wachovia Corp. | |
| 4.875% 02/15/14 | | | 375,000 | | | | 400,710 | | |
| Banks Total | | | 6,136,472 | | |
| Diversified Financial Services – 1.0% | |
| Ally Financial, Inc. | |
| 7.500% 09/15/20 (d) | | | 15,000 | | | | 15,975 | | |
| 8.000% 03/15/20 (d) | | | 175,000 | | | | 191,187 | | |
| American General Finance Corp. | |
| 6.900% 12/15/17 | | | 85,000 | | | | 70,975 | | |
| E*Trade Financial Corp. | |
| 7.375% 09/15/13 | | | 10,000 | | | | 9,775 | | |
| 7.875% 12/01/15 | | | 25,000 | | | | 24,438 | | |
PIK,
12.500% 11/30/17 | | | 25,000 | | | | 28,500 | | |
| ERAC USA Finance LLC | |
| 6.375% 10/15/17 (d) | | | 200,000 | | | | 232,509 | | |
| Ford Motor Credit Co., LLC | |
| 6.625% 08/15/17 | | | 100,000 | | | | 106,544 | | |
| 8.000% 12/15/16 | | | 75,000 | | | | 84,778 | | |
| General Electric Capital Corp. | |
| 2.250% 03/12/12 | | | 800,000 | | | | 820,409 | | |
| 5.000% 01/08/16 | | | 430,000 | | | | 472,423 | | |
| International Lease Finance Corp. | |
| 8.750% 03/15/17 (d) | | | 30,000 | | | | 32,175 | | |
| 8.875% 09/01/17 | | | 35,000 | | | | 37,800 | | |
| Lehman Brothers Holdings, Inc. | |
| 5.750% 07/18/11 (i) | | | 350,000 | | | | 77,437 | | |
| | | Par ($) | | Value ($) | |
| Pinafore LLC/Pinafore, Inc. | |
| 9.000% 10/01/18 (d) | | | 5,000 | | | | 5,250 | | |
| Diversified Financial Services Total | | | 2,210,175 | | |
| Insurance – 0.8% | |
| Chubb Corp. | |
| 5.750% 05/15/18 | | | 150,000 | | | | 173,592 | | |
| CNA Financial Corp. | |
| 7.350% 11/15/19 | | | 185,000 | | | | 208,001 | | |
| ING Groep NV | |
5.775% 12/29/49
(12/08/15) (f)(g) | | | 25,000 | | | | 22,438 | | |
| Lincoln National Corp. | |
| 8.750% 07/01/19 | | | 175,000 | | | | 225,113 | | |
| MetLife, Inc. | |
| 6.817% 08/15/18 | | | 210,000 | | | | 253,357 | | |
| Principal Life Income Funding Trusts | |
| 5.300% 04/24/13 | | | 225,000 | | | | 243,460 | | |
| Prudential Financial, Inc. | |
| 6.100% 06/15/17 | | | 200,000 | | | | 224,070 | | |
| Transatlantic Holdings, Inc. | |
| 8.000% 11/30/39 | | | 200,000 | | | | 208,381 | | |
| UnitedHealth Group, Inc. | |
| 5.250% 03/15/11 | | | 200,000 | | | | 203,801 | | |
| Insurance Total | | | 1,762,213 | | |
| Investment Companies – 0.0% | |
| Offshore Group Investments Ltd. | |
| 11.500% 08/01/15 (d) | | | 50,000 | | | | 52,500 | | |
| Investment Companies Total | | | 52,500 | | |
| Real Estate Investment Trusts (REITs) – 0.3% | |
| Duke Realty LP | |
| 8.250% 08/15/19 | | | 200,000 | | | | 236,858 | | |
| Kimco Realty Corp. | |
| 4.300% 02/01/18 | | | 180,000 | | | | 182,397 | | |
| Simon Property Group LP | |
| 6.750% 02/01/40 | | | 170,000 | | | | 200,468 | | |
| Real Estate Investment Trusts (REITs) Total | | | 619,723 | | |
| Financials Total | | | 10,781,083 | | |
| Industrials – 0.8% | |
| Aerospace & Defense – 0.2% | |
| Esterline Technologies Corp. | |
| 7.000% 08/01/20 (d) | | | 5,000 | | | | 5,175 | | |
| Kratos Defense & Security Solutions, Inc. | |
| 10.000% 06/01/17 | | | 15,000 | | | | 15,900 | | |
| United Technologies Corp. | |
| 5.375% 12/15/17 | | | 250,000 | | | | 293,667 | | |
| Aerospace & Defense Total | | | 314,742 | | |
See Accompanying Notes to Financial Statements.
43
Columbia Asset Allocation Fund
September 30, 2010
| Corporate Fixed-Income Bonds & Notes (continued) | |
| | | Par ($) | | Value ($) | |
| Building Materials – 0.0% | |
| Gibraltar Industries, Inc. | |
| 8.000% 12/01/15 | | | 15,000 | | | | 14,625 | | |
| Nortek, Inc. | |
| 11.000% 12/01/13 | | | 20,000 | | | | 21,250 | | |
| Building Materials Total | | | 35,875 | | |
| Machinery-Diversified – 0.1% | |
| Case New Holland, Inc. | |
| 7.875% 12/01/17 (d) | | | 55,000 | | | | 59,744 | | |
| Manitowoc Co., Inc. | |
| 9.500% 02/15/18 | | | 65,000 | | | | 67,925 | | |
| Machinery-Diversified Total | | | 127,669 | | |
| Miscellaneous Manufacturing – 0.2% | |
| Ingersoll-Rand Global Holding Co., Ltd. | |
| 9.500% 04/15/14 | | | 180,000 | | | | 222,720 | | |
| SPX Corp. | |
| 6.875% 09/01/17 (d) | | | 18,000 | | | | 19,080 | | |
| Tyco International Ltd./Tyco International Finance SA | |
| 7.000% 12/15/19 | | | 180,000 | | | | 224,064 | | |
| Miscellaneous Manufacturing Total | | | 465,864 | | |
| Packaging & Containers – 0.1% | |
| Graphic Packaging International, Inc. | |
| 7.875% 10/01/18 | | | 8,000 | | | | 8,220 | | |
| 9.500% 06/15/17 | | | 140,000 | | | | 149,100 | | |
| Packaging & Containers Total | | | 157,320 | | |
| Transportation – 0.2% | |
| Burlington Northern Santa Fe Corp. | |
| 6.200% 08/15/36 | | | 225,000 | | | | 259,604 | | |
| Canadian Pacific Railway Co. | |
| 4.450% 03/15/23 | | | 220,000 | | | | 224,491 | | |
| Transportation Total | | | 484,095 | | |
| Industrials Total | | | 1,585,565 | | |
| Technology – 0.2% | |
| Networking Products – 0.1% | |
| Cisco Systems, Inc. | |
| 4.950% 02/15/19 | | | 195,000 | | | | 223,083 | | |
| Networking Products Total | | | 223,083 | | |
| Semiconductors – 0.0% | |
| Freescale Semiconductor, Inc. | |
| 9.250% 04/15/18 (d) | | | 20,000 | | | | 20,800 | | |
| NXP BV/NXP Funding LLC | |
| 9.750% 08/01/18 (d) | | | 65,000 | | | | 69,225 | | |
| Semiconductors Total | | | 90,025 | | |
| Software – 0.1% | |
| First Data Corp. | |
| 8.875% 08/15/20 (d) | | | 35,000 | | | | 36,312 | | |
| 9.875% 09/24/15 | | | 35,000 | | | | 28,613 | | |
| | | Par ($) | | Value ($) | |
| Oracle Corp. | |
| 6.500% 04/15/38 | | | 190,000 | | | | 236,006 | | |
| Software Total | | | 300,931 | | |
| Technology Total | | | 614,039 | | |
| Utilities – 1.0% | |
| Electric – 0.7% | |
| Commonwealth Edison Co. | |
| 6.150% 09/15/17 | | | 200,000 | | | | 236,926 | | |
| Consolidated Edison Co. of New York | |
| 5.850% 03/15/36 | | | 185,000 | | | | 210,748 | | |
| Dominion Resources, Inc. | |
| 5.200% 08/15/19 | | | 190,000 | | | | 217,266 | | |
| Dynegy Holdings, Inc. | |
| 7.500% 06/01/15 | | | 15,000 | | | | 11,812 | | |
| 7.750% 06/01/19 | | | 16,000 | | | | 10,960 | | |
| Edison Mission Energy | |
| 7.000% 05/15/17 | | | 40,000 | | | | 28,900 | | |
| Energy Future Holdings Corp. | |
| 10.000% 01/15/20 (d) | | | 40,000 | | | | 39,710 | | |
| Indiana Michigan Power Co. | |
| 5.650% 12/01/15 | | | 175,000 | | | | 197,375 | | |
| Nevada Power Co. | |
| 6.500% 08/01/18 | | | 90,000 | | | | 108,900 | | |
| NRG Energy, Inc. | |
| 7.375% 01/15/17 | | | 40,000 | | | | 41,000 | | |
| Pacific Gas & Electric Co. | |
| 5.800% 03/01/37 | | | 200,000 | | | | 222,108 | | |
| Progress Energy, Inc. | |
| 7.750% 03/01/31 | | | 200,000 | | | | 264,021 | | |
| Electric Total | | | 1,589,726 | | |
| Gas – 0.3% | |
| Atmos Energy Corp. | |
| 6.350% 06/15/17 | | | 175,000 | | | | 200,401 | | |
| Nisource Finance Corp. | |
| 6.400% 03/15/18 | | | 200,000 | | | | 231,949 | | |
| Sempra Energy | |
| 6.500% 06/01/16 | | | 180,000 | | | | 215,363 | | |
| Gas Total | | | 647,713 | | |
| Utilities Total | | | 2,237,439 | | |
Total Corporate Fixed-Income Bonds & Notes
(Cost of $28,298,140) | | | 30,305,040 | | |
| Mortgage-Backed Securities – 9.9% | |
| Federal Home Loan Mortgage Corp. | |
| 4.500% 01/01/40 | | | 2,310,375 | | | | 2,405,341 | | |
| 4.500% 06/01/40 | | | 1,715,638 | | | | 1,786,159 | | |
| 4.500% 07/01/40 | | | 347,883 | | | | 362,182 | | |
| 4.500% 09/01/40 | | | 1,425,000 | | | | 1,483,574 | | |
See Accompanying Notes to Financial Statements.
44
Columbia Asset Allocation Fund
September 30, 2010
| Mortgage-Backed Securities (continued) | |
| | | Par ($) | | Value ($) | |
| 5.000% 06/01/36 | | | 428,462 | | | | 451,182 | | |
| 5.000% 02/01/38 | | | 604,573 | | | | 635,560 | | |
| 5.000% 04/01/38 | | | 674,999 | | | | 709,595 | | |
| 5.000% 08/01/40 | | | 549,865 | | | | 577,993 | | |
| 5.000% 09/01/40 | | | 1,824,818 | | | | 1,918,163 | | |
| 5.500% 12/01/38 | | | 675,000 | | | | 716,462 | | |
| 5.500% 01/01/39 | | | 1,249,876 | | | | 1,326,650 | | |
| 6.000% 01/01/38 | | | 675,000 | | | | 724,938 | | |
| 6.500% 02/01/11 | | | 429 | | | | 433 | | |
| 6.500% 04/01/11 | | | 4,195 | | | | 4,431 | | |
| 6.500% 05/01/11 | | | 2,125 | | | | 2,300 | | |
| 6.500% 10/01/11 | | | 4,706 | | | | 4,845 | | |
| 6.500% 07/01/16 | | | 6,961 | | | | 7,471 | | |
| 6.500% 04/01/26 | | | 19,083 | | | | 21,064 | | |
| 6.500% 06/01/26 | | | 25,719 | | | | 28,388 | | |
| 6.500% 02/01/27 | | | 22,704 | | | | 25,135 | | |
| 6.500% 06/01/31 | | | 26,906 | | | | 29,875 | | |
| 6.500% 07/01/31 | | | 8,171 | | | | 9,072 | | |
| 7.000% 07/01/28 | | | 29,903 | | | | 33,864 | | |
| 7.000% 04/01/29 | | | 20,074 | | | | 22,733 | | |
| 7.000% 01/01/30 | | | 4,390 | | | | 4,976 | | |
| 7.000% 06/01/31 | | | 5,731 | | | | 6,502 | | |
| 7.000% 08/01/31 | | | 64,404 | | | | 73,072 | | |
| 7.500% 08/01/15 | | | 268 | | | | 289 | | |
| 7.500% 01/01/30 | | | 43,133 | | | | 49,184 | | |
| 8.000% 09/01/15 | | | 15,399 | | | | 16,738 | | |
| TBA, | |
| 5.000% 12/01/40 (e) | | | 725,000 | | | | 761,476 | | |
| Federal National Mortgage Association | |
| 4.000% 01/01/25 | | | 462,795 | | | | 483,786 | | |
| 4.500% 04/01/40 | | | 830,741 | | | | 866,057 | | |
| 4.500% 05/01/40 | | | 253,310 | | | | 264,079 | | |
| 5.000% 01/01/38 | | | 662,584 | | | | 698,030 | | |
| 5.000% 05/01/40 | | | 1,356,685 | | | | 1,429,051 | | |
| 5.500% 03/01/37 | | | 1,062,756 | | | | 1,132,894 | | |
| 5.500% 06/01/37 | | | 300,493 | | | | 319,697 | | |
| 5.500% 04/01/39 | | | 681,535 | | | | 725,091 | | |
| 6.000% 03/01/39 | | | 316,512 | | | | 340,571 | | |
| 6.500% 03/01/11 | | | 572 | | | | 619 | | |
| 7.000% 03/01/15 | | | 25,853 | | | | 27,658 | | |
| 7.000% 07/01/16 | | | 6,561 | | | | 7,150 | | |
| 7.000% 02/01/31 | | | 17,432 | | | | 19,789 | | |
| 7.000% 07/01/31 | | | 58,023 | | | | 65,908 | | |
| 7.000% 07/01/32 | | | 5,206 | | | | 5,909 | | |
| 7.500% 06/01/15 | | | 5,144 | | | | 5,603 | | |
| 7.500% 08/01/15 | | | 27,438 | | | | 29,886 | | |
| 7.500% 09/01/15 | | | 9,063 | | | | 9,871 | | |
| 7.500% 02/01/31 | | | 19,674 | | | | 22,463 | | |
| 7.500% 08/01/31 | | | 15,511 | | | | 17,720 | | |
| 8.000% 12/01/29 | | | 18,451 | | | | 21,386 | | |
| 8.000% 04/01/30 | | | 27,356 | | | | 31,427 | | |
| | | Par ($) | | Value ($) | |
| 8.000% 05/01/30 | | | 2,585 | | | | 2,996 | | |
| 8.000% 07/01/31 | | | 23,545 | | | | 27,302 | | |
| Government National Mortgage Association | |
| 6.000% 04/15/13 | | | 1,672 | | | | 1,814 | | |
| 6.500% 05/15/13 | | | 5,774 | | | | 6,268 | | |
| 6.500% 06/15/13 | | | 1,845 | | | | 2,003 | | |
| 6.500% 08/15/13 | | | 1,569 | | | | 1,703 | | |
| 6.500% 11/15/13 | | | 11,085 | | | | 12,021 | | |
| 6.500% 07/15/14 | | | 10,555 | | | | 11,459 | | |
| 6.500% 01/15/29 | | | 4,059 | | | | 4,560 | | |
| 6.500% 03/15/29 | | | 59,823 | | | | 67,204 | | |
| 6.500% 04/15/29 | | | 82,243 | | | | 92,391 | | |
| 6.500% 05/15/29 | | | 73,365 | | | | 82,417 | | |
| 6.500% 07/15/31 | | | 33,894 | | | | 38,034 | | |
| 7.000% 11/15/13 | | | 70,532 | | | | 74,901 | | |
| 7.000% 05/15/29 | | | 8,663 | | | | 9,894 | | |
| 7.000% 09/15/29 | | | 22,082 | | | | 25,219 | | |
| 7.000% 06/15/31 | | | 21,839 | | | | 24,967 | | |
| 7.500% 06/15/23 | | | 681 | | | | 685 | | |
| 7.500% 01/15/26 | | | 16,289 | | | | 18,585 | | |
| 7.500% 09/15/29 | | | 23,079 | | | | 26,424 | | |
| 8.000% 07/15/25 | | | 8,535 | | | | 9,280 | | |
| 8.500% 12/15/30 | | | 2,531 | | | | 3,039 | | |
| 9.000% 12/15/17 | | | 15,071 | | | | 16,701 | | |
Total Mortgage-Backed Securities
(Cost of $20,902,457) | | | 21,284,159 | | |
| Government & Agency Obligations – 8.0% | |
| Foreign Government Obligations – 0.5% | |
| Province of Ontario | |
| 5.450% 04/27/16 | | | 500,000 | | | | 590,151 | | |
| Province of Quebec | |
| 4.625% 05/14/18 | | | 435,000 | | | | 495,506 | | |
| Foreign Government Obligations Total | | | 1,085,657 | | |
| U.S. Government Agencies – 0.1% | |
| Federal Home Loan Bank | |
| 5.500% 08/13/14 | | | 165,000 | | | | 192,288 | | |
| Federal Home Loan Mortgage Corp. | |
| 3.125% 10/25/10 (j) | | | 85,000 | | | | 85,166 | | |
| U.S. Government Agencies Total | | | 277,454 | | |
| U.S. Government Obligations – 7.4% | |
| U.S. Treasury Bonds | |
| 5.375% 02/15/31 | | | 4,280,000 | | | | 5,510,500 | | |
| U.S. Treasury Inflation Indexed Bonds | |
| 2.125% 02/15/40 | | | 75,649 | | | | 84,532 | | |
| 2.375% 01/15/25 | | | 491,542 | | | | 565,235 | | |
| 3.875% 04/15/29 | | | 371,322 | | | | 516,370 | | |
| U.S. Treasury Inflation Indexed Notes | |
| 1.625% 01/15/15 | | | 376,774 | | | | 402,648 | | |
See Accompanying Notes to Financial Statements.
45
Columbia Asset Allocation Fund
September 30, 2010
| Government & Agency Obligations (continued) | |
| | | Par ($) | | Value ($) | |
| 1.875% 07/15/13 | | | 249,270 | | | | 264,927 | | |
| 2.000% 01/15/14 | | | 277,269 | | | | 297,372 | | |
| 2.000% 01/15/16 | | | 269,110 | | | | 294,928 | | |
| 2.125% 01/15/19 | | | 284,318 | | | | 320,079 | | |
| 2.625% 07/15/17 | | | 220,895 | | | | 254,685 | | |
| 3.000% 07/15/12 | | | 1,685,389 | | | | 1,789,672 | | |
| U.S. Treasury Notes | |
| 1.375% 10/15/12 | | | 3,720,000 | | | | 3,789,750 | | |
| 2.125% 11/30/14 | | | 850,000 | | | | 888,383 | | |
| 2.375% 10/31/14 | | | 750,000 | | | | 791,602 | | |
| U.S. Government Obligations Total | | | 15,770,683 | | |
Total Government & Agency Obligations
(Cost of $15,802,340) | | | 17,133,794 | | |
| Commercial Mortgage-Backed Securities – 5.1% | |
| Bear Stearns Commercial Mortgage Securities | |
| 4.804% 09/11/42 | | | 799,749 | | | | 840,224 | | |
5.742% 09/11/42
(10/01/10) (f)(g) | | | 1,000,000 | | | | 1,109,636 | | |
| 5.746% 09/11/42 | | | 707,000 | | | | 788,948 | | |
| Commercial Mortgage Pass Through Certificates | |
5.234% 07/10/37
(10/01/10) (f)(g) | | | 980,000 | | | | 1,020,335 | | |
| Credit Suisse First Boston Mortgage Securities Corp. | |
| 4.681% 04/15/37 | | | 232,847 | | | | 242,766 | | |
| GE Capital Commercial Mortgage Corp. | |
| 4.819% 01/10/38 | | | 725,000 | | | | 772,137 | | |
| Greenwich Capital Commercial Funding Corp. | |
5.190% 04/10/37
(10/01/10) (f)(g) | | | 350,000 | | | | 377,258 | | |
| JPMorgan Chase Commercial Mortgage Securities Corp. | |
| 4.134% 10/15/37 | | | 264,935 | | | | 276,128 | | |
4.824% 10/15/42
(10/01/10) (f)(g) | | | 361,854 | | | | 382,394 | | |
5.201% 08/12/37
(10/01/10) (f)(g) | | | 489,318 | | | | 517,223 | | |
| 5.440% 06/12/47 | | | 1,020,000 | | | | 1,069,153 | | |
| 5.447% 06/12/47 | | | 509,000 | | | | 545,337 | | |
| Morgan Stanley Capital I | |
| 5.325% 12/15/43 | | | 800,000 | | | | 877,340 | | |
| 5.380% 04/15/49 | | | 289,873 | | | | 297,805 | | |
| 5.809% 12/12/49 | | | 1,500,000 | | | | 1,587,937 | | |
| Nationslink Funding Corp. | |
| 7.104% 01/22/26 | | | 380,321 | | | | 418,106 | | |
Total Commercial Mortgage-Backed Securities
(Cost of $10,236,926) | | | 11,122,727 | | |
| Collateralized Mortgage Obligations – 1.4% | |
| | | Par ($) | | Value ($) | |
| Agency – 1.2% | |
| Federal Home Loan Mortgage Corp. | |
| 4.500% 02/15/18 | | | 277,199 | | | | 291,280 | | |
| 4.500% 09/25/24 | | | 358,671 | | | | 375,205 | | |
| 5.000% 05/15/33 | | | 720,000 | | | | 778,118 | | |
| 6.000% 02/15/28 | | | 152,905 | | | | 153,469 | | |
| Federal National Mortgage Association | |
| 4.000% 12/25/20 | | | 377,308 | | | | 390,340 | | |
| 5.000% 12/25/15 | | | 42,364 | | | | 42,359 | | |
| 5.000% 12/25/16 | | | 275,000 | | | | 282,407 | | |
| Government National Mortgage Association | |
| 4.000% 05/16/39 | | | 204,583 | | | | 209,776 | | |
| Agency Total | | | 2,522,954 | | |
| Non-Agency – 0.2% | |
| American Mortgage Trust | |
| 8.445% 09/27/22 (b)(f) | | | 5,818 | | | | 3,527 | | |
| Countrywide Alternative Loan Trust | |
| 5.500% 10/25/35 | | | 455,884 | | | | 393,123 | | |
| Non-Agency Total | | | 396,650 | | |
Total Collateralized Mortgage Obligations
(Cost of $2,962,729) | | | 2,919,604 | | |
| Asset-Backed Securities – 0.7% | |
| Franklin Auto Trust | |
| 5.360% 05/20/16 | | | 989,000 | | | | 1,013,253 | | |
| Green Tree Financial Corp. | |
| 6.870% 01/15/29 | | | 95,754 | | | | 100,390 | | |
| Harley-Davidson Motorcycle Trust | |
| 5.350% 03/15/13 | | | 309,616 | | | | 314,560 | | |
Total Asset-Backed Securities
(Cost of $1,391,606) | | | 1,428,203 | | |
| Convertible Preferred Stocks – 0.4% | |
| | | Shares | | | |
| Energy – 0.1% | |
| Oil, Gas & Consumable Fuels – 0.1% | |
| Apache Corp., 6.000% | | | 4,020 | | | | 233,160 | | |
| Oil, Gas & Consumable Fuels Total | | | 233,160 | | |
| Energy Total | | | 233,160 | | |
| Financials – 0.2% | |
| Commercial Banks – 0.1% | |
| Fifth Third Bancorp., 8.500% | | | 900 | | | | 115,313 | | |
| Commercial Banks Total | | | 115,313 | | |
See Accompanying Notes to Financial Statements.
46
Columbia Asset Allocation Fund
September 30, 2010
| Convertible Preferred Stocks (continued) | |
| | | Shares | | Value ($) | |
| Diversified Financial Services – 0.1% | |
| Citigroup, Inc., 7.500% | | | 2,098 | | | | 248,634 | | |
| Diversified Financial Services Total | | | 248,634 | | |
| Financials Total | | | 363,947 | | |
| Industrials – 0.1% | |
| Automobiles – 0.1% | |
| Ford Motor Co. Capital Trust II, | |
| 6.500% | | | 6,300 | | | | 301,833 | | |
| Automobiles Total | | | 301,833 | | |
| Industrials Total | | | 301,833 | | |
Total Convertible Preferred Stocks
(Cost of $846,075) | | | 898,940 | | |
| Convertible Bonds – 0.1% | |
| | | Par ($) | | | |
| Consumer Cyclical – 0.0% | |
| Auto Manufacturers – 0.0% | |
| Navistar International Corp. | |
| 3.000% 10/15/14 | | | 80,000 | | | | 89,900 | | |
| Auto Manufacturers Total | | | 89,900 | | |
| Consumer Cyclical Total | | | 89,900 | | |
| Energy – 0.0% | |
| Oil & Gas Services – 0.0% | |
| Cameron International Corp. | |
| 2.500% 06/15/26 | | | 13,000 | | | | 16,786 | | |
| Oil & Gas Services Total | | | 16,786 | | |
| Energy Total | | | 16,786 | | |
| Technology – 0.1% | |
| Computers & Peripherals – 0.1% | |
| EMC Corp. | |
| 1.750% 12/01/13 | | | 140,000 | | | | 192,675 | | |
| Computers & Peripherals Total | | | 192,675 | | |
| Technology Total | | | 192,675 | | |
Total Convertible Bonds
(Cost of $287,159) | | | 299,361 | | |
| Preferred Stock – 0.1% | |
| | | Shares | | Value ($) | |
| Consumer Staples – 0.1% | |
| Household Products – 0.1% | |
| Henkel AG & Co., KGaA | | | 3,429 | | | | 184,438 | | |
| Household Products Total | | | 184,438 | | |
| Consumer Staples Total | | | 184,438 | | |
Total Preferred Stock
(Cost of $169,839) | | | 184,438 | | |
| Investment Company – 0.1% | |
| iShares MSCI EAFE Index Fund | | | 4,901 | | | | 269,163 | | |
Total Investment Company
(Cost of $245,487) | | | 269,163 | | |
| Purchased Call Options – 0.0% | |
| | | Contracts | | | |
CBOE SPX Volatility Index
strike price $30.00,
expiration 12/30/10 | | | 62 | | | | 22,320 | | |
Total Purchased Call Options
(Cost of $16,926) | | | 22,320 | | |
| | | Par ($) | | | |
| Short-Term Obligation – 3.9% | |
Repurchase agreement with
Fixed Income Clearing Corp.,
dated 09/30/10, due on
10/01/10, at 0.230%,
collateralized by
U.S. Government Agency
obligations with various
maturities to 11/20/14,
market value $8,628,125
(repurchase proceeds
$8,442,054) | | | 8,442,000 | | | | 8,442,000 | | |
Total Short-Term Obligation
(Cost of $8,442,000) | | | 8,442,000 | | |
Total Investments – 99.5%
(Cost of $192,263,579) (k) | | | 213,911,217 | | |
| Other Assets & Liabilities, Net – 0.5% | | | 983,236 | | |
| Net Assets – 100.0% | | | 214,894,453 | | |
Notes to Investment Portfolio:
(a) Non-income producing security.
(b) Represents fair value as determined in good faith under procedures approved by the Board of Trustees. The value of these securities amounted to $70,300, which represents less than 0.1% of net assets.
(c) All or a portion of this security is pledged as collateral for open written option contracts. At September 30, 2010, market value of this security pledged amounted to $391,613.
See Accompanying Notes to Financial Statements.
47
Columbia Asset Allocation Fund
September 30, 2010
(d) Security exempt from registration pursuant to Rule 144A under the Securities Act of 1933. These securities may be resold in transactions exempt from registration, normally to qualified institutional buyers. At September 30, 2010, these securities, which are not illiquid, amounted to $5,991,336, which represents 2.8% of net assets.
(e) Security purchased on a delayed delivery basis.
(f) The interest rate shown on floating rate or variable rate securities reflects the rate at September 30, 2010.
(g) Parenthetical date represents the effective maturity date for the security.
(h) Security is guaranteed by the Federal Deposit Insurance Corporation.
(i) The issuer has filed for bankruptcy protection under Chapter 11 and is in default of certain debt covenants. Income is not being accrued. At September 30, 2010, the value of this security amounted to $77,437 which represents less than 0.1% of net assets.
(j) All or a portion of this security is held as collateral for open futures contracts. At September 30, 2010, market value of the security pledged amounted to $70,136.
(k) Cost for federal income tax purposes is $193,725,345.
The following table summarizes the inputs used, as of September 30, 2010, in valuing the Fund's assets:
| Description | | Quoted
Prices
(Level 1) | | Other
Significant
Observable
Inputs
(Level 2) | | Significant
Unobservable
Inputs
(Level 3) | | Total | |
| Common Stocks | |
Consumer
Discretionary | | $ | 12,099,675 | | | $ | 1,761,885 | | | $ | — | | | $ | 13,861,560 | | |
| Consumer Staples | | | 7,605,711 | | | | 1,254,045 | | | | 17,139 | | | | 8,876,895 | | |
| Energy | | | 14,131,531 | | | | 1,160,740 | | | | — | | | | 15,292,271 | | |
| Financials | | | 16,229,572 | | | | 3,693,053 | | | | — | | | | 19,922,625 | | |
| Health Care | | | 11,405,844 | | | | 1,112,775 | | | | — | | | | 12,518,619 | | |
| Industrials | | | 13,018,351 | | | | 1,910,242 | | | | — | | | | 14,928,593 | | |
Information
Technology | | | 18,363,232 | | | | 951,115 | | | | — | | | | 19,314,347 | | |
| Materials | | | 5,655,879 | | | | 1,320,893 | | | | — | | | | 6,976,772 | | |
Telecommunication
Services | | | 2,052,326 | | | | 1,130,984 | | | | — | | | | 3,183,310 | | |
| Utilities | | | 3,747,239 | | | | 979,237 | | | | — | | | | 4,726,476 | | |
| Total Common Stocks | | | 104,309,360 | | | | 15,274,969 | | | | 17,139 | | | | 119,601,468 | | |
| Corporate Fixed-Income Bonds & Notes | |
| Basic Materials | | | — | | | | 978,848 | | | | — | | | | 978,848 | | |
| Communications | | | — | | | | 5,530,291 | | | | 49,634 | | | | 5,579,925 | | |
| Consumer Cyclical | | | — | | | | 1,214,588 | | | | — | | | | 1,214,588 | | |
| Consumer Non-Cyclical | | | — | | | | 3,206,635 | | | | — | | | | 3,206,635 | | |
| Energy | | | — | | | | 4,106,918 | | | | — | | | | 4,106,918 | | |
| Financials | | | — | | | | 10,781,083 | | | | — | | | | 10,781,083 | | |
| Industrials | | | — | | | | 1,585,565 | | | | — | | | | 1,585,565 | | |
| Technology | | | — | | | | 614,039 | | | | — | | | | 614,039 | | |
| Utilities | | | — | | | | 2,237,439 | | | | — | | | | 2,237,439 | | |
Total Corporate
Fixed-Income
Bonds & Notes | | | — | | | | 30,255,406 | | | | 49,634 | | | | 30,305,040 | | |
Total Mortgage-Backed
Securities | | | 761,476 | | | | 20,522,683 | | | | — | | | | 21,284,159 | | |
Government & Agency
Obligations | |
Foreign Government
Obligations | | | — | | | | 1,085,657 | | | | — | | | | 1,085,657 | | |
U.S. Government
Agencies | | | — | | | | 277,454 | | | | — | | | | 277,454 | | |
U.S. Government
Obligations | | | 15,770,683 | | | | — | | | | — | | | | 15,770,683 | | |
| Description | | Quoted
Prices
(Level 1) | | Other
Significant
Observable
Inputs
(Level 2) | | Significant
Unobservable
Inputs
(Level 3) | | Total | |
Total Government &
Agency Obligations | | $ | 15,770,683 | | | $ | 1,363,111 | | | $ | — | | | $ | 17,133,794 | | |
Total Commercial
Mortgage-Backed
Securities | | | — | | | | 11,122,727 | | | | — | | | | 11,122,727 | | |
Collateralized Mortgage
Obligations | | | | | | | | | | | | | | | | | |
| Agency | | | — | | | | 2,522,954 | | | | — | | | | 2,522,954 | | |
| Non- Agency | | | — | | | | 393,123 | | | | 3,527 | | | | 396,650 | | |
Total Collateralized
Mortgage Obligations | | | — | | | | 2,916,077 | | | | 3,527 | | | | 2,919,604 | | |
Total Asset-Backed
Securities | | | — | | | | 1,428,203 | | | | — | | | | 1,428,203 | | |
Convertible Preferred
Stocks | |
| Energy | | | 233,160 | | | | — | | | | — | | | | 233,160 | | |
| Financials | | | 248,634 | | | | 115,313 | | | | — | | | | 363,947 | | |
| Industrials | | | 301,833 | | | | — | | | | — | | | | 301,833 | | |
Total Convertible
Preferred Stocks | | | 783,627 | | | | 115,313 | | | | — | | | | 898,940 | | |
| Total Convertible Bonds | | | — | | | | 299,361 | | | | — | | | | 299,361 | | |
| Total Preferred Stock | | | — | | | | 184,438 | | | | — | | | | 184,438 | | |
Total Investment
Company | | | 269,163 | | | | — | | | | — | | | | 269,163 | | |
Total Purchased Call
Options | | | 22,320 | | | | — | | | | — | | | | 22,320 | | |
Total Short-Term
Obligation | | | — | | | | 8,442,000 | | | | — | | | | 8,442,000 | | |
| Total Investments | | | 121,916,629 | | | | 91,924,288 | | | | 70,300 | | | | 213,911,217 | | |
Unrealized Appreciation
on Futures Contracts | | | 151,191 | | | | — | | | | — | | | | 151,191 | | |
Unrealized Depreciation
on Futures Contracts | | | (49,505 | ) | | | — | | | | — | | | | (49,505 | ) | |
Unrealized Appreciation
on Forward Foreign
Currency Exchange
Contracts | | | — | | | | 98,839 | | | | — | | | | 98,839 | | |
Unrealized Depreciation
on Forward Foreign
Currency Exchange
Contracts | | | — | | | | (49,148 | ) | | | — | | | | (49,148 | ) | |
Total of Written Option
Contracts | | | (8,801 | ) | | | — | | | | — | | | | (8,801 | ) | |
| Total | | $ | 122,009,514 | | | $ | 91,973,979 | | | $ | 70,300 | | | $ | 214,053,793 | | |
The Fund's assets assigned to the Level 2 input category are generally valued using the market approach, in which a security's value is determined through reference to prices and information from market transactions for similar or identical assets.
These assets include foreign securities for which a third party statistical pricing service may be employed for purposes of fair market valuation. The models utilized byt the third party statistical pricing service take into account a security's correlation to available market data including, but not limited to, intraday index, ADR, and Exchange Traded Funds ("ETF") movements.
Certain short-term obligations may be valued using amortized cost, an income approach which converts future cash flows to a present value based upon the discount or premium at purchase.
There were no significant transfers of financial assets between Levels 1 and 2 during the period.
See Accompanying Notes to Financial Statements.
48
Columbia Asset Allocation Fund
September 30, 2010
The following table reconciles asset balances for the year ending September 30, 2010, in which significant unobservable inputs (Level 3) were used in determining value:
Investments
in Securities | | Balance as of
September 30,
2009 | | Accrued
Discounts/
(Premiums) | | Realized
Gain (Loss) | | Change in
Unrealized
Appreciation
(Depreciation) | | Purchases | | Sales | | Transfers
into
Level 3 | | Transfers
out of
Level 3 | | Balance
as of
September 30,
2010 | |
Common Stock
Consumer Staples | | $ | — | | | $ | — | | | $ | — | | | $ | (97,818 | ) | | $ | — | | | $ | — | | | $ | 114,957 | | | $ | — | | | $ | 17,139 | | |
Corporate Fixed-Income
Bonds Notes Communications | | | — | | | | — | | | | — | | | | — | | | | 49,634 | | | | — | | | | — | | | | — | | | | 49,634 | | |
Collateralized Mortgage
Obligations Non Agency | | | — | | | | — | | | | 74 | | | | 289 | | | | — | | | | (921 | ) | | | 4,085 | | | | — | | | | 3,527 | | |
| | | $ | — | | | $ | — | | | $ | 74 | | | $ | (97,529 | ) | | $ | 49,634 | | | $ | (921 | ) | | $ | 119,042 | | | $ | — | | | $ | 70,300 | | |
The information in the above reconciliation represents fiscal year to date activity for any securities identified as using Level 3 inputs at either the beginning or the end of the current fiscal period.
The change in unrealized appreciation attributable to securities owned at September 30, 2010, which were valued using significant unobservable inputs (Level 3) amounted to $(97,529).
Financial Assets were transferred from Level 2 to Level 3 due to be provided by valuation the pricing vendor discontinuing coverage, as a result the security was fair valued by management.
The following table shows transfers between Level 2 and Level 3 of the fair value hierarchy.
| Transfers In | | Transfers Out | |
| Level 2 | | Level 3 | | Level 2 | | Level 3 | |
| $ | — | | | $ | 119,042 | | | $ | 119,042 | | | $ | — | | |
For more information on valuation inputs, and their aggregation into the levels used in the tables above, please refer to the Security Valuation section in the accompanying Notes to Financial Statements.
Investments in affiliates during the year ended September 30, 2010:
| Affiliate | | Value,
beginning
of period | | Purchases | | Sales
Proceeds | | Interest
Income | | Value,
end of
period | |
Merrill Lynch & Co.,
Inc. 6.050%
08/15/12 | | $ | 373,270 | | | $ | — | | | $ | 374,420 | | | $ | 12,352 | | | $ | — | | |
As of May 1, 2010, this company was no longer an affiliate of the Fund. The above table reflects activity for the period from October 1, 2009 through April 30, 2010.
At September 30, 2010, the Fund held the following open long futures contracts:
Risk
Exposure
Equity
Risk | | Number of
Contracts | | Value | | Aggregate
Face Value | | Expiration
Date | | Unrealized
Appreciation | |
S&P 500
Index
Futures | | | 15 | | | $ | 4,262,625 | | | $ | 4,111,434 | | | Dec-2010 | | $ | 151,191 | | |
At September 30, 2010, the Fund held the following open short futures contracts:
Risk
Exposure
Interest
Rate
Risk | | Number of
Contracts | | Value | | Aggregate
Face Value | | Expiration
Date | | Unrealized
(Depreciation) | |
5-Year U.S.
Treasury
Notes | | | 40 | | | $ | 4,834,687 | | | $ | 4,785,182 | | | Dec.-2010 | | $ | (49,505 | ) | |
As of September 30, 2010, cash of $965,000 was pledged as collateral for open futures contracts.
At September 30, 2010, the Fund held the following written call option contracts:
| Name of Issuer | | Strike
Price | | Number of
Contracts | | Expiration
Date | | Premium | | Value | |
CBOE SPX
Volitility Index | | $ | 42.5 | | | | 62 | | | 12/22/10 | | $ | 4,588 | | | $ | (8,060 | ) | |
| XL Group PLC | | | 23 | | | | 39 | | | 10/16/10 | | | 586 | | | | (741 | ) | |
| Total written call options: (proceeds $5,174) | | $ | (8,801 | ) | |
| | | | |
For the year ended September 30, 2010 transactions in written call option contracts were as follows:
| Equity Risk | | Number of
contracts | | Premium
received | |
| Options outstanding at September 30, 2009 | | | — | | | | — | | |
| Options written | | | 1,309 | | | $ | 42,984 | | |
Options terminated in closing
purchase transactions | | | (423 | ) | | | (18,650 | ) | |
| Options exercised | | | (317 | ) | | | (3,738 | ) | |
| Options expired | | | (468 | ) | | | (15,422 | ) | |
| Options outstanding at September 30, 2010 | | | 101 | | | $ | 5,174 | | |
See Accompanying Notes to Financial Statements.
49
Columbia Asset Allocation Fund
September 30, 2010
Forward foreign currency exchange contracts outstanding on September 30, 2010 are:
Foreign Exchange Rate Risk
| Counterparty | | Forward
Foreign
Currency
Exchange
Contracts
to Buy | | Value | | Aggregate
Face Value | | Settlement
Date | | Unrealized
Appreciation
(Depreciation) | |
| UBS AG | | AUD | | $ | 851,816 | | | $ | 788,203 | | | 11/18/10 | | $ | 63,613 | | |
| UBS AG | | CAD | | | 88,349 | | | | 88,789 | | | 11/18/10 | | | (440 | ) | |
| UBS AG | | CHF | | | 313,571 | | | | 299,358 | | | 11/18/10 | | | 14,213 | | |
| UBS AG | | EUR | | | 87,218 | | | | 82,380 | | | 11/18/10 | | | 4,838 | | |
| UBS AG | | EUR | | | 35,432 | | | | 35,544 | | | 11/18/10 | | | (112 | ) | |
| UBS AG | | GBP | | | 909,257 | | | | 905,614 | | | 11/18/10 | | | 3,643 | | |
| UBS AG | | JPY | | | 235,134 | | | | 230,193 | | | 11/18/10 | | | 4,941 | | |
| UBS AG | | JPY | | | 113,894 | | | | 112,633 | | | 11/18/10 | | | 1,261 | | |
| UBS AG | | SGD | | | 235,706 | | | | 229,519 | | | 11/18/10 | | | 6,187 | | |
| | | $ | 98,144 | | |
| Counterparty | | Forward
Foreign
Currency
Exchange
Contracts
to Sell | | Value | | Aggregate
Face Value | | Settlement
Date | | Unrealized
Appreciation
(Depreciation) | |
| UBS AG | | AUD | | $ | 69,222 | | | $ | 63,425 | | | 11/18/10 | | $ | (5,797 | ) | |
| UBS AG | | CAD | | | 607,761 | | | | 605,714 | | | 11/18/10 | | | (2,047 | ) | |
| UBS AG | | DKK | | | 52,123 | | | | 49,258 | | | 11/18/10 | | | (2,865 | ) | |
| UBS AG | | DKK | | | 51,940 | | | | 48,484 | | | 11/18/10 | | | (3,456 | ) | |
| UBS AG | | EUR | | | 69,502 | | | | 64,874 | | | 11/18/10 | | | (4,628 | ) | |
| UBS AG | | JPY | | | 87,829 | | | | 87,972 | | | 11/18/10 | | | 143 | | |
| UBS AG | | KRW | | | 304,352 | | | | 294,954 | | | 11/18/10 | | | (9,398 | ) | |
| UBS AG | | NOK | | | 137,911 | | | | 131,574 | | | 11/18/10 | | | (6,337 | ) | |
| UBS AG | | SEK | | | 53,642 | | | | 49,198 | | | 11/18/10 | | | (4,444 | ) | |
| UBS AG | | THB | | | 52,734 | | | | 52,732 | | | 11/18/10 | | | (2 | ) | |
| UBS AG | | TWD | | | 517,401 | | | | 507,779 | | | 11/18/10 | | | (9,622 | ) | |
| | | $ | (48,453 | ) | |
At September 30, 2010, the asset allocation of the Fund is as follows:
| Asset Allocation (Unaudited) | | % of
Net Assets | |
| Common Stocks | | | 55.7 | | |
| Corporate Fixed-Income Bonds & Notes | | | 14.1 | | |
| Mortgaged-Backed Securities | | | 9.9 | | |
| Government & Agency Obligations | | | 8.0 | | |
| Commercial Mortgage-Backed Securities | | | 5.1 | | |
| Collateralized Mortgage Obligations | | | 1.4 | | |
| Asset-Backed Securities | | | 0.7 | | |
| Convertible Preferred Stocks | | | 0.4 | | |
| Convertible Bonds | | | 0.1 | | |
| Preferred Stock | | | 0.1 | | |
| Purchased Call Options | | | 0.0 | * | |
| | | | 95.5 | | |
| Investment Company | | | 0.1 | | |
| Short-Term Obligation | | | 3.9 | | |
| Other Assets & Liabilities, Net | | | 0.5 | | |
| | | | 100.0 | | |
* Rounds to less than 0.01%.
| Acronym | | Name | |
| ADR | | American Depositary Receipt | |
|
| AUD | | Australian Dollar | |
|
| CAD | | Canadian Dollar | |
|
| CHF | | Swiss Franc | |
|
| DKK | | Danish Krone | |
|
| ETF | | Exchange Traded Fund | |
|
| EUR | | Euro | |
|
| GBP | | Pound Sterling | |
|
| GDR | | Global Depositary Receipt | |
|
| JPY | | Japanese Yen | |
|
| KRW | | South Korean Won | |
|
| NOK | | Norwegian Krone | |
|
| PIK | | Payment-in-Kind | |
|
| SEK | | Swedish Krona | |
|
| SGD | | Singapore Dollar | |
|
| TBA | | To Be Announced | |
|
| THB | | Thailand Baht | |
|
| TWD | | Taiwan Dollar | |
|
See Accompanying Notes to Financial Statements.
50
Investment Portfolio – Columbia Large Cap Growth Fund
September 30, 2010
| Common Stocks – 100.4% | |
| | | Shares | | Value ($) | |
| Consumer Discretionary – 13.7% | |
| Auto Components – 1.3% | |
| Autoliv, Inc. | | | 242,500 | | | | 15,842,525 | | |
| Auto Components Total | | | 15,842,525 | | |
| Automobiles – 0.8% | |
| Ford Motor Co. (a) | | | 785,600 | | | | 9,615,744 | | |
| Automobiles Total | | | 9,615,744 | | |
| Hotels, Restaurants & Leisure – 2.4% | |
| Las Vegas Sands Corp. (a) | | | 336,600 | | | | 11,730,510 | | |
| McDonald's Corp. | | | 98,900 | | | | 7,369,039 | | |
| Starbucks Corp. | | | 404,200 | | | | 10,339,436 | | |
| Hotels, Restaurants & Leisure Total | | | 29,438,985 | | |
| Internet & Catalog Retail – 1.5% | |
| Amazon.com, Inc. (a) | | | 121,400 | | | | 19,067,084 | | |
| Internet & Catalog Retail Total | | | 19,067,084 | | |
| Media – 1.2% | |
| Time Warner Cable, Inc. | | | 44,800 | | | | 2,418,752 | | |
| Viacom, Inc., Class B | | | 327,700 | | | | 11,859,463 | | |
| Media Total | | | 14,278,215 | | |
| Multiline Retail – 2.2% | |
| Kohl's Corp. (a) | | | 188,300 | | | | 9,919,644 | | |
| Target Corp. | | | 316,400 | | | | 16,908,416 | | |
| Multiline Retail Total | | | 26,828,060 | | |
| Specialty Retail – 3.7% | |
| Dick's Sporting Goods, Inc. (a) | | | 192,000 | | | | 5,383,680 | | |
| GameStop Corp., Class A (a) | | | 402,500 | | | | 7,933,275 | | |
| Limited Brands, Inc. | | | 350,800 | | | | 9,394,424 | | |
| Lowe's Companies, Inc. | | | 241,900 | | | | 5,391,951 | | |
| TJX Companies, Inc. | | | 376,000 | | | | 16,780,880 | | |
| Specialty Retail Total | | | 44,884,210 | | |
| Textiles, Apparel & Luxury Goods – 0.6% | |
| Lululemon Athletica, Inc. (a) | | | 167,000 | | | | 7,468,240 | | |
| Textiles, Apparel & Luxury Goods Total | | | 7,468,240 | | |
| Consumer Discretionary Total | | | 167,423,063 | | |
| Consumer Staples – 8.7% | |
| Beverages – 2.5% | |
| Coca-Cola Co. | | | 256,300 | | | | 14,998,676 | | |
| Dr Pepper Snapple Group, Inc. | | | 75,329 | | | | 2,675,686 | | |
| PepsiCo, Inc. | | | 184,800 | | | | 12,278,112 | | |
| Beverages Total | | | 29,952,474 | | |
| Food & Staples Retailing – 2.1% | |
| Wal-Mart Stores, Inc. | | | 354,300 | | | | 18,962,136 | | |
| Whole Foods Market, Inc. (a) | | | 162,900 | | | | 6,045,219 | | |
| Food & Staples Retailing Total | | | 25,007,355 | | |
| | | Shares | | Value ($) | |
| Food Products – 1.0% | |
| Hershey Co. | | | 176,400 | | | | 8,394,876 | | |
Mead Johnson Nutrition Co.,
Class A | | | 68,700 | | | | 3,909,717 | | |
| Food Products Total | | | 12,304,593 | | |
| Personal Products – 1.4% | |
| Avon Products, Inc. | | | 405,700 | | | | 13,027,027 | | |
Estée Lauder Companies, Inc.,
Class A | | | 69,200 | | | | 4,375,516 | | |
| Personal Products Total | | | 17,402,543 | | |
| Tobacco – 1.7% | |
| Philip Morris International, Inc. | | | 373,100 | | | | 20,901,062 | | |
| Tobacco Total | | | 20,901,062 | | |
| Consumer Staples Total | | | 105,568,027 | | |
| Energy – 8.5% | |
| Energy Equipment & Services – 2.5% | |
| Dresser-Rand Group, Inc. (a) | | | 115,100 | | | | 4,246,039 | | |
| Halliburton Co. | | | 530,195 | | | | 17,533,549 | | |
| Nabors Industries Ltd. (a) | | | 439,400 | | | | 7,935,564 | | |
| Energy Equipment & Services Total | | | 29,715,152 | | |
| Oil, Gas & Consumable Fuels – 6.0% | |
| Apache Corp. | | | 84,900 | | | | 8,299,824 | | |
| Chevron Corp. | | | 182,500 | | | | 14,791,625 | | |
| Continental Resources, Inc. (a) | | | 163,300 | | | | 7,570,588 | | |
| EOG Resources, Inc. | | | 80,700 | | | | 7,502,679 | | |
| Exxon Mobil Corp. | | | 287,500 | | | | 17,764,625 | | |
| Occidental Petroleum Corp. | | | 143,242 | | | | 11,215,848 | | |
| Peabody Energy Corp. | | | 131,100 | | | | 6,425,211 | | |
| Oil, Gas & Consumable Fuels Total | | | 73,570,400 | | |
| Energy Total | | | 103,285,552 | | |
| Financials – 6.1% | |
| Capital Markets – 2.5% | |
| Franklin Resources, Inc. | | | 124,800 | | | | 13,341,120 | | |
| Morgan Stanley | | | 438,100 | | | | 10,812,308 | | |
| T. Rowe Price Group, Inc. | | | 134,200 | | | | 6,718,723 | | |
| Capital Markets Total | | | 30,872,151 | | |
| Commercial Banks – 0.3% | |
| Fifth Third Bancorp. | | | 340,200 | | | | 4,092,606 | | |
| Commercial Banks Total | | | 4,092,606 | | |
| Consumer Finance – 1.2% | |
| American Express Co. | | | 354,600 | | | | 14,903,838 | | |
| Consumer Finance Total | | | 14,903,838 | | |
| Diversified Financial Services – 1.3% | |
| IntercontinentalExchange, Inc. (a) | | | 147,200 | | | | 15,414,784 | | |
| Diversified Financial Services Total | | | 15,414,784 | | |
See Accompanying Notes to Financial Statements.
51
Columbia Large Cap Growth Fund
September 30, 2010
| Common Stocks (continued) | |
| | | Shares | | Value ($) | |
| Insurance – 0.8% | |
| MetLife, Inc. | | | 249,400 | | | | 9,589,430 | | |
| Insurance Total | | | 9,589,430 | | |
| Financials Total | | | 74,872,809 | | |
| Health Care – 12.1% | |
| Biotechnology – 2.9% | |
| Alexion Pharmaceuticals, Inc. (a) | | | 120,100 | | | | 7,729,636 | | |
| Amgen, Inc. (a) | | | 153,100 | | | | 8,437,341 | | |
| Celgene Corp. (a) | | | 275,800 | | | | 15,888,838 | | |
| Dendreon Corp. (a) | | | 93,400 | | | | 3,846,212 | | |
| Biotechnology Total | | | 35,902,027 | | |
| Health Care Equipment & Supplies – 2.4% | |
| Edwards Lifesciences Corp. (a) | | | 106,400 | | | | 7,134,120 | | |
| St. Jude Medical, Inc. (a) | | | 341,800 | | | | 13,446,412 | | |
| Varian Medical Systems, Inc. (a) | | | 143,700 | | | | 8,693,850 | | |
| Health Care Equipment & Supplies Total | | | 29,274,382 | | |
| Health Care Providers & Services – 3.3% | |
| Cardinal Health, Inc. | | | 314,100 | | | | 10,377,864 | | |
| Express Scripts, Inc. (a) | | | 223,200 | | | | 10,869,840 | | |
| UnitedHealth Group, Inc. | | | 224,400 | | | | 7,878,684 | | |
Universal Health Services, Inc.,
Class B | | | 274,600 | | | | 10,670,956 | | |
| Health Care Providers & Services Total | | | 39,797,344 | | |
| Life Sciences Tools & Services – 1.2% | |
| Life Technologies Corp. (a) | | | 127,000 | | | | 5,929,630 | | |
| Thermo Fisher Scientific, Inc. (a) | | | 169,469 | | | | 8,114,176 | | |
| Life Sciences Tools & Services Total | | | 14,043,806 | | |
| Pharmaceuticals – 2.3% | |
| Allergan, Inc. | | | 226,700 | | | | 15,082,351 | | |
Medicis Pharmaceutical Corp.,
Class A | | | 122,500 | | | | 3,632,125 | | |
| Mylan, Inc. (a) | | | 494,400 | | | | 9,299,664 | | |
| Pharmaceuticals Total | | | 28,014,140 | | |
| Health Care Total | | | 147,031,699 | | |
| Industrials – 13.0% | |
| Aerospace & Defense – 3.2% | |
| Goodrich Corp. | | | 170,200 | | | | 12,548,846 | | |
| Precision Castparts Corp. | | | 81,300 | | | | 10,353,555 | | |
| United Technologies Corp. | | | 221,100 | | | | 15,748,953 | | |
| Aerospace & Defense Total | | | 38,651,354 | | |
| Air Freight & Logistics – 1.2% | |
United Parcel Service, Inc.,
Class B | | | 224,200 | | | | 14,951,898 | | |
| Air Freight & Logistics Total | | | 14,951,898 | | |
| | | Shares | | Value ($) | |
| Commercial Services & Supplies – 0.9% | |
| Republic Services, Inc. | | | 352,100 | | | | 10,735,529 | | |
| Commercial Services & Supplies Total | | | 10,735,529 | | |
| Industrial Conglomerates – 1.8% | |
| 3M Co. | | | 109,900 | | | | 9,529,429 | | |
| General Electric Co. | | | 377,800 | | | | 6,139,250 | | |
| Tyco International Ltd. | | | 165,000 | | | | 6,060,450 | | |
| Industrial Conglomerates Total | | | 21,729,129 | | |
| Machinery – 5.4% | |
| Cummins, Inc. | | | 135,800 | | | | 12,300,764 | | |
| Deere & Co. | | | 179,100 | | | | 12,497,598 | | |
| Dover Corp. | | | 250,300 | | | | 13,068,163 | | |
| Flowserve Corp. | | | 92,400 | | | | 10,110,408 | | |
| Ingersoll-Rand PLC | | | 228,500 | | | | 8,159,735 | | |
| Parker Hannifin Corp. | | | 141,200 | | | | 9,892,472 | | |
| Machinery Total | | | 66,029,140 | | |
| Trading Companies & Distributors – 0.5% | |
| W.W. Grainger, Inc. | | | 57,400 | | | | 6,836,914 | | |
| Trading Companies & Distributors Total | | | 6,836,914 | | |
| Industrials Total | | | 158,933,964 | | |
| Information Technology – 32.9% | |
| Communications Equipment – 3.9% | |
| Cisco Systems, Inc. (a) | | | 1,141,923 | | | | 25,008,113 | | |
| QUALCOMM, Inc. | | | 493,500 | | | | 22,266,720 | | |
| Communications Equipment Total | | | 47,274,833 | | |
| Computers & Peripherals – 8.1% | |
| Apple, Inc. (a) | | | 210,517 | | | | 59,734,199 | | |
| EMC Corp. (a) | | | 1,276,600 | | | | 25,927,746 | | |
| Hewlett-Packard Co. | | | 239,057 | | | | 10,057,128 | | |
| SanDisk Corp. (a) | | | 82,000 | | | | 3,005,300 | | |
| Computers & Peripherals Total | | | 98,724,373 | | |
| Electronic Equipment, Instruments & Components – 1.4% | |
| Corning, Inc. | | | 468,300 | | | | 8,560,524 | | |
| Tyco Electronics Ltd. | | | 290,500 | | | | 8,488,410 | | |
Electronic Equipment, Instruments &
Components Total | | | 17,048,934 | | |
| Internet Software & Services – 4.0% | |
| Akamai Technologies, Inc. (a) | | | 168,500 | | | | 8,455,330 | | |
| Google, Inc., Class A (a) | | | 76,866 | | | | 40,415,374 | | |
| Internet Software & Services Total | | | 48,870,704 | | |
| IT Services – 4.5% | |
Cognizant Technology Solutions
Corp., Class A (a) | | | 243,400 | | | | 15,691,998 | | |
International Business
Machines Corp. | | | 170,000 | | | | 22,803,800 | | |
See Accompanying Notes to Financial Statements.
52
Columbia Large Cap Growth Fund
September 30, 2010
| Common Stocks (continued) | |
| | | Shares | | Value ($) | |
| Teradata Corp. (a) | | | 243,100 | | | | 9,373,936 | | |
| Visa, Inc., Class A | | | 102,000 | | | | 7,574,520 | | |
| IT Services Total | | | 55,444,254 | | |
| Semiconductors & Semiconductor Equipment – 2.5% | |
| Broadcom Corp., Class A | | | 189,300 | | | | 6,699,327 | | |
| Netlogic Microsystems, Inc. (a) | | | 268,300 | | | | 7,399,714 | | |
| Texas Instruments, Inc. | | | 417,600 | | | | 11,333,664 | | |
Varian Semiconductor Equipment
Associates, Inc. (a) | | | 164,500 | | | | 4,734,310 | | |
Semiconductors & Semiconductor
Equipment Total | | | 30,167,015 | | |
| Software – 8.5% | |
| Autodesk, Inc. (a) | | | 415,600 | | | | 13,286,732 | | |
| Intuit, Inc. (a) | | | 275,400 | | | | 12,065,274 | | |
| Microsoft Corp. | | | 717,198 | | | | 17,564,179 | | |
| Nintendo Co., Ltd., ADR | | | 151,547 | | | | 4,728,266 | | |
| Oracle Corp. | | | 1,198,236 | | | | 32,172,637 | | |
| Rovi Corp. (a) | | | 154,100 | | | | 7,768,181 | | |
| Salesforce.com, Inc. (a) | | | 75,900 | | | | 8,485,620 | | |
| SuccessFactors, Inc. (a) | | | 313,700 | | | | 7,877,007 | | |
| Software Total | | | 103,947,896 | | |
| Information Technology Total | | | 401,478,009 | | |
| Materials – 3.3% | |
| Chemicals – 0.3% | |
| CF Industries Holdings, Inc. | | | 36,400 | | | | 3,476,200 | | |
| Chemicals Total | | | 3,476,200 | | |
| Containers & Packaging – 0.7% | |
| Packaging Corp. of America | | | 348,028 | | | | 8,063,809 | | |
| Containers & Packaging Total | | | 8,063,809 | | |
| Metals & Mining – 2.3% | |
| Allegheny Technologies, Inc. | | | 217,100 | | | | 10,084,295 | | |
Freeport-McMoRan Copper &
Gold, Inc. | | | 84,100 | | | | 7,181,299 | | |
| Newmont Mining Corp. | | | 174,900 | | | | 10,985,469 | | |
| Metals & Mining Total | | | 28,251,063 | | |
| Materials Total | | | 39,791,072 | | |
| Telecommunication Services – 2.1% | |
| Wireless Telecommunication Services – 2.1% | |
| American Tower Corp., Class A (a) | | | 189,800 | | | | 9,729,148 | | |
| Millicom International Cellular SA | | | 71,151 | | | | 6,826,938 | | |
| NII Holdings, Inc. (a) | | | 219,906 | | | | 9,038,137 | | |
| Wireless Telecommunication Services Total | | | 25,594,223 | | |
| Telecommunication Services Total | | | 25,594,223 | | |
Total Common Stocks
(Cost of $1,008,330,134) | | | 1,223,978,418 | | |
| Short-Term Obligation – 0.5% | |
| | | Par ($) | | Value ($) | |
Repurchase agreement with
Fixed Income Clearing Corp.,
dated 09/30/10, due 10/01/10,
at 0.220%, collateralized by a
U.S. Treasury obligation
maturing 05/15/19, market
value $6,615,850 (repurchase
proceeds $6,483,040) | | | 6,483,000 | | | | 6,483,000 | | |
Total Short-Term Obligation
(Cost of $6,483,000) | | | 6,483,000 | | |
Total Investments – 100.9%
(Cost of $1,014,813,134) (b) | | | 1,230,461,418 | | |
| Other Assets & Liabilities, Net – (0.9)% | | | (11,241,145 | ) | |
| Net Assets – 100.0% | | | 1,219,220,273 | | |
Notes to Investment Portfolio:
(a) Non-income producing security.
(b) Cost for federal income tax purposes is $1,017,621,164.
The following table summarizes the inputs used, as of September 30, 2010, in valuing the Fund's assets:
| Description | | Quoted
(Level 1) | | Other
Significant
Observable
Inputs
(Level 2) | | Significant
Unobservable
Inputs
(Level 3) | | Total | |
| Total Common Stocks | | $ | 1,223,978,418 | | | $ | — | | | $ | — | | | $ | 1,223,978,418 | | |
Total Short-Term
Obligation | | | — | | | | 6,483,000 | | | | — | | | | 6,483,000 | | |
| Total Investments | | $ | 1,223,978,418 | | | $ | 6,483,000 | | | $ | — | | | $ | 1,230,461,418 | | |
Certain short-term obligations may be valued using amortized cost, an income approach which converts future cash flows to a present value based upon the discount or premium at purchase.
There were no significant transfers of financial assets between Levels 1 and 2 during the period.
For more information on valuation inputs, and their aggregation into the levels used in the table above, please refer to the Security Valuation section in the accompanying Notes to Financial Statements.
See Accompanying Notes to Financial Statements.
53
Columbia Large Cap Growth Fund
September 30, 2010
At September 30, 2010, the Fund held investments in the following sectors:
| Sector (Unaudited) | | % of
Net Assets | |
| Information Technology | | | 32.9 | | |
| Consumer Discretionary | | | 13.7 | | |
| Industrials | | | 13.0 | | |
| Health Care | | | 12.1 | | |
| Consumer Staples | | | 8.7 | | |
| Energy | | | 8.5 | | |
| Financials | | | 6.1 | | |
| Materials | | | 3.3 | | |
| Telecommunication Services | | | 2.1 | | |
| | | | 100.4 | | |
| Short-Term Obligation | | | 0.5 | | |
| Other Assets & Liabilities, Net | | | (0.9 | ) | |
| | | | 100.0 | | |
| Acronym | | Name | |
| ADR | | | American Depositary Receipt | | |
See Accompanying Notes to Financial Statements.
54
Investment Portfolio – Columbia Disciplined Value Fund
September 30, 2010
| Common Stocks – 101.6% | |
| | | Shares | | Value ($) | |
| Consumer Discretionary – 7.4% | |
| Auto Components – 0.7% | |
| Lear Corp. (a) | | | 12,500 | | | | 986,625 | | |
| TRW Automotive Holdings Corp. (a) | | | 13,300 | | | | 552,748 | | |
| Auto Components Total | | | 1,539,373 | | |
| Hotels, Restaurants & Leisure – 0.1% | |
| Hyatt Hotels Corp., Class A (a) | | | 2,900 | | | | 108,431 | | |
| Hotels, Restaurants & Leisure Total | | | 108,431 | | |
| Household Durables – 0.1% | |
| Garmin Ltd. | | | 8,400 | | | | 254,940 | | |
| Household Durables Total | | | 254,940 | | |
| Media – 4.8% | |
| Comcast Corp., Class A | | | 243,975 | | | | 4,411,068 | | |
| DISH Network Corp., Class A | | | 24,350 | | | | 466,546 | | |
| Time Warner Cable, Inc. | | | 13,350 | | | | 720,766 | | |
| Time Warner, Inc. | | | 138,550 | | | | 4,246,558 | | |
| Viacom, Inc., Class B | | | 7,180 | | | | 259,844 | | |
| Media Total | | | 10,104,782 | | |
| Multiline Retail – 0.1% | |
| Macy's, Inc. | | | 7,360 | | | | 169,942 | | |
| Multiline Retail Total | | | 169,942 | | |
| Specialty Retail – 1.6% | |
| Gap, Inc. | | | 87,960 | | | | 1,639,574 | | |
| Limited Brands, Inc. | | | 60,120 | | | | 1,610,014 | | |
| Specialty Retail Total | | | 3,249,588 | | |
| Consumer Discretionary Total | | | 15,427,056 | | |
| Consumer Staples – 10.4% | |
| Food & Staples Retailing – 2.3% | |
| Wal-Mart Stores, Inc. | | | 89,200 | | | | 4,773,984 | | |
| Food & Staples Retailing Total | | | 4,773,984 | | |
| Food Products – 3.0% | |
| Corn Products International, Inc. | | | 24,400 | | | | 915,000 | | |
| Del Monte Foods Co. | | | 157,615 | | | | 2,066,333 | | |
| Hershey Co. | | | 69,185 | | | | 3,292,514 | | |
| Food Products Total | | | 6,273,847 | | |
| Household Products – 1.5% | |
| Kimberly-Clark Corp. | | | 2,170 | | | | 141,159 | | |
| Procter & Gamble Co. | | | 48,830 | | | | 2,928,335 | | |
| Household Products Total | | | 3,069,494 | | |
| Tobacco – 3.6% | |
| Altria Group, Inc. | | | 85,660 | | | | 2,057,553 | | |
| Lorillard, Inc. | | | 9,475 | | | | 760,937 | | |
| Philip Morris International, Inc. | | | 84,190 | | | | 4,716,324 | | |
| Tobacco Total | | | 7,534,814 | | |
| Consumer Staples Total | | | 21,652,139 | | |
| | | Shares | | Value ($) | |
| Energy – 11.4% | |
| Energy Equipment & Services – 1.0% | |
| National-Oilwell Varco, Inc. | | | 22,475 | | | | 999,463 | | |
| Oceaneering International, Inc. (a) | | | 3,200 | | | | 172,352 | | |
| Rowan Companies, Inc. (a) | | | 30,790 | | | | 934,785 | | |
| Energy Equipment & Services Total | | | 2,106,600 | | |
| Oil, Gas & Consumable Fuels – 10.4% | |
| Alpha Natural Resources, Inc. (a) | | | 21,600 | | | | 888,840 | | |
| Apache Corp. | | | 48,050 | | | | 4,697,368 | | |
| Chevron Corp. | | | 108,540 | | | | 8,797,167 | | |
| ConocoPhillips | | | 71,070 | | | | 4,081,550 | | |
| Devon Energy Corp. | | | 18,215 | | | | 1,179,239 | | |
| Marathon Oil Corp. | | | 18,400 | | | | 609,040 | | |
| Valero Energy Corp. | | | 13,305 | | | | 232,971 | | |
| Whiting Petroleum Corp. (a) | | | 11,595 | | | | 1,107,438 | | |
| Oil, Gas & Consumable Fuels Total | | | 21,593,613 | | |
| Energy Total | | | 23,700,213 | | |
| Financials – 27.8% | |
| Capital Markets – 1.3% | |
| Franklin Resources, Inc. | | | 10,950 | | | | 1,170,555 | | |
| Goldman Sachs Group, Inc. | | | 10,570 | | | | 1,528,210 | | |
| Capital Markets Total | | | 2,698,765 | | |
| Commercial Banks – 1.3% | |
| Fifth Third Bancorp. | | | 39,640 | | | | 476,869 | | |
| KeyCorp | | | 29,165 | | | | 232,153 | | |
| PNC Financial Services Group, Inc. | | | 13,725 | | | | 712,465 | | |
| Wells Fargo & Co. | | | 51,665 | | | | 1,298,342 | | |
| Commercial Banks Total | | | 2,719,829 | | |
| Consumer Finance – 2.2% | |
| Capital One Financial Corp. | | | 13,305 | | | | 526,213 | | |
| Discover Financial Services | | | 148,175 | | | | 2,471,559 | | |
| SLM Corp. (a) | | | 141,980 | | | | 1,639,869 | | |
| Consumer Finance Total | | | 4,637,641 | | |
| Diversified Financial Services – 7.8% | |
| Bank of America Corp. | | | 131,525 | | | | 1,724,293 | | |
| Citigroup, Inc. (a) | | | 1,604,700 | | | | 6,258,330 | | |
| JPMorgan Chase & Co. | | | 212,720 | | | | 8,098,250 | | |
| NYSE Euronext | | | 7,200 | | | | 205,704 | | |
| Diversified Financial Services Total | | | 16,286,577 | | |
| Insurance – 10.2% | |
| AFLAC, Inc. | | | 68,900 | | | | 3,562,819 | | |
Allied World Assurance
Holdings Ltd. | | | 31,775 | | | | 1,798,147 | | |
| Allstate Corp. | | | 13,900 | | | | 438,545 | | |
| AON Corp. | | | 96,000 | | | | 3,754,560 | | |
Berkshire Hathaway, Inc.,
Class B (a) | | | 24,160 | | | | 1,997,549 | | |
See Accompanying Notes to Financial Statements.
55
Columbia Disciplined Value Fund
September 30, 2010
| Common Stocks (continued) | |
| | | Shares | | Value ($) | |
| Brown & Brown, Inc. | | | 70,500 | | | | 1,423,395 | | |
| CNA Financial Corp. (a) | | | 20,800 | | | | 582,192 | | |
Hartford Financial Services
Group, Inc. | | | 63,705 | | | | 1,462,030 | | |
| Protective Life Corp. | | | 124,810 | | | | 2,715,866 | | |
| Reinsurance Group of America, Inc. | | | 70,795 | | | | 3,418,690 | | |
| Insurance Total | | | 21,153,793 | | |
| Real Estate Investment Trusts (REITs) – 5.0% | |
| Annaly Capital Management, Inc. | | | 154,170 | | | | 2,713,392 | | |
Apartment Investment &
Management Co., Class A | | | 153,300 | | | | 3,277,554 | | |
| Hospitality Properties Trust | | | 80,035 | | | | 1,787,182 | | |
| Simon Property Group, Inc. | | | 27,410 | | | | 2,542,003 | | |
| Real Estate Investment Trusts (REITs) Total | | | 10,320,131 | | |
| Financials Total | | | 57,816,736 | | |
| Health Care – 13.5% | |
| Biotechnology – 2.7% | |
| Amgen, Inc. (a) | | | 57,880 | | | | 3,189,767 | | |
| Biogen Idec, Inc. (a) | | | 42,700 | | | | 2,396,324 | | |
| Biotechnology Total | | | 5,586,091 | | |
| Health Care Providers & Services – 4.5% | |
| AmerisourceBergen Corp. | | | 1,395 | | | | 42,771 | | |
| Cardinal Health, Inc. | | | 9,155 | | | | 302,481 | | |
| Humana, Inc. (a) | | | 72,170 | | | | 3,625,821 | | |
| Lincare Holdings, Inc. | | | 2,990 | | | | 75,019 | | |
| UnitedHealth Group, Inc. | | | 150,255 | | | | 5,275,453 | | |
| Health Care Providers & Services Total | | | 9,321,545 | | |
| Pharmaceuticals – 6.3% | |
| Abbott Laboratories | | | 4,530 | | | | 236,647 | | |
| Bristol-Myers Squibb Co. | | | 29,230 | | | | 792,425 | | |
| Eli Lilly & Co. | | | 116,800 | | | | 4,266,704 | | |
Endo Pharmaceuticals
Holdings, Inc. (a) | | | 54,930 | | | | 1,825,873 | | |
| Johnson & Johnson | | | 33,975 | | | | 2,105,091 | | |
| Merck & Co., Inc. | | | 62,195 | | | | 2,289,398 | | |
| Pfizer, Inc. | | | 91,785 | | | | 1,575,949 | | |
| Pharmaceuticals Total | | | 13,092,087 | | |
| Health Care Total | | | 27,999,723 | | |
| Industrials – 9.3% | |
| Aerospace & Defense – 2.4% | |
| Raytheon Co. | | | 60,970 | | | | 2,786,939 | | |
| United Technologies Corp. | | | 32,185 | | | | 2,292,537 | | |
| Aerospace & Defense Total | | | 5,079,476 | | |
| | | Shares | | Value ($) | |
| Commercial Services & Supplies – 1.5% | |
| R.R. Donnelley & Sons Co. | | | 182,095 | | | | 3,088,331 | | |
| Commercial Services & Supplies Total | | | 3,088,331 | | |
| Industrial Conglomerates – 3.7% | |
| General Electric Co. | | | 474,570 | | | | 7,711,763 | | |
| Industrial Conglomerates Total | | | 7,711,763 | | |
| Machinery – 0.4% | |
| Dover Corp. | | | 8,870 | | | | 463,103 | | |
| Eaton Corp. | | | 3,775 | | | | 311,400 | | |
| Machinery Total | | | 774,503 | | |
| Road & Rail – 1.3% | |
| Ryder System, Inc. | | | 62,690 | | | | 2,681,251 | | |
| Road & Rail Total | | | 2,681,251 | | |
| Industrials Total | | | 19,335,324 | | |
| Information Technology – 5.6% | |
| Computers & Peripherals – 1.4% | |
| Hewlett-Packard Co. | | | 58,140 | | | | 2,445,950 | | |
Lexmark International, Inc.,
Class A (a) | | | 9,300 | | | | 414,966 | | |
| Computers & Peripherals Total | | | 2,860,916 | | |
| IT Services – 0.3% | |
| Teradata Corp. (a) | | | 13,660 | | | | 526,730 | | |
| IT Services Total | | | 526,730 | | |
| Semiconductors & Semiconductor Equipment – 1.3% | |
| Intel Corp. | | | 100,665 | | | | 1,935,788 | | |
| Texas Instruments, Inc. | | | 31,710 | | | | 860,609 | | |
Semiconductors & Semiconductor
Equipment Total | | | 2,796,397 | | |
| Software – 2.6% | |
| Microsoft Corp. | | | 224,535 | | | | 5,498,862 | | |
| Software Total | | | 5,498,862 | | |
| Information Technology Total | | | 11,682,905 | | |
| Materials – 3.5% | |
| Chemicals – 3.4% | |
| Ashland, Inc. | | | 36,145 | | | | 1,762,792 | | |
| Cabot Corp. | | | 34,705 | | | | 1,130,342 | | |
| Eastman Chemical Co. | | | 34,870 | | | | 2,580,380 | | |
| Lubrizol Corp. | | | 14,060 | | | | 1,489,938 | | |
| PPG Industries, Inc. | | | 900 | | | | 65,520 | | |
| Chemicals Total | | | 7,028,972 | | |
See Accompanying Notes to Financial Statements.
56
Columbia Disciplined Value Fund
September 30, 2010
| Common Stocks (continued) | |
| | | Shares | | Value ($) | |
| Metals & Mining – 0.1% | |
Freeport-McMoRan Copper &
Gold, Inc. | | | 1,890 | | | | 161,387 | | |
| Metals & Mining Total | | | 161,387 | | |
| Materials Total | | | 7,190,359 | | |
| Telecommunication Services – 5.3% | |
| Diversified Telecommunication Services – 5.3% | |
| AT&T, Inc. | | | 159,615 | | | | 4,564,989 | | |
Qwest Communications
International, Inc. | | | 193,385 | | | | 1,212,524 | | |
| Verizon Communications, Inc. | | | 163,620 | | | | 5,332,376 | | |
Diversified Telecommunication
Services Total | | | 11,109,889 | | |
| Telecommunication Services Total | | | 11,109,889 | | |
| Utilities – 7.4% | |
| Electric Utilities – 3.5% | |
| DPL, Inc. | | | 53,140 | | | | 1,388,548 | | |
| Edison International | | | 13,400 | | | | 460,826 | | |
| Entergy Corp. | | | 11,325 | | | | 866,703 | | |
| Exelon Corp. | | | 100,045 | | | | 4,259,916 | | |
| FirstEnergy Corp. | | | 5,580 | | | | 215,053 | | |
| Electric Utilities Total | | | 7,191,046 | | |
| Gas Utilities – 0.7% | |
| Energen Corp. | | | 2,925 | | | | 133,731 | | |
| Questar Corp. | | | 69,500 | | | | 1,218,335 | | |
| UGI Corp. | | | 2,265 | | | | 64,801 | | |
| Gas Utilities Total | | | 1,416,867 | | |
| Multi-Utilities – 3.2% | |
| NiSource, Inc. | | | 47,000 | | | | 817,800 | | |
| NSTAR | | | 49,135 | | | | 1,933,462 | | |
Public Service Enterprise
Group, Inc. | | | 119,960 | | | | 3,968,277 | | |
| Multi-Utilities Total | | | 6,719,539 | | |
| Utilities Total | | | 15,327,452 | | |
Total Common Stocks
(Cost of $182,672,677) | | | 211,241,796 | | |
| Short-Term Obligation – 0.8% | |
| | | Par ($) | | Value ($) | |
Repurchase agreement with
Fixed Income Clearing Corp.,
dated 09/30/10, due 10/01/10
at 0.220%, collateralized by a
U.S. Treasury obligation
maturing 05/15/19, market
value $1,578,538 (repurchase
proceeds $1,547,009) | | | 1,547,000 | | | | 1,547,000 | | |
Total Short-Term Obligation
(Cost of $1,547,000) | | | 1,547,000 | | |
Total Investments – 102.4%
(Cost of $184,219,677) (b) | | | 212,788,796 | | |
| Other Assets & Liabilities, Net – (2.4)% | | | (4,959,373 | ) | |
| Net Assets – 100.0% | | | 207,829,423 | | |
Notes to Investment Portfolio:
(a) Non-income producing security.
(b) Cost for federal income tax purposes is $184,707,247.
The following table summarizes the inputs used, as of September 30, 2010, in valuing the Fund's assets:
| Description | | Quoted
Prices
(Level 1) | | Other
Significant
Observable
Inputs
(Level 2) | | Significant
Unobservable
Inputs
(Level 3) | | Total | |
| Total Common Stocks | | $ | 211,241,796 | | | $ | — | | | $ | — | | | $ | 211,241,796 | | |
| Total Short-Term Obligation | | | — | | | | 1,547,000 | | | | — | | | | 1,547,000 | | |
| Total Investments | | $ | 211,241,796 | | | $ | 1,547,000 | | | $ | — | | | $ | 212,788,796 | | |
The Fund's assets assigned to the Level 2 input category represent certain short-term obligatons which are valued using amortized cost, an income approach which converts future cash flows to a present value based upon the discount or premium at purchase.
There were no significant transfers of financial assets between Levels 1 and 2 during the period.
For more information on valuation inputs, and their aggregation into the levels used in the table above, please refer to the Security Valuation section in the accompanying Notes to Financial Statements.
At September 30, 2010, the Fund held investments in the following sectors:
| Sector (unaudited) | | % of
Net Assets | |
| Financials | | | 27.8 | | |
| Health Care | | | 13.5 | | |
| Energy | | | 11.4 | | |
| Consumer Staples | | | 10.4 | | |
| Industrials | | | 9.3 | | |
| Consumer Discretionary | | | 7.4 | | |
| Utilities | | | 7.4 | | |
| Information Technology | | | 5.6 | | |
| Telecommunication Services | | | 5.3 | | |
| Materials | | | 3.5 | | |
| | | | 101.6 | | |
| Short Term Obligation | | | 0.8 | | |
| Other Assets & Liabilities, Net | | | (2.4 | ) | |
| | | | 100.0 | | |
See Accompanying Notes to Financial Statements.
57
Investment Portfolio – Columbia Contrarian Core Fund
September 30, 2010
| Common Stocks – 100.1% | |
| | | Shares | | Value ($) | |
| Consumer Discretionary – 8.3% | |
| Hotels, Restaurants & Leisure – 1.4% | |
| Carnival Corp. | | | 169,000 | | | | 6,457,490 | | |
| Las Vegas Sands Corp. (a) | | | 44,000 | | | | 1,533,400 | | |
| Hotels, Restaurants & Leisure Total | | | 7,990,890 | | |
| Media – 1.7% | |
| Comcast Corp., Class A | | | 556,000 | | | | 10,052,480 | | |
| Media Total | | | 10,052,480 | | |
| Multiline Retail – 3.4% | |
| Kohl's Corp. (a) | | | 138,200 | | | | 7,280,376 | | |
| Target Corp. | | | 233,000 | | | | 12,451,520 | | |
| Multiline Retail Total | | | 19,731,896 | | |
| Specialty Retail – 1.2% | |
| American Eagle Outfitters, Inc. | | | 280,100 | | | | 4,190,296 | | |
| GameStop Corp., Class A (a) | | | 154,600 | | | | 3,047,166 | | |
| Specialty Retail Total | | | 7,237,462 | | |
| Textiles, Apparel & Luxury Goods – 0.6% | |
| NIKE, Inc., Class B | | | 46,300 | | | | 3,710,482 | | |
| Textiles, Apparel & Luxury Goods Total | | | 3,710,482 | | |
| Consumer Discretionary Total | | | 48,723,210 | | |
| Consumer Staples – 9.2% | |
| Beverages – 1.9% | |
| PepsiCo, Inc. | | | 173,900 | | | | 11,553,916 | | |
| Beverages Total | | | 11,553,916 | | |
| Food & Staples Retailing – 1.9% | |
| CVS Caremark Corp. | | | 349,200 | | | | 10,989,324 | | |
| Food & Staples Retailing Total | | | 10,989,324 | | |
| Food Products – 1.7% | |
| Kraft Foods, Inc., Class A | | | 323,200 | | | | 9,973,952 | | |
| Food Products Total | | | 9,973,952 | | |
| Personal Products – 0.6% | |
| Herbalife Ltd. | | | 63,500 | | | | 3,832,225 | | |
| Personal Products Total | | | 3,832,225 | | |
| Tobacco – 3.1% | |
| Philip Morris International, Inc. | | | 323,400 | | | | 18,116,868 | | |
| Tobacco Total | | | 18,116,868 | | |
| Consumer Staples Total | | | 54,466,285 | | |
| Energy – 14.1% | |
| Energy Equipment & Services – 2.3% | |
| Halliburton Co. | | | 237,900 | | | | 7,867,353 | | |
| Schlumberger Ltd. | | | 94,100 | | | | 5,797,501 | | |
| Energy Equipment & Services Total | | | 13,664,854 | | |
| | | Shares | | Value ($) | |
| Oil, Gas & Consumable Fuels – 11.8% | |
| Alpha Natural Resources, Inc. (a) | | | 127,400 | | | | 5,242,510 | | |
| Apache Corp. | | | 97,500 | | | | 9,531,600 | | |
| Chevron Corp. | | | 182,100 | | | | 14,759,205 | | |
| ConocoPhillips | | | 94,500 | | | | 5,427,135 | | |
| Devon Energy Corp. | | | 71,300 | | | | 4,615,962 | | |
| Exxon Mobil Corp. | | | 289,300 | | | | 17,875,847 | | |
| Petroleo Brasileiro SA, ADR | | | 202,100 | | | | 6,632,922 | | |
| Suncor Energy, Inc. | | | 166,800 | | | | 5,429,340 | | |
| Oil, Gas & Consumable Fuels Total | | | 69,514,521 | | |
| Energy Total | | | 83,179,375 | | |
| Financials – 16.0% | |
| Capital Markets – 6.6% | |
| Bank of New York Mellon Corp. | | | 245,200 | | | | 6,407,076 | | |
| Goldman Sachs Group, Inc. | | | 112,000 | | | | 16,192,960 | | |
| Invesco Ltd. | | | 222,500 | | | | 4,723,675 | | |
| State Street Corp. | | | 231,900 | | | | 8,733,354 | | |
Waddell & Reed Financial, Inc.,
Class A | | | 103,200 | | | | 2,823,552 | | |
| Capital Markets Total | | | 38,880,617 | | |
| Commercial Banks – 1.6% | |
| Itau Unibanco Holding SA, ADR | | | 142,100 | | | | 3,435,978 | | |
| Wells Fargo & Co. | | | 240,522 | | | | 6,044,318 | | |
| Commercial Banks Total | | | 9,480,296 | | |
| Diversified Financial Services – 4.1% | |
| Citigroup, Inc. (a) | | | 2,416,900 | | | | 9,425,910 | | |
| JPMorgan Chase & Co. | | | 391,372 | | | | 14,899,532 | | |
| Diversified Financial Services Total | | | 24,325,442 | | |
| Insurance – 3.7% | |
| AON Corp. | | | 186,200 | | | | 7,282,282 | | |
Berkshire Hathaway, Inc.,
Class B (a) | | | 71,450 | | | | 5,907,486 | | |
| MetLife, Inc. | | | 229,600 | | | | 8,828,120 | | |
| Insurance Total | | | 22,017,888 | | |
| Financials Total | | | 94,704,243 | | |
| Health Care – 11.0% | |
| Biotechnology – 1.9% | |
| Amgen, Inc. (a) | | | 97,400 | | | | 5,367,714 | | |
| Celgene Corp. (a) | | | 104,800 | | | | 6,037,528 | | |
| Biotechnology Total | | | 11,405,242 | | |
| Health Care Equipment & Supplies – 0.7% | |
| Baxter International, Inc. | | | 86,000 | | | | 4,103,060 | | |
| Health Care Equipment & Supplies Total | | | 4,103,060 | | |
See Accompanying Notes to Financial Statements.
58
Columbia Contrarian Core Fund
September 30, 2010
| Common Stocks (continued) | |
| | | Shares | | Value ($) | |
| Health Care Providers & Services – 2.6% | |
| Cardinal Health, Inc. | | | 170,900 | | | | 5,646,536 | | |
| Express Scripts, Inc. (a) | | | 87,800 | | | | 4,275,860 | | |
| Medco Health Solutions, Inc. (a) | | | 109,515 | | | | 5,701,351 | | |
| Health Care Providers & Services Total | | | 15,623,747 | | |
| Life Sciences Tools & Services – 1.6% | |
| Thermo Fisher Scientific, Inc. (a) | | | 197,250 | | | | 9,444,330 | | |
| Life Sciences Tools & Services Total | | | 9,444,330 | | |
| Pharmaceuticals – 4.2% | |
| Abbott Laboratories | | | 284,387 | | | | 14,856,376 | | |
| Pfizer, Inc. | | | 309,000 | | | | 5,305,530 | | |
Teva Pharmaceutical Industries
Ltd., ADR | | | 84,600 | | | | 4,462,650 | | |
| Pharmaceuticals Total | | | 24,624,556 | | |
| Health Care Total | | | 65,200,935 | | |
| Industrials – 12.2% | |
| Aerospace & Defense – 2.6% | |
| Honeywell International, Inc. | | | 161,550 | | | | 7,098,507 | | |
| United Technologies Corp. | | | 114,000 | | | | 8,120,220 | | |
| Aerospace & Defense Total | | | 15,218,727 | | |
| Air Freight & Logistics – 1.4% | |
| FedEx Corp. | | | 100,700 | | | | 8,609,850 | | |
| Air Freight & Logistics Total | | | 8,609,850 | | |
| Commercial Services & Supplies – 1.4% | |
| Avery Dennison Corp. | | | 222,400 | | | | 8,255,488 | | |
| Commercial Services & Supplies Total | | | 8,255,488 | | |
| Electrical Equipment – 0.8% | |
Sensata Technologies
Holding NV (a) | | | 229,600 | | | | 4,536,896 | | |
| Electrical Equipment Total | | | 4,536,896 | | |
| Industrial Conglomerates – 2.4% | |
| General Electric Co. | | | 643,440 | | | | 10,455,900 | | |
| Tyco International Ltd. | | | 103,500 | | | | 3,801,555 | | |
| Industrial Conglomerates Total | | | 14,257,455 | | |
| Machinery – 1.7% | |
| Illinois Tool Works, Inc. | | | 211,800 | | | | 9,958,836 | | |
| Machinery Total | | | 9,958,836 | | |
| Road & Rail – 1.9% | |
| Union Pacific Corp. | | | 135,820 | | | | 11,110,076 | | |
| Road & Rail Total | | | 11,110,076 | | |
| Industrials Total | | | 71,947,328 | | |
| | | Shares | | Value ($) | |
| Information Technology – 21.6% | |
| Communications Equipment – 4.0% | |
| Cisco Systems, Inc. (a) | | | 474,500 | | | | 10,391,550 | | |
| Motorola, Inc. (a) | | | 358,700 | | | | 3,059,711 | | |
| QUALCOMM, Inc. | | | 229,600 | | | | 10,359,552 | | |
| Communications Equipment Total | | | 23,810,813 | | |
| Computers & Peripherals – 5.0% | |
| Apple, Inc. (a) | | | 76,700 | | | | 21,763,625 | | |
| EMC Corp. (a) | | | 377,400 | | | | 7,664,994 | | |
| Computers & Peripherals Total | | | 29,428,619 | | |
| Electronic Equipment, Instruments & Components – 1.0% | |
| Corning, Inc. | | | 314,700 | | | | 5,752,716 | | |
Electronic Equipment, Instruments &
Components Total | | | 5,752,716 | | |
| Internet Software & Services – 4.4% | |
| eBay, Inc. (a) | | | 501,800 | | | | 12,243,920 | | |
| Google, Inc., Class A (a) | | | 26,900 | | | | 14,143,751 | | |
| Internet Software & Services Total | | | 26,387,671 | | |
| IT Services – 3.8% | |
International Business
Machines Corp. | | | 113,900 | | | | 15,278,546 | | |
| Visa, Inc., Class A | | | 94,000 | | | | 6,980,440 | | |
| IT Services Total | | | 22,258,986 | | |
| Semiconductors & Semiconductor Equipment – 1.3% | |
| Atmel Corp. (a) | | | 979,200 | | | | 7,794,432 | | |
Semiconductors & Semiconductor
Equipment Total | | | 7,794,432 | | |
| Software – 2.1% | |
| Adobe Systems, Inc. (a) | | | 165,900 | | | | 4,338,285 | | |
| Microsoft Corp. | | | 327,120 | | | | 8,011,169 | | |
| Software Total | | | 12,349,454 | | |
| Information Technology Total | | | 127,782,691 | | |
| Materials – 5.8% | |
| Chemicals – 3.5% | |
| Air Products & Chemicals, Inc. | | | 120,900 | | | | 10,012,938 | | |
| Celanese Corp., Series A | | | 142,200 | | | | 4,564,620 | | |
| Syngenta AG, ADR | | | 122,600 | | | | 6,104,254 | | |
| Chemicals Total | | | 20,681,812 | | |
| Metals & Mining – 2.3% | |
Freeport-McMoRan Copper &
Gold, Inc. | | | 85,100 | | | | 7,266,689 | | |
| Vale SA, ADR | | | 197,000 | | | | 6,160,190 | | |
| Metals & Mining Total | | | 13,426,879 | | |
| Materials Total | | | 34,108,691 | | |
See Accompanying Notes to Financial Statements.
59
Columbia Contrarian Core Fund
September 30, 2010
| Common Stocks (continued) | |
| | | Shares | | Value ($) | |
| Telecommunication Services – 0.9% | |
| Wireless Telecommunication Services – 0.9% | |
MetroPCS Communications,
Inc. (a) | | | 264,700 | | | | 2,768,762 | | |
Millicom International
Cellular SA | | | 24,400 | | | | 2,341,180 | | |
| Wireless Telecommunication Services Total | | | 5,109,942 | | |
| Telecommunication Services Total | | | 5,109,942 | | |
| Utilities – 1.0% | |
| Independent Power Producers & Energy Traders – 1.0% | |
| AES Corp. (a) | | | 504,700 | | | | 5,728,345 | | |
Independent Power Producers &
Energy Traders Total | | | 5,728,345 | | |
| Utilities Total | | | 5,728,345 | | |
Total Common Stocks
(Cost of $507,394,667) | | | 590,951,045 | | |
| | | Par ($) | | | |
| Short-Term Obligation – 0.0% | |
Repurchase agreement with
Fixed Income Clearing Corp.,
dated 09/30/10, due 10/01/10
at 0.220%, collateralized by a
U.S. Treasury obligation
maturing 05/15/19, market
value $161,625 (repurchase
proceeds $158,001) | | | 158,000 | | | | 158,000 | | |
Total Short-Term Obligation
(Cost of $158,000) | | | 158,000 | | |
Total Investments – 100.1%
(Cost of $507,552,667) (b) | | | 591,109,045 | | |
| Other Assets & Liabilities, Net – (0.1)% | | | (617,473 | ) | |
| Net Assets – 100.0% | | | 590,491,572 | | |
Notes to Investment Portfolio:
(a) Non-income producing security.
(b) Cost for federal income tax purposes is $510,889,362.
The following table summarizes the inputs used, as of September 30, 2010, in valuing the Fund's assets:
| Description | | Quoted
Prices
(Level 1) | | Other
Significant
Observable
Inputs
(Level 2) | | Significant
Unobservable
Inputs
(Level 3) | | Total | |
| Total Common Stocks | | $ | 590,951,045 | | | $ | — | | | $ | — | | | $ | 590,951,045 | | |
| Total Short-Term Obligation | | | — | | | | 158,000 | | | | — | | | | 158,000 | | |
| Total Investments | | $ | 590,951,045 | | | $ | 158,000 | | | $ | — | | | $ | 591,109,045 | | |
Certain short-term obligations may be valued using amortized cost, an income approach which converts future cash flows to a present value based upon the discount or premium at purchase.
There were no significant transfers of financial assets between Levels 1 and 2 during the period.
For more information on valuation inputs, and their aggregation into the levels used in the table above, please refer to the Security Valuation section in the accompanying Notes to Financial Statements.
At September 30, 2010, the Fund held investments in the following sectors:
| Sector (Unaudited) | | % of
Net Assets | |
| Information Technology | | | 21.6 | | |
| Financials | | | 16.0 | | |
| Energy | | | 14.1 | | |
| Industrials | | | 12.2 | | |
| Health Care | | | 11.0 | | |
| Consumer Staples | | | 9.2 | | |
| Consumer Discretionary | | | 8.3 | | |
| Materials | | | 5.8 | | |
| Utilities | | | 1.0 | | |
| Telecommunication Services | | | 0.9 | | |
| | | | 100.1 | | |
| Short-Term Obligation | | | 0.0 | * | |
| Other Assets & Liabilities, Net | | | (0.1 | ) | |
| | | | 100.0 | | |
* Round to less than 0.1%.
| Acronym | | Name | |
| ADR | | American Depositary Receipt | |
See Accompanying Notes to Financial Statements.
60
Investment Portfolio – Columbia Small Cap Core Fund
September 30, 2010
| Common Stocks – 98.0% | |
| | | Shares | | Value ($) | |
| Consumer Discretionary – 10.4% | |
| Auto Components – 1.0% | |
| Cooper Tire & Rubber Co. | | | 49,696 | | | | 975,533 | | |
| Dorman Products, Inc. (a) | | | 176,172 | | | | 5,429,621 | | |
| Auto Components Total | | | 6,405,154 | | |
| Diversified Consumer Services – 0.5% | |
| CPI Corp. | | | 60,818 | | | | 1,573,970 | | |
Nobel Learning Communities,
Inc. (a) | | | 250,966 | | | | 1,734,175 | | |
| Diversified Consumer Services Total | | | 3,308,145 | | |
| Hotels, Restaurants & Leisure – 1.7% | |
| CEC Entertainment, Inc. (a) | | | 196,007 | | | | 6,728,920 | | |
| Morgans Hotel Group Co. (a) | | | 204,831 | | | | 1,499,363 | | |
| O'Charleys, Inc. (a) | | | 360,062 | | | | 2,588,846 | | |
| Hotels, Restaurants & Leisure Total | | | 10,817,129 | | |
| Household Durables – 0.3% | |
| Jarden Corp. | | | 64,092 | | | | 1,995,184 | | |
| Household Durables Total | | | 1,995,184 | | |
| Leisure Equipment & Products – 1.5% | |
| Callaway Golf Co. | | | 222,847 | | | | 1,559,929 | | |
| RC2 Corp. (a) | | | 262,447 | | | | 5,498,265 | | |
Steinway Musical Instruments,
Inc. (a) | | | 147,764 | | | | 2,544,496 | | |
| Leisure Equipment & Products Total | | | 9,602,690 | | |
| Media – 1.8% | |
| Arbitron, Inc. | | | 171,700 | | | | 4,802,449 | | |
| John Wiley & Sons, Inc., Class A | | | 102,100 | | | | 4,171,806 | | |
| Scholastic Corp. | | | 83,986 | | | | 2,336,490 | | |
| Media Total | | | 11,310,745 | | |
| Specialty Retail – 3.5% | |
| Buckle, Inc. | | | 91,331 | | | | 2,423,925 | | |
| Collective Brands, Inc. (a) | | | 315,307 | | | | 5,089,055 | | |
| Foot Locker, Inc. | | | 121,000 | | | | 1,758,130 | | |
| Penske Auto Group, Inc. (a) | | | 253,000 | | | | 3,339,600 | | |
| Rent-A-Center, Inc. | | | 260,682 | | | | 5,834,063 | | |
| Stage Stores, Inc. | | | 302,028 | | | | 3,926,364 | | |
| Specialty Retail Total | | | 22,371,137 | | |
| Textiles, Apparel & Luxury Goods – 0.1% | |
| Rocky Brands, Inc. (a) | | | 107,199 | | | | 816,856 | | |
| Textiles, Apparel & Luxury Goods Total | | | 816,856 | | |
| Consumer Discretionary Total | | | 66,627,040 | | |
| Consumer Staples – 1.5% | |
| Food & Staples Retailing – 0.8% | |
| Casey's General Stores, Inc. | | | 59,851 | | | | 2,498,779 | | |
| Pantry, Inc. (a) | | | 105,216 | | | | 2,536,758 | | |
| Food & Staples Retailing Total | | | 5,035,537 | | |
| | | Shares | | Value ($) | |
| Food Products – 0.7% | |
| Corn Products International, Inc. | | | 115,401 | | | | 4,327,538 | | |
| Food Products Total | | | 4,327,538 | | |
| Consumer Staples Total | | | 9,363,075 | | |
| Energy – 3.7% | |
| Energy Equipment & Services – 3.2% | |
Gulfmark Offshore, Inc.,
Class A (a) | | | 114,691 | | | | 3,523,308 | | |
Helix Energy Solutions Group,
Inc. (a) | | | 224,700 | | | | 2,503,158 | | |
| Newpark Resources, Inc. (a) | | | 457,058 | | | | 3,839,287 | | |
Oceaneering International,
Inc. (a) | | | 36,570 | | | | 1,969,660 | | |
| Tetra Technologies, Inc. (a) | | | 628,281 | | | | 6,408,466 | | |
| Unit Corp. (a) | | | 61,400 | | | | 2,289,606 | | |
| Energy Equipment & Services Total | | | 20,533,485 | | |
| Oil, Gas & Consumable Fuels – 0.5% | |
| EXCO Resources, Inc. | | | 202,287 | | | | 3,008,008 | | |
| Oil, Gas & Consumable Fuels Total | | | 3,008,008 | | |
| Energy Total | | | 23,541,493 | | |
| Financials – 12.6% | |
| Capital Markets – 1.0% | |
Investment Technology Group,
Inc. (a) | | | 255,650 | | | | 3,635,343 | | |
Waddell & Reed Financial, Inc.,
Class A | | | 112,407 | | | | 3,075,456 | | |
| Capital Markets Total | | | 6,710,799 | | |
| Commercial Banks – 3.3% | |
| Centerstate Banks, Inc. | | | 188,180 | | | | 1,614,584 | | |
| Hancock Holding Co. | | | 72,106 | | | | 2,168,227 | | |
| Iberiabank Corp. | | | 46,535 | | | | 2,325,819 | | |
| Oriental Financial Group | | | 509,659 | | | | 6,778,465 | | |
| SCBT Financial Corp. | | | 52,136 | | | | 1,626,122 | | |
Simmons First National Corp.,
Class A | | | 91,400 | | | | 2,583,878 | | |
| Southwest Bancorp, Inc. | | | 23,306 | | | | 302,279 | | |
Union First Market Bankshares
Corp. | | | 121,924 | | | | 1,592,328 | | |
| Webster Financial Corp. | | | 120,470 | | | | 2,115,453 | | |
| Commercial Banks Total | | | 21,107,155 | | |
| Consumer Finance – 1.1% | |
| Cash America International, Inc. | | | 173,268 | | | | 6,064,380 | | |
| QC Holdings, Inc. | | | 177,170 | | | | 689,191 | | |
| Consumer Finance Total | | | 6,753,571 | | |
See Accompanying Notes to Financial Statements.
61
Columbia Small Cap Core Fund
September 30, 2010
| Common Stocks (continued) | |
| | | Shares | | Value ($) | |
| Insurance – 2.8% | |
| Arthur J. Gallagher & Co. | | | 94,900 | | | | 2,502,513 | | |
| CNO Financial Group, Inc. (a) | | | 434,450 | | | | 2,406,853 | | |
Delphi Financial Group, Inc.,
Class A | | | 94,100 | | | | 2,351,559 | | |
| eHealth, Inc. (a) | | | 90,800 | | | | 1,173,136 | | |
| First Mercury Financial Corp. | | | 238,217 | | | | 2,401,228 | | |
| Horace Mann Educators Corp. | | | 208,017 | | | | 3,698,542 | | |
| National Interstate Corp. | | | 72,821 | | | | 1,585,313 | | |
| State Auto Financial Corp. | | | 143,254 | | | | 2,178,893 | | |
| Insurance Total | | | 18,298,037 | | |
| Real Estate Investment Trusts (REITs) – 2.9% | |
| Acadia Realty Trust | | | 150,596 | | | | 2,861,324 | | |
American Campus Communities,
Inc. | | | 152,732 | | | | 4,649,162 | | |
| DiamondRock Hospitality Co. (a) | | | 266,733 | | | | 2,531,296 | | |
| DuPont Fabros Technology, Inc. | | | 139,800 | | | | 3,515,970 | | |
| First Potomac Realty Trust | | | 239,848 | | | | 3,597,720 | | |
| Mack-Cali Realty Corp. | | | 52,200 | | | | 1,707,462 | | |
| Real Estate Investment Trusts (REITs) Total | | | 18,862,934 | | |
| Thrifts & Mortgage Finance – 1.5% | |
| Abington Bancorp, Inc. | | | 176,921 | | | | 1,864,747 | | |
| Dime Community Bancshares | | | 193,167 | | | | 2,675,363 | | |
First Niagara Financial Group,
Inc. | | | 152,159 | | | | 1,772,653 | | |
| Jefferson Bancshares, Inc. | | | 219,422 | | | | 757,006 | | |
| NewAlliance Bancshares, Inc. | | | 196,389 | | | | 2,478,429 | | |
| Thrifts & Mortgage Finance Total | | | 9,548,198 | | |
| Financials Total | | | 81,280,694 | | |
| Health Care – 14.5% | |
| Biotechnology – 0.6% | |
| Myriad Genetics, Inc. (a) | | | 248,000 | | | | 4,069,680 | | |
| Biotechnology Total | | | 4,069,680 | | |
| Health Care Equipment & Supplies – 5.4% | |
| Analogic Corp. | | | 133,106 | | | | 5,973,797 | | |
| Cooper Companies, Inc. | | | 136,874 | | | | 6,326,316 | | |
| Greatbatch, Inc. (a) | | | 186,953 | | | | 4,335,440 | | |
| Invacare Corp. | | | 258,151 | | | | 6,843,583 | | |
| STAAR Surgical Co. (a) | | | 1,061,667 | | | | 5,743,619 | | |
| Symmetry Medical, Inc. (a) | | | 281,308 | | | | 2,711,809 | | |
West Pharmaceutical Services,
Inc. | | | 84,740 | | | | 2,907,430 | | |
| Health Care Equipment & Supplies Total | | | 34,841,994 | | |
| Health Care Providers & Services – 6.6% | |
| Air Methods Corp. (a) | | | 282,725 | | | | 11,755,705 | | |
| LifePoint Hospitals, Inc. (a) | | | 64,015 | | | | 2,244,366 | | |
| Magellan Health Services, Inc. (a) | | | 81,426 | | | | 3,846,564 | | |
| | | Shares | | Value ($) | |
| Owens & Minor, Inc. | | | 106,128 | | | | 3,020,403 | | |
| Providence Service Corp. (a) | | | 314,005 | | | | 5,146,542 | | |
| PSS World Medical, Inc. (a) | | | 143,202 | | | | 3,061,659 | | |
| Res-Care, Inc. (a) | | | 823,884 | | | | 10,932,941 | | |
| U.S. Physical Therapy, Inc. (a) | | | 118,939 | | | | 1,988,660 | | |
| Health Care Providers & Services Total | | | 41,996,840 | | |
| Life Sciences Tools & Services – 0.9% | |
| Accelrys, Inc. (a) | | | 421,459 | | | | 2,933,354 | | |
| Cambrex Corp. (a) | | | 686,303 | | | | 2,916,788 | | |
| Life Sciences Tools & Services Total | | | 5,850,142 | | |
| Pharmaceuticals – 1.0% | |
| Hi-Tech Pharmacal Co., Inc. (a) | | | 110,465 | | | | 2,235,812 | | |
| Obagi Medical Products, Inc. (a) | | | 383,931 | | | | 4,031,275 | | |
| Pharmaceuticals Total | | | 6,267,087 | | |
| Health Care Total | | | 93,025,743 | | |
| Industrials – 21.3% | |
| Aerospace & Defense – 3.8% | |
| AAR Corp. (a) | | | 290,494 | | | | 5,420,618 | | |
American Science &
Engineering, Inc. | | | 71,800 | | | | 5,288,070 | | |
Global Defense Technology &
Systems, Inc. (a) | | | 260,369 | | | | 3,567,055 | | |
| Ladish Co., Inc. (a) | | | 87,637 | | | | 2,728,140 | | |
| LMI Aerospace, Inc. (a) | | | 137,702 | | | | 2,192,216 | | |
| Moog, Inc., Class A (a) | | | 151,441 | | | | 5,377,670 | | |
| Aerospace & Defense Total | | | 24,573,769 | | |
| Air Freight & Logistics – 1.0% | |
Atlas Air Worldwide Holdings,
Inc. (a) | | | 110,683 | | | | 5,567,355 | | |
| Pacer International, Inc. (a) | | | 169,838 | | | | 1,025,821 | | |
| Air Freight & Logistics Total | | | 6,593,176 | | |
| Commercial Services & Supplies – 2.3% | |
| Consolidated Graphics, Inc. (a) | | | 83,303 | | | | 3,452,909 | | |
| McGrath Rentcorp | | | 180,268 | | | | 4,317,419 | | |
| Unifirst Corp. | | | 159,419 | | | | 7,038,349 | | |
| Commercial Services & Supplies Total | | | 14,808,677 | | |
| Construction & Engineering – 2.1% | |
| EMCOR Group, Inc. (a) | | | 293,068 | | | | 7,206,542 | | |
| MasTec, Inc. (a) | | | 293,028 | | | | 3,024,049 | | |
| Northwest Pipe Co. (a) | | | 93,981 | | | | 1,644,667 | | |
| Sterling Construction Co., Inc. (a) | | | 148,162 | | | | 1,834,246 | | |
| Construction & Engineering Total | | | 13,709,504 | | |
| Electrical Equipment – 3.2% | |
| Belden, Inc. | | | 203,200 | | | | 5,360,416 | | |
| EnerSys (a) | | | 122,500 | | | | 3,058,825 | | |
| GrafTech International Ltd. (a) | | | 201,646 | | | | 3,151,727 | | |
See Accompanying Notes to Financial Statements.
62
Columbia Small Cap Core Fund
September 30, 2010
| Common Stocks (continued) | |
| | | Shares | | Value ($) | |
| LaBarge, Inc. (a) | | | 177,714 | | | | 2,219,648 | | |
| LSI Industries, Inc. | | | 710,388 | | | | 4,560,691 | | |
| Powell Industries, Inc. (a) | | | 72,500 | | | | 2,256,200 | | |
| Electrical Equipment Total | | | 20,607,507 | | |
| Machinery – 3.6% | |
Albany International Corp.,
Class A | | | 345,700 | | | | 6,540,644 | | |
| Flanders Corp. (a) | | | 892,015 | | | | 2,720,646 | | |
| Key Technology, Inc. (a) | | | 175,917 | | | | 2,272,848 | | |
| Miller Industries, Inc. | | | 165,782 | | | | 2,243,030 | | |
| PMFG, Inc. (a) | | | 189,500 | | | | 3,230,975 | | |
| Tennant Co. | | | 93,248 | | | | 2,881,363 | | |
| Wabash National Corp. (a) | | | 407,301 | | | | 3,295,065 | | |
| Machinery Total | | | 23,184,571 | | |
| Professional Services – 2.7% | |
| FTI Consulting, Inc. (a) | | | 140,562 | | | | 4,876,096 | | |
| Hill International, Inc. (a) | | | 405,900 | | | | 1,818,432 | | |
| Kforce, Inc. (a) | | | 409,989 | | | | 5,625,049 | | |
| Navigant Consulting, Inc. (a) | | | 222,878 | | | | 2,592,071 | | |
| SFN Group, Inc. (a) | | | 361,545 | | | | 2,172,886 | | |
| Professional Services Total | | | 17,084,534 | | |
| Road & Rail – 0.6% | |
| Kansas City Southern (a) | | | 92,015 | | | | 3,442,281 | | |
| Road & Rail Total | | | 3,442,281 | | |
| Trading Companies & Distributors – 2.0% | |
| Kaman Corp. | | | 209,695 | | | | 5,496,106 | | |
| Rush Enterprises, Inc., Class A (a) | | | 155,430 | | | | 2,384,296 | | |
| Rush Enterprises, Inc., Class B (a) | | | 159,851 | | | | 2,197,951 | | |
| Titan Machinery, Inc. (a) | | | 162,966 | | | | 2,656,346 | | |
| Trading Companies & Distributors Total | | | 12,734,699 | | |
| Industrials Total | | | 136,738,718 | | |
| Information Technology – 26.0% | |
| Communications Equipment – 1.6% | |
| Adtran, Inc. | | | 98,346 | | | | 3,471,614 | | |
| EMS Technologies, Inc. (a) | | | 167,836 | | | | 3,126,785 | | |
| Globecomm Systems, Inc. (a) | | | 267,539 | | | | 2,239,301 | | |
Performance Technologies,
Inc. (a)(b) | | | 619,141 | | | | 1,331,153 | | |
| Communications Equipment Total | | | 10,168,853 | | |
| Computers & Peripherals – 1.9% | |
| Avid Technology, Inc. (a) | | | 89,028 | | | | 1,167,157 | | |
| Hypercom Corp. (a) | | | 615,515 | | | | 4,000,848 | | |
| Imation Corp. (a) | | | 220,204 | | | | 2,054,503 | | |
| Presstek, Inc. (a) | | | 396,137 | | | | 867,540 | | |
| Rimage Corp. (a) | | | 260,161 | | | | 4,277,047 | | |
| Computers & Peripherals Total | | | 12,367,095 | | |
| | | Shares | | Value ($) | |
| Electronic Equipment, Instruments & Components – 7.5% | |
| Benchmark Electronics, Inc. (a) | | | 926,000 | | | | 15,186,400 | | |
| FARO Technologies, Inc. (a) | | | 297,406 | | | | 6,486,425 | | |
| Keithley Instruments, Inc. | | | 439,562 | | | | 9,454,979 | | |
| LeCroy Corp. (a) | | | 202,148 | | | | 1,596,969 | | |
| Newport Corp. (a) | | | 270,756 | | | | 3,070,373 | | |
| Plexus Corp. (a) | | | 283,032 | | | | 8,306,989 | | |
| Spectrum Control, Inc. (a) | | | 165,100 | | | | 2,430,272 | | |
| Technitrol, Inc. | | | 417,423 | | | | 1,840,835 | | |
Electronic Equipment, Instruments &
Components Total | | | 48,373,242 | | |
| Internet Software & Services – 2.1% | |
| Digital River, Inc. (a) | | | 215,500 | | | | 7,335,620 | | |
| EarthLink, Inc. | | | 708,940 | | | | 6,444,264 | | |
| Internet Software & Services Total | | | 13,779,884 | | |
| IT Services – 2.7% | |
| Analysts International Corp. (a) | | | 171,353 | | | | 394,112 | | |
| Computer Task Group, Inc. (a) | | | 708,325 | | | | 5,411,603 | | |
| Integral Systems, Inc. (a) | | | 350,055 | | | | 2,583,406 | | |
| NCI, Inc., Class A (a) | | | 173,600 | | | | 3,284,512 | | |
| Startek, Inc. (a) | | | 52,590 | | | | 219,826 | | |
| TNS, Inc. (a) | | | 313,901 | | | | 5,320,622 | | |
| IT Services Total | | | 17,214,081 | | |
| Semiconductors & Semiconductor Equipment – 4.6% | |
| ATMI, Inc. (a) | | | 173,159 | | | | 2,573,143 | | |
| BTU International, Inc. (a) | | | 277,842 | | | | 1,922,667 | | |
| Cirrus Logic, Inc. (a) | | | 162,192 | | | | 2,893,505 | | |
| Exar Corp. (a) | | | 302,013 | | | | 1,809,058 | | |
Fairchild Semiconductor
International, Inc. (a) | | | 486,187 | | | | 4,570,158 | | |
| IXYS Corp. (a) | | | 156,629 | | | | 1,495,807 | | |
| MIPS Technologies, Inc. (a) | | | 406,000 | | | | 3,950,380 | | |
| ON Semiconductor Corp. (a) | | | 639,506 | | | | 4,610,838 | | |
| Pericom Semiconductor Corp. (a) | | | 276,657 | | | | 2,404,149 | | |
| Ultratech, Inc. (a) | | | 194,130 | | | | 3,319,623 | | |
Semiconductors & Semiconductor
Equipment Total | | | 29,549,328 | | |
| Software – 5.6% | |
| Bottomline Technologies, Inc. (a) | | | 205,012 | | | | 3,148,984 | | |
| Epicor Software Corp. (a) | | | 315,464 | | | | 2,744,537 | | |
| Lawson Software, Inc. (a) | | | 520,925 | | | | 4,412,235 | | |
| Mentor Graphics Corp. (a) | | | 346,924 | | | | 3,666,987 | | |
| Progress Software Corp. (a) | | | 388,290 | | | | 12,852,399 | | |
| S1 Corp. (a) | | | 506,660 | | | | 2,639,698 | | |
| Sonic Solutions (a) | | | 216,244 | | | | 2,460,857 | | |
| Websense, Inc. (a) | | | 210,000 | | | | 3,725,400 | | |
| Software Total | | | 35,651,097 | | |
| Information Technology Total | | | 167,103,580 | | |
See Accompanying Notes to Financial Statements.
63
Columbia Small Cap Core Fund
September 30, 2010
| Common Stocks (continued) | |
| | | Shares | | Value ($) | |
| Materials – 5.1% | |
| Chemicals – 2.7% | |
| H.B. Fuller Co. | | | 366,114 | | | | 7,274,685 | | |
| Sensient Technologies Corp. | | | 206,086 | | | | 6,283,562 | | |
| Spartech Corp. (a) | | | 446,607 | | | | 3,666,644 | | |
| Chemicals Total | | | 17,224,891 | | |
| Containers & Packaging – 1.3% | |
| Greif, Inc., Class A | | | 143,690 | | | | 8,454,720 | | |
| Containers & Packaging Total | | | 8,454,720 | | |
| Metals & Mining – 0.6% | |
| Metals USA Holdings Corp. (a) | | | 320,790 | | | | 4,163,854 | | |
| Metals & Mining Total | | | 4,163,854 | | |
| Paper & Forest Products – 0.5% | |
| Glatfelter Co. | | | 262,822 | | | | 3,195,915 | | |
| Paper & Forest Products Total | | | 3,195,915 | | |
| Materials Total | | | 33,039,380 | | |
| Telecommunication Services – 0.5% | |
| Diversified Telecommunication Services – 0.5% | |
General Communication, Inc.,
Class A (a) | | | 308,542 | | | | 3,076,164 | | |
Diversified Telecommunication
Services Total | | | 3,076,164 | | |
| Telecommunication Services Total | | | 3,076,164 | | |
| Utilities – 2.4% | |
| Gas Utilities – 1.4% | |
| New Jersey Resources Corp. | | | 96,499 | | | | 3,784,691 | | |
| South Jersey Industries, Inc. | | | 108,890 | | | | 5,386,788 | | |
| Gas Utilities Total | | | 9,171,479 | | |
| Water Utilities – 1.0% | |
| American States Water Co. | | | 114,859 | | | | 4,109,655 | | |
| California Water Service Group | | | 52,873 | | | | 1,953,657 | | |
| Water Utilities Total | | | 6,063,312 | | |
| Utilities Total | | | 15,234,791 | | |
Total Common Stocks
(Cost of $586,326,125) | | | 629,030,678 | | |
| Short-Term Obligation – 1.9% | |
| | | Par ($) | | Value ($) | |
Repurchase agreement with
Fixed Income Clearing Corp.,
dated 09/30/10, due 10/01/10
at 0.220%, collateralized by a
U.S. Treasury obligation
maturing 08/15/19, market
value $12,644,500 (repurchase
proceeds $12,394,076) | | | 12,394,000 | | | | 12,394,000 | | |
Total Short-Term Obligation
(Cost of $12,394,000) | | | 12,394,000 | | |
Total Investments – 99.9%
(Cost of $598,720,125) (c) | | | 641,424,678 | | |
| Other Assets & Liabilities, Net – 0.1% | | | 793,296 | | |
| Net Assets – 100.0% | | | 642,217,974 | | |
Notes to Investment Portfolio:
(a) Non-income producing security.
(b) An affiliate may include any company in which the Fund owns five percent or more of its outstanding voting shares. Transactions in this affiliated company during the year ended September 30, 2010, are as follows:
| Affiliate | | Value,
beginning
of period | | Purchases | | Sales
Proceeds | | Dividend
Income | | Value,
end of
period | |
Performance
Technologies,
Inc. | | $ | 1,776,935 | | | $ | — | | | $ | — | | | $ | — | | | $ | 1,331,153 | | |
(c) Cost for federal income tax purposes is $599,510,487.
The following table summarizes the inputs used, as of September 30, 2010, in valuing the Fund's assets:
| Description | | Quoted
(Level 1) | | Other
Significant
Observable
Inputs
(Level 2) | | Significant
Unobservable
Inputs
(Level 3) | | Total | |
| Total Common Stocks | | $ | 629,030,678 | | | $ | — | | | $ | — | | | $ | 629,030,678 | | |
Total Short-Term
Obligation | | | — | | | | 12,394,000 | | | | — | | | | 12,394,000 | | |
| Total Investments | | $ | 629,030,678 | | | $ | 12,394,000 | | | $ | — | | | $ | 641,424,678 | | |
Certain short-term obligations may be valued using amortized cost, an income approach which converts future cash flows to a present value based upon the discount or premium at purchase.
There were no significant transfers of financial assets between Levels 1 and 2 during the period.
For more information on valuation inputs, and their aggregation into the levels used in the table above, please refer to the Security Valuation section in the accompanying Notes to Financial Statements.
See Accompanying Notes to Financial Statements.
64
Columbia Small Cap Core Fund
September 30, 2010
At September 30, 2010, the Fund held investments in the following sectors:
| Sector (Unaudited) | | % of
Net Assets | |
| Information Technology | | | 26.0 | | |
| Industrials | | | 21.3 | | |
| Health Care | | | 14.5 | | |
| Financials | | | 12.6 | | |
| Consumer Discretionary | | | 10.4 | | |
| Materials | | | 5.1 | | |
| Energy | | | 3.7 | | |
| Utilities | | | 2.4 | | |
| Consumer Staples | | | 1.5 | | |
| Telecommunication Services | | | 0.5 | | |
| | | | 98.0 | | |
| Short-Term Obligation | | | 1.9 | | |
| Other Assets & Liabilities, Net | | | 0.1 | | |
| | | | 100.0 | | |
See Accompanying Notes to Financial Statements.
65
This page intentionally left blank.
Statements of Assets and Liabilities – Stock Funds
September 30, 2010
| | | Columbia
Asset
Allocation Fund | | Columbia
Large Cap
Growth Fund | | Columbia
Disciplined
Value Fund | | Columbia
Contrarian
Core Fund | | Columbia
Small Cap
Core Fund | |
| Assets | |
| Unaffiliated investments, at identified cost | | $ | 192,263,579 | | | $ | 1,014,813,134 | | | $ | 184,219,677 | | | $ | 507,552,667 | | | $ | 593,306,893 | | |
| Affiliated investments, at identified cost | | | — | | | | — | | | | — | | | | — | | | | 5,413,232 | | |
| Total investments, at identified cost | | | 192,263,579 | | | | 1,014,813,134 | | | | 184,219,677 | | | | 507,552,667 | | | | 598,720,125 | | |
| Unaffiliated investments, at value | | | 213,911,217 | | | | 1,230,461,418 | | | | 212,788,796 | | | | 591,109,045 | | | | 640,093,525 | | |
| Affiliated investments, at value | | | — | | | | — | | | | — | | | | — | | | | 1,331,153 | | |
| Total investments, at value | | | 213,911,217 | | | | 1,230,461,418 | | | | 212,788,796 | | | | 591,109,045 | | | | 641,424,678 | | |
| Cash | | | 154,940 | | | | 2,821,591 | | | | 104 | | | | 10,079 | | | | 632 | | |
| Cash collateral for open futures contracts | | | 965,000 | | | | — | | | | — | | | | — | | | | — | | |
Foreign currency (cost of $10,990, $—, $—,
$— and $—, respectively) | | | 11,011 | | | | — | | | | — | | | | — | | | | — | | |
Unrealized appreciation on forward
foreign currency exchange contracts | | | 98,839 | | | | — | | | | — | | | | — | | | | — | | |
| Receivable for: | |
| Investments sold | | | 2,480,538 | | | | 8,829,908 | | | | — | | | | 3,374,584 | | | | 1,826,291 | | |
| Fund shares sold | | | 19,114 | | | | 296,492 | | | | 108,149 | | | | 870,300 | | | | 961,184 | | |
| Dividends | | | 184,923 | | | | 953,171 | | | | 364,702 | | | | 704,841 | | | | 395,045 | | |
| Interest | | | 661,258 | | | | 40 | | | | 9 | | | | 1 | | | | 76 | | |
| Foreign tax reclaims | | | 42,842 | | | | — | | | | — | | | | — | | | | — | | |
Expense reimbursement due from
investment advisor | | | 123,756 | | | | — | | | | 4,699 | | | | 106,602 | | | | — | | |
| Trustees' deferred compensation plan | | | 51,275 | | | | 202,766 | | | | 50,645 | | | | 55,881 | | | | 90,382 | | |
| Prepaid expenses | | | 3,011 | | | | 15,321 | | | | 3,183 | | | | 5,825 | | | | 7,719 | | |
| Other assets | | | — | | | | 1,234 | | | | — | | | | — | | | | — | | |
| Total Assets | | | 218,707,724 | | | | 1,243,581,941 | | | | 213,320,287 | | | | 596,237,158 | | | | 644,706,007 | | |
| Liabilities | |
Written option contracts, at value (premium
of $5,174, $—, $—, $— and $—, respectively) | | | 8,801 | | | | — | | | | — | | | | — | | | | — | | |
Unrealized depreciation on forward foreign
currency exchange contracts | | | 49,148 | | | | — | | | | — | | | | — | | | | — | | |
| Payable for: | |
| Investments purchased | | | 2,205,809 | | | | 15,815,129 | | | | — | | | | 2,933,163 | | | | 776,250 | | |
Investments purchased on a delayed
delivery basis | | | 1,021,683 | | | | — | | | | — | | | | — | | | | — | | |
| Fund shares repurchased | | | 113,643 | | | | 7,272,487 | | | | 5,162,997 | | | | 2,170,212 | | | | 853,569 | | |
| Futures variation margin | | | 17,625 | | | | — | | | | 7,733 | | | | — | | | | — | | |
| Foreign capital gains taxes withheld | | | 934 | | | | — | | | | — | | | | — | | | | — | | |
| Investment advisory fee | | | 115,984 | | | | 516,136 | | | | 122,922 | | | | 329,564 | | | | 370,348 | | |
| Administration fee | | | 12,006 | | | | 49,358 | | | | 11,766 | | | | 31,852 | | | | 33,481 | | |
| Pricing and bookkeeping fees | | | 15,539 | | | | 11,895 | | | | 6,820 | | | | 9,982 | | | | 11,498 | | |
| Transfer agent fee | | | 52,822 | | | | 279,958 | | | | 40,079 | | | | 80,807 | | | | 216,833 | | |
| Trustees' fees | | | 415 | | | | 396 | | | | 203 | | | | 100 | | | | 1,566 | | |
| Audit fee | | | 36,971 | | | | 31,171 | | | | 27,971 | | | | 32,571 | | | | 30,571 | | |
| Custody fee | | | 45,607 | | | | 6,724 | | | | 3,175 | | | | 3,625 | | | | 3,961 | | |
| Distribution and service fees | | | 34,303 | | | | 93,503 | | | | 21,791 | | | | 66,709 | | | | 70,734 | | |
| Chief compliance officer expenses | | | 250 | | | | 525 | | | | 235 | | | | 319 | | | | 360 | | |
| Trustees' deferred compensation plan | | | 51,275 | | | | 202,766 | | | | 50,645 | | | | 55,881 | | | | 90,382 | | |
| Other liabilities | | | 30,456 | | | | 81,620 | | | | 34,527 | | | | 30,801 | | | | 28,480 | | |
| Total Liabilities | | | 3,813,271 | | | | 24,361,668 | | | | 5,490,864 | | | | 5,745,586 | | | | 2,488,033 | | |
| Net Assets | | | 214,894,453 | | | | 1,219,220,273 | | | | 207,829,423 | | | | 590,491,572 | | | | 642,217,974 | | |
| Net Assets Consist of | |
| Paid-in capital | | | 225,890,067 | | | | 1,254,627,133 | | | | 292,709,938 | | | | 518,033,925 | | | | 616,994,363 | | |
Undistributed (overdistributed) net
investment income | | | 92,622 | | | | 2,996,957 | | | | 220,560 | | | | 1,431,478 | | | | (547,519 | ) | |
| Accumulated net realized loss | | | (32,887,992 | ) | | | (254,052,101 | ) | | | (113,670,194 | ) | | | (12,530,209 | ) | | | (16,933,423 | ) | |
| Net unrealized appreciation (depreciation) on: | |
| Investments | | | 21,647,638 | | | | 215,648,284 | | | | 28,569,119 | | | | 83,556,378 | | | | 42,704,553 | | |
Foreign currency translations and forward
foreign currency exchange contracts | | | 54,993 | | | | — | | | | — | | | | — | | | | — | | |
| Futures contracts | | | 101,686 | | | | — | | | | — | | | | — | | | | — | | |
| Written option contracts | | | (3,627 | ) | | | — | | | | — | | | | — | | | | — | | |
| Foreign capital gains tax | | | (934 | ) | | | — | | | | — | | | | — | | | | — | | |
| Net Assets | | | 214,894,453 | | | | 1,219,220,273 | | | | 207,829,423 | | | | 590,491,572 | | | | 642,217,974 | | |
See Accompanying Notes to Financial Statements.
67
Statements of Assets and Liabilities (continued) – Stock Funds
September 30, 2010
| | | Columbia
Asset
Allocation Fund | | Columbia
Large Cap
Growth Fund | | Columbia
Disciplined
Value Fund | | Columbia
Contrarian
Core Fund | | Columbia
Small Cap
Core Fund | |
| Class A | |
| Net assets | | $ | 9,161,180 | | | $ | 148,455,253 | | | $ | 9,109,442 | | | $ | 111,182,019 | | | $ | 121,455,516 | | |
| Shares outstanding | | | 684,028 | | | | 7,193,914 | | | | 903,238 | | | | 8,816,877 | | | | 9,112,757 | | |
| Net asset value per share (a) | | $ | 13.39 | | | $ | 20.64 | | | $ | 10.09 | | | $ | 12.61 | | | $ | 13.33 | | |
| Maximum sales charge | | | 5.75 | % | | | 5.75 | % | | | 5.75 | % | | | 5.75 | % | | | 5.75 | % | |
| Maximum offering price per share (b) | | $ | 14.21 | | | $ | 21.90 | | | $ | 10.71 | | | $ | 13.38 | | | $ | 14.14 | | |
| Class B | |
| Net assets | | $ | 2,874,447 | | | $ | 14,526,570 | | | $ | 1,643,588 | | | $ | 3,990,937 | | | $ | 15,477,644 | | |
| Shares outstanding | | | 214,860 | | | | 765,782 | | | | 172,968 | | | | 338,703 | | | | 1,300,574 | | |
Net asset value and offering
price per share (a) | | $ | 13.38 | | | $ | 18.97 | | | $ | 9.50 | | | $ | 11.78 | | | $ | 11.90 | | |
| Class C | |
| Net assets | | $ | 1,519,057 | | | $ | 15,989,900 | | | $ | 1,879,191 | | | $ | 18,368,411 | | | $ | 19,635,260 | | |
| Shares outstanding | | | 113,509 | | | | 842,508 | | | | 198,574 | | | | 1,557,077 | | | | 1,647,681 | | |
Net asset value and offering
price per share (a) | | $ | 13.38 | | | $ | 18.98 | | | $ | 9.46 | | | $ | 11.80 | | | $ | 11.92 | | |
| Class E | |
| Net assets | | | — | | | $ | 12,800,418 | | | | — | | | | — | | | | — | | |
| Shares outstanding | | | — | | | | 621,432 | | | | — | | | | — | | | | — | | |
| Net asset value per share (a) | | | — | | | $ | 20.60 | | | | — | | | | — | | | | — | | |
| Maximum sales charge | | | | | | | 4.50 | % | | | | | | | | | | | | | |
| Maximum offering price per share (b) | | | — | | | $ | 21.57 | | | | — | | | | — | | | | — | | |
| Class F | |
| Net assets | | | — | | | $ | 425,226 | | | | — | | | | — | | | | — | | |
| Shares outstanding | | | — | | | | 22,427 | | | | — | | | | — | | | | — | | |
Net asset value and offering
price per share (a) | | | — | | | $ | 18.96 | | | | — | | | | — | | | | — | | |
| Class I (c) | |
| Net assets | | | — | | | $ | 2,495 | | | | — | | | $ | 2,497 | | | $ | 2,560 | | |
| Shares outstanding | | | — | | | | 118 | | | | — | | | | 197 | | | | 187 | | |
Net asset value, offering and redemption
price per share (a) | | | — | | | $ | 21.14 | | | | — | | | $ | 12.69 | (d) | | $ | 13.69 | | |
| Class R (c) | |
| Net assets | | | — | | | $ | 2,495 | | | | — | | | $ | 2,497 | | | | — | | |
| Shares outstanding | | | — | | | | 121 | | | | — | | | | 198 | | | | — | | |
Net asset value, offering and redemption
price per share | | | — | | | $ | 20.64 | (d) | | | — | | | $ | 12.61 | | | | — | | |
(a) Redemption price per share is equal to net asset value less any applicable contingent deferred sales charge.
(b) On sales of $50,000 or more the offering price is reduced.
(c) Shares commenced operations on September 27, 2010.
(d) Net asset value per share rounds to this amount due to fractional shares outstanding.
See Accompanying Notes to Financial Statements.
68
Statements of Assets and Liabilities (continued) – Stock Funds
September 30, 2010
| | | Columbia
Asset
Allocation Fund | | Columbia
Large Cap
Growth Fund | | Columbia
Disciplined
Value Fund | | Columbia
Contrarian
Core Fund | | Columbia
Small Cap
Core Fund | |
| Class T | |
| Net assets | | $ | 109,252,528 | | | $ | 143,783,874 | | | $ | 69,025,236 | | | $ | 112,861,722 | | | $ | 73,959,976 | | |
| Shares outstanding | | | 8,155,013 | | | | 7,016,073 | | | | 6,844,289 | | | | 9,019,636 | | | | 5,644,671 | | |
| Net asset value per share (a) | | $ | 13.40 | | | $ | 20.49 | | | $ | 10.09 | | | $ | 12.51 | | | $ | 13.10 | | |
| Maximum sales charge | | | 5.75 | % | | | 5.75 | % | | | 5.75 | % | | | 5.75 | % | | | 5.75 | % | |
| Maximum offering price per share (b) | | $ | 14.22 | | | $ | 21.74 | | | $ | 10.71 | | | $ | 13.27 | | | $ | 13.90 | | |
| Class W (c) | |
| Net assets | | | — | | | $ | 2,495 | | | | — | | | $ | 2,497 | | | $ | 2,560 | | |
| Shares outstanding | | | — | | | | 121 | | | | — | | | | 198 | | | | 192 | | |
Net asset value, offering and redemption
price per share | | | — | | | $ | 20.64 | (d) | | | — | | | $ | 12.61 | | | $ | 13.32 | (d) | |
| Class Y | |
| Net assets | | | — | | | $ | 22,272,056 | | | | — | | | | — | | | | — | | |
| Shares outstanding | | | — | | | | 1,053,680 | | | | — | | | | — | | | | — | | |
Net asset value, offering and redemption
price per share | | | — | | | $ | 21.14 | | | | — | | | | — | | | | — | | |
| Class Z | |
| Net assets | | $ | 92,087,241 | | | $ | 860,959,491 | | | $ | 126,171,966 | | | $ | 344,080,992 | | | $ | 411,684,458 | | |
| Shares outstanding | | | 6,847,762 | | | | 40,760,043 | | | | 12,184,353 | | | | 27,128,637 | | | | 30,063,379 | | |
Net asset value, offering and redemption
price per share | | $ | 13.45 | | | $ | 21.12 | | | $ | 10.36 | | | $ | 12.68 | | | $ | 13.69 | | |
(a) Redemption price per share is equal to net asset value less any applicable contingent deferred sales charge.
(b) On sales of $50,000 or more the offering price is reduced.
(c) Shares commenced operations on September 27, 2010.
(d) Net asset value per share rounds to this amount due to fractional shares outstanding.
See Accompanying Notes to Financial Statements.
69
Statements of Operations – Stock Funds
For the Year Ended September 30, 2010
| | | Columbia
Asset
Allocation Fund | | Columbia
Large Cap
Growth Fund | | Columbia
Disciplined
Value Fund | | Columbia
Contrarian
Core Fund | | Columbia
Small Cap
Core Fund | |
| Investment Income | |
| Dividends | | $ | 2,207,450 | | | $ | 16,393,112 | | | $ | 6,571,307 | | | $ | 7,644,016 | | | $ | 5,510,429 | | |
| Interest | | | 4,504,818 | | | | 222,155 | | | | 33,398 | | | | 3,890 | | | | 11,864 | | |
| Interest from affiliates | | | 12,352 | | | | — | | | | — | | | | — | | | | — | | |
| Foreign taxes withheld | | | (58,123 | ) | | | (92,578 | ) | | | — | | | | (121,633 | ) | | | (7,098 | ) | |
| Total Investment Income | | | 6,666,497 | | | | 16,522,689 | | | | 6,604,705 | | | | 7,526,273 | | | | 5,515,195 | | |
| Expenses | |
| Investment advisory fee | | | 1,428,488 | | | | 6,603,459 | | | | 1,818,195 | | | | 3,533,971 | | | | 4,378,058 | | |
| Administration fee | | | 147,295 | | | | 636,518 | | | | 174,009 | | | | 339,562 | | | | 395,196 | | |
| Distribution fee: | |
| Class B | | | 25,218 | | | | 145,009 | | | | 14,456 | | | | 29,044 | | | | 123,504 | | |
| Class C | | | 11,116 | | | | 125,726 | | | | 15,375 | | | | 102,777 | | | | 142,113 | | |
| Class E | | | — | | | | 13,009 | | | | — | | | | — | | | | — | | |
| Class F | | | — | | | | 2,969 | | | | — | | | | — | | | | — | | |
| Class R (a) | | | — | | | | — | * | | | — | | | | — | * | | | — | | |
| Service fee: | |
| Class A | | | 21,752 | | | | 372,954 | | | | 24,434 | | | | 175,325 | | | | 251,012 | | |
| Class B | | | 8,406 | | | | 48,336 | | | | 4,819 | | | | 9,682 | | | | 41,168 | | |
| Class C | | | 3,705 | | | | 41,908 | | | | 5,125 | | | | 34,259 | | | | 47,371 | | |
| Class E | | | — | | | | 32,522 | | | | — | | | | — | | | | — | | |
| Class F | | | — | | | | 990 | | | | — | | | | — | | | | — | | |
| Class W (a) | | | — | | | | — | * | | | — | | | | — | * | | | — | * | |
| Shareholder service fee—Class T | | | 335,387 | | | | 436,951 | | | | 213,459 | | | | 347,462 | | | | 223,174 | | |
Transfer agent fee—
Class A, Class B, Class C,
Class T and Class Z | | | 393,775 | | | | — | | | | 297,081 | | | | — | | | | — | | |
Transfer agent fee—
Class A, Class B, Class C, Class E, Class F,
Class R, Class T, Class W and Class Z | | | — | | | | 2,667,626 | | | | — | | | | — | | | | — | | |
Transfer agent fee—
Class A, Class B, Class C, Class R, Class T,
Class W and Class Z | | | — | | | | — | | | | — | | | | 658,225 | | | | — | | |
Transfer agent fee—
Class A, Class B, Class C, Class T,
Class W and Class Z | | | — | | | | — | | | | — | | | | — | | | | 1,018,748 | | |
| Transfer agent fee—Class Y | | | — | | | | 42 | | | | — | | | | — | | | | — | | |
| Pricing and bookkeeping fees | | | 143,227 | | | | 141,553 | | | | 79,963 | | | | 115,837 | | | | 130,787 | | |
| Trustees' fees | | | 23,498 | | | | 69,752 | | | | 28,050 | | | | 31,455 | | | | 35,343 | | |
| Custody fee | | | 252,626 | | | | 39,134 | | | | 17,868 | | | | 21,899 | | | | 19,430 | | |
| Chief compliance officer expenses | | | 1,006 | | | | 1,836 | | | | 1,039 | | | | 1,234 | | | | 1,338 | | |
| Other expenses | | | 222,380 | | | | 653,256 | | | | 243,067 | | | | 345,515 | | | | 244,508 | | |
| Expenses before interest expense | | | 3,017,879 | | | | 12,033,550 | | | | 2,936,940 | | | | 5,746,247 | | | | 7,051,750 | | |
| Interest expense | | | — | | | | 5,699 | | | | 732 | | | | — | | | | — | | |
| Total Expenses | | | 3,017,879 | | | | 12,039,249 | | | | 2,937,672 | | | | 5,746,247 | | | | 7,051,750 | | |
Fees waived or expenses reimbursed by
investment advisor | | | (523,026 | ) | | | — | | | | (60,657 | ) | | | (285,554 | ) | | | — | | |
| Expense reductions | | | (750 | ) | | | (79 | ) | | | (5 | ) | | | (24 | ) | | | (64 | ) | |
| Net Expenses | | | 2,494,103 | | | | 12,039,170 | | | | 2,877,010 | | | | 5,460,669 | | | | 7,051,686 | | |
| Net Investment Income (Loss) | | | 4,172,394 | | | | 4,483,519 | | | | 3,727,695 | | | | 2,065,604 | | | | (1,536,491 | ) | |
* Rounds to less than $1.
(a) Class R and Class W shares commenced operations on September 27, 2010.
See Accompanying Notes to Financial Statements.
70
Statements of Operations (continued) – Stock Funds
For the Year Ended September 30, 2010
| | | Columbia
Asset
Allocation Fund | | Columbia
Large Cap
Growth Fund | | Columbia
Disciplined
Value Fund | | Columbia
Contrarian
Core Fund | | Columbia
Small Cap
Core Fund | |
Net Realized and Unrealized Gain (Loss)
on Investments, Foreign Currency,
Futures Contracts and Written Option
Contracts | |
| Net realized gain (loss) on: | |
| Investments | | $ | 13,153,277 | | | $ | 132,554,148 | | | $ | 35,391,949 | | | $ | 24,721,344 | | | $ | 14,737,595 | | |
Foreign currency transactions and
forward foreign currency exchange
contracts | | | (70,411 | ) | | | (305 | ) | | | — | | | | 477 | | | | — | | |
| Futures contracts | | | (203,068 | ) | | | — | | | | 782,385 | | | | — | | | | — | | |
| Written option contracts | | | 10,428 | | | | — | | | | — | | | | — | | | | — | | |
| Net realized gain | | | 12,890,226 | | | | 132,553,843 | | | | 36,174,334 | | | | 24,721,821 | | | | 14,737,595 | | |
Net change in unrealized appreciation
(depreciation) on: | |
| Investments | | | 784,857 | | | | (6,602,770 | ) | | | (20,507,376 | ) | | | 8,379,488 | | | | 70,278,331 | | |
Foreign currency translations and
forward foreign currency exchange
contracts | | | (34,036 | ) | | | — | | | | — | | | | (37 | ) | | | — | | |
| Futures contracts | | | 48,811 | | | | — | | | | (27,918 | ) | | | — | | | | — | | |
| Written option contracts | | | (3,627 | ) | | | — | | | | — | | | | — | | | | — | | |
| Foreign capital gains tax | | | (934 | ) | | | — | | | | — | | | | — | | | | — | | |
Net change in unrealized appreciation
(depreciation) | | | 795,071 | | | | (6,602,770 | ) | | | (20,535,294 | ) | | | 8,379,451 | | | | 70,278,331 | | |
| Net Gain | | | 13,685,297 | | | | 125,951,073 | | | | 15,639,040 | | | | 33,101,272 | | | | 85,015,926 | | |
| Net Increase Resulting from Operations | | | 17,857,691 | | | | 130,434,592 | | | | 19,366,735 | | | | 35,166,876 | | | | 83,479,435 | | |
See Accompanying Notes to Financial Statements.
71
Statements of Changes in Net Assets – Stock Funds
| Increase (Decrease) in Net Assets | | Columbia Asset Allocation Fund | | Columbia Large Cap Growth Fund | | Columbia Disciplined Value Fund | |
| | | Year
Ended
September 30,
2010 ($) | | Year
Ended
September 30,
2009 ($) | | Year
Ended
September 30,
2010 ($) | | Year
Ended
September 30,
2009 ($) | | Year
Ended
September 30,
2010 ($) | | Year
Ended
September 30,
2009 ($) | |
| Operations | |
| Net investment income (loss) | | | 4,172,394 | | | | 4,898,776 | | | | 4,483,519 | | | | 6,338,320 | | | | 3,727,695 | | | | 5,566,376 | | |
Net realized gain (loss) on investments, foreign
currency transactions, forward foreign currency
exchange contracts, futures contracts and
written option contracts | | | 12,890,226 | | | | (35,320,273 | ) | | | 132,553,843 | | | | (338,092,454 | ) | | | 36,174,334 | | | | (103,097,904 | ) | |
Net change in unrealized appreciation (depreciation)
on investments, foreign currency translations,
forward foreign currency exchange contracts,
futures contracts and written option contracts | | | 795,071 | | | | 31,491,817 | | | | (6,602,770 | ) | | | 266,910,172 | | | | (20,535,294 | ) | | | 71,099,837 | | |
| Net increase (decrease) resulting from operations | | | 17,857,691 | | | | 1,070,320 | | | | 130,434,592 | | | | (64,843,962 | ) | | | 19,366,735 | | | | (26,431,691 | ) | |
| Distributions to Shareholders | |
| From net investment income: | |
| Class A | | | (177,876 | ) | | | (150,796 | ) | | | (706,752 | ) | | | (140,147 | ) | | | (125,111 | ) | | | (209,449 | ) | |
| Class B | | | (43,218 | ) | | | (55,722 | ) | | | — | | | | — | | | | (10,868 | ) | | | (31,603 | ) | |
| Class C | | | (18,826 | ) | | | (18,706 | ) | | | — | | | | — | | | | (11,938 | ) | | | (24,079 | ) | |
| Class E | | | — | | | | — | | | | (52,446 | ) | | | (1,130 | ) | | | — | | | | — | | |
| Class T | | | (2,212,179 | ) | | | (2,288,522 | ) | | | (644,779 | ) | | | — | | | | (878,838 | ) | | | (1,247,692 | ) | |
| Class Y | | | — | | | | — | | | | (144,925 | ) | | | — | | | | — | | | | — | | |
| Class Z | | | (2,137,943 | ) | | | (2,159,589 | ) | | | (6,417,493 | ) | | | (2,956,052 | ) | | | (2,534,221 | ) | | | (4,279,319 | ) | |
| From net realized gains: | |
| Class A | | | — | | | | — | | | | — | | | | — | | | | — | | | | — | | |
| Class B | | | — | | | | — | | | | — | | | | — | | | | — | | | | — | | |
| Class C | | | — | | | | — | | | | — | | | | — | | | | — | | | | — | | |
| Class T | | | — | | | | — | | | | — | | | | — | | | | — | | | | — | | |
| Class Z | | | — | | | | — | | | | — | | | | — | | | | — | | | | — | | |
| Total distributions to shareholders | | | (4,590,042 | ) | | | (4,673,335 | ) | | | (7,966,395 | ) | | | (3,097,329 | ) | | | (3,560,976 | ) | | | (5,792,142 | ) | |
| Net Capital Stock Transactions | | | (22,212,031 | ) | | | (24,306,040 | ) | | | (207,285,552 | ) | | | (28,921,925 | ) | | | (113,954,525 | ) | | | 3,409,644 | | |
| Increase from regulatory settlements | | | 39 | | | | — | | | | 24,162 | | | | 663,170 | | | | 4 | | | | — | | |
| Total increase (decrease) in net assets | | | (8,944,343 | ) | | | (27,909,055 | ) | | | (84,793,193 | ) | | | (96,200,046 | ) | | | (98,148,762 | ) | | | (28,814,189 | ) | |
| Net Assets | |
| Beginning of period | | | 223,838,796 | | | | 251,747,851 | | | | 1,304,013,466 | | | | 1,400,213,512 | | | | 305,978,185 | | | | 334,792,374 | | |
| End of period | | | 214,894,453 | | | | 223,838,796 | | | | 1,219,220,273 | | | | 1,304,013,466 | | | | 207,829,423 | | | | 305,978,185 | | |
Undistributed (Overdistributed) net investment
income at end of period | | | 92,622 | | | | 266,974 | | | | 2,996,957 | | | | 6,455,976 | | | | 220,560 | | | | 53,837 | | |
See Accompanying Notes to Financial Statements.
72
| Increase (Decrease) in Net Assets | | Columbia Contrarian Core Fund | | Columbia Small Cap Core Fund | |
| | | Year
Ended
September 30,
2010 ($) | | Year
Ended
September 30,
2009 ($) | | Year
Ended
September 30,
2010 ($) | | Year
Ended
September 30,
2009 ($) | |
| Operations | |
| Net investment income (loss) | | | 2,065,604 | | | | 2,909,706 | | | | (1,536,491 | ) | | | (854,945 | ) | |
Net realized gain (loss) on investments, foreign
currency transactions, forward foreign currency
exchange contracts, futures contracts and
written option contracts | | | 24,721,821 | | | | (34,481,649 | ) | | | 14,737,595 | | | | (30,320,543 | ) | |
Net change in unrealized appreciation (depreciation)
on investments, foreign currency translations,
forward foreign currency exchange contracts,
futures contracts and written option contracts | | | 8,379,451 | | | | 50,682,774 | | | | 70,278,331 | | | | (37,219,629 | ) | |
| Net increase (decrease) resulting from operations | | | 35,166,876 | | | | 19,110,831 | | | | 83,479,435 | | | | (68,395,117 | ) | |
| Distributions to Shareholders | |
| From net investment income: | |
| Class A | | | (201,274 | ) | | | (87,616 | ) | | | — | | | | — | | |
| Class B | | | — | | | | — | | | | — | | | | — | | |
| Class C | | | — | | | | — | | | | — | | | | — | | |
| Class E | | | — | | | | — | | | | — | | | | — | | |
| Class T | | | (531,782 | ) | | | (717,940 | ) | | | — | | | | — | | |
| Class Y | | | — | | | | — | | | | — | | | | — | | |
| Class Z | | | (1,864,758 | ) | | | (2,057,319 | ) | | | — | | | | — | | |
| From net realized gains: | |
| Class A | | | — | | | | — | | | | — | | | | (8,907,282 | ) | |
| Class B | | | — | | | | — | | | | — | | | | (1,940,780 | ) | |
| Class C | | | — | | | | — | | | | — | | | | (1,989,757 | ) | |
| Class T | | | — | | | | — | | | | — | | | | (7,421,795 | ) | |
| Class Z | | | — | | | | — | | | | — | | | | (31,170,222 | ) | |
| Total distributions to shareholders | | | (2,597,814 | ) | | | (2,862,875 | ) | | | — | | | | (51,429,836 | ) | |
| Net Capital Stock Transactions | | | 154,523,114 | | | | 64,862,004 | | | | 13,647,902 | | | | (10,237,809 | ) | |
| Increase from regulatory settlements | | | — | | | | 5,432 | | | | — | | | | 5,313 | | |
| Total increase (decrease) in net assets | | | 187,092,176 | | | | 81,115,392 | | | | 97,127,337 | | | | (130,057,449 | ) | |
| Net Assets | |
| Beginning of period | | | 403,399,396 | | | | 322,284,004 | | | | 545,090,637 | | | | 675,148,086 | | |
| End of period | | | 590,491,572 | | | | 403,399,396 | | | | 642,217,974 | | | | 545,090,637 | | |
Undistributed (Overdistributed) net investment
income at end of period | | | 1,431,478 | | | | 1,963,211 | | | | (547,519 | ) | | | (85,558 | ) | |
See Accompanying Notes to Financial Statements.
73
Statements of Changes in Net Assets (continued) – Capital Stock Activity
| | | Columbia Asset Allocation Fund | |
| | | Year Ended
September 30, 2010 | | Year Ended
September 30, 2009 | |
| | | Shares | | Dollars ($) | | Shares | | Dollars ($) | |
| Class A | |
| Subscriptions | | | 209,081 | | | | 2,715,792 | | | | 242,754 | | | | 2,594,996 | | |
| Distributions reinvested | | | 12,269 | | | | 160,092 | | | | 12,955 | | | | 141,198 | | |
| Redemptions | | | (158,514 | ) | | | (2,081,457 | ) | | | (212,773 | ) | | | (2,318,316 | ) | |
| Net increase | | | 62,836 | | | | 794,427 | | | | 42,936 | | | | 417,878 | | |
| Class B | |
| Subscriptions | | | 17,803 | | | | 230,184 | | | | 63,535 | | | | 696,944 | | |
| Distributions reinvested | | | 2,855 | | | | 37,047 | | | | 4,637 | | | | 49,933 | | |
| Redemptions | | | (110,295 | ) | | | (1,432,555 | ) | | | (137,489 | ) | | | (1,481,838 | ) | |
| Net decrease | | | (89,637 | ) | | | (1,165,324 | ) | | | (69,317 | ) | | | (734,961 | ) | |
| Class C | |
| Subscriptions | | | 18,904 | | | | 245,247 | | | | 40,293 | | | | 442,888 | | |
| Distributions reinvested | | | 1,255 | | | | 16,318 | | | | 1,489 | | | | 16,136 | | |
| Redemptions | | | (23,162 | ) | | | (301,944 | ) | | | (44,295 | ) | | | (486,881 | ) | |
| Net decrease | | | (3,003 | ) | | | (40,379 | ) | | | (2,513 | ) | | | (27,857 | ) | |
| Class T | |
| Subscriptions | | | 49,429 | | | | 711,217 | | | | 47,805 | | | | 517,944 | | |
| Distributions reinvested | | | 156,227 | | | | 2,035,883 | | | | 203,820 | | | | 2,211,059 | | |
| Redemptions | | | (1,080,880 | ) | | | (14,103,465 | ) | | | (1,620,242 | ) | | | (17,373,997 | ) | |
| Net decrease | | | (875,224 | ) | | | (11,356,365 | ) | | | (1,368,617 | ) | | | (14,644,994 | ) | |
| Class Z | |
| Subscriptions | | | 279,300 | | | | 3,656,141 | | | | 268,237 | | | | 3,235,752 | | |
| Distributions reinvested | | | 112,573 | | | | 1,472,006 | | | | 167,719 | | | | 1,827,162 | | |
| Redemptions | | | (1,191,485 | ) | | | (15,572,537 | ) | | | (1,324,767 | ) | | | (14,379,020 | ) | |
| Net decrease | | | (799,612 | ) | | | (10,444,390 | ) | | | (888,811 | ) | | | (9,316,106 | ) | |
See Accompanying Notes to Financial Statements.
74
Statements of Changes in Net Assets (continued) – Capital Stock Activity
| | | Columbia Large Cap Growth Fund | |
| | | Year Ended
September 30, 2010 | | Year Ended
September 30, 2009 | |
| | | Shares | | Dollars ($) | | Shares | | Dollars ($) | |
| Class A | |
| Subscriptions | | | 805,686 | | | | 16,024,417 | | | | 1,591,508 | | | | 24,021,794 | | |
| Distributions reinvested | | | 32,869 | | | | 640,942 | | | | 8,857 | | | | 126,318 | | |
| Redemptions | | | (1,414,921 | ) | | | (27,969,499 | ) | | | (1,831,457 | ) | | | (28,061,174 | ) | |
| Net decrease | | | (576,366 | ) | | | (11,304,140 | ) | | | (231,092 | ) | | | (3,913,062 | ) | |
| Class B | |
| Subscriptions | | | 20,276 | | | | 375,246 | | | | 107,673 | | | | 1,522,097 | | |
| Redemptions | | | (696,983 | ) | | | (12,816,473 | ) | | | (1,894,336 | ) | | | (26,316,082 | ) | |
| Net decrease | | | (676,707 | ) | | | (12,441,227 | ) | | | (1,786,663 | ) | | | (24,793,985 | ) | |
| Class C | |
| Subscriptions | | | 59,499 | | | | 1,084,006 | | | | 345,304 | | | | 4,759,197 | | |
| Redemptions | | | (215,573 | ) | | | (3,928,733 | ) | | | (514,603 | ) | | | (7,172,499 | ) | |
| Net decrease | | | (156,074 | ) | | | (2,844,727 | ) | | | (169,299 | ) | | | (2,413,302 | ) | |
| Class E | |
| Subscriptions | | | 932 | | | | 18,418 | | | | 4,972 | | | | 74,331 | | |
| Distributions reinvested | | | 2,687 | | | | 52,351 | | | | 79 | | | | 1,128 | | |
| Redemptions | | | (83,767 | ) | | | (1,658,131 | ) | | | (60,277 | ) | | | (935,864 | ) | |
| Net decrease | | | (80,148 | ) | | | (1,587,362 | ) | | | (55,226 | ) | | | (860,405 | ) | |
| Class F | |
| Subscriptions | | | 6,919 | | | | 120,000 | | | | 23 | | | | 354 | | |
| Redemptions | | | (1,365 | ) | | | (25,254 | ) | | | (4,123 | ) | | | (57,722 | ) | |
| Net increase (decrease) | | | 5,554 | | | | 94,746 | | | | (4,100 | ) | | | (57,368 | ) | |
| Class I (a)(b) | |
| Subscriptions | | | 118 | | | | 2,500 | | | | — | | | | — | | |
| Net increase | | | 118 | | | | 2,500 | | | | — | | | | — | | |
| Class R (a)(b) | |
| Subscriptions | | | 121 | | | | 2,500 | | | | — | | | | — | | |
| Net increase | | | 121 | | | | 2,500 | | | | — | | | | — | | |
| Class T | |
| Subscriptions | | | 82,332 | | | | 1,626,732 | | | | 97,232 | | | | 1,472,114 | | |
| Distributions reinvested | | | 32,478 | | | | 629,102 | | | | — | | | | — | | |
| Redemptions | | | (878,814 | ) | | | (17,268,207 | ) | | | (1,034,974 | ) | | | (15,755,361 | ) | |
| Net decrease | | | (764,004 | ) | | | (15,012,373 | ) | | | (937,742 | ) | | | (14,283,247 | ) | |
| Class W (a)(b) | |
| Subscriptions | | | 121 | | | | 2,500 | | | | — | | | | — | | |
| Net increase | | | 121 | | | | 2,500 | | | | — | | | | — | | |
| Class Y | |
| Subscriptions | | | 241,185 | | | | 4,654,648 | | | | 1,566,787 | | | | 28,038,000 | | |
| Distributions reinvested | | | 5 | | | | 97 | | | | — | | | | — | | |
| Redemptions | | | (56,363 | ) | | | (1,164,873 | ) | | | (697,934 | ) | | | (12,618,649 | ) | |
| Net increase | | | 184,827 | | | | 3,489,872 | | | | 868,853 | | | | 15,419,351 | | |
| Class Z | |
| Subscriptions | | | 3,131,342 | | | | 62,888,945 | | | | 9,868,328 | | | | 157,965,419 | | |
| Distributions reinvested | | | 184,404 | | | | 3,673,328 | | | | 119,365 | | | | 1,738,022 | | |
| Redemptions | | | (11,558,386 | ) | | | (234,250,114 | ) | | | (9,894,536 | ) | | | (157,723,348 | ) | |
| Net increase (decrease) | | | (8,242,640 | ) | | | (167,687,841 | ) | | | 93,157 | | | | 1,980,093 | | |
(a) ��Shares commenced operations on September 27, 2010
(b) Shares reflect activity for the period September 27, 2010 through September 30, 2010.
See Accompanying Notes to Financial Statements.
75
Statements of Changes in Net Assets (continued) – Capital Stock Activity
| | | Columbia Disciplined Value Fund | |
| | | Year Ended
September 30, 2010 | | Year Ended
September 30, 2009 | |
| | | Shares | | Dollars ($) | | Shares | | Dollars ($) | |
| Class A | |
| Subscriptions | | | 186,672 | | | | 1,851,059 | | | | 288,028 | | | | 2,281,055 | | |
| Distributions reinvested | | | 10,659 | | | | 105,510 | | | | 23,100 | | | | 179,703 | | |
| Redemptions | | | (402,173 | ) | | | (3,973,883 | ) | | | (739,426 | ) | | | (5,805,700 | ) | |
| Net decrease | | | (204,842 | ) | | | (2,017,314 | ) | | | (428,298 | ) | | | (3,344,942 | ) | |
| Class B | |
| Subscriptions | | | 13,113 | | | | 125,979 | | | | 17,707 | | | | 131,169 | | |
| Distributions reinvested | | | 969 | | | | 8,961 | | | | 3,913 | | | | 28,225 | | |
| Redemptions | | | (83,047 | ) | | | (772,352 | ) | | | (174,185 | ) | | | (1,255,003 | ) | |
| Net decrease | | | (68,965 | ) | | | (637,412 | ) | | | (152,565 | ) | | | (1,095,609 | ) | |
| Class C | |
| Subscriptions | | | 125,709 | | | | 1,149,866 | | | | 67,614 | | | | 542,251 | | |
| Distributions reinvested | | | 1,025 | | | | 9,459 | | | | 2,863 | | | | 20,584 | | |
| Redemptions | | | (154,143 | ) | | | (1,436,340 | ) | | | (127,694 | ) | | | (912,243 | ) | |
| Net decrease | | | (27,409 | ) | | | (277,015 | ) | | | (57,217 | ) | | | (349,408 | ) | |
| Class T | |
| Subscriptions | | | 64,224 | | | | 634,915 | | | | 65,624 | | | | 514,004 | | |
| Distributions reinvested | | | 83,258 | | | | 824,551 | | | | 157,011 | | | | 1,221,118 | | |
| Redemptions | | | (924,578 | ) | | | (9,113,863 | ) | | | (1,123,058 | ) | | | (8,716,795 | ) | |
| Net decrease | | | (777,096 | ) | | | (7,654,397 | ) | | | (900,423 | ) | | | (6,981,673 | ) | |
| Class Z | |
| Subscriptions | | | 1,141,944 | | | | 11,426,712 | | | | 8,733,478 | | | | 71,166,602 | | |
| Distributions reinvested | | | 77,238 | | | | 783,117 | | | | 206,897 | | | | 1,660,628 | | |
| Redemptions | | | (11,415,362 | ) | | | (115,578,216 | ) | | | (7,144,516 | ) | | | (57,645,954 | ) | |
| Net increase (decrease) | | | (10,196,180 | ) | | | (103,368,387 | ) | | | 1,795,859 | | | | 15,181,276 | | |
See Accompanying Notes to Financial Statements.
76
Statements of Changes in Net Assets (continued) – Capital Stock Activity
| | | Columbia Contrarian Core Fund | |
| | | Year Ended
September 30, 2010 | | Year Ended
September 30, 2009 | |
| | | Shares | | Dollars ($) | | Shares | | Dollars ($) | |
| Class A | |
| Subscriptions | | | 8,497,843 | | | | 105,495,991 | | | | 1,851,140 | | | | 18,894,886 | | |
| Distributions reinvested | | | 15,560 | | | | 189,054 | | | | 8,794 | | | | 77,084 | | |
| Redemptions | | | (2,055,029 | ) | | | (24,867,159 | ) | | | (442,332 | ) | | | (4,101,888 | ) | |
| Net increase | | | 6,458,374 | | | | 80,817,886 | | | | 1,417,602 | | | | 14,870,082 | | |
| Class B | |
| Subscriptions | | | 169,133 | | | | 1,953,902 | | | | 107,507 | | | | 1,009,446 | | |
| Redemptions | | | (141,450 | ) | | | (1,638,196 | ) | | | (122,331 | ) | | | (1,037,793 | ) | |
| Net increase (decrease) | | | 27,683 | | | | 315,706 | | | | (14,824 | ) | | | (28,347 | ) | |
| Class C | |
| Subscriptions | | | 1,128,021 | | | | 13,116,080 | | | | 604,409 | | | | 5,864,349 | | |
| Redemptions | | | (214,012 | ) | | | (2,471,200 | ) | | | (115,428 | ) | | | (1,028,223 | ) | |
| Net increase | | | 914,009 | | | | 10,644,880 | | | | 488,981 | | | | 4,836,126 | | |
| Class I (a)(b) | |
| Subscriptions | | | 197 | | | | 2,500 | | | | — | | | | — | | |
| Net increase | | | 197 | | | | 2,500 | | | | — | | | | — | | |
| Class R (a)(b) | |
| Subscriptions | | | 198 | | | | 2,500 | | | | — | | | | — | | |
| Net increase | | | 198 | | | | 2,500 | | | | — | | | | — | | |
| Class T | |
| Subscriptions | | | 45,158 | | | | 552,326 | | | | 57,531 | | | | 530,596 | | |
| Distributions reinvested | | | 38,797 | | | | 469,356 | | | | 77,542 | | | | 675,392 | | |
| Redemptions | | | (1,100,312 | ) | | | (13,448,179 | ) | | | (1,305,440 | ) | | | (11,973,025 | ) | |
| Net decrease | | | (1,016,357 | ) | | | (12,426,497 | ) | | | (1,170,367 | ) | | | (10,767,037 | ) | |
| Class W (a)(b) | |
| Subscriptions | | | 198 | | | | 2,500 | | | | — | | | | — | | |
| Net increase | | | 198 | | | | 2,500 | | | | — | | | | — | | |
| Class Z | |
| Subscriptions | | | 12,537,693 | | | | 155,092,288 | | | | 11,481,253 | | | | 103,217,377 | | |
| Distributions reinvested | | | 94,601 | | | | 1,154,130 | | | | 178,491 | | | | 1,572,554 | | |
| Redemptions | | | (6,471,030 | ) | | | (81,082,779 | ) | | | (5,182,054 | ) | | | (48,838,751 | ) | |
| Net increase | | | 6,161,264 | | | | 75,163,639 | | | | 6,477,690 | | | | 55,951,180 | | |
(a) Shares commenced operations on September 27, 2010.
(b) Shares reflect activity for the period September 27, 2010 through September 30, 2010.
See Accompanying Notes to Financial Statements.
77
Statements of Changes in Net Assets (continued) – Capital Stock Activity
| | | Columbia Small Cap Core Fund | |
| | | Year Ended
September 30, 2010 | | Year Ended
September 30, 2009 | |
| | | Shares | | Dollars ($) | | Shares | | Dollars ($) | |
| Class A | |
| Subscriptions | | | 4,149,507 | | | | 51,127,715 | | | | 2,080,374 | | | | 19,805,781 | | |
| Distributions reinvested | | | — | | | | — | | | | 980,677 | | | | 8,610,346 | | |
| Redemptions | | | (2,070,656 | ) | | | (25,689,627 | ) | | | (4,177,022 | ) | | | (38,542,843 | ) | |
| Net increase (decrease) | | | 2,078,851 | | | | 25,438,088 | | | | (1,115,971 | ) | | | (10,126,716 | ) | |
| Class B | |
| Subscriptions | | | 39,113 | | | | 429,257 | | | | 96,693 | | | | 842,189 | | |
| Distributions reinvested | | | — | | | | — | | | | 228,050 | | | | 1,813,000 | | |
| Redemptions | | | (400,346 | ) | | | (4,476,695 | ) | | | (442,312 | ) | | | (3,691,488 | ) | |
| Net decrease | | | (361,233 | ) | | | (4,047,438 | ) | | | (117,569 | ) | | | (1,036,299 | ) | |
| Class C | |
| Subscriptions | | | 318,672 | | | | 3,538,275 | | | | 271,949 | | | | 2,444,023 | | |
| Distributions reinvested | | | — | | | | — | | | | 226,347 | | | | 1,801,724 | | |
| Redemptions | | | (440,235 | ) | | | (4,877,105 | ) | | | (635,154 | ) | | | (5,307,813 | ) | |
| Net decrease | | | (121,563 | ) | | | (1,338,830 | ) | | | (136,858 | ) | | | (1,062,066 | ) | |
| Class I (a)(b) | |
| Subscriptions | | | 187 | | | | 2,500 | | | | — | | | | — | | |
| Net increase | | | 187 | | | | 2,500 | | | | — | | | | — | | |
| Class T | |
| Subscriptions | | | 43,232 | | | | 529,032 | | | | 81,099 | | | | 725,579 | | |
| Distributions reinvested | | | — | | | | — | | | | 800,276 | | | | 6,914,381 | | |
| Redemptions | | | (957,438 | ) | | | (11,648,106 | ) | | | (1,373,498 | ) | | | (13,187,203 | ) | |
| Net decrease | | | (914,206 | ) | | | (11,119,074 | ) | | | (492,123 | ) | | | (5,547,243 | ) | |
| Class W (a)(b) | |
| Subscriptions | | | 192 | | | | 2,500 | | | | — | | | | — | | |
| Net increase | | | 192 | | | | 2,500 | | | | — | | | | — | | |
| Class Z | |
| Subscriptions | | | 7,740,576 | | | | 98,116,927 | | | | 9,744,342 | | | | 94,177,339 | | |
| Distributions reinvested | | | — | | | | — | | | | 2,513,202 | | | | 22,568,553 | | |
| Redemptions | | | (7,423,189 | ) | | | (93,406,771 | ) | | | (11,209,503 | ) | | | (109,211,377 | ) | |
| Net increase | | | 317,387 | | | | 4,710,156 | | | | 1,048,041 | | | | 7,534,515 | | |
(a) Shares commenced operations on September 27, 2010.
(b) Shares reflect activity for the period September 27, 2010 through September 30, 2010.
See Accompanying Notes to Financial Statements.
78
Financial Highlights – Columbia Asset Allocation Fund
Selected data for a share outstanding throughout each period is as follows:
| | | Year Ended September 30, | |
| Class A Shares | | 2010 | | 2009 | | 2008 | | 2007 | | 2006 | |
| Net Asset Value, Beginning of Period | | $ | 12.61 | | | $ | 12.57 | | | $ | 16.80 | | | $ | 16.06 | | | $ | 16.47 | | |
| Income from Investment Operations: | |
| Net investment income (a) | | | 0.24 | | | | 0.26 | | | | 0.31 | | | | 0.32 | | | | 0.22 | | |
Net realized and unrealized gain (loss) on investments,
foreign currency, futures contracts, foreign capital gains
tax and written options | | | 0.81 | | | | 0.03 | | | | (2.76 | ) | | | 1.86 | | | | 0.92 | | |
| Total from investment operations | | | 1.05 | | | | 0.29 | | | | (2.45 | ) | | | 2.18 | | | | 1.14 | | |
| Less Distributions to Shareholders: | |
| From net investment income | | | (0.27 | ) | | | (0.25 | ) | | | (0.34 | ) | | | (0.33 | ) | | | (0.31 | ) | |
| From net realized gains | | | — | | | | — | | | | (1.44 | ) | | | (1.11 | ) | | | (1.24 | ) | |
| Total distributions to shareholders | | | (0.27 | ) | | | (0.25 | ) | | | (1.78 | ) | | | (1.44 | ) | | | (1.55 | ) | |
| Increase from regulatory settlements | | | — | (b) | | | — | | | | — | | | | — | | | | — | | |
| Net Asset Value, End of Period | | $ | 13.39 | | | $ | 12.61 | | | $ | 12.57 | | | $ | 16.80 | | | $ | 16.06 | | |
| Total return (c) | | | 8.36 | %(d) | | | 2.63 | %(d) | | | (16.23 | )% | | | 14.24 | % | | | 7.39 | %(d)(e) | |
| Ratios to Average Net Assets/Supplemental Data: | |
| Net expenses before interest expense | | | 1.20 | %(f) | | | 1.25 | %(f) | | | 1.29 | %(g) | | | 1.32 | %(f) | | | 1.31 | %(f) | |
| Interest expense | | | — | | | | — | %(h) | | | — | | | | — | | | | — | | |
| Net expenses | | | 1.20 | %(f) | | | 1.25 | %(f) | | | 1.29 | %(g) | | | 1.32 | %(f) | | | 1.31 | %(f) | |
| Waiver/Reimbursement | | | 0.24 | % | | | 0.22 | % | | | — | | | | — | | | | 0.01 | % | |
| Net investment income | | | 1.84 | %(f) | | | 2.35 | %(f) | | | 2.17 | %(g) | | | 1.98 | %(f) | | | 1.38 | %(f) | |
| Portfolio turnover rate | | | 109 | % | | | 107 | % | | | 94 | % | | | 100 | % | | | 98 | % | |
| Net assets, end of period (000s) | | $ | 9,161 | | | $ | 7,833 | | | $ | 7,266 | | | $ | 8,314 | | | $ | 5,863 | | |
(a) Per share data was calculated using the average shares outstanding during the period.
(b) Rounds to less than $0.01 per share.
(c) Total return at net asset value assuming all distributions reinvested and no initial sales charge or contingent deferred sales charge.
(d) Had the investment advisor and/or any of its affiliates not waived fees or reimbursed a portion of expenses, total return would have been reduced.
(e) Total return includes a voluntary reimbursement by the investment advisor for a realized investment loss due to a trading error. This reimbursement increased total return and net asset value per share by less than 0.01% and less than $0.01, respectively.
(f) The benefits derived from expense reductions had an impact of less than 0.01%.
(g) The benefits derived from expense reductions had an impact of 0.01%.
(h) Rounds to less than 0.01%.
See Accompanying Notes to Financial Statements.
79
Financial Highlights – Columbia Asset Allocation Fund
Selected data for a share outstanding throughout each period is as follows:
| | | Year Ended September 30, | |
| Class B Shares | | 2010 | | 2009 | | 2008 | | 2007 | | 2006 | |
| Net Asset Value, Beginning of Period | | $ | 12.60 | | | $ | 12.57 | | | $ | 16.80 | | | $ | 16.06 | | | $ | 16.47 | | |
| Income from Investment Operations: | |
| Net investment income (a) | | | 0.14 | | | | 0.18 | | | | 0.20 | | | | 0.20 | | | | 0.17 | | |
Net realized and unrealized gain (loss) on investments,
foreign currency, futures contracts, foreign capital gains
tax and written options | | | 0.81 | | | | 0.02 | | | | (2.76 | ) | | | 1.86 | | | | 0.85 | | |
| Total from investment operations | | | 0.95 | | | | 0.20 | | | | (2.56 | ) | | | 2.06 | | | | 1.02 | | |
| Less Distributions to Shareholders: | |
| From net investment income | | | (0.17 | ) | | | (0.17 | ) | | | (0.23 | ) | | | (0.21 | ) | | | (0.19 | ) | |
| From net realized gains | | | — | | | | — | | | | (1.44 | ) | | | (1.11 | ) | | | (1.24 | ) | |
| Total distributions to shareholders | | | (0.17 | ) | | | (0.17 | ) | | | (1.67 | ) | | | (1.32 | ) | | | (1.43 | ) | |
| Increase from regulatory settlements | | | — | (b) | | | — | | | | — | | | | — | | | | — | | |
| Net Asset Value, End of Period | | $ | 13.38 | | | $ | 12.60 | | | $ | 12.57 | | | $ | 16.80 | | | $ | 16.06 | | |
| Total return (c) | | | 7.56 | %(d) | | | 1.79 | %(d) | | | (16.88 | )% | | | 13.40 | % | | | 6.59 | %(d)(e) | |
| Ratios to Average Net Assets/Supplemental Data: | |
| Net expenses before interest expense | | | 1.95 | %(f) | | | 2.00 | %(f) | | | 2.04 | %(g) | | | 2.07 | %(f) | | | 2.06 | %(f) | |
| Interest expense | | | — | | | | — | %(h) | | | — | | | | — | | | | — | | |
| Net expenses | | | 1.95 | %(f) | | | 2.00 | %(f) | | | 2.04 | %(g) | | | 2.07 | %(f) | | | 2.06 | %(f) | |
| Waiver/Reimbursement | | | 0.24 | % | | | 0.22 | % | | | — | | | | — | | | | 0.01 | % | |
| Net investment income | | | 1.08 | %(f) | | | 1.61 | %(f) | | | 1.40 | %(g) | | | 1.21 | %(f) | | | 1.08 | %(f) | |
| Portfolio turnover rate | | | 109 | % | | | 107 | % | | | 94 | % | | | 100 | % | | | 98 | % | |
| Net assets, end of period (000s) | | $ | 2,874 | | | $ | 3,835 | | | $ | 4,699 | | | $ | 6,219 | | | $ | 6,788 | | |
(a) Per share data was calculated using the average shares outstanding during the period.
(b) Rounds to less than $0.01 per share.
(c) Total return at net asset value assuming all distributions reinvested and no contingent deferred sales charge.
(d) Had the investment advisor and/or any of its affiliates not waived fees or reimbursed a portion of expenses, total return would have been reduced.
(e) Total return includes a voluntary reimbursement by the investment advisor for a realized investment loss due to a trading error. This reimbursement increased total return and net asset value per share by less than 0.01% and less than $0.01, respectively.
(f) The benefits derived from expense reductions had an impact of less than 0.01%.
(g) The benefits derived from expense reductions had an impact of 0.01%.
(h) Rounds to less than 0.01%.
See Accompanying Notes to Financial Statements.
80
Financial Highlights – Columbia Asset Allocation Fund
Selected data for a share outstanding throughout each period is as follows:
| | | Year Ended September 30, | |
| Class C Shares | | 2010 | | 2009 | | 2008 | | 2007 | | 2006 | |
| Net Asset Value, Beginning of Period | | $ | 12.60 | | | $ | 12.57 | | | $ | 16.81 | | | $ | 16.06 | | | $ | 16.47 | | |
| Income from Investment Operations: | |
| Net investment income (a) | | | 0.14 | | | | 0.17 | | | | 0.21 | | | | 0.20 | | | | 0.16 | | |
Net realized and unrealized gain (loss) on investments,
foreign currency, futures contracts, foreign capital gains
tax and written options | | | 0.81 | | | | 0.03 | | | | (2.78 | ) | | | 1.87 | | | | 0.86 | | |
| Total from investment operations | | | 0.95 | | | | 0.20 | | | | (2.57 | ) | | | 2.07 | | | | 1.02 | | |
| Less Distributions to Shareholders: | |
| From net investment income | | | (0.17 | ) | | | (0.17 | ) | | | (0.23 | ) | | | (0.21 | ) | | | (0.19 | ) | |
| From net realized gains | | | — | | | | — | | | | (1.44 | ) | | | (1.11 | ) | | | (1.24 | ) | |
| Total distributions to shareholders | | | (0.17 | ) | | | (0.17 | ) | | | (1.67 | ) | | | (1.32 | ) | | | (1.43 | ) | |
| Increase from regulatory settlements | | | — | (b) | | | — | | | | — | | | | — | | | | — | | |
| Net Asset Value, End of Period | | $ | 13.38 | | | $ | 12.60 | | | $ | 12.57 | | | $ | 16.81 | | | $ | 16.06 | | |
| Total return (c) | | | 7.56 | %(d) | | | 1.79 | %(d) | | | (16.93 | )% | | | 13.46 | % | | | 6.59 | %(d)(e) | |
| Ratios to Average Net Assets/Supplemental Data: | |
| Net expenses before interest expense | | | 1.95 | %(f) | | | 2.00 | %(f) | | | 2.04 | %(g) | | | 2.07 | %(f) | | | 2.06 | %(f) | |
| Interest expense | | | — | | | | — | %(h) | | | — | | | | — | | | | — | | |
| Net expenses | | | 1.95 | %(f) | | | 2.00 | %(f) | | | 2.04 | %(g) | | | 2.07 | %(f) | | | 2.06 | %(f) | |
| Waiver/Reimbursement | | | 0.24 | % | | | 0.22 | % | | | — | | | | — | | | | 0.01 | % | |
| Net investment income | | | 1.08 | %(f) | | | 1.60 | %(f) | | | 1.41 | %(g) | | | 1.23 | %(f) | | | 0.98 | %(f) | |
| Portfolio turnover rate | | | 109 | % | | | 107 | % | | | 94 | % | | | 100 | % | | | 98 | % | |
| Net assets, end of period (000s) | | $ | 1,519 | | | $ | 1,468 | | | $ | 1,496 | | | $ | 1,806 | | | $ | 1,281 | | |
(a) Per share data was calculated using the average shares outstanding during the period.
(b) Rounds to less than $0.01 per share.
(c) Total return at net asset value assuming all distributions reinvested and no contingent deferred sales charge.
(d) Had the investment advisor and/or any of its affiliates not waived fees or reimbursed a portion of expenses, total return would have been reduced.
(e) Total return includes a voluntary reimbursement by the investment advisor for a realized investment loss due to a trading error. This reimbursement increased total return and net asset value per share by less than 0.01% and less than $0.01, respectively.
(f) The benefits derived from expense reductions had an impact of less than 0.01%.
(g) The benefits derived from expense reductions had an impact of 0.01%.
(h) Rounds to less than 0.01%.
See Accompanying Notes to Financial Statements.
81
Financial Highlights – Columbia Asset Allocation Fund
Selected data for a share outstanding throughout each period is as follows:
| | | Year Ended September 30, | |
| Class T Shares | | 2010 | | 2009 | | 2008 | | 2007 (a) | | 2006 | |
| Net Asset Value, Beginning of Period | | $ | 12.61 | | | $ | 12.58 | | | $ | 16.82 | | | $ | 16.08 | | | $ | 16.48 | | |
| Income from Investment Operations: | |
| Net investment income (b) | | | 0.23 | | | | 0.25 | | | | 0.31 | | | | 0.31 | | | | 0.28 | | |
Net realized and unrealized gain (loss) on investments,
foreign currency, futures contracts, foreign capital gains
tax and written options | | | 0.82 | | | | 0.02 | | | | (2.78 | ) | | | 1.86 | | | | 0.87 | | |
| Total from investment operations | | | 1.05 | | | | 0.27 | | | | (2.47 | ) | | | 2.17 | | | | 1.15 | | |
| Less Distributions to Shareholders: | |
| From net investment income | | | (0.26 | ) | | | (0.24 | ) | | | (0.33 | ) | | | (0.32 | ) | | | (0.31 | ) | |
| From net realized gains | | | — | | | | — | | | | (1.44 | ) | | | (1.11 | ) | | | (1.24 | ) | |
| Total distributions to shareholders | | | (0.26 | ) | | | (0.24 | ) | | | (1.77 | ) | | | (1.43 | ) | | | (1.55 | ) | |
| Increase from regulatory settlements | | | — | (c) | | | — | | | | — | | | | — | | | | — | | |
| Net Asset Value, End of Period | | $ | 13.40 | | | $ | 12.61 | | | $ | 12.58 | | | $ | 16.82 | | | $ | 16.08 | | |
| Total return (d) | | | 8.39 | %(e) | | | 2.50 | %(e) | | | (16.32 | )% | | | 14.17 | % | | | 7.39 | %(e)(f) | |
| Ratios to Average Net Assets/Supplemental Data: | |
| Net expenses before interest expense | | | 1.25 | %(g) | | | 1.30 | %(g) | | | 1.34 | %(h) | | | 1.37 | %(g) | | | 1.36 | %(g) | |
| Interest expense | | | — | | | | — | %(i) | | | — | | | | — | | | | — | | |
| Net expenses | | | 1.25 | %(g) | | | 1.30 | %(g) | | | 1.34 | %(h) | | | 1.37 | %(g) | | | 1.36 | %(g) | |
| Waiver/Reimbursement | | | 0.24 | % | | | 0.22 | % | | | — | | | | — | | | | 0.01 | % | |
| Net investment income | | | 1.79 | %(g) | | | 2.31 | %(g) | | | 2.10 | %(h) | | | 1.92 | %(g) | | | 1.78 | %(g) | |
| Portfolio turnover rate | | | 109 | % | | | 107 | % | | | 94 | % | | | 100 | % | | | 98 | % | |
| Net assets, end of period (000s) | | $ | 109,253 | | | $ | 113,895 | | | $ | 130,863 | | | $ | 180,757 | | | $ | 175,348 | | |
(a) On August 8, 2007, Class G shares were converted to Class T shares.
(b) Per share data was calculated using the average shares outstanding during the period.
(c) Rounds to less than $0.01 per share.
(d) Total return at net asset value assuming all distributions reinvested and no initial sales charge or contingent deferred sales charge.
(e) Had the investment advisor and/or any of its affiliates not waived fees or reimbursed a portion of expenses, total return would have been reduced.
(f) Total return includes a voluntary reimbursement by the investment advisor for a realized investment loss due to a trading error. This reimbursement increased total return and net asset value per share by less than 0.01% and less than $0.01, respectively.
(g) The benefits derived from expense reductions had an impact of less than 0.01%.
(h) The benefits derived from expense reductions had an impact of 0.01%.
(i) Rounds to less than 0.01%.
See Accompanying Notes to Financial Statements.
82
Financial Highlights – Columbia Asset Allocation Fund
Selected data for a share outstanding throughout each period is as follows:
| | | Year Ended September 30, | |
| Class Z Shares | | 2010 | | 2009 | | 2008 | | 2007 | | 2006 | |
| Net Asset Value, Beginning of Period | | $ | 12.66 | | | $ | 12.58 | | | $ | 16.82 | | | $ | 16.07 | | | $ | 16.48 | | |
| Income from Investment Operations: | |
| Net investment income (a) | | | 0.27 | | | | 0.29 | | | | 0.35 | | | | 0.36 | | | | 0.33 | | |
Net realized and unrealized gain (loss) on investments,
foreign currency, futures contracts, foreign capital gains
tax and written options | | | 0.82 | | | | 0.07 | | | | (2.77 | ) | | | 1.87 | | | | 0.85 | | |
| Total from investment operations | | | 1.09 | | | | 0.36 | | | | (2.42 | ) | | | 2.23 | | | | 1.18 | | |
| Less Distributions to Shareholders: | |
| From net investment income | | | (0.30 | ) | | | (0.28 | ) | | | (0.38 | ) | | | (0.37 | ) | | | (0.35 | ) | |
| From net realized gains | | | — | | | | — | | | | (1.44 | ) | | | (1.11 | ) | | | (1.24 | ) | |
| Total distributions to shareholders | | | (0.30 | ) | | | (0.28 | ) | | | (1.82 | ) | | | (1.48 | ) | | | (1.59 | ) | |
| Increase from regulatory settlements | | | — | (b) | | | — | | | | — | | | | — | | | | — | | |
| Net Asset Value, End of Period | | $ | 13.45 | | | $ | 12.66 | | | $ | 12.58 | | | $ | 16.82 | | | $ | 16.07 | | |
| Total return (c) | | | 8.67 | %(d) | | | 3.21 | %(d) | | | (16.06 | )% | | | 14.58 | % | | | 7.65 | %(d)(e) | |
| Ratios to Average Net Assets/Supplemental Data: | |
| Net expenses before interest expense | | | 0.95 | %(f) | | | 1.00 | %(f) | | | 1.04 | %(g) | | | 1.07 | %(f) | | | 1.06 | %(f) | |
| Interest expense | | | — | | | | — | %(h) | | | — | | | | — | | | | — | | |
| Net expenses | | | 0.95 | %(f) | | | 1.00 | %(f) | | | 1.04 | %(g) | | | 1.07 | %(f) | | | 1.06 | %(f) | |
| Waiver/Reimbursement | | | 0.24 | % | | | 0.22 | % | | | — | | | | — | | | | 0.01 | % | |
| Net investment income | | | 2.07 | %(f) | | | 2.60 | %(f) | | | 2.40 | %(g) | | | 2.21 | %(f) | | | 2.09 | %(f) | |
| Portfolio turnover rate | | | 109 | % | | | 107 | % | | | 94 | % | | | 100 | % | | | 98 | % | |
| Net assets, end of period (000s) | | $ | 92,087 | | | $ | 96,807 | | | $ | 107,424 | | | $ | 144,513 | | | $ | 151,703 | | |
(a) Per share data was calculated using the average shares outstanding during the period.
(b) Rounds to less than $0.01 per share.
(c) Total return at net asset value assuming all distributions reinvested.
(d) Had the investment advisor and/or any of its affiliates not waived fees or reimbursed a portion of expenses, total return would have been reduced.
(e) Total return includes a voluntary reimbursement by the investment advisor for a realized investment loss due to a trading error. This reimbursement increased total return and net asset value per share by less than 0.01% and less than $0.01, respectively.
(f) The benefits derived from expense reductions had an impact of less than 0.01%.
(g) The benefits derived from expense reductions had an impact of 0.01%.
(h) Rounds to less than 0.01%.
See Accompanying Notes to Financial Statements.
83
Financial Highlights – Columbia Large Cap Growth Fund
Selected data for a share outstanding throughout each period is as follows:
| | | Year Ended September 30, | |
| Class A Shares | | 2010 | | 2009 | | 2008 | | 2007 | | 2006 | |
| Net Asset Value, Beginning of Period | | $ | 18.77 | | | $ | 19.57 | | | $ | 26.76 | | | $ | 22.27 | | | $ | 21.11 | | |
| Income from Investment Operations: | |
| Net investment income (a) | | | 0.04 | | | | 0.07 | | | | 0.01 | | | | 0.02 | | | | 0.01 | | |
Net realized and unrealized gain (loss)
on investments and foreign currency | | | 1.92 | | | | (0.86 | ) | | | (5.40 | ) | | | 4.87 | | | | 1.19 | | |
| Total from investment operations | | | 1.96 | | | | (0.79 | ) | | | (5.39 | ) | | | 4.89 | | | | 1.20 | | |
| Less Distributions to Shareholders: | |
| From net investment income | | | (0.09 | ) | | | (0.02 | ) | | | — | | | | (0.03 | ) | | | (0.04 | ) | |
| From net realized gains | | | — | | | | — | | | | (1.81 | ) | | | (0.37 | ) | | | — | | |
| Total distributions to shareholders | | | (0.09 | ) | | | (0.02 | ) | | | (1.81 | ) | | | (0.40 | ) | | | (0.04 | ) | |
| Increase from regulatory settlements | | | — | (b) | | | 0.01 | | | | 0.01 | | | | — | | | | — | | |
| Net Asset Value, End of Period | | $ | 20.64 | | | $ | 18.77 | | | $ | 19.57 | | | $ | 26.76 | | | $ | 22.27 | | |
| Total return (c) | | | 10.48 | % | | | (3.97 | )% | | | (21.73 | )% | | | 22.19 | % | | | 5.69 | %(d) | |
| Ratios to Average Net Assets/Supplemental Data: | |
| Net expenses before interest expense | | | 1.10 | %(e) | | | 1.13 | %(e) | | | 1.02 | %(f) | | | 1.00 | %(e) | | | 1.01 | %(e) | |
| Interest expense | | | — | %(g) | | | — | %(g) | | | — | | | | — | %(g) | | | — | %(g) | |
| Net expenses | | | 1.10 | %(e) | | | 1.13 | %(e) | | | 1.02 | %(f) | | | 1.00 | %(e) | | | 1.01 | %(e) | |
| Waiver/Reimbursement | | | — | | | | — | | | | — | | | | — | | | | — | %(g) | |
| Net investment income | | | 0.19 | %(e) | | | 0.43 | %(e) | | | 0.01 | %(f) | | | 0.07 | %(e) | | | 0.07 | %(e) | |
| Portfolio turnover rate | | | 122 | % | | | 146 | % | | | 164 | % | | | 151 | % | | | 171 | % | |
| Net assets, end of period (000s) | | $ | 148,455 | | | $ | 145,825 | | | $ | 156,585 | | | $ | 167,408 | | | $ | 125,124 | | |
(a) Per share data was calculated using the average shares outstanding during the period.
(b) Rounds to less than $0.01 per share.
(c) Total return at net asset value assuming all distributions reinvested and no initial sales charge or contingent deferred sales charge.
(d) Had the investment advisor and/or any of its affiliates not waived fees or reimbursed a portion of expenses, total return would have been reduced.
(e) The benefits derived from expense reductions had an impact of less than 0.01%.
(f) The benefits derived from expense reductions had an impact of 0.01%.
(g) Rounds to less than 0.01%.
See Accompanying Notes to Financial Statements.
84
Financial Highlights – Columbia Large Cap Growth Fund
Selected data for a share outstanding throughout each period is as follows:
| | | Year Ended September 30, | |
| Class B Shares | | 2010 | | 2009 | | 2008 | | 2007 | | 2006 | |
| Net Asset Value, Beginning of Period | | $ | 17.30 | | | $ | 18.15 | | | $ | 25.12 | | | $ | 21.05 | | | $ | 20.07 | | |
| Income from Investment Operations: | |
| Net investment loss (a) | | | (0.10 | ) | | | (0.04 | ) | | | (0.17 | ) | | | (0.16 | ) | | | (0.13 | ) | |
Net realized and unrealized gain (loss)
on investments and foreign currency | | | 1.77 | | | | (0.82 | ) | | | (5.00 | ) | | | 4.60 | | | | 1.11 | | |
| Total from investment operations | | | 1.67 | | | | (0.86 | ) | | | (5.17 | ) | | | 4.44 | | | | 0.98 | | |
| Less Distributions to Shareholders: | |
| From net realized gains | | | — | | | | — | | | | (1.81 | ) | | | (0.37 | ) | | | — | | |
| Increase from regulatory settlements | | | — | (b) | | | 0.01 | | | | 0.01 | | | | — | | | | — | | |
| Net Asset Value, End of Period | | $ | 18.97 | | | $ | 17.30 | | | $ | 18.15 | | | $ | 25.12 | | | $ | 21.05 | | |
| Total return (c) | | | 9.65 | % | | | (4.68 | )% | | | (22.31 | )% | | | 21.31 | % | | | 4.88 | %(d) | |
| Ratios to Average Net Assets/Supplemental Data: | |
| Net expenses before interest expense | | | 1.85 | %(e) | | | 1.88 | %(e) | | | 1.77 | %(f) | | | 1.75 | %(e) | | | 1.76 | %(e) | |
| Interest expense | | | — | %(g) | | | — | %(g) | | | — | | | | — | %(g) | | | — | %(g) | |
| Net expenses | | | 1.85 | %(e) | | | 1.88 | %(e) | | | 1.77 | %(f) | | | 1.75 | %(e) | | | 1.76 | %(e) | |
| Waiver/Reimbursement | | | — | | | | — | | | | — | | | | — | | | | — | %(g) | |
| Net investment loss | | | (0.56 | )%(e) | | | (0.30 | )%(e) | | | (0.77 | )%(f) | | | (0.69 | )%(e) | | | (0.72 | )%(e) | |
| Portfolio turnover rate | | | 122 | % | | | 146 | % | | | 164 | % | | | 151 | % | | | 171 | % | |
| Net assets, end of period (000s) | | $ | 14,527 | | | $ | 24,951 | | | $ | 58,609 | | | $ | 168,284 | | | $ | 227,160 | | |
(a) Per share data was calculated using the average shares outstanding during the period.
(b) Rounds to less than $0.01 per share.
(c) Total return at net asset value assuming all distributions reinvested and no contingent deferred sales charge.
(d) Had the investment advisor and/or any of its affiliates not waived fees or reimbursed a portion of expenses, total return would have been reduced.
(e) The benefits derived from expense reductions had an impact of less than 0.01%.
(f) The benefits derived from expense reductions had an impact of 0.01%.
(g) Rounds to less than 0.01%.
See Accompanying Notes to Financial Statements.
85
Financial Highlights – Columbia Large Cap Growth Fund
Selected data for a share outstanding throughout each period is as follows:
| | | Year Ended September 30, | |
| Class C Shares | | 2010 | | 2009 | | 2008 | | 2007 | | 2006 | |
| Net Asset Value, Beginning of Period | | $ | 17.31 | | | $ | 18.16 | | | $ | 25.14 | | | $ | 21.06 | | | $ | 20.10 | | |
| Income from Investment Operations: | |
| Net investment loss (a) | | | (0.10 | ) | | | (0.05 | ) | | | (0.16 | ) | | | (0.16 | ) | | | (0.13 | ) | |
Net realized and unrealized gain (loss)
on investments and foreign currency | | | 1.77 | | | | (0.81 | ) | | | (5.02 | ) | | | 4.61 | | | | 1.09 | | |
| Total from investment operations | | | 1.67 | | | | (0.86 | ) | | | (5.18 | ) | | | 4.45 | | | | 0.96 | | |
| Less Distributions to Shareholders: | |
| From net realized gains | | | — | | | | — | | | | (1.81 | ) | | | (0.37 | ) | | | — | | |
| Increase from regulatory settlements | | | — | (b) | | | 0.01 | | | | 0.01 | | | | — | | | | — | | |
| Net Asset Value, End of Period | | $ | 18.98 | | | $ | 17.31 | | | $ | 18.16 | | | $ | 25.14 | | | $ | 21.06 | | |
| Total return (c) | | | 9.65 | % | | | (4.68 | )% | | | (22.33 | )% | | | 21.34 | % | | | 4.78 | %(d) | |
| Ratios to Average Net Assets/Supplemental Data: | |
| Net expenses before interest expense | | | 1.85 | %(e) | | | 1.88 | %(e) | | | 1.77 | %(f) | | | 1.75 | %(e) | | | 1.76 | %(e) | |
| Interest expense | | | — | %(g) | | | — | %(g) | | | — | | | | — | %(g) | | | — | %(g) | |
| Net expenses | | | 1.85 | %(e) | | | 1.88 | %(e) | | | 1.77 | %(f) | | | 1.75 | %(e) | | | 1.76 | %(e) | |
| Waiver/Reimbursement | | | — | | | | — | | | | — | | | | — | | | | — | %(g) | |
| Net investment loss | | | (0.55 | )%(e) | | | (0.33 | )%(e) | | | (0.75 | )%(f) | | | (0.68 | )%(e) | | | (0.69 | )%(e) | |
| Portfolio turnover rate | | | 122 | % | | | 146 | % | | | 164 | % | | | 151 | % | | | 171 | % | |
| Net assets, end of period (000s) | | $ | 15,990 | | | $ | 17,283 | | | $ | 21,208 | | | $ | 31,834 | | | $ | 31,046 | | |
(a) Per share data was calculated using the average shares outstanding during the period.
(b) Rounds to less than $0.01 per share.
(c) Total return at net asset value assuming all distributions reinvested and no contingent deferred sales charge.
(d) Had the investment advisor and/or any of its affiliates not waived fees or reimbursed a portion of expenses, total return would have been reduced.
(e) The benefits derived from expense reductions had an impact of less than 0.01%.
(f) The benefits derived from expense reductions had an impact of 0.01%.
(g) Rounds to less than 0.01%.
See Accompanying Notes to Financial Statements.
86
Financial Highlights – Columbia Large Cap Growth Fund
Selected data for a share outstanding throughout each period is as follows:
| | | Year Ended September 30, | | Period Ended
September 30, | |
| Class E Shares | | 2010 | | 2009 | | 2008 | | 2007 | | 2006 (a) | |
| Net Asset Value, Beginning of Period | | $ | 18.73 | | | $ | 19.53 | | | $ | 26.74 | | | $ | 22.27 | | | $ | 22.13 | | |
| Income from Investment Operations: | |
| Net investment income (loss) (b) | | | 0.02 | | | | 0.05 | | | | (0.02 | ) | | | (0.01 | ) | | | — | (c) | |
Net realized and unrealized gain (loss)
on investments and foreign currency | | | 1.93 | | | | (0.86 | ) | | | (5.39 | ) | | | 4.87 | | | | 0.14 | | |
| Total from investment operations | | | 1.95 | | | | (0.81 | ) | | | (5.41 | ) | | | 4.86 | | | | 0.14 | | |
| Less Distributions to Shareholders: | |
| From net investment income | | | (0.08 | ) | | | — | (c) | | | — | | | | (0.02 | ) | | | — | | |
| From net realized gains | | | — | | | | — | | | | (1.81 | ) | | | (0.37 | ) | | | — | | |
| Total distributions to shareholders | | | (0.08 | ) | | | — | (c) | | | (1.81 | ) | | | (0.39 | ) | | | — | | |
| Increase from regulatory settlements | | | — | (c) | | | 0.01 | | | | 0.01 | | | | — | | | | — | | |
| Net Asset Value, End of Year | | $ | 20.60 | | | $ | 18.73 | | | $ | 19.53 | | | $ | 26.74 | | | $ | 22.27 | | |
| Total Return (d) | | | 10.41 | % | | | (4.09 | )% | | | (21.82 | )% | | | 22.07 | % | | | 0.63 | %(e)(f) | |
| Ratios to Average Net Assets/Supplemental Data: | |
| Net expenses before interest expense | | | 1.20 | %(g) | | | 1.23 | %(g) | | | 1.12 | %(h) | | | 1.10 | %(g) | | | 1.12 | %(g)(i) | |
| Interest expense | | | — | %(j) | | | — | %(j) | | | — | | | | — | %(j) | | | — | %(i)(j) | |
| Net expenses | | | 1.20 | %(g) | | | 1.23 | %(g) | | | 1.12 | %(h) | | | 1.10 | %(g) | | | 1.12 | %(g)(i) | |
| Waiver/Reimbursement | | | — | | | | — | | | | — | | | | — | | | | — | %(i)(j) | |
| Net investment income (loss) | | | 0.10 | %(g) | | | 0.33 | %(g) | | | (0.09 | )%(h) | | | (0.03 | )%(g) | | | (0.23 | )%(g)(i) | |
| Portfolio turnover rate | | | 122 | % | | | 146 | % | | | 164 | % | | | 151 | % | | | 171 | %(f) | |
| Net assets, end of period (000s) | | $ | 12,800 | | | $ | 13,144 | | | $ | 14,782 | | | $ | 18,185 | | | $ | 13,071 | | |
(a) Class E shares commenced operations on September 22, 2006. Per share data and total return reflect activity from that date.
(b) Per share data was calculated using the average shares outstanding during the period.
(c) Rounds to less than $0.01 per share.
(d) Total return at net asset value assuming all distributions reinvested and no initial sales charge or contingent deferred sales charge.
(e) Had the investment advisor and/or any of its affiliates not waived fees or reimbursed a portion of expenses, total return would have been reduced.
(f) Not annualized.
(g) The benefits derived from expense reductions had an impact of less than 0.01%.
(h) The benefits derived from expense reductions had an impact of 0.01%.
(i) Annualized.
(j) Rounds to less than 0.01%.
See Accompanying Notes to Financial Statements.
87
Financial Highlights – Columbia Large Cap Growth Fund
Selected data for a share outstanding throughout each period is as follows:
| | | Year Ended September 30, | | Period Ended
September 30, | |
| Class F Shares | | 2010 | | 2009 | | 2008 | | 2007 | | 2006 (a) | |
| Net Asset Value, Beginning of Period | | $ | 17.29 | | | $ | 18.14 | | | $ | 25.11 | | | $ | 21.05 | | | $ | 20.93 | | |
| Income from Investment Operations: | |
| Net investment loss (b) | | | (0.10 | ) | | | (0.05 | ) | | | (0.18 | ) | | | (0.16 | ) | | | — | (c) | |
Net realized and unrealized gain (loss)
on investments and foreign currency | | | 1.77 | | | | (0.81 | ) | | | (4.99 | ) | | | 4.59 | | | | 0.12 | | |
| Total from investment operations | | | 1.67 | | | | (0.86 | ) | | | (5.17 | ) | | | 4.43 | | | | 0.12 | | |
| Less Distributions to Shareholders: | |
| From net realized gains | | | — | | | | — | | | | (1.81 | ) | | | (0.37 | ) | | | — | | |
| Increase from regulatory settlements | | | — | (c) | | | 0.01 | | | | 0.01 | | | | — | | | | — | | |
| Net Asset Value, End of Year | | $ | 18.96 | | | $ | 17.29 | | | $ | 18.14 | | | $ | 25.11 | | | $ | 21.05 | | |
| Total Return (d) | | | 9.66 | % | | | (4.69 | )% | | | (22.31 | )% | | | 21.26 | % | | | 0.57 | %(e)(f) | |
| Ratios to Average Net Assets/Supplemental Data: | |
| Net expenses before interest expense | | | 1.85 | %(g) | | | 1.88 | %(g) | | | 1.77 | %(h) | | | 1.75 | %(g) | | | 1.77 | %(g)(i) | |
| Interest expense | | | — | %(j) | | | — | %(j) | | | — | | | | — | %(j) | | | — | %(i)(j) | |
| Net expenses | | | 1.85 | %(g) | | | 1.88 | %(g) | | | 1.77 | %(h) | | | 1.75 | %(g) | | | 1.77 | %(g)(i) | |
| Waiver/Reimbursement | | | — | | | | — | | | | — | | | | — | | | | — | %(i)(j) | |
| Net investment loss | | | (0.55 | )%(g) | | | (0.32 | )%(g) | | | (0.80 | )%(h) | | | (0.70 | )%(g) | | | (0.88 | )%(g)(i) | |
| Portfolio turnover rate | | | 122 | % | | | 146 | % | | | 164 | % | | | 151 | % | | | 171 | %(f) | |
| Net assets, end of period (000s) | | $ | 425 | | | $ | 292 | | | $ | 380 | | | $ | 2,915 | | | $ | 5,319 | | |
(a) Class F shares commenced operations on September 22, 2006. Per share data and total return reflect activity from that date.
(b) Per share data was calculated using the average shares outstanding during the period.
(c) Rounds to less than $0.01 per share.
(d) Total return at net asset value assuming all distributions reinvested and no contingent deferred sales charge.
(e) Had the investment advisor and/or any of its affiliates not waived fees or reimbursed a portion of expenses, total return would have been reduced.
(f) Not annualized.
(g) The benefits derived from expense reductions had an impact of less than 0.01%.
(h) The benefits derived from expense reductions had an impact of 0.01%.
(i) Annualized.
(j) Rounds to less than 0.01%.
See Accompanying Notes to Financial Statements.
88
Financial Highlights – Columbia Large Cap Growth Fund
Selected data for a share outstanding throughout the period is as follows:
| Class I Shares | | Period Ended
September 30,
2010 (a) | |
| Net Asset Value, Beginning of Period | | $ | 21.18 | | |
| Income from Investment Operations: | |
| Net investment income (b)(c) | | | — | | |
| Net realized and unrealized loss on investments and foreign currency | | | (0.04 | ) | |
| Total from investment operations | | | (0.04 | ) | |
| Net Asset Value, End of Period | | $ | 21.14 | | |
| Total return (d)(e) | | | (0.19 | )% | |
| Ratios to Average Net Assets/Supplemental Data: | |
| Net expenses (f)(g) | | | 0.60 | % | |
| Net investment income (f)(g) | | | 1.89 | % | |
| Portfolio turnover rate (e) | | | 122 | % | |
| Net assets, end of period (000s) | | $ | 2 | | |
(a) Class I shares commenced operations on September 27, 2010. Per share data and total return reflect activity from that date.
(b) Per share data was calculated using the average shares outstanding during the period.
(c) Rounds to less than $0.01 per share.
(d) Total return at net asset value.
(e) Not annualized
(f) The benefits derived from expense reductions had an impact of less than 0.01%.
(g) Annualized.
See Accompanying Notes to Financial Statements.
89
Financial Highlights – Columbia Large Cap Growth Fund
Selected data for a share outstanding throughout the period is as follows:
| Class R Shares | | Period Ended
September 30,
2010 (a) | |
| Net Asset Value, Beginning of Period | | $ | 20.68 | | |
| Income from Investment Operations: | |
| Net investment income (b)(c) | | | — | | |
| Net realized and unrealized loss on investments and foreign currency | | | (0.04 | ) | |
| Total from investment operations | | | (0.04 | ) | |
| Net Asset Value, End of Period | | $ | 20.64 | | |
| Total return (d)(e) | | | (0.19 | )% | |
| Ratios to Average Net Assets/Supplemental Data: | |
| Net expenses (f)(g) | | | 1.21 | % | |
| Net investment income (f)(g) | | | 1.28 | % | |
| Portfolio turnover rate (e) | | | 122 | % | |
| Net assets, end of period (000s) | | $ | 2 | | |
(a) Class R shares commenced operations on September 27, 2010. Per share data and total return reflect activity from that date.
(b) Per share data was calculated using the average shares outstanding during the period.
(c) Rounds to less than $0.01 per share.
(d) Total return at net asset value.
(e) Not annualized
(f) The benefits derived from expense reductions had an impact of less than 0.01%.
(g) Annualized.
See Accompanying Notes to Financial Statements.
90
Financial Highlights – Columbia Large Cap Growth Fund
Selected data for a share outstanding throughout each period is as follows:
| | | Year Ended September 30, | |
| Class T Shares | | 2010 | | 2009 | | 2008 | | 2007 (a) | | 2006 | |
| Net Asset Value, Beginning of Period | | $ | 18.64 | | | $ | 19.42 | | | $ | 26.58 | | | $ | 22.13 | | | $ | 20.98 | | |
| Income from Investment Operations: | |
| Net investment income (loss) (b) | | | 0.03 | | | | 0.06 | | | | (0.01 | ) | | | 0.01 | | | | 0.01 | | |
Net realized and unrealized gain (loss)
on investments and foreign currency | | | 1.90 | | | | (0.85 | ) | | | (5.35 | ) | | | 4.84 | | | | 1.17 | | |
| Total from investment operations | | | 1.93 | | | | (0.79 | ) | | | (5.36 | ) | | | 4.85 | | | | 1.18 | | |
| Less Distributions to Shareholders: | |
| From net investment income | | | (0.08 | ) | | | — | | | | — | | | | (0.03 | ) | | | (0.03 | ) | |
| From net realized gains | | | — | | | | — | | | | (1.81 | ) | | | (0.37 | ) | | | — | | |
| Total distributions to shareholders | | | (0.08 | ) | | | — | | | | (1.81 | ) | | | (0.40 | ) | | | (0.03 | ) | |
| Increase from regulatory settlements | | | — | (c) | | | 0.01 | | | | 0.01 | | | | — | | | | — | | |
| Net Asset Value, End of Period | | $ | 20.49 | | | $ | 18.64 | | | $ | 19.42 | | | $ | 26.58 | | | $ | 22.13 | | |
| Total return (d) | | | 10.40 | % | | | (4.02 | )% | | | (21.76 | )% | | | 22.14 | % | | | 5.63 | %(e) | |
| Ratios to Average Net Assets/Supplemental Data: | |
| Net expenses before interest expense | | | 1.15 | %(f) | | | 1.18 | %(f) | | | 1.07 | %(g) | | | 1.05 | %(f) | | | 1.06 | %(f) | |
| Interest expense | | | — | %(h) | | | — | %(h) | | | — | | | | — | %(h) | | | — | %(h) | |
| Net expenses | | | 1.15 | %(f) | | | 1.18 | %(f) | | | 1.07 | %(g) | | | 1.05 | %(f) | | | 1.06 | %(f) | |
| Waiver/Reimbursement | | | — | | | | — | | | | — | | | | — | | | | — | %(h) | |
| Net investment income (loss) | | | 0.15 | %(f) | | | 0.38 | %(f) | | | (0.05 | )%(g) | | | 0.02 | %(f) | | | 0.06 | %(f) | |
| Portfolio turnover rate | | | 122 | % | | | 146 | % | | | 164 | % | | | 151 | % | | | 171 | % | |
| Net assets, end of period (000s) | | $ | 143,784 | | | $ | 145,011 | | | $ | 169,295 | | | $ | 244,901 | | | $ | 209,952 | | |
(a) On August 8, 2007, Class G shares were converted to Class T shares.
(b) Per share data was calculated using the average shares outstanding during the period.
(c) Rounds to less than $0.01 per share.
(d) Total return at net asset value assuming all distributions reinvested and no initial sales charge or contingent deferred sales charge.
(e) Had the investment advisor and/or any of its affiliates not waived fees or reimbursed a portion of expenses, total return would have been reduced.
(f) The benefits derived from expense reductions had an impact of less than 0.01%.
(g) The benefits derived from expense reductions had an impact of 0.01%.
(h) Rounds to less than 0.01%.
See Accompanying Notes to Financial Statements.
91
Financial Highlights – Columbia Large Cap Growth Fund
Selected data for a share outstanding throughout the period is as follows:
| Class W Shares | | Period Ended
September 30,
2010 (a) | |
| Net Asset Value, Beginning of Period | | $ | 20.68 | | |
| Income from Investment Operations: | |
| Net investment income (b)(c) | | | — | | |
| Net realized and unrealized loss on investments and foreign currency | | | (0.04 | ) | |
| Total from investment operations | | | (0.04 | ) | |
| Net Asset Value, End of Period | | $ | 20.64 | | |
| Total return (d)(e) | | | (0.19 | )% | |
| Ratios to Average Net Assets/Supplemental Data: | |
| Net expenses (f)(g) | | | 0.96 | % | |
| Net investment income (f)(g) | | | 1.52 | % | |
| Portfolio turnover rate (e) | | | 122 | % | |
| Net assets, end of period (000s) | | $ | 2 | | |
(a) Class W shares commenced operations on September 27, 2010. Per share data and total return reflect activity from that date.
(b) Per share data was calculated using the average shares outstanding during the period.
(c) Rounds to less than $0.01 per share.
(d) Total return at net asset value.
(e) Not annualized
(f) The benefits derived from expense reductions had an impact of less than 0.01%.
(g) Annualized.
See Accompanying Notes to Financial Statements.
92
Financial Highlights – Columbia Large Cap Growth Fund
Selected data for a share outstanding throughout each period is as follows:
| Class Y Shares | | Year Ended
September 30,
2010 | | Period Ended
September 30,
2009 (a) | |
| Net Asset Value, Beginning of Period | | $ | 19.20 | | | $ | 17.02 | | |
| Income from Investment Operations: | |
| Net investment income (b) | | | 0.13 | | | | 0.03 | | |
| Net realized and unrealized gain on investments and foreign currency | | | 1.97 | | | | 2.15 | | |
| Total from investment operations | | | 2.10 | | | | 2.18 | | |
| Less Distributions to Shareholders: | |
| From net investment income | | | (0.16 | ) | | | — | | |
| Increase from regulatory settlements | | | — | (c) | | | — | | |
| Net Asset Value, End of Period | | $ | 21.14 | | | $ | 19.20 | | |
| Total return (d) | | | 11.01 | % | | | 12.81 | %(e) | |
| Ratios to Average Net Assets/Supplemental Data: | |
| Net expenses before interest expense (f) | | | 0.64 | % | | | 0.63 | %(g) | |
| Interest expense (h) | | | — | % | | | — | %(g) | |
| Net expenses (f) | | | 0.64 | % | | | 0.63 | %(g) | |
| Net investment income (f) | | | 0.66 | % | | | 0.78 | %(g) | |
| Portfolio turnover rate | | | 122 | % | | | 146 | %(e) | |
| Net assets, end of period (000s) | | $ | 22,272 | | | $ | 16,686 | | |
(a) Class Y shares commenced operations on July 15, 2009. Per share data and total return reflect activity from that date.
(b) Per share data was calculated using the average shares outstanding during the period.
(c) Rounds to less than $0.01 per share.
(d) Total return at net asset value assuming all distributions reinvested.
(e) Not annualized.
(f) The benefits derived from expense reductions had an impact of less than 0.01%.
(g) Annualized.
(h) Rounds to less than 0.01%.
See Accompanying Notes to Financial Statements.
93
Financial Highlights – Columbia Large Cap Growth Fund
Selected data for a share outstanding throughout each period is as follows:
| | | Year Ended September 30, | |
| Class Z Shares | | 2010 | | 2009 | | 2008 | | 2007 | | 2006 | |
| Net Asset Value, Beginning of Period | | $ | 19.20 | | | $ | 20.02 | | | $ | 27.32 | | | $ | 22.68 | | | $ | 21.50 | | |
| Income from Investment Operations: | |
| Net investment income (a) | | | 0.09 | | | | 0.11 | | | | 0.06 | | | | 0.08 | | | | 0.08 | | |
Net realized and unrealized gain (loss)
on investments and foreign currency | | | 1.96 | | | | (0.88 | ) | | | (5.51 | ) | | | 4.97 | | | | 1.19 | | |
| Total from investment operations | | | 2.05 | | | | (0.77 | ) | | | (5.45 | ) | | | 5.05 | | | | 1.27 | | |
| Less Distributions to Shareholders: | |
| From net investment income | | | (0.13 | ) | | | (0.06 | ) | | | (0.05 | ) | | | (0.04 | ) | | | (0.09 | ) | |
| From net realized gains | | | — | | | | — | | | | (1.81 | ) | | | (0.37 | ) | | | — | | |
| Total distributions to shareholders | | | (0.13 | ) | | | (0.06 | ) | | | (1.86 | ) | | | (0.41 | ) | | | (0.09 | ) | |
| Increase from regulatory settlements | | | — | (b) | | | 0.01 | | | | 0.01 | | | | — | | | | — | | |
| Net Asset Value, End of Period | | $ | 21.12 | | | $ | 19.20 | | | $ | 20.02 | | | $ | 27.32 | | | $ | 22.68 | | |
| Total return (c) | | | 10.74 | % | | | (3.71 | )% | | | (21.55 | )% | | | 22.53 | % | | | 5.92 | %(d) | |
| Ratios to Average Net Assets/Supplemental Data: | |
| Net expenses before interest expense | | | 0.85 | %(e) | | | 0.88 | %(e) | | | 0.77 | %(f) | | | 0.75 | %(e) | | | 0.76 | %(e) | |
| Interest expense | | | — | %(g) | | | — | %(g) | | | — | | | | — | %(g) | | | — | %(g) | |
| Net expenses | | | 0.85 | %(e) | | | 0.88 | %(e) | | | 0.77 | %(f) | | | 0.75 | %(e) | | | 0.76 | %(e) | |
| Waiver/Reimbursement | | | — | | | | — | | | | — | | | | — | | | | — | %(g) | |
| Net investment income | | | 0.45 | %(e) | | | 0.67 | %(e) | | | 0.25 | %(f) | | | 0.32 | %(e) | | | 0.35 | %(e) | |
| Portfolio turnover rate | | | 122 | % | | | 146 | % | | | 164 | % | | | 151 | % | | | 171 | % | |
| Net assets, end of period (000s) | | $ | 860,959 | | | $ | 940,823 | | | $ | 979,353 | | | $ | 1,302,932 | | | $ | 1,169,103 | | |
(a) Per share data was calculated using the average shares outstanding during the period.
(b) Rounds to less than $0.01 per share.
(c) Total return at net asset value assuming all distributions reinvested.
(d) Had the investment advisor and/or any of its affiliates not waived fees or reimbursed a portion of expenses, total return would have been reduced.
(e) The benefits derived from expense reductions had an impact of less than 0.01%.
(f) The benefits derived from expense reductions had an impact of 0.01%.
(g) Rounds to less than 0.01%.
See Accompanying Notes to Financial Statements.
94
Financial Highlights – Columbia Disciplined Value Fund
Selected data for a share outstanding throughout each period is as follows:
| | | Year Ended September 30, | |
| Class A Shares | | 2010 | | 2009 | | 2008 | | 2007 | | 2006 | |
| Net Asset Value, Beginning of Period | | $ | 9.52 | | | $ | 10.53 | | | $ | 16.32 | | | $ | 15.70 | | | $ | 14.60 | | |
| Income from Investment Operations: | |
| Net investment income (a) | | | 0.13 | | | | 0.15 | | | | 0.17 | | | | 0.14 | | | | 0.17 | | |
Net realized and unrealized gain (loss)
on investments and futures contracts | | | 0.57 | | | | (1.00 | ) | | | (3.96 | ) | | | 2.10 | | | | 2.18 | | |
| Total from investment operations | | | 0.70 | | | | (0.85 | ) | | | (3.79 | ) | | | 2.24 | | | | 2.35 | | |
| Less Distributions to Shareholders: | |
| From net investment income | | | (0.13 | ) | | | (0.16 | ) | | | (0.17 | ) | | | (0.16 | ) | | | (0.18 | ) | |
| From net realized gains | | | — | | | | — | | | | (1.83 | ) | | | (1.46 | ) | | | (1.07 | ) | |
| Total distributions to shareholders | | | (0.13 | ) | | | (0.16 | ) | | | (2.00 | ) | | | (1.62 | ) | | | (1.25 | ) | |
| Increase from regulatory settlements | | | — | (b) | | | — | | | | — | | | | — | | | | — | | |
| Net Asset Value, End of Period | | $ | 10.09 | | | $ | 9.52 | | | $ | 10.53 | | | $ | 16.32 | | | $ | 15.70 | | |
| Total return (c) | | | 7.36 | %(d) | | | (7.72 | )% | | | (26.09 | )% | | | 15.00 | % | | | 17.19 | %(d) | |
| Ratios to Average Net Assets/Supplemental Data: | |
| Net expenses before interest expense (e) | | | 1.25 | % | | | 1.29 | % | | | 1.28 | % | | | 1.24 | % | | | 1.21 | % | |
| Interest expense | | | — | %(f) | | | — | %(f) | | | — | %(f) | | | — | | | | — | %(f) | |
| Net expenses (e) | | | 1.25 | % | | | 1.29 | % | | | 1.28 | % | | | 1.24 | % | | | 1.21 | % | |
| Waiver/Reimbursement | | | 0.02 | % | | | — | | | | — | | | | — | | | | — | %(f) | |
| Net investment income (e) | | | 1.30 | % | | | 1.94 | % | | | 1.32 | % | | | 0.89 | % | | | 1.15 | % | |
| Portfolio turnover rate | | | 79 | % | | | 170 | % | | | 78 | % | | | 91 | % | | | 81 | % | |
| Net assets, end of period (000s) | | $ | 9,109 | | | $ | 10,543 | | | $ | 16,171 | | | $ | 34,706 | | | $ | 12,717 | | |
(a) Per share data was calculated using the average shares outstanding during the period.
(b) Rounds to less than $0.01 per share.
(c) Total return at net asset value assuming all distributions reinvested and no initial sales charge or contingent deferred sales charge.
(d) Had the investment advisor and/or any of its affiliates not waived fees or reimbursed a portion of expenses, total return would have been reduced.
(e) The benefits derived from expense reductions had an impact of less than 0.01%.
(f) Rounds to less than 0.01%.
See Accompanying Notes to Financial Statements.
95
Financial Highlights – Columbia Disciplined Value Fund
Selected data for a share outstanding throughout each period is as follows:
| | | Year Ended September 30, | |
| Class B Shares | | 2010 | | 2009 | | 2008 | | 2007 | | 2006 | |
| Net Asset Value, Beginning of Period | | $ | 8.97 | | | $ | 9.92 | | | $ | 15.47 | | | $ | 14.96 | | | $ | 13.96 | | |
| Income from Investment Operations: | |
| Net investment income (a) | | | 0.05 | | | | 0.09 | | | | 0.07 | | | | 0.03 | | | | 0.06 | | |
Net realized and unrealized gain (loss)
on investments and futures contracts | | | 0.53 | | | | (0.94 | ) | | | (3.72 | ) | | | 1.98 | | | | 2.08 | | |
| Total from investment operations | | | 0.58 | | | | (0.85 | ) | | | (3.65 | ) | | | 2.01 | | | | 2.14 | | |
| Less Distributions to Shareholders: | |
| From net investment income | | | (0.05 | ) | | | (0.10 | ) | | | (0.07 | ) | | | (0.04 | ) | | | (0.07 | ) | |
| From net realized gains | | | — | | | | — | | | | (1.83 | ) | | | (1.46 | ) | | | (1.07 | ) | |
| Total distributions to shareholders | | | (0.05 | ) | | | (0.10 | ) | | | (1.90 | ) | | | (1.50 | ) | | | (1.14 | ) | |
| Increase from regulatory settlements | | | — | (b) | | | — | | | | — | | | | — | | | | — | | |
| Net Asset Value, End of Period | | $ | 9.50 | | | $ | 8.97 | | | $ | 9.92 | | | $ | 15.47 | | | $ | 14.96 | | |
| Total return (c) | | | 6.51 | %(d) | | | (8.33 | )% | | | (26.59 | )% | | | 14.12 | % | | | 16.35 | %(d) | |
| Ratios to Average Net Assets/Supplemental Data: | |
| Net expenses before interest expense (e) | | | 2.00 | % | | | 2.04 | % | | | 2.03 | % | | | 1.99 | % | | | 1.96 | % | |
| Interest expense | | | — | %(f) | | | — | %(f) | | | — | %(f) | | | — | | | | — | %(f) | |
| Net expenses (e) | | | 2.00 | % | | | 2.04 | % | | | 2.03 | % | | | 1.99 | % | | | 1.96 | % | |
| Waiver/Reimbursement | | | 0.02 | % | | | — | | | | — | | | | — | | | | — | %(f) | |
| Net investment income (e) | | | 0.55 | % | | | 1.22 | % | | | 0.56 | % | | | 0.19 | % | | | 0.43 | % | |
| Portfolio turnover rate | | | 79 | % | | | 170 | % | | | 78 | % | | | 91 | % | | | 81 | % | |
| Net assets, end of period (000s) | | $ | 1,644 | | | $ | 2,169 | | | $ | 3,914 | | | $ | 7,690 | | | $ | 5,332 | | |
(a) Per share data was calculated using the average shares outstanding during the period.
(b) Rounds to less than $0.01 per share.
(c) Total return at net asset value assuming all distributions reinvested and no contingent deferred sales charge.
(d) Had the investment advisor and/or any of its affiliates not waived fees or reimbursed a portion of expenses, total return would have been reduced.
(e) The benefits derived from expense reductions had an impact of less than 0.01%.
(f) Rounds to less than 0.01%.
See Accompanying Notes to Financial Statements.
96
Financial Highlights – Columbia Disciplined Value Fund
Selected data for a share outstanding throughout each period is as follows:
| | | Year Ended September 30, | |
| Class C Shares | | 2010 | | 2009 | | 2008 | | 2007 | | 2006 | |
| Net Asset Value, Beginning of Period | | $ | 8.94 | | | $ | 9.89 | | | $ | 15.44 | | | $ | 14.93 | | | $ | 13.94 | | |
| Income from Investment Operations: | |
| Net investment income (a) | | | 0.05 | | | | 0.09 | | | | 0.07 | | | | 0.02 | | | | 0.05 | | |
Net realized and unrealized gain (loss)
on investments and futures contracts | | | 0.52 | | | | (0.94 | ) | | | (3.72 | ) | | | 1.99 | | | | 2.08 | | |
| Total from investment operations | | | 0.57 | | | | (0.85 | ) | | | (3.65 | ) | | | 2.01 | | | | 2.13 | | |
| Less Distributions to Shareholders: | |
| From net investment income | | | (0.05 | ) | | | (0.10 | ) | | | (0.07 | ) | | | (0.04 | ) | | | (0.07 | ) | |
| From net realized gains | | | — | | | | — | | | | (1.83 | ) | | | (1.46 | ) | | | (1.07 | ) | |
| Total distributions to shareholders | | | (0.05 | ) | | | (0.10 | ) | | | (1.90 | ) | | | (1.50 | ) | | | (1.14 | ) | |
| Increase from regulatory settlements | | | — | (b) | | | — | | | | — | | | | — | | | | — | | |
| Net Asset Value, End of Period | | $ | 9.46 | | | $ | 8.94 | | | $ | 9.89 | | | $ | 15.44 | | | $ | 14.93 | | |
| Total return (c) | | | 6.42 | %(d) | | | (8.35 | )% | | | (26.64 | )% | | | 14.15 | % | | | 16.30 | %(d) | |
| Ratios to Average Net Assets/Supplemental Data: | |
| Net expenses before interest expense (e) | | | 2.00 | % | | | 2.04 | % | | | 2.03 | % | | | 1.99 | % | | | 1.96 | % | |
| Interest expense | | | — | %(f) | | | — | %(f) | | | — | %(f) | | | — | | | | — | %(f) | |
| Net expenses (e) | | | 2.00 | % | | | 2.04 | % | | | 2.03 | % | | | 1.99 | % | | | 1.96 | % | |
| Waiver/Reimbursement | | | 0.02 | % | | | — | | | | — | | | | — | | | | — | %(f) | |
| Net investment income (e) | | | 0.55 | % | | | 1.18 | % | | | 0.55 | % | | | 0.14 | % | | | 0.39 | % | |
| Portfolio turnover rate | | | 79 | % | | | 170 | % | | | 78 | % | | | 91 | % | | | 81 | % | |
| Net assets, end of period (000s) | | $ | 1,879 | | | $ | 2,020 | | | $ | 2,801 | | | $ | 5,650 | | | $ | 1,801 | | |
(a) Per share data was calculated using the average shares outstanding during the period.
(b) Rounds to less than $0.01 per share.
(c) Total return at net asset value assuming all distributions reinvested and no contingent deferred sales charge.
(d) Had the investment advisor and/or any of its affiliates not waived fees or reimbursed a portion of expenses, total return would have been reduced.
(e) The benefits derived from expense reductions had an impact of less than 0.01%.
(f) Rounds to less than 0.01%.
See Accompanying Notes to Financial Statements.
97
Financial Highlights – Columbia Disciplined Value Fund
Selected data for a share outstanding throughout each period is as follows:
| | | Year Ended September 30, | |
| Class T Shares | | 2010 | | 2009 | | 2008 | | 2007 (a) | | 2006 | |
| Net Asset Value, Beginning of Period | | $ | 9.52 | | | $ | 10.53 | | | $ | 16.33 | | | $ | 15.70 | | | $ | 14.60 | | |
| Income from Investment Operations: | |
| Net investment income (b) | | | 0.12 | | | | 0.15 | | | | 0.16 | | | | 0.15 | | | | 0.17 | | |
Net realized and unrealized gain (loss)
on investment and futures contracts | | | 0.57 | | | | (1.00 | ) | | | (3.97 | ) | | | 2.09 | | | | 2.18 | | |
| Total from investment operations | | | 0.69 | | | | (0.85 | ) | | | (3.81 | ) | | | 2.24 | | | | 2.35 | | |
| Less Distributions to Shareholders: | |
| From net investment income | | | (0.12 | ) | | | (0.16 | ) | | | (0.16 | ) | | | (0.15 | ) | | | (0.18 | ) | |
| From net realized gains | | | — | | | | — | | | | (1.83 | ) | | | (1.46 | ) | | | (1.07 | ) | |
| Total distributions to shareholders | | | (0.12 | ) | | | (0.16 | ) | | | (1.99 | ) | | | (1.61 | ) | | | (1.25 | ) | |
| Increase from regulatory settlements | | | — | (c) | | | — | | | | — | | | | — | | | | — | | |
| Net Asset Value, End of Period | | $ | 10.09 | | | $ | 9.52 | | | $ | 10.53 | | | $ | 16.33 | | | $ | 15.70 | | |
| Total return (d) | | | 7.30 | %(e) | | | (7.77 | )% | | | (26.18 | )% | | | 15.01 | % | | | 17.13 | %(e) | |
| Ratios to Average Net Assets/Supplemental Data: | |
| Net expenses before interest expense (f) | | | 1.30 | % | | | 1.34 | % | | | 1.33 | % | | | 1.29 | % | | | 1.26 | % | |
| Interest expense | | | — | %(g) | | | — | %(g) | | | — | %(g) | | | — | | | | — | %(g) | |
| Net expenses (f) | | | 1.30 | % | | | 1.34 | % | | | 1.33 | % | | | 1.29 | % | | | 1.26 | % | |
| Waiver/Reimbursement | | | 0.02 | % | | | — | | | | — | | | | — | | | | — | %(g) | |
| Net investment income (f) | | | 1.25 | % | | | 1.84 | % | | | 1.27 | % | | | 0.91 | % | | | 1.15 | % | |
| Portfolio turnover rate | | | 79 | % | | | 170 | % | | | 78 | % | | | 91 | % | | | 81 | % | |
| Net assets, end of period (000s) | | $ | 69,025 | | | $ | 72,555 | | | $ | 89,694 | | | $ | 140,443 | | | $ | 137,595 | | |
(a) On August 8, 2007, Class G shares were converted to Class T shares.
(b) Per share data was calculated using the average shares outstanding during the period.
(c) Rounds to less than $0.01 per share.
(d) Total return at net asset value assuming all distributions reinvested and no initial sales charge or contingent deferred sales charge.
(e) Had the investment advisor and/or any of its affiliates not waived fees or reimbursed a portion of expenses, total return would have been reduced.
(f) The benefits derived from expense reductions had an impact of less than 0.01%.
(g) Rounds to less than 0.01%.
See Accompanying Notes to Financial Statements.
98
Financial Highlights – Columbia Disciplined Value Fund
Selected data for a share outstanding throughout each period is as follows:
| | | Year Ended September 30, | |
| Class Z Shares | | 2010 | | 2009 | | 2008 | | 2007 | | 2006 | |
| Net Asset Value, Beginning of Period | | $ | 9.77 | | | $ | 10.80 | | | $ | 16.69 | | | $ | 16.02 | | | $ | 14.87 | | |
| Income from Investment Operations: | |
| Net investment income (a) | | | 0.16 | | | | 0.17 | | | | 0.21 | | | | 0.20 | | | | 0.22 | | |
Net realized and unrealized gain (loss)
on investments and futures contracts | | | 0.58 | | | | (1.02 | ) | | | (4.07 | ) | | | 2.13 | | | | 2.22 | | |
| Total from investment operations | | | 0.74 | | | | (0.85 | ) | | | (3.86 | ) | | | 2.33 | | | | 2.44 | | |
| Less Distributions to Shareholders: | |
| From net investment income | | | (0.15 | ) | | | (0.18 | ) | | | (0.20 | ) | | | (0.20 | ) | | | (0.22 | ) | |
| From net realized gains | | | — | | | | — | | | | (1.83 | ) | | | (1.46 | ) | | | (1.07 | ) | |
| Total distributions to shareholders | | | (0.15 | ) | | | (0.18 | ) | | | (2.03 | ) | | | (1.66 | ) | | | (1.29 | ) | |
| Increase from regulatory settlements | | | — | (b) | | | — | | | | — | | | | — | | | | — | | |
| Net Asset Value, End of Period | | $ | 10.36 | | | $ | 9.77 | | | $ | 10.80 | | | $ | 16.69 | | | $ | 16.02 | | |
| Total return (c) | | | 7.63 | %(d) | | | (7.49 | )% | | | (25.92 | )% | | | 15.29 | % | | | 17.50 | %(d) | |
| Ratios to Average Net Assets/Supplemental Data: | |
| Net expenses before interest expense (e) | | | 1.00 | % | | | 1.04 | % | | | 1.03 | % | | | 0.99 | % | | | 0.96 | % | |
| Interest expense | | | — | %(f) | | | — | %(f) | | | — | %(f) | | | — | | | | — | %(f) | |
| Net expenses (e) | | | 1.00 | % | | | 1.04 | % | | | 1.03 | % | | | 0.99 | % | | | 0.96 | % | |
| Waiver/Reimbursement | | | 0.02 | % | | | — | | | | — | | | | — | | | | — | %(f) | |
| Net investment income (e) | | | 1.54 | % | | | 2.13 | % | | | 1.58 | % | | | 1.20 | % | | | 1.45 | % | |
| Portfolio turnover rate | | | 79 | % | | | 170 | % | | | 78 | % | | | 91 | % | | | 81 | % | |
| Net assets, end of period (000s) | | $ | 126,172 | | | $ | 218,691 | | | $ | 222,212 | | | $ | 341,612 | | | $ | 285,941 | | |
(a) Per share data was calculated using the average shares outstanding during the period.
(b) Rounds to less than $0.01 per share.
(c) Total return at net asset value assuming all distributions reinvested.
(d) Had the investment advisor and/or any of its affiliates not waived fees or reimbursed a portion of expenses, total return would have been reduced.
(e) The benefits derived from expense reductions had an impact of less than 0.01%.
(f) Rounds to less than 0.01%.
See Accompanying Notes to Financial Statements.
99
Financial Highlights – Columbia Contrarian Core Fund
Selected data for a share outstanding throughout each period is as follows:
| | | Year Ended September 30, | |
| Class A Shares | | 2010 | | 2009 (a) | | 2008 | | 2007 | | 2006 | |
| Net Asset Value, Beginning of Period | | $ | 11.76 | | | $ | 11.89 | | | $ | 15.51 | | | $ | 14.03 | | | $ | 13.59 | | |
| Income from Investment Operations: | |
| Net investment income (b) | | | 0.04 | | | | 0.08 | | | | 0.07 | | | | 0.05 | | | | — | (c) | |
Net realized and unrealized gain (loss) on investments and
foreign currency | | | 0.87 | | | | (0.14 | ) | | | (2.17 | ) | | | 2.60 | | | | 1.21 | | |
| Total from investment operations | | | 0.91 | | | | (0.06 | ) | | | (2.10 | ) | | | 2.65 | | | | 1.21 | | |
| Less Distributions to Shareholders: | |
| From net investment income | | | (0.06 | ) | | | (0.07 | ) | | | (0.05 | ) | | | — | | | | (0.01 | ) | |
| From net realized gains | | | — | | | | — | | | | (1.47 | ) | | | (1.17 | ) | | | (0.76 | ) | |
| Total distributions to shareholders | | | (0.06 | ) | | | (0.07 | ) | | | (1.52 | ) | | | (1.17 | ) | | | (0.77 | ) | |
| Increase from regulatory settlements | | | — | | | | — | (c) | | | — | | | | — | | | | — | | |
| Net Asset Value, End of Period | | $ | 12.61 | | | $ | 11.76 | | | $ | 11.89 | | | $ | 15.51 | | | $ | 14.03 | | |
| Total return (d)(e) | | | 7.75 | % | | | (0.28 | )% | | | (15.35 | )% | | | 19.82 | % | | | 9.24 | % | |
| Ratios to Average Net Assets/Supplemental Data: | |
| Net expenses before interest expense | | | 1.19 | %(f) | | | 1.17 | %(f) | | | 1.14 | %(g) | | | 1.14 | %(f) | | | 1.14 | %(f) | |
| Interest expense | | | — | | | | — | %(h) | | | — | %(h) | | | — | | | | — | | |
| Net expenses | | | 1.19 | %(f) | | | 1.17 | %(f) | | | 1.14 | %(g) | | | 1.14 | %(f) | | | 1.14 | %(f) | |
| Waiver/Reimbursement | | | 0.06 | % | | | 0.11 | % | | | 0.10 | % | | | 0.10 | % | | | 0.12 | % | |
| Net investment income | | | 0.32 | %(f) | | | 0.77 | %(f) | | | 0.53 | %(g) | | | 0.32 | %(f) | | | — | %(f)(h) | |
| Portfolio turnover rate | | | 94 | % | | | 131 | % | | | 106 | % | | | 88 | % | | | 63 | % | |
| Net assets, end of period (000s) | | $ | 111,182 | | | $ | 27,742 | | | $ | 11,187 | | | $ | 12,054 | | | $ | 10,578 | | |
(a) On November 14, 2008, the Columbia Common Stock Fund was renamed the Columbia Contrarian Core Fund.
(b) Per share data was calculated using the average shares outstanding during the period.
(c) Rounds to less than $0.01 per share.
(d) Total return at net asset value assuming all distributions reinvested and no initial sales charge or contingent deferred sales charge.
(e) Had the investment advisor and/or any of its affiliates not waived fees or reimbursed a portion of expenses, total return would have been reduced.
(f) The benefits derived from expense reductions had an impact of less than 0.01%.
(g) The benefits derived from expense reductions had an impact of 0.01%.
(h) Rounds to less than 0.01%.
See Accompanying Notes to Financial Statements.
100
Financial Highlights – Columbia Contrarian Core Fund
Selected data for a share outstanding throughout each period is as follows:
| | | Year Ended September 30, | |
| Class B Shares | | 2010 | | 2009 (a) | | 2008 | | 2007 | | 2006 | |
| Net Asset Value, Beginning of Period | | $ | 11.02 | | | $ | 11.14 | | | $ | 14.67 | | | $ | 13.42 | | | $ | 13.12 | | |
| Income from Investment Operations: | |
| Net investment income (loss) (b) | | | (0.05 | ) | | | 0.01 | | | | (0.03 | ) | | | (0.06 | ) | | | (0.10 | ) | |
Net realized and unrealized gain (loss) on investments and
foreign currency | | | 0.81 | | | | (0.13 | ) | | | (2.03 | ) | | | 2.48 | | | | 1.16 | | |
| Total from investment operations | | | 0.76 | | | | (0.12 | ) | | | (2.06 | ) | | | 2.42 | | | | 1.06 | | |
| Less Distributions to Shareholders: | |
| From net realized gains | | | — | | | | — | | | | (1.47 | ) | | | (1.17 | ) | | | (0.76 | ) | |
| Increase from regulatory settlements | | | — | | | | — | (c) | | | — | | | | — | | | | — | | |
| Net Asset Value, End of Period | | $ | 11.78 | | | $ | 11.02 | | | $ | 11.14 | | | $ | 14.67 | | | $ | 13.42 | | |
| Total return (d)(e) | | | 6.90 | % | | | (1.08 | )% | | | (15.96 | )% | | | 18.94 | % | | | 8.40 | % | |
| Ratios to Average Net Assets/Supplemental Data: | |
| Net expenses before interest expense | | | 1.94 | %(f) | | | 1.92 | %(f) | | | 1.89 | %(g) | | | 1.89 | %(f) | | | 1.89 | %(f) | |
| Interest expense | | | — | | | | — | %(h) | | | — | %(h) | | | — | | | | — | | |
| Net expenses | | | 1.94 | %(f) | | | 1.92 | %(f) | | | 1.89 | %(g) | | | 1.89 | %(f) | | | 1.89 | %(f) | |
| Waiver/Reimbursement | | | 0.06 | % | | | 0.11 | % | | | 0.10 | % | | | 0.10 | % | | | 0.12 | % | |
| Net investment income (loss) | | | (0.46 | )%(f) | | | 0.12 | %(f) | | | (0.22 | )%(g) | | | (0.44 | )%(f) | | | (0.75 | )%(f) | |
| Portfolio turnover rate | | | 94 | % | | | 131 | % | | | 106 | % | | | 88 | % | | | 63 | % | |
| Net assets, end of period (000s) | | $ | 3,991 | | | $ | 3,428 | | | $ | 3,629 | | | $ | 4,796 | | | $ | 5,637 | | |
(a) On November 14, 2008, the Columbia Common Stock Fund was renamed the Columbia Contrarian Core Fund.
(b) Per share data was calculated using the average shares outstanding during the period.
(c) Rounds to less than $0.01 per share.
(d) Total return at net asset value assuming all distributions reinvested and no contingent deferred sales charge.
(e) Had the investment advisor and/or any of its affiliates not waived fees or reimbursed a portion of expenses, total return would have been reduced.
(f) The benefits derived from expense reductions had an impact of less than 0.01%.
(g) The benefits derived from expense reductions had an impact of 0.01%.
(h) Rounds to less than 0.01%.
See Accompanying Notes to Financial Statements.
101
Financial Highlights – Columbia Contrarian Core Fund
Selected data for a share outstanding throughout each period is as follows:
| | | Year Ended September 30, | |
| Class C Shares | | 2010 | | 2009 (a) | | 2008 | | 2007 | | 2006 | |
| Net Asset Value, Beginning of Period | | $ | 11.03 | | | $ | 11.15 | | | $ | 14.68 | | | $ | 13.43 | | | $ | 13.13 | | |
| Income from Investment Operations: | |
| Net investment income (loss) (b) | | | (0.05 | ) | | | 0.01 | | | | (0.03 | ) | | | (0.06 | ) | | | (0.10 | ) | |
Net realized and unrealized gain (loss) on investments and
foreign currency | | | 0.82 | | | | (0.13 | ) | | | (2.03 | ) | | | 2.48 | | | | 1.16 | | |
| Total from investment operations | | | 0.77 | | | | (0.12 | ) | | | (2.06 | ) | | | 2.42 | | | | 1.06 | | |
| Less Distributions to Shareholders: | |
| From net realized gains | | | — | | | | — | | | | (1.47 | ) | | | (1.17 | ) | | | (0.76 | ) | |
| Increase from regulatory settlements | | | — | | | | — | (c) | | | — | | | | — | | | | — | | |
| Net Asset Value, End of Period | | $ | 11.80 | | | $ | 11.03 | | | $ | 11.15 | | | $ | 14.68 | | | $ | 13.43 | | |
| Total return (d)(e) | | | 6.98 | % | | | (1.08 | )% | | | (15.95 | )% | | | 18.93 | % | | | 8.40 | % | |
| Ratios to Average Net Assets/Supplemental Data: | |
| Net expenses before interest expense | | | 1.94 | %(f) | | | 1.92 | %(f) | | | 1.89 | %(g) | | | 1.89 | %(f) | | | 1.89 | %(f) | |
| Interest expense | | | — | | | | — | %(h) | | | — | %(h) | | | — | | | | — | | |
| Net expenses | | | 1.94 | %(f) | | | 1.92 | %(f) | | | 1.89 | %(g) | | | 1.89 | %(f) | | | 1.89 | %(f) | |
| Waiver/Reimbursement | | | 0.06 | % | | | 0.11 | % | | | 0.10 | % | | | 0.10 | % | | | 0.12 | % | |
| Net investment income (loss) | | | (0.44 | )%(f) | | | 0.03 | %(f) | | | (0.21 | )%(g) | | | (0.41 | )%(f) | | | (0.75 | )%(f) | |
| Portfolio turnover rate | | | 94 | % | | | 131 | % | | | 106 | % | | | 88 | % | | | 63 | % | |
| Net assets, end of period (000s) | | $ | 18,368 | | | $ | 7,094 | | | $ | 1,718 | | | $ | 1,428 | | | $ | 906 | | |
(a) On November 14, 2008, the Columbia Common Stock Fund was renamed the Columbia Contrarian Core Fund.
(b) Per share data was calculated using the average shares outstanding during the period.
(c) Rounds to less than $0.01 per share.
(d) Total return at net asset value assuming all distributions reinvested and no contingent deferred sales charge.
(e) Had the investment advisor and/or any of its affiliates not waived fees or reimbursed a portion of expenses, total return would have been reduced.
(f) The benefits derived from expense reductions had an impact of less than 0.01%.
(g) The benefits derived from expense reductions had an impact of 0.01%.
(h) Rounds to less than 0.01%.
See Accompanying Notes to Financial Statements.
102
Financial Highlights – Columbia Contrarian Core Fund
Selected data for a share outstanding throughout the period is as follows:
| Class I Shares | | Period Ended
September 30,
2010 (a) | |
| Net Asset Value, Beginning of Period | | $ | 12.70 | | |
| Income from Investment Operations: | |
| Net investment income (b) | | | 0.01 | | |
| Net realized and unrealized loss on investments and foreign currency | | | (0.02 | ) | |
| Total from investment operations | | | (0.01 | ) | |
| Net Asset Value, End of Period | | $ | 12.69 | | |
| Total return (c)(d) | | | (0.08 | )% | |
| Ratios to Average Net Assets/Supplemental Data: | |
| Net expenses (e)(f) | | | 0.85 | % | |
| Net investment income (e)(f) | | | 4.99 | % | |
| Portfolio turnover rate (d) | | | 94 | % | |
| Net assets, end of period (000s) | | $ | 2 | | |
(a) Class I shares commenced operations on September 27, 2010. Per share data and total return reflect activity from that date.
(b) Per share data was calculated using the average shares outstanding during the period.
(c) Total return at net asset value.
(d) Not annualized.
(e) The benefits derived from expense reductions had an impact of less than 0.01%.
(f) Annualized.
See Accompanying Notes to Financial Statements.
103
Financial Highlights – Columbia Contrarian Core Fund
Selected data for a share outstanding throughout the period is as follows:
| Class R Shares | | Period Ended
September 30,
2010 (a) | |
| Net Asset Value, Beginning of Period | | $ | 12.62 | | |
| Income from Investment Operations: | |
| Net investment income (b)(c) | | | — | | |
| Net realized and unrealized loss on investments and foreign currency | | | (0.01 | ) | |
| Total from investment operations | | | (0.01 | ) | |
| Net Asset Value, End of Period | | $ | 12.61 | | |
| Total return (d)(e) | | | (0.08 | )% | |
| Ratios to Average Net Assets/Supplemental Data: | |
| Net expenses (f)(g) | | | 1.44 | % | |
| Net investment income (f)(g) | | | 4.34 | % | |
| Portfolio turnover rate (e) | | | 94 | % | |
| Net assets, end of period (000s) | | $ | 2 | | |
(a) Class R shares commenced operations on September 27, 2010. Per share data and total return reflect activity from that date.
(b) Per share data was calculated using the average shares outstanding during the period.
(c) Rounds to less than $0.01 per share.
(d) Total return at net asset value.
(e) Not annualized.
(f) The benefits derived from expense reductions had an impact of less than 0.01%.
(g) Annualized.
See Accompanying Notes to Financial Statements.
104
Financial Highlights – Columbia Contrarian Core Fund
Selected data for a share outstanding throughout each period is as follows:
| | | Year Ended September 30, | |
| Class T Shares | | 2010 | | 2009 (a) | | 2008 | | 2007 (b) | | 2006 | |
| Net Asset Value, Beginning of Period | | $ | 11.67 | | | $ | 11.80 | | | $ | 15.40 | | | $ | 13.95 | | | $ | 13.52 | | |
| Income from Investment Operations: | |
| Net investment income (loss) (c) | | | 0.03 | | | | 0.08 | | | | 0.06 | | | | 0.04 | | | | (0.01 | ) | |
Net realized and unrealized gain (loss) on investments and
foreign currency | | | 0.86 | | | | (0.14 | ) | | | (2.15 | ) | | | 2.58 | | | | 1.21 | | |
| Total from investment operations | | | 0.89 | | | | (0.06 | ) | | | (2.09 | ) | | | 2.62 | | | | 1.20 | | |
| Less Distributions to Shareholders: | |
| From net investment income | | | (0.05 | ) | | | (0.07 | ) | | | (0.04 | ) | | | — | (d) | | | (0.01 | ) | |
| From net realized gains | | | — | | | | — | | | | (1.47 | ) | | | (1.17 | ) | | | (0.76 | ) | |
| Total distributions to shareholders | | | (0.05 | ) | | | (0.07 | ) | | | (1.51 | ) | | | (1.17 | ) | | | (0.77 | ) | |
| Increase from regulatory settlements | | | — | | | | — | (d) | | | — | | | | — | | | | — | | |
| Net Asset Value, End of Period | | $ | 12.51 | | | $ | 11.67 | | | $ | 11.80 | | | $ | 15.40 | | | $ | 13.95 | | |
| Total return (e)(f) | | | 7.68 | % | | | (0.35 | )% | | | (15.37 | )% | | | 19.70 | % | | | 9.16 | % | |
| Ratios to Average Net Assets/Supplemental Data: | |
| Net expenses before interest expense | | | 1.24 | %(g) | | | 1.22 | %(g) | | | 1.19 | %(h) | | | 1.19 | %(g) | | | 1.19 | %(g) | |
| Interest expense | | | — | | | | — | %(i) | | | — | %(i) | | | — | | | | — | | |
| Net expenses | | | 1.24 | %(g) | | | 1.22 | %(g) | | | 1.19 | %(h) | | | 1.19 | %(g) | | | 1.19 | %(g) | |
| Waiver/Reimbursement | | | 0.06 | % | | | 0.11 | % | | | 0.10 | % | | | 0.10 | % | | | 0.12 | % | |
| Net investment income (loss) | | | 0.24 | %(g) | | | 0.81 | %(g) | | | 0.48 | %(h) | | | 0.27 | %(g) | | | (0.05 | )%(g) | |
| Portfolio turnover rate | | | 94 | % | | | 131 | % | | | 106 | % | | | 88 | % | | | 63 | % | |
| Net assets, end of period (000s) | | $ | 112,862 | | | $ | 117,161 | | | $ | 132,272 | | | $ | 177,345 | | | $ | 168,506 | | |
(a) On November 14, 2008, the Columbia Common Stock Fund was renamed the Columbia Contrarian Core Fund.
(b) On August 8, 2007, Class G shares were converted to Class T shares.
(c) Per share data was calculated using the average shares outstanding during the period.
(d) Rounds to less than $0.01 per share.
(e) Total return at net asset value assuming all distributions reinvested and no initial sales charge or contingent deferred sales charge.
(f) Had the investment advisor and/or any of its affiliates not waived fees or reimbursed a portion of expenses, total return would have been reduced.
(g) The benefits derived from expense reductions had an impact of less than 0.01%.
(h) The benefits derived from expense reductions had an impact of 0.01%.
(i) Rounds to less than 0.01%.
See Accompanying Notes to Financial Statements.
105
Financial Highlights – Columbia Contrarian Core Fund
Selected data for a share outstanding throughout the period is as follows:
| Class W Shares | | Period Ended
September 30,
2010 (a) | |
| Net Asset Value, Beginning of Period | | $ | 12.62 | | |
| Income from Investment Operations: | |
| Net investment income (b)(c) | | | — | | |
| Net realized and unrealized loss on investments and foreign currency | | | (0.01 | ) | |
| Total from investment operations | | | (0.01 | ) | |
| Net Asset Value, End of Period | | $ | 12.61 | | |
| Total return (d)(e) | | | (0.08 | )% | |
| Ratios to Average Net Assets/Supplemental Data: | |
| Net expenses (f)(g) | | | 1.19 | % | |
| Net investment income (f)(g) | | | 4.64 | % | |
| Portfolio turnover rate (e) | | | 94 | % | |
| Net assets, end of period (000s) | | $ | 2 | | |
(a) Class W shares commenced operations on September 27, 2010. Per share data and total return reflect activity from that date.
(b) Per share data was calculated using the average shares outstanding during the period.
(c) Rounds to less than $0.01 per share.
(d) Total return at net asset value.
(e) Not annualized.
(f) The benefits derived from expense reductions had an impact of less than 0.01%.
(g) Annualized.
See Accompanying Notes to Financial Statements.
106
Financial Highlights – Columbia Contrarian Core Fund
Selected data for a share outstanding throughout each period is as follows:
| | | Year Ended September 30, | |
| Class Z Shares | | 2010 | | 2009 (a) | | 2008 | | 2007 | | 2006 | |
| Net Asset Value, Beginning of Period | | $ | 11.83 | | | $ | 11.97 | | | $ | 15.60 | | | $ | 14.10 | | | $ | 13.66 | | |
| Income from Investment Operations: | |
| Net investment income (b) | | | 0.07 | | | | 0.11 | | | | 0.11 | | | | 0.08 | | | | 0.03 | | |
Net realized and unrealized gain (loss) on investments
and foreign currency | | | 0.86 | | | | (0.15 | ) | | | (2.18 | ) | | | 2.62 | | | | 1.21 | | |
| Total from investment operations | | | 0.93 | | | | (0.04 | ) | | | (2.07 | ) | | | 2.70 | | | | 1.24 | | |
| Less Distributions to Shareholders: | |
| From net investment income | | | (0.08 | ) | | | (0.10 | ) | | | (0.09 | ) | | | (0.03 | ) | | | (0.04 | ) | |
| From net realized gains | | | — | | | | — | | | | (1.47 | ) | | | (1.17 | ) | | | (0.76 | ) | |
| Total distributions to shareholders | | | (0.08 | ) | | | (0.10 | ) | | | (1.56 | ) | | | (1.20 | ) | | | (0.80 | ) | |
| Increase from regulatory settlements | | | — | | | | — | (c) | | | — | | | | — | | | | — | | |
| Net Asset Value, End of Period | | $ | 12.68 | | | $ | 11.83 | | | $ | 11.97 | | | $ | 15.60 | | | $ | 14.10 | | |
| Total return (d)(e) | | | 7.93 | % | | | (0.01 | )% | | | (15.11 | )% | | | 20.13 | % | | | 9.45 | % | |
| Ratios to Average Net Assets/Supplemental Data: | |
| Net expenses before interest expense | | | 0.94 | %(f) | | | 0.92 | %(f) | | | 0.89 | %(g) | | | 0.89 | %(f) | | | 0.89 | %(f) | |
| Interest expense | | | — | | | | — | %(h) | | | — | %(h) | | | — | | | | — | | |
| Net expenses | | | 0.94 | %(f) | | | 0.92 | %(f) | | | 0.89 | %(g) | | | 0.89 | %(f) | | | 0.89 | %(f) | |
| Waiver/Reimbursement | | | 0.06 | % | | | 0.11 | % | | | 0.10 | % | | | 0.10 | % | | | 0.12 | % | |
| Net investment income | | | 0.54 | %(f) | | | 1.09 | %(f) | | | 0.77 | %(g) | | | 0.57 | %(f) | | | 0.25 | %(f) | |
| Portfolio turnover rate | | | 94 | % | | | 131 | % | | | 106 | % | | | 88 | % | | | 63 | % | |
| Net assets, end of period (000s) | | $ | 344,081 | | | $ | 247,974 | | | $ | 173,479 | | | $ | 245,529 | | | $ | 256,039 | | |
(a) On November 14, 2008, the Columbia Common Stock Fund was renamed the Columbia Contrarian Core Fund.
(b) Per share data was calculated using the average shares outstanding during the period.
(c) Rounds to less than $0.01 per share.
(d) Total return at net asset value assuming all distributions reinvested.
(e) Had the investment advisor and/or any of its affiliates not waived fees or reimbursed a portion of expenses, total return would have been reduced.
(f) The benefits derived from expense reductions had an impact of less than 0.01%.
(g) The benefits derived from expense reductions had an impact of 0.01%.
(h) Rounds to less than 0.01%.
See Accompanying Notes to Financial Statements.
107
Financial Highlights – Columbia Small Cap Core Fund
Selected data for a share outstanding throughout each period is as follows:
| | | Year Ended September 30, | |
| Class A Shares | | 2010 | | 2009 | | 2008 | | 2007 | | 2006 | |
| Net Asset Value, Beginning of Period | | $ | 11.58 | | | $ | 14.14 | | | $ | 20.01 | | | $ | 19.72 | | | $ | 19.32 | | |
| Income from Investment Operations: | |
| Net investment income (loss) (a) | | | (0.05 | ) | | | (0.02 | ) | | | (0.09 | ) | | | 0.04 | (b) | | | (0.06 | ) | |
| Net realized and unrealized gain (loss) on investments | | | 1.80 | | | | (1.39 | ) | | | (2.11 | ) | | | 2.46 | | | | 1.91 | | |
| Total from investment operations | | | 1.75 | | | | (1.41 | ) | | | (2.20 | ) | | | 2.50 | | | | 1.85 | | |
| Less Distributions to Shareholders: | |
| From net investment income | | | — | | | | — | | | | (0.03 | ) | | | — | | | | — | | |
| From net realized gains | | | — | | | | (1.15 | ) | | | (3.64 | ) | | | (2.21 | ) | | | (1.45 | ) | |
| Total distributions to shareholders | | | — | | | | (1.15 | ) | | | (3.67 | ) | | | (2.21 | ) | | | (1.45 | ) | |
| Increase from regulatory settlements | | | — | | | | — | (c) | | | — | | | | — | | | | — | | |
| Net Asset Value, End of Period | | $ | 13.33 | | | $ | 11.58 | | | $ | 14.14 | | | $ | 20.01 | | | $ | 19.72 | | |
| Total return (d) | | | 15.11 | % | | | (7.41 | )% | | | (12.86 | )% | | | 13.30 | % | | | 10.08 | %(e) | |
| Ratios to Average Net Assets/Supplemental Data: | |
| Net expenses before interest expense (f) | | | 1.30 | % | | | 1.33 | % | | | 1.25 | % | | | 1.21 | % | | | 1.16 | % | |
| Interest expense | | | — | | | | — | | | | — | | | | — | | | | — | %(g) | |
| Net expenses (f) | | | 1.30 | % | | | 1.33 | % | | | 1.25 | % | | | 1.21 | % | | | 1.16 | % | |
| Waiver/Reimbursement | | | — | | | | — | | | | — | | | | — | | | | — | %(g) | |
| Net investment income (loss) (f) | | | (0.38 | )% | | | (0.28 | )% | | | (0.56 | )% | | | 0.22 | % | | | (0.30 | )% | |
| Portfolio turnover rate | | | 26 | % | | | 11 | % | | | 25 | % | | | 44 | % | | | 14 | % | |
| Net assets, end of period (000s) | | $ | 121,456 | | | $ | 81,474 | | | $ | 115,246 | | | $ | 176,504 | | | $ | 190,390 | | |
(a) Per share data was calculated using the average shares outstanding during the period.
(b) Net investment income per share reflects a special dividend. The effect of this dividend amounted to $0.07 per share.
(c) Rounds to less than $0.01 per share.
(d) Total return at net asset value assuming all distributions reinvested and no initial sales charge or contingent deferred sales charge.
(e) Had the investment advisor and/or any of its affiliates not waived fees or reimbursed a portion of expenses, total return would have been reduced.
(f) The benefits derived from expense reductions had an impact of less than 0.01%.
(g) Rounds to less than 0.01%.
See Accompanying Notes to Financial Statements.
108
Financial Highlights – Columbia Small Cap Core Fund
Selected data for a share outstanding throughout each period is as follows:
| | | Year Ended September 30, | |
| Class B Shares | | 2010 | | 2009 | | 2008 | | 2007 | | 2006 | |
| Net Asset Value, Beginning of Period | | $ | 10.42 | | | $ | 12.97 | | | $ | 18.75 | | | $ | 18.73 | | | $ | 18.56 | | |
| Income from Investment Operations: | |
| Net investment loss (a) | | | (0.12 | ) | | | (0.09 | ) | | | (0.19 | ) | | | (0.10 | )(b) | | | (0.19 | ) | |
| Net realized and unrealized gain (loss) on investments | | | 1.60 | | | | (1.31 | ) | | | (1.95 | ) | | | 2.33 | | | | 1.81 | | |
| Total from investment operations | | | 1.48 | | | | (1.40 | ) | | | (2.14 | ) | | | 2.23 | | | | 1.62 | | |
| Less Distributions to Shareholders: | |
| From net realized gains | | | — | | | | (1.15 | ) | | | (3.64 | ) | | | (2.21 | ) | | | (1.45 | ) | |
| Increase from regulatory settlements | | | — | | | | — | (c) | | | — | | | | — | | | | — | | |
| Net Asset Value, End of Period | | $ | 11.90 | | | $ | 10.42 | | | $ | 12.97 | | | $ | 18.75 | | | $ | 18.73 | | |
| Total return (d) | | | 14.20 | % | | | (8.08 | )% | | | (13.53 | )% | | | 12.49 | % | | | 9.17 | %(e) | |
| Ratios to Average Net Assets/Supplemental Data: | |
| Net expenses before interest expense (f) | | | 2.05 | % | | | 2.08 | % | | | 2.00 | % | | | 1.96 | % | | | 1.91 | % | |
| Interest expense | | | — | | | | — | | | | — | | | | — | | | | — | %(g) | |
| Net expenses (f) | | | 2.05 | % | | | 2.08 | % | | | 2.00 | % | | | 1.96 | % | | | 1.91 | % | |
| Waiver/Reimbursement | | | — | | | | — | | | | — | | | | — | | | | — | %(g) | |
| Net investment loss (f) | | | (1.11 | )% | | | (1.03 | )% | | | (1.31 | )% | | | (0.53 | )% | | | (1.05 | )% | |
| Portfolio turnover rate | | | 26 | % | | | 11 | % | | | 25 | % | | | 44 | % | | | 14 | % | |
| Net assets, end of period (000s) | | $ | 15,478 | | | $ | 17,317 | | | $ | 23,085 | | | $ | 35,918 | | | $ | 39,109 | | |
(a) Per share data was calculated using the average shares outstanding during the period.
(b) Net investment loss per share reflects a special dividend. The effect of this dividend amounted to $0.06 per share.
(c) Rounds to less than $0.01 per share.
(d) Total return at net asset value assuming all distributions reinvested and no contingent deferred sales charge.
(e) Had the investment advisor and/or any of its affiliates not waived fees or reimbursed a portion of expenses, total return would have been reduced.
(f) The benefits derived from expense reductions had an impact of less than 0.01%.
(g) Rounds to less than 0.01%.
See Accompanying Notes to Financial Statements.
109
Financial Highlights – Columbia Small Cap Core Fund
Selected data for a share outstanding throughout each period is as follows:
| | | Year Ended September 30, | |
| Class C Shares | | 2010 | | 2009 | | 2008 | | 2007 | | 2006 | |
| Net Asset Value, Beginning of Period | | $ | 10.43 | | | $ | 12.99 | | | $ | 18.76 | | | $ | 18.75 | | | $ | 18.57 | | |
| Income from Investment Operations: | |
| Net investment loss (a) | | | (0.12 | ) | | | (0.09 | ) | | | (0.19 | ) | | | (0.10 | )(b) | | | (0.19 | ) | |
| Net realized and unrealized gain (loss) on investments | | | 1.61 | | | | (1.32 | ) | | | (1.94 | ) | | | 2.32 | | | | 1.82 | | |
| Total from investment operations | | | 1.49 | | | | (1.41 | ) | | | (2.13 | ) | | | 2.22 | | | | 1.63 | | |
| Less Distributions to Shareholders: | |
| From net realized gains | | | — | | | | (1.15 | ) | | | (3.64 | ) | | | (2.21 | ) | | | (1.45 | ) | |
| Increase from regulatory settlements | | | — | | | | — | (c) | | | — | | | | — | | | | — | | |
| Net Asset Value, End of Period | | $ | 11.92 | | | $ | 10.43 | | | $ | 12.99 | | | $ | 18.76 | | | $ | 18.75 | | |
| Total return (d) | | | 14.29 | % | | | (8.15 | )% | | | (13.46 | )% | | | 12.41 | % | | | 9.23 | %(e) | |
| Ratios to Average Net Assets/Supplemental Data: | |
| Net expenses before interest expense (f) | | | 2.05 | % | | | 2.08 | % | | | 2.00 | % | | | 1.96 | % | | | 1.91 | % | |
| Interest expense | | | — | | | | — | | | | — | | | | — | | | | — | %(g) | |
| Net expenses (f) | | | 2.05 | % | | | 2.08 | % | | | 2.00 | % | | | 1.96 | % | | | 1.91 | % | |
| Waiver/Reimbursement | | | — | | | | — | | | | — | | | | — | | | | — | %(g) | |
| Net investment loss (f) | | | (1.12 | )% | | | (1.03 | )% | | | (1.29 | )% | | | (0.53 | )% | | | (1.05 | )% | |
| Portfolio turnover rate | | | 26 | % | | | 11 | % | | | 25 | % | | | 44 | % | | | 14 | % | |
| Net assets, end of period (000s) | | $ | 19,635 | | | $ | 18,461 | | | $ | 24,756 | | | $ | 42,312 | | | $ | 46,241 | | |
(a) Per share data was calculated using the average shares outstanding during the period.
(b) Net investment income per share reflects a special dividend. The effect of this dividend amounted to $0.06 per share.
(c) Rounds to less than $0.01 per share.
(d) Total return at net asset value assuming all distributions reinvested and no contingent deferred sales charge.
(e) Had the investment advisor and/or any of its affiliates not waived fees or reimbursed a portion of expenses, total return would have been reduced.
(f) The benefits derived from expense reductions had an impact of less than 0.01%.
(g) Rounds to less than 0.01%.
See Accompanying Notes to Financial Statements.
110
Financial Highlights – Columbia Small Cap Core Fund
Selected data for a share outstanding throughout the period is as follows:
| Class I Shares | | Period Ended
September 30,
2010 (a) | |
| Net Asset Value, Beginning of Period | | $ | 13.37 | | |
| Income from Investment Operations: | |
| Net investment income (b)(c) | | | — | | |
| Net realized and unrealized gain on investments | | | 0.32 | | |
| Total from investment operations | | | 0.32 | | |
| Net Asset Value, End of Period | | $ | 13.69 | | |
| Total return (d)(e) | | | 2.39 | % | |
| Ratios to Average Net Assets/Supplemental Data: | |
| Net expenses (f)(g) | | | 0.90 | % | |
| Net investment income (f)(g) | | | 2.13 | % | |
| Portfolio turnover rate (e) | | | 26 | % | |
| Net assets, end of period (000s) | | $ | 3 | | |
(a) Class I shares commenced operations on September 27, 2010. Per share data and total return reflect activity from that date.
(b) Per share data was calculated using the average shares outstanding during the period.
(c) Rounds to less than $0.01 per share.
(d) Total return at net asset value.
(e) Not annualized.
(f) The benefits derived from expense reductions had an impact of less than 0.01%.
(g) Annualized.
See Accompanying Notes to Financial Statements.
111
Financial Highlights – Columbia Small Cap Core Fund
Selected data for a share outstanding throughout each period is as follows:
| | | Year Ended September 30, | |
| Class T Shares | | 2010 | | 2009 | | 2008 | | 2007 (a) | | 2006 | |
| Net Asset Value, Beginning of Period | | $ | 11.39 | | | $ | 13.94 | | | $ | 19.78 | | | $ | 19.53 | | | $ | 19.15 | | |
| Income from Investment Operations: | |
| Net investment income (loss) (b) | | | (0.05 | ) | | | (0.03 | ) | | | (0.10 | ) | | | 0.03 | (c) | | | (0.07 | ) | |
| Net realized and unrealized gain (loss) on investments | | | 1.76 | | | | (1.37 | ) | | | (2.08 | ) | | | 2.43 | | | | 1.90 | | |
| Total from investment operations | | | 1.71 | | | | (1.40 | ) | | | (2.18 | ) | | | 2.46 | | | | 1.83 | | |
| Less Distributions to Shareholders: | |
| From net investment income | | | — | | | | — | | | | (0.02 | ) | | | — | | | | — | | |
| From net realized gains | | | — | | | | (1.15 | ) | | | (3.64 | ) | | | (2.21 | ) | | | (1.45 | ) | |
| Total distributions to shareholders | | | — | | | | (1.15 | ) | | | (3.66 | ) | | | (2.21 | ) | | | (1.45 | ) | |
| Increase from Regulatory Settlements | | | — | | | | — | (d) | | | — | | | | — | | | | — | | |
| Net Asset Value, End of Period | | $ | 13.10 | | | $ | 11.39 | | | $ | 13.94 | | | $ | 19.78 | | | $ | 19.53 | | |
| Total return (e) | | | 15.01 | % | | | (7.45 | )% | | | (12.90 | )% | | | 13.22 | % | | | 10.04 | %(f) | |
| Ratios to Average Net Assets/Supplemental Data: | |
| Net expenses before interest expense (g) | | | 1.35 | % | | | 1.38 | % | | | 1.30 | % | | | 1.26 | % | | | 1.21 | % | |
| Interest expense | | | — | | | | — | | | | — | | | | — | | | | — | %(h) | |
| Net expenses (g) | | | 1.35 | % | | | 1.38 | % | | | 1.30 | % | | | 1.26 | % | | | 1.21 | % | |
| Waiver/Reimbursement | | | — | | | | — | | | | — | | | | — | | | | — | %(h) | |
| Net investment income (loss) (g) | | | (0.42 | )% | | | (0.34 | )% | | | (0.63 | )% | | | 0.17 | % | | | (0.35 | )% | |
| Portfolio turnover rate | | | 26 | % | | | 11 | % | | | 25 | % | | | 44 | % | | | 14 | % | |
| Net assets, end of period (000s) | | $ | 73,960 | | | $ | 74,722 | | | $ | 98,299 | | | $ | 136,381 | | | $ | 135,538 | | |
(a) On August 8, 2007, Class G shares were converted to Class T shares.
(b) Per share data was calculated using the average shares outstanding during the period.
(c) Net investment income per share reflects a special dividend. The effect of this dividend amounted to $0.07 per share.
(d) Rounds to less than $0.01 per share.
(e) Total return at net asset value assuming all distributions reinvested and no initial sales charge or contingent deferred sales charge.
(f) Had the investment advisor and/or any of its affiliates not waived fees or reimbursed a portion of expenses, total return would have been reduced.
(g) The benefits derived from expense reductions had an impact of less than 0.01%.
(h) Rounds to less than 0.01%.
See Accompanying Notes to Financial Statements.
112
Financial Highlights – Columbia Small Cap Core Fund
Selected data for a share outstanding throughout the period is as follows:
| Class W Shares | | Period Ended
September 30,
2010 (a) | |
| Net Asset Value, Beginning of Period | | $ | 13.01 | | |
| Income from Investment Operations: | |
| Net investment income (b)(c) | | | — | | |
| Net realized and unrealized gain on investments | | | 0.31 | | |
| Total from investment operations | | | 0.31 | | |
| Net Asset Value, End of Period | | $ | 13.32 | | |
| Total return (d)(e) | | | 2.38 | % | |
| Ratios to Average Net Assets/Supplemental Data: | |
| Net expenses (f)(g) | | | 1.34 | % | |
| Net investment income (f)(g) | | | 1.69 | % | |
| Portfolio turnover rate (e) | | | 26 | % | |
| Net assets, end of period (000s) | | $ | 3 | | |
(a) Class W shares commenced operations on September 27, 2010. Per share data and total return reflect activity from that date.
(b) Per share data was calculated using the average shares outstanding during the period.
(c) Rounds to less than $0.01 per share.
(d) Total return at net asset value.
(e) Not annualized.
(f) The benefits derived from expense reductions had an impact of less than 0.01%.
(g) Annualized.
See Accompanying Notes to Financial Statements.
113
Financial Highlights – Columbia Small Cap Core Fund
Selected data for a share outstanding throughout each period is as follows:
| | | Year Ended September 30, | |
| Class Z Shares | | 2010 | | 2009 | | 2008 | | 2007 | | 2006 | |
| Net Asset Value, Beginning of Period | | $ | 11.87 | | | $ | 14.42 | | | $ | 20.33 | | | $ | 19.96 | | | $ | 19.54 | | |
| Income from Investment Operations: | |
| Net investment income (loss) (a) | | | (0.02 | ) | | | — | (b) | | | (0.04 | ) | | | 0.09 | (c) | | | (0.01 | ) | |
| Net realized and unrealized gain (loss) on investments | | | 1.84 | | | | (1.40 | ) | | | (2.15 | ) | | | 2.49 | | | | 1.93 | | |
| Total from investment operations | | | 1.82 | | | | (1.40 | ) | | | (2.19 | ) | | | 2.58 | | | | 1.92 | | |
| Less Distributions to Shareholders: | |
| From net investment income | | | — | | | | — | | | | (0.08 | ) | | | — | | | | — | | |
| From net realized gains | | | — | | | | (1.15 | ) | | | (3.64 | ) | | | (2.21 | ) | | | (1.50 | ) | |
| Total distributions to shareholders | | | — | | | | (1.15 | ) | | | (3.72 | ) | | | (2.21 | ) | | | (1.50 | ) | |
| Increase from regulatory settlements | | | — | | | | — | (b) | | | — | | | | — | | | | — | | |
| Net Asset Value, End of Period | | $ | 13.69 | | | $ | 11.87 | | | $ | 14.42 | | | $ | 20.33 | | | $ | 19.96 | | |
| Total return (d) | | | 15.33 | % | | | (7.18 | )% | | | (12.60 | )% | | | 13.56 | % | | | 10.32 | %(e) | |
| Ratios to Average Net Assets/Supplemental Data: | |
| Net expenses before interest expense (f) | | | 1.05 | % | | | 1.08 | % | | | 1.00 | % | | | 0.96 | % | | | 0.91 | % | |
| Interest expense | | | — | | | | — | | | | — | | | | — | | | | — | %(g) | |
| Net expenses (f) | | | 1.05 | % | | | 1.08 | % | | | 1.00 | % | | | 0.96 | % | | | 0.91 | % | |
| Waiver/Reimbursement | | | — | | | | — | | | | — | | | | — | | | | — | %(g) | |
| Net investment income (loss) (f) | | | (0.12 | )% | | | (0.04 | )% | | | (0.27 | )% | | | 0.46 | % | | | (0.05 | )% | |
| Portfolio turnover rate | | | 26 | % | | | 11 | % | | | 25 | % | | | 44 | % | | | 14 | % | |
| Net assets, end of period (000s) | | $ | 411,684 | | | $ | 353,117 | | | $ | 413,763 | | | $ | 834,537 | | | $ | 929,791 | | |
(a) Per share data was calculated using the average shares outstanding during the period.
(b) Rounds to less than $0.01 per share.
(c) Net investment income per share reflects a special dividend. The effect of this dividend amounted to $0.07 per share.
(d) Total return at net asset value assuming all distributions reinvested.
(e) Had the investment advisor and/or any of its affiliates not waived fees or reimbursed a portion of expenses, total return would have been reduced.
(f) The benefits derived from expense reductions had an impact of less than 0.01%.
(g) Rounds to less than 0.01%.
See Accompanying Notes to Financial Statements.
114
Notes to Financial Statements – Stock Funds
September 30, 2010
Note 1. Organization
Columbia Funds Series Trust I (the "Trust") is registered under the Investment Company Act of 1940, as amended (the "1940 Act"), as an open-end management investment company organized as a Massachusetts business trust. Information presented in these financial statements pertains to the following diversified series of the Trust funds (each, a "Fund" and collectively, the "Funds"):
Columbia Asset Allocation Fund
Columbia Large Cap Growth Fund
Columbia Disciplined Value Fund
Columbia Contrarian Core Fund
Columbia Small Cap Core Fund
Investment Objectives
Columbia Asset Allocation Fund seeks total return, consisting of current income and long-term capital appreciation. Columbia Large Cap Growth Fund and Columbia Small Cap Core Fund each seek long-term capital appreciation. Columbia Disciplined Value Fund seeks total return, consisting primarily of long-term capital appreciation and secondarily of current income. Columbia Contrarian Core Fund seeks total return, consisting of long-term capital appreciation and current income.
Fund Shares
The Trust may issue an unlimited number of shares, and each Fund offers the following classes of shares: Class A, Class B, Class C, Class T and Class Z. Columbia Large Cap Growth Fund also offers Class E, Class F, Class I, Class R, Class W and Class Y shares. Columbia Contrarian Core Fund also offers Class I, Class R and Class W shares. Columbia Small Cap Core Fund also offers Class I and Class W shares Effective September 27, 2010, Class I, Class R and Class W shares of Columbia Large Cap Growth Fund commenced operations. Also on that date, Class I, Class R and Class W shares of Columbia Contrarian Core Fund and Class I and Class W shares of Columbia Small Cap Core Fund commenced operations. Each share class has its own expense structure and sales charges, as applicable.
Columbia Large Cap Growth Fund is authorized to issue Class R4 and Class R5 shares and Columbia Contrarian Core Fund is authorized to issue Class R4 shares, however as of the date of this report these share classes are not offered for sale and have not commenced operations.
The Funds no longer accept investments by new or existing investors in the Funds' Class B shares, except in connection with the reinvestment of any dividend and/or capital gain distributions in Class B shares of each Fund and exchanges by existing Class B shareholders of the other Columbia Funds. Columbia Large Cap Growth Fund's Class E and Class F shares are closed to new investors and new accounts.
Class A, Class E and Class T shares are subject to a front-end sales charge based on the amount of initial investment. Class A and Class T shares purchased without an initial sales charge in accounts aggregating $1 million to $50 million at the time of purchase are subject to a maximum contingent deferred sales charge ("CDSC") of 1.00% based upon the holding period after purchase.
Class E shares purchased without an initial sales charge in accounts aggregating $1 million to $5 million at the time of purchase are subject to a 1.00% CDSC if the shares are sold within one year after purchase.
Class B and Class F shares are subject to a maximum CDSC of 5.00% based upon the holding period after purchase. Class B and Class F shares will generally convert to Class A and Class E shares, respectively, eight years after purchase.
Class C shares are subject to a 1.00% CDSC on shares sold within one year after purchase.
Class I, Class R, Class W, Class Y and Class Z shares are offered continuously at net asset value. There are certain restrictions on the purchase of these share classes, as described in each Fund's prospectus.
Note 2. Significant Accounting Policies
The preparation of financial statements in accordance with accounting principles generally accepted in the United States of America ("GAAP") requires management to make certain estimates and assumptions that affect the reported amounts of assets and liabilities, the disclosure of contingent assets and liabilities at the date of the financial statements and the reported amounts of revenue and expenses during the reporting period. Actual results could differ from those estimates.
115
Stock Funds, September 30, 2010 (continued)
Management has evaluated the events and transactions that have occurred through the date the financial statements were issued and, except as disclosed in Note 13, noted no items requiring adjustment of the financial statements or additional disclosures.
The following is a summary of significant accounting policies consistently followed by the Funds in the preparation of their financial statements.
Security Valuation
Debt securities generally are valued by pricing services approved by the Trust's Board of Trustees, based upon market transactions for normal, institutional-size trading units of similar securities. The services may use various pricing techniques which take into account appropriate factors such as yield, quality, coupon rate, maturity, type of issue, trading characteristics and other data, as well as broker quotes. Debt securities for which quotations are readily available may also be valued based upon an over-the-counter or exchange bid quotation.
Certain debt securities, which tend to be more thinly traded and of lesser quality, are priced based on fundamental analysis of the financial condition of the issuer and the estimated value of any collateral. Valuations developed through pricing techniques may vary from the actual amounts realized upon sale of the securities, and the potential variation may be greater for those securities valued using fundamental analysis.
Equity securities, exchange-traded funds and securities of certain investment companies are valued at the last sale price on the principal exchange on which they trade, except for securities traded on the NASDAQ, which are valued at the NASDAQ official close price. Unlisted securities or listed securities for which there were no sales during the day are valued at the closing bid price on such exchanges or over-the-counter markets.
Short-term investments maturing in 60 days or less are valued at amortized cost, which approximates market value.
Futures contracts are valued at the settlement price established each day by the board of trade or exchange on which they are traded.
Purchased options are valued at the last reported sale price, or in the absence of a sale, at the last quoted bid price. Written options are valued at the last reported sale price, or in the absence of a sale, at the last quoted ask price.
Forward foreign currency exchange contracts are valued at the prevailing forward exchange rate of the underlying currencies.
Foreign securities are generally valued at the last sale price on the foreign exchange or market on which they trade. If any foreign share prices are not readily available as a result of limited share activity, the securities are valued at the last sale price of the local shares in the principal market in which such securities are normally traded.
Generally, trading in foreign securities is substantially completed each day at various times prior to the close of the New York Stock Exchange ("NYSE"). The values of such securities used in computing the net asset value of the Funds' shares are determined as of such times. Foreign currency exchange rates are generally determined at 4:00 p.m. Eastern (U.S.) time. Occasionally, events affecting the values of such foreign securities and such exchange rates may occur between the times at which they are determined and the close of the customary trading session of the NYSE, which would not be reflected in the computation of the Funds' net asset values. If events materially affecting the values of such foreign securities occur and it is determined that market quotations are not reliable, then these foreign securities will be valued at their fair value using procedures approved by the Board of Trustees. Certain Funds may use a systema tic fair valuation model provided by an independent third party to value securities principally traded in foreign markets in order to adjust for possible stale pricing that may occur between the close of the foreign exchanges and the time for valuation.
Investments for which market quotations are not readily available, or that have quotations which management believes are not reliable, are valued at fair value as determined in good faith under consistently applied procedures established by and under the general supervision of the Board of Trustees. If a security is valued at fair value, such value is likely to be different from the last quoted market price for the security. The determination of fair value often requires significant judgment. To determine fair value, management may use assumptions including but not limited to future cash flows
116
Stock Funds, September 30, 2010 (continued)
and estimated risk premiums. Multiple inputs from various sources may be used to determine value.
GAAP establishes a hierarchy that prioritizes the inputs to valuation techniques used to measure fair value giving the highest priority to unadjusted quoted prices in active markets for identical securities (level 1 measurements) and the lowest priority to unobservable inputs (level 3 measurements) when market prices are not readily available or reliable. The three levels of the fair value hierarchy are described below:
• Level 1 – quoted prices in active markets for identical securities
• Level 2 – prices determined using other significant observable inputs (including quoted prices for similar securities, interest rates, prepayment speeds, credit risk and others)
• Level 3 – prices determined using significant unobservable inputs. In situations where quoted prices or observable inputs are unavailable or less reliable, unobservable inputs may be used. Unobservable inputs may include management's own assumptions about the factors market participants would use in pricing an investment.
The inputs or methodology used for valuing securities are not necessarily an indication of the risk associated with investing in those securities.
On January 21, 2010, the Financial Accounting Standards Board issued an Accounting Standards Update (the "amendment"), Fair Value Measurements and Disclosures (Topic 820): Improving Disclosures about Fair Value Measurements, which provides guidance on how investment assets and liabilities are to be valued and disclosed. Specifically, the amendment requires reporting entities to disclose the inputs and valuation techniques used to measure fair value for both recurring and nonrecurring fair value measurements for Level 2 and Level 3 positions. The amendment also requires that transfers between all levels (including Level 1 and Level 2) be disclosed on a gross basis (i.e., transfers out must be disclosed separately from transfers in), and requires disclosure of the reason(s) for sign ificant transfers. Additionally, purchases, sales, issuances and settlements must be disclosed on a gross basis in the Level 3 rollforward. The effective date of the amendment is for interim and annual periods beginning after December 15, 2009; except for the requirement to provide the Level 3 activity for purchases, sales, issuances and settlements on a gross basis, which will be effective for interim and annual periods beginning after December 15, 2010. At this time, management is evaluating the implications of the amendment and the impact to the financial statements.
Security Transactions
Security transactions are accounted for on the trade date. Cost is determined and gains (losses) are based upon the specific identification method for both financial statement and federal income tax purposes.
Derivative Instruments
Each Fund may invest in derivative instruments. For additional information on derivative instruments, please see Note 6.
Repurchase Agreements
Each Fund may engage in repurchase agreement transactions with institutions that that management has determined are creditworthy. Each Fund, through its custodian, receives delivery of the underlying securities collateralizing a repurchase agreement. Management is responsible for determining that the collateral is at least equal, at all times, to the value of the repurchase obligation including interest. A repurchase agreement transaction involves certain risks in the event of default or insolvency of the counterparty. These risks include possible delays in or restrictions on each Fund's ability to dispose of the underlying securities and a possible decline in the value of the underlying securities during the period while the Funds seek to assert their rights.
Delayed Delivery Securities
Each Fund may trade securities on other than normal settlement terms, including securities purchased or sold on a "when-issued" basis. This may increase the risk if the other party to the transaction fails to deliver and causes the Funds to subsequently invest at less advantageous prices. Each Fund identifies within its portfolio of investments cash or liquid securities in an amount equal to the delayed delivery commitment.
117
Stock Funds, September 30, 2010 (continued)
Treasury Inflation Protected Securities
Columbia Asset Allocation Fund may invest in treasury inflation protected securities ("TIPS"). The principal amount of TIPS is adjusted periodically and is increased for inflation or decreased for deflation based on a monthly published index. Interest payments are based on the adjusted principal at the time the interest is paid. These adjustments are recorded as interest income on the Statements of Operations.
Foreign Currency Transactions and Translations
The values of all assets and liabilities quoted in foreign currencies are translated into U.S. dollars at that day's exchange rates. Net realized and unrealized gains (losses) on foreign currency transactions and translations include gains (losses) arising from the fluctuation in exchange rates between trade and settlement dates on securities transactions, gains (losses) arising from the disposition of foreign currency and currency gains (losses) between the accrual and payment dates on dividends, interest income and foreign withholding taxes.
For financial statement purposes, the Funds do not distinguish that portion of gains (losses) on investments which is due to changes in foreign exchange rates from that which is due to changes in market prices of the investments. Such fluctuations are included with the net realized and unrealized gains (losses) on investments on the Statements of Operations.
Income Recognition
Interest income is recorded on the accrual basis. Premium and discount are amortized and accreted, respectively, on all debt securities, unless otherwise noted.
Corporate actions and dividend income are recorded on the ex-date except for certain foreign securities which are recorded as soon after the ex-date as the Funds become aware of such, net of any non-reclaimable tax withholdings.
Distributions received from real estate investment trusts (REITs) in excess of their income are recorded as a reduction of the cost of the related investments. If the Funds no longer own the applicable securities, any distributions received in excess of income are recorded as realized gains.
Awards from class action litigation are recorded as a reduction of cost if the Funds still own the applicable securities on the payment date. If the Funds no longer own the applicable securities, the proceeds are recorded as realized gains.
Expenses
General expenses of the Trust are allocated to the Funds and other series of the Trust based upon relative net assets or other expense allocation methodologies determined by the nature of the expense. Expenses directly attributable to a Fund are charged to such Fund. Expenses directly attributable to a specific class of shares are charged to that share class.
Determination of Class Net Asset Value
All income, expenses (other than class-specific expenses, as shown on the Statements of Operations) and realized and unrealized gains (losses) are allocated to each class of the Funds on a daily basis, based on the relative net assets of each class, for purposes of determining the net asset value of each class.
Federal Income Tax Status
Each Fund intends to qualify each year as a "regulated investment company" under Subchapter M of the Internal Revenue Code, as amended, and will distribute substantially all of its tax-exempt or taxable income, if any, for its tax year, and as such will not be subject to federal income taxes. In addition, each Fund intends to distribute in each calendar year substantially all of its net investment income, capital gains and certain other amounts, if any, such that each Fund should not be subject to federal excise tax. Therefore, no federal income or excise tax provision is recorded.
Distributions to Shareholders
Distributions from net investment income for Columbia Asset Allocation Fund and Columbia Disciplined Value Fund, if any, are declared and paid quarterly. Distributions from net investment income for Columbia Large Cap Growth Fund, Columbia Contrarian Core Fund and Columbia Small Cap Core Fund, if any, are declared and paid annually. Net realized capital gains, if any, are distributed at least annually for all Funds. Income distributions and capital gain distributions are determined in accordance with federal income tax regulations which may differ from GAAP.
118
Stock Funds, September 30, 2010 (continued)
Indemnification
In the normal course of business, each Fund enters into contracts that contain a variety of representations and warranties and which provide general indemnities. A Fund's maximum exposure under these arrangements is unknown because this would involve future claims against a Fund. Also, under the Trust's organizational documents and by contract, the Trustees and officers of the Trust are indemnified against certain liabilities that may arise out of actions relating to their duties to the Trust. However, based on experience, the Funds expect the risk of loss due to these representations, warranties and indemnities to be minimal.
Note 3. Federal Tax Information
The timing and character of income and capital gain distributions are determined in accordance with income tax regulations, which may differ from GAAP. Reclassifications are made to each Fund's capital accounts for permanent tax differences to reflect income and gains available for distribution (or available capital loss carryforwards) under income tax regulations.
For the year ended September 30, 2010, permanent book and tax basis differences resulting primarily from differing treatments for foreign currency transactions, expired capital loss carryforwards, market discount accretion/premium amortization on debt securities, REIT adjustments, proceeds from litigation settlements, passive foreign investment company ("PFIC") adjustments, reversal of net capital losses on a redemption-in-kind and paydown adjustments were identified and reclassified among the components of the Fund's net assets as follows:
| | | Undistributed/
(Overdistributed)
Net Investment
Income | | Accumulated
Net Realized Gain
(Loss) | | Paid-In Capital | |
| Columbia Asset Allocation Fund | | $ | 243,296 | | | $ | (243,294 | ) | | $ | (2 | ) | |
| Columbia Large Cap Growth Fund | | | 23,857 | | | | 92,626,324 | | | | (92,650,181 | ) | |
| Columbia Disciplined Value Fund | | | 4 | | | | 75,926 | | | | (75,930 | ) | |
| Columbia Contrarian Core Fund | | | 477 | | | | (477 | ) | | | — | | |
| Columbia Small Cap Core Fund | | | 1,074,530 | | | | (1 | ) | | | (1,074,529 | ) | |
Net investment income and net realized gains (losses), as disclosed on the Statements of Operations, and net assets were not affected by these reclassifications.
The tax character of distributions paid during the years ended September 30, 2010 and September 30, 2009 was as follows:
| | | September 30, 2010 | |
| | | Ordinary
Income* | | Long-term
Capital Gains | |
| Columbia Asset Allocation Fund | | $ | 4,590,042 | | | $ | — | | |
| Columbia Large Cap Growth Fund | | | 7,966,395 | | | | — | | |
| Columbia Disciplined Value Fund | | | 3,560,976 | | | | — | | |
| Columbia Contrarian Core Fund | | | 2,597,814 | | | | — | | |
| Columbia Small Cap Core Fund | | | — | | | | — | | |
119
Stock Funds, September 30, 2010 (continued)
| | | September 30, 2009 | |
| | | Ordinary
Income* | | Long-term
Capital Gains | |
| Columbia Asset Allocation Fund | | $ | 4,673,335 | | | $ | — | | |
| Columbia Large Cap Growth Fund | | | 3,097,329 | | | | — | | |
| Columbia Disciplined Value Fund | | | 5,792,142 | | | | — | | |
| Columbia Contrarian Core Fund | | | 2,862,875 | | | | — | | |
| Columbia Small Cap Core Fund | | | — | | | | 51,429,836 | | |
* For tax purposes short-term capital gain distributions, if any, are considered ordinary income distributions.
As of September 30, 2010, the components of distributable earnings on a tax basis were as follows:
| | | Undistributed
Ordinary Income | | Undistributed
Long-term
Capital Gains | | Net Unrealized
Appreciation* | |
| Columbia Asset Allocation Fund $ 459,679 | | $ | — | | | | $ | | | | 20,185,872 | | |
| Columbia Large Cap Growth Fund | | | 3,184,638 | | | | — | | | | 212,840,254 | | |
| Columbia Disciplined Value Fund | | | 268,407 | | | | — | | | | 28,081,549 | | |
| Columbia Contrarian Core Fund | | | 1,476,369 | | | | — | | | | 80,219,683 | | |
| Columbia Small Cap Core Fund | | | — | | | | — | | | | 41,914,191 | | |
* The differences between book-basis and tax-basis net unrealized appreciation/depreciation are primarily due to deferral of losses from wash sales and discount accretion/premium amortization on debt securities.
Unrealized appreciation and depreciation at September 30, 2010, based on cost of investments for federal income tax purposes, excluding any unrealized appreciation and depreciation from changes in the value of other assets and liabilities resulting from changes in exchange rates, were:
| | | Unrealized
Appreciation | | Unrealized
(Depreciation) | | Net Unrealized
Appreciation | |
| Columbia Asset Allocation Fund | | $ | 23,885,016 | | | $ | (3,699,144 | ) | | $ | 20,185,872 | | |
| Columbia Large Cap Growth Fund | | | 226,205,839 | | | | (13,365,585 | ) | | | 212,840,254 | | |
| Columbia Disciplined Value Fund | | | 30,916,269 | | | | (2,834,720 | ) | | | 28,081,549 | | |
| Columbia Contrarian Core Fund | | | 85,847,387 | | | | (5,627,704 | ) | | | 80,219,683 | | |
| Columbia Small Cap Core Fund | | | 140,711,101 | | | | (98,796,910 | ) | | | 41,914,191 | | |
120
Stock Funds, September 30, 2010 (continued)
The following capital loss carryforwards may be available to reduce taxable income arising from future net realized gains on investments, if any, to the extent permitted by the Internal Revenue Code:
| | | Year of Expiration | |
| | | 2011 | | 2017 | | 2018 | | Total | |
| Columbia Asset Allocation Fund | | $ | — | | | $ | 15,394,963 | | | $ | 16,050,883 | | | $ | 31,445,846 | | |
| Columbia Large Cap Growth Fund | | | 5,529,590 | | | | 101,274,621 | | | | 144,439,858 | | | | 251,244,069 | | |
| Columbia Disciplined Value Fund | | | — | | | | 57,648,687 | | | | 55,533,936 | | | | 113,182,623 | | |
| Columbia Contrarian Core Fund | | | — | | | | 9,193,513 | | | | — | | | | 9,193,513 | | |
| Columbia Small Cap Core Fund | | | — | | | | 6,883,381 | | | | 9,719,746 | | | | 16,603,127 | | |
Of the capital loss carryforwards attributable to Columbia Large Cap Growth Fund, $5,529,590 expiring September 30, 2011 remain from the merger with Columbia Growth Stock Fund.
Capital loss carryforwards were utilized and/or expired during the year ended September 30, 2010. Expired capital loss carryforwards are recorded as a reduction of paid-in capital. Capital loss carryforwards were utilized and/or expired were as follows:
| Columbia Asset Allocation Fund | | $ | — | | |
| Columbia Large Cap Growth Fund | | | 92,626,019 | | |
| Columbia Disciplined Value Fund | | | — | | |
| Columbia Contrarian Core Fund | | | 6,328,523 | | |
| Columbia Small Cap Core Fund | | | — | | |
Management is required to determine whether a tax position of the Funds is more likely than not to be sustained upon examination by the applicable taxing authority, including resolution of any related appeals or litigation processes, based on the technical merits of the position. The tax benefit to be recognized by each Fund is measured as the largest amount of benefit that is greater than fifty percent likely of being realized upon ultimate settlement. Management is not aware of any tax positions for which it is reasonably possible that the total amounts of unrecognized tax benefits will significantly change in the next twelve months. However, management's conclusions may be subject to review and adjustment at a later date based on factors including, but not limited to, new tax laws, regulations, and administrative interpretations (including relevant court decisions). The Funds' federal tax returns for the prior three fiscal ye ars remain subject to examination by the Internal Revenue Service.
Note 4. Fees and Compensation Paid to Affiliates
Investment Advisory Fee
After the close of business on April 30, 2010, Ameriprise Financial, Inc. ("Ameriprise Financial") acquired a portion of the asset management business of Columbia Management Group, LLC (the "Transaction"), including the business of managing the Funds. In connection with the closing of the Transaction (the "Closing"), RiverSource Investments, LLC, a wholly owned subsidiary of Ameriprise Financial, became the investment advisor of the Funds and subsequently changed its name to Columbia Management Investment Advisers, LLC
121
Stock Funds, September 30, 2010 (continued)
(the "New Advisor"). The New Advisor receives a monthly investment advisory fee based on each Fund's average daily net assets at the following annual rates:
| | | First
$200
Million | | $200 Million
to $500
Million | | $500 Million
to $1
Billion | | $1 Billion
to $1.5
Billion | | $1.5 Billion
to $2
Billion | | $2 Billion
to $3
Billion | | $3 Billion
to $6
Billion | | Over
$6 Billion | |
Columbia Asset
Allocation Fund | | | 0.650 | % | | | 0.650 | % | | | 0.600 | % | | | 0.550 | % | | | 0.500 | % | | | 0.500 | % | | | 0.480 | % | | | 0.460 | % | |
Columbia Large Cap
Growth Fund | | | 0.700 | % | | | 0.575 | % | | | 0.450 | % | | | 0.450 | % | | | 0.450 | % | | | 0.450 | % | | | 0.450 | % | | | 0.450 | % | |
Columbia Disciplined
Value Fund | | | 0.700 | % | | | 0.700 | % | | | 0.650 | % | | | 0.600 | % | | | 0.550 | % | | | 0.550 | % | | | 0.530 | % | | | 0.510 | % | |
Columbia Contrarian
Core Fund | | | 0.700 | % | | | 0.700 | % | | | 0.650 | % | | | 0.600 | % | | | 0.550 | % | | | 0.550 | % | | | 0.530 | % | | | 0.510 | % | |
Columbia Small Cap
Core Fund | | | 0.750 | % | | | 0.750 | % | | | 0.700 | % | | | 0.650 | % | | | 0.600 | % | | | 0.550 | % | | | 0.550 | % | | | 0.550 | % | |
Prior to the Closing, Columbia Management Advisors, LLC ("Columbia"), an indirect, wholly owned subsidiary of Bank of America Corporation ("BOA"), provided investment advisory services to the Funds under the same fee structure.
For the year ended September 30, 2010, the effective investment advisory fee rates for the Funds, as a percentage of each Fund's average daily net assets, were as follows:
| | | Effective
Fee Rate | |
| Columbia Asset Allocation Fund | | | 0.65 | % | |
| Columbia Large Cap Growth Fund | | | 0.52 | % | |
| Columbia Disciplined Value Fund | | | 0.70 | % | |
| Columbia Contrarian Core Fund | | | 0.70 | % | |
| Columbia Small Cap Core Fund | | | 0.74 | % | |
Administration Fee
Effective upon the Closing, the New Advisor became the administrator of the Funds under a new Administrative Services Agreement (the "Administrative Agreement"). Under the Administrative Agreement, the New Advisor provides administrative and other services to the Funds, including services previously performed under the Pricing and Bookkeeping Oversight and Services Agreement discussed below. The New Advisor receives a monthly administration fee from each Fund, except Columbia Large Cap Growth Fund, at the annual rate of 0.067% of each Fund's average daily net assets. The New Advisor receives a monthly administration fee from Columbia Large Cap Growth Fund at the annual rate of 0.050% of the Fund's average daily net assets. Prior to the Closing, Columbia provided administrative services to the Fund at the same fee rates.
Pricing and Bookkeeping Fees
Prior to the Closing, the Funds entered into a Financial Reporting Services Agreement (the "Financial Reporting Services Agreement") with State Street Bank and Trust Company ("State Street") and Columbia pursuant to which State Street provides financial reporting services to the Funds. The Funds also entered into an Accounting Services Agreement (collectively with the Financial Reporting Services Agreement, the "State Street Agreements") with State Street and Columbia pursuant to which State Street provides accounting services to the Funds. Upon the Closing, Columbia assigned and delegated its rights and obligations under the State Street Agreements to the New Advisor. Under the State Street Agreements, the Funds pay State Street an annual fee of $38,000 paid monthly plus an additional monthly fee based on an annualized percentage rate of average daily net assets of the Funds for the month. The aggregate fee will not exceed
122
Stock Funds, September 30, 2010 (continued)
$140,000 per year (exclusive of out-of-pocket expenses and charges). The Funds also reimburse State Street for certain out-of-pocket expenses and charges.
Also prior to the Closing, the Funds entered into a Pricing and Bookkeeping Oversight and Services Agreement (the "Services Agreement") with Columbia. Under the Services Agreement, Columbia provided services related to Fund expenses and the requirements of the Sarbanes-Oxley Act of 2002, and provided oversight of the accounting and financial reporting services provided by State Street. Under the Services Agreement, the Funds reimbursed Columbia for out-of-pocket expenses and charges, including fees payable to third parties, such as for pricing the Fund's portfolio securities, incurred by Columbia in the performance of services under the Services Agreement. These services are now provided under the Administrative Agreement discussed above.
Transfer Agent Fee
In connection with the Closing, RiverSource Service Corporation, a wholly owned subsidiary of Ameriprise Financial, became the transfer agent of the Funds and subsequently changed its name to Columbia Management Investment Services Corp. (the "New Transfer Agent"). The New Transfer Agent has contracted with Boston Financial Data Services ("BFDS") to serve as sub-transfer agent. The New Transfer Agent receives monthly account-based service fees based on the number of open accounts and asset-based fees, calculated based on assets held in omnibus accounts, which are intended to reimburse the New Transfer Agent for certain sub-transfer agent fees (exclusive of BFDS fees). The New Transfer Agent pays the fees of BFDS for services as sub-transfer agent and is not entitled to reimbursement for such fees from the Funds.
The New Transfer Agent may also retain, as additional compensation for its services, fees for wire, telephone and redemption orders, Individual Retirement Account ("IRA") trustee agent fees and account transcript fees due to the New Transfer Agent from shareholders of the Funds and credits (net of bank charges) earned with respect to balances in accounts the New Transfer Agent maintains in connection with its services to the Funds. The New Transfer Agent also receives reimbursement for certain out-of-pocket expenses.
Prior to the Closing, Columbia Management Services, Inc., an affiliate of Columbia and an indirect, wholly owned subsidiary of BOA, provided shareholder services to the Funds and contracted with BFDS to serve as sub-transfer agent, under the same fee structure.
For the year ended September 30, 2010, the funds' effective transfer agent fee rates of the Funds' average net assets were as follows:
| | | Class A | | Class B | | Class C | | Class E | | Class F | | Class R | | Class T | | Class W | | Class Y | | Class Z | |
Columbia Asset
Allocation Fund | | | 0.18 | % | | | 0.18 | % | | | 0.18 | % | | | — | | | | — | | | | — | | | | 0.18 | % | | | — | | | | — | | | | 0.18 | % | |
Columbia Large Cap
Growth Fund | | | 0.21 | % | | | 0.21 | % | | | 0.21 | % | | | 0.21 | % | | | 0.21 | % | | | 0.11 | % | | | 0.21 | % | | | 0.11 | % | | | 0.00 | %* | | | 0.21 | % | |
Columbia Disciplined
Value Fund | | | 0.11 | % | | | 0.11 | % | | | 0.11 | % | | | — | | | | — | | | | — | | | | 0.11 | % | | | — | | | | — | | | | 0.11 | % | |
Columbia Contrarian
Core Fund | | | 0.13 | % | | | 0.13 | % | | | 0.13 | % | | | — | | | | — | | | | 0.10 | % | | | 0.13 | % | | | 0.10 | % | | | — | | | | 0.13 | % | |
Columbia Small Cap
Core Fund | | | 0.17 | % | | | 0.17 | % | | | 0.17 | % | | | — | | | | — | | | | — | | | | 0.17 | % | | | 0.19 | % | | | — | | | | 0.17 | % | |
*Rounds to less than 0.01%.
123
Stock Funds, September 30, 2010 (continued)
Class I shares do not pay transfer agent fees.
An annual minimum account balance fee of $20 may apply to certain accounts with a value below each Fund's initial minimum investment requirements to reduce the impact of small accounts on transfer agent fees. These minimum account balance fees are recorded as part of expense reductions on the Statements of Operations. For the year ended September 30, 2010, no minimum account balance fees were charged by the Funds.
Underwriting Discounts, Service and Distribution Fees
In connection with the Closing, RiverSource Fund Distributors, Inc., an indirect wholly owned subsidiary of Ameriprise Financial, became the distributor of the Funds and subsequently changed its name to Columbia Management Investment Distributors, Inc. (the "New Distributor").
For the year ended September 30, 2010, initial sales charges paid by shareholders on the purchase of Class A, Class E and Class T shares and net CDSC fees paid by shareholders on certain redemptions of Class A, Class B and Class C shares were as follows:
| | | Front-End Sales Charge | | CDSC | |
| | | Class A | | Class E | | Class T | | Class A | | Class B | | Class C | | Class E | |
| Columbia Asset Allocation Fund | | $ | 4,497 | | | $ | — | | | $ | 1,836 | | | $ | — | | | $ | 2,598 | | | $ | 10 | | | $ | — | | |
| Columbia Large Cap Growth Fund | | | 10,453 | | | | 88 | | | | 4,898 | | | | 451 | | | | 19,269 | | | | 1,872 | | | | 598 | | |
| Columbia Disciplined Value Fund | | | 1,434 | | | | — | | | | 1,521 | | | | — | | | | 1,635 | | | | 266 | | | | — | | |
| Columbia Contrarian Core Fund | | | 47,594 | | | | — | | | | 1,978 | | | | 6 | | | | 3,157 | | | | 4,090 | | | | — | | |
| Columbia Small Cap Core Fund | | | 2,131 | | | | — | | | | — | | | | — | | | | 1,251 | | | | — | | | | — | | |
The Funds have adopted plans pursuant to Rule 12b-1 under the 1940 Act (the "Plans") which require the payment of monthly distribution and service fees to the New Distributor based on the average daily net assets of each Fund at the following annual rates:
| | | Distribution Fee | |
| | | Class A | | Class B | | Class C | | Class E | | Class F | | Class R | | Class W | |
| Columbia Asset Allocation Fund | | | 0.10 | % | | | 0.75 | % | | | 0.75 | % | | | — | | | | — | | | | — | | | | — | | |
| Columbia Large Cap Growth Fund | | | 0.10 | % | | | 0.75 | % | | | 0.75 | % | | | 0.10 | % | | | 0.75 | % | | | 0.50 | % | | | 0.25 | % | |
| Columbia Disciplined Value Fund | | | 0.10 | % | | | 0.75 | % | | | 0.75 | % | | | — | | | | — | | | | — | | | | — | | |
| Columbia Contrarian Core Fund | | | 0.10 | % | | | 0.75 | % | | | 0.75 | % | | | — | | | | — | | | | 0.50 | % | | | 0.25 | % | |
| Columbia Small Cap Core Fund | | | 0.10 | % | | | 0.75 | % | | | 0.75 | % | | | — | | | | — | | | | — | | | | 0.25 | % | |
124
Stock Funds, September 30, 2010 (continued)
| | | Service Fee | |
| | | Class A | | Class B | | Class C | | Class E | | Class F | | Class W | |
| Columbia Asset Allocation Fund | | | 0.25 | % | | | 0.25 | % | | | 0.25 | % | | | — | | | | — | | | | — | | |
| Columbia Large Cap Growth Fund | | | 0.25 | % | | | 0.25 | % | | | 0.25 | % | | | 0.25 | % | | | 0.25 | % | | | 0.25 | % | |
| Columbia Disciplined Value Fund | | | 0.25 | % | | | 0.25 | % | | | 0.25 | % | | | — | | | | — | | | | — | | |
| Columbia Contrarian Core Fund | | | 0.25 | % | | | 0.25 | % | | | 0.25 | % | | | — | | | | — | | | | 0.25 | % | |
| Columbia Small Cap Core Fund | | | 0.25 | % | | | 0.25 | % | | | 0.25 | % | | | — | | | | — | | | | 0.25 | % | |
The Funds may pay distribution and service (12b-1) fees at the maximum annual rate of 0.35% of each Fund's average daily net assets attributable to Class A shares (comprised of up to 0.10% for distribution services and up to 0.25% for shareholder services), but limited such fees to an aggregate of not more than 0.25% for Class A shares during the current fiscal year.
Columbia Contrarian Core Fund, Columbia Small Cap Core Fund and Columbia Large Cap Growth Fund may pay a distribution fee of up to 0.25% of each Fund's average daily net assets attributable to Class W shares and a service fee of up to 0.25% of each Fund's average daily net assets attributable to Class W shares, provided, however, that the aggregate fee shall not exceed 0.25% of each Fund's average daily net assets attributable to Class W shares. For the year ended September 30, 2010, the distribution and service fees were 0.00% and 0.25%, respectively, of each Fund's average daily net assets attributable to Class W.
The CDSC and the distribution fees received from the Plans are used principally as repayment to the New Distributor for amounts paid by the New Distributor to dealers who sold such shares.
Shareholder Services Fees
The Funds have adopted a shareholder services plan that permits them to pay for certain services provided to Class T shareholders by service organizations. The Funds may pay shareholder services fees of up to 0.25% of each Fund's average daily net assets attributable to Class T shares for shareholder liaison services and up to 0.25% of each Fund's average daily net assets attributable to Class T shares for administrative support services, provided, however, that the aggregate fee shall not exceed 0.30% of each Fund's average daily net assets attributable to Class T shares. For the year ended September 30, 2010, the shareholder services fee was 0.30% of each Fund's average daily net assets attributable to Class T shares.
Prior to the Closing, Columbia Management Distributors, Inc., an affiliate of Columbia and an indirect, wholly owned subsidiary of BOA, was the principal underwriter of the Funds' shares. There were no changes to the underwriting discount structure of the Funds or the service, distribution or shareholder services fee rates paid by the Funds as a result of the Transaction.
Fee Waivers and Expense Reimbursements
Effective September 27, 2010, the New Advisor has contractually agreed to reimburse a portion of Columbia Large Cap Growth Fund and Columbia Contrarian Core Fund expenses through September 30, 2011, so that each Fund's ordinary operating expenses (excluding any brokerage commissions, interest, taxes and extraordinary expenses, but including custodian charges relating to overdrafts, if any), after giving effect to any balance credits from each Fund's custodian, do not exceed the following annual rates, based on each Fund's average daily net assets. This expense arrangement may only be modified or amended with approval from all parties to such arrangements, including each Fund and the Advisor.
125
Stock Funds, September 30, 2010 (continued)
| | | Columbia
Large Cap
Growth Fund | | Columbia
Contrarian
Core Fund | |
| | | Annual Rates | |
| Class A | | | 1.25 | % | | | 1.19 | % | |
| Class B | | | 2.00 | % | | | 1.94 | % | |
| Class C | | | 2.00 | % | | | 1.94 | % | |
| Class E | | | 1.35 | % | | | N/A | | |
| Class F | | | 2.00 | % | | | N/A | | |
| Class I | | | 0.85 | % | | | 0.86 | % | |
| Class R | | | 1.50 | % | | | 1.44 | % | |
| Class T | | | 1.30 | % | | | 1.24 | % | |
| Class W | | | 1.25 | % | | | 1.19 | % | |
| Class Y | | | 1.00 | % | | | N/A | | |
| Class Z | | | 1.00 | % | | | 0.94 | % | |
Effective September 27, 2010, the New Advisor has voluntarily agreed to reimburse a portion of Columbia Small Cap Core Fund expenses so that ordinary operating expenses (excluding any brokerage commissions, interest, taxes and extraordinary expenses, but including custodian charges relating to overdrafts, if any), after giving effect to any balance credits from the Fund's custodian, do not exceed the annual rates of 1.35%, 2.10%, 2.10%, 0.96%, 1.40%, 1.35% and 1.10% of the Fund's average daily net assets attributable to Class A, Class B, Class C, Class I, Class T, Class W and Class Z shares, respectively, based on the Fund's average daily net assets. These arrangements may be modified or terminated by the New Advisor at any time.
From May 1, 2010 to September 26, 2010, the New Advisor had voluntarily agreed to reimburse a portion of Columbia Large Cap Growth Fund, Columbia Contrarian Core Fund and Columbia Small Cap Core Fund expenses so that ordinary operating expenses (excluding any distribution and service fees, brokerage commissions, interest, taxes and extraordinary expenses, but including custodian charges relating to overdrafts, if any), after giving effect to any balance credits from each Fund's custodian, did not exceed the following annual rates, based on each Fund's average daily net assets. Prior to May 1, 2010, Columbia voluntarily reimbursed a portion of each Fund's expenses in the same manner.
| Fund | | Annual Rates | |
| Columbia Large Cap Growth Fund | | | 1.00 | % | |
| Columbia Contrarian Core Fund | | | 0.94 | % | |
| Columbia Small Cap Core Fund | | | 1.10 | % | |
Effective May 1, 2010, the New Advisor has voluntarily agreed to reimburse a portion of Columbia Asset Allocation Fund and Columbia Disciplined Value Fund expenses so that ordinary operating expenses (excluding any distribution and service fees, brokerage commissions, interest, taxes and extraordinary expenses, but including custodian charges relating to overdrafts, if any), after giving effect to any balance credits from each Fund's custodian, do not exceed the following annual rates, based on each Fund's average daily net assets:
| Fund | | Annual Rates | |
| Columbia Asset Allocation Fund | | | 0.95 | % | |
| Columbia Disciplined Value Fund | | | 1.00 | % | |
These arrangements may be modified or terminated by the New Advisor at any time. Prior to May 1, 2010, Columbia voluntarily reimbursed a portion of each Fund's expenses in the same manner.
Fees Paid to Officers and Trustees
In connection with the Closing, all officers of the Funds are employees of the New Advisor or its affiliates and, with the exception of the Funds' Chief Compliance Officer, receive no compensation from the Funds. The Board of Trustees has appointed a Chief Compliance Officer to the Funds in accordance with federal securities regulations. The Funds, along with other affiliated funds, pay their pro-rata share of the expenses associated with the Chief Compliance Officer. Each Fund's expenses for the Chief Compliance Officer will not exceed $15,000 per year. Prior to the Closing, each Fund paid its pro-rata share of the expenses for the Chief Compliance Officer under the same fee structure.
The Trust's eligible Trustees may participate in a deferred compensation plan which may be terminated at any time. Obligations of the plan will be paid solely out of the Funds' assets.
126
Stock Funds, September 30, 2010 (continued)
Trustees are compensated for their services to the Funds, as set forth on the Statements of Operations. The Trust's eligible Trustees may participate in a deferred compensation plan which may be terminated at any time. Obligations of the plan will be paid solely out of the Funds' assets.
Other Related Party Transactions
Prior to the Closing, the Funds used one or more brokers that were affiliates of BOA in connection with the purchase and sale of their securities. Total brokerage commissions paid to affiliated brokers for the period prior to the Closing were as follows:
| | | Amount | |
| Columbia Asset Allocation Fund | | $ | 314 | | |
| Columbia Contrarian Core Fund | | | 5,007 | | |
| Columbia Small Cap Core Fund | | | 2,576 | | |
Note 5. Custody Credits
Each Fund has an agreement with its custodian bank under which custody fees may be reduced by balance credits. These credits are recorded as part of expense reductions on the Statements of Operations. The Funds could have invested a portion of the assets utilized in connection with the expense offset arrangement in an income-producing asset if they had not entered into such an agreement. For the year ended September 30, 2010, these custody credits reduced total expenses for the Funds as follows:
| | | Custody
Credits | |
| Columbia Asset Allocation Fund | | $ | 750 | | |
| Columbia Large Cap Growth Fund | | | 79 | | |
| Columbia Disciplined Value Fund | | | 5 | | |
| Columbia Contrarian Core Fund | | | 24 | | |
| Columbia Small Cap Core Fund | | | 64 | | |
Note 6. Objectives and Strategies for Investing in Derivative Instruments
Columbia Asset Allocation Fund and Columbia Disciplined Value Fund use derivatives instruments including futures contracts, options and forward contracts in order to meet their investment objectives. Each Fund employs strategies in differing combinations to permit it to increase, decrease or change the level of exposure to market risk factors. The achievement of any strategy relating to derivatives depends on an analysis of various risk factors, and if the strategies for the use of derivatives do not work as intended, each Fund may not achieve its investment objectives.
In pursuit of the Funds' investment objectives, the Funds are exposed to the following market risks, among others:
Equity risk: Equity risk relates to change in value of equity securities such as common stocks due to general market conditions such as real or perceived adverse economic conditions, changes in the general outlook for corporate earnings, or adverse investor sentiment. Equity securities generally have greater price volatility than fixed income securities.
Foreign exchange rate risk: Foreign exchange rate risk relates to the change in the U.S. dollar value of a security held that is denominated in a foreign currency. The U.S. dollar value of a foreign-currency-denominated security will decrease as the dollar appreciates against the currency, while the U.S. dollar value will increase as the dollar depreciates against the currency.
Interest rate risk: Interest rate risk relates to the fluctuation in value of fixed income securities because of the inverse relationship of price and yield. Fixed income securities generally will decline in value upon an increase in general interest rates and their value generally will increase upon a decline in general interest rates. Fixed income securities with longer durations tend to be more sensitive to changes in interest rates, usually making them more volatile than securities with shorter durations.
The following note provides more detailed information about each derivative type held by the Funds:
Foreign Forward Currency Exchange Contracts—Columbia Asset Allocation Fund entered into forward foreign currency exchange contracts to shift its investment exposure from one currency to another.
Forward foreign currency exchange contracts are agreements to exchange one currency for another at a future date at a specified price. These contracts are used to minimize the exposure to foreign exchange rate fluctuations during the
127
Stock Funds, September 30, 2010 (continued)
period between the trade and settlement dates of the contract. Contracts to buy generally are used to acquire exposure to foreign currencies, while contracts to sell are generally used to reduce the exposure to foreign exchange rate fluctuations. Forward foreign currency exchange contracts are valued daily at the current exchange rate of the underlying currency, resulting in unrealized gains (losses) which become realized at the time the forward foreign currency exchange contracts are closed or mature. Realized and unrealized gains (losses) arising from such transactions are included in net realized and unrealized gains (losses) on foreign currency transactions. The use of forward foreign currency exchange contracts does not eliminate fluctuations in the prices of the Fund's portfolio securities. While the maximum potential loss from such contracts is the aggregate face value in U.S. dollars at the time the contract was opened, exposure is typically limited to the change in value of the contract (in U.S. dollars) over the period it remains open. The Fund could also be exposed to risk that counterparties of the contracts may be unable to fulfill the terms of the contracts.
During the year ended September 30, 2010, Columbia Asset Allocation Fund entered into 20 forward foreign currency exchange contracts.
Futures Contracts—Columbia Asset Allocation Fund and Columbia Disciplined Value Fund entered into stock index futures contracts to equitize cash in order to maintain appropriate equity market exposure while keeping sufficient cash to accommodate daily redemptions. Columbia Asset Allocation Fund entered into interest rate futures contracts to manage the duration and yield curve exposure of the Fund versus the benchmark.
The use of futures contracts involves certain risks, which include, among others: (1) imperfect correlation between the price movement of the instruments and the underlying securities, (2) inability to close out positions due to differing trading hours, or the temporary absence of a liquid market, for either the instruments or the underlying securities, and (3) an inaccurate prediction of the future direction of interest rates by the Funds' investment advisor. In addition, upon entering into index futures contracts, the Fund bears risks which may include securities prices moving unexpectedly, in which case, the Fund may not achieve the anticipated benefits of the futures contracts and may realize a loss.
Upon entering into a futures contract, a Fund identifies within its portfolio of investments cash or securities in an amount sufficient to meet the initial margin requirement. Subsequent payments are made or received by a Fund equal to the daily change in the contract value and are recorded as variation margin receivable or payable and offset in unrealized gains or losses. A Fund recognizes a realized gain or loss when the contract is closed or expires.
Futures contracts involve, to varying degrees, risk of loss in excess of the variation margin disclosed on the Statements of Assets and Liabilities.
During the year ended September 30, 2010, Columbia Asset Allocation Fund entered into 141 futures contracts.
During the year ended September 30, 2010, Columbia Disciplined Value Fund entered into 335 futures contracts.
The Columbia Disciplined Value Fund did not have any open futures contracts at the end of the year.
Options—Columbia Asset Allocation Fund had written covered and purchased call options to neutralize the Fund's exposure to equity risk on underlying securities. Written covered call options and purchased call options become more valuable as the price of the underlying instruments depreciates and appreciates, respectively, relative to the strike price.
Writing put options tends to increase the Fund's exposure to the underlying instrument. When the Fund writes a call or put option, an amount equal to the premium received is recorded as a liability and subsequently marked-to-market to reflect the current value of the option written. Premiums received from writing options which expire are treated as realized gains. Premiums received from writing options which are exercised or closed are added to the proceeds or offset against the amounts paid on the underlying security transaction to determine the realized gain or loss. The Fund, as a writer of an option, has no control over whether the underlying security may be sold (call) or purchased (put) and as a result bears the market risk of an unfavorable change in the price of the security underlying the written option. There is the risk that the Fund may not be able to enter into a closing transaction because of an illiquid market. Th e Fund identifies within its portfolio of investments cash or liquid portfolio securities equal to the amount of the written options contract commitment.
128
Stock Funds, September 30, 2010 (continued)
The Fund may also purchase put and call options. Purchasing call options tends to increase the Fund's exposure to the underlying instrument. Purchasing put options tends to decrease the Fund's exposure to the underlying instrument. The Fund may pay a premium, which is included in the Fund's Statement of Assets and Liabilities as an investment and subsequently marked-to-market to reflect the current value of the option. The risk associated with purchasing put and call options is limited to the premium paid. Premiums paid for purchasing options which expire are treated as realized losses. Premiums paid for purchasing options which are exercised are added to the amounts paid (call) or offset against the proceeds (put) on the underlying security to determine the realized gain or loss. If the Fund enters into a closing transaction, the Fund will realize a gain or loss, depending on whether the proceeds from the closing transaction ar e greater or less than the cost of the option.
During the year ended September 30, 2010, Columbia Asset Allocation Fund entered into 1,039 written options contracts and 92 purchased options contracts.
The following table is a summary of the value of the Funds' derivative instruments as of September 30, 2010:
| | | | | Statement of Assts and Liabilities | |
| | | | | Fair Value of Derivative Instruments | |
| | | | | Assets | | Liabilities | |
| | | Risk | | Futures | | Call Options | | Unrealized
Appreciation
(Depreciation)
on Forward
Foreign
Currency
Exchange | | Futures | | Call Options | | Unrealized
Appreciation
(Depreciation)
on Forward
Foreign
Currency
Exchange | |
| Funds | | Exposure | | Contracts* | | Written | | Purchased** | | Contracts | | Contracts* | | Written | | Purchased | | Contracts | |
Columbia Asset
Allocation Fund | | Equity | | $ | — | | | $ | — | | | $ | 22,320 | | | $ | — | | | $ | — | | | $ | 8,801 | | | $ | — | | | $ | — | | |
Columbia Asset
Allocation Fund | | Interest
Rate | | | — | | | | — | | | | — | | | | — | | | | 17,625 | | | | — | | | | — | | | | — | | |
Columbia Asset
Allocation Fund | | Foreign
Exchange
Rate | | | — | | | | — | | | | — | | | | 98,839 | | | | — | | | | — | | | | — | | | | 49,148 | | |
Columbia Disciplined
Value Fund | | Equity | | | — | | | | — | | | | — | | | | — | | | | 7,733 | | | | — | | | | — | | | | — | | |
* Includes only the current day's variation margin.
** This amount is included in the Investments, at value on the Statement of Assets and Liabilities.
129
Stock Funds, September 30, 2010 (continued)
The effect of derivative instruments on the Statements of Operations for the year ended September 30, 2010:
| | | | | Amount of Realized Gain or (Loss)
on Derivatives Recognized in
Operations | | Change in Unrealized Appreciation
(Depreciation) on Derivatives
Recognized in Operations | |
| | | Risk | | Futures | | Call Options | | Forward
Foreign
Currency
Exchange | | Futures | | Call Options | | Forward
Foreign
Currency
Exchange | |
| Funds | | Exposure | | Contracts | | Written | | Purchased | | Contracts | | Contracts | | Written | | Purchased | | Contracts | |
Columbia Asset
Allocation Fund | |
Equity | | $ | — | | | $ | 10,428 | | | $ | — | | | $ | — | | | $ | — | | | $ | (3,627 | ) | | $ | 5,394 | | | $ | — | | |
Columbia Asset
Allocation Fund | | Interest
Rate | | | (203,068) | | | | — | | | | — | | | | — | | | | 48,811 | | | | — | | | | — | | | | — | | |
Columbia Asset
Allocation Fund | | Foreign
Exchange
Rate | | | — | | | | — | | | | — | | | | (65,020 | ) | | | — | | | | — | | | | — | | | | (32,894 | ) | |
Columbia Disciplined
Value Fund | | Equity | | | 782,385 | | | | — | | | | — | | | | — | | | | (27,918 | ) | | | — | | | | — | | | | — | | |
Note 7. Portfolio Information
For the year ended September 30, 2010, the cost of purchases and proceeds from sales of securities, excluding short-term obligations, for the Funds were as follows:
| | | U.S Government Securities | | Other Investment Securities | |
| | | Purchases | | Sales | | Purchases | | Sales | |
| Columbia Asset Allocation Fund | | $ | 44,751,258 | | | $ | 53,593,528 | | | $ | 180,310,137 | | | $ | 193,596,267 | | |
| Columbia Large Cap Growth Fund | | | — | | | | — | | | | 1,517,972,509 | | | | 1,720,340,682 | | |
| Columbia Disciplined Value Fund | | | — | | | | — | | | | 199,517,489 | | | | 293,420,985 | | |
| Columbia Contrarian Core Fund | | | — | | | | — | | | | 628,994,655 | | | | 467,205,283 | | |
| Columbia Small Cap Core Fund | | | — | | | | — | | | | 167,940,061 | | | | 147,386,910 | | |
130
Stock Funds, September 30, 2010 (continued)
Note 8. Regulatory Settlements
During the years ended September 30, 2010 and September 30, 2009, the following Funds received payments relating to certain regulatory settlements that the Funds had participated in during the respective periods. The payments have been included in "Increase from regulatory settlements" on the Statements of Changes in Net Assets. The payments were as follows:
| | | Year Ended
September 30, | |
| | | 2010 | | 2009 | |
| Columbia Asset Allocation Fund | | $ | 39 | | | $ | — | | |
| Columbia Large Cap Growth Fund | | | 24,162 | | | | 663,170 | | |
| Columbia Disciplined Value Fund | | | 4 | | | | — | | |
| Columbia Contrarian Core Fund | | | — | | | | 5,432 | | |
| Columbia Small Cap Core Fund | | | — | | | | 5,313 | | |
Note 9. Redemption-in-Kind
Sales of securities for the Columbia Disciplined Value Fund include the value of securities delivered through an in-kind redemption of certain fund shares on August 6, 2010. Any realized gain or loss on securities delivered through an in-kind redemption of fund shares is not taxable to the Fund. The value of securities and realized gain (loss) on securities delivered through in-kind redemption of fund shares aggregated $13,089,208 and $(73,911), respectively.
Note 10. Line of Credit
The Funds and other affiliated funds participate in a $280,000,000 committed, unsecured revolving line of credit provided by State Street. The maximum amount that may be borrowed by any fund is limited to the lesser of $200,000,000 and the Fund's borrowing limit set forth in the Fund's registration statement. Borrowings are available for short-term liquidity or temporary or emergency purposes.
Effective October 15, 2009, interest is charged to each participating fund based on the fund's borrowings at a rate per annum equal to the greater of the Federal Funds Rate plus 1.25% or the overnight LIBOR Rate plus 1.25%. In addition, a commitment fee of 0.15% per annum is accrued and apportioned among the participating funds pro rata based on their relative net assets.
Prior to October 15, 2009, interest was charged to each participating fund based on the fund's borrowings at a rate per annum equal to the greater of the Federal Funds Rate plus 0.50% or the overnight LIBOR Rate plus 0.50%. In addition, an annual operations agency fee of $20,000, an amendment fee of 0.02% and a commitment fee of 0.12% per annum were accrued and apportioned among the participating funds pro rata based on their relative net assets.
For the year ended September 30, 2010, the average daily loan balance outstanding on days where borrowing existed, and the weighted average interest rate of each Fund that borrowed were as follows:
| Fund | | Average Daily
Loan Balance
Outstanding on
Days Were
Borrowing
Existed | | Weighted
Average
Interest Rate | |
Columbia Large Cap
Growth Fund | | $ | 4,122,581 | | | | 1.447 | % | |
Columbia Disciplined
Value Fund | | | 3,400,000 | | | | 1.424 | | |
Note 11. Shareholder Concentration
As of September 30, 2010, certain shareholder accounts owned of record more than 10% of the outstanding shares of one or more of the Funds. The number of accounts and aggregate percentages of shares outstanding held therein are as follows:
| | | Number of
Accounts | | % of Shares
Outstanding
Held | |
Columbia Asset
Allocation Fund | | | 1 | | | | 23.4 | | |
Columbia Large Cap
Growth Fund | | | 1 | | | | 28.5 | | |
Columbia Disciplined
Value Fund | | | 2 | | | | 56.6 | | |
Columbia Contrarian
Core Fund | | | 1 | | | | 25.4 | | |
Columbia Small Cap
Core Fund | | | 2 | | | | 43.4 | | |
131
Stock Funds, September 30, 2010 (continued)
Subscription and redemption activity of these accounts may have a significant effect on the operations of the Funds.
Note 12. Significant Risks and Contingencies
Sector Focus Risk
Certain Funds may focus their investments in certain sectors, subjecting them to greater risk than a fund that is less focused.
High Yield Securities Risk
Columbia Asset Allocation Fund invests in high yield securities. Investing in high-yield securities may involve greater credit risk and considerations not typically associated with investing in U.S. Government bonds and other higher quality fixed income securities. These securities are non-investment grade securities, often referred to as "junk" bonds. Economic downturns may disrupt the high yield market and impair the ability of issuers to repay principal and interest. Also, an increase in interest rates would likely have an adverse impact on the value of such obligations. Moreover, high-yield securities may be less liquid to the extent that there is no established secondary market.
Foreign Securities Risk
There are certain additional risks involved when investing in foreign securities. These risks may involve foreign currency exchange rate fluctuations, adverse political and economic developments and the possible prevention of currency exchange or other foreign governmental laws or restrictions. In addition, the liquidity of foreign securities may be more limited than that of domestic securities.
Investments in emerging market countries are subject to additional risk. The risk of foreign investments is typically increased in less developed countries. These countries are also more likely to experience high levels of inflation, deflation or currency devaluation which could hurt their economies and securities markets.
Asset-Backed Securities Risk
Columbia Asset Allocation Fund invests in asset-backed securities. The value of asset-backed securities may be affected by, among other factors, changes in interest rates, the market's assessment of the quality of underlying assets, the creditworthiness of the servicer for the underlying assets, factors concerning the interests in and structure of the issuer or the originator of the underlying assets, or the creditworthiness or rating of the entities that provide any supporting letters of credit, surety bonds, derivative instruments, or other credit enhancement. The value of asset-backed securities also will be affected by the exhaustion, termination or expiration of any credit enhancement. Most asset-backed securities are subject to prepayment risk, which is the possibility that the underlying debt may be refinanced or prepaid prior to maturity during periods of declining or low interest rates, causing the Fund to have to reinv est the money received in securities that have lower yields. In addition, the impact of prepayments on the value of asset-backed securities may be difficult to predict and may result in greater volatility.
Mortgage-Backed Securities Risk
The value of mortgage-backed securities may be affected by, among other things, changes in interest rates, factors concerning the interests in and structure of the issuer or the originator of the mortgages, the creditworthiness of the entities that provide any supporting letters of credit, surety bonds or other credit enhancements or the quality of underlying assets or the market's assessment thereof. Mortgage-backed securities are subject to prepayment risk, which is the possibility that the underlying mortgage may be refinanced or prepaid prior to maturity during periods of declining or low interest rates, causing the Fund to have to reinvest the money received in securities that have lower yields. In addition, the impact of prepayments on the value of mortgage-backed securities may be difficult to predict and may result in greater volatility.
Information Regarding Pending and Settled Legal Proceedings
In June 2004, an action captioned John E. Gallus et al. v. American Express Financial Corp. and American Express Financial Advisors Inc. was filed in the United States District Court for the District of Arizona. The plaintiffs allege that they are investors in several American Express Company (now known as legacy RiverSource) mutual funds and they purport to bring the action derivatively on behalf of those funds under the Investment Company Act of 1940. The plaintiffs allege that fees allegedly paid to the defendants by the funds for investment advisory and administrative services are excessive.
132
Stock Funds, September 30, 2010 (continued)
The plaintiffs seek remedies including restitution and rescission of investment advisory and distribution agreements. The plaintiffs voluntarily agreed to transfer this case to the United States District Court for the District of Minnesota (the District Court). In response to defendants' motion to dismiss the complaint, the District Court dismissed one of plaintiffs' four claims and granted plaintiffs limited discovery. Defendants moved for summary judgment in April 2007. Summary judgment was granted in the defendants' favor on July 9, 2007. The plaintiffs filed a notice of appeal with the Eighth Circuit Court of Appeals (the Eighth Circuit) on August 8, 2007. On April 8, 2009, the Eighth Circuit reversed summary judgment and remanded to the District Court for further proceedings. On August 6, 2009, defendants filed a writ of certiorari with the U.S. Supreme Court (the Supreme Court), asking the Supreme Court to stay the Distric t Court proceedings while the Supreme Court considered and rules in a case captioned Jones v. Harris Associates, which involved issues of law similar to those presented in the Gallus case. On March 30, 2010, the Supreme Court issued its ruling in Jones v. Harris Associates, and on April 5, 2010, the Supreme Court vacated the Eighth Circuit's decision in the Gallus case and remanded the case to the Eighth Circuit for further consideration in light of the Supreme Court's decision in Jones v. Harris Associates. On June 4, 2010, the Eighth Circuit remanded the Gallus case to the District Court for further consideration in light of the Supreme Court's decision in Jones v. Harris Associates.
In December 2005, without admitting or denying the allegations, American Express Financial Corporation (AEFC, which is now known as Ameriprise Financial, Inc. (Ameriprise Financial)), entered into settlement agreements with the Securities and Exchange Commission (SEC) and Minnesota Department of Commerce (MDOC) related to market timing activities. As a result, AEFC was censured and ordered to cease and desist from committing or causing any violations of certain provisions of the Investment Advisers Act of 1940, the Investment Company Act of 1940, and various Minnesota laws. AEFC agreed to pay disgorgement of $10 million and civil money penalties of $7 million. AEFC also agreed to retain an independent distribution consultant to assist in developing a plan for distribution of all disgorgement and civil penalties ordered by the SEC in accordance with various undertakings detailed at http://www.sec.gov/litigation/admin/ia-2451.pdf. Ameriprise Financial and its affiliates have cooperated with the SEC and the MDOC in these legal proceedings, and have made regular reports to the funds' Boards of Directors/Trustees.
Ameriprise Financial and certain of its affiliates have historically been involved in a number of legal, arbitration and regulatory proceedings, including routine litigation, class actions, and governmental actions, concerning matters arising in connection with the conduct of their business activities. Ameriprise Financial believes that the Funds are not currently the subject of, and that neither Ameriprise Financial nor any of its affiliates are the subject of, any pending legal, arbitration or regulatory proceedings that are likely to have a material adverse effect on the Funds or the ability of Ameriprise Financial or its affiliates to perform under their contracts with the Funds. Ameriprise Financial is required to make 10-Q, 10-K and, as necessary, 8-K filings with the Securities and Exchange Commission on legal and regulatory matters that relate to Ameriprise Financial and its affiliates. Copies of these filings may be obt ained by accessing the SEC website at www.sec.gov.
There can be no assurance that these matters, or the adverse publicity associated with them, will not result in increased fund redemptions, reduced sale of fund shares or other adverse consequences to the Funds. Further, although we believe proceedings are not likely to have a material adverse effect on the Funds or the ability of Ameriprise Financial or its affiliates to perform under their contracts with the Funds, these proceedings are subject to uncertainties and, as such, we are unable to estimate the possible loss or range of loss that may result. An adverse outcome in one or more of these proceedings could result in adverse judgments, settlements, fines, penalties or other relief that could have a material adverse effect on the consolidated financial condition or results of operations of Ameriprise Financial.
Note 13. Subsequent Events
The Board of Trustees has approved a proposal to merge Columbia Asset Allocation Fund into Columbia LifeGoal Balanced Growth Portfolio and Columbia Disciplined Value Fund into Columbia Large Value Quantitative Fund (formerly known as RiverSource Disciplined Large Cap Value Fund). Shareholders of Columbia Asset Allocation Fund and Columbia Disciplined Value Fund will vote on each respective
133
Stock Funds, September 30, 2010 (continued)
proposed merger at a Special Meeting of Shareholders to be held during the first half of 2011.
Effective October 22, 2010, Columbia Asset Allocation Fund transitioned to a fund-of-fund structure, which means the Fund will seek to achieve its objective by investing primarily in shares of mutual funds managed by the New Advisor or its affiliates (Columbia Funds). Columbia Asset Allocation Fund may also invest in exchange-traded funds and third party-advised funds, equity and fixed income securities, including Treasury inflation protected securities, and other instruments such as derivatives.
Effective October 22, 2010, the New Advisor has contractually agreed to waive a portion of its advisory fee for Columbia Asset Allocation Fund through January 31, 2012 so that the effective advisory fee rate will be a blend of (i) 0.00% on assets invested in other Columbia Funds, exchange-traded funds or third party mutual funds, and (ii) 0.65% on other assets.
In addition, effective October 22, 2010, the New Advisor has contractually agreed to bear a portion of the Columbia Asset Allocation Fund's expenses, through January 31, 2012, so that the Fund's ordinary operating expenses (excluding any brokerage commissions, interest, taxes, extraordinary expenses, acquired fund fees and expenses and certain advisory fees, but including custodian charges relating to overdrafts, if any), after giving effect to any balance credits from the Fund's custodian, do not exceed the annual rates of 0.51%, 1.26%, 1.26%, 0.56% and 0.26% of Columbia Asset Allocation Fund's average daily net assets attributable to Class A, Class B, Class C, Class T and Class Z shares, respectively.
Effective October 14, 2010, the line of credit disclosed in Note 10 was extended. Interest on the $280,000,000 committed, unsecured revolving line of credit provided by State Street will continue to be charged at a rate per annum equal to the greater of the Federal Funds Rate plus 1.25% or the overnight LIBOR Rate plus 1.25%. The commitment fee has been decreased from 0.15% per annum to 0.125% per annum and will continue to be accrued and apportioned among the participating funds pro rata based on their relative net assets.
134
Report of Independent Registered Public Accounting Firm
To the Trustees and the Shareholders of Columbia Funds Series Trust I
In our opinion, the accompanying statements of assets and liabilities, including the investment portfolios, and the related statements of operations and of changes in net assets and the financial highlights present fairly, in all material respects, the financial position of Columbia Asset Allocation Fund, Columbia Large Cap Growth Fund, Columbia Disciplined Value Fund, Columbia Contrarian Core Fund, and Columbia Small Cap Core Fund (the "Funds") (constituting part of Columbia Funds Series Trust I) at September 30, 2010, the results of each of their operations for the year then ended, the changes in each of their net assets for each of the two years in the period then ended, and the financial highlights for each of the periods indicated in conformity with accounting principles generally accepted in the United States of America. These financial statements and financial highlights (hereafter referred to as "financial statements") a re the responsibility of the Funds' management. Our responsibility is to express an opinion on these financial statements based on our audits. We conducted our audits of these financial statements in accordance with the standards of the Public Company Accounting Oversight Board (United States). Those standards require that we plan and perform the audit to obtain reasonable assurance about whether the financial statements are free of material misstatement. An audit includes examining, on a test basis, evidence supporting the amounts and disclosures in the financial statements, assessing the accounting principles used and significant estimates made by management, and evaluating the overall financial statement presentation. We believe that our audits, which included confirmation of securities at September 30, 2010 by correspondence with the custodian and brokers, provide a reasonable basis for our opinion.
PricewaterhouseCoopers LLP
Boston, Massachusetts
November 19, 2010
135
Federal Income Tax Information (Unaudited) – Stock Funds
Columbia Asset Allocation Fund
For non-corporate shareholders 45.07% or the maximum amount allowable under the Jobs and Growth Tax Relief Reconciliation Act of 2003, of the ordinary income distributed by the Fund for the fiscal year ended September 30, 2010 may represent qualified dividend income.
31.66% of the ordinary income distributed by the Fund, for the fiscal year ended September 30, 2010, qualifies for the corporate dividends received deduction.
The Fund will notify shareholders in January 2011 of amounts for use in preparing 2010 income tax returns.
Columbia Large Cap Growth Fund
For non-corporate shareholders 100.00% or the maximum amount allowable under the Jobs and Growth Tax Relief Reconciliation Act of 2003, of the ordinary income distributed by the Fund for the fiscal year ended September 30, 2010 may represent qualified dividend income.
100.00% of the ordinary income distributed by the Fund, for the fiscal year ended September 30, 2010, qualifies for the corporate dividends received deduction.
The Fund will notify shareholders in January 2011 of amounts for use in preparing 2010 income tax returns.
Columbia Disciplined Value Fund
For non-corporate shareholders 100.00% or the maximum amount allowable under the Jobs and Growth Tax Relief Reconciliation Act of 2003, of the ordinary income distributed by the Fund for the fiscal year ended September 30, 2010 may represent qualified dividend income.
100.00% of the ordinary income distributed by the Fund, for the fiscal year ended September 30, 2010, qualifies for the corporate dividends received deduction.
The Fund will notify shareholders in January 2011 of amounts for use in preparing 2010 income tax returns.
Columbia Contrarian Core Fund
For non-corporate shareholders 100.00% or the maximum amount allowable under the Jobs and Growth Tax Relief Reconciliation Act of 2003, of the ordinary income distributed by the Fund for the fiscal year ended September 30, 2010 may represent qualified dividend income.
100.00% of the ordinary income distributed by the Fund, for the fiscal year ended September 30, 2010, qualifies for the corporate dividends received deduction.
The Fund will notify shareholders in January 2011 of amounts for use in preparing 2010 income tax returns.
136
Fund Governance
The Trustees serve terms of indefinite duration. The names, addresses and birth years of the Trustees and Officers of the Funds in the Columbia Funds Series Trust I, the year each was first elected or appointed to office, their principal business occupations during at least the last five years, the number of Funds overseen by each Trustee and other directorships they hold are shown below. Each officer listed below serves as an officer of each Fund in the Columbia Funds Complex.
Independent Trustees
Name, Address and Year of Birth,
Position with Funds, Year First
Elected or Appointed to Office | | Principal Occupation(s) During Past Five Years, Number of Funds in Columbia
Funds Complex Overseen by Trustee, Other Directorships Held
| |
| John D. Collins (Born 1938) | |
|
c/o Columbia Management
Investment Advisers, LLC
One Financial Center
Boston, MA 02111
Trustee (since 2005) | | Retired. Consultant, KPMG, LLP (accounting and tax firm) from July 1999 to June 2000; Partner, KPMG, LLP from March 1962 to June 1999. Oversees 64; Mrs. Fields Original Cookies, Inc. (consumer products); Suburban Propane Partners, L.P.; and Montpelier Re (insurance underwriting firm) | |
|
| Rodman L. Drake (Born 1943) | |
|
c/o Columbia Management
Investment Advisers, LLC
One Financial Center
Boston, MA 02111
Trustee (since 1994) and Chairman of the Board (since 2009) | | Co-Founder of Baringo Capital LLC (private equity) since 2002; CEO of Crystal River Capital, Inc. (real estate investment trust) since 2003; President, Continuation Investments Group, Inc. from 1997 to 2001. Oversees 64; Jackson Hewitt Tax Service Inc. (tax preparation services); Crystal Capital River, Inc. (real estate investment trust); Student Loan Corporation (student loan provider); Celgene Corporation (global biotechnology company); The Helios Funds (exchange-traded funds); and Apex Silver Mines Ltd. from 2007 to 2009 | |
|
| Douglas A. Hacker (Born 1955) | |
|
c/o Columbia Management
Investment Advisers, LLC
One Financial Center
Boston, MA 02111
Trustee (since 1996) | | Independent business executive since May 2006; Executive Vice President—Strategy of United Airlines (airline) from December 2002 to May 2006; President of UAL Loyalty Services (airline marketing company) from September 2001 to December 2002; Executive Vice President and Chief Financial Officer of United Airlines from July 1999 to September 2001. Oversees 64; Nash Finch Company (food distributor); Aircastle Limited (aircraft leasing) | |
|
| Janet Langford Kelly (Born 1957) | |
|
c/o Columbia Management
Investment Advisers, LLC
One Financial Center
Boston, MA 02111
Trustee (since 1996) | | Senior Vice President, General Counsel and Corporate Secretary, ConocoPhillips (integrated energy company) since September 2007; Deputy General Counsel—Corporate Legal Services, ConocoPhillips from August 2006 to August 2007; Partner, Zelle, Hofmann, Voelbel, Mason & Gette LLP (law firm) from March 2005 to July 2006; Adjunct Professor of Law, Northwestern University, from September 2004 to June 2006; Director, UAL Corporation (airline) from February 2006 to July 2006; Oversees 64; None | |
|
| Charles R. Nelson (Born 1942) | |
|
c/o Columbia Management
Investment Advisers, LLC
One Financial Center
Boston, MA 02111
Trustee (since 1981) | | Professor of Economics, University of Washington, since January 1976; Ford and Louisa Van Voorhis Professor of Political Economy, University of Washington, since September 1993; Adjunct Professor of Statistics, University of Washington, since September 1980; Associate Editor, Journal of Money Credit and Banking, 1993-2008; Consultant on econometric and statistical matters. Oversees 64; None | |
|
137
Fund Governance (continued)
Independent Trustees (continued)
Name, Address and Year of Birth,
Position with Funds, Year First
Elected or Appointed to Office | | Principal Occupation(s) During Past Five Years, Number of Funds in Columbia
Funds Complex Overseen by Trustee, Other Directorships Held
| |
| John J. Neuhauser (Born 1943) | |
|
c/o Columbia Management
Investment Advisers, LLC
One Financial Center
Boston, MA 02111
Trustee (since 1984) | | President, Saint Michael's College, since August 2007; Director or Trustee of several non-profit organizations, including Fletcher Allen Health Care, Inc.; University Professor, Boston College from November 2005 to August 2007; Academic Vice President and Dean of Faculties, Boston College from August 1999 to October 2005. Oversees 64; Liberty All-Star Equity Fund and Liberty All-Star Growth Fund, Inc. (closed-end funds) | |
|
| Jonathan Piel (Born 1938) | |
|
c/o Columbia Management
Investment Advisers, LLC
One Financial Center
Boston, MA 02111
Trustee (since 1994) | | Cable television producer and website designer; The Editor, Scientific American from 1984 to 1994; Vice President, Scientific American, Inc., from 1984 to 1994; Member, Advisory Board, Stone Age Institute, Bloomington, Indiana (research institute that explores the effect of technology on human evolution); Member, Board of Directors of the National Institute of Social Sciences, New York City; Member, Board of Trustees of the William Alanson White Institute, New York City (institution for training psychoanalysts); and Member, Advisory Board, Mount Sinai Children's Environmental Health Center, New York. Oversees 64; None | |
|
| Patrick J. Simpson (Born 1944) | |
|
c/o Columbia Management
Investment Advisers, LLC
One Financial Center
Boston, MA 02111
Trustee (since 2000) | | Partner, Perkins Coie LLP (law firm). Oversees 64; None | |
|
| Anne-Lee Verville (Born 1945) | |
|
c/o Columbia Management
Investment Advisers, LLC
One Financial Center
Boston, MA 02111
Trustee (since 1998) | | Retired since 1997 (formerly General Manager–Global Education Industry from 1994 to 1997, President–Application Systems Division from 1991 to 1994, Chief Financial Officer–US Marketing & Services from 1988 to 1991, and Chief Information Officer from 1987 to 1988, IBM Corporation (computer and technology)). Oversees 64; Enesco Group, Inc. (producer of giftware and home and garden decor products) from 2001 to 2006 | |
|
138
Fund Governance (continued)
Interested Trustee
Name, Address and Year of Birth,
Position with Funds, Year First
Elected or Appointed to Office | | Principal Occupation(s) During Past Five Years, Number of Funds in Columbia
Funds Complex Overseen by Trustee, Other Directorships Held
| |
| William E. Mayer1 (Born 1940) | |
|
c/o Columbia Management
Investment Advisers, LLC
One Financial Center
Boston, MA 02111
Trustee (since 1994) | | Partner, Park Avenue Equity Partners (private equity) since February 1999; Dean and Professor, College of Business and Management, University of Maryland from 1992 to 1996. Oversees 64; DynaVox Inc. (software developer); Lee Enterprises (print media); WR Hambrecht + Co. (financial service provider); BlackRock Kelso Capital Corporation (investment company) | |
|
1 Mr. Mayer may technically be an "interested person" (as defined in the Investment Company Act of 1940) by reason of his affiliation with WR Hambrecht + Co., a registered broker/dealer that may execute portfolio transactions for, engage in principal transactions with or distribute shares of a Fund or other funds or accounts advised/managed by the Adviser or any sub-adviser to a Fund.
The Statement of Additional Information includes additional information about the Trustees of the Funds and is available, without charge, upon request by calling 1-800-345-6611.
Officers
| Name, Year of Birth and Address | | Principal Occupation(s) During the Past Five Years | |
| J. Kevin Connaughton (Born 1964) | |
|
One Financial Center
Boston, MA 02111
President (since 2009) | | Senior Vice President and General Manager–Mutual Fund Products, Columbia Management Investment Advisers, LLC since May 2010; President, Columbia Funds, since 2009, and RiverSource Funds, since May 2010 (previously Senior Vice President and Chief Financial Officer, Columbia Funds, from June 2008 to January 2009, Treasurer, Columbia Funds, from October 2003 to May 2008, and senior officer of various other affiliated funds since 2000); Managing Director, Columbia Management Advisors, LLC from December 2004 to April 2010. | |
|
| Michael G. Clarke (Born 1969) | |
|
One Financial Center
Boston, MA 02111
Senior Vice President and Chief
Financial Officer (since 2009) | | Vice President, Columbia Management Investment Advisers, LLC since May 2010; Managing Director of Fund Administration, Columbia Management Advisors, LLC, from September 2004 to April 2010; senior officer of Columbia Funds and affiliated funds since 2002. | |
|
| Scott R. Plummer (Born 1959) | |
|
5228 Ameriprise Financial Center
Minneapolis, MN 55474
Senior Vice President, Secretary
and Chief Legal Officer (since 2010) | | Chief Legal Officer and Assistant Secretary, Columbia Management Investment Advisers, LLC since June 2005; Vice President and Lead Chief Counsel–Asset Management, Ameriprise Financial, Inc. since May 2010 (previously Vice President and Chief Counsel–Asset Management, from 2005 to April 2010, and Vice President–Asset Management Compliance from 2004 to 2005); Vice President, Chief Counsel and Assistant Secretary, Columbia Management Investment Distributors, Inc. since 2008; Vice President, General Counsel and Secretary, Ameriprise Certificate Company since 2005; Chief Counsel, RiverSource Distributors, Inc. since 2006; Vice President, General Counsel and Secretary, RiverSource Funds, since December 2006; Senior Vice President, Secretary and Chief Legal Officer, Columbia Funds, since May 2010. | |
|
139
Fund Governance (continued)
Officers (continued)
| Name, Year of Birth and Address | | Principal Occupation(s) During the Past Five Years | |
| Linda J. Wondrack (Born 1964) | |
|
One Financial Center
Boston, MA 02111
Senior Vice President and Chief
Compliance Officer (since 2007) | | Vice President and Chief Compliance Officer, Columbia Management Investment Advisers, LLC since May 2010; Chief Compliance Officer, Columbia Funds, since 2007, and RiverSource Funds, since May 2010; Director (Columbia Management Group, LLC and Investment Product Group Compliance), Bank of America, from June 2005 to April 2010; Director of Corporate Compliance and Conflicts Officer of MFS Investment Management (investment management) from August 2004 to May 2005. | |
|
| William F. Truscott (Born 1960) | |
|
53600 Ameriprise Financial Center
Minneapolis, MN 55474
Senior Vice President (since 2010) | | Chairman of the Board, Columbia Management Investment Advisers, LLC since May 2010 (previously President, Chairman of the Board and Chief Investment Officer, from 2001 to April 2010); Chief Executive Officer, U.S. Asset Management & President, Annuities, Ameriprise Financial, Inc. since May 2010 (previously President–U.S. Asset Management and Chief Investment Officer from 2005 to April 2010, and Senior Vice President—Chief Investment Officer, from 2001 to 2005); Director, President and Chief Executive Officer, Ameriprise Certificate Company since 2006; Director, Columbia Management Investment Distributors, Inc. since May 2010 (previously Chairman of the Board and Chief Executive Officer from 2008 to April 2010); Chairman of the Board and Chief Executive Officer, RiverSource Distributors, Inc. since 2006. | |
|
| Colin Moore (Born 1958) | |
|
One Financial Center
Boston, MA 02111
Senior Vice President (since 2010) | | Director and Chief Investment Officer, Columbia Management Investment Advisers, LLC since May 2010; Manager, Managing Director and Chief Investment Officer of Columbia Management Advisors, LLC from 2007 to April 2010; Head of Equities, Columbia Management Advisors, LLC from 2002 to 2007. | |
|
| Michael A. Jones (Born 1959) | |
|
100 Federal Street
Boston, MA 02110
Senior Vice President (since 2010) | | Director and President, Columbia Management Investment Advisers, LLC since May 2010; President and Director, Columbia Management Investment Distributors, Inc. since May 2010; Manager, Chairman, Chief Executive Officer and President, Columbia Management Advisors, LLC from 2007 to April 2010; Chief Executive Officer, President and Director, Columbia Management Distributors, Inc. from November 2006 to April 2010; previously, co-president and senior managing director at Robeco Investment Management. | |
|
| Amy Johnson (Born 1965) | |
|
5228 Ameriprise Financial Center
Minneapolis, MN 55474
Senior Vice President (since 2010) | | Senior Vice President and Chief Operating Officer, Columbia Management Investment Advisers, LLC since May 2010 (previously Chief Administrative Officer, from 2009 until April 2010, Vice President—Asset Management and Trust Company Services, from 2006 to 2009, and Vice President—Operations and Compliance from 2004 to 2006). | |
|
| Joseph F. DiMaria (Born 1968) | |
|
One Financial Center
Boston, MA 02111
Treasurer (since 2009) and
Chief Accounting Officer (since 2008) | | Vice President, Mutual Fund Administration, Columbia Management Investment Advisers, LLC, since May 2010; Director of Fund Administration, Columbia Management Advisors, LLC from January 2006 to April 2010; Head of Tax/Compliance and Assistant Treasurer, Columbia Management Advisors, LLC, from November 2004 to December 2005. | |
|
140
Fund Governance (continued)
Officers (continued)
| Name, Year of Birth and Address | | Principal Occupation(s) During the Past Five Years | |
| Marybeth Pilat (Born 1968) | |
|
One Financial Center
Boston, MA 02111
Deputy Treasurer (since 2010) | | Vice President, Mutual Fund Administration, Columbia Management Investment Advisers, LLC, since May 2010; Vice President, Investment Operations, Bank of America, from October 2008 to April 2010; Finance Manager, Boston Children's Hospital from August 2008 to October 2008; Director, Mutual Fund Administration, Columbia Management Advisors, LLC, from May 2007 to July 2008; Vice President, Mutual Fund Valuation, Columbia Management Advisors, LLC, from January 2006 to May 2007; Vice President, Mutual Fund Accounting Oversight, Columbia Management Advisors, LLC from January 2005 to January 2006. | |
|
| Julian Quero (Born 1967) | |
|
One Financial Center
Boston, MA 02111
Deputy Treasurer (since 2008) | | Vice President, Mutual Fund Administration, Columbia Management Investment Advisers, LLC since May 2010; Director of Fund Administration, Columbia Management Advisors, LLC, from August 2008 to April 2010; Senior Tax Manager, Columbia Management Advisors, LLC from August 2006 to July 2008; Senior Compliance Manager, Columbia Management Advisors, LLC from April 2002 to August 2006. | |
|
| Stephen T. Welsh (Born 1957) | |
|
One Financial Center
Boston, MA 02111
Vice President (since 2006) | | President and Director, Columbia Management Investment Services Corp. since May 2010; President and Director, Columbia Management Services, Inc. from July 2004 to April 2010; Managing Director, Columbia Management Distributors, Inc. from August 2007 to April 2010. | |
|
141
Board Consideration and Approval of Advisory Agreements
Columbia Large Cap Growth Fund, Columbia Contrarian Core Fund and Columbia Small Cap Core Fund
In September 2010, the Board of Trustees (the "Board") unanimously approved new Investment Management Services Agreements (the "Advisory Agreements") on behalf of various Columbia funds that would increase or decrease the contractual investment advisory fee rates payable by each affected Columbia fund (each, an "Affected Fund") to Columbia Management for investment advisory services. For each of Columbia Large Cap Growth Fund, Columbia Contrarian Core Fund and Columbia Small Cap Core Fund, the Advisory Agreement would, subject to shareholder approval, increase contractual investment advisory fee rates. As detailed below, the Board held numerous meetings and discussions with the management team of Columbia Management and reviewed and considered materials in connection with the approval of the investment advisory fee before determining to approve the Advisory Agreements.
On April 30, 2010, Ameriprise Financial, Inc. acquired the long-term asset management business of Columbia Management Group, LLC, a subsidiary of Bank of America and the parent of the Affected Funds' former investment adviser. In connection with that acquisition, the Affected Funds entered into investment management services agreements with Columbia Management, a subsidiary of Ameriprise Financial, Inc.
Beginning in April 2010, Columbia Management presented to the Advisory Fees and Expenses Committee (the "Committee") of the Board a proposal to rationalize the fees and expenses, including the advisory fees, of the various registered investment companies in the combined complex of Columbia-, RiverSource-, Seligman- and Threadneedle-branded funds (the "Columbia Funds Complex"). Because these funds were organized at different times by many different sponsors, their fees and expenses did not reflect a common overall design, and Columbia Management proposed to implement a more consistent schedule of fees for similar funds based on a uniform pricing model across all of the funds. In this regard, Columbia Management presented the Committee with various data comparing current and proposed fee schedules to the fee schedules of peer funds, as selected by an independent third-party data provider. While Columbia Management projected that t he proposed rationalization would reduce the overall fees and expenses of all of the funds in the aggregate, it was expected that certain fees and expenses, including advisory fees, would increase for certain funds. At the same time, Columbia Management presented the Committee with proposals to provide for consistent administrative services fee schedules across funds in the same asset class, reduced custody fee rates and a consistent transfer agency fee schedule across the funds, as well as initial proposals to merge various funds. In connection with these proposals, the Committee and the trustees considered a proposal by Columbia Management to contractually limit the total operating expenses (exclusive of brokerage commissions, interest (but including custodial charges relating to overdrafts), taxes and extraordinary expenses, after giving effect to any balance credits from each fund's custodian) of class A shares of funds, the expenses of which exceed the median expenses of such fund's class A shares peer group (as determined from time to time, generally annually, by an independent third-party data provider), to such median expenses (or a lower, agreed-upon rate), and to limit the total expenses of such funds' other classes to a corresponding amount, adjusted to reflect any class-specific expenses (including transfer agency fees and payments under any distribution plan, shareholder servicing plan, and/or plan administration agreement).
The Committee and the trustees who are not "interested persons" (as defined in the Investment Company Act of 1940 (the "1940 Act")) of the Trust (the "Independent Trustees") requested and evaluated materials from, and were provided materials and information regarding the Advisory Agreements by, Columbia Management. The Committee, at meetings held on April 20, 2010, May 3, 2010, June 7, 2010, July 27, 2010 and August 10, 2010, and the Independent Trustees, at meetings held on April 20, 2010, May 4, 2010, June 7, 2010 and August 11, 2010, reviewed the materials provided in connection with their consideration of the Advisory Agreements and other matters relating to the proposals and discussed them with representatives of Columbia Management. The Committee and the Independent Trustees also reviewed and considered information that they had previously received in connection with their most recent consideration and approval of the curr ent investment management services agreements with Columbia Management. They also consulted with Fund counsel and with the Independent Trustees' independent legal counsel, who advised on the legal standards for consideration
142
by the trustees and otherwise assisted the trustees in their deliberations. The trustees also met with, and reviewed and considered a report prepared and provided by, the independent fee consultant (the "Fee Consultant") appointed by the Independent Trustees pursuant to an assurance of discontinuance entered into by Columbia Management Advisors, LLC, the Affected Funds' previous adviser, with the New York Attorney General ("NYAG") to settle a civil complaint filed by the NYAG relating to trading in mutual fund shares (the "NYAG Settlement"). Under the NYAG Settlement, the Fee Consultant's role is to manage the process by which management fees are negotiated so that they are negotiated in a manner that is at arms' length and reasonable. On August 10, 2010, the Committee recommended that the trustees approve the Advisory Agreements. On September 14, 2010, the trustees, including a majority of the Independent Trustees, approved the Advisory Agreement for each Affected Fund, subject to shareholder approval.
The trustees considered all materials that they, their legal counsel or Columbia Management believed reasonably necessary to evaluate and to determine whether to approve the Advisory Agreements. The factors considered by the Committee and the trustees in recommending approval and approving the Advisory Agreement for each Affected Fund included the following:
• The expected benefits of continuing to retain Columbia Management as the Affected Funds' investment manager;
• The terms and conditions of the Advisory Agreements, including the increase or decrease, as applicable, in the advisory fee schedule for each Affected Fund;
• The impact of the proposed changes in investment advisory fee rates, as well as proposed changes in administrative services, transfer agency and custody fee rates, on each Affected Fund's total expense ratio;
• For each of Columbia Contrarian Core Fund, Columbia Large Cap Growth Fund and Columbia Small Cap Core Fund, the reduction in the rates payable under each Fund's administrative services agreement at certain asset levels;
• The willingness of Columbia Management to agree to contractually limit or cap total operating expenses for each of Columbia Contrarian Core Fund, Columbia Large Cap Growth Fund and Columbia Small Cap Core Fund so that total operating expenses (exclusive of brokerage commissions, interest (but including custodial charges relating to overdrafts), taxes and extraordinary expenses, after giving effect to any balance credits from each fund's custodian) of class A shares would not exceed the median expenses of such fund's class A shares peer group (as determined from time to time, generally annually, by an independent third-party data provider);
• That Columbia Management, and not any Affected Fund, would bear the costs of obtaining any necessary shareholder approvals of the Advisory Agreements;
• The expected impact on expenses for certain Affected Funds of proposed mergers; and
• The expected benefits of further integrating the Combined Fund Complex by:
o Standardizing total management fees across similar funds in the Combined Fund Complex to promote comparability of pricing among a menu of funds available to investors, including through exchange privileges; and
o Aligning investment advisory fee rates across funds in the Combined Fund Complex that are in the same investment category (e.g., the amendment would align the investment advisory fee rates of Columbia Large Cap Growth Fund with those of all other actively managed large-cap funds in the Combined Fund Complex).
Nature, Extent and Quality of Services Provided under the Advisory Agreements
The trustees considered the nature, extent and quality of services provided to the Affected Funds by Columbia Management and its affiliates under the Advisory Agreements and under separate agreements for the provision of transfer agency and administrative services, and the resources dedicated to the Affected Funds by Columbia Management and its affiliates. The trustees considered, among other things, the ability of Columbia Management to attract, motivate and retain highly qualified research, advisory and supervisory investment professionals (including Columbia Management's personnel and other resources, compensation programs for personnel involved in fund management, reputation and other attributes), the portfolio management services provided by
143
those investment professionals, the trade execution services provided on behalf of the Affected Funds and the quality of Columbia Management's investment research capabilities and the other resources that it devotes to each Affected Fund. For each Affected Fund, the trustees also considered the potential benefits to shareholders of investing in a mutual fund that is part of a fund complex offering exposure to a variety of asset classes and investment disciplines and providing a variety of fund and shareholder services. After reviewing these and related factors, the trustees concluded, within the context of their overall conclusions, that the nature, extent and quality of the services to be provided to each Affected Fund under the Advisory Agreements supported the approval of the Advisory Agreements.
Investment Performance
The trustees reviewed information about the performance of each Affected Fund over various time periods, including information prepared by an independent third-party data provider that compared the performance of each Affected Fund to the performance of peer groups of mutual funds and performance benchmarks. The trustees also reviewed a description of the third party's methodology for identifying each Fund's peer group for purposes of performance and expense comparisons. In the case of each Affected Fund whose performance lagged that of a relevant peer group for certain (although not necessarily all) periods, the trustees concluded that other factors relevant to performance were sufficient, in light of other considerations, to warrant approval of the Affected Fund's Advisory Agreement. Those factors varied from fund to fund, but included one or more of the following: (i) that the Affected Fund's performance, although lagging in certain recent periods, was stronger over the longer term; (ii) that the underperformance was attributable, to a significant extent, to investment decisions that were reasonable and consistent with the Affected Fund's investment strategy and policies and that the Affected Fund was performing within a reasonable range of expectations, given those investment decisions, market conditions and the Affected Fund's investment strategy; (iii) that the Affected Fund's performance was competitive when compared to other relevant performance benchmarks or peer groups; and (iv) that Columbia Management had taken or was taking steps designed to help improve the Affected Fund's investment performance, including, but not limited to, replacing portfolio managers, enhancing the resources supporting the portfolio managers, or modifying investment strategies.
The trustees noted the performance of each Affected Fund through February 28, 2010 relative to that of a peer group selected by an independent third-party data provider for purposes of performance comparisons. Specifically, Columbia Contrarian Core Fund's performance was in the second quintile (where the best performance would be in the first quintile) for the one-year period and in the first quintile for the three-, five- and ten-year periods; Columbia Large Cap Growth Fund's performance was in the third quintile for the one-, three- and five- year periods; and Columbia Small Cap Core Fund's performance was in the second quintile for the one-, three-, five- and ten-year periods.
After reviewing those and related factors, the trustees concluded, within the context of their overall conclusions regarding each of the Advisory Agreements, that the performance of each Affected Fund and Columbia Management was sufficient, in light of other considerations, to warrant the approval of the Advisory Agreement pertaining to that Affected Fund.
Investment Advisory Fee Rates and Other Expenses
The trustees considered that the Advisory Agreement for each of Columbia Contrarian Core Fund, Columbia Large Cap Growth Fund and Columbia Small Cap Core Fund would increase the contractual investment advisory fee rates payable by each fund and would be otherwise identical to each fund's current investment management services agreement. In addition, the trustees also considered that, for Columbia Contrarian Core Fund, with the proposed fee reductions under the administrative services agreement, the contractual fee rate under both the Advisory Agreement and the proposed administrative services agreement would be lower than the current combined contractual fee rate under those agreements at certain asset levels. The trustees also considered that based on its expenses for its most recent fiscal year, adjusted to give effect to its Advisory Agreement and other proposed contractual changes, including the contractual expense limitatio ns described above, Columbia Contrarian Core Fund's contractual management fees and total net expenses would have been in the fourth and third quintiles (where the lowest fees and expenses would be in the first quintile), respectively, of the peer group selected by an
144
independent third-party data provider for purposes of expense comparisons; Columbia Large Cap Growth Fund's contractual management fees and total net expenses would have been in the fourth and first quintiles, respectively; and Columbia Small Cap Core Fund's contractual management fees and total net expenses would have been in the third and first quintiles, respectively.
After reviewing these and related factors, the trustees concluded, within the context of their overall conclusions, that the advisory fee rates under the Advisory Agreements and anticipated total expenses of each Affected Fund supported the approval of the Advisory Agreements.
Costs of Services Provided and Profitability
The trustees considered information about the advisory fees charged by Columbia Management to comparable institutional accounts. In considering the fees charged to those accounts, the trustees took into account, among other things, Columbia Management's representations about the differences between managing mutual funds as compared to other types of accounts, including differences in the services provided, differences in the risk profile of such business for Columbia Management, and the additional resources required to manage mutual funds effectively. In evaluating each Affected Fund's proposed advisory fees, the trustees also took into account the demands, complexity and quality of the investment management of the Affected Fund.
The trustees also considered the compensation directly or indirectly received by Columbia Management and its affiliates in connection with their relationships with the Affected Funds. The trustees reviewed information provided by management as to the projected profitability to Columbia Management and its affiliates of their relationships with each Affected Fund, and information about the allocation of expenses used to calculate profitability. When reviewing profitability, the trustees also considered court cases in which adviser profitability was an issue in whole or in part, the performance of the relevant Affected Funds, the current and anticipated expense levels of each Affected Fund, and the implementation of breakpoints and/or expense limitations with respect to each Affected Fund.
After reviewing those and related factors, the trustees concluded, within the context of their overall conclusions, that the proposed changes to the advisory fees, and the related profitability to Columbia Management and its affiliates of their relationships with the Affected Fund, supported the approval of the Advisory Agreement pertaining to that Affected Fund.
Economies of Scale
The trustees considered the existence of any economies of scale in the provision by Columbia Management of services to each Affected Fund, to groups of related funds and to Columbia Management's investment advisory clients as a whole, and whether those economies of scale were shared with the Affected Funds through breakpoints in the proposed investment advisory fees or other means, such as expense limitation arrangements and additional investments by Columbia Management in investment, trading and compliance resources. The trustees noted that all of the Affected Funds were expected to benefit from breakpoints and/or expense limitation arrangements. In considering those issues, the trustees also took note of the costs of the services to be provided (both on an absolute and relative basis) and the projected profitability to Columbia Management and its affiliates of their relationships with the Affected Funds, as discussed above. Th e trustees also noted the expected expense synergies and other anticipated benefits to Columbia Management and fund shareholders of both the rationalization of fees and expenses and the proposed mergers of certain Affected Funds. After reviewing these and related factors, the trustees concluded, within the context of their overall conclusions, that the extent to which economies of scale were expected to be shared with the Affected Funds supported the approval of the Advisory Agreements.
Other Benefits to Columbia Management
The trustees received and considered information regarding any expected "fall-out" or ancillary benefits to be received by Columbia Management and its affiliates as a result of their relationships with the Affected Funds, such as the provision by Columbia Management of administrative services to the Affected Funds and the provision by Columbia Management's affiliates of distribution and transfer agency services to the Affected Funds, and how the proposed rationalization of fees and expenses might affect such benefits, including the fact that to the extent fees payable by the Affected Funds decrease, and the fees for such Funds were subject to a contractual limit or cap on expenses, Columbia Management may pay less in expense reimbursements. The trustees considered that the
145
Affected Funds' distributor, an affiliate of Columbia Management, retains a portion of the distribution fees from the Affected Funds and receives a portion of the sales charges on sales or redemptions of certain classes of shares of the Affected Funds, and that other affiliates of Columbia Management receive various forms of compensation in connection with their sale of shares of the Affected Funds. The trustees also considered the benefits of research made available to Columbia Management by reason of brokerage commissions generated by the Affected Funds' securities transactions, and reviewed information about Columbia Management's practices with respect to allocating portfolio brokerage and the use of "soft" commission dollars to pay for research. The trustees considered the possible conflicts of interest associated with certain fall-out or other ancillary benefits and the reporting, disclosure and other processes that would b e in place to disclose and to monitor such possible conflicts of interest. The trustees recognized that Columbia Management's profitability would be somewhat lower without these benefits.
In their deliberations, the trustees did not identify any single item that was paramount or controlling and individual trustees may have attributed different weights to various factors. The trustees also evaluated all information available to them on a fund-by-fund basis, and their determinations were made separately in respect of each Affected Fund.
Based on their evaluation of all factors that they deemed to be material, including those factors described above, and assisted by the advice of independent legal counsel and the Fee Consultant, the trustees, including the Independent Trustees, approved each Advisory Agreement.
146
Summary of Management Fee Evaluation by Independent Fee Consultant
REPORT OF INDEPENDENT FEE CONSULTANT TO THE FUNDS SUPERVISED BY THE COLUMBIA ATLANTIC BOARD
Prepared Pursuant to the February 9, 2005
Assurance of Discontinuance among the
Office of Attorney General of New York State,
Columbia Management Advisors, LLC, and
Columbia Management Distributors, Inc.
September 21, 2010
I. Overview
On February 9, 2005, Columbia Management Advisors, LLC ("CMA") and Columbia Management Distributors, Inc.1 ("CMD") agreed to the New York Attorney General's Assurance of Discontinuance ("AOD"). Among other things, the AOD stipulates that CMA may manage or advise a Columbia Fund ("Columbia Fund" and, together with some or all of such funds, the "Columbia Funds") only if the Independent Members of the Columbia Fund's Board of Trustees appoint a Senior Officer or retain an Independent Fee Consultant ("IFC") who is to manage the process by which proposed management fees are negotiated. The AOD further stipulates that the Senior Officer or IFC is to prepare a written annual evaluation of the fee negotiation process.
With effect from January 1, 2007, the Independent Members of the Board of Trustees for certain Columbia Funds known collectively as the "Atlantic Funds" (together with the other members of that Board, the "Trustees") retained me as IFC for the Atlantic Funds.2 In this capacity, I have prepared this written evaluation of the fee negotiation process. As has been the case with my previous reports, my immediate predecessor as IFC, John Rea, provided invaluable assistance in the preparation of this report.
On September 29, 2009, Ameriprise entered into an asset purchase agreement with Bank of America, N.A. and its parent, Bank of America Corporation (together, the "Bank") pursuant to which the Bank agreed to sell certain CMG assets relating to Columbia's long-term asset management business, including management of the Atlantic Funds (the "Transaction"). The Transaction, which closed on April 30, 2010,3 resulted in the termination of the existing Investment Management Agreements with CMA. Prior to the closing of the Transaction, the Trustees and the shareholders of the Funds approved new Advisory and Administrative Agreements with an Ameriprise subsidiary now called Columbia Management Investment Advisers, LLC ("CMIA"). Those Agreements did not change the rates paid by the Funds from the levels specified in the former agreements with CMA.
CMIA serves as the adviser of funds supervised by three different Boards of Trustees: the Atlantic, Nations, and RiverSource Boards, and a subsidiary of CMIA serves as adviser to funds overseen by a fourth Board, Columbia/Wanger. After reviewing the range of funds overseen by all four Boards, CMIA proposed a series of changes intended, among other things, to rationalize its mutual fund product offerings (by, for example, proposing to merge funds with similar investment strategies) and the fees charged to the funds by CMIA and its affiliates. These proposals included (1) changes to the advisory fees paid by certain funds, (2) changes to administrative and similar fees paid by certain funds, (3) changes to the transfer agency, sub-transfer agency, custody, and pricing/bookkeeping fees paid by the Funds, and (4) mergers involving more than 60 funds. CMIA asked the Trustees to consider these proposals together. This report, consiste nt with and (to the extent applicable) in fulfillment of the terms of the AOD, will focus on changes to advisory and aggregate management fees and discuss other proposals insofar as they affect total fund expenses, which may be a relevant factor in considering the appropriate level of advisory and management fees (defined for purposes of this report as advisory plus administrative fees).
A. Role of the Independent Fee Consultant
The AOD charges the IFC with "managing the process by which proposed management fees ... to be charged the Columbia Fund are negotiated so that they are negotiated in a manner which is at arms' length and reasonable and consistent with this Assurance of Discontinuance." The AOD also provides that CMA "may manage or advise a Columbia Fund only if the reasonableness of the proposed management fees is determined by the Board of Trustees ... using ... an
1 CMA and CMD are subsidiaries of Columbia Management Group, LLC ("CMG"), and are the successors to the entities named in the AOD.
2 I have no material relationship with Bank of America, CMG or Ameriprise Financial, Inc. ("Ameriprise"), aside from serving as IFC, and I am aware of no material relationship with any of their affiliates. I retained John Rea, an independent economic consultant, to assist me with this report.
3 CMIA, Materials Prepared for the Atlantic Fees and Expense Committee, June 7, 2010 ("June 7 Materials"), Tab 1 at p. 1.
Unless otherwise stated or required by the context, this report covers only the Atlantic Funds.
147
annual independent written evaluation prepared by or under the direction of ... the Independent Fee Consultant." Therefore, the AOD makes clear that the IFC does not supplant the Trustees in negotiating management fees, nor does the IFC substitute his or her judgment for that of the Trustees with respect to the reasonableness of proposed fees or any other matter that is committed to the business judgment of the Trustees.
B. Elements Involved in Managing the Fee Negotiation Process
In preparing the report required by the AOD, the IFC must consider at least the following six factors set forth in the AOD:
1. The nature and quality of the adviser's services, including the Fund's performance;
2. Management fees (including any components thereof) charged by other mutual fund companies for like services;
3. Possible economies of scale as the Fund grows larger;
4. Management fees (including any components thereof) charged to institutional and other clients of the adviser for like services;
5. Costs to the adviser and its affiliates of supplying services pursuant to the management fee agreements, excluding any intra-corporate profit; and
6. Profit margins of the adviser and its affiliates from supplying such services.
II. Findings
1. Based upon my examination of the information supplied by CMIA and Ameriprise in the light of the six factors set forth in the AOD, I conclude that the Trustees have the relevant information necessary to evaluate the reasonableness of the proposed contractual advisory and/or administrative fee changes at any asset level for each affected Atlantic Fund (each a "Fee Change Fund").
2. In my view, the process by which the proposed management fees of each Fee Change Fund have been negotiated with CMIA thus far has been, to the extent practicable, at arm's length and reasonable and consistent with the AOD.
3. There are 25 Funds for which CMIA has proposed an increase either in the contractual advisory or management fee (each a "Fee Increase Fund"). Seven of these Funds have a combination of higher contractual advisory fees and either lower or unchanged contractual management fees. The remaining 18 Funds have higher contractual management fees with the majority resulting from higher contractual advisory fees. For five Funds, however, the higher management fees result from a combination of lower advisory fees and higher administrative fees.
4. The actual management fee, computed on the basis of assets as of October 31, 2009, would increase for 16 of the Fee Increase Funds after accounting for CMIA's proposed expense limitation program, non-management fee changes, and proposed mergers. Seven Funds would have lower actual management fees, and two would experience no change in actual management fees.
5. Sixteen of the 25 Fee Increase Funds have generally median or better-than-median performance. Only one Fee Increase Fund – High Yield Opportunity Fund – would be identified for further review based on performance criteria used by the Trustees in past contract review processes.
6. CMIA proposed that the Funds and most other mutual funds it or its affiliates advise or sponsor (together, the "CMIA Funds") be subject to a contractual expense limitation calculated as the median of the relevant fund's Lipper expense group. As a result, all Fee Increase Funds are projected to have total expenses in the first, second, or third quintiles after full implementation of the proposed fee changes, expense limitations, and mergers. The expense limitation would be recalculated every year based on updated Lipper data. An analysis of the changes in median expenses for 2009 and 2010 indicates that some Funds are likely to experience sizable changes in their expense limits. Some Funds would have higher-than-median actual management fees notwithstanding the newly-established expense limitations.
148
7. CMIA reviewed differences between management of retail mutual funds and advising institutional accounts and supplied charts plotting contractual and actual institutional and fund fees against assets in various investment categories. The data showed that mutual fund fees are often lower at small asset levels reflecting CMIA's reimbursement of fund expenses. At higher asset levels, mutual fund fees typically exceed institutional fees.
8. CMIA provided fund-by-fund projected profitability data. Due to the significant changes in the operations of the Funds (including the change of the Funds' investment adviser), historical profitability data was judged to have little relevance.
9. CMIA provided projections of both the cumulative benefit to CMIA Fund shareholders of all aspects of its proposals (including proposed mergers) and the synergies in the form of decreased expenses that would benefit CMIA and its parent, Ameriprise.
149
This page intentionally left blank.
This page intentionally left blank.
This page intentionally left blank.
Important Information About This Report
The funds mail one shareholder report to each shareholder address. If you would like more than one report, please call shareholder services at 1-800-345-6611 and additional reports will be sent to you. This report has been prepared for shareholders of the Stock Funds listed on the front cover.
A description of the policies and procedures each the fund uses to determine how to vote proxies and a copy of each fund's voting records are available (i) at www.columbiamanagement.com, (ii) on the Securities and Exchange Commission's website at www.sec.gov, and (iii) without charge, upon request, by calling 1-800-368-0346. Information regarding how each fund voted proxies relating to portfolio securities during the 12-month period ended June 30 is available from the SEC's website. Information regarding how each fund voted proxies relating to portfolio securities is also available from the funds' website, www.columbiamanagement.com.
Each fund files a complete schedule of portfolio holdings with the SEC for the first and third quarters of each fiscal year on Form N-Q. Each fund's Form N-Q is available on the SEC's website at www.sec.gov and may be reviewed and copied at the SEC's Public Reference Room in Washington, D.C. Information on the operation of the Public Reference Room may be obtained by calling 1-800-SEC-0330.
Transfer Agent
Columbia Management Investment
Services Corp.
P.O. Box 8081
Boston, MA 02266-8081
1-800-345-6611
Distributor
Columbia Management Investment
Distributors, Inc.
One Financial Center
Boston, MA 02111
Investment Advisor
Columbia Management Investment Advisers, LLC
100 Federal Street
Boston, MA 02110
153

PRSRT STD
U.S. Postage
PAID
Holliston, MA
Permit NO. 20
Stock Funds
P. O. Box 8081
Boston, MA 02266-8081
columbiamanagement.com
This information is for use with concurrent or prior delivery of a fund prospectus. Investors should consider the investment objectives, risks, charges and expenses of a mutual fund carefully before investing. For a free prospectus, which contains this and other important information about the funds, visit columbiamanagement.com. Read the prospectus carefully before investing. The Funds are distributed by Columbia Management Investment Distributors, Inc., member FINRA, and managed by Columbia Management Investment Advisers, LLC.
© 2010 Columbia Management Investment Advisers, LLC. All rights reserved.
C-1401 A (11/10)

Columbia Dividend Income Fund
Annual Report for the Period Ended September 30, 2010
Table of Contents
The views expressed in this report reflect the current views of the respective parties. These views are not guarantees of future performance and involve certain risks, uncertainties and assumptions that are difficult to predict, so actual outcomes and results may differ significantly from the views expressed. These views are subject to change at any time based upon economic, market or other conditions and the respective parties disclaim any responsibility to update such views. These views may not be relied on as investment advice and, because investment decisions for a Columbia Fund are based on numerous factors, may not be relied on as an indication of trading intent on behalf of any particular Columbia Fund. References to specific securities should not be construed as a recommendation or investment advice.
President’s Message

Dear Shareholder:
The Columbia Management story began over 100 years ago, and today, we are one of the nation’s largest dedicated asset managers. The recent acquisition by Ameriprise Financial, Inc. brings together the talents, resources and capabilities of Columbia Management with those of RiverSource Investments, Threadneedle (acquired by Ameriprise in 2003) and Seligman Investments (acquired by Ameriprise in 2008) to build a best-in-class asset management business that we believe is truly greater than its parts.
RiverSource Investments traces its roots to 1894 when its then newly-founded predecessor, Investors Syndicate, offered a face-amount savings certificate that gave small investors the opportunity to build a safe and secure fund for retirement, education or other special needs. A mutual fund pioneer, Investors Syndicate launched Investors Mutual Fund in 1940. In the decades that followed, its mutual fund products and services lineup grew to include a full spectrum of styles and specialties. More than 110 years later, RiverSource continues to be a trusted financial products leader.
Threadneedle, a leader in global asset management and one of Europe’s largest asset managers, offers sophisticated international experience from a dedicated U.K. management team. Headquartered in London, it is named for Threadneedle Street in the heart of the city’s financial district, where British investors pioneered international and global investing. Threadneedle was acquired in 2003 and today operates as an affiliate of Columbia Management.
Seligman Investments’ beginnings date back to the establishment of the investment firm J. & W. Seligman & Co. in 1864. In the years that followed, Seligman played a major role in the geographical expansion and industrial development of the United States. In 1874, President Ulysses S. Grant named Seligman as fiscal agent for the U.S. Navy — an appointment that would last through World War I. Seligman helped finance the westward path of the railroads and the building of the Panama Canal. The firm organized its first investment company in 1929 and began managing its first mutual fund in 1930. In 2008, J. & W. Seligman & Co. Incorporated was acquired and Seligman Investments became an offering brand of RiverSource Investments, LLC.
We are proud of the rich and distinctive history of these firms, the strength and breadth of products and services they offer, and the combined cultures of pioneering spirit and forward thinking. Together we are committed to providing more for our shareholders than ever before.
| n | | A singular focus on our shareholders. Our business is asset management, so investors are our first priority. We dedicate our resources to identifying timely investment opportunities and provide a comprehensive choice of equity, fixed-income and alternative investments to help meet your individual needs. |
| n | | First-class research and thought leadership. We are dedicated to helping you take advantage of today’s opportunities and anticipate tomorrow’s. We stay abreast of the latest investment trends and ideas, using our collective insight to evaluate events and transform them into solutions you can use. |
| n | | A disciplined investment approach. We aren’t distracted by passing fads. Our teams adhere to a rigorous investment process that helps ensure the integrity of our products and enables you and your financial advisor to match our solutions to your objectives with confidence. |
When you choose Columbia Management, you can be confident that we will take the time to understand your needs and help you and your financial advisor identify the solutions that are right for you. Because at Columbia Management, we don’t consider ourselves successful unless you are.
Sincerely,

J. Kevin Connaughton
President, Columbia Funds
Investors should consider the investment objectives, risks, charges and expenses of a mutual fund carefully before investing. For a free prospectus, which contains this and other important information about the funds, visit www.columbiamanagement.com. The prospectus should be read carefully before investing.
Columbia Funds are distributed by Columbia Management Investment Distributors, Inc., member FINRA, and managed by Columbia Management Investment Advisers, LLC.
© 2010 Columbia Management Investment Advisers, LLC. All rights reserved.
Fund Profile – Columbia Dividend Income Fund
Performance data quoted represents past performance and current performance may be lower or higher. Past performance is no guarantee of future results. The investment return and principal value will fluctuate so that shares, when redeemed, may be worth more or less than the original cost. Please visit www.columbiamanagement.com for daily and most recent month-end performance updates.
Summary
1-year return as of 09/30/10
| | |
| |
 | | +11.02% Class A shares
(without sales charge) |
| |
| | +10.75% Russell 1000 Index |
|
Morningstar Style BoxTM |
|
Equity Style |
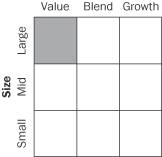
|
The Morningstar Style Box™ is based on the fund’s portfolio holdings. For equity funds, the vertical axis shows the market capitalization of the stocks owned, and the horizontal axis shows investment style (value, blend, or growth). Information shown is based on the most recent data provided by Morningstar.
© 2010 Morningstar, Inc. All rights reserved. The information contained herein is proprietary to Morningstar and/or its content providers, may not be copied or distributed and is not warranted to be accurate, complete, or timely. Neither Morningstar nor its content providers are responsible for any damages or losses arising from any use of this information. Past performance is no guarantee of future results.
Summary
| n | | For the 12-month period that ended September 30, 2010, the fund’s Class A shares returned 11.02% without sales charge. |
| n | | The fund outperformed its benchmark, the Russell 1000 Index1, but trailed the average return of its peer group, the Lipper Equity Income Funds Classification.2 |
| n | | Successful stock selection in the materials, consumer and health care sectors fed the fund’s solid performance during the year. |
Portfolio Management
Scott L. Davis has co-managed the fund since November 2001 and has been associated with the advisor since May 2010. Prior to joining the advisor, Mr. Davis was associated with the fund’s previous advisor or its predecessors since 1985.
Richard E. Dahlberg has co-managed the fund since October 2003 and has been associated with the advisor since May 2010. Prior to joining the advisor, Mr. Dahlberg was associated with the fund’s previous advisor or its predecessors since 2003.
Effective May 1, 2010, RiverSource Investments, LLC, a subsidiary of Ameriprise Financial, Inc., became the investment advisor to the fund and changed its name to Columbia Management Investment Advisers, LLC. Please see the fund’s prospectuses, as supplemented, for more information regarding the change in investment advisor and certain other changes.
| 1 | The Russell 1000 Index measures the performance of 1,000 of the largest U.S. companies, based on market capitalization. |
| 2 | Lipper Inc., a widely respected data provider in the industry, calculates an average total return (assuming reinvestment of distributions) for mutual funds with investment objectives similar to those of the fund. Lipper makes no adjustment for the effect of sales loads. |
Indices are not available for investment, are not professionally managed and do not reflect sales charges, fees, brokerage commissions, taxes or other expenses of investing. Securities in the fund may not match those in an index.
1
Economic Update – Columbia Dividend Income Fund
Summary
For the 12-month period that ended September 30, 2010
| | n | | The U.S. stock market, as measured by the S&P 500 Index, delivered solid returns, despite a summer correction. Emerging market stocks, as measured by the MSCI Emerging Markets Index (Net), outperformed U.S. stocks as well as stock markets in developed foreign markets, as measured by the MSCI EAFE Index. | |
| | |
| S&P Index | | MSCI Emerging Markets Index |
| |

| |
|
10.16% | | 20.22% |
| | n | | Modest economic growth and relatively low interest rates boosted bond market returns. The Barclays Capital Aggregate Bond Index delivered solid results. High-yield bonds outperformed stocks, as measured by the JPMorgan Developed BB High Yield Index. | |
| | |
| Barclays Aggregate Index | | JPMorgan
Index |
| |
| |
|
8.16% | | 16.19% |
Although it has been more than a year since U.S. economic growth turned positive, the economy continues to send mixed signals about the sustainability of this recovery. Economic growth, as measured by gross domestic product, was a solid 5.0% in the last quarter of 2009. However, it was 3.7% in the first quarter of 2010 and only 1.7% in the second quarter. Expectations are for continued lackluster growth through the end of the year, as government incentive programs have ended and stimulus spending winds down. Even so, it appears to be unlikely that the U.S. economy will sink back into recession, as many key indicators remain positive.
Consumer spending on cars, clothing and other goods increased throughout the year, although the pace of increased spending was small. Personal income also moved higher. Consumer confidence, as measured by the Conference Board Consumer Confidence Index, gained ground in the first half of 2010. However, the index fell sharply during the summer. Consumers surveyed in the final months of the reporting period indicated they were concerned about business conditions and job prospects and generally apprehensive about the future.
The housing market — another bellwether for the consumer sector — showed a glimmer of improvement in the final months of the period. Although both new and existing home sales fell during the summer after a federal tax credit for new and repeat homebuyers expired, sales of existing homes picked up in August 2010. Sales of new homes were flat in August 2010 and the inventory of new homes for sale fell to a 42-year low. Pending home sales, a forward-looking indicator, rose in both July 2010 and August 2010. The latest data points to rising sales in the months ahead. Distressed properties continued to pressure prices. The national median price of existing homes rose slightly over the one-year period, while the national median price of new homes declined slightly. The inventory of unsold new homes declined sharply at the end of the period.
News on the job front was mostly positive for the period, but the number of new jobs added to the economy fell short of expectations. A good portion of the jobs added in March, April and May were temporary, government-sponsored census positions, which began to unwind in June, July and August. Private sector job growth was disappointing given the stage of economic recovery. Nevertheless, private sector payroll employment trended modestly higher through the end of the period, and news of massive layoffs declined.
Reports from the business side of the economy were generally positive. A key measure of the nation’s manufacturing situation — the Institute for Supply Management’s Index — trended higher for 14 consecutive months before dipping downward in September. Industrial production moved higher, as did the amount of manufacturing capacity utilized — a key measure of the health of the manufacturing sector.
Stock rally regains its footing
Against a strengthening economic backdrop, a stock market rally that began early in 2009 continued into the spring of 2010. But during the early summer months, a debt crisis brewing in Europe raised concerns among U.S. investors, as did mixed signals on the economy, and some of the stock market’s earlier gains vanished. Then, in
2
Economic Update (continued) – Columbia Dividend Income Fund
September, investors reversed course and bid stocks sharply higher. The S&P 500 Index1 returned 10.16% for the 12-month period. Outside the United States, stock market returns were mixed. The MSCI EAFE Index (Net),2 a broad gauge of stock market performance in foreign developed markets, returned 3.27% (in U.S. dollars) for the period, as concerns about the impact of a bailout for weak eurozone economies weighed on the markets. Emerging stock markets were more resilient. The MSCI Emerging Markets Index (Net)3 returned 20.22% (in U.S. dollars) for the 12-month period.
Bonds delivered solid returns
As the economy strengthened, bonds also delivered solid returns. The Barclays Capital Aggregate Bond Index4 returned 8.16%. The high-yield bond market outpaced stocks by a sizeable margin during the period. For the 12 months covered by this report, the JPMorgan Developed BB High Yield Index5 returned 16.19%. The Treasury market was also positive. As the yield on the 10-year U.S. Treasury, a common bellwether for the bond market, fell over the 12-month period (Bond prices and yields move in opposite directions), the Barclays Capital U.S. Treasury Index6 returned 7.32%. Despite positive economic activity, the Federal Reserve Board kept a key short-term interest rate — the federal funds rate — close to zero.
Past performance is no guarantee of future results.
| 1 | The Standard & Poor’s (S&P) 500 Index tracks the performance of 500 widely held, large-capitalization U.S. stocks. |
| 2 | The Morgan Stanley Capital International Europe, Australasia, Far East (MSCI EAFE) Index (Net) is a free float-adjusted market capitalization index that is designed to measure the equity market performance of developed markets, excluding the U.S. & Canada. As of May 27, 2010, the MSCI EAFE Index (Net) consisted of the following 22 developed market country indices: Australia, Austria, Belgium, Denmark, Finland, France, Germany, Greece, Hong Kong, Ireland, Israel, Italy, Japan, the Netherlands, New Zealand, Norway, Portugal, Singapore, Spain, Sweden, Switzerland, and the United Kingdom. |
| 3 | The Morgan Stanley Capital International Emerging Markets (MSCI EM) Index (Net) is a free float-adjusted market capitalization index that is designed to measure equity market performance in the global emerging markets. As of May 27, 2010, the MSCI Emerging Markets Index (Net) consisted of the following 21 emerging market country indices: Brazil, Chile, China, Colombia, Czech Republic, Egypt, Hungary, India, Indonesia, Korea, Malaysia, Mexico, Morocco, Peru, Philippines, Poland, Russia, South Africa, Taiwan, Thailand, and Turkey. |
| 4 | The Barclays Capital Aggregate Bond Index is a market value-weighted index that tracks the daily price, coupon, pay-downs and total return performance of fixed-rate, publicly placed, dollar-denominated and non-convertible investment grade debt issues with at least $250 million par amount outstanding and with at least one year to final maturity. |
| 5 | The JPMorgan Developed BB High Yield Index is an unmanaged index designed to mirror the investable universe of the U.S. dollar developed, BB-rated, high yield corporate debt market. |
| 6 | The Barclays Capital U.S. Treasury Index includes public obligations of the U.S. Treasury. Treasury bills are excluded by the maturity constraint. In addition, certain special issues, such as state and local government series bonds (SLGs), as well as U.S. Treasury TIPS, are excluded. STRIPS are excluded from the index because their inclusion would result in double-counting. |
Indices are not available for investment, are not professionally managed and do not reflect sales charges, fees, brokerage commissions, taxes or other expenses of investing. Securities in the fund may not match those in an index.
3
Performance Information – Columbia Dividend Income Fund
Performance data quoted represents past performance and current performance may be lower or higher. Past performance is no guarantee of future results. The investment return and principal value will fluctuate so that shares, when redeemed, may be worth more or less than the original cost. Please visit www.columbiamanagement.com for daily and most recent month-end performance updates.
| | | | |
| Net asset value per share | |
| |
as of 09/30/10 ($) | | | | |
Class A | | | 12.12 | |
Class B | | | 11.86 | |
Class C | | | 11.85 | |
Class I | | | 12.13 | |
Class R | | | 12.13 | |
Class T | | | 12.13 | |
Class W | | | 12.12 | |
Class Z | | | 12.13 | |
| Distributions declared per share | |
| |
10/01/09 – 09/30/10 ($) | | | | |
Class A | | | 0.28 | |
Class B | | | 0.20 | |
Class C | | | 0.20 | |
Class R | | | 0.25 | |
Class T | | | 0.28 | |
Class Z | | | 0.31 | |
|
| Performance of a $10,000 investment 10/01/00 – 09/30/10 |
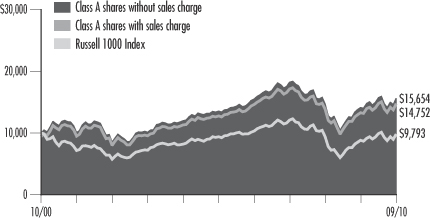
The chart above shows the change in value of a hypothetical $10,000 investment in Class A shares of Columbia Dividend Income Fund during the stated time period, and does not reflect the deduction of taxes that a shareholder may pay on fund distributions or on the redemption of fund shares.
| | | | | | | | |
| Performance of a $10,000 investment 10/01/00 – 09/30/10 ($) | |
| | |
| Sales charge | | without | | | with | |
Class A | | | 15,654 | | | | 14,752 | |
Class B | | | 14,515 | | | | 14,515 | |
Class C | | | 14,504 | | | | 14,504 | |
Class I | | | n/a | | | | n/a | |
Class R | | | 15,568 | | | | n/a | |
Class T | | | 15,600 | | | | 14,701 | |
Class W | | | n/a | | | | n/a | |
Class Z | | | 16,167 | | | | n/a | |
| | | | | | | | | | | | | | | | | | | | | | | | | | | | | | | | | | | | | | | | | | | | | | | | |
| Average annual total return as of 09/30/10 (%) | |
| | | | | | | | |
| Share class | | A | | | B | | | C | | | I | | | R | | | T | | | W | | | Z | |
| Inception | | 11/25/02 | | | 11/25/02 | | | 11/25/02 | | | 09/27/10 | | | 03/28/08 | | | 03/04/98 | | | 09/27/10 | | | 03/04/98 | |
| Sales charge | | without | | | with | | | without | | | with | | | without | | | with | | | without | | | without | | | without | | | with | | | without | | | without | |
1-year | | | 11.02 | | | | 4.65 | | | | 10.24 | | | | 5.24 | | | | 10.25 | | | | 9.25 | | | | n/a | | | | 10.84 | | | | 11.06 | | | | 4.69 | | | | n/a | | | | 11.38 | |
5-year | | | 2.91 | | | | 1.70 | | | | 2.16 | | | | 1.79 | | | | 2.16 | | | | 2.16 | | | | n/a | | | | 2.80 | | | | 2.88 | | | | 1.67 | | | | n/a | | | | 3.18 | |
10-year/Life | | | 4.58 | | | | 3.96 | | | | 3.80 | | | | 3.80 | | | | 3.79 | | | | 3.79 | | | | –0.08 | | | | 4.53 | | | | 4.55 | | | | 3.93 | | | | –0.08 | | | | 4.92 | |
The “with sales charge” returns include the maximum initial sales charge of 5.75% for Class A and Class T shares and the applicable contingent deferred sales charge of 5.00% in the first year, declining to 1.00% in the sixth year and eliminated thereafter for Class B shares and 1.00% for Class C shares for the first year only. The “without sales charge” returns do not include the effect of sales charges. If they had, returns would be lower.
Performance results reflect any fee waivers or reimbursements of fund expenses by the investment advisor and/or any of its affiliates. Absent these fee waivers or expense reimbursement arrangements, performance results would have been lower.
All results shown assume reinvestment of distributions. Class I and Class Z shares are sold at net asset value with no distribution and service (Rule 12b-1) fees. Class R and Class W shares are sold at net asset value with a distribution (12b-1) fee. Class I, Class R, Class W and Class Z shares have limited eligibility and the investment minimum requirements may vary. Please see the fund’s prospectuses for details. Performance for different share classes will vary based on differences in sales charges and fees associated with each class.
The tables do not reflect the deduction of taxes that a shareholder may pay on fund distributions or on the redemption of fund shares.
Class A, Class B, Class C, Class T and Class Z share performance information includes returns of Retail A shares (for Class A and Class T shares), Retail B shares (for Class B and Class C shares) and Trust shares (for Class Z shares) of Galaxy Strategic Equity Fund, the predecessor to the Fund and a series of the Galaxy Fund (the “Predecessor Fund”), for periods prior to November 25, 2002, the date on which Class A, Class B, Class C, Class T and Class Z shares were initially offered by the Fund. Class R share performance information includes returns of Class A shares for the period from November 25, 2002 through March 27, 2008, and the returns of Retail A shares for periods prior thereto. These returns shown for all share classes reflect any differences in sales charges, but have not been restated to reflect any differences in expenses between the Predecessor Fund share classes (and, in the case of Class R shares, Class A shares) and the corresponding newer share classes. If differences in expenses had been reflected, the returns shown for periods prior to November 25, 2002 would be lower for Class B and Class C, and the returns shown for periods prior to March 28, 2008 would be lower for Class R shares.
Class I and Class W shares were initially offered by the fund on September 27, 2010.
4
Understanding Your Expenses – Columbia Dividend Income Fund
Estimating your actual expenses
To estimate the expenses that you paid over the period, first you will need your account balance at the end of the period:
| | n | | For shareholders who receive their account statements from Columbia Management Investment Services Corp., your account balance is available online at www.columbiamanagement.com or by calling Shareholder Services at 800.345.6611. | |
| | n | | For shareholders who receive their account statements from their financial intermediary, contact your financial intermediary to obtain your account balance. | |
| | 1. | Divide your ending account balance by $1,000. For example, if an account balance was $8,600 at the end of the period, the result would be 8.6. | |
| | 2. | In the section of the table below titled “Expenses paid during the period,” locate the amount for your share class. You will find this number in the column labeled “Actual.” Multiply this number by the result from step 1. Your answer is an estimate of the expenses you paid on your account during the period. | |
If the value of your account falls below the minimum initial investment requirement applicable to you, your account may be subject to a $20 annual fee. This fee is not included in the accompanying table. If you are subject to the fee, keep it in mind when you are estimating the ongoing expenses of investing in the fund and when comparing the expenses of this fund with other funds.
As a fund shareholder, you incur two types of costs. There are transaction costs, which generally include sales charges on purchases and may include redemption fees or exchange fees. There are also ongoing costs, which generally include investment advisory fees, distribution and service (Rule 12b-1) fees and other fund expenses. The information on this page is intended to help you understand the ongoing costs of investing in the fund and to compare these costs with the ongoing costs of investing in other mutual funds.
Analyzing your fund’s expenses by share class
To illustrate these ongoing costs, we have provided an example and calculated the expenses paid by investors in each share class during the period. The information in the following table is based on an initial investment of $1,000, which is invested at the beginning of the period and held for the entire period. Expense information is calculated two ways and each method provides you with different information. The amount listed in the “Actual” column is calculated using the fund’s actual operating expenses and total return for the period. The amount listed in the “Hypothetical” column for each share class assumes that the return each year is 5% before expenses and is calculated based on the fund’s actual operating expenses. You should not use the hypothetical account values and expenses to estimate either your actual account balance at the end of the period or the expenses you paid during this period.
Compare with other funds
Since all mutual funds are required to include the same hypothetical calculations about expenses in shareholder reports, you can use this information to compare the ongoing costs of investing in the fund with other funds. To do so, compare the 5% hypothetical example with the 5% hypothetical examples that appear in the shareholder reports of other funds. As you compare hypothetical examples of other funds, it is important to note that hypothetical examples are meant to highlight the ongoing costs of investing in a fund and do not reflect any transaction costs, such as sales charges, redemption fees or exchange fees.
| | | | | | | | | | | | | | | | | | | | | | | | | | | | |
| 04/01/10 – 09/30/10 | | | | | | | |
| | | Account value at the beginning of the period ($) | | | Account value at the end of the period ($) | | | Expenses paid during the period ($) | | | Fund’s annualized
expense ratio (%) | |
| | | Actual | | | Hypothetical | | | Actual | | | Hypothetical | | | Actual | | | Hypothetical | | | Actual | |
Class A | | | 1,000.00 | | | | 1,000.00 | | | | 996.40 | | | | 1,019.80 | | | | 5.25 | | | | 5.32 | | | | 1.05 | |
Class B | | | 1,000.00 | | | | 1,000.00 | | | | 993.30 | | | | 1,016.04 | | | | 8.99 | | | | 9.10 | | | | 1.80 | |
Class C | | | 1,000.00 | | | | 1,000.00 | | | | 993.30 | | | | 1,016.04 | | | | 8.99 | | | | 9.10 | | | | 1.80 | |
Class I | | | 1,000.00 | | | | 1,000.00 | | | | 999.20 | * | | | 1,021.51 | | | | 0.06 | * | | | 3.60 | | | | 0.71 | |
Class R | | | 1,000.00 | | | | 1,000.00 | | | | 995.90 | | | | 1,018.55 | | | | 6.50 | | | | 6.58 | | | | 1.30 | |
Class T | | | 1,000.00 | | | | 1,000.00 | | | | 997.00 | | | | 1,019.55 | | | | 5.51 | | | | 5.57 | | | | 1.10 | |
Class W | | | 1,000.00 | | | | 1,000.00 | | | | 999.20 | * | | | 1,019.80 | | | | 0.09 | * | | | 5.32 | | | | 1.05 | |
Class Z | | | 1,000.00 | | | | 1,000.00 | | | | 998.50 | | | | 1,021.06 | | | | 4.01 | | | | 4.05 | | | | 0.80 | |
Expenses paid during the period are equal to the annualized expense ratio for the share class, multiplied by the average account value over the period, then multiplied by the number of days in the fund’s most recent fiscal half-year and divided by 365.
Had the investment advisor and/or any of its affiliates not waived fees or reimbursed a portion of expenses, account value at the end of the period would have been reduced.
It is important to note that the expense amounts shown in the table are meant to highlight only ongoing costs of investing in the fund and do not reflect any transaction costs, such as sales charges, redemption fees or exchange fees. Therefore, the hypothetical examples provided may not help you determine the relative total costs of owning shares of different funds. If these transaction costs were included, your costs would have been higher.
| *For | the period September 27, 2010 through September 30, 2010. Class I and Class W shares commenced operations on September 27, 2010. |
5
Portfolio Managers’ Report – Columbia Dividend Income Fund
Performance data quoted represents past performance and current performance may be lower or higher. Past performance is no guarantee of future results. The investment return and principal value will fluctuate so that shares, when redeemed, may be worth more or less than the original cost. Please visit www.columbiamanagement.com for daily and most recent month-end performance updates.
| | | | |
Sectors | | | |
| |
as of 09/30/10 (%) | | | | |
Consumer Staples | | | 13.4 | |
Financials | | | 12.4 | |
Energy | | | 11.0 | |
Industrials | | | 10.1 | |
Health Care | | | 10.1 | |
Information Technology | | | 9.5 | |
Consumer Discretionary | | | 8.1 | |
Telecommunications Services | | | 7.1 | |
Utilities | | | 5.9 | |
Materials | | | 5.5 | |
Cash & Equivalents | | | 6.9 | |
The fund is actively managed and the composition of its portfolio will change over time. Information provided is calculated as a percentage of net assets.
For the 12-month period that ended September 30, 2010, the fund’s Class A shares returned 11.02% without sales charge. The fund’s benchmark, the Russell 1000 Index, returned 10.75% for the same period. The average return of the fund’s peer group, the Lipper Equity Income Funds Classification, was 11.40%. The fund’s dividend increased over the period.
As the recession began to wind down last year, investors developed a renewed appetite for risk in anticipation of a healthy economic recovery. Money began to shift from the most conservative commitments into equities, initially favoring smaller company stocks over those of larger, more stable issues. However, after peaking in the third quarter of 2009, the pace of economic growth decelerated right through this year’s second quarter. A resulting decline in stock prices persisted over the summer. Faced with the prospect of a long period of mediocre growth, market participants moved heavily into bonds, raising prices and driving yields to extremely low levels. As a result, many company dividend yields now exceed the yields available on their bonds.
Consumer and health care holdings led performance
Defensive positioning and good selection among companies with growing dividends aided returns in the consumer staples and health care sectors. McDonald’s (1.8% of net assets) continued to execute its business plan skillfully, increasing same-store sales despite recessionary conditions. Philip Morris International (2.8% of net assets) also delivered strong operating results, as did Altria Group and H.J. Heinz (1.1% and 1.3% of net assets, respectively). Philip Morris International and McDonald’s are among the few stocks whose prices remain above their pre-recession levels. Health care standouts included Bristol-Myers Squibb (2.1% of net assets) and Schering Plough, which was acquired by Merck & Co. (2.6% of net assets).
Good stock selection also brought positive results in the materials sector. Sherwin-Williams (1.7% of net assets) led the way as it maintained margins and profitability despite a very difficult housing environment. China’s relentless demand helped push up prices of industrial commodities, aiding energy and materials companies. Farm equipment manufacturer Deere & Co. (0.9% of net assets) rode the global agricultural boom as prices on farm commodities hit new highs. In energy, drilling specialist Smith International spiked higher on news of its pending takeover by Schlumberger (0.9% of net assets), the largest supplier of drilling products and services. In telecom, Verizon Communications (3.1% of net assets) was a strong contributor, and laggard AT&T (3.4% of net assets) edged higher late in the period.
Technology and financials lagged
Results in technology suffered from the absence of strong-performing stocks, among them Apple. Technology is normally an area of relative weakness for the fund because so few tech companies pay meaningful dividends. Similarly, not owning Amazon penalized relative returns among consumer discretionary issues. A decline in steelmaker Nucor (0.8% of net assets) was largely offset by good performance in Allegheny Technologies (no longer in the portfolio), which makes specialized metals and alloys.
6
Portfolio Managers’ Report (continued) – Columbia Dividend Income Fund
The fund’s positioning in financials was positive overall, but sector results were mixed. We kept bank holdings at below-benchmark levels due to a foggy regulatory outlook and focused instead on insurers and investment management companies. Avoiding CitiGroup, Bank of America and Goldman Sachs bolstered relative returns. JPMorgan Chase and Morgan Stanley (1.8% and 0.6% of net assets, respectively) disappointed, but American Express (1.1% of net assets) rose sharply thanks to reduced charge offs and an expected recovery in business travel.
Looking ahead
We believe economic growth will proceed at a snail’s pace as countries and companies throughout the developed world strive to contain debt. Consumers have been attempting to reduce their own debt loads in response to high unemployment levels and shrunken housing values. With the public skittish about reentering the stock market, dividends could be an attractive incentive now that many corporate dividends exceed the yields on bonds of the same issuers. And of course, the upcoming elections will be important, as future monetary and fiscal policies take shape.
There has not yet been a widespread move by equity investors up the ladder of stock quality. But we believe that trend may not be far off, given the current appealing valuations on many high-grade, dividend-paying equities. Meanwhile, the fund’s positive cash flow allows us to continue to pursue our established investment policies.
Portfolio characteristics and holdings are subject to change and may not be representative of current characteristics and holdings. The outlook for the fund may differ from those presented for other Columbia Funds.
Equity securities are affected by stock market fluctuations that occur in response to economic and business developments.
Dividend payments are not guaranteed. The amount of a dividend payment, if any, can vary over time.
Value stocks are securities of companies that may have experienced adverse business or industry developments or may be subject to special risks that have caused the stocks to be out of favor. If the manager’s assessment of a company’s prospects is wrong, the price of its stock may not approach the value the manager has placed on it.
7
Investment Portfolio – Columbia Dividend Income Fund
September 30, 2010
Common Stocks – 92.6%
| | | | | | | | |
| | | Shares | | | Value ($) | |
| Consumer Discretionary – 8.1% | | | | | | | | |
| Hotels, Restaurants & Leisure – 1.8% | | | | | |
McDonald’s Corp. | | | 600,000 | | | | 44,706,000 | |
| | | | | | | | |
Hotels, Restaurants & Leisure Total | | | | | | | 44,706,000 | |
| |
| Media – 2.5% | | | | | |
McGraw-Hill Companies, Inc. | | | 440,000 | | | | 14,546,400 | |
Meredith Corp. | | | 570,000 | | | | 18,986,700 | |
Time Warner, Inc. | | | 965,000 | | | | 29,577,250 | |
| | | | | | | | |
Media Total | | | | | | | 63,110,350 | |
| |
| Multiline Retail – 1.7% | | | | | |
Nordstrom, Inc. | | | 365,000 | | | | 13,578,000 | |
Target Corp. | | | 565,000 | | | | 30,193,600 | |
| | | | | | | | |
Multiline Retail Total | | | | | | | 43,771,600 | |
| |
| Specialty Retail – 2.1% | | | | | |
Home Depot, Inc. | | | 960,000 | | | | 30,412,800 | |
Staples, Inc. | | | 440,000 | | | | 9,204,800 | |
TJX Companies, Inc. | | | 280,000 | | | | 12,496,400 | |
| | | | | | | | |
Specialty Retail Total | | | | | | | 52,114,000 | |
| | | | | | | | |
Consumer Discretionary Total | | | | | | | 203,701,950 | |
| | | | | | | | |
| Consumer Staples – 12.9% | | | | | | | | |
| Beverages – 2.3% | | | | | | | | |
Coca-Cola Co. | | | 260,000 | | | | 15,215,200 | |
Diageo PLC, ADR | | | 410,000 | | | | 28,294,100 | |
PepsiCo, Inc. | | | 225,000 | | | | 14,949,000 | |
| | | | | | | | |
Beverages Total | | | | | | | 58,458,300 | |
| |
| Food & Staples Retailing – 0.9% | | | | | |
Wal-Mart Stores, Inc. | | | 434,061 | | | | 23,230,945 | |
| | | | | | | | |
Food & Staples Retailing Total | | | | | | | 23,230,945 | |
| |
| Food Products – 3.1% | | | | | |
General Mills, Inc. | | | 545,000 | | | | 19,914,300 | |
H.J. Heinz Co. | | | 685,000 | | | | 32,448,450 | |
J.M. Smucker Co. | | | 190,000 | | | | 11,500,700 | |
Kraft Foods, Inc., Class A | | | 425,000 | | | | 13,115,500 | |
| | | | | | | | |
Food Products Total | | | | | | | 76,978,950 | |
| |
| Household Products – 2.7% | | | | | |
Kimberly-Clark Corp. | | | 465,000 | | | | 30,248,250 | |
Procter & Gamble Co. | | | 640,000 | | | | 38,380,800 | |
| | | | | | | | |
Household Products Total | | | | | | | 68,629,050 | |
| |
| Tobacco – 3.9% | | | | | |
Altria Group, Inc. | | | 1,200,000 | | | | 28,824,000 | |
Philip Morris International, Inc. | | | 1,260,000 | | | | 70,585,200 | |
| | | | | | | | |
Tobacco Total | | | | | | | 99,409,200 | |
| | | | | | | | |
Consumer Staples Total | | | | | | | 326,706,445 | |
| | | | | | | | |
| | | Shares | | | Value ($) | |
| Energy – 11.0% | | | | | | | | |
| Energy Equipment & Services – 1.9% | | | | | |
Schlumberger Ltd. | | | 348,300 | | | | 21,458,763 | |
Transocean Ltd. (a) | | | 400,000 | | | | 25,716,000 | |
| | | | | | | | |
Energy Equipment & Services Total | | | | | | | 47,174,763 | |
| |
| Oil, Gas & Consumable Fuels – 9.1% | | | | | |
Chevron Corp. | | | 600,000 | | | | 48,630,000 | |
ConocoPhillips | | | 290,000 | | | | 16,654,700 | |
Encana Corp. | | | 740,000 | | | | 22,370,200 | |
Exxon Mobil Corp. | | | 1,010,000 | | | | 62,407,900 | |
Murphy Oil Corp. | | | 170,000 | | | | 10,526,400 | |
Occidental Petroleum Corp. | | | 260,000 | | | | 20,358,000 | |
Royal Dutch Shell PLC, ADR | | | 810,000 | | | | 48,843,000 | |
| | | | | | | | |
Oil, Gas & Consumable Fuels Total | | | | | | | 229,790,200 | |
| | | | | | | | |
Energy Total | | | | | | | 276,964,963 | |
| | | | | | | | |
| Financials – 12.4% | | | | | |
| |
| Capital Markets – 3.5% | | | | | |
Eaton Vance Corp. | | | 645,000 | | | | 18,730,800 | |
Federated Investors, Inc., Class B | | | 800,000 | | | | 18,208,000 | |
Morgan Stanley | | | 600,000 | | | | 14,808,000 | |
Northern Trust Corp. | | | 460,000 | | | | 22,190,400 | |
T. Rowe Price Group, Inc. | | | 260,000 | | | | 13,016,900 | |
| | | | | | | | |
Capital Markets Total | | | | | | | 86,954,100 | |
| |
| Commercial Banks – 2.4% | | | | | |
PNC Financial Services Group, Inc. | | | 325,000 | | | | 16,870,750 | |
Toronto-Dominion Bank | | | 50,000 | | | | 3,613,000 | |
U.S. Bancorp | | | 790,000 | | | | 17,079,800 | |
Wells Fargo & Co. | | | 860,000 | | | | 21,611,800 | |
| | | | | | | | |
Commercial Banks Total | | | | | | | 59,175,350 | |
| | |
| Consumer Finance – 1.1% | | | | | | | | |
American Express Co. | | | 685,000 | | | | 28,790,550 | |
| | | | | | | | |
Consumer Finance Total | | | | | | | 28,790,550 | |
| |
| Diversified Financial Services – 1.8% | | | | | |
JPMorgan Chase & Co. | | | 1,188,000 | | | | 45,227,160 | |
| | | | | | | | |
Diversified Financial Services Total | | | | | | | 45,227,160 | |
| Insurance – 3.0% | | | | | | | | |
Arthur J. Gallagher & Co. | | | 690,000 | | | | 18,195,300 | |
Chubb Corp. | | | 290,000 | | | | 16,527,100 | |
MetLife, Inc. | | | 488,000 | | | | 18,763,600 | |
RenaissanceRe Holdings Ltd. | | | 110,000 | | | | 6,595,600 | |
See Accompanying Notes to Financial Statements.
8
Columbia Dividend Income Fund
September 30, 2010
Common Stocks (continued)
| | | | | | | | |
| | | Shares | | | Value ($) | |
| Financials (continued) | | | | | | | | |
Unum Group | | | 745,000 | | | | 16,501,750 | |
| | | | | | | | |
Insurance Total | | | | | | | 76,583,350 | |
| |
| Thrifts & Mortgage Finance – 0.6% | | | | | |
People’s United Financial, Inc. | | | 1,165,000 | | | | 15,249,850 | |
| | | | | | | | |
Thrifts & Mortgage Finance Total | | | | | | | 15,249,850 | |
| | | | | | | | |
Financials Total | | | | | | | 311,980,360 | |
| | | | | | | | |
| Health Care – 10.1% | | | | | | | | |
| Pharmaceuticals – 10.1% | | | | | |
Abbott Laboratories | | | 895,000 | | | | 46,754,800 | |
Bristol-Myers Squibb Co. | | | 1,940,000 | | | | 52,593,400 | |
Johnson & Johnson | | | 625,000 | | | | 38,725,000 | |
Merck & Co., Inc. | | | 1,775,000 | | | | 65,337,750 | |
Pfizer, Inc. | | | 3,025,000 | | | | 51,939,250 | |
| | | | | | | | |
Pharmaceuticals Total | | | | | | | 255,350,200 | |
| | | | | | | | |
Health Care Total | | | | | | | 255,350,200 | |
| | | | | | | | |
| Industrials – 10.1% | | | | | | | | |
| Aerospace & Defense – 3.5% | | | | | |
Honeywell International, Inc. | | | 710,000 | | | | 31,197,400 | |
Raytheon Co. | | | 580,000 | | | | 26,511,800 | |
United Technologies Corp. | | | 425,000 | | | | 30,272,750 | |
| | | | | | | | |
Aerospace & Defense Total | | | | | | | 87,981,950 | |
| |
| Commercial Services & Supplies – 0.9% | | | | | |
Waste Management, Inc. | | | 645,000 | | | | 23,052,300 | |
| | | | | | | | |
Commercial Services & Supplies Total | | | | | | | 23,052,300 | |
| |
| Electrical Equipment – 0.8% | | | | | |
Emerson Electric Co. | | | 385,000 | | | | 20,274,100 | |
| | | | | | | | |
Electrical Equipment Total | | | | | | | 20,274,100 | |
| |
| Industrial Conglomerates – 1.1% | | | | | |
General Electric Co. | | | 1,760,000 | | | | 28,600,000 | |
| | | | | | | | |
Industrial Conglomerates Total | | | | | | | 28,600,000 | |
| |
| Machinery – 3.1% | | | | | |
Deere & Co. | | | 340,000 | | | | 23,725,200 | |
Dover Corp. | | | 425,000 | | | | 22,189,250 | |
Illinois Tool Works, Inc. | | | 275,000 | | | | 12,930,500 | |
Parker Hannifin Corp. | | | 275,000 | | | | 19,266,500 | |
| | | | | | | | |
Machinery Total | | | | | | | 78,111,450 | |
| |
| Road & Rail – 0.7% | | | | | |
Norfolk Southern Corp. | | | 292,500 | | | | 17,406,675 | |
| | | | | | | | |
Road & Rail Total | | | | | | | 17,406,675 | |
| | | | | | | | |
Industrials Total | | | | | | | 255,426,475 | |
| | | | | | | | |
| | | Shares | | | Value ($) | |
| Information Technology – 9.5% | | | | | | | | |
| Computers & Peripherals – 0.8% | | | | | |
Hewlett-Packard Co. | | | 485,000 | | | | 20,403,950 | |
| | | | | | | | |
Computers & Peripherals Total | | | | | | | 20,403,950 | |
| |
| IT Services – 3.6% | | | | | |
Automatic Data Processing, Inc. | | | 525,000 | | | | 22,065,750 | |
International Business Machines Corp. | | | 510,000 | | | | 68,411,400 | |
| | | | | | | | |
IT Services Total | | | | | | | 90,477,150 | |
| |
| Office Electronics – 0.5% | | | | | |
Canon, Inc., ADR | | | 290,000 | | | | 13,548,800 | |
| | | | | | | | |
Office Electronics Total | | | | | | | 13,548,800 | |
| |
| Semiconductors & Semiconductor Equipment – 2.8% | | | | | |
Intel Corp. | | | 2,285,000 | | | | 43,940,550 | |
Linear Technology Corp. | | | 210,000 | | | | 6,453,300 | |
Texas Instruments, Inc. | | | 750,000 | | | | 20,355,000 | |
| | | | | | | | |
Semiconductors & Semiconductor Equipment Total | | | | | | | 70,748,850 | |
| |
| Software – 1.8% | | | | | |
Microsoft Corp. | | | 1,840,000 | | | | 45,061,600 | |
| | | | | | | | |
Software Total | | | | | | | 45,061,600 | |
| | | | | | | | |
Information Technology Total | | | | | | | 240,240,350 | |
| | | | | | | | |
| Materials – 5.5% | | | | | | | | |
| Chemicals – 3.4% | | | | | |
E.I. du Pont de Nemours & Co. | | | 365,000 | | | | 16,286,300 | |
International Flavors & Fragrances, Inc. | | | 300,000 | | | | 14,556,000 | |
RPM International, Inc. | | | 605,000 | | | | 12,051,600 | |
Sherwin-Williams Co. | | | 565,000 | | | | 42,454,100 | |
| | | | | | | | |
Chemicals Total | | | | | | | 85,348,000 | |
| |
| Containers & Packaging – 0.7% | | | | | |
Sonoco Products Co. | | | 525,000 | | | | 17,556,000 | |
| | | | | | | | |
Containers & Packaging Total | | | | | | | 17,556,000 | |
| |
| Metals & Mining – 1.4% | | | | | |
BHP Billiton Ltd., ADR | | | 210,000 | | | | 16,027,200 | |
Nucor Corp. | | | 505,000 | | | | 19,291,000 | |
| | | | | | | | |
Metals & Mining Total | | | | | | | 35,318,200 | |
| | | | | | | | |
Materials Total | | | | | | | 138,222,200 | |
| | | | | | | | |
See Accompanying Notes to Financial Statements.
9
Columbia Dividend Income Fund
September 30, 2010
Common Stocks (continued)
| | | | | | | | |
| | | Shares | | | Value ($) | |
| Telecommunication Services – 7.1% | |
| Diversified Telecommunication Services – 7.1% | | | | | |
AT&T, Inc. | | | 3,040,000 | | | | 86,944,000 | |
Frontier Communications Corp. | | | 720,000 | | | | 5,882,400 | |
Verizon Communications, Inc. | | | 2,435,000 | | | | 79,356,650 | |
Windstream Corp. | | | 610,000 | | | | 7,496,900 | |
| | | | | | | | |
Diversified Telecommunication
Services Total | | | | 179,679,950 | |
| | | | | | | | |
Telecommunication Services Total | | | | 179,679,950 | |
| | | | | | | | |
| Utilities – 5.9% | | | | | | | | |
| Electric Utilities – 3.2% | | | | | |
American Electric Power Co., Inc. | | | 420,000 | | | | 15,216,600 | |
Entergy Corp. | | | 125,000 | | | | 9,566,250 | |
Exelon Corp. | | | 230,000 | | | | 9,793,400 | |
FirstEnergy Corp. | | | 450,000 | | | | 17,343,000 | |
NextEra Energy, Inc. | | | 205,000 | | | | 11,149,950 | |
PPL Corp. | | | 665,000 | | | | 18,107,950 | |
| | | | | | | | |
Electric Utilities Total | | | | | | | 81,177,150 | |
| | |
| Gas Utilities – 0.7% | | | | | | | | |
National Fuel Gas Co. | | | 340,000 | | | | 17,615,400 | |
| | | | | | | | |
Gas Utilities Total | | | | | | | 17,615,400 | |
| | |
| Multi-Utilities – 2.0% | | | | | | | | |
PG&E Corp. | | | 305,000 | | | | 13,853,100 | |
Public Service Enterprise Group, Inc. | | | 600,000 | | | | 19,848,000 | |
Sempra Energy | | | 280,000 | | | | 15,064,000 | |
| | | | | | | | |
Multi-Utilities Total | | | | | | | 48,765,100 | |
| | | | | | | | |
Utilities Total | | | | | | | 147,557,650 | |
| | | | | | | | |
Total Common Stocks
(cost of $2,099,841,336) | | | | | | | 2,335,830,543 | |
| |
Convertible Preferred Stock – 0.5% | | | | | |
| | | | | | | | |
| Consumer Staples – 0.5% | | | | | | | | |
| | |
| Food Products – 0.5% | | | | | | | | |
Archer-Daniels-Midland Co., 6.250% | | | 325,000 | | | | 13,435,500 | |
| | | | | | | | |
Food Products Total | | | | | | | 13,435,500 | |
| | | | | | | | |
Consumer Staples Total | | | | 13,435,500 | |
| | | | | | | | |
Total Convertible Preferred Stock
(cost of $12,291,823) | | | | 13,435,500 | |
Investment Company – 2.5%
| | | | | | | | |
| | | Shares | | | Value ($) | |
SPDR S&P 500 ETF Trust | | | 550,000 | | | | 62,766,000 | |
| | | | | | | | |
Total Investment Company
(cost of $62,605,115) | | | | 62,766,000 | |
| | |
Short-Term Obligation – 4.2% | | | | | | | | |
| | | Par ($) | | | | |
Repurchase agreement with Fixed Income Clearing Corp., dated 09/30/10, due 10/01/10 at 0.220%, collateralized by a U.S. Treasury obligation maturing 08/15/19, market value $107,712,000 (repurchase proceeds $105,599,645) | | | 105,599,000 | | | | 105,599,000 | |
| | | | | | | | |
Total Short-Term Obligation
(cost of $105,599,000) | | | | 105,599,000 | |
| | | | | | | | |
Total Investments – 99.8%
(cost of $2,280,337,274)(b) | | | | 2,517,631,043 | |
| | | | | | | | |
Other Assets & Liabilities, Net – 0.2% | | | | 6,213,032 | |
| | | | | | | | |
Net Assets – 100.0% | | | | | | | 2,523,844,075 | |
Notes to Investment Portfolio:
| (a) | Non-income producing security. |
| (b) | Cost for federal income tax purposes is $2,280,939,069. |
The following table summarizes the inputs used, as of September 30, 2010, in valuing the Fund’s assets:
| | | | | | | | | | | | | | | | |
Description | | Quoted Prices (Level 1) | | | Other Significant
Observable Inputs (Level 2) | | | Significant
Unobservable
Inputs (Level 3) | | | Total | |
Total Common Stocks | | $ | 2,335,830,543 | | | $ | — | | | $ | — | | | $ | 2,335,830,543 | |
| | | | | | | | | | | | | | | | |
Total Convertible Preferred Stock | | | 13,435,500 | | | | — | | | | — | | | | 13,435,500 | |
| | | | | | | | | | | | | | | | |
Total Investment Company | | | 62,766,000 | | | | — | | | | — | | | | 62,766,000 | |
| | | | | | | | | | | | | | | | |
Total Short-Term Obligation | | | — | | | | 105,599,000 | | | | — | | | | 105,599,000 | |
| | | | | | | | | | | | | | | | |
Total Investments | | $ | 2,412,032,043 | | | $ | 105,599,000 | | | $ | — | | | $ | 2,517,631,043 | |
| | | | | | | | | | | | | | | | |
Certain short-term obligations may be valued using amortized cost, an income approach which converts future cash flows to a present value based upon the premium or discount at purchase.
There were no significant transfers of financial assets between Levels 1 and 2 during the period.
For more information on valuation inputs, and their aggregation into the levels used in the above table, please refer to the Security Valuation section in the accompanying Notes to Financial Statements.
See Accompanying Notes to Financial Statements.
10
Columbia Dividend Income Fund
September 30, 2010
At September 30, 2010, the Fund held investments in the following sectors:
| | | | |
Sector Allocation (Unaudited) | | % of
Net Assets | |
Consumer Staples | | | 13.4 | |
Financials | | | 12.4 | |
Energy | | | 11.0 | |
Industrials | | | 10.1 | |
Health Care | | | 10.1 | |
Information Technology | | | 9.5 | |
Consumer Discretionary | | | 8.1 | |
Telecommunication Services | | | 7.1 | |
Utilities | | | 5.9 | |
Materials | | | 5.5 | |
| | | | |
| | | 93.1 | |
Investment Company | | | 2.5 | |
Short-Term Obligation | | | 4.2 | |
Other Assets & Liabilities, Net | | | 0.2 | |
| | | | |
| | | 100.0 | |
| | | | |
| | |
Acronym | | Name |
| ADR | | American Depositary Receipt |
See Accompanying Notes to Financial Statements.
11
Statement of Assets and Liabilities – Columbia Dividend Income Fund
September 30, 2010
| | | | | | |
| | | | | ($) | |
| Assets | | Investments, at identified cost | | | 2,280,337,274 | |
| | | | | | |
| | Investments, at value | | | 2,517,631,043 | |
| | Cash | | | 939 | |
| | Receivable for: | | | | |
| | Investments sold | | | 6,454,898 | |
| | Fund shares sold | | | 9,835,400 | |
| | Dividends | | | 7,078,535 | |
| | Interest | | | 645 | |
| | Expense reimbursement due from investment advisor | | | 280,142 | |
| | Trustees’ deferred compensation plan | | | 106,811 | |
| | Prepaid expenses | | | 30,459 | |
| | | | | | |
| | Total Assets | | | 2,541,418,872 | |
| | |
| Liabilities | | Payable for: | | | | |
| | Investments purchased | | | 13,262,691 | |
| | Fund shares repurchased | | | 2,048,479 | |
| | Investment advisory fee | | | 1,230,916 | |
| | Administration fee | | | 134,929 | |
| | Pricing and bookkeeping fees | | | 11,934 | |
| | Transfer agent fee | | | 413,220 | |
| | Trustees’ fees | | | 93 | |
| | Custody fee | | | 9,505 | |
| | Distribution and service fees | | | 257,294 | |
| | Chief compliance officer expenses | | | 797 | |
| | Trustees’ deferred compensation plan | | | 106,811 | |
| | Other liabilities | | | 98,128 | |
| | | | | | |
| | Total Liabilities | | | 17,574,797 | |
| | |
| | | | | | |
| | Net Assets | | | 2,523,844,075 | |
| | |
| Net Assets Consist of | | Paid-in capital | | | 2,385,542,698 | |
| | Undistributed net investment income | | | 648,759 | |
| | Accumulated net realized loss | | | (99,641,151 | ) |
| | Net unrealized appreciation on investments | | | 237,293,769 | |
| | | | | | |
| | Net Assets | | | 2,523,844,075 | |
See Accompanying Notes to Financial Statements.
12
Statement of Assets and Liabilities (continued) – Columbia Dividend Income Fund
September 30, 2010
| | | | | | |
| | | | | | |
| Class A | | Net assets | | $ | 728,218,616 | |
| | Shares outstanding | | | 60,060,516 | |
| | Net asset value per share | | $ | 12.12 | (a) |
| | Maximum sales charge | | | 5.75 | % |
| | Maximum offering price per share($12.12/0.9425) | | $ | 12.86 | (b) |
| | |
| Class B | | Net assets | | $ | 21,126,333 | |
| | Shares outstanding | | | 1,781,705 | |
| | Net asset value and offering price per share | | $ | 11.86 | (a) |
| | |
| Class C | | Net assets | | $ | 94,091,042 | |
| | Shares outstanding | | | 7,941,406 | |
| | Net asset value and offering price per share | | $ | 11.85 | (a) |
| | |
| Class I (c) | | Net assets | | $ | 2,499 | |
| | Shares outstanding | | | 206 | |
| | Net asset value, offering and redemption price per share | | $ | 12.13 | |
| | |
| Class R | | Net assets | | $ | 8,577,453 | |
| | Shares outstanding | | | 707,057 | |
| | Net asset value, offering and redemption price per share | | $ | 12.13 | |
| | |
| Class T | | Net assets | | $ | 80,405,173 | |
| | Shares outstanding | | | 6,630,315 | |
| | Net asset value per share | | $ | 12.13 | (a) |
| | Maximum sales charge | | | 5.75 | % |
| | Maximum offering price per share($12.13/0.9425) | | $ | 12.87 | (b) |
| | |
| Class W (c) | | Net assets | | $ | 2,498 | |
| | Shares outstanding | | | 206 | |
| | Net asset value, offering and redemption price per share | | $ | 12.12 | (d) |
| | |
| Class Z | | Net assets | | $ | 1,591,420,461 | |
| | Shares outstanding | | | 131,201,543 | |
| | Net asset value, offering and redemption price per share | | $ | 12.13 | |
| (a) | Redemption price per share is equal to net asset value less any applicable contingent deferred sales charge. |
| (b) | On sales of $50,000 or more the offering price is reduced. |
| (c) | Shares commenced operations on September 27, 2010. |
| (d) | Net asset value per share rounds to this amount due to fractional shares outstanding. |
See Accompanying Notes to Financial Statements.
13
Statement of Operations – Columbia Dividend Income Fund
For the Year Ended September 30, 2010
| | | | | | |
| | | | | ($) (a) | |
| Investment Income | | Dividends | | | 73,809,419 | |
| | Interest | | | 480,092 | |
| | Foreign taxes withheld | | | (514,729 | ) |
| | | | | | |
| | Total Investment Income | | | 73,774,782 | |
| | |
| Expenses | | Investment advisory fee | | | 13,230,692 | |
| | Administration fee | | | 1,429,520 | |
| | Distribution fee: | | | | |
| | Class B | | | 184,600 | |
| | Class C | | | 532,546 | |
| | Class R | | | 19,027 | |
| | Service fee: | | | | |
| | Class A | | | 1,539,059 | |
| | Class B | | | 61,533 | |
| | Class C | | | 177,515 | |
| | Class W | | | — | * |
| | Shareholder services fee – Class T | | | 239,195 | |
| | Transfer agent fee – Class A, Class B, Class C, Class R, Class T, Class W and Class Z | | | 1,917,108 | |
| | Pricing and bookkeeping fees | | | 141,503 | |
| | Trustees’ fees | | | 86,443 | |
| | Custody fee | | | 55,155 | |
| | Chief compliance officer expenses | | | 2,452 | |
| | Other expenses | | | 670,971 | |
| | | | | | |
| | Total Expenses | | | 20,287,319 | |
| | |
| | Fees waived or expenses reimbursed by investment advisor | | | (466,874 | ) |
| | Expense reductions | | | (66 | ) |
| | | | | | |
| | Net Expenses | | | 19,820,379 | |
| | |
| | | | | | |
| | Net Investment Income | | | 53,954,403 | |
| | |
| Net Realized and Unrealized Gain (Loss) on Investments | | Net realized gain on investments | | | 43,830,633 | |
| | Net change in unrealized appreciation on investments | | | 114,609,413 | |
| | | | | | |
| | Net Gain | | | 158,440,046 | |
| | |
| | | | | | |
| | Net Increase Resulting from Operations | | | 212,394,449 | |
| (a) | Class I and Class W shares commenced operations on September 27, 2010. |
See Accompanying Notes to Financial Statements.
14
Statement of Changes in Net Assets – Columbia Dividend Income Fund
| | | | | | | | | | |
| Increase (Decrease) in Net Assets | | | | Year Ended
September 30,
2010 ($)(a) | | | Year Ended
September 30,
2009 ($) | |
| Operations | | Net investment income | | | 53,954,403 | | | | 37,742,177 | |
| | Net realized gain (loss) on investments | | | 43,830,633 | | | | (97,509,148 | ) |
| | Net change in unrealized appreciation (depreciation) on investments | | | 114,609,413 | | | | 103,911,886 | |
| | | | | | | | | | |
| | Net increase resulting from operations | | | 212,394,449 | | | | 44,144,915 | |
| | | |
| Distributions to Shareholders | | From net investment income: | | | | | | | | |
| | Class A | | | (15,010,735 | ) | | | (9,328,760 | ) |
| | Class B | | | (408,584 | ) | | | (520,145 | ) |
| | Class C | | | (1,243,004 | ) | | | (572,360 | ) |
| | Class R | | | (90,437 | ) | | | (3,846 | ) |
| | Class T | | | (1,868,788 | ) | | | (1,630,665 | ) |
| | Class Z | | | (36,042,620 | ) | | | (25,318,495 | ) |
| | | | | | | | | | |
| | Total distributions to shareholders | | | (54,664,168 | ) | | | (37,374,271 | ) |
| | | |
| | Net Capital Stock Transactions | | | 671,056,299 | | | | 621,633,779 | |
| | Increase from regulatory settlements | | | — | | | | 665,701 | |
| | | | | | | | | | |
| | Total increase in net assets | | | 828,786,580 | | | | 629,070,124 | |
| | | |
| Net Assets | | Beginning of period | | | 1,695,057,495 | | | | 1,065,987,371 | |
| | End of period | | | 2,523,844,075 | | | | 1,695,057,495 | |
| | Undistributed net investment income at end of period | | | 648,759 | | | | 1,358,520 | |
| (a) | Class I and Class W shares commenced operations on September 27, 2010. |
See Accompanying Notes to Financial Statements.
15
Statement of Changes in Net Assets (continued) – Columbia Dividend Income Fund
| | | | | | | | | | | | | | | | |
| | | Capital Stock Activity | |
| | | Year Ended
September 30, 2010 | | | Year Ended
September 30, 2009 | |
| | | Shares | | | Dollars ($) | | | Shares | | | Dollars ($) | |
Class A | | | | | | | | | | | | | | | | |
Subscriptions | | | 27,619,891 | | | | 326,418,937 | | | | 27,895,461 | | | | 276,099,772 | |
Distributions reinvested | | | 1,091,127 | | | | 12,956,124 | | | | 778,447 | | | | 7,861,416 | |
Redemptions | | | (11,936,159 | ) | | | (140,954,594 | ) | | | (8,547,450 | ) | | | (85,291,578 | ) |
| | | | | | | | | | | | | | | | |
Net increase | | | 16,774,859 | | | | 198,420,467 | | | | 20,126,458 | | | | 198,669,610 | |
| | | | |
Class B | | | | | | | | | | | | | | | | |
Subscriptions | | | 287,214 | | | | 3,327,780 | | | | 1,129,813 | | | | 10,598,969 | |
Distributions reinvested | | | 28,145 | | | | 326,729 | | | | 44,163 | | | | 430,960 | |
Redemptions | | | (1,094,271 | ) | | | (12,733,090 | ) | | | (1,277,029 | ) | | | (12,135,167 | ) |
| | | | | | | | | | | | | | | | |
Net decrease | | | (778,912 | ) | | | (9,078,581 | ) | | | (103,053 | ) | | | (1,105,238 | ) |
| | | | |
Class C | | | | | | | | | | | | | | | | |
Subscriptions | | | 4,345,783 | | | | 50,314,346 | | | | 3,828,234 | | | | 36,845,519 | |
Distributions reinvested | | | 78,265 | | | | 908,798 | | | | 43,574 | | | | 432,821 | |
Redemptions | | | (914,304 | ) | | | (10,483,246 | ) | | | (515,925 | ) | | | (5,019,427 | ) |
| | | | | | | | | | | | | | | | |
Net increase | | | 3,509,744 | | | | 40,739,898 | | | | 3,355,883 | | | | 32,258,913 | |
| | | | |
Class I (a)(b) | | | | | | | | | | | | | | | | |
Subscriptions | | | 206 | | | | 2,500 | | | | — | | | | — | |
| | | | | | | | | | | | | | | | |
Net increase | | | 206 | | | | 2,500 | | | | — | | | | — | |
| | | | |
Class R | | | | | | | | | | | | | | | | |
Subscriptions | | | 758,691 | | | | 9,240,343 | | | | 57,996 | | | | 584,229 | |
Distributions reinvested | | | 6,868 | | | | 81,266 | | | | 346 | | | | 3,834 | |
Redemptions | | | (117,253 | ) | | | (1,359,907 | ) | | | (503 | ) | | | (5,468 | ) |
| | | | | | | | | | | | | | | | |
Net increase | | | 648,306 | | | | 7,961,702 | | | | 57,839 | | | | 582,595 | |
| | | | |
Class T | | | | | | | | | | | | | | | | |
Subscriptions | | | 784,478 | | | | 9,235,572 | | | | 1,258,177 | | | | 12,683,562 | |
Distributions reinvested | | | 146,661 | | | | 1,740,293 | | | | 156,696 | | | | 1,572,896 | |
Redemptions | | | (898,540 | ) | | | (10,598,500 | ) | | | (830,271 | ) | | | (8,164,564 | ) |
| | | | | | | | | | | | | | | | |
Net increase | | | 32,599 | | | | 377,365 | | | | 584,602 | | | | 6,091,894 | |
| | | | |
Class W (a)(b) | | | | | | | | | | | | | | | | |
Subscriptions | | | 206 | | | | 2,500 | | | | — | | | | — | |
| | | | | | | | | | | | | | | | |
Net increase | | | 206 | | | | 2,500 | | | | — | | | | — | |
| | | | |
Class Z | | | | | | | | | | | | | | | | |
Subscriptions | | | 62,622,462 | | | | 742,481,198 | | | | 71,665,405 | | | | 704,770,708 | |
Distributions reinvested | | | 971,154 | | | | 11,539,013 | | | | 524,210 | | | | 5,276,709 | |
Redemptions | | | (27,195,653 | ) | | | (321,389,763 | ) | | | (33,309,318 | ) | | | (324,911,412 | ) |
| | | | | | | | | | | | | | | | |
Net increase | | | 36,397,963 | | | | 432,630,448 | | | | 38,880,297 | | | | 385,136,005 | |
| (a) | Shares commenced operations on September 27, 2010. |
| (b) | Shares reflect activity for the period September 27, 2010 through September 30, 2010. |
See Accompanying Notes to Financial Statements.
16
Financial Highlights – Columbia Dividend Income Fund
Selected data for a share outstanding throughout each period is as follows:
| | | | | | | | | | | | | | | | | | | | |
| | | Year Ended September 30, | |
| Class A Shares | | 2010 | | | 2009 | | | 2008 | | | 2007 | | | 2006 | |
Net Asset Value, Beginning of Period | | $ | 11.18 | | | $ | 12.01 | | | $ | 15.35 | | | $ | 13.45 | | | $ | 12.01 | |
| | | | | |
Income from Investment Operations: | | | | | | | | | | | | | | | | | | | | |
Net investment income (a) | | | 0.28 | | | | 0.29 | | | | 0.31 | | | | 0.28 | | | | 0.26 | |
Net realized and unrealized gain (loss) on investments | | | 0.94 | | | | (0.86 | ) | | | (3.18 | ) | | | 2.02 | | | | 1.45 | |
| | | | | | | | | | | | | | | | | | | | |
Total from investment operations | | | 1.22 | | | | (0.57 | ) | | | (2.87 | ) | | | 2.30 | | | | 1.71 | |
| | | | | |
Less Distributions to Shareholders: | | | | | | | | | | | | | | | | | | | | |
From net investment income | | | (0.28 | ) | | | (0.27 | ) | | | (0.31 | ) | | | (0.27 | ) | | | (0.27 | ) |
From net realized gains | | | — | | | | — | | | | (0.16 | ) | | | (0.13 | ) | | | — | |
| | | | | | | | | | | | | | | | | | | | |
Total distributions to shareholders | | | (0.28 | ) | | | (0.27 | ) | | | (0.47 | ) | | | (0.40 | ) | | | (0.27 | ) |
| | | | | |
Increase from regulatory settlements | | | — | | | | 0.01 | | | | — | | | | — | | | | — | |
| | | | | |
Net Asset Value, End of Period | | $ | 12.12 | | | $ | 11.18 | | | $ | 12.01 | | | $ | 15.35 | | | $ | 13.45 | |
Total return (b)(c) | | | 11.02 | % | | | (4.33 | )% | | | (19.06 | )% | | | 17.31 | % | | | 14.45 | % |
| | | | | |
Ratios to Average Net Assets/Supplemental Data: | | | | | | | | | | | | | | | | | | | | |
Net expenses (d) | | | 1.05 | % | | | 1.05 | % | | | 1.05 | % | | | 1.05 | % | | | 1.05 | % |
Waiver/Reimbursement | | | 0.02 | % | | | 0.06 | % | | | 0.06 | % | | | 0.07 | % | | | 0.12 | % |
Net investment income (d) | | | 2.41 | % | | | 2.88 | % | | | 2.24 | % | | | 1.90 | % | | | 2.19 | % |
Portfolio turnover rate | | | 17 | % | | | 23 | % | | | 16 | % | | | 21 | % | | | 52 | % |
Net assets, end of period (000s) | | $ | 728,219 | | | $ | 483,916 | | | $ | 278,122 | | | $ | 370,358 | | | $ | 345,595 | |
| (a) | Per share data was calculated using the average shares outstanding during the period. |
| (b) | Had the investment advisor and/or any of its affiliates not waived fees or reimbursed a portion of expenses, total return would have been reduced. |
| (c) | Total return at net asset value assuming all distributions reinvested and no initial sales charge or contingent deferred sales charge. |
| (d) | The benefits derived from expense reductions had an impact of less than 0.01%. |
See Accompanying Notes to Financial Statements.
17
Financial Highlights – Columbia Dividend Income Fund
Selected data for a share outstanding throughout each period is as follows:
| | | | | | | | | | | | | | | | | | | | |
| | | Year Ended September 30, | |
| Class B Shares | | 2010 | | | 2009 | | | 2008 | | | 2007 | | | 2006 | |
Net Asset Value, Beginning of Period | | $ | 10.94 | | | $ | 11.75 | | | $ | 15.03 | | | $ | 13.17 | | | $ | 11.77 | |
| | | | | |
Income from Investment Operations: | | | | | | | | | | | | | | | | | | | | |
Net investment income (a) | | | 0.19 | | | | 0.21 | | | | 0.20 | | | | 0.16 | | | | 0.16 | |
Net realized and unrealized gain (loss) on investments | | | 0.93 | | | | (0.82 | ) | | | (3.11 | ) | | | 1.99 | | | | 1.42 | |
| | | | | | | | | | | | | | | | | | | | |
Total from investment operations | | | 1.12 | | | | (0.61 | ) | | | (2.91 | ) | | | 2.15 | | | | 1.58 | |
| | | | | |
Less Distributions to Shareholders: | | | | | | | | | | | | | | | | | | | | |
From net investment income | | | (0.20 | ) | | | (0.20 | ) | | | (0.21 | ) | | | (0.16 | ) | | | (0.18 | ) |
From net realized gains | | | — | | | | — | | | | (0.16 | ) | | | (0.13 | ) | | | — | |
| | | | | | | | | | | | | | | | | | | | |
Total distributions to shareholders | | | (0.20 | ) | | | (0.20 | ) | | | (0.37 | ) | | | (0.29 | ) | | | (0.18 | ) |
| | | | | |
Increase from regulatory settlements | | | — | | | | — | (b) | | | — | | | | — | | | | — | |
| | | | | |
Net Asset Value, End of Period | | $ | 11.86 | | | $ | 10.94 | | | $ | 11.75 | | | $ | 15.03 | | | $ | 13.17 | |
Total return (c)(d) | | | 10.24 | % | | | (4.97 | )% | | | (19.71 | )% | | | 16.49 | % | | | 13.55 | % |
| | | | | |
Ratios to Average Net Assets/Supplemental Data: | | | | | | | | | | | | | | | | | | | | |
Net expenses (e) | | | 1.80 | % | | | 1.80 | % | | | 1.80 | % | | | 1.80 | % | | | 1.80 | % |
Waiver/Reimbursement | | | 0.02 | % | | | 0.06 | % | | | 0.06 | % | | | 0.07 | % | | | 0.12 | % |
Net investment income (e) | | | 1.67 | % | | | 2.18 | % | | | 1.48 | % | | | 1.16 | % | | | 1.30 | % |
Portfolio turnover rate | | | 17 | % | | | 23 | % | | | 16 | % | | | 21 | % | | | 52 | % |
Net assets, end of period (000s) | | $ | 21,126 | | | $ | 28,006 | | | $ | 31,307 | | | $ | 52,937 | | | $ | 57,644 | |
| (a) | Per share data was calculated using the average shares outstanding during the period. |
| (b) | Rounds to less than $0.01 per share. |
| (c) | Total return at net asset value assuming all distributions reinvested and no contingent deferred sales charge. |
| (d) | Had the investment advisor and/or any of its affiliates not waived fees or reimbursed a portion of expenses, total return would have been reduced. |
| (e) | The benefits derived from expense reductions had an impact of less than 0.01%. |
See Accompanying Notes to Financial Statements.
18
Financial Highlights – Columbia Dividend Income Fund
Selected data for a share outstanding throughout each period is as follows:
| | | | | | | | | | | | | | | | | | | | |
| | | Year Ended September 30, | |
| Class C Shares | | 2010 | | | 2009 | | | 2008 | | | 2007 | | | 2006 | |
Net Asset Value, Beginning of Period | | $ | 10.93 | | | $ | 11.74 | | | $ | 15.02 | | | $ | 13.17 | | | $ | 11.76 | |
| | | | | |
Income from Investment Operations: | | | | | | | | | | | | | | | | | | | | |
Net investment income (a) | | | 0.19 | | | | 0.20 | | | | 0.20 | | | | 0.16 | | | | 0.16 | |
Net realized and unrealized gain (loss) on investments | | | 0.93 | | | | (0.82 | ) | | | (3.11 | ) | | | 1.98 | | | | 1.43 | |
| | | | | | | | | | | | | | | | | | | | |
Total from investment operations | | | 1.12 | | | | (0.62 | ) | | | (2.91 | ) | | | 2.14 | | | | 1.59 | |
| | | | | |
Less Distributions to Shareholders: | | | | | | | | | | | | | | | | | | | | |
From net investment income | | | (0.20 | ) | | | (0.20 | ) | | | (0.21 | ) | | | (0.16 | ) | | | (0.18 | ) |
From net realized gains | | | — | | | | — | | | | (0.16 | ) | | | (0.13 | ) | | | — | |
| | | | | | | | | | | | | | | | | | | | |
Total distributions to shareholders | | | (0.20 | ) | | | (0.20 | ) | | | (0.37 | ) | | | (0.29 | ) | | | (0.18 | ) |
| | | | | |
Increase from regulatory settlements | | | — | | | | 0.01 | | | | — | | | | — | | | | — | |
| | | | | |
Net Asset Value, End of Period | | $ | 11.85 | | | $ | 10.93 | | | $ | 11.74 | | | $ | 15.02 | | | $ | 13.17 | |
Total return (b)(c) | | | 10.25 | % | | | (4.98 | )% | | | (19.72 | )% | | | 16.42 | % | | | 13.64 | % |
| | | | | |
Ratios to Average Net Assets/Supplemental Data: | | | | | | | | | | | | | | | | | | | | |
Net expenses (d) | | | 1.80 | % | | | 1.80 | % | | | 1.80 | % | | | 1.80 | % | | | 1.80 | % |
Waiver/Reimbursement | | | 0.02 | % | | | 0.06 | % | | | 0.06 | % | | | 0.07 | % | | | 0.12 | % |
Net investment income (d) | | | 1.66 | % | | | 2.08 | % | | | 1.48 | % | | | 1.14 | % | | | 1.29 | % |
Portfolio turnover rate | | | 17 | % | | | 23 | % | | | 16 | % | | | 21 | % | | | 52 | % |
Net assets, end of period (000s) | | $ | 94,091 | | | $ | 48,438 | | | $ | 12,635 | | | $ | 20,622 | | | $ | 12,950 | |
| (a) | Per share data was calculated using the average shares outstanding during the period. |
| (b) | Had the investment advisor and/or any of its affiliates not waived fees or reimbursed a portion of expenses, total return would have been reduced. |
| (c) | Total return at net asset value assuming all distributions reinvested and no contingent deferred sales charge. |
| (d) | The benefits derived from expense reductions had an impact of less than 0.01%. |
See Accompanying Notes to Financial Statements.
19
Financial Highlights – Columbia Dividend Income Fund
Selected data for a share outstanding throughout the period is as follows:
| | | | |
| Class I Shares | | Period Ended
September 30,
2010 (a) | |
Net Asset Value, Beginning of Period | | $ | 12.14 | |
| |
Income from Investment Operations: | | | | |
Net investment income (b) | | | 0.01 | |
Net realized and unrealized loss on investments | | | (0.02 | ) |
| | | | |
Total from investment operations | | | (0.01 | ) |
| |
Net Asset Value, End of Period | | $ | 12.13 | |
Total return (c)(d) | | | (0.08 | )% |
| |
Ratios to Average Net Assets/Supplemental Data: | | | | |
Net expenses (e)(f) | | | 0.71 | % |
Net investment income (e)(f) | | | 8.17 | % |
Portfolio turnover rate (d) | | | 17 | % |
Net assets, end of period (000s) | | $ | 2 | |
| (a) | Class I shares commenced operations on September 27, 2010. Per share data and total return reflect activity from that date. |
| (b) | Per share data was calculated using the average shares outstanding during the period. |
| (c) | Total return at net asset value. |
| (e) | The benefits derived from expense reductions had an impact of less than 0.01%. |
See Accompanying Notes to Financial Statements.
20
Financial Highlights – Columbia Dividend Income Fund
Selected data for a share outstanding throughout each period is as follows:
| | | | | | | | | | | | |
| | | Year Ended
September 30, | | | Period Ended
September 30, | |
| Class R Shares | | 2010 | | | 2009 | | | 2008 (a) | |
Net Asset Value, Beginning of Period | | $ | 11.18 | | | $ | 12.01 | | | $ | 13.39 | |
| | | |
Income from Investment Operations: | | | | | | | | | | | | |
Net investment income (b) | | | 0.27 | | | | 0.28 | | | | 0.14 | |
Net realized and unrealized gain (loss) on investments | | | 0.93 | | | | (0.86 | ) | | | (1.38 | ) |
| | | | | | | | | | | | |
Total from investment operations | | | 1.20 | | | | (0.58 | ) | | | (1.24 | ) |
| | | |
Less Distributions to Shareholders: | | | | | | | | | | | | |
From net investment income | | | (0.25 | ) | | | (0.25 | ) | | | (0.14 | ) |
| | | |
Increase from regulatory settlements | | | — | | | | — | (c) | | | — | |
| | | |
Net Asset Value, End of Period | | $ | 12.13 | | | $ | 11.18 | | | $ | 12.01 | |
Total return (d)(e) | | | 10.84 | % | | | (4.57 | )% | | | (9.28 | )%(f) |
| | | |
Ratios to Average Net Assets/Supplemental Data: | | | | | | | | | | | | |
Net expenses (g) | | | 1.30 | % | | | 1.30 | % | | | 1.30 | %(h) |
Waiver/Reimbursement | | | 0.02 | % | | | 0.06 | % | | | 0.06 | %(h) |
Net investment income (g) | | | 2.27 | % | | | 2.59 | % | | | 2.10 | %(h) |
Portfolio turnover rate | | | 17 | % | | | 23 | % | | | 16 | %(f) |
Net assets, end of period (000s) | | $ | 8,577 | | | $ | 657 | | | $ | 11 | |
| (a) | Class R shares commenced operations on March 28, 2008. Per share data and total return reflect activity from that date. |
| (b) | Per share data was calculated using the average shares outstanding during the period. |
| (c) | Rounds to less than $0.01 per share. |
| (d) | Total return at net asset value assuming all distributions reinvested. |
| (e) | Had the investment advisor and/or any of its affiliates not waived fees or reimbursed a portion of expenses, total return would have been reduced. |
| (g) | The benefits derived from expense reductions had an impact of less than 0.01%. |
See Accompanying Notes to Financial Statements.
21
Financial Highlights – Columbia Dividend Income Fund
Selected data for a share outstanding throughout each period is as follows:
| | | | | | | | | | | | | | | | | | | | |
| | | Year Ended September 30, | |
| Class T Shares | | 2010 | | | 2009 | | | 2008 | | | 2007 | | | 2006 | |
Net Asset Value, Beginning of Period | | $ | 11.18 | | | $ | 12.01 | | | $ | 15.35 | | | $ | 13.45 | | | $ | 12.01 | |
| | | | | |
Income from Investment Operations: | | | | | | | | | | | | | | | | | | | | |
Net investment income (a) | | | 0.28 | | | | 0.29 | | | | 0.30 | | | | 0.27 | | | | 0.25 | |
Net realized and unrealized gain (loss) on investments | | | 0.95 | | | | (0.85 | ) | | | (3.18 | ) | | | 2.02 | | | | 1.46 | |
| | | | | | | | | | | | | | | | | | | | |
Total from investment operations | | | 1.23 | | | | (0.56 | ) | | | (2.88 | ) | | | 2.29 | | | | 1.71 | |
| | | | | |
Less Distributions to Shareholders: | | | | | | | | | | | | | | | | | | | | |
From net investment income | | | (0.28 | ) | | | (0.27 | ) | | | (0.30 | ) | | | (0.26 | ) | | | (0.27 | ) |
From net realized gains | | | — | | | | — | | | | (0.16 | ) | | | (0.13 | ) | | | — | |
| | | | | | | | | | | | | | | | | | | | |
Total distributions to shareholders | | | (0.28 | ) | | | (0.27 | ) | | | (0.46 | ) | | | (0.39 | ) | | | (0.27 | ) |
| | | | | |
Increase from regulatory settlements | | | — | | | | — | (b) | | | — | | | | — | | | | — | |
| | | | | |
Net Asset Value, End of Period | | $ | 12.13 | | | $ | 11.18 | | | $ | 12.01 | | | $ | 15.35 | | | $ | 13.45 | |
Total return (c)(d) | | | 11.06 | % | | | (4.38 | )% | | | (19.10 | )% | | | 17.25 | % | | | 14.39 | % |
| | | | | |
Ratios to Average Net Assets/Supplemental Data: | | | | | | | | | | | | | | | | | | | | |
Net expenses (e) | | | 1.10 | % | | | 1.10 | % | | | 1.10 | % | | | 1.10 | % | | | 1.10 | % |
Waiver/Reimbursement | | | 0.02 | % | | | 0.06 | % | | | 0.06 | % | | | 0.07 | % | | | 0.12 | % |
Net investment income (e) | | | 2.36 | % | | | 2.87 | % | | | 2.19 | % | | | 1.85 | % | | | 1.96 | % |
Portfolio turnover rate | | | 17 | % | | | 23 | % | | | 16 | % | | | 21 | % | | | 52 | % |
Net assets, end of period (000s) | | $ | 80,405 | | | $ | 73,773 | | | $ | 72,213 | | | $ | 100,932 | | | $ | 96,651 | |
| (a) | Per share data was calculated using the average shares outstanding during the period. |
| (b) | Rounds to less than $0.01 per share. |
| (c) | Total return at net asset value assuming all distributions reinvested and no initial sales charge or contingent deferred sales charge. |
| (d) | Had the investment advisor and/or any of its affiliates not waived fees or reimbursed a portion of expenses, total return would have been reduced. |
| (e) | The benefits derived from expense reductions had an impact of less than 0.01%. |
See Accompanying Notes to Financial Statements.
22
Financial Highlights – Columbia Dividend Income Fund
Selected data for a share outstanding throughout the period is as follows:
| | | | |
| Class W Shares | | Period Ended
September 30,
2010 (a) | |
Net Asset Value, Beginning of Period | | $ | 12.13 | |
| |
Income from Investment Operations: | | | | |
Net investment income (b) | | | 0.01 | |
Net realized and unrealized loss on investments | | | (0.02 | ) |
| | | | |
Total from investment operations | | | (0.01 | ) |
| |
Net Asset Value, End of Period | | $ | 12.12 | |
Total return (c)(d) | | | (0.08 | )% |
| |
Ratios to Average Net Assets/Supplemental Data: | | | | |
Net expenses (e)(f) | | | 1.05 | % |
Waiver/Reimbursement (f) | | | 0.01 | % |
Net investment income (e)(f) | | | 7.83 | % |
Portfolio turnover rate (d) | | | 17 | % |
Net assets, end of period (000s) | | $ | 2 | |
| (a) | Class W shares commenced operations on September 27, 2010. Per share data and total return reflect activity from that date. |
| (b) | Per share data was calculated using the average shares outstanding during the period. |
| (c) | Total return at net asset value. |
| (e) | The benefits derived from expense reductions had an impact of less than 0.01%. |
See Accompanying Notes to Financial Statements.
23
Financial Highlights – Columbia Dividend Income Fund
Selected data for a share outstanding throughout each period is as follows:
| | | | | | | | | | | | | | | | | | | | |
| | | Year Ended September 30, | |
| Class Z Shares | | 2010 | | | 2009 | | | 2008 | | | 2007 | | | 2006 | |
Net Asset Value, Beginning of Period | | $ | 11.18 | | | $ | 12.01 | | | $ | 15.36 | | | $ | 13.45 | | | $ | 12.01 | |
| | | | | |
Income from Investment Operations: | | | | | | | | | | | | | | | | | | | | |
Net investment income (a) | | | 0.31 | | | | 0.31 | | | | 0.34 | | | | 0.31 | | | | 0.28 | |
Net realized and unrealized gain (loss) on | | | 0.95 | | | | (0.85 | ) | | | (3.19 | ) | | | 2.04 | | | | 1.47 | |
| | | | | | | | | | | | | | | | | | | | |
Total from investment operations | | | 1.26 | | | | (0.54 | ) | | | (2.85 | ) | | | 2.35 | | | | 1.75 | |
| | | | | |
Less Distributions to Shareholders: | | | | | | | | | | | | | | | | | | | | |
From net investment income | | | (0.31 | ) | | | (0.30 | ) | | | (0.34 | ) | | | (0.31 | ) | | | (0.31 | ) |
From net realized gains | | | — | | | | — | | | | (0.16 | ) | | | (0.13 | ) | | | — | |
| | | | | | | | | | | | | | | | | | | | |
Total distributions to shareholders | | | (0.31 | ) | | | (0.30 | ) | | | (0.50 | ) | | | (0.44 | ) | | | (0.31 | ) |
| | | | | |
Increase from regulatory settlements | | | — | | | | 0.01 | | | | — | | | | — | | | | — | |
| | | | | |
Net Asset Value, End of Period | | $ | 12.13 | | | $ | 11.18 | | | $ | 12.01 | | | $ | 15.36 | | | $ | 13.45 | |
Total return (b)(c) | | | 11.38 | % | | | (4.10 | )% | | | (18.90 | )% | | | 17.67 | % | | | 14.73 | % |
| | | | | |
Ratios to Average Net Assets/Supplemental Data: | | | | | | | | | | | | | | | | | | | | |
Net expenses (d) | | | 0.80 | % | | | 0.80 | % | | | 0.80 | % | | | 0.80 | % | | | 0.80 | % |
Waiver/Reimbursement | | | 0.02 | % | | | 0.06 | % | | | 0.06 | % | | | 0.07 | % | | | 0.12 | % |
Net investment income (d) | | | 2.66 | % | | | 3.15 | % | | | 2.51 | % | | | 2.15 | % | | | 2.27 | % |
Portfolio turnover rate | | | 17 | % | | | 23 | % | | | 16 | % | | | 21 | % | | | 52 | % |
Net assets, end of period (000s) | | $ | 1,591,420 | | | $ | 1,060,268 | | | $ | 671,700 | | | $ | 594,859 | | | $ | 471,876 | |
| (a) | Per share data was calculated using the average shares outstanding during the period. |
| (b) | Total return at net asset value assuming all distributions reinvested. |
| (c) | Had the investment advisor and/or any of its affiliates not waived fees or reimbursed a portion of expenses, total return would have been reduced. |
| (d) | The benefits derived from expense reductions had an impact of less than 0.01%. |
See Accompanying Notes to Financial Statements.
24
Notes to Financial Statements – Columbia Dividend Income Fund
September 30, 2010
Note 1. Organization
Columbia Dividend Income Fund (the “Fund”), a series of Columbia Funds Series Trust I (the “Trust”), is a diversified fund. The Trust is registered under the Investment Company Act of 1940, as amended (the “1940 Act”), as an open-end management investment company organized as a Massachusetts business trust.
Investment Objective
The Fund seeks total return, consisting of current income and capital appreciation.
Fund Shares
The Trust may issue an unlimited number of shares, and the Fund offers eight classes of shares: Class A, Class B, Class C, Class I, Class R, Class T, Class W and Class Z. Effective September 27, 2010, Class I and Class W shares commenced operations. Each share class has its own expense structure and sales charges, as applicable.
The Fund no longer accepts investments by new or existing investors in the Fund’s Class B shares, except in connection with the reinvestment of any dividend and/or capital gain distributions in Class B shares of the Fund and exchanges by existing Class B shareholders of other Columbia Funds.
Class A and Class T shares are subject to a maximum front-end sales charge of 5.75% based on the amount of initial investment. Class A and Class T shares purchased without an initial sales charge in accounts aggregating $1 million to $50 million at the time of purchase are subject to a maximum contingent deferred sales charge (“CDSC”) of 1.00% based upon the holding period after purchase.
Class B shares are subject to a maximum CDSC of 5.00% based upon the holding period after purchase. Class B shares will generally convert to Class A shares eight years after purchase.
Class C shares are subject to a 1.00% CDSC on shares sold within one year after purchase.
Class I, Class R, Class W and Class Z shares are offered continuously at net asset value. There are certain restrictions on the purchase of these share classes, as described in the Fund’s prospectus.
Note 2. Significant Accounting Policies
The preparation of financial statements in accordance with accounting principles generally accepted in the United States of America (“GAAP”) requires management to make certain estimates and assumptions that affect the reported amounts of assets and liabilities, the disclosure of contingent assets and liabilities at the date of the financial statements and the reported amounts of revenue and expenses during the reporting period. Actual results could differ from those estimates.
Management has evaluated the events and transactions that have occurred through the date the financial statements were issued and, except as disclosed in Note 11, noted no items requiring adjustment of the financial statements or additional disclosures.
The following is a summary of significant accounting policies consistently followed by the Fund in the preparation of its financial statements.
Security Valuation
Equity securities are valued at the last sale price on the principal exchange on which they trade, except for securities traded on the NASDAQ, which are valued at the NASDAQ official close price. Unlisted securities or listed securities for which there were no sales during the day are valued at the closing bid price on such exchanges or over-the-counter markets.
Short-term investments maturing in 60 days or less are valued at amortized cost, which approximates market value.
Investments for which market quotations are not readily available, or that have quotations which management believes are not reliable, are valued at fair value as determined in good faith under consistently applied procedures established by and under the general supervision of the Board of Trustees. If a security is valued at fair value, such value is likely to be different from the last quoted market price for the security. The determination of fair value often requires significant judgment. To determine fair value, management may use assumptions including but not limited to future cash flows and estimated risk premiums. Multiple inputs from various sources may be used to determine value.
GAAP establishes a hierarchy that prioritizes the inputs to valuation techniques used to measure fair value giving the
25
Columbia Dividend Income Fund
September 30, 2010
highest priority to unadjusted quoted prices in active markets for identical securities (Level 1 measurements) and the lowest priority to unobservable inputs (Level 3 measurements) when market prices are not readily available or reliable. The three levels of the fair value hierarchy are described below:
| n | | Level 1 — quoted prices in active markets for identical securities |
| n | | Level 2 — prices determined using other significant observable inputs (including quoted prices for similar securities, interest rates, prepayment speeds, credit risk and others) |
| n | | Level 3 — prices determined using significant unobservable inputs. In situations where quoted prices or observable inputs are unavailable or less reliable, unobservable inputs may be used. Unobservable inputs may include management’s own assumptions about the factors market participants would use in pricing an investment. |
The inputs or methodology used for valuing securities are not necessarily an indication of the risk associated with investing in those securities.
On January 21, 2010, the Financial Accounting Standards Board issued an Accounting Standards Update (the “amendment”), Fair Value Measurements and Disclosures (Topic 820): Improving Disclosures about Fair Value Measurements, which provides guidance on how investment assets and liabilities are to be valued and disclosed. Specifically, the amendment requires reporting entities to disclose the inputs and valuation techniques used to measure fair value for both recurring and nonrecurring fair value measurements for Level 2 and Level 3 positions. The amendment also requires that transfers between all levels (including Level 1 and Level 2) be disclosed on a gross basis (i.e., transfers out must be disclosed separately from transfers in), and requires disclosure of the reason(s) for significant transfers. Additionally, purchases, sales, issuances and settlements must be disclosed on a gross basis in the Level 3 roll forward. The effective date of the amendment is for interim and annual periods beginning after December 15, 2009; except for the requirement to provide the Level 3 activity for purchases, sales, issuances and settlements on a gross basis, which will be effective for interim and annual periods beginning after December 15, 2010. At this time, management is evaluating the implications of the amendment and the impact to the financial statements.
Security Transactions
Security transactions are accounted for on the trade date. Cost is determined and gains (losses) are based upon the specific identification method for both financial statement and federal income tax purposes.
Repurchase Agreements
The Fund may engage in repurchase agreement transactions with institutions that management has determined are creditworthy. The Fund, through its custodian, receives delivery of the underlying securities collateralizing a repurchase agreement. Management is responsible for determining that the collateral is at least equal, at all times, to the value of the repurchase obligation including interest. A repurchase agreement transaction involves certain risks in the event of default or insolvency of the counterparty. These risks include possible delays in or restrictions on the Fund’s ability to dispose of the underlying securities and a possible decline in the value of the underlying securities during the period while the Fund seeks to assert its rights.
Income Recognition
Interest income is recorded on the accrual basis.
Corporate actions and dividend income are recorded on the ex-date.
Distributions received from real estate investment trusts (REITs) in excess of their income are recorded as a reduction of the cost of the related investments. If the Fund no longer owns the applicable securities, any distributions received in excess of income are recorded as realized gains.
Awards from class action litigation are recorded as a reduction of cost if the Fund still owns the applicable securities on the payment date. If the Fund no longer owns the applicable securities, the proceeds are recorded as realized gains.
Expenses
General expenses of the Trust are allocated to the Fund and other series of the Trust based upon relative net assets or other expense allocation methodologies determined by the nature of the expense. Expenses directly attributable to a specific class of shares are charged to that share class. Expenses directly attributable to the Fund are charged to the Fund.
26
Columbia Dividend Income Fund
September 30, 2010
Determination of Class Net Asset Value
All income, expenses (other than class-specific expenses, as shown on the Statement of Operations) and realized and unrealized gains (losses) are allocated to each class of the Fund on a daily basis, based on the relative net assets of each class, for purposes of determining the net asset value of each class.
Federal Income Tax Status
The Fund intends to qualify each year as a “regulated investment company” under Subchapter M of the Internal Revenue Code, as amended, and will distribute substantially all of its tax exempt or taxable income, if any, for its tax year, and as such will not be subject to federal income taxes. In addition, the Fund intends to distribute in each calendar year substantially all of its net investment income, capital gains and certain other amounts, if any, such that the Fund should not be subject to federal excise tax. Therefore, no federal income or excise tax provision is recorded.
Distributions to Shareholders
Distributions from net investment income are declared and paid quarterly. Net realized capital gains, if any, are distributed at least annually. Income distributions and capital gain distributions are determined in accordance with federal income tax regulations which may differ from GAAP.
Indemnification
In the normal course of business, the Fund enters into contracts that contain a variety of representations and warranties and which provide general indemnities. The Fund’s maximum exposure under these arrangements is unknown because this would involve future claims against the Fund. Also, under the Trust’s organizational documents and by contract, the Trustees and officers of the Trust are indemnified against certain liabilities that may arise out of actions relating to their duties to the Trust. However, based on experience, the Fund expects the risk of loss due to these representations, warranties and indemnities to be minimal.
Note 3. Federal Tax Information
The timing and character of income and capital gain distributions are determined in accordance with income tax regulations, which may differ from GAAP. Reclassifications are made to the Fund’s capital accounts for permanent tax differences to reflect income and gains available for distribution (or available capital loss carryforwards) under income tax regulations.
For the year ended September 30, 2010, permanent book and tax basis differences resulting primarily from differing treatments for proceeds received from litigation settlements and expired capital loss carryforwards were identified and reclassified among the components of the Fund’s net assets as follows:
| | | | |
| |
Undistributed Net Investment
Income | | Accumulated Net Realized
Loss | | Paid-In Capital |
| $4 | | $71,401,738 | | $(71,401,742) |
Net investment income and net realized gains (losses), as disclosed on the Statement of Operations, and net assets were not affected by this reclassification.
The tax character of distributions paid during the years ended September 30, 2010 and September 30, 2009 was as follows:
| | | | | | | | |
| | | September 30, | |
| | | 2010 | | | 2009 | |
Ordinary Income* | | $ | 54,664,168 | | | $ | 37,374,271 | |
| * | For tax purposes short-term capital gain distributions, if any, are considered ordinary income distributions. |
As of September 30, 2010, the components of distributable earnings on a tax basis were as follows:
| | | | |
| |
Undistributed
Ordinary Income | | Undistributed Long-term Capital Gains | | Net Unrealized Appreciation* |
| $822,821 | | $— | | $236,691,974 |
| * | The differences between book-basis and tax-basis net unrealized appreciation are primarily due to deferral of losses from wash sales. |
Unrealized appreciation and depreciation at September 30, 2010, based on cost of investments for federal income tax purposes were:
| | | | |
| | |
Unrealized appreciation | | $ | 344,789,120 | |
Unrealized depreciation | | | (108,097,146 | ) |
| | | | |
Net unrealized appreciation | | $ | 236,691,974 | |
27
Columbia Dividend Income Fund
September 30, 2010
The following capital loss carryforwards determined as of September 30, 2010, may be available to reduce taxable income arising from future net realized gains on investments, if any, to the extent permitted by the Internal Revenue Code:
| | | | |
| | |
| Year of Expiration | | Capital Loss Carryforwards | |
| 2011 | | $ | 2,393,321 | |
| 2013 | | | 990,327 | |
| 2014 | | | 4,705,019 | |
| 2017 | | | 65,052,409 | |
| 2018 | | | 25,898,280 | |
| | | | |
| Total | | $ | 99,039,356 | |
Of the capital loss carryforwards attributable to the Fund, $8,088,667 ($2,393,321 of which expires on September 30, 2011, $990,327 of which expires on September 30, 2013 and $4,705,019 of which expires on September 30, 2014) was acquired from fund mergers. The availability of a portion of the remaining capital loss carryforwards acquired as part of a fund merger may be limited in a given year.
Capital loss carryforwards of $71,401,738 expired during the year ended September 30, 2010. Expired capital loss carryforwards are recorded as a reduction of paid-in capital.
Management is required to determine whether a tax position of the Fund is more likely than not to be sustained upon examination by the applicable taxing authority, including resolution of any related appeals or litigation processes, based on the technical merits of the position. The tax benefit to be recognized by the Fund is measured as the largest amount of benefit that is greater than fifty percent likely of being realized upon ultimate settlement. Management is not aware of any tax positions for which it is reasonably possible that the total amounts of unrecognized tax benefits will significantly change in the next twelve months. However, management’s conclusions may be subject to review and adjustment at a later date based on factors including, but not limited to, new tax laws, regulations, and administrative interpretations (including relevant court decisions). The Fund’s federal tax returns for the prior three fiscal years remain subject to examination by the Internal Revenue Service.
Note 4. Fees and Compensation Paid to Affiliates
Investment Advisory Fee
After the close of business on April 30, 2010, Ameriprise Financial, Inc. (“Ameriprise Financial”) acquired a portion of the asset management business of Columbia Management Group, LLC (the “Transaction”), including the business of managing the Fund. In connection with the closing of the Transaction (the “Closing”), RiverSource Investments, LLC, a wholly owned subsidiary of Ameriprise Financial, became the investment advisor of the Fund and subsequently changed its name to Columbia Management Investment Advisers, LLC (the “New Advisor”). The New Advisor receives a monthly investment advisory fee based on the Fund’s average daily net assets at the following annual rates:
| | | | |
| | |
| Average Daily Net Assets | | Annual Fee Rate | |
First $500 million | | | 0.70% | |
$500 million to $1 billion | | | 0.65% | |
$1 billion to $1.5 billion | | | 0.60% | |
$1.5 billion to $3 billion | | | 0.55% | |
$3 billion to $6 billion | | | 0.53% | |
Over $6 billion | | | 0.51% | |
Prior to the Closing, Columbia Management Advisors, LLC (“Columbia”), an indirect, wholly owned subsidiary of Bank of America Corporation (“BOA”), provided investment advisory services to the Fund under the same fee structure.
For the year ended September 30, 2010, the Fund’s effective investment advisory fee rate was 0.62% of the Fund’s average daily net assets.
Administration Fee
Effective upon the Closing, the New Advisor became the administrator of the Fund under a new Administrative Services Agreement (the “Administrative Agreement”). Under the Administrative Agreement, the New Advisor provides administrative and other services to the Fund, including services previously performed under the Pricing and Bookkeeping Oversight and Services Agreement discussed below. The New Advisor receives a monthly administration fee at the annual rate of 0.067% of the Fund’s average daily net assets. Prior to the Closing, Columbia
28
Columbia Dividend Income Fund
September 30, 2010
provided administrative services to the Fund at the same fee rates.
Pricing and Bookkeeping Fees
Prior to the Closing, the Fund entered into a Financial Reporting Services Agreement (the “Financial Reporting Services Agreement”) with State Street Bank and Trust Company (“State Street”) and Columbia pursuant to which State Street provides financial reporting services to the Fund. The Fund also entered into an Accounting Services Agreement (collectively with the Financial Reporting Services Agreement, the “State Street Agreements”) with State Street and Columbia pursuant to which State Street provides accounting services to the Fund. Upon the Closing, Columbia assigned and delegated its rights and obligations under the State Street Agreements to the New Advisor. Under the State Street Agreements, the Fund pays State Street an annual fee of $38,000 paid monthly plus an additional monthly fee based on an annualized percentage rate of average daily net assets of the Fund for the month. The aggregate fee will not exceed $140,000 per year (exclusive of out-of-pocket expenses and charges). The Fund also reimburses State Street for certain out-of-pocket expenses and charges.
Also prior to the Closing, the Fund entered into a Pricing and Bookkeeping Oversight and Services Agreement (the “Services Agreement”) with Columbia. Under the Services Agreement, Columbia provided services related to Fund expenses and the requirements of the Sarbanes-Oxley Act of 2002, and provided oversight of the accounting and financial reporting services provided by State Street. Under the Services Agreement, the Fund reimbursed Columbia for out-of-pocket expenses and charges, including fees payable to third parties, such as for pricing the Fund’s portfolio securities, incurred by Columbia in the performance of services under the Services Agreement. The Services Agreement was terminated upon the Closing. These services are now provided under the Administrative Agreement discussed above.
Transfer Agent Fee
In connection with the Closing, RiverSource Service Corporation, a wholly owned subsidiary of Ameriprise Financial, became the transfer agent of the Fund and subsequently changed its name to Columbia Management Investment Services Corp. (the “New Transfer Agent”). The New Transfer Agent has contracted with Boston Financial Data Services (“BFDS”) to serve as sub-transfer agent. The New Transfer Agent receives monthly account-based service fees based on the number of open accounts and asset-based fees, calculated based on assets held in omnibus accounts, which are intended to reimburse the New Transfer Agent for certain sub-transfer agent fees (exclusive of BFDS fees). The New Transfer Agent pays the fees of BFDS for services as sub-transfer agent and is not entitled to reimbursement for such fees from the Fund.
The New Transfer Agent may also retain, as additional compensation for its services, fees for wire, telephone and redemption orders, Individual Retirement Account (“IRA”) trustee agent fees and account transcript fees due to the New Transfer Agent from shareholders of the Fund and credits (net of bank charges) earned with respect to balances in accounts the New Transfer Agent maintains in connection with its services to the Fund. The New Transfer Agent also receives reimbursement for certain out-of-pocket expenses.
Prior to the Closing, Columbia Management Services, Inc., an affiliate of Columbia and an indirect, wholly owned subsidiary of BOA, provided shareholder services to the Fund and contracted with BFDS to serve as sub-transfer agent, under the same fee structure.
For the year ended September 30, 2010, the Fund’s effective transfer agent fee rate for each class as a percentage of average daily net assets was as follows:
| | | | | | | | | | | | |
| | | | | | | | | | | | | |
| Class A | | Class B | | Class C | | Class R | | Class T | | Class W | | Class Z |
| 0.09% | | 0.09% | | 0.09% | | 0.09% | | 0.09% | | 0.10% | | 0.09% |
Class I shares do not pay transfer agent fees.
An annual minimum account balance fee of $20 may apply to certain accounts with a value below the Fund’s initial minimum investment requirements to reduce the impact of small accounts on transfer agent fees. These minimum account balance fees are recorded as part of expense reductions on the Statement of Operations. For the year ended September 30, 2010, no minimum account balance fees were charged by the Fund.
29
Columbia Dividend Income Fund
September 30, 2010
Underwriting Discounts, Service and Distribution Fees
In connection with the Closing, RiverSource Fund Distributors, Inc., an indirect wholly owned subsidiary of Ameriprise Financial, became the distributor of the Fund and subsequently changed its name to Columbia Management Investment Distributors, Inc. (the “New Distributor”).
For the year ended September 30, 2010, initial sales charges paid by shareholders on the purchase of Class A and Class T shares amounted to $157,121 and $690, respectively. For the same time period, net CDSC fees paid by shareholders on certain redemptions of Class A, Class B and Class C shares amounted to $7,725, $24,617 and $19,053, respectively.
The Fund has adopted plans pursuant to Rule 12b-1 under the 1940 Act (the “Plans”) which require the payment of monthly distribution and service fees to the New Distributor based on the average daily net assets of the applicable class of the Fund at the following annual rates:
| | | | | | | | |
| Distribution Fee |
| Class A | | Class B | | Class C | | Class R | | Class W |
| 0.10% | | 0.75% | | 0.75% | | 0.50% | | 0.25% |
| | | | | | |
| Service Fee |
| Class A | | Class B | | Class C | | Class W |
| 0.25% | | 0.25% | | 0.25% | | 0.25% |
The Fund may pay distribution and service fees up to a maximum annual rate of 0.35% of the Fund’s average daily net assets attributable to Class A shares (comprised of up to 0.10% for distribution services and up to 0.25% for shareholder services), but limited such fees to an aggregate of not more than 0.25% for Class A shares during the current fiscal year. For the year ended September 30, 2010, the distribution and service fees were 0.00% and 0.25%, respectively, of the Fund’s average daily net assets.
The Fund may pay a distribution fee of up to 0.25% of the Fund’s average daily net assets attributable to Class W shares and a service fee of up to 0.25% of the Fund’s average daily net assets attributable to Class W shares, provided, however, that the aggregate fee shall not exceed 0.25% of the Fund’s average daily net assets attributable to Class W shares.
The CDSC and the distribution fees received from the Plans are used principally as repayment to the Distributor for amounts paid by the Distributor to dealers who sold such shares.
Shareholder Services Fees
The Fund has adopted a shareholder services plan that permits it to pay for certain services provided to Class T shareholders by service organizations. The Fund may pay shareholder services fees of up to 0.25% of the Fund’s average daily net assets attributable to Class T shares for shareholder liaison services and up to 0.25% of the Fund’s average daily net assets attributable to Class T shares for administrative support services, provided, however, that the aggregate fee shall not exceed 0.30% of the Fund’s average daily net assets attributable to Class T shares. For the year ended September 30, 2010, the shareholder services fee was 0.30% of each Fund’s average daily net assets attributable to Class T shares.
Prior to the Closing, Columbia Management Distributors, Inc., an affiliate of Columbia and an indirect, wholly owned subsidiary of BOA, was the principal underwriter of the Fund’s shares. There were no changes to the underwriting discount structure of the Fund or the service, distribution or shareholder services fee rates paid by the Fund as a result of the Transaction.
Fee Waivers and Expense Reimbursements
Effective September 27, 2010, the New Advisor has contractually agreed to reimburse a portion of the Fund’s expenses through September 30, 2011, so that the Fund’s ordinary operating expenses (excluding any brokerage commissions, interest, taxes and extraordinary expenses, but including custodian charges relating to overdrafts, if any), after giving effect to any balance credits from the Fund’s custodian, do not exceed the annual rates of 1.05%, 1.80%, 1.80%, 0.74%, 1.30%, 1.10%, 1.05% and 0.80% of the Fund’s average daily net assets attributable to Class A, Class B, Class C, Class I, Class R, Class T, Class W, and Class Z shares, respectively. This expense arrangement may only be modified or amended with approval from all parties to such arrangements, including the Fund’s and the New Advisor.
From May 1, 2010 to September 26, 2010, the New Advisor had voluntarily agreed to reimburse a portion of the Fund’s expenses, so that the Fund’s ordinary operating expenses (excluding any distribution and service fees, brokerage commissions, interest, taxes and extraordinary expenses, but including custodian charges relating to overdrafts, if any), after giving effect to any balance credits from the Fund’s
30
Columbia Dividend Income Fund
September 30, 2010
custodian, did not exceed 0.80% of the Fund’s average daily net assets on an annualized basis. Prior to May 1, 2010, Columbia voluntarily reimbursed a portion of the Fund’s expenses in the same manner.
Fees Paid to Officers and Trustees
In connection with the Closing, all officers of the Fund are employees of the New Advisor or its affiliates and, with the exception of the Fund’s Chief Compliance Officer, receive no compensation from the Fund. The Board of Trustees has appointed a Chief Compliance Officer to the Fund in accordance with federal securities regulations. The Fund, along with other affiliated funds, pays its pro-rata share of the expenses associated with the Chief Compliance Officer. The Fund’s expenses for the Chief Compliance Officer will not exceed $15,000 per year. Prior to the Closing, the Fund paid its pro-rata share of the expenses for the Chief Compliance Officer under the same fee structure.
Trustees are compensated for their services to the Fund, as set forth on the Statement of Operations. The Trust’s eligible Trustees may participate in a deferred compensation plan which may be terminated at any time. Obligations of the plan will be paid solely out of the Fund’s assets.
Other Related Party Transactions
Prior to the Closing, the Fund used one or more brokers that were affiliates of BOA in connection with the purchase and sale of its securities. Total brokerage commissions paid to affiliated brokers for the period prior to the Closing were $11,250.
Note 5. Custody Credits
The Fund has an agreement with its custodian bank under which custody fees may be reduced by balance credits. These credits are recorded as part of expense reductions on the Statement of Operations. The Fund could have invested a portion of the assets utilized in connection with the expense offset arrangement in an income-producing asset if it had not entered into such an agreement.
For the year ended September 30, 2010, these custody credits reduced total expenses by $66 for the Fund.
Note 6. Portfolio Information
For the year ended September 30, 2010, the cost of purchases and proceeds from sales of securities, excluding short-term obligations, for the Fund were $985,102,692 and $342,518,741, respectively.
Note 7. Regulatory Settlements
During the year ended September 30, 2009, the Fund received payments totaling $665,701 relating to certain regulatory settlements with third parties that the Fund had participated in during the twelve month period. The payments have been included in “Increase from regulatory settlements” on the Statement of Changes in Net Assets.
Note 8. Line of Credit
The Fund and other affiliated funds participate in a $280,000,000 committed, unsecured revolving line of credit provided by State Street. The maximum amount that may be borrowed by any fund is limited to the lesser of $200,000,000 and the Fund’s borrowing limit set forth in the Fund’s registration statement. Borrowings are available for short-term liquidity or temporary or emergency purposes.
Effective October 15, 2009, interest is charged to each participating fund based on the fund’s borrowings at a rate per annum equal to the greater of the Federal Funds Rate plus 1.25% or the overnight LIBOR Rate plus 1.25%. In addition, a commitment fee of 0.15% per annum is accrued and apportioned among the participating funds pro rata based on their relative net assets.
Prior to October 15, 2009, interest was charged to each participating fund based on the fund’s borrowings at a rate per annum equal to the greater of the Federal Funds Rate plus 0.50% or the overnight LIBOR Rate plus 0.50%. In addition, an annual operations agency fee of $20,000, an amendment fee of 0.02% and a commitment fee of 0.12% per annum were accrued and apportioned among the participating funds pro rata based on their relative net assets.
For the year ended September 30, 2010, the Fund did not borrow under these arrangements.
Note 9. Shareholder Concentration
As of September 30, 2010, one shareholder account owned 36.6% of the outstanding shares of the Fund. Purchase and
31
Columbia Dividend Income Fund
September 30, 2010
redemption activity of this account may have a significant effect on the operations of the Fund.
Note 10. Significant Risks and Contingencies
Information Regarding Pending and Settled Legal Proceedings
In June 2004, an action captioned John E. Gallus et al. v. American Express Financial Corp. and American Express Financial Advisors Inc. was filed in the United States District Court for the District of Arizona. The plaintiffs allege that they are investors in several American Express Company (now known as legacy RiverSource) mutual funds and they purport to bring the action derivatively on behalf of those funds under the Investment Company Act of 1940. The plaintiffs allege that fees allegedly paid to the defendants by the funds for investment advisory and administrative services are excessive. The plaintiffs seek remedies including restitution and rescission of investment advisory and distribution agreements. The plaintiffs voluntarily agreed to transfer this case to the United States District Court for the District of Minnesota (the District Court). In response to defendants’ motion to dismiss the complaint, the District Court dismissed one of plaintiffs’ four claims and granted plaintiffs limited discovery. Defendants moved for summary judgment in April 2007. Summary judgment was granted in the defendants’ favor on July 9, 2007. The plaintiffs filed a notice of appeal with the Eighth Circuit Court of Appeals (the Eighth Circuit) on August 8, 2007. On April 8, 2009, the Eighth Circuit reversed summary judgment and remanded to the District Court for further proceedings. On August 6, 2009, defendants filed a writ of certiorari with the U.S. Supreme Court (the Supreme Court), asking the Supreme Court to stay the District Court proceedings while the Supreme Court considers and rules in a case captioned Jones v. Harris Associates, which involves issues of law similar to those presented in the Gallus case. On March 30, 2010, the Supreme Court issued its ruling in Jones v. Harris Associates, and on April 5, 2010, the Supreme Court vacated the Eighth Circuit’s decision in the Gallus case and remanded the case to the Eighth Circuit for further consideration in light of the Supreme Court’s decision in Jones v. Harris Associates. On June 4, 2010, the Eighth Circuit remanded the Gallus case to the District Court for further consideration in light of the Supreme Court’s decision in Jones v. Harris Associates.
In December 2005, without admitting or denying the allegations, American Express Financial Corporation (AEFC, which is now known as Ameriprise Financial, Inc. (Ameriprise Financial)), entered into settlement agreements with the Securities and Exchange Commission (SEC) and Minnesota Department of Commerce (MDOC) related to market timing activities. As a result, AEFC was censured and ordered to cease and desist from committing or causing any violations of certain provisions of the Investment Advisers Act of 1940, the Investment Company Act of 1940, and various Minnesota laws. AEFC agreed to pay disgorgement of $10 million and civil money penalties of $7 million. AEFC also agreed to retain an independent distribution consultant to assist in developing a plan for distribution of all disgorgement and civil penalties ordered by the SEC in accordance with various undertakings detailed at http://www.sec.gov/litigation/admin/ia-2451.pdf. Ameriprise Financial and its affiliates have cooperated with the SEC and the MDOC in these legal proceedings, and have made regular reports to the funds’ Boards of Directors/Trustees.
Ameriprise Financial and certain of its affiliates have historically been involved in a number of legal, arbitration and regulatory proceedings, including routine litigation, class actions, and governmental actions, concerning matters arising in connection with the conduct of their business activities. Ameriprise Financial believes that the Funds are not currently the subject of, and that neither Ameriprise Financial nor any of its affiliates are the subject of, any pending legal, arbitration or regulatory proceedings that are likely to have a material adverse effect on the Funds or the ability of Ameriprise Financial or its affiliates to perform under their contracts with the Funds. Ameriprise Financial is required to make 10-Q, 10-K and, as necessary, 8-K filings with the Securities and Exchange Commission on legal and regulatory matters that relate to Ameriprise Financial and its affiliates. Copies of these filings may be obtained by accessing the SEC website at www.sec.gov.
There can be no assurance that these matters, or the adverse publicity associated with them, will not result in increased fund redemptions, reduced sale of fund shares or other adverse consequences to the Funds. Further, although we believe proceedings are not likely to have a material adverse effect on the Funds or the ability of Ameriprise Financial or its affiliates to perform under their contracts with the Funds, these proceedings are subject to uncertainties and, as such,
32
Columbia Dividend Income Fund
September 30, 2010
we are unable to estimate the possible loss or range of loss that may result. An adverse outcome in one or more of these proceedings could result in adverse judgments, settlements, fines, penalties or other relief that could have a material adverse effect on the consolidated financial condition or results of operations of Ameriprise Financial.
Note 11. Subsequent Event
Effective October 14, 2010, the line of credit disclosed in Note 8 was extended. Interest on the $280,000,000 committed, unsecured revolving line of credit provided by State Street will continue to be charged at a rate per annum equal to the greater of the Federal Funds Rate plus 1.25% or the overnight LIBOR Rate plus 1.25%. The commitment fee has been decreased from 0.15% per annum to 0.125% per annum and will continue to be accrued and apportioned among the participating funds pro rata based on their relative net assets.
33
Report of Independent Registered Public Accounting Firm
To the Trustees of Columbia Funds Series Trust I and Shareholders of Columbia Dividend Income Fund
In our opinion, the accompanying statement of assets and liabilities, including the investment portfolio, and the related statements of operations and of changes in net assets and the financial highlights present fairly, in all material respects, the financial position of Columbia Dividend Income Fund (the “Fund”) (a series of Columbia Funds Series Trust I) at September 30, 2010, the results of its operations for the period then ended, the changes in its net assets for each of the two years in the period then ended, and the financial highlights for each of the five years in the period then ended, in conformity with accounting principles generally accepted in the United States of America. These financial statements and financial highlights (hereafter referred to as “financial statements”) are the responsibility of the Fund’s management. Our responsibility is to express an opinion on these financial statements based on our audits. We conducted our audits of these financial statements in accordance with the standards of the Public Company Accounting Oversight Board (United States). Those standards require that we plan and perform the audit to obtain reasonable assurance about whether the financial statements are free of material misstatement. An audit includes examining, on a test basis, evidence supporting the amounts and disclosures in the financial statements, assessing the accounting principles used and significant estimates made by management, and evaluating the overall financial statement presentation. We believe that our audits, which included confirmation of securities at September 30, 2010 by correspondence with the custodian and brokers, provide a reasonable basis for our opinion.
PricewaterhouseCoopers LLP
Boston, Massachusetts
November 19, 2010
34
Federal Income Tax Information (Unaudited) – Columbia Dividend Income Fund
For non-corporate shareholders, 100.00%, or the maximum amount allowable under the Jobs and Growth Tax Relief Reconciliation Act of 2003, of the ordinary income distributed by the Fund for the fiscal year ended September 30, 2010 may represent qualified dividend income.
100.00% of the ordinary income distributed by the Fund for the fiscal year ended September 30, 2010, qualifies for the corporate dividends received deduction.
The Fund will notify shareholders in January 2011 of amounts for use in preparing 2010 income tax returns.
35
Fund Governance
The Trustees serve terms of indefinite duration. The names, addresses and birth years of the Trustees and Officers of the Funds in the Columbia Funds Series Trust I, the year each was first elected or appointed to office, their principal business occupations during at least the last five years, the number of Funds overseen by each Trustee and other directorships they hold are shown below. Each officer listed below serves as an officer of each Fund in the Columbia Funds Complex.
Independent Trustees
| | |
Name, address and year of birth,
position with funds, Year first
elected or appointed to office | | Principal occupation(s) during past five years, Number of funds in Columbia Funds
Complex overseen by trustee, Other directorships held |
| |
| John D. Collins (born 1938) | | |
c/o Columbia Management Investment Advisers, LLC One Financial Center Boston, MA 02111 Trustee (since 2005) | | Retired. Consultant, KPMG, LLP (accounting and tax firm) from July 1999 to June 2000; Partner, KPMG, LLP from March 1962 to June 1999. Oversees 64; Mrs. Fields Original Cookies, Inc. (consumer products); Suburban Propane Partners, L.P.; and Montpelier Re (insurance underwriting firm) |
| |
| Rodman L. Drake (born 1943) | | |
c/o Columbia Management Investment Advisers, LLC One Financial Center Boston, MA 02111 Trustee (since 1994) and Chairman of the Board (since 2009) | | Co-Founder of Baringo Capital LLC (private equity) since 2002; CEO of Crystal River Capital, Inc. (real estate investment trust) since 2003; President, Continuation Investments Group, Inc. from 1997 to 2001. Oversees 64; Jackson Hewitt Tax Service Inc. (tax preparation services); Crystal Capital River Inc. (real estate investment trust); Student Loan Corporation (student loan provider); Celgene Corporation (global biotechnology company); The Helios Funds (exchange-traded funds); and Apex Silver Mines Ltd. from 2007 to 2009 |
| |
| Douglas A. Hacker (born 1955) | | |
c/o Columbia Management Investment Advisers, LLC One Financial Center Boston, MA 02111 Trustee (since 1996) | | Independent business executive since May 2006; Executive Vice President–Strategy of United Airlines (airline) from December 2002 to May 2006; President of UAL Loyalty Services (airline marketing company) from September 2001 to December 2002; Executive Vice President and Chief Financial Officer of United Airlines from July 1999 to September 2001. Oversees 64; Nash Finch Company (food distributor); Aircastle Limited (aircraft leasing) |
|
| Janet Langford Kelly (born 1957) |
c/o Columbia Management Investment Advisers, LLC One Financial Center Boston, MA 02111 Trustee (since 1996) | | Senior Vice President, General Counsel and Corporate Secretary, ConocoPhillips (integrated energy company) since September 2007; Deputy General Counsel–Corporate Legal Services, ConocoPhillips from August 2006 to August 2007; Partner, Zelle, Hofmann, Voelbel, Mason & Gette LLP (law firm) from March 2005 to July 2006; Adjunct Professor of Law, Northwestern University, from September 2004 to June 2006; Director, UAL Corporation (airline) from February 2006 to July 2006; Oversees 64; None |
| |
| Charles R. Nelson (born 1942) | | |
c/o Columbia Management Investment Advisers, LLC One Financial Center Boston, MA 02111 Trustee (since 1981) | | Professor of Economics, University of Washington, since January 1976; Ford and Louisa Van Voorhis Professor of Political Economy, University of Washington, since September 1993; Adjunct Professor of Statistics, University of Washington, since September 1980; Associate Editor, Journal of Money Credit and Banking, 1993-2008 Consultant on econometric and statistical matters. Oversees 64; None |
36
Fund Governance (continued)
Independent Trustees (continued)
| | |
Name, address and year of birth,
position with funds, Year first
elected or appointed to office | | Principal occupation(s) during past five years, Number of funds in Columbia Funds
Complex overseen by trustee, Other directorships held |
| |
| John J. Neuhauser (born 1943) | | |
c/o Columbia Management Investment Advisers, LLC One Financial Center Boston, MA 02111 Trustee (since 1984) | | President, Saint Michael’s College, since August 2007; Director or Trustee of several non-profit organization, including Fletcher Allen Health Care, Inc.; University Professor, Boston College from November 2005 to August 2007; Academic Vice President and Dean of Faculties, Boston College from August 1999 to October 2005. Oversees 64; Liberty All-Star Equity Fund and Liberty All-Star Growth Fund, Inc. (closed-end funds) |
| |
| Jonathan Piel (born 1938) | | |
c/o Columbia Management Investment Advisers, LLC One Financial Center Boston, MA 02111 Trustee (since 1994) | | Cable television producer and website designer; The Editor, Scientific American from 1984 to 1994; Vice President, Scientific American, Inc., from 1984 to 1994; Member, Advisory Board, Stone Age Institute, Bloomington, Indiana (research institute that explores the effect of technology on human evolution); Member, Board of Directors of the National Institute of Social Sciences, New York City; Member, Board of Trustees of the William Alanson White Institute, New York City (institution for training psychoanalysts); and Member, Advisory Board, Mount Sinai Children’s Environmental Health Center, New York. Oversees 64; None |
| |
| Patrick J. Simpson (born 1944) | | |
c/o Columbia Management Investment Advisers, LLC One Financial Center Boston, MA 02111 Trustee (since 2000) | | Partner, Perkins Coie LLP (law firm). Oversees 64; None |
| |
| Anne-Lee Verville (born 1945) | | |
c/o Columbia Management Investment Advisers, LLC One Financial Center Boston, MA 02111 Trustee (since 1998) | | Retired since 1997 (formerly General Manager–Global Education Industry (from 1994 to 1997), President–Application Systems Division (from 1991 to 1994), Chief Financial Officer–US Marketing & Services (from 1988 to 1991), and Chief Information Officer (from 1987 to 1988), IBM Corporation (computer and technology)). Oversees 64; Enesco Group, Inc. (producer of giftware and home and garden decor products) from 2001 to 2006 |
37
Fund Governance (continued)
Interested Trustee
| | |
Name, address and year of birth,
position with funds, Year first
elected or appointed to office | | Principal occupation(s) during past five years, Number of funds in Columbia Funds
Complex overseen by trustee, Other directorships held |
| |
| William E. Mayer1 (born 1940) | | |
c/o Columbia Management Investment Advisers, LLC One Financial Center Boston, MA 02111 Trustee (since 1994) | | Partner, Park Avenue Equity Partners (private equity) since February 1999; Dean and Professor, College of Business and Management, University of Maryland from 1992 to 1996. Oversees 64; DynaVox Inc. (software developer); Lee Enterprises (print media), WR Hambrecht + Co. (financial service provider); BlackRock Kelso Capital Corporation (investment company) |
| 1 | Mr. Mayer may technically be an “interested person” (as defined in the Investment Company Act of 1940) by reason of his affiliation with WR Hambrecht + Co., a registered broker/dealer that may execute portfolio transactions for, engage in principal transactions with or distribute shares of a Fund or other funds or accounts advised/managed by the Advisor or any sub-advisor to a Fund. |
The Statement of Additional Information includes additional information about the Trustees of the Funds and is available, without charge, upon request by calling 1-800-345-6611.
38
Fund Governance (continued)
Officers
| | |
| Name, Year of birth and address | | Principal occupation(s) during the past five years |
| |
| J. Kevin Connaughton (born 1964) | | |
One Financial Center Boston, MA 02111 President (since 2009) | | Senior Vice President and General Manager–Mutual Fund Products, Columbia Management Investment Advisers, LLC since May 2010; President, Columbia Funds, since 2009, and RiverSource Funds, since May 2010 (previously Senior Vice President and Chief Financial Officer, Columbia Funds, from June 2008 to January 2009, Treasurer, Columbia Funds, from October 2003 to May 2008, and senior officer of various other affiliated funds since 2000); Managing Director, Columbia Management Advisors, LLC from December 2004 to April 2010. |
| |
| Michael G. Clarke (born 1969) | | |
One Financial Center Boston, MA 02111 Senior Vice President and Chief Financial Officer (since 2009) | | Vice President, Columbia Management Investment Advisers, LLC since May 2010; Managing Director of Fund Administration, Columbia Management Advisors, LLC, from September 2004 to April 2010; senior officer of Columbia Funds and affiliated funds since 2002. |
| |
| Scott R. Plummer (born 1959) | | |
5228 Ameriprise Financial Center Minneapolis, MN 55474 Senior Vice President, Secretary and Chief Legal Officer (since 2010) | | Chief Legal Officer and Assistant Secretary, Columbia Management Investment Advisers, LLC since June 2005; Vice President and Lead Chief Counsel–Asset Management, Ameriprise Financial, Inc. since May 2010 (previously Vice President and Chief Counsel–Asset Management, from 2005 to April 2010, and Vice President–Asset Management Compliance from 2004 to 2005); Vice President, Chief Counsel and Assistant Secretary, Columbia Management Investment Distributors, Inc. since 2008; Vice President, General Counsel and Secretary, Ameriprise Certificate Company since 2005; Chief Counsel, RiverSource Distributors, Inc. since 2006; Vice President, General Counsel and Secretary, RiverSource Funds, since December 2006; Senior Vice President, Secretary and Chief Legal Officer, Columbia Funds, since May 2010. |
| |
| Linda J. Wondrack (born 1964) | | |
One Financial Center Boston, MA 02111 Senior Vice President and Chief Compliance Officer (since 2007) | | Vice President and Chief Compliance Officer, Columbia Management Investment Advisers, LLC since May 2010; Chief Compliance Officer, Columbia Funds, since 2007, and RiverSource Funds, since May 2010; Director (Columbia Management Group, LLC and Investment Product Group Compliance), Bank of America, from June 2005 to April 2010; Director of Corporate Compliance and Conflicts Officer of MFS Investment Management (investment management) from August 2004 to May 2005. |
| |
| William F. Truscott (born 1960) | | |
53600 Ameriprise Financial Center Minneapolis, MN 55474 Senior Vice President (since 2010) | | Chairman of the Board, Columbia Management Investment Advisers, LLC since May 2010 (previously President, Chairman of the Board and Chief Investment Officer, from 2001 to April 2010); Chief Executive Officer, U.S. Asset Management & President, Annuities, Ameriprise Financial, Inc. since May 2010 (previously President–U.S. Asset Management and Chief Investment Officer from 2005 to April 2010, and Senior Vice President—Chief Investment Officer, from 2001 to 2005); Director, President and Chief Executive Officer, Ameriprise Certificate Company since 2006; Director, Columbia Management Investment Distributors, Inc. since May 2010 (previously Chairman of the Board and Chief Executive Officer from 2008 to April 2010); Chairman of the Board and Chief Executive Officer, RiverSource Distributors, Inc. since 2006. |
39
Fund Governance (continued)
Officers (continued)
| | |
| Name, Year of birth and address | | Principal occupation(s) during the past five years |
|
| Colin Moore (born 1958) |
One Financial Center Boston, MA 02111 Senior Vice President (since 2010) | | Director and Chief Investment Officer, Columbia Management Investment Advisers, LLC since May 2010; Manager, Managing Director and Chief Investment Officer of Columbia Management Advisors, LLC from 2007 to April 2010; Head of Equities, Columbia Management Advisors, LLC from 2002 to 2007. |
| |
| Michael A. Jones (born 1959) | | |
100 Federal Street Boston, MA 02110 Senior Vice President (since 2010) | | Director and President, Columbia Management Investment Advisers, LLC since May 2010; President and Director, Columbia Management Investment Distributors, Inc. since May 2010; Manager, Chairman, Chief Executive Officer and President, Columbia Management Advisors, LLC from 2007 to April 2010; Chief Executive Officer, President and Director, Columbia Management Distributors, Inc. from November 2006 to April 2010; previously, co-president and senior managing director at Robeco Investment Management. |
| |
| Amy Johnson (born 1965) | | |
5228 Ameriprise Financial Center Minneapolis, MN 55474 Senior Vice President (since 2010) | | Senior Vice President and Chief Operating Officer, Columbia Management Investment Advisers, LLC since May 2010 (previously Chief Administrative Officer, from 2009 until April 2010, Vice President–Asset Management and Trust Company Services, from 2006 to 2009, and Vice President–Operations and Compliance from 2004 to 2006). |
| |
| Joseph F. DiMaria (born 1968) | | |
One Financial Center Boston, MA 02111 Treasurer (since 2009) and Chief Accounting Officer (since 2008) | | Vice President, Mutual Fund Administration, Columbia Management Investment Advisers, LLC, since May 2010; Director of Fund Administration, Columbia Management Advisors, LLC from January 2006 to April 2010; Head of Tax/Compliance and Assistant Treasurer, Columbia Management Advisors, LLC, from November 2004 to December 2005. |
| |
| Marybeth Pilat (born 1968) | | |
One Financial Center Boston, MA 02111 Deputy Treasurer (since 2010) | | Vice President, Mutual Fund Administration, Columbia Management Investment Advisers, LLC, since May 2010; Vice President, Investment Operations, Bank of America, from October 2008 to April 2010; Finance Manager, Boston Children’s Hospital from August 2008 to October 2008; Director, Mutual Fund Administration, Columbia Management Advisors, LLC, from May 2007 to July 2008; Vice President, Mutual Fund Valuation, Columbia Management Advisors, LLC, from January 2006 to May 2007; Vice President, Mutual Fund Accounting Oversight, Columbia Management Advisors, LLC from January 2005 to January 2006. |
| |
| Julian Quero (born 1967) | | |
One Financial Center Boston, MA 02111 Deputy Treasurer (since 2008) | | Vice President, Mutual Fund Administration, Columbia Management Investment Advisers, LLC since May 2010; Director of Fund Administration, Columbia Management Advisors, LLC, from August 2008 to April 2010; Senior Tax Manager, Columbia Management Advisors, LLC from August 2006 to July 2008; Senior Compliance Manager, Columbia Management Advisors, LLC from April 2002 to August 2006. |
| |
| Stephen T. Welsh (born 1957) | | |
One Financial Center Boston, MA 02111 Vice President (since 2006) | | President and Director, Columbia Management Investment Services Corp. since May 2010; President and Director, Columbia Management Services, Inc. from July 2004 to April 2010; Managing Director, Columbia Management Distributors, Inc. from August 2007 to April 2010. |
40
Board Consideration and Approval of Advisory Agreements
In September 2010, the Board of Trustees (the “Board”) unanimously approved new Investment Management Services Agreements (the “Advisory Agreements”) on behalf of various Columbia funds that would increase or decrease the contractual investment advisory fee rates payable by each affected Columbia fund (each, an “Affected Fund”) to Columbia Management for investment advisory services. For Columbia Dividend Income Fund, the Advisory Agreement will decrease contractual investment advisory fee rates. As detailed below, the Board held numerous meetings and discussions with the management team of Columbia Management and reviewed and considered materials in connection with the approval of the investment advisory fee before determining to approve the Advisory Agreements.
On April 30, 2010, Ameriprise Financial, Inc. acquired the long-term asset management business of Columbia Management Group, LLC, a subsidiary of Bank of America and the parent of the Affected Funds’ former investment adviser. In connection with that acquisition, the Affected Funds entered into investment management services agreements with Columbia Management, a subsidiary of Ameriprise Financial, Inc.
Beginning in April 2010, Columbia Management presented to the Advisory Fees and Expenses Committee (the “Committee”) of the Board a proposal to rationalize the fees and expenses, including the advisory fees, of the various registered investment companies in the combined complex of Columbia-, RiverSource-, Seligman- and Threadneedle-branded funds (the “Columbia Funds Complex”). Because these funds were organized at different times by many different sponsors, their fees and expenses did not reflect a common overall design, and Columbia Management proposed to implement a more consistent schedule of fees for similar funds based on a uniform pricing model across all of the funds. In this regard, Columbia Management presented the Committee with various data comparing current and proposed fee schedules to the fee schedules of peer funds, as selected by an independent third-party data provider. While Columbia Management projected that the proposed rationalization would reduce the overall fees and expenses of all of the funds in the aggregate, it was expected that certain fees and expenses, including advisory fees, would increase for certain funds. At the same time, Columbia Management presented the Committee with proposals to provide for consistent administrative services fee schedules across funds in the same asset class, reduced custody fee rates and a consistent transfer agency fee schedule across the funds, as well as initial proposals to merge various funds. In connection with these proposals, the Committee and the trustees considered a proposal by Columbia Management to contractually limit the total operating expenses (exclusive of brokerage commissions, interest (but including custodial charges relating to overdrafts), taxes and extraordinary expenses, after giving effect to any balance credits from each fund’s custodian) of Class A shares of funds, the expenses of which exceed the median expenses of such fund’s Class A shares peer group (as determined from time to time, generally annually, by an independent third-party data provider), to such median expenses (or a lower, agreed-upon rate), and to limit the total expenses of such funds’ other classes to a corresponding amount, adjusted to reflect any class-specific expenses (including transfer agency fees and payments under any distribution plan, shareholder servicing plan, and/or plan administration agreement).
The Committee and the trustees who are not “interested persons” (as defined in the Investment Company Act of 1940 (the “1940 Act”)) of the Trust (the “Independent Trustees”) requested and evaluated materials from, and were provided materials and information regarding the Advisory Agreements by, Columbia Management. The Committee, at meetings held on April 20, 2010, May 3, 2010, June 7, 2010, July 27, 2010 and August 10, 2010, and the Independent Trustees, at meetings held on April 20, 2010, May 4, 2010, June 7, 2010 and August 11, 2010, reviewed the materials provided in connection with their consideration of the Advisory Agreements and other matters relating to the proposals and discussed them with representatives of Columbia Management. The Committee and the Independent Trustees also reviewed and considered information that they had previously received in connection with their most recent consideration and approval of the current investment management services agreements with Columbia Management. They also consulted with Fund counsel and with the Independent Trustees’ independent legal counsel, who advised on the legal standards for consideration by the trustees and otherwise assisted the trustees in their deliberations. The trustees also met with, and reviewed and considered a report prepared and provided by, the independent fee consultant (the “Fee Consultant”) appointed by the Independent Trustees pursuant to an assurance of discontinuance entered into by Columbia Management
41
Advisors, LLC, the Affected Funds’ previous adviser, with the New York Attorney General (“NYAG”) to settle a civil complaint filed by the NYAG relating to trading in mutual fund shares (the “NYAG Settlement”). Under the NYAG Settlement, the Fee Consultant’s role is to manage the process by which management fees are negotiated so that they are negotiated in a manner that is at arms’ length and reasonable. On August 10, 2010, the Committee recommended that the trustees approve the Advisory Agreements. On September 14, 2010, the trustees, including a majority of the Independent Trustees, approved the Advisory Agreement for each Affected Fund, subject to shareholder approval.
The trustees considered all materials that they, their legal counsel or Columbia Management believed reasonably necessary to evaluate and to determine whether to approve the Advisory Agreements. The factors considered by the Committee and the trustees in recommending approval and approving the Advisory Agreement for each Affected Fund included the following:
| n | | The expected benefits of continuing to retain Columbia Management as the Affected Funds’ investment manager; |
| n | | The terms and conditions of the Advisory Agreements, including the increase or decrease, as applicable, in the advisory fee schedule for each Affected Fund; |
| n | | The impact of the proposed changes in investment advisory fee rates, as well as proposed changes in administrative services, transfer agency and custody fee rates, on each Affected Fund’s total expense ratio; |
| n | | For Columbia Dividend Income Fund, the reduction in the rates payable under its administrative services agreement; |
| n | | The willingness of Columbia Management to agree to contractually limit or cap total operating expenses for Columbia Dividend Income Fund so that total operating expenses (exclusive of brokerage commissions, interest (but including custodial charges relating to overdrafts), taxes and extraordinary expenses, after giving effect to any balance credits from each fund’s custodian) of Class A shares would not exceed the median expenses of such fund’s class A shares peer group (as determined from time to time, generally annually, by an independent third-party data provider); |
| n | | That Columbia Management, and not any Affected Fund, would bear the costs of obtaining any necessary shareholder approvals of the Advisory Agreements; |
| n | | The expected impact on expenses for certain Affected Funds of proposed mergers; and |
| n | | The expected benefits of further integrating the Combined Fund Complex by: |
| | n | | Standardizing total management fees across similar funds in the Combined Fund Complex to promote comparability of pricing among a menu of funds available to investors, including through exchange privileges; and | |
| | n | | Aligning investment advisory fee rates across funds in the Combined Fund Complex that are in the same investment category (e.g., the amendment would align the investment advisory fee rates of Columbia Large Cap Growth Fund with those of all other actively managed large-cap funds in the Combined Fund Complex). | |
Nature, Extent and Quality of Services Provided under the Advisory Agreements
The trustees considered the nature, extent and quality of services provided to the Affected Funds by Columbia Management and its affiliates under the Advisory Agreements and under separate agreements for the provision of transfer agency and administrative services, and the resources dedicated to the Affected Funds by Columbia Management and its affiliates. The trustees considered, among other things, the ability of Columbia Management to attract, motivate and retain highly qualified research, advisory and supervisory investment professionals (including Columbia Management’s personnel and other resources, compensation programs for personnel involved in fund management, reputation and other attributes), the portfolio management services provided by those investment professionals, the trade execution services provided on behalf of the Affected Funds and the quality of Columbia Management’s investment research capabilities and the other resources that it devotes to each Affected Fund. For each Affected Fund, the trustees also considered the potential benefits to shareholders of investing in a mutual fund that is part of a fund complex offering exposure to a variety of asset classes and investment disciplines and providing a variety of fund and shareholder services. After reviewing these and related factors, the trustees concluded, within the context of their overall conclusions, that the nature, extent and quality of the services to be provided to each Affected Fund under the
42
Advisory Agreements supported the approval of the Advisory Agreements.
Investment Performance
The trustees reviewed information about the performance of each Affected Fund over various time periods, including information prepared by an independent third-party data provider that compared the performance of each Affected Fund to the performance of peer groups of mutual funds and performance benchmarks. The trustees also reviewed a description of the third party’s methodology for identifying each Fund’s peer group for purposes of performance and expense comparisons. In the case of each Affected Fund whose performance lagged that of a relevant peer group for certain (although not necessarily all) periods, the trustees concluded that other factors relevant to performance were sufficient, in light of other considerations, to warrant approval of the Affected Fund’s Advisory Agreement. Those factors varied from fund to fund, but included one or more of the following: (i) that the Affected Fund’s performance, although lagging in certain recent periods, was stronger over the longer term; (ii) that the underperformance was attributable, to a significant extent, to investment decisions that were reasonable and consistent with the Affected Fund’s investment strategy and policies and that the Affected Fund was performing within a reasonable range of expectations, given those investment decisions, market conditions and the Affected Fund’s investment strategy; (iii) that the Affected Fund’s performance was competitive when compared to other relevant performance benchmarks or peer groups; and (iv) that Columbia Management had taken or was taking steps designed to help improve the Affected Fund’s investment performance, including, but not limited to, replacing portfolio managers, enhancing the resources supporting the portfolio managers, or modifying investment strategies.
The trustees noted that, through February 28, 2010, Columbia Dividend Income Fund’s performance was in the fourth quintile (where the best performance would be in the first quintile) for the one-year period and in the second quintile for the three- and five-year periods of the peer group selected by an independent third-party data provider for the purposes of performance comparisons.
After reviewing those and related factors, the trustees concluded, within the context of their overall conclusions regarding each of the Advisory Agreements, that the performance of each Affected Fund and Columbia Management was sufficient, in light of other considerations, to warrant the approval of the Advisory Agreement pertaining to that Affected Fund.
Investment Advisory Fee Rates and Other Expenses
The trustees considered that the Advisory Agreement for Columbia Dividend Income Fund would decrease the contractual investment advisory fee rates payable by that Fund and would be otherwise identical to that Fund’s current investment management services agreement. The trustees reviewed and considered information that they had previously received in connection with the most recent approval of Columbia Dividend Income Fund’s current investment management services agreement with Columbia Management.
After reviewing these and related factors, the trustees concluded, within the context of their overall conclusions, that the advisory fee rates under the Advisory Agreements and anticipated total expenses of each Affected Fund supported the approval of the Advisory Agreements.
Costs of Services Provided and Profitability
The trustees considered information about the advisory fees charged by Columbia Management to comparable institutional accounts. In considering the fees charged to those accounts, the trustees took into account, among other things, Columbia Management’s representations about the differences between managing mutual funds as compared to other types of accounts, including differences in the services provided, differences in the risk profile of such business for Columbia Management, and the additional resources required to manage mutual funds effectively. In evaluating each Affected Fund’s proposed advisory fees, the trustees also took into account the demands, complexity and quality of the investment management of the Affected Fund.
The trustees also considered the compensation directly or indirectly received by Columbia Management and its affiliates in connection with their relationships with the Affected Funds. The trustees reviewed information provided by management as to the projected profitability to Columbia Management and its affiliates of their relationships with each
43
Affected Fund, and information about the allocation of expenses used to calculate profitability. When reviewing profitability, the trustees also considered court cases in which adviser profitability was an issue in whole or in part, the performance of the relevant Affected Funds, the current and anticipated expense levels of each Affected Fund, and the implementation of breakpoints and/or expense limitations with respect to each Affected Fund.
After reviewing those and related factors, the trustees concluded, within the context of their overall conclusions, that the proposed changes to the advisory fees, and the related profitability to Columbia Management and its affiliates of their relationships with the Affected Fund, supported the approval of the Advisory Agreement pertaining to that Affected Fund.
Economies of Scale
The trustees considered the existence of any economies of scale in the provision by Columbia Management of services to each Affected Fund, to groups of related funds and to Columbia Management’s investment advisory clients as a whole, and whether those economies of scale were shared with the Affected Funds through breakpoints in the proposed investment advisory fees or other means, such as expense limitation arrangements and additional investments by Columbia Management in investment, trading and compliance resources. The trustees noted that all of the Affected Funds were expected to benefit from breakpoints and/or expense limitation arrangements. In considering those issues, the trustees also took note of the costs of the services to be provided (both on an absolute and relative basis) and the projected profitability to Columbia Management and its affiliates of their relationships with the Affected Funds, as discussed above. The trustees also noted the expected expense synergies and other anticipated benefits to Columbia Management and fund shareholders of both the rationalization of fees and expenses and the proposed mergers of certain Affected Funds. After reviewing these and related factors, the trustees concluded, within the context of their overall conclusions, that the extent to which economies of scale were expected to be shared with the Affected Funds supported the approval of the Advisory Agreements.
Other Benefits to Columbia Management
The trustees received and considered information regarding any expected “fall-out” or ancillary benefits to be received by Columbia Management and its affiliates as a result of their relationships with the Affected Funds, such as the provision by Columbia Management of administrative services to the Affected Funds and the provision by Columbia Management’s affiliates of distribution and transfer agency services to the Affected Funds, and how the proposed rationalization of fees and expenses might affect such benefits, including the fact that to the extent fees payable by the Affected Funds decrease, and the fees for such Funds were subject to a contractual limit or cap on expenses, Columbia Management may pay less in expense reimbursements. The trustees considered that the Affected Funds’ distributor, an affiliate of Columbia Management, retains a portion of the distribution fees from the Affected Funds and receives a portion of the sales charges on sales or redemptions of certain classes of shares of the Affected Funds, and that other affiliates of Columbia Management receive various forms of compensation in connection with their sale of shares of the Affected Funds. The trustees also considered the benefits of research made available to Columbia Management by reason of brokerage commissions generated by the Affected Funds’ securities transactions, and reviewed information about Columbia Management’s practices with respect to allocating portfolio brokerage and the use of “soft” commission dollars to pay for research. The trustees considered the possible conflicts of interest associated with certain fall-out or other ancillary benefits and the reporting, disclosure and other processes that would be in place to disclose and to monitor such possible conflicts of interest. The trustees recognized that Columbia Management’s profitability would be somewhat lower without these benefits.
In their deliberations, the trustees did not identify any single item that was paramount or controlling and individual trustees may have attributed different weights to various factors. The trustees also evaluated all information available to them on a fund-by-fund basis, and their determinations were made separately in respect of each Affected Fund.
Based on their evaluation of all factors that they deemed to be material, including those factors described above, and assisted by the advice of independent legal counsel and the Fee Consultant, the trustees, including the Independent Trustees, approved each Advisory Agreement.
44
Summary of Management Fee Evaluation by Independent Fee Consultant
REPORT OF INDEPENDENT FEE CONSULTANT TO THE FUNDS SUPERVISED BY THE COLUMBIA ATLANTIC BOARD
Prepared Pursuant to the February 9, 2005 Assurance of Discontinuance among the Office of Attorney General of New York State, Columbia Management Advisors, LLC, and Columbia Management Distributors, Inc. September 21, 2010
I. Overview
On February 9, 2005, Columbia Management Advisors, LLC (“CMA”) and Columbia Management Distributors, Inc.1 (“CMD”) agreed to the New York Attorney General’s Assurance of Discontinuance (“AOD”). Among other things, the AOD stipulates that CMA may manage or advise a Columbia Fund (“Columbia Fund” and, together with some or all of such funds, the “Columbia Funds”) only if the Independent Members of the Columbia Fund’s Board of Trustees appoint a Senior Officer or retain an Independent Fee Consultant (“IFC”) who is to manage the process by which proposed management fees are negotiated. The AOD further stipulates that the Senior Officer or IFC is to prepare a written annual evaluation of the fee negotiation process.
With effect from January 1, 2007, the Independent Members of the Board of Trustees for certain Columbia Funds known collectively as the “Atlantic Funds” (together with the other members of that Board, the “Trustees”) retained me as IFC for the Atlantic Funds.2 In this capacity, I have prepared this written evaluation of the fee negotiation process. As has been the case with my previous reports, my immediate predecessor as IFC, John Rea, provided invaluable assistance in the preparation of this report.
On September 29, 2009, Ameriprise entered into an asset purchase agreement with Bank of America, N.A. and its parent, Bank of America Corporation (together, the “Bank”) pursuant to which the Bank agreed to sell certain CMG assets relating to Columbia’s long-term asset management business, including management of the Atlantic Funds (the “Transaction”). The Transaction, which closed on April 30, 2010,3 resulted in the termination of the existing Investment Management Agreements with CMA. Prior to the closing of the Transaction, the Trustees and the shareholders of the Funds approved new Advisory and Administrative Agreements with an Ameriprise subsidiary now called Columbia Management Investment Advisers, LLC (“CMIA”). Those Agreements did not change the rates paid by the Funds from the levels specified in the former agreements with CMA.
CMIA serves as the adviser of funds supervised by three different Boards of Trustees: the Atlantic, Nations, and RiverSource Boards, and a subsidiary of CMIA serves as adviser to funds overseen by a fourth Board, Columbia/Wanger. After reviewing the range of funds overseen by all four Boards, CMIA proposed a series of changes intended, among other things, to rationalize its mutual fund product offerings (by, for example, proposing to merge funds with similar investment strategies) and the fees charged to the funds by CMIA and its affiliates. These proposals included (1) changes to the advisory fees paid by certain funds, (2) changes to administrative and similar fees paid by certain funds, (3) changes to the transfer agency, sub-transfer agency, custody, and pricing/bookkeeping fees paid by the Funds, and (4) mergers involving more than 60 funds. CMIA asked the Trustees to consider these proposals together. This report, consistent with and (to the extent applicable) in fulfillment of the terms of the AOD, will focus on changes to advisory and aggregate management fees and discuss other proposals insofar as they affect total fund expenses, which may be a relevant factor in considering the appropriate level of advisory and management fees (defined for purposes of this report as advisory plus administrative fees).
A. Role of the Independent Fee Consultant
The AOD charges the IFC with “managing the process by which proposed management fees … to be charged the Columbia Fund are negotiated so that they are negotiated in a manner which is at arms’ length and reasonable and consistent with this Assurance of Discontinuance.” The AOD also provides that CMA “may manage or advise a Columbia
| 1 | CMA and CMD are subsidiaries of Columbia Management Group, LLC (“CMG”), and are the successors to the entities named in the AOD. |
| 2 | I have no material relationship with Bank of America, CMG or Ameriprise Financial, Inc. (“Ameriprise”), aside from serving as IFC, and I am aware of no material relationship with any of their affiliates. I retained John Rea, an independent economic consultant, to assist me with this report. |
| | Unless otherwise stated or required by the context, this report covers only the Atlantic Funds. |
| 3 | CMIA, Materials Prepared for the Atlantic Fees and Expense Committee, June 7, 2010 (“June 7 Materials”), Tab 1 at p. 1. |
45
Fund only if the reasonableness of the proposed management fees is determined by the Board of Trustees … using … an annual independent written evaluation prepared by or under the direction of … the Independent Fee Consultant.” Therefore, the AOD makes clear that the IFC does not supplant the Trustees in negotiating management fees, nor does the IFC substitute his or her judgment for that of the Trustees with respect to the reasonableness of proposed fees or any other matter that is committed to the business judgment of the Trustees.
B. Elements Involved in Managing the Fee Negotiation Process
In preparing the report required by the AOD, the IFC must consider at least the following six factors set forth in the AOD:
| 1. | The nature and quality of the adviser’s services, including the Fund’s performance; |
| 2. | Management fees (including any components thereof) charged by other mutual fund companies for like services; |
| 3. | Possible economies of scale as the Fund grows larger; |
| 4. | Management fees (including any components thereof) charged to institutional and other clients of the adviser for like services; |
| 5. | Costs to the adviser and its affiliates of supplying services pursuant to the management fee agreements, excluding any intra-corporate profit; and |
| 6. | Profit margins of the adviser and its affiliates from supplying such services. |
II. Findings
| 1. | Based upon my examination of the information supplied by CMIA and Ameriprise in the light of the six factors set forth in the AOD, I conclude that the Trustees have the relevant information necessary to evaluate the reasonableness of the proposed contractual advisory and/or administrative fee changes at any asset level for each affected Atlantic Fund (each a “Fee Change Fund”). |
| 2. | In my view, the process by which the proposed management fees of each Fee Change Fund have been negotiated with CMIA thus far has been, to the extent practicable, at arm’s length and reasonable and consistent with the AOD. |
| 3. | There are 25 Funds for which CMIA has proposed an increase either in the contractual advisory or management fee (each a “Fee Increase Fund”). Seven of these Funds have a combination of higher contractual advisory fees and either lower or unchanged contractual management fees. The remaining 18 Funds have higher contractual management fees with the majority resulting from higher contractual advisory fees. For five Funds, however, the higher management fees result from a combination of lower advisory fees and higher administrative fees. |
| 4. | The actual management fee, computed on the basis of assets as of October 31, 2009, would increase for 16 of the Fee Increase Funds after accounting for CMIA’s proposed expense limitation program, non-management fee changes, and proposed mergers. Seven Funds would have lower actual management fees, and two would experience no change in actual management fees. |
| 5. | Sixteen of the 25 Fee Increase Funds have generally median or better-than-median performance. Only one Fee Increase Fund – High Yield Opportunity Fund – would be identified for further review based on performance criteria used by the Trustees in past contract review processes. |
| 6. | CMIA proposed that the Funds and most other mutual funds it or its affiliates advise or sponsor (together, the “CMIA Funds”) be subject to a contractual expense limitation calculated as the median of the relevant fund’s Lipper expense group. As a result, all Fee Increase Funds are projected to have total expenses in the first, second, or third quintiles after full implementation of the proposed fee changes, expense limitations, and mergers. The expense limitation would be recalculated every year based on updated Lipper data. An analysis of the changes in median expenses for 2009 and 2010 indicates that some Funds are likely to experience sizable changes in their expense limits. Some Funds would have higher-than-median actual management fees notwithstanding the newly-established expense limitations. |
| 7. | CMIA reviewed differences between management of retail mutual funds and advising institutional accounts and supplied charts plotting contractual and actual institutional and fund fees against assets in various investment categories. The data showed that mutual fund fees are often lower at small asset levels reflecting CMIA’s reimbursement of fund expenses. At higher asset levels, mutual fund fees typically exceed institutional fees. |
46
| 8. | CMIA provided fund-by-fund projected profitability data. Due to the significant changes in the operations of the Funds (including the change of the Funds’ investment adviser), historical profitability data was judged to have little relevance. |
| 9. | CMIA provided projections of both the cumulative benefit to CMIA Fund shareholders of all aspects of its proposals (including proposed mergers) and the synergies in the form of decreased expenses that would benefit CMIA and its parent, Ameriprise. |
47
[THIS PAGE INTENTIONALLY LEFT BLANK]
48
Important Information About This Report
The fund mails one shareholder report to each shareholder address. If you would like more than one report, please call shareholder services at 1-800-345-6611 and additional reports will be sent to you. This report has been prepared for shareholders of Columbia Dividend Income Fund.
A description of the policies and procedures that the fund uses to determine how to vote proxies and a copy of the fund’s voting records are available (i) at www.columbiamanagement.com, (ii) on the Securities and Exchange Commission’s website at www.sec.gov, and (iii) without charge, upon request, by calling 1-800-368-0346. Information regarding how the fund voted proxies relating to portfolio securities during the 12-month period ended June 30 is available from the SEC’s website. Information regarding how the fund voted proxies relating to portfolio securities is also available from the fund’s website, www.columbiamanagement.com.
The fund files a complete schedule of portfolio holdings with the SEC for the first and third quarters of each fiscal year on Form N-Q. The fund’s Form N-Q is available on the SEC’s website at www.sec.gov and may be reviewed and copied at the SEC’s Public Reference Room in Washington, D.C. Information on the operation of the Public Reference Room may be obtained by calling
1-800-SEC-0330.
Transfer Agent
Columbia Management Investment Services Corp.
P.O. Box 8081
Boston, MA 02266-8081
1-800-345-6611
Distributor
Columbia Management Investment
Distributors, Inc.
One Financial Center
Boston, MA 02111
Investment Advisor
Columbia Management Investment Advisers, LLC
100 Federal Street
Boston, MA 02110
49

Columbia Dividend Income Fund
P.O. Box 8081
Boston, MA 02266-8081
columbiamanagement.com
This information is for use with concurrent or prior delivery of a fund prospectus. Investors should consider the investment objectives, risks, charges and expenses of a mutual fund carefully before investing. For a free prospectus, which contains this and other important information about the funds, visit columbiamanagement.com. Read the prospectus carefully before investing. The Fund is distributed by Columbia Management Investment Distributors, Inc., member FINRA, and managed by Columbia Management Investment Advisers, LLC.
©2010 Columbia Management Investment Advisers, LLC. All rights reserved.
C-1391 A (11/10)

Columbia Liberty Fund
Annual Report for the Period Ended September 30, 2010
Table of Contents
The views expressed in this report reflect the current views of the respective parties. These views are not guarantees of future performance and involve certain risks, uncertainties and assumptions that are difficult to predict, so actual outcomes and results may differ significantly from the views expressed. These views are subject to change at any time based upon economic, market or other conditions and the respective parties disclaim any responsibility to update such views. These views may not be relied on as investment advice and, because investment decisions for a Columbia Fund are based on numerous factors, may not be relied on as an indication of trading intent on behalf of any particular Columbia Fund. References to specific securities should not be construed as a recommendation or investment advice.
President’s Message

Dear Shareholder:
The Columbia Management story began over 100 years ago, and today, we are one of the nation’s largest dedicated asset managers. The recent acquisition by Ameriprise Financial, Inc. brings together the talents, resources and capabilities of Columbia Management with those of RiverSource Investments, Threadneedle (acquired by Ameriprise in 2003) and Seligman Investments (acquired by Ameriprise in 2008) to build a best-in-class asset management business that we believe is truly greater than its parts.
RiverSource Investments traces its roots to 1894 when its then newly-founded predecessor, Investors Syndicate, offered a face-amount savings certificate that gave small investors the opportunity to build a safe and secure fund for retirement, education or other special needs. A mutual fund pioneer, Investors Syndicate launched Investors Mutual Fund in 1940. In the decades that followed, its mutual fund products and services lineup grew to include a full spectrum of styles and specialties. More than 110 years later, RiverSource continues to be a trusted financial products leader.
Threadneedle, a leader in global asset management and one of Europe’s largest asset managers, offers sophisticated international experience from a dedicated U.K. management team. Headquartered in London, it is named for Threadneedle Street in the heart of the city’s financial district, where British investors pioneered international and global investing. Threadneedle was acquired in 2003 and today operates as an affiliate of Columbia Management.
Seligman Investments’ beginnings date back to the establishment of the investment firm J. & W. Seligman & Co. in 1864. In the years that followed, Seligman played a major role in the geographical expansion and industrial development of the United States. In 1874, President Ulysses S. Grant named Seligman as fiscal agent for the U.S. Navy — an appointment that would last through World War I. Seligman helped finance the westward path of the railroads and the building of the Panama Canal. The firm organized its first investment company in 1929 and began managing its first mutual fund in 1930. In 2008, J. & W. Seligman & Co. Incorporated was acquired and Seligman Investments became an offering brand of RiverSource Investments, LLC.
We are proud of the rich and distinctive history of these firms, the strength and breadth of products and services they offer, and the combined cultures of pioneering spirit and forward thinking. Together we are committed to providing more for our shareholders than ever before.
| n | | A singular focus on our shareholders. Our business is asset management, so investors are our first priority. We dedicate our resources to identifying timely investment opportunities and provide a comprehensive choice of equity, fixed-income and alternative investments to help meet your individual needs. |
| n | | First-class research and thought leadership. We are dedicated to helping you take advantage of today’s opportunities and anticipate tomorrow’s. We stay abreast of the latest investment trends and ideas, using our collective insight to evaluate events and transform them into solutions you can use. |
| n | | A disciplined investment approach. We aren’t distracted by passing fads. Our teams adhere to a rigorous investment process that helps ensure the integrity of our products and enables you and your financial advisor to match our solutions to your objectives with confidence. |
When you choose Columbia Management, you can be confident that we will take the time to understand your needs and help you and your financial advisor identify the solutions that are right for you. Because at Columbia Management, we don’t consider ourselves successful unless you are.
Sincerely,

J. Kevin Connaughton
President, Columbia Funds
Investors should consider the investment objectives, risks, charges and expenses of a mutual fund carefully before investing. For a free prospectus, which contains this and other important information about the funds, visit columbiamanagement.com. The prospectus should be read carefully before investing.
Columbia Funds are distributed by Columbia Management Investment Distributors, Inc., member FINRA, and managed by Columbia Management Investment Advisers, LLC.
© 2010 Columbia Management Investment Advisers, LLC. All rights reserved.
Fund Profile – Columbia Liberty Fund
Performance data quoted represents past performance and current performance may be lower or higher. Past performance is no guarantee of future results. The investment return and principal value will fluctuate so that shares, when redeemed, may be worth more or less than the original cost. Please visit www.columbiamanagement.com for daily and most recent month-end performance updates.
Summary
1-year return as of 09/30/10
| | |
| |
 | | +8.63% Class A shares (without sales charge) |
| |
| | +10.16% S&P 500 Index |
| |
| | +8.16% Barclays Capital Aggregate Bond Index3 |
Summary
| n | | For the 12-month period that ended September 30, 2010, the fund’s Class A shares returned 8.63% without sales charge. |
| n | | The fund trailed the 9.26% average return of its peer group, the Lipper Mixed-Asset Target Allocation Moderate Funds Classification.1 |
| n | | The fund’s investment-grade bonds produced strong results, while performance from large-cap value and overseas developed market stocks was disappointing relative to the S&P 5002. |
Portfolio Management
Anwiti Bahuguna, PhD has co-managed the fund since 2009 and has been associated with the advisor since May 2010. Prior to joining the advisor, Ms. Bahuguna was associated with the fund’s previous advisor or its predecessors since 2002.
Kent M. Bergene has co-managed the fund since May 2010 and has been associated with the advisor or its predecessors since 1981.
David Joy has co-managed the fund since May 2010 and has been associated with the advisor or its predecessors since 2003.
Colin Moore has co-managed the fund since 2008 and has been associated with the advisor since May 2010. Prior to joining the advisor, Mr. Moore was associated with the fund’s previous advisor or its predecessors since 2002.
Kent M. Peterson, PhD has co-managed the fund since 2009 and has been associated with the advisor since May 2010. Prior to joining the advisor, Mr. Peterson was associated with the fund’s previous advisor or its predecessors since 2006.
Marie M. Schofield, CFA has co-managed the fund since 2009 and has been associated with the advisor since May 2010. Prior to joining the advisor, Ms. Schofield was associated with the fund’s previous advisor or its predecessors since 1990.
Effective as of May 1, 2010, Kent M. Bergene and David Joy became co-managers of the fund.
Effective May 1, 2010, RiverSource Investments, LLC, a subsidiary of Ameriprise Financial, Inc., became the investment advisor to the fund and changed its name to Columbia Management Investment Advisers, LLC. Please see the fund’s prospectus, as supplemented, for more information regarding the change in investment advisor and certain other changes.
| 1 | Lipper Inc., a widely respected data provider in the industry, calculates an average total return (assuming reinvestment of distributions) for mutual funds with investment objectives similar to those of the fund. Lipper makes no adjustment for the effect of sales loads. |
| 2 | The Standard & Poor’s (S&P) 500 Index tracks the performance of 500 widely held, large-capitalization U.S. stocks. |
| 3 | The Barclays Capital Aggregate Bond Index is a market value-weighted index that tracks the daily price, coupon, pay-downs and total return performance of fixed-rate, publicly placed, dollar-denominated and non-convertible investment grade debt issues with at least $250 million par amount outstanding and with at least one year to final maturity. |
Indices are not available for investment, are not professionally managed and do not reflect sales charges, fees, brokerage commissions, taxes or other expenses of investing. Securities in the fund may not match those in an index.
1
Economic Update – Columbia Liberty Fund
Summary
For the 12-month period that ended September 30, 2010
| | n | | The U.S. stock market, as measured by the S&P 500 Index, delivered solid returns, despite a summer correction. Emerging market stocks, as measured by the MSCI Emerging Markets Index (Net), outperformed U.S. stocks as well as stock markets in developed foreign markets, as measured by the MSCI EAFE Index. | |
| | |
| S&P Index | | MSCI Emerging Markets Index |
| |

| |
|
10.16% | | 20.22% |
| | n | | Modest economic growth and relatively low interest rates boosted bond market returns. The Barclays Capital Aggregate Bond Index delivered solid results. High-yield bonds outperformed stocks, as measured by the JPMorgan Developed BB High Yield Index. | |
| | |
| Barclays Aggregate Index | | JPMorgan Index |
| |
| |
|
8.16% | | 16.19% |
Although it has been more than a year since U.S. economic growth turned positive, the economy continues to send mixed signals about the sustainability of this recovery. Economic growth, as measured by gross domestic product (GDP), was a solid 5.0% in the last quarter of 2009. However, it was 3.7% in the first quarter of 2010 and only 1.7% in the second quarter. Expectations are for continued lackluster growth through the end of the year, as government incentive programs have ended and stimulus spending winds down. Even so, it appears to be unlikely that the U.S. economy will sink back into recession, as many key indicators remain positive.
Consumer spending on cars, clothing and other goods increased throughout the year, although the pace of increased spending was small. Personal income also moved higher. Consumer confidence, as measured by the Conference Board Consumer Confidence Index, gained ground in the first half of 2010. However, the index fell sharply during the summer. Consumers surveyed in the final months of the reporting period indicated they were concerned about business conditions and job prospects and generally apprehensive about the future.
The housing market — another bellwether for the consumer sector — showed a glimmer of improvement in the final months of the period. Although both new and existing home sales fell during the summer after a federal tax credit for new and repeat homebuyers expired, sales of existing homes picked up in August 2010. Sales of new homes were flat in August 2010 and the inventory of new homes for sales fell to a 42-year low. Pending home sales, a forward-looking indicator, rose in both July 2010 and August 2010. The latest data points to rising sales in the months ahead. Distressed properties continued to pressure prices. The national median price of existing homes rose slightly over the one-year period, while the national median price of new homes declined slightly. The inventory of unsold new homes declined sharply at the end of the period.
News on the job front was mostly positive for the period, but the number of new jobs added to the economy fell short of expectations. A good portion of the jobs added in March, April and May were temporary, government-sponsored census positions, which began to unwind in June, July and August. Private sector job growth was disappointing given the stage of economic recovery. Nevertheless, private sector payroll employment trended modestly higher through the end of the period, and news of massive layoffs declined.
Reports from the business side of the economy were generally positive. A key measure of the nation’s manufacturing situation — the Institute for Supply Management’s Index — trended higher for 14 consecutive months, before dipping downward in September. Industrial production moved higher, as did the amount of manufacturing capacity utilized — a key measure of the health of the manufacturing sector.
Stock rally regains its footing
Against a strengthening economic backdrop, a stock market rally that began early in 2009 continued into the spring of 2010. But during the early summer months, a debt crisis brewing in Europe raised concerns among U.S. investors, as did mixed signals on the economy, and some of the stock market’s earlier gains vanished. Then, in
2
Economic Update (continued) – Columbia Liberty Fund
September, investors reversed course and bid stocks sharply higher. The S&P 500 Index1 returned 10.16% for the 12-month period. Outside the United States, stock market returns were mixed. The MSCI EAFE Index (Net)2, a broad gauge of stock market performance in foreign developed markets, returned 3.27% (in U.S. dollars) for the period, as concerns about the impact of a bailout for weak eurozone economies weighed on the markets. Emerging stock markets were more resilient. The MSCI Emerging Markets Index (Net)3 returned 20.22% (in U.S. dollars) for the 12-month period.
Bonds delivered solid returns
As the economy strengthened, bonds also delivered solid returns. The Barclays Capital Aggregate Bond Index4 returned 8.16%. The high-yield bond market outpaced stocks by a sizeable margin during the period. For the 12 months covered by this report, the JPMorgan Developed BB High Yield Index5 returned 16.19%. The Treasury market was also positive. As the yield on the 10-year U.S. Treasury, a common bellwether for the bond market, fell over the 12-month period (Bond prices and yields move in opposite directions), the Barclays Capital U.S. Treasury Index6 returned 7.32%. Despite positive economic activity, the Federal Reserve Board (the Fed) kept a key short-term interest rate — the federal funds rate—close to zero.
Past performance is no guarantee of future results.
| 1 | The Standard & Poor’s (S&P) 500 Index tracks the performance of 500 widely held, large-capitalization U.S. stocks. |
| 2 | The Morgan Stanley Capital International Europe, Australasia, Far East (MSCI EAFE) Index (Net) is a free float-adjusted market capitalization index that is designed to measure the equity market performance of developed markets, excluding the U.S. & Canada. As of May 27, 2010 the MSCI EAFE Index (Net) consisted of the following 22 developed market country indices: Australia, Austria, Belgium, Denmark, Finland, France, Germany, Greece, Hong Kong, Ireland, Israel, Italy, Japan, the Netherlands, New Zealand, Norway, Portugal, Singapore, Spain, Sweden, Switzerland, and the United Kingdom. |
| 3 | The Morgan Stanley Capital International Emerging Markets (MSCI EMI) Index (Net) is a free float-adjusted market capitalization index that is designed to measure equity market performance of emerging markets. As of May 27, 2010, the MSCI Emerging Markets Index consisted of the following 21 emerging market country indices: Brazil, Chile, China, Colombia, Czech Republic, Egypt, Hungary, India, Indonesia, Korea, Malaysia, Mexico, Morocco, Peru, Philippines, Poland, Russia, South Africa, Taiwan, Thailand and Turkey. |
| 4 | The Barclays Capital Aggregate Bond Index is a market value-weighted index that tracks the daily price, coupon, pay-downs, and total return performance of fixed-rate, publicly placed, dollar-denominated, and non-convertible investment grade debt issues with at least $250 million par amount outstanding and with at least one year to final maturity. |
| 5 | The JPMorgan Developed BB High Yield Index is an unmanaged index designed to mirror the investable universe of the U.S. dollar developed, BB-rated, high yield corporate debt market. |
| 6 | The Barclays Capital U.S. Treasury Index includes public obligations of the U.S. Treasury. Treasury bills are excluded by the maturity constraint. In addition, certain special issues, such as state and local government series bonds (SLGs), as well as U.S. Treasury TIPS, are excluded. STRIPS are excluded from the index because their inclusion would result in double-counting. |
Indices are not available for investment, are not professionally managed and do not reflect sales charges, fees, brokerage commissions, taxes or other expenses of investing. Securities in the fund may not match those in an index.
3
Performance Information – Columbia Liberty Fund
Performance data quoted represents past performance and current performance may be lower or higher. Past performance is no guarantee of future results. The investment return and principal value will fluctuate so that shares, when redeemed, may be worth more or less than the original cost. Please visit www.columbiamanagement.com for daily and most recent month-end performance updates.
| | | | |
| Net asset value per share | |
| |
as of 09/30/10 ($) | | | | |
Class A | | | 7.52 | |
Class B | | | 7.55 | |
Class C | | | 7.53 | |
Class Z | | | 8.11 | |
| | | | |
| Distributions declared per share | |
| |
10/01/09 – 09/30/10 ($) | | | | |
Class A | | | 0.13 | |
Class B | | | 0.08 | |
Class C | | | 0.08 | |
Class Z | | | 0.15 | |
|
| Performance of a $10,000 investment 10/01/00 – 09/30/10 |
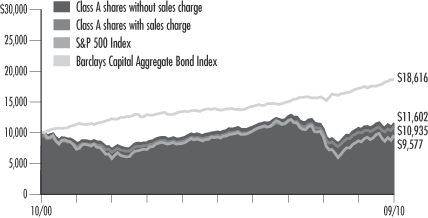
The chart above shows the change in value of a hypothetical $10,000 investment in Class A shares of Columbia Liberty Fund during the stated time period, and does not reflect the deduction of taxes that a shareholder may pay on fund distributions or on the redemption of fund shares.
| | | | | | | | |
| Performance of a $10,000 investment 10/01/00 – 09/30/10 ($) | |
| Sales charge | | without | | | with | |
Class A | | | 11,602 | | | | 10,935 | |
Class B | | | 10,755 | | | | 10,755 | |
Class C | | | 10,747 | | | | 10,747 | |
Class Z | | | 11,879 | | | | n/a | |
| | | | | | | | | | | | | | | | | | | | | | | | | | | | |
| Average annual total return as of 09/30/10 (%) | | | | |
| Share class | | A | | | B | | | C | | | Z | |
| Inception | | 04/30/82 | | | 05/05/92 | | | 08/01/97 | | | 07/31/95 | |
| Sales charge | | without | | | with | | | without | | | with | | | without | | | with | | | without | |
1-year | | | 8.63 | | | | 2.39 | | | | 7.80 | | | | 2.80 | | | | 7.82 | | | | 6.82 | | | | 8.92 | |
5-year | | | 2.75 | | | | 1.54 | | | | 1.95 | | | | 1.61 | | | | 1.95 | | | | 1.95 | | | | 3.00 | |
10-year | | | 1.50 | | | | 0.90 | | | | 0.73 | | | | 0.73 | | | | 0.72 | | | | 0.72 | | | | 1.74 | |
The “with sales charge” returns include the maximum initial sales charge of 5.75% for Class A shares and the applicable contingent deferred sales charge of 5.00% in the first year, declining to 1.00% in the sixth year, and eliminated thereafter for Class B shares and 1.00% for Class C shares for the first year only. The “without sales charge” returns do not include the effect of sales charges. If they had, returns would be lower.
Performance results reflect any fee waivers or reimbursements of fund expenses by the investment advisor and/or any of its affiliates. Absent these fee waivers or expense reimbursement arrangements, performance results would have been lower.
All results shown assume reinvestment of distributions. Class Z shares are sold at net asset value with no distribution and service (Rule 12b-1) fees. Class Z shares have limited eligibility and the investment minimum requirements may vary. Please see the fund’s prospectus for details. Performance for different share classes will vary based on differences in sales charges and fees associated with each class.
The tables do not reflect the deduction of taxes that a shareholder may pay on fund distributions or on the redemption of fund shares.
4
Understanding Your Expenses – Columbia Liberty Fund
Estimating your actual expenses
To estimate the expenses that you paid over the period, first you will need your account balance at the end of the period:
| | n | | For shareholders who receive their account statements from Columbia Management Investment Services Corp., your account balance is available online at www.columbiamanagement.com or by calling Shareholder Services at 800.345.6611. | |
| | n | | For shareholders who receive their account statements from their financial intermediary, contact your financial intermediary to obtain your account balance. | |
| | 1. | Divide your ending account balance by $1,000. For example, if an account balance was $8,600 at the end of the period, the result would be 8.6. | |
| | 2. | In the section of the table below titled “Expenses paid during the period,” locate the amount for your share class. You will find this number in the column labeled “Actual.” Multiply this number by the result from step 1. Your answer is an estimate of the expenses you paid on your account during the period. | |
If the value of your account falls below the minimum initial investment requirement applicable to you, your account may be subject to a $20 annual fee. This fee is not included in the accompanying table. If you are subject to the fee, keep it in mind when you are estimating the ongoing expenses of investing in the fund and when comparing the expenses of this fund with other funds.
As a fund shareholder, you incur two types of costs. There are transaction costs, which generally include sales charges on purchases and may include redemption fees or exchange fees. There are also ongoing costs, which generally include investment advisory fees, distribution and service (Rule 12b-1) fees and other fund expenses. The information on this page is intended to help you understand the ongoing costs of investing in the fund and to compare these costs with the ongoing costs of investing in other mutual funds.
Analyzing your fund’s expenses by share class
To illustrate these ongoing costs, we have provided an example and calculated the expenses paid by investors in each share class during the period. The information in the following table is based on an initial investment of $1,000, which is invested at the beginning of the period and held for the entire period. Expense information is calculated two ways and each method provides you with different information. The amount listed in the “Actual” column is calculated using the fund’s actual operating expenses and total return for the period. The amount listed in the “Hypothetical” column for each share class assumes that the return each year is 5% before expenses and is calculated based on the fund’s actual operating expenses. You should not use the hypothetical account values and expenses to estimate either your actual account balance at the end of the period or the expenses you paid during this period.
Compare with other funds
Since all mutual funds are required to include the same hypothetical calculations about expenses in shareholder reports, you can use this information to compare the ongoing costs of investing in the fund with other funds. To do so, compare the 5% hypothetical example with the 5% hypothetical examples that appear in the shareholder reports of other funds. As you compare hypothetical examples of other funds, it is important to note that hypothetical examples are meant to highlight the ongoing costs of investing in a fund and do not reflect any transaction costs, such as sales charges, redemption fees or exchange fees.
| | | | | | | | | | | | | | | | | | | | | | | | | | | | |
| 04/01/10 – 09/30/10 | |
| | | | |
| | | Account value at the
beginning of the period ($) | | | Account value at the
end of the period ($) | | | Expenses paid
during the period ($) | | | Fund’s annualized
expense ratio (%) | |
| | | Actual | | | Hypothetical | | | Actual | | | Hypothetical | | | Actual | | | Hypothetical | | | Actual | |
Class A | | | 1,000.00 | | | | 1,000.00 | | | | 1,015.90 | | | | 1,019.45 | | | | 5.66 | | | | 5.67 | | | | 1.12 | |
Class B | | | 1,000.00 | | | | 1,000.00 | | | | 1,012.00 | | | | 1,015.69 | | | | 9.43 | | | | 9.45 | | | | 1.87 | |
Class C | | | 1,000.00 | | | | 1,000.00 | | | | 1,012.10 | | | | 1,015.69 | | | | 9.43 | | | | 9.45 | | | | 1.87 | |
Class Z | | | 1,000.00 | | | | 1,000.00 | | | | 1,018.30 | | | | 1,020.66 | | | | 4.45 | | | | 4.46 | | | | 0.88 | |
Expenses paid during the period are equal to the annualized expense ratio for the share class, multiplied by the average account value over the period, then multiplied by the number of days in the fund’s most recent fiscal half-year and divided by 365.
It is important to note that the expense amounts shown in the table are meant to highlight only ongoing costs of investing in the fund and do not reflect any transaction costs, such as sales charges, redemption fees or exchange fees. Therefore, the hypothetical examples provided may not help you determine the relative total costs of owning shares of different funds. If these transaction costs were included, your costs would have been higher.
5
Portfolio Managers’ Report – Columbia Liberty Fund
Performance data quoted represents past performance and current performance may be lower or higher. Past performance is no guarantee of future results. The investment return and principal value will fluctuate so that shares, when redeemed, may be worth more or less than the original cost. Please visit www.columbiamanagement.com for daily and most recent month-end performance updates.
| | | | |
| Top 5 equity sectors | | | |
| |
as of 09/30/10 (%) | | | | |
Information Technology | | | 10.5 | |
Financials | | | 10.0 | |
Industrials | | | 8.4 | |
Consumer Discretionary | | | 7.9 | |
Health Care | | | 6.6 | |
| | | | |
| Top 10 equity holdings | | | |
| |
as of 09/30/10 (%) | | | | |
Chevron | | | 1.2 | |
Apple | | | 1.2 | |
JPMorgan | | | 0.9 | |
Philip Morris International | | | 0.9 | |
Google | | | 0.9 | |
International Business Machines | | | 0.8 | |
Occidental Petroleum | | | 0.8 | |
Target | | | 0.8 | |
United Technologies | | | 0.8 | |
Wells Fargo | | | 0.8 | |
| | | | |
| Portfolio structure | | | |
| |
as of 09/30/10 (%) | | | | |
Common Stocks | | | 60.3 | |
Mortgage-Backed Securities | | | 9.9 | |
Corporate Fixed-Income Bonds & Notes | | | 9.9 | |
Government & Agency Obligations | | | 7.6 | |
Commercial Mortgage-Backed Securities | | | 5.4 | |
Collateralized Mortgage Obligations | | | 1.5 | |
Cash & Equivalents | | | 4.3 | |
Asset-Backed Securities | | | 0.8 | |
Convertible Preferred Stocks | | | 0.4 | |
Convertible Bonds | | | 0.2 | |
Preferred Stock | | | 0.6 | |
| | The fund is actively managed and the composition of its portfolio will change over time. Information provided is calculated as a percentage of net assets. |
For the 12-month period that ended September 30, 2010, the fund’s Class A shares returned 8.63% without sales charge. Performance trailed the fund’s peer group, the Lipper Mixed-Asset Target Allocation Moderate Funds Classification, which had an average return of 9.26%. By comparison, the fund’s equity benchmark, the S&P 500 Index, returned 10.16%, and its fixed-income benchmark, the Barclays Capital Aggregate Bond Index, returned 8.16%. We believe the fund’s underperformance came from the equity side of the portfolio.
Extreme volatility in second half of reporting period
Stocks rallied during the first six months of the period, as businesses started spending to restock depleted inventories and government stimulus measures transferred money to unemployed workers. Starting in April, however, the stock market became much more volatile, as investors worried about the impact of a European sovereign debt crisis, the end of U.S. government stimulus programs and a fragile economic recovery. Stocks regained some momentum in July, before sliding in August as investors reacted to more disappointing economic data. Stocks ended the period with a sharp rally in September, triggered by indications from the Federal Reserve that it was ready to intervene to keep the economic recovery on track and by prospects for a shift in Congressional leadership in the upcoming November elections. Bonds also produced strong returns in the past year, but lagged stocks. Fixed-income markets benefited as interest rates stayed low, Treasury yields fell and risk-averse investors shifted into fixed-income assets.
Gains from fixed-income investments
The fund picked up ground as the fixed-income side of the portfolio, which consists entirely of investment-grade bond issues, outperformed its benchmark, the Barclays Capital Aggregate Bond Index. Selections in the finance, insurance and real estate investment trust (REIT) segments were especially helpful. Over the year, we locked in gains and reduced the investment-grade bond allocation from 41% to 35%. We used the proceeds to take advantage of buying opportunities in the large-cap and developed market foreign equities sectors.
| 1 | The Russell 1000 Value Index measures the performance of those Russell 1000 Index companies with lower price-to-book ratios and lower forecasted growth values. |
| 2 | The Russell 1000 Growth Index measures the performance of those Russell 1000 Index companies with higher price-to-book ratios and higher forecasted growth values. |
| 3 | The Morgan Stanley Capital International Europe, Australasia, Far East (MSCI EAFE) Index (Net) is a free float-adjusted market capitalization index that is designed to measure the equity market performance of developed markets, excluding the U.S. & Canada. As of May 27, 2010 the MSCI EAFE Index (Net) consisted of the following 22 developed market country indices: Australia, Austria, Belgium, Denmark, Finland, France, Germany, Greece, Hong Kong, Ireland, Israel, Italy, Japan, the Netherlands, New Zealand, Norway, Portugal, Singapore, Spain, Sweden, Switzerland, and the United Kingdom. |
Indices are not available for investment, are not professionally managed and do not reflect sales charges, fees, brokerage commissions, taxes or other expenses of investing. Securities in the fund may not match those in an index.
6
Portfolio Managers’ Report (continued) – Columbia Liberty Fund
Disappointing results from large-cap and overseas portfolios
More than half the fund’s assets at period end were invested in large-cap stocks, split nearly equally between the growth and value disciplines. Large-cap value stocks were the biggest hindrance overall to performance, in part as the Russell 1000 Value Index’s1 8.90% return put the sector behind the broader market. In addition, the fund’s large-cap value return lagged the Russell index. On the large-cap growth side, performance was very strong in absolute terms, outpacing the S&P 500. The fund’s large-cap growth stocks, however, fell modestly behind the 12.65% return of their benchmark, the Russell 1000 Growth Index2. An 11% stake in developed overseas markets also pressured results, as developed international market stock returns were well behind U.S. stock returns, mainly because of concerns that some peripheral European countries might default on their sovereign debt. The fund’s overseas holdings trailed the 3.27% return of their benchmark, the MSCI EAFE Index (Net)3.
Positioned for slow economic growth
By period end, economic data seemed to confirm a loss of momentum in growth. However, we do not think we’ll see the double-dip recession that some market observers have feared. Going forward, we plan to continue to favor equities, particularly higher-quality domestic stocks that pay dividends. We believe these types of stocks will benefit as investors search for yield in a period of prolonged low interest rates, low inflation and muted economic growth. Over the period, we increased the fund’s stake in large-cap stocks from 47% to 52%, as we found attractively-valued buying opportunities in the sector. We funded these purchases with the proceeds from selling investment-grade bond holdings. The fund’s fixed-income investments remain focused on issues with a yield advantage, as we expect income to be a bigger driver of bond returns than price appreciation going forward.
Portfolio characteristics and holdings are subject to change and may not be representative of current characteristics and holdings. The outlook for the fund may differ from that presented for other Columbia Funds.
Equity securities are subject to stock market fluctuations that occur in response to economic and business developments.
Investing in fixed-income securities may involve certain risks, including the credit quality of individual issuers, possible prepayments, market or economic developments and yield and share price fluctuations due to changes in interest rates. When interest rates go up, bond prices typically drop, and vice versa.
International investing involves special risks, including foreign taxation, currency risks, risks associated with possible differences in financial standards and other risks associated with future political and economic developments.
7
Investment Portfolio – Columbia Liberty Fund
September 30, 2010
Common Stocks – 60.3%
| | | | | | | | |
| | | Shares | | | Value ($) | |
| Consumer Discretionary – 7.7% | | | | | | | | |
| Auto Components – 1.0% | | | | | | | | |
Autoliv, Inc. (a) | | | 17,290 | | | | 1,129,556 | |
Bridgestone Corp. | | | 38,100 | | | | 695,707 | |
Continental AG (a) | | | 9,232 | | | | 717,772 | |
Dana Holding Corp. (a) | | | 18,700 | | | | 230,384 | |
Hyundai Mobis | | | 3,133 | | | | 706,165 | |
| | | | | | | | |
Auto Components Total | | | | | | | 3,479,584 | |
| | |
| Automobiles – 0.6% | | | | | | | | |
Daimler AG, Registered Shares (a) | | | 14,521 | | | | 921,289 | |
Ford Motor Co. (a) | | | 56,250 | | | | 688,500 | |
Suzuki Motor Corp. | | | 21,100 | | | | 443,835 | |
| | | | | | | | |
Automobiles Total | | | | | | | 2,053,624 | |
| | |
| Distributors – 0.3% | | | | | | | | |
CFAO SA | | | 8,212 | | | | 327,336 | |
Genuine Parts Co. | | | 19,700 | | | | 878,423 | |
| | | | | | | | |
Distributors Total | | | | | | | 1,205,759 | |
| | |
| Hotels, Restaurants & Leisure – 1.4% | | | | | | | | |
Carnival Corp. | | | 21,000 | | | | 802,410 | |
Carnival PLC | | | 12,173 | | | | 478,827 | |
Las Vegas Sands Corp. (a) | | | 24,060 | | | | 838,491 | |
McDonald’s Corp. | | | 18,526 | | | | 1,380,372 | |
Starbucks Corp. | | | 28,620 | | | | 732,099 | |
Starwood Hotels & Resorts Worldwide, Inc. | | | 8,285 | | | | 435,377 | |
| | | | | | | | |
Hotels, Restaurants & Leisure Total | | | | | | | 4,667,576 | |
| | |
| Internet & Catalog Retail – 0.5% | | | | | | | | |
Amazon.com, Inc. (a) | | | 8,660 | | | | 1,360,140 | |
Rakuten, Inc. | | | 289 | | | | 211,522 | |
| | | | | | | | |
Internet & Catalog Retail Total | | | | | | | 1,571,662 | |
| | |
| Media – 0.3% | | | | | | | | |
Time Warner Cable, Inc. | | | 3,290 | | | | 177,627 | |
Viacom, Inc., Class B | | | 24,030 | | | | 869,646 | |
| | | | | | | | |
Media Total | | | | | | | 1,047,273 | |
| | |
| Multiline Retail – 1.2% | | | | | | | | |
Kohl’s Corp. (a) | | | 13,610 | | | | 716,975 | |
Nordstrom, Inc. | | | 18,600 | | | | 691,920 | |
Target Corp. | | | 53,370 | | | | 2,852,092 | |
| | | | | | | | |
Multiline Retail Total | | | | | | | 4,260,987 | |
| | |
| Specialty Retail – 1.5% | | | | | | | | |
Dick’s Sporting Goods, Inc. (a) | | | 13,350 | | | | 374,334 | |
Esprit Holdings Ltd. | | | 115,900 | | | | 623,977 | |
GameStop Corp., Class A (a) | | | 28,860 | | | | 568,831 | |
Limited Brands, Inc. | | | 46,730 | | | | 1,251,430 | |
Lowe’s Companies, Inc. | | | 17,480 | | | | 389,629 | |
O’Reilly Automotive, Inc. (a) | | | 11,947 | | | | 635,580 | |
| | | | | | | | |
| | | Shares | | | Value ($) | |
TJX Companies, Inc. | | | 26,800 | | | | 1,196,084 | |
| | | | | | | | |
Specialty Retail Total | | | | | | | 5,039,865 | |
| |
| Textiles, Apparel & Luxury Goods – 0.9% | | | | | |
Compagnie Financiére Richemont SA | | | 16,684 | | | | 803,005 | |
lululemon athletica, Inc. (a) | | | 12,120 | | | | 542,006 | |
NIKE, Inc., Class B | | | 8,500 | | | | 681,190 | |
Swatch Group AG | | | 2,120 | | | | 799,058 | |
Warnaco Group, Inc. (a) | | | 4,000 | | | | 204,520 | |
| | | | | | | | |
Textiles, Apparel & Luxury Goods Total | | | | 3,029,779 | |
| | | | | | | | |
Consumer Discretionary Total | | | | | | | 26,356,109 | |
| | | | | | | | |
| Consumer Staples – 5.9% | | | | | | | | |
| Beverages – 1.2% | | | | | | | | |
Coca-Cola Co. | | | 18,700 | | | | 1,094,324 | |
Diageo PLC, ADR | | | 18,026 | | | | 1,243,974 | |
Dr Pepper Snapple Group, Inc. | | | 5,374 | | | | 190,885 | |
Molson Coors Brewing Co., Class B | | | 18,300 | | | | 864,126 | |
PepsiCo, Inc. | | | 13,030 | | | | 865,713 | |
| | | | | | | | |
Beverages Total | | | | | | | 4,259,022 | |
| | |
| Food & Staples Retailing – 0.7% | | | | | | | | |
Wal-Mart Stores, Inc. | | | 39,560 | | | | 2,117,251 | |
Whole Foods Market, Inc. (a) | | | 11,600 | | | | 430,476 | |
| | | | | | | | |
Food & Staples Retailing Total | | | | | | | 2,547,727 | |
| | |
| Food Products – 1.7% | | | | | | | | |
Danone SA | | | 14,148 | | | | 847,270 | |
General Mills, Inc. | | | 20,000 | | | | 730,800 | |
H.J. Heinz Co. | | | 20,400 | | | | 966,348 | |
Hershey Co. | | | 12,440 | | | | 592,020 | |
Kraft Foods, Inc., Class A | | | 28,200 | | | | 870,252 | |
Mead Johnson Nutrition Co., Class A | | | 4,920 | | | | 279,997 | |
Nestle SA, Registered Shares | | | 28,464 | | | | 1,517,023 | |
| | | | | | | | |
Food Products Total | | | | | | | 5,803,710 | |
| | |
| Household Products – 0.3% | | | | | | | | |
Procter & Gamble Co. | | | 15,900 | | | | 953,523 | |
| | | | | | | | |
Household Products Total | | | | | | | 953,523 | |
| | |
| Personal Products – 0.4% | | | | | | | | |
Avon Products, Inc. | | | 29,610 | | | | 950,777 | |
Estée Lauder Companies, Inc., Class A | | | 4,940 | | | | 312,356 | |
| | | | | | | | |
Personal Products Total | | | | | | | 1,263,133 | |
| | |
| Tobacco – 1.6% | | | | | | | | |
British American Tobacco PLC | | | 28,098 | | | | 1,049,785 | |
Japan Tobacco, Inc. | | | 400 | | | | 1,333,901 | |
Philip Morris International, Inc. | | | 53,584 | | | | 3,001,776 | |
| | | | | | | | |
Tobacco Total | | | | | | | 5,385,462 | |
| | | | | | | | |
Consumer Staples Total | | | | | | | 20,212,577 | |
See Accompanying Notes to Financial Statements.
8
Columbia Liberty Fund
September 30, 2010
Common Stocks (continued)
| | | | | | | | |
| | | Shares | | | Value ($) | |
| Energy – 5.9% | | | | | | | | |
| Energy Equipment & Services – 1.4% | | | | | | | | |
Cameron International Corp. (a) | | | 22,100 | | | | 949,416 | |
Dresser-Rand Group, Inc. (a) | | | 8,460 | | | | 312,090 | |
Halliburton Co. | | | 65,934 | | | | 2,180,437 | |
John Wood Group PLC | | | 85,946 | | | | 590,479 | |
Nabors Industries Ltd. (a) | | | 56,770 | | | | 1,025,266 | |
| | | | | | | | |
Energy Equipment & Services Total | | | | | | | 5,057,688 | |
| | |
| Oil, Gas & Consumable Fuels – 4.5% | | | | | | | | |
Alpha Natural Resources, Inc. (a) | | | 2,300 | | | | 94,645 | |
Anadarko Petroleum Corp. | | | 8,000 | | | | 456,400 | |
Apache Corp. | | | 16,940 | | | | 1,656,055 | |
BG Group PLC | | | 55,921 | | | | 983,295 | |
Cairn Energy PLC (a) | | | 100,817 | | | | 718,953 | |
Chevron Corp. | | | 52,900 | | | | 4,287,545 | |
Continental Resources, Inc. (a) | | | 11,350 | | | | 526,186 | |
EOG Resources, Inc. | | | 5,730 | | | | 532,718 | |
Exxon Mobil Corp. | | | 20,580 | | | | 1,271,638 | |
Murphy Oil Corp. | | | 7,800 | | | | 482,976 | |
Occidental Petroleum Corp. | | | 36,639 | | | | 2,868,834 | |
Peabody Energy Corp. | | | 9,620 | | | | 471,476 | |
Petroleo Brasileiro SA, ADR | | | 12,397 | | | | 449,639 | |
Williams Companies, Inc. | | | 31,100 | | | | 594,321 | |
| | | | | | | | |
Oil, Gas & Consumable Fuels Total | | | | | | | 15,394,681 | |
| | | | | | | | |
Energy Total | | | | | | | 20,452,369 | |
| | | | | | | | |
| Financials – 9.8% | | | | | | | | |
| Capital Markets – 1.4% | | | | | | | | |
Affiliated Managers Group, Inc. (a) | | | 1,200 | | | | 93,612 | |
Credit Suisse Group AG, Registered Shares | | | 20,857 | | | | 893,262 | |
Franklin Resources, Inc. | | | 8,920 | | | | 953,548 | |
Goldman Sachs Group, Inc. | | | 10,100 | | | | 1,460,258 | |
Morgan Stanley | | | 32,060 | | | | 791,241 | |
T. Rowe Price Group, Inc. | | | 9,350 | | | | 468,108 | |
| | | | | | | | |
Capital Markets Total | | | | | | | 4,660,029 | |
| | |
| Commercial Banks – 3.0% | | | | | | | | |
Banco Santander Brasil SA, ADR | | | 42,095 | | | | 579,648 | |
BB&T Corp. | | | 10,900 | | | | 262,472 | |
CIT Group, Inc. (a) | | | 16,300 | | | | 665,366 | |
Danske Bank A/S (a) | | | 36,776 | | | | 886,580 | |
Fifth Third Bancorp. | | | 63,470 | | | | 763,544 | |
Huntington Bancshares, Inc. | | | 30,500 | | | | 172,935 | |
Mitsubishi UFJ Financial Group, Inc. | | | 168,700 | | | | 787,393 | |
PNC Financial Services Group, Inc. | | | 21,729 | | | | 1,127,953 | |
Societe Generale | | | 13,796 | | | | 798,721 | |
SVB Financial Group (a) | | | 2,000 | | | | 84,640 | |
| | | | | | | | |
| | | Shares | | | Value ($) | |
U.S. Bancorp | | | 66,113 | | | | 1,429,363 | |
Wells Fargo & Co. | | | 103,696 | | | | 2,605,881 | |
Zions Bancorporation | | | 8,100 | | | | 173,016 | |
| | | | | | | | |
Commercial Banks Total | | | | | | | 10,337,512 | |
| | |
| Consumer Finance – 0.9% | | | | | | | | |
American Express Co. | | | 61,640 | | | | 2,590,729 | |
SKS Microfinance Ltd. (a) | | | 17,939 | | | | 531,364 | |
| | | | | | | | |
Consumer Finance Total | | | | | | | 3,122,093 | |
| | |
| Diversified Financial Services – 1.5% | | | | | | | | |
Citigroup, Inc. (a) | | | 212,300 | | | | 827,970 | |
IntercontinentalExchange, Inc. (a) | | | 10,720 | | | | 1,122,598 | |
JPMorgan Chase & Co. | | | 81,528 | | | | 3,103,771 | |
| | | | | | | | |
Diversified Financial Services Total | | | | | | | 5,054,339 | |
| | |
| Insurance – 2.0% | | | | | | | | |
ACE Ltd. | | | 28,099 | | | | 1,636,767 | |
Assured Guaranty Ltd. | | | 4,400 | | | | 75,284 | |
Axis Capital Holdings Ltd. | | | 22,200 | | | | 731,268 | |
MetLife, Inc. | | | 44,051 | | | | 1,693,761 | |
Prudential Financial, Inc. | | | 28,930 | | | | 1,567,427 | |
Prudential PLC | | | 64,902 | | | | 649,586 | |
XL Group PLC | | | 28,300 | | | | 612,978 | |
| | | | | | | | |
Insurance Total | | | | | | | 6,967,071 | |
|
| Real Estate Investment Trusts (REITs) – 0.5% | |
Equity Residential Property Trust | | | 12,800 | | | | 608,896 | |
ProLogis | | | 18,500 | | | | 217,930 | |
Rayonier, Inc. | | | 13,800 | | | | 691,656 | |
Weyerhaeuser Co. | | | 16,743 | | | | 263,870 | |
| | | | | | | | |
Real Estate Investment Trusts (REITs) Total | | | | 1,782,352 | |
|
| Thrifts & Mortgage Finance – 0.5% | |
Housing Development Finance Corp., Ltd. | | | 101,225 | | | | 1,643,683 | |
| | | | | | | | |
Thrifts & Mortgage Finance Total | | | | | | | 1,643,683 | |
| | | | | | | | |
Financials Total | | | | | | | 33,567,079 | |
| | | | | | | | |
| Health Care – 6.6% | | | | | | | | |
| Biotechnology – 1.0% | | | | | | | | |
Alexion Pharmaceuticals, Inc. (a) | | | 8,460 | | | | 544,485 | |
Amgen, Inc. (a) | | | 23,310 | | | | 1,284,614 | |
Celgene Corp. (a) | | | 19,080 | | | | 1,099,199 | |
Dendreon Corp. (a) | | | 6,800 | | | | 280,024 | |
NeuroSearch AS (a) | | | 11,345 | | | | 171,081 | |
| | | | | | | | |
Biotechnology Total | | | | | | | 3,379,403 | |
|
| Health Care Equipment & Supplies – 0.9% | |
Edwards Lifesciences Corp. (a) | | | 7,550 | | | | 506,228 | |
Mindray Medical International Ltd., ADR | | | 19,750 | | | | 584,007 | |
See Accompanying Notes to Financial Statements.
9
Columbia Liberty Fund
September 30, 2010
Common Stocks (continued)
| | | | | | | | |
| | | Shares | | | Value ($) | |
| Health Care (continued) | | | | | | | | |
St. Jude Medical, Inc. (a) | | | 24,390 | | | | 959,503 | |
Varian Medical Systems, Inc. (a) | | | 10,560 | | | | 638,880 | |
Zimmer Holdings, Inc. (a) | | | 8,500 | | | | 444,805 | |
| | | | | | | | |
Health Care Equipment & Supplies Total | | | | 3,133,423 | |
|
| Health Care Providers & Services – 1.4% | |
Cardinal Health, Inc. | | | 22,210 | | | | 733,819 | |
CIGNA Corp. | | | 3,800 | | | | 135,964 | |
Express Scripts, Inc. (a) | | | 16,440 | | | | 800,628 | |
Humana, Inc. (a) | | | 2,600 | | | | 130,624 | |
Medco Health Solutions, Inc. (a) | | | 18,800 | | | | 978,728 | |
UnitedHealth Group, Inc. | | | 33,430 | | | | 1,173,727 | |
Universal Health Services, Inc., Class B | | | 19,570 | | | | 760,490 | |
| | | | | | | | |
Health Care Providers & Services Total | | | | 4,713,980 | |
|
| Life Sciences Tools & Services – 1.2% | |
Life Technologies Corp. (a) | | | 36,950 | | | | 1,725,196 | |
QIAGEN N.V. (a) | | | 31,637 | | | | 565,963 | |
Thermo Fisher Scientific, Inc. (a) | | | 41,916 | | | | 2,006,938 | |
| | | | | | | | |
Life Sciences Tools & Services Total | | | | | | | 4,298,097 | |
|
| Pharmaceuticals – 2.1% | |
Allergan, Inc. | | | 16,590 | | | | 1,103,733 | |
GlaxoSmithKline PLC, ADR | | | 16,400 | | | | 648,128 | |
Medicis Pharmaceutical Corp., Class A | | | 8,920 | | | | 264,478 | |
Merck & Co., Inc. | | | 22,928 | | | | 843,980 | |
Mylan, Inc. (a) | | | 34,340 | | | | 645,935 | |
Novo-Nordisk A/S, Class B | | | 11,057 | | | | 1,094,411 | |
Pfizer, Inc. | | | 75,300 | | | | 1,292,901 | |
Roche Holding AG, Genusschein Shares | | | 3,906 | | | | 533,326 | |
Watson Pharmaceuticals, Inc. (a) | | | 15,000 | | | | 634,650 | |
| | | | | | | | |
Pharmaceuticals Total | | | | | | | 7,061,542 | |
| | | | | | | | |
Health Care Total | | | | | | | 22,586,445 | |
| | | | | | | | |
| Industrials – 8.4% | | | | | | | | |
| Aerospace & Defense – 1.6% | | | | | | | | |
General Dynamics Corp. | | | 11,400 | | | | 716,034 | |
Goodrich Corp. | | | 11,970 | | | | 882,548 | |
Honeywell International, Inc. | | | 14,100 | | | | 619,554 | |
Precision Castparts Corp. | | | 5,840 | | | | 743,724 | |
United Technologies Corp. | | | 36,526 | | | | 2,601,747 | |
| | | | | | | | |
Total Aerospace & Defense | | | | | | | 5,563,607 | |
|
| Air Freight & Logistics – 0.5% | |
United Parcel Service, Inc., Class B | | | 27,720 | | | | 1,848,647 | |
| | | | | | | | |
Air Freight & Logistics Total | | | | | | | 1,848,647 | |
| | | | | | | | |
| | | Shares | | | Value ($) | |
| Airlines – 0.2% | |
Jet Airways India Ltd. (a) | | | 43,701 | | | | 793,445 | |
| | | | | | | | |
Airlines Total | | | | | | | 793,445 | |
|
| Commercial Services & Supplies – 0.2% | |
Republic Services, Inc. | | | 25,100 | | | | 765,299 | |
| | | | | | | | |
Commercial Services & Supplies Total | | | | 765,299 | |
|
| Construction & Engineering – 0.5% | |
Fluor Corp. | | | 14,900 | | | | 737,997 | |
Foster Wheeler AG (a) | | | 23,800 | | | | 582,148 | |
Outotec Oyj | | | 9,469 | | | | 401,757 | |
| | | | | | | | |
Construction & Engineering Total | | | | | | | 1,721,902 | |
|
| Electrical Equipment – 0.6% | |
ABB Ltd., Registered Shares (a) | | | 37,331 | | | | 787,700 | |
Dongfang Electrical Machinery Co., Ltd., Class H | | | 230 | | | | 1,085 | |
Prysmian SpA | | | 33,570 | | | | 614,475 | |
Vestas Wind Systems A/S (a) | | | 14,880 | | | | 560,125 | |
| | | | | | | | |
Electrical Equipment Total | | | | | | | 1,963,385 | |
|
| Industrial Conglomerates – 1.0% | |
3M Co. | | | 17,990 | | | | 1,559,913 | |
General Electric Co. | | | 90,355 | | | | 1,468,269 | |
Tyco International Ltd. | | | 12,180 | | | | 447,371 | |
| | | | | | | | |
Industrial Conglomerates Total | | | | | | | 3,475,553 | |
|
| Machinery – 2.8% | |
ArvinMeritor, Inc. (a) | | | 14,500 | | | | 225,330 | |
Cummins, Inc. | | | 9,890 | | | | 895,836 | |
Deere & Co. | | | 12,800 | | | | 893,184 | |
Dover Corp. | | | 17,890 | | | | 934,037 | |
Eaton Corp. | | | 2,700 | | | | 222,723 | |
Flowserve Corp. | | | 6,450 | | | | 705,759 | |
GEA Group AG | | | 21,122 | | | | 528,481 | |
Illinois Tool Works, Inc. | | | 19,600 | | | | 921,592 | |
Ingersoll-Rand PLC | | | 45,030 | | | | 1,608,021 | |
Kennametal, Inc. | | | 9,400 | | | | 290,742 | |
Komatsu Ltd. | | | 26,300 | | | | 612,323 | |
Navistar International Corp. (a) | | | 7,567 | | | | 330,224 | |
Parker Hannifin Corp. | | | 10,420 | | | | 730,025 | |
Vallourec | | | 5,789 | | | | 576,058 | |
| | | | | | | | |
Machinery Total | | | | | | | 9,474,335 | |
|
| Professional Services – 0.3% | |
Manpower, Inc. | | | 16,450 | | | | 858,690 | |
| | | | | | | | |
Professional Services Total | | | | | | | 858,690 | |
|
| Trading Companies & Distributors – 0.5% | |
Mitsui & Co., Ltd. | | | 52,400 | | | | 779,654 | |
W.W. Grainger, Inc. | | | 4,080 | | | | 485,969 | |
Wolseley PLC (a) | | | 19,180 | | | | 482,864 | |
| | | | | | | | |
Trading Companies & Distributors Total | | | | 1,748,487 | |
See Accompanying Notes to Financial Statements.
10
Columbia Liberty Fund
September 30, 2010
Common Stocks (continued)
| | | | | | | | |
| | | Shares | | | Value ($) | |
| Industrials (continued) | | | | | | | | |
| Transportation Infrastructure – 0.2% | |
Koninklijke Vopak NV | | | 13,368 | | | | 638,776 | |
| | | | | | | | |
Transportation Infrastructure Total | | | | | | | 638,776 | |
| | | | | | | | |
Industrials Total | | | | | | | 28,852,126 | |
| | | | | | | | |
| Information Technology – 10.5% | | | | | | | | |
| Communications Equipment – 1.0% | |
Cisco Systems, Inc. (a) | | | 84,055 | | | | 1,840,805 | |
QUALCOMM, Inc. | | | 35,260 | | | | 1,590,931 | |
| | | | | | | | |
Communications Equipment Total | | | | | | | 3,431,736 | |
|
| Computers & Peripherals – 2.7% | |
Apple, Inc. (a) | | | 14,990 | | | | 4,253,412 | |
EMC Corp. (a) | | | 112,350 | | | | 2,281,828 | |
Gemalto NV | | | 9,998 | | | | 410,716 | |
Hewlett-Packard Co. | | | 46,551 | | | | 1,958,401 | |
SanDisk Corp. (a) | | | 6,060 | | | | 222,099 | |
| | | | | | | | |
Computers & Peripherals Total | | | | | | | 9,126,456 | |
|
| Electronic Equipment, Instruments & Components – 0.7% | |
Corning, Inc. | | | 34,450 | | | | 629,746 | |
Nippon Electric Glass Co., Ltd. | | | 61,000 | | | | 834,082 | |
Tyco Electronics Ltd. | | | 37,250 | | | | 1,088,445 | |
| | | | | | | | |
Electronic Equipment, Instruments & Components Total | | | | 2,552,273 | |
|
| Internet Software & Services – 1.1% | |
Akamai Technologies, Inc. (a) | | | 12,330 | | | | 618,720 | |
Google, Inc., Class A (a) | | | 5,651 | | | | 2,971,239 | |
| | | | | | | | |
Internet Software & Services Total | | | | | | | 3,589,959 | |
|
| IT Services – 1.5% | |
Cognizant Technology Solutions Corp., Class A (a) | | | 17,430 | | | | 1,123,712 | |
International Business Machines Corp. | | | 21,720 | | | | 2,913,521 | |
Teradata Corp. (a) | | | 17,590 | | | | 678,271 | |
Visa, Inc., Class A | | | 7,190 | | | | 533,929 | |
| | | | | | | | |
IT Services Total | | | | | | | 5,249,433 | |
|
| Semiconductors & Semiconductor Equipment – 0.6% | |
Broadcom Corp., Class A | | | 13,930 | | | | 492,983 | |
Netlogic Microsystems, Inc. (a) | | | 18,980 | | | | 523,468 | |
Texas Instruments, Inc. | | | 30,200 | | | | 819,628 | |
Varian Semiconductor Equipment Associates, Inc. (a) | | | 12,100 | | | | 348,238 | |
| | | | | | | | |
Semiconductors & Semiconductor Equipment Total | | | | 2,184,317 | |
| | | | | | | | |
| | | Shares | | | Value ($) | |
| Software – 2.9% | |
Autodesk, Inc. (a) | | | 29,780 | | | | 952,067 | |
Autonomy Corp. PLC (a) | | | 30,776 | | | | 877,215 | |
Intuit, Inc. (a) | | | 20,060 | | | | 878,829 | |
Microsoft Corp. | | | 52,245 | | | | 1,279,480 | |
Nintendo Co., Ltd., ADR | | | 10,569 | | | | 329,753 | |
Nuance Communications, Inc. (a) | | | 46,700 | | | | 730,388 | |
Oracle Corp. | | | 85,700 | | | | 2,301,045 | |
Rovi Corp. (a) | | | 11,340 | | | | 571,649 | |
Salesforce.com, Inc. (a) | | | 5,550 | | | | 620,490 | |
SuccessFactors, Inc. (a) | | | 22,840 | | | | 573,512 | |
Temenos Group AG (a) | | | 26,475 | | | | 811,658 | |
| | | | | | | | |
Software Total | | | | | | | 9,926,086 | |
| | | | | | | | |
Information Technology Total | | | | 36,060,260 | |
| | | | | | | | |
| Materials – 2.3% | | | | | | | | |
| Chemicals – 0.6% | | | | | | | | |
Celanese Corp., Series A | | | 7,800 | | | | 250,380 | |
CF Industries Holdings, Inc. | | | 2,670 | | | | 254,985 | |
Linde AG | | | 4,590 | | | | 598,735 | |
Potash Corp. of Saskatchewan, Inc. | | | 6,800 | | | | 979,472 | |
| | | | | | | | |
Chemicals Total | | | | | | | 2,083,572 | |
|
| Containers & Packaging – 0.2% | |
Packaging Corp. of America | | | 25,573 | | | | 592,526 | |
| | | | | | | | |
Containers & Packaging Total | | | | | | | 592,526 | |
|
| Metals & Mining – 1.4% | |
Allegheny Technologies, Inc. | | | 26,140 | | | | 1,214,203 | |
Freeport-McMoRan Copper & Gold, Inc. | | | 8,982 | | | | 766,973 | |
Newmont Mining Corp. | | | 12,310 | | | | 773,191 | |
Rio Tinto Ltd. | | | 11,159 | | | | 828,064 | |
United States Steel Corp. | | | 10,400 | | | | 455,936 | |
Xstrata PLC | | | 45,533 | | | | 874,365 | |
| | | | | | | | |
Metals & Mining Total | | | | | | | 4,912,732 | |
|
| Paper & Forest Products – 0.1% | |
International Paper Co. | | | 22,700 | | | | 493,725 | |
| | | | | | | | |
Paper & Forest Products Total | | | | | | | 493,725 | |
| | | | | | | | |
Materials Total | | | | | | | 8,082,555 | |
| | | | | | | | |
| Telecommunication Services – 1.3% | |
| Diversified Telecommunication Services – 0.6% | |
AT&T, Inc. | | | 67,415 | | | | 1,928,069 | |
| | | | | | | | |
Diversified Telecommunication Services Total | | | | 1,928,069 | |
See Accompanying Notes to Financial Statements.
11
Columbia Liberty Fund
September 30, 2010
Common Stocks (continued)
| | | | | | | | |
| | | Shares | | | Value ($) | |
| Telecommunication Services (continued) | |
| Wireless Telecommunication Services – 0.7% | |
American Tower Corp., Class A (a) | | | 13,460 | | | | 689,960 | |
Millicom International Cellular SA | | | 4,979 | | | | 477,735 | |
NII Holdings, Inc. (a) | | | 15,672 | | | | 644,119 | |
Vodafone Group PLC | | | 309,796 | | | | 766,889 | |
| | | | | | | | |
Wireless Telecommunication Services Total | | | | 2,578,703 | |
| | | | | | | | |
Telecommunication Services Total | | | | 4,506,772 | |
| | | | | | | | |
| Utilities – 1.9% | | | | | | | | |
| Electric Utilities – 0.9% | | | | | | | | |
American Electric Power Co., Inc. | | | 31,700 | | | | 1,148,491 | |
NextEra Energy, Inc. | | | 28,300 | | | | 1,539,237 | |
Northeast Utilities | | | 14,021 | | | | 414,601 | |
| | | | | | | | |
Electric Utilities Total | | | | | | | 3,102,329 | |
| | |
| Multi-Utilities – 1.0% | | | | | | | | |
PG&E Corp. | | | 25,448 | | | | 1,155,848 | |
Sempra Energy | | | 17,800 | | | | 957,640 | |
Wisconsin Energy Corp. | | | 7,875 | | | | 455,175 | |
Xcel Energy, Inc. | | | 39,700 | | | | 911,909 | |
| | | | | | | | |
Multi-Utilities Total | | | | | | | 3,480,572 | |
| | | | | | | | |
Utilities Total | | | | | | | 6,582,901 | |
| | | | | | | | |
Total Common Stocks
(cost of $176,721,142) | | | | 207,259,193 | |
| | | | | | | | |
|
Mortgage-Backed Securities – 9.9% | |
| | | Par ($) | | | | |
| Federal Home Loan Mortgage Corp. | | | | | |
4.500% 02/01/39 | | | 339,873 | | | | 354,055 | |
4.500% 04/01/39 | | | 653,122 | | | | 679,968 | |
4.500% 10/01/39 | | | 832,985 | | | | 867,224 | |
4.500% 01/01/40 | | | 1,495,958 | | | | 1,557,448 | |
4.500% 06/01/40 | | | 4,432,264 | | | | 4,614,450 | |
4.500% 07/01/40 | | | 646,068 | | | | 672,624 | |
4.500% 09/01/40 | | | 1,375,000 | | | | 1,431,519 | |
5.000% 06/01/36 | | | 793,914 | | | | 836,014 | |
5.000% 04/01/38 | | | 1,199,999 | | | | 1,261,503 | |
5.000% 11/01/38 | | | 1,582,136 | | | | 1,663,226 | |
5.000% 08/01/39 | | | 1,157,924 | | | | 1,217,156 | |
5.000% 08/01/40 | | | 1,471,261 | | | | 1,546,521 | |
5.000% 09/01/40 | | | 924,908 | | | | 972,220 | |
5.500% 07/01/21 | | | 10,796 | | | | 11,624 | |
5.500% 12/01/38 | | | 1,200,000 | | | | 1,273,711 | |
6.000% 01/01/38 | | | 1,200,000 | | | | 1,288,778 | |
6.500% 07/01/14 | | | 18,477 | | | | 19,997 | |
| | | | | | | | |
| | | Par ($) | | | Value ($) | |
6.500% 12/01/14 | | | 15,727 | | | | 17,021 | |
6.500% 06/01/29 | | | 20,914 | | | | 23,222 | |
6.500% 01/01/30 | | | 60,124 | | | | 66,758 | |
7.000% 11/01/29 | | | 40,797 | | | | 46,237 | |
7.000% 01/01/30 | | | 2,634 | | | | 2,985 | |
8.000% 07/01/20 | | | 14,663 | | | | 15,915 | |
| | |
| TBA: | | | | | | | | |
4.500% 10/01/40 (b) | | | 1,425,000 | | | | 1,481,778 | |
5.000% 10/01/40 (b) | | | 1,175,000 | | | | 1,234,117 | |
| |
| Federal National Mortgage Association | | | | | |
4.500% 05/01/40 | | | 139,015 | | | | 144,925 | |
5.000% 04/01/40 | | | 1,656,242 | | | | 1,744,587 | |
5.000% 05/01/40 | | | 2,170,696 | | | | 2,286,482 | |
5.500% 03/01/37 | | | 1,839,996 | | | | 1,961,429 | |
5.500% 06/01/37 | | | 1,340,660 | | | | 1,426,340 | |
5.500% 09/01/37 | | | 1,440,722 | | | | 1,532,798 | |
5.500% 04/01/39 | | | 338,727 | | | | 360,375 | |
6.500% 04/01/11 | | | 15,838 | | | | 17,139 | |
6.500% 05/01/11 | | | 56,728 | | | | 61,389 | |
6.500% 11/01/25 | | | 2 | | | | 2 | |
6.500% 08/01/34 | | | 256,390 | | | | 284,320 | |
7.000% 08/15/23 | | | 107,846 | | | | 122,315 | |
7.000% 07/01/32 | | | 11,930 | | | | 13,541 | |
7.000% 01/01/37 | | | 37,198 | | | | 41,475 | |
7.000% 07/01/37 | | | 210,861 | | | | 235,102 | |
| |
| Government National Mortgage Association | | | | | |
6.000% 12/15/37 | | | 507,942 | | | | 552,151 | |
| | | | | | | | |
Total Mortgage-Backed Securities
(cost of $33,368,007) | | | | 33,940,441 | |
|
Corporate Fixed-Income Bonds & Notes – 9.9% | |
| | | | | | | | |
| Basic Materials – 0.2% | | | | | | | | |
| Iron/Steel – 0.1% | | | | | | | | |
| ArcelorMittal USA, Inc. | | | | | | | | |
6.500% 04/15/14 | | | 350,000 | | | | 387,896 | |
| | | | | | | | |
Iron/Steel Total | | | | | | | 387,896 | |
| | |
| Metals & Mining – 0.1% | | | | | | | | |
| Vale Overseas Ltd. | | | | | | | | |
6.250% 01/23/17 | | | 325,000 | | | | 372,016 | |
| | | | | | | | |
Metals & Mining Total | | | | | | | 372,016 | |
| | | | | | | | |
Basic Materials Total | | | | | | | 759,912 | |
| | | | | | | | |
| Communications – 1.5% | | | | | | | | |
| Media – 0.6% | | | | | | | | |
| DIRECTV Holdings LLC | | | | | | | | |
3.550% 03/15/15 | | | 330,000 | | | | 342,554 | |
| NBC Universal, Inc. | | | | | | | | |
5.950% 04/01/41 (c) | | | 375,000 | | | | 385,729 | |
See Accompanying Notes to Financial Statements.
12
Columbia Liberty Fund
September 30, 2010
Corporate Fixed-Income Bonds & Notes (continued)
| | | | | | | | |
| | | Par ($) | | | Value ($) | |
| Communications (continued) | | | | | | | | |
| News America, Inc. | | | | | | | | |
6.550% 03/15/33 | | | 295,000 | | | | 329,263 | |
| | |
| RR Donnelley & Sons Co. | | | | | | | | |
6.125% 01/15/17 | | | 550,000 | | | | 575,841 | |
| | |
| Time Warner, Inc. | | | | | | | | |
6.200% 03/15/40 | | | 350,000 | | | | 381,289 | |
| | | | | | | | |
Media Total | | | | | | | 2,014,676 | |
| | |
| Telecommunication Services – 0.9% | | | | | | | | |
| America Movil SAB de CV | | | | | | | | |
5.625% 11/15/17 | | | 325,000 | | | | 366,670 | |
| | |
| AT&T, Inc. | | | | | | | | |
5.350% 09/01/40 (c) | | | 388,000 | | | | 389,828 | |
| | |
| British Telecommunications PLC | | | | | | | | |
5.150% 01/15/13 | | | 400,000 | | | | 427,464 | |
|
| Cellco Partnership/Verizon Wireless Capital LLC | |
5.550% 02/01/14 | | | 625,000 | | | | 706,784 | |
| | |
| Telecom Italia Capital SA | | | | | | | | |
4.950% 09/30/14 | | | 375,000 | | | | 399,274 | |
| | |
| Telefonica Emisiones SAU | | | | | | | | |
0.775% 02/04/13 (11/04/10) (d)(e) | | | 400,000 | | | | 391,559 | |
| | |
| Vodafone Group PLC | | | | | | | | |
5.750% 03/15/16 | | | 370,000 | | | | 423,611 | |
| | | | | | | | |
Telecommunication Services Total | | | | | | | 3,105,190 | |
| | | | | | | | |
Communications Total | | | | | | | 5,119,866 | |
| | | | | | | | |
| Consumer Cyclical – 0.2% | | | | | | | | |
| Retail – 0.2% | | | | | | | | |
| CVS Pass-Through Trust | | | | | | | | |
7.507% 01/10/32 (c) | | | 440,152 | | | | 516,457 | |
| | | | | | | | |
Retail Total | | | | | | | 516,457 | |
| | | | | | | | |
Consumer Cyclical Total | | | | | | | 516,457 | |
| | | | | | | | |
| Consumer Non-Cyclical – 1.0% | | | | | | | | |
| Beverages – 0.3% | | | | | | | | |
| Anheuser-Busch InBev Worldwide, Inc. | | | | | |
2.500% 03/26/13 | | | 350,000 | | | | 359,091 | |
| | |
| Bottling Group LLC | | | | | | | | |
6.950% 03/15/14 | | | 300,000 | | | | 355,661 | |
| | |
| Miller Brewing Co. | | | | | | | | |
5.500% 08/15/13 (c)(f) | | | 316,000 | | | | 347,503 | |
| | | | | | | | |
Beverages Total | | | | | | | 1,062,255 | |
| | | | | | | | |
| | | Par ($) | | | Value ($) | |
Food – 0.4% | | | | | | | | |
ConAgra Foods, Inc. | | | | | | | | |
5.875% 04/15/14 | | | 325,000 | | | | 371,056 | |
| | |
| Kraft Foods, Inc. | | | | | | | | |
5.375% 02/10/20 | | | 390,000 | | | | 435,649 | |
| | |
| Kroger Co. | | | | | | | | |
5.400% 07/15/40 | | | 375,000 | | | | 389,750 | |
| | | | | | | | |
Food Total | | | | | | | 1,196,455 | |
| | |
| Healthcare Services – 0.1% | | | | | | | | |
| Roche Holdings, Inc. | | | | | | | | |
6.000% 03/01/19 (c)(f) | | | 325,000 | | | | 393,726 | |
| | | | | | | | |
Healthcare Services Total | | | | | | | 393,726 | |
| | |
| Pharmaceuticals – 0.2% | | | | | | | | |
| Express Scripts, Inc. | | | | | | | | |
6.250% 06/15/14 | | | 250,000 | | | | 287,025 | |
| | |
| Wyeth | | | | | | | | |
5.500% 02/01/14 | | | 325,000 | | | | 368,826 | |
| | | | | | | | |
Pharmaceuticals Total | | | | | | | 655,851 | |
| | | | | | | | |
Consumer Non-Cyclical Total | | | | | | | 3,308,287 | |
| | | | | | | | |
| Energy – 1.1% | | | | | | | | |
| Oil & Gas – 0.6% | | | | | | | | |
| Anadarko Petroleum Corp. | | | | | | | | |
6.200% 03/15/40 | | | 500,000 | | | | 487,442 | |
| | |
| Canadian Natural Resources Ltd. | | | | | | | | |
5.700% 05/15/17 | | | 300,000 | | | | 345,189 | |
| | |
| Nexen, Inc. | | | | | | | | |
5.875% 03/10/35 | | | 350,000 | | | | 357,169 | |
| | |
| Petroleos Mexicanos | | | | | | | | |
5.500% 01/21/21 (c) | | | 410,000 | | | | 436,650 | |
| | |
| Talisman Energy, Inc. | | | | | | | | |
6.250% 02/01/38 | | | 315,000 | | | | 346,363 | |
| | | | | | | | |
Oil & Gas Total | | | | | | | 1,972,813 | |
| | |
| Oil & Gas Services – 0.2% | | | | | | | | |
| Weatherford International Ltd. | | | | | | | | |
5.150% 03/15/13 | | | 340,000 | | | | 364,043 | |
6.750% 09/15/40 | | | 385,000 | | | | 401,276 | |
| | | | | | | | |
Oil & Gas Services Total | | | | | | | 765,319 | |
| | |
| Pipelines – 0.3% | | | | | | | | |
| Enterprise Products Operating LLC | | | | | | | | |
4.600% 08/01/12 | | | 350,000 | | | | 368,600 | |
| | |
| TransCanada Pipelines Ltd. | | | | | | | | |
6.350% 05/15/67 (05/15/17) (d)(e) | | | 450,000 | | | | 420,750 | |
See Accompanying Notes to Financial Statements.
13
Columbia Liberty Fund
September 30, 2010
Corporate Fixed-Income Bonds & Notes (continued)
| | | | | | | | |
| | | Par ($) | | | Value ($) | |
| Energy (continued) | | | | | | | | |
| Williams Partners LP | | | | | | | | |
7.250% 02/01/17 | | | 310,000 | | | | 369,257 | |
| | | | | | | | |
Pipelines Total | | | | | | | 1,158,607 | |
| | | | | | | | |
Energy Total | | | | | | | 3,896,739 | |
| | | | | | | | |
| Financials – 4.1% | | | | | | | | |
| Banks – 2.5% | | | | | | | | |
| ANZ National International Ltd. | | | | | | | | |
6.200% 07/19/13 (c)(f) | | | 450,000 | | | | 500,121 | |
| | |
| Barclays Bank PLC | | | | | | | | |
6.750% 05/22/19 | | | 500,000 | | | | 594,183 | |
| | |
| Bear Stearns Companies, Inc. | | | | | | | | |
7.250% 02/01/18 | | | 750,000 | | | | 913,601 | |
| | |
| Capital One Financial Corp. | | | | | | | | |
5.500% 06/01/15 | | | 450,000 | | | | 495,027 | |
| | |
| Citicorp Lease Pass-Through Trust | | | | | | | | |
8.040% 12/15/19 (c)(f) | | | 1,360,000 | | | | 1,597,168 | |
| | |
| Commonwealth Bank of Australia | | | | | | | | |
3.750% 10/15/14 (c) | | | 350,000 | | | | 374,050 | |
| | |
| Credit Suisse/New York NY | | | | | | | | |
6.000% 02/15/18 | | | 550,000 | | | | 607,401 | |
| | |
| Goldman Sachs Group, Inc. | | | | | | | | |
5.350% 01/15/16 | | | 400,000 | | | | 439,766 | |
| | |
| Keycorp | | | | | | | | |
6.500% 05/14/13 | | | 420,000 | | | | 460,295 | |
| | |
| Merrill Lynch & Co., Inc. | | | | | | | | |
6.875% 04/25/18 | | | 750,000 | | | | 841,272 | |
| | |
| Morgan Stanley | | | | | | | | |
6.750% 04/15/11 | | | 310,000 | | | | 319,294 | |
| | |
| Royal Bank of Scotland PLC | | | | | | | | |
3.950% 09/21/15 | | | 500,000 | | | | 505,228 | |
| | |
| Santander U.S. Debt SA Unipersonal | | | | | | | | |
2.991% 10/07/13 (b)(c) | | | 400,000 | | | | 399,280 | |
| | |
| Wachovia Corp. | | | | | | | | |
4.875% 02/15/14 | | | 650,000 | | | | 694,565 | |
| | | | | | | | |
Banks Total | | | | | | | 8,741,251 | |
| | |
| Diversified Financial Services – 0.4% | | | | | | | | |
| ERAC USA Finance LLC | | | | | | | | |
6.375% 10/15/17 (c) | | | 340,000 | | | | 395,265 | |
| | |
| General Electric Capital Corp. | | | | | | | | |
5.000% 01/08/16 | | | 605,000 | | | | 664,689 | |
| | |
| Lehman Brothers Holdings, Inc. | | | | | | | | |
5.750% 07/18/11 (g) | | | 750,000 | | | | 165,937 | |
| | | | | | | | |
Diversified Financial Services Total | | | | | | | 1,225,891 | |
| | | | | | | | |
| | | Par ($) | | | Value ($) | |
Insurance – 0.9% | | | | | | | | |
| Chubb Corp. | | | | | | | | |
5.750% 05/15/18 | | | 375,000 | | | | 433,979 | |
| CNA Financial Corp. | | | | | | | | |
7.350% 11/15/19 | | | 350,000 | | | | 393,516 | |
| | |
| Lincoln National Corp. | | | | | | | | |
8.750% 07/01/19 | | | 285,000 | | | | 366,613 | |
| | |
| MetLife, Inc. | | | | | | | | |
6.817% 08/15/18 | | | 315,000 | | | | 380,036 | |
| | |
| Principal Life Income Funding Trusts | | | | | | | | |
5.300% 04/24/13 | | | 300,000 | | | | 324,614 | |
| | |
| Prudential Financial, Inc. | | | | | | | | |
6.100% 06/15/17 | | | 310,000 | | | | 347,308 | |
| | |
| Transatlantic Holdings, Inc. | | | | | | | | |
8.000% 11/30/39 | | | 350,000 | | | | 364,667 | |
| | |
| UnitedHealth Group, Inc. | | | | | | | | |
5.250% 03/15/11 | | | 376,000 | | | | 383,146 | |
| | | | | | | | |
Insurance Total | | | | | | | 2,993,879 | |
|
| Real Estate Investment Trusts (REITs) – 0.3% | |
| Duke Realty LP | | | | | | | | |
8.250% 08/15/19 | | | 325,000 | | | | 384,894 | |
| | |
| Kimco Realty Corp. | | | | | | | | |
4.300% 02/01/18 | | | 325,000 | | | | 329,328 | |
| | |
| Simon Property Group LP | | | | | | | | |
6.750% 02/01/40 | | | 300,000 | | | | 353,767 | |
| | | | | | | | |
Real Estate Investment Trusts (REITs) Total | | | | | | | 1,067,989 | |
| | | | | | | | |
Financials Total | | | | | | | 14,029,010 | |
| | | | | | | | |
| Industrials – 0.5% | | | | | | | | |
| Aerospace & Defense – 0.1% | | | | | | | | |
| United Technologies Corp. | | | | | | | | |
5.375% 12/15/17 | | | 350,000 | | | | 411,134 | |
| | | | | | | | |
Aerospace & Defense Total | | | | | | | 411,134 | |
| |
| Miscellaneous Manufacturing – 0.2% | | | | | |
| Ingersoll-Rand Global Holding Co., Ltd. | | | | | |
9.500% 04/15/14 | | | 300,000 | | | | 371,201 | |
| | |
| Tyco International Ltd./Tyco International Finance SA | | | | | | | | |
7.000% 12/15/19 | | | 290,000 | | | | 360,991 | |
| | | | | | | | |
Miscellaneous Manufacturing Total | | | | | | | 732,192 | |
| | |
| Transportation – 0.2% | | | | | | | | |
| Burlington Northern Santa Fe Corp. | | | | | | | | |
6.200% 08/15/36 | | | 290,000 | | | | 334,601 | |
See Accompanying Notes to Financial Statements.
14
Columbia Liberty Fund
September 30, 2010
Corporate Fixed-Income Bonds & Notes (continued)
| | | | | | | | |
| | | Par ($) | | | Value ($) | |
| Industrials (continued) | | | | | | | | |
| Canadian Pacific Railway Co. | | | | | | | | |
4.450% 03/15/23 | | | 370,000 | | | | 377,553 | |
| | | | | | | | |
Transportation Total | | | | | | | 712,154 | |
| | | | | | | | |
Industrials Total | | | | | | | 1,855,480 | |
| | | | | | | | |
| Technology – 0.2% | | | | | | | | |
| Networking Products – 0.1% | | | | | | | | |
| Cisco Systems, Inc. | | | | | | | | |
4.950% 02/15/19 | | | 325,000 | | | | 371,805 | |
| | | | | | | | |
Networking Products Total | | | | | | | 371,805 | |
| | |
| Software – 0.1% | | | | | | | | |
| Oracle Corp. | | | | | | | | |
6.500% 04/15/38 | | | 325,000 | | | | 403,695 | |
| | | | | | | | |
Software Total | | | | | | | 403,695 | |
| | | | | | | | |
Technology Total | | | | | | | 775,500 | |
| | | | | | | | |
| Utilities – 1.1% | | | | | | | | |
| Electric – 0.9% | | | | | | | | |
| Commonwealth Edison Co. | | | | | | | | |
6.150% 09/15/17 | | | 350,000 | | | | 414,620 | |
| | |
| Consolidated Edison Co. of New York | | | | | | | | |
5.850% 03/15/36 | | | 345,000 | | | | 393,016 | |
| | |
| Dominion Resources, Inc. | | | | | | | | |
5.200% 08/15/19 | | | 360,000 | | | | 411,662 | |
| | |
| Indiana Michigan Power Co. | | | | | | | | |
5.650% 12/01/15 | | | 323,000 | | | | 364,297 | |
| | |
| Nevada Power Co. | | | | | | | | |
6.500% 08/01/18 | | | 175,000 | | | | 211,749 | |
| | |
| Nisource Finance Corp. | | | | | | | | |
6.400% 03/15/18 | | | 365,000 | | | | 423,308 | |
| | |
| Pacific Gas & Electric Co. | | | | | | | | |
5.800% 03/01/37 | | | 360,000 | | | | 399,795 | |
| | |
| Progress Energy, Inc. | | | | | | | | |
7.750% 03/01/31 | | | 325,000 | | | | 429,034 | |
| | | | | | | | |
Electric Total | | | | | | | 3,047,481 | |
| | |
| Gas – 0.2% | | | | | | | | |
| Atmos Energy Corp. | | | | | | | | |
6.350% 06/15/17 | | | 325,000 | | | | 372,174 | |
| | | | | | | | |
| | | Par ($) | | | Value ($) | |
| Sempra Energy | | | | | | | | |
6.500% 06/01/16 | | | 300,000 | | | | 358,938 | |
| | | | | | | | |
Gas Total | | | | | | | 731,112 | |
| | | | | | | | |
Utilities Total | | | | | | | 3,778,593 | |
| | | | | | | | |
Total Corporate Fixed-Income Bonds & Notes (cost of $31,649,340) | | | | 34,039,844 | |
|
Government & Agency Obligations – 7.6% | |
| | | | | |
| | | | | | | | |
| Foreign Government Obligations – 0.5% | | | | | |
| Province of Ontario | | | | | | | | |
5.450% 04/27/16 | | | 700,000 | | | | 826,212 | |
| | |
| Province of Quebec | | | | | | | | |
4.625% 05/14/18 | | | 760,000 | | | | 865,712 | |
| | | | | | | | |
Foreign Government Obligations Total | | | | 1,691,924 | |
| | | | | | | | |
| U.S. Government Agencies – 1.2% | | | | | | | | |
| Federal Home Loan Bank | | | | | | | | |
5.500% 08/13/14 | | | 2,055,000 | | | | 2,394,864 | |
| |
| Federal Home Loan Mortgage Corp. | | | | | |
3.125% 10/25/10 | | | 95,000 | | | | 95,185 | |
5.500% 08/23/17 | | | 1,285,000 | | | | 1,552,497 | |
| | | | | | | | |
U.S. Government Agencies Total | | | | | | | 4,042,546 | |
| | | | | | | | |
| U.S. Government Obligations – 5.9% | | | | | |
| U.S. Treasury Bonds | | | | | | | | |
5.375% 02/15/31 | | | 6,496,000 | | | | 8,363,600 | |
| |
| U.S. Treasury Inflation Indexed Notes | | | | | |
3.000% 07/15/12 | | | 2,788,773 | | | | 2,961,328 | |
| | |
| U.S. Treasury Notes | | | | | | | | |
1.375% 10/15/12 | | | 5,170,000 | | | | 5,266,938 | |
2.375% 10/31/14 | | | 3,700,000 | | | | 3,905,235 | |
| | | | | | | | |
U.S. Government Obligations Total | | | | 20,497,101 | |
| | | | | | | | |
Total Government & Agency Obligations (cost of $24,034,611) | | | | 26,231,571 | |
| | | | | | | | |
| Commercial Mortgage-Backed Securities – 5.4% | |
| Bear Stearns Commercial Mortgage Securities, Inc. | | | | | |
4.804% 09/11/42 | | | 1,456,542 | | | | 1,530,258 | |
4.980% 02/11/41 | | | 462,525 | | | | 489,788 | |
5.882% 09/11/38 (10/01/10) (d)(e) | | | 1,500,000 | | | | 1,655,453 | |
| |
| Credit Suisse First Boston Mortgage Securities Corp. | | | | | |
4.681% 04/15/37 | | | 433,096 | | | | 451,545 | |
See Accompanying Notes to Financial Statements.
15
Columbia Liberty Fund
September 30, 2010
Commercial Mortgage-Backed Securities (continued)
| | | | | | | | |
| | | Par ($) | | | Value ($) | |
| GE Capital Commercial Mortgage Corp. | | | | | |
4.819% 01/10/38 | | | 1,375,000 | | | | 1,464,397 | |
| |
| JPMorgan Chase Commercial Mortgage Securities Corp. | | | | | |
4.659% 07/15/42 | | | 433,935 | | | | 457,054 | |
5.201% 08/12/37 (10/01/10) (d)(e) | | | 638,240 | | | | 674,638 | |
5.440% 06/12/47 | | | 2,040,000 | | | | 2,138,305 | |
5.447% 06/12/47 | | | 1,023,000 | | | | 1,096,032 | |
5.506% 12/12/44 (10/01/10) (d)(e) | | | 1,157,372 | | | | 1,243,957 | |
| |
| LB-UBS Commercial Mortgage Trust | | | | | |
6.510% 12/15/26 | | | 664,951 | | | | 665,878 | |
| |
| Morgan Stanley Capital I | | | | | |
4.500% 06/15/40 | | | 384,550 | | | | 387,467 | |
5.325% 12/15/43 | | | 1,500,000 | | | | 1,645,012 | |
5.558% 03/12/44 (10/01/10) (d)(e) | | | 2,800,000 | | | | 3,060,002 | |
| |
| Morgan Stanley Dean Witter Capital I | | | | | |
4.390% 09/15/37 | | | 549,845 | | | | 556,687 | |
| | |
| NationsLink Funding Corp. | | | | | | | | |
7.104% 01/22/26 | | | 760,641 | | | | 836,212 | |
| | | | | | | | |
Total Commercial Mortgage-Backed Securities (cost of $16,801,977) | | | | 18,352,685 | |
| | | | | |
| Collateralized Mortgage Obligations – 1.5% | |
| Agency – 1.3% | | | | | | | | |
| Federal Home Loan Mortgage Corp. | | | | | |
4.500% 08/15/28 | | | 373,338 | | | | 386,809 | |
5.500% 09/15/33 | | | 1,600,000 | | | | 1,735,384 | |
| |
| Federal National Mortgage Association | | | | | |
5.000% 12/25/15 | | | 95,318 | | | | 95,307 | |
| |
| Federal National Mortgage Association REMICS | | | | | |
4.350% 10/25/20 | | | 432,941 | | | | 443,529 | |
5.000% 12/25/16 | | | 525,000 | | | | 539,140 | |
5.000% 05/25/32 | | | 873,695 | | | | 919,495 | |
| |
| Government National Mortgage Association | | | | | |
4.000% 05/16/39 | | | 431,896 | | | | 442,861 | |
| | | | | | | | |
Agency Total | | | | | | | 4,562,525 | |
| | |
| Non-Agency – 0.2% | | | | | | | | |
| Countrywide Alternative Loan Trust | | | | | |
5.500% 10/25/35 | | | 759,807 | | | | 655,205 | |
| | | | | | | | |
Non-agency Total | | | | | | | 655,205 | |
| | | | | | | | |
Total Collateralized Mortgage Obligations (cost of $5,276,401) | | | | 5,217,730 | |
| | | | | | | | |
| | | Par ($) | | | Value ($) | |
| Asset-Backed Securities – 0.8% | | | | | | | | |
| Franklin Auto Trust | | | | | | | | |
5.360% 05/20/16 | | | 1,890,000 | | | | 1,936,349 | |
| |
| Green Tree Financial Corp. | | | | | |
6.870% 01/15/29 | | | 229,809 | | | | 240,935 | |
| |
| Harley-Davidson Motorcycle Trust | | | | | |
5.350% 03/15/13 | | | 643,048 | | | | 653,317 | |
| | | | | | | | |
Total Asset-Backed Securities
(cost of $2,759,421) | | | | 2,830,601 | |
|
Convertible Preferred Stocks – 0.4% | |
| | | Shares | | | | |
| Consumer Discretionary – 0.2% | | | | | | | | |
| Automobiles – 0.2% | | | | | | | | |
Ford Motor Co. Capital Trust II, 6.500% | | | 14,300 | | | | 685,113 | |
| | | | | | | | |
Automobiles Total | | | | | | | 685,113 | |
| | | | | | | | |
Consumer Discretionary Total | | | | | | | 685,113 | |
| | | | | | | | |
| Financials – 0.2% | | | | | | | | |
| Commercial Banks – 0.1% | | | | | | | | |
Fifth Third Bancorp., 8.500% | | | 1,700 | | | | 217,813 | |
| | | | | | | | |
Commercial Banks Total | | | | | | | 217,813 | |
|
| Diversified Financial Services – 0.1% | |
Citigroup, Inc., 7.500% | | | 4,597 | | | | 544,790 | |
| | | | | | | | |
Diversified Financial Services Total | | | | 544,790 | |
| | | | | | | | |
Financials Total | | | | | | | 762,603 | |
| | | | | | | | |
Total Convertible Preferred Stocks
(cost of $1,393,270) | | | | 1,447,716 | |
| | |
Convertible Bonds – 0.2% | | | | | | | | |
| | | Par ($) | | | | |
| Industrials – 0.1% | | | | | | | | |
| Machinery – 0.1% | | | | | | | | |
| Navistar International Corp. | | | | | | | | |
3.000% 10/15/14 | | | 180,000 | | | | 202,275 | |
| | | | | | | | |
Machinery Total | | | | | | | 202,275 | |
| | | | | | | | |
Industrials Total | | | | | | | 202,275 | |
See Accompanying Notes to Financial Statements.
16
Columbia Liberty Fund
September 30, 2010
Convertible Bonds – 0.2%
| | | | | | | | |
| | | Par ($) | | | Value ($) | |
| Information Technology – 0.1% | | | | | | | | |
| Computers & Peripherals – 0.1% | | | | | |
| EMC Corp. | | | | | | | | |
1.750% 12/01/13 | | | 330,000 | | | | 454,162 | |
| | | | | | | | |
Computers & Peripherals Total | | | | 454,162 | |
| | | | | | | | |
Information Technology Total | | | | | | | 454,162 | |
| | | | | | | | |
Total Convertible Bonds
(cost of $630,872) | | | | 656,437 | |
| |
Preferred Stock – 0.2% | | | | | |
| | | Shares ($) | | | | |
| Energy – 0.2% | | | | | | | | |
| Oil, Gas & Consumable Fuels – 0.2% | | | | | |
Apache Corp., 6.000% | | | 9,187 | | | | 532,846 | |
| | | | | | | | |
Oil, Gas & Consumable Fuels Total | | | | 532,846 | |
| | | | | | | | |
Energy Total | | | | | | | 532,846 | |
| | | | | | | | |
Total Preferred Stock
(cost of $479,631) | | | | 532,846 | |
| |
Short-Term Obligation – 4.3% | | | | | |
| | | Par ($) | | | | |
Repurchase agreement with Fixed Income Clearing Corp., dated 09/30/10, due on 10/01/10, at 0.230%, collateralized by U.S. Government Agency obligations with various maturities to 04/15/14, market value $15,219,271 (repurchase proceeds $14,915,095) | | | 14,915,000 | | | | 14,915,000 | |
| | | | | | | | |
Total Short-Term Obligation
(cost of $14,915,000) | | | | 14,915,000 | |
| | | | | | | | |
Total Investments – 100.5%
(cost of $308,029,672)(h) | | | | 345,424,064 | |
| | | | | | | | |
Other Assets & Liabilities, Net – (0.5)% | | | | (1,666,923 | ) |
| | | | | | | | |
Net Assets – 100.0% | | | | 343,757,141 | |
Notes to Investment Portfolio:
| (a) | Non-income producing security. |
| (b) | Security purchased on a delayed delivery basis. |
| (c) | Security exempt from registration pursuant to Rule 144A under the Securities Act of 1933. These securities may be resold in transactions exempt from registration, normally to qualified institutional buyers. At September 30, 2010, the value of these securities, which are not illiquid, amounted to $5,735,777, which represents 1.7% of net assets. |
| (d) | Parenthetical date represents the next interest rate reset date for the security. |
| (e) | The interest rate shown on floating rate or variable rate securities reflects the rate at September 30, 2010. |
| (f) | Denotes a restricted security, which is subject to restrictions on resale under federal securities laws or in transactions exempt from registration. At September 30, 2010, the value of these securities amounted $2,838,518, which represent 0.8% of net assets. |
| | | | | | | | | | | | | | | | |
Security | | Acquisition
Date | | | Par | | | Acquisition
Cost | | | Market Value | |
ANZ National
International
Ltd.
6.200%
07/19/13 | |
| 04/27/2009-
05/19/2009 |
| | $ | 450,000 | | | $ | 451,868 | | | $ | 500,121 | |
Citicorp Lease Pass-Through Trust, 8.040% 12/15/19 | |
| 01/06/2000-
04/12/2001 |
| | | 1,360,000 | | | | 1,371,414 | | | | 1,597,168 | |
Miller Brewing Co.,
5.500% 08/15/13 | | | 06/09/2009 | | | | 316,000 | | | | 450,971 | | | | 347,503 | |
Roche Holdings, Inc.,
6.000% 03/01/19 | | | 07/30/2009 | | | | 325,000 | | | | 353,451 | | | | 393,726 | |
| | | | | | | | | | | | | | | | |
| | | | | | | | | | | | | | $ | 2,838,518 | |
| | | | | | | | | | | | | | | | |
| (g) | The issuer has filed for bankruptcy protection under Chapter 11. Income is not being accrued. At September 30, 2010, the value of this security amounted to $165,937, which represents less than 0.1% of net assets. |
| (h) | Cost for federal income tax purposes is $309,221,950. |
Investments in affiliates during the six months ended September 30, 2010:
| | | | | | | | | | | | | | | | | | | | |
Affiliate | | Value,
beginning of
period | | | Purchases | | | Sales
Proceeds | | | Interest
Income | | | Value,
end of
period | |
Merrill Lynch & Co., Inc.
6.050% 08/15/12 | | $ | 774,304 | | | $ | — | | | $ | — | | | $ | 3,655 | | | $ | — | |
As of May 1, 2010, this company was no longer an affiliate of the fund. The above table reflects activity for the period from April 1, 2010 through April 30, 2010.
The following table summarizes the inputs used, as of September 30, 2010, in valuing the Fund’s assets:
| | | | | | | | | | | | | | | | |
Description | | Quoted Prices
(Level 1) | | | Other
Significant
Observable
Inputs
(Level 2) | | | Significant
Unobservable
Inputs
(Level 3) | | | Total | |
Common Stocks | | | | | | | | | | | | | | | | |
Consumer Discretionary | | $ | 19,627,616 | | | $ | 6,728,493 | | | $ | — | | | $ | 26,356,109 | |
Consumer Staples | | | 15,464,598 | | | | 4,747,979 | | | | — | | | | 20,212,577 | |
Energy | | | 18,159,642 | | | | 2,292,727 | | | | — | | | | 20,452,369 | |
Financials | | | 27,376,490 | | | | 6,190,589 | | | | — | | | | 33,567,079 | |
Health Care | | | 20,221,664 | | | | 2,364,781 | | | | — | | | | 22,586,445 | |
Industrials | | | 22,075,383 | | | | 6,776,743 | | | | — | | | | 28,852,126 | |
Information Technology | | | 33,126,589 | | | | 2,933,671 | | | | — | | | | 36,060,260 | |
Materials | | | 5,781,391 | | | | 2,301,164 | | | | — | | | | 8,082,555 | |
Telecommunication Services | | | 3,739,883 | | | | 766,889 | | | | — | | | | 4,506,772 | |
Utilities | | | 6,582,901 | | | | — | | | | — | | | | 6,582,901 | |
| | | | | | | | | | | | | | | | |
Total Common Stocks | | | 172,156,157 | | | | 35,103,036 | | | | — | | | | 207,259,193 | |
| | | | | | | | | | | | | | | | |
Total Mortgage-Backed Securities | | | 1,234,117 | | | | 32,706,324 | | | | — | | | | 33,940,441 | |
| | | | | | | | | | | | | | | | |
Total Corporate Fixed-Income Bonds & Notes | | | — | | | | 34,039,844 | | | | — | | | | 34,039,844 | |
| | | | | | | | | | | | | | | | |
See Accompanying Notes to Financial Statements.
17
Columbia Liberty Fund
September 30, 2010
| | | | | | | | | | | | | | | | |
Description | | Quoted Prices
(Level 1) | | | Other
Significant
Observable
Inputs
(Level 2) | | | Significant
Unobservable
Inputs
(Level 3) | | | Total | |
Government & Agency Obligations | | | | | | | | | | | | | | | | |
Foreign Government Obligations | | $ | — | | | $ | 1,691,924 | | | $ | — | | | $ | 1,691,924 | |
U.S. Government Agencies | | | — | | | | 4,042,546 | | | | — | | | | 4,042,546 | |
U.S. Government Obligations | | | — | | | | 20,497,101 | | | | — | | | | 20,497,101 | |
| | | | | | | | | | | | | | | | |
Total Government &
Agency Obligations | | | — | | | | 26,231,571 | | | | — | | | | 26,231,571 | |
| | | | | | | | | | | | | | | | |
Total Commercial
Mortgage-Backed Securities | | | — | | | | 18,352,685 | | | | — | | | | 18,352,685 | |
| | | | | | | | | | | | | | | | |
Total Collateralized
Mortgage Obligations | | | — | | | | 5,217,730 | | | | — | | | | 5,217,730 | |
| | | | | | | | | | | | | | | | |
Total Asset-Backed
Securities | | | — | | | | 2,830,601 | | | | — | | | | 2,830,601 | |
| | | | | | | | | | | | | | | | |
Convertible Preferred Stock | | | | | | | | | |
Energy | | | 532,846 | | | | — | | | | — | | | | 532,846 | |
Financials | | | 544,790 | | | | 217,813 | | | | — | | | | 762,603 | |
Consumer Discretionary | | | 685,113 | | | | — | | | | — | | | | 685,113 | |
| | | | | | | | | | | | | | | | |
Total Convertible Preferred Stock | | | 1,762,749 | | | | 217,813 | | | | — | | | | 1,980,562 | |
| | | | | | | | | | | | | | | | |
Total Convertible Bonds | | | — | | | | 656,437 | | | | — | | | | 656,437 | |
| | | | | | | | | | | | | | | | |
Total Short-Term Obligation | | | — | | | | 14,915,000 | | | | — | | | | 14,915,000 | |
| | | | | | | | | | | | | | | | |
Total Investments | | | 175,153,023 | | | | 170,271,041 | | | | — | | | | 345,424,064 | |
| | | | | | | | | | | | | | | | |
Unrealized Appreciation on Futures Contracts | | | 238,798 | | | | — | | | | — | | | | 238,798 | |
Unrealized Depreciation on Futures Contracts | | | (75,495 | ) | | | — | | | | — | | | | (75,495 | ) |
| | | | | | | | | | | | | | | | |
Total | | $ | 175,316,326 | | | $ | 170,271,041 | | | $ | — | | | $ | 345,587,367 | |
| | | | | | | | | | | | | | | | |
The Fund’s assets assigned to the Level 2 input category are generally valued using the market approach, in which a security’s value is determined through reference to prices and information from market transactions for similar or identical assets. These assets include certain foreign securities for which a third party statistical pricing service may be employed for purposes of fair valuation. The models utilized by the third party statistical pricing service take into account a security’s correlation to available market data including, but not limited to, intraday index, ADR, and ETF movements.
Certain short-term obligations may be valued using amortized cost, an income approach which converts future cash flows to a present value based upon the discount or premium at purchase.
There were no significant transfers of financial assets between Levels 1 and 2 during the period.
For more information on valuation inputs, and their aggregation into the levels used in the table above, please refer to the Security Valuation section in the accompanying Notes to Financial Statements.
At September 30, 2010, the Fund held the following open long futures contracts:
| | | | | | | | | | | | | | | | | | | | |
| Equity Risk | | | | | | | | | | | | | | | |
Type | | Number of
Contracts | | | Value | | | Aggregate
Face Value | | | Expiration
Date | | | Unrealized
Appreciation | |
S&P 500 Index Futures | | | 24 | | | $ | 6,820,200 | | | $ | 6,581,402 | | | | Dec-2010 | | | $ | 238,798 | |
At September 30, 2010, the Fund held the following open short futures contracts:
| | | | | | | | | | | | | | | | | | | | |
| Interest Rate Risk | | | | | | | | | | | | | | | |
Type | | Number of
Contracts | | | Value | | | Aggregate
Face Value | | | Expiration
Date | | | Unrealized
Depreciation | |
5-Year U.S. Treasury Notes | | | 61 | | | $ | 7,372,898 | | | $ | 7,297,403 | | | | Dec-2010 | | | $ | (75,495 | ) |
As of September 30, 2010, cash of $1,215,000 was pledged as collateral for open futures contracts.
At September 30, 2010, the asset allocation of the Fund is as follows:
| | | | |
Asset Allocation (Unaudited) | | % of
Net Assets | |
Common Stocks | | | 60.3 | |
Mortgage-Backed Securities | | | 9.9 | |
Corporate Fixed-Income Bonds & Notes | | | 9.9 | |
Government & Agency Obligations | | | 7.6 | |
Commercial Mortgage-Backed Securities | | | 5.4 | |
Collateralized Mortgage Obligations | | | 1.5 | |
Asset-Backed Securities | | | 0.8 | |
Convertible Preferred Stocks | | | 0.4 | |
Convertible Bonds | | | 0.2 | |
Preferred Stock | | | 0.2 | |
| | | | |
| | | 96.2 | |
Short-Term Obligation | | | 4.3 | |
Other Assets & Liabilities, Net | | | (0.5 | ) |
| | | | |
| | | 100.0 | |
| | | | |
| | |
Acronym | | Name |
| ADR | | American Depositary Receipt |
| REMICS | | Real Estate Mortgage Investment Conduits |
| TBA | | To Be Announced |
See Accompanying Notes to Financial Statements.
18
Statement of Assets and Liabilities – Columbia Liberty Fund
September 30, 2010
| | | | | | |
| | | | | ($) | |
| Assets | | Investments, at identified cost | | | 308,029,672 | |
| | | | | | |
| | Investments, at value | | | 345,424,064 | |
| | Cash | | | 210,269 | |
| | Foreign currency (cost of $27,045) | | | 27,557 | |
| | Cash collateral for open futures contracts | | | 1,215,000 | |
| | Receivable for: | | | | |
| | Investments sold | | | 2,876,819 | |
| | Fund shares sold | | | 17,290 | |
| | Dividends | | | 289,119 | |
| | Interest | | | 801,649 | |
| | Foreign tax reclaims | | | 63,606 | |
| | Trustees’ deferred compensation plan | | | 90,368 | |
| | Prepaid expenses | | | 5,172 | |
| | | | | | |
| | Total Assets | | | 351,020,913 | |
| | |
| Liabilities | | Payable for: | | | | |
| | Investments purchased | | | 207,610 | |
| | Investments purchased on a delayed delivery basis | | | 5,702,400 | |
| | Fund shares repurchased | | | 745,997 | |
| | Futures variation margin | | | 26,664 | |
| | Foreign capital gains taxes withheld | | | 67,103 | |
| | Investment advisory fee | | | 153,899 | |
| | Pricing and bookkeeping fees | | | 10,545 | |
| | Transfer agent fee | | | 71,471 | |
| | Trustees’ fees | | | 733 | |
| | Audit fee | | | 50,546 | |
| | Custody fee | | | 22,602 | |
| | Distribution and service fees | | | 74,667 | |
| | Chief compliance officer expenses | | | 284 | |
| | Trustees’ deferred compensation plan | | | 90,368 | |
| | Other liabilities | | | 38,883 | |
| | | | | | |
| | Total Liabilities | | | 7,263,772 | |
| | |
| | | | | | |
| | Net Assets | | | 343,757,141 | |
| | |
| Net Assets Consist of | | Paid-in capital | | | 366,037,715 | |
| | Undistributed net investment income | | | 233,573 | |
| | Accumulated net realized loss | | | (60,013,262 | ) |
| | Net unrealized appreciation (depreciation) on: | | | | |
| | Investments | | | 37,394,392 | |
| | Foreign currency translations | | | 8,523 | |
| | Futures contracts | | | 163,303 | |
| | Foreign capital gains tax | | | (67,103 | ) |
| | | | | | |
| | Net Assets | | | 343,757,141 | |
See Accompanying Notes to Financial Statements.
19
Statement of Assets and Liabilities (continued) – Columbia Liberty Fund
September 30, 2010
| | | | | | |
| | | | | | |
| Class A | | Net assets | | $ | 331,372,155 | |
| | Shares outstanding | | | 44,075,422 | |
| | Net asset value per share | | $ | 7.52 | (a) |
| | Maximum sales charge | | | 5.75 | % |
| | Maximum offering price per share ($7.52/0.9425) | | $ | 7.98 | (b) |
| | |
| Class B | | Net assets | | $ | 7,269,035 | |
| | Shares outstanding | | | 962,488 | |
| | Net asset value and offering price per share | | $ | 7.55 | (a) |
| | |
| Class C | | Net assets | | $ | 4,098,967 | |
| | Shares outstanding | | | 544,245 | |
| | Net asset value and offering price per share | | $ | 7.53 | (a) |
| | |
| Class Z | | Net assets | | $ | 1,016,984 | |
| | Shares outstanding | | | 125,460 | |
| | Net asset value, offering and redemption price per share | | $ | 8.11 | |
| (a) | Redemption price per share is equal to net asset value less any applicable contingent deferred sales charge. |
| (b) | On sales of $50,000 or more the offering price is reduced. |
See Accompanying Notes to Financial Statements.
20
Statement of Operations – Columbia Liberty Fund
For the Year Ended September 30, 2010
| | | | | | |
| | | | | ($) | |
| Investment Income | | Dividends | | | 3,648,939 | |
| | Interest | | | 6,258,767 | |
| | Interest from affiliates | | | 3,655 | |
| | Foreign taxes withheld | | | (61,918 | ) |
| | | | | | |
| | Total Investment Income | | | 9,849,443 | |
| | |
| Expenses | | Investment advisory fee | | | 1,952,405 | |
| | Distribution fee: | | | | |
| | Class B | | | 71,097 | |
| | Class C | | | 31,205 | |
| | Service fee: | | | | |
| | Class A | | | 820,422 | |
| | Class B | | | 22,808 | |
| | Class C | | | 10,026 | |
| | Transfer agent fee | | | 611,477 | |
| | Pricing and bookkeeping fees | | | 117,102 | |
| | Trustees’ fees | | | 31,228 | |
| | Custody fee | | | 136,934 | |
| | Chief compliance officer expenses | | | 1,128 | |
| | Other expenses | | | 288,317 | |
| | | | | | |
| | Total Expenses | | | 4,094,149 | |
| | Expense reductions | | | (813 | ) |
| | | | | | |
| | Net Expenses | | | 4,093,336 | |
| | |
| | | | | | |
| | Net Investment Income | | | 5,756,107 | |
| | |
| Net Realized and Unrealized Gain (Loss) on Investments, Futures Contracts, Foreign Currency and Foreign Capital Gains Tax | | Net realized gain (loss) on: | | | | |
| | Investments | | | 21,897,291 | |
| | Foreign currency transactions | | | (27,617 | ) |
| | Futures contracts | | | 50,027 | |
| | | | | | |
| | Net realized gain | | | 21,919,701 | |
| | |
| | Net change in unrealized appreciation (depreciation) on: | | | | |
| | Investments | | | 1,325,945 | |
| | Foreign currency translations | | | 3,386 | |
| | Futures contracts | | | 124,685 | |
| | Foreign capital gains tax | | | 3,490 | |
| | | | | | |
| | Net change in unrealized appreciation (depreciation) | | | 1,457,506 | |
| | | | | | |
| | Net Gain | | | 23,377,207 | |
| | |
| | | | | | |
| | Net Increase Resulting from Operations | | | 29,133,314 | |
See Accompanying Notes to Financial Statements.
21
Statement of Changes in Net Assets – Columbia Liberty Fund
| | | | | | | | | | |
| | | | | Year Ended September 30, | |
| Increase (Decrease) in Net Assets | | | | 2010 ($) | | | 2009 ($) | |
| Operations | | Net investment income | | | 5,756,107 | | | | 7,892,596 | |
| | Net realized gain (loss) on investments, futures contracts and foreign currency transactions | | | 21,919,701 | | | | (66,041,687 | ) |
| | Net change in unrealized appreciation (depreciation) on investments, futures contracts, foreign currency translations and foreign capital gains tax | | | 1,457,506 | | | | 53,611,790 | |
| | | | | | | | | | |
| | Net increase (decrease) resulting from operations | | | 29,133,314 | | | | (4,537,301 | ) |
| | | |
| Distributions to Shareholders | | From net investment income: | | | | | | | | |
| | Class A | | | (6,227,412 | ) | | | (7,937,444 | ) |
| | Class B | | | (101,531 | ) | | | (263,578 | ) |
| | Class C | | | (45,346 | ) | | | (62,787 | ) |
| | Class Z | | | (18,498 | ) | | | (19,444 | ) |
| | | | | | | | | | |
| | Total distributions to shareholders | | | (6,392,787 | ) | | | (8,283,253 | ) |
| | | |
| | Net Capital Stock Transactions | | | (45,040,768 | ) | | | (44,655,167 | ) |
| | Increase from regulatory settlements | | | 20,589 | | | | — | |
| | | | | | | | | | |
| | Total decrease in net assets | | | (22,279,652 | ) | | | (57,475,721 | ) |
| | | |
| Net Assets | | Beginning of period | | | 366,036,793 | | | | 423,512,514 | |
| | End of period | | | 343,757,141 | | | | 366,036,793 | |
| | Undistributed net investment income at end of period | | | 233,573 | | | | 376,153 | |
See Accompanying Notes to Financial Statements.
22
Statement of Changes in Net Assets (continued) – Columbia Liberty Fund
| | | | | | | | | | | | | | | | |
| | | Capital Stock Activity | |
| | | Year Ended
September 30, 2010 | | | Year Ended
September 30, 2009 | |
| | | Shares | | | Dollars ($) | | | Shares | | | Dollars ($) | |
Class A | | | | | | | | | | | | | | | | |
Subscriptions | | | 860,116 | | | | 6,299,617 | | | | 1,615,185 | | | | 9,816,547 | |
Distributions reinvested | | | 769,837 | | | | 5,643,740 | | | | 1,176,047 | | | | 7,279,444 | |
Redemptions | | | (7,040,195 | ) | | | (51,270,536 | ) | | | (8,541,579 | ) | | | (52,173,187 | ) |
| | | | | | | | | | | | | | | | |
Net decrease | | | (5,410,242 | ) | | | (39,327,179 | ) | | | (5,750,347 | ) | | | (35,077,196 | ) |
| | | | |
Class B | | | | | | | | | | | | | | | | |
Subscriptions | | | 18,126 | | | | 134,142 | | | | 82,928 | | | | 496,044 | |
Distributions reinvested | | | 12,714 | | | | 93,244 | | | | 41,084 | | | | 251,924 | |
Redemptions | | | (757,471 | ) | | | (5,577,072 | ) | | | (1,730,218 | ) | | | (10,553,453 | ) |
| | | | | | | | | | | | | | | | |
Net decrease | | | (726,631 | ) | | | (5,349,686 | ) | | | (1,606,206 | ) | | | (9,805,485 | ) |
| | | | |
Class C | | | | | | | | | | | | | | | | |
Subscriptions | | | 44,504 | | | | 324,424 | | | | 121,898 | | | | 763,588 | |
Distributions reinvested | | | 5,699 | | | | 41,772 | | | | 9,606 | | | | 59,444 | |
Redemptions | | | (107,212 | ) | | | (780,241 | ) | | | (104,380 | ) | | | (644,439 | ) |
| | | | | | | | | | | | | | | | |
Net increase (decrease) | | | (57,009 | ) | | | (414,045 | ) | | | 27,124 | | | | 178,593 | |
| | | | |
Class Z | | | | | | | | | | | | | | | | |
Subscriptions | | | 16,926 | | | | 132,528 | | | | 23,681 | | | | 151,192 | |
Distributions reinvested | | | 2,171 | | | | 17,177 | | | | 2,750 | | | | 18,379 | |
Redemptions | | | (12,554 | ) | | | (99,563 | ) | | | (17,473 | ) | | | (120,650 | ) |
| | | | | | | | | | | | | | | | |
Net increase | | | 6,543 | | | | 50,142 | | | | 8,958 | | | | 48,921 | |
See Accompanying Notes to Financial Statements.
23
Financial Highlights – Columbia Liberty Fund
Selected data for a share outstanding throughout each period is as follows:
| | | | | | | | | | | | | | | | | | | | |
| | | Year Ended September 30, | |
| Class A Shares | | 2010 | | | 2009 | | | 2008 | | | 2007 | | | 2006 | |
Net Asset Value, Beginning of Period | | $ | 7.05 | | | $ | 7.15 | | | $ | 9.63 | | | $ | 8.79 | | | $ | 8.36 | |
| | | | | |
Income from Investment Operations: | | | | | | | | | | | | | | | | | | | | |
Net investment income (a) | | | 0.12 | | | | 0.15 | | | | 0.18 | | | | 0.19 | | | | 0.18 | |
| Net realized and unrealized gain (loss) on investment, foreign currency, futures contracts, foreign capital gains tax and written options | | | 0.48 | | | | (0.10 | ) | | | (1.53 | ) | | | 1.12 | | | | 0.44 | |
| | | | | | | | | | | | | | | | | | | | |
Total from investment operations | | | 0.60 | | | | 0.05 | | | | (1.35 | ) | | | 1.31 | | | | 0.62 | |
| | | | | |
Less Distributions to Shareholders: | | | | | | | | | | | | | | | | | | | | |
From net investment income | | | (0.13 | ) | | | (0.15 | ) | | | (0.20 | ) | | | (0.21 | ) | | | (0.19 | ) |
From net realized gains | | | — | | | | — | | | | (0.93 | ) | | | (0.26 | ) | | | — | |
| | | | | | | | | | | | | | | | | | | | |
Total distributions to shareholders | | | (0.13 | ) | | | (0.15 | ) | | | (1.13 | ) | | | (0.47 | ) | | | (0.19 | ) |
| | | | | |
Increase from regulatory settlements | | | — | (b) | | | — | | | | — | | | | — | | | | — | |
| | | | | |
Net Asset Value, End of Period | | $ | 7.52 | | | $ | 7.05 | | | $ | 7.15 | | | $ | 9.63 | | | $ | 8.79 | |
Total return (c) | | | 8.63 | % | | | 1.07 | %(d) | | | (15.83 | )% | | | 15.29 | % | | | 7.47 | %(e)(f) |
| | | | | |
Ratios to Average Net Assets/Supplemental Data: | | | | | | | | | | | | | | | | | | | | |
Net expenses before interest expense | | | 1.12 | %(g) | | | 1.16 | %(g) | | | 1.03 | %(h) | | | 1.04 | %(g) | | | 1.03 | %(g) |
Interest expense | | | — | | | | — | | | | — | %(i) | | | — | | | | — | |
Net expenses | | | 1.12 | %(g) | | | 1.16 | %(g) | | | 1.03 | %(h) | | | 1.04 | %(g) | | | 1.03 | %(g) |
Waiver/Reimbursement | | | — | | | | — | | | | — | | | | — | | | | 0.01 | % |
Net investment income | | | 1.65 | %(g) | | | 2.36 | %(g) | | | 2.18 | %(h) | | | 2.06 | %(g) | | | 2.07 | %(g) |
Portfolio turnover rate | | | 96 | % | | | 105 | % | | | 88 | % | | | 106 | % | | | 98 | % |
Net assets, end of period (000s) | | $ | 331,372 | | | $ | 348,922 | | | $ | 394,884 | | | $ | 532,413 | | | $ | 514,826 | |
| (a) | Per share data was calculated using the average shares outstanding during the period. |
| (b) | Rounds to less than $0.01 per share. |
| (c) | Total return at net asset value assuming all distributions reinvested and no initial sales charge or contingent deferred sales charge. |
| (d) | Total return includes a reimbursement of a loss experienced by the Fund due to a compliance violation. This reimbursement had an impact of less than 0.01% on total return. |
| (e) | Had the investment advisor and/or any of its affiliates not waived fees or reimbursed a portion of expenses, total return would have been reduced. |
| (f) | Total return includes a voluntary reimbursement by the investment advisor for a realized investment loss due to a trading error. This reimbursement had an impact of less than 0.01%. |
| (g) | The benefits derived from expense reductions had an impact of less than 0.01%. |
| (h) | The benefits derived from expense reductions had an impact of 0.01%. |
| (i) | Rounds to less than 0.01%. |
See Accompanying Notes to Financial Statements.
24
Financial Highlights – Columbia Liberty Fund
Selected data for a share outstanding throughout each period is as follows:
| | | | | | | | | | | | | | | | | | | | |
| | | Year Ended September 30, | |
| Class B Shares | | 2010 | | | 2009 | | | 2008 | | | 2007 | | | 2006 | |
Net Asset Value, Beginning of Period | | $ | 7.08 | | | $ | 7.18 | | | $ | 9.62 | | | $ | 8.78 | | | $ | 8.36 | |
| | | | | |
Income from Investment Operations: | | | | | | | | | | | | | | | | | | | | |
Net investment income (a) | | | 0.06 | | | | 0.10 | | | | 0.12 | | | | 0.12 | | | | 0.11 | |
| Net realized and unrealized gain (loss) on investments, foreign currency, futures contracts, foreign capital gains tax and written options | | | 0.49 | | | | (0.09 | ) | | | (1.54 | ) | | | 1.12 | | | | 0.43 | |
| | | | | | | | | | | | | | | | | | | | |
Total from investment operations | | | 0.55 | | | | 0.01 | | | | (1.42 | ) | | | 1.24 | | | | 0.54 | |
| | | | | |
Less Distributions to Shareholders: | | | | | | | | | | | | | | | | | | | | |
From net investment income | | | (0.08 | ) | | | (0.11 | ) | | | (0.09 | ) | | | (0.14 | ) | | | (0.12 | ) |
From net realized gains | | | — | | | | — | | | | (0.93 | ) | | | (0.26 | ) | | | — | |
| | | | | | | | | | | | | | | | | | | | |
Total distributions to shareholders | | | (0.08 | ) | | | (0.11 | ) | | | (1.02 | ) | | | (0.40 | ) | | | (0.12 | ) |
| | | | | |
Increase from regulatory settlements | | | — | (b) | | | — | | | | — | | | | — | | | | — | |
| | | | | |
Net Asset Value, End of Period | | $ | 7.55 | | | $ | 7.08 | | | $ | 7.18 | | | $ | 9.62 | | | $ | 8.78 | |
Total return (c) | | | 7.80 | % | | | 0.32 | %(d) | | | (16.51 | )% | | | 14.46 | % | | | 6.55 | %(e)(f) |
| | | | | |
Ratios to Average Net Assets/Supplemental Data: | | | | | | | | | | | | | | | | | | | | |
Net expenses before interest expense | | | 1.87 | %(g) | | | 1.91 | %(g) | | | 1.78 | %(h) | | | 1.79 | %(g) | | | 1.78 | %(g) |
Interest expense | | | — | | | | — | | | | — | %(i) | | | — | | | | — | |
Net expenses | | | 1.87 | %(g) | | | 1.91 | %(g) | | | 1.78 | %(h) | | | 1.79 | %(g) | | | 1.78 | %(g) |
Waiver/Reimbursement | | | — | | | | — | | | | — | | | | — | | | | 0.01 | % |
Net investment income | | | 0.88 | %(g) | | | 1.67 | %(g) | | | 1.39 | %(h) | | | 1.28 | %(g) | | | 1.31 | %(g) |
Portfolio turnover rate | | | 96 | % | | | 105 | % | | | 88 | % | | | 106 | % | | | 98 | % |
Net assets, end of period (000s) | | $ | 7,269 | | | $ | 11,965 | | | $ | 23,672 | | | $ | 51,229 | | | $ | 85,766 | |
| (a) | Per share data was calculated using the average shares outstanding during the period. |
| (b) | Rounds to less than $0.01 per share. |
| (c) | Total return at net asset value assuming all distributions reinvested and no contingent deferred sales charge. |
| (d) | Total return includes a reimbursement of a loss experienced by the Fund due to a compliance violation. The reimbursement had an impact of less than 0.01% on total return. |
| (e) | Had the investment advisor and/or any of its affiliates not waived fees or reimbursed a portion of expenses, total return would have been reduced. |
| (f) | Total return includes a voluntary reimbursement by the investment advisor for a realized investment loss due to a trading error. This reimbursement had an impact of less than 0.01%. |
| (g) | The benefits derived from expense reductions had an impact of less than 0.01%. |
| (h) | The benefits derived from expense reductions had an impact of 0.01%. |
| (i) | Rounds to less than 0.01%. |
See Accompanying Notes to Financial Statements.
25
Financial Highlights – Columbia Liberty Fund
Selected data for a share outstanding throughout each period is as follows:
| | | | | | | | | | | | | | | | | | | | |
| | | Year Ended September 30, | |
| Class C Shares | | 2010 | | | 2009 | | | 2008 | | | 2007 | | | 2006 | |
Net Asset Value, Beginning of Period | | $ | 7.06 | | | $ | 7.16 | | | $ | 9.59 | | | $ | 8.76 | | | $ | 8.34 | |
| | | | | |
Income from Investment Operations: | | | | | | | | | | | | | | | | | | | | |
Net investment income (a) | | | 0.07 | | | | 0.10 | | | | 0.12 | | | | 0.12 | | | | 0.11 | |
| Net realized and unrealized gain (loss) on investments, foreign currency, futures contracts, foreign capital gains tax and written options | | | 0.48 | | | | (0.09 | ) | | | (1.53 | ) | | | 1.11 | | | | 0.43 | |
| | | | | | | | | | | | | | | | | | | | |
Total from investment operations | | | 0.55 | | | | 0.01 | | | | (1.41 | ) | | | 1.23 | | | | 0.54 | |
| | | | | |
Less Distributions to Shareholders: | | | | | | | | | | | | | | | | | | | | |
From net investment income | | | (0.08 | ) | | | (0.11 | ) | | | (0.09 | ) | | | (0.14 | ) | | | (0.12 | ) |
From net realized gains | | | — | | | | — | | | | (0.93 | ) | | | (0.26 | ) | | | — | |
| | | | | | | | | | | | | | | | | | | | |
Total distributions to shareholders | | | (0.08 | ) | | | (0.11 | ) | | | (1.02 | ) | | | (0.40 | ) | | | (0.12 | ) |
| | | | | |
Increase from regulatory settlements | | | — | (b) | | | — | | | | — | | | | — | | | | — | |
| | | | | |
Net Asset Value, End of Period | | $ | 7.53 | | | $ | 7.06 | | | $ | 7.16 | | | $ | 9.59 | | | $ | 8.76 | |
Total return (c) | | | 7.82 | % | | | 0.33 | %(d) | | | (16.46 | )% | | | 14.38 | % | | | 6.56 | %(e)(f) |
| | | | | |
Ratios to Average Net Assets/Supplemental Data: | | | | | | | | | | | | | | | | | | | | |
Net expenses before interest expense | | | 1.87 | %(g) | | | 1.91 | %(g) | | | 1.78 | %(h) | | | 1.79 | %(g) | | | 1.78 | %(g) |
Interest expense | | | — | | | | — | | | | — | %(i) | | | — | | | | — | |
Net expenses | | | 1.87 | %(g) | | | 1.91 | %(g) | | | 1.78 | %(h) | | | 1.79 | %(g) | | | 1.78 | %(g) |
Waiver/Reimbursement | | | — | | | | — | | | | — | | | | — | | | | 0.01 | % |
Net investment income | | | 0.90 | %(g) | | | 1.60 | %(g) | | | 1.43 | %(h) | | | 1.31 | %(g) | | | 1.31 | %(g) |
Portfolio turnover rate | | | 96 | % | | | 105 | % | | | 88 | % | | | 106 | % | | | 98 | % |
Net assets, end of period (000s) | | $ | 4,099 | | | $ | 4,247 | | | $ | 4,112 | | | $ | 5,447 | | | $ | 5,076 | |
| (a) | Per share data was calculated using the average shares outstanding during the period. |
| (b) | Rounds to less than $0.01 per share. |
| (c) | Total return at net asset value assuming all distributions reinvested and no contingent deferred sales charge. |
| (d) | Total return includes a reimbursement of a loss experienced by the Fund due to a compliance violation. The reimbursement had an impact of less than 0.01% on total return. |
| (e) | Had the investment advisor and/or any of its affiliates not waived fees or reimbursed a portion of expenses, total return would have been reduced. |
| (f) | Total return includes a voluntary reimbursement by the investment advisor for a realized investment loss due to a trading error. This reimbursement had an impact of less than 0.01%. |
| (g) | The benefits derived from expense reductions had an impact of less than 0.01%. |
| (h) | The benefits derived from expense reductions had an impact of 0.01%. |
| (i) | Rounds to less than 0.01%. |
See Accompanying Notes to Financial Statements.
26
Financial Highlights – Columbia Liberty Fund
Selected data for a share outstanding throughout each period is as follows:
| | | | | | | | | | | | | | | | | | | | |
| | | Year Ended September 30, | |
| Class Z Shares | | 2010 | | | 2009 | | | 2008 | | | 2007 | | | 2006 | |
Net Asset Value, Beginning of Period | | $ | 7.59 | | | $ | 7.68 | | | $ | 10.28 | | | $ | 9.34 | | | $ | 8.88 | |
| | | | | |
Income from Investment Operations: | | | | | | | | | | | | | | | | | | | | |
Net investment income (a) | | | 0.15 | | | | 0.17 | | | | 0.22 | | | | 0.22 | | | | 0.21 | |
| Net realized and unrealized gain (loss) on investments, foreign currency, futures contracts, foreign capital gains tax and written options | | | 0.52 | | | | (0.09 | ) | | | (1.65 | ) | | | 1.21 | | | | 0.46 | |
| | | | | | | | | | | | | | | | | | | | |
Total from investment operations | | | 0.67 | | | | 0.08 | | | | (1.43 | ) | | | 1.43 | | | | 0.67 | |
| | | | | |
Less Distributions to Shareholders: | | | | | | | | | | | | | | | | | | | | |
From net investment income | | | (0.15 | ) | | | (0.17 | ) | | | (0.24 | ) | | | (0.23 | ) | | | (0.21 | ) |
From net realized gains | | | — | | | | — | | | | (0.93 | ) | | | (0.26 | ) | | | — | |
| | | | | | | | | | | | | | | | | | | | |
Total distributions to shareholders | | | (0.15 | ) | | | (0.17 | ) | | | (1.17 | ) | | | (0.49 | ) | | | (0.21 | ) |
| | | | | |
Increase from regulatory settlements | | | — | (b) | | | — | | | | — | | | | — | | | | — | |
| | | | | |
Net Asset Value, End of Period | | $ | 8.11 | | | $ | 7.59 | | | $ | 7.68 | | | $ | 10.28 | | | $ | 9.34 | |
Total return (c) | | | 8.92 | % | | | 1.35 | %(d) | | | (15.67 | )% | | | 15.72 | % | | | 7.60 | %(e)(f) |
| | | | | |
Ratios to Average Net Assets/Supplemental Data: | | | | | | | | | | | | | | | | | | | | |
Net expenses before interest expense | | | 0.88 | %(g) | | | 0.92 | %(g) | | | 0.79 | %(h) | | | 0.80 | %(g) | | | 0.79 | %(g) |
Interest expense | | | — | | | | — | | | | — | %(i) | | | — | | | | — | |
Net expenses | | | 0.88 | %(g) | | | 0.92 | %(g) | | | 0.79 | %(h) | | | 0.80 | %(g) | | | 0.79 | %(g) |
Waiver/Reimbursement | | | — | | | | — | | | | — | | | | — | | | | 0.01 | % |
Net investment income | | | 1.90 | %(g) | | | 2.58 | %(g) | | | 2.44 | %(h) | | | 2.29 | %(g) | | | 2.34 | %(g) |
Portfolio turnover rate | | | 96 | % | | | 105 | % | | | 88 | % | | | 106 | % | | | 98 | % |
Net assets, end of period (000s) | | $ | 1,017 | | | $ | 903 | | | $ | 845 | | | $ | 856 | | | $ | 1,175 | |
| (a) | Per share data was calculated using the average shares outstanding during the period. |
| (b) | Rounds to less than $0.01 per share. |
| (c) | Total return at net asset value assuming all distributions reinvested. |
| (d) | Total return includes a reimbursement of a loss experienced by the Fund due to a compliance violation. The reimbursement had an impact of less than 0.01% on total return. |
| (e) | Had the investment advisor and/or any of its affiliates not waived fees or reimbursed a portion of expenses, total return would have been reduced. |
| (f) | Total return includes a voluntary reimbursement by the investment advisor for a realized investment loss due to a trading error. This reimbursement had an impact of less than 0.01%. |
| (g) | The benefits derived from expense reductions had an impact of less than 0.01%. |
| (h) | The benefits derived from expense reductions had an impact of 0.01%. |
| (i) | Rounds to less than 0.01%. |
See Accompanying Notes to Financial Statements.
27
Notes to Financial Statements – Columbia Liberty Fund
September 30, 2010
Note 1. Organization
Columbia Liberty Fund (the “Fund”), a series of Columbia Funds Series Trust I (the “Trust”), is a diversified fund. The Trust is registered under the Investment Company Act of 1940, as amended (the “1940 Act”), as an open-end management investment company organized as a Massachusetts business trust.
Investment Objective
The Fund seeks total return, consisting of current income and long-term capital appreciation.
Fund Shares
The Trust may issue an unlimited number of shares, and the Fund offers four classes of shares: Class A, Class B, Class C and Class Z. Each share class has its own expense structure and sales charges, as applicable. The Fund no longer accepts investments from new or existing investors in the Fund’s Class B shares, except in connection with the reinvestment of any dividend and/or capital gain distributions in Class B shares of the Fund and exchanges by existing Class B shareholders of the other Columbia Funds.
Class A shares are subject to a maximum front-end sales charge of 5.75% based on the amount of initial investment. Class A shares purchased without an initial sales charge in accounts aggregating $1 million to $50 million at the time of purchase are subject to a maximum contingent deferred sales charge (“CDSC”) of 1.00% based upon the holding period after purchase. Class B shares are subject to a maximum CDSC of 5.00% based upon the holding period after purchase. Class B shares will convert to Class A shares eight years after purchase. Class C shares are subject to a 1.00% CDSC on shares sold within one year after purchase. Class Z shares are offered continuously at net asset value. There are certain restrictions on the purchase of Class Z shares, as described in the Fund’s prospectus.
Note 2. Significant Accounting Policies
The preparation of financial statements in accordance with accounting principles generally accepted in the United States of America (“GAAP”) requires management to make certain estimates and assumptions that affect the reported amounts of assets and liabilities, the disclosure of contingent assets and liabilities at the date of the financial statements and the reported amounts of revenue and expenses during the reporting period. Actual results could differ from those estimates.
Management has evaluated the events and transactions that have occurred through the date the financial statements were issued and, except as noted in Note 12, noted no items requiring adjustment of the financial statements or additional disclosures.
The following is a summary of significant accounting policies consistently followed by the Fund in the preparation of its financial statements.
Security Valuation
Debt securities generally are valued by pricing services approved by the Trust’s Board of Trustees, based upon market transactions for normal, institutional-size trading units of similar securities. The services may use various pricing techniques which take into account appropriate factors such as yield, quality, coupon rate, maturity, type of issue, trading characteristics and other data, as well as broker quotes. Debt securities for which quotations are readily available may also be valued based upon an over-the-counter or exchange bid quotation.
Certain debt securities, which tend to be more thinly traded and of lesser quality, are priced based on fundamental analysis of the financial condition of the issuer and the estimated value of any collateral. Valuations developed through pricing techniques may vary from the actual amounts realized upon sale of the securities, and the potential variation may be greater for those securities valued using fundamental analysis.
Equity securities are valued at the last sale price on the principal exchange on which they trade, except for securities traded on the NASDAQ, which are valued at the NASDAQ official close price. Unlisted securities or listed securities for which there were no sales during the day are valued at the closing bid price on such exchanges or over-the-counter markets.
Short-term investments maturing in 60 days or less are valued at amortized cost, which approximates market value.
Futures contracts are valued at the settlement price established each day by the board of trade or exchange on which they are traded.
28
Columbia Liberty Fund
September 30, 2010
Foreign securities are generally valued at the last sale price on the foreign exchange or market on which they trade. If any foreign share prices are not readily available as a result of limited share activity, the securities are valued at the last sale price of the local shares in the principal market in which such securities are normally traded.
Generally, trading in foreign securities is substantially completed each day at various times prior to the close of the New York Stock Exchange (“NYSE”). The values of such securities used in computing the net asset value of the Fund’s shares are determined as of such times. Foreign currency exchange rates are generally determined at 4:00 p.m. Eastern (U.S.) time. Occasionally, events affecting the values of such foreign securities and such exchange rates may occur between the times at which they are determined and the close of the customary trading session of the NYSE, which would not be reflected in the computation of the Fund’s net asset value. If events materially affecting the values of such foreign securities occur and it is determined that market quotations are not reliable, then these foreign securities will be valued at their fair value using procedures approved by the Board of Trustees.
The Fund may use a systematic fair valuation model provided by an independent third party to value securities principally traded in foreign markets in order to adjust for possible stale pricing that may occur between the close of the foreign exchanges and the time for valuation.
Investments for which market quotations are not readily available, or that have quotations which management believes are not reliable, are valued at fair value as determined in good faith under consistently applied procedures established by and under the general supervision of the Board of Trustees. If a security is valued at fair value, such value is likely to be different from the last quoted market price for the security. The determination of fair value often requires significant judgment. To determine fair value, management may use assumptions including but not limited to future cash flows and estimated risk premiums. Multiple inputs from various sources may be used to determine value.
GAAP establishes a hierarchy that prioritizes the inputs to valuation techniques used to measure fair value giving the highest priority to unadjusted quoted prices in active markets for identical securities (Level 1 measurements) and the lowest priority to unobservable inputs (Level 3 measurements) when market prices are not readily available or reliable. The three levels of the fair value hierarchy are described below:
| n | | Level 1 — quoted prices in active markets for identical securities |
| n | | Level 2 — prices determined using other significant observable inputs (including quoted prices for similar securities, interest rates, prepayment speeds, credit risk and others) |
| n | | Level 3 — prices determined using significant unobservable inputs. In situations where quoted prices or observable inputs are unavailable or less reliable, unobservable inputs may be used. Unobservable inputs may include management’s own assumptions about the factors market participants would use in pricing an investment. |
The inputs or methodology used for valuing securities are not necessarily an indication of the risk associated with investing in those securities.
On January 21, 2010, the Financial Accounting Standards Board issued an Accounting Standards Update (the “amendment”), Fair Value Measurements and Disclosures (Topic 820): Improving Disclosures about Fair Value Measurements, which provides guidance on how investment assets and liabilities are to be valued and disclosed. Specifically, the amendment requires reporting entities to disclose the inputs and valuation techniques used to measure fair value for both recurring and nonrecurring fair value measurements for Level 2 and Level 3 positions. The amendment also requires that transfers between all levels (including Level 1 and Level 2) be disclosed on a gross basis (i.e., transfers out must be disclosed separately from transfers in), and requires disclosure of the reason(s) for significant transfers. Additionally, purchases, sales, issuances and settlements must be disclosed on a gross basis in the Level 3 roll forward. The effective date of the amendment is for interim and annual periods beginning after December 15, 2009; except for the requirement to provide the Level 3 activity for purchases, sales, issuances and settlements on a gross basis, which will be effective for interim and annual periods beginning after December 15, 2010. At this time, management is evaluating the implications of the amendment and the impact to the financial statements.
29
Columbia Liberty Fund
September 30, 2010
Security Transactions
Security transactions are accounted for on the trade date. Cost is determined and gains (losses) are based upon the specific identification method for both financial statement and federal income tax purposes.
Derivative Instruments
The Fund may invest in derivative instruments. For additional information on derivative instruments, please see Note 6.
Repurchase Agreements
The Fund may engage in repurchase agreement transactions with institutions that management has determined are creditworthy. The Fund, through its custodian, receives delivery of the underlying securities collateralizing a repurchase agreement. Management is responsible for determining that the collateral is at least equal, at all times, to the value of the repurchase obligation including interest. A repurchase agreement transaction involves certain risks in the event of default or insolvency of the counterparty. These risks include possible delays in or restrictions on the Fund’s ability to dispose of the underlying securities and a possible decline in the value of the underlying securities during the period while the Fund seeks to assert its rights.
Delayed Delivery Securities
The Fund may trade securities on other than normal settlement terms, including securities purchased or sold on a “when-issued” basis. This may increase the risk if the other party to the transaction fails to deliver and causes the Fund to subsequently invest at less advantageous prices. The Fund identifies within its portfolio of investments cash or liquid securities in an amount equal to the delayed delivery commitment.
Treasury Inflation Protected Securities
The Fund may invest in treasury inflation protected securities (“TIPS”). The principal amount of TIPS is increased for inflation or decreased for deflation based on a monthly published index. Interest payments are based on the adjusted principal at the time the interest is paid. These adjustments are recorded as interest income on the Statement of Operations.
Foreign Currency Transactions and Translations
The values of all assets and liabilities quoted in foreign currencies are translated into U.S. dollars at that day’s exchange rates. Net realized and unrealized gains (losses) on foreign currency transactions and translations include gains (losses) arising from the fluctuation in exchange rates between trade and settlement dates on securities transactions, gains (losses) arising from the disposition of foreign currency and currency gains (losses) between the accrual and payment dates on dividends, interest income and foreign withholding taxes.
For financial statement purposes, the Fund does not distinguish that portion of gains (losses) on investments which is due to changes in foreign exchange rates from that which is due to changes in market prices of the investments. Such fluctuations are included with the net realized and unrealized gains (losses) on investments on the Statement of Operations.
Income Recognition
Interest income is recorded on the accrual basis. Premium and discount are amortized and accreted, respectively, on all debt securities, unless otherwise noted.
Corporate actions and dividend income are recorded on the ex-date except for certain foreign securities which are recorded as soon after the ex-date as the Fund becomes aware of such, net of any non-reclaimable tax withholdings.
Distributions received from real estate investment trusts (REITs) in excess of their income are recorded as a reduction of the cost of the related investments. If the Fund no longer owns the applicable securities, any distributions received in excess of income are recorded as realized gains.
Awards from class action litigation are recorded as a reduction of cost if the Fund still owns the applicable securities on the payment date. If the Fund no longer owns the applicable securities, the proceeds are recorded as realized gains.
The value of additional securities received as an income payment is recorded as income and as an increase to the cost basis of such securities.
30
Columbia Liberty Fund
September 30, 2010
Expenses
General expenses of the Trust are allocated to the Fund and other series of the Trust based upon relative net assets or other expense allocation methodologies determined by the nature of the expense. Expenses directly attributable to the Fund are charged to the Fund. Expenses directly attributable to a specific class of shares are charged to that share class.
Determination of Class Net Asset Value
All income, expenses (other than class-specific expenses, as shown on the Statement of Operations) and realized and unrealized gains (losses) are allocated to each class of the Fund on a daily basis, based on the relative net assets of each class, for purposes of determining the net asset value of each class.
Federal Income Tax Status
The Fund intends to qualify each year as a “regulated investment company” under Subchapter M of the Internal Revenue Code, as amended, and will distribute substantially all of its taxable income, if any, for its tax year, and as such will not be subject to federal income taxes. In addition, the Fund intends to distribute in each calendar year substantially all of its net investment income, capital gains and certain other amounts, if any, such that the Fund should not be subject to federal excise tax. Therefore, no provision is made for federal income or excise taxes.
Foreign Taxes
The Fund may be subject to foreign taxes on income, gains on investments or currency repatriation, a portion of which may be recoverable. The Fund will accrue such taxes and recoveries as applicable, based upon its current interpretation of tax rules and regulations that exist in the markets in which it invests.
Realized gains in certain countries may be subject to foreign taxes at the fund level, at rates ranging from approximately 10% to 15%. The Fund accrues for such foreign taxes on net realized and unrealized gains at the appropriate rate for each jurisdiction.
Distributions to Shareholders
Distributions from net investment income are declared and paid quarterly. Net realized capital gains, if any, are distributed at least annually. Income distributions and capital gain distributions are determined in accordance with federal income tax regulations which may differ from GAAP.
Indemnification
In the normal course of business, the Fund enters into contracts that contain a variety of representations and warranties and which provide general indemnities. The Fund’s maximum exposure under these arrangements is unknown because this would involve future claims against the Fund. Also, under the Trust’s organizational documents and by contract, the Trustees and officers of the Trust are indemnified against certain liabilities that may arise out of actions relating to their duties to the Trust. However, based on experience, the Fund expects the risk of loss due to these representations, warranties and indemnities to be minimal.
Note 3. Federal Tax Information
The timing and character of income and capital gain distributions are determined in accordance with income tax regulations, which may differ from GAAP. Reclassifications are made to the Fund’s capital accounts for permanent tax differences to reflect income and gains available for distribution or available capital loss carryforwards under income tax regulations.
For the year ended September 30, 2010, permanent book and tax basis differences resulting primarily from differing treatments for paydown reclassifications, foreign currency transactions, market discount reclassifications and discount accretion/premium amortization on debt securities were identified and reclassified among the components of the Fund’s net assets as follows:
| | | | |
| |
Undistributed Net Investment
Income | | Accumulated
Net Realized
Loss | | Paid-In Capital |
| $494,100 | | $(473,511) | | $(20,589) |
Net investment income and net realized gains (losses), as disclosed on the Statement of Operations, and net assets were not affected by this reclassification.
31
Columbia Liberty Fund
September 30, 2010
The tax character of distributions paid during the years ended September 30, 2010 and September 30, 2009 was as follows:
| | | | |
| | | September 30, 2010 | | September 30, 2009 |
| Distributions paid from: | | | | |
| Ordinary Income* | | $6,392,787 | | $8,283,253 |
| * | For tax purposes short-term capital gain distributions, if any, are considered ordinary income distributions. |
As of September 30, 2010, the components of distributable earnings on a tax basis were as follows:
| | | | |
| |
Undistributed
Ordinary Income | | Undistributed Long-Term Capital Gains | | Net Unrealized Appreciation* |
| $451,997 | | $— | | $36,202,114 |
| * | The differences between book-basis and tax-basis net unrealized depreciation are primarily due to deferral of losses from wash sales. |
Unrealized appreciation and depreciation at September 30, 2010, based on cost of investments for federal income tax purposes were:
| | | | |
| | | | |
Unrealized appreciation | | $ | 41,050,133 | |
Unrealized depreciation | | | (4,848,019 | ) |
| | | | |
Net unrealized appreciation | | $ | 36,202,114 | |
The following capital loss carryforward may be available to reduce taxable income arising from future net realized gains on investments, if any, to the extent permitted by the Internal Revenue Code:
| | | | |
| | | | |
| Year of Expiration | | Capital Loss Carryforward | |
| 2017 | | $ | 25,018,329 | |
| 2018 | | | 33,715,527 | |
| | | | |
| Total | | $ | 58,733,856 | |
Management is required to determine whether a tax position of the Fund is more likely than not to be sustained upon examination by the applicable taxing authority, including resolution of any related appeals or litigation processes, based on the technical merits of the position. The tax benefit to be recognized by the Fund is measured as the largest amount of benefit that is greater than fifty percent likely of being realized upon ultimate settlement. Management is not aware of any tax positions for which it is reasonably possible that the total amounts of unrecognized tax benefits will significantly change in the next twelve months. However, management’s conclusions may be subject to review and adjustment at a later date based on factors including, but not limited to, new tax laws, regulations, and administrative interpretations (including relevant court decisions). The Fund’s federal tax returns for the prior three fiscal years remain subject to examination by the Internal Revenue Service.
Note 4. Fees and Compensation Paid to Affiliates
Investment Advisory Fee
After the close of business on April 30, 2010, Ameriprise Financial, Inc. (“Ameriprise Financial”) acquired a portion of the asset management business of Columbia Management Group, LLC (the “Transaction”), including the business of managing the Fund. In connection with the closing of the Transaction (the “Closing”), RiverSource Investments, LLC, a wholly owned subsidiary of Ameriprise Financial, became the investment advisor of the Fund and subsequently changed its name to Columbia Management Investment Advisers, LLC (the “New Advisor”). The New Advisor receives a monthly investment advisory fee based on the Fund’s average daily net assets at the following annual rates:
| | | | |
| | | | |
| Average Daily Net Assets | | Annual Fee Rate | |
First $1 billion | | | 0.55 | % |
$1 billion to $1.5 billion | | | 0.50 | % |
Over $1.5 billion | | | 0.45 | % |
Prior to the Closing, Columbia Management Advisors, LLC (“Columbia”), an indirect, wholly owned subsidiary of Bank of America Corporation (“BOA”), provided investment advisory, administrative and other services to the Fund under the same fee structure.
For the year ended September 30, 2010, the Fund’s effective investment advisory fee rate was 0.55% of the Fund’s average daily net assets.
32
Columbia Liberty Fund
September 30, 2010
Sub-Advisory Fee
Nordea Investment Management North America, Inc. (“NIMNAI”) has been retained by the New Advisor to serve as the investment sub-advisor and to manage a portion of the Fund’s assets. As the sub-advisor, and subject to the oversight of the New Advisor and the Fund’s Board of Trustees, NIMNAI is responsible for daily investment operations, including placing all orders for the purchase and sale of portfolio securities for foreign stocks of the Fund. The New Advisor, from the investment advisory fee it receives, pays NIMNAI a monthly sub-advisory fee.
Prior to the Closing, NIMNAI provided sub-advisory services to the Fund under the same fee structure in accordance with an agreement with Columbia. Effective October 22, 2010, NIMNAI will no longer serve as the investment sub-advisor to the Fund.
Administration Fee
Effective upon the Closing, the New Advisor became the administrator of the Fund under a new Administrative Services Agreement (the “Administrative Agreement”). Under the Administrative Agreement, the New Advisor provides administrative and other services to the Fund, including services previously performed under the Pricing and Bookkeeping Oversight and Services Agreement discussed below. The New Advisor does not receive a fee for its services under the Administrative Agreement. Prior to the Closing, Columbia provided administrative services to the Fund as discussed in the Investment Advisory Fee note above.
Pricing and Bookkeeping Fees
Prior to the Closing, the Fund entered into a Financial Reporting Services Agreement (the “Financial Reporting Services Agreement”) with State Street Bank and Trust Company (“State Street”) and Columbia pursuant to which State Street provides financial reporting services to the Fund. The Fund also entered into an Accounting Services Agreement (collectively with the Financial Reporting Services Agreement, the “State Street Agreements”) with State Street and Columbia pursuant to which State Street provides accounting services to the Fund. Upon the Closing, Columbia assigned and delegated its rights and obligations under the State Street Agreements to the New Advisor. Under the State Street Agreements, the Fund pays State Street an annual fee of $38,000 paid monthly plus an additional monthly fee based on an annualized percentage rate of average daily net assets of the Fund for the month. The aggregate fee will not exceed $140,000 per year (exclusive of out-of-pocket expenses and charges). The Fund also reimburses State Street for certain out-of-pocket expenses and charges.
Also prior to the Closing, the Fund entered into a Pricing and Bookkeeping Oversight and Services Agreement (the “Services Agreement”) with Columbia. Under the Services Agreement, Columbia provided services related to Fund expenses and the requirements of the Sarbanes-Oxley Act of 2002, and provided oversight of the accounting and financial reporting services provided by State Street. Under the Services Agreement, the Fund reimbursed Columbia for out-of-pocket expenses and charges, including fees payable to third parties, such as for pricing the Fund’s portfolio securities, incurred by Columbia in the performance of services under the Services Agreement. These services are now provided under the Administrative Agreement discussed above.
Transfer Agent Fee
In connection with the Closing, RiverSource Service Corporation, a wholly owned subsidiary of Ameriprise Financial, became the transfer agent of the Fund and subsequently changed its name to Columbia Management Investment Services Corp. (the “New Transfer Agent”). The New Transfer Agent has contracted with Boston Financial Data Services (“BFDS”) to serve as sub-transfer agent. The New Transfer Agent receives monthly account-based service fees based on the number of open accounts and asset-based fees, calculated based on assets held in omnibus accounts, which are intended to reimburse the New Transfer Agent for certain sub-transfer agent fees (exclusive of BFDS fees). The New Transfer Agent pays the fees of BFDS for services as sub-transfer agent and is not entitled to reimbursement for such fees from the Fund.
The New Transfer Agent may also retain, as additional compensation for its services, fees for wire, telephone and redemption orders, Individual Retirement Account (“IRA”) trustee agent fees and account transcript fees due to the New Transfer Agent from shareholders of the Fund and credits (net of bank charges) earned with respect to balances in accounts the New Transfer Agent maintains in connection
33
Columbia Liberty Fund
September 30, 2010
with its services to the Fund. The New Transfer Agent also receives reimbursement for certain out-of-pocket expenses.
Prior to the Closing, Columbia Management Services, Inc. an affiliate of Columbia and an indirect, wholly owned subsidiary of BOA, provided shareholder services to the Fund and contracted with BFDS to serve as sub-transfer agent, under the same fee structure.
For the year ended September 30, 2010, the Fund’s effective transfer agent fee rate for each class was 0.17% of the Fund’s average daily net assets.
An annual minimum account balance fee of $20 may apply to certain accounts with a value below the Fund’s initial minimum investment requirements to reduce the impact of small accounts on transfer agent fees. These minimum account balance fees are recorded as part of expense reductions on the Statement of Operations. For the year ended September 30, 2010, no minimum account balance fees were charged by the Fund.
Underwriting Discounts, Service and Distribution Fees
In connection with the Closing, RiverSource Fund Distributors, Inc., an indirect wholly owned subsidiary of Ameriprise Financial, became the distributor of the Fund and subsequently changed its name to Columbia Management Investment Distributors, Inc. (the “New Distributor”).
For the year ended September 30, 2010, initial sales charges paid by shareholders on the purchase of Class A shares amounted to $8,849 and net CDSC fees paid by shareholders on certain redemptions of Class A, Class B and Class C shares amounted to $225, $7,789 and $527, respectively.
The Fund has adopted plans pursuant to Rule 12b-1 under the 1940 Act (the “Plans”) for Class A, Class B and Class C shares, which require the payment of a monthly service fee to the New Distributor. The annual service fee portion of the Plans may equal up to 0.15% net assets attributable to shares issued prior to April 1, 1989 and 0.25% on net assets attributable to shares issued thereafter. This arrangement results in a rate of service fee for all shares that is a blend between the 0.15% and 0.25% annual rates. For the year ended September 30, 2010, the Class A, Class B and Class C shares’ effective service fee rate was 0.24%.
The Plans also require the payment of a monthly distribution fee to the New Distributor at the annual rate of 0.75% of the average daily net assets attributable to Class B and Class C shares only.
The CDSC and the distribution fees received from the Plans are used principally as repayment to the New Distributor for amounts paid by the New Distributor to dealers who sold such shares.
Prior to the Closing, Columbia Management Distributors, Inc., an affiliate of Columbia and an indirect, wholly owned subsidiary of BOA, was the principal underwriter of the Fund’s shares. There were no changes to the underwriting discount structure of the Fund or the service or distribution fee rates paid by the Fund as a result of the Transaction.
Fee Waivers and Expense Reimbursements
Effective May 1, 2010, the New Advisor has voluntarily agreed to reimburse a portion of the Fund’s expenses so that the Fund’s ordinary operating expenses (excluding any distribution and service fees, brokerage commissions, interest, taxes and extraordinary expenses, but including custodian charges relating to overdrafts, if any), after giving effect to any balance credits from the Fund’s custodian, do not exceed 0.95% of the Fund’s average daily net assets on an annualized basis. This arrangement may be modified or terminated by the New Advisor at any time. Prior to May 1, 2010, Columbia voluntarily agreed to reimburse a portion of the Fund’s expenses so that the Fund’s ordinary operating expenses (excluding any distribution and service fees, brokerage commissions, interest, taxes and extraordinary expenses, but including custodian charges relating to overdrafts, if any) after giving effect to any balance credits from the Fund’s custodian, did not exceed 0.95% of the Fund’s average daily net assets on an annualized basis.
Fees Paid to Officers and Trustees
In connection with the Closing, all officers of the Fund are employees of the New Advisor or its affiliates and, with the exception of the Fund’s Chief Compliance Officer, receive no compensation from the Fund. The Board of Trustees has appointed a Chief Compliance Officer to the Fund in accordance with federal securities regulations. The Fund, along with other affiliated funds, pays its pro-rata share of the
34
Columbia Liberty Fund
September 30, 2010
expenses associated with the Chief Compliance Officer. The Fund’s expenses for the Chief Compliance Officer will not exceed $15,000 per year. Prior to the Closing, the Fund paid its pro-rata share of the expenses for the Chief Compliance Officer under the same fee structure.
Trustees are compensated for their services to the Fund, as set forth on the Statement of Operations. The Trust’s eligible Trustees may participate in a deferred compensation plan which may be terminated at any time. Obligations of the plan will be paid solely out of the Fund’s assets.
Other Related Party Transactions
Prior to the Closing, the Fund used one or more brokers that were affiliates of BOA in connection with the purchase and sale of its securities. Total brokerage commissions paid to affiliated brokers for the period prior to the Closing were $270.
Note 5. Custody Credits
The Fund has an agreement with its custodian bank under which custody fees may be reduced by balance credits. These credits are recorded as part of expense reductions on the Statement of Operations. The Fund could have invested a portion of the assets utilized in connection with the expense offset arrangement in an income-producing asset if it had not entered into such an agreement. For the year ended September 30, 2010, these custody credits reduced total expenses by $813 for the Fund.
Note 6. Objectives and Strategies for Investing in Derivative Instruments
The Fund uses derivatives instruments including futures contracts in order to meet its investment objectives. The Fund employs strategies in differing combinations to permit it to increase, decrease or change the level of exposure to market risk factors. The achievement of any strategy relating to derivatives depends on an analysis of various risk factors, and if the strategies for the use of derivatives do not work as intended, the Fund may not achieve its investment objectives.
In pursuit of its investment objectives, the Fund is exposed to the following market risks:
Equity risk: Equity risk relates to change in value of equity securities such as common stocks due to general market conditions such as real or perceived adverse economic conditions, changes in the general outlook for corporate earnings, or adverse investor sentiment. Equity securities generally have greater price volatility than fixed income securities.
Interest rate risk: Interest rate risk relates to the fluctuation in value of fixed income securities because of the inverse relationship of price and yield. Fixed income securities generally will decline in value upon an increase in general interest rates and their value generally will increase upon a decline in general interest rates. Fixed income securities with longer durations tend to be more sensitive to changes in interest rates, usually making them more volatile than securities with shorter durations.
The following provides more detailed information about the derivative type held by the Fund:
Futures Contracts — The Fund entered into U.S. Treasury Note futures contracts to manage the duration and yield curve exposure of the Fund versus the benchmark and equity index futures contracts to equitize cash in order to maintain appropriate equity market exposure while keeping sufficient cash to accommodate daily redemptions.
The use of futures contracts involves certain risks, which include, among these: (1) imperfect correlation between the price movement of the instruments and the underlying securities, (2) inability to close out positions due to differing trading hours, or the temporary absence of a liquid market, for either the instruments or the underlying securities, and (3) an inaccurate prediction of the future direction of interest rates by the Fund’s investment advisor. In addition, upon entering into index futures contracts, the Fund bears risks which may include securities prices moving unexpectedly, in which case, the Fund may not achieve the anticipated benefits of the futures contracts and may realize a loss.
Upon entering into a futures contract, the Fund identifies within its portfolio of investments cash or securities in an amount sufficient to meet the initial margin requirement. Subsequent payments are made or received by the Fund equal to the daily change in the contract value and are recorded as variation margin receivable or payable and offset in unrealized gains or losses. The Fund recognizes a realized gain or loss when the contract is closed or expires.
35
Columbia Liberty Fund
September 30, 2010
Futures contracts involve, to varying degrees, risk of loss in excess of the variation margin disclosed on the Statement of Assets and Liabilities.
During the year ended September 30, 2010, the Fund entered into 677 futures contracts.
The following table is a summary of the value of the Fund’s derivative instruments as of September 30, 2010.
| | | | | | |
| Fair Value of Derivative Instruments |
| Statement of Assets and Liabilities |
| Asset | | Fair Value | | Liability | | Fair Value |
| | | | Futures
variation
margin | | $26,664* |
| * | Includes only the current day’s variation margin. |
The effect of derivative instruments on the Fund’s Statement of Operations for the year ended September 30, 2010.
| | | | | | | | | | |
| | | | | | | | | |
| | | Amount of Realized Gain or (Loss) and
Change in Unrealized Appreciation or
(Depreciation) on Derivatives
Recognized in Income | |
| | | Risk
Exposure | | Net
Realized Gain
(Loss) | | | Change in Unrealized Appreciation (Depreciation) | |
| Futures Contracts | | Interest
Rate/Equity | | $ | 50,027 | | | $ | 124,685 | |
Note 7. Portfolio Information
For the year ended September 30, 2010, the cost of purchases and proceeds from sales of securities, excluding short-term obligations, for the Fund were $325,226,790 and $367,710,603, respectively, of which $79,440,241 and $80,721,005, respectively, were U.S. Government securities.
Note 8. Regulatory Settlements
During the year ended September 30, 2010, the Fund received payments totaling $20,589 relating to certain regulatory settlements with third parties that the Fund had participated in during the year. The payments have been included in “Increase from regulatory settlements” on the Statement of Changes in Net Assets.
Note 9. Line of Credit
The Fund and other affiliated funds participate in a $280,000,000 committed, unsecured revolving line of credit provided by State Street. The maximum amount that may be borrowed by any fund is limited to the lesser of $200,000,000 and the Fund’s borrowing limit set forth in the Fund’s registration statement. Borrowings are available for short-term liquidity or temporary or emergency purposes.
Effective October 15, 2009, interest is charged to each participating fund based on the fund’s borrowings at a rate per annum equal to the greater of the Federal Funds Rate plus 1.25% or the overnight LIBOR Rate plus 1.25%. In addition, a commitment fee of 0.15% per annum is accrued and apportioned among the participating funds pro rata based on their relative net assets.
Prior to October 15, 2009, interest was charged to each participating fund based on the fund’s borrowings at a rate per annum equal to the greater of the Federal Funds Rate plus 0.50% or the overnight LIBOR Rate plus 0.50%. In addition, an annual operations agency fee of $20,000, an amendment fee of 0.02% and a commitment fee of 0.12% per annum were accrued and apportioned among the participating funds pro rata based on their relative net assets.
For the year ended September 30, 2010, the Fund did not borrow under these arrangements.
Note 10. Shareholder Concentration
As of September 30, 2010, one shareholder account owned 15.3% of the outstanding shares of the Fund. Purchase and redemption activity of this account may have a significant effect on the operations of the Fund.
Note 11. Significant Risks and Contingencies
Foreign Securities Risk
There are certain additional risks involved when investing in foreign securities. These risks may involve foreign currency exchange rate fluctuations, adverse political and economic developments and the possible prevention of currency exchange or other foreign governmental laws or restrictions. In addition, the liquidity of foreign securities may be more limited than that of domestic securities.
36
Columbia Liberty Fund
September 30, 2010
Asset-Backed Securities Risk
The value of asset-backed securities may be affected by, among other factors, changes in interest rates, the market’s assessment of the quality of underlying assets, the creditworthiness of the servicer for the underlying assets, factors concerning the interests in and structure of the issuer or the originator of the underlying assets, or the creditworthiness or rating of the entities that provide any supporting letters of credit, surety bonds, derivative instruments, or other credit enhancement. The value of asset-backed securities also will be affected by the exhaustion, termination or expiration of any credit enhancement. Most asset-backed securities are subject to prepayment risk, which is the possibility that the underlying debt may be refinanced or prepaid prior to maturity during periods of declining or low interest rates, causing the Fund to have to reinvest the money received in securities that have lower yields. In addition, the impact of prepayments on the value of asset-backed securities may be difficult to predict and may result in greater volatility.
Mortgage-Backed Securities Risk
The value of mortgage-backed securities may be affected by, among other things, changes in interest rates, factors concerning the interests in and structure of the issuer or the originator of the mortgages, the creditworthiness of the entities that provide any supporting letters of credit, surety bonds or other credit enhancements or the quality of underlying assets or the market’s assessment thereof. Mortgage-backed securities are subject to prepayment risk, which is the possibility that the underlying mortgage may be refinanced or prepaid prior to maturity during periods of declining or low interest rates, causing the Fund to have to reinvest the money received in securities that have lower yields. In addition, the impact of prepayments on the value of mortgage-backed securities may be difficult to predict and may result in greater volatility.
Information Regarding Pending and Settled Legal Proceedings
In June 2004, an action captioned John E. Gallus et al. v. American Express Financial Corp. and American Express Financial Advisors Inc. was filed in the United States District Court for the District of Arizona. The plaintiffs allege that they are investors in several American Express Company (now known as legacy RiverSource) mutual funds and they purport to bring the action derivatively on behalf of those funds under the Investment Company Act of 1940. The plaintiffs allege that fees allegedly paid to the defendants by the funds for investment advisory and administrative services are excessive. The plaintiffs seek remedies including restitution and rescission of investment advisory and distribution agreements. The plaintiffs voluntarily agreed to transfer this case to the United States District Court for the District of Minnesota (the District Court). In response to defendants’ motion to dismiss the complaint, the District Court dismissed one of plaintiffs’ four claims and granted plaintiffs limited discovery. Defendants moved for summary judgment in April 2007. Summary judgment was granted in the defendants’ favor on July 9, 2007. The plaintiffs filed a notice of appeal with the Eighth Circuit Court of Appeals (the Eighth Circuit) on August 8, 2007. On April 8, 2009, the Eighth Circuit reversed summary judgment and remanded to the District Court for further proceedings. On August 6, 2009, defendants filed a writ of certiorari with the U.S. Supreme Court (the Supreme Court), asking the Supreme Court to stay the District Court proceedings while the Supreme Court considers and rules in a case captioned Jones v. Harris Associates, which involves issues of law similar to those presented in the Gallus case. On March 30, 2010, the Supreme Court issued its ruling in Jones v. Harris Associates, and on April 5, 2010, the Supreme Court vacated the Eighth Circuit’s decision in the Gallus case and remanded the case to the Eighth Circuit for further consideration in light of the Supreme Court’s decision in Jones v. Harris Associates. On June 4, 2010, the Eighth Circuit remanded the Gallus case to the District Court for further consideration in light of the Supreme Court’s decision in Jones v. Harris Associates.
In December 2005, without admitting or denying the allegations, American Express Financial Corporation (AEFC, which is now known as Ameriprise Financial, Inc. (Ameriprise Financial)), entered into settlement agreements with the Securities and Exchange Commission (SEC) and Minnesota Department of Commerce (MDOC) related to market timing activities. As a result, AEFC was censured and ordered to cease and desist from committing or causing any violations of certain provisions of the Investment Advisers Act of 1940, the Investment Company Act of 1940, and various Minnesota laws. AEFC agreed to pay disgorgement of $10 million and civil money penalties of $7 million. AEFC also agreed to retain
37
Columbia Liberty Fund
September 30, 2010
an independent distribution consultant to assist in developing a plan for distribution of all disgorgement and civil penalties ordered by the SEC in accordance with various undertakings detailed at http://www.sec.gov/litigation/admin/ia-2451.pdf. Ameriprise Financial and its affiliates have cooperated with the SEC and the MDOC in these legal proceedings, and have made regular reports to the funds’ Boards of Directors/Trustees.
Ameriprise Financial and certain of its affiliates have historically been involved in a number of legal, arbitration and regulatory proceedings, including routine litigation, class actions, and governmental actions, concerning matters arising in connection with the conduct of their business activities. Ameriprise Financial believes that the Funds are not currently the subject of, and that neither Ameriprise Financial nor any of its affiliates are the subject of, any pending legal, arbitration or regulatory proceedings that are likely to have a material adverse effect on the Funds or the ability of Ameriprise Financial or its affiliates to perform under their contracts with the Funds. Ameriprise Financial is required to make 10-Q, 10-K and, as necessary, 8-K filings with the Securities and Exchange Commission on legal and regulatory matters that relate to Ameriprise Financial and its affiliates. Copies of these filings may be obtained by accessing the SEC website at www.sec.gov.
There can be no assurance that these matters, or the adverse publicity associated with them, will not result in increased fund redemptions, reduced sale of fund shares or other adverse consequences to the Funds. Further, although we believe proceedings are not likely to have a material adverse effect on the Funds or the ability of Ameriprise Financial or its affiliates to perform under their contracts with the Funds, these proceedings are subject to uncertainties and, as such, we are unable to estimate the possible loss or range of loss that may result. An adverse outcome in one or more of these proceedings could result in adverse judgments, settlements, fines, penalties or other relief that could have a material adverse effect on the consolidated financial condition or results of operations of Ameriprise Financial.
Note 12. Subsequent Events
The Board of Trustees has approved a proposal to merge the Fund into Columbia LifeGoal Balanced Growth Portfolio. Shareholders of the Fund will vote on the proposed merger at a Special Meeting of Shareholders scheduled to be held during the first half of 2011.
Effective October 22, 2010, the Fund transitioned to a fund-of-fund structure, which means the Fund will seek to achieve its objective by investing primarily in shares of mutual funds managed by the New Advisor or its affiliates (Columbia Funds). The Fund may also invest in exchange- traded funds and third party-advised funds, equity and fixed income securities, including Treasury inflation protected securities, and other instruments such as derivatives.
Effective October 22, 2010, the New Advisor has contractually agreed to waive a portion of its advisory fee through January 31, 2012 so that the effective advisory fee rate will be a blend of (i) 0.00% on assets invested in other Columbia Funds, exchange-traded funds or third party mutual funds, and (ii) 0.55% on other assets.
In addition, effective October 22, 2010, the New Advisor has contractually agreed to reimburse a portion of the Fund’s expenses, through January 31, 2012, so that the Fund’s ordinary operating expenses (excluding any brokerage commissions, interest, taxes, extraordinary expenses, acquired fund fees and expenses and certain advisory fees, but including custodian charges relating to overdrafts, if any), after giving effect to any balance credits from the Fund’s custodian, do not exceed the annual rates of 0.51%, 1.26%, 1.26% and 0.27% of the Fund’s average daily net assets attributable to Class A, Class B, Class C and Class Z shares, respectively.
Effective October 14, 2010, the line of credit disclosed in Note 9 was extended. Interest on the $280,000,000 committed, unsecured revolving line of credit provided by State Street will continue to be charged at a rate per annum equal to the greater of the Federal Funds Rate plus 1.25% or the overnight LIBOR Rate plus 1.25%. The commitment fee has been decreased from 0.15% per annum to 0.125% per annum and will continue to be accrued and apportioned among the participating funds pro rata based on their relative net assets.
38
Report of Independent Registered Public Accounting Firm
To the Trustees of Columbia Funds Series Trust I and Shareholders of Columbia Liberty Fund
In our opinion, the accompanying statement of assets and liabilities, including the investment portfolio, and the related statements of operations and of changes in net assets and the financial highlights present fairly, in all material respects, the financial position of Columbia Liberty Fund (the “Fund”) (a series of Columbia Funds Series Trust I) at September 30, 2010, the results of its operations for the year then ended, the changes in its net assets for each of the two years in the period then ended, and the financial highlights for each of the five years in the period then ended, in conformity with accounting principles generally accepted in the United States of America. These financial statements and financial highlights (hereafter referred to as “financial statements”) are the responsibility of the Fund’s management. Our responsibility is to express an opinion on these financial statements based on our audits. We conducted our audits of these financial statements in accordance with the standards of the Public Company Accounting Oversight Board (United States). Those standards require that we plan and perform the audit to obtain reasonable assurance about whether the financial statements are free of material misstatement. An audit includes examining, on a test basis, evidence supporting the amounts and disclosures in the financial statements, assessing the accounting principles used and significant estimates made by management, and evaluating the overall financial statement presentation. We believe that our audits, which included confirmation of securities at September 30, 2010 by correspondence with the custodian and brokers, provide a reasonable basis for our opinion.
PricewaterhouseCoopers LLP
Boston, Massachusetts
November 19, 2010
39
Federal Income Tax Information (Unaudited) – Columbia Liberty Fund
For non-corporate shareholders, 54.57%, or the maximum amount allowable under the Jobs and Growth Tax Relief Reconciliation Act of 2003, of the ordinary income distributed by the Fund for the fiscal year ended September 30, 2010 may represent qualified dividend income.
43.37% of the ordinary income distributed by the Fund for the fiscal year ended September 30, 2010 qualifies for the corporate dividends received deduction.
The Fund will notify shareholders in January 2011, of the amounts used in preparing 2010 income tax return.
40
Fund Governance
The Trustees serve terms of indefinite duration. The names, addresses and birth years of the Trustees and Officers of the Funds in the Columbia Funds Series Trust I, the year each was first elected or appointed to office, their principal business occupations during at least the last five years, the number of Funds overseen by each Trustee and other directorships they hold are shown below. Each officer listed below serves as an officer of each Fund in the Columbia Funds Complex.
Independent Trustees
| | |
Name, Address and Year of Birth,
Position with Funds, Year First
Elected or Appointed to Office | | Principal Occupation(s) During Past Five Years, Number of Funds in Columbia Funds
Complex Overseen by Trustee, Other Directorships Held |
| |
| John D. Collins (born 1938) | | |
c/o Columbia Management Investment Advisers, LLC One Financial Center Boston, MA 02111 Trustee (since 2005) | | Retired. Consultant, KPMG, LLP (accounting and tax firm) from July 1999 to June 2000; Partner, KPMG, LLP from March 1962 to June 1999. Oversees 64; Mrs. Fields Original Cookies, Inc. (consumer products); Suburban Propane Partners, L.P.; and Montpelier Re (insurance underwriting firm) |
| |
| Rodman L. Drake (born 1943) | | |
c/o Columbia Management Investment Advisers, LLC One Financial Center Boston, MA 02111 Trustee (since 1994) and Chairman of the Board (since 2009) | | Co-Founder of Baringo Capital LLC (private equity) since 2002; CEO of Crystal River Capital, Inc. (real estate investment trust) since 2003; President, Continuation Investments Group, Inc. from 1997 to 2001. Oversees 64; Jackson Hewitt Tax Service Inc. (tax preparation services); Crystal Capital River Inc. (real estate investment trust); Student Loan Corporation (student loan provider); Celgene Corporation (global biotechnology company); The Helios Funds (exchange-traded funds); and Apex Silver Mines Ltd. from 2007 to 2009 |
| |
| Douglas A. Hacker (born 1955) | | |
c/o Columbia Management Investment Advisers, LLC One Financial Center Boston, MA 02111 Trustee (since 1996) | | Independent business executive since May 2006; Executive Vice President–Strategy of United Airlines (airline) from December 2002 to May 2006; President of UAL Loyalty Services (airline marketing company) from September 2001 to December 2002; Executive Vice President and Chief Financial Officer of United Airlines from July 1999 to September 2001. Oversees 64; Nash Finch Company (food distributor); Aircastle Limited (aircraft leasing) |
|
| Janet Langford Kelly (born 1957) |
c/o Columbia Management Investment Advisers, LLC One Financial Center Boston, MA 02111 Trustee (since 1996) | | Senior Vice President, General Counsel and Corporate Secretary, ConocoPhillips (integrated energy company) since September 2007; Deputy General Counsel–Corporate Legal Services, ConocoPhillips from August 2006 to August 2007; Partner, Zelle, Hofmann, Voelbel, Mason & Gette LLP (law firm) from March 2005 to July 2006; Adjunct Professor of Law, Northwestern University, from September 2004 to June 2006; Director, UAL Corporation (airline) from February 2006 to July 2006; Oversees 64; None |
| |
| Charles R. Nelson (born 1942) | | |
c/o Columbia Management Investment Advisers, LLC One Financial Center Boston, MA 02111 Trustee (since 1981) | | Professor of Economics, University of Washington, since January 1976; Ford and Louisa Van Voorhis Professor of Political Economy, University of Washington, since September 1993; Adjunct Professor of Statistics, University of Washington, since September 1980; Associate Editor, Journal of Money Credit and Banking, 1993-2008 Consultant on econometric and statistical matters. Oversees 64; None |
41
Fund Governance (continued)
Independent Trustees (continued)
| | |
Name, Address and Year of Birth,
Position with Funds, Year First
Elected or Appointed to Office | | Principal Occupation(s) During Past Five Years, Number of Funds in Columbia Funds
Complex Overseen by Trustee, Other Directorships Held |
| |
| John J. Neuhauser (born 1943) | | |
c/o Columbia Management Investment Advisers, LLC One Financial Center Boston, MA 02111 Trustee (since 1984) | | President, Saint Michael’s College, since August 2007; Director or Trustee of several non-profit organization, including Fletcher Allen Health Care, Inc.; University Professor, Boston College from November 2005 to August 2007; Academic Vice President and Dean of Faculties, Boston College from August 1999 to October 2005. Oversees 64; Liberty All-Star Equity Fund and Liberty All-Star Growth Fund, Inc. (closed-end funds) |
| |
| Jonathan Piel (born 1938) | | |
c/o Columbia Management Investment Advisers, LLC One Financial Center Boston, MA 02111 Trustee (since 1994) | | Cable television producer and website designer; The Editor, Scientific American from 1984 to 1994; Vice President, Scientific American, Inc., from 1984 to 1994; Member, Advisory Board, Stone Age Institute, Bloomington, Indiana (research institute that explores the effect of technology on human evolution); Member, Board of Directors of the National Institute of Social Sciences, New York City; Member, Board of Trustees of the William Alanson White Institute, New York City (institution for training psychoanalysts); and Member, Advisory Board, Mount Sinai Children’s Environmental Health Center, New York. Oversees 64; None |
| |
| Patrick J. Simpson (born 1944) | | |
c/o Columbia Management Investment Advisers, LLC One Financial Center Boston, MA 02111 Trustee (since 2000) | | Partner, Perkins Coie LLP (law firm). Oversees 64; None |
| |
| Anne-Lee Verville (born 1945) | | |
c/o Columbia Management Investment Advisers, LLC One Financial Center Boston, MA 02111 Trustee (since 1998) | | Retired since 1997 (formerly General Manager–Global Education Industry from 1994 to 1997, President–Application Systems Division from 1991 to 1994, Chief Financial Officer–US Marketing & Services from 1988 to 1991, and Chief Information Officer from 1987 to 1988, IBM Corporation (computer and technology)). Oversees 64; Enesco Group, Inc. (producer of giftware and home and garden decor products) from 2001 to 2006 |
42
Fund Governance (continued)
Interested Trustee
| | |
Name, Address and Year of Birth,
Position with Funds, Year First
Elected or Appointed to Office | | Principal Occupation(s) During Past Five Years, Number of Funds in Columbia Funds
Complex Overseen by Trustee, Other Directorships Held |
| |
| William E. Mayer1 (born 1940) | | |
c/o Columbia Management Investment Advisers, LLC One Financial Center Boston, MA 02111 Trustee (since 1994) | | Partner, Park Avenue Equity Partners (private equity) since February 1999; Dean and Professor, College of Business and Management, University of Maryland from 1992 to 1996. Oversees 64; DynaVox Inc. (software developer); Lee Enterprises (print media), WR Hambrecht + Co. (financial service provider); BlackRock Kelso Capital Corporation (investment company) |
| 1 | Mr. Mayer may technically be an “interested person” (as defined in the Investment Company Act of 1940) by reason of his affiliation with WR Hambrecht + Co., a registered broker/dealer that may execute portfolio transactions for, engage in principal transactions with or distribute shares of a Fund or other funds or accounts advised/managed by the Advisor or any sub-advisor to a Fund. |
The Statement of Additional Information includes additional information about the Trustees of the Funds and is available, without charge, upon request by calling 1-800-345-6611.
43
Fund Governance (continued)
Officers
| | |
| Name, Year of Birth and Address | | Principal Occupation(s) During the Past Five Years |
|
| J. Kevin Connaughton (born 1964) |
One Financial Center Boston, MA 02111 President (since 2009) | | Senior Vice President and General Manager–Mutual Fund Products, Columbia Management Investment Advisers, LLC since May 2010; President, Columbia Funds, since 2009, and RiverSource Funds, since May 2010 (previously Senior Vice President and Chief Financial Officer, Columbia Funds, from June 2008 to January 2009, Treasurer, Columbia Funds, from October 2003 to May 2008, and senior officer of various other affiliated funds since 2000); Managing Director, Columbia Management Advisors, LLC from December 2004 to April 2010. |
| |
| Michael G. Clarke (born 1969) | | |
One Financial Center Boston, MA 02111 Senior Vice President and Chief Financial Officer (since 2009) | | Vice President, Columbia Management Investment Advisers, LLC since May 2010; Managing Director of Fund Administration, Columbia Management Advisors, LLC, from September 2004 to April 2010; senior officer of Columbia Funds and affiliated funds since 2002. |
| |
| Scott R. Plummer (born 1959) | | |
5228 Ameriprise Financial Center Minneapolis, MN 55474 Senior Vice President, Secretary and Chief Legal Officer (since 2010) | | Chief Legal Officer and Assistant Secretary, Columbia Management Investment Advisers, LLC since June 2005; Vice President and Lead Chief Counsel–Asset Management, Ameriprise Financial, Inc. since May 2010 (previously Vice President and Chief Counsel–Asset Management, from 2005 to April 2010, and Vice President–Asset Management Compliance from 2004 to 2005); Vice President, Chief Counsel and Assistant Secretary, Columbia Management Investment Distributors, Inc. since 2008; Vice President, General Counsel and Secretary, Ameriprise Certificate Company since 2005; Chief Counsel, RiverSource Distributors, Inc. since 2006; Vice President, General Counsel and Secretary, RiverSource Funds, since December 2006; Senior Vice President, Secretary and Chief Legal Officer, Columbia Funds, since May 2010. |
| |
| Linda J. Wondrack (born 1964) | | |
One Financial Center Boston, MA 02111 Senior Vice President and Chief Compliance Officer (since 2007) | | Vice President and Chief Compliance Officer, Columbia Management Investment Advisers, LLC since May 2010; Chief Compliance Officer, Columbia Funds, since 2007, and RiverSource Funds, since May 2010; Director (Columbia Management Group, LLC and Investment Product Group Compliance), Bank of America, from June 2005 to April 2010; Director of Corporate Compliance and Conflicts Officer of MFS Investment Management (investment management) from August 2004 to May 2005. |
| |
| William F. Truscott (born 1960) | | |
53600 Ameriprise Financial Center Minneapolis, MN 55474 Senior Vice President (since 2010) | | Chairman of the Board, Columbia Management Investment Advisers, LLC since May 2010 (previously President, Chairman of the Board and Chief Investment Officer, from 2001 to April 2010); Chief Executive Officer, U.S. Asset Management & President, Annuities, Ameriprise Financial, Inc. since May 2010 (previously President–U.S. Asset Management and Chief Investment Officer from 2005 to April 2010, and Senior Vice President–Chief Investment Officer, from 2001 to 2005); Director, President and Chief Executive Officer, Ameriprise Certificate Company since 2006; Director, Columbia Management Investment Distributors, Inc. since May 2010 (previously Chairman of the Board and Chief Executive Officer from 2008 to April 2010); Chairman of the Board and Chief Executive Officer, RiverSource Distributors, Inc. since 2006. |
44
Fund Governance (continued)
Officers (continued)
| | |
| Name, Year of Birth and Address | | Principal Occupation(s) During the Past Five Years |
|
| Colin Moore (born 1958) |
One Financial Center Boston, MA 02111 Senior Vice President (since 2010) | | Director and Chief Investment Officer, Columbia Management Investment Advisers, LLC since May 2010; Manager, Managing Director and Chief Investment Officer of Columbia Management Advisors, LLC from 2007 to April 2010; Head of Equities, Columbia Management Advisors, LLC from 2002 to 2007. |
| |
| Michael A. Jones (born 1959) | | |
100 Federal Street Boston, MA 02110 Senior Vice President (since 2010) | | Director and President, Columbia Management Investment Advisers, LLC since May 2010; President and Director, Columbia Management Investment Distributors, Inc. since May 2010; Manager, Chairman, Chief Executive Officer and President, Columbia Management Advisors, LLC from 2007 to April 2010; Chief Executive Officer, President and Director, Columbia Management Distributors, Inc. from November 2006 to April 2010; previously, co-president and senior managing director at Robeco Investment Management. |
| |
| Amy Johnson (born 1965) | | |
5228 Ameriprise Financial Center Minneapolis, MN 55474 Senior Vice President (since 2010) | | Senior Vice President and Chief Operating Officer, Columbia Management Investment Advisers, LLC since May 2010 (previously Chief Administrative Officer, from 2009 until April 2010, Vice President–Asset Management and Trust Company Services, from 2006 to 2009, and Vice President–Operations and Compliance from 2004 to 2006). |
| |
| Joseph F. DiMaria (born 1968) | | |
One Financial Center Boston, MA 02111 Treasurer (since 2009) and Chief Accounting Officer (since 2008) | | Vice President, Mutual Fund Administration, Columbia Management Investment Advisers, LLC, since May 2010; Director of Fund Administration, Columbia Management Advisors, LLC from January 2006 to April 2010; Head of Tax/Compliance and Assistant Treasurer, Columbia Management Advisors, LLC, from November 2004 to December 2005. |
| |
| Marybeth Pilat (born 1968) | | |
One Financial Center Boston, MA 02111 Deputy Treasurer (since 2010) | | Vice President, Mutual Fund Administration, Columbia Management Investment Advisers, LLC, since May 2010; Vice President, Investment Operations, Bank of America, from October 2008 to April 2010; Finance Manager, Boston Children’s Hospital from August 2008 to October 2008; Director, Mutual Fund Administration, Columbia Management Advisors, LLC, from May 2007 to July 2008; Vice President, Mutual Fund Valuation, Columbia Management Advisors, LLC, from January 2006 to May 2007; Vice President, Mutual Fund Accounting Oversight, Columbia Management Advisors, LLC from January 2005 to January 2006. |
| |
| Julian Quero (born 1967) | | |
One Financial Center Boston, MA 02111 Deputy Treasurer (since 2008) | | Vice President, Mutual Fund Administration, Columbia Management Investment Advisers, LLC since May 2010; Director of Fund Administration, Columbia Management Advisors, LLC, from August 2008 to April 2010; Senior Tax Manager, Columbia Management Advisors, LLC from August 2006 to July 2008; Senior Compliance Manager, Columbia Management Advisors, LLC from April 2002 to August 2006. |
| |
| Stephen T. Welsh (born 1957) | | |
One Financial Center Boston, MA 02111 Vice President (since 2006) | | President and Director, Columbia Management Investment Services Corp. since May 2010; President and Director, Columbia Management Services, Inc. from July 2004 to April 2010; Managing Director, Columbia Management Distributors, Inc. from August 2007 to April 2010. |
45
[THIS PAGE INTENTIONALLY LEFT BLANK]
46
[THIS PAGE INTENTIONALLY LEFT BLANK]
47
[THIS PAGE INTENTIONALLY LEFT BLANK]
48
Important Information About This Report
The fund mails one shareholder report to each shareholder address. If you would like more than one report, please call shareholder services at 1-800-345-6611 and additional reports will be sent to you. This report has been prepared for shareholders of Columbia Liberty Fund.
A description of the policies and procedures that the fund uses to determine how to vote proxies and a copy of the fund’s voting records are available (i) at www.columbiamanagement.com, (ii) on the Securities and Exchange Commission’s website at www.sec.gov, and (iii) without charge, upon request, by calling 1-800-368-0346. Information regarding how the fund voted proxies relating to portfolio securities during the 12-month period ended June 30 is available from the SEC’s website. Information regarding how the fund voted proxies relating to portfolio securities is also available from the fund’s website, www.columbiamanagement.com.
The fund files a complete schedule of portfolio holdings with the SEC for the first and third quarters of each fiscal year on Form N-Q. The fund’s Form N-Q is available on the SEC’s website at www.sec.gov and may be reviewed and copied at the SEC’s Public Reference Room in Washington, D.C. Information on the operation of the Public Reference Room may be obtained by calling
1-800-SEC-0330.
Transfer Agent
Columbia Management Investment Services Corp.
P.O. Box 8081
Boston, MA 02266-8081
1-800-345-6611
Distributor
Columbia Management Investment
Distributors, Inc.
One Financial Center
Boston, MA 02111
Investment Advisor
Columbia Management Investment Advisers, LLC
100 Federal Street
Boston, MA 02110
49

Columbia Liberty Fund
P.O. Box 8081
Boston, MA 02266-8081
columbiamanagement.com
This information is for use with concurrent or prior delivery of a fund prospectus. Investors should consider the investment objectives, risks, charges and expenses of a mutual fund carefully before investing. For a free prospectus, which contains this and other important information about the funds, visit columbiamanagement.com. Read the prospectus carefully before investing. The Fund is distributed by Columbia Management Investment Distributors, Inc., member FINRA, and managed by Columbia Management Investment Advisers, LLC.
©2010 Columbia Management Investment Advisers, LLC. All rights reserved.
C-1396 A (11/10)
Item 2. Code of Ethics.
(a) The registrant has adopted a code of ethics that applies to the registrant’s principal executive officer, principal financial officer, principal accounting officer or controller, or persons performing similar functions, regardless of whether these individuals are employed by the registrant or a third party.
(b) During the period covered by this report, there were not any amendments to a provision of the code of ethics adopted in 2(a) above.
(c) During the period covered by this report, there were no waivers, including any implicit waivers, from a provision of the code of ethics described in 2(a) above that relates to one or more of the items set forth in paragraph (b) of this item’s instructions.
Item 3. Audit Committee Financial Expert.
The registrant’s Board of Trustees has determined that John D. Collins, Douglas A. Hacker, Charles R. Nelson and Anne-Lee Verville, each of whom are members of the registrant’s Board of Trustees and Audit Committee, each qualify as an audit committee financial expert. Mr. Collins, Mr. Hacker, Mr. Nelson and Ms. Verville are each independent trustees, as defined in paragraph (a)(2) of this item’s instructions.
Item 4. Principal Accountant Fees and Services.
Fee information below is disclosed for the seven series of the registrant whose reports to stockholders is included in this annual filing.
(a) Audit Fees. Aggregate Audit Fees billed by the principal accountant for professional services rendered during the fiscal years ended September 30, 2010 and September 30, 2009 are approximately as follows:
2010 | | 2009 | |
$ | 238,500 | | $ | 241,000 | |
| | | | | |
Audit Fees include amounts related to the audit of the registrant’s annual financial statements or services that are normally provided by the accountant in connection with statutory and regulatory filings or engagements for those fiscal years. Audit fees in fiscal
year 2009 also include fees for the review of and provision of consent in connection with filing Form N-1A for a new share class.
(b) Audit-Related Fees. Aggregate Audit-Related Fees billed to the registrant by the principal accountant for professional services rendered during the fiscal years ended September 30, 2010 and September 30, 2009 are approximately as follows:
2010 | | 2009 | |
$ | 32,200 | | $ | 32,200 | |
| | | | | |
Audit-Related Fees include amounts for assurance and related services by the principal accountant that are reasonably related to the performance of the audit of the registrant’s financial statements and are not reported in Audit Fees above. In both fiscal years 2010 and 2009, Audit-Related Fees consist of agreed-upon procedures performed for semi-annual shareholder reports.
During the fiscal years ended September 30, 2010 and September 30, 2009, there were no Audit-Related Fees billed by the registrant’s principal accountant to the registrant’s investment adviser (not including any sub-adviser whose role is primarily portfolio management and is subcontracted with or overseen by another investment adviser) and any entity controlling, controlled by, or under common control with the adviser that provides ongoing services to the registrant for an engagement that related directly to the operations and financial reporting of the registrant.
(c) Tax Fees. Aggregate Tax Fees billed by the principal accountant to the registrant for professional services rendered during the fiscal years ended September 30, 2010 and September 30, 2009 are approximately as follows:
2010 | | 2009 | |
$ | 37,300 | | $ | 27,700 | |
| | | | | |
Tax Fees include amounts for the review of annual tax returns, the review of required shareholder distribution calculations and typically include amounts for professional services by the principal accountant for tax compliance, tax advice and tax planning. Fiscal year 2010 also includes tax fees for assistance with foreign tax filings.
During the fiscal years ended September 30, 2010 and September 30, 2009, there were no Tax Fees billed by the registrant’s principal accountant to the registrant’s investment adviser (not including any sub-adviser whose role is primarily portfolio management and is subcontracted with or overseen by another investment adviser) and any entity controlling, controlled by, or under common control with the adviser that provides ongoing services to the registrant for an engagement that related directly to the operations and financial reporting of the registrant.
(d) All Other Fees. Aggregate All Other Fees billed by the principal accountant to the registrant for professional services rendered during the fiscal years ended September 30, 2010 and September 30, 2009 are approximately as follows:
All Other Fees include amounts for products and services provided by the principal accountant, other than the services reported in paragraphs (a) through (c) above.
Aggregate All Other Fees billed by the registrant’s principal accountant to the registrant’s investment adviser (not including any sub-adviser whose role is primarily portfolio management and is subcontracted with or overseen by another investment adviser) and any entity controlling, controlled by, or under common control with the adviser that provides ongoing services to the registrant for an engagement that related directly to the operations and financial reporting of the registrant during the fiscal years ended September 30, 2010 and September 30, 2009 are approximately as follows:
2010 | | 2009 | |
$ | 999,300 | | $ | 891,900 | |
| | | | | |
In both fiscal years 2010 and 2009, All Other Fees consist of fees billed for internal control examinations of the registrant’s transfer agent and investment advisor. Fiscal year 2010 also includes fees for agreed upon procedures related to the sale of the long-term asset management business and fees related to the review of revenue modeling schedules.
(e)(1) Audit Committee Pre-Approval Policies and Procedures
The registrant’s Audit Committee is required to pre-approve the engagement of the registrant’s independent accountants to provide audit and non-audit services to the registrant and non-audit services to its investment adviser (not including any sub-adviser whose role is primarily portfolio management and is subcontracted with or overseen by another investment adviser) or any entity controlling, controlled by or under common control with such investment adviser that provides ongoing services to the registrant (“Adviser Affiliates”), if the engagement relates directly to the operations and financial reporting of the registrant.
The Audit Committee has adopted a Policy for Engagement of Independent Accountants for Audit and Non-Audit Services (“Policy”). The Policy sets forth the understanding of the Audit Committee regarding the engagement of the registrant’s independent accountants to provide (i) audit and permissible audit-related, tax and other services to the registrant (collectively “Fund Services”); (ii) non-audit services to the registrant’s investment adviser (not including any sub-adviser whose role is primarily portfolio management and is subcontracted with or overseen by another investment adviser) and Adviser Affiliates, if the engagement relates directly to the operations or
financial reporting of a Fund (collectively “Fund-related Adviser Services”); and (iii) certain other audit and non-audit services to the registrant’s investment adviser (not including any sub-adviser whose role is primarily portfolio management and is subcontracted with or overseen by another investment adviser) and Adviser Affiliates. Unless a type of service receives general pre-approval under the Policy, it requires specific pre-approval by the Audit Committee if it is to be provided by the independent accountants. Pre-approval of non-audit services to the registrant, the registrant’s investment adviser (not including any sub-adviser whose role is primarily portfolio management and is subcontracted with or overseen by another investment adviser) and Adviser Affiliates may be waived provided that the “de minimis” requirements set forth under paragraph (c)(7)(i)(C) of Rule 2-01 of Regulation S-X are met.
Under the Policy, the Audit Committee may delegate pre-approval authority to any pre-designated member or members who are Independent Trustees/Directors. The member(s) to whom such authority is delegated must report, for informational purposes only, any pre-approval decisions to the Audit Committee at its next regular meeting. The Audit Committee’s responsibilities with respect to the pre-approval of services performed by the independent accountants may not be delegated to management.
The Policy requires the Fund Treasurer and/or Director of Board Administration to submit to the Audit Committee, on an annual basis, a schedule of the types of services that are subject to general pre-approval. The schedule(s) provide a description of each type of service that is subject to general pre-approval and, where possible, will provide estimated fee caps for each instance of providing each service. The Audit Committees will review and approve the types of services and review the projected fees for the next fiscal year and may add to, or subtract from, the list of general pre-approved services from time to time based on subsequent determinations. That approval acknowledges that the Audit Committee is in agreement with the specific types of services that the independent accountants will be permitted to perform.
The Fund Treasurer and/or Director of Board Administration shall report to the Audit Committee at each of its regular meetings regarding all Fund Services or Fund-related Adviser Services initiated since the last such report was rendered, including a general description of the services, actual billed and projected fees, and the means by which such Fund Services or Fund-related Adviser Services were pre-approved by the Audit Committee.
*****
(e)(2) The percentage of services described in paragraphs (b) through (d) of this Item approved pursuant to the “de minimis” exception under paragraph (c)(7)(i)(C) of Rule 2-01 of Regulation S-X during both fiscal years ended September 30, 2010 and September 30, 2009 was zero.
(f) Not applicable.
(g) The aggregate non-audit fees billed by the registrant’s accountant for services rendered to the registrant, and rendered to the registrant’s investment adviser (not including any sub-adviser whose role is primarily portfolio management and is subcontracted with or overseen by another investment adviser), and any entity controlling, controlled by, or under common control with the adviser that provides ongoing services to the registrant for the fiscal years ended September 30, 2010 and September 30, 2009 are approximately as follows:
2010 | | 2009 | |
$ | 1,068,800 | | $ | 951,800 | |
| | | | | |
(h) The registrant’s Audit Committee of the Board of Directors has considered whether the provision of non-audit services that were rendered to the registrant’s adviser (not including any sub-adviser whose role is primarily portfolio management and is subcontracted with or overseen by another investment adviser), and any entity controlling, controlled by, or under common control with the investment adviser that provides ongoing services to the registrant that were not pre-approved pursuant to paragraph (c)(7)(ii) of Rule 2-01 of Regulation S-X, is compatible with maintaining the principal accountant’s independence.
Item 5. Audit Committee of Listed Registrants.
Not applicable.
Item 6. Investments
(a) The registrant’s “Schedule I — Investments in securities of unaffiliated issuers” (as set forth in 17 CFR 210.12-12) is included in Item 1 of this Form N-CSR.
(b) Not applicable.
Item 7. Disclosure of Proxy Voting Policies and Procedures for Closed-End Management Investment Companies.
Not applicable.
Item 8. Portfolio Managers of Closed-End Management Investment Companies.
Not applicable.
Item 9. Purchases of Equity Securities by Closed-End Management Investment Company and Affiliated Purchasers.
Not applicable.
Item 10. Submission of Matters to a Vote of Security Holders.
There were no material changes to the procedures by which shareholders may recommend nominees to the registrant’s board of directors.
Item 11. Controls and Procedures.
(a) The registrant’s principal executive officer and principal financial officers, based on their evaluation of the registrant’s disclosure controls and procedures as of a date within 90 days of the filing of this report, have concluded that such controls and procedures are adequately designed to ensure that material information required to be disclosed by the registrant in Form N-CSR is accumulated and communicated to the registrant’s management, including the principal executive officer and principal financial officer, or persons performing similar functions, as appropriate to allow timely decisions regarding required disclosure.
(b) There was no change in the registrant’s internal control over financial reporting that occurred during the registrant’s second fiscal quarter of the period covered by this report that has materially affected, or is reasonably likely to materially affect, the registrant’s internal control over financial reporting.
Item 12. Exhibits.
(a)(1) Code of ethics required to be disclosed under Item 2 of Form N-CSR attached hereto as Exhibit 99.CODE ETH.
(a)(2) Certifications pursuant to Rule 30a-2(a) under the Investment Company Act of 1940 (17 CFR 270.30a-2(a)) attached hereto as Exhibit 99.CERT.
(a)(3) Not applicable.
(b) Certification pursuant to Rule 30a-2(b) under the Investment Company Act of 1940 (17 CFR 270.30a-2(b)) attached hereto as Exhibit 99.906CERT.
SIGNATURES
Pursuant to the requirements of the Securities Exchange Act of 1934 and the Investment Company Act of 1940, the registrant has duly caused this report to be signed on its behalf by the undersigned, thereunto duly authorized.
(registrant) | | Columbia Funds Series Trust I | |
| | | |
| |
By (Signature and Title) | | /s/J. Kevin Connaughton | |
| | J. Kevin Connaughton, President | |
| | |
| | |
Date | | November 19, 2010 | |
| | | | | | |
Pursuant to the requirements of the Securities Exchange Act of 1934 and the Investment Company Act of 1940, this report has been signed below by the following persons on behalf of the registrant and in the capacities and on the dates indicated.
By (Signature and Title) | | /s/J. Kevin Connaughton | |
| | J. Kevin Connaughton, President | |
| | |
| | |
Date | | November 19, 2010 | |
| | |
| | |
By (Signature and Title) | | /s/Michael G. Clarke | |
| | Michael G. Clarke, Chief Financial Officer | |
| | |
| | |
Date | | November 19, 2010 | |
| | | | |