UNITED STATES
SECURITIES AND EXCHANGE COMMISSION
Washington, D.C. 20549
FORM N-CSR
CERTIFIED SHAREHOLDER REPORT OF REGISTERED
MANAGEMENT INVESTMENT COMPANIES
Investment Company Act file number 811-04367
Columbia Funds Series Trust I
(Exact name of registrant as specified in charter)
One Financial Center, Boston, Massachusetts 02111
(Address of principal executive offices) (Zip code)
Scott R. Plummer
5228 Ameriprise Financial Center
Minneapolis, MN 55474
(Name and address of agent for service)
Registrant’s telephone number, including area code: 1-612-671-1947
Date of fiscal year end: June 30
Date of reporting period: June 30, 2010
Form N-CSR is to be used by management investment companies to file reports with the Commission not later than 10 days after the transmission to stockholders of any report that is required to be transmitted to stockholders under Rule 30e-1 under the Investment Company Act of 1940 (17 CFR 270.30e-1). The Commission may use the information provided on Form N-CSR in its regulatory, disclosure review, inspection, and policymaking roles.
A registrant is required to disclose the information specified by Form N-CSR, and the Commission will make this information public. A registrant is not required to respond to the collection of information contained in Form N-CSR unless the Form displays a currently valid Office of Management and Budget (“OMB”) control number. Please direct comments concerning the accuracy of the information collection burden estimate and any suggestions for reducing the burden to Secretary, Securities and Exchange Commission, 450 Fifth Street, NW, Washington, DC 20549-0609. The OMB has reviewed this collection of information under the clearance requirements of 44 U.S.C. § 3507.
| Item 1. | Reports to Stockholders. |

Columbia Small Cap Value Fund I
Annual Report for the Period Ended June 30, 2010
Table of Contents
The views expressed in this report reflect the current views of the respective parties. These views are not guarantees of future performance and involve certain risks, uncertainties and assumptions that are difficult to predict, so actual outcomes and results may differ significantly from the views expressed. These views are subject to change at any time based upon economic, market or other conditions and the respective parties disclaim any responsibility to update such views. These views may not be relied on as investment advice and, because investment decisions for a Columbia Fund are based on numerous factors, may not be relied on as an indication of trading intent on behalf of any particular Columbia Fund. References to specific securities should not be construed as a recommendation or investment advice.
President’s Message

Dear Shareholder:
On May 3, 2010, Ameriprise Financial, Inc. announced that it had completed the acquisition of the long-term asset management business of Columbia Management Group, LLC from Bank of America. This includes the business of managing its equity and fixed-income mutual funds. Ameriprise Financial has combined its current U.S. asset management business, RiverSource Investments, LLC, with Columbia Management. This transaction puts together two leading asset management firms to create one entity that ranks as one of the largest managers of long-term mutual fund assets in the United States. This combined business will operate under the well-regarded Columbia Management brand, where we will build on the strengths of our combined investment capabilities and talent, our broad and diversified product lineup and exceptional service.
Our combined business has a new breadth and depth of investment choices. William “Ted” Truscott, CEO, U.S. asset management and president of annuities for Ameriprise Financial, leads the combined U.S. asset management business. Michael Jones serves as president, U.S. asset management.1 Colin Moore continues to serve as chief investment officer.1 I am also continuing in my role as head of mutual funds, responsible for the delivery of mutual fund products and services to investors. The Columbia funds’ advisers, distributor and transfer agent are now subsidiaries of our parent company, Ameriprise Financial, but operate under the Columbia Management name. You will begin to see these names used in communications and statements going forward.
| | |
| | | Service provider name |
| Advisers | | Columbia Management Investment Advisers, LLC Columbia Wanger Asset Management, LLC |
| Distributor | | Columbia Management Investment Distributors, Inc. |
| Transfer Agent | | Columbia Management Investment Services Corp. |
As a valued investor in Columbia funds, please know that our goal is to ensure a smooth transition and provide the highest quality products and services. Transition teams across the organization continue their efforts to build on best practices from both legacy organizations with integration efforts including rebranding, vendor and system consolidations and client communications. Additionally, we want to assure you that the funds’ portfolio managers also continue to focus on providing uninterrupted service to all fund shareholders.
Although we have a lot of work ahead of us in 2010, Columbia Management and Ameriprise Financial are excited about the opportunities for our combined organization. I share this optimism and believe it positions us as a best-in-class asset management business with the ability to deliver more for our clients than ever before.
Sincerely,

J. Kevin Connaughton
President, Columbia Funds
| 1 | Associate joined Columbia Management Investment Advisers, LLC as part of its 2010 acquisition of the long-term asset management business of Columbia Management Group, LLC from Bank of America. |
Investors should consider the investment objectives, risks, charges and expenses of a mutual fund carefully before investing. For a free prospectus, which contains this and other important information about the funds, visit www.columbiamanagement.com. Read the prospectus carefully before investing.
Securities products offered through Columbia Management Investment Distributors, Inc. (formerly known as RiverSource Fund Distributors, Inc.), member FINRA. Advisory services provided by Columbia Management Investment Advisers, LLC (formerly known as RiverSource Investments, LLC).
© 2010 Columbia Management Investment Advisers, LLC. All rights reserved.
Fund Profile – Columbia Small Cap Value Fund I
Summary
| n | | For the 12-month period that ended June 30, 2010, the fund’s Class A shares returned 22.99% without sales charge. |
| n | | The fund’s performance lagged its benchmark, the Russell 2000 Value Index1. It also lagged the average return of funds in its peer group, the Lipper Small-Cap Value Funds Classification.2 |
| n | | We believe the fund’s focus on higher-quality small-cap companies and lack of exposure to mid-cap stocks hampered results relative to the peer group, as lower-quality and mid-cap stocks led a market rally. |
Portfolio Management
Stephen D. Barbaro has managed or co-managed the fund since June 2002 and has been associated with the advisor since May 2010. Prior to joining the advisor, Mr. Barbaro was associated with the fund’s previous advisor or its predecessors since 1976.
Jeremy Javidi has co-managed the fund since August 2005 and has been associated with the advisor since May 2010. Prior to joining the advisor, Mr. Javidi was associated with the fund’s previous advisor or its predecessors since 2000.
Effective May 1, 2010, RiverSource Investment, LLC, a subsidiary of Ameriprise Financial, Inc., became the investment advisor to the fund and changed its names to Columbia Management Investment Advisers, LLC. Please see the fund’s prospectuses, as supplemented, for more information regarding the change in investment advisor and certain other changes.
| 1 | The Russell 2000 Value Index tracks the performance of those Russell 2000 Index companies with lower price-to-book ratios and lower forecasted growth values. Indices are not available for investment, are not professionally managed and do not reflect sales charges, fees, brokerage commissions, taxes or other expenses of investing. Securities in the fund may not match those in an index. |
| 2 | Lipper Inc., a widely respected data provider in the industry, calculates an average total return (assuming reinvestment of distributions) for mutual funds with investment objectives similar to those of the fund. Lipper makes no adjustment for the effect of sales loads. |
Performance data quoted represents past performance and current performance may be lower or higher. Past performance is no guarantee of future results. The investment return and principal value will fluctuate so that shares, when redeemed, may be worth more or less than the original cost. Please visit www.columbiafunds.com for daily and most recent month-end performance updates.
Summary
1-year return as of 06/30/10
| | |
| |
 | | +22.99% Class A shares (without sales charge) |
| |
| | +25.07% Russell 2000 Value Index |
|
Morningstar Style Box™ |
|
Equity Style |
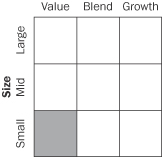
|
The Morningstar Style Box™ reveals a fund’s investment strategy. For equity funds, the vertical axis shows the market capitalization of the stocks owned, and the horizontal axis shows investment style (value, blend or growth). Information shown is based on the most recent data provided by Morningstar.
1
Economic Update – Columbia Small Cap Value Fund I
Summary
For the 12-month period that ended June 30, 2010
| | n | | Solid economic growth and relatively low interest rates boosted bond market returns. The Barclays Capital Aggregate Bond Index delivered solid results. High-yield bonds outperformed stocks, as measured by the BofA Merrill Lynch U.S. High Yield Cash Pay Index and the S&P 500 Index. | |
| | |
Barclays Aggregate Index | | BofA
Merrill Lynch Index |
| |

| |
|
9.50% | | 27.01% |
| | n | | The U.S. stock market, as measured by the S&P 500 Index, delivered solid returns, despite a correction in the last months of the period. Emerging market stocks, as measured by the MSCI Emerging Markets Index (Net), outperformed U.S. stocks as well as stock markets in developed foreign markets. | |
| | |
| S&P Index | | MSCI Index |
| |
| |
|
14.43% | | 23.15% |
Although it has been a year since U.S. economic growth turned positive, the economy continues to send mixed signals about the sustainability of this recovery. Economic growth, as measured by gross domestic product (GDP), was a solid 5.6% in the last quarter of 2009. However, it was 2.7% in the first quarter of 2010 and expectations are for lackluster growth through the end of the year, as government incentive programs have ended and stimulus spending winds down.
Consumer spending on cars, clothing and other goods was solid throughout most of the year, but in May, spending on these items fell 1.2%. And consumer confidence, which gained ground earlier in the period, fell sharply in June as consumers surveyed indicated they were concerned about business conditions and job prospects. The housing market — another bellwether for the consumer sector — showed some signs of stabilizing. However, a full recovery remained out of reach. Both new and existing home sales fell in June as a federal tax credit for new and repeat homebuyers was set to expire. Distressed properties continued to pressure prices and a huge backlog of foreclosed homes is likely to continue to keep a lid on prices for some time. The inventory of unsold homes rose to a level that would take eight and a half months to deplete at the current sales pace — the long-term average is on the order of six months.
News on the job front was mostly positive, but the number of new jobs added to the economy fell short of expectations. A good portion of the jobs added in March, April and May were temporary, government-sponsored census positions, which began to unwind in June. Private sector job growth was disappointing given the stage of economic recovery.
Reports from the business side of the economy were generally positive. A key measure of the nation’s manufacturing situation — the Institute for Supply Management’s Index — generally rose throughout the period, although there were slight downticks in February and May. Industrial production moved higher, as did the amount of manufacturing capacity utilized — a key measure of the health of the manufacturing sector. Perhaps the best news was about corporate profits. Of the S&P 500 companies announcing first-quarter results, 77% exceeded Wall Street earnings forecasts. Now, the focus has shifted to second-quarter earnings, which will be announced later in the summer.
Bond returns ranged from solid to strong
As the economy strengthened, bonds delivered solid returns. The Barclays Capital Aggregate Bond Index1 returned 9.50%. Municipal bonds gained almost as much as taxable investment-grade bonds, even without factoring in potential tax advantages to investors in higher income-tax brackets. The Barclays Capital Municipal Bond Index2 returned 9.61%. The high-yield bond market outpaced stocks during the period by a margin of almost two to one. For the 12 months covered by this report, the BofA Merrill
| 1 | The Barclays Capital Aggregate Bond Index is a market value-weighted index that tracks the daily price, coupon, pay-downs and total return performance of fixed-rate, publicly placed, dollar-denominated and non-convertible investment grade debt issues with at least $250 million par amount outstanding and with at least one year to final maturity. |
| 2 | The Barclays Capital Municipal Bond Index is considered representative of the broad market for investment grade, tax-exempt bonds with a maturity of at least one year. |
2
Economic Update (continued) – Columbia Small Cap Value Fund I
Lynch U.S. High Yield Cash Pay Index3 returned 27.01%. Even the Treasury market was positive as the yield on the 10-year U.S. Treasury, a common bellwether for the bond market, fell just below 3.0% at the end of the 12-month period. Despite the pickup in economic activity, the Federal Reserve Board (the Fed) kept a key short-term interest rate — the federal funds rate — close to zero.
Stocks staged a solid comeback
Against a strengthening economic backdrop, a stock market rally that began in mid-March 2009 continued into the spring of 2010, when a debt crisis brewing in Europe spilled over and reclaimed some of the stock market’s earlier gains. The S&P 500 Index4 returned 14.43% for the 12-month period. Outside the United States, stock market returns were not as strong. The MSCI EAFE Index (Net),5 a broad gauge of stock market performance in foreign developed markets, returned 5.92% (net of dividends, in U.S. dollars) for the period, as concerns about the impact of a bailout for weak eurozone economies weighed on the markets. Emerging stock markets were more resilient. The MSCI Emerging Markets Index (Net)6 returned 23.15% (net of dividends, in U.S. dollars) for the 12-month period.
Past performance is no guarantee of future results.
| 3 | The BofA Merrill Lynch U.S. High Yield Cash Pay Index tracks the performance of non-investment-grade corporate bonds. |
| 4 | The Standard & Poor’s (S&P) 500 Index tracks the performance of 500 widely held, large-capitalization U.S. stocks. |
| 5 | The Morgan Stanley Capital International Europe, Australasia, Far East (MSCI EAFE) Index (Net) is a capitalization-weighted index that tracks the total return of common stocks in 22 developed-market countries within Europe, Australasia and the Far East. |
| 6 | The Morgan Stanley Capital International (MSCI) Emerging Markets Index (Net) is a free float-adjusted market capitalization index that is designed to measure equity market performance of emerging markets. As of May 2010, the MSCI Emerging Markets Index consisted of the following 21 emerging market country indices: Brazil, Chile, China, Colombia, Czech Republic, Egypt, Hungary, India, Indonesia, Korea, Malaysia, Mexico, Morocco, Peru, Philippines, Poland, Russia, South Africa, Taiwan, Thailand and Turkey. |
Indices are not available for investment, are not professionally managed and do not reflect sales charges, fees, brokerage commissions, taxes or other expenses of investing. Securities in the fund may not match those in an index.
3
Performance Information – Columbia Small Cap Value Fund I
Performance data quoted represents past performance and current performance may be lower or higher. Past performance is no guarantee of future results. The investment return and principal value will fluctuate so that shares, when redeemed, may be worth more or less than the original cost. Please visit www.columbiafunds.com for daily and most recent month-end performance updates.
| | |
| Annual operating expense ratio (%)* |
| |
Class A | | 1.33 |
Class B | | 2.08 |
Class C | | 2.08 |
Class Y | | 0.90 |
Class Z | | 1.08 |
| * | The annual operating expense ratio is as stated in the fund’s prospectus that is current as of the date of this report. Differences in expense ratios disclosed elsewhere in this report may result from the inclusion of fee waivers and expense reimbursements as well as different time periods used in calculating the ratios. |
|
| Performance of a $10,000 investment 07/01/00 – 06/30/10 |
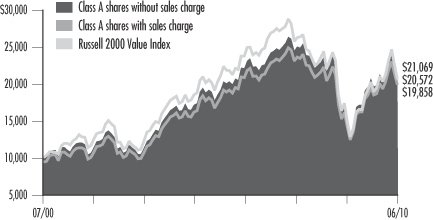
The chart above shows the change in value of a hypothetical $10,000 investment in Class A shares of Columbia Small Cap Value Fund I during the stated time period, and does not reflect the deduction of taxes that a shareholder may pay on fund distributions or on the redemption of fund shares.
| | | | |
| Performance of a $10,000 investment 07/01/00 – 06/30/10 ($) |
| | |
| Sales charge | | without | | with |
Class A | | 21,069 | | 19,858 |
Class B | | 19,520 | | 19,520 |
Class C | | 19,520 | | 19,520 |
Class Y | | 21,655 | | n/a |
Class Z | | 21,621 | | n/a |
| | | | | | | | | | | | | | | | |
| Average annual total return as of 06/30/10 (%) | | |
| | | | | |
| Share class | | A | | B | | C | | Y | | Z |
| Inception | | 07/25/86 | | 11/09/92 | | 01/15/96 | | 07/15/09 | | 07/31/95 |
| Sales charge | | without | | with | | without | | with | | without | | with | | without | | without |
1-year | | 22.99 | | 15.91 | | 22.02 | | 17.02 | | 22.04 | | 21.04 | | 23.47 | | 23.28 |
5-year | | 1.88 | | 0.68 | | 1.11 | | 0.81 | | 1.11 | | 1.11 | | 2.16 | | 2.13 |
10-year | | 7.74 | | 7.10 | | 6.92 | | 6.92 | | 6.92 | | 6.92 | | 8.03 | | 8.02 |
The “with sales charge” returns include the maximum initial sales charge of 5.75% for Class A shares and the applicable contingent deferred sales charge of 5.00% in the first year, declining to 1.00% in the sixth year and eliminated thereafter for Class B shares and 1.00% for Class C shares for the first year only. The “without sales charge” returns do not include the effect of sales charges. If they had, returns would be lower.
Performance results reflect any fee waivers or reimbursements of fund expenses by the investment advisor and/or any of its affiliates. Absent these fee waivers or expense reimbursement arrangements, performance results would have been lower.
All results shown assume reinvestment of distributions. Class Y and Class Z shares are sold at net asset value with no distribution and service (Rule 12b-1) fees. Class Y and Class Z shares have limited eligibility and the investment minimum requirements may vary. Please see the fund’s prospectus for details. Performance for different share classes will vary based on differences in sales charges and fees associated with each class.
The tables do not reflect the deduction of taxes that a shareholder may pay on fund distributions or on the redemption of fund shares.
The returns for Class Y shares include the returns for Class Z shares for the periods prior to July 15, 2009. The returns shown have not been adjusted to reflect any differences in expenses between Class Y shares and Class Z shares. Class Y shares were initially offered on July 15, 2009.
4
Understanding Your Expenses – Columbia Small Cap Value Fund I
Estimating your actual expenses
To estimate the expenses that you paid over the period, first you will need your account balance at the end of the period:
| | n | | For shareholders who receive their account statements from Columbia Management Investment Services Corp., your account balance is available online at www.columbiafunds.com or by calling Shareholder Services at 800.345.6611. | |
| | n | | For shareholders who receive their account statements from their financial intermediary, contact your financial intermediary to obtain your account balance. | |
| | 1. | Divide your ending account balance by $1,000. For example, if an account balance was $8,600 at the end of the period, the result would be 8.6. | |
| | 2. | In the section of the table below titled “Expenses paid during the period,” locate the amount for your share class. You will find this number in the column labeled “Actual.” Multiply this number by the result from step 1. Your answer is an estimate of the expenses you paid on your account during the period. | |
If the value of your account falls below the minimum initial investment requirement applicable to you, your account may be subject to a $20 annual fee. This fee is not included in the accompanying table. If you are subject to the fee, keep it in mind when you are estimating the ongoing expenses of investing in the fund and when comparing the expenses of this fund with other funds.
As a fund shareholder, you incur two types of costs. There are transaction costs, which generally include sales charges on purchases and may include redemption fees or exchange fees. There are also ongoing costs, which generally include investment advisory fees, distribution and service (Rule 12b-1) fees and other fund expenses. The information on this page is intended to help you understand the ongoing costs of investing in the fund and to compare these costs with the ongoing costs of investing in other mutual funds.
Analyzing your fund’s expenses by share class
To illustrate these ongoing costs, we have provided an example and calculated the expenses paid by investors in each share class during the period. The information in the following table is based on an initial investment of $1,000, which is invested at the beginning of the period and held for the entire period. Expense information is calculated two ways and each method provides you with different information. The amount listed in the “Actual” column is calculated using the fund’s actual operating expenses and total return for the period. The amount listed in the “Hypothetical” column for each share class assumes that the return each year is 5% before expenses and is calculated based on the fund’s actual operating expenses. You should not use the hypothetical account values and expenses to estimate either your actual account balance at the end of the period or the expenses you paid during this period.
Compare with other funds
Since all mutual funds are required to include the same hypothetical calculations about expenses in shareholder reports, you can use this information to compare the ongoing costs of investing in the fund with other funds. To do so, compare the 5% hypothetical example with the 5% hypothetical examples that appear in the shareholder reports of other funds. As you compare hypothetical examples of other funds, it is important to note that hypothetical examples are meant to highlight the ongoing costs of investing in a fund and do not reflect any transaction costs, such as sales charges, redemption fees or exchange fees.
| | | | | | | | | | | | | | |
| 01/01/10 – 06/30/10 |
| | | | |
| | | Account value at the
beginning of the period ($) | | Account value at the
end of the period ($) | | Expenses paid
during the period ($) | | Fund’s annualized
expense ratio (%) |
| | | Actual | | Hypothetical | | Actual | | Hypothetical | | Actual | | Hypothetical | | Actual |
Class A | | 1,000.00 | | 1,000.00 | | 993.10 | | 1,018.60 | | 6.18 | | 6.26 | | 1.25 |
Class B | | 1,000.00 | | 1,000.00 | | 989.10 | | 1,014.88 | | 9.86 | | 9.99 | | 2.00 |
Class C | | 1,000.00 | | 1,000.00 | | 989.40 | | 1,014.88 | | 9.87 | | 9.99 | | 2.00 |
Class Y | | 1,000.00 | | 1,000.00 | | 995.00 | | 1,020.63 | | 4.16 | | 4.21 | | 0.84 |
Class Z | | 1,000.00 | | 1,000.00 | | 994.40 | | 1,019.84 | | 4.95 | | 5.01 | | 1.00 |
Expenses paid during the period are equal to the annualized expense ratio for the share class, multiplied by the average account value over the period, then multiplied by the number of days in the fund’s most recent fiscal half-year and divided by 365.
It is important to note that the expense amounts shown in the table are meant to highlight only ongoing costs of investing in the fund and do not reflect any transaction costs, such as sales charges, redemption fees or exchange fees. Therefore, the hypothetical examples provided may not help you determine the relative total costs of owning shares of different funds. If these transaction costs were included, your costs would have been higher.
5
Portfolio Managers’ Report – Columbia Small Cap Value Fund I
Performance data quoted represents past performance and current performance may be lower or higher. Past performance is no guarantee of future results. The investment return and principal value will fluctuate so that shares, when redeemed, may be worth more or less than the original cost. Please visit www.columbiafunds.com for daily and most recent month-end performance updates.
| | |
| Net asset value per share |
| |
as of 06/30/10 ($) | | |
Class A | | 35.84 |
Class B | | 29.17 |
Class C | | 30.87 |
Class Y | | 37.63 |
Class Z | | 37.60 |
| | |
| Distributions declared per share |
| |
07/01/09 – 06/30/10 ($) | | |
Class A | | 0.18 |
Class B | | 0.07 |
Class C | | 0.07 |
Class Y | | 0.24 |
Class Z | | 0.22 |
For the 12-month period that ended June 30, 2010, the fund’s Class A shares returned 22.99% without sales charge. By comparison, the fund’s benchmark, the Russell 2000 Value Index, returned 25.07%. The average return of competing funds was 25.39%, as measured by the Lipper Small-Cap Value Funds Classification. Our focus was on high-quality small-cap companies with strong balance sheets and good cash flows whose stocks were selling at a discount to their peers. We believe that the fund’s lack of exposure to lower-quality and mid-cap stocks — both of which led the recent market rally — accounted for its modest shortfall versus the Lipper peer group.
A shifting market environment
The period began on an up note in the summer of 2009. Stocks were buoyed by an improving economic outlook that lifted investor confidence. Economically-sensitive sectors, such as consumer discretionary and materials, led the market’s climb. However, in the second half of the period, stocks gave back some of their gains, amid growing concerns over an unfolding European sovereign debt crisis, a potential slowdown in China and a lackluster recovery in the United States. As volatility increased, investors moved away from heavily indebted companies and economically-sensitive sectors into higher-quality, lower-risk companies and more defensive sectors. Our decision to avoid companies whose earnings growth depended on the strength of the economic recovery helped protect the fund during the downturn.
Strong stock selection in energy, utilities, technology
Going into 2010, we expected the best investment opportunities would come from companies that could gain market share, increase their dividend payments or yield to stronger industry players through mergers and acquisitions. This theme played out, as several holdings were acquired at handsome premiums and stock selection in the energy, utilities and technology sectors was rewarded. In this regard, Mariner Energy, Inc., an offshore driller in the Gulf of Mexico; Maine & Maritimes Corp., an electric utility company serving customers in northern Maine; and CPI International, Inc., a semiconductor company all did well. Another standout was semiconductor communications equipment company OmniVision Technologies, Inc. (0.4% of net assets), whose components go into the popular iPads and iPhones. The company gained market share during the period.
Disappointments in financials, health care and consumer discretionary
The fund lost ground versus the index in the financials sectors, primarily because it did not have exposure to heavily leveraged banks and real estate investment trusts (REITs), both of which made very strong comebacks during the period. In health care, facilities-based companies, including Res-Care, Inc. and MedCath Corp. (0.3% and 0.3% of net assets, respectively), hampered results, as concerns about changes in Medicare reimbursement policies pressured the stocks. In consumer discretionary, we avoided auto-related companies, many of which have weak balance sheets and are saddled with huge pension liabilities. However, auto stocks were strong performers early in the 12-month period as the government’s “Cash-for-Clunkers” program bolstered sales growth.
6
Portfolio Managers’ Report (continued) – Columbia Small Cap Value Fund I
Opportunities in technology and industrials
Going forward, we expect stock performance to be driven more by company-specific factors rather than economic growth. However, we expect certain sectors to benefit broadly as business investment slowly improves, which is why we raised the fund’s exposure relative to the index to technology and industrials stocks. Within these sectors, we are finding opportunities to buy reasonably priced stocks issued by strong companies that have the potential to pick up market share from weaker competitors in an environment of slow growth. The fund ended the period with underweights versus the index in financials, consumer discretionary and consumer staples — sectors where we have not found as many stocks that meet our investment criteria. Within financials, which represents nearly one-third of assets, the fund had underweights in REITs, which we think are overvalued, and in commercial banks, many of which could be hurt by their decision not to recognize losses from non-performing loans in the current period. Instead, we favored insurance stocks that were selling at extreme discounts relative to their asset values, as well as thrifts and mortgage finance companies with strong balance sheets, which are positioned to benefit as the federal government unwinds its involvement in the industry.
Portfolio characteristics and holdings are subject to change periodically and may not be representative of current characteristics and holdings. The outlook for the fund may differ from that presented for other Columbia Funds.
Equity securities are subject to stock market fluctuations that occur in response to economic and business developments.
Investments in small-cap stocks may be subject to greater volatility and price fluctuations because they may be thinly traded and less liquid than investments in larger companies.
Value stocks are stocks of companies that may have experienced adverse business or industry developments or may be subject to special risks that have caused the stocks to be out of favor. If the manager’s assessment of a company’s prospects is wrong, the price of its stock may not approach the value the manager has placed on it.
7
Investment Portfolio – Columbia Small Cap Value Fund I
June 30, 2010
Common Stocks – 97.4%
| | | | |
| | | Shares | | Value ($) |
| Consumer Discretionary – 8.5% | | | | |
| Diversified Consumer Services – 0.4% | | |
Regis Corp. | | 385,906 | | 6,008,556 |
| | | | |
Diversified Consumer Services Total | | | | 6,008,556 |
| |
| Hotels, Restaurants & Leisure – 1.6% | | |
Benihana, Inc., Class A (a) | | 698,267 | | 4,133,741 |
Bob Evans Farms, Inc. | | 254,571 | | 6,267,538 |
CEC Entertainment, Inc. (a) | | 142,841 | | 5,036,574 |
Jack in the Box, Inc. (a) | | 213,470 | | 4,151,991 |
Red Robin Gourmet Burgers, Inc. (a) | | 237,671 | | 4,078,434 |
| | | | |
Hotels, Restaurants & Leisure Total | | | | 23,668,278 |
| |
| Household Durables – 1.0% | | |
American Greetings Corp., Class A | | 235,130 | | 4,411,039 |
Cavco Industries, Inc. (a) | | 146,927 | | 5,168,892 |
CSS Industries, Inc. | | 276,352 | | 4,559,808 |
| | | | |
Household Durables Total | | | | 14,139,739 |
| |
| Leisure Equipment & Products – 0.4% | | |
JAKKS Pacific, Inc. (a) | | 376,350 | | 5,411,913 |
| | | | |
Leisure Equipment & Products Total | | | | 5,411,913 |
| |
| Media – 0.3% | | |
Scholastic Corp. | | 219,330 | | 5,290,240 |
| | | | |
Media Total | | | | 5,290,240 |
| |
| Specialty Retail – 4.2% | | |
America’s Car-Mart, Inc. (a) | | 215,260 | | 4,871,334 |
Christopher & Banks Corp. | | 695,020 | | 4,302,174 |
Finish Line, Inc., Class A | | 400,030 | | 5,572,418 |
Foot Locker, Inc. | | 483,475 | | 6,101,455 |
GameStop Corp., Class A (a) | | 275,790 | | 5,182,094 |
Men’s Wearhouse, Inc. | | 299,525 | | 5,499,279 |
OfficeMax, Inc. (a) | | 454,990 | | 5,942,169 |
Pacific Sunwear of California, Inc. (a) | | 2,391,786 | | 7,653,715 |
Rent-A-Center, Inc. (a) | | 464,084 | | 9,402,342 |
Shoe Carnival, Inc. (a) | | 271,649 | | 5,571,521 |
| | | | |
Specialty Retail Total | | | | 60,098,501 |
| |
| Textiles, Apparel & Luxury Goods – 0.6% | | |
Movado Group, Inc. (a) | | 420,819 | | 4,494,347 |
Wolverine World Wide, Inc. | | 150,680 | | 3,800,149 |
| | | | |
Textiles, Apparel & Luxury Goods Total | | | | 8,294,496 |
| | | | |
Consumer Discretionary Total | | | | 122,911,723 |
| | | | |
| | | Shares | | Value ($) |
| Consumer Staples – 1.5% | | | | |
| Food & Staples Retailing – 0.8% | | |
Ruddick Corp. | | 224,179 | | 6,947,307 |
Spartan Stores, Inc. | | 334,624 | | 4,591,041 |
| | | | |
Food & Staples Retailing Total | | | | 11,538,348 |
| |
| Food Products – 0.7% | | |
Fresh Del Monte Produce, Inc. (a) | | 478,995 | | 9,694,859 |
| | | | |
Food Products Total | | | | 9,694,859 |
| | | | |
Consumer Staples Total | | | | 21,233,207 |
| | | | |
| Energy – 5.5% | | | | |
| Energy Equipment & Services – 2.6% | | |
Dawson Geophysical Co. (a) | | 174,020 | | 3,701,405 |
Gulf Island Fabrication, Inc. | | 314,450 | | 4,880,264 |
Lufkin Industries, Inc. | | 52,463 | | 2,045,532 |
Matrix Service Co. (a) | | 410,370 | | 3,820,545 |
Patterson-UTI Energy, Inc. | | 436,140 | | 5,613,122 |
T-3 Energy Services, Inc. (a) | | 214,730 | | 5,990,967 |
TGC Industries, Inc. (a) | | 647,765 | | 1,962,728 |
Tidewater, Inc. | | 138,110 | | 5,347,619 |
Union Drilling, Inc. (a) | | 837,146 | | 4,612,675 |
| | | | |
Energy Equipment & Services Total | | | | 37,974,857 |
| |
| Oil, Gas & Consumable Fuels – 2.9% | | |
Berry Petroleum Co., Class A | | 177,410 | | 4,562,985 |
Bill Barrett Corp. (a) | | 203,560 | | 6,263,541 |
Forest Oil Corp. (a) | | 174,800 | | 4,782,528 |
Holly Corp. | | 177,109 | | 4,707,557 |
International Coal Group, Inc. (a) | | 873,440 | | 3,362,744 |
Stone Energy Corp. (a) | | 387,430 | | 4,323,719 |
Swift Energy Co. (a) | | 286,869 | | 7,719,645 |
World Fuel Services Corp. | | 199,900 | | 5,185,406 |
| | | | |
Oil, Gas & Consumable Fuels Total | | | | 40,908,125 |
| | | | |
Energy Total | | | | 78,882,982 |
| | | | |
| Financials – 31.3% | | | | |
| Capital Markets – 3.1% | | |
Federated Investors, Inc., Class B | | 164,549 | | 3,407,810 |
GFI Group, Inc. | | 762,162 | | 4,252,864 |
International Assets Holding Corp. (a) | | 277,170 | | 4,434,720 |
Investment Technology Group, Inc. (a) | | 491,068 | | 7,886,552 |
Knight Capital Group, Inc., Class A (a) | | 673,150 | | 9,282,739 |
Mass Financial Corp., Class A (a) | | 389,170 | | 3,580,364 |
See Accompanying Notes to Financial Statements.
8
Columbia Small Cap Value Fund I
June 30, 2010
Common Stocks (continued)
| | | | |
| | | Shares | | Value ($) |
| Financials (continued) | | | | |
optionsXpress Holdings, Inc. (a) | | 372,100 | | 5,856,854 |
Piper Jaffray Companies, Inc. (a) | | 196,002 | | 6,315,184 |
| | | | |
Capital Markets Total | | | | 45,017,087 |
| |
Commercial Banks – 7.1% | | |
Ameris Bancorp (a) | | 215,310 | | 2,079,895 |
BancFirst Corp. | | 167,433 | | 6,109,630 |
BancTrust Financial Group, Inc. (a) | | 474,228 | | 1,754,644 |
Bryn Mawr Bank Corp. | | 363,884 | | 6,105,974 |
Chemical Financial Corp. | | 432,303 | | 9,415,559 |
Columbia Banking System, Inc. | | 377,947 | | 6,901,312 |
Community Trust Bancorp, Inc. | | 267,460 | | 6,713,246 |
First Citizens BancShares, Inc., Class A | | 61,006 | | 11,733,284 |
First Commonwealth Financial Corp. | | 1,526,334 | | 8,013,253 |
First Financial Corp. Indiana | | 320,828 | | 8,280,571 |
First National Bank of Alaska | | 2,371 | | 4,379,237 |
Investors Bancorp, Inc. (a) | | 454,057 | | 5,957,228 |
Merchants Bancshares, Inc. | | 279,256 | | 6,205,068 |
Northfield Bancorp, Inc. | | 431,114 | | 5,595,860 |
Northrim BanCorp, Inc. (b) | | 343,766 | | 5,321,498 |
West Coast Bancorp | | 1,643,986 | | 4,192,164 |
Whitney Holding Corp. | | 336,462 | | 3,112,273 |
| | | | |
Commercial Banks Total | | | | 101,870,696 |
| |
Consumer Finance – 0.7% | | |
Cash America International, Inc. | | 283,839 | | 9,727,163 |
| | | | |
Consumer Finance Total | | | | 9,727,163 |
| |
| Diversified Financial Services – 0.5% | | |
Medallion Financial Corp. | | 480,975 | | 3,174,435 |
Pico Holdings, Inc. (a) | | 121,661 | | 3,646,180 |
| | | | |
Diversified Financial Services Total | | | | 6,820,615 |
| |
| Insurance – 9.2% | | |
Allied World Assurance Holdings Ltd. | | 118,010 | | 5,355,294 |
American Safety Insurance Holdings Ltd. (a) | | 405,810 | | 6,379,333 |
Argo Group International Holdings Ltd. | | 261,620 | | 8,002,956 |
Baldwin & Lyons, Inc., Class B (b) | | 271,632 | | 5,706,988 |
CNA Surety Corp. (a) | | 496,739 | | 7,982,596 |
eHealth, Inc. (a) | | 538,377 | | 6,121,347 |
EMC Insurance Group, Inc. | | 312,899 | | 6,861,875 |
| | | | |
| | | Shares | | Value ($) |
FBL Financial Group, Inc., Class A | | 317,783 | | 6,673,443 |
First Mercury Financial Corp. | | 531,575 | | 5,624,064 |
Hanover Insurance Group, Inc. | | 106,020 | | 4,611,870 |
Harleysville Group, Inc. | | 163,935 | | 5,086,903 |
Horace Mann Educators Corp. | | 619,542 | | 9,478,993 |
National Western Life Insurance Co., Class A | | 29,829 | | 4,556,678 |
Navigators Group, Inc. (a) | | 228,961 | | 9,417,166 |
RLI Corp. | | 98,790 | | 5,187,463 |
Safety Insurance Group, Inc. | | 272,721 | | 10,096,131 |
Stewart Information Services Corp. | | 394,820 | | 3,561,276 |
United America Indemnity Ltd., Class A (a) | | 1,692,453 | | 12,456,454 |
United Fire & Casualty Co. | | 494,388 | | 9,798,770 |
| | | | |
Insurance Total | | | | 132,959,600 |
|
| Real Estate Investment Trusts (REITs) – 5.3% |
DCT Industrial Trust, Inc. | | 1,593,129 | | 7,200,943 |
DiamondRock Hospitality Co. (a) | | 971,595 | | 7,986,511 |
Franklin Street Properties Corp. | | 518,290 | | 6,121,005 |
Getty Realty Corp. | | 232,146 | | 5,202,392 |
National Health Investors, Inc. | | 215,519 | | 8,310,412 |
Potlatch Corp. | | 272,922 | | 9,751,503 |
Starwood Property Trust, Inc. | | 485,580 | | 8,230,581 |
Sunstone Hotel Investors, Inc. (a) | | 568,526 | | 5,645,463 |
Terreno Realty Corp. (a) | | 282,310 | | 4,999,710 |
Universal Health Realty Income Trust | | 213,813 | | 6,869,812 |
Urstadt Biddle Properties, Inc., Class A | | 398,492 | | 6,427,676 |
| | | | |
Real Estate Investment Trusts (REITs) Total | | | | 76,746,008 |
|
| Real Estate Management & Development – 0.4% |
Avatar Holdings, Inc. (a) | | 298,751 | | 5,730,044 |
Maui Land & Pineapple Co., Inc. (a) | | 171,340 | | 639,098 |
| | | | |
Real Estate Management & Development Total | | | | 6,369,142 |
|
| Thrifts & Mortgage Finance – 5.0% |
Bank Mutual Corp. | | 1,286,326 | | 7,306,332 |
BankFinancial Corp. | | 810,825 | | 6,737,956 |
Beneficial Mutual Bancorp, Inc. (a) | | 831,029 | | 8,210,566 |
Brookline Bancorp, Inc. | | 854,209 | | 7,585,376 |
Clifton Savings Bancorp, Inc. | | 514,875 | | 4,453,669 |
ESSA Bancorp, Inc. | | 403,680 | | 4,969,301 |
Home Federal Bancorp, Inc. | | 655,028 | | 8,273,004 |
See Accompanying Notes to Financial Statements.
9
Columbia Small Cap Value Fund I
June 30, 2010
Common Stocks (continued)
| | | | |
| | | Shares | | Value ($) |
| Financials (continued) | | | | |
TrustCo Bank Corp. NY | | 784,844 | | 4,395,126 |
United Financial Bancorp, Inc. | | 414,176 | | 5,653,502 |
Washington Federal, Inc. | | 410,201 | | 6,637,052 |
Westfield Financial, Inc. | | 895,876 | | 7,462,647 |
| | | | |
Thrifts & Mortgage Finance Total | | | | 71,684,531 |
| | | | |
Financials Total | | | | 451,194,842 |
| | | | |
| Health Care – 5.3% | | | | |
| Biotechnology – 0.2% | | | | |
Martek Biosciences Corp. (a) | | 137,130 | | 3,251,352 |
| | | | |
Biotechnology Total | | | | 3,251,352 |
| |
| Health Care Equipment & Supplies – 1.6% | | |
Analogic Corp. | | 99,729 | | 4,538,667 |
Cantel Medical Corp. | | 235,971 | | 3,940,716 |
ICU Medical, Inc. (a) | | 1,249 | | 40,180 |
Kensey Nash Corp. (a) | | 230,306 | | 5,460,555 |
Symmetry Medical, Inc. (a) | | 505,460 | | 5,327,548 |
Young Innovations, Inc. | | 143,180 | | 4,030,517 |
| | | | |
Health Care Equipment & Supplies Total | | | | 23,338,183 |
| |
| Health Care Providers & Services – 3.5% | | |
AmSurg Corp. (a) | | 272,817 | | 4,861,599 |
Healthspring, Inc. (a) | | 494,384 | | 7,667,896 |
Kindred Healthcare, Inc. (a) | | 443,901 | | 5,699,689 |
Magellan Health Services, Inc. (a) | | 149,060 | | 5,413,859 |
MedCath Corp. (a) | | 533,210 | | 4,191,030 |
NovaMed, Inc. (a) | | 321,986 | | 2,672,484 |
Owens & Minor, Inc. | | 160,965 | | 4,568,187 |
Res-Care, Inc. (a) | | 520,538 | | 5,028,397 |
Triple-S Management Corp., Class B (a) | | 276,300 | | 5,125,365 |
U.S. Physical Therapy, Inc. (a) | | 252,336 | | 4,259,432 |
| | | | |
Health Care Providers & Services Total | | | | 49,487,938 |
| | | | |
Health Care Total | | | | 76,077,473 |
| | | | |
| Industrials – 18.2% | | | | |
| Aerospace & Defense – 1.6% | | |
AAR Corp. (a) | | 237,975 | | 3,983,702 |
Ceradyne, Inc. (a) | | 295,366 | | 6,311,971 |
Esterline Technologies Corp. (a) | | 135,650 | | 6,436,592 |
Ladish Co., Inc. (a) | | 295,530 | | 6,714,442 |
| | | | |
Aerospace & Defense Total | | | | 23,446,707 |
| |
| Air Freight & Logistics – 0.4% | | |
Pacer International, Inc. (a) | | 776,893 | | 5,430,482 |
| | | | |
Air Freight & Logistics Total | | | | 5,430,482 |
| | | | |
| | | Shares | | Value ($) |
| Airlines – 0.3% | | |
Skywest, Inc. | | 397,171 | | 4,853,430 |
| | | | |
Airlines Total | | | | 4,853,430 |
| |
| Building Products – 1.6% | | |
A.O. Smith Corp. | | 151,820 | | 7,316,206 |
Ameron International Corp. | | 102,442 | | 6,180,326 |
Lennox International, Inc. | | 108,239 | | 4,499,495 |
NCI Building Systems, Inc. (a) | | 102,138 | | 854,895 |
Universal Forest Products, Inc. | | 155,541 | | 4,714,448 |
| | | | |
Building Products Total | | | | 23,565,370 |
| |
| Commercial Services & Supplies – 2.2% | | |
ABM Industries, Inc. | | 241,520 | | 5,059,844 |
ATC Technology Corp. (a) | | 284,580 | | 4,587,430 |
Consolidated Graphics, Inc. (a) | | 176,670 | | 7,639,211 |
Ennis, Inc. | | 317,047 | | 4,758,875 |
G&K Services, Inc., Class A | | 148,490 | | 3,066,318 |
United Stationers, Inc. (a) | | 128,800 | | 7,015,736 |
| | | | |
Commercial Services & Supplies Total | | | | 32,127,414 |
| |
| Construction & Engineering – 2.8% | | |
Comfort Systems USA, Inc. | | 464,281 | | 4,484,954 |
Dycom Industries, Inc. (a) | | 637,841 | | 5,453,541 |
EMCOR Group, Inc. (a) | | 356,240 | | 8,254,081 |
KBR, Inc. | | 307,689 | | 6,258,394 |
KHD Humboldt Wedag International AG | | 247,120 | | 1,297,346 |
Layne Christensen Co. (a) | | 215,920 | | 5,240,378 |
Pike Electric Corp. (a) | | 493,525 | | 4,649,005 |
Sterling Construction Co., Inc. (a) | | 313,972 | | 4,062,798 |
| | | | |
Construction & Engineering Total | | | | 39,700,497 |
| |
| Electrical Equipment – 1.6% | | |
Acuity Brands, Inc. | | 138,580 | | 5,041,540 |
Belden, Inc. | | 253,411 | | 5,575,042 |
Broadwind Energy, Inc. (a) | | 354,137 | | 991,584 |
GrafTech International Ltd. (a) | | 758,516 | | 11,089,504 |
| | | | |
Electrical Equipment Total | | | | 22,697,670 |
| |
| Machinery – 3.3% | | |
Astec Industries, Inc. (a) | | 194,787 | | 5,401,444 |
CIRCOR International, Inc. | | 180,480 | | 4,616,678 |
EnPro Industries, Inc. (a) | | 270,702 | | 7,620,261 |
FreightCar America, Inc. | | 204,711 | | 4,630,563 |
Harsco Corp. | | 172,767 | | 4,060,024 |
Kadant, Inc. (a) | | 346,690 | | 6,039,340 |
LB Foster Co., Class A (a) | | 161,751 | | 4,192,586 |
Mueller Industries, Inc. | | 284,010 | | 6,986,646 |
Robbins & Myers, Inc. | | 207,980 | | 4,521,485 |
| | | | |
Machinery Total | | | | 48,069,027 |
See Accompanying Notes to Financial Statements.
10
Columbia Small Cap Value Fund I
June 30, 2010
Common Stocks (continued)
| | | | |
| | | Shares | | Value ($) |
| Industrials (continued) | | | | |
| Professional Services – 1.8% | | |
CDI Corp. | | 331,076 | | 5,141,610 |
FTI Consulting, Inc. (a) | | 134,160 | | 5,848,034 |
Kforce, Inc. (a) | | 305,954 | | 3,900,913 |
Korn/Ferry International (a) | | 339,121 | | 4,713,782 |
LECG Corp. (a) | | 1,041,901 | | 2,708,943 |
Navigant Consulting, Inc. (a) | | 317,870 | | 3,299,491 |
| | | | |
Professional Services Total | | | | 25,612,773 |
| |
| Road & Rail – 1.8% | | |
Arkansas Best Corp. | | 177,970 | | 3,692,878 |
Heartland Express, Inc. | | 343,264 | | 4,984,193 |
Ryder System, Inc. | | 119,459 | | 4,805,836 |
Werner Enterprises, Inc. | | 566,689 | | 12,404,822 |
| | | | |
Road & Rail Total | | | | 25,887,729 |
| |
| Trading Companies & Distributors – 0.8% | | |
Applied Industrial Technologies, Inc. | | 217,300 | | 5,502,036 |
Kaman Corp. | | 257,799 | | 5,702,514 |
| | | | |
Trading Companies & Distributors Total | | | | 11,204,550 |
| | | | |
Industrials Total | | | | 262,595,649 |
| | | | |
| Information Technology – 13.8% | | | | |
| Communications Equipment – 2.7% | | |
ADC Telecommunications, Inc. (a) | | 750,869 | | 5,563,939 |
Anaren, Inc. (a) | | 336,050 | | 5,020,587 |
Bel Fuse, Inc., Class B (b) | | 137,017 | | 2,262,151 |
Black Box Corp. | | 212,369 | | 5,922,971 |
Plantronics, Inc. | | 187,040 | | 5,349,344 |
Symmetricom, Inc. (a) | | 825,920 | | 4,203,933 |
Tekelec (a) | | 433,010 | | 5,733,052 |
Tellabs, Inc. | | 626,950 | | 4,006,211 |
| | | | |
Communications Equipment Total | | | | 38,062,188 |
| |
| Computers & Peripherals – 0.2% | | |
Adaptec, Inc. (a) | | 1,110,973 | | 3,210,712 |
| | | | |
Computers & Peripherals Total | | | | 3,210,712 |
| |
| Electronic Equipment, Instruments & Components – 3.5% | | |
Anixter International, Inc. (a) | | 177,490 | | 7,561,074 |
Benchmark Electronics, Inc. (a) | | 506,030 | | 8,020,575 |
Brightpoint, Inc. (a) | | 829,382 | | 5,805,674 |
CTS Corp. | | 540,667 | | 4,995,763 |
Electro Scientific Industries, Inc. (a) | | 357,300 | | 4,773,528 |
| | | | |
| | | Shares | | Value ($) |
Littelfuse, Inc. (a) | | 159,211 | | 5,032,660 |
Methode Electronics, Inc. | | 510,544 | | 4,972,699 |
MTS Systems Corp. | | 203,714 | | 5,907,706 |
NAM TAI Electronics, Inc. (a) | | 949,350 | | 3,911,322 |
| | | | |
Electronic Equipment, Instruments & Components Total | | | | 50,981,001 |
| |
| Internet Software & Services – 0.5% | | |
InfoSpace, Inc. (a) | | 454,230 | | 3,415,810 |
United Online, Inc. | | 751,740 | | 4,330,022 |
| | | | |
Internet Software & Services Total | | | | 7,745,832 |
| |
| IT Services – 2.1% | | |
Acxiom Corp. (a) | | 332,810 | | 4,888,979 |
CACI International, Inc., Class A (a) | | 131,320 | | 5,578,474 |
CSG Systems International, Inc. (a) | | 285,429 | | 5,231,914 |
MAXIMUS, Inc. | | 94,089 | | 5,444,930 |
MoneyGram International, Inc. (a) | | 1,857,214 | | 4,550,174 |
TeleTech Holdings, Inc. (a) | | 339,700 | | 4,378,733 |
| | | | |
IT Services Total | | | | 30,073,204 |
| |
| Semiconductors & Semiconductor Equipment – 2.8% | | |
Amkor Technology, Inc. (a) | | 644,890 | | 3,553,344 |
ATMI, Inc. (a) | | 301,222 | | 4,409,890 |
Fairchild Semiconductor International, Inc. (a) | | 448,315 | | 3,770,329 |
Integrated Device Technology, Inc. (a) | | 658,280 | | 3,258,486 |
Kulicke & Soffa Industries, Inc. (a) | | 528,365 | | 3,709,122 |
MKS Instruments, Inc. (a) | | 241,702 | | 4,524,661 |
OmniVision Technologies, Inc. (a) | | 298,156 | | 6,392,465 |
Varian Semiconductor Equipment Associates, Inc. (a) | | 131,350 | | 3,764,491 |
Verigy Ltd. (a) | | 403,307 | | 3,504,738 |
Zoran Corp. (a) | | 414,956 | | 3,958,680 |
| | | | |
Semiconductors & Semiconductor Equipment Total | | | | 40,846,206 |
| |
| Software – 2.0% | | |
Compuware Corp. (a) | | 533,960 | | 4,261,001 |
Jack Henry & Associates, Inc. | | 157,360 | | 3,757,757 |
Mentor Graphics Corp. (a) | | 677,346 | | 5,994,512 |
Monotype Imaging Holdings, Inc. (a) | | 490,745 | | 4,421,613 |
Parametric Technology Corp. (a) | | 257,690 | | 4,038,002 |
See Accompanying Notes to Financial Statements.
11
Columbia Small Cap Value Fund I
June 30, 2010
Common Stocks (continued)
| | | | |
| | | Shares | | Value ($) |
| Information Technology (continued) | | |
Progress Software Corp. (a) | | 204,909 | | 6,153,417 |
| | | | |
Software Total | | | | 28,626,302 |
| | | | |
Information Technology Total | | | | 199,545,445 |
| | | | |
| Materials – 6.2% | | | | |
| Chemicals – 1.6% | | | | |
Cytec Industries, Inc. | | 134,834 | | 5,392,012 |
H.B. Fuller Co. | | 494,239 | | 9,385,598 |
OM Group, Inc. (a) | | 339,877 | | 8,109,465 |
| | | | |
Chemicals Total | | | | 22,887,075 |
| |
| Construction Materials – 0.3% | | |
Eagle Materials, Inc. | | 170,411 | | 4,418,757 |
| | | | |
Construction Materials Total | | | | 4,418,757 |
| |
| Containers & Packaging – 2.2% | | |
Greif, Inc., Class A | | 101,156 | | 5,618,205 |
Greif, Inc., Class B | | 268,877 | | 14,142,930 |
Packaging Corp. of America | | 244,400 | | 5,381,688 |
Silgan Holdings, Inc. | | 221,690 | | 6,291,562 |
| | | | |
Containers & Packaging Total | | | | 31,434,385 |
| |
| Metals & Mining – 2.1% | | |
Carpenter Technology Corp. | | 174,840 | | 5,739,997 |
Haynes International, Inc. | | 192,144 | | 5,923,800 |
Olympic Steel, Inc. | | 234,509 | | 5,386,672 |
RTI International Metals, Inc. (a) | | 283,521 | | 6,835,691 |
Terra Nova Royalty Corp. (a) | | 315,562 | | 2,628,632 |
Thompson Creek Metals Co., Inc. (a) | | 514,830 | | 4,468,724 |
| | | | |
Metals & Mining Total | | | | 30,983,516 |
| | | | |
Materials Total | | | | 89,723,733 |
| | | | |
| Telecommunication Services – 1.7% | | |
| Diversified Telecommunication Services – 0.3% |
Warwick Valley Telephone Co. (b) | | 342,773 | | 4,822,816 |
| | | | |
Diversified Telecommunication Services Total | | | | 4,822,816 |
|
| Wireless Telecommunication Services – 1.4% |
NTELOS Holdings Corp. | | 409,620 | | 7,045,464 |
Shenandoah Telecommunications Co. | | 279,269 | | 4,954,232 |
Syniverse Holdings, Inc. (a) | | 383,166 | | 7,835,745 |
| | | | |
Wireless Telecommunication Services Total | | | | 19,835,441 |
| | | | |
Telecommunication Services Total | | | | 24,658,257 |
| | | | |
| | | Shares | | Value ($) |
| Utilities – 5.4% | | |
| Electric Utilities – 2.0% |
ALLETE, Inc. | | 252,340 | | 8,640,122 |
El Paso Electric Co. (a) | | 385,642 | | 7,462,173 |
Great Plains Energy, Inc. | | 200 | | 3,404 |
Hawaiian Electric Industries, Inc. | | 163,451 | | 3,723,414 |
MGE Energy, Inc. | | 217,164 | | 7,826,590 |
UIL Holdings Corp. | | 9,617 | | 240,713 |
| | | | |
Electric Utilities Total | | | | 27,896,416 |
| |
| Gas Utilities – 1.2% | | |
Laclede Group, Inc. | | 239,040 | | 7,919,395 |
Nicor, Inc. | | 239,300 | | 9,691,650 |
| | | | |
Gas Utilities Total | | | | 17,611,045 |
| |
| Independent Power Producers & Energy Traders – 0.6% | | |
Black Hills Corp. | | 313,711 | | 8,931,352 |
| | | | |
Independent Power Producers & Energy Traders Total | | | | 8,931,352 |
| |
| Multi-Utilities – 1.6% | | |
Avista Corp. | | 441,790 | | 8,628,159 |
CH Energy Group, Inc. | | 159,414 | | 6,255,406 |
NorthWestern Corp. | | 325,011 | | 8,515,288 |
| | | | |
Multi-Utilities Total | | | | 23,398,853 |
| | | | |
Utilities Total | | | | 77,837,666 |
| | | | |
Total Common Stocks
(cost of $1,344,473,175) | | | | 1,404,660,977 |
See Accompanying Notes to Financial Statements.
12
Columbia Small Cap Value Fund I
June 30, 2010
Short-Term Obligation – 0.7%
| | | | |
| | | Par ($) | | Value ($) |
Repurchase agreement with Fixed Income Clearing Corp., dated 06/30/10, due 07/01/10 at 0.000%, collateralized by a U.S. Treasury obligation maturing 01/31/14, market value $9,681,125 (repurchase proceeds $9,490,000) | | 9,490,000 | | 9,490,000 |
| | | | |
Total Short-Term Obligation
(cost of $9,490,000) | | 9,490,000 |
| | | | |
Total Investments – 98.1%
(cost of $1,353,963,175) (c) | | 1,414,150,977 |
| | | | |
Other Assets & Liabilities, Net – 1.9% | | 27,422,729 |
| | | | |
Net Assets – 100.0% | | | | 1,441,573,706 |
Notes to Investment Portfolio:
| (a) | Non-income producing security. |
| (b) | An affiliate may include any company in which the fund owns five percent or more of its outstanding voting shares. Transactions with companies which are or were affiliated during the year ended June 30, 2010, are as follows: |
| | | | | | | | | | | | | | | |
Affiliate | | Value,
Beginning of
Period | | Purchases | | Sales
Proceeds | | Dividend
Income | | Value,
End of
Period |
Baldwin & Lyons, Inc., Class B | | $ | 4,112,217 | | $ | 1,484,593 | | $ | 34,132 | | $ | 308,980 | | $ | 5,706,988 |
Bel Fuse, Inc., Class B | | | 1,618,709 | | | 748,700 | | | 12,498 | | | 32,436 | | | 2,262,151 |
Northrim BanCorp, Inc. | | | 3,536,320 | | | 1,441,593 | | | — | | | 123,184 | | | 5,321,498 |
Warwick Valley Telephone Co. | | | 3,118,800 | | | 957,929 | | | 55,201 | | | 295,981 | | | 4,822,816 |
| | | | | | | | | | | | | | | |
| | $ | 12,386,046 | | $ | 4,632,815 | | $ | 101,831 | | $ | 760,581 | | $ | 18,113,453 |
| | | | | | | | | | | | | | | |
| (c) | Cost for federal income tax purposes is $1,364,259,641. |
The following table summarizes the inputs used, as of June 30, 2010, in valuing the Fund’s assets:
| | | | | | | | | | | | |
Description | | Quoted Prices
(Level 1) | | Other
Significant
Observable
Inputs
(Level 2) | | Significant
Unobser-
vable
Inputs
(Level 3) | | Total |
Common Stocks | | | | | | | | | | | | |
Consumer Discretionary | | $ | 122,911,723 | | $ | — | | $ | — | | $ | 122,911,723 |
Consumer Staples | | | 21,233,207 | | | — | | | — | | | 21,233,207 |
Energy | | | 78,882,982 | | | — | | | — | | | 78,882,982 |
Financials | | | 451,194,842 | | | — | | | — | | | 451,194,842 |
Health Care | | | 76,077,473 | | | — | | | — | | | 76,077,473 |
Industrials | | | 261,711,295 | | | 884,354 | | | — | | | 262,595,649 |
Information Technology | | | 199,545,445 | | | — | | | — | | | 199,545,445 |
Materials | | | 89,723,733 | | | — | | | — | | | 89,723,733 |
Telecommunication Services | | | 24,658,257 | | | — | | | — | | | 24,658,257 |
Utilities | | | 77,837,666 | | | — | | | — | | | 77,837,666 |
| | | | | | | | | | | | |
Total Common Stocks | | | 1,403,776,623 | | | 884,354 | | | — | | | 1,404,660,977 |
| | | | | | | | | | | | |
Total Short-Term Obligation | | | — | | | 9,490,000 | | | — | | | 9,490,000 |
| | | | | | | | | | | | |
Total Investments | | $ | 1,403,776,623 | | $ | 10,374,354 | | $ | — | | $ | 1,414,150,977 |
| | | | | | | | | | | | |
The Fund’s assets assigned to the Level 2 input category include certain foreign securities for which a third party statistical pricing service may be employed for purposes of fair market valuation.
For more information on valuation inputs, and their aggregation into the levels used in the table above, please refer to the Security Valuation section in the accompanying Notes to Financial Statements.
At June 30, 2010, the Fund held investments in the following sectors:
| | |
Sector (Unaudited) | | % of
Net Assets |
Financials | | 31.3 |
Industrials | | 18.2 |
Information Technology | | 13.8 |
Consumer Discretionary | | 8.5 |
Materials | | 6.2 |
Energy | | 5.5 |
Utilities | | 5.4 |
Health Care | | 5.3 |
Telecommunication Services | | 1.7 |
Consumer Staples | | 1.5 |
| | |
| | 97.4 |
Short-Term Obligation | | 0.7 |
Other Assets & Liabilities, Net | | 1.9 |
| | |
| | 100.0 |
| | |
See Accompanying Notes to Financial Statements.
13
Statement of Assets and Liabilities – Columbia Small Cap Value Fund I
June 30, 2010
| | | | | |
| | | | | ($) | |
| Assets | | Unaffiliated investments, at cost | | 1,334,424,201 | |
| | Affiliated investments, at cost | | 19,538,974 | |
| | | | | |
| | Total investments, at cost | | 1,353,963,175 | |
| | |
| | Unaffiliated investments, at value | | 1,396,037,524 | |
| | Affiliated investments, at value | | 18,113,453 | |
| | | | | |
| | Total investments, at value | | 1,414,150,977 | |
| | Cash | | 8,771 | |
| | Receivable for: | | | |
| | Investments sold | | 15,886,367 | |
| | Fund shares sold | | 36,970,788 | |
| | Dividends | | 1,785,768 | |
| | Trustees’ deferred compensation plan | | 63,339 | |
| | Prepaid expenses | | 37,942 | |
| | | | | |
| | Total Assets | | 1,468,903,952 | |
| | |
| Liabilities | | Payable for: | | | |
| | Investments purchased | | 22,522,499 | |
| | Fund shares repurchased | | 2,870,715 | |
| | Investment advisory fee | | 907,069 | |
| | Pricing and bookkeeping fees | | 12,689 | |
| | Transfer agent fee | | 611,050 | |
| | Trustees’ fees | | 967 | |
| | Custody fee | | 52,618 | |
| | Distribution and service fees | | 191,244 | |
| | Chief compliance officer expenses | | 274 | |
| | Trustees’ deferred compensation plan | | 63,339 | |
| | Other liabilities | | 97,782 | |
| | | | | |
| | Total Liabilities | | 27,330,246 | |
| | |
| | | | | |
| | Net Assets | | 1,441,573,706 | |
| | |
| Net Assets Consist of | | Paid-in capital | | 1,398,361,371 | |
| | Undistributed net investment income | | 5,747,004 | |
| | Accumulated net realized loss | | (22,722,432 | ) |
| | Net unrealized appreciation (depreciation) on: | | | |
| | Investments | | 60,187,802 | |
| | Foreign currency translations | | (39 | ) |
| | | | | |
| | Net Assets | | 1,441,573,706 | |
See Accompanying Notes to Financial Statements.
14
Statement of Assets and Liabilities (continued) – Columbia Small Cap Value Fund I
June 30, 2010
| | | | | | |
| | | | | | |
| Class A | | Net assets | | $ | 593,209,149 | |
| | Shares outstanding | | | 16,553,689 | |
| | Net asset value per share | | $ | 35.84 | (a) |
| | Maximum sales charge | | | 5.75 | % |
| | Maximum offering price per share ($35.84/0.9425) | | $ | 38.03 | (b) |
| | |
| Class B | | Net assets | | $ | 22,775,432 | |
| | Shares outstanding | | | 780,724 | |
| | Net asset value and offering price per share | | $ | 29.17 | (a) |
| | |
| Class C | | Net assets | | $ | 49,887,864 | |
| | Shares outstanding | | | 1,616,212 | |
| | Net asset value and offering price per share | | $ | 30.87 | (a) |
| | |
| Class Y (c) | | Net assets | | $ | 1,110,772 | |
| | Shares outstanding | | | 29,518 | |
| | Net asset value, offering and redemption price per share | | $ | 37.63 | |
| | |
| Class Z | | Net assets | | $ | 774,590,489 | |
| | Shares outstanding | | | 20,602,843 | |
| | Net asset value, offering and redemption price per share | | $ | 37.60 | |
| (a) | Redemption price per share is equal to net asset value less any applicable contingent deferred sales charge. |
| (b) | On sales of $50,000 or more the offering price is reduced. |
| (c) | Class Y shares commenced operations on July 15, 2009. |
See Accompanying Notes to Financial Statements.
15
Statement of Operations – Columbia Small Cap Value Fund I
For the Year Ended June 30, 2010
| | | | | |
| | | | | ($) (a) | |
| Investment Income | | Dividends | | 20,966,107 | |
| | Dividends from affiliates | | 760,581 | |
| | Interest | | 6,780 | |
| | | | | |
| | Total Investment Income | | 21,733,468 | |
| | |
| Expenses | | Investment advisory fee | | 9,677,615 | |
| | Distribution fee: | | | |
| | Class B | | 221,359 | |
| | Class C | | 396,269 | |
| | Service fee: | | | |
| | Class A | | 1,442,237 | |
| | Class B | | 73,786 | |
| | Class C | | 132,091 | |
| | Pricing and bookkeeping fees | | 146,364 | |
| | Transfer agent fee – Class A, Class B, Class C and Class Z | | 2,295,916 | |
| | Transfer agent fee – Class Y | | 45 | |
| | Trustees’ fees | | 62,122 | |
| | Custody fee | | 328,221 | |
| | Chief compliance officer expenses | | 982 | |
| | Other expenses | | 536,995 | |
| | | | | |
| | Expenses before interest expense | | 15,314,002 | |
| | Interest expense | | 860 | |
| | | | | |
| | Total Expenses | | 15,314,862 | |
| | Expense reductions | | (27 | ) |
| | | | | |
| | Net Expenses | | 15,314,835 | |
| | |
| | | | | |
| | Net Investment Income | | 6,418,633 | |
| | |
| Net Realized and Unrealized Gain (Loss) on Investments and Foreign Currency | | Net realized gain on: | | | |
| | Unaffiliated investments | | 52,489,108 | |
| | Affiliated investments | | 864 | |
| | Foreign currency transactions | | 494 | |
| | | | | |
| | Net realized gain | | 52,490,466 | |
| | Net change in unrealized appreciation (depreciation) on: | | | |
| | Investments | | 146,219,335 | |
| | Foreign currency translations | | (39 | ) |
| | | | | |
| | Net change in unrealized appreciation (depreciation) | | 146,219,296 | |
| | | | | |
| | Net Gain | | 198,709,762 | |
| | |
| | | | | |
| | Net Increase Resulting from Operations | | 205,128,395 | |
| (a) | Class Y shares commenced operations on July 15, 2009. |
See Accompanying Notes to Financial Statements.
16
Statement of Changes in Net Assets – Columbia Small Cap Value Fund I
| | | | | | | | |
| | | | | Year Ended June 30, | |
| Increase (Decrease) in Net Assets | | | | 2010 ($) (a)(b) | | | 2009 ($) | |
| Operations | | Net investment income | | 6,418,633 | | | 5,865,359 | |
| | Net realized gain (loss) on investments and foreign currency transactions | | 52,490,466 | | | (67,787,043 | ) |
| | Net change in unrealized appreciation (depreciation) on investments and foreign currency translations | | 146,219,296 | | | (120,306,186 | ) |
| | | | | | | | |
| | Net increase (decrease) resulting from operations | | 205,128,395 | | | (182,227,870 | ) |
| | | |
| Distributions to Shareholders | | From net investment income: | | | | | | |
| | Class A | | (2,853,169 | ) | | (96,427 | ) |
| | Class B | | (69,066 | ) | | — | |
| | Class C | | (111,769 | ) | | — | |
| | Class Y | | (7,732 | ) | | — | |
| | Class Z | | (3,363,591 | ) | | (409,448 | ) |
| | From net realized gains: | | | | | | |
| | Class A | | — | | | (26,043,809 | ) |
| | Class B | | — | | | (2,603,676 | ) |
| | Class C | | — | | | (3,321,986 | ) |
| | Class Z | | — | | | (13,590,135 | ) |
| | | | | | | | |
| | Total distributions to shareholders | | (6,405,327 | ) | | (46,065,481 | ) |
| | | |
| | Net Capital Stock Transactions | | 362,267,219 | | | 247,711,791 | |
| | | |
| | Increase from Regulatory Settlements | | 4,978 | | | 20,959 | |
| | Total increase in net assets | | 560,995,265 | | | 19,439,399 | |
| | | |
| Net Assets | | Beginning of period | | 880,578,441 | | | 861,139,042 | |
| | End of period | | 1,441,573,706 | | | 880,578,441 | |
| | Undistributed net investment income at end of period | | 5,747,004 | | | 5,670,837 | |
| (a) | Class Y shares commenced operations on July 15, 2009. |
| (b) | Class Y shares reflects activity for the period July 15, 2009 through June 30, 2010. |
See Accompanying Notes to Financial Statements.
17
Statement of Changes in Net Assets (continued) – Columbia Small Cap Value Fund I
| | | | | | | | | | | | |
| | | Capital Stock Activity | |
| | | Year Ended
June 30, 2010 (a) | | | Year Ended
June 30, 2009 | |
| | | Shares | | | Dollars ($) | | | Shares | | | Dollars ($) | |
Class A | | | | | | | | | | | | |
Subscriptions | | 6,146,642 | | | 221,981,390 | | | 6,328,169 | | | 197,710,536 | |
Distributions reinvested | | 75,419 | | | 2,640,419 | | | 847,952 | | | 23,835,899 | |
Redemptions | | (4,797,429 | ) | | (173,704,231 | ) | | (5,050,685 | ) | | (152,493,634 | ) |
| | | | | | | | | | | | |
Net increase | | 1,424,632 | | | 50,917,578 | | | 2,125,436 | | | 69,052,801 | |
| | | | |
Class B | | | | | | | | | | | | |
Subscriptions | | 19,122 | | | 550,695 | | | 120,146 | | | 3,182,019 | |
Distributions reinvested | | 2,192 | | | 62,564 | | | 103,495 | | | 2,389,643 | |
Redemptions | | (450,056 | ) | | (13,437,067 | ) | | (553,019 | ) | | (14,125,365 | ) |
| | | | | | | | | | | | |
Net decrease | | (428,742 | ) | | (12,823,808 | ) | | (329,378 | ) | | (8,553,703 | ) |
| | | | |
Class C | | | | | | | | | | | | |
Subscriptions | | 304,578 | | | 9,288,017 | | | 450,221 | | | 12,286,660 | |
Distributions reinvested | | 2,808 | | | 85,020 | | | 104,710 | | | 2,558,051 | |
Redemptions | | (441,992 | ) | | (13,769,158 | ) | | (560,320 | ) | | (14,796,916 | ) |
| | | | | | | | | | | | |
Net increase (decrease) | | (134,606 | ) | | (4,396,121 | ) | | (5,389 | ) | | 47,795 | |
| | | | |
Class Y (b) | | | | | | | | | | | | |
Subscriptions | | 61,757 | | | 2,010,000 | | | — | | | — | |
Distributions reinvested | | 211 | | | 7,732 | | | — | | | — | |
Redemptions | | (32,450 | ) | | (1,129,792 | ) | | — | | | — | |
| | | | | | | | | | | | |
Net increase | | 29,518 | | | 887,940 | | | — | | | — | |
| | | | |
Class Z | | | | | | | | | | | | |
Subscriptions | | 13,255,465 | | | 499,789,626 | | | 8,119,589 | | | 249,737,204 | |
Distributions reinvested | | 55,528 | | | 2,036,209 | | | 348,224 | | | 10,237,790 | |
Redemptions | | (4,575,482 | ) | | (174,144,205 | ) | | (2,317,324 | ) | | (72,810,096 | ) |
| | | | | | | | | | | | |
Net increase | | 8,735,511 | | | 327,681,630 | | | 6,150,489 | | | 187,164,898 | |
| (a) | Class Y shares reflects activity for the period July 15, 2009 through June 30, 2010. |
| (b) | Class Y shares commenced operations on July 15, 2009. |
See Accompanying Notes to Financial Statements.
18
Financial Highlights – Columbia Small Cap Value Fund I
Selected data for a share outstanding throughout each period is as follows:
| | | | | | | | | | | | | | | | | | | | |
| | | Year Ended June 30, | |
| Class A Shares | | 2010 | | | 2009 | | | 2008 | | | 2007 | | | 2006 | |
Net Asset Value, Beginning of Period | | $ | 29.29 | | | $ | 39.50 | | | $ | 52.16 | | | $ | 48.03 | | | $ | 43.12 | |
| | | | | |
Income from Investment Operations: | | | | | | | | | | | | | | | | | | | | |
Net investment income (a) | | | 0.15 | | | | 0.23 | (b) | | | 0.15 | | | | 0.12 | (c) | | | 0.06 | |
Net realized and unrealized gain (loss) on investments and foreign currency | | | 6.58 | | | | (8.50 | ) | | | (8.46 | ) | | | 7.61 | | | | 6.82 | |
| | | | | | | | | | | | | | | | | | | | |
Total from investment operations | | | 6.73 | | | | (8.27 | ) | | | (8.31 | ) | | | 7.73 | | | | 6.88 | |
| | | | | |
Less Distributions to Shareholders: | | | | | | | | | | | | | | | | | | | | |
From net investment income | | | (0.18 | ) | | | (0.01 | ) | | | (0.14 | ) | | | (0.01 | ) | | | — | |
From net realized gains | | | — | | | | (1.93 | ) | | | (4.21 | ) | | | (3.59 | ) | | | (1.97 | ) |
| | | | | | | | | | | | | | | | | | | | |
Total distributions to shareholders | | | (0.18 | ) | | | (1.94 | ) | | | (4.35 | ) | | | (3.60 | ) | | | (1.97 | ) |
| | | | | |
Increase from regulatory settlements | | | — | (d) | | | — | (d) | | | — | | | | — | | | | — | |
| | | | | |
Net Asset Value, End of Period | | $ | 35.84 | | | $ | 29.29 | | | $ | 39.50 | | | $ | 52.16 | | | $ | 48.03 | |
Total return (e) | | | 22.99 | % | | | (20.73 | )% | | | (16.96 | )% | | | 16.61 | % | | | 16.25 | %(f)(g) |
| | | | | |
Ratios to Average Net Assets/Supplemental Data: | | | | | | | | | | | | | | | | | | | | |
Net expenses before interest expense (h) | | | 1.27 | % | | | 1.38 | % | | | 1.26 | % | | | 1.29 | % | | | 1.28 | % |
Interest expense (i) | | | — | % | | | — | % | | | — | % | | | — | % | | | — | % |
Net expenses (h) | | | 1.27 | % | | | 1.38 | % | | | 1.26 | % | | | 1.29 | % | | | 1.28 | % |
Waiver/Reimbursement | | | — | | | | — | | | | — | | | | — | | | | 0.01 | % |
Net investment income (h) | | | 0.43 | % | | | 0.74 | % | | | 0.29 | % | | | 0.25 | % | | | 0.13 | % |
Portfolio turnover rate | | | 30 | % | | | 50 | % | | | 40 | % | | | 39 | % | | | 32 | % |
Net assets, end of period (000s) | | $ | 593,209 | | | $ | 443,154 | | | $ | 513,671 | | | $ | 663,160 | | | $ | 505,971 | |
| (a) | Per share data was calculated using the average shares outstanding during the period. |
| (b) | Net investment income per share reflects special dividends. The effect of these dividends amounted to $0.03 per share. |
| (c) | Net investment income per share reflects special dividends. The effect of these dividends amounted to $0.05 per share. |
| (d) | Rounds to less than $0.01 per share. |
| (e) | Total return at net asset value assuming all distributions reinvested and no initial sales charge or contingent deferred sales charge. |
| (f) | Total return includes a voluntary reimbursement by the investment advisor for a realized investment loss due to a trading error. This reimbursement increased total return and net asset value per share by less than 0.01% and less than $0.01, respectively. |
| (g) | Had the investment advisor and/or any of its affiliates not waived fees or reimbursed a portion of expenses, total return would have been reduced. |
| (h) | The benefits derived from expense reductions had an impact of less than 0.01%. |
| (i) | Rounds to less than 0.01%. |
See Accompanying Notes to Financial Statements.
19
Financial Highlights – Columbia Small Cap Value Fund I
Selected data for a share outstanding throughout each period is as follows:
| | | | | | | | | | | | | | | | | | | | |
| | | Year Ended June 30, | |
| Class B Shares | | 2010 | | | 2009 | | | 2008 | | | 2007 | | | 2006 | |
Net Asset Value, Beginning of Period | | $ | 23.96 | | | $ | 33.00 | | | $ | 44.51 | | | $ | 41.75 | | | $ | 38.00 | |
| | | | | |
Income from Investment Operations: | | | | | | | | | | | | | | | | | | | | |
Net investment loss (a) | | | (0.10 | ) | | | (0.01 | )(b) | | | (0.21 | ) | | | (0.24 | )(c) | | | (0.26 | ) |
Net realized and unrealized gain (loss) on investments and foreign currency | | | 5.38 | | | | (7.10 | ) | | | (7.09 | ) | | | 6.59 | | | | 5.98 | |
| | | | | | | | | | | | | | | | | | | | |
Total from investment operations | | | 5.28 | | | | (7.11 | ) | | | (7.30 | ) | | | 6.35 | | | | 5.72 | |
| | | | | |
Less Distributions to Shareholders: | | | | | | | | | | | | | | | | | | | | |
From net investment income | | | (0.07 | ) | | | — | | | | — | | | | — | | | | — | |
From net realized gains | | | — | | | | (1.93 | ) | | | (4.21 | ) | | | (3.59 | ) | | | (1.97 | ) |
| | | | | | | | | | | | | | | | | | | | |
Total distributions to shareholders | | | (0.07 | ) | | | (1.93 | ) | | | (4.21 | ) | | | (3.59 | ) | | | (1.97 | ) |
| | | | | |
Increase from regulatory settlements | | | — | (d) | | | — | (d) | | | — | | | | — | | | | — | |
| | | | | |
Net Asset Value, End of Period | | $ | 29.17 | | | $ | 23.96 | | | $ | 33.00 | | | $ | 44.51 | | | $ | 41.75 | |
Total return (e) | | | 22.02 | % | | | (21.31 | )% | | | (17.58 | )% | | | 15.74 | % | | | 15.36 | %(f)(g) |
| | | | | |
Ratios to Average Net Assets/Supplemental Data: | | | | | | | | | | | | | | | | | | | | |
Net expenses before interest expense (h) | | | 2.02 | % | | | 2.13 | % | | | 2.01 | % | | | 2.04 | % | | | 2.03 | % |
Interest expense (i) | | | — | % | | | — | % | | | — | % | | | — | % | | | — | % |
Net expenses (h) | | | 2.02 | % | | | 2.13 | % | | | 2.01 | % | | | 2.04 | % | | | 2.03 | % |
Waiver/Reimbursement | | | — | | | | — | | | | — | | | | — | | | | 0.01 | % |
Net investment loss (h) | | | (0.33 | )% | | | (0.02 | )% | | | (0.47 | )% | | | (0.55 | )% | | | (0.64 | )% |
Portfolio turnover rate | | | 30 | % | | | 50 | % | | | 40 | % | | | 39 | % | | | 32 | % |
Net assets, end of period (000s) | | $ | 22,775 | | | $ | 28,977 | | | $ | 50,784 | | | $ | 97,425 | | | $ | 135,721 | |
| (a) | Per share data was calculated using the average shares outstanding during the period. |
| (b) | Net investment income per share reflects special dividends. The effect of these dividends amounted to $0.03 per share. |
| (c) | Net investment income per share reflects special dividends. The effect of these dividends amounted to $0.05 per share. |
| (d) | Rounds to less than $0.01 per share. |
| (e) | Total return at net asset value assuming all distributions reinvested and no contingent deferred sales charge. |
| (f) | Total return includes a voluntary reimbursement by the investment advisor for a realized investment loss due to a trading error. This reimbursement increased total return and net asset value per share by less than 0.01% and less than $0.01, respectively. |
| (g) | Had the investment advisor and/or any of its affiliates not waived fees or reimbursed a portion of expenses, total return would have been reduced. |
| (h) | The benefits derived from expense reductions had an impact of less than 0.01%. |
| (i) | Rounds to less than 0.01%. |
See Accompanying Notes to Financial Statements.
20
Financial Highlights – Columbia Small Cap Value Fund I
Selected data for a share outstanding throughout each period is as follows:
| | | | | | | | | | | | | | | | | | | | |
| | | Year Ended June 30, | |
| Class C Shares | | 2010 | | | 2009 | | | 2008 | | | 2007 | | | 2006 | |
Net Asset Value, Beginning of Period | | $ | 25.35 | | | $ | 34.76 | | | $ | 46.65 | | | $ | 43.60 | | | $ | 39.60 | |
| | | | | |
Income from Investment Operations: | | | | | | | | | | | | | | | | | | | | |
Net investment loss (a) | | | (0.10 | ) | | | — | (b)(c) | | | (0.22 | ) | | | (0.23 | )(d) | | | (0.26 | ) |
Net realized and unrealized gain (loss) on investments and foreign currency | | | 5.69 | | | | (7.48 | ) | | | (7.46 | ) | | | 6.87 | | | | 6.23 | |
| | | | | | | | | | | | | | | | | | | | |
Total from investment operations | | | 5.59 | | | | (7.48 | ) | | | (7.68 | ) | | | 6.64 | | | | 5.97 | |
| | | | | |
Less Distributions to Shareholders: | | | | | | | | | | | | | | | | | | | | |
From net investment income | | | (0.07 | ) | | | — | | | | — | | | | — | | | | — | |
From net realized gains | | | — | | | | (1.93 | ) | | | (4.21 | ) | | | (3.59 | ) | | | (1.97 | ) |
| | | | | | | | | | | | | | | | | | | | |
Total distributions to shareholders | | | (0.07 | ) | | | (1.93 | ) | | | (4.21 | ) | | | (3.59 | ) | | | (1.97 | ) |
| | | | | |
Increase from regulatory settlements | | | — | (c) | | | — | (c) | | | — | | | | — | | | | — | |
| | | | | |
Net Asset Value, End of Period | | $ | 30.87 | | | $ | 25.35 | | | $ | 34.76 | | | $ | 46.65 | | | $ | 43.60 | |
Total return (e) | | | 22.04 | % | | | (21.30 | )% | | | (17.59 | )% | | | 15.74 | % | | | 15.37 | %(f)(g) |
| | | | | |
Ratios to Average Net Assets/Supplemental Data: | | | | | | | | | | | | | | | | | | | | |
Net expenses before interest expense (h) | | | 2.02 | % | | | 2.13 | % | | | 2.01 | % | | | 2.04 | % | | | 2.03 | % |
Interest expense (i) | | | — | % | | | — | % | | | — | % | | | — | % | | | — | % |
Net expenses (h) | | | 2.02 | % | | | 2.13 | % | | | 2.01 | % | | | 2.04 | % | | | 2.03 | % |
Waiver/Reimbursement | | | — | | | | — | | | | — | | | | — | | | | 0.01 | % |
Net investment loss (h) | | | (0.33 | )% | | | (0.01 | )% | | | (0.47 | )% | | | (0.51 | )% | | | (0.62 | )% |
Portfolio turnover rate | | | 30 | % | | | 50 | % | | | 40 | % | | | 39 | % | | | 32 | % |
Net assets, end of period (000s) | | $ | 49,888 | | | $ | 44,377 | | | $ | 61,053 | | | $ | 87,642 | | | $ | 68,436 | |
| (a) | Per share data was calculated using the average shares outstanding during the period. |
| (b) | Net investment income per share reflects special dividends. The effect of these dividends amounted to $0.03 per share. |
| (c) | Rounds to less than $0.01 per share. |
| (d) | Net investment income per share reflects special dividends. The effect of these dividends amounted to $0.05 per share. |
| (e) | Total return at net asset value assuming all distributions reinvested and no contingent deferred sales charge. |
| (f) | Total return includes a voluntary reimbursement by the investment advisor for a realized investment loss due to a trading error. This reimbursement increased total return and net asset value per share by less than 0.01% and less than $0.01, respectively. |
| (g) | Had the investment advisor and/or any of its affiliates not waived fees or reimbursed a portion of expenses, total return would have been reduced. |
| (h) | The benefits derived from expense reductions had an impact of less than 0.01%. |
| (i) | Rounds to less than 0.01%. |
See Accompanying Notes to Financial Statements.
21
Financial Highlights – Columbia Small Cap Value Fund I
Selected data for a share outstanding for the period is as follows:
| | | | |
| Class Y Shares | | Period Ended
June 30,
2010 (a) | |
Net Asset Value, Beginning of Period | | $ | 31.68 | |
| |
Income from Investment Operations: | | | | |
Net investment income (b) | | | 0.31 | |
Net realized and unrealized gain on investment and foreign currency | | | 5.88 | |
| | | | |
Total from investment operations | | | 6.19 | |
| |
Less Distributions to Shareholders: | | | | |
From net investment income | | | (0.24 | ) |
| |
Increase from regulatory settlements | | | — | (c) |
| |
Net Asset Value, End of Period | | $ | 37.63 | |
Total return (d) | | | 19.57 | %(e) |
| |
Ratios to Average Net Assets/Supplemental Data: | | | | |
Net expenses before interest expense (f) | | | 0.85 | %(g) |
Interest expense (h) | | | — | % |
Net expenses (f) | | | 0.85 | %(g) |
Net investment income (f) | | | 0.85 | %(g) |
Portfolio turnover rate | | | 30 | %(e) |
Net assets, end of period (000s) | | $ | 1,111 | |
| (a) | Class Y shares commenced operations on July 15, 2009. Per share data and total return reflect activity from that date. |
| (b) | Per share data was calculated using the average shares outstanding during the period. |
| (c) | Rounds to less than $0.01 per share. |
| (d) | Total return at net asset value assuming all distributions reinvested. |
| (f) | The benefits derived from expense reductions had an impact of less than 0.01%. |
| (h) | Rounds to less than 0.01%. |
See Accompanying Notes to Financial Statements.
22
Financial Highlights – Columbia Small Cap Value Fund I
Selected data for a share outstanding throughout each period is as follows:
| | | | | | | | | | | | | | | | | | | | |
| | | Year Ended June 30, | |
| Class Z Shares | | 2010 | | | 2009 | | | 2008 | | | 2007 | | | 2006 | |
Net Asset Value, Beginning of Period | | $ | 30.68 | | | $ | 41.22 | | | $ | 54.23 | | | $ | 49.79 | | | $ | 44.54 | |
| | | | | |
Income from Investment Operations: | | | | | | | | | | | | | | | | | | | | |
Net investment income (a) | | | 0.26 | | | | 0.32 | (b) | | | 0.30 | | | | 0.26 | (c) | | | 0.18 | |
Net realized and unrealized gain (loss) on investments and foreign currency | | | 6.88 | | | | (8.87 | ) | | | (8.84 | ) | | | 7.90 | | | | 7.05 | |
| | | | | | | | | | | | | | | | | | | | |
Total from investment operations | | | 7.14 | | | | (8.55 | ) | | | (8.54 | ) | | | 8.16 | | | | 7.23 | |
| | | | | |
Less Distributions to Shareholders: | | | | | | | | | | | | | | | | | | | | |
From net investment income | | | (0.22 | ) | | | (0.06 | ) | | | (0.26 | ) | | | (0.13 | ) | | | (0.01 | ) |
From net realized gains | | | — | | | | (1.93 | ) | | | (4.21 | ) | | | (3.59 | ) | | | (1.97 | ) |
| | | | | | | | | | | | | | | | | | | | |
Total distributions to shareholders | | | (0.22 | ) | | | (1.99 | ) | | | (4.47 | ) | | | (3.72 | ) | | | (1.98 | ) |
| | | | | |
Increase from regulatory settlements | | | — | (d) | | | — | (d) | | | — | | | | — | | | | — | |
| | | | | |
Net Asset Value, End of Period | | $ | 37.60 | | | $ | 30.68 | | | $ | 41.22 | | | $ | 54.23 | | | $ | 49.79 | |
Total return (e) | | | 23.28 | % | | | (20.53 | )% | | | (16.74 | )% | | | 16.91 | % | | | 16.51 | %(f)(g) |
| | | | | |
Ratios to Average Net Assets/Supplemental Data: | | | | | | | | | | | | | | | | | | | | |
Net expenses before interest expense (h) | | | 1.02 | % | | | 1.13 | % | | | 1.01 | % | | | 1.04 | % | | | 1.03 | % |
Interest expense (i) | | | — | % | | | — | % | | | — | % | | | — | % | | | — | % |
Net expenses (h) | | | 1.02 | % | | | 1.13 | % | | | 1.01 | % | | | 1.04 | % | | | 1.03 | % |
Waiver/Reimbursement | | | — | | | | — | | | | — | | | | — | | | | 0.01 | % |
Net investment income (h) | | | 0.69 | % | | | 1.00 | % | | | 0.55 | % | | | 0.51 | % | | | 0.37 | % |
Portfolio turnover rate | | | 30 | % | | | 50 | % | | | 40 | % | | | 39 | % | | | 32 | % |
Net assets, end of period (000s) | | $ | 774,590 | | | $ | 364,071 | | | $ | 235,632 | | | $ | 177,158 | | | $ | 113,833 | |
| (a) | Per share data was calculated using the average shares outstanding during the period. |
| (b) | Net investment income per share reflects special dividends. The effect of these dividends amounted to $0.03 per share. |
| (c) | Net investment income per share reflects special dividends. The effect of these dividends amounted to $0.05 per share. |
| (d) | Rounds to less than $0.01 per share. |
| (e) | Total return at net asset value assuming all distributions reinvested. |
| (f) | Total return includes a voluntary reimbursement by the investment advisor for a realized investment loss due to a trading error. This reimbursement increased total return and net asset value per share by less than 0.01% and less than $0.01, respectively. |
| (g) | Had the investment advisor and/or any of its affiliates not waived fees or reimbursed a portion of expenses, total return would have been reduced. |
| (h) | The benefits derived from expense reductions had an impact of less than 0.01%. |
| (i) | Rounds to less than 0.01%. |
See Accompanying Notes to Financial Statements.
23
Notes to Financial Statements – Columbia Small Cap Value Fund I
June 30, 2010
Note 1. Organization
Columbia Small Cap Value Fund I (the “Fund”), a series of Columbia Funds Series Trust I (the “Trust”), is a diversified portfolio. The Trust is registered under the Investment Company Act of 1940, as amended (the “1940 Act”), as an open-end management investment company organized as a Massachusetts business trust.
Investment Objective
The Fund seeks long-term capital appreciation.
Fund Shares
The Trust may issue an unlimited number of shares, and the Fund offers five classes of shares: Class A, Class B, Class C, Class Y and Class Z. Each share class has its own expense structure and sales charges, as applicable. Class Y shares commenced operations effective July 15, 2009. As of the close of business on June 30, 2010, the Fund no longer accepts investments from new or existing investors, subject to certain limited exceptions as described in the Fund’s prospectus. Also, additional Class B shares will be issued only in connection with the reinvestment of any dividend and/or capital gain distributions in Class B shares of the Fund and exchanges by existing Class B shareholders of the other Columbia Funds.
Class A shares are subject to a maximum front-end sales charge of 5.75% based on the amount of initial investment. Class A shares purchased without an initial sales charge in accounts aggregating $1 million to $50 million at the time of purchase are subject to a 1.00% contingent deferred sales charge (“CDSC”) if the shares are sold within one year after purchase. Class B shares are subject to a maximum CDSC of 5.00% based upon the holding period after purchase. Class B shares will convert to Class A shares eight years after purchase. Class C shares are subject to a 1.00% CDSC on shares sold within one year after purchase. Class Y and Class Z shares are offered continuously at net asset value. There are certain restrictions on the purchase of Class Y and Class Z shares, as described in the Fund’s prospectus.
Note 2. Significant Accounting Policies
The preparation of financial statements in accordance with accounting principles generally accepted in the United States of America (“GAAP”) requires management to make certain estimates and assumptions that affect the reported amounts of assets and liabilities, the disclosure of contingent assets and liabilities at the date of the financial statements and the reported amounts of revenue and expenses during the reporting period. Actual results could differ from those estimates.
Management has evaluated the events and transactions that have occurred through the date the financial statements were issued and noted no items requiring adjustment of the financial statements or additional disclosures.
The following is a summary of significant accounting policies consistently followed by the Fund in the preparation of its financial statements.
Security Valuation
Equity securities are valued at the last sale price on the principal exchange on which they trade, except for securities traded on the NASDAQ, which are valued at the NASDAQ official close price. Unlisted securities or listed securities for which there were no sales during the day are valued at the closing bid price on such exchanges or over-the-counter markets.
Short-term investments maturing in 60 days or less are valued at amortized cost, which approximates market value.
Foreign securities are generally valued at the last sale price on the foreign exchange or market on which they trade. If any foreign share prices are not readily available as a result of limited share activity, the securities are valued at the last sale price of the local shares in the principal market in which such securities are normally traded.
Generally, trading in foreign securities is substantially completed each day at various times prior to the close of the New York Stock Exchange (“NYSE”). The values of such securities used in computing the net asset value of the Fund’s shares are determined as of such times. Foreign currency exchange rates are generally determined at 4:00 p.m. Eastern (U.S.) time. Occasionally, events affecting the values of such foreign securities and such exchange rates may occur between the times at which they are determined and the close of the customary trading session of the NYSE, which would not be reflected in the computation of the Fund’s net asset value. If events materially affecting the values of such foreign securities occur and it is determined that market
24
Columbia Small Cap Value Fund I
June 30, 2010
quotations are not reliable, then these foreign securities will be valued at their fair value using procedures approved by the Board of Trustees.
Investments for which market quotations are not readily available, or that have quotations which management believes are not reliable, are valued at fair value as determined in good faith under consistently applied procedures established by and under the general supervision of the Board of Trustees. If a security is valued at fair value, such value is likely to be different from the last quoted market price for the security. The determination of fair value often requires significant judgment. To determine fair value, management may use assumptions including but not limited to future cash flows and estimated risk premiums. Multiple inputs from various sources may be used to determine value.
GAAP establishes a hierarchy that prioritizes the inputs to valuation techniques used to measure fair value giving the highest priority to unadjusted quoted prices in active markets for identical securities (level 1 measurements) and the lowest priority to unobservable inputs (level 3 measurements) when market prices are not readily available or reliable. The three levels of the fair value hierarchy are described below:
| n | | Level 1 — quoted prices in active markets for identical securities |
| n | | Level 2 — prices determined using other significant observable inputs (including quoted prices for similar securities, interest rates, prepayment speeds, credit risk and others) |
| n | | Level 3 — prices determined using significant unobservable inputs. In situations where quoted prices or observable inputs are unavailable or less reliable, unobservable inputs may be used. Unobservable inputs may include management’s own assumptions about the factors market participants would use in pricing an investment. |
The inputs or methodology used for valuing securities are not necessarily an indication of the risk associated with investing in those securities.
On January 21, 2010, the Financial Accounting Standards Board issued an Accounting Standards Update (the “amendment”), Fair Value Measurements and Disclosures (Topic 820): Improving Disclosures about Fair Value Measurements, which provides guidance on how investment assets and liabilities are to be valued and disclosed. Specifically, the amendment requires reporting entities to disclose the input and valuation techniques used to measure fair value for both recurring and nonrecurring fair value measurements for Level 2 and Level 3 positions. The amendment also requires that transfers between all levels (including Level 1 and Level 2) be disclosed on a gross basis (i.e., transfers out must be disclosed separately from transfers in), and the reason(s) for the transfer. Additionally, purchases, sales, issuances and settlements must be disclosed on a gross basis in the Level 3 rollforward. The effective date of the amendment is for interim and annual periods beginning after December 15, 2009; except for the requirement to provide the Level 3 activity for purchases, sales, issuances and settlements on a gross basis, which will be effective for interim and annual periods beginning after December 15, 2010. At this time, management is evaluating the implications of the amendment and the impact to the financial statements.
Security Transactions
Security transactions are accounted for on the trade date. Cost is determined and gains (losses) are based upon the specific identification method for both financial statement and federal income tax purposes.
Repurchase Agreements
The Fund may engage in repurchase agreement transactions with institutions that management has determined are creditworthy. The Fund, through its custodian, receives delivery of the underlying securities collateralizing a repurchase agreement. Management is responsible for determining that the collateral is at least equal, at all times, to the value of the repurchase obligation including interest. A repurchase agreement transaction involves certain risks in the event of default or insolvency of the counterparty. These risks include possible delays in or restrictions on the Fund’s ability to dispose of the underlying securities and a possible decline in the value of the underlying securities during the period while the Fund seeks to assert its rights.
Foreign Currency Transactions and Translations
The values of all assets and liabilities quoted in foreign currencies are translated into U.S. dollars at that day’s exchange rates. Net realized and unrealized gains (losses) on
25
Columbia Small Cap Value Fund I
June 30, 2010
foreign currency transactions and translations include gains (losses) arising from the fluctuation in exchange rates between trade and settlement dates on securities transactions, gains (losses) arising from the disposition of foreign currency and currency gains (losses) between the accrual and payment dates on dividends, interest income and foreign withholding taxes.
For financial statement purposes, the Fund does not distinguish that portion of gains (losses) on investments which is due to changes in foreign exchange rates from that which is due to changes in market prices of the investments. Such fluctuations are included with the net realized and unrealized gains (losses) on investments on the Statement of Operations.
Income Recognition
Interest income is recorded on the accrual basis.
Corporate actions and dividend income are recorded on the ex-date except for certain foreign securities which are recorded as soon after the ex-date as the Fund becomes aware of such, net of any non-reclaimable tax withholdings.
Distributions received from real estate investment trusts (REITs) in excess of their income are recorded as a reduction of the cost of the related investments. If the Fund no longer owns the applicable securities, any distributions received in excess of income are recorded as realized gains.
Awards from class action litigation are recorded as a reduction of cost if the Fund still owns the applicable securities on the payment date. If the Fund no longer owns the applicable securities, the proceeds are recorded as realized gains.
Expenses
General expenses of the Trust are allocated to the Fund and other series of the Trust based upon relative net assets or other expense allocation methodologies determined by the nature of the expense. Expenses directly attributable to a specific class of shares are charged to that share class. Expenses directly attributable to the Fund are charged to the Fund.
Determination of Class Net Asset Value
All income, expenses (other than class-specific expenses, as shown on the Statement of Operations) and realized and unrealized gains (losses) are allocated to each class of the Fund on a daily basis, based on the relative net assets of each class, for purposes of determining the net asset value of each class.
Federal Income Tax Status
The Fund intends to qualify each year as a “regulated investment company” under Subchapter M of the Internal Revenue Code, as amended, and will distribute substantially all of its taxable income, if any, for its tax year, and as such will not be subject to federal income taxes. In addition, the Fund intends to distribute in each calendar year substantially all of its net investment income, capital gains and certain other amounts, if any, such that the Fund should not be subject to federal excise tax. Therefore, no provision is made for federal income or excise taxes.
Distributions to Shareholders
Distributions from net investment income, if any, are declared and paid annually. Net realized capital gains, if any, are distributed at least annually. Income distributions and capital gain distributions are determined in accordance with federal income tax regulations which may differ from GAAP.
Indemnification
In the normal course of business, the Fund enters into contracts that contain a variety of representations and warranties and which provide general indemnities. The Fund’s maximum exposure under these arrangements is unknown because this would involve future claims against the Fund. Also, under the Trust’s organizational documents and by contract, the Trustees and officers of the Trust are indemnified against certain liabilities that may arise out of actions relating to their duties to the Trust. However, based on experience, the Fund expects the risk of loss due to these representations, warranties and indemnities to be minimal.
Note 3. Federal Tax Information
The timing and character of income and capital gain distributions are determined in accordance with income tax regulations, which may differ from GAAP. Reclassifications are made to the Fund’s capital accounts for permanent tax differences to reflect income and gains available for distribution (or available capital loss carryforwards) under income tax regulations.
26
‘
Columbia Small Cap Value Fund I
June 30, 2010
For the year ended June 30, 2010, permanent book and tax basis differences resulting primarily from differing treatments for foreign currency transactions, proceeds from litigation settlements and passive foreign investment company (“PFIC”) adjustments were identified and reclassified among the components of the Fund’s net assets as follows:
| | | | |
| | | | | |
Undistributed Net Investment Income | | Accumulated Net Realized
Loss | | Paid-In Capital |
| $62,861 | | $(1,690) | | $(61,171) |
Net investment income and net realized gains (losses), as disclosed on the Statement of Operations, and net assets were not affected by this reclassification.
The tax character of distributions paid during the years ended June 30, 2010 and June 30, 2009 was as follows:
| | | | | | |
| | | June 30, |
| | | 2010 | | 2009 |
| Distributions paid from: | | | | |
Ordinary Income* | | $ | 6,405,327 | | $ | 505,874 |
Long-Term Capital Gains | | | — | | | 45,559,607 |
| * | For tax purposes short-term capital gain distributions, if any, are considered ordinary income distributions. |
As of June 30, 2010, the components of distributable earnings on a tax basis were as follows:
| | | | |
| | | | | |
Undistributed
Ordinary Income | | Undistributed Long-Term Capital Gains | | Net
Unrealized Appreciation* |
| $10,181,746 | | $— | | $49,891,336 |
| * | The differences between book-basis and tax-basis net unrealized appreciation are primarily due to deferral of losses from wash sales and PFIC adjustments. |
Unrealized appreciation and depreciation at June 30, 2010, based on cost of investments for federal income tax purposes were:
| | | | |
| | | | |
Unrealized appreciation | | $ | 162,722,830 | |
Unrealized depreciation | | | (112,831,494 | ) |
Net unrealized appreciation | | $ | 49,891,336 | |
The following capital loss carryforwards may be available to reduce taxable income arising from future net realized gains on investments, if any, to the extent permitted by the Internal Revenue Code:
| | | |
| | | |
| Year of Expiration | | Capital Loss Carryforwards |
| 2012* | | $ | 4,144,552 |
| 2017 | | | 12,636,496 |
| | | |
| | $ | 16,781,048 |
| * | These carryforwards remain from the Fund’s merger with Liberty Contrarian Small Cap Fund on 11/01/2002. Utilization of Liberty Contrarian Small Cap Fund’s losses could be subject to limitations imposed by the Internal Revenue Code. |
Capital loss carryforwards of $789,231 were utilized during the year ended June 30, 2010.
Management is required to determine whether a tax position of the Fund is more likely than not to be sustained upon examination by the applicable taxing authority, including resolution of any related appeals or litigation processes, based on the technical merits of the position. The tax benefit to be recognized by the Fund is measured as the largest amount of benefit that is greater than fifty percent likely of being realized upon ultimate settlement. Management is not aware of any tax positions for which it is reasonably possible that the total amounts of unrecognized tax benefits will significantly change in the next twelve months. However, management’s conclusions may be subject to review and adjustment at a later date based on factors including, but not limited to, new tax laws, regulations, and administrative interpretations (including relevant court decisions). The Fund’s federal tax returns for the prior three fiscal years remain subject to examination by the Internal Revenue Service.
Note 4. Fees and Compensation Paid to Affiliates
Investment Advisory Fee
After the close of business on April 30, 2010, Ameriprise Financial, Inc. (“Ameriprise Financial”) acquired a portion of the asset management business of Columbia Management Group, LLC (the “Transaction”), including the business of managing the Fund. In connection with the closing of the Transaction (the “Closing”), RiverSource Investments, LLC, a wholly owned subsidiary of Ameriprise Financial, became the investment advisor of the Fund and subsequently changed its name to Columbia Management Investment Advisers, LLC (the “New Advisor”). The New Advisor receives a monthly
27
Columbia Small Cap Value Fund I
June 30, 2010
investment advisory fee based on the Fund’s average daily net assets at the following annual rates:
| | |
| | | |
| Average Daily Net Assets | | Annual Fee Rate |
First $500 million | | 0.80% |
$500 million to $1 billion | | 0.75% |
Over $1 billion | | 0.70% |
For the year ended June 30, 2010, the Fund’s effective investment advisory fee rate was 0.76% of the Fund’s average daily net assets.
Prior to the Closing, Columbia Management Advisors, LLC (“Columbia”), an indirect, wholly owned subsidiary of Bank of America Corporation (“BOA”), provided investment advisory, administrative and other services to the Fund under the same fee structure.
Administration Fee
Effective upon the Closing, the New Advisor became the administrator of the Fund under a new Administrative Services Agreement (the “Administrative Agreement”). Under the Administrative Agreement, the New Advisor provides administrative and other services to the Fund, including services previously performed under the Pricing and Bookkeeping Oversight and Services Agreement discussed below. The New Advisor does not receive a fee for its services under the Administrative Agreement.
Pricing and Bookkeeping Fees
Prior to the Closing, the Fund entered into a Financial Reporting Services Agreement (the “Financial Reporting Services Agreement”) with State Street Bank and Trust Company (“State Street”) and Columbia pursuant to which State Street provides financial reporting services to the Fund. The Fund also entered into an Accounting Services Agreement (collectively with the Financial Reporting Services Agreement, the “State Street Agreements”) with State Street and Columbia pursuant to which State Street provides accounting services to the Fund. Upon the Closing, Columbia assigned and delegated its rights and obligations under the State Street Agreements to the New Advisor. Under the State Street Agreements, the Fund pays State Street an annual fee of $38,000 paid monthly plus an additional monthly fee based on an annualized percentage rate of average daily net assets of the Fund for the month. The aggregate fee will not exceed $140,000 per year (exclusive of out-of-pocket expenses and charges). The Fund also reimburses State Street for certain out-of-pocket expenses and charges.
Also prior to the Closing, the Fund entered into a Pricing and Bookkeeping Oversight and Services Agreement (the “Services Agreement”) with Columbia. Under the Services Agreement, Columbia provided services related to Fund expenses and the requirements of the Sarbanes-Oxley Act of 2002, and provided oversight of the accounting and financial reporting services provided by State Street. Under the Services Agreement, the Fund reimbursed Columbia for out-of-pocket expenses. The Services Agreement was terminated upon the Closing. These services are now provided under the Administrative Agreement discussed above.
Transfer Agent Fee
In connection with the Closing, RiverSource Service Corporation, a wholly owned subsidiary of Ameriprise Financial, became the transfer agent of the Fund and subsequently changed its name to Columbia Management Investment Services Corp. (the “New Transfer Agent”). The New Transfer Agent has contracted with Boston Financial Data Services (“BFDS”) to serve as sub-transfer agent.
The New Transfer Agent receives a monthly fee for its services. All share classes, with the exception of Class Y shares (the “Other Share Classes”) pay a monthly service fee (the “aggregate fee”) based on the following:
| (i) | An annual rate of $22.36 is applied to the aggregate number of accounts for the Other Share Classes. |
| (ii) | An allocated portion of fees for wire, telephone and redemption orders, Individual Retirement Account (“IRA”) trustee agent fees and account transcript fees due to the New Transfer Agent from shareholders of the Fund and credits (net of bank charges) earned with respect to balances in accounts the New Transfer Agent maintains in connection with its services to the Fund. The New Transfer Agent also receives reimbursement for certain out-of-pocket expenses. |
The aggregate fee is allocated to the Other Share Classes based on the relative average daily net assets of each share class.
28
Columbia Small Cap Value Fund I
June 30, 2010
Class Y shares of the Fund pay a monthly service fee based on the following:
| (i) | An annual rate of $22.36 is applied to the aggregate number of accounts for Class Y shares. |
| (ii) | An allocated portion of fees for wire, telephone and redemption orders, IRA trustee agent fees and account transcript fees due to the New Transfer Agent from shareholders of the Fund and credits (net of bank charges) earned with respect to balances in accounts the New Transfer Agent maintains in connection with its services to the Fund. The New Transfer Agent also receives reimbursement for certain out-of-pocket expenses. |
The New Transfer Agent also receives reimbursement of certain sub-transfer agent fees paid by the New Transfer Agent (exclusive of BFDS fees), calculated based on the combined assets held in the Other Share Classes in omnibus accounts and intended to recover the cost of payments to other parties (including affiliates of BOA) for services to those accounts. Such fees are allocated to the Other Share Classes based on the relative average daily net assets of each share class. The New Transfer Agent pays the fees of BFDS for services as sub-transfer agent and is not entitled to reimbursement for such fees from the Fund.
Prior to the Closing, Columbia Management Services, Inc. (the “Previous Transfer Agent”), an affiliate of Columbia and an indirect, wholly owned subsidiary of BOA, provided shareholder services to the Fund and contracted with BFDS to serve as sub-transfer agent, under the same fee structure. Prior to November 1, 2009, all share classes paid a monthly service fee at the annual rate of $17.34 per open account.
An annual minimum account balance fee of $20 may apply to certain accounts with a value below the Fund’s initial minimum investment requirements to reduce the impact of small accounts on transfer agent fees. These minimum account balance fees are recorded as part of expense reductions on the Statement of Operations. For the year ended June 30, 2010, no minimum account balance fees were charged by the Fund.
Underwriting Discounts, Service and Distribution Fees
In connection with the Closing, RiverSource Fund Distributors, Inc., an indirect wholly owned subsidiary of Ameriprise Financial, became the distributor of the Fund and subsequently changed its name to Columbia Management Investment Distributors, Inc. (the “New Distributor”).
For the year ended June 30, 2010, initial sales charges paid by shareholders on the purchase of Class A shares amounted to $27,704 and net CDSC fees paid by shareholders on certain redemptions of Class A, Class B and Class C shares amounted to $1,001, $36,729 and $5,331, respectively.
The Fund has adopted distribution and shareholder servicing plans (the “Plans”) pursuant to Rule 12b-1 under the 1940 Act for Class A, Class B and Class C shares, which require the payment of distribution and service fees. The fees are intended to compensate the New Distributor and/or eligible selling and/or servicing agents for selling shares of the Fund and providing services to investors.
Payments under the Plans, which are calculated daily and paid monthly, are based on the average daily net assets of the applicable class of the Fund at the following annual rates:
| | | | | | | | | | | | |
| Distribution Fee | | | Service Fee | |
| Class B | | Class C | | | Class A | | | Class B | | | Class C | |
| 0.75% | | 0.75 | % | | 0.25 | % | | 0.25 | % | | 0.25 | % |
Prior to the Closing, Columbia Management Distributors, Inc. (the “Previous Distributor”), an affiliate of Columbia and an indirect, wholly owned subsidiary of BOA, was the principal underwriter of the Fund’s shares. There were no changes to the underwriting discount structure of the Fund or the service or distribution fee rates paid by the Fund as a result of the Transaction.
Fee Waivers and Expense Reimbursements
Effective May 1, 2010, the New Advisor has voluntarily agreed to reimburse a portion of the Fund’s expenses so that the Fund’s ordinary operating expenses (excluding any distribution and service fees, brokerage commissions, interest, taxes and extraordinary expenses, but including custodian charges relating to overdrafts, if any), after giving effect to any balance credits from the Fund’s custodian, do not exceed 1.10% of the Fund’s average daily net assets on an annualized basis. This arrangement may be modified or terminated by the New Advisor at any time. Prior to May 1, 2010, Columbia voluntarily reimbursed a portion of the Fund’s expenses in the same manner.
29
Columbia Small Cap Value Fund I
June 30, 2010
Fees Paid to Officers and Trustees
In connection with the Closing, all officers of the Fund are employees of the New Advisor or its affiliates and, with the exception of the Fund’s Chief Compliance Officer, receive no compensation from the Fund. The Board of Trustees has appointed a Chief Compliance Officer to the Fund in accordance with federal securities regulations. The Fund, along with other affiliated funds, pays its pro-rata share of the expenses associated with the Chief Compliance Officer. The Fund’s expenses for the Chief Compliance Officer will not exceed $15,000 per year. Prior to the Closing, the Fund paid its pro-rata share of the expenses for the Chief Compliance Officer under the same fee structure.
Trustees are compensated for their services to the Fund, as set forth on the Statement of Operations. The Trust’s eligible Trustees may participate in a deferred compensation plan which may be terminated at any time. Obligations of the plan will be paid solely out of the Fund’s assets.
Other Related Party Transactions
Prior to the Closing, the Fund used one or more brokers that were affiliates of BOA in connection with the purchase and sale of its securities. Total brokerage commissions paid to affiliated brokers for the period prior to the Closing were $3,513.
Note 5. Custody Credits
The Fund has an agreement with its custodian bank under which custody fees may be reduced by balance credits. These credits are recorded as part of expense reductions on the Statement of Operations. The Fund could have invested a portion of the assets utilized in connection with the expense offset arrangement in an income-producing asset if it had not entered into such an agreement. For the year ended June 30, 2010, these custody credits reduced total expenses by $27 for the Fund.
Note 6. Portfolio Information
For the year ended June 30, 2010, the cost of purchases and proceeds from sales of securities, excluding short-term obligations, for the Fund were $703,681,066 and $372,781,306, respectively.
Note 7. Regulatory Settlements
During the year ended June 30, 2010, the Fund received payments totaling $4,978 relating to certain regulatory settlements with third parties that the Fund had participated in during the year. The payments have been included in “Increase from regulatory settlements” on the Statement of Changes in Net Assets.
Note 8. Line of Credit
The Fund and other affiliated funds participate in a $280,000,000 committed, unsecured revolving line of credit provided by State Street. The maximum amount that may be borrowed by any fund is limited to the lesser of $200,000,000 and the Fund’s borrowing limit set forth in the Fund’s registration statement. Borrowings are available for short-term liquidity or temporary or emergency purposes.
Effective October 15, 2009, interest is charged to each participating fund based on the fund’s borrowings at a rate per annum equal to the greater of the Federal Funds Rate plus 1.25% or the overnight LIBOR Rate plus 1.25%. In addition, a commitment fee of 0.15% per annum is accrued and apportioned among the participating funds pro rata based on their relative net assets.
Prior to October 15, 2009, interest was charged to each participating fund based on the fund’s borrowings at a rate per annum equal to the greater of the Federal Funds Rate plus 0.50% or the overnight LIBOR Rate plus 0.50%. In addition, an annual operations agency fee of $20,000, an amendment fee of 0.02% and a commitment fee of 0.12% per annum were accrued and apportioned among the participating funds pro rata based on their relative net assets.
For the year ended June 30, 2010, the average daily loan balance outstanding on days where borrowing existed was $5,450,000 at a weighted average interest rate of 1.421%.
Note 9. Shareholder Concentration
As of June 30, 2010, two shareholder accounts owned 17.7% of the outstanding shares of the Fund. Purchase and redemption activity of these accounts may have a significant effect on the operations of the Fund.
Note 10. Significant Risks and Contingencies
Sector Focus Risk
The Fund may focus its investments in certain sectors, subjecting it to greater risk than a fund that is less focused.
30
Columbia Small Cap Value Fund I
June 30, 2010
Information Regarding Pending and Settled Legal Proceedings
In June 2004, an action captioned John E. Gallus et al. v. American Express Financial Corp. and American Express Financial Advisors Inc. was filed in the United States District Court for the District of Arizona. The plaintiffs allege that they are investors in several American Express Company (now known as RiverSource) mutual funds and they purport to bring the action derivatively on behalf of those funds under the Investment Company Act of 1940. The plaintiffs allege that fees allegedly paid to the defendants by the funds for investment advisory and administrative services are excessive. The plaintiffs seek remedies including restitution and rescission of investment advisory and distribution agreements. The plaintiffs voluntarily agreed to transfer this case to the United States District Court for the District of Minnesota (the District Court). In response to defendants’ motion to dismiss the complaint, the District Court dismissed one of plaintiffs’ four claims and granted plaintiffs limited discovery. Defendants moved for summary judgment in April 2007. Summary judgment was granted in the defendants’ favor on July 9, 2007. The plaintiffs filed a notice of appeal with the Eighth Circuit Court of Appeals (the Eighth Circuit) on August 8, 2007. On April 8, 2009, the Eighth Circuit reversed summary judgment and remanded to the District Court for further proceedings. On August 6, 2009, defendants filed a writ of certiorari with the U.S. Supreme Court (the Supreme Court), asking the Supreme Court to stay the District Court proceedings while the Supreme Court considers and rules in a case captioned Jones v. Harris Associates, which involves issues of law similar to those presented in the Gallus case. On March 30, 2010, the Supreme Court issued its ruling in Jones v. Harris Associates, and on April 5, 2010, the Supreme Court vacated the Eighth Circuit’s decision in the Gallus case and remanded the case to the Eighth Circuit for further consideration in light of the Supreme Court’s decision in Jones v. Harris Associates. On June 4, 2010, the Eighth Circuit remanded the Gallus case to the District Court for further consideration in light of the Supreme Court’s decision in Jones v. Harris Associates.
In December 2005, without admitting or denying the allegations, American Express Financial Corporation (AEFC, which is now known as Ameriprise Financial, Inc. (Ameriprise Financial)), entered into settlement agreements with the Securities and Exchange Commission (SEC) and Minnesota Department of Commerce (MDOC) related to market timing activities. As a result, AEFC was censured and ordered to cease and desist from committing or causing any violations of certain provisions of the Investment Advisers Act of 1940, the Investment Company Act of 1940, and various Minnesota laws. AEFC agreed to pay disgorgement of $10 million and civil money penalties of $7 million. AEFC also agreed to retain an independent distribution consultant to assist in developing a plan for distribution of all disgorgement and civil penalties ordered by the SEC in accordance with various undertakings detailed at http://www.sec.gov/litigation/admin/ia-2451.pdf. Ameriprise Financial and its affiliates have cooperated with the SEC and the MDOC in these legal proceedings, and have made regular reports to the RiverSource, Seligman and Threadneedle Funds’ Boards of Directors/Trustees.
Ameriprise Financial and certain of its affiliates have historically been involved in a number of legal, arbitration and regulatory proceedings, including routine litigation, class actions, and governmental actions, concerning matters arising in connection with the conduct of their business activities. Ameriprise Financial believes that the Funds are not currently the subject of, and that neither Ameriprise Financial nor any of its affiliates are the subject of, any pending legal, arbitration or regulatory proceedings that are likely to have a material adverse effect on the Funds or the ability of Ameriprise Financial or its affiliates to perform under their contracts with the Funds. Ameriprise Financial is required to make 10-Q, 10-K and, as necessary, 8-K filings with the Securities and Exchange Commission on legal and regulatory matters that relate to Ameriprise Financial and its affiliates. Copies of these filings may be obtained by accessing the SEC website at www.sec.gov.
There can be no assurance that these matters, or the adverse publicity associated with them, will not result in increased fund redemptions, reduced sale of fund shares or other adverse consequences to the Funds. Further, although we believe proceedings are not likely to have a material adverse effect on the Funds or the ability of Ameriprise Financial or its affiliates to perform under their contracts with the Funds, these proceedings are subject to uncertainties and, as such, we are unable to estimate the possible loss or range of loss that may result. An adverse outcome in one or more of these proceedings could result in adverse judgments, settlements, fines, penalties or other relief that could have a material adverse effect on the consolidated financial condition or results of operations of Ameriprise Financial.
31
Report of Independent Registered Public Accounting Firm
To the Trustees of Columbia Funds Series Trust I and the Shareholders of Columbia Small Cap Value Fund I
In our opinion, the accompanying statement of assets and liabilities, including the investment portfolio, and the related statements of operations and of changes in net assets and the financial highlights present fairly, in all material respects, the financial position of Columbia Small Cap Value Fund I (the “Fund”) (a series of Columbia Funds Series Trust I) at June 30, 2010, the results of its operations for the year then ended, the changes in its net assets for each of the two years in the period then ended and the financial highlights for each of the five years in the period then ended, in conformity with accounting principles generally accepted in the United States of America. These financial statements and financial highlights (hereafter referred to as “financial statements”) are the responsibility of the Fund’s management. Our responsibility is to express an opinion on these financial statements based on our audits. We conducted our audits of these financial statements in accordance with the standards of the Public Company Accounting Oversight Board (United States). Those standards require that we plan and perform the audit to obtain reasonable assurance about whether the financial statements are free of material misstatement. An audit includes examining, on a test basis, evidence supporting the amounts and disclosures in the financial statements, assessing the accounting principles used and significant estimates made by management, and evaluating the overall financial statement presentation. We believe that our audits, which included confirmation of securities at June 30, 2010 by correspondence with the custodian and brokers, provide a reasonable basis for our opinion.
PricewaterhouseCoopers LLP
Boston, Massachusetts
August 23, 2010
32
Federal Income Tax Information (Unaudited) – Columbia Small Cap Value Fund I
100.00% of the ordinary dividend income distributed by the Fund, for the fiscal year ended June 30, 2010, qualifies for the corporate dividends received deduction.
For non-corporate shareholders 100.00% or the maximum amount allowable under the Jobs and Growth Tax Relief Reconciliation Act of 2003, of ordinary income distributed by the Fund for the fiscal year ended June 30, 2010 may represent qualified dividend income.
The Fund will notify shareholders in January 2011 of amounts for use in preparing 2010 income tax returns.
33
Fund Governance
The Trustees serve terms of indefinite duration. The names, addresses and birth years of the Trustees and Officers of the Funds in the Columbia Funds Series Trust I, the year each was first elected or appointed to office, their principal business occupations during at least the last five years, the number of Funds overseen by each Trustee and other directorships they hold are shown below. Each officer listed below serves as an officer of each Fund in the Columbia Funds Complex.
Independent Trustees
| | |
Name, Address and Year of Birth,
Position with Funds, Year First
Elected or Appointed to Office | | Principal Occupation(s) During Past Five Years, Number of Funds in Columbia Funds
Complex Overseen by Trustee, Other Directorships Held |
| |
| John D. Collins (Born 1938) | | |
c/o Columbia Management Investment Advisers, LLC One Financial Center Boston, MA 02111 Trustee (since 2005) | | Retired. Consultant, KPMG, LLP (accounting and tax firm) from July 1999 to June 2000; Partner, KPMG, LLP from March 1962 to June 1999. Oversees 64; Mrs. Fields Famous Brands LLC (consumer products); Suburban Propane Partners, L.P.; and Montpelier Re (insurance underwriting firm) |
| |
| Rodman L. Drake (Born 1943) | | |
c/o Columbia Management Investment Advisers, LLC One Financial Center Boston, MA 02111 Trustee (since 1994) and Chairman of the Board (since 2009) | | Co-Founder of Baringo Capital LLC (private equity) since 2002; CEO of Crystal River Capital, Inc. (real estate investment trust) since 2003; President, Continuation Investments Group, Inc. from 1997 to 2001. Oversees 64; Jackson Hewitt Tax Service Inc. (tax preparation services); Crystal Capital River Inc. (real estate investment trust); Student Loan Corporation (student loan provider); Celgene Corporation (global biotechnology company); and The Helios Funds (exchange-traded funds) |
| |
| Douglas A. Hacker (Born 1955) | | |
c/o Columbia Management Investment Advisers, LLC One Financial Center Boston, MA 02111 Trustee (since 1996) | | Independent business executive since May 2006; Executive Vice President–Strategy of United Airlines (airline) from December 2002 to May 2006; President of UAL Loyalty Services (airline marketing company) from September 2001 to December 2002; Executive Vice President and Chief Financial Officer of United Airlines from July 1999 to September 2001. Oversees 64; Nash Finch Company (food distributor); Aircastle Limited (aircraft leasing) |
|
| Janet Langford Kelly (Born 1957) |
c/o Columbia Management Investment Advisers, LLC One Financial Center Boston, MA 02111 Trustee (since 1996) | | Senior Vice President, General Counsel and Corporate Secretary, ConocoPhillips (integrated energy company) since September 2007; Deputy General Counsel–Corporate Legal Services, ConocoPhillips from August 2006 to August 2007; Partner, Zelle, Hofmann, Voelbel, Mason & Gette LLP (law firm) from March 2005 to July 2006; Adjunct Professor of Law, Northwestern University, from September 2004 to June 2006; Director, UAL Corporation (airline) from February 2006 to July 2006; Oversees 64; None |
| |
| Charles R. Nelson (Born 1942) | | |
c/o Columbia Management Investment Advisers, LLC One Financial Center Boston, MA 02111 Trustee (since 1981) | | Professor of Economics, University of Washington, since January 1976; Ford and Louisa Van Voorhis Professor of Political Economy, University of Washington, since September 1993; Adjunct Professor of Statistics, University of Washington, since September 1980; Associate Editor, Journal of Money Credit and Banking, 1993-2008 Consultant on econometric and statistical matters. Oversees 64; None |
34
Fund Governance (continued)
Independent Trustees (continued)
| | |
Name, Address and Year of Birth,
Position with Funds, Year First
Elected or Appointed to Office | | Principal Occupation(s) During Past Five Years, Number of Funds in Columbia Funds
Complex Overseen by Trustee, Other Directorships Held |
| |
| John J. Neuhauser (Born 1943) | | |
c/o Columbia Management Investment Advisers, LLC One Financial Center Boston, MA 02111 Trustee (since 1984) | | President, Saint Michael’s College, since August 2007; University Professor, Boston College from November 2005 to August 2007; Academic Vice President and Dean of Faculties, Boston College from August 1999 to October 2005. Oversees 64; Liberty All-Star Equity Fund and Liberty All-Star Growth Fund, Inc. (closed-end funds) |
| |
| Jonathan Piel (Born 1938) | | |
c/o Columbia Management Investment Advisers, LLC One Financial Center Boston, MA 02111 Trustee (since 1994) | | Cable television producer and website designer; The Editor, Scientific American from 1984 to 1994; Vice President, Scientific American, Inc., from 1984 to 1994; Member, Advisory Board, Stone Age Institute, Bloomington, Indiana (research institute that explores the effect of technology on human evolution); Member, Board of Directors of the National Institute of Social Sciences, New York City; Member, Board of Trustees of the William Alanson White Institute, New York City (institution for training psychoanalysts); and Member, Advisory Board, Mount Sinai Children’s Environmental Health Center, New York. Oversees 64; None |
| |
| Patrick J. Simpson (Born 1944) | | |
c/o Columbia Management Investment Advisers, LLC One Financial Center Boston, MA 02111 Trustee (since 2000) | | Partner, Perkins Coie LLP (law firm). Oversees 64; None |
| |
| Anne-Lee Verville (Born 1945) | | |
c/o Columbia Management Investment Advisers, LLC One Financial Center Boston, MA 02111 Trustee (since 1998) | | Retired since 1997 (formerly General Manager–Global Education Industry (from 1994 to 1997), President–Application Systems Division (from 1991 to 1994), Chief Financial Officer–US Marketing & Services (from 1988 to 1991), and Chief Information Officer (from 1987 to 1988), IBM Corporation (computer and technology)). Oversees 64; None |
35
Fund Governance (continued)
Interested Trustee
| | |
Name, Address and Year of Birth,
Position with Funds, Year First
Elected or Appointed to Office | | Principal Occupation(s) During Past Five Years, Number of Funds in Columbia Funds
Complex Overseen by Trustee, Other Directorships Held |
| |
| William E. Mayer1 (Born 1940) | | |
c/o Columbia Management Investment Advisers, LLC One Financial Center Boston, MA 02111 Trustee (since 1994) | | Partner, Park Avenue Equity Partners (private equity) since February 1999; Dean and Professor, College of Business, University of Maryland from 1992 to 1997. Oversees 64; Lee Enterprises (print media), WR Hambrecht + Co. (financial service provider); BlackRock Kelso Capital Corporation (investment company) |
| 1 | Mr. Mayer may technically be an “interested person” (as defined in the Investment Company Act of 1940) by reason of his affiliation with WR Hambrecht + Co., a registered broker/dealer that may execute portfolio transactions for, engage in principal transactions with or distribute shares of a Fund or other funds or accounts advised/managed by the Advisor or any sub-advisor to a Fund. |
The Statement of Additional Information includes additional information about the Trustees of the Funds and is available, without charge, upon request by calling 1-800-345-6611.
36
Fund Governance (continued)
Officers
| | |
| Name, Year of Birth and Address | | Principal Occupation(s) During the Past Five Years |
| |
| J. Kevin Connaughton (Born 1964) | | |
One Financial Center Boston, MA 02111 President (since 2009) | | Senior Vice President and General Manager–Mutual Fund Products, Columbia Management Investment Advisers, LLC since May 2010; President, Columbia Funds, since 2009, and RiverSource Funds, since May 2010 (previously Senior Vice President and Chief Financial Officer, Columbia Funds, from June 2008 to January 2009, Treasurer, Columbia Funds, from October 2003 to May 2008, and senior officer of various other affiliated funds since 2000); Managing Director, Columbia Management Advisors, LLC from December 2004 to April 2010. |
| |
| Michael G. Clarke (Born 1969) | | |
One Financial Center Boston, MA 02111 Senior Vice President and Chief Financial Officer (since 2009) | | Vice President, Columbia Management Investment Advisers, LLC since May 2010; Managing Director of Fund Administration, Columbia Management Advisors, LLC, from September 2004 to April 2010; senior officer of Columbia Funds and affiliated funds since 2002. |
| |
| Scott R. Plummer (Born 1959) | | |
5228 Ameriprise Financial Center Minneapolis, MN 55474 Senior Vice President, Secretary and Chief Legal Officer (since 2010) | | Chief Legal Officer and Assistant Secretary, Columbia Management Investment Advisers, LLC since June 2005; Vice President and Lead Chief Counsel–Asset Management, Ameriprise Financial, Inc. since May 2010 (previously Vice President and Chief Counsel–Asset Management, from 2005 to April 2010, and Vice President–Asset Management Compliance from 2004 to 2005); Vice President, Chief Counsel and Assistant Secretary, Columbia Management Investment Distributors, Inc. since 2008; Vice President, General Counsel and Secretary, Ameriprise Certificate Company since 2005; Chief Counsel, RiverSource Distributors, Inc. since 2006; Vice President, General Counsel and Secretary, RiverSource Funds, since December 2006; Senior Vice President, Secretary and Chief Legal Officer, Columbia Funds, since May 2010. |
| |
| Linda J. Wondrack (Born 1964) | | |
One Financial Center Boston, MA 02111 Senior Vice President and Chief Compliance Officer (since 2007) | | Vice President and Chief Compliance Officer, Columbia Management Investment Advisers, LLC since May 2010; Chief Compliance Officer, Columbia Funds, since 2007, and RiverSource Funds, since May 2010; Director (Columbia Management Group, LLC and Investment Product Group Compliance), Bank of America, from June 2005 to April 2010; Director of Corporate Compliance and Conflicts Officer of MFS Investment Management (investment management) from August 2004 to May 2005. |
| |
| William F. Truscott (Born 1960) | | |
53600 Ameriprise Financial Center Minneapolis, MN 55474 Senior Vice President (since 2010) | | Chairman of the Board, Columbia Management Investment Advisers, LLC since May 2010 (previously President, Chairman of the Board and Chief Investment Officer, from 2001 to April 2010); Chief Executive Officer, U.S. Asset Management & President, Annuities, Ameriprise Financial, Inc. since May 2010 (previously President–U.S. Asset Management and Chief Investment Officer from 2005 to April 2010, and Senior Vice President — Chief Investment Officer, from 2001 to 2005); Director, President and Chief Executive Officer, Ameriprise Certificate Company since 2006; Director, Columbia Management Investment Distributors, Inc. since May 2010 (previously Chairman of the Board and Chief Executive Officer from 2008 to April 2010); Chairman of the Board and Chief Executive Officer, RiverSource Distributors, Inc. since 2006. |
37
Fund Governance (continued)
Officers (continued)
| | |
| Name, Year of Birth and Address | | Principal Occupation(s) During the Past Five Years |
|
| Colin Moore (Born 1958) |
One Financial Center Boston, MA 02111 Senior Vice President (since 2010) | | Director and Chief Investment Officer, Columbia Management Investment Advisers, LLC since May 2010; Manager, Managing Director and Chief Investment Officer of Columbia Management Advisors, LLC from 2007 to April 2010; Head of Equities, Columbia Management Advisors, LLC from 2002 to 2007. |
| |
| Michael A. Jones (Born 1959) | | |
100 Federal Street Boston, MA 02110 Senior Vice President (since 2010) | | Director and President, Columbia Management Investment Advisers, LLC since May 2010; President and Director, Columbia Management Investment Distributors, Inc. since May 2010; Manager, Chairman, Chief Executive Officer and President, Columbia Management Advisors, LLC from 2007 to April 2010; Chief Executive Officer, President and Director, Columbia Management Distributors, Inc. from November 2006 to April 2010; previously, co-president and senior managing director at Robeco Investment Management. |
| |
| Amy Johnson (Born 1965) | | |
5228 Ameriprise Financial Center Minneapolis, MN 55474 Senior Vice President (since 2010) | | Senior Vice President and Chief Operating Officer, Columbia Management Investment Advisers, LLC since May 2010 (previously Chief Administrative Officer, from 2009 until April 2010, Vice President–Asset Management and Trust Company Services, from 2006 to 2009, and Vice President–Operations and Compliance from 2004 to 2006). |
| |
| Joseph F. DiMaria (Born 1968) | | |
One Financial Center Boston, MA 02111 Treasurer (since 2009) and Chief Accounting Officer (since 2008) | | Vice President, Mutual Fund Administration, Columbia Management Investment Advisers, LLC, since May 2010; Director of Fund Administration, Columbia Management Advisors, LLC from January 2006 to April 2010; Head of Tax/Compliance and Assistant Treasurer, Columbia Management Advisors, LLC, from November 2004 to December 2005. |
| |
| Marybeth Pilat (Born 1968) | | |
One Financial Center Boston, MA 02111 Deputy Treasurer (since 2010) | | Vice President, Mutual Fund Administration, Columbia Management Investment Advisers, LLC, since May 2010; Vice President, Investment Operations, Bank of America, from October 2008 to April 2010; Finance Manager, Boston Children’s Hospital from August 2008 to October 2008; Director, Mutual Fund Administration, Columbia Management Advisors, LLC, from May 2007 to July 2008; Vice President, Mutual Fund Valuation, Columbia Management Advisors, LLC, from January 2006 to May 2007; Vice President, Mutual Fund Accounting Oversight, Columbia Management Advisors, LLC from January 2005 to January 2006. |
| |
| Julian Quero (Born 1967) | | |
One Financial Center Boston, MA 02111 Deputy Treasurer (since 2008) | | Vice President, Mutual Fund Administration, Columbia Management Investment Advisers, LLC since May 2010; Director of Fund Administration, Columbia Management Advisors, LLC, from August 2008 to April 2010; Senior Tax Manager, Columbia Management Advisors, LLC from August 2006 to July 2008; Senior Compliance Manager, Columbia Management Advisors, LLC from April 2002 to August 2006. |
| |
| Stephen T. Welsh (Born 1957) | | |
One Financial Center Boston, MA 02111 Vice President (since 2006) | | President and Director, Columbia Management Investment Services Corp. since May 2010; President and Director, Columbia Management Services, Inc. from July 2004 to April 2010; Managing Director, Columbia Management Distributors, Inc. from August 2007 to April 2010. |
38
-
Board Consideration and Approval of Advisory Agreements
The Board unanimously approved the Advisory Agreements at a meeting held on December 17, 2009. These agreements were approved by shareholders on March 3, 2010, and took effect upon the closing of the acquisition of the long-term asset management business of Columbia by Ameriprise Financial, Inc. (“Ameriprise”) (the “Transaction”).
The Advisory Fees and Expenses Committee (the “Committee”) of the Board met on multiple occasions to review the investment management services agreements (the “Advisory Agreements”) for the funds for which the Trustees serve as trustees (each a “Fund,” and collectively, the “Funds”). On December 14, 2009, the Committee recommended that the full Board approve the Advisory Agreements. On December 17, 2009, the full Board, including a majority of the Trustees who have no direct or indirect interest in the Advisory Agreements and who are not “interested persons” (as defined in the 1940 Act) of the Trust (the “Independent Trustees”), approved the Advisory Agreement with Columbia Management Investment Advisers, LLC (formerly, RiverSource Investments, LLC) (“CMIA”) for each Fund. Prior to their approval of the Advisory Agreements, the Committee and the Independent Trustees requested and evaluated materials from, and were provided materials and information about the Transaction and matters related to the proposals by, BOA, Columbia, CMIA and Ameriprise. In connection with their most recent approval of the Funds’ previous advisory agreements (the “Former Advisory Agreements”) on October 28, 2009, the Committee and the Trustees requested and evaluated materials from Columbia, and discussed such materials with representatives of Columbia. The Committee, at meetings held on August 11, 2009, September 23, 2009, October 27, 2009, November 30, 2009, December 7, 2009 and December 14, 2009, and the Independent Trustees, at meetings held on August 12, 2009, August 20, 2009, October 28, 2009, December 8, 2009, December 14, 2009 and December 17, 2009, discussed the materials provided in connection with the October 28, 2009 approvals and the materials provided in connection with their consideration of the Advisory Agreements and other matters relating to the Transaction with representatives of BOA, Columbia, CMIA and Ameriprise. The Trustees consulted with experienced legal counsel, who advised on the legal standards for consideration by the Trustees. The Independent Trustees also discussed the proposed approvals with independent legal counsel in private sessions.
The Trustees reviewed each Advisory Agreement, as well as certain information obtained through CMIA’s responses to initial and supplemental questionnaires prepared at the request of the Trustees by counsel to the Funds and independent legal counsel to the Independent Trustees. The Committee and the Trustees also met with, and reviewed and considered a report prepared and provided by, the independent fee consultant (the “Fee Consultant”) appointed by the Independent Trustees pursuant to an assurance of discontinuance entered into by Columbia with the New York Attorney General (“NYAG”) to settle a civil complaint filed by the NYAG relating to trading in mutual fund shares (the “NYAG Settlement”). Under the NYAG Settlement, the Fee Consultant’s role is to manage the process by which management fees are negotiated so that they are negotiated in a manner that is at arms’ length and reasonable.
The Trustees considered all materials that they, their legal counsel or CMIA believed reasonably necessary to evaluate and to determine whether to approve the Advisory Agreements. In their deliberations, the Trustees did not identify any particular information that was all-important or controlling, and individual Trustees may have attributed different weights to the various factors. The material factors that formed the basis for the Trustees’ approvals included the factors set forth below:
| (i) | the reputation, financial strength, regulatory histories and resources of CMIA and its parent, Ameriprise; |
| (ii) | the capabilities of CMIA with respect to compliance, including an assessment of CMIA’s compliance system by the Funds’ Chief Compliance Officer; |
| (iii) | the qualifications of the personnel of CMIA that would be expected to provide advisory services to each Fund, including CMIA’s representations that the Chief Investment Officer of Columbia would serve as the Chief Investment Officer of CMIA, and that the process for determining the portfolio management team for each Fund would be substantially the same process as has customarily been followed by Columbia, and reported to the Trustees, in evaluating the performance of Columbia’s portfolio management teams; |
39
| (iv) | the terms and conditions of the Advisory Agreements, including the differences between the Advisory Agreements and Former Advisory Agreements in connection with CMIA’s efforts to standardize such agreements across the Columbia Fund complex and the legacy RiverSource fund complex; |
| (v) | the terms and conditions of other agreements and arrangements relating to the future operations of the Funds, including an administrative services agreement and the Master Services and Distribution Agreement; |
| (vi) | the commitment of CMIA and Ameriprise that there would not be any diminution in the nature, quality and extent of services provided to each Fund or its shareholders following closing of the Transaction; |
| (vii) | that the Trustees recently had completed a full annual review of the Former Advisory Agreements, as required by the 1940 Act, for each Fund and had determined that they were satisfied with the nature, extent and quality of services provided thereunder and that the management fee rate for each Fund were sufficient to warrant their approval; |
| (viii) | that the advisory fee rates payable by each Fund would not change; |
| (ix) | that CMIA and BOA, and not any Fund, would bear the costs of obtaining approvals of the Advisory Agreements; |
| (x) | that Ameriprise and CMIA had agreed to exercise reasonable best efforts to assure that, for a period of two years after the Closing, there would not be imposed on any Fund any “unfair burden” (within the meaning of Section 15(f) of 1940 Act) with respect to the Transaction; and |
| (xi) | that certain members of CMIA’s management had a significant amount of experience integrating other fund families; that certain current Columbia personnel that would be integrated into CMIA and its affiliates as a result of the Transaction also had experience in integrating fund families; and that the senior management of CMIA following the Transaction would include certain senior executives of Columbia who were, at that time, responsible for oversight of services provided to the Funds. |
Nature, Extent and Quality of Services to be Provided. The Trustees considered the expected nature, extent and quality of services to be provided to the Funds by CMIA and its affiliates and the resources to be dedicated to the Funds by CMIA and its affiliates. The Trustees considered, among other things, the expected effect of the Transaction on the operations of the Funds, the information provided by CMIA with respect to the nature, extent and quality of services to be provided by it, CMIA’s compliance programs and compliance records, the ability of CMIA (including personnel and other resources, compensation programs for personnel involved in fund management, reputation and other attributes) to attract, motivate and retain highly qualified research, advisory and supervisory investment professionals, the trade execution services to be provided on behalf of the Funds and the quality of CMIA’s investment research capabilities and the other resources that it indicated it would devote to each Fund. As noted above, the Trustees also considered CMIA’s representations that the Chief Investment Officer of Columbia would serve as the Chief Investment Officer of CMIA following the Transaction, and that the process for determining the portfolio management team for each Fund would be substantially the same process as has customarily been followed by Columbia, and reported to the Trustees, in evaluating the performance of Columbia’s portfolio management teams.
The Trustees noted the professional experience and qualifications of the senior personnel of CMIA. The Trustees also considered the compliance programs of and the compliance-related resources proposed to be provided to the Funds by CMIA and its affiliates, including discussions with the Funds’ Chief Compliance Officer regarding CMIA’s compliance program. The Trustees also discussed CMIA’s compliance program with the Chief Compliance Officer for the legacy RiverSource funds. The Trustees also considered CMIA’s representation that the Funds’ Chief Compliance Officer would serve as the Chief Compliance Officer of CMIA following the Transaction. The Trustees considered CMIA’s ability to provide administrative services to the Funds, noting that while some Former Advisory Agreements contemplated the provision of certain administrative services, following the Transaction, all administrative services were anticipated to be provided pursuant to a new administrative services agreement. The Trustees also considered CMIA’s ability to coordinate the activities of each Fund’s other service
40
providers. The Trustees considered performance information provided by CMIA with respect to other mutual funds advised by CMIA, and discussed with senior executives of CMIA its process for identifying which portfolio management teams of the legacy Columbia and legacy CMIA organizations would be responsible for the management of the Funds following the Transaction. After reviewing these and related factors, the Trustees concluded, within the context of their overall conclusions, that the expected nature, extent and quality of the services to be provided to each Fund under the Advisory Agreements supported the approval of such agreements.
Investment Advisory Fee Rates and Other Expenses. The Trustees considered the fact that the advisory fee rates payable by each Fund to CMIA under the Advisory Agreements were the same as those that were paid by each Fund to Columbia under the Former Advisory Agreements. The Trustees noted that in connection with their October 28, 2009 approval of the Former Advisory Agreements, they had concluded, within the context of their overall conclusions regarding each such agreement, that the advisory fees charged to each Fund supported the continuation of the agreement(s) pertaining to that Fund.
The Trustees noted that in certain cases the effective advisory fee rate for a legacy RiverSource fund was lower than the proposed investment advisory fee rate for a Fund with generally similar investment objectives and strategies. The Trustees also noted that CMIA’s investment advisory fee rates for equity and balanced funds generally are subject to adjustments based on investment performance, whereas the proposed investment advisory fee rates for the Funds, consistent with those in the Former Advisory Agreements, do not reflect performance adjustments. The Trustees considered existing advisory fee breakpoints and CMIA’s undertaking not to change expense caps previously implemented by Columbia with respect to the Funds without further discussion with the Independent Trustees.
The Trustees received and considered information about the advisory fees charged by CMIA to institutional accounts. In considering the fees charged to those accounts, the Trustees took into account, among other things, CMIA’s representations about the differences between managing mutual funds as compared to other types of accounts, including differences in the services provided, differences in the risk profile of such business for CMIA and the additional resources required to manage mutual funds effectively. In evaluating each Fund’s advisory fees, the Trustees also took into account the demands, complexity and quality of the investment management of the Fund.
The Trustees also considered that for certain Funds, certain administrative services that were provided under the Former Advisory Agreements would not be provided under the Advisory Agreements, but under a separate administrative services agreement. The Trustees noted that, unlike fees under an advisory agreement, fees under the administrative services agreement could be changed without shareholder approval, although CMIA had not proposed any increase in such administrative fees and any such increase would require Board approval. The Trustees also noted Ameriprise’s and CMIA’s covenants regarding compliance with Section 15(f) of the 1940 Act.
After reviewing these and related factors, the Trustees concluded, within the context of their overall conclusions, that the expected advisory fee rates and expenses of each Fund supported the approval of the Advisory Agreements.
Costs of Services to be Provided and Profitability. The Trustees noted that in connection with their October 28, 2009 approval of the Former Advisory Agreements, they had concluded, within the context of their overall conclusions regarding each such agreement, that profitability to Columbia and its affiliates of their relationships with each Fund supported the continuation of the agreement(s) pertaining to that Fund. In connection with the integration of the legacy Columbia and legacy CMIA organizations, the Trustees considered, among other things, CMIA’s projected annual net expense synergies (reductions in the cost of providing services to the Funds), the timetable over which such synergies are expected to be realized and the extent to which any such synergies are expected to be shared with the Funds. The Trustees also considered information provided by CMIA regarding their respective financial conditions. The Trustees considered that CMIA proposed to continue voluntary expense caps currently in effect for the Funds and that CMIA had undertaken not to change these caps without further discussion with the Independent Trustees. After reviewing these and related factors, the Trustees concluded, within the context of their overall conclusions, that the expected profitability to CMIA and its affiliates from its relationship with each Fund supported the approval of the Advisory Agreements.
41
Economies of Scale. The Trustees considered the existence of any anticipated economies of scale in the provision by CMIA of services to each Fund, to groups of related Funds and to CMIA’s investment advisory clients as a whole, and whether those economies of scale were expected to be shared with the Funds. The Trustees considered Ameriprise’s anticipated net expense synergies resulting from the Transaction, and considered the possibility that the Funds might benefit from economies of scale over time as part of the larger, combined fund complex. The Trustees considered how expected synergies and potential economies of scale might benefit the Funds and their shareholders. The Trustees considered the potential impact of the Transaction on the distribution of the Funds, and noted that the proposed management fee schedules for the Funds generally contained breakpoints that would reduce the fee rate on assets above specified threshold levels. After reviewing these and related factors, the Trustees concluded, within the context of their overall conclusions, that the extent to which economies of scale were expected to be shared with the Funds supported the approval of the Advisory Agreements.
Other Benefits to CMIA. The Trustees received and considered information regarding any expected “fall-out” or ancillary benefits to be received by CMIA and its affiliates as a result of their relationships with the Funds, such as the engagement of CMIA to provide administrative services to the Funds and the engagement of CMIA’s affiliates to provide distribution and transfer agency services to the Funds. The Trustees considered that the Funds’ distributor, which would be an affiliate of CMIA, retains a portion of the distribution fees from the Funds and receives a portion of the sales charges on sales or redemptions of certain classes of shares of the Funds. The Trustees also considered the benefits of research made available to CMIA by reason of brokerage commissions generated by the Funds’ securities transactions, and reviewed information about CMIA’s practices with respect to allocating portfolio brokerage for brokerage and research services. The Trustees considered the possible conflicts of interest associated with certain fall-out or other ancillary benefits and the reporting, disclosure and other processes that would be in place to disclose and to monitor such possible conflicts of interest. The Trustees recognized that CMIA’s profitability would be somewhat lower without these benefits.
Conclusion. Based on their evaluation of all factors that they deemed to be material, including those factors described above, and assisted by the advice of independent legal counsel and the Fee Consultant, the Trustees, including the Independent Trustees, approved, and recommended that Fund shareholders approve, each Advisory Agreement.
42
Summary of Management Fee Evaluation by Independent Fee Consultant (RiverSource Investments, LLC)
EXCERPTS FROM REPORT OF INDEPENDENT FEE CONSULTANT TO THE FUNDS SUPERVISED BY THE COLUMBIA ATLANTIC BOARD
Prepared Pursuant to the February 9, 2005 Assurance of Discontinuance among the Office of Attorney General of New York State, Columbia Management Advisors, LLC, and Columbia Management Distributors, Inc. December 21, 2009
I. Overview
On February 9, 2005, Columbia Management Advisors, LLC (“CMA”) and Columbia Management Distributors, Inc.1 (“CMD”) agreed to the New York Attorney General’s Assurance of Discontinuance (“AOD”). Among other things, the AOD stipulates that CMA may manage or advise a Columbia Fund (“Columbia Fund” and, together with some or all of such funds, the “Columbia Funds”) only if the Independent Members of the Columbia Fund’s Board of Trustees appoint a Senior Officer or retain an Independent Fee Consultant (“IFC”) who is to manage the process by which proposed management fees are negotiated. The AOD further stipulates that the Senior Officer or IFC is to prepare a written annual evaluation of the fee negotiation process.
With effect from January 1, 2007, the Independent Members of the Board of Trustees for certain Columbia Funds known collectively as the “Atlantic Funds” (together with the other members of that Board, the “Trustees”) retained me as IFC for the Atlantic Funds.2 In this capacity, I have prepared this written evaluation of the fee negotiation process. As was the case with the last three annual reports, my immediate predecessor as IFC, John Rea, provided invaluable assistance in the preparation of this report.
On September 29, 2009, Ameriprise entered into an asset purchase agreement with Bank of America, N.A. and its parent, Bank of America Corporation (together, the “Bank”) pursuant to which the Bank agreed to sell certain CMG assets relating to Columbia’s long-term asset management business, including management of the Atlantic Funds (the “Transaction”).3 The Transaction if completed would result in the termination of the existing Investment Management Agreements with CMA. Therefore, the Trustees have been requested to approve and recommend to the shareholders of each Atlantic Fund new Investment Management and Sub-Advisory Agreements (together, the “Management Agreements”) with RiverSource Investments, LLC (“RI”),4 investment manager of the RiverSource Funds and a subsidiary of Ameriprise. This report is intended to fulfill the requirements of the AOD with respect to the Trustees’ consideration of the new Management Agreements.
A. Role of the Independent Fee Consultant
The AOD charges the IFC with “managing the process by which proposed management fees … to be charged the Columbia Fund are negotiated so that they are negotiated in a manner which is at arms’ length and reasonable and consistent with this Assurance of Discontinuance.” The AOD also provides that CMA “may manage or advise a Columbia Fund only if the reasonableness of the proposed management fees is determined by the Board of Trustees … using … an annual independent written evaluation prepared by or under the direction of … the Independent Fee Consultant.” Therefore, the AOD makes clear that the IFC does not supplant the Trustees in negotiating management fees with CMA (or RI), nor does the IFC substitute his or her judgment for that of the Trustees with respect to the reasonableness of proposed fees or any other matter that is committed to the business judgment of the Trustees.
| 1 | CMA and CMD are subsidiaries of Columbia Management Group, LLC (“CMG”), and are the successors to the entities named in the AOD. |
| 2 | I have no material relationship with Bank of America, CMG or Ameriprise Financial, Inc. (“Ameriprise”), aside from serving as IFC, and I am aware of no material relationship with any of their affiliates. I retained John Rea, an independent economic consultant, to assist me with this report. |
| | Unless otherwise stated or required by the context, this report covers only the Atlantic Funds. |
| 3 | Preliminary Response of Ameriprise to Information Request of Columbia Atlantic Board dated October 21, 2009 (hereafter, the “Preliminary Response”), p. 1. The one money market Atlantic Fund, Money Market Fund VS, was included in the Transaction because it was an integral part of CMG's array of Funds used as investment vehicles by variable annuity and similar insurance products. |
| 4 | Ameriprise intends to re-brand RI with the “Columbia” name (which is one of the assets being sold in the Transaction). Preliminary Response, pp. 4-5. In the case of new Sub-Advisory Agreements, the current sub-adviser would also be a party. |
43
B. Elements Involved in Managing the Fee Negotiation Process
In preparing the report required by the AOD, the IFC must consider at least the following six factors set forth in the AOD:
| 1. | The nature and quality of the adviser’s services, including the Fund’s performance; |
| 2. | Management fees (including any components thereof) charged by other mutual fund companies for like services; |
| 3. | Possible economies of scale as the Fund grows larger; |
| 4. | Management fees (including any components thereof) charged to institutional and other clients of the adviser for like services; |
| 5. | Costs to the adviser and its affiliates of supplying services pursuant to the management fee agreements, excluding any intra-corporate profit; and |
| 6. | Profit margins of the adviser and its affiliates from supplying such services. |
C. Data Presented to the Trustees
In considering the proposed new Management Agreements with RI, the Trustees relied in part on the data that had been prepared as part of their annual contract review process, which concluded in late October. This data remained relevant because the fees in the proposed Management Agreements were identical to the fees approved at that time. The annual review materials included a Lipper report on the performance of each Atlantic Fund compared to its peers and its benchmark, comparisons of the fees and expenses of each Atlantic Fund to similar CMG-sponsored Funds, comparable competitive funds chosen by Lipper, and institutional accounts advised by CMA, revenues, expenses, and profits of CMG from managing the Atlantic Funds, calculated both by Fund and collectively, and CMG’s views on the existence and sharing of economies of scale.
In addition, the Trustees reviewed materials specific to the proposed new Management Agreements with RI in response to requests for information made on behalf of the Trustees, including the following:
| n | | Performance data for the RiverSource Funds showing percentile and quartile rankings of each fund within its Lipper performance universe for periods up to five years and net returns of each fund relative to its benchmark returns. This data was arguably relevant due to the possibility that some RiverSource investment teams would be providing investment management services to certain Columbia Funds. 5 |
| n | | tables comparing the fee schedules and effective fee rates of funds managed by CMA and RI and institutional accounts advised by the two firms. |
| n | | extensive discussion of the process by which the various components of the two asset management businesses would be integrated including investment management, compliance, transfer agency, custody, fund accounting, and distribution. |
| n | | information about the financial condition of Ameriprise, including its most recent annual report on Form 10-K, RI’s profit margins from managing the RiverSource Funds in 2007 and 2008, and pro forma income statements for the combined Columbia and RiverSource fund complex. |
| n | | disclosure that certain senior CMG executives, including President Michael Jones, Chief Investment Officer Colin Moore, Head of Mutual Funds J. Kevin Connaughton, and Chief Compliance Officer Linda Wondrack would continue in analogous capacities following the consummation of the Transaction, and |
| n | | a breakdown of the synergies RI expects to realize in the two years following the Transaction and the extent to which those potential synergies are expected to be shared with shareholders of funds advised by RI. |
| 5 | On page 20 of its Supplemental Response to the Atlantic Trustees (undated but delivered November 24, 2009), Ameriprise said that “most personnel decisions, including with respect to the portfolio management teams for the Atlantic Funds . . . will be made primarily by [current CMA CIO] Colin Moore using the Columbia 5P process.” |
44
II. Findings
| 1. | Based upon my examination of the information supplied by CMG and Ameriprise in the light of the six factors set forth in the AOD, I conclude that the Trustees have the relevant information necessary to evaluate the reasonableness of the proposed management fees for each Atlantic Fund. |
| 2. | In my view, the process by which the proposed management fees of the Atlantic Funds have been negotiated with RI thus far has been, to the extent practicable, at arms’ length and reasonable and consistent with the AOD. |
Respectfully submitted,
Steven E. Asher
45
Shareholder Meeting Results
Columbia Small Cap Value Fund I
On March 3, 2010, a special meeting of shareholders of Columbia Funds Series Trust I was held to consider the approval of several proposals listed in the proxy statement for the meeting. Proposal 1 and Proposal 2 were voted on at the March 3, 2010 meeting of shareholders and Proposal 3 was voted on at an adjourned meeting of shareholders held on March 31, 2010. The shareholder meeting results are as follows:
Proposal 1: A proposed Investment Management Services Agreement with Columbia Management Investment Advisers, LLC (formerly, RiverSource Investments, LLC) (CMIA) was approved as follows:
| | | | | | |
| | | | | | | |
| Votes For | | Votes
Against | | Abstentions | | Broker
Non-Votes |
| 629,853,233 | | 10,721,744 | | 17,287,668 | | 123,534,961 |
Proposal 2: A proposal authorizing CMIA to enter into and materially amend subadvisory agreements for the Fund in the future, with the approval of the Trust’s Board of Trustees, but without obtaining additional shareholder approval, was approved as follows:
| | | | | | |
| | | | | | | |
| Votes For | | Votes
Against | | Abstentions | | Broker
Non-Votes |
| 550,577,024 | | 87,731,245 | | 19,554,000 | | 123,535,339 |
Proposal 3: Each of the nominees for trustees was elected to the Trust’s Board of Trustees, as follows:
| | | | | | |
| | | | | | | |
| Trustee | | Votes For | | Votes
Withheld | | Abstentions |
| John D. Collins | | 30,977,072,412 | | 859,827,038 | | 0 |
Rodman L. Drake | | 30,951,179,004 | | 885,720,446 | | 0 |
| Douglas A. Hacker | | 30,989,793,279 | | 847,106,171 | | 0 |
Janet Langford Kelly | | 30,999,020,814 | | 837,878,636 | | 0 |
| William E. Mayer | | 16,291,139,483 | | 15,545,759,967 | | 0 |
Charles R. Nelson | | 30,997,700,700 | | 839,198,750 | | 0 |
| John J. Neuhauser | | 30,988,095,661 | | 848,803,789 | | 0 |
Jonathon Piel | | 30,968,801,048 | | 868,098,402 | | 0 |
| Patrick J. Simpson | | 30,999,065,030 | | 837,834,420 | | 0 |
Anne-Lee Verville | | 30,996,227,913 | | 840,671,537 | | 0 |
46
[THIS PAGE INTENTIONALLY LEFT BLANK]
47
[THIS PAGE INTENTIONALLY LEFT BLANK]
48
Important Information About This Report
The fund mails one shareholder report to each shareholder address. If you would like more than one report, please call shareholder services at 1-800-345-6611 and additional reports will be sent to you. This report has been prepared for shareholders of Columbia Small Cap Value Fund I.
A description of the policies and procedures that the fund uses to determine how to vote proxies and a copy of the fund’s voting records are available (i) at www.columbiamanagement.com, (ii) on the Securities and Exchange Commission’s website at www.sec.gov, and (iii) without charge, upon request, by calling 1-800-368-0346. Information regarding how the fund voted proxies relating to portfolio securities during the 12-month period ended June 30 is available from the SEC’s website. Information regarding how the fund voted proxies relating to portfolio securities is also available from the fund’s website, www.columbiamanagement.com.
The fund files a complete schedule of portfolio holdings with the SEC for the first and third quarters of each fiscal year on Form N-Q. The fund’s Form N-Q is available on the SEC’s website at www.sec.gov and may be reviewed and copied at the SEC’s Public Reference Room in Washington, D.C. Information on the operation of the Public Reference Room may be obtained by calling
1-800-SEC-0330.
Investors should consider the investment objectives, risks, charges and expenses of a mutual fund carefully before investing. For a free prospectus, which contains this and other important information about the funds, visit www.columbiamanagement.com. Read the prospectus carefully before investing.
On April 30, 2010, Ameriprise Financial, Inc., the parent company of RiverSource Investments, LLC, acquired the long-term asset management business of Columbia Management Group, LLC, including certain of its affiliates, which were, prior to this acquisition, part of Bank of America. In connection with the acquisition of the long-term assets, the Columbia Funds have a new investment adviser, RiverSource Investments, LLC, which is now known as Columbia Management Investment Advisers, LLC. For those series that used the services of a subadviser prior to this acquisition, those arrangements continue to be in effect. RiverSource Fund Distributors, Inc., now known as Columbia Management Investment Distributors, Inc., member FINRA, will act as the principal distributor of the Columbia Funds.
Transfer Agent
Columbia Management Investment Services Corp.
P.O. Box 8081
Boston, MA 02266-8081
1-800-345-6611
Distributor
Columbia Management Investment
Distributors, Inc.
One Financial Center
Boston, MA 02111
Investment Advisor
Columbia Management Investment Advisers, LLC
100 Federal Street
Boston, MA 02110
49

Columbia Small Cap Value Fund I
One Financial Center
Boston, MA 02111-2621
www.columbiafunds.com
This report must be accompanied or preceeded by the Fund’s current prospectus. Columbia Management mutual funds are distributed by Columbia Management Investment Distributors, Inc.
©2010 Columbia Management Investment Advisers, LLC. All rights reserved.
C-1361 A (8/10)

Columbia High Yield Municipal Fund
Annual Report for the Period Ended June 30, 2010
Table of Contents
The views expressed in this report reflect the current views of the respective parties. These views are not guarantees of future performance and involve certain risks, uncertainties and assumptions that are difficult to predict, so actual outcomes and results may differ significantly from the views expressed. These views are subject to change at any time based upon economic, market or other conditions and the respective parties disclaim any responsibility to update such views. These views may not be relied on as investment advice and, because investment decisions for a Columbia Fund are based on numerous factors, may not be relied on as an indication of trading intent on behalf of any particular Columbia Fund. References to specific securities should not be construed as a recommendation or investment advice.
President’s Message

Dear Shareholder:
On May 3, 2010, Ameriprise Financial, Inc. announced that it had completed the acquisition of the long-term asset management business of Columbia Management Group, LLC from Bank of America. This includes the business of managing its equity and fixed-income mutual funds. Ameriprise Financial has combined its current U.S. asset management business, RiverSource Investments, LLC, with Columbia Management. This transaction puts together two leading asset management firms to create one entity that ranks as one of the largest managers of long-term mutual fund assets in the United States. This combined business will operate under the well-regarded Columbia Management brand, where we will build on the strengths of our combined investment capabilities and talent, our broad and diversified product lineup and exceptional service.
Our combined business has a new breadth and depth of investment choices. William “Ted” Truscott, CEO, U.S. asset management and president of annuities for Ameriprise Financial, leads the combined U.S. asset management business. Michael Jones serves as president, U.S. asset management.1 Colin Moore continues to serve as chief investment officer.1 I am also continuing in my role as head of mutual funds, responsible for the delivery of mutual fund products and services to investors. The Columbia funds’ advisers, distributor and transfer agent are now subsidiaries of our parent company, Ameriprise Financial, but operate under the Columbia Management name. You will begin to see these names used in communications and statements going forward.
| | |
| | | Service provider name |
| Advisers | | Columbia Management Investment Advisers, LLC Columbia Wanger Asset Management, LLC |
| Distributor | | Columbia Management Investment Distributors, Inc. |
| Transfer Agent | | Columbia Management Investment Services Corp. |
As a valued investor in Columbia funds, please know that our goal is to ensure a smooth transition and provide the highest quality products and services. Transition teams across the organization continue their efforts to build on best practices from both legacy organizations with integration efforts including rebranding, vendor and system consolidations and client communications. Additionally, we want to assure you that the funds’ portfolio managers also continue to focus on providing uninterrupted service to all fund shareholders.
Although we have a lot of work ahead of us in 2010, Columbia Management and Ameriprise Financial are excited about the opportunities for our combined organization. I share this optimism and believe it positions us as a best-in-class asset management business with the ability to deliver more for our clients than ever before.
Sincerely,

J. Kevin Connaughton
President, Columbia Funds
| 1 | Associate joined Columbia Management Investment Advisers, LLC as part of its 2010 acquisition of the long-term asset management business of Columbia Management Group, LLC from Bank of America. |
Investors should consider the investment objectives, risks, charges and expenses of a mutual fund carefully before investing. For a free prospectus, which contains this and other important information about the funds, visit www.columbiamanagement.com. Read the prospectus carefully before investing.
Securities products offered through Columbia Management Investment Distributors, Inc. (formerly known as RiverSource Fund Distributors, Inc.), member FINRA. Advisory services provided by Columbia Management Investment Advisers, LLC (formerly known as RiverSource Investments, LLC).
© 2010 Columbia Management Investment Advisers, LLC. All rights reserved.
Fund Profile – Columbia High Yield Municipal Fund
Performance data quoted represents past performance and current performance may be lower or higher. Past performance is no guarantee of future results. The investment return and principal value will fluctuate so that shares, when redeemed, may be worth more or less than the original cost. Please visit www.columbiafunds.com for daily and most recent month-end performance updates.
Summary
1-year return as of 06/30/10
| | |
| |
 | | +17.25% Class A shares (without sales charge) |
| |
| | +21.90% Barclays Capital High Yield Municipal Bond Index |
| |
| | +16.89% Blended Benchmark |
| |
| | +9.61 Barclays Capital Municipal Bond Index |
Summary
| n | | For the 12-month period that ended June 30, 2010, the fund’s Class A shares returned 17.25% without sales charge. |
| n | | The fund’s return was lower than the return of its primary benchmark, the Barclays Capital High Yield Municipal Bond Index1, but higher than the return of the Blended Benchmark2 (which consists of 60% Barclays Capital High Yield Municipal Bond Index and 40% Barclays Capital Municipal Bond Index) and its former benchmark, the Barclays Capital Municipal Bond Index3. The fund trailed the average return of the funds in its peer group, the Lipper High Yield Municipal Debt Funds Classification4. |
| n | | The fund’s higher-quality bias relative to its high yield benchmark and peer group average contributed to underperformance, as the market rally favored higher-risk securities. |
Portfolio Management
Chad Farrington has managed the fund since February 2009 and has been associated with the advisor or its predecessors since 2003.
Effective May 1, 2010, RiverSource Investments, LLC, a subsidiary of Ameriprise Financial, Inc., became the investment advisor to the fund and changed its name to Columbia Management Investment Advisers, LLC. Please see the fund’s prospectus, as supplemented, for more information regarding the change in investment advisor and certain other changes.
| 1 | The Barclays Capital High Yield Municipal Bond Index is comprised of bonds with maturities greater than one- year, having a par value of at least $3 million issued as part of a transaction size greater than $20 million ,and rated no higher than “BB+” or equivalent by any of the three principal rating agencies. |
| 2 | The Blended Benchmark is a custom composite established by the Advisor, consisting of a 60% weighting of the Barclays Capital High Yield Municipal Bond Index and a 40% weighting of the Barclays Capital Municipal Bond Index. |
| 3 | The Barclays Capital Municipal Bond Index is considered representative of the broad market for investment-grade, tax-exempt bonds with a maturity of at least one year. Indices are not available for investment, are not professionally managed and do not reflect sales charges, fees, brokerage commissions, taxes or other expenses of investing. Securities in the fund may not match those in an index. |
| 4 | Lipper Inc., a widely respected data provider in the industry, calculates an average total return (assuming reinvestment of distributions) for mutual funds with investment objectives similar to those of the fund. Lipper makes no adjustment for the effect of sales loads. |
1
Economic Update – Columbia High Yield Municipal Fund
Summary
For the 12-month period that ended June 30, 2010
| | n | | Solid economic growth and relatively low interest rates boosted bond market returns. The Barclays Capital Aggregate Bond Index delivered solid results. High-yield bonds outperformed stocks, as measured by the BofA Merrill Lynch U.S. High Yield Cash Pay Index and the S&P 500 Index. | |
| | |
| Barclays Aggregate Index | | BofA ML Index |
| |

| |
|
9.50% | | 27.01% |
| | n | | The U.S. stock market, as measured by the S&P 500 Index, delivered solid returns, despite a correction in the last months of the period. Emerging market stocks, as measured by the MSCI Emerging Markets Index (Net), outperformed U.S. stocks as well as stock markets in developed foreign markets. | |
| | |
| S&P Index | | MSCI Index |
| |
| |
|
14.43% | | 23.15% |
| | |
Although it has been a year since U.S. economic growth turned positive, the economy continues to send mixed signals about the sustainability of this recovery. Economic growth, as measured by gross domestic product (GDP), was a solid 5.6% in the last quarter of 2009. However, it was 2.7% in the first quarter of 2010, with expectations for lackluster growth through the end of the year, as government incentive programs have ended and stimulus spending winds down.
Consumer spending on cars, clothing and other goods was solid throughout most of the year. But in May, spending on these items fell 1.2%. Consumer confidence, which gained ground earlier in the period, fell sharply in June as consumers surveyed indicated they were concerned about business conditions and job prospects. The housing market — another bellwether for the consumer sector — showed some signs of stabilizing. However, a full recovery remained out of reach. Both new and existing home sales fell in June as a federal tax credit for new and repeat homebuyers was set to expire. Distressed properties continued to pressure prices and a huge backlog of foreclosed homes is likely to continue to keep a lid on prices for some time. The inventory of unsold homes rose to eight and a half months—the long-term average is on the order of six months.
News on the job front was mostly positive, but the number of new jobs added to the economy fell short of expectations. A good portion of the jobs added in March, April and May were temporary, government-sponsored census positions, which began to unwind in June. Private sector job growth was disappointing given the stage of economic recovery.
Reports from the business side of the economy were generally positive. A key measure of the nation’s manufacturing situation — the Institute for Supply Management’s Index — generally rose throughout the period, although there were slight downticks in February and May. Industrial production moved higher, as did the amount of manufacturing capacity utilized — a key measure of the health of the manufacturing sector. Perhaps the best news was about corporate profits. Of the S&P 500 companies announcing first-quarter results, 77% exceeded Wall Street earnings forecasts. Now, the focus has shifted to second-quarter earnings, which will be announced later in the summer.
Bond returns ranged from solid to strong
As the economy strengthened, bonds delivered solid returns. The Barclays Capital Aggregate Bond Index 1 returned 9.50%. Municipal bonds gained almost as much as taxable investment-grade bonds, even without factoring in potential tax advantages to investors in higher income-tax brackets. The Barclays Capital Municipal Bond Index2 returned 9.61%. The high-yield bond market outpaced stocks during the period by a margin of almost two to one. For the 12 months covered by this report, the BofA Merrill Lynch U.S. High Yield Cash Pay Index3 returned 27.01%. Even the Treasury market was positive as the yield on the 10-year U.S. Treasury, a common bellwether for the bond market, fell just below 3.0% at the end of the 12-month period. Despite the pickup in economic activity, the Federal Reserve Board (the Fed) kept a key short-term interest rate — the federal funds rate — close to zero.
2
Economic Update (continued) – Columbia High Yield Municipal Fund
Stocks staged a solid comeback
Against a strengthening economic backdrop, a stock market rally that began in mid-March 2009 continued into the spring of 2010, when a debt crisis brewing in Europe spilled over and reclaimed some of the stock market’s earlier gains. The S&P 500 Index returned 14.43% for the 12-month period.4 Outside the United States, stock market returns were not as strong. The MSCI EAFE Index (Net),5 a broad gauge of stock market performance in foreign developed markets, returned 5.92% (net of dividends, in U.S. dollars) for the period, as concerns about the impact of a bailout for weak eurozone economies weighed on the markets. Emerging stock markets were more resilient. The MSCI Emerging Markets Index (Net)6 returned 23.15% (net of dividends, in U.S. dollars) for the 12-month period.
Past performance is no guarantee of future results.
| 1 | The Barclays Capital Aggregate Bond Index is a market value-weighted index that tracks the daily price, coupon, pay-downs and total return performance of fixed-rate, publicly placed, dollar-denominated and non-convertible investment grade debt issues with at least $250 million par amount outstanding and with at least one year to final maturity. |
| 2 | The Barclays Capital Municipal Bond Index is considered representative of the broad market for investment grade, tax-exempt bonds with a maturity of at least one year. |
| 3 | The BofA Merrill Lynch U.S. High Yield Cash Pay Index tracks the performance of non-investment-grade corporate bonds. |
| 4 | The Standard & Poor’s (S&P) 500 Index tracks the performance of 500 widely held, large-capitalization U.S. stocks. |
| 5 | The Morgan Stanley Capital International Europe, Australasia, Far East (MSCI EAFE) Index (Net) is a capitalization-weighted index that tracks the total return of common stocks in 22 developed-market countries within Europe, Australasia and the Far East. |
| 6 | The Morgan Stanley Capital International Emerging Markets Index (Net) (MSCI EMI) is a free float-adjusted market capitalization index that is designed to measure equity market performance of emerging markets. As of May 2010, the MSCI Emerging Markets Index consisted of the following 21 emerging market country indices: Brazil, Chile, China, Colombia, Czech Republic, Egypt, Hungary, India, Indonesia, Korea, Malaysia, Mexico, Morocco, Peru, Philippines, Poland, Russia, South Africa, Taiwan, Thailand, and Turkey. |
Indices are not available for investment, are not professionally managed and do not reflect sales charges, fees, brokerage commissions, taxes or other expenses of investing. Securities in the fund may not match those in an index.
3
Performance Information – Columbia High Yield Municipal Fund
Performance data quoted represents past performance and current performance may be lower or higher. Past performance is no guarantee of future results. The investment return and principal value will fluctuate so that shares, when redeemed, may be worth more or less than the original cost. Please visit www.columbiafunds.com for daily and most recent month-end performance updates.
| | |
| Annual operating expense ratio (%)* |
| |
Class A | | 0.90 |
Class B | | 1.65 |
Class C | | 1.65 |
Class Z | | 0.70 |
| * | The annual operating expense ratio is as stated in the fund’s prospectus that is current as of the date of this report and includes the expenses incurred by the investment companies in which the fund invests. Differences in expense ratios disclosed elsewhere in this report may result from expenses incurred by the investment companies, inclusion of fee waivers and expense reimbursements as well as the use of different time periods to calculate the ratios. |
|
| Performance of a $10,000 Investment 07/01/00 – 06/30/10 |
The chart above shows the change in value of a hypothetical $10,000 investment in Class A shares of Columbia High Yield Municipal Fund during the stated time period, and does not reflect the deduction of taxes that a shareholder may pay on fund distributions or on the redemption of fund shares. A $10,000 investment in the Fund since 07/01/00 appreciated to $12,142 on May 30, 2003, the inception date of the Barclays Capital High Yield Municipal Bond Index and the Blended Benchmark. For comparison with these indices, we assigned them the same value as the Fund at the indices’ inception date.
| | | | |
| Performance of a $10,000 investment 07/01/00 – 06/30/10 ($) |
| | |
| Sales charge: | | without | | with |
Class A | | 14,898 | | 14,191 |
Class B | | 14,035 | | 14,035 |
Class C | | 14,201 | | 14,201 |
Class Z | | 15,235 | | n/a |
| | | | | | | | | | | | | | |
| Average annual total return as of 06/30/10 (%) |
| | | | |
| Share class | | A | | B | | C | | Z |
| Inception | | 07/31/00 | | 07/15/02 | | 07/15/02 | | 03/05/84 |
| Sales charge | | without | | with | | without | | with | | without | | with | | without |
1-year | | 17.25 | | 11.66 | | 16.39 | | 11.39 | | 16.55 | | 15.55 | | 17.48 |
5-year | | 1.97 | | 0.98 | | 1.22 | | 0.89 | | 1.36 | | 1.36 | | 2.18 |
10-year | | 4.07 | | 3.56 | | 3.45 | | 3.45 | | 3.57 | | 3.57 | | 4.30 |
The “with sales charge” returns include the maximum initial sales charge of 4.75% for Class A shares and the applicable contingent deferred sales charge of 5.00% in the first year, declining to 1.00% in the sixth year and eliminated thereafter for Class B shares and 1.00% for Class C shares for the first year only. The “without sales charge” returns do not include the effect of sales charges. If they had, returns would be lower.
All results shown assume reinvestment of distributions. Class Z shares are sold at net asset value with no distribution and service (Rule 12b-1) fees. Class Z shares have limited eligibility and the investment minimum requirements may vary. Please see the fund’s prospectus for details. Performance for different share classes will vary based on differences in sales charges and fees associated with each class.
Performance results reflect any fee waivers or reimbursements of fund expenses by the investment advisor and/or any of its affiliates. Absent these fee waivers or expense reimbursement arrangements, performance results would have been lower.
The tables do not reflect the deduction of taxes that a shareholder may pay on fund distributions or on the redemption of fund shares.
Class A, Class B and Class C are newer classes of shares. Class A performance information includes the performance of Class Z shares (the oldest existing share class) for periods prior to its inception. Class B and Class C performance information includes returns of Class A shares for the period from July 31, 2000 through July 15, 2002, and the returns of Class Z shares for periods prior thereto. These returns reflect differences in sales charges, but have not been restated to reflect any differences in expenses (such as distribution and service (Rule 12b-1) fees) between Class Z shares (or Class A shares) and the newer classes of shares. If differences in expenses had been reflected, the returns shown for periods prior to the inception of the newer classes of shares would have been lower, since the newer classes of shares are subject to a distribution and service (Rule 12b-1) fees. Class A shares were initially offered on July 31, 2000, Class B and Class C shares were initially offered July 15, 2002, and Class Z shares were initially offered on March 5, 1984.
4
Understanding Your Expenses – Columbia High Yield Municipal Fund
Estimating your actual expenses
To estimate the expenses that you paid over the period, first you will need your account balance at the end of the period:
| | n | | For shareholders who receive their account statements from Columbia Management Investment Services Corp., your account balance is available online at www.columbiafunds.com or by calling Shareholder Services at 800.345.6611. | |
| | n | | For shareholders who receive their account statements from their financial intermediary, contact your financial intermediary to obtain your account balance. | |
| | 1. | Divide your ending account balance by $1,000. For example, if an account balance was $8,600 at the end of the period, the result would be 8.6. | |
| | 2. | In the section of the table below titled “Expenses paid during the period,” locate the amount for your share class. You will find this number in the column labeled “Actual.” Multiply this number by the result from step 1. Your answer is an estimate of the expenses you paid on your account during the period. | |
If the value of your account falls below the minimum initial investment requirement applicable to you, your account may be subject to a $20 annual fee. This fee is not included in the accompanying table. If you are subject to the fee, keep it in mind when you are estimating the ongoing expenses of investing in the fund and when comparing the expenses of this fund with other funds.
As a fund shareholder, you incur two types of costs. There are transaction costs, which generally include sales charges on purchases and may include redemption fees or exchange fees. There are also ongoing costs, which generally include investment advisory fees, distribution and service (Rule 12b-1) fees and other fund expenses. The information on this page is intended to help you understand the ongoing costs of investing in the fund and to compare these costs with the ongoing costs of investing in other mutual funds.
Analyzing your fund’s expenses by share class
To illustrate these ongoing costs, we have provided an example and calculated the expenses paid by investors in each share class during the period. The information in the following table is based on an initial investment of $1,000, which is invested at the beginning of the period and held for the entire period. Expense information is calculated two ways and each method provides you with different information. The amount listed in the “Actual” column is calculated using the fund’s actual operating expenses and total return for the period. The amount listed in the “Hypothetical” column for each share class assumes that the return each year is 5% before expenses and is calculated based on the fund’s actual operating expenses. You should not use the hypothetical account values and expenses to estimate either your actual account balance at the end of the period or the expenses you paid during this period.
Compare with other funds
Since all mutual funds are required to include the same hypothetical calculations about expenses in shareholder reports, you can use this information to compare the ongoing costs of investing in the fund with other funds. To do so, compare the 5% hypothetical example with the 5% hypothetical examples that appear in the shareholder reports of other funds. As you compare hypothetical examples of other funds, it is important to note that hypothetical examples are meant to highlight the ongoing costs of investing in a fund and do not reflect any transaction costs, such as sales charges, redemption fees or exchange fees.
| | | | | | | | | | | | | | |
| 01/01/10 – 06/30/10 |
| | | | |
| | | Account value at the
beginning of the period ($) | | Account value at the
end of the period ($) | | Expenses paid
during the period ($) | | Fund’s annualized
expense ratio (%) |
| | | Actual | | Hypothetical | | Actual | | Hypothetical | | Actual | | Hypothetical | | Actual |
Class A | | 1,000.00 | | 1,000.00 | | 1,058.20 | | 1,020.53 | | 4.39 | | 4.31 | | 0.86 |
Class B | | 1,000.00 | | 1,000.00 | | 1,054.30 | | 1,016.81 | | 8.20 | | 8.05 | | 1.61 |
Class C | | 1,000.00 | | 1,000.00 | | 1,055.10 | | 1,017.55 | | 7.44 | | 7.30 | | 1.46 |
Class Z | | 1,000.00 | | 1,000.00 | | 1,059.30 | | 1,021.52 | | 3.37 | | 3.31 | | 0.66 |
Expenses paid during the period are equal to the annualized expense ratio for the share class, multiplied by the average account value over the period, then multiplied by the number of days in the fund’s most recent fiscal half-year and divided by 365.
Had the investment advisor and/or any of its affiliates not waived fees or reimbursed a portion of expenses for Class C shares, the account value at the end of the period for Class C shares would have been reduced.
It is important to note that the expense amounts shown in the table are meant to highlight only ongoing costs of investing in the fund and do not reflect any transaction costs, such as sales charges, redemption fees or exchange fees. Therefore, the hypothetical examples provided may not help you determine the relative total costs of owning shares of different funds. If these transaction costs were included, your costs would have been higher.
5
Portfolio Manager’s Report – Columbia High Yield Municipal Fund
Performance data quoted represents past performance and current performance may be lower or higher. Past performance is no guarantee of future results. The investment return and principal value will fluctuate so that shares, when redeemed, may be worth more or less than the original cost. Please visit www.columbiafunds.com for daily and most recent month-end performance updates.
| | |
| Net asset value per share |
| |
as of 06/30/10 ($) | | |
Class A | | 9.77 |
Class B | | 9.77 |
Class C | | 9.77 |
Class Z | | 9.77 |
| | |
| Distributions declared per share |
| |
07/01/09 – 06/30/10 ($) | | |
Class A | | 0.51 |
Class B | | 0.44 |
Class C | | 0.45 |
Class Z | | 0.53 |
A portion of the fund’s income may be subject to the alternative minimum tax. The fund may at times purchase tax-exempt securities at a discount. Some, or all of this discount may be included in the fund’s ordinary income, and is taxable when distributed.
| | |
| 30-day SEC yields |
| |
as of 06/30/10 (%) | | |
Class A | | 5.03 |
Class B | | 4.53 |
Class C | | 4.68 |
Class Z | | 5.49 |
The 30-day SEC yields reflect the fund’s earning power, net of expenses, expressed as an annualized percentage of the public offering price per share at the end of the period.
| | |
| Taxable-equivalent SEC yields |
| |
as of 06/30/10 (%) | | |
Class A | | 7.74 |
Class B | | 6.97 |
Class C | | 7.20 |
Class Z | | 8.44 |
Taxable-equivalent SEC yields are based on the maximum effective 35.0% federal income tax rate. This tax rate does not reflect the phase out of exemptions or the reduction of otherwise allowable deductions that occur when adjusted gross income exceeds certain levels.
For the 12-month period that ended June 30, 2010, the fund’s Class A shares returned 17.25% without sales charge. By comparison, the fund’s primary benchmark, the Barclays Capital High Yield Municipal Bond Index, returned 21.90% and its Blended Benchmark returned 16.89%, while the fund’s former benchmark, the Barclays Capital Municipal Bond Index, returned 9.61%. The fund also trailed the 18.52% average return of the funds in its peer group, the Lipper High Yield Municipal Debt Funds Classification. The fund’s higher-quality, shorter-maturity bias hampered its return against the Barclays High Yield Municipal Index, which only includes bonds with below investment-grade ratings, and also against the Lipper peer group. The fund benefited from having more exposure to higher-yielding, lower-quality municipal bonds than the Barclays Capital Municipal Bond Index, which consists entirely of investment-grade (BBB or higher) issues.
A good year for high-yield municipals
During the year covered by this report, the municipal sector benefited from a decrease in new tax-exempt issuances and rising demand from investors, who are likely anticipating higher tax rates. Yields declined across all maturities, with long maturity issues producing the strongest gains. Higher-yielding, lower-quality bonds did especially well as low interest rates and an improving economy pushed investors to take on more risk for added yield. Within the high-yield sector, the best performers were airline, industrial revenue and hospital bonds.
During the period, we focused on lower-rated (BBB and below) and longer-maturity (20- to 30-year) municipal bonds with attractive yields. The fund owned BBB and A-rated bonds in certain sectors with compelling yields, including securities used to finance hospital and continuing care retirement center (CCRC) projects. When we could not find attractive high-yield opportunities, we put cash to work in shorter-maturity, higher-quality bonds that provided better-than-cash yields while maintaining liquidity. At the close of the period, approximately 40% of the fund’s assets were invested in non-rated or below-investment-grade bonds with the balance in investment-grade issues.
Rebounds from depressed sectors
CCRC bonds with ratings of BBB and below made strong comebacks during the period, as more people were able to sell their homes to fund moves into retirement communities. Bonds secured by economically sensitive revenues, such as sales tax revenues, also rebounded sharply, as did certain special assessment district bonds in Florida, which are issued by developers to help fund infrastructure needs for new developments. Electric utility bonds with ratings of BBB and lower further aided results. All these sectors benefited from an improving economic outlook. The most significant contribution to return came from tax-exempt bonds issued by Visy Paper, Inc. (0.6% of net assets) — a non-rated forest products company in Georgia, which rallied as investors became less risk averse.
Disappointing sector weights
No sector generated negative returns for the fund. However, an underweight in industrial development revenue bonds, particularly prepaid gas bonds, hampered
6
Portfolio Manager’s Report (continued) – Columbia High Yield Municipal Fund
results versus the peer group and high-yield benchmark. Prepaid gas bonds, which are issued by public utilities with the help of investment banks to guarantee set natural gas rates, rallied sharply from the lows they reached when investment bank Lehman Brothers went bankrupt in 2008. The fund also lost ground because it was underweight in tax-exempt airline bonds, which are backed by the lease revenues received from major airlines. These bonds rebounded as the economy recovered and prospects for travel improved. Credits that hurt performance included two CCRC issues in Illinois, Sedgebrook and Monarch Landing (0.3% and 0.04% of net assets), which defaulted when their for-profit management company filed for bankruptcy, and a special assessment district bond in Florida, Sarasota National (0.2% of net assets), which defaulted due to lack of developer support for the project.
Cautious outlook
We expect continued low interest rates combined with higher tax rates and limited tax-exempt supply to support strong demand for high-yield municipals. In addition, although the yield difference between BBB and AAA rated municipal bonds has narrowed, it remains wide relative to historical averages in many sectors, including hospitals, CCRCs, some special assessment districts and charter schools. We believe the yield difference in these sectors could narrow further, which would benefit high-yield bond prices. Going forward, we plan to selectively add yield through the purchase of lower-quality securities as long as we believe that we are being compensated for the risk.
Past performance is no guarantee of future results.
Portfolio characteristics and holdings are subject to change periodically and may not be representative of current characteristics and holdings. The outlook for the fund may differ from those presented for other Columbia Funds.
Tax-exempt investing offers current tax-exempt income, but it also involves special risks. The value of the fund will be affected by interest rate changes and the creditworthiness of issues held in the fund. When interest rates go up, bond prices generally drop and vice versa. Interest income from certain tax-exempt bonds may be subject to certain state and local taxes and, if applicable, the alternative minimum tax. Any capital gains distributed are taxable to the investor.
Investments in high-yield bonds (sometimes referred to as “junk” bonds) offer the potential for high current income and attractive total return, but involve certain risks. Changes in economic conditions or other circumstances may adversely affect a high-yield bond issuer’s ability to make principal and interest payments.
| | |
| Top 10 issuers |
|
as of 06/30/10 (%) |
TX Dallas-Fort Worth International Airport American Airlines, Inc | | 2.08 |
OH Buckeye Tobacco Settlement Financing Authority | | 1.63 |
NJ Economic Development Authority | | 1.46 |
CA State General Obligations | | 1.01 |
MD State General Obligations | | 0.97 |
CA Housing Finance Agency | | 0.93 |
MI Municipal Bond Authority | | 0.79 |
CO Health Facilities Authority Evangelical Lutheran Society | | 0.77 |
KS Lenexa Lakeview Village, Inc. | | 0.74 |
FL Board of Education | | 0.72 |
| | |
| Quality breakdown |
|
as of 06/30/10 (%) |
AAA | | 9.8 |
AA | | 4.2 |
A | | 19.1 |
BBB | | 27.4 |
BB | | 3.1 |
B | | 2.5 |
CCC | | 1.0 |
Non-Rated | | 32.9 |
| | |
| Maturity breakdown |
|
as of 06/30/10 (%) |
0–1 year | | 1.8 |
1–3 years | | 5.6 |
3–5 years | | 3.7 |
5–7 years | | 3.2 |
7–10 years | | 7.3 |
10–15 years | | 7.7 |
15–20 years | | 14.3 |
20–25 years | | 14.9 |
25 years and over | | 39.4 |
Cash & Equivalents | | 2.1 |
The fund is actively managed and the composition of its portfolio will change over time. Top 10 issuers, quality and maturity breakdowns are calculated as a percentage of net assets. Ratings shown in the quality breakdown are assigned to individual bonds by taking the lower of the ratings available from one of the following nationally recognized rating agencies: Standard & Poor’s or Moody’s Investor Services. If a security is rated by only one of the two agencies, that rating is used. If a security is not rated by either of the two agencies, it is designated as Non-Rated. Ratings are relative and subjective and are not absolute standards of quality. The credit quality of the fund’s investments does not remove market risk.
7
Investment Portfolio – Columbia High Yield Municipal Fund
June 30, 2010
Municipal Bonds – 96.9%
| | | | |
| | | Par ($) | | Value ($) |
| Education – 5.2% | | | | |
| Education – 2.1% | | |
| CA Municipal Finance Authority | | |
Biola University,
Series 2008,
5.875% 10/01/34 | | 1,500,000 | | 1,541,640 |
| |
| CA Statewide Communities Development Authority | | |
San Francisco Art Institute,
Series 2002,
7.375% 04/01/32 | | 500,000 | | 417,185 |
| |
| IL Finance Authority | | |
Columbia College,
Series 2007, Insured: NPFGC 5.000% 12/01/37 | | 5,000,000 | | 4,485,400 |
| |
| OR Forest Grove | | |
Pacific University,
Series 2009,
6.375% 05/01/39 | | 2,000,000 | | 2,086,240 |
| |
| VT Education & Health Buildings Agency | | |
Vermont Law School Project,
Series 2003 A,
5.500% 01/01/33 | | 500,000 | | 477,055 |
| |
| WI Health & Educational Facilities Authority | | |
Medical College of Wisconsin,
Series 2008 A,
5.250% 12/01/35 | | 5,000,000 | | 4,951,300 |
| |
| WV University of West Virginia | | |
Series 2000 A,
Insured: AMBAC: | | | | |
(a) 04/01/19 | | 1,250,000 | | 869,375 |
(a) 04/01/25 | | 2,750,000 | | 1,342,523 |
| | | | |
Education Total | | | | 16,170,718 |
| | |
| Prep School – 2.5% | | | | |
| AZ Pima County Industrial Development Authority | | |
American Charter School Foundation,
Series 2007 A,
5.625% 07/01/38 | | 3,440,000 | | 3,030,124 |
| |
| CA Statewide Communities Development Authority | | |
Crossroads School for Arts & Sciences,
Series 1998,
6.000% 08/01/28 (b) | | 890,000 | | 859,500 |
| | | | |
| | | Par ($) | | Value ($) |
Series 2010, | | | | |
GTY AGMT: PCSD Guaranty
Pool LLC
6.125% 07/01/46 | | 5,000,000 | | 4,967,600 |
| IL Finance Authority | | |
Chicago Charter School Foundation,
Series 2007,
5.000% 12/01/36 | | 1,750,000 | | 1,555,365 |
| |
| MI Conner Creek Academy | | |
Series 2007,
5.000% 11/01/26 | | 2,540,000 | | 1,981,733 |
| |
| MI Summit Academy North | | |
Series 2005,
5.500% 11/01/35 | | 750,000 | | 511,050 |
| |
| TX La Vernia Higher Education Finance Corp. | | |
Kipp, Inc,
Series 2009 A: | | | | |
6.000% 08/15/29 | | 1,000,000 | | 1,036,150 |
6.250% 08/15/39 | | 1,500,000 | | 1,552,560 |
| |
| TX Pharr Higher Education Finance Authority | | |
Series 2009 A,
6.500% 08/15/39 | | 3,000,000 | | 3,099,720 |
| | | | |
Prep School Total | | | | 18,593,802 |
| | |
| Student Loan – 0.6% | | | | |
| CT Higher Education Supplemental Loan Authority | | |
Family Education Loan Program,
Series 2005 A, AMT,
Insured: NPFGC | | |
4.375% 11/15/21 | | 1,020,000 | | 974,528 |
| |
| MA Educational Financing Authority | | |
Series 2008 H, AMT,
Insured: AGO
6.350% 01/01/30 | | 3,635,000 | | 3,829,691 |
| | | | |
Student Loan Total | | | | 4,804,219 |
| | | | |
Education Total | | | | 39,568,739 |
| | | | |
| Health Care – 35.3% | | | | |
| Continuing Care Retirement – 18.0% | | |
| CA Statewide Communities Development Authority | | |
American Baptist Homes West, Series 2010,
GTY AGMT: American Baptist Homes Foundation | | | | |
6.250% 10/01/39 | | 2,750,000 | | 2,731,410 |
See Accompanying Notes to Financial Statements.
8
Columbia High Yield Municipal Fund
June 30, 2010
Municipal Bonds (continued)
| | | | |
| | | Par ($) | | Value ($) |
| Health Care (continued) | | | | |
| CO Health Facilities Authority | | |
Christian Living Communities,
Series 2006 A: | | | | |
5.750% 01/01/26 | | 500,000 | | 467,425 |
5.750% 01/01/37 | | 1,500,000 | | 1,307,775 |
Covenant Retirement Communities, Inc.:
Series 2002 B, |
6.125% 12/01/33 | | 1,000,000 | | 972,700 |
Series 2005, | | | | |
5.000% 12/01/35 | | 2,900,000 | | 2,428,315 |
| |
| FL Lakeland | | |
Series 2008: | | | | |
6.250% 01/01/28 | | 675,000 | | 645,975 |
6.375% 01/01/43 | | 2,250,000 | | 2,078,640 |
| |
| FL Lee County Industrial Development Authority | | |
Shell Point Village,
Series 2007,
5.000% 11/15/29 | | 4,000,000 | | 3,379,200 |
| |
| FL Orange County Health Facilities Authority | | |
Orlando Lutheran:
Series 2005,
5.700% 07/01/26 | | 2,000,000 | | 1,792,920 |
Series 2007: | | | | |
5.500% 07/01/32 | | 350,000 | | 294,270 |
5.500% 07/01/38 | | 1,750,000 | | 1,438,832 |
| |
| FL Palm Beach County Health Facilities Authority | | |
Abbey Delray South,
Series 2003,
5.350% 10/01/14 | | 1,250,000 | | 1,308,487 |
| |
| FL Sarasota County Health Facility Authority | | |
Village on the Isle,
Series 2007,
5.500% 01/01/32 | | 4,000,000 | | 3,548,560 |
| |
| FL St. John’s County Industrial Development Authority | | |
Glenmoor at St. John’s, Inc.,
Series 2006 A,
5.375% 01/01/40 | | 4,275,000 | | 3,111,687 |
Ponte Vedra, Inc.,
Series 2007,
5.000% 02/15/27 | | 4,030,000 | | 3,625,106 |
| |
| GA Fulton County | | |
Canterbury Court,
Series 2004 A,
6.125% 02/15/34 | | 1,000,000 | | 899,540 |
| | | | |
| | | Par ($) | | Value ($) |
Lenbrook,
Series 2006 A: | | | | |
5.000% 07/01/17 | | 2,000,000 | | 1,800,320 |
5.000% 07/01/29 | | 3,000,000 | | 2,126,400 |
| |
| GA Savannah Economic Development Authority | | |
Marshes of Skidaway,
Series 2003 A: | | | | |
7.400% 01/01/24 | | 500,000 | | 501,170 |
7.400% 01/01/34 | | 3,000,000 | | 2,902,890 |
| |
| HI Department of Budget & Finance | | |
Series 2009, | | | | |
9.000% 11/15/44 | | 2,375,000 | | 2,662,090 |
| |
| IA Finance Authority | | |
Deerfield Retirement Community, Inc.,
Series 2007 A:
5.000% 11/15/15 | | 2,210,000 | | 1,929,750 |
5.500% 11/15/27 | | 1,135,000 | | 822,217 |
5.500% 11/15/37 | | 750,000 | | 496,208 |
| |
| IL Du Page County Special Service Area No. 31 | | |
Monarch Landing Project,
Series 2006,
5.625% 03/01/36 | | 750,000 | | 587,963 |
| |
| IL Finance Authority | | |
Lutheran Senior Services,
Series 2006,
5.125% 02/01/26 | | 2,000,000 | | 1,882,160 |
Monarch Landing, Inc.,
Series 2007 A,
7.000% 12/01/27 (c) | | 1,502,364 | | 300,473 |
Sedgebrook, Inc.,
Series 2007 A: | | | | |
6.000% 11/15/37 (c) | | 5,000,000 | | 1,750,000 |
6.000% 11/15/42 (c) | | 2,000,000 | | 700,000 |
Washington & Jane Smith Community:
Series 2003 A,
7.000% 11/15/32 | | 1,000,000 | | 920,770 |
Series 2005 A, | | | | |
6.250% 11/15/35 | | 2,750,000 | | 2,340,305 |
| |
| IL Lincolnshire Special Services Area No. 1 | | |
Sedgebrook Project,
Series 2004,
6.250% 03/01/34 | | 750,000 | | 647,550 |
See Accompanying Notes to Financial Statements.
9
Columbia High Yield Municipal Fund
June 30, 2010
Municipal Bonds (continued)
| | | | |
| | | Par ($) | | Value ($) |
| Health Care (continued) | | | | |
| IN Health & Educational Facilities Financing Authority | | |
Baptist Homes of Indiana, Inc., Series 2005,
5.250% 11/15/35 | | 2,750,000 | | 2,533,052 |
| |
| KS Lenexa | | |
Lakeview Village, Inc.:
Series 2007,
5.500% 05/15/39 | | 4,250,000 | | 3,545,775 |
Series 2009: | | | | |
7.125% 05/15/29 | | 500,000 | | 507,740 |
7.250% 05/15/39 | | 1,500,000 | | 1,542,180 |
| |
| KS Manhattan | | |
Manhattan Health Care Facility, Series 2007 A,
5.000% 05/15/29 | | 2,680,000 | | 2,083,512 |
| | |
| MA Development Finance Agency | | | | |
Linden Ponds, Inc.,
Series 2007 A:
5.500% 11/15/27 | | 3,000,000 | | 2,251,860 |
5.750% 11/15/35 | | 900,000 | | 647,577 |
5.750% 11/15/42 | | 3,530,000 | | 2,459,033 |
Series 2009 B1, | | | | |
7.250% 06/01/16 | | 3,500,000 | | 3,513,860 |
Series 2009, | | | | |
7.875% 06/01/44 | | 1,500,000 | | 1,560,555 |
| |
| MD Howard County | | |
Columbia Vantage House Corp.: Series 2007 A,
5.250% 04/01/33 | | 1,990,000 | | 1,517,057 |
Series 2007 B, | | | | |
5.250% 04/01/37 | | 1,500,000 | | 1,109,940 |
| |
| MD Westminster Economic Development Authority | | |
Carroll Lutheran Village, Inc.,
Series 2004 A,
6.250% 05/01/34 | | 1,750,000 | | 1,506,872 |
| |
| MN Columbia Heights | | |
Crest View Corp.,
Series 2007 A:
5.550% 07/01/27 | | 1,000,000 | | 837,160 |
5.700% 07/01/42 | | 2,000,000 | | 1,511,800 |
| |
| MO Health & Educational Facilities Authority | | |
Lutheran Senior Services,
Series 2007 A,
4.875% 02/01/27 | | 3,000,000 | | 2,712,690 |
| | | | |
| | | Par ($) | | Value ($) |
| MO Kirkwood Industrial Development Authority | | |
Ashfield Active Living and Wellness Communities, Inc.,
Series 2010 A,
8.250% 05/15/45 | | 4,500,000 | | 4,463,595 |
| |
| MO St. Louis Industrial Development Authority | | |
St. Andrew’s Resources for Seniors, | | | | |
Series 2007 A: | | | | |
6.250% 12/01/26 | | 2,000,000 | | 1,851,200 |
6.375% 12/01/41 | | 3,000,000 | | 2,693,280 |
| |
| MT Facility Finance Authority | | |
St. John’s Lutheran Ministries, Inc., Series 2006 A,
6.125% 05/15/36 | | 1,000,000 | | 793,620 |
| |
| NJ Economic Development Authority | | |
Seabrook Village, Inc.,
Series 2006,
5.250% 11/15/36 | | 2,250,000 | | 1,865,407 |
| |
| NY Broome County Industrial Development Agency | | |
Good Shepherd Village Endwell, | | | | |
Series 2008 A, 6.875% 07/01/40 | | 4,000,000 | | 3,342,840 |
| |
| NY East Rochester Housing Authority | | |
Woodland Village Project,
Series 2006,
5.500% 08/01/33 | | 1,700,000 | | 1,435,718 |
| |
| PA Bucks County Industrial Development Authority | | |
Ann’s Choice, Inc.,
Series 2005 A,
6.250% 01/01/35 | | 1,750,000 | | 1,601,057 |
| |
| PA Chartiers Valley Industrial & Commercial Development Authority | | |
Asbury Health Center,
Series 1999,
6.375% 12/01/24 | | 750,000 | | 719,625 |
| |
| PA Montgomery County Industrial Development Authority | | |
Whitemarsh Continuing Care Retirement Community:
Series 2005:
6.125% 02/01/28 | | 1,400,000 | | 1,139,768 |
6.250% 02/01/35 | | 1,350,000 | | 1,045,562 |
Series 2008, 7.000% 02/01/36 | | 2,000,000 | | 1,697,980 |
See Accompanying Notes to Financial Statements.
10
Columbia High Yield Municipal Fund
June 30, 2010
Municipal Bonds (continued)
| | | | |
| | | Par ($) | | Value ($) |
| Health Care (continued) | | | | |
| SC Jobs Economic Development Authority | | |
Lutheran Homes of South Carolina, Inc.,
Series 2007:
5.375% 05/01/21 | | 1,000,000 | | 935,570 |
5.500% 05/01/28 | | 1,100,000 | | 991,221 |
Wesley Commons,
Series 2006,
5.300% 10/01/36 | | 3,000,000 | | 2,358,090 |
| |
| TN Metropolitan Government Nashville & Davidson County | | |
Blakeford at Green Hills,
Series 1998,
5.650% 07/01/24 | | 1,825,000 | | 1,588,352 |
| |
TN Shelby County Health Educational &
Housing Facilities Board | | |
Germantown Village:
Series 2003 A,
7.250% 12/01/34 | | 675,000 | | 660,589 |
Series 2006, 6.250% 12/01/34 | | 500,000 | | 433,435 |
| |
| TX Abilene Health Facilities Development Corp. | | |
Sears Methodist Retirement Center: Series 1998 A,
5.900% 11/15/25 | | 1,350,000 | | 1,133,150 |
Series 2003 A, 7.000% 11/15/33 | | 800,000 | | 709,008 |
| |
| TX HFDC of Central Texas, Inc. | | |
Legacy at Willow Bend,
Series 2006 A,
5.750% 11/01/36 | | 5,000,000 | | 3,991,150 |
Sears Tyler Methodist Retirement,
Series 2009 A,
7.750% 11/15/44 | | 4,000,000 | | 4,004,680 |
| |
TX Tarrant County Cultural Education
Facilities Finance Corp. | | |
Air Force Villages, Inc.,
Series 2009,
6.375% 11/15/44 | | 4,250,000 | | 4,250,807 |
CC Young Memorial Home,
Series 2009,
8.000% 02/15/38 | | 4,000,000 | | 4,012,720 |
| | | | |
| | | Par ($) | | Value ($) |
| WI Health & Educational Facilities Authority | | |
Clement Manor,
Series 1998,
5.750% 08/15/24 | | 2,200,000 | | 2,022,284 |
Series 2009 A, 7.625% 09/15/39 | | 1,750,000 | | 1,850,905 |
Series 2009 C-1, 6.400% 09/15/15 | | 2,000,000 | | 2,002,880 |
Three Pillars Senior Living Communities:
Series 2003,
5.600% 08/15/23 | | 790,000 | | 793,666 |
Series 2004 A, 5.500% 08/15/34 | | 870,000 | | 789,186 |
| | | | |
Continuing Care Retirement Total | | 137,419,116 |
| | |
| Health Services – 0.5% | | | | |
| MA Development Finance Agency | | |
Boston Biomedical Research Institute,
Series 1999:
5.650% 02/01/19 | | 340,000 | | 333,669 |
5.750% 02/01/29 | | 375,000 | | 349,470 |
| |
MN Minneapolis & St. Paul
Housing & Redevelopment Authority | | |
HealthPartners,
Series 2003,
5.875% 12/01/29 | | 400,000 | | 401,388 |
| |
| VA Small Business Financing Authority | | |
Series 2009,
8.000% 07/01/19 | | 2,895,000 | | 3,199,728 |
| | | | |
Health Services Total | | | | 4,284,255 |
| | |
| Hospitals – 13.6% | | | | |
| AZ Health Facilities Authority | | |
Phoenix Memorial Hospital,
Series 1991,
8.125% 06/01/12 (d) | | 1,803,743 | | 18,037 |
| |
| AZ Yavapai County Industrial Development Authority | | |
Yavapai Community Hospital Association,
Series 2008 B,
5.625% 08/01/37 | | 3,500,000 | | 3,343,165 |
See Accompanying Notes to Financial Statements.
11
Columbia High Yield Municipal Fund
June 30, 2010
Municipal Bonds (continued)
| | | | |
| | | Par ($) | | Value ($) |
| Health Care (continued) | | | | |
| CA Health Facilities Financing Authority | | |
Catholic Healthcare West,
Series 2009 F,
5.000% 07/01/27 (07/01/14) (e)(f) | | 1,000,000 | | 1,086,710 |
| |
| CO Health Facilities Authority | | |
Catholic Health Initiatives,
Series 2008,
4.000% 10/01/40 (11/12/15) (e)(f) | | 1,725,000 | | 1,820,393 |
| |
| DE Health Facilities Authority | | |
Beebe Medical Center,
Series 2004 A,
5.250% 06/01/11 | | 1,275,000 | | 1,083,368 |
| |
| FL North Brevard County Hospital District | | |
Series 2008,
5.750% 10/01/38 | | 5,000,000 | | 5,124,850 |
| |
| FL Orange County Health Facilities Authority | | |
Orlando Regional Healthcare System,
Series 2008 C,
5.250% 10/01/35 | | 4,000,000 | | 3,944,600 |
| |
| FL South Lake Hospital District | | |
South Lake Hospital, Inc.:
Series 2003: | | | | |
6.375% 10/01/28 | | 750,000 | | 758,775 |
6.375% 10/01/34 | | 500,000 | | 502,775 |
Series 2010, 6.250% 04/01/39 | | 665,000 | | 682,396 |
| |
| FL West Orange Health Care District | | |
Series 2001 A,
5.650% 02/01/22 | | 1,450,000 | | 1,466,559 |
| |
| GA DeKalb County Hospital Authority | | |
Dekalb Medical Center, Inc.,
Series 2010,
6.125% 09/01/40 | | 4,500,000 | | 4,465,845 |
| |
| IL Finance Authority | | |
Provena Health,
Series 2009,
7.750% 08/15/34 | | 4,000,000 | | 4,604,480 |
Riverside Health System,
Series 2009,
6.250% 11/15/35 | | 3,000,000 | | 3,142,710 |
Silver Cross Hospital & Medical,
Series 2009,
7.000% 08/15/44 | | 5,000,000 | | 5,313,050 |
| | | | |
| | | Par ($) | | Value ($) |
| IL Southwestern Development Authority | | |
Anderson Hospital: | | | | |
Series 1999, 5.625% 08/15/29 | | 250,000 | | 240,500 |
Series 2006, 5.125% 08/15/26 | | 1,245,000 | | 1,141,528 |
| |
| IN Health & Educational Facility Financing Authority | | |
Schneck Memorial,
Series 2006 A,
5.250% 02/15/30 | | 1,000,000 | | 941,560 |
| |
| LA Public Facilities Authority | | |
Ochsner Clinic Foundation,
Series 2007 A,
5.250% 05/15/38 | | 5,000,000 | | 4,373,200 |
Touro Infirmary,
Series 1999 A: | | | | |
5.500% 08/15/19 | | 510,000 | | 479,318 |
5.625% 08/15/29 | | 240,000 | | 216,948 |
| |
| MA Health & Educational Facilities Authority | | |
Boston Medical Center,
Series 2008,
5.250% 07/01/38 | | 5,000,000 | | 4,563,600 |
Milford-Whitinsville Regional Hospital,
Series 2007,
5.000% 07/15/32 | | 1,250,000 | | 1,020,600 |
| |
| MI Dickinson County | | |
Dickinson County Health Care System,
Series 1999,
5.800% 11/01/24 | | 1,000,000 | | 978,040 |
| |
| MI Hospital Finance Authority | | |
Detroit Medical Center,
Series 1997 A,
Insured: AMBAC | | | | |
5.500% 08/15/24 | | 3,000,000 | | 2,600,430 |
Garden City Hospital,
Series 2007,
5.000% 08/15/38 | | 2,250,000 | | 1,486,485 |
Henry Ford Health,
Series 2006 A: | | | | |
5.000% 11/15/21 | | 1,000,000 | | 985,460 |
5.250% 11/15/46 | | 3,000,000 | | 2,691,120 |
McLaren Health Care Corp.,
Series 2005 C,
5.000% 08/01/35 | | 2,500,000 | | 2,330,875 |
See Accompanying Notes to Financial Statements.
12
Columbia High Yield Municipal Fund
June 30, 2010
Municipal Bonds (continued)
| | | | |
| | | Par ($) | | Value ($) |
| Health Care (continued) | | | | |
Oakwood Healthcare System,
Series 2007,
5.000% 07/15/37 | | 5,000,000 | | 4,501,100 |
| |
| MI Saginaw Hospital Finance Authority | | |
Covenant Medical Center Inc.,
Series 2000 F,
6.500% 07/01/30 | | 3,000,000 | | 3,031,230 |
| |
| MN St. Paul Housing & Redevelopment Authority | | |
HealthEast, Inc.,
Series 2005,
6.000% 11/15/30 | | 4,000,000 | | 3,867,480 |
| |
MN Washington County Housing &
Redevelopment Authority | | |
HealthEast, Inc.,
Series 1998,
5.250% 11/15/12 | | 1,100,000 | | 1,108,063 |
| |
| MO Cape Girardeau County | | |
Southeast Missouri Hospital Association,
Series 2003,
5.000% 06/01/27 | | 3,750,000 | | 3,414,112 |
| |
| MO Grundy County Industrial Development Authority | | |
Series 2009,
6.750% 09/01/34 | | 2,250,000 | | 2,294,348 |
| |
| MO Saline County Industrial Development Authority | | |
John Fitzgibbon Memorial Hospital,
Series 2005,
5.625% 12/01/35 | | 5,485,000 | | 4,527,648 |
| |
| NC Medical Care Commission | | |
Stanly Memorial Hospital,
Series 1999,
6.375% 10/01/29 | | 1,000,000 | | 1,000,820 |
| |
| NJ Health Care Facilities Financing Authority | | |
St. Joseph’s Hospital & Medical Center,
Series 2008: | | | | |
6.000% 07/01/18 | | 2,000,000 | | 2,095,480 |
6.625% 07/01/38 | | 2,000,000 | | 2,066,860 |
| | | | |
| | | Par ($) | | Value ($) |
| NY Dormitory Authority | | |
NYU Hospital Center,
Series 2007 B,
5.625% 07/01/37 | | 2,000,000 | | 2,049,240 |
| |
| NY Monroe County Industrial Development Agency | | |
Highland Hospital,
Series 2005,
5.000% 08/01/25 | | 1,110,000 | | 1,092,407 |
| |
| OH Lakewood Hospital Improvement District | | |
Lakewood Hospital Association,
Series 2003,
5.500% 02/15/15 | | 1,250,000 | | 1,324,375 |
| |
| SC Jobs Economic Development Authority | | |
Series 2008,
6.000% 09/15/38 | | 4,000,000 | | 3,994,160 |
| |
TN Sullivan County Health Educational &
Housing Facilities Board | | |
Wellmont Health System,
Series 2006 C,
5.250% 09/01/36 | | 3,635,000 | | 3,321,663 |
| |
| WI Health & Educational Facilities Authority | | |
Aurora Health Care, Inc.,
Series 2003,
6.400% 04/15/33 | | 700,000 | | 713,853 |
Fort Health Care, Inc.,
Series 2004,
6.100% 05/01/34 | | 1,965,000 | | 1,962,347 |
| | | | |
Hospitals Total | | | | 103,772,563 |
| |
| Intermediate Care Facilities – 0.5% | | |
| IL Development Finance Authority | | |
Hoosier Care, Inc.,
Series 1999 A,
7.125% 06/01/34 | | 1,350,000 | | 1,166,211 |
| |
| IN Health Facilities Financing Authority | | |
Hoosier Care, Inc.,
Series 1999 A,
7.125% 06/01/34 | | 1,105,000 | | 932,885 |
| |
| LA Public Facilities Authority | | |
Progressive Health Care Providers, Inc.,
Series 1998,
6.375% 10/01/28 | | 2,000,000 | | 1,645,940 |
| | | | |
Intermediate Care Facilities Total | | 3,745,036 |
See Accompanying Notes to Financial Statements.
13
Columbia High Yield Municipal Fund
June 30, 2010
Municipal Bonds (continued)
| | | | |
| | | Par ($) | | Value ($) |
| Health Care (continued) | | | | |
| Nursing Homes – 2.7% | | | | |
| AK Juneau | | |
St. Ann’s Care Center, Inc.,
Series 1999,
6.875% 12/01/25 | | 1,500,000 | | 1,434,810 |
| |
| CO Health Facilities Authority | | |
Evangelical Lutheran Society,
Series 2009 A,
6.125% 06/01/38 | | 5,750,000 | | 5,854,592 |
| |
| CT Development Authority Health Facility | | |
Alzheimers Resources Center, Inc.,
Series 2007: | | | | |
5.400% 08/15/21 | | 1,080,000 | | 994,982 |
5.500% 08/15/27 | | 1,000,000 | | 854,330 |
| |
| IA Finance Authority | | |
Care Initiatives,
Series 1998 B: | | | | |
5.750% 07/01/18 | | 555,000 | | 514,374 |
5.750% 07/01/28 | | 1,475,000 | | 1,212,288 |
| |
| IA Marion Health Care Facilities | | |
AHF/Kentucky-Iowa, Inc.,
Series 2003,
8.000% 01/01/29 | | 285,000 | | 285,493 |
| |
| KY Economic Development Finance Authority | | |
AHF/Kentucky-Iowa, Inc.,
Series 2003,
8.000% 01/01/29 | | 873,000 | | 874,510 |
| |
| MA Development Finance Agency | | |
Alliance Health Care,
Series 1999 A,
7.100% 07/01/32 | | 2,085,000 | | 1,872,476 |
| |
| MA Industrial Finance Agency | | |
GF/Massachusetts, Inc.,
Series 1994,
8.300% 07/01/23 (g) | | 755,000 | | 528,500 |
| |
| MN Eveleth | | |
Arrowhead Senior Living Community,
Series 2007,
5.200% 10/01/27 | | 2,375,000 | | 1,849,199 |
| |
| MN Sartell | | |
Foundation for Health Care: | | | | |
Series 1999 A, | | | | |
6.625% 09/01/29 | | 2,000,000 | | 2,010,780 |
| | | | |
| | | Par ($) | | Value ($) |
Series 2001 A, | | | | |
8.000% 09/01/30 | | 975,000 | | 975,907 |
| |
| MO St. Louis County Industrial Development Authority | | |
Ranken Jordan,
Series 2007,
5.000% 11/15/35 | | 1,300,000 | | 1,022,827 |
| |
| NJ Economic Development Authority | | |
Seashore Gardens,
Series 2006,
5.300% 11/01/26 | | 500,000 | | 417,175 |
| |
| PA Chester County Industrial Development Authority | | |
Pennsylvania Nursing Home, Series 2002,
8.500% 05/01/32 | | 365,000 | | 328,803 |
| | | | |
Nursing Homes Total | | | | 21,031,046 |
| | | | |
Health Care Total | | | | 270,252,016 |
| | | | |
| Housing – 7.3% |
| Assisted Living/Senior – 1.4% |
| DE Kent County | | |
Heritage at Dover,
Series 1999, AMT,
7.625% 01/01/30 | | 2,405,000 | | 2,057,093 |
| |
| FL St. John’s County Industrial Development Authority | | |
Bayview Assisted Living,
Series 2007 A,
5.250% 10/01/41 | | 3,725,000 | | 2,615,062 |
| |
| GA Columbus Housing Authority | | |
The Gardens at Calvary,
Series 1999,
7.000% 11/15/29 | | 2,000,000 | | 1,667,840 |
| |
| MA Development Finance Agency | | |
VOA Concord Assisted Living, Inc.,
Series 2007,
5.200% 11/01/41 | | 1,000,000 | | 719,190 |
| |
| MN Roseville | | |
Care Institute, Inc.,
Series 1993,
7.750% 11/01/23 | | 1,270,000 | | 985,329 |
| |
| NY Huntington Housing Authority | | |
Gurwin Jewish Senior Center, | | | | |
Series 1999 A: | | | | |
5.875% 05/01/19 | | 1,755,000 | | 1,608,106 |
6.000% 05/01/29 | | 625,000 | | 516,994 |
See Accompanying Notes to Financial Statements.
14
Columbia High Yield Municipal Fund
June 30, 2010
Municipal Bonds (continued)
| | | | |
| | | Par ($) | | Value ($) |
| Housing (continued) |
| NY Suffolk County Industrial Development Agency | | |
Gurwin Jewish Senior Center Phase II,
Series 2004,
6.700% 05/01/39 | | 490,000 | | 415,726 |
| | | | |
Assisted Living/Senior Total | | | | 10,585,340 |
| | |
| Multi-Family – 4.5% | | | | |
| CO Educational & Cultural Facilities Authority | | |
Campus Village Apartments LLC,
Series 2008 CA,
5.500% 06/01/38 | | 5,000,000 | | 5,035,400 |
| |
| DC Housing Finance Agency | | |
FDS Residential II LP,
Series 2004, AMT,
Insured: FHA
4.850% 06/01/35 | | 1,460,000 | | 1,406,783 |
| |
| DE Wilmington | | |
Electra Arms Senior Association,
Series 1998, AMT,
6.250% 06/01/28 | | 805,000 | | 670,066 |
| |
| FL Broward County Housing Finance Authority | | |
Chaves Lake Apartments Ltd.,
Series 2000 A, AMT,
7.500% 07/01/40 (07/15/10) (e)(f) | | 1,500,000 | | 1,459,215 |
| |
| FL Capital Trust Agency | | |
Atlantic Housing Foundation,
Series 2008 B,
3.900% 07/15/32 (07/15/10) (e)(f)(h) | | 1,425,000 | | 604,143 |
| |
| FL Clay County Housing Finance Authority | | |
Breckenridge Commons Ltd.,
Series 2000 A, AMT,
7.450% 07/01/40 | | 1,315,000 | | 1,247,409 |
| |
| MA Housing Finance Agency | | |
Series 2005 E, AMT,
5.000% 12/01/28 | | 750,000 | | 752,918 |
| |
| MD Economic Development Corp. | | |
University of Maryland, College Park Projects, |
Series 2008, 5.875% 06/01/43 | | 2,735,000 | | 2,751,164 |
| | | | |
| | | Par ($) | | Value ($) |
| MN Minneapolis Student Housing | | |
Riverton Community Housing, Inc.,
Series 2006 A,
5.700% 08/01/40 | | 1,600,000 | | 1,257,856 |
| |
| NC Durham Housing Authority | | |
Magnolia Pointe Apartments,
Series 2005, AMT,
5.650% 02/01/38 (b) | | 3,244,158 | | 2,578,587 |
| |
| NC Medical Care Commission | | |
ARC Project,
Series 2004 A,
5.800% 10/01/34 | | 1,550,000 | | 1,539,863 |
| |
| NM Mortgage Finance Authority | | |
Series 2005 E, AMT,
Insured: FHA
4.800% 09/01/40 | | 1,200,000 | | 1,134,720 |
| |
| OH Montgomery County | | |
Heartland of Centerville LLC,
Series 2005, AMT,
Insured: FHLMC
4.950% 11/01/35 (e) | | 750,000 | | 766,342 |
| |
| OK County Finance Authority | | |
Sail Associates LLC,
Series 2007, AMT,
LOC: Bank of the West
5.250% 12/01/41 (e) | | 1,475,000 | | 1,494,396 |
|
| OR Forest Grove Student Housing |
Oak Tree Foundation,
Series 2007,
5.500% 03/01/37 | | 2,900,000 | | 2,640,160 |
| |
| OR Housing & Community Services Department | | |
Series 2005 A, AMT,
Insured: FHA
4.850% 07/01/35 | | 1,755,000 | | 1,690,995 |
| |
| PA Higher Educational Facilities Authority | | |
Edinboro University:
Series 2008,
5.875% 07/01/38 | | 2,200,000 | | 2,200,682 |
Series 2010, | | | | |
5.800% 07/01/30 | | 2,500,000 | | 2,507,525 |
|
| Resolution Trust Corp. |
Pass-Through Certificates,
Series 1993 A,
8.500% 12/01/16 (i) | | 455,481 | | 432,352 |
See Accompanying Notes to Financial Statements.
15
Columbia High Yield Municipal Fund
June 30, 2010
Municipal Bonds (continued)
| | | | |
| | | Par ($) | | Value ($) |
| Housing (continued) | | | | |
| TX El Paso County Housing Finance Corp. | | |
American Village Communities: Series 2000 C,
8.000% 12/01/32 | | 555,000 | | 552,081 |
Series 2000 D, | | | | |
10.000% 12/01/32 | | 660,000 | | 624,591 |
| |
| WA Seattle Housing Authority | | |
High Rise Rehabilitation Phase I LP, |
Series 2005, AMT, Insured: AGMC 5.000% 11/01/25 | | 1,000,000 | | 1,001,790 |
| | | | |
Multi-Family Total | | | | 34,349,038 |
| |
| Single-Family – 1.4% | | |
| CA Housing Finance Agency | | |
Series 2006 K, AMT,
4.625% 08/01/26 | | 5,000,000 | | 4,292,000 |
Series 2008 K AMT, | | | | |
5.550% 08/01/33 | | 3,000,000 | | 2,793,390 |
| |
| CO Housing & Finance Authority | | |
Series 1997 A-2, AMT,
7.250% 05/01/27 | | 5,000 | | 5,086 |
| |
| FL Housing Finance Corp. | | |
Series 2006 1, AMT,
Guarantor: GNMA
4.850% 07/01/37 | | 1,095,000 | | 1,051,999 |
| |
| MA Housing Finance Agency | | |
Series 2006 122, AMT,
4.875% 12/01/37 (e) | | 2,955,000 | | 2,865,759 |
| |
| MN Minneapolis St. Paul Housing Finance Board | | |
Series 2006, AMT,
Guarantor: GNMA
5.000% 12/01/38 | | 94,868 | | 95,192 |
| | | | |
Single-Family Total | | | | 11,103,426 |
| | | | |
Housing Total | | | | 56,037,804 |
| | | | |
| Industrials – 4.7% | | | | |
| Food Products – 0.3% | | |
| MI Strategic Fund | | |
Imperial Sugar Co.:
Series 1998 A, | | | | |
6.250% 11/01/15 | | 1,000,000 | | 958,370 |
Series 1998 C, AMT, | | | | |
GTY AGMT: Imperial Sugar Co. | | | | |
6.550% 11/01/25 | | 1,500,000 | | 1,288,395 |
| | | | |
Food Products Total | | | | 2,246,765 |
| | | | |
| | | Par ($) | | Value ($) |
| Forest Products & Paper – 1.7% | | |
| AL Courtland Industrial Development Board | | |
International Paper Co.: | | | | |
Series 2003 B, AMT, 6.250% 08/01/25 | | 2,000,000 | | 2,023,680 |
Series 2005 A, 5.200% 06/01/25 | | 1,000,000 | | 932,070 |
| |
| AL Phenix City Industrial Development Board | | |
Meadwestvaco Corp.,
Series 2002 A, AMT,
6.350% 05/15/35 | | 1,000,000 | | 933,820 |
| |
| AR Camden Environmental Improvement Authority | | |
International Paper Co.,
Series 2004 A, AMT,
5.000% 11/01/18 | | 250,000 | | 252,357 |
| |
| GA Rockdale County Development Authority | | |
Visy Paper, Inc.,
Series 2007 A, AMT,
GTY AGMT: Pratt USA
6.125% 01/01/34 | | 5,000,000 | | 4,656,550 |
| |
| MS Lowndes County | | |
Weyerhaeuser Co.: | | | | |
Series 1992 A, 6.800% 04/01/22 | | 1,995,000 | | 2,200,505 |
Series 1992 B, 6.700% 04/01/22 | | 230,000 | | 251,733 |
| |
| MS Warren County Gulf Opportunity Zone | | |
International Paper Co.,
Series 2008 A,
6.500% 09/01/32 | | 2,000,000 | | 2,087,220 |
| | | | |
Forest Products & Paper Total | | | | 13,337,935 |
| | |
| Manufacturing – 0.3% | | | | |
| IL Will-Kankakee Regional Development Authority | | |
Flanders Corp.,
Series 1997, AMT,
6.500% 12/15/17 | | 550,000 | | 537,955 |
| |
| KS Wichita Airport Authority | | |
Cessna Citation Service Center,
Series 2002 A, AMT,
GTY AGMT: Textron, Inc. | | | | |
6.250% 06/15/32 | | 1,875,000 | | 1,634,044 |
| | | | |
Manufacturing Total | | | | 2,171,999 |
See Accompanying Notes to Financial Statements.
16
Columbia High Yield Municipal Fund
June 30, 2010
Municipal Bonds (continued)
| | | | |
| | | Par ($) | | Value ($) |
| Industrials (continued) | | | | |
| Oil & Gas – 2.0% | | | | |
| CA M-S-R Energy Authority | | |
Series 2009,
6.500% 11/01/39 | | 5,000,000 | | 5,357,050 |
| |
| LA St. John Baptist Parish | | |
Marathon Oil Corp.,
Series 2007 A,
5.125% 06/01/37 | | 5,000,000 | | 4,712,550 |
| |
| NV Clark County Industrial Development Authority | | |
Southwest Gas Corp.,
Series 2003 E, AMT,
5.800% 03/01/38 (e) | | 1,750,000 | | 1,829,170 |
| |
| TX Gulf Coast Industrial Development Authority | | |
Citgo Petroleum,
Series 1998, AMT,
8.000% 04/01/28 | | 875,000 | | 876,785 |
| |
| TX Gulf Coast Waste Disposal Authority | | |
BP Products North America,
Series 2007,
2.300% 01/01/42 (09/03/13) (e)(f) | | 2,500,000 | | 2,212,525 |
| | | | |
Oil & Gas Total | | | | 14,988,080 |
| |
| Other Industrial Development Bonds – 0.4% | | |
| NJ Economic Development Authority | | |
GMT Realty LLC,
Series 2006 B, AMT,
6.875% 01/01/37 | | 4,000,000 | | 3,280,320 |
| | | | |
Other Industrial Development Bonds Total | | 3,280,320 |
| | | | |
Industrials Total | | | | 36,025,099 |
| | | | |
| Other – 8.2% | | | | |
| Other – 1.7% | | | | |
| LA New Orleans Aviation Board | | |
Series 2009 A, 6.500% 01/01/40 | | 5,000,000 | | 5,218,700 |
| |
| OR Warm Springs Reservation Confederated Tribes | | |
Series 2009 B, 6.375% 11/01/33 | | 2,410,000 | | 2,479,528 |
| |
| TX Capital Area Cultural Education Facilities Finance Corp. | | |
Roman Catholic Diocese Austin,
Series 2005 B,
6.125% 04/01/45 | | 5,000,000 | | 5,015,800 |
| | | | |
Other Total | | | | 12,714,028 |
| | | | |
| | | Par ($) | | Value ($) |
| Pool/Bond Bank – 0.7% | | | | |
| OH Cleveland-Cuyahoga County Port Authority | | |
Series 2005 B,
5.125% 05/15/25 | | 680,000 | | 590,770 |
| |
| OH Summit County Port Authority | | |
Seville Project,
Series 2005 A,
5.100% 05/15/25 | | 415,000 | | 359,531 |
| |
| PA Industrial Development Authority | | |
Series 2008,
5.500% 07/01/23 | | 2,355,000 | | 2,586,426 |
| |
| SD Economic Development Finance Authority | | |
Davis Family Sodak,
Series 2004 4-A, AMT,
6.000% 04/01/29 | | 1,400,000 | | 1,424,248 |
| | | | |
Pool/Bond Bank Total | | | | 4,960,975 |
| | |
| Refunded/Escrowed (j) – 4.2% | | | | |
| AL Camden Industrial Development Board | | |
Weyerhaeuser Co.,
Series 2003 B, AMT,
Pre-refunded 12/01/13,
6.375% 12/01/24 | | 275,000 | | 323,953 |
| |
| CA Golden State Tobacco Securitization Corp. | | |
Series 2003 A-1,
Pre-refunded 06/01/13,
6.750% 06/01/39 | | 200,000 | | 232,376 |
| |
| CA Lincoln Community Facilities District No. 2003-1 | | |
Series 2004,
Pre-refunded 09/01/13:
5.750% 09/01/20 | | 450,000 | | 524,277 |
5.900% 09/01/24 | | 445,000 | | 520,517 |
| |
| CO Adams County | | |
Series 1991 B:
Escrowed to Maturity,
11.250% 09/01/11 | | 220,000 | | 247,621 |
Pre-refunded 09/01/10, 11.250% 09/01/11 | | 360,000 | | 366,581 |
| FL Islands at Doral Southwest Community Development District | | |
Series 2003,
Pre-refunded 05/01/13,
6.375% 05/01/35 | | 745,000 | | 829,997 |
See Accompanying Notes to Financial Statements.
17
Columbia High Yield Municipal Fund
June 30, 2010
Municipal Bonds (continued)
| | | | |
| | | Par ($) | | Value ($) |
| Other (continued) | | | | |
| FL Orange County Health Facilities Authority | | |
Orlando Regional Health Care System,
Series 2002,
Pre-refunded 12/01/12,
5.750% 12/01/32 | | 350,000 | | 391,276 |
| |
| GA Municipal Electric Authority | | |
Series 1991 V:
Escrowed to Maturity,
6.600% 01/01/18 | | 690,000 | | 825,316 |
Pre-refunded 01/01/13, 6.600% 01/01/18 | | 75,000 | | 87,149 |
| |
| IA Finance Authority | | |
Care Initiatives,
Series 1996,
Pre-refunded 07/01/11,
9.250% 07/01/25 | | 420,000 | | 464,461 |
| |
| MA Development Finance Agency | | |
Western New England College,
Series 2002,
Pre-refunded 12/01/12,
6.125% 12/01/32 | | 300,000 | | 338,568 |
| |
| MA Health & Educational Facilities Authority | | |
Civic Investments, Inc.,
Series 2002 A,
Pre-refunded 12/15/12,
9.000% 12/15/15 | | 1,200,000 | | 1,388,184 |
Milford-Whitinsville Regional Hospital,
Series 2002 D,
Pre-refunded 07/15/12,
6.350% 07/15/32 | | 1,715,000 | | 1,931,330 |
| |
| MI Pontiac Tax Increment Finance Authority | | |
Development Area No. 3,
Series 2002,
Pre-refunded 06/01/12, | | | | |
6.375% 06/01/31 | | 1,000,000 | | 1,116,530 |
| |
| NC Eastern Municipal Power Agency | | |
Series 1991 A,
Escrowed to Maturity,
6.500% 01/01/18 | | 3,320,000 | | 4,236,420 |
| |
| NH Health & Educational Facilities Authority | | |
Catholic Medical Center,
Series 2002 A,
Pre-refunded 7/01/12,
6.125% 07/01/32 | | 350,000 | | 391,524 |
| | | | |
| | | Par ($) | | Value ($) |
| NH Industrial Development Authority | | |
Pennichuck Water Works, Inc.,
Series 1988, AMT,
Escrowed to Maturity,
7.500% 07/01/18 | | 275,000 | | 325,036 |
| |
| NJ Tobacco Settlement Financing Corp. | | |
Series 2003,
Pre-refunded 06/01/13,
6.750% 06/01/39 | | 2,000,000 | | 2,339,720 |
| |
| SC Jobs Economic Development Authority | | |
Bon Secours Health System,
Series 2002 A,
Pre-refunded 11/15/12,
5.500% 11/15/23 | | 485,000 | | 539,368 |
| |
| TX Houston Health Facilities Development Corp. | | |
Buckingham Senior Living Community, Inc.,
Series 2004 A,
Pre-refunded 02/15/14,
7.125% 02/15/34 | | 1,000,000 | | 1,206,790 |
| |
| TX Tyler Health Facilities Development Corp. | | |
Mother Frances Hospital,
Series 2001,
Pre-refunded 07/01/12,
6.000% 07/01/31 | | 750,000 | | 823,387 |
| |
| VA Tobacco Settlement Financing Corp. | | |
Series 2005,
Pre-refunded 06/01/15,
5.625% 06/01/37 | | 10,000,000 | | 11,807,400 |
| |
| WI Health & Educational Facilities Authority | | |
Wheaton Franciscan Services,
Series 2002,
Pre-refunded 02/15/12, 5.750% 08/15/30 | | 1,050,000 | | 1,147,251 |
| | | | |
Refunded/Escrowed Total | | | | 32,405,032 |
| | |
| Tobacco – 1.6% | | | | |
| CA Silicon Valley Tobacco Securitization Authority | | |
Series 2007 A,
(a) 06/01/36 | | 3,000,000 | | 287,190 |
| IA Tobacco Settlement Authority | | |
Series 2005 C,
5.625% 06/01/46 | | 3,000,000 | | 2,136,030 |
See Accompanying Notes to Financial Statements.
18
Columbia High Yield Municipal Fund
June 30, 2010
Municipal Bonds (continued)
| | | | |
| | | Par ($) | | Value ($) |
| Other (continued) | | | | |
| MI Tobacco Settlement Finance Authority | | |
Series 2007 A,
6.000% 06/01/48 | | 5,000,000 | | 3,634,100 |
| |
| NJ Tobacco Settlement Financing Corp. | | |
Series 2007 1C,
(a) 06/01/41 | | 7,500,000 | | 301,050 |
| |
| NY Nassau County Tobacco Settlement Corp. | | |
Series 2006,
(a) 06/01/60 | | 25,000,000 | | 236,500 |
| |
| OH Buckeye Tobacco Settlement Financing Authority | | |
Series 2007 A-2: | | | | |
5.750% 06/01/34 | | 2,000,000 | | 1,489,700 |
5.875% 06/01/47 | | 2,100,000 | | 1,498,833 |
6.000% 06/01/42 | | 3,250,000 | | 2,405,033 |
| |
| PR Commonwealth of Puerto Rico Children’s Trust Fund | | |
Series 2005 B,
(a) 05/15/55 | | 25,000,000 | | 441,500 |
| | | | |
Tobacco Total | | | | 12,429,936 |
| | | | |
Other Total | | | | 62,509,971 |
| | | | |
| Other Revenue – 2.3% |
| Hotels – 0.2% | | | | |
| NJ Middlesex County Improvement Authority |
Heldrich Associates LLC: | | | | |
Series 2005 B,
6.250% 01/01/37 | | 6,450,000 | | 1,167,643 |
Series 2005 C,
8.750% 01/01/37 | | 1,250,000 | | 200,913 |
Series 2005 B,
6.125% 01/01/25 | | 2,750,000 | | 501,242 |
| | | | |
Hotels Total | | | | 1,869,798 |
| | |
| Recreation – 2.1% | | | | |
| CA Agua Caliente Band Cahuilla Indians | | |
Series 2003,
6.000% 07/01/18 (i) | | 2,000,000 | | 1,954,900 |
| |
| CA Cabazon Band Mission Indians | | |
Series 2004: | | | | |
7.358% 10/01/11 (10/01/10) (e)(f) | | 405,000 | | 273,071 |
8.375% 10/01/15 (i) | | 560,000 | | 366,789 |
8.750% 10/01/19 (i) | | 2,785,000 | | 1,816,126 |
Series 2010,
8.375% 10/01/20 | | 1,420,000 | | 1,420,951 |
| | | | |
| | | Par ($) | | Value ($) |
| CT Mashantucket Western Pequot Tribe | | |
Series 1999 B,
(a) 09/01/15 (c)(i) | | 2,000,000 | | 895,120 |
| |
| CT Mohegan Tribe Gaming Authority | | |
Series 2001,
6.250% 01/01/31 (i) | | 475,000 | | 388,484 |
| |
| CT Mohegan Tribe of Indians | | |
Series 2003,
5.250% 01/01/33 (i) | | 1,000,000 | | 707,150 |
| |
| FL Seminole Indian Tribe | | |
Series 2007,
5.500% 10/01/24 (i) | | 2,000,000 | | 1,883,080 |
| |
| IL Finance Authority Sports Facility | | |
Leafs Hockey Club Project,
Series 2007 A,
6.000% 03/01/37 (c) | | 1,000,000 | | 250,570 |
| |
| NY Liberty Development Corp. | | |
National Sports Museum,
Series 2006 A,
6.125% 02/15/19 (c)(i) | | 1,979,996 | | 5,940 |
| |
| OK Chickasaw Nation | | |
Series 2007: | | | | |
6.000% 12/01/25 (i) | | 1,030,000 | | 1,081,974 |
6.250% 12/01/32 (i) | | 3,500,000 | | 3,674,090 |
| |
| OR Cow Creek Band Umpqua Tribe of Indians | | |
Series 2006 C,
5.625% 10/01/26 (i) | | 1,700,000 | | 1,257,949 |
| | | | |
Recreation Total | | | | 15,976,194 |
| | | | |
Other Revenue Total | | | | 17,845,992 |
| | | | |
| Resource Recovery – 1.7% | | | | |
| Disposal – 0.7% | | | | |
| NY Seneca County Industrial Development Agency | | |
IESI Corp.,
Series 2005, AMT,
GTY AGMT: IESI Corp.
| | | | |
6.625% 10/01/35 (10/13/10) (e)(f)(i) | | 5,000,000 | | 5,026,850 |
| | | | |
Disposal Total | | | | 5,026,850 |
| |
| Resource Recovery – 1.0% | | |
| FL Lee County Solid Waste Systems | | |
Series 2006 A, AMT,
Insured: AMBAC | | | | |
5.000% 10/01/17 | | 2,010,000 | | 2,067,426 |
See Accompanying Notes to Financial Statements.
19
Columbia High Yield Municipal Fund
June 30, 2010
Municipal Bonds (continued)
| | | | |
| | | Par ($) | | Value ($) |
| Resource Recovery (continued) | | | | |
| MA Development Finance Agency | | |
Covanta,
Series 1999 A, AMT,
6.700% 12/01/14 | | 375,000 | | 378,870 |
| |
| MA Industrial Finance Agency | | |
Covanta,
Series 1998 A, AMT,
5.600% 12/01/19 | | 1,000,000 | | 990,370 |
| |
| NY Niagara County Industrial Development Agency | | |
Covanta,
Series 2001 A, AMT,
5.450% 11/15/26 (11/15/12) (e)(f) | | 1,000,000 | | 1,026,530 |
| |
| PA Economic Development Financing Authority | | |
Philidelphia Project Finance,
Series 2009 B,
6.250% 01/01/32 | | 3,375,000 | | 3,524,850 |
| | | | |
Resource Recovery Total | | | | 7,988,046 |
| | | | |
Resource Recovery Total | | | | 13,014,896 |
| | | | |
| Tax-Backed – 20.0% | | | | |
| Local Appropriated – 1.1% | | | | |
| CA Richmond Joint Powers Financing Authority | | |
Series 2009,
Insured: AGMC,
5.875% 08/01/37 | | 3,500,000 | | 3,713,395 |
| |
| CA Southeast Resource Recovery Facilities Authority | | |
Series 2003 B, AMT,
Insured: AMBAC | | | | |
5.375% 12/01/18 | | 2,000,000 | | 2,064,540 |
| |
| MO St. Louis Industrial Development Authority | | |
St. Louis Convention Center,
Series 2000,
Insured: AMBAC | | | | |
(a) 07/15/18 | | 3,000,000 | | 1,660,800 |
| |
| SC Laurens County School District No. 55 | | |
Series 2005,
5.250% 12/01/30 | | 1,300,000 | | 1,229,878 |
| | | | |
Local Appropriated Total | | | | 8,668,613 |
| | | | |
| | | Par ($) | | Value ($) |
| Local General Obligations – 3.0% | | |
| CO Northwest Metropolitan District No. 3 | | |
Series 2005,
6.250% 12/01/35 | | 1,000,000 | | 775,600 |
| |
| CO Red Sky Ranch Metropolitan District | | |
Series 2003,
6.050% 12/01/33 | | 1,000,000 | | 866,670 |
| |
| MI Detroit | | |
Series 2009 C,
10.000% 10/01/10 | | 5,000,000 | | 4,993,450 |
| |
| MI Wayne | | |
Series 2009 A,
6.750% 11/01/39 | | 5,000,000 | | 5,281,250 |
| |
| NY New York City | | |
Series 2009 H1,
5.000% 03/01/13 | | 5,000,000 | | 5,505,100 |
| |
| TX Dallas County Flood Control District | | |
Series 2002,
7.250% 04/01/32 | | 1,000,000 | | 1,043,260 |
| |
| TX Deaf Smith County Hospital District | | |
Series 2010 A,
6.500% 03/01/40 | | 4,000,000 | | 4,042,400 |
| | | | |
Local General Obligations Total | | | | 22,507,730 |
| |
| Special Non-Property Tax – 3.9% | | |
| FL Miami-Dade | | |
Series 2009,
(a) 10/01/41 | | 40,000,000 | | 5,008,400 |
|
| IL Bolingbrook |
Sales Tax Revenue,
Series 2005,
6.250% 01/01/24 | | 1,500,000 | | 952,755 |
| |
| KS Wyandotte County Unified Government | | |
Series 2005 B,
5.000% 12/01/20 | | 3,125,000 | | 3,187,250 |
Series 2006,
4.875% 10/01/28 | | 2,020,000 | | 1,495,790 |
Series 2010,
(a) 06/01/21 | | 2,475,000 | | 1,316,155 |
| |
| KY Economic Development Finance Authority | | |
Louisville Arena Project,
Series 2008 A1,
Insured: AGO
6.000% 12/01/38 | | 1,150,000 | | 1,250,234 |
See Accompanying Notes to Financial Statements.
20
Columbia High Yield Municipal Fund
June 30, 2010
Municipal Bonds (continued)
| | | | |
| | | Par ($) | | Value ($) |
| Tax-Backed (continued) | | | | |
| MO Manchester | | |
Series 2010,
6.875% 11/01/39 | | 5,000,000 | | 5,028,400 |
| |
| NJ Economic Development Authority | | |
Cigarette Tax, | | | | |
Series 2004: | | | | |
5.500% 06/15/31 | | 315,000 | | 303,244 |
5.750% 06/15/29 | | 1,000,000 | | 998,820 |
| |
| NV Sparks Tourism Improvement District No. 1 | | |
Series 2008 A,
6.750% 06/15/28 (i) | | 5,000,000 | | 4,698,600 |
| |
| PR Commonwealth of Puerto Rico Sales Tax Financing Corp. | | |
Series 2009 B,
5.000% 08/01/39 (08/01/11) (e)(f) | | 5,000,000 | | 5,238,700 |
| | | | |
Special Non-Property Tax Total | | | | 29,478,348 |
| |
| Special Property Tax – 7.1% | | |
| CA Carson | | |
Series 1992,
7.375% 09/02/22 | | 110,000 | | 110,020 |
| |
| CA Empire Union School District | | |
Series 1987-1 A,
Insured: AMBAC
(a) 10/01/21 | | 1,665,000 | | 876,423 |
| |
| CA Huntington Beach Community Facilities District | | |
Grand Coast Resort,
Series 2001-1, | | | | |
6.450% 09/01/31 | | 1,250,000 | | 1,251,275 |
| |
| CA Oakdale Public Financing Authority | | |
Series 2004,
5.375% 06/01/33 | | 2,000,000 | | 1,759,520 |
| |
| CA San Francisco City & County Redevelopment Agency | | |
Series 2009 D,
6.625% 08/01/39 | | 1,500,000 | | 1,590,045 |
| |
| CT Harbor Point Infrastructure Improvement District | | |
Series 2010 A,
7.875% 04/01/39 | | 5,000,000 | | 5,262,500 |
| | | | |
| | | Par ($) | | Value ($) |
| FL Ave Maria Stewardship Community District | | |
Series 2006 A,
5.125% 05/01/38 | | 3,430,000 | | 2,585,877 |
| |
| FL Brandy Creek Community Development District | | |
Series 2003 A,
6.350% 05/01/34 | | 935,000 | | 950,764 |
| |
| FL Celebration Community Development District | | |
Series 2003 A,
6.400% 05/01/34 | | 925,000 | | 933,917 |
| |
| FL Channing Park Development District | | |
Series 2007,
5.300% 05/01/38 | | 900,000 | | 638,775 |
| |
| FL Colonial Country Club Community Development District | | |
Series 2003,
6.400% 05/01/33 | | 690,000 | | 709,472 |
| |
| FL Double Branch Community Development District | | |
Series 2002 A,
6.700% 05/01/34 | | 645,000 | | 663,531 |
| |
| FL Lexington Oaks Community Development District | | |
Series 2002 A,
6.700% 05/01/33 | | 250,000 | | 255,715 |
| |
| FL Middle Village Community Development District | | |
Series 2004 A,
6.000% 05/01/35 | | 2,000,000 | | 1,849,660 |
| |
| FL Oakmont Grove Community Development District | | |
Series 2007 A,
5.400% 05/01/38 (c) | | 1,200,000 | | 444,000 |
Series 2007 B,
5.250% 05/01/12 (c) | | 1,000,000 | | 370,000 |
| |
| FL Sarasota National Community Development District | | |
Series 2003, | | | | |
5.300% 05/01/39 (c) | | 4,000,000 | | 1,280,000 |
| |
| FL Seven Oaks Community Development District II | | |
Series 2004 A,
5.875% 05/01/35 | | 455,000 | | 276,422 |
Series 2004 B,
7.500% 05/01/16 | | 3,805,000 | | 3,587,658 |
See Accompanying Notes to Financial Statements.
21
Columbia High Yield Municipal Fund
June 30, 2010
Municipal Bonds (continued)
| | | | |
| | | Par ($) | | Value ($) |
| Tax-Backed (continued) | | | | |
| FL Sweetwater Creek Community Development District | | |
Series 2007 A,
5.500% 05/01/38 | | 3,850,000 | | 1,732,500 |
| |
| FL Tolomato Community Development District | | |
Series 2007:
6.375% 05/01/17 | | 2,000,000 | | 1,833,380 |
6.650% 05/01/40 | | 3,000,000 | | 2,489,790 |
| |
| FL Waterset North Community Development District | | |
Series 2007 A,
6.600% 05/01/39 | | 2,000,000 | | 1,216,120 |
| |
| FL West Villages Improvement District | | |
Series 2006,
5.500% 05/01/37 (c) | | 1,700,000 | | 788,375 |
| |
| FL Westchester Community Development District No. 1 | | |
Series 2003,
6.125% 05/01/35 | | 800,000 | | 638,432 |
| |
| FL Westridge Community Development District | | |
Series 2005,
5.800% 05/01/37 (c) | | 2,650,000 | | 1,007,000 |
| |
| GA Atlanta | | |
Eastside Project,
Series 2005 B,
5.600% 01/01/30 | | 1,615,000 | | 1,566,582 |
| |
| IL Annawan | | |
Patriot Renewable Fuels LLC,
Series 2007,
5.625% 01/01/18 | | 3,975,000 | | 3,175,667 |
| |
| IL Chicago | | |
Pilsen Redevelopment,
Series 2004 B,
6.750% 06/01/22 | | 1,225,000 | | 1,176,600 |
| |
| IL Hillside | | |
Series 2008,
7.000% 01/01/28 | | 2,500,000 | | 2,196,600 |
| |
| IL Plano Special Service Area No. 4 | | |
Lakewood Springs Project,
Series 2005 5-B,
6.000% 03/01/35 | | 2,957,000 | | 2,502,243 |
| | | | |
| | | Par ($) | | Value ($) |
| IL Rosemont | | |
River Road Hotel Partners Project,
Series 2007,
5.100% 12/30/23 | | 2,800,000 | | 2,256,380 |
| |
| IL Volo Village Special Service Area No. 3 | | |
Symphony Meadows Project,
Series 2006-1,
6.000% 03/01/36 | | 1,996,000 | | 1,461,870 |
| | |
| IN Portage | | | | |
Ameriplex Project,
Series 2006,
5.000% 07/15/23 | | 700,000 | | 693,371 |
| | |
| MO Fenton | | | | |
Tax Increment Revenue,
Series 2006,
4.500% 04/01/21 | | 320,000 | | 309,325 |
| |
| MO Kansas City Tax Increment Financing Commission | | |
Maincor Project, Inc.,
Series 2007 A,
5.250% 03/01/18 | | 1,000,000 | | 947,970 |
|
| MO Riverside |
Tax Increment Revenue,
Series 2004,
5.250% 05/01/20 | | 1,275,000 | | 1,303,828 |
|
| OH Hickory Chase Community Authority |
Series 2008,
7.000% 12/01/38 | | 2,500,000 | | 1,698,000 |
| | | | |
Special Property Tax Total | | | | 54,389,607 |
| | |
| State Appropriated – 2.9% | | | | |
| CA Public Works Board |
Series 2009, | | | | |
6.375% 11/01/34 | | 5,000,000 | | 5,304,400 |
|
| MI Municipal Bond Authority |
Series 2009 D, | | | | |
9.500% 08/20/10 | | 6,000,000 | | 5,995,920 |
|
| NJ Economic Development Authority |
Series 2010, | | | | |
5.000% 12/15/18 | | 10,000,000 | | 11,094,500 |
| | | | |
State Appropriated Total | | | | 22,394,820 |
|
| State General Obligations – 2.0% |
| CA State |
Series 2007, | | | | |
5.000% 11/01/37 | | 2,475,000 | | 2,355,235 |
See Accompanying Notes to Financial Statements.
22
Columbia High Yield Municipal Fund
June 30, 2010
Municipal Bonds (continued)
| | | | |
| | | Par ($) | | Value ($) |
| Tax-Backed (continued) | | | | |
| FL Board of Education | | |
Series 2009,
5.000% 06/01/24 | | 5,000,000 | | 5,510,650 |
| |
| MD State | | |
Series 2007,
5.000% 08/01/16 | | 6,250,000 | | 7,355,750 |
| | | | |
State General Obligations Total | | 15,221,635 |
| | | | |
Tax-Backed Total | | | | 152,660,753 |
| | | | |
| Transportation – 5.7% | | | | |
| Air Transportation – 3.0% | | | | |
| CA Los Angeles Regional Airports Improvement Corp. | | |
American Airlines, Inc.,
Series 2000 C, AMT,
7.500% 12/01/24 (e) | | 400,000 | | 399,504 |
| |
| FL Capital Trust Agency | | |
Air Cargo-Orlando,
Series 2003, AMT,
6.750% 01/01/32 | | 650,000 | | 618,930 |
| |
| NC Charlotte/Douglas International Airport | | |
US Airways, Inc.,
Series 1998, AMT,
5.600% 07/01/27 | | 1,500,000 | | 1,218,885 |
| |
| NJ Economic Development Authority | | |
Continental Airlines, Inc.:
Series 1999, AMT: | | | | |
6.250% 09/15/19 | | 1,000,000 | | 960,760 |
6.250% 09/15/29 | | 2,500,000 | | 2,308,300 |
Series 2003, AMT,
9.000% 06/01/33 (e) | | 1,000,000 | | 1,050,050 |
| |
| NY New York City Industrial Development Agency | | |
American Airlines, Inc.:
Series 2002 A, AMT,
GTY AGMT: AMR Corp.
8.000% 08/01/12 | | 7,775,000 | | 7,956,157 |
Series 2005, 8.000% 08/01/28 (e) | | 2,000,000 | | 2,102,460 |
Series 2005, AMT, GTY AGMT: AMR Corp. 7.625% 08/01/25 (e) | | 3,000,000 | | 3,049,320 |
| | | | |
| | | Par ($) | | Value ($) |
| PA Philadelphia Authority for Industrial Development | | |
Aero Philadelphia,
Series 1999, AMT,
5.500% 01/01/24 | | 900,000 | | 718,281 |
| |
| TX Dallas-Fort Worth International Airport | | |
American Airlines, Inc.,
Series 2000 A, AMT,
9.000% 05/01/29 (e) | | 2,250,000 | | 2,292,368 |
| | | | |
Air Transportation Total | | | | 22,675,015 |
| |
| Airports – 0.4% | | |
| CA Sacramento | | |
Series 2009 D,
6.000% 07/01/35 | | 2,500,000 | | 2,709,500 |
| | | | |
Airports Total | | | | 2,709,500 |
| |
| Toll Facilities – 2.2% | | |
| CA Foothill Eastern Transportation Corridor Agency | | |
Series 1999: | | | | |
(a) 01/15/30 | | 11,520,000 | | 2,991,514 |
5.750% 01/15/40 | | 2,000,000 | | 1,883,820 |
| |
| CO E-470 Public Highway Authority | | |
Series 2000,
Insured: NPFGC
(a) 09/01/18 | | 4,000,000 | | 2,545,440 |
| |
| DC Metropolitan WA Airports Authority | | |
Series 2009,
(a) 10/01/34 | | 22,550,000 | | 5,165,303 |
| |
| TX North Texas Tollway Authority | | |
Series 2008 F,
5.750% 01/01/38 | | 2,645,000 | | 2,757,756 |
Series 2009 A,
6.250% 01/01/39 | | 1,500,000 | | 1,631,835 |
| | | | |
Toll Facilities Total | | | | 16,975,668 |
| |
| Transportation – 0.1% | | |
| NV Director of the State of NV Department of Business & Industry | | |
Las Vegas Monorail Co,
Series 2000,
Insured: AMBAC
5.625% 01/01/34 (c) | | 3,000,000 | | 948,750 |
| | | | |
Transportation Total | | | | 948,750 |
| | | | |
Transportation Total | | | | 43,308,933 |
See Accompanying Notes to Financial Statements.
23
Columbia High Yield Municipal Fund
June 30, 2010
Municipal Bonds (continued)
| | | | |
| | | Par ($) | | Value ($) |
| Utilities – 6.5% | | | | |
| Independent Power Producers – 1.0% | | |
| NY Port Authority of New York & New Jersey | | |
KIAC Partners,
Series 1996 IV, AMT: | | | | |
6.750% 10/01/11 | | 1,600,000 | | 1,605,280 |
6.750% 10/01/19 | | 120,000 | | 106,305 |
| |
| OR Western Generation Agency | | |
Wauna Cogeneration,
Series 2006 A,
5.000% 01/01/20 | | 2,235,000 | | 2,126,267 |
| |
| PR Commonwealth of Puerto Rico Industrial, Tourist, Educational, Medical & Environmental Cogeneration Facilities | | |
AES Project,
Series 2000, AMT,
6.625% 06/01/26 | | 3,820,000 | | 3,849,987 |
| | | | |
Independent Power Producers Total | | | | 7,687,839 |
| | |
| Investor Owned – 4.7% | | | | |
| AZ Maricopa County Pollution Control Corp. | | |
El Paso Electric Co.,
Series 2009 B,
7.250% 04/01/40 | | 3,600,000 | | 4,067,316 |
| |
| CA Chula Vista Industrial Development Authority | | |
San Diego Gas & Electric Co.,
Series 1996 B, AMT,
5.500% 12/01/21 | | 1,275,000 | | 1,341,402 |
| |
| HI Department of Budget & Finance | | |
Hawaiian Electric Co.,
Series 2009,
GTY AGMT: Hawaiian Electric Co.
6.500% 07/01/39 | | 1,750,000 | | 1,900,115 |
| |
| IL Development Finance Authority | | |
Peoples Gas Light & Coke Co.,
Series 2003 E, AMT,
Insured: AMBAC
4.875% 11/01/38 (11/01/18) (e)(f) | | 2,500,000 | | 2,543,300 |
| |
| IN Jasper County Pollution Control Revenue | | |
Northern Indiana Public Service Co.,
Series 1994 C,
Insured: NPFGC
5.850% 04/01/19 | | 1,000,000 | | 1,100,580 |
| | | | |
| | | Par ($) | | Value ($) |
| IN Petersburg | | |
Indianapolis Power & Light Co.,
Series 1991,
5.750% 08/01/21 | | 1,000,000 | | 1,025,030 |
| |
| LA Calcasieu Parish Industrial Development Board | | |
Entergy Gulf States, Inc.,
Series 1999,
5.450% 07/01/10 | | 270,000 | | 270,000 |
| |
| LA West Feliciana Parish | | |
Entergy Gulf States, Inc.,
Series 1999 B,
6.600% 09/01/28 | | 135,000 | | 135,119 |
| |
| NV Clark County Industrial Development Authority | | |
Nevada Power Co.,
Series 1995 B, AMT,
5.900% 10/01/30 | | 3,135,000 | | 3,051,703 |
| |
| PA Economic Development Financing Authority | | |
Allegheny Energy Specialty Co.,
Series 2009,
7.000% 07/15/39 | | 4,000,000 | | 4,471,160 |
| |
| TX Brazos River Authority | | |
TXU Energy Co., LLC:
Series 2001 C, AMT,
5.750% 05/01/36 (11/01/11) (e)(f) | | 2,515,000 | | 2,409,345 |
Series 2003 C, AMT, | | | | |
6.750% 10/01/38 | | 1,180,000 | | 660,859 |
| |
| TX Matagorda County Navigation District No. 1 | | |
AEP Texas Project, | | | | |
Series 2005 A, | | | | |
Insured: AMBAC | | | | |
4.400% 05/01/30 | | 7,500,000 | | 6,474,975 |
| |
| TX Sabine River Authority | | |
TXU Energy Co., LLC, | | | | |
Series 2001 B, AMT, | | | | |
5.750% 05/01/30 (11/01/11) (e)(f) | | 1,415,000 | | 1,350,051 |
|
| WY Campbell County |
Black Hills Power, Inc., | | | | |
Series 2004, | | | | |
5.350% 10/01/24 | | 3,250,000 | | 3,179,995 |
See Accompanying Notes to Financial Statements.
24
Columbia High Yield Municipal Fund
June 30, 2010
Municipal Bonds (continued)
| | | | |
| | | Par ($) | | Value ($) |
| Utilities (continued) | | | | |
| WY Converse County |
PacifiCorp,
Series 1988,
3.900% 01/01/14 (06/03/13) (e)(f) | | 1,500,000 | | 1,565,400 |
| | | | |
Investor Owned Total | | | | 35,546,350 |
| | |
| Municipal Electric – 0.1% | | | | |
| PR Commonwealth of Puerto Rico Electric Power Authority | | |
Series 1998 NN, | | | | |
5.500% 07/01/20 | | 1,005,000 | | 1,116,455 |
| | | | |
Municipal Electric Total | | | | 1,116,455 |
| |
| Water & Sewer – 0.7% | | |
| AZ Surprise Municipal Property Corp. |
Series 2007, | | | | |
4.900% 04/01/32 | | 2,000,000 | | 1,720,160 |
|
| MS V Lakes Utility District |
Series 1994, | | | | |
7.000% 07/15/37 (07/15/24) (e)(f) | | 250,000 | | 222,242 |
| |
| PA Dauphin County Industrial Development Authority | | |
Dauphin Water Supply Co.,
Series 1992 A, AMT,
6.900% 06/01/24 | | 3,200,000 | | 3,703,200 |
| | | | |
Water & Sewer Total | | | | 5,645,602 |
| | | | |
Utilities Total | | | | 49,996,246 |
| | | | |
Total Municipal Bonds
(cost of $777,520,297) | | | | 741,220,449 |
| | |
Investment Companies – 0.8% | | | | |
| | | Shares | | |
BofA Tax-Exempt Reserves,
Capital Class (k)(l)
(7 day yield of 0.150%) | | 3,181,000 | | 3,181,000 |
Dreyfus Tax-Exempt Cash
Management Fund
(7 day yield of 0.170%) | | 2,825,404 | | 2,825,404 |
| | | | |
Total Investment Companies
(cost of $6,006,404) | | | | 6,006,404 |
Municipal Preferred Stocks – 0.4%
| | | | |
| | | Shares | | Value ($) |
| Housing – 0.4% |
| Multi-Family – 0.4% | | | | |
| Centerline Equity Issuer Trust | | | | |
AMT,
6.300% 05/15/19 (i) | | 1,000,000 | | 1,059,980 |
Series 2000, AMT,
7.600% 12/15/10 (11/30/10) (e)(f)(i) | | 1,500,000 | | 1,525,860 |
| |
| MuniMae Trust | | |
AMT,
5.800% 06/30/49 (i) | | 1,000,000 | | 668,090 |
| | | | |
Multi-Family Total | | | | 3,253,930 |
| | | | |
Housing Total | | | | 3,253,930 |
| | | | |
Total Municipal Preferred Stocks
(cost of $3,500,000) | | | | 3,253,930 |
| | |
Short-Term Obligation – 0.7% | | | | |
| | | Par ($) | | |
| Variable Rate Demand Note (m) – 0.7% | | |
| SC Berkeley | | | | |
Amoco Chemical Co.,
Series 1997, AMT,
5.000% 04/01/27 (07/01/10) (e)(f) | | 5,000,000 | | 5,000,000 |
| | | | |
Total Short-Term Obligation
(cost of $5,000,000) | | | | 5,000,000 |
| | | | |
Total Investments – 98.8%
(cost of $792,026,701) (n) | | | | 755,480,783 |
| | | | |
Other Assets & Liabilities, Net – 1.2% | | 9,368,856 |
| | | | |
Net Assets – 100.0% | | | | 764,849,639 |
Notes to Investment Portfolio:
| (b) | Denotes a restricted security, which is subject to restrictions on resale under federal securities laws or in transactions exempt from registration. At June 30, 2010, the value of these securities amounted to $3,438,087, which represents 0.4% of net assets. |
| | | | | |
Security | | Acquisition
Date | | Acquisition
Cost |
CA Statewide Communities Development Authority, Crossroads School for Arts & Sciences,
Series 1998, | | | | | |
6.000% 08/01/28 | | 08/21/98 | | $ | 265,000 |
6.000% 08/01/28 | | 08/31/98 | | | 700,000 |
NC Durham Housing Authority, Magnolia Pointe Apartments, Series 2005, AMT, | | | | | |
5.650% 02/01/38 | | 12/19/06 | | | 3,500,000 |
| | | | | |
| | | | $ | 4,465,000 |
| | | | | |
See Accompanying Notes to Financial Statements.
25
Columbia High Yield Municipal Fund
June 30, 2010
| (c) | The issuer is in default of certain debt covenants. Income is not being accrued. At June 30, 2010, the value of these securities amounted to $8,740,228, which represents 1.1% of net assets. |
| (d) | The issuer had filed for bankruptcy protection under Chapter 11, and is in default of certain covenants. Income is not being accrued. At June 30, 2010, the value of this security amounted to $18,037, which represents less than 0.1% if the net assets. |
| (e) | The interest rate shown on floating rate or variable rate securities reflects the rate at June 30, 2010. |
| (f) | Parenthetical date represents the next interest rate reset date for the security. |
| (g) | Represents fair value as determined in good faith under procedures approved by the Board of Trustees. At June 30, 2010, the value of these securities amounted to $528,500, which represents 0.1% of net assets. |
| (h) | The issuer is in default of certain debt covenants. Income is being partially accrued. At June 30, 2010, the value of this security amounted to $604,143, which represents 0.1% of net assets. |
| (i) | Security exempt from registration pursuant to Rule 144A under the Securities Act of 1933. These securities may be resold in transactions exempt from registration, normally to qualified institutional buyers. At June 30, 2010, these securities, which are not illiquid, except as listed below, amounted to $27,443,334, which represents 3.6% of net assets. |
| | | | | | | | | | | |
Security | | Acquisition
Date | | Par/Shares | | Acquisition
Cost | | Value |
Resolution Trust Corp. Pass-Through Certificates, Series 1993 A, | | | | | | | | | | | |
8.500% 12/01/16 | | 11/12/93 | | $ | 455,481 | | $ | 463,388 | | $ | 432,352 |
CA Cabazon Band Mission Indians, Series 2004: | | | | | | | | | | | |
8.375% 10/01/15 | | 10/08/04 | | | 560,000 | | | 488,250 | | | 366,789 |
8.750% 10/01/19 | | 10/08/04 | | | 2,785,000 | | | 2,440,250 | | | 1,816,126 |
OR Cow Creek Band Umpqua Tribe of Indians, Series 2006 C, | | | | | | | | | | | |
5.625% 10/01/26 | | 06/15/06 | | | 1,700,000 | | | 1,700,000 | | | 1,257,949 |
NY Liberty Development Corp., National Sports Museum Series 2006 A, | | | | | | | | | | | |
6.125% 02/15/19 | | 08/17/06 | | | 1,979,996 | | | 1,984,234 | | | 5,940 |
MuniMae Trust, AMT, | | | | | | | | | | | |
5.800% 06/30/49 | | 10/19/04 | | | 1,000,000 | | | 1,000,000 | | | 668,090 |
| | | | | | | | | | | |
| | | | | | | | | | $ | 4,547,246 |
| | | | | | | | | | | |
| (j) | The Fund has been informed that each issuer has placed direct obligations of the U.S. Government in an irrevocable trust, solely for the payment of principal and interest. |
| (k) | Investments in affiliates during the year ended June 30, 2010: |
| | | | | | | | | | | | | | | |
Affiliate | | Value,
beginning of
period | | Purchases | | Sales
Proceeds | | Dividend
Income | | Value,
end of
period |
BofA Tax-Exempt Reserves, Capital Class (7 day yield of 0.150%)* | | $ | 10,025,800 | | $ | 152,675,257 | | $ | 148,198,083 | | $ | 18,240 | | $ | — |
*As of May 1, 2010, this company was no longer an affiliate of the fund. The above table reflects activity for the period from July 1, 2009 through April 30, 2010.
| (l) | Money market mutual fund registered under the Investment Company Act of 1940, as amended, and advised by BofA Global Capital Management Group, LLC. |
| (m) | Variable rate demand notes. These securities are payable upon demand and are secured by letters of credit or other credit support agreements from banks. The interest rates change periodically and the interest rates shown reflect the rates at June 30, 2010. |
| (n) | Cost for federal income tax purposes is $791,068,562. |
The following table summarizes the inputs used, as of June 30, 2010 in valuing the Fund’s assets:
| | | | | | | | | | | | |
Description | | Quoted
Prices
(Level 1) | | Other
Significant
Observable
Inputs
(Level 2) | | Significant
Unobservable
Inputs
(Level 3) | | Total |
Municipal Bonds | | | | | | | | | | | | |
Education | | $ | — | | $ | 39,568,739 | | $ | — | | $ | 39,568,739 |
Health Care | | | — | | | 269,723,516 | | | 528,500 | | | 270,252,016 |
Housing | | | — | | | 56,037,804 | | | — | | | 56,037,804 |
Industrials | | | — | | | 36,025,099 | | | — | | | 36,025,099 |
Other | | | — | | | 62,509,971 | | | — | | | 62,509,971 |
Other Revenue | | | — | | | 17,845,992 | | | — | | | 17,845,992 |
Resource Recovery | | | — | | | 13,014,896 | | | — | | | 13,014,896 |
Tax-Backed | | | — | | | 152,660,753 | | | — | | | 152,660,753 |
Transportation | | | — | | | 43,308,933 | | | — | | | 43,308,933 |
Utilities | | | — | | | 49,996,246 | | | — | | | 49,996,246 |
| | | | | | | | | | | | |
Total Municipal Bonds | | | — | | | 740,691,949 | | | 528,500 | | | 741,220,449 |
| | | | | | | | | | | | |
Total Investment Companies | | | 6,006,404 | | | — | | | — | | | 6,006,404 |
| | | | | | | | | | | | |
Total Municipal Preferred Stocks | | | — | | | 3,253,930 | | | — | | | 3,253,930 |
| | | | | | | | | | | | |
Total Short-Term Obligation | | | — | | | 5,000,000 | | | — | | | 5,000,000 |
| | | | | | | | | | | | |
Total Investments | | $ | 6,006,404 | | $ | 748,945,879 | | $ | 528,500 | | $ | 755,480,783 |
| | | | | | | | | | | | |
There were no significant transfers between Levels 1 and 2 during the period.
Certain short-term obligations may be valued using amortized cost, an income approach which converts future cash flows to a present value based upon the premium or discount at purchase.
| The | following table reconciles asset balances for the year ending June 30, 2010, in which significant unobservable inputs (Level 3) were used in determining value: |
| | | | | | | | | | | | | | | | | | | | | | | | | | | | |
Investment in Securities | | Balance
as of
June 30,
2009 | | Accrued
Discounts/
(Premiums) | | Realized
Gain
(Loss) | | Change in
Unrealized
Appreciation
(Depreciation) | | Purchases | | Sales | | | Transfers
into
Level 3 | | Transfers
out of
Level 3 | | Balance as of
June 30, 2010 |
Municipal Bonds | | | | | | | | | | | | | | | | | | | | | | | | | | | | |
Health Care | | $ | 549,500 | | $ | — | | $ | — | | $ | 9,000 | | $ | — | | $ | (30,000 | ) | | $ | — | | $ | — | | $ | 528,500 |
| | | | | | | | | | | | | | | | | | | | | | | | | | | | |
See Accompanying Notes to Financial Statements.
26
Columbia High Yield Municipal Fund
June 30, 2010
The information in the above reconciliation represents fiscal year to date activity for any securities identified as using Level 3 inputs at either the beginning or the end of the current fiscal period.
The change in unrealized appreciation attributable to securities owned at June 30, 2010 which were valued using significant unobservable inputs (Level 3) amounted to $9,000. This amount is included in net change in unrealized appreciation (depreciation) on the Statement of Changes in Net Assets.
For more information on valuation inputs, and their aggregation into the levels used in the tables above, please refer to the Security Valuation section in the accompanying Notes to Financial Statements.
At June 30, 2010 the composition of the Fund by Revenue Source is as follows:
| | |
Revenue Source (Unaudited) | | % of
Net Assets |
Health Care | | 35.3 |
Tax-Backed | | 20.0 |
Other | | 8.2 |
Housing | | 7.7 |
Utilities | | 6.5 |
Transportation | | 5.7 |
Education | | 5.2 |
Industrials | | 4.7 |
Other Revenue | | 2.3 |
Resource Recovery | | 1.7 |
| | |
| | 97.3 |
Investment Companies | | 0.8 |
Short-Term Obligation | | 0.7 |
Other Assets & Liabilities, Net | | 1.2 |
| | |
| | 100.0 |
| | |
| | |
Acronym | | Name |
| AGMC | | Assured Guaranty Municipal Corp. |
| AGO | | Assured Guaranty Ltd. |
| AMBAC | | Ambac Assurance Corp. |
| AMT | | Alternative Minimum Tax |
| FHA | | Federal Housing Administration |
| FHLMC | | Federal Home Loan Mortgage Corp. |
| GNMA | | Government National Mortgage Association |
| GTY AGMT | | Guarantee Agreement |
| HFDC | | Health Facility Development Corporation |
| LOC | | Letter of Credit |
| NPFGC | | National Public Finance Guarantee Corp. |
See Accompanying Notes to Financial Statements.
27
Statement of Assets and Liabilities – Columbia High Yield Municipal Fund
June 30, 2010
| | | | | |
| | | | | ($) | |
| Assets | | Investments, at cost | | 792,026,701 | |
| | | | | |
| | Investments, at value | | 755,480,783 | |
| | Cash | | 298 | |
| | Receivable for: | | | |
| | Fund shares sold | | 1,440,862 | |
| | Interest | | 12,973,186 | |
| | Trustees’ deferred compensation plan | | 53,684 | |
| | Prepaid expenses | | 20,215 | |
| | | |
| | Total Assets | | 769,969,028 | |
| | | | | |
| | |
| Liabilities | | Payable for: | | | |
| | Fund shares repurchased | | 1,695,776 | |
| | Distributions | | 2,921,182 | |
| | Investment advisory fee | | 247,657 | |
| | Administration fee | | 66,271 | |
| | Transfer agent fee | | 32,911 | |
| | Pricing and bookkeeping fees | | 21,047 | |
| | Trustees’ fees | | 36 | |
| | Custody fee | | 3,809 | |
| | Distribution and service fees | | 20,302 | |
| | Chief compliance officer expenses | | 195 | |
| | Trustees’ deferred compensation plan | | 53,684 | |
| | Other liabilities | | 56,519 | |
| | | |
| | Total Liabilities | | 5,119,389 | |
| |
| | | |
| | Net Assets | | 764,849,639 | |
| | |
| Net Assets Consist of | | Paid-in capital | | 871,305,684 | |
| | Undistributed net investment income | | 1,728,108 | |
| | Accumulated net realized loss | | (71,638,235 | ) |
| | Net unrealized appreciation (depreciation) on investments | | (36,545,918 | ) |
| | | |
| | Net Assets | | 764,849,639 | |
See Accompanying Notes to Financial Statements.
28
Statement of Assets and Liabilities (continued) – Columbia High Yield Municipal Fund
June 30, 2010
| | | | | | |
| Class A | | Net assets | | $ | 80,691,057 | |
| | Shares outstanding | | | 8,261,976 | |
| | Net asset value per share | | $ | 9.77 | (a) |
| | Maximum sales charge | | | 4.75 | % |
| | Maximum offering price per share ($9.77/0.9525) | | $ | 10.26 | (b) |
| | |
| Class B | | Net assets | | $ | 5,995,127 | |
| | Shares outstanding | | | 613,851 | |
| | Net asset value and offering price per share | | $ | 9.77 | (a) |
| | |
| Class C | | Net assets | | $ | 9,287,999 | |
| | Shares outstanding | | | 951,044 | |
| | Net asset value and offering price per share | | $ | 9.77 | (a) |
| | |
| Class Z | | Net assets | | $ | 668,875,456 | |
| | Shares outstanding | | | 68,488,299 | |
| | Net asset value, offering and redemption price per share | | $ | 9.77 | |
| (a) | Redemption price per share is equal to net asset value less any applicable contingent deferred sales charge. |
| (b) | On sales of $50,000 or more the offering price is reduced. |
See Accompanying Notes to Financial Statements.
29
Statement of Operations – Columbia High Yield Municipal Fund
For the Year Ended June 30, 2010
| | | | | |
| | | | | ($) | |
| Investment Income | | Interest | | 44,231,387 | |
| | Dividends | | 16,640 | |
| | Dividends from affiliates | | 18,240 | |
| | | |
| | Total Investment Income | | 44,266,267 | |
| | |
| Expenses | | Investment advisory fee | | 2,886,094 | |
| | Administration fee | | 777,773 | |
| | Distribution fee: | | | |
| | Class B | | 54,325 | |
| | Class C | | 67,431 | |
| | Service fee: | | | |
| | Class A | | 139,321 | |
| | Class B | | 14,486 | |
| | Class C | | 17,977 | |
| | Transfer agent fee | | 392,715 | |
| | Pricing and bookkeeping fees | | 192,931 | |
| | Trustees’ fees | | 42,961 | |
| | Custody fee | | 22,466 | |
| | Chief compliance officer expenses | | 824 | |
| | Other expenses | | 259,460 | |
| | | |
| | Total Expenses | | 4,868,764 | |
| | |
| | Fees waived by distributor – Class C | | (13,500 | ) |
| | Expense reductions | | (32 | ) |
| | | |
| | Net Expenses | | 4,855,232 | |
| |
| | | |
| | Net Investment Income | | 39,411,035 | |
| | |
Net Realized and Unrealized Gain (Loss) on Investments | | Net realized loss on investments | | (2,150,911 | ) |
| | Net change in unrealized appreciation (depreciation) on investments | | 71,014,028 | |
| | | |
| | Net Gain | | 68,863,117 | |
| |
| | | |
| | Net Increase Resulting from Operations | | 108,274,152 | |
See Accompanying Notes to Financial Statements.
30
Statement of Changes in Net Assets – Columbia High Yield Municipal Fund
| | | | | | | | |
| | | | | Year Ended June 30, | |
| Increase (Decrease) in Net Assets | | | | 2010 ($) | | | 2009 ($) | |
| Operations | | Net investment income | | 39,411,035 | | | 35,365,810 | |
| | Net realized loss on investments and futures contracts | | (2,150,911 | ) | | (39,803,821 | ) |
| | Net change in unrealized appreciation (depreciation) on investments and futures contracts | | 71,014,028 | | | (70,585,468 | ) |
| | | |
| | Net increase (decrease) resulting from operations | | 108,274,152 | | | (75,023,479 | ) |
| | | |
| Distributions to Shareholders | | From net investment income: | | | | | | |
| | Class A | | (3,738,375 | ) | | (3,633,149 | ) |
| | Class B | | (336,155 | ) | | (466,244 | ) |
| | Class C | | (429,275 | ) | | (468,337 | ) |
| | Class Z | | (34,347,738 | ) | | (30,574,264 | ) |
| | | |
| | Total distributions to shareholders | | (38,851,543 | ) | | (35,141,994 | ) |
| | | |
| | Net Capital Stock Transactions | | 120,771,323 | | | (42,026,276 | ) |
| | | |
| | Total increase (decrease) in net assets | | 190,193,932 | | | (152,191,749 | ) |
| | | |
| Net Assets | | Beginning of period | | 574,655,707 | | | 726,847,456 | |
| | End of period | | 764,849,639 | | | 574,655,707 | |
| | Undistributed net investment income at end of period | | 1,728,108 | | | 1,240,262 | |
See Accompanying Notes to Financial Statements.
31
Statement of Changes in Net Assets (continued) – Columbia High Yield Municipal Fund
| | | | | | | | | | | | |
| | | Capital Stock Activity | |
| | | Year Ended
June 30, 2010 | | | Year Ended
June 30, 2009 | |
| | | Shares | | | Dollars ($) | | | Shares | | | Dollars ($) | |
Class A | | | | | | | | | | | | |
Subscriptions | | 2,724,407 | | | 25,945,561 | | | 1,077,239 | | | 9,324,226 | |
Distributions reinvested | | 204,643 | | | 1,945,394 | | | 225,765 | | | 1,993,420 | |
Redemptions | | (1,403,983 | ) | | (13,328,513 | ) | | (1,794,935 | ) | | (15,859,796 | ) |
| | | | | | | | | | | | |
Net increase (decrease) | | 1,525,067 | | | 14,562,442 | | | (491,931 | ) | | (4,542,150 | ) |
| | | | |
Class B | | | | | | | | | | | | |
Subscriptions | | 21,015 | | | 200,054 | | | 185,475 | | | 1,578,364 | |
Distributions reinvested | | 15,765 | | | 149,362 | | | 26,304 | | | 232,508 | |
Redemptions | | (378,136 | ) | | (3,574,031 | ) | | (414,186 | ) | | (3,688,094 | ) |
| | | | | | | | | | | | |
Net decrease | | (341,356 | ) | | (3,224,615 | ) | | (202,407 | ) | | (1,877,222 | ) |
| | | | |
Class C | | | | | | | | | | | | |
Subscriptions | | 231,532 | | | 2,197,355 | | | 218,827 | | | 1,900,642 | |
Distributions reinvested | | 19,728 | | | 187,674 | | | 23,318 | | | 205,692 | |
Redemptions | | (249,583 | ) | | (2,374,418 | ) | | (367,569 | ) | | (3,276,441 | ) |
| | | | | | | | | | | | |
Net increase (decrease) | | 1,677 | | | 10,611 | | | (125,424 | ) | | (1,170,107 | ) |
| | | | |
Class Z | | | | | | | | | | | | |
Subscriptions | | 24,496,505 | | | 231,051,837 | | | 15,518,948 | | | 138,277,279 | |
Distributions reinvested | | 518,686 | | | 4,928,209 | | | 575,053 | | | 5,081,922 | |
Redemptions | | (13,292,723 | ) | | (126,557,161 | ) | | (20,306,908 | ) | | (177,795,998 | ) |
| | | | | | | | | | | | |
Net increase (decrease) | | 11,722,468 | | | 109,422,885 | | | (4,212,907 | ) | | (34,436,797 | ) |
See Accompanying Notes to Financial Statements.
32
Financial Highlights – Columbia High Yield Municipal Fund
Selected data for a share outstanding throughout each period is as follows:
| | | | | | | | | | | | | | | | | | | | |
| | | Year Ended June 30, | |
| Class A Shares | | 2010 | | | 2009 | | | 2008 | | | 2007 | | | 2006 | |
Net Asset Value, Beginning of Period | | $ | 8.79 | | | $ | 10.32 | | | $ | 11.33 | | | $ | 11.25 | | | $ | 11.39 | |
| | | | | |
Income from Investment Operations: | | | | | | | | | | | | | | | | | | | | |
Net investment income (a) | | | 0.52 | | | | 0.53 | | | | 0.52 | | | | 0.51 | | | | 0.52 | |
Net realized and unrealized gain (loss) on investments, swap contracts and futures contracts | | | 0.97 | | | | (1.53 | ) | | | (1.01 | ) | | | 0.08 | | | | (0.14 | ) |
| | | | | | | | | | | | | | | | | | | | |
Total from investment operations | | | 1.49 | | | | (1.00 | ) | | | (0.49 | ) | | | 0.59 | | | | 0.38 | |
| | | | | |
Less Distributions to Shareholders: | | | | | | | | | | | | | | | | | | | | |
From net investment income | | | (0.51 | ) | | | (0.53 | ) | | | (0.52 | ) | | | (0.51 | ) | | | (0.52 | ) |
| | | | | |
Net Asset Value, End of Period | | $ | 9.77 | | | $ | 8.79 | | | $ | 10.32 | | | $ | 11.33 | | | $ | 11.25 | |
Total return (b) | | | 17.25 | % | | | (9.60 | )% | | | (4.39 | )% | | | 5.23 | % | | | 3.39 | %(c) |
| | | | |
Ratios to Average Net Assets/Supplemental Data: | | | | | | | | | | | | | | | | | |
Net expenses before interest expense and fees (d) | | | 0.85 | % | | | 0.90 | % | | | 0.90 | % | | | 0.88 | % | | | 0.85 | % |
Interest expense and fees | | | — | | | | — | | | | 0.05 | %(e) | | | 0.07 | %(e) | | | 0.07 | %(e) |
Net expenses (d) | | | 0.85 | % | | | 0.90 | % | | | 0.95 | % | | | 0.95 | % | | | 0.92 | % |
Waiver/Reimbursement | | | — | | | | — | | | | — | | | | — | | | | — | %(f) |
Net investment income (d) | | | 5.44 | % | | | 5.90 | % | | | 4.84 | % | | | 4.43 | % | | | 4.60 | % |
Portfolio turnover rate | | | 18 | % | | | 26 | % | | | 32 | % | | | 27 | % | | | 13 | % |
Net assets, end of period (000s) | | $ | 80,691 | | | $ | 59,189 | | | $ | 74,593 | | | $ | 89,977 | | | $ | 90,151 | |
| (a) | Per share data was calculated using the average shares outstanding during the period. |
| (b) | Total return at net asset value assuming all distributions reinvested and no initial sales charge or contingent deferred sales charge. |
| (c) | Had the investment advisor and/or any of its affiliates not waived fees or reimbursed a portion of expenses, total return would have been reduced. |
| (d) | The benefits derived from expense reductions had an impact of less than 0.01%. |
| (e) | Interest expense and fees relate to the Fund’s liability with respect to floating-rate notes held in conjunction with investments in inverse floating rate obligations. |
| (f) | Rounds to less than 0.01%. |
See Accompanying Notes to Financial Statements.
33
Financial Highlights – Columbia High Yield Municipal Fund
Selected data for a share outstanding throughout each period is as follows:
| | | | | | | | | | | | | | | | | | | | |
| | | Year Ended June 30, | |
| Class B Shares | | 2010 | | | 2009 | | | 2008 | | | 2007 | | | 2006 | |
Net Asset Value, Beginning of Period | | $ | 8.79 | | | $ | 10.32 | | | $ | 11.33 | | | $ | 11.25 | | | $ | 11.39 | |
| | | | | |
Income from Investment Operations: | | | | | | | | | | | | | | | | | | | | |
Net investment income (a) | | | 0.45 | | | | 0.46 | | | | 0.44 | | | | 0.42 | | | | 0.43 | |
Net realized and unrealized gain (loss) on investments, swap contracts and futures contracts | | | 0.97 | | | | (1.53 | ) | | | (1.01 | ) | | | 0.08 | | | | (0.14 | ) |
| | | | | | | | | | | | | | | | | | | | |
Total from investment operations | | | 1.42 | | | | (1.07 | ) | | | (0.57 | ) | | | 0.50 | | | | 0.29 | |
| | | | | |
Less Distributions to Shareholders: | | | | | | | | | | | | | | | | | | | | |
From net investment income | | | (0.44 | ) | | | (0.46 | ) | | | (0.44 | ) | | | (0.42 | ) | | | (0.43 | ) |
| | | | | |
Net Asset Value, End of Period | | $ | 9.77 | | | $ | 8.79 | | | $ | 10.32 | | | $ | 11.33 | | | $ | 11.25 | |
Total return (b) | | | 16.39 | % | | | (10.27 | )% | | | (5.10 | )% | | | 4.45 | % | | | 2.62 | %(c) |
| | | | |
Ratios to Average Net Assets/Supplemental Data: | | | | | | | | | | | | | | | | | |
Net expenses before interest expense and fees (d) | | | 1.60 | % | | | 1.65 | % | | | 1.65 | % | | | 1.63 | % | | | 1.60 | % |
Interest expense and fees | | | — | | | | — | | | | 0.05 | %(e) | | | 0.07 | %(e) | | | 0.07 | %(e) |
Net expenses (d) | | | 1.60 | % | | | 1.65 | % | | | 1.70 | % | | | 1.70 | % | | | 1.67 | % |
Waiver/Reimbursement | | | — | | | | — | | | | — | | | | — | | | | — | %(f) |
Net investment income (d) | | | 4.72 | % | | | 5.13 | % | | | 4.09 | % | | | 3.68 | % | | | 3.85 | % |
Portfolio turnover rate | | | 18 | % | | | 26 | % | | | 32 | % | | | 27 | % | | | 13 | % |
Net assets, end of period (000s) | | $ | 5,995 | | | $ | 8,392 | | | $ | 11,945 | | | $ | 17,407 | | | $ | 24,735 | |
| (a) | Per share data was calculated using the average shares outstanding during the period. |
| (b) | Total return at net asset value assuming all distributions reinvested and no contingent deferred sales charge. |
| (c) | Had the investment advisor and/or any of its affiliates not waived fees or reimbursed a portion of expenses, total return would have been reduced. |
| (d) | The benefits derived from expense reductions had an impact of less than 0.01%. |
| (e) | Interest expense and fees relate to the Fund’s liability with respect to floating-rate notes held in conjunction with investments in inverse floating rate obligations. |
| (f) | Rounds to less than 0.01%. |
See Accompanying Notes to Financial Statements.
34
Financial Highlights – Columbia High Yield Municipal Fund
Selected data for a share outstanding throughout each period is as follows:
| | | | | | | | | | | | | | | | | | | | |
| | | Year Ended June 30, | |
| Class C Shares | | 2010 | | | 2009 | | | 2008 | | | 2007 | | | 2006 | |
Net Asset Value, Beginning of Period | | $ | 8.79 | | | $ | 10.32 | | | $ | 11.33 | | | $ | 11.25 | | | $ | 11.39 | |
| | | | | |
Income from Investment Operations: | | | | | | | | | | | | | | | | | | | | |
Net investment income (a) | | | 0.46 | | | | 0.48 | | | | 0.46 | | | | 0.44 | | | | 0.45 | |
Net realized and unrealized gain (loss) on investments, swap contracts and futures contracts | | | 0.97 | | | | (1.54 | ) | | | (1.01 | ) | | | 0.08 | | | | (0.14 | ) |
| | | | | | | | | | | | | | | | | | | | |
Total from investment operations | | | 1.43 | | | | (1.06 | ) | | | (0.55 | ) | | | 0.52 | | | | 0.31 | |
| | | | | |
Less Distributions to Shareholders: | | | | | | | | | | | | | | | | | | | | |
From net investment income | | | (0.45 | ) | | | (0.47 | ) | | | (0.46 | ) | | | (0.44 | ) | | | (0.45 | ) |
| | | | | |
Net Asset Value, End of Period | | $ | 9.77 | | | $ | 8.79 | | | $ | 10.32 | | | $ | 11.33 | | | $ | 11.25 | |
Total return (b)(c) | | | 16.55 | % | | | (10.14 | )% | | | (4.96 | )% | | | 4.61 | % | | | 2.77 | % |
| | | | |
Ratios to Average Net Assets/Supplemental Data: | | | | | | | | | | | | | | | | | |
Net expenses before interest expense and fees (d) | | | 1.45 | % | | | 1.50 | % | | | 1.50 | % | | | 1.48 | % | | | 1.45 | % |
Interest expense and fees | | | — | | | | — | | | | 0.05 | %(e) | | | 0.07 | %(e) | | | 0.07 | %(e) |
Net expenses (d) | | | 1.45 | % | | | 1.50 | % | | | 1.55 | % | | | 1.55 | % | | | 1.52 | % |
Waiver/Reimbursement | | | 0.15 | % | | | 0.15 | % | | | 0.15 | % | | | 0.15 | % | | | 0.15 | % |
Net investment income (d) | | | 4.85 | % | | | 5.29 | % | | | 4.24 | % | | | 3.82 | % | | | 3.99 | % |
Portfolio turnover rate | | | 18 | % | | | 26 | % | | | 32 | % | | | 27 | % | | | 13 | % |
Net assets, end of period (000s) | | $ | 9,288 | | | $ | 8,341 | | | $ | 11,090 | | | $ | 14,134 | | | $ | 14,727 | |
| (a) | Per share data was calculated using the average shares outstanding during the period. |
| (b) | Total return at net asset value assuming all distributions reinvested and no contingent deferred sales charge. |
| (c) | Had the investment advisor and/or any of its affiliates not waived fees or reimbursed a portion of expenses, total return would have been reduced. |
| (d) | The benefits derived from expense reductions had an impact of less than 0.01%. |
| (e) | Interest expense and fees relate to the Fund’s liability with respect to floating-rate notes held in conjunction with investments in inverse floating rate obligations. |
See Accompanying Notes to Financial Statements.
35
Financial Highlights – Columbia High Yield Municipal Fund
Selected data for a share outstanding throughout each period is as follows:
| | | | | | | | | | | | | | | | | | | | |
| | | Year Ended June 30, | |
| Class Z Shares | | 2010 | | | 2009 | | | 2008 | | | 2007 | | | 2006 | |
Net Asset Value, Beginning of Period | | $ | 8.79 | | | $ | 10.32 | | | $ | 11.33 | | | $ | 11.25 | | | $ | 11.39 | |
| | | | | |
Income from Investment Operations: | | | | | | | | | | | | | | | | | | | | |
Net investment income (a) | | | 0.54 | | | | 0.55 | | | | 0.54 | | | | 0.53 | | | | 0.54 | |
Net realized and unrealized gain (loss) on investments, swap contracts and futures contracts | | | 0.97 | | | | (1.54 | ) | | | (1.01 | ) | | | 0.08 | | | | (0.14 | ) |
| | | | | | | | | | | | | | | | | | | | |
Total from investment operations | | | 1.51 | | | | (0.99 | ) | | | (0.47 | ) | | | 0.61 | | | | 0.40 | |
| | | | | |
Less Distributions to Shareholders: | | | | | | | | | | | | | | | | | | | | |
From net investment income | | | (0.53 | ) | | | (0.54 | ) | | | (0.54 | ) | | | (0.53 | ) | | | (0.54 | ) |
| | | | | |
Net Asset Value, End of Period | | $ | 9.77 | | | $ | 8.79 | | | $ | 10.32 | | | $ | 11.33 | | | $ | 11.25 | |
Total return (b) | | | 17.48 | % | | | (9.42 | )% | | | (4.20 | )% | | | 5.44 | % | | | 3.59 | %(c) |
| | | | |
Ratios to Average Net Assets/Supplemental Data: | | | | | | | | | | | | | | | | | |
Net expenses before interest expense and fees (d) | | | 0.65 | % | | | 0.70 | % | | | 0.70 | % | | | 0.68 | % | | | 0.65 | % |
Interest expense and fees | | | — | | | | — | | | | 0.05 | %(e) | | | 0.07 | %(e) | | | 0.07 | %(e) |
Net expenses (d) | | | 0.65 | % | | | 0.70 | % | | | 0.75 | % | | | 0.75 | % | | | 0.72 | % |
Waiver/Reimbursement | | | — | | | | — | | | | — | | | | — | | | | — | %(f) |
Net investment income (d) | | | 5.64 | % | | | 6.07 | % | | | 5.03 | % | | | 4.63 | % | | | 4.80 | % |
Portfolio turnover rate | | | 18 | % | | | 26 | % | | | 32 | % | | | 27 | % | | | 13 | % |
Net assets, end of period (000s) | | $ | 668,875 | | | $ | 498,734 | | | $ | 629,219 | | | $ | 698,454 | | | $ | 576,355 | |
| (a) | Per share data was calculated using the average shares outstanding during the period. |
| (b) | Total return at net asset value assuming all distributions reinvested. |
| (c) | Had the investment advisor and/or any of its affiliates not waived fees or reimbursed a portion of expenses, total return would have been reduced. |
| (d) | The benefits derived from expense reductions had an impact of less than 0.01%. |
| (e) | Interest expense and fees relate to the Fund’s liability with respect to floating-rate notes held in conjunction with investments in inverse floating rate obligations. |
| (f) | Rounds to less than 0.01%. |
See Accompanying Notes to Financial Statements.
36
Notes to Financial Statements – Columbia High Yield Municipal Fund
June 30, 2010
Note 1. Organization
Columbia High Yield Municipal Fund (the “Fund”), a series of Columbia Funds Series Trust I (the “Trust”), is a diversified portfolio. The Trust is registered under the Investment Company Act of 1940, as amended (the “1940 Act”), as an open-end management investment company organized as a Massachusetts business trust.
Investment Objective
The Fund seeks total return, consisting of current income exempt from federal income tax and of capital appreciation.
Fund Shares
The Trust may issue an unlimited number of shares, and the Fund offers four classes of shares: Class A, Class B, Class C and Class Z. Each share class has its own expense structure and sales charges, as applicable. The Fund no longer accepts investments from new or existing investors in the Fund’s Class B shares, except in connection with the reinvestment of any dividend and/or capital gain distributions in Class B shares of the Fund and exchanges by existing Class B shareholders of the other Columbia Funds.
Class A shares are subject to a maximum front-end sales charge of 4.75% based on the amount of initial investment. Class A shares purchased without an initial sales charge in accounts aggregating $1 million to $50 million at the time of purchase are subject to a 1.00% contingent deferred sales charge (“CDSC”) if the shares are sold within one year after purchase. Class B shares are subject to a maximum CDSC of 5.00% based upon the holding period after purchase. Class B shares will convert to Class A shares eight years after purchase. Class C shares are subject to a 1.00% CDSC on shares sold within one year after purchase. Class Z shares are offered continuously at net asset value. There are certain restrictions on the purchase of Class Z shares, as described in the Fund’s prospectus.
Note 2. Significant Accounting Policies
The preparation of financial statements in accordance with accounting principles generally accepted in the United States of America (“GAAP”) requires management to make certain estimates and assumptions that affect the reported amounts of assets and liabilities, the disclosure of contingent assets and liabilities at the date of the financial statements and the reported amounts of revenue and expenses during the reporting period. Actual results could differ from those estimates.
Management has evaluated the events and transactions that have occurred through the date the financial statements were issued and noted no items requiring adjustment of the financial statements or additional disclosures.
The following is a summary of significant accounting policies consistently followed by the Funds in the preparation of their financial statements.
Security Valuation
Debt securities generally are valued by pricing services approved by the Trust’s Board of Trustees, based upon market transactions for normal, institutional-size trading units of similar securities. The services may use various pricing techniques which take into account appropriate factors such as yield, quality, coupon rate, maturity, type of issue, trading characteristics and other data, as well as broker quotes. Debt securities for which quotations are readily available may also be valued based upon an over-the-counter or exchange bid quotation.
Certain debt securities, which tend to be more thinly traded and of lesser quality, are priced based on fundamental analysis of the financial condition of the issuer and the estimated value of any collateral. Valuations developed through pricing techniques may vary from the actual amounts realized upon sale of the securities, and the potential variation may be greater for those securities valued using fundamental analysis.
Short-term investments maturing in 60 days or less are valued at amortized cost, which approximates market value.
Investments in other open-end investment companies are valued at net asset value.
Investments for which market quotations are not readily available, or that have quotations which management believes are not reliable, are valued at fair value as determined in good faith under consistently applied procedures established by and under the general supervision of the Board of Trustees. If a security is valued at fair value, such value is likely to be different from the last quoted market price for the security. The determination of fair value often requires significant judgment. To determine fair value, management may use assumptions including but not limited
37
Columbia High Yield Municipal Fund
June 30, 2010
to future cash flows and estimated risk premiums. Multiple inputs from various sources may be used to determine value.
GAAP establishes a hierarchy that prioritizes the inputs to valuation techniques used to measure fair value giving the highest priority to unadjusted quoted prices in active markets for identical securities (level 1 measurements) and the lowest priority to unobservable inputs (level 3 measurements) when market prices are not readily available or reliable. The three levels of the fair value hierarchy are described below:
| n | | Level 1 — quoted prices in active markets for identical securities |
| n | | Level 2 — prices determined using other significant observable inputs (including quoted prices for similar securities, interest rates, prepayment speeds, credit risk and others) |
| n | | Level 3 — prices determined using significant unobservable inputs. In situations where quoted prices or observable inputs are unavailable or less reliable, unobservable inputs may be used. Unobservable inputs may include management’s own assumptions about the factors market participants would use in pricing an investment. |
The inputs or methodology used for valuing securities are not necessarily an indication of the risk associated with investing in those securities.
On January 21, 2010, the Financial Accounting Standards Board issued an Accounting Standards Update (the “amendment”), Fair Value Measurements and Disclosures (Topic 820): Improving Disclosures about Fair Value Measurements, which provides guidance on how investment assets and liabilities are to be valued and disclosed. Specifically, the amendment requires reporting entities to disclose the input and valuation techniques used to measure fair value for both recurring and nonrecurring fair value measurements for Level 2 and Level 3 positions. The amendment also requires that transfers between all levels (including Level 1 and Level 2) be disclosed on a gross basis (i.e., transfers out must be disclosed separately from transfers in), and the reason(s) for the transfer. Additionally, purchases, sales, issuances and settlements must be disclosed on a gross basis in the Level 3 rollforward. The effective date of the amendment is for interim and annual periods beginning after December 15, 2009; except for the requirement to provide the Level 3 activity for purchases, sales, issuances and settlements on a gross basis, which will be effective for interim and annual periods beginning after December 15, 2010. At this time, management is evaluating the implications of the amendment and the impact to the financial statements.
Security Transactions
Security transactions are accounted for on the trade date. Cost is determined and gains (losses) are based upon the specific identification method for both financial statement and federal income tax purposes.
Restricted Securities
Restricted securities are securities that may only be resold upon registration under federal securities laws or in transactions exempt from registration. In some cases, the issuer of restricted securities has agreed to register such securities for resale at the issuer’s expense either upon demand by the Fund or in connection with another registered offering of the securities. Many restricted securities may be resold in the secondary market in transactions exempt from registration. Such restricted securities may be determined to be liquid under criteria established by the Board of Trustees. The Fund will not incur any registration costs upon such resale.
Delayed Delivery Securities
The Fund may trade securities on other than normal settlement terms, including securities purchased or sold on a “when-issued” basis. This may increase the risk if the other party to the transaction fails to deliver and causes the Fund to subsequently invest at less advantageous prices. The Fund identifies within its portfolio of investments cash or liquid securities in an amount equal to the delayed delivery commitment.
Income Recognition
Interest income is recorded on the accrual basis. Premium and discount are amortized and accreted, respectively, on all debt securities, unless otherwise noted.
Original issue discount is accreted to interest income over the life of the security with a corresponding increase in the cost basis.
Dividend income is recorded on the ex-date.
38
Columbia High Yield Municipal Fund
June 30, 2010
Expenses
General expenses of the Trust are allocated to the Fund and other series of the Trust based upon relative net assets or other expense allocation methodologies determined by the nature of the expense. Expenses directly attributable to the Fund are charged to the Fund.
Determination of Class Net Asset Value
All income, expenses (other than class-specific expenses, as shown on the Statement of Operations) and realized and unrealized gains (losses) are allocated to each class of the Fund on a daily basis for purposes of determining the net asset value of each class. Income and expenses are allocated to each class based on the settled shares method, while realized and unrealized gains (losses) are allocated based on the relative net assets of each class.
Federal Income Tax Status
The Fund intends to qualify each year as a “regulated investment company” under Subchapter M of the Internal Revenue Code, as amended, and will distribute substantially all of its tax exempt or taxable income, if any, for its tax year, and as such will not be subject to federal income taxes. In addition, the Fund intends to distribute in each calendar year substantially all of its net investment income, capital gains and certain other amounts, if any, such that the Fund should not be subject to federal excise tax. Therefore, no federal income or excise tax provision is recorded.
Distributions to Shareholders
Distributions from net investment income, if any, are declared and paid annually. Net realized capital gains, if any, are distributed at least annually. Income distributions and capital gain distributions are determined in accordance with federal income tax regulations which may differ from GAAP.
Indemnification
In the normal course of business, the Fund enters into contracts that contain a variety of representations and warranties and which provide general indemnities. The Fund’s maximum exposure under these arrangements is unknown because this would involve future claims against the Fund. Also, under the Trust’s organizational documents and by contract, the Trustees and officers of the Trust are indemnified against certain liabilities that may arise out of actions relating to their duties to the Trust. However, based on experience, the Fund expects the risk of loss due to these representations, warranties and indemnities to be minimal.
Note 3. Federal Tax Information
The timing and character of income and capital gain distributions are determined in accordance with income tax regulations, which may differ from GAAP. Reclassifications are made to the Fund’s capital accounts for permanent tax differences to reflect income and gains available for distribution (or available capital loss carryforwards) under income tax regulations.
For the year ended June 30, 2010, permanent book and tax basis differences resulting primarily from differing treatments for discount accretion/premium amortization on debt securities, market discount reclasses and expired capital loss carryforwards were identified and reclassified among the components of the Fund’s net assets as follows:
| | | | |
| | | | | |
Undistributed
Net Investment
Income | | Accumulated
Net Realized
Loss | | Paid-In Capital |
| $(71,646) | | $1,852,082 | | $(1,780,436) |
Net investment income and net realized gains (losses), as disclosed on the Statement of Operations, and net assets were not affected by this reclassification.
The tax character of distributions paid during the years ended June 30, 2010 and June 30, 2009 was as follows:
| | | | | | |
| | | June 30, 2010 | | June 30, 2009 |
| Distributions paid from: | | | | |
Tax-Exempt Income | | $ | 38,819,554 | | $ | 34,890,769 |
Ordinary Income* | | | 31,988 | | | 251,225 |
| * | For tax purposes short-term capital gain distributions, if any, are considered ordinary income distributions. |
As of June 30, 2010, the components of distributable earnings on a tax basis were as follows:
| | | | |
| | | | | |
Undistributed
Tax-Exempt
Income | | Undistributed
Long-Term
Capital Gains | | Net Unrealized
Depreciation* |
| $4,725,481 | | $— | | $(35,587,779) |
| * | The differences between book-basis and tax-basis net unrealized depreciation are primarily due to deferral of losses from wash sales. |
39
Columbia High Yield Municipal Fund
June 30, 2010
Unrealized appreciation and depreciation at June 30, 2010, based on cost of investments for federal income tax purposes were:
| | | | |
| | | | |
Unrealized appreciation | | $ | 30,550,369 | |
Unrealized depreciation | | | (66,138,148 | ) |
Net unrealized depreciation | | $ | (35,587,779 | ) |
The following capital loss carryforwards may be available to reduce taxable income arising from future net realized gains on investments, if any, to the extent permitted by the Internal Revenue Code:
| | | |
| | | |
| Year of Expiration | | Capital Loss Carryforwards |
| 2011 | | $ | 697,947 |
| 2012 | | | 1,587,432 |
| 2013 | | | 5,621,572 |
| 2014 | | | 466,991 |
| 2015 | | | 1,471,699 |
| 2016 | | | 5,694,295 |
| 2017 | | | 17,741,445 |
| 2018 | | | 35,721,468 |
| | | |
| Total | | $ | 69,002,849 |
Capital loss carryforwards of $1,780,434 expired during the year ended June 30, 2010.
Of the capital loss carryforwards attributable to the Fund, $1,095,076 (expiring on June 30, 2010) was obtained in a merger with Liberty High Yield Municipal Fund. Utilization of these losses could be subject to limitations imposed by the Internal Revenue Code.
Under current tax rules, certain currency and capital losses realized after October 31 may be deferred and treated as occurring on the first day of the following fiscal year. As of June 30, 2010, post-October capital losses of $2,002,489 attributed to security transactions were deferred to July 1, 2010.
Management is required to determine whether a tax position of the Fund is more likely than not to be sustained upon examination by the applicable taxing authority, including resolution of any related appeals or litigation processes, based on the technical merits of the position. The tax benefit to be recognized by the Fund is measured as the largest amount of benefit that is greater than fifty percent likely of being realized upon ultimate settlement. Management is not aware of any tax positions for which it is reasonably possible that the total amounts of unrecognized tax benefits will significantly change in the next twelve months. However, management’s conclusions may be subject to review and adjustment at a later date based on factors including, but not limited to, new tax laws, regulations, and administrative interpretations (including relevant court decisions). The Fund’s federal tax returns for the prior three fiscal years remain subject to examination by the Internal Revenue Service.
Note 4. Fees and Compensation Paid to Affiliates
Investment Advisory Fee
After the close of business on April 30, 2010, Ameriprise Financial, Inc. (“Ameriprise Financial”) acquired a portion of the asset management business of Columbia Management Group, LLC (the “Transaction”), including the business of managing the Fund. In connection with the closing of the Transaction (the “Closing”), RiverSource Investments, LLC, a wholly owned subsidiary of Ameriprise Financial, became the investment advisor of the Fund and subsequently changed its name to Columbia Management Investment Advisers, LLC (the “New Advisor”). The New Advisor receives a monthly investment advisory fee based on the Fund’s average daily net assets at the following annual rates:
| | | |
| | | | |
| Average Daily Net Assets | | Annual Fee Rate | |
First $100 million | | 0.450 | % |
$100 million to $200 million | | 0.425 | % |
Over $200 million | | 0.400 | % |
For the year ended June 30, 2010, the Fund’s effective investment advisory fee rate was 0.41% of the Fund’s average daily net assets.
Prior to the Closing, Columbia Management Advisors, LLC (“Columbia”), an indirect, wholly owned subsidiary of Bank of America Corporation (“BOA”), provided investment advisory services to the Fund under the same fee structure.
Administration Fee
Effective upon the Closing, the New Advisor became the administrator of the Fund under a new Administrative
40
Columbia High Yield Municipal Fund
June 30, 2010
Services Agreement (the “Administrative Agreement”). Under the Administrative Agreement, the New Advisor provides administrative and other services to the Fund, including services previously performed under the Pricing and Bookkeeping Oversight and Services Agreement discussed below. The New Advisor receives a monthly administration fee based on the Fund’s average daily net assets at the following annual rates:
| | | |
| | | | |
| Average Daily Net Assets | | Annual Fee Rate | |
First $100 million | | 0.150 | % |
$100 million to $200 million | | 0.125 | % |
Over $200 million | | 0.100 | % |
Prior to the Closing, Columbia provided administrative services to the Fund under the same fee rates. For the year ended June 30, 2010, the Fund’s effective administration fee rate was 0.11% of the Fund’s average daily net assets.
Pricing and Bookkeeping Fees
Prior to the Closing, the Fund entered into a Financial Reporting Services Agreement (the “Financial Reporting Services Agreement”) with State Street Bank and Trust Company (“State Street”) and Columbia pursuant to which State Street provides financial reporting services to the Fund. The Fund also entered into an Accounting Services Agreement (collectively with the Financial Reporting Services Agreement, the “State Street Agreements”) with State Street and Columbia pursuant to which State Street provides accounting services to the Fund. Upon the Closing, Columbia assigned and delegated its rights and obligations under the State Street Agreements to the New Advisor. Under the State Street Agreements, the Fund pays State Street an annual fee of $38,000 paid monthly plus an additional monthly fee based on an annualized percentage rate of average daily net assets of the Fund for the month. The aggregate fee will not exceed $140,000 per year (exclusive of out-of-pocket expenses and charges). The Fund also reimburses State Street for certain out-of-pocket expenses and charges.
Also prior to the Closing, the Fund entered into a Pricing and Bookkeeping Oversight and Services Agreement (the “Services Agreement”) with Columbia. Under the Services Agreement, Columbia provided services related to Fund expenses and the requirements of the Sarbanes-Oxley Act of 2002, and provided oversight of the accounting and financial reporting services provided by State Street. Under the Services Agreement, the Fund reimbursed Columbia for out-of-pocket expenses. The Services Agreement was terminated upon the Closing. These services are now provided under the Administrative Agreement discussed above.
Transfer Agent Fee
In connection with the Closing, RiverSource Service Corporation, a wholly owned subsidiary of Ameriprise Financial, became the transfer agent of the Fund and subsequently changed its name to Columbia Management Investment Services Corp. (the “New Transfer Agent”). The New Transfer Agent has contracted with Boston Financial Data Services (“BFDS”) to serve as sub-transfer agent. The New Transfer Agent receives a fee for its services, paid monthly, at the annual rate of $22.36 per account plus reimbursement of certain sub-transfer agent fees paid by the New Transfer Agent (exclusive of BFDS fees), calculated based on assets held in omnibus accounts and intended to recover the cost of payments to other parties (including affiliates of BOA) for services to those accounts. The New Transfer Agent pays the fees of BFDS for services as sub-transfer agent and is not entitled to reimbursement for such fees from the Fund.
The New Transfer Agent may also retain, as additional compensation for its services, fees for wire, telephone and redemption orders, Individual Retirement Account (“IRA”) trustee agent fees and account transcript fees due to the New Transfer Agent from shareholders of the Fund and credits (net of bank charges) earned with respect to balances in accounts the New Transfer Agent maintains in connection with its services to the Fund. The New Transfer Agent also receives reimbursement for certain out-of-pocket expenses.
Prior to the Closing, Columbia Management Services, Inc. (the “Previous Transfer Agent”), an affiliate of Columbia and an indirect, wholly owned subsidiary of BOA, provided shareholder services to the Fund and contracted with BFDS to serve as sub-transfer agent, under the same fee structure. Prior to November 1, 2009, the annual rate was $17.34 per open account.
An annual minimum account balance fee of $20 may apply to certain accounts with a value below the Fund’s initial
41
Columbia High Yield Municipal Fund
June 30, 2010
minimum investment requirements to reduce the impact of small accounts on transfer agent fees. These minimum account balance fees are recorded as part of expense reductions on the Statement of Operations. For the year ended June 30, 2010, no minimum account balance fees were charged by the Fund.
Underwriting Discounts, Service and Distribution Fees
In connection with the Closing, RiverSource Fund Distributors, Inc., an indirect wholly owned subsidiary of Ameriprise Financial, became the distributor of the Fund and subsequently changed its name to Columbia Management Investment Distributors, Inc. (the “New Distributor”).
For the year ended June 30, 2010, initial sales charges paid by shareholders on the purchase of Class A shares amounted to $10,460 and net CDSC fees paid by shareholders on certain redemptions of Class A, Class B and Class C shares amounted to $13, $8,610 and $2,743, respectively.
The Fund has adopted distribution and shareholder servicing plans (the “Plans”) pursuant to Rule 12b-1 under the 1940 Act for Class A, Class B and Class C shares, which require the payment of distribution and service fees. The fees are intended to compensate the New Distributor and/or eligible selling and/or servicing agents for selling shares of the Fund and providing services to investors.
Payments under the Plans, which are calculated daily and paid monthly, are based on the average daily net assets of the applicable class of the Fund at the following annual rates:
| | | | | | | | | | | | |
| Distribution Fee | | | Service Fee | |
| Class B | | Class C | | | Class A | | | Class B | | | Class C | |
| 0.75% | | 0.75 | % | | 0.20 | % | | 0.20 | % | | 0.20 | % |
The New Distributor has voluntarily agreed to waive a portion of the distribution fee for Class C shares so that the combined distribution and service fees do not exceed 0.80% annually of the average daily net assets attributable to Class C shares. This arrangement may be modified or terminated by the New Distributor at any time.
Prior to the Closing, Columbia Management Distributors, Inc. (the “Previous Distributor”), an affiliate of Columbia and an indirect, wholly owned subsidiary of BOA, was the principal underwriter of the Fund’s shares. There were no changes to the underwriting discount structure of the Fund or the service or distribution fee rates paid by the Fund as a result of the Transaction.
Fee Waivers and Expense Reimbursements
Effective May 1, 2010, the New Advisor has voluntarily agreed to reimburse a portion of the Fund’s expenses so that the Fund’s ordinary operating expenses (excluding any distribution and service fees, brokerage commissions, interest, taxes and extraordinary expenses, but including custodian charges relating to overdrafts, if any), after giving effect to any balance credits from the Fund’s custodian, do not exceed 0.65% of the Fund’s average daily net assets on an annualized basis. This arrangement may be modified or terminated by the New Advisor at any time. Prior to May 1, 2010, Columbia voluntarily reimbursed a portion of the Fund’s expenses in the same manner.
Fees Paid to Officers and Trustees
In connection with the Closing, all officers of the Fund are employees of the New Advisor or its affiliates and, with the exception of the Fund’s Chief Compliance Officer, receive no compensation from the Fund. The Board of Trustees has appointed a Chief Compliance Officer to the Fund in accordance with federal securities regulations. The Fund, along with other affiliated funds, pays its pro-rata share of the expenses associated with the Chief Compliance Officer. The Fund’s expenses for the Chief Compliance Officer will not exceed $15,000 per year. Prior to the Closing, the Fund paid its pro-rata share of the expenses for the Chief Compliance Officer under the same fee structure.
Trustees are compensated for their services to the Fund, as set forth on the Statement of Operations. The Trust’s eligible Trustees may participate in a deferred compensation plan which may be terminated at any time. Obligations of the plan will be paid solely out of the Fund’s assets.
Other
Prior to the Closing, the Fund made daily investments of cash balances in BofA (formerly Columbia) Tax-Exempt Reserves, an affiliated open-ended investment company of Columbia, pursuant to an exemptive order received from the Securities and Exchange Commission. As an investing Fund, the Fund was indirectly allocated its proportionate share of the expenses of BofA (formerly Columbia) Tax-Exempt Reserves.
42
Columbia High Yield Municipal Fund
June 30, 2010
Note 5. Custody Credits
The Fund has an agreement with its custodian bank under which custody fees may be reduced by balance credits. These credits are recorded as part of expense reductions on the Statement of Operations. The Fund could have invested a portion of the assets utilized in connection with the expense offset arrangement in an income-producing asset if it had not entered into such an agreement. For the year ended June 30, 2010, these custody credits reduced total expenses by $32 for the Fund.
Note 6. Portfolio Information
For the year ended June 30, 2010, the cost of purchases and proceeds from sales of securities, excluding short-term obligations, for the Fund were $246,239,116 and $121,673,796, respectively.
Note 7. Line of Credit
The Fund and other affiliated funds participate in a $280,000,000 committed, unsecured revolving line of credit provided by State Street. The maximum amount that may be borrowed by any fund is limited to the lesser of $200,000,000 and the Fund’s borrowing limit set forth in the Fund’s registration statement. Borrowings are available for short-term liquidity or temporary or emergency purposes.
Effective October 15, 2009, interest is charged to each participating fund based on the fund’s borrowings at a rate per annum equal to the greater of the Federal Funds Rate plus 1.25% or the overnight LIBOR Rate plus 1.25%. In addition, a commitment fee of 0.15% per annum is accrued and apportioned among the participating funds pro rata based on their relative net assets.
Prior to October 15, 2009, interest was charged to each participating fund based on the fund’s borrowings at a rate per annum equal to the greater of the Federal Funds Rate plus 0.50% or the overnight LIBOR Rate plus 0.50%. In addition, an annual operations agency fee of $20,000, an amendment fee of 0.02% and a commitment fee of 0.12% per annum were accrued and apportioned among the participating funds pro rata based on their relative net assets.
For the year ended June 30, 2010, the Fund did not borrow under these arrangements.
Note 8. Shareholder Concentration
As of June 30, 2010, one shareholder account owned 71.0% of the outstanding shares of the Fund. Purchase and redemption activity of this account may have a significant effect on the operations of the Fund.
Note 9. Significant Risks and Contingencies
Sector Focus Risk
The Fund may focus its investments in certain sectors, subjecting it to greater risk than a fund that is less focused.
High-Yield Securities Risk
Investing in high-yield securities may involve greater credit risk and considerations not typically associated with investing in U.S. Government bonds and other higher quality fixed income securities. These securities are non-investment grade securities, often referred to as “junk” bonds. Economic downturns may disrupt the high yield market and impair the ability of issuers to repay principal and interest. Also, an increase in interest rates would likely have an adverse impact on the value of such obligations. Moreover, high-yield securities may be less liquid to the extent that there is no established secondary market.
Geographic Concentration
The Fund had greater than 5% of its total net assets at June 30, 2010, invested in debt obligations issued by each of California (7.8%), Florida (10.6%), Illinois (6.3%), Michigan (5.8%) and Texas (7.6%) and their political subdivisions, agencies and public authorities. The Fund is more susceptible to economic and political factors adversely affecting issuers of these states’ or territories’ municipal securities than are municipal bond funds that are not concentrated to the same extent in these issuers.
Tax Development Risk
The Fund purchases municipal securities whose interest, in the opinion of bond counsel, is free from federal income tax. There is no assurance that the Internal Revenue Service (IRS) will agree with this opinion. In the event the IRS determines that an issuer does not comply with relevant tax requirements, interest payments from a security could become federally taxable, possibly retroactively to the date the security was issued. As a shareholder of the Fund, you may be required to file an amended tax return as a result.
43
Columbia High Yield Municipal Fund
June 30, 2010
Information Regarding Pending and Settled Legal Proceedings
In June 2004, an action captioned John E. Gallus et al. v. American Express Financial Corp. and American Express Financial Advisors Inc. was filed in the United States District Court for the District of Arizona. The plaintiffs allege that they are investors in several American Express Company (now known as RiverSource) mutual funds and they purport to bring the action derivatively on behalf of those funds under the Investment Company Act of 1940. The plaintiffs allege that fees allegedly paid to the defendants by the funds for investment advisory and administrative services are excessive. The plaintiffs seek remedies including restitution and rescission of investment advisory and distribution agreements. The plaintiffs voluntarily agreed to transfer this case to the United States District Court for the District of Minnesota (the District Court). In response to defendants’ motion to dismiss the complaint, the District Court dismissed one of plaintiffs’ four claims and granted plaintiffs limited discovery. Defendants moved for summary judgment in April 2007. Summary judgment was granted in the defendants’ favor on July 9, 2007. The plaintiffs filed a notice of appeal with the Eighth Circuit Court of Appeals (the Eighth Circuit) on August 8, 2007. On April 8, 2009, the Eighth Circuit reversed summary judgment and remanded to the District Court for further proceedings. On August 6, 2009, defendants filed a writ of certiorari with the U.S. Supreme Court (the Supreme Court), asking the Supreme Court to stay the District Court proceedings while the Supreme Court considers and rules in a case captioned Jones v. Harris Associates, which involves issues of law similar to those presented in the Gallus case. On March 30, 2010, the Supreme Court issued its ruling in Jones v. Harris Associates, and on April 5, 2010, the Supreme Court vacated the Eighth Circuit’s decision in the Gallus case and remanded the case to the Eighth Circuit for further consideration in light of the Supreme Court’s decision in Jones v. Harris Associates. On June 4, 2010, the Eighth Circuit remanded the Gallus case to the District Court for further consideration in light of the Supreme Court’s decision in Jones v. Harris Associates.
In December 2005, without admitting or denying the allegations, American Express Financial Corporation (AEFC, which is now known as Ameriprise Financial, Inc. (Ameriprise Financial)), entered into settlement agreements with the Securities and Exchange Commission (SEC) and Minnesota Department of Commerce (MDOC) related to market timing activities. As a result, AEFC was censured and ordered to cease and desist from committing or causing any violations of certain provisions of the Investment Advisers Act of 1940, the Investment Company Act of 1940, and various Minnesota laws. AEFC agreed to pay disgorgement of $10 million and civil money penalties of $7 million. AEFC also agreed to retain an independent distribution consultant to assist in developing a plan for distribution of all disgorgement and civil penalties ordered by the SEC in accordance with various undertakings detailed at http://www.sec.gov/litigation/admin/ia-2451.pdf. Ameriprise Financial and its affiliates have cooperated with the SEC and the MDOC in these legal proceedings, and have made regular reports to the RiverSource, Seligman and Threadneedle funds’ Boards of Directors/Trustees.
Ameriprise Financial and certain of its affiliates have historically been involved in a number of legal, arbitration and regulatory proceedings, including routine litigation, class actions, and governmental actions, concerning matters arising in connection with the conduct of their business activities. Ameriprise Financial believes that the Funds are not currently the subject of, and that neither Ameriprise Financial nor any of its affiliates are the subject of, any pending legal, arbitration or regulatory proceedings that are likely to have a material adverse effect on the Funds or the ability of Ameriprise Financial or its affiliates to perform under their contracts with the Funds. Ameriprise Financial is required to make 10-Q, 10-K and, as necessary, 8-K filings with the Securities and Exchange Commission on legal and regulatory matters that relate to Ameriprise Financial and its affiliates. Copies of these filings may be obtained by accessing the SEC website at www.sec.gov.
There can be no assurance that these matters, or the adverse publicity associated with them, will not result in increased fund redemptions, reduced sale of fund shares or other adverse consequences to the Funds. Further, although we believe proceedings are not likely to have a material adverse effect on the Funds or the ability of Ameriprise Financial or its affiliates to perform under their contracts with the Funds, these proceedings are subject to uncertainties and, as such, we are unable to estimate the possible loss or range of loss that may result. An adverse outcome in one or more of these proceedings could result in adverse judgments, settlements, fines, penalties or other relief that could have a material adverse effect on the consolidated financial condition or results of operations of Ameriprise Financial.
44
Report of Independent Registered Public Accounting Firm
To the Trustees of Columbia Funds Series Trust I and the Shareholders of Columbia High Yield Municipal Fund
In our opinion, the accompanying statement of assets and liabilities, including the investment portfolio, and the related statements of operations and of changes in net assets and the financial highlights present fairly, in all material respects, the financial position of Columbia High Yield Municipal Fund (the “Fund”)(a series of Columbia Funds Series Trust I) at June 30, 2010, the results of its operations for the year then ended, the changes in its net assets for each of the two years in the period then ended and the financial highlights for each of the five years in the period then ended, in conformity with accounting principles generally accepted in the United States of America. These financial statements and financial highlights (hereafter referred to as “financial statements”) are the responsibility of the Fund’s management. Our responsibility is to express an opinion on these financial statements based on our audits. We conducted our audits of these financial statements in accordance with the standards of the Public Company Accounting Oversight Board (United States). Those standards require that we plan and perform the audit to obtain reasonable assurance about whether the financial statements are free of material misstatement. An audit includes examining, on a test basis, evidence supporting the amounts and disclosures in the financial statements, assessing the accounting principles used and significant estimates made by management, and evaluating the overall financial statement presentation. We believe that our audits, which included confirmation of securities at June 30, 2010 by correspondence with the custodian and brokers, provide a reasonable basis for our opinion.
PricewaterhouseCoopers LLP
Boston, Massachusetts
August 23, 2010
45
Federal Income Tax Information (Unaudited) – Columbia High Yield Municipal Fund
For the fiscal year ended June 30, 2010, 99.93% of the distributions from net investments income of the Fund qualified as exempt interest dividends for federal income tax purposes. A portion of income may be subject to federal alternative minimum tax.
The Fund will notify shareholders in January 2011 of amounts for use in preparing 2010 income tax returns.
46
Fund Governance
The Trustees serve terms of indefinite duration. The names, addresses and birth years of the Trustees and Officers of the Funds of Columbia Funds Series Trust I, the year each was first elected or appointed to office, their principal business occupations during at least the last five years, the number of Funds overseen by each Trustee and other directorships they hold are shown below. Each officer listed below serves as an officer of each Fund in the Columbia Funds Complex.
Independent Trustees
| | |
Name, Address and Year of Birth,
Position with Funds, Year First
Elected or Appointed to Office | | Principal Occupation(s) During Past Five Years, Number of Funds in the
Columbia Funds Complex Overseen by Trustee, Other Directorships Held |
| |
| John D. Collins (Born 1938) | | |
c/o Columbia Management Investment Advisers, LLC One Financial Center Boston, MA 02111 Trustee (since 2005) | | Retired. Consultant, KPMG, LLP (accounting and tax firm) from July 1999 to June 2000; Partner, KPMG, LLP from March 1962 to June 1999. Oversees 64; Mrs. Fields Famous Brands LLC (consumer products); Suburban Propane Partners, L.P.; and Montpelier Re (insurance underwriting firm) |
| |
| Rodman L. Drake (Born 1943) | | |
c/o Columbia Management Investment Advisers, LLC One Financial Center Boston, MA 02111 Trustee (since 1994) and Chairman of the Board (since 2009) | | Co-Founder of Baringo Capital LLC (private equity) since 2002; CEO of Crystal River Capital, Inc. (real estate investment trust) since 2003; President, Continuation Investments Group, Inc. from 1997 to 2001. Oversees 64; Jackson Hewitt Tax Service Inc. (tax preparation services); Crystal Capital River Inc. (real estate investment trust); Student Loan Corporation (student loan provider); Celgene Corporation (global biotechnology company); and The Helios Funds (exchange-traded funds) |
| |
| Douglas A. Hacker (Born 1955) | | |
c/o Columbia Management Investment Advisers, LLC One Financial Center Boston, MA 02111 Trustee (since 1996) | | Independent business executive since May 2006; Executive Vice President–Strategy of United Airlines (airline) from December 2002 to May 2006; President of UAL Loyalty Services (airline marketing company) from September 2001 to December 2002; Executive Vice President and Chief Financial Officer of United Airlines from July 1999 to September 2001. Oversees 64; Nash Finch Company (food distributor); Aircastle Limited (aircraft leasing) |
|
| Janet Langford Kelly (Born 1957) |
c/o Columbia Management Investment Advisers, LLC One Financial Center Boston, MA 02111 Trustee (since 1996) | | Senior Vice President, General Counsel and Corporate Secretary, ConocoPhillips (integrated energy company) since September 2007; Deputy General Counsel–Corporate Legal Services, ConocoPhillips from August 2006 to August 2007; Partner, Zelle, Hofmann, Voelbel, Mason & Gette LLP (law firm) from March 2005 to July 2006; Adjunct Professor of Law, Northwestern University, from September 2004 to June 2006; Director, UAL Corporation (airline) from February 2006 to July 2006; Oversees 64; None |
| |
| Charles R. Nelson (Born 1942) | | |
c/o Columbia Management Investment Advisers, LLC One Financial Center Boston, MA 02111 Trustee (since 1981) | | Professor of Economics, University of Washington, since January 1976; Ford and Louisa Van Voorhis Professor of Political Economy, University of Washington, since September 1993; Adjunct Professor of Statistics, University of Washington, since September 1980; Associate Editor, Journal of Money Credit and Banking, 1993-2008; Consultant on econometric and statistical matters. Oversees 64; None |
47
Fund Governance (continued)
Independent Trustees (continued)
| | |
Name, Address and Year of Birth,
Position with Funds, Year First
Elected or Appointed to Office | | Principal Occupation(s) During Past Five Years, Number of Funds in the
Columbia Funds Complex Overseen by Trustee, Other Directorships Held |
| |
| John J. Neuhauser (Born 1943) | | |
c/o Columbia Management Investment Advisers, LLC One Financial Center Boston, MA 02111 Trustee (since 1984) | | President, Saint Michael’s College, since August 2007; University Professor, Boston College from November 2005 to August 2007; Academic Vice President and Dean of Faculties, Boston College from August 1999 to October 2005. Oversees 64; Liberty All-Star Equity Fund and Liberty All-Star Growth Fund, Inc. (closed-end funds) |
| |
| Jonathan Piel (Born 1938) | | |
c/o Columbia Management Investment Advisers, LLC One Financial Center Boston, MA 02111 Trustee (since 1994) | | Cable television producer and website designer; The Editor, Scientific American from 1984 to 1994; Vice President, Scientific American, Inc., from 1984 to 1994; Member, Advisory Board, Stone Age Institute, Bloomington, Indiana (research institute that explores the effect of technology on human evolution); Member, Board of Directors of the National Institute of Social Sciences, New York City; Member, Board of Trustees of the William Alanson White Institute, New York City (institution for training psychoanalysts); and Member, Advisory Board, Mount Sinai Children’s Environmental Health Center, New York. Oversees 64; None |
| |
| Patrick J. Simpson (Born 1944) | | |
c/o Columbia Management Investment Advisers, LLC One Financial Center Boston, MA 02111 Trustee (since 2000) | | Partner, Perkins Coie LLP (law firm). Oversees 64; None |
| |
| Anne-Lee Verville (Born 1945) | | |
c/o Columbia Management Investment Advisers, LLC One Financial Center Boston, MA 02111 Trustee (since 1998) | | Retired since 1997 (formerly General Manager–Global Education Industry (from 1994 to 1997), President–Application Systems Division (from 1991 to 1994), Chief Financial Officer–US Marketing & Services (from 1988 to 1991), and Chief Information Officer (from 1987 to 1988), IBM Corporation (computer and technology)). Oversees 64; None |
48
Fund Governance (continued)
Interested Trustee
| | |
Name, Address and Year of Birth,
Position with Funds, Year First
Elected or Appointed to Office | | Principal Occupation(s) During Past Five Years, Number of Funds in the
Columbia Funds Complex Overseen by Trustee, Other Directorships Held |
| |
| William E. Mayer1 (Born 1940) | | |
c/o Columbia Management Investment Advisers, LLC One Financial Center Boston, MA 02111 Trustee (since 1994) | | Partner, Park Avenue Equity Partners (private equity) since February 1999; Dean and Professor, College of Business, University of Maryland from 1992 to 1997. Oversees 64; Lee Enterprises (print media), WR Hambrecht + Co. (financial service provider); BlackRock Kelso Capital Corporation (investment company) |
| 1 | Mr. Mayer may technically be an “interested person” (as defined in the Investment Company Act of 1940) by reason of his affiliation with WR Hambrecht + Co., a registered broker/dealer that may execute portfolio transactions for, engage in principal transactions with or distribute shares of a Fund or other funds or accounts advised/managed by the Advisor or any sub-advisor to a Fund. |
The Statement of Additional Information includes additional information about the Trustees of the Funds and is available, without charge, upon request by calling 1-800-345-6611.
49
Fund Governance (continued)
Officers
| | |
| Name, Year of Birth and Address | | Principal Occupation(s) During the Past Five Years |
| |
| J. Kevin Connaughton (Born 1964) | | |
One Financial Center Boston, MA 02111 President (since 2009) | | Senior Vice President and General Manager–Mutual Fund Products, Columbia Management Investment Advisers, LLC since May 2010; President, Columbia Funds, since 2009, and RiverSource Funds, since May 2010 (previously Senior Vice President and Chief Financial Officer, Columbia Funds, from June 2008 to January 2009, Treasurer, Columbia Funds, from October 2003 to May 2008, and senior officer of various other affiliated funds since 2000); Managing Director, Columbia Management Advisors, LLC from December 2004 to April 2010. |
| |
| Michael G. Clarke (Born 1969) | | |
One Financial Center Boston, MA 02111 Senior Vice President and Chief Financial Officer (since 2009) | | Vice President, Columbia Management Investment Advisers, LLC since May 2010; Managing Director of Fund Administration, Columbia Management Advisors, LLC, from September 2004 to April 2010; senior officer of Columbia Funds and affiliated funds since 2002. |
| |
| Scott R. Plummer (Born 1959) | | |
5228 Ameriprise Financial Center Minneapolis, MN 55474 Senior Vice President, Secretary and Chief Legal Officer (since 2010) | | Chief Legal Officer and Assistant Secretary, Columbia Management Investment Advisers, LLC since June 2005; Vice President and Lead Chief Counsel–Asset Management, Ameriprise Financial, Inc. since May 2010 (previously Vice President and Chief Counsel–Asset Management, from 2005 to April 2010, and Vice President–Asset Management Compliance from 2004 to 2005); Vice President, Chief Counsel and Assistant Secretary, Columbia Management Investment Distributors, Inc. since 2008; Vice President, General Counsel and Secretary, Ameriprise Certificate Company since 2005; Chief Counsel, RiverSource Distributors, Inc. since 2006; Vice President, General Counsel and Secretary, RiverSource Funds, since December 2006; Senior Vice President, Secretary and Chief Legal Officer, Columbia Funds, since May 2010. |
| |
| Linda J. Wondrack (Born 1964) | | |
One Financial Center Boston, MA 02111 Senior Vice President and Chief Compliance Officer (since 2007) | | Vice President and Chief Compliance Officer, Columbia Management Investment Advisers, LLC since May 2010; Chief Compliance Officer, Columbia Funds, since 2007, and RiverSource Funds, since May 2010; Director (Columbia Management Group, LLC and Investment Product Group Compliance), Bank of America, from June 2005 to April 2010; Director of Corporate Compliance and Conflicts Officer of MFS Investment Management (investment management) from August 2004 to May 2005. |
| |
| William F. Truscott (Born 1960) | | |
53600 Ameriprise Financial Center Minneapolis, MN 55474 Senior Vice President (since 2010) | | Chairman of the Board, Columbia Management Investment Advisers, LLC since May 2010 (previously President, Chairman of the Board and Chief Investment Officer, from 2001 to April 2010); Chief Executive Officer, U.S. Asset Management & President, Annuities, Ameriprise Financial, Inc. since May 2010 (previously President–U.S. Asset Management and Chief Investment Officer from 2005 to April 2010, and Senior Vice President–Chief Investment Officer, from 2001 to 2005); Director, President and Chief Executive Officer, Ameriprise Certificate Company since 2006; Director, Columbia Management Investment Distributors, Inc. since May 2010 (previously Chairman of the Board and Chief Executive Officer from 2008 to April 2010); Chairman of the Board and Chief Executive Officer, RiverSource Distributors, Inc. since 2006. |
50
Fund Governance (continued)
Officers (continued)
| | |
| Name, Year of Birth and Address | | Principal Occupation(s) During the Past Five Years |
|
| Colin Moore (Born 1958) |
One Financial Center Boston, MA 02111 Senior Vice President (since 2010) | | Director and Chief Investment Officer, Columbia Management Investment Advisers, LLC since May 2010; Manager, Managing Director and Chief Investment Officer of Columbia Management Advisors, LLC from 2007 to April 2010; Head of Equities, Columbia Management Advisors, LLC from 2002 to 2007. |
| |
| Michael A. Jones (Born 1959) | | |
100 Federal Street Boston, MA 02110 Senior Vice President (since 2010) | | Director and President, Columbia Management Investment Advisers, LLC since May 2010; President and Director, Columbia Management Investment Distributors, Inc. since May 2010; Manager, Chairman, Chief Executive Officer and President, Columbia Management Advisors, LLC from 2007 to April 2010; Chief Executive Officer, President and Director, Columbia Management Distributors, Inc. from November 2006 to April 2010; previously, co-president and senior managing director at Robeco Investment Management. |
| |
| Amy Johnson (Born 1965) | | |
5228 Ameriprise Financial Center Minneapolis, MN 55474 Senior Vice President (since 2010) | | Senior Vice President and Chief Operating Officer, Columbia Management Investment Advisers, LLC since May 2010 (previously Chief Administrative Officer, from 2009 until April 2010, Vice President–Asset Management and Trust Company Services, from 2006 to 2009, and Vice President–Operations and Compliance from 2004 to 2006). |
| |
| Joseph F. DiMaria (Born 1968) | | |
One Financial Center Boston, MA 02111 Treasurer (since 2009) and Chief Accounting Officer (since 2008) | | Vice President, Mutual Fund Administration, Columbia Management Investment Advisers, LLC, since May 2010; Director of Fund Administration, Columbia Management Advisors, LLC from January 2006 to April 2010; Head of Tax/Compliance and Assistant Treasurer, Columbia Management Advisors, LLC, from November 2004 to December 2005. |
| |
| Marybeth Pilat (Born 1968) | | |
One Financial Center Boston, MA 02111 Deputy Treasurer (since 2010) | | Vice President, Mutual Fund Administration, Columbia Management Investment Advisers, LLC, since May 2010; Vice President, Investment Operations, Bank of America, from October 2008 to April 2010; Finance Manager, Boston Children’s Hospital from August 2008 to October 2008; Director, Mutual Fund Administration, Columbia Management Advisors, LLC, from May 2007 to July 2008; Vice President, Mutual Fund Valuation, Columbia Management Advisors, LLC, from January 2006 to May 2007; Vice President, Mutual Fund Accounting Oversight, Columbia Management Advisors, LLC from January 2005 to January 2006. |
| |
| Julian Quero (Born 1967) | | |
One Financial Center Boston, MA 02111 Deputy Treasurer (since 2008) | | Vice President, Mutual Fund Administration, Columbia Management Investment Advisers, LLC since May 2010; Director of Fund Administration, Columbia Management Advisors, LLC, from August 2008 to April 2010; Senior Tax Manager, Columbia Management Advisors, LLC from August 2006 to July 2008; Senior Compliance Manager, Columbia Management Advisors, LLC from April 2002 to August 2006. |
| |
| Stephen T. Welsh (Born 1957) | | |
One Financial Center Boston, MA 02111 Vice President (since 2006) | | President and Director, Columbia Management Investment Services Corp. since May 2010; President and Director, Columbia Management Services, Inc. from July 2004 to April 2010; Managing Director, Columbia Management Distributors, Inc. from August 2007 to April 2010. |
51
-
Board Consideration and Approval of Advisory Agreements
The Board unanimously approved the Advisory Agreements at a meeting held on December 17, 2009. These agreements were approved by shareholders on March 3, 2010, and took effect upon the closing of the acquisition of the long-term asset management business of Columbia by Ameriprise Financial, Inc. (“Ameriprise”) (the “Transaction”).
The Advisory Fees and Expenses Committee (the “Committee”) of the Board met on multiple occasions to review the investment management services agreements (the “Advisory Agreements”) for the funds for which the Trustees serve as trustees (each a “Fund,” and collectively, the “Funds”). On December 14, 2009, the Committee recommended that the full Board approve the Advisory Agreements. On December 17, 2009, the full Board, including a majority of the Trustees who have no direct or indirect interest in the Advisory Agreements and who are not “interested persons” (as defined in the 1940 Act) of the Trust (the “Independent Trustees”), approved the Advisory Agreement with Columbia Management Investment Advisers, LLC (formerly, RiverSource Investments, LLC) (“CMIA”) for each Fund. Prior to their approval of the Advisory Agreements, the Committee and the Independent Trustees requested and evaluated materials from, and were provided materials and information about the Transaction and matters related to the proposals by, BOA, Columbia, CMIA and Ameriprise. In connection with their most recent approval of the Funds’ previous advisory agreements (the “Former Advisory Agreements”) on October 28, 2009, the Committee and the Trustees requested and evaluated materials from Columbia, and discussed such materials with representatives of Columbia. The Committee, at meetings held on August 11, 2009, September 23, 2009, October 27, 2009, November 30, 2009, December 7, 2009 and December 14, 2009, and the Independent Trustees, at meetings held on August 12, 2009, August 20, 2009, October 28, 2009, December 8, 2009, December 14, 2009 and December 17, 2009, discussed the materials provided in connection with the October 28, 2009 approvals and the materials provided in connection with their consideration of the Advisory Agreements and other matters relating to the Transaction with representatives of BOA, Columbia, CMIA and Ameriprise. The Trustees consulted with experienced legal counsel, who advised on the legal standards for consideration by the Trustees. The Independent Trustees also discussed the proposed approvals with independent legal counsel in private sessions.
The Trustees reviewed each Advisory Agreement, as well as certain information obtained through CMIA’s responses to initial and supplemental questionnaires prepared at the request of the Trustees by counsel to the Funds and independent legal counsel to the Independent Trustees. The Committee and the Trustees also met with, and reviewed and considered a report prepared and provided by, the independent fee consultant (the “Fee Consultant”) appointed by the Independent Trustees pursuant to an assurance of discontinuance entered into by Columbia with the New York Attorney General (“NYAG”) to settle a civil complaint filed by the NYAG relating to trading in mutual fund shares (the “NYAG Settlement”). Under the NYAG Settlement, the Fee Consultant’s role is to manage the process by which management fees are negotiated so that they are negotiated in a manner that is at arms’ length and reasonable.
The Trustees considered all materials that they, their legal counsel or CMIA believed reasonably necessary to evaluate and to determine whether to approve the Advisory Agreements. In their deliberations, the Trustees did not identify any particular information that was all-important or controlling, and individual Trustees may have attributed different weights to the various factors. The material factors that formed the basis for the Trustees’ approvals included the factors set forth below:
| (i) | the reputation, financial strength, regulatory histories and resources of CMIA and its parent, Ameriprise; |
| (ii) | the capabilities of CMIA with respect to compliance, including an assessment of CMIA’s compliance system by the Funds’ Chief Compliance Officer; |
| (iii) | the qualifications of the personnel of CMIA that would be expected to provide advisory services to each Fund, including CMIA’s representations that the Chief Investment Officer of Columbia would serve as the Chief Investment Officer of CMIA, and that the process for determining the portfolio management team for each Fund would be substantially the same process as has customarily been followed by Columbia, and reported to the Trustees, in evaluating the performance of Columbia’s portfolio management teams; |
| (iv) | the terms and conditions of the Advisory Agreements, including the differences between the Advisory Agreements and Former Advisory Agreements in connection with CMIA’s efforts to standardize such |
52
| | agreements across the Columbia Fund complex and the legacy RiverSource fund complex; |
| (v) | the terms and conditions of other agreements and arrangements relating to the future operations of the Funds, including an administrative services agreement and the Master Services and Distribution Agreement; |
| (vi) | the commitment of CMIA and Ameriprise that there would not be any diminution in the nature, quality and extent of services provided to each Fund or its shareholders following closing of the Transaction; |
| (vii) | that the Trustees recently had completed a full annual review of the Former Advisory Agreements, as required by the 1940 Act, for each Fund and had determined that they were satisfied with the nature, extent and quality of services provided thereunder and that the management fee rate for each Fund were sufficient to warrant their approval; |
| (viii) | that the advisory fee rates payable by each Fund would not change; |
| (ix) | that CMIA and BOA, and not any Fund, would bear the costs of obtaining approvals of the Advisory Agreements; |
| (x) | that Ameriprise and CMIA had agreed to exercise reasonable best efforts to assure that, for a period of two years after the Closing, there would not be imposed on any Fund any “unfair burden” (within the meaning of Section 15(f) of 1940 Act) with respect to the Transaction; and |
| (xi) | that certain members of CMIA’s management had a significant amount of experience integrating other fund families; that certain current Columbia personnel that would be integrated into CMIA and its affiliates as a result of the Transaction also had experience in integrating fund families; and that the senior management of CMIA following the Transaction would include certain senior executives of Columbia who were, at that time, responsible for oversight of services provided to the Funds. |
Nature, Extent and Quality of Services to be Provided. The Trustees considered the expected nature, extent and quality of services to be provided to the Funds by CMIA and its affiliates and the resources to be dedicated to the Funds by CMIA and its affiliates. The Trustees considered, among other things, the expected effect of the Transaction on the operations of the Funds, the information provided by CMIA with respect to the nature, extent and quality of services to be provided by it, CMIA’s compliance programs and compliance records, the ability of CMIA (including personnel and other resources, compensation programs for personnel involved in fund management, reputation and other attributes) to attract, motivate and retain highly qualified research, advisory and supervisory investment professionals, the trade execution services to be provided on behalf of the Funds and the quality of CMIA’s investment research capabilities and the other resources that it indicated it would devote to each Fund. As noted above, the Trustees also considered CMIA’s representations that the Chief Investment Officer of Columbia would serve as the Chief Investment Officer of CMIA following the Transaction, and that the process for determining the portfolio management team for each Fund would be substantially the same process as has customarily been followed by Columbia, and reported to the Trustees, in evaluating the performance of Columbia’s portfolio management teams.
The Trustees noted the professional experience and qualifications of the senior personnel of CMIA. The Trustees also considered the compliance programs of and the compliance-related resources proposed to be provided to the Funds by CMIA and its affiliates, including discussions with the Funds’ Chief Compliance Officer regarding CMIA’s compliance program. The Trustees also discussed CMIA’s compliance program with the Chief Compliance Officer for the legacy RiverSource funds. The Trustees also considered CMIA’s representation that the Funds’ Chief Compliance Officer would serve as the Chief Compliance Officer of CMIA following the Transaction. The Trustees considered CMIA’s ability to provide administrative services to the Funds, noting that while some Former Advisory Agreements contemplated the provision of certain administrative services, following the Transaction, all administrative services were anticipated to be provided pursuant to a new administrative services agreement. The Trustees also considered CMIA’s ability to coordinate the activities of each Fund’s other service providers. The Trustees considered performance information provided by CMIA with respect to other mutual funds advised by CMIA, and discussed with senior executives of CMIA its process for identifying which portfolio management teams of
53
the legacy Columbia and legacy CMIA organizations would be responsible for the management of the Funds following the Transaction. After reviewing these and related factors, the Trustees concluded, within the context of their overall conclusions, that the expected nature, extent and quality of the services to be provided to each Fund under the Advisory Agreements supported the approval of such agreements.
Investment Advisory Fee Rates and Other Expenses. The Trustees considered the fact that the advisory fee rates payable by each Fund to CMIA under the Advisory Agreements were the same as those that were paid by each Fund to Columbia under the Former Advisory Agreements. The Trustees noted that in connection with their October 28, 2009 approval of the Former Advisory Agreements, they had concluded, within the context of their overall conclusions regarding each such agreement, that the advisory fees charged to each Fund supported the continuation of the agreement(s) pertaining to that Fund.
The Trustees noted that in certain cases the effective advisory fee rate for a legacy RiverSource fund was lower than the proposed investment advisory fee rate for a Fund with generally similar investment objectives and strategies. The Trustees also noted that CMIA’s investment advisory fee rates for equity and balanced funds generally are subject to adjustments based on investment performance, whereas the proposed investment advisory fee rates for the Funds, consistent with those in the Former Advisory Agreements, do not reflect performance adjustments. The Trustees considered existing advisory fee breakpoints and CMIA’s undertaking not to change expense caps previously implemented by Columbia with respect to the Funds without further discussion with the Independent Trustees.
The Trustees received and considered information about the advisory fees charged by CMIA to institutional accounts. In considering the fees charged to those accounts, the Trustees took into account, among other things, CMIA’s representations about the differences between managing mutual funds as compared to other types of accounts, including differences in the services provided, differences in the risk profile of such business for CMIA and the additional resources required to manage mutual funds effectively. In evaluating each Fund’s advisory fees, the Trustees also took into account the demands, complexity and quality of the investment management of the Fund.
The Trustees also considered that for certain Funds, certain administrative services that were provided under the Former Advisory Agreements would not be provided under the Advisory Agreements, but under a separate administrative services agreement. The Trustees noted that, unlike fees under an advisory agreement, fees under the administrative services agreement could be changed without shareholder approval, although CMIA had not proposed any increase in such administrative fees and any such increase would require Board approval. The Trustees also noted Ameriprise’s and CMIA’s covenants regarding compliance with Section 15(f) of the 1940 Act.
After reviewing these and related factors, the Trustees concluded, within the context of their overall conclusions, that the expected advisory fee rates and expenses of each Fund supported the approval of the Advisory Agreements.
Costs of Services to be Provided and Profitability. The Trustees noted that in connection with their October 28, 2009 approval of the Former Advisory Agreements, they had concluded, within the context of their overall conclusions regarding each such agreement, that profitability to Columbia and its affiliates of their relationships with each Fund supported the continuation of the agreement(s) pertaining to that Fund. In connection with the integration of the legacy Columbia and legacy CMIA organizations, the Trustees considered, among other things, CMIA’s projected annual net expense synergies (reductions in the cost of providing services to the Funds), the timetable over which such synergies are expected to be realized and the extent to which any such synergies are expected to be shared with the Funds. The Trustees also considered information provided by CMIA regarding their respective financial conditions. The Trustees considered that CMIA proposed to continue voluntary expense caps currently in effect for the Funds and that CMIA had undertaken not to change these caps without further discussion with the Independent Trustees. After reviewing these and related factors, the Trustees concluded, within the context of their overall conclusions, that the expected profitability to CMIA and its affiliates from its relationship with each Fund supported the approval of the Advisory Agreements.
Economies of Scale. The Trustees considered the existence of any anticipated economies of scale in the provision by CMIA of services to each Fund, to groups of related Funds
54
and to CMIA’s investment advisory clients as a whole, and whether those economies of scale were expected to be shared with the Funds. The Trustees considered Ameriprise’s anticipated net expense synergies resulting from the Transaction, and considered the possibility that the Funds might benefit from economies of scale over time as part of the larger, combined fund complex. The Trustees considered how expected synergies and potential economies of scale might benefit the Funds and their shareholders. The Trustees considered the potential impact of the Transaction on the distribution of the Funds, and noted that the proposed management fee schedules for the Funds generally contained breakpoints that would reduce the fee rate on assets above specified threshold levels. After reviewing these and related factors, the Trustees concluded, within the context of their overall conclusions, that the extent to which economies of scale were expected to be shared with the Funds supported the approval of the Advisory Agreements.
Other Benefits to CMIA. The Trustees received and considered information regarding any expected “fall-out” or ancillary benefits to be received by CMIA and its affiliates as a result of their relationships with the Funds, such as the engagement of CMIA to provide administrative services to the Funds and the engagement of CMIA’s affiliates to provide distribution and transfer agency services to the Funds. The Trustees considered that the Funds’ distributor, which would be an affiliate of CMIA, retains a portion of the distribution fees from the Funds and receives a portion of the sales charges on sales or redemptions of certain classes of shares of the Funds. The Trustees also considered the benefits of research made available to CMIA by reason of brokerage commissions generated by the Funds’ securities transactions, and reviewed information about CMIA’s practices with respect to allocating portfolio brokerage for brokerage and research services. The Trustees considered the possible conflicts of interest associated with certain fall-out or other ancillary benefits and the reporting, disclosure and other processes that would be in place to disclose and to monitor such possible conflicts of interest. The Trustees recognized that CMIA’s profitability would be somewhat lower without these benefits.
Conclusion. Based on their evaluation of all factors that they deemed to be material, including those factors described above, and assisted by the advice of independent legal counsel and the Fee Consultant, the Trustees, including the Independent Trustees, approved, and recommended that Fund shareholders approve, each Advisory Agreement.
55
Summary of Management Fee Evaluation by Independent Fee Consultant (RiverSource Investments, LLC)
EXCERPTS FROM REPORT OF INDEPENDENT FEE CONSULTANT TO THE FUNDS SUPERVISED BY THE COLUMBIA ATLANTIC BOARD
Prepared Pursuant to the February 9, 2005 Assurance of Discontinuance among the Office of Attorney General of New York State, Columbia Management Advisors, LLC, and Columbia Management Distributors, Inc. December 21, 2009
I. Overview
On February 9, 2005, Columbia Management Advisors, LLC (“CMA”) and Columbia Management Distributors, Inc.1 (“CMD”) agreed to the New York Attorney General’s Assurance of Discontinuance (“AOD”). Among other things, the AOD stipulates that CMA may manage or advise a Columbia Fund (“Columbia Fund” and, together with some or all of such funds, the “Columbia Funds”) only if the Independent Members of the Columbia Fund’s Board of Trustees appoint a Senior Officer or retain an Independent Fee Consultant (“IFC”) who is to manage the process by which proposed management fees are negotiated. The AOD further stipulates that the Senior Officer or IFC is to prepare a written annual evaluation of the fee negotiation process.
With effect from January 1, 2007, the Independent Members of the Board of Trustees for certain Columbia Funds known collectively as the “Atlantic Funds” (together with the other members of that Board, the “Trustees”) retained me as IFC for the Atlantic Funds.2 In this capacity, I have prepared this written evaluation of the fee negotiation process. As was the case with the last three annual reports, my immediate predecessor as IFC, John Rea, provided invaluable assistance in the preparation of this report.
On September 29, 2009, Ameriprise entered into an asset purchase agreement with Bank of America, N.A. and its parent, Bank of America Corporation (together, the “Bank”) pursuant to which the Bank agreed to sell certain CMG assets relating to Columbia’s long-term asset management business, including management of the Atlantic Funds (the “Transaction”).3 The Transaction if completed would result in the termination of the existing Investment Management Agreements with CMA. Therefore, the Trustees have been requested to approve and recommend to the shareholders of each Atlantic Fund new Investment Management and Sub-Advisory Agreements (together, the “Management Agreements”) with RiverSource Investments, LLC (“RI”),4 investment manager of the RiverSource Funds and a subsidiary of Ameriprise. This report is intended to fulfill the requirements of the AOD with respect to the Trustees’ consideration of the new Management Agreements.
A. Role of the Independent Fee Consultant
The AOD charges the IFC with “managing the process by which proposed management fees … to be charged the Columbia Fund are negotiated so that they are negotiated in a manner which is at arms’ length and reasonable and consistent with this Assurance of Discontinuance.” The AOD also provides that CMA “may manage or advise a Columbia Fund only if the reasonableness of the proposed management fees is determined by the Board of Trustees … using … an annual independent written evaluation prepared by or under the direction of … the Independent Fee Consultant.” Therefore, the AOD makes clear that the IFC does not supplant the Trustees in negotiating management fees with CMA (or RI), nor does the IFC substitute his or her judgment for that of the Trustees with respect to the reasonableness of proposed fees or any other matter that is committed to the business judgment of the Trustees.
| 1 | CMA and CMD are subsidiaries of Columbia Management Group, LLC (“CMG”), and are the successors to the entities named in the AOD. |
| 2 | I have no material relationship with Bank of America, CMG or Ameriprise Financial, Inc. (“Ameriprise”), aside from serving as IFC, and I am aware of no material relationship with any of their affiliates. I retained John Rea, an independent economic consultant, to assist me with this report. |
| | Unless otherwise stated or required by the context, this report covers only the Atlantic Funds. |
| 3 | Preliminary Response of Ameriprise to Information Request of Columbia Atlantic Board dated October 21, 2009 (hereafter, the “Preliminary Response”), p. 1. The one money market Atlantic Fund, Money Market Fund VS, was included in the Transaction because it was an integral part of CMG's array of Funds used as investment vehicles by variable annuity and similar insurance products. |
| 4 | Ameriprise intends to re-brand RI with the “Columbia” name (which is one of the assets being sold in the Transaction). Preliminary Response, pp. 4-5. In the case of new Sub-Advisory Agreements, the current sub-adviser would also be a party. |
56
B. Elements Involved in Managing the Fee Negotiation Process
In preparing the report required by the AOD, the IFC must consider at least the following six factors set forth in the AOD:
| 1. | The nature and quality of the adviser’s services, including the Fund’s performance; |
| 2. | Management fees (including any components thereof) charged by other mutual fund companies for like services; |
| 3. | Possible economies of scale as the Fund grows larger; |
| 4. | Management fees (including any components thereof) charged to institutional and other clients of the adviser for like services; |
| 5. | Costs to the adviser and its affiliates of supplying services pursuant to the management fee agreements, excluding any intra-corporate profit; and |
| 6. | Profit margins of the adviser and its affiliates from supplying such services. |
C. Data Presented to the Trustees
In considering the proposed new Management Agreements with RI, the Trustees relied in part on the data that had been prepared as part of their annual contract review process, which concluded in late October. This data remained relevant because the fees in the proposed Management Agreements were identical to the fees approved at that time. The annual review materials included a Lipper report on the performance of each Atlantic Fund compared to its peers and its benchmark, comparisons of the fees and expenses of each Atlantic Fund to similar CMG-sponsored Funds, comparable competitive funds chosen by Lipper, and institutional accounts advised by CMA, revenues, expenses, and profits of CMG from managing the Atlantic Funds, calculated both by Fund and collectively, and CMG’s views on the existence and sharing of economies of scale.
In addition, the Trustees reviewed materials specific to the proposed new Management Agreements with RI in response to requests for information made on behalf of the Trustees, including the following:
| n | | Performance data for the RiverSource Funds showing percentile and quartile rankings of each fund within its Lipper performance universe for periods up to five years and net returns of each fund relative to its benchmark returns. This data was arguably relevant due to the possibility that some RiverSource investment teams would be providing investment management services to certain Columbia Funds. 5 |
| n | | tables comparing the fee schedules and effective fee rates of funds managed by CMA and RI and institutional accounts advised by the two firms. |
| n | | extensive discussion of the process by which the various components of the two asset management businesses would be integrated including investment management, compliance, transfer agency, custody, fund accounting, and distribution. |
| n | | information about the financial condition of Ameriprise, including its most recent annual report on Form 10-K, RI’s profit margins from managing the RiverSource Funds in 2007 and 2008, and pro forma income statements for the combined Columbia and RiverSource fund complex. |
| n | | disclosure that certain senior CMG executives, including President Michael Jones, Chief Investment Officer Colin Moore, Head of Mutual Funds J. Kevin Connaughton, and Chief Compliance Officer Linda Wondrack would continue in analogous capacities following the consummation of the Transaction, and |
| n | | a breakdown of the synergies RI expects to realize in the two years following the Transaction and the extent to which those potential synergies are expected to be shared with shareholders of funds advised by RI. |
| 5 | On page 20 of its Supplemental Response to the Atlantic Trustees (undated but delivered November 24, 2009), Ameriprise said that “most personnel decisions, including with respect to the portfolio management teams for the Atlantic Funds . . . will be made primarily by [current CMA CIO] Colin Moore using the Columbia 5P process.” |
57
II. Findings
| 1. | Based upon my examination of the information supplied by CMG and Ameriprise in the light of the six factors set forth in the AOD, I conclude that the Trustees have the relevant information necessary to evaluate the reasonableness of the proposed management fees for each Atlantic Fund. |
| 2. | In my view, the process by which the proposed management fees of the Atlantic Funds have been negotiated with RI thus far has been, to the extent practicable, at arms’ length and reasonable and consistent with the AOD. |
Respectfully submitted,
Steven E. Asher
58
Shareholder Meeting Results
Columbia High Yield Municipal Fund
On March 3, 2010, a special meeting of shareholders of Columbia Funds Series Trust I was held to consider the approval of several proposals listed in the proxy statement for the meeting. Proposal 1 and Proposal 2 were voted on at the March 3, 2010 meeting of shareholders and Proposal 3 was voted on at an adjourned meeting of shareholders held on March 31, 2010. The shareholder meeting results are as follows:
Proposal 1: A proposed Investment Management Services Agreement with Columbia Management Investment Advisers, LLC (formerly, RiverSource Investments, LLC) (CMIA) was approved as follows:
| | | | | | |
| | | | | | | |
| Votes For | | Votes Against | | Abstentions | | Broker Non-Votes |
| 605,045,946 | | 6,963,123 | | 4,021,471 | | 54,777,722 |
Proposal 2: A proposal authorizing CMIA to enter into and materially amend subadvisory agreements for the Fund in the future, with the approval of the Trust’s Board of Trustees, but without obtaining additional shareholder approval, was approved as follows:
| | | | | | |
| | | | | | | |
| Votes For | | Votes Against | | Abstentions | | Broker Non-Votes |
| 597,337,131 | | 14,537,701 | | 4,155,659 | | 54,777,770 |
Proposal 3: Each of the nominees for trustees was elected to the Trust’s Board of Trustees, as follows:
| | | | | | |
| | | | | | | |
| Trustee | | Votes For | | Votes Withheld | | Abstentions |
| John D. Collins | | 30,977,072,412 | | 859,827,038 | | 0 |
Rodman L. Drake | | 30,951,179,004 | | 885,720,446 | | 0 |
| Douglas A. Hacker | | 30,989,793,279 | | 847,106,171 | | 0 |
Janet Langford Kelly | | 30,999,020,814 | | 837,878,636 | | 0 |
| William E. Mayer | | 16,291,139,483 | | 15,545,759,967 | | 0 |
Charles R. Nelson | | 30,997,700,700 | | 839,198,750 | | 0 |
| John J. Neuhauser | | 30,988,095,661 | | 848,803,789 | | 0 |
Jonathon Piel | | 30,968,801,048 | | 868,098,402 | | 0 |
| Patrick J. Simpson | | 30,999,065,030 | | 837,834,420 | | 0 |
Anne-Lee Verville | | 30,996,227,913 | | 840,671,537 | | 0 |
59
[THIS PAGE INTENTIONALLY LEFT BLANK]
60
Important Information About This Report
The fund mails one shareholder report to each shareholder address. If you would like more than one report, please call shareholder services at 1-800-345-6611 and additional reports will be sent to you. This report has been prepared for shareholders of Columbia High Yield Municipal Fund.
A description of the policies and procedures that the fund uses to determine how to vote proxies and a copy of the fund’s voting records are available (i) at www.columbiamanagement.com, (ii) on the Securities and Exchange Commission’s website at www.sec.gov, and (iii) without charge, upon request, by calling 1-800-368-0346. Information regarding how the fund voted proxies relating to portfolio securities during the 12-month period ended June 30 is available from the SEC’s website. Information regarding how the fund voted proxies relating to portfolio securities is also available from the fund’s website, www.columbiamanagement.com.
The fund files a complete schedule of portfolio holdings with the SEC for the first and third quarters of each fiscal year on Form N-Q. The fund’s Form N-Q is available on the SEC’s website at www.sec.gov and may be reviewed and copied at the SEC’s Public Reference Room in Washington, D.C. Information on the operation of the Public Reference Room may be obtained by calling
1-800-SEC-0330.
Investors should consider the investment objectives, risks, charges and expenses of a mutual fund carefully before investing. For a free prospectus, which contains this and other important information about the funds, visit www.columbiamanagement.com. Read the prospectus carefully before investing.
On April 30, 2010, Ameriprise Financial, Inc., the parent company of RiverSource Investments, LLC, acquired the long-term asset management business of Columbia Management Group, LLC, including certain of its affiliates, which were, prior to this acquisition, part of Bank of America. In connection with the acquisition of the long-term assets, the Columbia Funds have a new investment adviser, RiverSource Investments, LLC, which is now known as Columbia Management Investment Advisers, LLC. For those series that used the services of a subadviser prior to this acquisition, those arrangements continue to be in effect. RiverSource Fund Distributors, Inc., now known as Columbia Management Investment Distributors, Inc., member FINRA, will act as the principal distributor of the Columbia Funds.
Transfer Agent
Columbia Management Investment Services Corp.
P.O. Box 8081
Boston, MA 02266-8081
1-800-345-6611
Distributor
Columbia Management Investment
Distributors, Inc.
One Financial Center
Boston, MA 02111
Investment Advisor
Columbia Management Investment Advisers, LLC
100 Federal Street
Boston, MA 02110
61

Columbia High Yield Municipal Fund
One Financial Center
Boston, MA 02111-2621
www.columbiafunds.com
This report must be accompanied or preceeded by the Fund’s current prospectus. Columbia Management mutual funds are distributed by Columbia Management Investment Distributors, Inc.
©2010 Columbia Management Investment Advisers, LLC. All rights reserved.
C-1356 A (8/10)
| | (a) | The registrant has adopted a code of ethics that applies to the registrant’s principal executive officer, principal financial officer, principal accounting officer or controller, or persons performing similar functions, regardless of whether these individuals are employed by the registrant or a third party. |
| | (b) | During the period covered by this report, there were not any amendments to a provision of the code of ethics adopted in 2(a) above. |
| | (c) | During the period covered by this report, there were no waivers, including any implicit waivers, from a provision of the code of ethics described in 2(a) above that relates to one or more of the items set forth in paragraph (b) of this item’s instructions. |
| Item 3. | Audit Committee Financial Expert. |
The registrant’s Board of Trustees has determined that John D. Collins, Douglas A. Hacker, Charles R. Nelson and Anne-Lee Verville, each of whom are members of the registrant’s Board of Trustees and Audit Committee, each qualify as an audit committee financial expert. Mr. Collins, Mr. Hacker, Mr. Nelson and Ms. Verville are each independent trustees, as defined in paragraph (a)(2) of this item’s instructions.
| Item 4. | Principal Accountant Fees and Services. |
Fee information below is disclosed for the two series of the registrant whose report to stockholders is included in this annual filing.
(a) Audit Fees. Aggregate Audit Fees billed by the principal accountant for professional services rendered during the fiscal years ended June 30, 2010 and June 30, 2009 are approximately as follows:
Audit Fees include amounts related to the audit of the registrant’s annual financial statements or services that are normally provided by the accountant in connection with statutory and regulatory filings or engagements for those fiscal years.
(b) Audit-Related Fees. Aggregate Audit-Related Fees billed to the registrant by the principal accountant for professional services rendered during the fiscal years ended June 30, 2010 and June 30, 2009 are approximately as follows:
Audit-Related Fees include amounts for assurance and related services by the principal accountant that are reasonably related to the performance of the audit of the registrant’s financial statements and are not reported in Audit Fees above. In both fiscal years 2010 and 2009, Audit-Related Fees consist of agreed-upon procedures performed for semi-annual shareholder reports.
During the fiscal years ended June 30, 2010 and June 30, 2009, there were no Audit-Related Fees billed by the registrant’s principal accountant to the registrant’s investment adviser (not including any sub-adviser whose role is primarily portfolio management and is subcontracted with or overseen by another investment adviser) and any entity controlling, controlled by, or under common control with the adviser that provides ongoing services to the registrant for an engagement that related directly to the operations and financial reporting of the registrant.
(c) Tax Fees. Aggregate Tax Fees billed by the principal accountant to the registrant for professional services rendered during the fiscal years ended June 30, 2010 and June 30, 2009 are approximately as follows:
Tax Fees include amounts for the review of annual tax returns, the review of required shareholder distribution calculations and typically include amounts for professional services by the principal accountant for tax compliance, tax advice and tax planning.
During the fiscal years ended June 30, 2010 and June 30, 2009, there were no Tax Fees billed by the registrant’s principal accountant to the registrant’s investment adviser (not including any sub-adviser whose role is primarily portfolio management and is subcontracted with or overseen by another investment adviser) and any entity controlling, controlled by, or under common control with the adviser that provides ongoing services to the registrant for an engagement that related directly to the operations and financial reporting of the registrant.
(d) All Other Fees. Aggregate All Other Fees billed by the principal accountant to the registrant for professional services rendered during the fiscal years ended June 30, 2010 and June 30, 2009 are approximately as follows:
All Other Fees include amounts for products and services provided by the principal accountant, other than the services reported in paragraphs (a) through (c) above.
Aggregate All Other Fees billed by the registrant’s principal accountant to the registrant’s investment adviser (not including any sub-adviser whose role is primarily portfolio management and is subcontracted with or overseen by another investment adviser) and any entity controlling, controlled by, or under common control with the adviser that provides ongoing services to the registrant for an engagement that related directly to the operations and financial reporting of the registrant during the fiscal years ended June 30, 2010 and June 30, 2009 are approximately as follows:
| | |
| 2010 | | 2009 |
| $1,424,400 | | $711,800 |
In both fiscal years 2010 and 2009, All Other Fees consist of fees billed for internal control examinations of the registrant’s transfer agent and investment advisor. Fiscal year 2010 also includes fees for agreed upon procedures related to the sale of the long-term asset management business and fees related to the review of revenue modeling schedules.
(e)(1) Audit Committee Pre-Approval Policies and Procedures
The registrant’s Audit Committee is required to pre-approve the engagement of the registrant’s independent accountants to provide audit and non-audit services to the registrant and non-audit services to its investment adviser (not including any sub-adviser whose role is primarily portfolio management and is subcontracted with or overseen by another investment adviser) or any entity controlling, controlled by or under common control with such investment adviser that provides ongoing services to the registrant (“Adviser Affiliates”), if the engagement relates directly to the operations and financial reporting of the registrant.
The Audit Committee has adopted a Policy for Engagement of Independent Accountants for Audit and Non-Audit Services (“Policy”). The Policy sets forth the understanding of the Audit Committee regarding the engagement of the registrant’s independent accountants to provide (i) audit and permissible audit-related, tax and other services to the registrant (collectively “Fund Services”); (ii) non-audit services to the registrant’s investment adviser (not including any sub-adviser whose role is primarily portfolio management and is subcontracted with or overseen by another investment
adviser) and Adviser Affiliates, if the engagement relates directly to the operations or financial reporting of a Fund (collectively “Fund-related Adviser Services”); and (iii) certain other audit and non-audit services to the registrant’s investment adviser (not including any sub-adviser whose role is primarily portfolio management and is subcontracted with or overseen by another investment adviser) and Adviser Affiliates. Unless a type of service receives general pre-approval under the Policy, it requires specific pre-approval by the Audit Committee if it is to be provided by the independent accountants. Pre-approval of non-audit services to the registrant, the registrant’s investment adviser (not including any sub-adviser whose role is primarily portfolio management and is subcontracted with or overseen by another investment adviser) and Adviser Affiliates may be waived provided that the “de minimis” requirements set forth under paragraph (c)(7)(i)(C) of Rule 2-01 of Regulation S-X are met.
Under the Policy, the Audit Committee may delegate pre-approval authority to any pre-designated member or members who are Independent Trustees/Directors. The member(s) to whom such authority is delegated must report, for informational purposes only, any pre-approval decisions to the Audit Committee at its next regular meeting. The Audit Committee’s responsibilities with respect to the pre-approval of services performed by the independent accountants may not be delegated to management.
The Policy requires the Fund Treasurer and/or Director of Board Administration to submit to the Audit Committee, on an annual basis, a schedule of the types of services that are subject to general pre-approval. The schedule(s) provide a description of each type of service that is subject to general pre-approval and, where possible, will provide estimated fee caps for each instance of providing each service. The Audit Committees will review and approve the types of services and review the projected fees for the next fiscal year and may add to, or subtract from, the list of general pre-approved services from time to time based on subsequent determinations. That approval acknowledges that the Audit Committee is in agreement with the specific types of services that the independent accountants will be permitted to perform.
The Fund Treasurer and/or Director of Board Administration shall report to the Audit Committee at each of its regular meetings regarding all Fund Services or Fund-related Adviser Services initiated since the last such report was rendered, including a general description of the services, actual billed and projected fees, and the means by which such Fund Services or Fund-related Adviser Services were pre-approved by the Audit Committee.
*****
(e)(2) The percentage of services described in paragraphs (b) through (d) of this Item approved pursuant to the “de minimis” exception under paragraph (c)(7)(i)(C) of Rule 2-01 of Regulation S-X during both fiscal years ended June 30, 2010 and June 30, 2009 was zero.
(f) Not applicable.
(g) The aggregate non-audit fees billed by the registrant’s accountant for services rendered to the registrant, and rendered to the registrant’s investment adviser (not including any sub-adviser whose role is primarily portfolio management and is subcontracted with or overseen by another investment adviser), and any entity controlling, controlled by, or under common control with the adviser that provides ongoing services to the registrant for the fiscal years ended June 30, 2010 and June 30, 2009 are approximately as follows:
| | |
| 2010 | | 2009 |
| $1,442,000 | | $730,300 |
(h) The registrant’s Audit Committee of the Board of Directors has considered whether the provision of non-audit services that were rendered to the registrant’s adviser (not including any sub-adviser whose role is primarily portfolio management and is subcontracted with or overseen by another investment adviser), and any entity controlling, controlled by, or under common control with the investment adviser that provides ongoing services to the registrant that were not pre-approved pursuant to paragraph (c)(7)(ii) of Rule 2-01 of Regulation S-X, is compatible with maintaining the principal accountant’s independence.
| Item 5. | Audit Committee of Listed Registrants. |
Not applicable.
| | (a) | The registrant’s “Schedule I – Investments in securities of unaffiliated issuers” (as set forth in 17 CFR 210.12-12) is included in Item 1 of this Form N-CSR. |
| Item 7. | Disclosure of Proxy Voting Policies and Procedures for Closed-End Management Investment Companies. |
Not applicable.
| Item 8. | Portfolio Managers of Closed-End Management Investment Companies. |
Not applicable.
| Item 9. | Purchases of Equity Securities by Closed-End Management Investment Company and Affiliated Purchasers. |
Not applicable.
| Item 10. | Submission of Matters to a Vote of Security Holders. |
There were no material changes to the procedures by which shareholders may recommend nominees to the registrant’s board of directors.
| Item 11. | Controls and Procedures. |
| | (a) | The registrant’s principal executive officer and principal financial officers, based on their evaluation of the registrant’s disclosure controls and procedures as of a date within 90 days of the filing of this report, have concluded that such controls and procedures are adequately designed to ensure that material information required to be disclosed by the registrant in Form N-CSR is accumulated and communicated to the registrant’s management, including the principal executive officer and principal financial officer, or persons performing similar functions, as appropriate to allow timely decisions regarding required disclosure. |
| | (b) | There was no change in the registrant’s internal control over financial reporting that occurred during the registrant’s second fiscal quarter of the period covered by this report that has materially affected, or is reasonably likely to materially affect, the registrant’s internal control over financial reporting. |
(a)(1) Code of ethics required to be disclosed under Item 2 of Form N-CSR attached hereto as Exhibit 99.CODE ETH.
(a)(2) Certifications pursuant to Rule 30a-2(a) under the Investment Company Act of 1940 (17 CFR 270.30a-2(a)) attached hereto as Exhibit 99.CERT.
(a)(3) Not applicable.
(b) Certification pursuant to Rule 30a-2(b) under the Investment Company Act of 1940 (17 CFR 270.30a-2(b)) attached hereto as Exhibit 99.906CERT.
SIGNATURES
Pursuant to the requirements of the Securities Exchange Act of 1934 and the Investment Company Act of 1940, the registrant has duly caused this report to be signed on its behalf by the undersigned, thereunto duly authorized.
| | | | | | | | | | | | | | | | |
| (registrant) | | | | | | | | | | | | Columbia Funds Series Trust I | | | | |
| | | | |
| By (Signature and Title) | | | | /s/ J. Kevin Connaughton | | | | |
| | | | | | | | | | | | J. Kevin Connaughton, President | | | | |
| | | | | | | | |
| Date | | | | | | | | | | | | August 23, 2010 | | | | |
Pursuant to the requirements of the Securities Exchange Act of 1934 and the Investment Company Act of 1940, this report has been signed below by the following persons on behalf of the registrant and in the capacities and on the dates indicated. |
| By (Signature and Title) | | | | /s/ J. Kevin Connaughton | | | | |
| | | | | | | | | | | | J. Kevin Connaughton, President | | | | |
| | | | | | | | |
| Date | | | | | | | | | | | | August 23, 2010 | | | | |
| | | | |
| By (Signature and Title) | | | | /s/ Michael G. Clarke | | | | |
| | | | | | | | | | | | Michael G. Clarke, Chief Financial Officer | | | | |
| | | | | | | | |
| Date | | | | | | | | | | | | August 23, 2010 | | | | |

